UNITED STATES
SECURITIES AND EXCHANGE COMMISSION
Washington, D.C. 20549
Form N-CSR
CERTIFIED SHAREHOLDER REPORT OF REGISTERED MANAGEMENT
INVESTMENT COMPANIES
Investment Company Act File Number 811-03833
MAINSTAY VP FUNDS TRUST
(Exact name of Registrant as specified in charter)
51 Madison Avenue, New York, NY 10010
(Address of principal executive offices) (Zip code)
J. Kevin Gao, Esq.
30 Hudson Street
Jersey City, New Jersey 07302
(Name and address of agent for service)
Registrant’s telephone number, including area code: (212) 576-7000
Date of fiscal year end: December 31
Date of reporting period: June 30, 2021
| Item 1. | Reports to Stockholders. |
MainStay VP Wellington U.S. Equity Portfolio
(formerly known as MainStay VP MacKay Common Stock Portfolio)
Message from the President and Semiannual Report
Unaudited | June 30, 2021
Sign up for e-delivery of your shareholder reports. For full details on e-delivery, including who can participate and what you can receive via e-delivery,
please log in to newyorklifeinvestments.com/accounts.
| Not FDIC/NCUA Insured | Not a Deposit | May Lose Value | No Bank Guarantee | Not Insured by Any Government Agency |
This page intentionally left blank
Message from the President
The COVID-19 pandemic continued to afflict our personal lives and broad segments of the U.S. and global economy throughout the six-month reporting period ended June 30, 2021. However, with the deployment of multiple vaccines around the world, including three highly effective versions approved for emergency use in the United States, investors began to turn their attention toward the gradual reopening of the economy and the shape the “new normal” would take.
The first half of the reporting period saw increasing inflationary concerns as fiscal stimulus business reopenings drove accelerating economic growth, rising commodity prices and increased consumer spending. However, the U.S. Federal Reserve noted that price increases were likely to prove temporary and made clear their intention to remain accommodative for the foreseeable future. Accordingly, after moving higher in the first quarter of 2021, interest rates declined in the second quarter.
In response to the uncertain inflation outlook, equity market leadership shifted from value in the first quarter of the year to growth in the second quarter. Nevertheless, investor sentiment remained buoyant throughout the reporting period, with all eleven sectors in the S&P 500® Index, a widely regarded benchmark of market performance, producing positive returns. Energy led the market’s rise fueled by rapidly increasing oil and gas prices, followed by financials and real estate, which benefited from rising interest rates and the economic reopening, respectively. Communication services produced the slowest growth, followed by the traditionally defensive utilities and consumer staples
sectors. In the fixed income market, lower-credit-quality issues tended to outperform their higher-grade counterparts, with high-yield corporate bonds generating the strongest performance. Among securitized products, commercial mortgage-backed securities generally produced the strongest returns, followed by mortgage-backed securities and asset-backed securities, while Treasury securities lagged.
Despite the tremendous progress we’ve seen so far this year, the United States and the world continue to face significant pandemic-related challenges. Newer, more contagious variants of COVID-19 threaten the return of restrictions and lockdowns that could stall the economic recovery. At the same time, supply chain shortages have led to rising prices on everything from laptops to autos, stoking fears of uncontrolled inflation despite reassurance from the U.S. Federal Reserve. At New York Life Investments, we recognize that the shape that the “new normal” eventually takes may differ from our expectations. You can depend on us to keep a sharp watch for the unexpected, and to continue to help you find your way through this rapidly evolving investment landscape.
Sincerely,
Kirk C. Lehneis
President
The opinions expressed are as of the date of this report and are subject to change. There is no guarantee that any forecast made will come to pass. This material does not constitute investment advice and is not intended as an endorsement of any specific investment. Past performance is no guarantee of future results.
Not part of the Semiannual Report
Investors should refer to the Portfolio’s Summary Prospectus and/or Prospectus and consider the Portfolio’s investment objectives, strategies, risks, charges and expenses carefully before investing. The Summary Prospectus and/or Prospectus contain this and other information about the Portfolio. You may obtain copies of the Portfolio’s Summary Prospectus and/or the Prospectus and the Statement of Additional Information free of charge, upon request, by calling toll-free 800-598-2019, by writing to New York Life Insurance and Annuity Corporation, 51 Madison Avenue, Room 251, New York, New York 10010 or by sending an email to MainStayShareholdersServices@nylim.com. These documents are also available at nylinvestments.com/vpdocuments. Please read the Portfolio's Summary Prospectus and/or Prospectus carefully before investing. MainStay VP Funds Trust portfolios are separate account options which are purchased through a variable insurance or variable annuity contract.
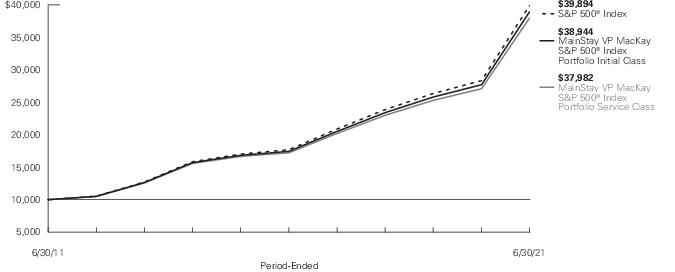
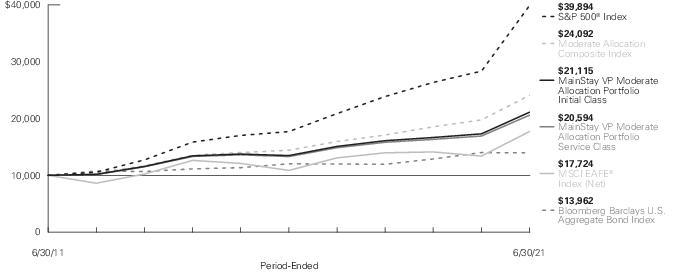
Investment and Performance Comparison (Unaudited)
Performance data quoted represents past performance. Past performance is no guarantee of future results. Because of market volatility and other factors, current performance may be lower or higher than the figures shown. Investment return and principal value will fluctuate, and as a result, when shares are redeemed, they may be worth more or less than their original cost. The performance table and graph do not reflect any deduction of sales charges, mortality and expense charges, contract charges or administrative charges. Please refer to the Performance Summary appropriate for your policy. For performance information current to the most recent month-end, please call 800-598-2019 or visit www.newyorklife.com.
Performance figures may reflect certain fee waivers and/or expense limitations, without which total returns may have been different. For information on current fee waivers and/or expense limitations (if any), please refer to the Notes to Financial Statements.
| Average Annual Total Returns for the Period-Ended June 30, 2021 |
| Class | Inception
Date1, 2 | Six
Months | One
Year | Five
Years | Ten
Years | Gross
Expense
Ratio3 |
| Initial Class Shares | 1/23/1984 | 16.26% | 40.15% | 15.94% | 14.13% | 0.58% |
| Service Class Shares | 6/5/2003 | 16.11 | 39.80 | 15.65 | 13.84 | 0.83 |
| 1. | Effective January 1, 2018, due to an organizational restructuring whereby all investment personnel of Cornerstone Capital Management Holdings LLC, a former subadvisor, transitioned to MacKay Shields LLC, a former subadvisor. The past performance in the chart and table prior to that date reflects the Portfolio’s prior subadvisor and principal investment strategies. |
| 2. | Effective May 1, 2021, the Portfolio replaced its subadvisor and modified its principal investment strategies. The past performance in the graph and table prior to that date reflects the Portfolio's prior subadvisor and principal investment strategies. |
| 3. | The gross expense ratios presented reflect the Portfolio’s “Total Annual Portfolio Operating Expenses” from the most recent Prospectus, as supplemented, and may differ from other expense ratios disclosed in this report. |
| Benchmark Performance | Six
Months | One
Year | Five
Years | Ten
Years |
| S&P 500® Index1 | 15.25% | 40.79% | 17.65% | 14.84% |
| Morningstar Large Blend Category Average2 | 14.78 | 39.87 | 15.65 | 12.51 |
| 1. | The S&P 500® Index is the Portfolio’s primary benchmark. "S&P 500®" is a trademark of The McGraw-Hill Companies, Inc. The S&P 500® Index is widely regarded as the standard index for measuring large-cap U.S. stock market performance. Results assume reinvestment of all dividends and capital gains. An investment cannot be made directly in an index. |
| 2. | The Morningstar Large Blend Category Average is representative of funds that represent the overall U.S. stock market in size, growth rates and price. Stocks in the top 70% of the capitalization of the U.S. equity market are defined as large cap. The blend style is assigned to funds' where neither growth nor value characteristics predominate. These funds tend to invest across the spectrum of U.S. industries, and owing to their broad exposure, the funds' returns are often similar to those of the S&P 500® Index. Results are based on average total returns of similar funds with all dividends and capital gain distributions reinvested. |
Cost in Dollars of a $1,000 Investment in MainStay VP Wellington U.S. Equity Portfolio (Unaudited)
The example below is intended to describe the fees and expenses borne by shareholders during the six-month period from January 1, 2021 to June 30, 2021, and the impact of those costs on your investment.
Example
As a shareholder of the Portfolio you incur two types of costs: (1) transaction costs, including exchange fees and sales charges (loads) on purchases (as applicable), and (2) ongoing costs, including management fees, distribution and/or service (12b-1) fees, and other Portfolio expenses (as applicable). This example is intended to help you understand your ongoing costs (in dollars) of investing in the Portfolio and to compare these costs with the ongoing costs of investing in other mutual funds. The example is based on an investment of $1,000 made at the beginning of the six-month period and held for the entire period from January 1, 2021 to June 30, 2021. Shares are only sold in connection with variable life and annuity contracts and the example does not reflect any contract level or transactional fees or expenses. If these costs had been included, your costs would have been higher.
This example illustrates your Portfolio’s ongoing costs in two ways:
Actual Expenses
The second and third data columns in the table below provide information about actual account values and actual expenses. You may use the information in these columns, together with the amount you invested, to estimate the expenses that you paid during the six months ended June
30, 2021. Simply divide your account value by $1,000 (for example, an $8,600 account value divided by $1,000 = 8.6), then multiply the result by the number under the heading entitled “Expenses Paid During Period” to estimate the expenses you paid on your account during this period.
Hypothetical Example for Comparison Purposes
The fourth and fifth data columns in the table below provide information about hypothetical account values and hypothetical expenses based on the Portfolio’s actual expense ratio and an assumed rate of return of 5% per year before expenses, which is not the Portfolio’s actual return. The hypothetical account values and expenses may not be used to estimate the actual ending account balances or expenses you paid for the six-month period shown. You may use this information to compare the ongoing costs of investing in the Portfolio with the ongoing costs of investing in other mutual funds. To do so, compare this 5% hypothetical example with the 5% hypothetical examples that appear in the shareholder reports of the other mutual funds.
Please note that the expenses shown in the table are meant to highlight your ongoing costs only and do not reflect any transactional costs, such as exchange fees or sales charges (loads). Therefore, the fourth and fifth data columns of the table are useful in comparing ongoing costs only and will not help you determine the relative total costs of owning different funds. In addition, if these transactional costs were included, your costs would have been higher.
| Share Class | Beginning
Account
Value
1/1/21 | Ending Account
Value (Based
on Actual
Returns and
Expenses)
6/30/21 | Expenses
Paid
During
Period1 | Ending Account
Value (Based
on Hypothetical
5% Annualized
Return and
Actual Expenses)
6/30/21 | Expenses
Paid
During
Period1 | Net Expense
Ratio
During
Period2 |
| Initial Class Shares | $1,000.00 | $1,162.60 | $3.06 | $1,021.97 | $2.86 | 0.57% |
| Service Class Shares | $1,000.00 | $1,161.10 | $4.39 | $1,020.73 | $4.11 | 0.82% |
| 1. | Expenses are equal to the Portfolio’s annualized expense ratio of each class multiplied by the average account value over the period, divided by 365 and multiplied by 181 (to reflect the six-month period). The table above represents the actual expenses incurred during the six-month period. In addition to the fees and expenses which the Portfolio bears directly, it also indirectly bears a pro rata share of the fees and expenses of the underlying funds in which it invests. Such indirect expenses are not included in the above-reported expense figures. |
| 2. | Expenses are equal to the Portfolio's annualized expense ratio to reflect the six-month period. |
| 6 | MainStay VP Wellington U.S. Equity Portfolio |
Industry Composition as of June 30, 2021 (Unaudited)
| Software | 9.0% |
| Interactive Media & Services | 8.4 |
| Semiconductors & Semiconductor Equipment | 5.8 |
| Technology Hardware, Storage & Peripherals | 5.5 |
| Banks | 5.4 |
| Internet & Direct Marketing Retail | 4.6 |
| Health Care Equipment & Supplies | 4.5 |
| IT Services | 4.2 |
| Capital Markets | 3.8 |
| Textiles, Apparel & Luxury Goods | 3.4 |
| Entertainment | 3.4 |
| Pharmaceuticals | 3.3 |
| Household Products | 2.9 |
| Hotels, Restaurants & Leisure | 2.7 |
| Machinery | 2.6 |
| Beverages | 2.4 |
| Electric Utilities | 2.2 |
| Health Care Providers & Services | 2.1 |
| Chemicals | 2.1 |
| Biotechnology | 2.0 |
| Professional Services | 1.7% |
| Equity Real Estate Investment Trusts | 1.7 |
| Electronic Equipment, Instruments & Components | 1.7 |
| Consumer Finance | 1.6 |
| Specialty Retail | 1.6 |
| Oil, Gas & Consumable Fuels | 1.5 |
| Air Freight & Logistics | 1.3 |
| Life Sciences Tools & Services | 1.3 |
| Diversified Telecommunication Services | 1.2 |
| Aerospace & Defense | 1.2 |
| Building Products | 1.0 |
| Electrical Equipment | 0.9 |
| Insurance | 0.8 |
| Commercial Services & Supplies | 0.6 |
| Automobiles | 0.4 |
| Short–Term Investment | 1.1 |
| Other Assets, Less Liabilities | 0.1 |
| | 100.0% |
See Portfolio of Investments beginning on page 10 for specific holdings within these categories. The Portfolio's holdings are subject to change.
Top Ten Holdings as of June 30, 2021 (excluding short-term investments) (Unaudited)
| 1. | Microsoft Corp. |
| 2. | Alphabet, Inc. |
| 3. | Amazon.com, Inc. |
| 4. | Apple, Inc. |
| 5. | Facebook, Inc., Class A |
| 6. | JPMorgan Chase & Co. |
| 7. | Bank of America Corp. |
| 8. | UnitedHealth Group, Inc. |
| 9. | Walt Disney Co. (The) |
| 10. | Procter & Gamble Co. (The) |
Portfolio Management Discussion and Analysis (Unaudited)
Answers to the questions reflect the views of portfolio managers Migene Kim, CFA, and Mona Patni of MacKay Shields LLC (“MacKay Shields”), the Portfolio’s former Subadvisor, and Mammen Chally, CFA, Douglas W. McLane, CFA, and David A. Siegle, CFA, of Wellington Management Company LLP (“Wellington”), the Portfolio's current Subadvisor.
How did MainStay VP Wellington U.S. Equity Portfolio perform relative to its benchmark and peers during the six months ended June 30, 2021?
For the six months ended June 30, 2021, MainStay VP Wellington U.S. Equity Portfolio returned 16.26% for Initial Class shares and 16.11% for Service Class shares. Over the same period, both share classes outperformed the 15.25% return of the S&P 500® Index (“the Index”), which is the Portfolio’s primary benchmark. For the six months ended June 30, 2021, both share classes also outperformed the 14.78% return of the Morningstar Large Blend Category Average.1
Were there any changes to the Portfolio during the reporting period?
At meetings held on January 21, January 25 and February 3, 2021, the Board of Trustees of MainStay VP Funds Trust considered and approved, among other related proposals: (i) appointing Wellington Management Company LLP as the Portfolio’s subadvisor, and the related subadvisory agreement; (ii) changing the Portfolio’s name and modifying its non-fundamental “names rule” investment policy; and (iii) modifying the Portfolio’s principal investment strategies and investment process. For more information on these and other changes refer to the supplement dated February 5, 2021.
In the process of implementing the new principal investment strategies and investment process, the Portfolio may have experienced a high level of portfolio turnover. Also, during this transition period, the Portfolio may not have been pursuing its investment objective or may not have been managed consistent with its investment strategies as stated in the Prospectus. This may have impacted the Portfolio’s performance.
What factors affected the Portfolio’s relative performance during the reporting period?
MacKay Shields
During the time MacKay Shields managed the Portfolio, the Portfolio outperformed the Index, helped by strong stock selection, most notably among financials, industrials and information technology stocks. Sector allocation effect mildly detracted from relative returns due to underweight exposure to the strong-performing energy and financials sectors. In terms of stock-selection model efficacy, the combination of signals used by the Portfolio’s quantitative stock selection model was rewarded primarily by valuation measures.
Wellington
During the time Wellington managed the Portfolio, the Portfolio underperformed the Index, primarily due to security selection. Sector attribution, a result of Wellington's bottom-up stock
selection process, also weighed on results.
Which sectors were the strongest positive contributors to the Portfolio’s relative performance, and which sectors were particularly weak?
MacKay Shields
During the time MacKay Shields managed the Portfolio, the strongest positive contributors to the Portfolio’s performance relative to the Index were the industrials, financials and information technology sectors. (Contributions take weightings and total returns into account.) During the same period, the most significant detractors from benchmark-relative performance were the real estate, energy and materials sectors.
Wellington
During the time Wellington managed the Portfolio, security selection in the financials and health care sectors contributed positively to performance relative to the Index, while security selection in the information technology, consumer discretionary and consumer staples sectors detracted. From an allocation perspective, the Portfolio’s underweight exposure to utilities enhanced relative returns, while underweight exposure to the energy sector weighed on relative performance.
During the reporting period, which individual stocks made the strongest positive contributions to the Portfolio’s absolute performance and which stocks detracted the most?
MacKay Shields
The stocks providing the strongest positive contributions to the Portfolio’s absolute performance during the time MacKay Shields managed the portfolio included systems software developer Microsoft and Internet content and information services provider Alphabet, the parent company of Google. During the same period, the most significant detractors from absolute performance were consumer technology company Apple, wireless communications technology firm Qualcomm and interactive home entertainment developer Take-Two Interactive Software.
Wellington
The strongest contributors to absolute performance during the time Wellington managed the Portfolio were holdings in Microsoft, pharmaceutical company Eli Lilly and semiconductor developer Marvell Technology. Microsoft shares rebounded with the broader technology sector in May 2021, as hawkish rhetoric from the U.S. Federal Reserve prompted a market rotation away from cyclically sensitive value stocks into growth stocks. Eli Lilly shares rose after the U.S. Food and Drug Administration granted Breakthrough Therapy designation for donanemab, an Alzheimer’s Disease treatment. Donanemab targets N3pG, a form of beta amyloid, and has exhibited positive safety and efficacy results. The
| 1. | See page 5 for more information on benchmark and peer group returns. |
| 8 | MainStay VP Wellington U.S. Equity Portfolio |
company announced plans to submit a Biologics License Application in 2021. Eli Lilly also gained emergency use authorization in India for the use of baricitinib to treat severely ill COVID-19 patients. Shares of Marvell Technology rose after the company reported fiscal first-quarter results that exceeded consensus estimates, while also forecasting record revenue for the second quarter bolstered by its April 2021 acquisition of Inphi, a leading producer of high-speed networking semiconductors.
The most significant detractors from the Portfolio’s absolute performance were holdings in financial technology company Global Payments, entertainment provider The Walt Disney Company and travel technology company Booking Holdings. Shares of Global Payments lost ground despite posting first-quarter 2021 earnings that exceeded consensus estimates. Rather than reward this positive news, market participants appeared more focused on increasing competition in the electronic payments space, while also reacting skeptically to the company’s two announced acquisitions. Shares of Disney fell after reporting second-quarter revenue below expectations, with fewer Disney+ subscribers than expected. Management noted that the average monthly revenue per Disney+ subscriber decreased significantly from $5.63 to $3.99 due to the launch of Hotstar, the company’s Indian streaming service, which had grown to make up approximately a third of the total Disney+ subscriber base. Shares of Booking Holdings suffered along with other travel-related stocks amid a global rise in COVID-19 cases and increased travel restrictions.
Did the Portfolio make any significant purchases or sales during the reporting period?
MacKay Shields
The Portfolio’s largest initial purchase during the time MacKay Shields managed the Portfolio was in diversified banking firm Citigroup, while the largest increase in position size was in conglomerate Berkshire Hathaway. The Portfolio's largest full sale was its position in freight and logistics company FedEx Corporation, while its most significantly decreased position size was in Apple.
Wellington
There were no notable purchases or sales during the time Wellington managed the Portfolio.
How did the Portfolio’s sector weightings change during the reporting period?
MacKay Shields
During the time MacKay Shields managed the portfolio, the largest increases in benchmark-relative sector exposures were in the
financials and communication services sectors. Conversely, the Portfolio's largest decreases in benchmark-relative sector exposures were in the industrials and information technology sectors.
Wellington
During the time Wellington managed the Portfolio, there were no significant changes to sector weights.
How was the Portfolio positioned at the end of the reporting period?
MacKay Shields
At the end of the period when MacKay Shields managed the Portfolio, the Portfolio held its most overweight exposures relative to the Index in the health care and consumer discretionary sectors. As of the same date, the Portfolio held its most relatively underweight exposures in the industrials and materials sectors.
Wellington
As of June 30, 2021, the Portfolio’s largest overweight positions relative to the Index were in communication services and industrials, while its most significantly underweight positions were in real estate and consumer staples.
The opinions expressed are those of the portfolio managers as of the date of this report and are subject to change. There is no guarantee that any forecasts will come to pass. This material does not constitute investment advice and is not intended as an endorsement of any specific investment.
Not all MainStay VP Portfolios and/or share classes are available under all policies.
Portfolio of Investments June 30, 2021† (Unaudited)
| | Shares | Value |
| Common Stocks 98.8% |
| Aerospace & Defense 1.2% |
| Raytheon Technologies Corp. | 124,620 | $ 10,631,332 |
| Air Freight & Logistics 1.3% |
| FedEx Corp. | 38,982 | 11,629,500 |
| Automobiles 0.4% |
| Tesla, Inc. (a) | 5,500 | 3,738,350 |
| Banks 5.4% |
| Bank of America Corp. | 467,775 | 19,286,363 |
| JPMorgan Chase & Co. | 140,717 | 21,887,122 |
| PNC Financial Services Group, Inc. (The) | 38,046 | 7,257,655 |
| | | 48,431,140 |
| Beverages 2.4% |
| Constellation Brands, Inc., Class A | 49,989 | 11,691,927 |
| Monster Beverage Corp. (a) | 106,336 | 9,713,794 |
| | | 21,405,721 |
| Biotechnology 2.0% |
| Regeneron Pharmaceuticals, Inc. (a) | 12,880 | 7,193,995 |
| Seagen, Inc. (a) | 27,300 | 4,310,124 |
| Vertex Pharmaceuticals, Inc. (a) | 31,147 | 6,280,170 |
| | | 17,784,289 |
| Building Products 1.0% |
| Fortune Brands Home & Security, Inc. | 93,081 | 9,271,798 |
| Capital Markets 3.8% |
| BlackRock, Inc. | 12,604 | 11,028,122 |
| Charles Schwab Corp. (The) | 118,059 | 8,595,876 |
| Morgan Stanley | 159,105 | 14,588,337 |
| | | 34,212,335 |
| Chemicals 2.1% |
| PPG Industries, Inc. | 57,221 | 9,714,409 |
| Sherwin-Williams Co. (The) | 33,635 | 9,163,856 |
| | | 18,878,265 |
| Commercial Services & Supplies 0.6% |
| Copart, Inc. (a) | 40,861 | 5,386,706 |
| Consumer Finance 1.6% |
| American Express Co. | 88,744 | 14,663,171 |
| | Shares | Value |
| |
| Diversified Telecommunication Services 1.2% |
| Verizon Communications, Inc. | 197,025 | $ 11,039,311 |
| Electric Utilities 2.2% |
| American Electric Power Co., Inc. | 56,502 | 4,779,504 |
| Duke Energy Corp. | 86,038 | 8,493,672 |
| Pinnacle West Capital Corp. | 79,964 | 6,554,649 |
| | | 19,827,825 |
| Electrical Equipment 0.9% |
| AMETEK, Inc. | 62,696 | 8,369,916 |
| Electronic Equipment, Instruments & Components 1.7% |
| CDW Corp. | 43,626 | 7,619,281 |
| Corning, Inc. | 176,309 | 7,211,038 |
| | | 14,830,319 |
| Entertainment 3.4% |
| Netflix, Inc. (a) | 24,581 | 12,983,930 |
| Walt Disney Co. (The) (a) | 97,240 | 17,091,875 |
| | | 30,075,805 |
| Equity Real Estate Investment Trusts 1.7% |
| American Tower Corp. | 33,018 | 8,919,483 |
| Gaming and Leisure Properties, Inc. | 128,337 | 5,945,853 |
| | | 14,865,336 |
| Health Care Equipment & Supplies 4.5% |
| Abbott Laboratories | 63,742 | 7,389,610 |
| Baxter International, Inc. | 108,991 | 8,773,775 |
| Becton Dickinson and Co. | 30,308 | 7,370,603 |
| Danaher Corp. | 38,012 | 10,200,900 |
| Hologic, Inc. (a) | 91,651 | 6,114,955 |
| | | 39,849,843 |
| Health Care Providers & Services 2.1% |
| UnitedHealth Group, Inc. | 47,705 | 19,102,990 |
| Hotels, Restaurants & Leisure 2.7% |
| Airbnb, Inc., Class A (a) | 40,795 | 6,247,346 |
| Booking Holdings, Inc. (a) | 3,819 | 8,356,316 |
| McDonald's Corp. | 40,004 | 9,240,524 |
| | | 23,844,186 |
| Household Products 2.9% |
| Colgate-Palmolive Co. | 115,525 | 9,397,959 |
| Procter & Gamble Co. (The) | 123,869 | 16,713,644 |
| | | 26,111,603 |
The notes to the financial statements are an integral part of, and should be read in conjunction with, the financial statements.
| 10 | MainStay VP Wellington U.S. Equity Portfolio |
| | Shares | Value |
| Common Stocks (continued) |
| Insurance 0.8% |
| Chubb Ltd. | 46,655 | $ 7,415,346 |
| Interactive Media & Services 8.4% |
| Alphabet, Inc. (a) | | |
| Class A | 15,577 | 38,035,763 |
| Class C | 4,862 | 12,185,728 |
| |
| Facebook, Inc., Class A (a) | 71,476 | 24,852,920 |
| | | 75,074,411 |
| Internet & Direct Marketing Retail 4.6% |
| Amazon.com, Inc. (a) | 11,963 | 41,154,634 |
| IT Services 4.2% |
| Fidelity National Information Services, Inc. | 58,370 | 8,269,278 |
| Global Payments, Inc. | 42,892 | 8,043,966 |
| GoDaddy, Inc., Class A (a) | 79,437 | 6,907,841 |
| Mastercard, Inc., Class A | 39,745 | 14,510,502 |
| | | 37,731,587 |
| Life Sciences Tools & Services 1.3% |
| Thermo Fisher Scientific, Inc. | 22,286 | 11,242,619 |
| Machinery 2.6% |
| Deere & Co. | 21,284 | 7,507,079 |
| Illinois Tool Works, Inc. | 32,071 | 7,169,793 |
| Nordson Corp. | 36,749 | 8,066,773 |
| | | 22,743,645 |
| Oil, Gas & Consumable Fuels 1.5% |
| EOG Resources, Inc. | 82,993 | 6,924,936 |
| Pioneer Natural Resources Co. | 38,029 | 6,180,473 |
| | | 13,105,409 |
| Pharmaceuticals 3.3% |
| Eli Lilly and Co. | 68,028 | 15,613,786 |
| Merck & Co., Inc. | 182,214 | 14,170,783 |
| | | 29,784,569 |
| Professional Services 1.7% |
| Equifax, Inc. | 31,477 | 7,539,056 |
| Leidos Holdings, Inc. | 76,706 | 7,754,977 |
| | | 15,294,033 |
| Semiconductors & Semiconductor Equipment 5.8% |
| Advanced Micro Devices, Inc. (a) | 99,149 | 9,313,066 |
| KLA Corp. | 28,594 | 9,270,461 |
| | Shares | | Value |
| |
| Semiconductors & Semiconductor Equipment (continued) |
| Marvell Technology, Inc. | 143,004 | | $ 8,341,423 |
| QUALCOMM, Inc. | 71,836 | | 10,267,519 |
| Texas Instruments, Inc. | 73,861 | | 14,203,470 |
| | | | 51,395,939 |
| Software 9.0% |
| Microsoft Corp. | 199,013 | | 53,912,621 |
| salesforce.com, Inc. (a) | 56,900 | | 13,898,963 |
| SS&C Technologies Holdings, Inc. | 65,472 | | 4,717,912 |
| Workday, Inc., Class A (a) | 32,326 | | 7,717,509 |
| | | | 80,247,005 |
| Specialty Retail 1.6% |
| TJX Cos., Inc. (The) | 216,454 | | 14,593,329 |
| Technology Hardware, Storage & Peripherals 5.5% |
| Apple, Inc. | 299,363 | | 41,000,757 |
| NetApp, Inc. | 103,142 | | 8,439,078 |
| | | | 49,439,835 |
| Textiles, Apparel & Luxury Goods 3.4% |
| NIKE, Inc., Class B | 73,979 | | 11,429,016 |
| PVH Corp. (a) | 58,747 | | 6,320,590 |
| Under Armour, Inc., Class C (a) | 252,492 | | 4,688,776 |
| VF Corp. | 97,235 | | 7,977,159 |
| | | | 30,415,541 |
Total Common Stocks
(Cost $750,392,539) | | | 883,587,643 |
| Short-Term Investment 1.1% |
| Affiliated Investment Company 1.1% |
| MainStay U.S. Government Liquidity Fund, 0.01% (b) | 9,906,952 | | 9,906,952 |
Total Short-Term Investment
(Cost $9,906,952) | | | 9,906,952 |
Total Investments
(Cost $760,299,491) | 99.9% | | 893,494,595 |
| Other Assets, Less Liabilities | 0.1 | | 493,777 |
| Net Assets | 100.0% | | $ 893,988,372 |
| † | Percentages indicated are based on Portfolio net assets. |
| (a) | Non-income producing security. |
| (b) | Current yield as of June 30, 2021. |
The notes to the financial statements are an integral part of, and should be read in conjunction with, the financial statements.
11
Portfolio of Investments June 30, 2021† (Unaudited) (continued)
The following is a summary of the fair valuations according to the inputs used as of June 30, 2021, for valuing the Portfolio’s assets:
| Description | Quoted
Prices in
Active
Markets for
Identical
Assets
(Level 1) | | Significant
Other
Observable
Inputs
(Level 2) | | Significant
Unobservable
Inputs
(Level 3) | | Total |
| Asset Valuation Inputs | | | | | | | |
| Investments in Securities (a) | | | | | | | |
| Common Stocks | $ 883,587,643 | | $ — | | $ — | | $ 883,587,643 |
| Short-Term Investment | | | | | | | |
| Affiliated Investment Company | 9,906,952 | | — | | — | | 9,906,952 |
| Total Investments in Securities | $ 893,494,595 | | $ — | | $ — | | $ 893,494,595 |
| (a) | For a complete listing of investments and their industries, see the Portfolio of Investments. |
The notes to the financial statements are an integral part of, and should be read in conjunction with, the financial statements.
| 12 | MainStay VP Wellington U.S. Equity Portfolio |
Statement of Assets and Liabilities as of June 30, 2021 (Unaudited)
| Assets |
Investment in unaffiliated securities, at value
(identified cost $750,392,539) | $883,587,643 |
Investment in affiliated investment companies, at value
(identified cost $9,906,952) | 9,906,952 |
| Cash | 1,549 |
| Receivables: | |
| Portfolio shares sold | 638,157 |
| Dividends | 369,158 |
| Other assets | 52,351 |
| Total assets | 894,555,810 |
| Liabilities |
| Payables: | |
| Manager (See Note 3) | 386,650 |
| Portfolio shares redeemed | 77,870 |
| NYLIFE Distributors (See Note 3) | 59,119 |
| Professional fees | 27,357 |
| Custodian | 16,442 |
| Total liabilities | 567,438 |
| Net assets | $893,988,372 |
| Composition of Net Assets |
| Shares of beneficial interest outstanding (par value of $.001 per share) unlimited number of shares authorized | $ 27,335 |
| Additional paid-in-capital | 543,509,191 |
| | 543,536,526 |
| Total distributable earnings (loss) | 350,451,846 |
| Net assets | $893,988,372 |
| Initial Class | |
| Net assets applicable to outstanding shares | $602,746,265 |
| Shares of beneficial interest outstanding | 18,333,437 |
| Net asset value per share outstanding | $ 32.88 |
| Service Class | |
| Net assets applicable to outstanding shares | $291,242,107 |
| Shares of beneficial interest outstanding | 9,001,563 |
| Net asset value per share outstanding | $ 32.35 |
The notes to the financial statements are an integral part of, and should be read in conjunction with, the financial statements.
13
Statement of Operations for the six months ended June 30, 2021 (Unaudited)
| Investment Income (Loss) |
| Income | |
| Dividends-unaffiliated | $ 5,070,969 |
| Securities lending | 3,617 |
| Dividends-affiliated | 202 |
| Total income | 5,074,788 |
| Expenses | |
| Manager (See Note 3) | 2,227,357 |
| Distribution/Service—Service Class (See Note 3) | 348,997 |
| Professional fees | 50,041 |
| Shareholder communication | 36,225 |
| Custodian | 13,970 |
| Trustees | 7,788 |
| Miscellaneous | 10,674 |
| Total expenses | 2,695,052 |
| Net investment income (loss) | 2,379,736 |
| Realized and Unrealized Gain (Loss) |
| Net realized gain (loss) on unaffiliated investments | 165,789,628 |
| Net change in unrealized appreciation (depreciation) on unaffiliated investments | (42,893,265) |
| Net realized and unrealized gain (loss) | 122,896,363 |
| Net increase (decrease) in net assets resulting from operations | $125,276,099 |
The notes to the financial statements are an integral part of, and should be read in conjunction with, the financial statements.
| 14 | MainStay VP Wellington U.S. Equity Portfolio |
Statements of Changes in Net Assets
for the six months ended June 30, 2021 (Unaudited) and the year ended December 31, 2020
| | 2021 | 2020 |
| Increase (Decrease) in Net Assets |
| Operations: | | |
| Net investment income (loss) | $ 2,379,736 | $ 7,124,852 |
| Net realized gain (loss) | 165,789,628 | 44,306,392 |
| Net change in unrealized appreciation (depreciation) | (42,893,265) | 43,345,069 |
| Net increase (decrease) in net assets resulting from operations | 125,276,099 | 94,776,313 |
| Distributions to shareholders: | | |
| Initial Class | — | (40,145,517) |
| Service Class | — | (22,213,114) |
| Total distributions to shareholders | — | (62,358,631) |
| Capital share transactions: | | |
| Net proceeds from sales of shares | 94,819,838 | 95,611,235 |
| Net asset value of shares issued to shareholder in reinvestment of distributions | — | 62,358,631 |
| Cost of shares redeemed | (93,921,544) | (234,921,020) |
| Increase (decrease) in net assets derived from capital share transactions | 898,294 | (76,951,154) |
| Net increase (decrease) in net assets | 126,174,393 | (44,533,472) |
| Net Assets |
| Beginning of period | 767,813,979 | 812,347,451 |
| End of period | $893,988,372 | $ 767,813,979 |
The notes to the financial statements are an integral part of, and should be read in conjunction with, the financial statements.
15
Financial Highlights selected per share data and ratios
| | Six months ended
June 30,
2021* | | Year Ended December 31, |
| Initial Class | 2020 | | 2019 | | 2018 | | 2017 | | 2016 |
| Net asset value at beginning of period | $ 28.28 | | $ 26.83 | | $ 25.23 | | $ 29.75 | | $ 25.60 | | $ 25.43 |
| Net investment income (loss) (a) | 0.10 | | 0.28 | | 0.38 | | 0.42 | | 0.43 | | 0.40 |
| Net realized and unrealized gain (loss) on investments | 4.50 | | 3.68 | | 5.74 | | (1.69) | | 5.30 | | 1.82 |
| Total from investment operations | 4.60 | | 3.96 | | 6.12 | | (1.27) | | 5.73 | | 2.22 |
| Less distributions: | | | | | | | | | | | |
| From net investment income | — | | (0.43) | | (0.43) | | (0.49) | | (0.39) | | (0.40) |
| From net realized gain on investments | — | | (2.08) | | (4.09) | | (2.76) | | (1.19) | | (1.65) |
| Total distributions | — | | (2.51) | | (4.52) | | (3.25) | | (1.58) | | (2.05) |
| Net asset value at end of period | $ 32.88 | | $ 28.28 | | $ 26.83 | | $ 25.23 | | $ 29.75 | | $ 25.60 |
| Total investment return (b) | 16.27%(c) | | 15.55% | | 26.21% | | (5.84)% | | 22.83% | | 9.12% |
| Ratios (to average net assets)/Supplemental Data: | | | | | | | | | | | |
| Net investment income (loss) | 0.66%†† | | 1.09% | | 1.37% | | 1.40% | | 1.53% | | 1.57% |
| Net expenses (d) | 0.57%†† | | 0.58% | | 0.58% | | 0.57% | | 0.57% | | 0.58% |
| Portfolio turnover rate | 22% | | 143% | | 119% | | 125% | | 98% | | 125% |
| Net assets at end of period (in 000’s) | $ 602,746 | | $ 497,644 | | $ 543,355 | | $ 454,804 | | $ 639,120 | | $ 577,310 |
| * | Unaudited. |
| †† | Annualized. |
| (a) | Per share data based on average shares outstanding during the period. |
| (b) | Total return does not reflect any deduction of sales charges, mortality and expense charges, contract charges or administrative charges. For periods of less than one year, total return is not annualized. |
| (c) | Total investment return may reflect adjustments to conform to generally accepted accounting principles. |
| (d) | In addition to the fees and expenses which the Portfolio bears directly, it also indirectly bears a pro-rata share of the fees and expenses of the underlying funds in which it invests. Such indirect expenses are not included in the above expense ratios. |
| | Six months ended
June 30,
2021* | | Year Ended December 31, |
| Service Class | 2020 | | 2019 | | 2018 | | 2017 | | 2016 |
| Net asset value at beginning of period | $ 27.87 | | $ 26.47 | | $ 24.94 | | $ 29.45 | | $ 25.37 | | $ 25.23 |
| Net investment income (loss) (a) | 0.06 | | 0.21 | | 0.31 | | 0.35 | | 0.35 | | 0.33 |
| Net realized and unrealized gain (loss) on investments | 4.42 | | 3.62 | | 5.67 | | (1.68) | | 5.26 | | 1.81 |
| Total from investment operations | 4.48 | | 3.83 | | 5.98 | | (1.33) | | 5.61 | | 2.14 |
| Less distributions: | | | | | | | | | | | |
| From net investment income | — | | (0.35) | | (0.36) | | (0.42) | | (0.34) | | (0.35) |
| From net realized gain on investments | — | | (2.08) | | (4.09) | | (2.76) | | (1.19) | | (1.65) |
| Total distributions | — | | (2.43) | | (4.45) | | (3.18) | | (1.53) | | (2.00) |
| Net asset value at end of period | $ 32.35 | | $ 27.87 | | $ 26.47 | | $ 24.94 | | $ 29.45 | | $ 25.37 |
| Total investment return (b) | 16.07%(c) | | 15.26% | | 25.89% | | (6.08)% | | 22.52% | | 8.85% |
| Ratios (to average net assets)/Supplemental Data: | | | | | | | | | | | |
| Net investment income (loss) | 0.41%†† | | 0.83% | | 1.12% | | 1.17% | | 1.28% | | 1.32% |
| Net expenses (d) | 0.82%†† | | 0.83% | | 0.83% | | 0.82% | | 0.82% | | 0.83% |
| Portfolio turnover rate | 22% | | 143% | | 119% | | 125% | | 98% | | 125% |
| Net assets at end of period (in 000’s) | $ 291,242 | | $ 270,170 | | $ 268,992 | | $ 237,094 | | $ 268,526 | | $ 194,992 |
| * | Unaudited. |
| †† | Annualized. |
| (a) | Per share data based on average shares outstanding during the period. |
| (b) | Total return does not reflect any deduction of sales charges, mortality and expense charges, contract charges or administrative charges. For periods of less than one year, total return is not annualized. |
| (c) | Total investment return may reflect adjustments to conform to generally accepted accounting principles. |
| (d) | In addition to the fees and expenses which the Portfolio bears directly, it also indirectly bears a pro-rata share of the fees and expenses of the underlying funds in which it invests. Such indirect expenses are not included in the above expense ratios. |
The notes to the financial statements are an integral part of, and should be read in conjunction with, the financial statements.
| 16 | MainStay VP Wellington U.S. Equity Portfolio |
Notes to Financial Statements (Unaudited)
Note 1–Organization and Business
MainStay VP Funds Trust (the “Fund”) was organized as a Delaware statutory trust on February 1, 2011. The Fund is registered under the Investment Company Act of 1940, as amended (the “1940 Act”), as an open-end management investment company. The Fund is comprised of thirty-one separate series (collectively referred to as the “Portfolios”). These financial statements and notes relate to the MainStay VP Wellington U.S. Equity Portfolio (formerly known as MainStay VP MacKay Common Stock Portfolio) (the "Portfolio"), a "diversified” portfolio, as that term is defined in the 1940 Act, as interpreted or modified by regulatory authorities having jurisdiction, from time to time.
Shares of the Portfolio are currently offered to certain separate accounts to fund variable annuity policies and variable universal life insurance policies issued by New York Life Insurance and Annuity Corporation (“NYLIAC”), a wholly-owned subsidiary of New York Life Insurance Company (“New York Life”) and may also be offered to fund variable annuity policies and variable universal life insurance policies issued by other insurance companies. NYLIAC allocates shares of the Portfolios to, among others, certain NYLIAC separate accounts. Shares of the Portfolio are also offered to the MainStay VP Conservative Allocation Portfolio, MainStay VP Moderate Allocation Portfolio, MainStay VP Growth Allocation Portfolio (formerly known as MainStay VP Moderate Growth Allocation Portfolio) and MainStay VP Equity Allocation Portfolio (formerly known as MainStay VP Growth Allocation Portfolio), which operate as “funds-of-funds," and other variable insurance funds.
The following table lists the Portfolio's share classes that have been registered and commenced operations:
| Class | Commenced Operations |
| Initial Class | January 23, 1984 |
| Service Class | June 5, 2003 |
Shares of the Portfolio are offered and are redeemed at a price equal to their respective net asset value (“NAV”) per share. No sales or redemption charge is applicable to the purchase or redemption of the Portfolio's shares. Under the terms of the Fund’s multiple class plan, adopted pursuant to Rule 18f-3 under the 1940 Act, the classes differ in that, among other things, Service Class shares of the Portfolio pay a combined distribution and service fee of 0.25% of average daily net assets attributable to Service Class shares of the Portfolio to the Distributor (as defined in Note 3(B)) pursuant to a plan adopted in accordance with Rule 12b-1 under the 1940 Act. Contract owners of variable annuity contracts purchased after June 2, 2003, are permitted to invest only in the Service Class shares.
The Portfolio's investment objective is to seek long-term growth of capital.
Note 2–Significant Accounting Policies
The Portfolio is an investment company and accordingly follows the investment company accounting and reporting guidance of the Financial Accounting Standards Board (“FASB”) Accounting Standard Codification Topic 946 Financial Services—Investment Companies. The Portfolio prepares its financial statements in accordance with generally accepted accounting principles (“GAAP”) in the United States of America and follows the significant accounting policies described below.
(A) Securities Valuation. Investments are usually valued as of the close of regular trading on the New York Stock Exchange (the "Exchange") (usually 4:00 p.m. Eastern time) on each day the Portfolio is open for business ("valuation date").
The Board of Trustees of the Fund (the "Board") adopted procedures establishing methodologies for the valuation of the Portfolio's securities and other assets and delegated the responsibility for valuation determinations under those procedures to the Valuation Committee of the Fund (the “Valuation Committee”). The procedures state that, subject to the oversight of the Board and unless otherwise noted, the responsibility for the day-to-day valuation of portfolio assets (including fair value measurements for the Portfolio's assets and liabilities) rests with New York Life Investment Management LLC (“New York Life Investments” or the "Manager"), aided to whatever extent necessary by the Subadvisor (as defined in Note 3(A)). To assess the appropriateness of security valuations, the Manager, the Subadvisor or the Portfolio's third-party service provider, who is subject to oversight by the Manager, regularly compares prior day prices, prices on comparable securities and the sale prices to the prior and current day prices and challenges prices with changes exceeding certain tolerance levels with third-party pricing services or broker sources.
The Board authorized the Valuation Committee to appoint a Valuation Subcommittee (the “Subcommittee”) to establish the prices of securities for which market quotations are not readily available or the prices of which are not otherwise readily determinable under the procedures. The Subcommittee meets (in person, via electronic mail or via teleconference) on an as-needed basis. The Valuation Committee meets to ensure that actions taken by the Subcommittee were appropriate.
For those securities valued through either a standardized fair valuation methodology or a fair valuation measurement, the Subcommittee deals with such valuation and the Valuation Committee reviews and affirms, if appropriate, the reasonableness of the valuation based on such methodologies and measurements on a regular basis after considering information that is reasonably available and deemed relevant by the Valuation Committee. Any action taken by the Subcommittee with respect to the valuation of a portfolio security or other asset is submitted for review and ratification (if appropriate) to the Valuation Committee and the Board at the next regularly scheduled meeting.
"Fair value" is defined as the price the Portfolio would reasonably expect to receive upon selling an asset or liability in an orderly transaction to an independent buyer in the principal or most advantageous market for the
Notes to Financial Statements (Unaudited) (continued)
asset or liability. Fair value measurements are determined within a framework that establishes a three-tier hierarchy that maximizes the use of observable market data and minimizes the use of unobservable inputs to establish a classification of fair value measurements for disclosure purposes. "Inputs" refer broadly to the assumptions that market participants would use in pricing the asset or liability, including assumptions about risk, such as the risk inherent in a particular valuation technique used to measure fair value using a pricing model and/or the risk inherent in the inputs for the valuation technique. Inputs may be observable or unobservable. Observable inputs reflect the assumptions market participants would use in pricing the asset or liability based on market data obtained from sources independent of the Portfolio. Unobservable inputs reflect the Portfolio’s own assumptions about the assumptions market participants would use in pricing the asset or liability based on the information available. The inputs or methodology used for valuing assets or liabilities may not be an indication of the risks associated with investing in those assets or liabilities. The three-tier hierarchy of inputs is summarized below.
| • | Level 1—quoted prices in active markets for an identical asset or liability |
| • | Level 2—other significant observable inputs (including quoted prices for a similar asset or liability in active markets, interest rates and yield curves, prepayment speeds, credit risk, etc.) |
| • | Level 3—significant unobservable inputs (including the Portfolio's own assumptions about the assumptions that market participants would use in measuring fair value of an asset or liability) |
The level of an asset or liability within the fair value hierarchy is based on the lowest level of an input, both individually and in the aggregate, that is significant to the fair value measurement. The aggregate value by input level of the Portfolio’s assets and liabilities as of June 30, 2021, is included at the end of the Portfolio of Investments.
The Portfolio may use third-party vendor evaluations, whose prices may be derived from one or more of the following standard inputs, among others:
| • Broker/dealer quotes | • Benchmark securities |
| • Two-sided markets | • Reference data (corporate actions or material event notices) |
| • Bids/offers | • Monthly payment information |
| • Industry and economic events | • Reported trades |
An asset or liability for which market values cannot be measured using the methodologies described above is valued by methods deemed reasonable in good faith by the Valuation Committee, following the procedures established by the Board, to represent fair value. Under these procedures, the Portfolio generally uses a market-based approach which may use related or comparable assets or liabilities, recent transactions, market multiples, book values and other relevant information. The Portfolio may also use an income-based valuation approach in which the anticipated future cash flows of the asset or liability are discounted to
calculate fair value. Discounts may also be applied due to the nature and/or duration of any restrictions on the disposition of the asset or liability. Fair value represents a good faith approximation of the value of a security. Fair value determinations involve the consideration of a number of subjective factors, an analysis of applicable facts and circumstances and the exercise of judgment. As a result, it is possible that the fair value for a security determined in good faith in accordance with the Portfolio's valuation procedures may differ from valuations for the same security determined by other funds using their own valuation procedures. Although the Portfolio's valuation procedures are designed to value a security at the price the Portfolio may reasonably expect to receive upon the security's sale in an orderly transaction, there can be no assurance that any fair value determination thereunder would, in fact, approximate the amount that the Portfolio would actually realize upon the sale of the security or the price at which the security would trade if a reliable market price were readily available. During the six-month period ended June 30, 2021, there were no material changes to the fair value methodologies.
Securities which may be valued in this manner include, but are not limited to: (i) a security for which trading has been halted or suspended; (ii) a debt security that has recently gone into default and for which there is not a current market quotation; (iii) a security of an issuer that has entered into a restructuring; (iv) a security that has been delisted from a national exchange; (v) a security for which the market price is not readily available from a third-party pricing source or, if so provided, does not, in the opinion of the Manager or the Subadvisor, reflect the security's market value; (vi) a security subject to trading collars for which no or limited trading takes place; and (vii) a security whose principal market has been temporarily closed at a time when, under normal conditions, it would be open. Securities valued in this manner are generally categorized as Level 3 in the hierarchy. No securities held by the Portfolio as of June 30, 2021 were fair valued in such a manner.
Equity securities are valued at the last quoted sales prices as of the close of regular trading on the relevant exchange on each valuation date. Securities that are not traded on the valuation date are valued at the mean of the last quoted bid and ask prices. Prices are normally taken from the principal market in which each security trades. These securities are generally categorized as Level 1 in the hierarchy.
Investments in mutual funds, including money market funds, are valued at their respective NAVs at the close of business each day on the valuation date. These securities are generally categorized as Level 1 in the hierarchy.
Temporary cash investments acquired in excess of 60 days to maturity at the time of purchase are valued using the latest bid prices or using valuations based on a matrix system (which considers such factors as security prices, yields, maturities and ratings), both as furnished by independent pricing services. Temporary cash investments that mature in 60 days or less at the time of purchase ("Short-Term Investments") are valued using the amortized cost method of valuation, unless the use of such method would be inappropriate. The amortized cost method involves valuing a security at its cost on the date of purchase and thereafter
| 18 | MainStay VP Wellington U.S. Equity Portfolio |
assuming a constant amortization to maturity of the difference between such cost and the value on maturity date. Amortized cost approximates the current fair value of a security. Securities valued using the amortized cost method are not valued using quoted prices in an active market and are generally categorized as Level 2 in the hierarchy.
The information above is not intended to reflect an exhaustive list of the methodologies that may be used to value portfolio investments. The valuation procedures permit the use of a variety of valuation methodologies in connection with valuing portfolio investments. The methodology used for a specific type of investment may vary based on the market data available or other considerations. The methodologies summarized above may not represent the specific means by which portfolio investments are valued on any particular business day.
(B) Income Taxes. The Portfolio's policy is to comply with the requirements of the Internal Revenue Code of 1986, as amended (the “Internal Revenue Code”), applicable to regulated investment companies and to distribute all of its taxable income to the shareholders of the Portfolio within the allowable time limits.
The Manager evaluates the Portfolio’s tax positions to determine if the tax positions taken meet the minimum recognition threshold in connection with accounting for uncertainties in income tax positions taken or expected to be taken for the purposes of measuring and recognizing tax liabilities in the financial statements. Recognition of tax benefits of an uncertain tax position is permitted only to the extent the position is “more likely than not” to be sustained assuming examination by taxing authorities. The Manager analyzed the Portfolio's tax positions taken on federal, state and local income tax returns for all open tax years (for up to three tax years) and has concluded that no provisions for federal, state and local income tax are required in the Portfolio's financial statements. The Portfolio's federal, state and local income tax and federal excise tax returns for tax years for which the applicable statutes of limitations have not expired are subject to examination by the Internal Revenue Service and state and local departments of revenue.
(C) Dividends and Distributions to Shareholders. Dividends and distributions are recorded on the ex-dividend date. The Portfolio intends to declare and pay dividends from net investment income and distributions from net realized capital and currency gains, if any, at least annually. Unless a shareholder elects otherwise, all dividends and distributions are reinvested at NAV in the same class of shares of the Portfolio. Dividends and distributions to shareholders are determined in accordance with federal income tax regulations and may differ from determinations using GAAP.
(D) Security Transactions and Investment Income. The Portfolio records security transactions on the trade date. Realized gains and losses on security transactions are determined using the identified cost method. Dividend income is recognized on the ex-dividend date, net of any foreign tax withheld at the source, and interest income is accrued as earned using the effective interest rate method. Distributions received from real
estate investment trusts may be classified as dividends, capital gains and/or return of capital.
Investment income and realized and unrealized gains and losses on investments of the Portfolio are allocated pro rata to the separate classes of shares based upon their relative net assets on the date the income is earned or realized and unrealized gains and losses are incurred.
(E) Expenses. Expenses of the Fund are allocated to the individual Portfolios in proportion to the net assets of the respective Portfolios when the expenses are incurred, except where direct allocations of expenses can be made. Expenses (other than fees incurred under the distribution and service plans, further discussed in Note 3(B), which are charged directly to the Service Class shares) are allocated to separate classes of shares pro rata based upon their relative net assets on the date the expenses are incurred. The expenses borne by the Portfolio, including those of related parties to the Portfolio, are shown in the Statement of Operations.
Additionally, the Portfolio may invest in exchange-traded funds ("ETFs") and mutual funds, which are subject to management fees and other fees that may cause the costs of investing in ETFs and mutual funds to be greater than the costs of owning the underlying securities directly. These indirect expenses of ETFs and mutual funds are not included in the amounts shown as expenses in the Statement of Operations or in the expense ratios included in the Financial Highlights.
(F) Use of Estimates. In preparing financial statements in conformity with GAAP, the Manager makes estimates and assumptions that affect the reported amounts and disclosures in the financial statements. Actual results could differ from those estimates and assumptions.
(G) Securities Lending. In order to realize additional income, the Portfolio may engage in securities lending, subject to the limitations set forth in the 1940 Act and relevant guidance by the staff of the Securities and Exchange Commission (“SEC”). If the Portfolio engages in securities lending, the Portfolio will lend through its custodian, JPMorgan Chase Bank, N.A., ("JPMorgan"), acting as securities lending agent on behalf of the Portfolio. Under the current arrangement, JPMorgan will manage the Portfolio's collateral in accordance with the securities lending agency agreement between the Portfolio and JPMorgan, and indemnify the Portfolio against counterparty risk. The loans will be collateralized by cash (which may be invested in a money market fund) and/or non-cash collateral (which may include U.S. Treasury securities and/or U.S. government agency securities issued or guaranteed by the United States government or its agencies or instrumentalities) at least equal at all times to the market value of the securities loaned. The Portfolio bears the risk of delay in recovery of, or loss of rights in, the securities loaned. The Portfolio may also record a realized gain or loss on securities deemed sold due to a borrower’s inability to return securities on loan. The Portfolio bears the risk of any loss on investment of cash collateral. The Portfolio will receive compensation for lending its securities in the form of fees or it will retain a portion of interest earned on the investment of any cash collateral. The Portfolio will also continue to receive interest and dividends
Notes to Financial Statements (Unaudited) (continued)
on the securities loaned and any gain or loss in the market price of the securities loaned that may occur during the term of the loan will be for the account of the Portfolio. Income earned from securities lending activities, if any, is reflected in the Statement of Operations. As of June 30, 2021, the Portfolio did not have any portfolio securities on loan.
Prior to February 22, 2021, these services were provided by State Street Bank and Trust Company (“State Street”).
(H) Indemnifications. Under the Fund’s organizational documents, its officers and trustees are indemnified against certain liabilities that may arise out of performance of their duties to the Fund. Additionally, in the normal course of business, the Portfolio enters into contracts with third-party service providers that contain a variety of representations and warranties and that may provide general indemnifications. The Portfolio's maximum exposure under these arrangements is unknown, as this would involve future claims that may be made against the Portfolio that have not yet occurred. The Manager believes that the risk of loss in connection with these potential indemnification obligations is remote. However, there can be no assurance that material liabilities related to such obligations will not arise in the future, which could adversely impact the Portfolio.
Note 3–Fees and Related Party Transactions
(A) Manager and Subadvisor. New York Life Investments, a registered investment adviser and an indirect, wholly-owned subsidiary of New York Life, serves as the Portfolio's Manager, pursuant to an Amended and Restated Management Agreement ("Management Agreement"). The Manager provides offices, conducts clerical, recordkeeping and bookkeeping services and keeps most of the financial and accounting records required to be maintained by the Portfolio. Except for the portion of salaries and expenses that are the responsibility of the Portfolio, the Manager pays the salaries and expenses of all personnel affiliated with the Portfolio and certain operational expenses of the Portfolio. The Portfolio reimburses New York Life Investments in an amount equal to the portion of the compensation of the Chief Compliance Officer attributable to the Portfolio. The Portfolio’s subadvisor changed effective May 1, 2021, due to the replacement of MacKay Shields LLC ("MacKay Shields") as the Portfolio’s subadvisor and the appointment of Wellington Management Company LLP (“Wellington” or the “Subadvisor”) as the Portfolio’s subadvisor. Wellington, a registered investment adviser, is responsible for the day-to-day portfolio management of the Portfolio. Pursuant to the terms of a Subadvisory Agreement ("Subadvisory Agreement") between New York Life Investments and Wellington, New York Life Investments pays for the services of the Subadvisor.
Pursuant to the Management Agreement, the Fund pays the Manager, on behalf of the Portfolio, a monthly fee for the services performed and the facilities furnished at an annual rate of the Portfolio's average daily net assets as follows: 0.55% up to $500 million; 0.525% from $500 million to $1 billion; and 0.50% in excess of $1 billion. During the six-month period ended June 30, 2021, the effective management fee rate was 0.54%
During the six-month period ended June 30, 2021, New York Life Investments earned fees from the Portfolio in the amount of $2,227,357 and paid MacKay Shields and Wellington $726,612 and $337,696, respectively.
JPMorgan provides sub-administration and sub-accounting services to the Portfolio pursuant to an agreement with New York Life Investments. These services include calculating the daily NAVs of the Portfolio, maintaining the general ledger and sub-ledger accounts for the calculation of the Portfolio's NAVs, and assisting New York Life Investments in conducting various aspects of the Portfolio's administrative operations. For providing these services to the Portfolio, JPMorgan is compensated by New York Life Investments.
Prior to February 22, 2021, these services were provided by State Street.
Pursuant to an agreement between the Fund and New York Life Investments, New York Life Investments is responsible for providing or procuring certain regulatory reporting services for the Portfolio. The Portfolio will reimburse New York Life Investments for the actual costs incurred by New York Life Investments in connection with providing or procuring these services for the Portfolio.
(B) Distribution and Service Fees. The Fund, on behalf of the Portfolio, has entered into a distribution agreement with NYLIFE Distributors LLC (the “Distributor”), an affiliate of New York Life Investments. The Portfolio has adopted a distribution plan (the “Plan”) in accordance with the provisions of Rule 12b-1 under the 1940 Act. Under the Plan, the Distributor has agreed to provide, through its affiliates or independent third parties, various distribution-related, shareholder and administrative support services to the Service Class shareholders. For its services, the Distributor is entitled to a combined distribution and service fee accrued daily and paid monthly at an annual rate of 0.25% of the average daily net assets attributable to the Service Class shares of the Portfolio.
| 20 | MainStay VP Wellington U.S. Equity Portfolio |
(C) Investments in Affiliates (in 000’s). During the six-month period ended June 30, 2021, purchases and sales transactions, income earned from investments and shares held of investment companies managed by New York Life Investments or its affiliates were as follows:
| Affiliated Investment Companies | Value,
Beginning
of Period | Purchases
at Cost | Proceeds
from
Sales | Net
Realized
Gain/(Loss)
on Sales | Change in
Unrealized
Appreciation/
(Depreciation) | Value,
End of
Period | Dividend
Income | Other
Distributions | Shares
End of
Period |
| MainStay U.S. Government Liquidity Fund | $ 2,314 | $ 85,626 | $ (78,033) | $ — | $ — | $ 9,907 | $ —(a) | $ — | 9,907 |
Note 4-Federal Income Tax
As of June 30, 2021, the cost and unrealized appreciation (depreciation) of the Portfolio’s investment portfolio, including applicable derivative contracts and other financial instruments, as determined on a federal income tax basis, were as follows:
| | Federal Tax
Cost | Gross
Unrealized
Appreciation | Gross
Unrealized
(Depreciation) | Net
Unrealized
Appreciation/
(Depreciation) |
| Investments in Securities | $762,718,292 | $141,348,864 | $(10,572,561) | $130,776,303 |
During the year ended December 31, 2020, the tax character of distributions paid as reflected in the Statements of Changes in Net Assets was as follows:
| | 2020 |
| Distributions paid from: | |
| Ordinary Income | $19,229,381 |
| Long-Term Capital Gains | 43,129,250 |
| Total | $62,358,631 |
Note 5–Custodian
JPMorgan is the custodian of cash and securities held by the Portfolio. Custodial fees are charged to the Portfolio based on the Portfolio's net assets and/or the market value of securities held by the Portfolio and the number of certain transactions incurred by the Portfolio.
Prior to February 22, 2021, these services were provided by State Street. The services provided by State Street were a direct expense of the Portfolio and are included in the Statement of Operations as Custodian fees which totaled $3,859 for the period January 1, 2021 through February 21, 2021.
Note 6–Line of Credit
The Portfolio and certain other funds managed by New York Life Investments maintain a line of credit with a syndicate of banks in order to secure a source of funds for temporary purposes to meet unanticipated or excessive redemption requests.
Effective July 27, 2021, under the credit agreement (the “Credit Agreement”), the aggregate commitment amount is $600,000,000 with
an additional uncommitted amount of $100,000,000. The commitment fee is an annual rate of 0.15% of the average commitment amount payable quarterly, regardless of usage, to JPMorgan, who serves as the agent to the syndicate. The commitment fee is allocated among the Portfolio and certain other funds managed by New York Life Investments based upon their respective net assets and other factors. Interest on any revolving credit loan is charged based upon the Federal Funds Rate or the one-month London Interbank Offered Rate ("LIBOR"), whichever is higher. The Credit Agreement expires on July 26, 2022, although the Portfolio, certain other funds managed by New York Life Investments and the syndicate of banks may renew the Credit Agreement for an additional year on the same or different terms or enter into a credit agreement with a different syndicate of banks. Prior to July 27, 2021, the aggregate commitment amount and the commitment fee were the same as those under the current Credit Agreement. During the six-month period ended June 30, 2021, there were no borrowings made or outstanding with respect to the Portfolio under the Credit Agreement.
Note 7–Interfund Lending Program
Pursuant to an exemptive order issued by the SEC, the Portfolio, along with certain other funds managed by New York Life Investments, may participate in an interfund lending program. The interfund lending program provides an alternative credit facility that permits the Portfolio and certain other funds managed by New York Life Investments to lend or borrow money for temporary purposes directly to or from one another, subject to the conditions of the exemptive order. During the six-month period ended June 30, 2021, there were no interfund loans made or outstanding with respect to the Portfolio.
Note 8–Purchases and Sales of Securities (in 000’s)
During the six-month period ended June 30, 2021, purchases and sales of securities, other than short-term securities, were $189,308 and $179,712, respectively.
Note 9–Capital Share Transactions
Transactions in capital shares for the six-month period ended June 30, 2021 and the year ended December 31, 2020, were as follows:
Notes to Financial Statements (Unaudited) (continued)
| Initial Class | Shares | Amount |
| Period ended June 30, 2021: | | |
| Shares sold | 2,921,509 | $ 90,733,745 |
| Shares redeemed | (2,185,238) | (68,849,134) |
| Net increase (decrease) | 736,271 | $ 21,884,611 |
| Year ended December 31, 2020: | | |
| Shares sold | 2,990,187 | $ 77,797,974 |
| Shares issued to shareholders in reinvestment of distributions | 1,546,962 | 40,145,517 |
| Shares redeemed | (7,190,684) | (182,095,530) |
| Net increase (decrease) | (2,653,535) | $ (64,152,039) |
| |
| Service Class | Shares | Amount |
| Period ended June 30, 2021: | | |
| Shares sold | 138,469 | $ 4,086,093 |
| Shares redeemed | (832,555) | (25,072,410) |
| Net increase (decrease) | (694,086) | $ (20,986,317) |
| Year ended December 31, 2020: | | |
| Shares sold | 742,721 | $ 17,813,261 |
| Shares issued to shareholders in reinvestment of distributions | 868,198 | 22,213,114 |
| Shares redeemed | (2,077,311) | (52,825,490) |
| Net increase (decrease) | (466,392) | $ (12,799,115) |
Note 10-Litigation
The Portfolio has been named as a defendant in the case entitled Kirschner v. FitzSimons, No. 12-2652 (S.D.N.Y.) (the “FitzSimons action”) as a result of its ownership of shares in the Tribune Company (“Tribune”) in 2007 when Tribune effected a leveraged buyout transaction (“LBO”) by which Tribune converted to a privately-held company. In its complaint, the plaintiff asserts claims against certain insiders, shareholders, professional advisers, and others involved in the LBO.
Separately, the complaint also seeks to obtain from former Tribune shareholders, including the Portfolio, any proceeds they received in connection with the LBO. The sole claim and cause of action brought against the Portfolio is for fraudulent conveyance pursuant to United States Bankruptcy Code Section 548(a)(1)(A).
In June 2011, certain Tribune creditors filed numerous additional actions asserting state law constructive fraudulent conveyance claims (the “SLCFC actions”) against specifically-named former Tribune shareholders and, in some cases, putative defendant classes comprised of former Tribune shareholders. One of the SLCFC actions, entitled Deutsche Bank Trust Co. Americas v. Blackrock Institutional Trust Co., No. 11-9319 (S.D.N.Y.) (the “Deutsche Bank action”), named the Portfolio as a defendant.
The FitzSimons action and Deutsche Bank action have been consolidated with the majority of the other Tribune LBO-related lawsuits in a multidistrict litigation proceeding entitled In re Tribune Co. Fraudulent Conveyance Litig., No. 11-md-2296 (S.D.N.Y.) (the “MDL Proceeding”).
On September 23, 2013, the District Court granted the defendants’ motion to dismiss the SLCFC actions, including the Deutsche Bank action, on the basis that the plaintiffs did not have standing to pursue their claims. On September 30, 2013, the plaintiffs in the SLCFC actions filed a notice of appeal to the United States Court of Appeals for the Second Circuit. On October 28, 2013, the defendants filed a joint notice of cross-appeal of that same order. On November 5, 2014, the Second Circuit Court of Appeals held an oral argument on appeal. On March 29, 2016, the United States Court of Appeals for the Second Circuit issued its opinion on the appeal of the SLCFC actions. The appeals court affirmed the District Court’s dismissal of those lawsuits, but on different grounds than the District Court. The appeals court held that while the plaintiffs have standing under the U.S. Bankruptcy Code, their claims were pre-empted by Section 546(e) of the Bankruptcy Code—the statutory safe harbor for settlement payments. On April 12, 2016, the plaintiffs in the SLCFC actions filed a petition seeking rehearing en banc before the appeals court. On July 22, 2016, the appeals court denied the petition. On September 9, 2016, the plaintiffs filed a petition for writ of certiorari in the U.S. Supreme Court challenging the Second Circuit’s decision that the safe harbor of Section 546(e) applied to their claims. Certain shareholder defendants filed a joint brief in opposition to the petition for certiorari on October 24, 2016. The plaintiffs filed a reply in support of the petition on November 4, 2016. On April 3, 2018, Justice Kennedy and Justice Thomas issued a “Statement” related to the petition for certiorari suggesting that the Second Circuit and/or District Court may want to take steps to reexamine the application of the Section 546(e) safe harbor to the previously dismissed state law constructive fraudulent transfer claims based on the Supreme Court’s decision in Merit Management Group LP v. FTI Consulting, Inc. On April 10, 2018, the plaintiffs filed in the Second Circuit a motion for that court to recall its mandate, vacate its prior decision, and remand to the District Court for further proceedings consistent with Merit Management. On April 20, 2018, the shareholder defendants filed a response to the plaintiffs’ motion to recall the mandate. On May 15, 2018, the Second Circuit issued an order recalling the mandate “in anticipation of further panel review.” On December 19, 2019, the Second Circuit issued an amended opinion that again affirmed the district court’s ruling on the basis that plaintiffs’ claims were preempted by Section 546(e) of the Bankruptcy Code. Plaintiffs filed a motion for rehearing and rehearing en banc on January 2, 2020, which was denied on February 6, 2020. Plaintiffs filed a new petition for certiorari with the Supreme Court on July 6, 2020. In that petition, plaintiffs stated that “[t]o make it more likely that there will be a quorum for this petition,” they have “abandon[ed] the case and let the judgment below stand” with respect to certain defendants. That list did not include the Portfolio. Defendants filed an opposition to the certiorari petition on August 26, 2020. Plaintiffs filed a reply in support of the petition for certiorari on September 8, 2020. On March 12, 2021, the Solicitor General filed an amicus brief recommending that certiorari be denied. Plaintiffs filed a supplemental brief in response to the Solicitor General’s amicus brief on March 31, 2021, and Defendants filed a supplemental brief on April 1, 2021. The Supreme Court denied the petition for certiorari on April 19, 2021.
| 22 | MainStay VP Wellington U.S. Equity Portfolio |
On August 2, 2013, the plaintiff in the FitzSimons action filed a Fifth Amended Complaint. On May 23, 2014, the defendants filed motions to dismiss the FitzSimons action, including a global motion to dismiss Count I, which is the claim brought against former Tribune shareholders for intentional fraudulent conveyance under U.S. federal law. On January 6, 2017, the United States District Court for the Southern District of New York granted the shareholder defendants’ motion to dismiss the intentional fraudulent conveyance claim in the FitzSimons action. In dismissing the intentional fraudulent conveyance claim, the Court denied the plaintiff’s request to amend the complaint. The Court’s order is not immediately appealable, but the plaintiff has asked the Court to direct entry of a final judgment in order to make the order immediately appealable. On February 23, 2017, the Court issued an order stating that it intends to permit an interlocutory appeal of the dismissal order, but will wait to do so until it has resolved outstanding motions to dismiss filed by other defendants.
On July 18, 2017, the plaintiff submitted a letter to the District Court seeking leave to amend its complaint to add a constructive fraudulent transfer claim. The shareholder defendants opposed that request.
On August 24, 2017, the Court denied the plaintiff’s request without prejudice to renewal of the request in the event of an intervening change in the law. On March 8, 2018, the plaintiff renewed his request for leave to file a motion to amend the complaint to assert a constructive fraudulent transfer claim based on the Supreme Court’s ruling in Merit Management. The shareholder defendants opposed that request. On June 18, 2018, the District Court ordered that the request would be stayed pending further action by the Second Circuit in the still-pending appeal, discussed above. On December 18, 2018, the plaintiff filed a letter with the District Court requesting that the stay be dissolved in order to permit briefing on the motion to amend the complaint and indicating the plaintiff’s intention to file another motion to amend the complaint to reinstate claims for intentional fraudulent transfer. The shareholder defendants opposed that request. On January 14, 2019, the Court held a case management conference, during which the Court stated that it would not lift the stay prior to further action from the Second Circuit. The Court stated that it would allow the plaintiff to file a motion to amend to try to reinstate its intentional fraudulent transfer claim. On January 23, 2019, the Court ordered the parties still facing pending claims to participate in a mediation. On March 27, 2019, the Court held a telephone conference and decided to allow the plaintiff to file a motion for leave to amend. On April 4, 2019, the plaintiff filed a motion to amend the Fifth Amended Complaint to assert a federal constructive fraudulent transfer claim against certain shareholder defendants. On April 10, 2019, the shareholder defendants filed a brief in opposition to the plaintiff’s motion to amend. On April 12, 2019, the plaintiff filed a reply brief. The Court denied leave to amend the complaint on April 23, 2019. On June 13, 2019, the Court entered judgment pursuant to Rule 54(b), which would permit an appeal of the Court’s dismissal of the claim against the shareholder defendants. On July 15, 2019, the Trustee filed a notice of appeal to the Second Circuit. Appellant filed his brief on January 7, 2020. The shareholder defendants filed an opposition brief on April 27, 2020,
and Appellant filed a reply brief on May 18, 2020. The Court held oral argument on August 24, 2020. In addition, the District Court has entered two bar orders in connection with the plaintiff’s settlement with certain non-shareholder defendants. The orders bar claims against the settling defendants, but contain a judgment reduction provision that preserves the value of any potential claim by a shareholder defendant against a settling defendant. Specifically, the judgment reduction provision reduces the amount of money recoverable against a shareholder defendant to the extent the shareholder defendant could have recovered on a claim against a settling defendant.
The value of the proceeds received by the Portfolio in connection with the LBO and the Portfolio's cost basis in shares of Tribune was as follows:
| Portfolio | Proceeds | Cost Basis |
| MainStay VP Wellington U.S. Equity Portfolio | $1,300,602 | $1,174,184 |
At this stage of the proceedings, it would be difficult to assess with any reasonable certainty the probable outcome of the pending litigation or the effect, if any, on the Portfolio's net asset value.
Note 11–Other Matters
An outbreak of COVID-19, first detected in December 2019, has developed into a global pandemic and has resulted in travel restrictions, closure of international borders, certain businesses and securities markets, restrictions on securities trading activities, prolonged quarantines, supply chain disruptions, and lower consumer demand, as well as general concern and uncertainty. The continued impact of COVID-19 and related new variants is uncertain and could further adversely affect the global economy, national economies, individual issuers and capital markets in unforeseeable ways and result in a substantial and extended economic downturn. Developments that disrupt global economies and financial markets, such as COVID-19, may magnify factors that affect the Portfolio's performance.
Note 12–Subsequent Events
In connection with the preparation of the financial statements of the Portfolio as of and for the six-month period ended June 30, 2021, events and transactions subsequent to June 30, 2021, through the date the financial statements were issued have been evaluated by the Manager for possible adjustment and/or disclosure. No subsequent events requiring financial statement adjustment or disclosure have been identified.
Board Consideration and Approval of Subadvisory Agreement with Wellington Management Company LLP (Unaudited)
The Subadvisory Agreement between New York Life Investment Management LLC (“New York Life Investments”) and Wellington Management Company LLP (“Wellington”) with respect to the MainStay VP Wellington U.S. Equity Portfolio (formerly known as the MainStay VP MacKay Common Stock Portfolio) (“Portfolio”) (“New Subadvisory Agreement”), must be approved initially and, following an initial term of up to two years, is subject to annual review and approval by the Board of Trustees of MainStay VP Funds Trust (“Board” of the “Trust”) in accordance with Section 15 of the Investment Company Act of 1940, as amended (“1940 Act”). At its February 3, 2021 meeting, the Board, including the Trustees who are not an “interested person” (as such term is defined in the 1940 Act) of the Trust (“Independent Trustees”) voting separately, unanimously approved the New Subadvisory Agreement for an initial two-year period.
At meetings held on January 21, January 25 and February 3, 2021, the Board considered and approved New York Life Investments’ recommendations to appoint Wellington as the subadvisor to the Portfolio, to approve the New Subadvisory Agreement and to approve the related changes to the Portfolio’s principal investment strategies, name and investment process (the “Repositioning”), all effective on or about May 1, 2021. The Board noted that the material terms of the New Subadvisory Agreement are substantially identical to the terms of the then-current subadvisory agreement with MacKay Shields LLC (“MacKay”) with respect to the Portfolio, but that the subadvisory fee schedule under the New Subadvisory Agreement with Wellington includes fees that are lower at every level of assets than the subadvisory fees paid to MacKay under the then-current subadvisory agreement.
In reaching the decisions to approve the Repositioning and New Subadvisory Agreement, the Board considered information furnished by New York Life Investments and Wellington in connection with meetings of the Board and its Contracts, Investment and Risk and Compliance Oversight Committees held on January 21, January 25 and February 3, 2021, as well as other information furnished to the Board and its Committees throughout the year, as deemed relevant by the Trustees. In addition, the Board considered information previously provided to the Board in connection with its review of the subadvisory agreements for other funds in the MainStay Group of Funds, as deemed relevant to each Trustee. The Board also considered information furnished by Wellington in response to requests prepared on behalf of the Board, and in consultation with the Independent Trustees, by independent legal counsel to the Independent Trustees, which encompassed a variety of topics, including those summarized below.
The Board took into account information provided in connection with its meetings throughout the year, including, among other items, information regarding the legal standards and fiduciary obligations applicable to its consideration of the New Subadvisory Agreement and investment performance reports on the Portfolio as well as presentations from New York Life Investments and Wellington personnel. The contract review process, including the structure and format for materials provided to the Board, has been developed in consultation with the Board. The
Independent Trustees also met in executive sessions with their independent legal counsel and, for a portion thereof, with senior management of New York Life Investments.
In considering the Repositioning and the New Subadvisory Agreement, the Trustees reviewed and evaluated the information and factors they believed to reasonably be necessary and appropriate in light of legal advice furnished to them by independent legal counsel and through the exercise of their own business judgment. Although individual Trustees may have weighed certain factors or information differently, the factors considered by the Board are described in greater detail below and include, among other factors: (i) the nature, extent and quality of the services to be provided to the Portfolio by Wellington; (ii) the investment performance of the Portfolio, the qualifications of the proposed portfolio managers of the Portfolio and the historical investment performance of products managed by such portfolio managers with investment strategies similar to those of the Portfolio, as repositioned; (iii) the anticipated costs of the services to be provided, and profits expected to be realized, by Wellington from its relationship with the Portfolio; (iv) the extent to which economies of scale may be realized if the Portfolio grows and the extent to which economies of scale may benefit the Portfolio’s shareholders; and (v) the reasonableness of the Portfolio’s proposed subadvisory fee to be paid by New York Life Investments to Wellington and estimated total ordinary operating expenses. Although the Board recognized that comparisons between the Portfolio’s proposed fees and estimated expenses and those of other funds are imprecise given different terms of agreements, variations in fund strategies and other factors, the Board considered the reasonableness of the Portfolio’s proposed fees and estimated total ordinary operating expenses as compared to the peer funds identified by New York Life Investments.
Although individual Trustees may have weighed certain factors or information differently, the Board’s decisions to approve the Repositioning and the New Subadvisory Agreement were based on a consideration of the information provided to the Trustees throughout the year, such as presentations from Wellington personnel, as well as information furnished specifically in connection with the contract review process for the Portfolio, in each case as deemed relevant to each Trustee. The Trustees noted that, throughout the year, the Trustees would be afforded an opportunity to ask questions of, and request additional information or materials from, New York Life Investments and Wellington with respect to the Portfolio. The Board took note of New York Life Investments’ belief that Wellington, with its resources and historical investment performance track record for strategies similar to those of the Portfolio, as repositioned, is well qualified to serve as the Portfolio’s subadvisor. In addition to considering the above-referenced factors, the Board observed that in the marketplace, notably under variable life insurance policies and variable annuity contracts for which the Portfolio serves as an investment option, there are a range of investment options available to the Portfolio’s shareholders and such shareholders, having had the opportunity to consider other investment options, have chosen to invest in the Portfolio.
| 24 | MainStay VP Wellington U.S. Equity Portfolio |
The factors that figured prominently in the Board’s decisions to approve the Repositioning and the New Subadvisory Agreement are summarized in more detail below, and the Board did not consider any factor or information controlling in reaching such decisions.
Nature, Extent and Quality of Services Provided by Wellington
In considering the Repositioning and the New Subadvisory Agreement, the Board considered New York Life Investments’ responsibilities as manager of the Portfolio, noting that New York Life Investments is responsible for supervising the Portfolio’s subadvisor. The Board examined the nature, extent and quality of the investment advisory services that Wellington proposed to provide to the Portfolio. Further, the Board evaluated and/or examined the following with regard to Wellington:
| • | experience in providing investment advisory services; |
| • | experience in serving as advisor or subadvisor to other funds with similar strategies as those of the Portfolio, as repositioned, and the performance track record of those funds; |
| • | experience of investment advisory, senior management and administrative personnel; |
| • | overall legal and compliance environment, resources and history and policies and procedures in place with respect to matters that may involve conflicts of interest between the Portfolio’s investments and those of other accounts managed by Wellington; |
| • | New York Life Investments’ and Wellington’s belief that their respective compliance policies, procedures and systems are reasonably designed to prevent violation of the federal securities laws and their commitment to further developing and strengthening compliance programs relating to the MainStay Group of Funds generally and the Portfolio specifically; |
| • | ability to attract and retain qualified investment professionals and willingness to invest in personnel to service and support the Portfolio; |
| • | portfolio construction and risk management processes; |
| • | experience of the Portfolio’s proposed portfolio managers, including with respect to investment strategies similar to those of the Portfolio, as repositioned, the number of accounts managed by the portfolio managers and the method for compensating the portfolio managers; and |
| • | overall reputation, financial condition and assets under management. |
Based on these considerations, the Board concluded that the Portfolio would likely benefit from the nature, extent and quality of the proposed investment advisory services to be provided by Wellington.
Investment Performance
In evaluating the Portfolio’s investment performance, the Board considered investment performance results over various periods in light of the Portfolio’s investment objective, strategies and risks. The Board considered investment reports on, and analysis of, the Portfolio’s performance provided to the Board throughout the year. These reports
include, among other items, information on the Portfolio’s gross and net returns, the Portfolio’s investment performance compared to relevant investment categories and the Portfolio’s benchmarks, the Portfolio’s risk-adjusted investment performance and the Portfolio’s investment performance as compared to peer funds, as appropriate, as well as portfolio attribution information and commentary on the effect of market conditions.
The Board also gave weight to its discussions with senior management at New York Life Investments concerning the Portfolio’s investment performance and remediation efforts undertaken by New York Life Investments, and other alternatives to the Repositioning, and the New Subadvisory Agreement considered by New York Life Investments. In addition, the Board considered steps taken to seek to improve the Portfolio’s investment performance and discussions between the Portfolio’s current portfolio management team and the Investment Committee of the Board. The Board further considered that shareholders may benefit from Wellington’s investment process, including its portfolio construction and risk management processes. The Board noted that the Repositioning had not yet been implemented so an investment performance track record for the Portfolio, as repositioned, was not available.
The Board evaluated the Portfolio’s proposed portfolio management team, investment process, strategies and risks. The Board noted that Wellington currently manages one or more portfolios with investment strategies similar to those of the Portfolio, as repositioned. Additionally, the Board considered the historical performance of such portfolio or portfolios and other portfolios managed by the proposed portfolio managers for the Portfolio. Based on these considerations, the Board concluded that the Portfolio was likely to be managed responsibly and capably by Wellington.
Based on these considerations, the Board concluded that the selection of Wellington as the subadvisor to the Portfolio is likely to benefit the Portfolio’s long-term investment performance.
Costs of the Services to be Provided, and Profits to be Realized, by Wellington
The Board considered the anticipated costs of the services to be provided by Wellington under the New Subadvisory Agreement and the profits expected to be realized by Wellington due to its relationship with the Portfolio. The Board considered that Wellington’s subadvisory fee had been negotiated at arm’s-length by New York Life Investments and that these fees would be paid by New York Life Investments, not the Portfolio.
In evaluating the anticipated costs of the services to be provided by Wellington and profits expected to be realized by Wellington, the Board considered, among other factors, Wellington’s investments in, or willingness to invest in, personnel, systems, equipment and other resources and infrastructure to support and further enhance the services proposed to be provided to the Portfolio, and that New York Life Investments would be responsible for paying the subadvisory fee to Wellington. The Board also considered the financial resources of Wellington and acknowledged that Wellington must be in a position to
Board Consideration and Approval of Subadvisory Agreement with Wellington Management Company LLP (Unaudited) (continued)
attract and retain experienced professional personnel and to maintain a strong financial position for Wellington to be able to provide high-quality services to the Portfolio.
In considering anticipated costs and profitability, the Board also considered certain fall-out benefits that may be realized by Wellington due to its relationship with the Portfolio, including reputational and other indirect benefits. The Board recognized, for example, the potential benefits to Wellington from legally permitted “soft-dollar” arrangements by which brokers would provide research and other services to Wellington in exchange for commissions paid by the Portfolio with respect to trades in the Portfolio’s portfolio securities. In addition, the Board also requested and received information from New York Life Investments concerning other material business relationships between Wellington and its affiliates and New York Life Investments and its affiliates, and considered the existence of a strategic partnership between New York Life Investments and Wellington that relates to certain current and future products that represented a conflict of interest associated with New York Life Investments’ recommendation to approve the Repositioning and the New Subadvisory Agreement.
The Board took into account the fact that the Portfolio would undergo changes to its principal investment strategies in connection with the Repositioning. The Board noted estimates from New York Life Investments and Wellington that a significant portion of the holdings of the Portfolio would be sold to align the Portfolio’s holdings with the strategies that would be pursued by Wellington. Additionally, the Board considered New York Life Investments’ representation that New York Life Investments would work closely with Wellington to seek to execute the optimal transition strategy and that New York Life Investments would make every effort to minimize potential direct and indirect costs associated with the Repositioning.
The Board considered that any profits realized by Wellington due to its relationship with the Portfolio would be the result of arm’s-length negotiations between New York Life Investments and Wellington, acknowledging that any such profits would be based on fees paid to Wellington by New York Life Investments, not the Portfolio.
Subadvisory Fee and Estimated Total Ordinary Operating Expenses
The Board evaluated the reasonableness of the fee to be paid under the New Subadvisory Agreement and the Portfolio’s estimated total ordinary operating expenses. The Board primarily considered the reasonableness of the management fee to be paid by the Portfolio to New York Life Investments because the subadvisory fee to be paid to Wellington would be paid by New York Life Investments, not the Portfolio. The Board also considered the reasonableness of the subadvisory fee to be paid by New York Life Investments and the amount of the management fee expected to be retained by New York Life Investments.
In assessing the reasonableness of the Portfolio’s proposed fees and estimated expenses, the Board considered information provided by New York Life Investments on fees and expenses of peer funds. The Board also considered that in proposing fees for the Portfolio, New York Life Investments considers the competitive marketplace for mutual funds.
Based on the factors outlined above, the Board concluded that the Portfolio’s management fee and total ordinary operating expenses were within a range that is competitive and support a conclusion that these fees and expenses are reasonable.
Economies of Scale
The Board considered information regarding economies of scale, including whether the Portfolio’s proposed expense structure would permit economies of scale to be appropriately shared with the Portfolio’s beneficial shareholders. The Board also considered a report from New York Life Investments, previously prepared at the request of the Board, that addressed economies of scale, including with respect to the mutual fund business generally and the various ways in which the benefits of economies of scale may be shared with the funds in the MainStay Group of Funds. Although the Board recognized the difficulty of determining economies of scale with precision, the Board acknowledged that economies of scale may be shared with the Portfolio in a number of ways, including, for example, through the imposition of fee breakpoints, initially setting management fee rates at scale or making additional investments to enhance services.
Based on this information, the Board concluded that economies of scale are appropriately reflected for the benefit of the Portfolio’s beneficial shareholders through the Portfolio’s proposed expense structure and other methods to share benefits from economies of scale.
Conclusion
On the basis of the information and factors summarized above, among other information and factors deemed relevant by the Trustees, and the evaluation thereof, the Board, including the Independent Trustees voting separately, unanimously voted to approve the Repositioning and the New Subadvisory Agreement.
| 26 | MainStay VP Wellington U.S. Equity Portfolio |
Discussion of the Operation and Effectiveness of the Portfolio's Liquidity Risk Management Program (Unaudited)
In compliance with Rule 22e-4 under the Investment Company Act of 1940, as amended (the “Liquidity Rule”), the Portfolio has adopted and implemented a liquidity risk management program (the “Program”), which New York Life Investment Management LLC believes is reasonably designed to assess and manage the Portfolio's liquidity risk (the risk that the Portfolio could not meet requests to redeem shares issued by the Portfolio without significant dilution of remaining investors’ interests in the Portfolio). The Board of Trustees of MainStay VP Funds Trust (the "Board") designated New York Life Investment Management LLC as administrator of the Program (the “Administrator”). The Administrator has established a Liquidity Risk Management Committee to assist the Administrator in the implementation and day-to-day administration of the Program and to otherwise support the Administrator in fulfilling its responsibilities under the Program.
At a meeting of the Board held on March 8, 2021, the Administrator provided the Board with a written report addressing the Program’s operation and assessing its adequacy and effectiveness of implementation for the period from January 1, 2020 through December 31, 2020 (the "Review Period"), as required under the Liquidity Rule. The report noted that the Administrator concluded that (i) the Program operated effectively to assess and manage the Portfolio's liquidity risk, (ii) the Program has been adequately and effectively implemented to monitor and, as applicable, respond to the Portfolio's liquidity developments and (iii) the Portfolio's investment strategy continues to be appropriate for an open-end fund. In addition, the report discussed notable events that impacted liquidity risk during the Review Period, including the COVID-19 pandemic and the resulting economic shutdown.
In accordance with the Program, the Portfolio's liquidity risk is assessed no less frequently than annually taking into consideration certain factors, as applicable, such as (i) investment strategy and liquidity of portfolio investments, (ii) short-term and long-term cash flow projections and (iii) holdings of cash and cash equivalents, as well as borrowing arrangements and other funding sources. Certain factors are considered under both normal and reasonably foreseeable stressed conditions.
Each Portfolio portfolio investment is classified into one of four liquidity categories. The classification is based on a determination of the number of days it is reasonably expected to take to convert the investment into cash, or sell or dispose of the investment, in current market conditions without significantly changing the market value of the investment. The Administrator has delegated liquidity classification determinations to the Portfolio’s subadvisor, subject to appropriate oversight by the Administrator, and classification determinations are made by taking into account the Portfolio's reasonably anticipated trade size, various market, trading and investment-specific considerations, as well as market depth, and, in certain cases, third-party vendor data.
The Liquidity Rule requires portfolios that do not primarily hold assets that are highly liquid investments to adopt a minimum amount of net assets that must be invested in highly liquid investments that are assets (an “HLIM”). In addition, the Liquidity Rule limits a portfolio's investments in illiquid investments. Specifically, the Liquidity Rule prohibits acquisition of illiquid investments if doing so would result in a portfolio holding more than 15% of its net assets in illiquid investments that are assets. The Program includes provisions reasonably designed to determine, periodically review and comply with the HLIM requirement, as applicable, and to comply with the 15% limit on illiquid investments.
There can be no assurance that the Program will achieve its objectives under all circumstances in the future. Please refer to the Portfolio's prospectus for more information regarding the Portfolio's exposure to liquidity risk and other risks to which it may be subject.
Proxy Voting Record
The Portfolio is required to file with the SEC its proxy voting records for the 12-month period ending June 30 on Form N-PX. The Portfolio's most recent Form N-PX or proxy voting record is available free of charge upon request (i) by calling 800-598-2019; (ii) by visiting New York Life Investments’ website at https://www.nylinvestments.com/mainstay/
products-and-performance/mainstay-vp-funds-trust; or (iii) by visiting the SEC’s website at www.sec.gov.
Shareholder Reports and Quarterly Portfolio Disclosure
The Portfolio is required to file its complete schedule of portfolio holdings with the SEC 60 days after its first and third fiscal quarter on Form N-PORT. The Portfolio's holdings report is available free of charge upon request by calling 800-598-2019 or by visiting the SEC’s website at www.sec.gov.
| 28 | MainStay VP Wellington U.S. Equity Portfolio |
This page intentionally left blank
This page intentionally left blank.
MainStay VP Portfolios
MainStay VP offers a wide range of Portfolios. The full array of MainStay VP offerings is listed here, with information about the manager, subadvisors, legal counsel, and independent registered public accounting firm.
Equity
MainStay VP Candriam Emerging Markets Equity Portfolio
MainStay VP Epoch U.S. Equity Yield Portfolio
MainStay VP Fidelity Institutional AM® Utilities Portfolio†
MainStay VP MacKay International Equity Portfolio
MainStay VP MacKay S&P 500 Index Portfolio
MainStay VP Natural Resources Portfolio
MainStay VP Small Cap Growth Portfolio
MainStay VP T. Rowe Price Equity Income Portfolio
MainStay VP Wellington Growth Portfolio
MainStay VP Wellington Mid Cap Portfolio
MainStay VP Wellington Small Cap Portfolio
MainStay VP Wellington U.S. Equity Portfolio
MainStay VP Winslow Large Cap Growth Portfolio
Mixed Asset
MainStay VP Balanced Portfolio
MainStay VP Income Builder Portfolio
MainStay VP Janus Henderson Balanced Portfolio
MainStay VP MacKay Convertible Portfolio
Income
MainStay VP Bond Portfolio
MainStay VP Floating Rate Portfolio
MainStay VP Indexed Bond Portfolio
MainStay VP MacKay Government Portfolio
MainStay VP MacKay High Yield Corporate Bond Portfolio
MainStay VP MacKay Strategic Bond Portfolio
MainStay VP PIMCO Real Return Portfolio
Money Market
MainStay VP U.S. Government Money Market Portfolio
Alternative
MainStay VP CBRE Global Infrastructure Portfolio
MainStay VP IQ Hedge Multi-Strategy Portfolio
Asset Allocation
MainStay VP Conservative Allocation Portfolio
MainStay VP Equity Allocation Portfolio
MainStay VP Growth Allocation Portfolio
MainStay VP Moderate Allocation Portfolio
Manager
New York Life Investment Management LLC
New York, New York
Subadvisors
Brown Advisory LLC
Baltimore, Maryland
Candriam Belgium S.A.*
Brussels, Belgium
CBRE Clarion Securities LLC
Radnor, Pennsylvania
Epoch Investment Partners, Inc.
New York, New York
FIAM LLC
Smithfield, Rhode Island
IndexIQ Advisors LLC*
New York, New York
Janus Capital Management LLC
Denver, Colorado
MacKay Shields LLC*
New York, New York
Mellon Investments Corporation
Boston, Massachusetts
NYL Investors LLC*
New York, New York
Pacific Investment Management Company LLC
Newport Beach, California
Segall Bryant & Hamill, LLC
Chicago, Illinois
T. Rowe Price Associates, Inc.
Baltimore, Maryland
Wellington Management Company LLP
Boston, Massachusetts
Winslow Capital Management, LLC
Minneapolis, Minnesota
Legal Counsel
Dechert LLP
Washington, District of Columbia
Independent Registered Public Accounting Firm
PricewaterhouseCoopers LLP
New York, New York
Distributor
NYLIFE Distributors LLC*
Jersey City, New Jersey
Custodian
JPMorgan Chase Bank, N.A.
New York, New York
Some Portfolios may not be available in all products.
† Fidelity Institutional AM is a registered trade mark of FMR LLC. Used with permission.
* An affiliate of New York Life Investment Management LLC
Not part of the Semiannual Report
2021 Semiannual Report
This report is for the general information of New York Life Variable Annuities and NYLIAC Variable Universal Life Insurance Products policyowners. It must be preceded or accompanied by the appropriate product(s) and funds prospectuses if it is given to anyone who is not an owner of a New York Life variable annuity policy or a NYLIAC Variable Universal Life Insurance Product. This report does not offer for sale or solicit orders to purchase securities.
The performance data quoted in this report represents past performance. Past performance is no guarantee of future results. Due to market volatility and other factors, current performance may be lower or higher than the figures shown. The most recent month-end performance summary for your variable annuity or variable life policy is available by calling 800-598-2019 and is updated periodically on newyorklife.com.
The New York Life Variable Annuities and NYLIAC Variable Universal Life Insurance Products are issued by New York Life Insurance and Annuity Corporation (a Delaware Corporation) and distributed by NYLIFE Distributors LLC (Member FINRA/SIPC).
New York Life Insurance Company
New York Life Insurance and Annuity
Corporation (NYLIAC) (A Delaware Corporation)
51 Madison Avenue, Room 551
New York, NY 10010
newyorklife.com
nylinvestments.com
NYLIFE Distributors LLC, 30 Hudson Street, Jersey City, NJ 07302
New York Life Investment Management LLC is the investment manager to the MainStay VP Funds Trust
©2021 by NYLIFE Distributors LLC. All rights reserved.
You may obtain copies of the Prospectus and the Statement of Additional Information free of charge, upon request, by calling toll-free 800-598-2019 or writing to New York Life Insurance and Annuity Corporation, 51 Madison Avenue, New York, NY 10010.
| Not FDIC Insured | No Bank Guarantee | May Lose Value |
(NYLIAC) NI511
MainStay VP Small Cap Growth Portfolio
Message from the President and Semiannual Report
Unaudited | June 30, 2021
Sign up for e-delivery of your shareholder reports. For full details on e-delivery, including who can participate and what you can receive via e-delivery,
please log in to newyorklifeinvestments.com/accounts.
| Not FDIC/NCUA Insured | Not a Deposit | May Lose Value | No Bank Guarantee | Not Insured by Any Government Agency |
This page intentionally left blank
Message from the President
The COVID-19 pandemic continued to afflict our personal lives and broad segments of the U.S. and global economy throughout the six-month reporting period ended June 30, 2021. However, with the deployment of multiple vaccines around the world, including three highly effective versions approved for emergency use in the United States, investors began to turn their attention toward the gradual reopening of the economy and the shape the “new normal” would take.
The first half of the reporting period saw increasing inflationary concerns as fiscal stimulus business reopenings drove accelerating economic growth, rising commodity prices and increased consumer spending. However, the U.S. Federal Reserve noted that price increases were likely to prove temporary and made clear their intention to remain accommodative for the foreseeable future. Accordingly, after moving higher in the first quarter of 2021, interest rates declined in the second quarter.
In response to the uncertain inflation outlook, equity market leadership shifted from value in the first quarter of the year to growth in the second quarter. Nevertheless, investor sentiment remained buoyant throughout the reporting period, with all eleven sectors in the S&P 500® Index, a widely regarded benchmark of market performance, producing positive returns. Energy led the market’s rise fueled by rapidly increasing oil and gas prices, followed by financials and real estate, which benefited from rising interest rates and the economic reopening, respectively. Communication services produced the slowest growth, followed by the traditionally defensive utilities and consumer staples
sectors. In the fixed income market, lower-credit-quality issues tended to outperform their higher-grade counterparts, with high-yield corporate bonds generating the strongest performance. Among securitized products, commercial mortgage-backed securities generally produced the strongest returns, followed by mortgage-backed securities and asset-backed securities, while Treasury securities lagged.
Despite the tremendous progress we’ve seen so far this year, the United States and the world continue to face significant pandemic-related challenges. Newer, more contagious variants of COVID-19 threaten the return of restrictions and lockdowns that could stall the economic recovery. At the same time, supply chain shortages have led to rising prices on everything from laptops to autos, stoking fears of uncontrolled inflation despite reassurance from the U.S. Federal Reserve. At New York Life Investments, we recognize that the shape that the “new normal” eventually takes may differ from our expectations. You can depend on us to keep a sharp watch for the unexpected, and to continue to help you find your way through this rapidly evolving investment landscape.
Sincerely,
Kirk C. Lehneis
President
The opinions expressed are as of the date of this report and are subject to change. There is no guarantee that any forecast made will come to pass. This material does not constitute investment advice and is not intended as an endorsement of any specific investment. Past performance is no guarantee of future results.
Not part of the Semiannual Report
Investors should refer to the Portfolio’s Summary Prospectus and/or Prospectus and consider the Portfolio’s investment objectives, strategies, risks, charges and expenses carefully before investing. The Summary Prospectus and/or Prospectus contain this and other information about the Portfolio. You may obtain copies of the Portfolio’s Summary Prospectus and/or the Prospectus and the Statement of Additional Information free of charge, upon request, by calling toll-free 800-598-2019, by writing to New York Life Insurance and Annuity Corporation, 51 Madison Avenue, Room 251, New York, New York 10010 or by sending an email to MainStayShareholdersServices@nylim.com. These documents are also available at nylinvestments.com/vpdocuments. Please read the Portfolio's Summary Prospectus and/or Prospectus carefully before investing. MainStay VP Funds Trust portfolios are separate account options which are purchased through a variable insurance or variable annuity contract.
Investment and Performance Comparison (Unaudited)
Performance data quoted represents past performance. Past performance is no guarantee of future results. Because of market volatility and other factors, current performance may be lower or higher than the figures shown. Investment return and principal value will fluctuate, and as a result, when shares are redeemed, they may be worth more or less than their original cost. The performance table and graph do not reflect any deduction of sales charges, mortality and expense charges, contract charges or administrative charges. Please refer to the Performance Summary appropriate for your policy. For performance information current to the most recent month-end, please call 800-598-2019 or visit www.newyorklife.com.
Performance figures may reflect certain fee waivers and/or expense limitations, without which total returns may have been different. For information on current fee waivers and/or expense limitations (if any), please refer to the Notes to Financial Statements.
| Average Annual Total Returns for the Period-Ended June 30, 2021 |
| Class | Inception
Date1 | Six
Months | One
Year | Five
Years | Since
Inception | Gross
Expense
Ratio2 |
| Initial Class Shares | 2/17/2012 | 9.36% | 53.13% | 19.05% | 13.05% | 0.85% |
| Service Class Shares | 2/17/2012 | 9.23 | 52.75 | 18.76 | 12.77 | 1.10 |
| 1. | Effective May 1, 2020, the Portfolio replaced its subadvisor and modified its principal investment strategies. Therefore, the performance information shown in this report prior to May 1, 2020 reflects the Portfolio’s prior subadvisor and its principal investment strategies. |
| 2. | The gross expense ratios presented reflect the Portfolio’s “Total Annual Portfolio Operating Expenses” from the most recent Prospectus, as supplemented, and may differ from other expense ratios disclosed in this report. |
| Benchmark Performance | Six
Months | One
Year | Five
Years | Since
Inception |
| Russell 2000® Growth Index1 | 8.98% | 51.36% | 18.76% | 14.40% |
| Morningstar Small Growth Category Average2 | 12.20 | 54.34 | 20.21 | 14.40 |
| 1. | The Russell 2000® Growth Index is the Portfolio’s primary benchmark. The Russell 2000® Growth Index is a broad-based benchmark that measures the performance of the small-cap growth segment of the U.S. equity universe. It includes those Russell 2000® Index companies with higher price-to-book ratios and higher forecasted growth values. Results assume reinvestment of all dividends and capital gains. An investment cannot be made directly in an index. |
| 2. | The Morningstar Small Growth Category Average is representative of funds that focus on faster-growing companies whose shares are at the lower end of the market-capitalization range. These funds tend to favor companies in up-and-coming industries or young firms in their early growth stages. Results are based on average total returns of similar funds with all dividends and capital gain distributions reinvested. |
Cost in Dollars of a $1,000 Investment in MainStay VP Small Cap Growth Portfolio (Unaudited)
The example below is intended to describe the fees and expenses borne by shareholders during the six-month period from January 1, 2021 to June 30, 2021, and the impact of those costs on your investment.
Example
As a shareholder of the Portfolio you incur two types of costs: (1) transaction costs, including exchange fees and sales charges (loads) on purchases (as applicable), and (2) ongoing costs, including management fees, distribution and/or service (12b-1) fees, and other Portfolio expenses (as applicable). This example is intended to help you understand your ongoing costs (in dollars) of investing in the Portfolio and to compare these costs with the ongoing costs of investing in other mutual funds. The example is based on an investment of $1,000 made at the beginning of the six-month period and held for the entire period from January 1, 2021 to June 30, 2021. Shares are only sold in connection with variable life and annuity contracts and the example does not reflect any contract level or transactional fees or expenses. If these costs had been included, your costs would have been higher.
This example illustrates your Portfolio’s ongoing costs in two ways:
Actual Expenses
The second and third data columns in the table below provide information about actual account values and actual expenses. You may use the information in these columns, together with the amount you invested, to estimate the expenses that you paid during the six months ended June
30, 2021. Simply divide your account value by $1,000 (for example, an $8,600 account value divided by $1,000 = 8.6), then multiply the result by the number under the heading entitled “Expenses Paid During Period” to estimate the expenses you paid on your account during this period.
Hypothetical Example for Comparison Purposes
The fourth and fifth data columns in the table below provide information about hypothetical account values and hypothetical expenses based on the Portfolio’s actual expense ratio and an assumed rate of return of 5% per year before expenses, which is not the Portfolio’s actual return. The hypothetical account values and expenses may not be used to estimate the actual ending account balances or expenses you paid for the six-month period shown. You may use this information to compare the ongoing costs of investing in the Portfolio with the ongoing costs of investing in other mutual funds. To do so, compare this 5% hypothetical example with the 5% hypothetical examples that appear in the shareholder reports of the other mutual funds.
Please note that the expenses shown in the table are meant to highlight your ongoing costs only and do not reflect any transactional costs, such as exchange fees or sales charges (loads). Therefore, the fourth and fifth data columns of the table are useful in comparing ongoing costs only and will not help you determine the relative total costs of owning different funds. In addition, if these transactional costs were included, your costs would have been higher.
| Share Class | Beginning
Account
Value
1/1/21 | Ending Account
Value (Based
on Actual
Returns and
Expenses)
6/30/21 | Expenses
Paid
During
Period1 | Ending Account
Value (Based
on Hypothetical
5% Annualized
Return and
Actual Expenses)
6/30/21 | Expenses
Paid
During
Period1 | Net Expense
Ratio
During
Period2 |
| Initial Class Shares | $1,000.00 | $1,093.60 | $4.31 | $1,020.68 | $4.16 | 0.83% |
| Service Class Shares | $1,000.00 | $1,092.30 | $5.60 | $1,019.44 | $5.41 | 1.08% |
| 1. | Expenses are equal to the Portfolio’s annualized expense ratio of each class multiplied by the average account value over the period, divided by 365 and multiplied by 181 (to reflect the six-month period). The table above represents the actual expenses incurred during the six-month period. In addition to the fees and expenses which the Portfolio bears directly, it also indirectly bears a pro rata share of the fees and expenses of the underlying funds in which it invests. Such indirect expenses are not included in the above-reported expense figures. |
| 2. | Expenses are equal to the Portfolio's annualized expense ratio to reflect the six-month period. |
| 6 | MainStay VP Small Cap Growth Portfolio |
Industry Composition as of June 30, 2021 (Unaudited)
| Software | 9.9% |
| IT Services | 7.0 |
| Health Care Equipment & Supplies | 5.9 |
| Health Care Providers & Services | 5.9 |
| Semiconductors & Semiconductor Equipment | 5.6 |
| Biotechnology | 5.1 |
| Commercial Services & Supplies | 4.5 |
| Life Sciences Tools & Services | 4.1 |
| Hotels, Restaurants & Leisure | 3.7 |
| Chemicals | 3.4 |
| Insurance | 3.3 |
| Professional Services | 3.3 |
| Diversified Consumer Services | 3.1 |
| Health Care Technology | 3.0 |
| Capital Markets | 2.4 |
| Building Products | 2.2 |
| Equity Real Estate Investment Trusts | 2.0 |
| Aerospace & Defense | 2.0 |
| Machinery | 1.8 |
| Diversified Telecommunication Services | 1.6 |
| Banks | 1.6 |
| Specialty Retail | 1.5 |
| Interactive Media & Services | 1.5 |
| Entertainment | 1.5% |
| Leisure Products | 1.3 |
| Pharmaceuticals | 1.3 |
| Food Products | 1.2 |
| Electronic Equipment, Instruments & Components | 1.0 |
| Road & Rail | 0.9 |
| Construction & Engineering | 0.9 |
| Food & Staples Retailing | 0.9 |
| Trading Companies & Distributors | 0.6 |
| Household Durables | 0.6 |
| Electrical Equipment | 0.6 |
| Auto Components | 0.5 |
| Communications Equipment | 0.5 |
| Multiline Retail | 0.5 |
| Internet & Direct Marketing Retail | 0.4 |
| Media | 0.3 |
| Consumer Finance | 0.3 |
| Energy Equipment & Services | 0.3 |
| Short–Term Investments | 2.7 |
| Other Assets, Less Liabilities | –0.7 |
| | 100.0% |
See Portfolio of Investments beginning on page 11 for specific holdings within these categories. The Portfolio's holdings are subject to change.
Top Ten Holdings as of June 30, 2021 (excluding short-term investments) (Unaudited)
| 1. | Bright Horizons Family Solutions, Inc. |
| 2. | Charles River Laboratories International, Inc. |
| 3. | Workiva, Inc. |
| 4. | Cogent Communications Holdings, Inc. |
| 5. | Zynga, Inc., Class A |
| 6. | Genpact Ltd. |
| 7. | Churchill Downs, Inc. |
| 8. | Goosehead Insurance, Inc., Class A |
| 9. | Globant SA |
| 10. | Endava plc |
Portfolio Management Discussion and Analysis (Unaudited)
Answers to the questions reflect the views of Brian C. Fitzsimons, CFA, and Mitch S. Begun, CFA, of Segall Bryant & Hamill, LLC (“SBH”), one of the Portfolio’s Subadvisors, and Christopher A. Berrier and George Sakellaris, CFA, of Brown Advisory Group LLC (“Brown Advisory”), the Portfolio’s other Subadvisor.
How did MainStay VP Small Cap Growth Portfolio perform relative to its benchmark and peers during the six months ended June 30, 2021?
For the six months ended June 30, 2021, MainStay VP Small Cap Growth Portfolio returned 9.36% for Initial Class shares and 9.23% for Service Class shares. Over the same period, both share classes outperformed the 8.98% return of the Russell 2000® Growth Index (“the Index”), which is the Portfolio’s primary benchmark, and underperformed the 12.20% return of the Morningstar Small Growth Category Average.1
What factors affected the Portfolio’s relative performance during the reporting period?
SBH
The portion of the Portfolio subadvised by SBH outperformed the Index due to favorable sector allocation decisions. Security selection detracted slightly from relative performance.
Brown Advisory
In the first half of the reporting period, market leadership was dominated by companies with high short interest, low return on equity, high leverage and low share prices, all characteristics of stocks we consider to be lower quality. We tend to invest in issues that we consider higher quality. For the portion of the Portfolio subadvised by Brown Advisory, underweight exposure to these low-quality factors certainly produced a performance headwind for the first half of the reporting period. Thus, while the fundamental results from the vast majority of our companies were solid, our stock selection struggled to overcome the market’s bias in favor of lower quality. As the second half of the reporting period started, this trend began to reverse and market participants seemed to once again focus on fundamentals, which aided the Portfolio’s performance. During the final month of the reporting period, however, low-quality factors once again began to lead the market. This oscillation between high-quality and low-quality market leadership made relative returns volatile; nevertheless, the Portfolio outperformed the Index, largely due to positive security selection.
Which sectors were the strongest positive contributors to the Portfolio’s relative performance, and which sectors were particularly weak?
SBH
The three sectors that made the strongest positive contributions to the performance of the portion of the Portfolio subadvised by SBH relative to the Index were information technology, industrials and real estate. (Contributions take weightings and total returns into account.) Conversely, the three sectors that detracted most from relative performance during the reporting period were financials, health care and consumer discretionary.
Brown Advisory
The three sectors making the strongest contributions to the relative performance of the portion of the Portfolio subadvised by Brown Advisory were health care, real estate and energy. In health care, the bulk of the strong positive performance relative to the Index was the result of stock selection; however, the Portfolio’s underweight exposure to the sector also proved helpful. The three weakest contributors were consumer discretionary, industrials and information technology.
During the reporting period, which individual stocks made the strongest positive contributions to the Portfolio’s absolute performance and which stocks detracted the most?
SBH
The three strongest performing holdings in the portion of the Portfolio subadvised by SBH included online freelance marketplace provider Upwork, online apparel retailer Revolve Group and work management software company Asana. Upwork’s user growth and engagement on its platform were strong as the pandemic heightened awareness of the value of its offerings to those engaged in remote and distributed work. Revolve Group reported improving sales trends as the economy reopened, driving an uptick in average order sizes. The company’s ability to generate significant free cash flow during the reporting period was also notable and a testament to its lean, flexible business model. Asana experienced accelerating sales growth with continued success moving upmarket to serve larger enterprise customers. In addition, the CEO was an aggressive buyer of the stock during the reporting period. We trimmed all three positions during the reporting period over valuation concerns. Shares in another notably strong performer, information technology services provider Endava, gained ground based on the company’s strength across all regions and verticals. As of June 30, 2021, Endava remained one of the Portfolio’s largest positions, reflecting our view that digital transformation projects remain in the early innings of adoption with a very large addressable market.
The stocks that detracted most from absolute performance were insurance distributor SelectQuote and biotechnology companies Turning Point Therapeutics and Amicus Therapeutics. SelectQuote stock lost ground when the company gave mixed guidance after ramping up investments for new product offerings; nevertheless, we remained optimistic about the company’s growth profile, particularly in the expanding area of Medicare Advantage. Turning Point shares were weak after the company reported inconclusive early-stage data from a drug candidate for a rare form of lung cancer. However, in our opinion, the primary driver behind the stock’s slide during the reporting period was a broadly based decline affecting most of the biotechnology subsector. Shares in
| 1. | See page 5 for more information on benchmark and peer group returns. |
| 8 | MainStay VP Small Cap Growth Portfolio |
Amicus Therapeutics, which develops treatments for rare diseases, declined after the company announced disappointing results from a clinical trial for a drug candidate for Pompe disease. In our opinion, the company’s valuation remains attractive based solely on our expectations for revenues from its drug for Fabry disease.
Brown Advisory
The three strongest performing holdings in the portion of the Portfolio subadvised by Brown Advisory included laboratory testing and contract research services provider Charles River Laboratories International, silicone breast implant developer and manufacturer Establishment Labs and health care for seniors services provider agilon health. Charles River stock benefited from the company’s success in continuing to execute at a very high level as the leading pre-clinical contract research organization, supporting hundreds of well-funded biotech assets. Strategic mergers and acquisitions in the high growth and exciting areas of cell and gene therapy continued during the reporting period, and investors continued to gain confidence in the company’s next phase of growth. Establishment Labs continued to garner more investor attention following several new and novel product announcements that dramatically expanded its total addressable market. The management team executed well during the pandemic and the company appears well positioned as global economies reopen. The Portfolio initiated its position in agilon health upon the company’s initial public offering on April 15, 2021, with a sizeable allocation, building on a relationship with the company’s management team and sponsors begun while agilon was still privately held. In our opinion, agilon possesses a highly scalable, value-based care model that partners with and enables leading primary care groups to assume full financial risk for their Medicare patients, enhancing both quality of care and medical practice economics.
The stocks that detracted most from absolute performance were automobile auction services firm IAA, genetic and molecular testing services company NeoGenomics, and childcare and education services provider Bright Horizons Family Solutions. IAA shares retreated after a strong rebound off pandemic-related lows in mid-2020. We believe that secular trends toward higher total loss rates and the company's digital transformation can continue to drive years of double-digit cash flow growth. NeoGenomics stock was pressured during the reporting period as a result of the company’s investment in (and assumed future purchase of) Inivata, a privately held, next-generation diagnostics company. During the reporting period, Inivata saw its public peers, such as Guardant and Natera, come under pressure due to their extended valuations. Bright Horizons Family Solutions’ shares pulled back in the second quarter of 2021 following strong share-price appreciation earlier in the year as investors began to focus on the number of centers that remained closed due to the lingering effects of the pandemic.
Did the Portfolio make any significant purchases or sales during the reporting period?
SBH
Significant new purchases during the reporting period included payment processor solutions provider Shift4 Payments and social media management software company Sprout Social. Shift4 is a niche market leader of payment solutions in the hospitality industry, benefiting from the reopening of the economy. In our opinion, the company has a unique opportunity to capture incremental revenues from existing customers through its new, broader product suite. We believe Sprout Social’s cloud software platform is well positioned for the ongoing shift to social media as the default medium for managing brand communication with customers.
The most notable sales included semiconductor materials provider Entegris and ski resort company Vail Mountain Resorts. The Entegris position was sold as the company’s market cap rose beyond the small-cap investment universe. We exited the Portfolio’s Vail position after the company cut prices on its season passes, which we viewed as a long-term negative.
Brown Advisory
Significant purchases included building products manufacturer AZEK, pest control provider Terminix and health care provider agilon health. The Portfolio’s purchase of AZEK shares reflected our view that the company—a leading manufacturer of low-maintenance and environmentally sustainable building products—operates in an attractive composite decking space that offers a combination of secular growth, less cyclicality given decking replacement demand and margin enhancement opportunities. Terminix’s new CEO shed ancillary businesses and appears focused on returning the core pest business to organic growth while improving profitability, a task that we think is achievable given the company’s leading brand recognition.
Significant sales included the Portfolio’s positions in alternative asset manager Ares Management; process optimization software solutions provider Aspen Technology; and utility, aerospace and commercial product and system producer ESCO Technologies. Ares Management was eliminated from the Portfolio due to market-cap constraints. The position in Aspen Technology was sold on concerns regarding the long-term health of the end markets Aspen serves. ESCO Technologies holdings were eliminated from the Portfolio based on the stock’s relatively high valuation and the availability of more attractive opportunities elsewhere.
How did the Portfolio’s sector weightings change during the reporting period?
SBH
The portion of the Portfolio subadvised by SBH saw its largest sector increases relative to the Index in information technology after underperformance across the sector in the first quarter of
2021 presented buying opportunities we judged attractive. Significant consumer discretionary reductions relative to the Index occurred after the sector exhibited extraordinary strength due to reopening prospects, giving us pause about valuations across a number of holdings. Energy was the only other sector experiencing a material change in positioning as the Portfolio’s relative exposure declined when the sector’s representation rose in the Index.
Brown Advisory
The most notable change in sector exposure affecting the portion of the Portfolio subadvised by Brown Advisory was an increase in health care, reducing the extent of the Portfolio’s underweight exposure relative to the Index. We also trimmed the Portfolio’s information technology exposure from an overweight position to approximately in line with the Index.
How was the Portfolio positioned at the end of the reporting period?
SBH
As of June 30, 2021, the portion of the Portfolio subadvised by SBH held overweight exposure, relative to the Index, in the financials and industrials sectors, and underweight exposure primarily in the health care and consumer discretionary sectors. The portfolio’s overweight exposure to financials was primarily due not to investments in traditional banks, but rather to investments in unique, secular growth companies in the insurance sector, such as Goosehead Insurance and Trupanion. The Portfolio’s underweight exposure to health care was primarily due to holding relatively few investments in biotechnology companies, the vast majority of which do not, in our opinion, exhibit fundamentally stable growth characteristics.
Brown Advisory
As of June 30, 2021, the portion of the Portfolio subadvised by Brown Advisory held overweight exposure to the consumer discretionary and industrials sectors. As of the same date, the Portfolio held underweight exposure to energy and financials, neither of which represented a large portion of the Index. The Portfolio also held an underweight position in health care due to a relative lack of biotechnology exposure.
The opinions expressed are those of the portfolio managers as of the date of this report and are subject to change. There is no guarantee that any forecasts will come to pass. This material does not constitute investment advice and is not intended as an endorsement of any specific investment.
Not all MainStay VP Portfolios and/or share classes are available under all policies.
| 10 | MainStay VP Small Cap Growth Portfolio |
Portfolio of Investments June 30, 2021† (Unaudited)
| | Shares | Value |
| Common Stocks 98.0% |
| Aerospace & Defense 2.0% |
| AeroVironment, Inc. (a) | 22,009 | $ 2,204,201 |
| Hexcel Corp. (a) | 63,667 | 3,972,821 |
| Kratos Defense & Security Solutions, Inc. (a) | 114,705 | 3,267,946 |
| Mercury Systems, Inc. (a) | 34,068 | 2,258,027 |
| | | 11,702,995 |
| Auto Components 0.5% |
| Fox Factory Holding Corp. (a) | 19,484 | 3,032,879 |
| Banks 1.6% |
| Bank OZK | 37,104 | 1,564,305 |
| Eagle Bancorp, Inc. | 48,319 | 2,709,729 |
| Prosperity Bancshares, Inc. | 73,379 | 5,268,612 |
| | | 9,542,646 |
| Biotechnology 5.1% |
| Abcam plc, Sponsored ADR (a) | 58,943 | 1,122,275 |
| Acceleron Pharma, Inc. (a) | 16,866 | 2,116,514 |
| Amicus Therapeutics, Inc. (a) | 119,829 | 1,155,152 |
| Ascendis Pharma A/S, ADR (a) | 12,790 | 1,682,524 |
| Biohaven Pharmaceutical Holding Co. Ltd. (a) | 35,277 | 3,424,691 |
| Blueprint Medicines Corp. (a) | 52,562 | 4,623,353 |
| Fate Therapeutics, Inc. (a) | 37,859 | 3,285,783 |
| Natera, Inc. (a) | 51,254 | 5,818,867 |
| Neurocrine Biosciences, Inc. (a) | 27,828 | 2,708,221 |
| Turning Point Therapeutics, Inc. (a) | 31,792 | 2,480,412 |
| Xencor, Inc. (a) | 56,078 | 1,934,130 |
| | | 30,351,922 |
| Building Products 2.2% |
| AZEK Co., Inc. (The) (a) | 167,453 | 7,110,054 |
| Trex Co., Inc. (a) | 57,343 | 5,861,028 |
| | | 12,971,082 |
| Capital Markets 2.4% |
| Evercore, Inc., Class A | 17,710 | 2,493,037 |
| Focus Financial Partners, Inc., Class A (a) | 51,947 | 2,519,429 |
| Hamilton Lane, Inc., Class A | 49,131 | 4,476,817 |
| Houlihan Lokey, Inc. | 32,383 | 2,648,605 |
| StepStone Group, Inc., Class A | 61,845 | 2,127,468 |
| | | 14,265,356 |
| Chemicals 3.4% |
| Avient Corp. | 64,342 | 3,163,053 |
| HB Fuller Co. | 44,822 | 2,851,127 |
| Ingevity Corp. (a) | 42,416 | 3,450,966 |
| | Shares | Value |
| |
| Chemicals (continued) |
| Innospec, Inc. | 20,239 | $ 1,833,856 |
| Livent Corp. (a) | 250,598 | 4,851,577 |
| Quaker Chemical Corp. | 16,538 | 3,922,648 |
| | | 20,073,227 |
| Commercial Services & Supplies 4.5% |
| IAA, Inc. (a) | 127,513 | 6,954,559 |
| Montrose Environmental Group, Inc. (a) | 33,414 | 1,792,995 |
| MSA Safety, Inc. | 20,034 | 3,317,230 |
| Ritchie Bros Auctioneers, Inc. | 55,734 | 3,303,912 |
| Tetra Tech, Inc. | 37,894 | 4,624,584 |
| Waste Connections, Inc. | 59,275 | 7,079,213 |
| | | 27,072,493 |
| Communications Equipment 0.5% |
| Infinera Corp. (a) | 293,389 | 2,992,568 |
| Construction & Engineering 0.9% |
| Ameresco, Inc., Class A (a) | 64,949 | 4,073,601 |
| Valmont Industries, Inc. | 6,552 | 1,546,600 |
| | | 5,620,201 |
| Consumer Finance 0.3% |
| LendingTree, Inc. (a) | 9,363 | 1,983,832 |
| Diversified Consumer Services 3.1% |
| Bright Horizons Family Solutions, Inc. (a) | 87,147 | 12,820,196 |
| Chegg, Inc. (a) | 32,820 | 2,727,670 |
| Terminix Global Holdings, Inc. (a) | 66,210 | 3,158,879 |
| | | 18,706,745 |
| Diversified Telecommunication Services 1.6% |
| Cogent Communications Holdings, Inc. | 124,880 | 9,602,023 |
| Electrical Equipment 0.6% |
| TPI Composites, Inc. (a) | 71,942 | 3,483,432 |
| Electronic Equipment, Instruments & Components 1.0% |
| Littelfuse, Inc. | 12,129 | 3,090,348 |
| Novanta, Inc. (a) | 22,770 | 3,068,485 |
| | | 6,158,833 |
| Energy Equipment & Services 0.3% |
| Cactus, Inc., Class A | 47,945 | 1,760,540 |
| Entertainment 1.5% |
| Zynga, Inc., Class A (a) | 843,749 | 8,969,052 |
The notes to the financial statements are an integral part of, and should be read in conjunction with, the financial statements.
11
Portfolio of Investments June 30, 2021† (Unaudited) (continued)
| | Shares | Value |
| Common Stocks (continued) |
| Equity Real Estate Investment Trusts 2.0% |
| Americold Realty Trust | 58,861 | $ 2,227,889 |
| DigitalBridge Group, Inc. (a) | 208,331 | 1,645,815 |
| EastGroup Properties, Inc. | 28,567 | 4,697,843 |
| Terreno Realty Corp. | 57,390 | 3,702,803 |
| | | 12,274,350 |
| Food & Staples Retailing 0.9% |
| Casey's General Stores, Inc. | 26,200 | 5,099,568 |
| Food Products 1.2% |
| Hain Celestial Group, Inc. (The) (a) | 65,724 | 2,636,847 |
| Simply Good Foods Co. (The) (a) | 129,724 | 4,736,223 |
| | | 7,373,070 |
| Health Care Equipment & Supplies 5.9% |
| Cardiovascular Systems, Inc. (a) | 60,295 | 2,571,582 |
| CONMED Corp. | 40,212 | 5,526,335 |
| Establishment Labs Holdings, Inc. (a) | 59,365 | 5,184,939 |
| Globus Medical, Inc., Class A (a) | 72,014 | 5,583,246 |
| Inari Medical, Inc. (a) | 35,502 | 3,311,627 |
| Integra LifeSciences Holdings Corp. (a) | 36,515 | 2,491,784 |
| LivaNova plc (a) | 24,793 | 2,085,339 |
| Nevro Corp. (a) | 11,641 | 1,929,961 |
| OrthoPediatrics Corp. (a) | 42,741 | 2,700,376 |
| SI-BONE, Inc. (a) | 45,157 | 1,421,091 |
| Silk Road Medical, Inc. (a) | 57,512 | 2,752,524 |
| | | 35,558,804 |
| Health Care Providers & Services 5.9% |
| Accolade, Inc. (a) | 44,239 | 2,402,620 |
| Addus HomeCare Corp. (a) | 37,526 | 3,273,768 |
| agilon health, Inc. (a) | 114,350 | 4,639,180 |
| Alignment Healthcare, Inc. (a)(b) | 60,435 | 1,412,366 |
| Amedisys, Inc. (a) | 24,286 | 5,948,370 |
| Castle Biosciences, Inc. (a) | 42,580 | 3,122,391 |
| Encompass Health Corp. | 35,968 | 2,806,583 |
| HealthEquity, Inc. (a) | 51,601 | 4,152,848 |
| LifeStance Health Group, Inc. (a) | 68,775 | 1,916,072 |
| Oak Street Health, Inc. (a) | 44,281 | 2,593,538 |
| Progyny, Inc. (a) | 50,534 | 2,981,506 |
| | | 35,249,242 |
| Health Care Technology 3.0% |
| Inspire Medical Systems, Inc. (a) | 27,068 | 5,231,162 |
| Omnicell, Inc. (a) | 38,706 | 5,862,024 |
| Phreesia, Inc. (a) | 58,358 | 3,577,345 |
| | Shares | Value |
| |
| Health Care Technology (continued) |
| Vocera Communications, Inc. (a) | 81,373 | $ 3,242,714 |
| | | 17,913,245 |
| Hotels, Restaurants & Leisure 3.7% |
| Choice Hotels International, Inc. | 22,675 | 2,695,151 |
| Churchill Downs, Inc. | 42,985 | 8,522,206 |
| MakeMyTrip Ltd. (a) | 116,594 | 3,503,650 |
| Shake Shack, Inc., Class A (a) | 38,006 | 4,067,402 |
| Wingstop, Inc. | 22,523 | 3,550,300 |
| | | 22,338,709 |
| Household Durables 0.6% |
| TopBuild Corp. (a) | 17,996 | 3,559,249 |
| Insurance 3.3% |
| Goosehead Insurance, Inc., Class A | 66,229 | 8,430,952 |
| Palomar Holdings, Inc. (a) | 42,829 | 3,231,876 |
| Selectquote, Inc. (a) | 97,811 | 1,883,840 |
| Trupanion, Inc. (a) | 53,023 | 6,102,947 |
| | | 19,649,615 |
| Interactive Media & Services 1.5% |
| Angi, Inc. (a) | 323,513 | 4,373,896 |
| Eventbrite, Inc., Class A (a) | 161,969 | 3,077,411 |
| Vimeo, Inc. (a) | 31,888 | 1,562,512 |
| | | 9,013,819 |
| Internet & Direct Marketing Retail 0.4% |
| Revolve Group, Inc. (a) | 37,795 | 2,604,075 |
| IT Services 7.0% |
| Endava plc, Sponsored ADR (a) | 69,346 | 7,862,449 |
| Evo Payments, Inc., Class A (a) | 186,982 | 5,186,881 |
| Genpact Ltd. | 190,769 | 8,666,636 |
| Globant SA (a) | 36,429 | 7,984,508 |
| MAXIMUS, Inc. | 46,633 | 4,102,305 |
| Shift4 Payments, Inc., Class A (a) | 55,968 | 5,245,321 |
| WEX, Inc. (a) | 14,042 | 2,722,744 |
| | | 41,770,844 |
| Leisure Products 1.3% |
| Callaway Golf Co. | 152,993 | 5,160,454 |
| Clarus Corp. | 106,350 | 2,733,195 |
| | | 7,893,649 |
| Life Sciences Tools & Services 4.1% |
| Adaptive Biotechnologies Corp. (a) | 61,136 | 2,498,017 |
| Bruker Corp. | 51,086 | 3,881,514 |
The notes to the financial statements are an integral part of, and should be read in conjunction with, the financial statements.
| 12 | MainStay VP Small Cap Growth Portfolio |
| | Shares | Value |
| Common Stocks (continued) |
| Life Sciences Tools & Services (continued) |
| Charles River Laboratories International, Inc. (a) | 26,424 | $ 9,774,766 |
| NanoString Technologies, Inc. (a) | 40,060 | 2,595,487 |
| NeoGenomics, Inc. (a) | 120,979 | 5,464,622 |
| Olink Holding AB, ADR (a) | 13,947 | 480,056 |
| | | 24,694,462 |
| Machinery 1.8% |
| IDEX Corp. | 6,367 | 1,401,058 |
| John Bean Technologies Corp. | 44,565 | 6,355,860 |
| Proto Labs, Inc. (a) | 10,431 | 957,566 |
| Woodward, Inc. | 15,355 | 1,886,823 |
| | | 10,601,307 |
| Media 0.3% |
| New York Times Co. (The), Class A | 46,043 | 2,005,173 |
| Multiline Retail 0.5% |
| Ollie's Bargain Outlet Holdings, Inc. (a) | 32,077 | 2,698,638 |
| Pharmaceuticals 1.3% |
| Catalent, Inc. (a) | 52,683 | 5,696,086 |
| Pacira BioSciences, Inc. (a) | 34,068 | 2,067,246 |
| | | 7,763,332 |
| Professional Services 3.3% |
| ASGN, Inc. (a) | 30,949 | 2,999,887 |
| FTI Consulting, Inc. (a) | 29,873 | 4,080,951 |
| Huron Consulting Group, Inc. (a) | 50,849 | 2,499,228 |
| ManTech International Corp., Class A | 39,380 | 3,407,945 |
| Upwork, Inc. (a) | 113,032 | 6,588,635 |
| | | 19,576,646 |
| Road & Rail 0.9% |
Knight-Swift Transportation
Holdings, Inc. | 38,701 | 1,759,348 |
| Saia, Inc. (a) | 18,468 | 3,868,861 |
| | | 5,628,209 |
| Semiconductors & Semiconductor Equipment 5.6% |
| CMC Materials, Inc. | 29,693 | 4,475,923 |
| Entegris, Inc. | 38,152 | 4,691,551 |
| Lattice Semiconductor Corp. (a) | 74,821 | 4,203,444 |
| Onto Innovation, Inc. (a) | 65,776 | 4,804,279 |
| Power Integrations, Inc. | 38,792 | 3,183,271 |
| Silicon Laboratories, Inc. (a) | 48,459 | 7,426,342 |
| | Shares | | Value |
| |
| Semiconductors & Semiconductor Equipment (continued) |
| SiTime Corp. (a) | 38,371 | | $ 4,857,385 |
| | | | 33,642,195 |
| Software 9.9% |
| Anaplan, Inc. (a) | 77,888 | | 4,151,430 |
| Asana, Inc., Class A (a)(b) | 49,895 | | 3,094,987 |
| Blackline, Inc. (a) | 28,913 | | 3,217,150 |
| Dynatrace, Inc. (a) | 72,395 | | 4,229,316 |
| Envestnet, Inc. (a) | 94,879 | | 7,197,521 |
| Everbridge, Inc. (a) | 27,083 | | 3,685,455 |
| Mimecast Ltd. (a) | 73,980 | | 3,924,639 |
| nCino, Inc. (a) | 62,609 | | 3,751,531 |
| Nuance Communications, Inc. (a) | 73,120 | | 3,980,653 |
| ON24, Inc. (a) | 23,081 | | 818,914 |
| PROS Holdings, Inc. (a) | 56,100 | | 2,556,477 |
| Sprout Social, Inc., Class A (a) | 51,343 | | 4,591,091 |
| Sumo Logic, Inc. (a)(b) | 48,408 | | 999,625 |
| Workiva, Inc. (a) | 86,376 | | 9,616,240 |
| Zuora, Inc., Class A (a) | 190,668 | | 3,289,023 |
| | | | 59,104,052 |
| Specialty Retail 1.5% |
| Leslie's, Inc. (a) | 66,636 | | 1,831,824 |
| National Vision Holdings, Inc. (a) | 97,345 | | 4,977,250 |
| Vroom, Inc. (a) | 52,925 | | 2,215,440 |
| | | | 9,024,514 |
| Trading Companies & Distributors 0.6% |
| SiteOne Landscape Supply, Inc. (a) | 21,857 | | 3,699,516 |
Total Common Stocks
(Cost $391,339,179) | | | 587,026,109 |
| Short-Term Investments 2.7% |
| Affiliated Investment Company 2.0% |
| MainStay U.S. Government Liquidity Fund, 0.01% (c) | 11,797,116 | | 11,797,116 |
| Unaffiliated Investment Company 0.7% |
| Wells Fargo Government Money Market Fund, 0.025% (c)(d) | 4,522,423 | | 4,522,423 |
Total Short-Term Investments
(Cost $16,319,539) | | | 16,319,539 |
Total Investments
(Cost $407,658,718) | 100.7% | | 603,345,648 |
| Other Assets, Less Liabilities | (0.7) | | (4,404,163) |
| Net Assets | 100.0% | | $ 598,941,485 |
The notes to the financial statements are an integral part of, and should be read in conjunction with, the financial statements.
13
Portfolio of Investments June 30, 2021† (Unaudited) (continued)
| † | Percentages indicated are based on Portfolio net assets. |
| (a) | Non-income producing security. |
| (b) | All or a portion of this security was held on loan. As of June 30, 2021, the aggregate market value of securities on loan was $5,094,168; the total market value of collateral held by the Portfolio was $5,306,633. The market value of the collateral held included non-cash collateral in the form of U.S. Treasury securities with a value of $784,210. The Portfolio received cash collateral with a value of $4,522,423. (See Note 2(H)) |
| (c) | Current yield as of June 30, 2021. |
| (d) | Represents a security purchased with cash collateral received for securities on loan. |
| Abbreviation(s): |
| ADR—American Depositary Receipt |
The following is a summary of the fair valuations according to the inputs used as of June 30, 2021, for valuing the Portfolio’s assets:
| Description | Quoted
Prices in
Active
Markets for
Identical
Assets
(Level 1) | | Significant
Other
Observable
Inputs
(Level 2) | | Significant
Unobservable
Inputs
(Level 3) | | Total |
| Asset Valuation Inputs | | | | | | | |
| Investments in Securities (a) | | | | | | | |
| Common Stocks | $ 587,026,109 | | $ — | | $ — | | $ 587,026,109 |
| Short-Term Investments | | | | | | | |
| Affiliated Investment Company | 11,797,116 | | — | | — | | 11,797,116 |
| Unaffiliated Investment Company | 4,522,423 | | — | | — | | 4,522,423 |
| Total Short-Term Investments | 16,319,539 | | — | | — | | 16,319,539 |
| Total Investments in Securities | $ 603,345,648 | | $ — | | $ — | | $ 603,345,648 |
| (a) | For a complete listing of investments and their industries, see the Portfolio of Investments. |
The notes to the financial statements are an integral part of, and should be read in conjunction with, the financial statements.
| 14 | MainStay VP Small Cap Growth Portfolio |
Statement of Assets and Liabilities as of June 30, 2021 (Unaudited)
| Assets |
Investment in unaffiliated securities, at value
(identified cost $395,861,602) including securities on loan of $5,094,168 | $591,548,532 |
Investment in affiliated investment companies, at value
(identified cost $11,797,116) | 11,797,116 |
| Receivables: | |
| Portfolio shares sold | 514,947 |
| Dividends | 163,583 |
| Securities lending | 1,205 |
| Other assets | 7,437 |
| Total assets | 604,032,820 |
| Liabilities |
| Cash collateral received for securities on loan | 4,522,423 |
| Payables: | |
| Manager (See Note 3) | 392,988 |
| Portfolio shares redeemed | 82,679 |
| Shareholder communication | 40,839 |
| NYLIFE Distributors (See Note 3) | 34,923 |
| Custodian | 13,640 |
| Professional fees | 3,780 |
| Trustees | 63 |
| Total liabilities | 5,091,335 |
| Net assets | $598,941,485 |
| Composition of Net Assets |
| Shares of beneficial interest outstanding (par value of $.001 per share) unlimited number of shares authorized | $ 30,429 |
| Additional paid-in-capital | 273,065,194 |
| | 273,095,623 |
| Total distributable earnings (loss) | 325,845,862 |
| Net assets | $598,941,485 |
| Initial Class | |
| Net assets applicable to outstanding shares | $425,672,408 |
| Shares of beneficial interest outstanding | 21,436,609 |
| Net asset value per share outstanding | $ 19.86 |
| Service Class | |
| Net assets applicable to outstanding shares | $173,269,077 |
| Shares of beneficial interest outstanding | 8,992,870 |
| Net asset value per share outstanding | $ 19.27 |
The notes to the financial statements are an integral part of, and should be read in conjunction with, the financial statements.
15
Statement of Operations for the six months ended June 30, 2021 (Unaudited)
| Investment Income (Loss) |
| Income | |
| Dividends-unaffiliated (net of foreign tax withholding of $10,989) | $ 942,701 |
| Securities lending | 9,060 |
| Dividends-affiliated | 960 |
| Total income | 952,721 |
| Expenses | |
| Manager (See Note 3) | 2,329,697 |
| Distribution/Service—Service Class (See Note 3) | 205,012 |
| Shareholder communication | 25,193 |
| Custodian | 14,033 |
| Professional fees | 9,551 |
| Trustees | 5,692 |
| Miscellaneous | 7,416 |
| Total expenses before waiver/reimbursement | 2,596,594 |
| Expense waiver/reimbursement from Manager (See Note 3) | (9,680) |
| Net expenses | 2,586,914 |
| Net investment income (loss) | (1,634,193) |
| Realized and Unrealized Gain (Loss) |
| Net realized gain (loss) on unaffiliated investments | 58,013,781 |
| Net change in unrealized appreciation (depreciation) on unaffiliated investments | (3,128,972) |
| Net realized and unrealized gain (loss) | 54,884,809 |
| Net increase (decrease) in net assets resulting from operations | $53,250,616 |
The notes to the financial statements are an integral part of, and should be read in conjunction with, the financial statements.
| 16 | MainStay VP Small Cap Growth Portfolio |
Statements of Changes in Net Assets
for the six months ended June 30, 2021 (Unaudited) and the year ended December 31, 2020
| | 2021 | 2020 |
| Increase (Decrease) in Net Assets |
| Operations: | | |
| Net investment income (loss) | $ (1,634,193) | $ (2,292,539) |
| Net realized gain (loss) | 58,013,781 | 76,227,902 |
| Net change in unrealized appreciation (depreciation) | (3,128,972) | 100,556,905 |
| Net increase (decrease) in net assets resulting from operations | 53,250,616 | 174,492,268 |
| Distributions to shareholders: | | |
| Initial Class | — | (11,171,351) |
| Service Class | — | (3,851,068) |
| Total distributions to shareholders | — | (15,022,419) |
| Capital share transactions: | | |
| Net proceeds from sales of shares | 60,143,619 | 73,550,635 |
| Net asset value of shares issued to shareholder in reinvestment of distributions | — | 15,022,419 |
| Cost of shares redeemed | (91,196,126) | (129,080,099) |
| Increase (decrease) in net assets derived from capital share transactions | (31,052,507) | (40,507,045) |
| Net increase (decrease) in net assets | 22,198,109 | 118,962,804 |
| Net Assets |
| Beginning of period | 576,743,376 | 457,780,572 |
| End of period | $598,941,485 | $ 576,743,376 |
The notes to the financial statements are an integral part of, and should be read in conjunction with, the financial statements.
17
Financial Highlights selected per share data and ratios
| | Six months ended
June 30,
2021* | | Year Ended December 31, |
| Initial Class | 2020 | | 2019 | | 2018 | | 2017 | | 2016 |
| Net asset value at beginning of period | $ 18.16 | | $ 13.31 | | $ 12.20 | | $ 14.09 | | $ 12.03 | | $ 11.53 |
| Net investment income (loss) (a) | (0.05) | | (0.06) | | (0.06) | | (0.06) | | (0.06) | | (0.05) |
| Net realized and unrealized gain (loss) on investments | 1.75 | | 5.36 | | 2.96 | | (1.04) | | 2.78 | | 1.19 |
| Net realized and unrealized gain (loss) on foreign currency transactions | — | | 0.00‡ | | — | | — | | — | | — |
| Total from investment operations | 1.70 | | 5.30 | | 2.90 | | (1.10) | | 2.72 | | 1.14 |
| Less distributions: | | | | | | | | | | | |
| From net realized gain on investments | — | | (0.45) | | (1.79) | | (0.79) | | (0.66) | | (0.64) |
| Net asset value at end of period | $ 19.86 | | $ 18.16 | | $ 13.31 | | $ 12.20 | | $ 14.09 | | $ 12.03 |
| Total investment return (b) | 9.36% | | 40.48% | | 25.59% | | (8.88)% | | 22.83% | | 10.01% |
| Ratios (to average net assets)/Supplemental Data: | | | | | | | | | | | |
| Net investment income (loss) | (0.50)%†† | | (0.41)% | | (0.41)% | | (0.40)% | | (0.48)% | | (0.41)% |
| Net expenses (c) | 0.83%††(d) | | 0.85%(d) | | 0.85% | | 0.85% | | 0.85% | | 0.86% |
| Portfolio turnover rate | 18% | | 101% | | 46% | | 41% | | 41% | | 36% |
| Net assets at end of period (in 000’s) | $ 425,672 | | $ 422,200 | | $ 332,474 | | $ 251,547 | | $ 312,106 | | $ 282,378 |
| * | Unaudited. |
| ‡ | Less than one cent per share. |
| †† | Annualized. |
| (a) | Per share data based on average shares outstanding during the period. |
| (b) | Total return does not reflect any deduction of sales charges, mortality and expense charges, contract charges or administrative charges. For periods of less than one year, total return is not annualized. |
| (c) | In addition to the fees and expenses which the Portfolio bears directly, it also indirectly bears a pro-rata share of the fees and expenses of the underlying funds in which it invests. Such indirect expenses are not included in the above expense ratios. |
| (d) | Expense waiver/reimbursement less than 0.01%. |
| | Six months ended
June 30,
2021* | | Year Ended December 31, |
| Service Class | 2020 | | 2019 | | 2018 | | 2017 | | 2016 |
| Net asset value at beginning of period | $ 17.64 | | $ 12.97 | | $ 11.96 | | $ 13.87 | | $ 11.88 | | $ 11.42 |
| Net investment income (loss) (a) | (0.07) | | (0.09) | | (0.09) | | (0.09) | | (0.09) | | (0.07) |
| Net realized and unrealized gain (loss) on investments | 1.70 | | 5.21 | | 2.89 | | (1.03) | | 2.74 | | 1.17 |
| Net realized and unrealized gain (loss) on foreign currency transactions | — | | 0.00‡ | | — | | — | | — | | — |
| Total from investment operations | 1.63 | | 5.12 | | 2.80 | | (1.12) | | 2.65 | | 1.10 |
| Less distributions: | | | | | | | | | | | |
| From net realized gain on investments | — | | (0.45) | | (1.79) | | (0.79) | | (0.66) | | (0.64) |
| Net asset value at end of period | $ 19.27 | | $ 17.64 | | $ 12.97 | | $ 11.96 | | $ 13.87 | | $ 11.88 |
| Total investment return (b) | 9.24%(c) | | 40.13% | | 25.28% | | (9.11)% | | 22.53% | | 9.73% |
| Ratios (to average net assets)/Supplemental Data: | | | | | | | | | | | |
| Net investment income (loss) | (0.75)%†† | | (0.66)% | | (0.65)% | | (0.64)% | | (0.72)% | | (0.66)% |
| Net expenses (d) | 1.08%††(e) | | 1.10%(e) | | 1.10% | | 1.10% | | 1.10% | | 1.11% |
| Portfolio turnover rate | 18% | | 101% | | 46% | | 41% | | 41% | | 36% |
| Net assets at end of period (in 000’s) | $ 173,269 | | $ 154,543 | | $ 125,306 | | $ 96,497 | | $ 90,887 | | $ 70,131 |
| * | Unaudited. |
| ‡ | Less than one cent per share. |
| †† | Annualized. |
| (a) | Per share data based on average shares outstanding during the period. |
| (b) | Total return does not reflect any deduction of sales charges, mortality and expense charges, contract charges or administrative charges. For periods of less than one year, total return is not annualized. |
| (c) | Total investment return may reflect adjustments to conform to generally accepted accounting principles. |
| (d) | In addition to the fees and expenses which the Portfolio bears directly, it also indirectly bears a pro-rata share of the fees and expenses of the underlying funds in which it invests. Such indirect expenses are not included in the above expense ratios. |
| (e) | Expense waiver/reimbursement less than 0.01%. |
The notes to the financial statements are an integral part of, and should be read in conjunction with, the financial statements.
| 18 | MainStay VP Small Cap Growth Portfolio |
Notes to Financial Statements (Unaudited)
Note 1–Organization and Business
MainStay VP Funds Trust (the “Fund”) was organized as a Delaware statutory trust on February 1, 2011. The Fund is registered under the Investment Company Act of 1940, as amended (the “1940 Act”), as an open-end management investment company. The Fund is comprised of thirty-one separate series (collectively referred to as the “Portfolios”). These financial statements and notes relate to the MainStay VP Small Cap Growth Portfolio (the "Portfolio"), a "diversified” portfolio, as that term is defined in the 1940 Act, as interpreted or modified by regulatory authorities having jurisdiction, from time to time.
Shares of the Portfolio are currently offered to certain separate accounts to fund variable annuity policies and variable universal life insurance policies issued by New York Life Insurance and Annuity Corporation (“NYLIAC”), a wholly-owned subsidiary of New York Life Insurance Company (“New York Life”) and may also be offered to fund variable annuity policies and variable universal life insurance policies issued by other insurance companies. NYLIAC allocates shares of the Portfolios to, among others, certain NYLIAC separate accounts. Shares of the Portfolio are also offered to the MainStay VP Conservative Allocation Portfolio, MainStay VP Moderate Allocation Portfolio, MainStay VP Growth Allocation Portfolio (formerly known as MainStay VP Moderate Growth Allocation Portfolio) and MainStay VP Equity Allocation Portfolio (formerly known as MainStay VP Growth Allocation Portfolio), which operate as “funds-of-funds," and other variable insurance funds.
The following table lists the Portfolio's share classes that have been registered and commenced operations:
| Class | Commenced Operations |
| Initial Class | February 17, 2012 |
| Service Class | February 17, 2012 |
Shares of the Portfolio are offered and are redeemed at a price equal to their respective net asset value (“NAV”) per share. No sales or redemption charge is applicable to the purchase or redemption of the Portfolio's shares. Under the terms of the Fund’s multiple class plan, adopted pursuant to Rule 18f-3 under the 1940 Act, the classes differ in that, among other things, Service Class shares of the Portfolio pay a combined distribution and service fee of 0.25% of average daily net assets attributable to Service Class shares of the Portfolio to the Distributor (as defined in Note 3(B)) pursuant to a plan adopted in accordance with Rule 12b-1 under the 1940 Act. Contract owners of variable annuity contracts purchased after June 2, 2003, are permitted to invest only in the Service Class shares.
The Portfolio's investment objective is to seek long-term capital appreciation.
Note 2–Significant Accounting Policies
The Portfolio is an investment company and accordingly follows the investment company accounting and reporting guidance of the Financial Accounting Standards Board (“FASB”) Accounting Standard Codification
Topic 946 Financial Services—Investment Companies. The Portfolio prepares its financial statements in accordance with generally accepted accounting principles (“GAAP”) in the United States of America and follows the significant accounting policies described below.
(A) Securities Valuation. Investments are usually valued as of the close of regular trading on the New York Stock Exchange (the "Exchange") (usually 4:00 p.m. Eastern time) on each day the Portfolio is open for business ("valuation date").
The Board of Trustees of the Fund (the "Board") adopted procedures establishing methodologies for the valuation of the Portfolio's securities and other assets and delegated the responsibility for valuation determinations under those procedures to the Valuation Committee of the Fund (the “Valuation Committee”). The procedures state that, subject to the oversight of the Board and unless otherwise noted, the responsibility for the day-to-day valuation of portfolio assets (including fair value measurements for the Portfolio's assets and liabilities) rests with New York Life Investment Management LLC (“New York Life Investments” or the "Manager"), aided to whatever extent necessary by the Subadvisor (as defined in Note 3(A)). To assess the appropriateness of security valuations, the Manager, the Subadvisor or the Portfolio's third-party service provider, who is subject to oversight by the Manager, regularly compares prior day prices, prices on comparable securities and the sale prices to the prior and current day prices and challenges prices with changes exceeding certain tolerance levels with third-party pricing services or broker sources.
The Board authorized the Valuation Committee to appoint a Valuation Subcommittee (the “Subcommittee”) to establish the prices of securities for which market quotations are not readily available or the prices of which are not otherwise readily determinable under the procedures. The Subcommittee meets (in person, via electronic mail or via teleconference) on an as-needed basis. The Valuation Committee meets to ensure that actions taken by the Subcommittee were appropriate.
For those securities valued through either a standardized fair valuation methodology or a fair valuation measurement, the Subcommittee deals with such valuation and the Valuation Committee reviews and affirms, if appropriate, the reasonableness of the valuation based on such methodologies and measurements on a regular basis after considering information that is reasonably available and deemed relevant by the Valuation Committee. Any action taken by the Subcommittee with respect to the valuation of a portfolio security or other asset is submitted for review and ratification (if appropriate) to the Valuation Committee and the Board at the next regularly scheduled meeting.
"Fair value" is defined as the price the Portfolio would reasonably expect to receive upon selling an asset or liability in an orderly transaction to an independent buyer in the principal or most advantageous market for the asset or liability. Fair value measurements are determined within a framework that establishes a three-tier hierarchy that maximizes the use of observable market data and minimizes the use of unobservable inputs to establish a classification of fair value measurements for disclosure
Notes to Financial Statements (Unaudited) (continued)
purposes. "Inputs" refer broadly to the assumptions that market participants would use in pricing the asset or liability, including assumptions about risk, such as the risk inherent in a particular valuation technique used to measure fair value using a pricing model and/or the risk inherent in the inputs for the valuation technique. Inputs may be observable or unobservable. Observable inputs reflect the assumptions market participants would use in pricing the asset or liability based on market data obtained from sources independent of the Portfolio. Unobservable inputs reflect the Portfolio’s own assumptions about the assumptions market participants would use in pricing the asset or liability based on the information available. The inputs or methodology used for valuing assets or liabilities may not be an indication of the risks associated with investing in those assets or liabilities. The three-tier hierarchy of inputs is summarized below.
| • | Level 1—quoted prices in active markets for an identical asset or liability |
| • | Level 2—other significant observable inputs (including quoted prices for a similar asset or liability in active markets, interest rates and yield curves, prepayment speeds, credit risk, etc.) |
| • | Level 3—significant unobservable inputs (including the Portfolio's own assumptions about the assumptions that market participants would use in measuring fair value of an asset or liability) |
The level of an asset or liability within the fair value hierarchy is based on the lowest level of an input, both individually and in the aggregate, that is significant to the fair value measurement. The aggregate value by input level of the Portfolio’s assets and liabilities as of June 30, 2021, is included at the end of the Portfolio of Investments.
The Portfolio may use third-party vendor evaluations, whose prices may be derived from one or more of the following standard inputs, among others:
| • Broker/dealer quotes | • Benchmark securities |
| • Two-sided markets | • Reference data (corporate actions or material event notices) |
| • Bids/offers | • Monthly payment information |
| • Industry and economic events | • Reported trades |
An asset or liability for which market values cannot be measured using the methodologies described above is valued by methods deemed reasonable in good faith by the Valuation Committee, following the procedures established by the Board, to represent fair value. Under these procedures, the Portfolio generally uses a market-based approach which may use related or comparable assets or liabilities, recent transactions, market multiples, book values and other relevant information. The Portfolio may also use an income-based valuation approach in which the anticipated future cash flows of the asset or liability are discounted to calculate fair value. Discounts may also be applied due to the nature and/or duration of any restrictions on the disposition of the asset or liability. Fair value represents a good faith approximation of the value of a security. Fair value determinations involve the consideration of a number
of subjective factors, an analysis of applicable facts and circumstances and the exercise of judgment. As a result, it is possible that the fair value for a security determined in good faith in accordance with the Portfolio's valuation procedures may differ from valuations for the same security determined by other funds using their own valuation procedures. Although the Portfolio's valuation procedures are designed to value a security at the price the Portfolio may reasonably expect to receive upon the security's sale in an orderly transaction, there can be no assurance that any fair value determination thereunder would, in fact, approximate the amount that the Portfolio would actually realize upon the sale of the security or the price at which the security would trade if a reliable market price were readily available. During the six-month period ended June 30, 2021, there were no material changes to the fair value methodologies.
Securities which may be valued in this manner include, but are not limited to: (i) a security for which trading has been halted or suspended; (ii) a debt security that has recently gone into default and for which there is not a current market quotation; (iii) a security of an issuer that has entered into a restructuring; (iv) a security that has been delisted from a national exchange; (v) a security for which the market price is not readily available from a third-party pricing source or, if so provided, does not, in the opinion of the Manager or the Subadvisor, reflect the security's market value; (vi) a security subject to trading collars for which no or limited trading takes place; and (vii) a security whose principal market has been temporarily closed at a time when, under normal conditions, it would be open. Securities valued in this manner are generally categorized as Level 3 in the hierarchy. No securities held by the Portfolio as of June 30, 2021 were fair valued in such a manner.
Certain securities held by the Portfolio may principally trade in foreign markets. Events may occur between the time the foreign markets close and the time at which the Portfolio's NAVs are calculated. These events may include, but are not limited to, situations relating to a single issuer in a market sector, significant fluctuations in U.S. or foreign markets, natural disasters, armed conflicts, governmental actions or other developments not tied directly to the securities markets. Should the Manager or the Subadvisor conclude that such events may have affected the accuracy of the last price of such securities reported on the local foreign market, the Subcommittee may, pursuant to procedures adopted by the Board, adjust the value of the local price to reflect the estimated impact on the price of such securities as a result of such events. In this instance, securities are generally categorized as Level 3 in the hierarchy. Additionally, certain foreign equity securities are also fair valued whenever the movement of a particular index exceeds certain thresholds. In such cases, the securities are fair valued by applying factors provided by a third-party vendor in accordance with valuation procedures adopted by the Board and are generally categorized as Level 2 in the hierarchy. No foreign equity securities held by the Portfolio as of June 30, 2021 were fair valued in such a manner.
Equity securities are valued at the last quoted sales prices as of the close of regular trading on the relevant exchange on each valuation date. Securities that are not traded on the valuation date are valued at the mean of the last quoted bid and ask prices. Prices are normally taken
| 20 | MainStay VP Small Cap Growth Portfolio |
from the principal market in which each security trades. These securities are generally categorized as Level 1 in the hierarchy.
Investments in mutual funds, including money market funds, are valued at their respective NAVs at the close of business each day on the valuation date. These securities are generally categorized as Level 1 in the hierarchy.
Temporary cash investments acquired in excess of 60 days to maturity at the time of purchase are valued using the latest bid prices or using valuations based on a matrix system (which considers such factors as security prices, yields, maturities and ratings), both as furnished by independent pricing services. Temporary cash investments that mature in 60 days or less at the time of purchase ("Short-Term Investments") are valued using the amortized cost method of valuation, unless the use of such method would be inappropriate. The amortized cost method involves valuing a security at its cost on the date of purchase and thereafter assuming a constant amortization to maturity of the difference between such cost and the value on maturity date. Amortized cost approximates the current fair value of a security. Securities valued using the amortized cost method are not valued using quoted prices in an active market and are generally categorized as Level 2 in the hierarchy.
The information above is not intended to reflect an exhaustive list of the methodologies that may be used to value portfolio investments. The valuation procedures permit the use of a variety of valuation methodologies in connection with valuing portfolio investments. The methodology used for a specific type of investment may vary based on the market data available or other considerations. The methodologies summarized above may not represent the specific means by which portfolio investments are valued on any particular business day.
(B) Income Taxes. The Portfolio's policy is to comply with the requirements of the Internal Revenue Code of 1986, as amended (the “Internal Revenue Code”), applicable to regulated investment companies and to distribute all of its taxable income to the shareholders of the Portfolio within the allowable time limits.
The Manager evaluates the Portfolio’s tax positions to determine if the tax positions taken meet the minimum recognition threshold in connection with accounting for uncertainties in income tax positions taken or expected to be taken for the purposes of measuring and recognizing tax liabilities in the financial statements. Recognition of tax benefits of an uncertain tax position is permitted only to the extent the position is “more likely than not” to be sustained assuming examination by taxing authorities. The Manager analyzed the Portfolio's tax positions taken on federal, state and local income tax returns for all open tax years (for up to three tax years) and has concluded that no provisions for federal, state and local income tax are required in the Portfolio's financial statements. The Portfolio's federal, state and local income tax and federal excise tax returns for tax years for which the applicable statutes of limitations have not expired are subject to examination by the Internal Revenue Service and state and local departments of revenue.
(C) Foreign Taxes. The Portfolio may be subject to foreign taxes on income and other transaction-based taxes imposed by certain countries in which it invests. A portion of the taxes on gains on investments or currency purchases/repatriation may be reclaimable. The Portfolio will accrue such taxes and reclaims as applicable, based upon its current interpretation of tax rules and regulations that exist in the markets in which it invests.
The Portfolio may be subject to taxation on realized capital gains, repatriation proceeds and other transaction-based taxes imposed by certain countries in which it invests. The Portfolio will accrue such taxes as applicable based upon its current interpretation of tax rules and regulations that exist in the market in which it invests. Capital gains taxes relating to positions still held are reflected as a liability in the Statement of Assets and Liabilities, as well as an adjustment to the Portfolio's net unrealized appreciation (depreciation). Taxes related to capital gains realized, if any, are reflected as part of net realized gain (loss) in the Statement of Operations. Changes in tax liabilities related to capital gains taxes on unrealized investment gains, if any, are reflected as part of the change in net unrealized appreciation (depreciation) on investments in the Statement of Operations. Transaction-based charges are generally assessed as a percentage of the transaction amount.
(D) Dividends and Distributions to Shareholders. Dividends and distributions are recorded on the ex-dividend date. The Portfolio intends to declare and pay dividends from net investment income and distributions from net realized capital and currency gains, if any, at least annually. Unless a shareholder elects otherwise, all dividends and distributions are reinvested at NAV in the same class of shares of the Portfolio. Dividends and distributions to shareholders are determined in accordance with federal income tax regulations and may differ from determinations using GAAP.
(E) Security Transactions and Investment Income. The Portfolio records security transactions on the trade date. Realized gains and losses on security transactions are determined using the identified cost method. Dividend income is recognized on the ex-dividend date, net of any foreign tax withheld at the source, and interest income is accrued as earned using the effective interest rate method. Distributions received from real estate investment trusts may be classified as dividends, capital gains and/or return of capital.
Investment income and realized and unrealized gains and losses on investments of the Portfolio are allocated pro rata to the separate classes of shares based upon their relative net assets on the date the income is earned or realized and unrealized gains and losses are incurred.
(F) Expenses. Expenses of the Fund are allocated to the individual Portfolios in proportion to the net assets of the respective Portfolios when the expenses are incurred, except where direct allocations of expenses can be made. Expenses (other than fees incurred under the distribution and service plans, further discussed in Note 3(B), which are charged directly to the Service Class shares) are allocated to separate classes of shares pro rata based upon their relative net assets on the date the
Notes to Financial Statements (Unaudited) (continued)
expenses are incurred. The expenses borne by the Portfolio, including those of related parties to the Portfolio, are shown in the Statement of Operations.
Additionally, the Portfolio may invest in mutual funds, which are subject to management fees and other fees that may cause the costs of investing in mutual funds to be greater than the costs of owning the underlying securities directly. These indirect expenses of mutual funds are not included in the amounts shown as expenses in the Statement of Operations or in the expense ratios included in the Financial Highlights.
(G) Use of Estimates. In preparing financial statements in conformity with GAAP, the Manager makes estimates and assumptions that affect the reported amounts and disclosures in the financial statements. Actual results could differ from those estimates and assumptions.
(H) Securities Lending. In order to realize additional income, the Portfolio may engage in securities lending, subject to the limitations set forth in the 1940 Act and relevant guidance by the staff of the Securities and Exchange Commission (“SEC”). If the Portfolio engages in securities lending, the Portfolio will lend through its custodian, JPMorgan Chase Bank, N.A., ("JPMorgan"), acting as securities lending agent on behalf of the Portfolio. Under the current arrangement, JPMorgan will manage the Portfolio's collateral in accordance with the securities lending agency agreement between the Portfolio and JPMorgan, and indemnify the Portfolio against counterparty risk. The loans will be collateralized by cash (which may be invested in a money market fund) and/or non-cash collateral (which may include U.S. Treasury securities and/or U.S. government agency securities issued or guaranteed by the United States government or its agencies or instrumentalities) at least equal at all times to the market value of the securities loaned. The Portfolio bears the risk of delay in recovery of, or loss of rights in, the securities loaned. The Portfolio may also record a realized gain or loss on securities deemed sold due to a borrower’s inability to return securities on loan. The Portfolio bears the risk of any loss on investment of cash collateral. The Portfolio will receive compensation for lending its securities in the form of fees or it will retain a portion of interest earned on the investment of any cash collateral. The Portfolio will also continue to receive interest and dividends on the securities loaned and any gain or loss in the market price of the securities loaned that may occur during the term of the loan will be for the account of the Portfolio. Income earned from securities lending activities, if any, is reflected in the Statement of Operations. Securities on loan as of June 30, 2021, are shown in the Portfolio of Investments.
Prior to February 22, 2021, these services were provided by State Street Bank and Trust Company (“State Street”).
(I) Foreign Securities Risk. The Portfolio invests in foreign securities, which carry certain risks that are in addition to the usual risks inherent in domestic securities. These risks include those resulting from currency fluctuations, future adverse political or economic developments and possible imposition of currency exchange blockages or other foreign governmental laws or restrictions. These risks are likely to be greater in emerging markets than in developed markets. The ability of issuers of
debt securities held by the Portfolio to meet their obligations may be affected by, among other things, economic or political developments in a specific country, industry or region.
(J) Indemnifications. Under the Fund’s organizational documents, its officers and trustees are indemnified against certain liabilities that may arise out of performance of their duties to the Fund. Additionally, in the normal course of business, the Portfolio enters into contracts with third-party service providers that contain a variety of representations and warranties and that may provide general indemnifications. The Portfolio's maximum exposure under these arrangements is unknown, as this would involve future claims that may be made against the Portfolio that have not yet occurred. The Manager believes that the risk of loss in connection with these potential indemnification obligations is remote. However, there can be no assurance that material liabilities related to such obligations will not arise in the future, which could adversely impact the Portfolio.
Note 3–Fees and Related Party Transactions
(A) Manager and Subadvisors. New York Life Investments, a registered investment adviser and an indirect, wholly-owned subsidiary of New York Life, serves as the Portfolio’s Manager pursuant to an Amended and Restated Management Agreement (“Management Agreement”). The Manager provides offices, conducts clerical, recordkeeping and bookkeeping services, and keeps most of the financial and accounting records required to be maintained by the Portfolio. Except for the portion of salaries and expenses that are the responsibility of the Portfolio, the Manager pays the salaries and expenses of all personnel affiliated with the Portfolio and certain operational expenses of the Portfolio. The Portfolio reimburses New York Life Investments in an amount equal to the portion of the compensation of the Chief Compliance Officer attributable to the Portfolio. The Portfolio’s subadvisor changed effective May 1, 2020, due to the termination of Eagle Asset Management, Inc. as the Portfolio’s subadvisor and the appointment of Segall Bryant & Hamill, LLC (“SBH” or a “Subadvisor”) and Brown Advisory LLC (“Brown Advisory” or a “Subadvisor”, and together, with SBH, the “subadvisors”), as the Portfolio’s subadvisors. SBH, a registered investment adviser, serves as a Subadvisor to the Portfolio, pursuant to the terms of a Subadvisory Agreement between New York Life Investments and SBH. Brown Advisory, a registered investment adviser, serves as a Subadvisor to the Portfolio, pursuant to the terms of a Subadvisory Agreement between New York Life Investments and Brown Advisory. Each Subadvisor is responsible for managing a portion of the Portfolio’s assets, as designated by the Manager from time to time. New York Life Investments pays for the services of the Subadvisors.
Pursuant to the Management Agreement, the Fund pays the Manager, on behalf of the Portfolio, a monthly fee for the services performed and the facilities furnished at an annual rate of the Portfolio's average daily net assets as follows: 0.81% up to $1 billion; and 0.785% in excess of $1 billion. During the six-month period ended June 30, 2021, the effective management fee rate was 0.81%.
| 22 | MainStay VP Small Cap Growth Portfolio |
During the six-month period ended June 30, 2021, New York Life Investments earned fees from the Portfolio in the amount of $2,329,697 and voluntarily waived fees/reimbursed expenses in the amount of $9,680 and paid SBH and Brown Advisory in the amount of $582,429 and $567,782, respectively.
JPMorgan provides sub-administration and sub-accounting services to the Portfolio pursuant to an agreement with New York Life Investments. These services include calculating the daily NAVs of the Portfolio, maintaining the general ledger and sub-ledger accounts for the calculation of the Portfolio's NAVs, and assisting New York Life Investments in conducting various aspects of the Portfolio's administrative operations. For providing these services to the Portfolio, JPMorgan is compensated by New York Life Investments.
Prior to February 22, 2021, these services were provided by State Street.
Pursuant to an agreement between the Fund and New York Life Investments, New York Life Investments is responsible for providing or
procuring certain regulatory reporting services for the Portfolio. The Portfolio will reimburse New York Life Investments for the actual costs incurred by New York Life Investments in connection with providing or procuring these services for the Portfolio.
(B) Distribution and Service Fees. The Fund, on behalf of the Portfolio, has entered into a distribution agreement with NYLIFE Distributors LLC (the “Distributor”), an affiliate of New York Life Investments. The Portfolio has adopted a distribution plan (the “Plan”) in accordance with the provisions of Rule 12b-1 under the 1940 Act. Under the Plan, the Distributor has agreed to provide, through its affiliates or independent third parties, various distribution-related, shareholder and administrative support services to the Service Class shareholders. For its services, the Distributor is entitled to a combined distribution and service fee accrued daily and paid monthly at an annual rate of 0.25% of the average daily net assets attributable to the Service Class shares of the Portfolio.
(C) Investments in Affiliates (in 000’s). During the six-month period ended June 30, 2021, purchases and sales transactions, income earned from investments and shares held of investment companies managed by New York Life Investments or its affiliates were as follows:
| Affiliated Investment Companies | Value,
Beginning
of Period | Purchases
at Cost | Proceeds
from
Sales | Net
Realized
Gain/(Loss)
on Sales | Change in
Unrealized
Appreciation/
(Depreciation) | Value,
End of
Period | Dividend
Income | Other
Distributions | Shares
End of
Period |
| MainStay U.S. Government Liquidity Fund | $ 9,588 | $ 140,116 | $ (137,907) | $ — | $ — | $ 11,797 | $ 1 | $ — | 11,797 |
Note 4-Federal Income Tax
As of June 30, 2021, the cost and unrealized appreciation (depreciation) of the Portfolio’s investment portfolio, including applicable derivative contracts and other financial instruments, as determined on a federal income tax basis, were as follows:
| | Federal Tax
Cost | Gross
Unrealized
Appreciation | Gross
Unrealized
(Depreciation) | Net
Unrealized
Appreciation/
(Depreciation) |
| Investments in Securities | $408,031,159 | $200,057,426 | $(4,742,937) | $195,314,489 |
During the year ended December 31, 2020, the tax character of distributions paid as reflected in the Statements of Changes in Net Assets was as follows:
| | 2020 |
| Distributions paid from: | |
| Long-Term Capital Gains | $15,022,419 |
Note 5–Custodian
JPMorgan is the custodian of cash and securities held by the Portfolio. Custodial fees are charged to the Portfolio based on the Portfolio's net assets and/or the market value of securities held by the Portfolio and the number of certain transactions incurred by the Portfolio.
Prior to February 22, 2021, these services were provided by State Street. The services provided by State Street were a direct expense of the Portfolio and are included in the Statement of Operations as Custodian fees which totaled $3,877 for the period January 1, 2021 through February 21, 2021.
Note 6–Line of Credit
The Portfolio and certain other funds managed by New York Life Investments maintain a line of credit with a syndicate of banks in order to secure a source of funds for temporary purposes to meet unanticipated or excessive redemption requests.
Effective July 27, 2021, under the credit agreement (the “Credit Agreement”), the aggregate commitment amount is $600,000,000 with an additional uncommitted amount of $100,000,000. The commitment fee is an annual rate of 0.15% of the average commitment amount payable quarterly, regardless of usage, to JPMorgan, who serves as the agent to the syndicate. The commitment fee is allocated among the Portfolio and certain other funds managed by New York Life Investments based upon their respective net assets and other factors. Interest on any revolving credit loan is charged based upon the Federal Funds Rate or the one-month London Interbank Offered Rate ("LIBOR"), whichever is higher. The Credit Agreement expires on July 26, 2022, although the Portfolio, certain other funds managed by New York Life Investments and the syndicate of banks may renew the Credit Agreement for an additional year on the same or different terms or enter into a credit agreement with
Notes to Financial Statements (Unaudited) (continued)
a different syndicate of banks. Prior to July 27, 2021, the aggregate commitment amount and the commitment fee were the same as those under the current Credit Agreement. During the six-month period ended June 30, 2021, there were no borrowings made or outstanding with respect to the Portfolio under the Credit Agreement.
Note 7–Interfund Lending Program
Pursuant to an exemptive order issued by the SEC, the Portfolio, along with certain other funds managed by New York Life Investments, may participate in an interfund lending program. The interfund lending program provides an alternative credit facility that permits the Portfolio and certain other funds managed by New York Life Investments to lend or borrow money for temporary purposes directly to or from one another, subject to the conditions of the exemptive order. During the six-month period ended June 30, 2021, there were no interfund loans made or outstanding with respect to the Portfolio.
Note 8–Purchases and Sales of Securities (in 000’s)
During the six-month period ended June 30, 2021, purchases and sales of securities, other than short-term securities, were $98,244 and $133,567, respectively.
Note 9–Capital Share Transactions
Transactions in capital shares for the six-month period ended June 30, 2021 and the year ended December 31, 2020, were as follows:
| Initial Class | Shares | Amount |
| Period ended June 30, 2021: | | |
| Shares sold | 2,421,405 | $ 45,647,679 |
| Shares redeemed | (4,237,487) | (81,096,969) |
| Net increase (decrease) | (1,816,082) | $(35,449,290) |
| Year ended December 31, 2020: | | |
| Shares sold | 3,917,901 | $ 53,281,864 |
| Shares issued to shareholders in reinvestment of distributions | 737,251 | 11,171,351 |
| Shares redeemed | (6,390,605) | (93,305,819) |
| Net increase (decrease) | (1,735,453) | $(28,852,604) |
| |
| Service Class | Shares | Amount |
| Period ended June 30, 2021: | | |
| Shares sold | 779,159 | $ 14,495,940 |
| Shares redeemed | (547,524) | (10,099,157) |
| Net increase (decrease) | 231,635 | $ 4,396,783 |
| Year ended December 31, 2020: | | |
| Shares sold | 1,540,640 | $ 20,268,771 |
| Shares issued to shareholders in reinvestment of distributions | 261,458 | 3,851,068 |
| Shares redeemed | (2,702,909) | (35,774,280) |
| Net increase (decrease) | (900,811) | $(11,654,441) |
Note 10–Other Matters
An outbreak of COVID-19, first detected in December 2019, has developed into a global pandemic and has resulted in travel restrictions, closure of international borders, certain businesses and securities markets, restrictions on securities trading activities, prolonged quarantines, supply chain disruptions, and lower consumer demand, as well as general concern and uncertainty. The continued impact of COVID-19 and related new variants is uncertain and could further adversely affect the global economy, national economies, individual issuers and capital markets in unforeseeable ways and result in a substantial and extended economic downturn. Developments that disrupt global economies and financial markets, such as COVID-19, may magnify factors that affect the Portfolio's performance.
Note 11–Subsequent Events
In connection with the preparation of the financial statements of the Portfolio as of and for the six-month period ended June 30, 2021, events and transactions subsequent to June 30, 2021, through the date the financial statements were issued have been evaluated by the Manager for possible adjustment and/or disclosure. No subsequent events requiring financial statement adjustment or disclosure have been identified.
| 24 | MainStay VP Small Cap Growth Portfolio |
Discussion of the Operation and Effectiveness of the Portfolio's Liquidity Risk Management Program (Unaudited)
In compliance with Rule 22e-4 under the Investment Company Act of 1940, as amended (the “Liquidity Rule”), the Portfolio has adopted and implemented a liquidity risk management program (the “Program”), which New York Life Investment Management LLC believes is reasonably designed to assess and manage the Portfolio's liquidity risk (the risk that the Portfolio could not meet requests to redeem shares issued by the Portfolio without significant dilution of remaining investors’ interests in the Portfolio). The Board of Trustees of MainStay VP Funds Trust (the "Board") designated New York Life Investment Management LLC as administrator of the Program (the “Administrator”). The Administrator has established a Liquidity Risk Management Committee to assist the Administrator in the implementation and day-to-day administration of the Program and to otherwise support the Administrator in fulfilling its responsibilities under the Program.
At a meeting of the Board held on March 8, 2021, the Administrator provided the Board with a written report addressing the Program’s operation and assessing its adequacy and effectiveness of implementation for the period from January 1, 2020 through December 31, 2020 (the "Review Period"), as required under the Liquidity Rule. The report noted that the Administrator concluded that (i) the Program operated effectively to assess and manage the Portfolio's liquidity risk, (ii) the Program has been adequately and effectively implemented to monitor and, as applicable, respond to the Portfolio's liquidity developments and (iii) the Portfolio's investment strategy continues to be appropriate for an open-end fund. In addition, the report discussed notable events that impacted liquidity risk during the Review Period, including the COVID-19 pandemic and the resulting economic shutdown.
In accordance with the Program, the Portfolio's liquidity risk is assessed no less frequently than annually taking into consideration certain factors, as applicable, such as (i) investment strategy and liquidity of portfolio investments, (ii) short-term and long-term cash flow projections and (iii) holdings of cash and cash equivalents, as well as borrowing arrangements and other funding sources. Certain factors are considered under both normal and reasonably foreseeable stressed conditions.
Each Portfolio portfolio investment is classified into one of four liquidity categories. The classification is based on a determination of the number of days it is reasonably expected to take to convert the investment into cash, or sell or dispose of the investment, in current market conditions without significantly changing the market value of the investment. The Administrator has delegated liquidity classification determinations to the Portfolio’s subadvisors, subject to appropriate oversight by the Administrator, and classification determinations are made by taking into account the Portfolio's reasonably anticipated trade size, various market, trading and investment-specific considerations, as well as market depth, and, in certain cases, third-party vendor data.
The Liquidity Rule requires portfolios that do not primarily hold assets that are highly liquid investments to adopt a minimum amount of net assets that must be invested in highly liquid investments that are assets (an “HLIM”). In addition, the Liquidity Rule limits a portfolio's investments in illiquid investments. Specifically, the Liquidity Rule prohibits acquisition of illiquid investments if doing so would result in a portfolio holding more than 15% of its net assets in illiquid investments that are assets. The Program includes provisions reasonably designed to determine, periodically review and comply with the HLIM requirement, as applicable, and to comply with the 15% limit on illiquid investments.
There can be no assurance that the Program will achieve its objectives under all circumstances in the future. Please refer to the Portfolio's prospectus for more information regarding the Portfolio's exposure to liquidity risk and other risks to which it may be subject.
Proxy Voting Record
The Portfolio is required to file with the SEC its proxy voting records for the 12-month period ending June 30 on Form N-PX. The Portfolio's most recent Form N-PX or proxy voting record is available free of charge upon request (i) by calling 800-598-2019; (ii) by visiting New York Life Investments’ website at https://www.nylinvestments.com/mainstay/
products-and-performance/mainstay-vp-funds-trust; or (iii) by visiting the SEC’s website at www.sec.gov.
Shareholder Reports and Quarterly Portfolio Disclosure
The Portfolio is required to file its complete schedule of portfolio holdings with the SEC 60 days after its first and third fiscal quarter on Form N-PORT. The Portfolio's holdings report is available free of charge upon request by calling 800-598-2019 or by visiting the SEC’s website at www.sec.gov.
| 26 | MainStay VP Small Cap Growth Portfolio |
MainStay VP Portfolios
MainStay VP offers a wide range of Portfolios. The full array of MainStay VP offerings is listed here, with information about the manager, subadvisors, legal counsel, and independent registered public accounting firm.
Equity
MainStay VP Candriam Emerging Markets Equity Portfolio
MainStay VP Epoch U.S. Equity Yield Portfolio
MainStay VP Fidelity Institutional AM® Utilities Portfolio†
MainStay VP MacKay International Equity Portfolio
MainStay VP MacKay S&P 500 Index Portfolio
MainStay VP Natural Resources Portfolio
MainStay VP Small Cap Growth Portfolio
MainStay VP T. Rowe Price Equity Income Portfolio
MainStay VP Wellington Growth Portfolio
MainStay VP Wellington Mid Cap Portfolio
MainStay VP Wellington Small Cap Portfolio
MainStay VP Wellington U.S. Equity Portfolio
MainStay VP Winslow Large Cap Growth Portfolio
Mixed Asset
MainStay VP Balanced Portfolio
MainStay VP Income Builder Portfolio
MainStay VP Janus Henderson Balanced Portfolio
MainStay VP MacKay Convertible Portfolio
Income
MainStay VP Bond Portfolio
MainStay VP Floating Rate Portfolio
MainStay VP Indexed Bond Portfolio
MainStay VP MacKay Government Portfolio
MainStay VP MacKay High Yield Corporate Bond Portfolio
MainStay VP MacKay Strategic Bond Portfolio
MainStay VP PIMCO Real Return Portfolio
Money Market
MainStay VP U.S. Government Money Market Portfolio
Alternative
MainStay VP CBRE Global Infrastructure Portfolio
MainStay VP IQ Hedge Multi-Strategy Portfolio
Asset Allocation
MainStay VP Conservative Allocation Portfolio
MainStay VP Equity Allocation Portfolio
MainStay VP Growth Allocation Portfolio
MainStay VP Moderate Allocation Portfolio
Manager
New York Life Investment Management LLC
New York, New York
Subadvisors
Brown Advisory LLC
Baltimore, Maryland
Candriam Belgium S.A.*
Brussels, Belgium
CBRE Clarion Securities LLC
Radnor, Pennsylvania
Epoch Investment Partners, Inc.
New York, New York
FIAM LLC
Smithfield, Rhode Island
IndexIQ Advisors LLC*
New York, New York
Janus Capital Management LLC
Denver, Colorado
MacKay Shields LLC*
New York, New York
Mellon Investments Corporation
Boston, Massachusetts
NYL Investors LLC*
New York, New York
Pacific Investment Management Company LLC
Newport Beach, California
Segall Bryant & Hamill, LLC
Chicago, Illinois
T. Rowe Price Associates, Inc.
Baltimore, Maryland
Wellington Management Company LLP
Boston, Massachusetts
Winslow Capital Management, LLC
Minneapolis, Minnesota
Legal Counsel
Dechert LLP
Washington, District of Columbia
Independent Registered Public Accounting Firm
PricewaterhouseCoopers LLP
New York, New York
Distributor
NYLIFE Distributors LLC*
Jersey City, New Jersey
Custodian
JPMorgan Chase Bank, N.A.
New York, New York
Some Portfolios may not be available in all products.
† Fidelity Institutional AM is a registered trade mark of FMR LLC. Used with permission.
* An affiliate of New York Life Investment Management LLC
Not part of the Semiannual Report
2021 Semiannual Report
This report is for the general information of New York Life Variable Annuities and NYLIAC Variable Universal Life Insurance Products policyowners. It must be preceded or accompanied by the appropriate product(s) and funds prospectuses if it is given to anyone who is not an owner of a New York Life variable annuity policy or a NYLIAC Variable Universal Life Insurance Product. This report does not offer for sale or solicit orders to purchase securities.
The performance data quoted in this report represents past performance. Past performance is no guarantee of future results. Due to market volatility and other factors, current performance may be lower or higher than the figures shown. The most recent month-end performance summary for your variable annuity or variable life policy is available by calling 800-598-2019 and is updated periodically on newyorklife.com.
The New York Life Variable Annuities and NYLIAC Variable Universal Life Insurance Products are issued by New York Life Insurance and Annuity Corporation (a Delaware Corporation) and distributed by NYLIFE Distributors LLC (Member FINRA/SIPC).
New York Life Insurance Company
New York Life Insurance and Annuity
Corporation (NYLIAC) (A Delaware Corporation)
51 Madison Avenue, Room 551
New York, NY 10010
newyorklife.com
nylinvestments.com
NYLIFE Distributors LLC, 30 Hudson Street, Jersey City, NJ 07302
New York Life Investment Management LLC is the investment manager to the MainStay VP Funds Trust
©2021 by NYLIFE Distributors LLC. All rights reserved.
You may obtain copies of the Prospectus and the Statement of Additional Information free of charge, upon request, by calling toll-free 800-598-2019 or writing to New York Life Insurance and Annuity Corporation, 51 Madison Avenue, New York, NY 10010.
| Not FDIC Insured | No Bank Guarantee | May Lose Value |
(NYLIAC) NI515
MainStay VP MacKay International Equity Portfolio
Message from the President and Semiannual Report
Unaudited | June 30, 2021
Sign up for e-delivery of your shareholder reports. For full details on e-delivery, including who can participate and what you can receive via e-delivery,
please log in to newyorklifeinvestments.com/accounts.
| Not FDIC/NCUA Insured | Not a Deposit | May Lose Value | No Bank Guarantee | Not Insured by Any Government Agency |
This page intentionally left blank
Message from the President
The COVID-19 pandemic continued to afflict our personal lives and broad segments of the U.S. and global economy throughout the six-month reporting period ended June 30, 2021. However, with the deployment of multiple vaccines around the world, including three highly effective versions approved for emergency use in the United States, investors began to turn their attention toward the gradual reopening of the economy and the shape the “new normal” would take.
The first half of the reporting period saw increasing inflationary concerns as fiscal stimulus business reopenings drove accelerating economic growth, rising commodity prices and increased consumer spending. However, the U.S. Federal Reserve noted that price increases were likely to prove temporary and made clear their intention to remain accommodative for the foreseeable future. Accordingly, after moving higher in the first quarter of 2021, interest rates declined in the second quarter.
In response to the uncertain inflation outlook, equity market leadership shifted from value in the first quarter of the year to growth in the second quarter. Nevertheless, investor sentiment remained buoyant throughout the reporting period, with all eleven sectors in the S&P 500® Index, a widely regarded benchmark of market performance, producing positive returns. Energy led the market’s rise fueled by rapidly increasing oil and gas prices, followed by financials and real estate, which benefited from rising interest rates and the economic reopening, respectively. Communication services produced the slowest growth, followed by the traditionally defensive utilities and consumer staples
sectors. In the fixed income market, lower-credit-quality issues tended to outperform their higher-grade counterparts, with high-yield corporate bonds generating the strongest performance. Among securitized products, commercial mortgage-backed securities generally produced the strongest returns, followed by mortgage-backed securities and asset-backed securities, while Treasury securities lagged.
Despite the tremendous progress we’ve seen so far this year, the United States and the world continue to face significant pandemic-related challenges. Newer, more contagious variants of COVID-19 threaten the return of restrictions and lockdowns that could stall the economic recovery. At the same time, supply chain shortages have led to rising prices on everything from laptops to autos, stoking fears of uncontrolled inflation despite reassurance from the U.S. Federal Reserve. At New York Life Investments, we recognize that the shape that the “new normal” eventually takes may differ from our expectations. You can depend on us to keep a sharp watch for the unexpected, and to continue to help you find your way through this rapidly evolving investment landscape.
Sincerely,
Kirk C. Lehneis
President
The opinions expressed are as of the date of this report and are subject to change. There is no guarantee that any forecast made will come to pass. This material does not constitute investment advice and is not intended as an endorsement of any specific investment. Past performance is no guarantee of future results.
Not part of the Semiannual Report
Investors should refer to the Portfolio’s Summary Prospectus and/or Prospectus and consider the Portfolio’s investment objectives, strategies, risks, charges and expenses carefully before investing. The Summary Prospectus and/or Prospectus contain this and other information about the Portfolio. You may obtain copies of the Portfolio’s Summary Prospectus and/or the Prospectus and the Statement of Additional Information free of charge, upon request, by calling toll-free 800-598-2019, by writing to New York Life Insurance and Annuity Corporation, 51 Madison Avenue, Room 251, New York, New York 10010 or by sending an email to MainStayShareholdersServices@nylim.com. These documents are also available at nylinvestments.com/vpdocuments. Please read the Portfolio's Summary Prospectus and/or Prospectus carefully before investing. MainStay VP Funds Trust portfolios are separate account options which are purchased through a variable insurance or variable annuity contract.
Investment and Performance Comparison (Unaudited)
Performance data quoted represents past performance. Past performance is no guarantee of future results. Because of market volatility and other factors, current performance may be lower or higher than the figures shown. Investment return and principal value will fluctuate, and as a result, when shares are redeemed, they may be worth more or less than their original cost. The performance table and graph do not reflect any deduction of sales charges, mortality and expense charges, contract charges or administrative charges. Please refer to the Performance Summary appropriate for your policy. For performance information current to the most recent month-end, please call 800-598-2019 or visit www.newyorklife.com.
Performance figures may reflect certain fee waivers and/or expense limitations, without which total returns may have been different. For information on current fee waivers and/or expense limitations (if any), please refer to the Notes to Financial Statements.
| Average Annual Total Returns for the Period-Ended June 30, 2021 |
| Class | Inception
Date | Six
Months | One
Year | Five
Years | Ten
Years | Gross
Expense
Ratio1 |
| Initial Class Shares | 5/1/1995 | 8.89% | 37.24% | 12.95% | 8.24% | 0.96% |
| Service Class Shares | 6/5/2003 | 8.76 | 36.90 | 12.67 | 7.97 | 1.21 |
| 1. | The gross expense ratios presented reflect the Portfolio’s “Total Annual Portfolio Operating Expenses” from the most recent Prospectus, as supplemented, and may differ from other expense ratios disclosed in this report. |
| Benchmark Performance | Six
Months | One
Year | Five
Years | Ten
Years |
| MSCI ACWI® ex USA Index (Net)1 | 9.16% | 35.72% | 11.08% | 5.45% |
| MSCI EAFE® Index (Net)2 | 8.83 | 32.35 | 10.28 | 5.89 |
| Morningstar Foreign Large Growth Category Average3 | 7.15 | 34.83 | 13.78 | 7.75 |
| 1. | The Portfolio has selected the MSCI ACWI® (All Country World Index) ex USA Index (Net) as its primary benchmark. The MSCI ACWI® ex USA Index (Net) is a free float-adjusted market capitalization weighted index is a broad-based benchmark that is designed to measure the equity market performance of developed and emerging markets, excluding the U.S. Results assume reinvestment of all dividends and capital gains. An investment cannot be made directly in an index. |
| 2. | The MSCI EAFE® Index (Net) is the Portfolio's secondary benchmark. The MSCI EAFE® Index (Net) consists of international stocks representing the developed world outside of North America. Results assume reinvestment of all dividends and capital gains. An investment cannot be made directly in an index. |
| 3. | The Morningstar Foreign Large Growth Category Average is representative of funds that focus on high-priced growth stocks, mainly outside of the United States. Most of these funds divide their assets among a dozen or more developed markets, including Japan, Britain, France, and Germany. These funds primarily invest in stocks that have market caps in the top 70% of each economically integrated market and will have less than 20% of assets invested in U.S. stocks. Results are based on average total returns of similar funds with all dividends and capital gain distributions reinvested. |
Cost in Dollars of a $1,000 Investment in MainStay VP MacKay International Equity Portfolio (Unaudited)
The example below is intended to describe the fees and expenses borne by shareholders during the six-month period from January 1, 2021 to June 30, 2021, and the impact of those costs on your investment.
Example
As a shareholder of the Portfolio you incur two types of costs: (1) transaction costs, including exchange fees and sales charges (loads) on purchases (as applicable), and (2) ongoing costs, including management fees, distribution and/or service (12b-1) fees, and other Portfolio expenses (as applicable). This example is intended to help you understand your ongoing costs (in dollars) of investing in the Portfolio and to compare these costs with the ongoing costs of investing in other mutual funds. The example is based on an investment of $1,000 made at the beginning of the six-month period and held for the entire period from January 1, 2021 to June 30, 2021. Shares are only sold in connection with variable life and annuity contracts and the example does not reflect any contract level or transactional fees or expenses. If these costs had been included, your costs would have been higher.
This example illustrates your Portfolio’s ongoing costs in two ways:
Actual Expenses
The second and third data columns in the table below provide information about actual account values and actual expenses. You may use the information in these columns, together with the amount you invested, to estimate the expenses that you paid during the six months ended June
30, 2021. Simply divide your account value by $1,000 (for example, an $8,600 account value divided by $1,000 = 8.6), then multiply the result by the number under the heading entitled “Expenses Paid During Period” to estimate the expenses you paid on your account during this period.
Hypothetical Example for Comparison Purposes
The fourth and fifth data columns in the table below provide information about hypothetical account values and hypothetical expenses based on the Portfolio’s actual expense ratio and an assumed rate of return of 5% per year before expenses, which is not the Portfolio’s actual return. The hypothetical account values and expenses may not be used to estimate the actual ending account balances or expenses you paid for the six-month period shown. You may use this information to compare the ongoing costs of investing in the Portfolio with the ongoing costs of investing in other mutual funds. To do so, compare this 5% hypothetical example with the 5% hypothetical examples that appear in the shareholder reports of the other mutual funds.
Please note that the expenses shown in the table are meant to highlight your ongoing costs only and do not reflect any transactional costs, such as exchange fees or sales charges (loads). Therefore, the fourth and fifth data columns of the table are useful in comparing ongoing costs only and will not help you determine the relative total costs of owning different funds. In addition, if these transactional costs were included, your costs would have been higher.
| Share Class | Beginning
Account
Value
1/1/21 | Ending Account
Value (Based
on Actual
Returns and
Expenses)
6/30/21 | Expenses
Paid
During
Period1 | Ending Account
Value (Based
on Hypothetical
5% Annualized
Return and
Actual Expenses)
6/30/21 | Expenses
Paid
During
Period1 | Net Expense
Ratio
During
Period2 |
| Initial Class Shares | $1,000.00 | $1,088.90 | $4.92 | $1,020.08 | $4.76 | 0.95% |
| Service Class Shares | $1,000.00 | $1,087.60 | $6.21 | $1,018.84 | $6.01 | 1.20% |
| 1. | Expenses are equal to the Portfolio’s annualized expense ratio of each class multiplied by the average account value over the period, divided by 365 and multiplied by 181 (to reflect the six-month period). The table above represents the actual expenses incurred during the six-month period. In addition to the fees and expenses which the Portfolio bears directly, it also indirectly bears a pro rata share of the fees and expenses of the underlying funds in which it invests. Such indirect expenses are not included in the above-reported expense figures. |
| 2. | Expenses are equal to the Portfolio's annualized expense ratio to reflect the six-month period. |
| 6 | MainStay VP MacKay International Equity Portfolio |
Country Composition as of June 30, 2021 (Unaudited)
| France | 15.9% |
| United Kingdom | 13.6 |
| Germany | 13.1 |
| Japan | 9.9 |
| United States | 9.0 |
| Netherlands | 5.7 |
| Denmark | 5.5 |
| Switzerland | 4.6 |
| India | 4.6 |
| China | 4.3 |
| Taiwan | 3.1 |
| Sweden | 1.9% |
| Ireland | 1.9 |
| Mexico | 1.4 |
| Canada | 1.2 |
| Italy | 1.1 |
| Spain | 1.1 |
| Israel | 1.1 |
| Brazil | 0.9 |
| Other Assets, Less Liabilities | 0.1 |
| | 100.0% |
See Portfolio of Investments beginning on page 9 for specific holdings within these categories. The Portfolio's holdings are subject to change.
Top Ten Holdings as of June 30, 2021 (excluding short-term investments) (Unaudited)
| 1. | Tencent Holdings Ltd. |
| 2. | Sartorius Stedim Biotech |
| 3. | Teleperformance |
| 4. | Lonza Group AG (Registered) |
| 5. | STERIS plc |
| 6. | CyberAgent, Inc. |
| 7. | Deutsche Boerse AG |
| 8. | Dassault Systemes SE |
| 9. | Koninklijke Philips NV |
| 10. | Scout24 AG |
Portfolio Management Discussion and Analysis (Unaudited)
Answers to the questions reflect the views of portfolio managers Carlos Garcia-Tunon, CFA, Ian Murdoch, CFA, and Lawrence Rosenberg, CFA, of MacKay Shields LLC, the Portfolio’s Subadvisor.
How did MainStay VP MacKay International Equity Portfolio perform relative to its benchmarks and peers during the six months ended June 30, 2021?
For the six months ended June 30, 2021, MainStay VP MacKay International Equity Portfolio returned 8.89% for Initial Class shares and 8.76% for Service Class shares. Over the same period, both share classes underperformed the 9.16% return of the MSCI ACWI® Ex U.S. Index (Net), which is the Portfolio’s primary benchmark, while Initial Class shares outperformed and Service Class shares underperformed the 8.83% return of the MSCI EAFE® Index (Net), which is a secondary benchmark of the Portfolio. For the six months ended June 30, 2021, both share classes outperformed the 7.15% return of the Morningstar Foreign Large Growth Category Average.1
What factors affected the Portfolio’s relative performance during the reporting period?
The Portfolio’s underperformance relative to the MSCI ACWI® Ex U.S. Index (Net) was driven primarily by stock selection on both a sector and country basis. However, positive contributions from sector and country allocation helped to offset some of these headwinds. (Contributions take weightings and total returns into account.)
Which sectors were the strongest positive contributors to the Portfolio’s relative performance, and which sectors were particularly weak?
During the reporting period, the strongest positive contributions to the Portfolio's performance relative to the MSCI ACWI® Ex U.S. Index (Net) came from the consumer discretionary, consumer staples and health care sectors. During the same period, the weakest contributors to relative performance were the industrials, materials and energy sectors.
During the reporting period, which individual stocks made the strongest positive contributions to the Portfolio’s absolute performance and which stocks detracted the most?
The top contributors to the Portfolio's absolute performance during the reporting period included shares in U.K. wealth manager St. James's Place, French customer relationship management services firm Teleperformance, and Swiss contract development and manufacturing organization Lonza Group. The most significant detractors in terms of absolute performance were holdings in Japanese elder care services facilitator SMS, German dialysis equipment and services provider Fresenius Medical Care, and Japanese engineering staffing provider TechnoPro Holdings.
Did the Portfolio make any significant purchases or sales during the reporting period?
During the reporting period, the Portfolio's largest initial purchase was in shares of French pharmaceutical and laboratory equipment supplier Sartorius Stedim Biotech, while the largest increase in position size was in shares of Lonza Group. The Portfolio's largest full sale was its position in Fresenius Medical Care, while the largest decreased position size was in shares of Swedish measurement technology provider Hexagon.
How did the Portfolio’s sector weightings change during the reporting period?
The Portfolio's largest increases in sector exposures relative to the MSCI ACWI® Ex U.S. Index (Net) were in the health care and communication services sectors. Conversely, the Portfolio's largest decreases in relative sector exposures were within the information technology and real estate sectors.
How was the Portfolio positioned at the end of the reporting period?
As of June 30, 2021, the Portfolio’s most overweight positions relative to the MSCI ACWI® Ex U.S. Index (Net) were in the health care and technology sectors. As of that same date, the Portfolio’s most significantly underweight positions relative to the Index were in the consumer discretionary and consumer staples sectors.
| 1. | See page 5 for more information on benchmark and peer group returns. |
The opinions expressed are those of the portfolio managers as of the date of this report and are subject to change. There is no guarantee that any forecasts will come to pass. This material does not constitute investment advice and is not intended as an endorsement of any specific investment.
Not all MainStay VP Portfolios and/or share classes are available under all policies.
| 8 | MainStay VP MacKay International Equity Portfolio |
Portfolio of Investments June 30, 2021† (Unaudited)
| | Shares | Value |
| Common Stocks 98.7% |
| Brazil 0.9% |
| Notre Dame Intermedica Participacoes SA (Health Care Providers & Services) | 309,149 | $ 5,278,866 |
| Canada 1.2% |
| Constellation Software, Inc. (Software) | 4,361 | 6,604,861 |
| China 4.3% |
| Tencent Holdings Ltd. (Interactive Media & Services) | 331,925 | 24,966,088 |
| Denmark 5.5% |
| Chr Hansen Holding A/S (Chemicals) | 159,417 | 14,387,885 |
| Novo Nordisk A/S, Class B (Pharmaceuticals) | 208,289 | 17,450,275 |
| | | 31,838,160 |
| France 15.9% |
| BioMerieux (Health Care Equipment & Supplies) | 139,760 | 16,240,601 |
| Dassault Systemes SE (Software) | 77,621 | 18,821,996 |
| Edenred (IT Services) | 273,651 | 15,591,345 |
| Sartorius Stedim Biotech (Life Sciences Tools & Services) | 45,461 | 21,502,856 |
| Teleperformance (Professional Services) | 49,818 | 20,220,241 |
| | | 92,377,039 |
| Germany 13.1% |
| Carl Zeiss Meditec AG (Health Care Equipment & Supplies) | 30,283 | 5,851,220 |
| Deutsche Boerse AG (Capital Markets) | 108,284 | 18,900,149 |
| SAP SE (Software) | 115,440 | 16,267,173 |
| Scout24 AG (Interactive Media & Services) (a) | 213,695 | 18,021,015 |
| Symrise AG (Chemicals) | 83,687 | 11,659,744 |
| Zalando SE (Internet & Direct Marketing Retail) (a)(b) | 44,739 | 5,408,373 |
| | | 76,107,674 |
| India 4.6% |
| HDFC Bank Ltd. (Banks) | 868,517 | 17,502,376 |
| Housing Development Finance Corp. Ltd. (Thrifts & Mortgage Finance) | 269,667 | 8,980,133 |
| | | 26,482,509 |
| Ireland 1.9% |
| ICON plc (Life Sciences Tools & Services) (b)(c) | 51,594 | 10,664,996 |
| | Shares | Value |
| |
| Israel 1.1% |
| Nice Ltd. Sponsored ADR(Software) (b) | 24,803 | $ 6,137,750 |
| Italy 1.1% |
| Reply SpA (IT Services) | 38,383 | 6,308,052 |
| Japan 9.9% |
| CyberAgent, Inc. (Media) | 901,000 | 19,342,770 |
| Menicon Co. Ltd. (Health Care Equipment & Supplies) | 84,000 | 5,897,655 |
| Relo Group, Inc. (Real Estate Management & Development) | 507,200 | 11,596,274 |
| SMS Co. Ltd. (Professional Services) | 320,400 | 9,589,360 |
| TechnoPro Holdings, Inc. (Professional Services) | 465,600 | 11,013,968 |
| | | 57,440,027 |
| Mexico 1.4% |
| Regional SAB de CV (Banks) | 1,410,934 | 8,297,572 |
| Netherlands 5.7% |
| Koninklijke DSM NV (Chemicals) | 80,009 | 14,932,644 |
| Koninklijke Philips NV (Health Care Equipment & Supplies) | 366,958 | 18,183,683 |
| | | 33,116,327 |
| Spain 1.1% |
| Industria de Diseno Textil SA (Specialty Retail) | 176,881 | 6,231,276 |
| Sweden 1.9% |
| Hexagon AB, Class B (Electronic Equipment, Instruments & Components) | 383,936 | 5,688,539 |
| MIPS AB (Leisure Products) | 64,296 | 5,529,481 |
| | | 11,218,020 |
| Switzerland 4.6% |
| Belimo Holding AG (Registered) (Building Products) | 15,455 | 7,065,620 |
| Lonza Group AG (Registered) (Life Sciences Tools & Services) | 27,969 | 19,823,907 |
| | | 26,889,527 |
| Taiwan 3.1% |
| Taiwan Semiconductor Manufacturing Co. Ltd. Sponsored ADR(Semiconductors & Semiconductor Equipment) | 149,300 | 17,939,888 |
The notes to the financial statements are an integral part of, and should be read in conjunction with, the financial statements.
9
Portfolio of Investments June 30, 2021† (Unaudited) (continued)
| | Shares | Value |
| Common Stocks (continued) |
| United Kingdom 13.6% |
| Diageo plc (Beverages) | 343,143 | $ 16,428,318 |
| Experian plc (Professional Services) | 137,510 | 5,299,462 |
| HomeServe plc (Commercial Services & Supplies) | 678,674 | 8,970,327 |
| Linde plc (Chemicals) | 60,286 | 17,428,683 |
| Prudential plc (Insurance) | 768,726 | 14,605,506 |
| St James's Place plc (Capital Markets) | 800,938 | 16,364,237 |
| | | 79,096,533 |
| United States 7.8% |
| Accenture plc, Class A (IT Services) | 18,064 | 5,325,087 |
| Globant SA (IT Services) (b) | 23,967 | 5,253,087 |
| STERIS plc (Health Care Equipment & Supplies) | 94,545 | 19,504,633 |
| TE Connectivity Ltd. (Electronic Equipment, Instruments & Components) | 111,638 | 15,094,574 |
| | | 45,177,381 |
Total Common Stocks
(Cost $487,860,500) | | 572,172,546 |
| Short-Term Investments 1.2% |
| Affiliated Investment Company 0.0% ‡ |
| United States 0.0% ‡ |
| MainStay U.S. Government Liquidity Fund, 0.01% (d) | 138,503 | 138,503 |
| | Shares | | Value |
| |
| Unaffiliated Investment Company 1.2% |
| United States 1.2% |
| Wells Fargo Government Money Market Fund, 0.025% (d)(e) | 7,004,829 | | $ 7,004,829 |
Total Short-Term Investments
(Cost $7,143,332) | | | 7,143,332 |
Total Investments
(Cost $495,003,832) | 99.9% | | 579,315,878 |
| Other Assets, Less Liabilities | 0.1 | | 677,420 |
| Net Assets | 100.0% | | $ 579,993,298 |
| † | Percentages indicated are based on Portfolio net assets. |
| ‡ | Less than one-tenth of a percent. |
| (a) | May be sold to institutional investors only under Rule 144A or securities offered pursuant to Section 4(a)(2) of the Securities Act of 1933, as amended. |
| (b) | Non-income producing security. |
| (c) | All or a portion of this security was held on loan. As of June 30, 2021, the aggregate market value of securities on loan was $6,628,570. The Portfolio received cash collateral with a value of $7,004,829. (See Note 2(I)) |
| (d) | Current yield as of June 30, 2021. |
| (e) | Represents a security purchased with cash collateral received for securities on loan. |
| Abbreviation(s): |
| ADR—American Depositary Receipt |
The following is a summary of the fair valuations according to the inputs used as of June 30, 2021, for valuing the Portfolio’s assets:
| Description | Quoted
Prices in
Active
Markets for
Identical
Assets
(Level 1) | | Significant
Other
Observable
Inputs
(Level 2) | | Significant
Unobservable
Inputs
(Level 3) | | Total |
| Asset Valuation Inputs | | | | | | | |
| Investments in Securities (a) | | | | | | | |
| Common Stocks | $ 572,172,546 | | $ — | | $ — | | $ 572,172,546 |
| Short-Term Investments | | | | | | | |
| Affiliated Investment Company | 138,503 | | — | | — | | 138,503 |
| Unaffiliated Investment Company | 7,004,829 | | — | | — | | 7,004,829 |
| Total Short-Term Investments | 7,143,332 | | — | | — | | 7,143,332 |
| Total Investments in Securities | $ 579,315,878 | | $ — | | $ — | | $ 579,315,878 |
| (a) | For a complete listing of investments and their industries, see the Portfolio of Investments. |
The notes to the financial statements are an integral part of, and should be read in conjunction with, the financial statements.
| 10 | MainStay VP MacKay International Equity Portfolio |
Industry Diversification
| | Value | | Percent |
| Banks | $ 25,799,948 | | 4.4% |
| Beverages | 16,428,318 | | 2.8 |
| Building Products | 7,065,620 | | 1.2 |
| Capital Markets | 35,264,386 | | 6.1 |
| Chemicals | 58,408,956 | | 10.1 |
| Commercial Services & Supplies | 8,970,327 | | 1.6 |
| Electronic Equipment, Instruments & Components | 20,783,113 | | 3.6 |
| Health Care Equipment & Supplies | 65,677,792 | | 11.3 |
| Health Care Providers & Services | 5,278,866 | | 0.9 |
| Insurance | 14,605,506 | | 2.5 |
| Interactive Media & Services | 42,987,103 | | 7.4 |
| Internet & Direct Marketing Retail | 5,408,373 | | 0.9 |
| IT Services | 32,477,571 | | 5.6 |
| Leisure Products | 5,529,481 | | 0.9 |
| Life Sciences Tools & Services | 51,991,759 | | 9.0 |
| Media | 19,342,770 | | 3.3 |
| Pharmaceuticals | 17,450,275 | | 3.0 |
| Professional Services | 46,123,031 | | 8.0 |
| Real Estate Management & Development | 11,596,274 | | 2.0 |
| Semiconductors & Semiconductor Equipment | 17,939,888 | | 3.1 |
| Software | 47,831,780 | | 8.3 |
| Specialty Retail | 6,231,276 | | 1.1 |
| Thrifts & Mortgage Finance | 8,980,133 | | 1.6 |
| | 572,172,546 | | 98.7 |
| Short-Term Investments | 7,143,332 | | 1.2 |
| Other Assets, Less Liabilities | 677,420 | | 0.1 |
| Net Assets | $579,993,298 | | 100.0% |
| † | Percentages indicated are based on Portfolio net assets. |
The notes to the financial statements are an integral part of, and should be read in conjunction with, the financial statements.
11
Statement of Assets and Liabilities as of June 30, 2021 (Unaudited)
| Assets |
Investment in unaffiliated securities, at value
(identified cost $494,865,329) including securities on loan of $6,628,570 | $579,177,375 |
Investment in affiliated investment companies, at value
(identified cost $138,503) | 138,503 |
Cash denominated in foreign currencies
(identified cost $8,249,153) | 8,160,209 |
| Due from custodian | 238,496 |
| Receivables: | |
| Dividends and interest | 1,333,759 |
| Investment securities sold | 323,652 |
| Securities lending | 1,278 |
| Other assets | 4,553 |
| Total assets | 589,377,825 |
| Liabilities |
| Cash collateral received for securities on loan | 7,004,829 |
| Due to custodian | 3,305 |
| Payables: | |
| Foreign capital gains tax (See Note 2) | 824,522 |
| Investment securities purchased | 618,083 |
| Manager (See Note 3) | 421,237 |
| Portfolio shares redeemed | 273,069 |
| Custodian | 82,824 |
| NYLIFE Distributors (See Note 3) | 66,476 |
| Shareholder communication | 46,424 |
| Professional fees | 39,315 |
| Trustees | 71 |
| Accrued expenses | 4,372 |
| Total liabilities | 9,384,527 |
| Net assets | $579,993,298 |
| Composition of Net Assets |
| Shares of beneficial interest outstanding (par value of $.001 per share) unlimited number of shares authorized | $ 29,082 |
| Additional paid-in-capital | 377,811,988 |
| | 377,841,070 |
| Total distributable earnings (loss) | 202,152,228 |
| Net assets | $579,993,298 |
| Initial Class | |
| Net assets applicable to outstanding shares | $256,080,842 |
| Shares of beneficial interest outstanding | 12,757,660 |
| Net asset value per share outstanding | $ 20.07 |
| Service Class | |
| Net assets applicable to outstanding shares | $323,912,456 |
| Shares of beneficial interest outstanding | 16,324,806 |
| Net asset value per share outstanding | $ 19.84 |
The notes to the financial statements are an integral part of, and should be read in conjunction with, the financial statements.
| 12 | MainStay VP MacKay International Equity Portfolio |
Statement of Operations for the six months ended June 30, 2021 (Unaudited)
| Investment Income (Loss) |
| Income | |
| Dividends-unaffiliated (net of foreign tax withholding of $473,422) | $ 5,060,574 |
| Securities lending | 25,726 |
| Interest | 312 |
| Dividends-affiliated | 32 |
| Total income | 5,086,644 |
| Expenses | |
| Manager (See Note 3) | 2,486,255 |
| Distribution/Service—Service Class (See Note 3) | 391,175 |
| Custodian | 71,567 |
| Professional fees | 49,862 |
| Shareholder communication | 26,022 |
| Trustees | 5,727 |
| Miscellaneous | 18,353 |
| Total expenses | 3,048,961 |
| Net investment income (loss) | 2,037,683 |
| Realized and Unrealized Gain (Loss) |
| Net realized gain (loss) on: | |
| Unaffiliated investment transactions(a) | 50,815,083 |
| Foreign currency transactions | 249,315 |
| Net realized gain (loss) | 51,064,398 |
| Net change in unrealized appreciation (depreciation) on: | |
| Unaffiliated investments(b) | (4,784,867) |
| Translation of other assets and liabilities in foreign currencies | (158,182) |
| Net change in unrealized appreciation (depreciation) | (4,943,049) |
| Net realized and unrealized gain (loss) | 46,121,349 |
| Net increase (decrease) in net assets resulting from operations | $48,159,032 |
| (a) | Realized gain (loss) on security transactions recorded net of foreign capital gains tax in the amount of $(182,783). |
| (b) | Net change in unrealized appreciation (depreciation) on investments recorded net of foreign capital gains tax in the amount of $166,225. |
The notes to the financial statements are an integral part of, and should be read in conjunction with, the financial statements.
13
Statements of Changes in Net Assets
for the six months ended June 30, 2021 (Unaudited) and the year ended December 31, 2020
| | 2021 | 2020 |
| Increase (Decrease) in Net Assets |
| Operations: | | |
| Net investment income (loss) | $ 2,037,683 | $ 94,714 |
| Net realized gain (loss) | 51,064,398 | 68,904,965 |
| Net change in unrealized appreciation (depreciation) | (4,943,049) | 27,504,268 |
| Net increase (decrease) in net assets resulting from operations | 48,159,032 | 96,503,947 |
| Distributions to shareholders: | | |
| Initial Class | — | (13,134,233) |
| Service Class | — | (17,213,641) |
| Total distributions to shareholders | — | (30,347,874) |
| Capital share transactions: | | |
| Net proceeds from sales of shares | 7,469,853 | 34,835,816 |
| Net asset value of shares issued to shareholder in reinvestment of distributions | — | 30,347,874 |
| Cost of shares redeemed | (35,980,749) | (83,407,113) |
| Increase (decrease) in net assets derived from capital share transactions | (28,510,896) | (18,223,423) |
| Net increase (decrease) in net assets | 19,648,136 | 47,932,650 |
| Net Assets |
| Beginning of period | 560,345,162 | 512,412,512 |
| End of period | $579,993,298 | $560,345,162 |
The notes to the financial statements are an integral part of, and should be read in conjunction with, the financial statements.
| 14 | MainStay VP MacKay International Equity Portfolio |
Financial Highlights selected per share data and ratios
| | Six months ended
June 30,
2021* | | Year Ended December 31, |
| Initial Class | 2020 | | 2019 | | 2018 | | 2017 | | 2016 |
| Net asset value at beginning of period | $ 18.43 | | $ 16.21 | | $ 14.99 | | $ 17.46 | | $ 13.24 | | $ 14.04 |
| Net investment income (loss) (a) | 0.08 | | 0.03 | | 0.12 | | 0.10 | | 0.07 | | 0.10 |
| Net realized and unrealized gain (loss) on investments | 1.55 | | 3.24 | | 3.28 | | (2.00) | | 4.21 | | (0.77) |
| Net realized and unrealized gain (loss) on foreign currency transactions | 0.01 | | 0.00‡ | | 0.03 | | (0.04) | | 0.03 | | (0.02) |
| Total from investment operations | 1.64 | | 3.27 | | 3.43 | | (1.94) | | 4.31 | | (0.69) |
| Less distributions: | | | | | | | | | | | |
| From net investment income | — | | (0.12) | | (0.08) | | (0.21) | | (0.09) | | (0.11) |
| From net realized gain on investments | — | | (0.93) | | (2.13) | | (0.32) | | — | | — |
| Total distributions | — | | (1.05) | | (2.21) | | (0.53) | | (0.09) | | (0.11) |
| Net asset value at end of period | $ 20.07 | | $ 18.43 | | $ 16.21 | | $ 14.99 | | $ 17.46 | | $ 13.24 |
| Total investment return (b) | 8.90%(c) | | 20.85% | | 24.80% | | (11.56)% | | 32.61% | | (4.95)% |
| Ratios (to average net assets)/Supplemental Data: | | | | | | | | | | | |
| Net investment income (loss) | 0.87%†† | | 0.16% | | 0.74% | | 0.55% | | 0.43% | | 0.71%(d) |
| Net expenses (e) | 0.95%†† | | 0.96% | | 0.96% | | 0.96% | | 0.96% | | 0.95%(f) |
| Portfolio turnover rate | 46% | | 135% | | 66% | | 46% | | 49% | | 28% |
| Net assets at end of period (in 000’s) | $ 256,081 | | $ 245,101 | | $ 209,278 | | $ 158,215 | | $ 196,676 | | $ 171,048 |
| * | Unaudited. |
| ‡ | Less than one cent per share. |
| †† | Annualized. |
| (a) | Per share data based on average shares outstanding during the period. |
| (b) | Total return does not reflect any deduction of sales charges, mortality and expense charges, contract charges or administrative charges. For periods of less than one year, total return is not annualized. |
| (c) | Total investment return may reflect adjustments to conform to generally accepted accounting principles. |
| (d) | Without the custody fee reimbursement, net investment income (loss) would have been 0.70%. |
| (e) | In addition to the fees and expenses which the Portfolio bears directly, it also indirectly bears a pro-rata share of the fees and expenses of the underlying funds in which it invests. Such indirect expenses are not included in the above expense ratios. |
| (f) | Without the custody fee reimbursement, net expenses would have been 0.96%. |
The notes to the financial statements are an integral part of, and should be read in conjunction with, the financial statements.
15
Financial Highlights selected per share data and ratios
| | Six months ended
June 30,
2021* | | Year Ended December 31, |
| Service Class | 2020 | | 2019 | | 2018 | | 2017 | | 2016 |
| Net asset value at beginning of period | $ 18.24 | | $ 16.06 | | $ 14.86 | | $ 17.32 | | $ 13.13 | | $ 13.92 |
| Net investment income (loss) (a) | 0.06 | | (0.01) | | 0.08 | | 0.05 | | 0.03 | | 0.05 |
| Net realized and unrealized gain (loss) on investments | 1.53 | | 3.20 | | 3.25 | | (1.99) | | 4.18 | | (0.74) |
| Net realized and unrealized gain (loss) on foreign currency transactions | 0.01 | | 0.00‡ | | 0.03 | | (0.04) | | 0.03 | | (0.03) |
| Total from investment operations | 1.60 | | 3.19 | | 3.36 | | (1.98) | | 4.24 | | (0.72) |
| Less distributions: | | | | | | | | | | | |
| From net investment income | — | | (0.08) | | (0.03) | | (0.16) | | (0.05) | | (0.07) |
| From net realized gain on investments | — | | (0.93) | | (2.13) | | (0.32) | | — | | — |
| Total distributions | — | | (1.01) | | (2.16) | | (0.48) | | (0.05) | | (0.07) |
| Net asset value at end of period | $ 19.84 | | $ 18.24 | | $ 16.06 | | $ 14.86 | | $ 17.32 | | $ 13.13 |
| Total investment return (b) | 8.77%(c) | | 20.54% | | 24.49% | | (11.78)% | | 32.28% | | (5.17)% |
| Ratios (to average net assets)/Supplemental Data: | | | | | | | | | | | |
| Net investment income (loss) | 0.61%†† | | (0.08)% | | 0.52% | | 0.32% | | 0.18% | | 0.40%(d) |
| Net expenses (e) | 1.20%†† | | 1.21% | | 1.21% | | 1.21% | | 1.21% | | 1.20%(f) |
| Portfolio turnover rate | 46% | | 135% | | 66% | | 46% | | 49% | | 28% |
| Net assets at end of period (in 000’s) | $ 323,912 | | $ 315,244 | | $ 303,135 | | $ 258,307 | | $ 310,793 | | $ 251,474 |
| * | Unaudited. |
| ‡ | Less than one cent per share. |
| †† | Annualized. |
| (a) | Per share data based on average shares outstanding during the period. |
| (b) | Total return does not reflect any deduction of sales charges, mortality and expense charges, contract charges or administrative charges. For periods of less than one year, total return is not annualized. |
| (c) | Total investment return may reflect adjustments to conform to generally accepted accounting principles. |
| (d) | Without the custody fee reimbursement, net investment income (loss) would have been 0.39%. |
| (e) | In addition to the fees and expenses which the Portfolio bears directly, it also indirectly bears a pro-rata share of the fees and expenses of the underlying funds in which it invests. Such indirect expenses are not included in the above expense ratios. |
| (f) | Without the custody fee reimbursement, net expenses would have been 1.21%. |
The notes to the financial statements are an integral part of, and should be read in conjunction with, the financial statements.
| 16 | MainStay VP MacKay International Equity Portfolio |
Notes to Financial Statements (Unaudited)
Note 1–Organization and Business
MainStay VP Funds Trust (the “Fund”) was organized as a Delaware statutory trust on February 1, 2011. The Fund is registered under the Investment Company Act of 1940, as amended (the “1940 Act”), as an open-end management investment company. The Fund is comprised of thirty-one separate series (collectively referred to as the “Portfolios”). These financial statements and notes relate to the MainStay VP MacKay International Equity Portfolio (the "Portfolio"), a "diversified” portfolio, as that term is defined in the 1940 Act, as interpreted or modified by regulatory authorities having jurisdiction, from time to time.
Shares of the Portfolio are currently offered to certain separate accounts to fund variable annuity policies and variable universal life insurance policies issued by New York Life Insurance and Annuity Corporation (“NYLIAC”), a wholly-owned subsidiary of New York Life Insurance Company (“New York Life”) and may also be offered to fund variable annuity policies and variable universal life insurance policies issued by other insurance companies. NYLIAC allocates shares of the Portfolios to, among others, certain NYLIAC separate accounts. Shares of the Portfolio are also offered to the MainStay VP Conservative Allocation Portfolio, MainStay VP Moderate Allocation Portfolio, MainStay VP Growth Allocation Portfolio (formerly known as MainStay VP Moderate Growth Allocation Portfolio) and MainStay VP Equity Allocation Portfolio (formerly known as MainStay VP Growth Allocation Portfolio), which operate as “funds-of-funds," and other variable insurance funds.
The following table lists the Portfolio's share classes that have been registered and commenced operations:
| Class | Commenced Operations |
| Initial Class | May 1, 1995 |
| Service Class | June 5, 2003 |
Shares of the Portfolio are offered and are redeemed at a price equal to their respective net asset value (“NAV”) per share. No sales or redemption charge is applicable to the purchase or redemption of the Portfolio's shares. Under the terms of the Fund’s multiple class plan, adopted pursuant to Rule 18f-3 under the 1940 Act, the classes differ in that, among other things, Service Class shares of the Portfolio pay a combined distribution and service fee of 0.25% of average daily net assets attributable to Service Class shares of the Portfolio to the Distributor (as defined in Note 3(B)) pursuant to a plan adopted in accordance with Rule 12b-1 under the 1940 Act. Contract owners of variable annuity contracts purchased after June 2, 2003, are permitted to invest only in the Service Class shares.
The Portfolio's investment objective is to seek long-term growth of capital.
Note 2–Significant Accounting Policies
The Portfolio is an investment company and accordingly follows the investment company accounting and reporting guidance of the Financial Accounting Standards Board (“FASB”) Accounting Standard Codification
Topic 946 Financial Services—Investment Companies. The Portfolio prepares its financial statements in accordance with generally accepted accounting principles (“GAAP”) in the United States of America and follows the significant accounting policies described below.
(A) Securities Valuation. Investments are usually valued as of the close of regular trading on the New York Stock Exchange (the "Exchange") (usually 4:00 p.m. Eastern time) on each day the Portfolio is open for business ("valuation date").
The Board of Trustees of the Fund (the "Board") adopted procedures establishing methodologies for the valuation of the Portfolio's securities and other assets and delegated the responsibility for valuation determinations under those procedures to the Valuation Committee of the Fund (the “Valuation Committee”). The procedures state that, subject to the oversight of the Board and unless otherwise noted, the responsibility for the day-to-day valuation of portfolio assets (including fair value measurements for the Portfolio's assets and liabilities) rests with New York Life Investment Management LLC (“New York Life Investments” or the "Manager"), aided to whatever extent necessary by the Subadvisor (as defined in Note 3(A)). To assess the appropriateness of security valuations, the Manager, the Subadvisor or the Portfolio's third-party service provider, who is subject to oversight by the Manager, regularly compares prior day prices, prices on comparable securities and the sale prices to the prior and current day prices and challenges prices with changes exceeding certain tolerance levels with third-party pricing services or broker sources.
The Board authorized the Valuation Committee to appoint a Valuation Subcommittee (the “Subcommittee”) to establish the prices of securities for which market quotations are not readily available or the prices of which are not otherwise readily determinable under the procedures. The Subcommittee meets (in person, via electronic mail or via teleconference) on an as-needed basis. The Valuation Committee meets to ensure that actions taken by the Subcommittee were appropriate.
For those securities valued through either a standardized fair valuation methodology or a fair valuation measurement, the Subcommittee deals with such valuation and the Valuation Committee reviews and affirms, if appropriate, the reasonableness of the valuation based on such methodologies and measurements on a regular basis after considering information that is reasonably available and deemed relevant by the Valuation Committee. Any action taken by the Subcommittee with respect to the valuation of a portfolio security or other asset is submitted for review and ratification (if appropriate) to the Valuation Committee and the Board at the next regularly scheduled meeting.
"Fair value" is defined as the price the Portfolio would reasonably expect to receive upon selling an asset or liability in an orderly transaction to an independent buyer in the principal or most advantageous market for the asset or liability. Fair value measurements are determined within a framework that establishes a three-tier hierarchy that maximizes the use of observable market data and minimizes the use of unobservable inputs to establish a classification of fair value measurements for disclosure
Notes to Financial Statements (Unaudited) (continued)
purposes. "Inputs" refer broadly to the assumptions that market participants would use in pricing the asset or liability, including assumptions about risk, such as the risk inherent in a particular valuation technique used to measure fair value using a pricing model and/or the risk inherent in the inputs for the valuation technique. Inputs may be observable or unobservable. Observable inputs reflect the assumptions market participants would use in pricing the asset or liability based on market data obtained from sources independent of the Portfolio. Unobservable inputs reflect the Portfolio’s own assumptions about the assumptions market participants would use in pricing the asset or liability based on the information available. The inputs or methodology used for valuing assets or liabilities may not be an indication of the risks associated with investing in those assets or liabilities. The three-tier hierarchy of inputs is summarized below.
| • | Level 1—quoted prices in active markets for an identical asset or liability |
| • | Level 2—other significant observable inputs (including quoted prices for a similar asset or liability in active markets, interest rates and yield curves, prepayment speeds, credit risk, etc.) |
| • | Level 3—significant unobservable inputs (including the Portfolio's own assumptions about the assumptions that market participants would use in measuring fair value of an asset or liability) |
The level of an asset or liability within the fair value hierarchy is based on the lowest level of an input, both individually and in the aggregate, that is significant to the fair value measurement. The aggregate value by input level of the Portfolio’s assets and liabilities as of June 30, 2021, is included at the end of the Portfolio of Investments.
The Portfolio may use third-party vendor evaluations, whose prices may be derived from one or more of the following standard inputs, among others:
| • Broker/dealer quotes | • Benchmark securities |
| • Two-sided markets | • Reference data (corporate actions or material event notices) |
| • Bids/offers | • Monthly payment information |
| • Industry and economic events | • Reported trades |
An asset or liability for which market values cannot be measured using the methodologies described above is valued by methods deemed reasonable in good faith by the Valuation Committee, following the procedures established by the Board, to represent fair value. Under these procedures, the Portfolio generally uses a market-based approach which may use related or comparable assets or liabilities, recent transactions, market multiples, book values and other relevant information. The Portfolio may also use an income-based valuation approach in which the anticipated future cash flows of the asset or liability are discounted to calculate fair value. Discounts may also be applied due to the nature and/or duration of any restrictions on the disposition of the asset or liability. Fair value represents a good faith approximation of the value of a security. Fair value determinations involve the consideration of a number
of subjective factors, an analysis of applicable facts and circumstances and the exercise of judgment. As a result, it is possible that the fair value for a security determined in good faith in accordance with the Portfolio's valuation procedures may differ from valuations for the same security determined by other funds using their own valuation procedures. Although the Portfolio's valuation procedures are designed to value a security at the price the Portfolio may reasonably expect to receive upon the security's sale in an orderly transaction, there can be no assurance that any fair value determination thereunder would, in fact, approximate the amount that the Portfolio would actually realize upon the sale of the security or the price at which the security would trade if a reliable market price were readily available. During the six-month period ended June 30, 2021, there were no material changes to the fair value methodologies.
Securities which may be valued in this manner include, but are not limited to: (i) a security for which trading has been halted or suspended; (ii) a debt security that has recently gone into default and for which there is not a current market quotation; (iii) a security of an issuer that has entered into a restructuring; (iv) a security that has been delisted from a national exchange; (v) a security for which the market price is not readily available from a third-party pricing source or, if so provided, does not, in the opinion of the Manager or the Subadvisor, reflect the security's market value; (vi) a security subject to trading collars for which no or limited trading takes place; and (vii) a security whose principal market has been temporarily closed at a time when, under normal conditions, it would be open. Securities valued in this manner are generally categorized as Level 3 in the hierarchy. No securities held by the Portfolio as of June 30, 2021 were fair valued in such a manner.
Certain securities held by the Portfolio may principally trade in foreign markets. Events may occur between the time the foreign markets close and the time at which the Portfolio's NAVs are calculated. These events may include, but are not limited to, situations relating to a single issuer in a market sector, significant fluctuations in U.S. or foreign markets, natural disasters, armed conflicts, governmental actions or other developments not tied directly to the securities markets. Should the Manager or the Subadvisor conclude that such events may have affected the accuracy of the last price of such securities reported on the local foreign market, the Subcommittee may, pursuant to procedures adopted by the Board, adjust the value of the local price to reflect the estimated impact on the price of such securities as a result of such events. In this instance, securities are generally categorized as Level 3 in the hierarchy. Additionally, certain foreign equity securities are also fair valued whenever the movement of a particular index exceeds certain thresholds. In such cases, the securities are fair valued by applying factors provided by a third-party vendor in accordance with valuation procedures adopted by the Board and are generally categorized as Level 2 in the hierarchy. No foreign equity securities held by the Portfolio as of June 30, 2021 were fair valued in such a manner.
Equity securities are valued at the last quoted sales prices as of the close of regular trading on the relevant exchange on each valuation date. Securities that are not traded on the valuation date are valued at the mean of the last quoted bid and ask prices. Prices are normally taken
| 18 | MainStay VP MacKay International Equity Portfolio |
from the principal market in which each security trades. These securities are generally categorized as Level 1 in the hierarchy.
Investments in mutual funds, including money market funds, are valued at their respective NAVs at the close of business each day on the valuation date. These securities are generally categorized as Level 1 in the hierarchy.
Temporary cash investments acquired in excess of 60 days to maturity at the time of purchase are valued using the latest bid prices or using valuations based on a matrix system (which considers such factors as security prices, yields, maturities and ratings), both as furnished by independent pricing services. Temporary cash investments that mature in 60 days or less at the time of purchase ("Short-Term Investments") are valued using the amortized cost method of valuation, unless the use of such method would be inappropriate. The amortized cost method involves valuing a security at its cost on the date of purchase and thereafter assuming a constant amortization to maturity of the difference between such cost and the value on maturity date. Amortized cost approximates the current fair value of a security. Securities valued using the amortized cost method are not valued using quoted prices in an active market and are generally categorized as Level 2 in the hierarchy.
The information above is not intended to reflect an exhaustive list of the methodologies that may be used to value portfolio investments. The valuation procedures permit the use of a variety of valuation methodologies in connection with valuing portfolio investments. The methodology used for a specific type of investment may vary based on the market data available or other considerations. The methodologies summarized above may not represent the specific means by which portfolio investments are valued on any particular business day.
(B) Income Taxes. The Portfolio's policy is to comply with the requirements of the Internal Revenue Code of 1986, as amended (the “Internal Revenue Code”), applicable to regulated investment companies and to distribute all of its taxable income to the shareholders of the Portfolio within the allowable time limits.
The Manager evaluates the Portfolio’s tax positions to determine if the tax positions taken meet the minimum recognition threshold in connection with accounting for uncertainties in income tax positions taken or expected to be taken for the purposes of measuring and recognizing tax liabilities in the financial statements. Recognition of tax benefits of an uncertain tax position is permitted only to the extent the position is “more likely than not” to be sustained assuming examination by taxing authorities. The Manager analyzed the Portfolio's tax positions taken on federal, state and local income tax returns for all open tax years (for up to three tax years) and has concluded that no provisions for federal, state and local income tax are required in the Portfolio's financial statements. The Portfolio's federal, state and local income tax and federal excise tax returns for tax years for which the applicable statutes of limitations have not expired are subject to examination by the Internal Revenue Service and state and local departments of revenue.
(C) Foreign Taxes. The Portfolio may be subject to foreign taxes on income and other transaction-based taxes imposed by certain countries in which it invests. A portion of the taxes on gains on investments or currency purchases/repatriation may be reclaimable. The Portfolio will accrue such taxes and reclaims as applicable, based upon its current interpretation of tax rules and regulations that exist in the markets in which it invests.
The Portfolio may be subject to taxation on realized capital gains, repatriation proceeds and other transaction-based taxes imposed by certain countries in which it invests. The Portfolio will accrue such taxes as applicable based upon its current interpretation of tax rules and regulations that exist in the market in which it invests. Capital gains taxes relating to positions still held are reflected as a liability in the Statement of Assets and Liabilities, as well as an adjustment to the Portfolio's net unrealized appreciation (depreciation). Taxes related to capital gains realized, if any, are reflected as part of net realized gain (loss) in the Statement of Operations. Changes in tax liabilities related to capital gains taxes on unrealized investment gains, if any, are reflected as part of the change in net unrealized appreciation (depreciation) on investments in the Statement of Operations. Transaction-based charges are generally assessed as a percentage of the transaction amount.
(D) Dividends and Distributions to Shareholders. Dividends and distributions are recorded on the ex-dividend date. The Portfolio intends to declare and pay dividends from net investment income and distributions from net realized capital and currency gains, if any, at least annually. Unless a shareholder elects otherwise, all dividends and distributions are reinvested at NAV in the same class of shares of the Portfolio. Dividends and distributions to shareholders are determined in accordance with federal income tax regulations and may differ from determinations using GAAP.
(E) Security Transactions and Investment Income. The Portfolio records security transactions on the trade date. Realized gains and losses on security transactions are determined using the identified cost method. Dividend income is recognized on the ex-dividend date, net of any foreign tax withheld at the source, and interest income is accrued as earned using the effective interest rate method. Distributions received from real estate investment trusts may be classified as dividends, capital gains and/or return of capital.
Investment income and realized and unrealized gains and losses on investments of the Portfolio are allocated pro rata to the separate classes of shares based upon their relative net assets on the date the income is earned or realized and unrealized gains and losses are incurred.
(F) Expenses. Expenses of the Fund are allocated to the individual Portfolios in proportion to the net assets of the respective Portfolios when the expenses are incurred, except where direct allocations of expenses can be made. Expenses (other than fees incurred under the distribution and service plans, further discussed in Note 3(B), which are charged directly to the Service Class shares) are allocated to separate classes of shares pro rata based upon their relative net assets on the date the
Notes to Financial Statements (Unaudited) (continued)
expenses are incurred. The expenses borne by the Portfolio, including those of related parties to the Portfolio, are shown in the Statement of Operations.
Additionally, the Portfolio may invest in mutual funds, which are subject to management fees and other fees that may cause the costs of investing in mutual funds to be greater than the costs of owning the underlying securities directly. These indirect expenses of mutual funds are not included in the amounts shown as expenses in the Statement of Operations or in the expense ratios included in the Financial Highlights.
(G) Use of Estimates. In preparing financial statements in conformity with GAAP, the Manager makes estimates and assumptions that affect the reported amounts and disclosures in the financial statements. Actual results could differ from those estimates and assumptions.
(H) Foreign Currency Transactions. The Portfolio's books and records are maintained in U.S. dollars. Prices of securities denominated in foreign currency amounts are translated into U.S. dollars at the mean between the buying and selling rates last quoted by any major U.S. bank at the following dates:
(i) market value of investment securities, other assets and liabilities— at the valuation date; and
(ii) purchases and sales of investment securities, income and expenses—at the date of such transactions.
The assets and liabilities that are denominated in foreign currency amounts are presented at the exchange rates and market values at the close of the period. The realized and unrealized changes in net assets arising from fluctuations in exchange rates and market prices of securities are not separately presented.
Net realized gain (loss) on foreign currency transactions represents net currency gains or losses realized as a result of differences between the amounts of securities sale proceeds or purchase cost, dividends, interest and withholding taxes as recorded on the Portfolio's books, and the U.S. dollar equivalent amount actually received or paid. Net currency gains or losses from valuing such foreign currency denominated assets and liabilities, other than investments at valuation date exchange rates, are reflected in unrealized foreign exchange gains or losses.
(I) Securities Lending. In order to realize additional income, the Portfolio may engage in securities lending, subject to the limitations set forth in the 1940 Act and relevant guidance by the staff of the Securities and Exchange Commission (“SEC”). If the Portfolio engages in securities lending, the Portfolio will lend through its custodian, JPMorgan Chase Bank, N.A., ("JPMorgan"), acting as securities lending agent on behalf of the Portfolio. Under the current arrangement, JPMorgan will manage the Portfolio's collateral in accordance with the securities lending agency agreement between the Portfolio and JPMorgan, and indemnify the Portfolio against counterparty risk. The loans will be collateralized by cash (which may be invested in a money market fund) and/or non-cash collateral (which may include U.S. Treasury securities and/or U.S. government agency securities issued or guaranteed by the United States
government or its agencies or instrumentalities) at least equal at all times to the market value of the securities loaned. The Portfolio bears the risk of delay in recovery of, or loss of rights in, the securities loaned. The Portfolio may also record a realized gain or loss on securities deemed sold due to a borrower’s inability to return securities on loan. The Portfolio bears the risk of any loss on investment of cash collateral. The Portfolio will receive compensation for lending its securities in the form of fees or it will retain a portion of interest earned on the investment of any cash collateral. The Portfolio will also continue to receive interest and dividends on the securities loaned and any gain or loss in the market price of the securities loaned that may occur during the term of the loan will be for the account of the Portfolio. Income earned from securities lending activities, if any, is reflected in the Statement of Operations. Securities on loan as of June 30, 2021, are shown in the Portfolio of Investments.
Prior to February 22, 2021, these services were provided by State Street Bank and Trust Company (“State Street”).
(J) Foreign Securities Risk. The Portfolio invests in foreign securities, which carry certain risks that are in addition to the usual risks inherent in domestic securities. These risks include those resulting from currency fluctuations, future adverse political or economic developments and possible imposition of currency exchange blockages or other foreign governmental laws or restrictions. These risks are likely to be greater in emerging markets than in developed markets. The ability of issuers of debt securities held by the Portfolio to meet their obligations may be affected by, among other things, economic or political developments in a specific country, industry or region.
(K) Indemnifications. Under the Fund’s organizational documents, its officers and trustees are indemnified against certain liabilities that may arise out of performance of their duties to the Fund. Additionally, in the normal course of business, the Portfolio enters into contracts with third-party service providers that contain a variety of representations and warranties and that may provide general indemnifications. The Portfolio's maximum exposure under these arrangements is unknown, as this would involve future claims that may be made against the Portfolio that have not yet occurred. The Manager believes that the risk of loss in connection with these potential indemnification obligations is remote. However, there can be no assurance that material liabilities related to such obligations will not arise in the future, which could adversely impact the Portfolio.
Note 3–Fees and Related Party Transactions
(A) Manager and Subadvisor. New York Life Investments, a registered investment adviser and an indirect, wholly-owned subsidiary of New York Life, serves as the Portfolio's Manager, pursuant to an Amended and Restated Management Agreement ("Management Agreement"). The Manager provides offices, conducts clerical, recordkeeping and bookkeeping services and keeps most of the financial and accounting records required to be maintained by the Portfolio. Except for the portion of salaries and expenses that are the responsibility of the Portfolio, the Manager pays the salaries and expenses of all personnel affiliated with the Portfolio and certain operational expenses of the Portfolio. The
| 20 | MainStay VP MacKay International Equity Portfolio |
Portfolio reimburses New York Life Investments in an amount equal to the portion of the compensation of the Chief Compliance Officer attributable to the Portfolio. MacKay Shields LLC ("MacKay Shields" or the "Subadvisor"), a registered investment adviser and an indirect, wholly-owned subsidiary of New York Life, serves as Subadvisor to the Portfolio and is responsible for the day-to-day portfolio management of the Portfolio. Pursuant to the terms of an Amended and Restated Subadvisory Agreement ("Subadvisory Agreement") between New York Life Investments and MacKay Shields, New York Life Investments pays for the services of the Subadvisor.
Pursuant to the Management Agreement, the Fund pays the Manager, on behalf of the Portfolio, a monthly fee for the services performed and the facilities furnished at an annual rate of the Portfolio's average daily net assets as follows: 0.89% up to $500 million; and 0.85% in excess of $500 million. During the six-month period ended June 30, 2021, the effective management fee rate was 0.89%.
During the six-month period ended June 30, 2021, New York Life Investments earned fees from the Portfolio in the amount of $2,486,255 and paid the Subadvisor fees in the amount of $1,243,711.
JPMorgan provides sub-administration and sub-accounting services to the Portfolio pursuant to an agreement with New York Life Investments. These services include calculating the daily NAVs of the Portfolio, maintaining the general ledger and sub-ledger accounts for the calculation of the Portfolio's NAVs, and assisting New York Life
Investments in conducting various aspects of the Portfolio's administrative operations. For providing these services to the Portfolio, JPMorgan is compensated by New York Life Investments.
Prior to February 22, 2021, these services were provided by State Street.
Pursuant to an agreement between the Fund and New York Life Investments, New York Life Investments is responsible for providing or procuring certain regulatory reporting services for the Portfolio. The Portfolio will reimburse New York Life Investments for the actual costs incurred by New York Life Investments in connection with providing or procuring these services for the Portfolio.
(B) Distribution and Service Fees. The Fund, on behalf of the Portfolio, has entered into a distribution agreement with NYLIFE Distributors LLC (the “Distributor”), an affiliate of New York Life Investments. The Portfolio has adopted a distribution plan (the “Plan”) in accordance with the provisions of Rule 12b-1 under the 1940 Act. Under the Plan, the Distributor has agreed to provide, through its affiliates or independent third parties, various distribution-related, shareholder and administrative support services to the Service Class shareholders. For its services, the Distributor is entitled to a combined distribution and service fee accrued daily and paid monthly at an annual rate of 0.25% of the average daily net assets attributable to the Service Class shares of the Portfolio.
(C) Investments in Affiliates (in 000’s). During the six-month period ended June 30, 2021, purchases and sales transactions, income earned from investments and shares held of investment companies managed by New York Life Investments or its affiliates were as follows:
| Affiliated Investment Companies | Value,
Beginning
of Period | Purchases
at Cost | Proceeds
from
Sales | Net
Realized
Gain/(Loss)
on Sales | Change in
Unrealized
Appreciation/
(Depreciation) | Value,
End of
Period | Dividend
Income | Other
Distributions | Shares
End of
Period |
| MainStay U.S. Government Liquidity Fund | $ 622 | $ 28,727 | $ (29,210) | $ — | $ — | $ 139 | $ —(a) | $ — | 139 |
Note 4-Federal Income Tax
As of June 30, 2021, the cost and unrealized appreciation (depreciation) of the Portfolio’s investment portfolio, including applicable derivative contracts and other financial instruments, as determined on a federal income tax basis, were as follows:
| | Federal Tax
Cost | Gross
Unrealized
Appreciation | Gross
Unrealized
(Depreciation) | Net
Unrealized
Appreciation/
(Depreciation) |
| Investments in Securities | $504,386,707 | $76,555,064 | $(1,625,893) | $74,929,171 |
During the year ended December 31, 2020, the tax character of distributions paid as reflected in the Statements of Changes in Net Assets was as follows:
| | 2020 |
| Distributions paid from: | |
| Ordinary Income | $ 8,353,687 |
| Long-Term Capital Gains | 21,994,187 |
| Total | $30,347,874 |
Note 5–Custodian
JPMorgan is the custodian of cash and securities held by the Portfolio. Custodial fees are charged to the Portfolio based on the Portfolio's net assets and/or the market value of securities held by the Portfolio and the number of certain transactions incurred by the Portfolio.
Notes to Financial Statements (Unaudited) (continued)
Prior to February 22, 2021, these services were provided by State Street. The services provided by State Street were a direct expense of the Portfolio and are included in the Statement of Operations as Custodian fees which totaled $19,770 for the period January 1, 2021 through February 21, 2021.
Note 6–Line of Credit
The Portfolio and certain other funds managed by New York Life Investments maintain a line of credit with a syndicate of banks in order to secure a source of funds for temporary purposes to meet unanticipated or excessive redemption requests.
Effective July 27, 2021, under the credit agreement (the “Credit Agreement”), the aggregate commitment amount is $600,000,000 with an additional uncommitted amount of $100,000,000. The commitment fee is an annual rate of 0.15% of the average commitment amount payable quarterly, regardless of usage, to JPMorgan, who serves as the agent to the syndicate. The commitment fee is allocated among the Portfolio and certain other funds managed by New York Life Investments based upon their respective net assets and other factors. Interest on any revolving credit loan is charged based upon the Federal Funds Rate or the one-month London Interbank Offered Rate ("LIBOR"), whichever is higher. The Credit Agreement expires on July 26, 2022, although the Portfolio, certain other funds managed by New York Life Investments and the syndicate of banks may renew the Credit Agreement for an additional year on the same or different terms or enter into a credit agreement with a different syndicate of banks. Prior to July 27, 2021, the aggregate commitment amount and the commitment fee were the same as those under the current Credit Agreement. During the six-month period ended June 30, 2021, there were no borrowings made or outstanding with respect to the Portfolio under the Credit Agreement.
Note 7–Interfund Lending Program
Pursuant to an exemptive order issued by the SEC, the Portfolio, along with certain other funds managed by New York Life Investments, may participate in an interfund lending program. The interfund lending program provides an alternative credit facility that permits the Portfolio and certain other funds managed by New York Life Investments to lend or borrow money for temporary purposes directly to or from one another, subject to the conditions of the exemptive order. During the six-month period ended June 30, 2021, there were no interfund loans made or outstanding with respect to the Portfolio.
Note 8–Purchases and Sales of Securities (in 000’s)
During the six-month period ended June 30, 2021, purchases and sales of securities, other than short-term securities, were $251,653 and $271,698, respectively.
Note 9–Capital Share Transactions
Transactions in capital shares for the six-month period ended June 30, 2021 and the year ended December 31, 2020, were as follows:
| Initial Class | Shares | Amount |
| Period ended June 30, 2021: | | |
| Shares sold | 257,564 | $ 4,866,797 |
| Shares redeemed | (796,687) | (15,363,509) |
| Net increase (decrease) | (539,123) | $(10,496,712) |
| Year ended December 31, 2020: | | |
| Shares sold | 713,217 | $ 11,874,962 |
| Shares issued to shareholders in reinvestment of distributions | 783,932 | 13,134,233 |
| Shares redeemed | (1,109,972) | (17,404,149) |
| Net increase (decrease) | 387,177 | $ 7,605,046 |
| |
| Service Class | Shares | Amount |
| Period ended June 30, 2021: | | |
| Shares sold | 139,989 | $ 2,603,056 |
| Shares redeemed | (1,094,926) | (20,617,240) |
| Net increase (decrease) | (954,937) | $(18,014,184) |
| Year ended December 31, 2020: | | |
| Shares sold | 1,552,128 | $ 22,960,854 |
| Shares issued to shareholders in reinvestment of distributions | 1,037,498 | 17,213,641 |
| Shares redeemed | (4,189,934) | (66,002,964) |
| Net increase (decrease) | (1,600,308) | $(25,828,469) |
Note 10–Other Matters
An outbreak of COVID-19, first detected in December 2019, has developed into a global pandemic and has resulted in travel restrictions, closure of international borders, certain businesses and securities markets, restrictions on securities trading activities, prolonged quarantines, supply chain disruptions, and lower consumer demand, as well as general concern and uncertainty. The continued impact of COVID-19 and related new variants is uncertain and could further adversely affect the global economy, national economies, individual issuers and capital markets in unforeseeable ways and result in a substantial and extended economic downturn. Developments that disrupt global economies and financial markets, such as COVID-19, may magnify factors that affect the Portfolio's performance.
Note 11–Subsequent Events
In connection with the preparation of the financial statements of the Portfolio as of and for the six-month period ended June 30, 2021, events and transactions subsequent to June 30, 2021, through the date the financial statements were issued have been evaluated by the Manager for possible adjustment and/or disclosure. No subsequent events requiring financial statement adjustment or disclosure have been identified.
| 22 | MainStay VP MacKay International Equity Portfolio |
Discussion of the Operation and Effectiveness of the Portfolio's Liquidity Risk Management Program (Unaudited)
In compliance with Rule 22e-4 under the Investment Company Act of 1940, as amended (the “Liquidity Rule”), the Portfolio has adopted and implemented a liquidity risk management program (the “Program”), which New York Life Investment Management LLC believes is reasonably designed to assess and manage the Portfolio's liquidity risk (the risk that the Portfolio could not meet requests to redeem shares issued by the Portfolio without significant dilution of remaining investors’ interests in the Portfolio). The Board of Trustees of MainStay VP Funds Trust (the "Board") designated New York Life Investment Management LLC as administrator of the Program (the “Administrator”). The Administrator has established a Liquidity Risk Management Committee to assist the Administrator in the implementation and day-to-day administration of the Program and to otherwise support the Administrator in fulfilling its responsibilities under the Program.
At a meeting of the Board held on March 8, 2021, the Administrator provided the Board with a written report addressing the Program’s operation and assessing its adequacy and effectiveness of implementation for the period from January 1, 2020 through December 31, 2020 (the "Review Period"), as required under the Liquidity Rule. The report noted that the Administrator concluded that (i) the Program operated effectively to assess and manage the Portfolio's liquidity risk, (ii) the Program has been adequately and effectively implemented to monitor and, as applicable, respond to the Portfolio's liquidity developments and (iii) the Portfolio's investment strategy continues to be appropriate for an open-end fund. In addition, the report discussed notable events that impacted liquidity risk during the Review Period, including the COVID-19 pandemic and the resulting economic shutdown.
In accordance with the Program, the Portfolio's liquidity risk is assessed no less frequently than annually taking into consideration certain factors, as applicable, such as (i) investment strategy and liquidity of portfolio investments, (ii) short-term and long-term cash flow projections and (iii) holdings of cash and cash equivalents, as well as borrowing arrangements and other funding sources. Certain factors are considered under both normal and reasonably foreseeable stressed conditions.
Each Portfolio portfolio investment is classified into one of four liquidity categories. The classification is based on a determination of the number of days it is reasonably expected to take to convert the investment into cash, or sell or dispose of the investment, in current market conditions without significantly changing the market value of the investment. The Administrator has delegated liquidity classification determinations to the Portfolio’s subadvisor, subject to appropriate oversight by the Administrator, and classification determinations are made by taking into account the Portfolio's reasonably anticipated trade size, various market, trading and investment-specific considerations, as well as market depth, and, in certain cases, third-party vendor data.
The Liquidity Rule requires portfolios that do not primarily hold assets that are highly liquid investments to adopt a minimum amount of net assets that must be invested in highly liquid investments that are assets (an “HLIM”). In addition, the Liquidity Rule limits a portfolio's investments in illiquid investments. Specifically, the Liquidity Rule prohibits acquisition of illiquid investments if doing so would result in a portfolio holding more than 15% of its net assets in illiquid investments that are assets. The Program includes provisions reasonably designed to determine, periodically review and comply with the HLIM requirement, as applicable, and to comply with the 15% limit on illiquid investments.
There can be no assurance that the Program will achieve its objectives under all circumstances in the future. Please refer to the Portfolio's prospectus for more information regarding the Portfolio's exposure to liquidity risk and other risks to which it may be subject.
Proxy Voting Record
The Portfolio is required to file with the SEC its proxy voting records for the 12-month period ending June 30 on Form N-PX. The Portfolio's most recent Form N-PX or proxy voting record is available free of charge upon request (i) by calling 800-598-2019; (ii) by visiting New York Life Investments’ website at https://www.nylinvestments.com/mainstay/
products-and-performance/mainstay-vp-funds-trust; or (iii) by visiting the SEC’s website at www.sec.gov.
Shareholder Reports and Quarterly Portfolio Disclosure
The Portfolio is required to file its complete schedule of portfolio holdings with the SEC 60 days after its first and third fiscal quarter on Form N-PORT. The Portfolio's holdings report is available free of charge upon request by calling 800-598-2019 or by visiting the SEC’s website at www.sec.gov.
| 24 | MainStay VP MacKay International Equity Portfolio |
This page intentionally left blank
This page intentionally left blank.
MainStay VP Portfolios
MainStay VP offers a wide range of Portfolios. The full array of MainStay VP offerings is listed here, with information about the manager, subadvisors, legal counsel, and independent registered public accounting firm.
Equity
MainStay VP Candriam Emerging Markets Equity Portfolio
MainStay VP Epoch U.S. Equity Yield Portfolio
MainStay VP Fidelity Institutional AM® Utilities Portfolio†
MainStay VP MacKay International Equity Portfolio
MainStay VP MacKay S&P 500 Index Portfolio
MainStay VP Natural Resources Portfolio
MainStay VP Small Cap Growth Portfolio
MainStay VP T. Rowe Price Equity Income Portfolio
MainStay VP Wellington Growth Portfolio
MainStay VP Wellington Mid Cap Portfolio
MainStay VP Wellington Small Cap Portfolio
MainStay VP Wellington U.S. Equity Portfolio
MainStay VP Winslow Large Cap Growth Portfolio
Mixed Asset
MainStay VP Balanced Portfolio
MainStay VP Income Builder Portfolio
MainStay VP Janus Henderson Balanced Portfolio
MainStay VP MacKay Convertible Portfolio
Income
MainStay VP Bond Portfolio
MainStay VP Floating Rate Portfolio
MainStay VP Indexed Bond Portfolio
MainStay VP MacKay Government Portfolio
MainStay VP MacKay High Yield Corporate Bond Portfolio
MainStay VP MacKay Strategic Bond Portfolio
MainStay VP PIMCO Real Return Portfolio
Money Market
MainStay VP U.S. Government Money Market Portfolio
Alternative
MainStay VP CBRE Global Infrastructure Portfolio
MainStay VP IQ Hedge Multi-Strategy Portfolio
Asset Allocation
MainStay VP Conservative Allocation Portfolio
MainStay VP Equity Allocation Portfolio
MainStay VP Growth Allocation Portfolio
MainStay VP Moderate Allocation Portfolio
Manager
New York Life Investment Management LLC
New York, New York
Subadvisors
Brown Advisory LLC
Baltimore, Maryland
Candriam Belgium S.A.*
Brussels, Belgium
CBRE Clarion Securities LLC
Radnor, Pennsylvania
Epoch Investment Partners, Inc.
New York, New York
FIAM LLC
Smithfield, Rhode Island
IndexIQ Advisors LLC*
New York, New York
Janus Capital Management LLC
Denver, Colorado
MacKay Shields LLC*
New York, New York
Mellon Investments Corporation
Boston, Massachusetts
NYL Investors LLC*
New York, New York
Pacific Investment Management Company LLC
Newport Beach, California
Segall Bryant & Hamill, LLC
Chicago, Illinois
T. Rowe Price Associates, Inc.
Baltimore, Maryland
Wellington Management Company LLP
Boston, Massachusetts
Winslow Capital Management, LLC
Minneapolis, Minnesota
Legal Counsel
Dechert LLP
Washington, District of Columbia
Independent Registered Public Accounting Firm
PricewaterhouseCoopers LLP
New York, New York
Distributor
NYLIFE Distributors LLC*
Jersey City, New Jersey
Custodian
JPMorgan Chase Bank, N.A.
New York, New York
Some Portfolios may not be available in all products.
† Fidelity Institutional AM is a registered trade mark of FMR LLC. Used with permission.
* An affiliate of New York Life Investment Management LLC
Not part of the Semiannual Report
2021 Semiannual Report
This report is for the general information of New York Life Variable Annuities and NYLIAC Variable Universal Life Insurance Products policyowners. It must be preceded or accompanied by the appropriate product(s) and funds prospectuses if it is given to anyone who is not an owner of a New York Life variable annuity policy or a NYLIAC Variable Universal Life Insurance Product. This report does not offer for sale or solicit orders to purchase securities.
The performance data quoted in this report represents past performance. Past performance is no guarantee of future results. Due to market volatility and other factors, current performance may be lower or higher than the figures shown. The most recent month-end performance summary for your variable annuity or variable life policy is available by calling 800-598-2019 and is updated periodically on newyorklife.com.
The New York Life Variable Annuities and NYLIAC Variable Universal Life Insurance Products are issued by New York Life Insurance and Annuity Corporation (a Delaware Corporation) and distributed by NYLIFE Distributors LLC (Member FINRA/SIPC).
New York Life Insurance Company
New York Life Insurance and Annuity
Corporation (NYLIAC) (A Delaware Corporation)
51 Madison Avenue, Room 551
New York, NY 10010
newyorklife.com
nylinvestments.com
NYLIFE Distributors LLC, 30 Hudson Street, Jersey City, NJ 07302
New York Life Investment Management LLC is the investment manager to the MainStay VP Funds Trust
©2021 by NYLIFE Distributors LLC. All rights reserved.
You may obtain copies of the Prospectus and the Statement of Additional Information free of charge, upon request, by calling toll-free 800-598-2019 or writing to New York Life Insurance and Annuity Corporation, 51 Madison Avenue, New York, NY 10010.
| Not FDIC Insured | No Bank Guarantee | May Lose Value |
(NYLIAC) NI523
MainStay VP Winslow Large Cap Growth Portfolio
Message from the President and Semiannual Report
Unaudited | June 30, 2021
Sign up for e-delivery of your shareholder reports. For full details on e-delivery, including who can participate and what you can receive via e-delivery,
please log in to newyorklifeinvestments.com/accounts.
| Not FDIC/NCUA Insured | Not a Deposit | May Lose Value | No Bank Guarantee | Not Insured by Any Government Agency |
This page intentionally left blank
Message from the President
The COVID-19 pandemic continued to afflict our personal lives and broad segments of the U.S. and global economy throughout the six-month reporting period ended June 30, 2021. However, with the deployment of multiple vaccines around the world, including three highly effective versions approved for emergency use in the United States, investors began to turn their attention toward the gradual reopening of the economy and the shape the “new normal” would take.
The first half of the reporting period saw increasing inflationary concerns as fiscal stimulus business reopenings drove accelerating economic growth, rising commodity prices and increased consumer spending. However, the U.S. Federal Reserve noted that price increases were likely to prove temporary and made clear their intention to remain accommodative for the foreseeable future. Accordingly, after moving higher in the first quarter of 2021, interest rates declined in the second quarter.
In response to the uncertain inflation outlook, equity market leadership shifted from value in the first quarter of the year to growth in the second quarter. Nevertheless, investor sentiment remained buoyant throughout the reporting period, with all eleven sectors in the S&P 500® Index, a widely regarded benchmark of market performance, producing positive returns. Energy led the market’s rise fueled by rapidly increasing oil and gas prices, followed by financials and real estate, which benefited from rising interest rates and the economic reopening, respectively. Communication services produced the slowest growth, followed by the traditionally defensive utilities and consumer staples
sectors. In the fixed income market, lower-credit-quality issues tended to outperform their higher-grade counterparts, with high-yield corporate bonds generating the strongest performance. Among securitized products, commercial mortgage-backed securities generally produced the strongest returns, followed by mortgage-backed securities and asset-backed securities, while Treasury securities lagged.
Despite the tremendous progress we’ve seen so far this year, the United States and the world continue to face significant pandemic-related challenges. Newer, more contagious variants of COVID-19 threaten the return of restrictions and lockdowns that could stall the economic recovery. At the same time, supply chain shortages have led to rising prices on everything from laptops to autos, stoking fears of uncontrolled inflation despite reassurance from the U.S. Federal Reserve. At New York Life Investments, we recognize that the shape that the “new normal” eventually takes may differ from our expectations. You can depend on us to keep a sharp watch for the unexpected, and to continue to help you find your way through this rapidly evolving investment landscape.
Sincerely,
Kirk C. Lehneis
President
The opinions expressed are as of the date of this report and are subject to change. There is no guarantee that any forecast made will come to pass. This material does not constitute investment advice and is not intended as an endorsement of any specific investment. Past performance is no guarantee of future results.
Not part of the Semiannual Report
Investors should refer to the Portfolio’s Summary Prospectus and/or Prospectus and consider the Portfolio’s investment objectives, strategies, risks, charges and expenses carefully before investing. The Summary Prospectus and/or Prospectus contain this and other information about the Portfolio. You may obtain copies of the Portfolio’s Summary Prospectus and/or the Prospectus and the Statement of Additional Information free of charge, upon request, by calling toll-free 800-598-2019, by writing to New York Life Insurance and Annuity Corporation, 51 Madison Avenue, Room 251, New York, New York 10010 or by sending an email to MainStayShareholdersServices@nylim.com. These documents are also available at nylinvestments.com/vpdocuments. Please read the Portfolio's Summary Prospectus and/or Prospectus carefully before investing. MainStay VP Funds Trust portfolios are separate account options which are purchased through a variable insurance or variable annuity contract.
Investment and Performance Comparison (Unaudited)
Performance data quoted represents past performance. Past performance is no guarantee of future results. Because of market volatility and other factors, current performance may be lower or higher than the figures shown. Investment return and principal value will fluctuate, and as a result, when shares are redeemed, they may be worth more or less than their original cost. The performance table and graph do not reflect any deduction of sales charges, mortality and expense charges, contract charges or administrative charges. Please refer to the Performance Summary appropriate for your policy. For performance information current to the most recent month-end, please call 800-598-2019 or visit www.newyorklife.com.
Performance figures may reflect certain fee waivers and/or expense limitations, without which total returns may have been different. For information on current fee waivers and/or expense limitations (if any), please refer to the Notes to Financial Statements.
| Average Annual Total Returns for the Period-Ended June 30, 2021 |
| Class | Inception
Date | Six
Months | One
Year | Five
Years | Ten
Years | Gross
Expense
Ratio1 |
| Initial Class Shares | 5/1/1998 | 12.69% | 37.88% | 23.68% | 16.61% | 0.75% |
| Service Class Shares | 6/6/2003 | 12.55 | 37.54 | 23.37 | 16.32 | 1.00 |
| 1. | The gross expense ratios presented reflect the Portfolio’s “Total Annual Portfolio Operating Expenses” from the most recent Prospectus, as supplemented, and may differ from other expense ratios disclosed in this report. |
| Benchmark Performance | Six
Months | One
Year | Five
Years | Ten
Years |
| Russell 1000® Growth Index1 | 12.99% | 42.50% | 23.66% | 17.87% |
| S&P 500® Index2 | 15.25 | 40.79 | 17.65 | 14.84 |
| Morningstar Large Growth Category Average3 | 12.82 | 41.56 | 21.40 | 15.41 |
| 1. | The Russell 1000® Growth Index is the Portfolio's primary benchmark. The Russell 1000® Growth Index is a broad-based benchmark that measures the performance of the large-cap growth segment of the U.S. equity universe. It includes those Russell 1000® Index companies with higher price-to-book ratios and higher forecasted growth values. Results assume reinvestment of all dividends and capital gains. An investment cannot be made directly in an index. |
| 2. | The S&P 500® Index is the Portfolio's secondary benchmark. “S&P 500®" is a trademark of The McGraw-Hill Companies, Inc. The S&P 500® Index is widely regarded as the standard index for measuring large-cap U.S. stock market performance. Results assume reinvestment of all dividends and capital gains. An investment cannot be made directly in an index. |
| 3. | The Morningstar Large Growth Category Average is representative of funds that invest primarily in big U.S. companies that are projected to grow faster than other large-cap stocks. Stocks in the top 70% of the capitalization of the U.S. equity market are defined as large cap. Growth is defined based on fast growth and high valuations. Most of these funds focus on companies in rapidly expanding industries. Results are based on average total returns of similar funds with all dividends and capital gain distributions reinvested. |
Cost in Dollars of a $1,000 Investment in MainStay VP Winslow Large Cap Growth Portfolio (Unaudited)
The example below is intended to describe the fees and expenses borne by shareholders during the six-month period from January 1, 2021 to June 30, 2021, and the impact of those costs on your investment.
Example
As a shareholder of the Portfolio you incur two types of costs: (1) transaction costs, including exchange fees and sales charges (loads) on purchases (as applicable), and (2) ongoing costs, including management fees, distribution and/or service (12b-1) fees, and other Portfolio expenses (as applicable). This example is intended to help you understand your ongoing costs (in dollars) of investing in the Portfolio and to compare these costs with the ongoing costs of investing in other mutual funds. The example is based on an investment of $1,000 made at the beginning of the six-month period and held for the entire period from January 1, 2021 to June 30, 2021. Shares are only sold in connection with variable life and annuity contracts and the example does not reflect any contract level or transactional fees or expenses. If these costs had been included, your costs would have been higher.
This example illustrates your Portfolio’s ongoing costs in two ways:
Actual Expenses
The second and third data columns in the table below provide information about actual account values and actual expenses. You may use the information in these columns, together with the amount you invested, to estimate the expenses that you paid during the six months ended June
30, 2021. Simply divide your account value by $1,000 (for example, an $8,600 account value divided by $1,000 = 8.6), then multiply the result by the number under the heading entitled “Expenses Paid During Period” to estimate the expenses you paid on your account during this period.
Hypothetical Example for Comparison Purposes
The fourth and fifth data columns in the table below provide information about hypothetical account values and hypothetical expenses based on the Portfolio’s actual expense ratio and an assumed rate of return of 5% per year before expenses, which is not the Portfolio’s actual return. The hypothetical account values and expenses may not be used to estimate the actual ending account balances or expenses you paid for the six-month period shown. You may use this information to compare the ongoing costs of investing in the Portfolio with the ongoing costs of investing in other mutual funds. To do so, compare this 5% hypothetical example with the 5% hypothetical examples that appear in the shareholder reports of the other mutual funds.
Please note that the expenses shown in the table are meant to highlight your ongoing costs only and do not reflect any transactional costs, such as exchange fees or sales charges (loads). Therefore, the fourth and fifth data columns of the table are useful in comparing ongoing costs only and will not help you determine the relative total costs of owning different funds. In addition, if these transactional costs were included, your costs would have been higher.
| Share Class | Beginning
Account
Value
1/1/21 | Ending Account
Value (Based
on Actual
Returns and
Expenses)
6/30/21 | Expenses
Paid
During
Period1 | Ending Account
Value (Based
on Hypothetical
5% Annualized
Return and
Actual Expenses)
6/30/21 | Expenses
Paid
During
Period1 | Net Expense
Ratio
During
Period2 |
| Initial Class Shares | $1,000.00 | $1,126.90 | $3.90 | $1,021.13 | $3.71 | 0.74% |
| Service Class Shares | $1,000.00 | $1,125.50 | $5.22 | $1,019.89 | $4.96 | 0.99% |
| 1. | Expenses are equal to the Portfolio’s annualized expense ratio of each class multiplied by the average account value over the period, divided by 365 and multiplied by 181 (to reflect the six-month period). The table above represents the actual expenses incurred during the six-month period. In addition to the fees and expenses which the Portfolio bears directly, it also indirectly bears a pro rata share of the fees and expenses of the underlying funds in which it invests. Such indirect expenses are not included in the above-reported expense figures. |
| 2. | Expenses are equal to the Portfolio's annualized expense ratio to reflect the six-month period. |
| 6 | MainStay VP Winslow Large Cap Growth Portfolio |
Industry Composition as of June 30, 2021 (Unaudited)
| Software | 20.0% |
| IT Services | 13.0 |
| Interactive Media & Services | 11.9 |
| Internet & Direct Marketing Retail | 8.0 |
| Semiconductors & Semiconductor Equipment | 5.9 |
| Hotels, Restaurants & Leisure | 5.2 |
| Textiles, Apparel & Luxury Goods | 4.9 |
| Technology Hardware, Storage & Peripherals | 3.7 |
| Life Sciences Tools & Services | 3.5 |
| Health Care Equipment & Supplies | 2.9 |
| Capital Markets | 1.9 |
| Pharmaceuticals | 1.7 |
| Specialty Retail | 1.7 |
| Chemicals | 1.6 |
| Air Freight & Logistics | 1.6 |
| Health Care Technology | 1.4% |
| Health Care Providers & Services | 1.3 |
| Personal Products | 1.3 |
| Electronic Equipment, Instruments & Components | 1.2 |
| Commercial Services & Supplies | 1.2 |
| Entertainment | 1.1 |
| Professional Services | 1.1 |
| Machinery | 1.1 |
| Biotechnology | 1.1 |
| Containers & Packaging | 1.1 |
| Real Estate Management & Development | 0.0‡ |
| Short–Term Investment | 0.3 |
| Other Assets, Less Liabilities | 0.3 |
| | 100.0% |
‡ Less than one-tenth of percent.
See Portfolio of Investments beginning on page 10 for specific holdings within these categories. The Portfolio's holdings are subject to change.
Top Ten Holdings as of June 30, 2021 (excluding short-term investments) (Unaudited)
| 1. | Microsoft Corp. |
| 2. | Amazon.com, Inc. |
| 3. | Alphabet, Inc. |
| 4. | Visa, Inc., Class A |
| 5. | Facebook, Inc., Class A |
| 6. | Apple, Inc. |
| 7. | Adobe, Inc. |
| 8. | NIKE, Inc., Class B |
| 9. | Mastercard, Inc., Class A |
| 10. | NVIDIA Corp. |
Portfolio Management Discussion and Analysis (Unaudited)
Answers to the questions reflect the views of portfolio managers Justin H. Kelly, CFA, and Patrick M. Burton, CFA, of Winslow Capital Management, LLC, the Portfolio’s Subadvisor.
How did MainStay VP Winslow Large Cap Growth Portfolio perform relative to its benchmarks and peers during the six months ended June 30, 2021?
For the six months ended June 30, 2021, MainStay VP Winslow Large Cap Growth Portfolio returned 12.69% for Initial Class shares and 12.55% for Service Class shares. Over the same period, both share classes underperformed the 12.99% return of the Russell 1000® Growth Index, which is the Portfolio’s primary benchmark, and the 15.25% return of the S&P 500® Index, which is a secondary benchmark of the Portfolio. For the six months ended June 30, 2021, both share classes underperformed the 12.82% return of the Morningstar Large Growth Category Average. 1
What factors affected the Portfolio’s relative performance during the reporting period?
During the reporting period, the Portfolio’s performance relative to the Russell 1000® Growth Index was undermined by security selection in the industrials and consumer discretionary sectors, and by sector allocations. These negative effects were partly offset by strong stock selection in the information technology and health care sectors.
During the reporting period, were there any market events that materially impacted the Portfolio’s performance or liquidity?
In the first half of 2021, markets continued to reflect the recovery sentiment that started to take hold at the end of 2020. Vaccine delivery accelerated, further confirming the light at the end of the pandemic tunnel. Another major fiscal stimulus measure was implemented in the first quarter of 2021, providing additional near-term support in the economy’s transition to “reopening.” The prospect of additional significant infrastructure spending over the next decade and continued support from the U.S. Federal Reserve, both in liquidity measures and accommodative interest rate policy, provided further tailwinds to economic growth expectations.
Importantly for equity investors, corporate earnings proved stronger than forecasted and corporate sentiment returned to, and in fact, moved ahead of pre-pandemic levels, supporting the positive macroeconomic outlook.
Which sectors were the strongest positive contributors to the Portfolio’s relative performance, and which sectors were particularly weak?
The sectors making the strongest positive contributions to the Portfolio’s performance relative to the Russell 1000® Growth Index included information technology, health care and consumer staples. (Contributions take weightings and total returns into account.) Within information technology and health care, the
strongest positive contributions were driven predominantly by security selection. The relative outperformance of the Portfolio in the consumer staples sector was predominantly the result of relatively underweight exposure to this weak-performing sector, although stock selection within the sector further enhanced relative performance.
The three weakest-contributing sectors to the Portfolio’s performance relative to the Index were industrials, consumer discretionary and real estate.
During the reporting period, which individual stocks made the strongest positive contributions to the Portfolio’s absolute performance and which stocks detracted the most?
The leading positive contributors to the Portfolio’s absolute performance during the reporting period included holdings in Alphabet (the holding company of Internet advertising firm Google), software company Microsoft and computer graphics chip maker NVIDIA. All three companies were major beneficiaries of the ongoing global transition to a digitally driven economy.
Notable detractors from the Portfolio’s absolute performance during the same period included social media company Pinterest, cryptocurrency platform Coinbase Global, and information and risk management solutions provider TransUnion. While Pinterest has benefited from the ongoing shift to digital advertising and the monetization of its large user base, the company guided lower on a key user metric during the reporting period. This disappointment coincided with a shift in market sentiment away from price-to-revenue stocks. Coinbase’s initial public offering during the same period preceded a meaningful sell-off in crypto currencies, resulting in decline in the company’s stock. TransUnion underperformed as market sentiment shifted to favor more economically sensitive cyclical sectors and industries. The Portfolio sold all three positions during the reporting period.
Did the Portfolio make any significant purchases or sales during the reporting period?
The Portfolio’s three largest purchases during the reporting period included shares in home improvement specialty retailer Lowe’s, logistics and package delivery company United Parcel Service and specialty coffee company Starbucks. The purchase of Lowe’s stock reflected our view that home improvement trends are likely to remain strong over the coming 2+ years given housing price appreciation and the general lack of home supply. The investment in United Parcel Service was based on our strong outlook for both domestic and global economies, which we believe should be positive for the company. We believe Starbucks will show strong same-store sale comparative growth and a recovery to pre-pandemic margin levels.
| 1. | See page 5 for more information on benchmark and peer group returns. |
| 8 | MainStay VP Winslow Large Cap Growth Portfolio |
Significant sales during the reporting period included positions in consumer electronics company Apple, ride-hailing and food delivery company Uber Technologies and American pharmaceutical firm Eli Lilly and Company. While Apple shares are still held in the Portfolio, our research points to a likely pull forward in demand for many of the company’s products and services over the near term. While we expect Apple’s upcoming June 2021 quarter to be strong, we are concerned about the potential for revenue decline in fiscal year 2022, which would likely result in free cash flow deterioration. Regarding Uber, concern over potential regulatory risk involving their workforce created a near-term overhang on the company’s stock price, leading to the decision to sell the Portfolio’s position. We exited the Portfolio’s position in Eli Lilly as limited upside to our price target weighed on future return potential.
How did the Portfolio’s sector weightings change during the reporting period?
During the reporting period the Portfolio’s sector weightings relative to the Russell 1000® Growth Index underwent shifts due to both structural changes within the Portfolio as well as the reconstitution of the Index. In absolute terms the Portfolio’s exposure to the consumer discretionary and communication services sectors increased. The largest declines in absolute exposure came from information technology, while real estate exposure fell to essentially zero at the reporting period’s end. On a relative basis, the largest shift came in information technology, where the Portfolio transitioned from a notably overweight position at the beginning of the reporting period to a nearly equal-weight position as of June 30, 2021.
How was the Portfolio positioned at the end of the reporting period?
As of June 30, 2021, the Portfolio held meaningfully overweight sector positions relative to the Russell 1000® Growth Index in the health care sector and, to a lesser degree, materials. As of the same date, the Portfolio held its most significantly underweight position in consumer staples, and a smaller underweight position in real estate. All of the Portfolio’s other sector weights were more closely in line with the Index.
The opinions expressed are those of the portfolio managers as of the date of this report and are subject to change. There is no guarantee that any forecasts will come to pass. This material does not constitute investment advice and is not intended as an endorsement of any specific investment.
Not all MainStay VP Portfolios and/or share classes are available under all policies.
Portfolio of Investments June 30, 2021† (Unaudited)
| | Shares | Value |
| Common Stocks 99.4% |
| Air Freight & Logistics 1.6% |
| United Parcel Service, Inc., Class B | 140,900 | $ 29,302,973 |
| Biotechnology 1.1% |
| AbbVie, Inc. | 176,900 | 19,926,016 |
| Capital Markets 1.9% |
| Moody's Corp. | 61,340 | 22,227,776 |
| MSCI, Inc. | 23,200 | 12,367,456 |
| | | 34,595,232 |
| Chemicals 1.6% |
| Linde plc | 101,750 | 29,415,925 |
| Commercial Services & Supplies 1.2% |
| Cintas Corp. | 56,600 | 21,621,200 |
| Containers & Packaging 1.1% |
| Ball Corp. | 240,700 | 19,501,514 |
| Electronic Equipment, Instruments & Components 1.2% |
| TE Connectivity Ltd. | 165,550 | 22,384,016 |
| Entertainment 1.1% |
| Netflix, Inc. (a) | 38,600 | 20,388,906 |
| Health Care Equipment & Supplies 2.9% |
| Align Technology, Inc. (a) | 46,410 | 28,356,510 |
| Edwards Lifesciences Corp. (a) | 240,100 | 24,867,157 |
| | | 53,223,667 |
| Health Care Providers & Services 1.3% |
| UnitedHealth Group, Inc. | 59,430 | 23,798,149 |
| Health Care Technology 1.4% |
| Doximity, Inc., Class A (a) | 59,600 | 3,468,720 |
| Veeva Systems, Inc., Class A (a) | 68,500 | 21,300,075 |
| | | 24,768,795 |
| Hotels, Restaurants & Leisure 5.2% |
| Airbnb, Inc., Class A (a) | 139,800 | 21,408,972 |
| Chipotle Mexican Grill, Inc. (a) | 17,050 | 26,433,297 |
| Hilton Worldwide Holdings, Inc. (a) | 186,800 | 22,531,816 |
| Starbucks Corp. | 224,600 | 25,112,526 |
| | | 95,486,611 |
| | Shares | Value |
| |
| Interactive Media & Services 11.9% |
| Alphabet, Inc. (a) | | |
| Class A | 24,780 | $ 60,507,556 |
| Class C | 25,214 | 63,194,353 |
| |
| Facebook, Inc., Class A (a) | 206,510 | 71,805,592 |
| Snap, Inc., Class A (a) | 315,800 | 21,518,612 |
| | | 217,026,113 |
| Internet & Direct Marketing Retail 8.0% |
| Amazon.com, Inc. (a) | 42,535 | 146,327,206 |
| IT Services 13.0% |
| Mastercard, Inc., Class A | 163,850 | 59,819,996 |
| Payoneer, Inc. (a)(b) | 148,000 | 1,493,320 |
| PayPal Holdings, Inc. (a) | 167,550 | 48,837,474 |
| Square, Inc., Class A (a) | ���108,000 | 26,330,400 |
| Visa, Inc., Class A | 342,400 | 80,059,968 |
| Wix.com Ltd. (a) | 67,850 | 19,695,498 |
| | | 236,236,656 |
| Life Sciences Tools & Services 3.5% |
| Agilent Technologies, Inc. | 195,490 | 28,895,377 |
| Bio-Techne Corp. | 22,300 | 10,040,798 |
| IQVIA Holdings, Inc. (a) | 100,950 | 24,462,204 |
| | | 63,398,379 |
| Machinery 1.1% |
| Parker-Hannifin Corp. | 65,500 | 20,115,705 |
| Personal Products 1.3% |
| Estee Lauder Cos., Inc. (The), Class A | 72,700 | 23,124,416 |
| Pharmaceuticals 1.7% |
| Zoetis, Inc. | 169,650 | 31,615,974 |
| Professional Services 1.1% |
| CoStar Group, Inc. (a) | 245,950 | 20,369,579 |
| Real Estate Management & Development 0.0% ‡ |
| Compass, Inc., Class A (a)(c) | 54,700 | 718,758 |
| Semiconductors & Semiconductor Equipment 5.9% |
| Analog Devices, Inc. | 113,600 | 19,557,376 |
| ASML Holding NV (Registered) | 47,010 | 32,476,388 |
| NVIDIA Corp. | 69,300 | 55,446,930 |
| | | 107,480,694 |
The notes to the financial statements are an integral part of, and should be read in conjunction with, the financial statements.
| 10 | MainStay VP Winslow Large Cap Growth Portfolio |
| | Shares | Value |
| Common Stocks (continued) |
| Software 20.0% |
| Adobe, Inc. (a) | 109,650 | $ 64,215,426 |
| Atlassian Corp. plc, Class A (a) | 81,400 | 20,908,404 |
| Intuit, Inc. | 65,050 | 31,885,558 |
| Microsoft Corp. | 597,500 | 161,862,750 |
| PTC, Inc. (a) | 112,900 | 15,948,254 |
| salesforce.com, Inc. (a) | 82,530 | 20,159,603 |
| ServiceNow, Inc. (a) | 52,850 | 29,043,718 |
| Workday, Inc., Class A (a) | 91,300 | 21,796,962 |
| | | 365,820,675 |
| Specialty Retail 1.7% |
| Lowe's Cos., Inc. | 155,400 | 30,142,938 |
| Technology Hardware, Storage & Peripherals 3.7% |
| Apple, Inc. | 498,000 | 68,206,080 |
| Textiles, Apparel & Luxury Goods 4.9% |
| Lululemon Athletica, Inc. (a) | 75,500 | 27,555,235 |
| NIKE, Inc., Class B | 395,250 | 61,062,172 |
| | | 88,617,407 |
Total Common Stocks
(Cost $1,053,611,303) | | 1,813,613,584 |
| | Shares | | Value |
| Short-Term Investment 0.3% |
| Affiliated Investment Company 0.3% |
| MainStay U.S. Government Liquidity Fund, 0.01% (d) | 6,475,279 | | $ 6,475,279 |
Total Short-Term Investment
(Cost $6,475,279) | | | 6,475,279 |
Total Investments
(Cost $1,060,086,582) | 99.7% | | 1,820,088,863 |
| Other Assets, Less Liabilities | 0.3 | | 5,277,002 |
| Net Assets | 100.0% | | $ 1,825,365,865 |
| † | Percentages indicated are based on Portfolio net assets. |
| ‡ | Less than one-tenth of a percent. |
| (a) | Non-income producing security. |
| (b) | Restricted security. (See Note 5) |
| (c) | All or a portion of this security was held on loan. As of June 30, 2021, the aggregate market value of securities on loan was $105,567. The market value of the collateral held included non-cash collateral in the form of U.S. Treasury securities with a value of $111,013. (See Note 2(H)) |
| (d) | Current yield as of June 30, 2021. |
The following is a summary of the fair valuations according to the inputs used as of June 30, 2021, for valuing the Portfolio’s assets:
| Description | Quoted
Prices in
Active
Markets for
Identical
Assets
(Level 1) | | Significant
Other
Observable
Inputs
(Level 2) | | Significant
Unobservable
Inputs
(Level 3) | | Total |
| Asset Valuation Inputs | | | | | | | |
| Investments in Securities (a) | | | | | | | |
| Common Stocks | $ 1,812,120,264 | | $ 1,493,320 | | $ — | | $ 1,813,613,584 |
| Short-Term Investment | | | | | | | |
| Affiliated Investment Company | 6,475,279 | | — | | — | | 6,475,279 |
| Total Investments in Securities | $ 1,818,595,543 | | $ 1,493,320 | | $ — | | $ 1,820,088,863 |
| (a) | For a complete listing of investments and their industries, see the Portfolio of Investments. |
The notes to the financial statements are an integral part of, and should be read in conjunction with, the financial statements.
11
Statement of Assets and Liabilities as of June 30, 2021 (Unaudited)
| Assets |
Investment in unaffiliated securities, at value
(identified cost $1,053,611,303) including securities on loan of $105,567 | $1,813,613,584 |
Investment in affiliated investment companies, at value
(identified cost $6,475,279) | 6,475,279 |
| Receivables: | |
| Investment securities sold | 18,404,460 |
| Dividends | 105,883 |
| Portfolio shares sold | 61,185 |
| Securities lending | 424 |
| Other assets | 23,935 |
| Total assets | 1,838,684,750 |
| Liabilities |
| Payables: | |
| Investment securities purchased | 11,770,899 |
| Manager (See Note 3) | 1,043,981 |
| NYLIFE Distributors (See Note 3) | 245,325 |
| Shareholder communication | 115,501 |
| Portfolio shares redeemed | 66,928 |
| Professional fees | 60,194 |
| Custodian | 16,057 |
| Total liabilities | 13,318,885 |
| Net assets | $1,825,365,865 |
| Composition of Net Assets |
| Shares of beneficial interest outstanding (par value of $.001 per share) unlimited number of shares authorized | $ 51,758 |
| Additional paid-in-capital | 824,411,442 |
| | 824,463,200 |
| Total distributable earnings (loss) | 1,000,902,665 |
| Net assets | $1,825,365,865 |
| Initial Class | |
| Net assets applicable to outstanding shares | $ 591,882,833 |
| Shares of beneficial interest outstanding | 16,031,892 |
| Net asset value per share outstanding | $ 36.92 |
| Service Class | |
| Net assets applicable to outstanding shares | $1,233,483,032 |
| Shares of beneficial interest outstanding | 35,726,219 |
| Net asset value per share outstanding | $ 34.53 |
The notes to the financial statements are an integral part of, and should be read in conjunction with, the financial statements.
| 12 | MainStay VP Winslow Large Cap Growth Portfolio |
Statement of Operations for the six months ended June 30, 2021 (Unaudited)
| Investment Income (Loss) |
| Income | |
| Dividends-unaffiliated (net of foreign tax withholding of $14,054) | $ 3,574,677 |
| Securities lending | 9,636 |
| Dividends-affiliated | 907 |
| Total income | 3,585,220 |
| Expenses | |
| Manager (See Note 3) | 6,054,105 |
| Distribution/Service—Service Class (See Note 3) | 1,417,284 |
| Professional fees | 74,739 |
| Shareholder communication | 63,960 |
| Trustees | 16,411 |
| Custodian | 13,647 |
| Miscellaneous | 18,954 |
| Total expenses before waiver/reimbursement | 7,659,100 |
| Expense waiver/reimbursement from Manager (See Note 3) | (13,940) |
| Net expenses | 7,645,160 |
| Net investment income (loss) | (4,059,940) |
| Realized and Unrealized Gain (Loss) |
| Net realized gain (loss) on unaffiliated investments | 106,468,622 |
| Net change in unrealized appreciation (depreciation) on unaffiliated investments | 103,509,661 |
| Net realized and unrealized gain (loss) | 209,978,283 |
| Net increase (decrease) in net assets resulting from operations | $205,918,343 |
The notes to the financial statements are an integral part of, and should be read in conjunction with, the financial statements.
13
Statements of Changes in Net Assets
for the six months ended June 30, 2021 (Unaudited) and the year ended December 31, 2020
| | 2021 | 2020 |
| Increase (Decrease) in Net Assets |
| Operations: | | |
| Net investment income (loss) | $ (4,059,940) | $ (4,447,507) |
| Net realized gain (loss) | 106,468,622 | 138,815,013 |
| Net change in unrealized appreciation (depreciation) | 103,509,661 | 308,412,770 |
| Net increase (decrease) in net assets resulting from operations | 205,918,343 | 442,780,276 |
| Distributions to shareholders: | | |
| Initial Class | — | (32,083,765) |
| Service Class | — | (68,003,617) |
| Total distributions to shareholders | — | (100,087,382) |
| Capital share transactions: | | |
| Net proceeds from sales of shares | 87,040,327 | 205,574,641 |
| Net asset value of shares issued to shareholder in reinvestment of distributions | — | 100,087,382 |
| Cost of shares redeemed | (96,405,357) | (282,706,153) |
| Increase (decrease) in net assets derived from capital share transactions | (9,365,030) | 22,955,870 |
| Net increase (decrease) in net assets | 196,553,313 | 365,648,764 |
| Net Assets |
| Beginning of period | 1,628,812,552 | 1,263,163,788 |
| End of period | $1,825,365,865 | $1,628,812,552 |
The notes to the financial statements are an integral part of, and should be read in conjunction with, the financial statements.
| 14 | MainStay VP Winslow Large Cap Growth Portfolio |
Financial Highlights selected per share data and ratios
| | Six months ended
June 30,
2021* | | Year Ended December 31, |
| Initial Class | 2020 | | 2019 | | 2018 | | 2017 | | 2016 |
| Net asset value at beginning of period | $ 32.76 | | $ 25.51 | | $ 21.64 | | $ 23.92 | | $ 18.71 | | $ 20.83 |
| Net investment income (loss) (a) | (0.05) | | (0.04) | | 0.00‡ | | 0.00‡ | | 0.02 | | 0.01 |
| Net realized and unrealized gain (loss) on investments | 4.21 | | 9.36 | | 6.95 | | 1.36 | | 6.00 | | (0.43) |
| Total from investment operations | 4.16 | | 9.32 | | 6.95 | | 1.36 | | 6.02 | | (0.42) |
| Less distributions: | | | | | | | | | | | |
| From net realized gain on investments | — | | (2.07) | | (3.08) | | (3.64) | | (0.81) | | (1.70) |
| Net asset value at end of period | $ 36.92 | | $ 32.76 | | $ 25.51 | | $ 21.64 | | $ 23.92 | | $ 18.71 |
| Total investment return (b) | 12.70%(c) | | 37.16% | | 33.64% | | 3.57% | | 32.39% | | (2.27)% |
| Ratios (to average net assets)/Supplemental Data: | | | | | | | | | | | |
| Net investment income (loss) | (0.31)%†† | | (0.16)% | | 0.01% | | 0.01% | | 0.10% | | 0.07% |
| Net expenses (d) | 0.74%††(e) | | 0.75%(e) | | 0.76%(e) | | 0.76%(e) | | 0.76%(e) | | 0.77% |
| Portfolio turnover rate | 31% | | 54% | | 56% | | 58% | | 53% | | 94% |
| Net assets at end of period (in 000’s) | $ 591,883 | | $ 534,965 | | $ 438,089 | | $ 238,174 | | $ 368,861 | | $ 518,425 |
| * | Unaudited. |
| ‡ | Less than one cent per share. |
| †† | Annualized. |
| (a) | Per share data based on average shares outstanding during the period. |
| (b) | Total return does not reflect any deduction of sales charges, mortality and expense charges, contract charges or administrative charges. For periods of less than one year, total return is not annualized. |
| (c) | Total investment return may reflect adjustments to conform to generally accepted accounting principles. |
| (d) | In addition to the fees and expenses which the Portfolio bears directly, it also indirectly bears a pro-rata share of the fees and expenses of the underlying funds in which it invests. Such indirect expenses are not included in the above expense ratios. |
| (e) | Expense waiver/reimbursement less than 0.01%. |
| | Six months ended
June 30,
2021* | | Year Ended December 31, |
| Service Class | 2020 | | 2019 | | 2018 | | 2017 | | 2016 |
| Net asset value at beginning of period | $ 30.68 | | $ 24.05 | | $ 20.60 | | $ 22.96 | | $ 18.03 | | $ 20.18 |
| Net investment income (loss) (a) | (0.09) | | (0.11) | | (0.06) | | (0.06) | | (0.03) | | (0.03) |
| Net realized and unrealized gain (loss) on investments | 3.94 | | 8.81 | | 6.59 | | 1.34 | | 5.77 | | (0.42) |
| Total from investment operations | 3.85 | | 8.70 | | 6.53 | | 1.28 | | 5.74 | | (0.45) |
| Less distributions: | | | | | | | | | | | |
| From net realized gain on investments | — | | (2.07) | | (3.08) | | (3.64) | | (0.81) | | (1.70) |
| Net asset value at end of period | $ 34.53 | | $ 30.68 | | $ 24.05 | | $ 20.60 | | $ 22.96 | | $ 18.03 |
| Total investment return (b) | 12.55% | | 36.81% | | 33.30% | | 3.31% | | 32.06% | | (2.52)% |
| Ratios (to average net assets)/Supplemental Data: | | | | | | | | | | | |
| Net investment income (loss) | (0.56)%†† | | (0.41)% | | (0.25)% | | (0.23)% | | (0.15)% | | (0.17)% |
| Net expenses (c) | 0.99%††(d) | | 1.00%(d) | | 1.01%(d) | | 1.01%(d) | | 1.01%(d) | | 1.02% |
| Portfolio turnover rate | 31% | | 54% | | 56% | | 58% | | 53% | | 94% |
| Net assets at end of period (in 000’s) | $ 1,233,483 | | $ 1,093,847 | | $ 825,075 | | $ 623,836 | | $ 575,514 | | $ 435,029 |
| * | Unaudited. |
| †† | Annualized. |
| (a) | Per share data based on average shares outstanding during the period. |
| (b) | Total return does not reflect any deduction of sales charges, mortality and expense charges, contract charges or administrative charges. For periods of less than one year, total return is not annualized. |
| (c) | In addition to the fees and expenses which the Portfolio bears directly, it also indirectly bears a pro-rata share of the fees and expenses of the underlying funds in which it invests. Such indirect expenses are not included in the above expense ratios. |
| (d) | Expense waiver/reimbursement less than 0.01%. |
The notes to the financial statements are an integral part of, and should be read in conjunction with, the financial statements.
15
Notes to Financial Statements (Unaudited)
Note 1–Organization and Business
MainStay VP Funds Trust (the “Fund”) was organized as a Delaware statutory trust on February 1, 2011. The Fund is registered under the Investment Company Act of 1940, as amended (the “1940 Act”), as an open-end management investment company. The Fund is comprised of thirty-one separate series (collectively referred to as the “Portfolios”). These financial statements and notes relate to the MainStay VP Winslow Large Cap Growth Portfolio (the "Portfolio"), a "diversified” portfolio, as that term is defined in the 1940 Act, as interpreted or modified by regulatory authorities having jurisdiction, from time to time.
Shares of the Portfolio are currently offered to certain separate accounts to fund variable annuity policies and variable universal life insurance policies issued by New York Life Insurance and Annuity Corporation (“NYLIAC”), a wholly-owned subsidiary of New York Life Insurance Company (“New York Life”) and may also be offered to fund variable annuity policies and variable universal life insurance policies issued by other insurance companies. NYLIAC allocates shares of the Portfolios to, among others, certain NYLIAC separate accounts. Shares of the Portfolio are also offered to the MainStay VP Conservative Allocation Portfolio, MainStay VP Moderate Allocation Portfolio, MainStay VP Growth Allocation Portfolio (formerly known as MainStay VP Moderate Growth Allocation Portfolio) and MainStay VP Equity Allocation Portfolio (formerly known as MainStay VP Growth Allocation Portfolio), which operate as “funds-of-funds," and other variable insurance funds.
The following table lists the Portfolio's share classes that have been registered and commenced operations:
| Class | Commenced Operations |
| Initial Class | May 1, 1998 |
| Service Class | June 6, 2003 |
Shares of the Portfolio are offered and are redeemed at a price equal to their respective net asset value (“NAV”) per share. No sales or redemption charge is applicable to the purchase or redemption of the Portfolio's shares. Under the terms of the Fund’s multiple class plan, adopted pursuant to Rule 18f-3 under the 1940 Act, the classes differ in that, among other things, Service Class shares of the Portfolio pay a combined distribution and service fee of 0.25% of average daily net assets attributable to Service Class shares of the Portfolio to the Distributor (as defined in Note 3(B)) pursuant to a plan adopted in accordance with Rule 12b-1 under the 1940 Act. Contract owners of variable annuity contracts purchased after June 2, 2003, are permitted to invest only in the Service Class shares.
The Portfolio's investment objective is to seek long-term growth of capital.
Note 2–Significant Accounting Policies
The Portfolio is an investment company and accordingly follows the investment company accounting and reporting guidance of the Financial Accounting Standards Board (“FASB”) Accounting Standard Codification
Topic 946 Financial Services—Investment Companies. The Portfolio prepares its financial statements in accordance with generally accepted accounting principles (“GAAP”) in the United States of America and follows the significant accounting policies described below.
(A) Securities Valuation. Investments are usually valued as of the close of regular trading on the New York Stock Exchange (the "Exchange") (usually 4:00 p.m. Eastern time) on each day the Portfolio is open for business ("valuation date").
The Board of Trustees of the Fund (the "Board") adopted procedures establishing methodologies for the valuation of the Portfolio's securities and other assets and delegated the responsibility for valuation determinations under those procedures to the Valuation Committee of the Fund (the “Valuation Committee”). The procedures state that, subject to the oversight of the Board and unless otherwise noted, the responsibility for the day-to-day valuation of portfolio assets (including fair value measurements for the Portfolio's assets and liabilities) rests with New York Life Investment Management LLC (“New York Life Investments” or the "Manager"), aided to whatever extent necessary by the Subadvisor (as defined in Note 3(A)). To assess the appropriateness of security valuations, the Manager, the Subadvisor or the Portfolio's third-party service provider, who is subject to oversight by the Manager, regularly compares prior day prices, prices on comparable securities and the sale prices to the prior and current day prices and challenges prices with changes exceeding certain tolerance levels with third-party pricing services or broker sources.
The Board authorized the Valuation Committee to appoint a Valuation Subcommittee (the “Subcommittee”) to establish the prices of securities for which market quotations are not readily available or the prices of which are not otherwise readily determinable under the procedures. The Subcommittee meets (in person, via electronic mail or via teleconference) on an as-needed basis. The Valuation Committee meets to ensure that actions taken by the Subcommittee were appropriate.
For those securities valued through either a standardized fair valuation methodology or a fair valuation measurement, the Subcommittee deals with such valuation and the Valuation Committee reviews and affirms, if appropriate, the reasonableness of the valuation based on such methodologies and measurements on a regular basis after considering information that is reasonably available and deemed relevant by the Valuation Committee. Any action taken by the Subcommittee with respect to the valuation of a portfolio security or other asset is submitted for review and ratification (if appropriate) to the Valuation Committee and the Board at the next regularly scheduled meeting.
"Fair value" is defined as the price the Portfolio would reasonably expect to receive upon selling an asset or liability in an orderly transaction to an independent buyer in the principal or most advantageous market for the asset or liability. Fair value measurements are determined within a framework that establishes a three-tier hierarchy that maximizes the use of observable market data and minimizes the use of unobservable inputs to establish a classification of fair value measurements for disclosure
| 16 | MainStay VP Winslow Large Cap Growth Portfolio |
purposes. "Inputs" refer broadly to the assumptions that market participants would use in pricing the asset or liability, including assumptions about risk, such as the risk inherent in a particular valuation technique used to measure fair value using a pricing model and/or the risk inherent in the inputs for the valuation technique. Inputs may be observable or unobservable. Observable inputs reflect the assumptions market participants would use in pricing the asset or liability based on market data obtained from sources independent of the Portfolio. Unobservable inputs reflect the Portfolio’s own assumptions about the assumptions market participants would use in pricing the asset or liability based on the information available. The inputs or methodology used for valuing assets or liabilities may not be an indication of the risks associated with investing in those assets or liabilities. The three-tier hierarchy of inputs is summarized below.
| • | Level 1—quoted prices in active markets for an identical asset or liability |
| • | Level 2—other significant observable inputs (including quoted prices for a similar asset or liability in active markets, interest rates and yield curves, prepayment speeds, credit risk, etc.) |
| • | Level 3—significant unobservable inputs (including the Portfolio's own assumptions about the assumptions that market participants would use in measuring fair value of an asset or liability) |
The level of an asset or liability within the fair value hierarchy is based on the lowest level of an input, both individually and in the aggregate, that is significant to the fair value measurement. The aggregate value by input level of the Portfolio’s assets and liabilities as of June 30, 2021, is included at the end of the Portfolio of Investments.
The Portfolio may use third-party vendor evaluations, whose prices may be derived from one or more of the following standard inputs, among others:
| • Broker/dealer quotes | • Benchmark securities |
| • Two-sided markets | • Reference data (corporate actions or material event notices) |
| • Bids/offers | • Monthly payment information |
| • Industry and economic events | • Reported trades |
An asset or liability for which market values cannot be measured using the methodologies described above is valued by methods deemed reasonable in good faith by the Valuation Committee, following the procedures established by the Board, to represent fair value. Under these procedures, the Portfolio generally uses a market-based approach which may use related or comparable assets or liabilities, recent transactions, market multiples, book values and other relevant information. The Portfolio may also use an income-based valuation approach in which the anticipated future cash flows of the asset or liability are discounted to calculate fair value. Discounts may also be applied due to the nature and/or duration of any restrictions on the disposition of the asset or liability. Fair value represents a good faith approximation of the value of a security. Fair value determinations involve the consideration of a number
of subjective factors, an analysis of applicable facts and circumstances and the exercise of judgment. As a result, it is possible that the fair value for a security determined in good faith in accordance with the Portfolio's valuation procedures may differ from valuations for the same security determined by other funds using their own valuation procedures. Although the Portfolio's valuation procedures are designed to value a security at the price the Portfolio may reasonably expect to receive upon the security's sale in an orderly transaction, there can be no assurance that any fair value determination thereunder would, in fact, approximate the amount that the Portfolio would actually realize upon the sale of the security or the price at which the security would trade if a reliable market price were readily available. During the six-month period ended June 30, 2021, there were no material changes to the fair value methodologies.
Securities which may be valued in this manner include, but are not limited to: (i) a security for which trading has been halted or suspended; (ii) a debt security that has recently gone into default and for which there is not a current market quotation; (iii) a security of an issuer that has entered into a restructuring; (iv) a security that has been delisted from a national exchange; (v) a security for which the market price is not readily available from a third-party pricing source or, if so provided, does not, in the opinion of the Manager or the Subadvisor, reflect the security's market value; (vi) a security subject to trading collars for which no or limited trading takes place; and (vii) a security whose principal market has been temporarily closed at a time when, under normal conditions, it would be open. Securities valued in this manner are generally categorized as Level 3 in the hierarchy. No securities held by the Portfolio as of June 30, 2021 were fair valued in such a manner.
Certain securities held by the Portfolio may principally trade in foreign markets. Events may occur between the time the foreign markets close and the time at which the Portfolio's NAVs are calculated. These events may include, but are not limited to, situations relating to a single issuer in a market sector, significant fluctuations in U.S. or foreign markets, natural disasters, armed conflicts, governmental actions or other developments not tied directly to the securities markets. Should the Manager or the Subadvisor conclude that such events may have affected the accuracy of the last price of such securities reported on the local foreign market, the Subcommittee may, pursuant to procedures adopted by the Board, adjust the value of the local price to reflect the estimated impact on the price of such securities as a result of such events. In this instance, securities are generally categorized as Level 3 in the hierarchy. Additionally, certain foreign equity securities are also fair valued whenever the movement of a particular index exceeds certain thresholds. In such cases, the securities are fair valued by applying factors provided by a third-party vendor in accordance with valuation procedures adopted by the Board and are generally categorized as Level 2 in the hierarchy. No foreign equity securities held by the Portfolio as of June 30, 2021 were fair valued in such a manner.
Equity securities are valued at the last quoted sales prices as of the close of regular trading on the relevant exchange on each valuation date. Securities that are not traded on the valuation date are valued at the mean of the last quoted bid and ask prices. Prices are normally taken
Notes to Financial Statements (Unaudited) (continued)
from the principal market in which each security trades. These securities are generally categorized as Level 1 in the hierarchy.
Investments in mutual funds, including money market funds, are valued at their respective NAVs at the close of business each day on the valuation date. These securities are generally categorized as Level 1 in the hierarchy.
Temporary cash investments acquired in excess of 60 days to maturity at the time of purchase are valued using the latest bid prices or using valuations based on a matrix system (which considers such factors as security prices, yields, maturities and ratings), both as furnished by independent pricing services. Temporary cash investments that mature in 60 days or less at the time of purchase ("Short-Term Investments") are valued using the amortized cost method of valuation, unless the use of such method would be inappropriate. The amortized cost method involves valuing a security at its cost on the date of purchase and thereafter assuming a constant amortization to maturity of the difference between such cost and the value on maturity date. Amortized cost approximates the current fair value of a security. Securities valued using the amortized cost method are not valued using quoted prices in an active market and are generally categorized as Level 2 in the hierarchy.
The information above is not intended to reflect an exhaustive list of the methodologies that may be used to value portfolio investments. The valuation procedures permit the use of a variety of valuation methodologies in connection with valuing portfolio investments. The methodology used for a specific type of investment may vary based on the market data available or other considerations. The methodologies summarized above may not represent the specific means by which portfolio investments are valued on any particular business day.
(B) Income Taxes. The Portfolio's policy is to comply with the requirements of the Internal Revenue Code of 1986, as amended (the “Internal Revenue Code”), applicable to regulated investment companies and to distribute all of its taxable income to the shareholders of the Portfolio within the allowable time limits.
The Manager evaluates the Portfolio’s tax positions to determine if the tax positions taken meet the minimum recognition threshold in connection with accounting for uncertainties in income tax positions taken or expected to be taken for the purposes of measuring and recognizing tax liabilities in the financial statements. Recognition of tax benefits of an uncertain tax position is permitted only to the extent the position is “more likely than not” to be sustained assuming examination by taxing authorities. The Manager analyzed the Portfolio's tax positions taken on federal, state and local income tax returns for all open tax years (for up to three tax years) and has concluded that no provisions for federal, state and local income tax are required in the Portfolio's financial statements. The Portfolio's federal, state and local income tax and federal excise tax returns for tax years for which the applicable statutes of limitations have not expired are subject to examination by the Internal Revenue Service and state and local departments of revenue.
(C) Foreign Taxes. The Portfolio may be subject to foreign taxes on income and other transaction-based taxes imposed by certain countries in which it invests. A portion of the taxes on gains on investments or currency purchases/repatriation may be reclaimable. The Portfolio will accrue such taxes and reclaims as applicable, based upon its current interpretation of tax rules and regulations that exist in the markets in which it invests.
The Portfolio may be subject to taxation on realized capital gains, repatriation proceeds and other transaction-based taxes imposed by certain countries in which it invests. The Portfolio will accrue such taxes as applicable based upon its current interpretation of tax rules and regulations that exist in the market in which it invests. Capital gains taxes relating to positions still held are reflected as a liability in the Statement of Assets and Liabilities, as well as an adjustment to the Portfolio's net unrealized appreciation (depreciation). Taxes related to capital gains realized, if any, are reflected as part of net realized gain (loss) in the Statement of Operations. Changes in tax liabilities related to capital gains taxes on unrealized investment gains, if any, are reflected as part of the change in net unrealized appreciation (depreciation) on investments in the Statement of Operations. Transaction-based charges are generally assessed as a percentage of the transaction amount.
(D) Dividends and Distributions to Shareholders. Dividends and distributions are recorded on the ex-dividend date. The Portfolio intends to declare and pay dividends from net investment income and distributions from net realized capital and currency gains, if any, at least annually. Unless a shareholder elects otherwise, all dividends and distributions are reinvested at NAV in the same class of shares of the Portfolio. Dividends and distributions to shareholders are determined in accordance with federal income tax regulations and may differ from determinations using GAAP.
(E) Security Transactions and Investment Income. The Portfolio records security transactions on the trade date. Realized gains and losses on security transactions are determined using the identified cost method. Dividend income is recognized on the ex-dividend date, net of any foreign tax withheld at the source, and interest income is accrued as earned using the effective interest rate method. Distributions received from real estate investment trusts may be classified as dividends, capital gains and/or return of capital.
Investment income and realized and unrealized gains and losses on investments of the Portfolio are allocated pro rata to the separate classes of shares based upon their relative net assets on the date the income is earned or realized and unrealized gains and losses are incurred.
(F) Expenses. Expenses of the Fund are allocated to the individual Portfolios in proportion to the net assets of the respective Portfolios when the expenses are incurred, except where direct allocations of expenses can be made. Expenses (other than fees incurred under the distribution and service plans, further discussed in Note 3(B), which are charged directly to the Service Class shares) are allocated to separate classes of shares pro rata based upon their relative net assets on the date the
| 18 | MainStay VP Winslow Large Cap Growth Portfolio |
expenses are incurred. The expenses borne by the Portfolio, including those of related parties to the Portfolio, are shown in the Statement of Operations.
Additionally, the Portfolio may invest in mutual funds, which are subject to management fees and other fees that may cause the costs of investing in mutual funds to be greater than the costs of owning the underlying securities directly. These indirect expenses of mutual funds are not included in the amounts shown as expenses in the Statement of Operations or in the expense ratios included in the Financial Highlights.
(G) Use of Estimates. In preparing financial statements in conformity with GAAP, the Manager makes estimates and assumptions that affect the reported amounts and disclosures in the financial statements. Actual results could differ from those estimates and assumptions.
(H) Securities Lending. In order to realize additional income, the Portfolio may engage in securities lending, subject to the limitations set forth in the 1940 Act and relevant guidance by the staff of the Securities and Exchange Commission (“SEC”). If the Portfolio engages in securities lending, the Portfolio will lend through its custodian, JPMorgan Chase Bank, N.A., ("JPMorgan"), acting as securities lending agent on behalf of the Portfolio. Under the current arrangement, JPMorgan will manage the Portfolio's collateral in accordance with the securities lending agency agreement between the Portfolio and JPMorgan, and indemnify the Portfolio against counterparty risk. The loans will be collateralized by cash (which may be invested in a money market fund) and/or non-cash collateral (which may include U.S. Treasury securities and/or U.S. government agency securities issued or guaranteed by the United States government or its agencies or instrumentalities) at least equal at all times to the market value of the securities loaned. The Portfolio bears the risk of delay in recovery of, or loss of rights in, the securities loaned. The Portfolio may also record a realized gain or loss on securities deemed sold due to a borrower’s inability to return securities on loan. The Portfolio bears the risk of any loss on investment of cash collateral. The Portfolio will receive compensation for lending its securities in the form of fees or it will retain a portion of interest earned on the investment of any cash collateral. The Portfolio will also continue to receive interest and dividends on the securities loaned and any gain or loss in the market price of the securities loaned that may occur during the term of the loan will be for the account of the Portfolio. Income earned from securities lending activities, if any, is reflected in the Statement of Operations. Securities on loan as of June 30, 2021, are shown in the Portfolio of Investments.
Prior to February 22, 2021, these services were provided by State Street Bank and Trust Company (“State Street”).
(I) Indemnifications. Under the Fund’s organizational documents, its officers and trustees are indemnified against certain liabilities that may arise out of performance of their duties to the Fund. Additionally, in the normal course of business, the Portfolio enters into contracts with third-party service providers that contain a variety of representations and warranties and that may provide general indemnifications. The Portfolio's maximum exposure under these arrangements is unknown, as this would
involve future claims that may be made against the Portfolio that have not yet occurred. The Manager believes that the risk of loss in connection with these potential indemnification obligations is remote. However, there can be no assurance that material liabilities related to such obligations will not arise in the future, which could adversely impact the Portfolio.
Note 3–Fees and Related Party Transactions
(A) Manager and Subadvisor. New York Life Investments, a registered investment adviser and an indirect, wholly-owned subsidiary of New York Life, serves as the Fund’s Manager, pursuant to an Amended and Restated Management Agreement (“Management Agreement”). The Manager provides offices, conducts clerical, recordkeeping and bookkeeping services and keeps most of the financial and accounting records required to be maintained by the Fund. Except for the portion of salaries and expenses that are the responsibility of the Fund, the Manager pays the salaries and expenses of all personnel affiliated with the Fund and certain operational expenses of the Fund. The Fund reimburses New York Life Investments in an amount equal to the portion of the compensation of the Chief Compliance Officer attributable to the Fund. Winslow Capital Management, LLC. (“Winslow” or the “Subadvisor”), a registered investment adviser, serves as Subadvisor to the Fund and is responsible for the day-to-day portfolio management of the Fund. Pursuant to the terms of a Subadvisory Agreement (“Subadvisory Agreement”) between New York Life Investments and Winslow, New York Life Investments pays for the services of the Subadvisor.
Pursuant to the Management Agreement, the Fund pays the Manager, on behalf of the Portfolio, a monthly fee for the services performed and the facilities furnished at an annual rate of the Portfolio's average daily net assets as follows: 0.75% up to $500 million; 0.725% from $500 million to $750 million; 0.71% from $750 million to $1 billion; 0.70% from $1 billion to $2 billion; 0.66% from $2 billion to $3 billion; 0.61% from $3 billion to $7 billion; 0.585% from $7 billion to $9 billion; and 0.575% in excess of $9 billion.
New York Life Investments has voluntarily agreed to waive a portion of its management fee when the subadvisory fee is reduced as a result of achieving breakpoints in the subadvisory fee schedule. The savings that result from the reduced subadvisory fee will be shared equally with the Portfolio provided that the amount of the management fee retained by New York Life Investments, after payment of the subadvisory fee, exceeds 0.35% of the average daily net assets of the Portfolio. This waiver may be discontinued at any time.
New York Life Investments has contractually agreed to waive a portion of its management fee so that the management fee does not exceed 0.55% of the Portfolio’s average daily net assets from $11 billion to $13 billion; and 0.525% of the Portfolio’s average daily net assets over $13 billion. This agreement expires May 1, 2022, and may only be amended or terminated prior to that date by action of the Board. During the six-month period ended June 30, 2021, the effective management fee rate was 0.72% (exclusive of any applicable waivers/reimbursements).
Notes to Financial Statements (Unaudited) (continued)
During the six-month period ended June 30, 2021, New York Life Investments earned fees from the Portfolio in the amount of $6,054,105 and waived fees and/or reimbursed expenses in the amount of $13,940 and paid the Subadvisor fees in the amount of $2,165,077.
JPMorgan provides sub-administration and sub-accounting services to the Portfolio pursuant to an agreement with New York Life Investments. These services include calculating the daily NAVs of the Portfolio, maintaining the general ledger and sub-ledger accounts for the calculation of the Portfolio's NAVs, and assisting New York Life Investments in conducting various aspects of the Portfolio's administrative operations. For providing these services to the Portfolio, JPMorgan is compensated by New York Life Investments.
Prior to February 22, 2021, these services were provided by State Street.
Pursuant to an agreement between the Fund and New York Life Investments, New York Life Investments is responsible for providing or procuring certain regulatory reporting services for the Portfolio. The
Portfolio will reimburse New York Life Investments for the actual costs incurred by New York Life Investments in connection with providing or procuring these services for the Portfolio.
(B) Distribution and Service Fees. The Fund, on behalf of the Portfolio, has entered into a distribution agreement with NYLIFE Distributors LLC (the “Distributor”), an affiliate of New York Life Investments. The Portfolio has adopted a distribution plan (the “Plan”) in accordance with the provisions of Rule 12b-1 under the 1940 Act. Under the Plan, the Distributor has agreed to provide, through its affiliates or independent third parties, various distribution-related, shareholder and administrative support services to the Service Class shareholders. For its services, the Distributor is entitled to a combined distribution and service fee accrued daily and paid monthly at an annual rate of 0.25% of the average daily net assets attributable to the Service Class shares of the Portfolio.
(C) Investments in Affiliates (in 000’s). During the six-month period ended June 30, 2021, purchases and sales transactions, income earned from investments and shares held of investment companies managed by New York Life Investments or its affiliates were as follows:
| Affiliated Investment Companies | Value,
Beginning
of Period | Purchases
at Cost | Proceeds
from
Sales | Net
Realized
Gain/(Loss)
on Sales | Change in
Unrealized
Appreciation/
(Depreciation) | Value,
End of
Period | Dividend
Income | Other
Distributions | Shares
End of
Period |
| MainStay U.S. Government Liquidity Fund | $ 14,908 | $ 135,650 | $ (144,083) | $ — | $ — | $ 6,475 | $ 1 | $ — | 6,475 |
Note 4-Federal Income Tax
As of June 30, 2021, the cost and unrealized appreciation (depreciation) of the Portfolio’s investment portfolio, including applicable derivative contracts and other financial instruments, as determined on a federal income tax basis, were as follows:
| | Federal Tax
Cost | Gross
Unrealized
Appreciation | Gross
Unrealized
(Depreciation) | Net
Unrealized
Appreciation/
(Depreciation) |
| Investments in Securities | $1,060,407,558 | $762,805,652 | $(3,124,347) | $759,681,305 |
During the year ended December 31, 2020, the tax character of distributions paid as reflected in the Statements of Changes in Net Assets was as follows:
| | 2020 |
| Distributions paid from: | |
| Long-Term Capital Gains | $100,087,382 |
Note 5–Restricted Securities
Restricted securities are subject to legal or contractual restrictions on resale. Private placement securities are generally considered to be restricted except for those securities traded between qualified institutional investors under the provisions of Rule 144A of the Securities Act of 1933, as amended. Disposal of restricted securities may involve time consuming negotiations and expenses, and prompt sale at an acceptable price may be difficult to achieve.
As of June 30, 2021, restricted securities held by the Portfolio were as follows:
| Security | Date of
Acquisition | Shares | Cost | 6/30/21
Value | Percent of
Net Assets |
| Payoneer, Inc. |
| Common Stock | 6/25/21 | 148,000 | $ 1,480,000 | $ 1,493,320 | 0.1% |
| 20 | MainStay VP Winslow Large Cap Growth Portfolio |
Note 6–Custodian
JPMorgan is the custodian of cash and securities held by the Portfolio. Custodial fees are charged to the Portfolio based on the Portfolio's net assets and/or the market value of securities held by the Portfolio and the number of certain transactions incurred by the Portfolio.
Prior to February 22, 2021, these services were provided by State Street. The services provided by State Street were a direct expense of the Portfolio and are included in the Statement of Operations as Custodian fees which totaled $3,770 for the period January 1, 2021 through February 21, 2021.
Note 7–Line of Credit
The Portfolio and certain other funds managed by New York Life Investments maintain a line of credit with a syndicate of banks in order to secure a source of funds for temporary purposes to meet unanticipated or excessive redemption requests.
Effective July 27, 2021, under the credit agreement (the “Credit Agreement”), the aggregate commitment amount is $600,000,000 with an additional uncommitted amount of $100,000,000. The commitment fee is an annual rate of 0.15% of the average commitment amount payable quarterly, regardless of usage, to JPMorgan, who serves as the agent to the syndicate. The commitment fee is allocated among the Portfolio and certain other funds managed by New York Life Investments based upon their respective net assets and other factors. Interest on any revolving credit loan is charged based upon the Federal Funds Rate or the one-month London Interbank Offered Rate ("LIBOR"), whichever is higher. The Credit Agreement expires on July 26, 2022, although the Portfolio, certain other funds managed by New York Life Investments and the syndicate of banks may renew the Credit Agreement for an additional year on the same or different terms or enter into a credit agreement with a different syndicate of banks. Prior to July 27, 2021, the aggregate commitment amount and the commitment fee were the same as those under the current Credit Agreement. During the six-month period ended June 30, 2021, there were no borrowings made or outstanding with respect to the Portfolio under the Credit Agreement.
Note 8–Interfund Lending Program
Pursuant to an exemptive order issued by the SEC, the Portfolio, along with certain other funds managed by New York Life Investments, may participate in an interfund lending program. The interfund lending program provides an alternative credit facility that permits the Portfolio and certain other funds managed by New York Life Investments to lend or borrow money for temporary purposes directly to or from one another, subject to the conditions of the exemptive order. During the six-month period ended June 30, 2021, there were no interfund loans made or outstanding with respect to the Portfolio.
Note 9–Purchases and Sales of Securities (in 000’s)
During the six-month period ended June 30, 2021, purchases and sales of securities, other than short-term securities, were $523,877 and $534,765, respectively.
Note 10–Capital Share Transactions
Transactions in capital shares for the six-month period ended June 30, 2021 and the year ended December 31, 2020, were as follows:
| Initial Class | Shares | Amount |
| Period ended June 30, 2021: | | |
| Shares sold | 1,288,740 | $ 43,567,551 |
| Shares redeemed | (1,585,093) | (54,364,365) |
| Net increase (decrease) | (296,353) | $ (10,796,814) |
| Year ended December 31, 2020: | | |
| Shares sold | 1,607,424 | $ 47,202,241 |
| Shares issued to shareholders in reinvestment of distributions | 1,053,301 | 32,083,765 |
| Shares redeemed | (3,506,165) | (99,452,086) |
| Net increase (decrease) | (845,440) | $ (20,166,080) |
| |
| Service Class | Shares | Amount |
| Period ended June 30, 2021: | | |
| Shares sold | 1,384,321 | $ 43,472,776 |
| Shares redeemed | (1,314,554) | (42,040,992) |
| Net increase (decrease) | 69,767 | $ 1,431,784 |
| Year ended December 31, 2020: | | |
| Shares sold | 5,983,502 | $ 158,372,400 |
| Shares issued to shareholders in reinvestment of distributions | 2,382,965 | 68,003,617 |
| Shares redeemed | (7,019,980) | (183,254,067) |
| Net increase (decrease) | 1,346,487 | $ 43,121,950 |
Note 11–Other Matters
An outbreak of COVID-19, first detected in December 2019, has developed into a global pandemic and has resulted in travel restrictions, closure of international borders, certain businesses and securities markets, restrictions on securities trading activities, prolonged quarantines, supply chain disruptions, and lower consumer demand, as well as general concern and uncertainty. The continued impact of COVID-19 and related new variants is uncertain and could further adversely affect the global economy, national economies, individual issuers and capital markets in unforeseeable ways and result in a substantial and extended economic downturn. Developments that disrupt global economies and financial markets, such as COVID-19, may magnify factors that affect the Portfolio's performance.
Notes to Financial Statements (Unaudited) (continued)
Note 12–Subsequent Events
In connection with the preparation of the financial statements of the Portfolio as of and for the six-month period ended June 30, 2021, events and transactions subsequent to June 30, 2021, through the date the financial statements were issued have been evaluated by the Manager for possible adjustment and/or disclosure. No subsequent events requiring financial statement adjustment or disclosure have been identified.
| 22 | MainStay VP Winslow Large Cap Growth Portfolio |
Discussion of the Operation and Effectiveness of the Portfolio's Liquidity Risk Management Program (Unaudited)
In compliance with Rule 22e-4 under the Investment Company Act of 1940, as amended (the “Liquidity Rule”), the Portfolio has adopted and implemented a liquidity risk management program (the “Program”), which New York Life Investment Management LLC believes is reasonably designed to assess and manage the Portfolio's liquidity risk (the risk that the Portfolio could not meet requests to redeem shares issued by the Portfolio without significant dilution of remaining investors’ interests in the Portfolio). The Board of Trustees of MainStay VP Funds Trust (the "Board") designated New York Life Investment Management LLC as administrator of the Program (the “Administrator”). The Administrator has established a Liquidity Risk Management Committee to assist the Administrator in the implementation and day-to-day administration of the Program and to otherwise support the Administrator in fulfilling its responsibilities under the Program.
At a meeting of the Board held on March 8, 2021, the Administrator provided the Board with a written report addressing the Program’s operation and assessing its adequacy and effectiveness of implementation for the period from January 1, 2020 through December 31, 2020 (the "Review Period"), as required under the Liquidity Rule. The report noted that the Administrator concluded that (i) the Program operated effectively to assess and manage the Portfolio's liquidity risk, (ii) the Program has been adequately and effectively implemented to monitor and, as applicable, respond to the Portfolio's liquidity developments and (iii) the Portfolio's investment strategy continues to be appropriate for an open-end fund. In addition, the report discussed notable events that impacted liquidity risk during the Review Period, including the COVID-19 pandemic and the resulting economic shutdown.
In accordance with the Program, the Portfolio's liquidity risk is assessed no less frequently than annually taking into consideration certain factors, as applicable, such as (i) investment strategy and liquidity of portfolio investments, (ii) short-term and long-term cash flow projections and (iii) holdings of cash and cash equivalents, as well as borrowing arrangements and other funding sources. Certain factors are considered under both normal and reasonably foreseeable stressed conditions.
Each Portfolio portfolio investment is classified into one of four liquidity categories. The classification is based on a determination of the number of days it is reasonably expected to take to convert the investment into cash, or sell or dispose of the investment, in current market conditions without significantly changing the market value of the investment. The Administrator has delegated liquidity classification determinations to the Portfolio’s subadvisor, subject to appropriate oversight by the Administrator, and classification determinations are made by taking into account the Portfolio's reasonably anticipated trade size, various market, trading and investment-specific considerations, as well as market depth, and, in certain cases, third-party vendor data.
The Liquidity Rule requires portfolios that do not primarily hold assets that are highly liquid investments to adopt a minimum amount of net assets that must be invested in highly liquid investments that are assets (an “HLIM”). In addition, the Liquidity Rule limits a portfolio's investments in illiquid investments. Specifically, the Liquidity Rule prohibits acquisition of illiquid investments if doing so would result in a portfolio holding more than 15% of its net assets in illiquid investments that are assets. The Program includes provisions reasonably designed to determine, periodically review and comply with the HLIM requirement, as applicable, and to comply with the 15% limit on illiquid investments.
There can be no assurance that the Program will achieve its objectives under all circumstances in the future. Please refer to the Portfolio's prospectus for more information regarding the Portfolio's exposure to liquidity risk and other risks to which it may be subject.
Proxy Voting Record
The Portfolio is required to file with the SEC its proxy voting records for the 12-month period ending June 30 on Form N-PX. The Portfolio's most recent Form N-PX or proxy voting record is available free of charge upon request (i) by calling 800-598-2019; (ii) by visiting New York Life Investments’ website at https://www.nylinvestments.com/mainstay/
products-and-performance/mainstay-vp-funds-trust; or (iii) by visiting the SEC’s website at www.sec.gov.
Shareholder Reports and Quarterly Portfolio Disclosure
The Portfolio is required to file its complete schedule of portfolio holdings with the SEC 60 days after its first and third fiscal quarter on Form N-PORT. The Portfolio's holdings report is available free of charge upon request by calling 800-598-2019 or by visiting the SEC’s website at www.sec.gov.
| 24 | MainStay VP Winslow Large Cap Growth Portfolio |
This page intentionally left blank
This page intentionally left blank.
MainStay VP Portfolios
MainStay VP offers a wide range of Portfolios. The full array of MainStay VP offerings is listed here, with information about the manager, subadvisors, legal counsel, and independent registered public accounting firm.
Equity
MainStay VP Candriam Emerging Markets Equity Portfolio
MainStay VP Epoch U.S. Equity Yield Portfolio
MainStay VP Fidelity Institutional AM® Utilities Portfolio†
MainStay VP MacKay International Equity Portfolio
MainStay VP MacKay S&P 500 Index Portfolio
MainStay VP Natural Resources Portfolio
MainStay VP Small Cap Growth Portfolio
MainStay VP T. Rowe Price Equity Income Portfolio
MainStay VP Wellington Growth Portfolio
MainStay VP Wellington Mid Cap Portfolio
MainStay VP Wellington Small Cap Portfolio
MainStay VP Wellington U.S. Equity Portfolio
MainStay VP Winslow Large Cap Growth Portfolio
Mixed Asset
MainStay VP Balanced Portfolio
MainStay VP Income Builder Portfolio
MainStay VP Janus Henderson Balanced Portfolio
MainStay VP MacKay Convertible Portfolio
Income
MainStay VP Bond Portfolio
MainStay VP Floating Rate Portfolio
MainStay VP Indexed Bond Portfolio
MainStay VP MacKay Government Portfolio
MainStay VP MacKay High Yield Corporate Bond Portfolio
MainStay VP MacKay Strategic Bond Portfolio
MainStay VP PIMCO Real Return Portfolio
Money Market
MainStay VP U.S. Government Money Market Portfolio
Alternative
MainStay VP CBRE Global Infrastructure Portfolio
MainStay VP IQ Hedge Multi-Strategy Portfolio
Asset Allocation
MainStay VP Conservative Allocation Portfolio
MainStay VP Equity Allocation Portfolio
MainStay VP Growth Allocation Portfolio
MainStay VP Moderate Allocation Portfolio
Manager
New York Life Investment Management LLC
New York, New York
Subadvisors
Brown Advisory LLC
Baltimore, Maryland
Candriam Belgium S.A.*
Brussels, Belgium
CBRE Clarion Securities LLC
Radnor, Pennsylvania
Epoch Investment Partners, Inc.
New York, New York
FIAM LLC
Smithfield, Rhode Island
IndexIQ Advisors LLC*
New York, New York
Janus Capital Management LLC
Denver, Colorado
MacKay Shields LLC*
New York, New York
Mellon Investments Corporation
Boston, Massachusetts
NYL Investors LLC*
New York, New York
Pacific Investment Management Company LLC
Newport Beach, California
Segall Bryant & Hamill, LLC
Chicago, Illinois
T. Rowe Price Associates, Inc.
Baltimore, Maryland
Wellington Management Company LLP
Boston, Massachusetts
Winslow Capital Management, LLC
Minneapolis, Minnesota
Legal Counsel
Dechert LLP
Washington, District of Columbia
Independent Registered Public Accounting Firm
PricewaterhouseCoopers LLP
New York, New York
Distributor
NYLIFE Distributors LLC*
Jersey City, New Jersey
Custodian
JPMorgan Chase Bank, N.A.
New York, New York
Some Portfolios may not be available in all products.
† Fidelity Institutional AM is a registered trade mark of FMR LLC. Used with permission.
* An affiliate of New York Life Investment Management LLC
Not part of the Semiannual Report
2021 Semiannual Report
This report is for the general information of New York Life Variable Annuities and NYLIAC Variable Universal Life Insurance Products policyowners. It must be preceded or accompanied by the appropriate product(s) and funds prospectuses if it is given to anyone who is not an owner of a New York Life variable annuity policy or a NYLIAC Variable Universal Life Insurance Product. This report does not offer for sale or solicit orders to purchase securities.
The performance data quoted in this report represents past performance. Past performance is no guarantee of future results. Due to market volatility and other factors, current performance may be lower or higher than the figures shown. The most recent month-end performance summary for your variable annuity or variable life policy is available by calling 800-598-2019 and is updated periodically on newyorklife.com.
The New York Life Variable Annuities and NYLIAC Variable Universal Life Insurance Products are issued by New York Life Insurance and Annuity Corporation (a Delaware Corporation) and distributed by NYLIFE Distributors LLC (Member FINRA/SIPC).
New York Life Insurance Company
New York Life Insurance and Annuity
Corporation (NYLIAC) (A Delaware Corporation)
51 Madison Avenue, Room 551
New York, NY 10010
newyorklife.com
nylinvestments.com
NYLIFE Distributors LLC, 30 Hudson Street, Jersey City, NJ 07302
New York Life Investment Management LLC is the investment manager to the MainStay VP Funds Trust
©2021 by NYLIFE Distributors LLC. All rights reserved.
You may obtain copies of the Prospectus and the Statement of Additional Information free of charge, upon request, by calling toll-free 800-598-2019 or writing to New York Life Insurance and Annuity Corporation, 51 Madison Avenue, New York, NY 10010.
| Not FDIC Insured | No Bank Guarantee | May Lose Value |
(NYLIAC) NI525
MainStay VP Wellington Mid Cap Portfolio
(formerly known as MainStay VP MacKay Mid Cap Core Portfolio)
Message from the President and Semiannual Report
Unaudited | June 30, 2021
Sign up for e-delivery of your shareholder reports. For full details on e-delivery, including who can participate and what you can receive via e-delivery,
please log in to newyorklifeinvestments.com/accounts.
| Not FDIC/NCUA Insured | Not a Deposit | May Lose Value | No Bank Guarantee | Not Insured by Any Government Agency |
This page intentionally left blank
Message from the President
The COVID-19 pandemic continued to afflict our personal lives and broad segments of the U.S. and global economy throughout the six-month reporting period ended June 30, 2021. However, with the deployment of multiple vaccines around the world, including three highly effective versions approved for emergency use in the United States, investors began to turn their attention toward the gradual reopening of the economy and the shape the “new normal” would take.
The first half of the reporting period saw increasing inflationary concerns as fiscal stimulus business reopenings drove accelerating economic growth, rising commodity prices and increased consumer spending. However, the U.S. Federal Reserve noted that price increases were likely to prove temporary and made clear their intention to remain accommodative for the foreseeable future. Accordingly, after moving higher in the first quarter of 2021, interest rates declined in the second quarter.
In response to the uncertain inflation outlook, equity market leadership shifted from value in the first quarter of the year to growth in the second quarter. Nevertheless, investor sentiment remained buoyant throughout the reporting period, with all eleven sectors in the S&P 500® Index, a widely regarded benchmark of market performance, producing positive returns. Energy led the market’s rise fueled by rapidly increasing oil and gas prices, followed by financials and real estate, which benefited from rising interest rates and the economic reopening, respectively. Communication services produced the slowest growth, followed by the traditionally defensive utilities and consumer staples
sectors. In the fixed income market, lower-credit-quality issues tended to outperform their higher-grade counterparts, with high-yield corporate bonds generating the strongest performance. Among securitized products, commercial mortgage-backed securities generally produced the strongest returns, followed by mortgage-backed securities and asset-backed securities, while Treasury securities lagged.
Despite the tremendous progress we’ve seen so far this year, the United States and the world continue to face significant pandemic-related challenges. Newer, more contagious variants of COVID-19 threaten the return of restrictions and lockdowns that could stall the economic recovery. At the same time, supply chain shortages have led to rising prices on everything from laptops to autos, stoking fears of uncontrolled inflation despite reassurance from the U.S. Federal Reserve. At New York Life Investments, we recognize that the shape that the “new normal” eventually takes may differ from our expectations. You can depend on us to keep a sharp watch for the unexpected, and to continue to help you find your way through this rapidly evolving investment landscape.
Sincerely,
Kirk C. Lehneis
President
The opinions expressed are as of the date of this report and are subject to change. There is no guarantee that any forecast made will come to pass. This material does not constitute investment advice and is not intended as an endorsement of any specific investment. Past performance is no guarantee of future results.
Not part of the Semiannual Report
Investors should refer to the Portfolio’s Summary Prospectus and/or Prospectus and consider the Portfolio’s investment objectives, strategies, risks, charges and expenses carefully before investing. The Summary Prospectus and/or Prospectus contain this and other information about the Portfolio. You may obtain copies of the Portfolio’s Summary Prospectus and/or the Prospectus and the Statement of Additional Information free of charge, upon request, by calling toll-free 800-598-2019, by writing to New York Life Insurance and Annuity Corporation, 51 Madison Avenue, Room 251, New York, New York 10010 or by sending an email to MainStayShareholdersServices@nylim.com. These documents are also available at nylinvestments.com/vpdocuments. Please read the Portfolio's Summary Prospectus and/or Prospectus carefully before investing. MainStay VP Funds Trust portfolios are separate account options which are purchased through a variable insurance or variable annuity contract.
Investment and Performance Comparison (Unaudited)
Performance data quoted represents past performance. Past performance is no guarantee of future results. Because of market volatility and other factors, current performance may be lower or higher than the figures shown. Investment return and principal value will fluctuate, and as a result, when shares are redeemed, they may be worth more or less than their original cost. The performance table and graph do not reflect any deduction of sales charges, mortality and expense charges, contract charges or administrative charges. Please refer to the Performance Summary appropriate for your policy. For performance information current to the most recent month-end, please call 800-598-2019 or visit www.newyorklife.com.
Performance figures may reflect certain fee waivers and/or expense limitations, without which total returns may have been different. For information on current fee waivers and/or expense limitations (if any), please refer to the Notes to Financial Statements.
| Average Annual Total Returns for the Period-Ended June 30, 2021 |
| Class | Inception
Date1, 2 | Six
Months | One
Year | Five
Years | Ten
Years | Gross
Expense
Ratio3 |
| Initial Class Shares | 7/2/2001 | 16.04% | 46.81% | 12.50% | 11.85% | 0.89% |
| Service Class Shares | 6/5/2003 | 15.90 | 46.44 | 12.22 | 11.57 | 1.14 |
| 1. | Effective January 1, 2018, due to an organizational restructuring whereby all investment personnel of Cornerstone Capital Management Holdings LLC, the former subadvisor, transitioned to MacKay Shields LLC. |
| 2. | Effective May 1, 2021, the Portfolio replaced its subadvisor and modified its principal investment strategies. The past performance in the chart and table prior to that date reflects the Portfolio’s prior subadvisor and principal investment strategies. |
| 3. | The gross expense ratios presented reflect the Portfolio’s “Total Annual Portfolio Operating Expenses” from the most recent Prospectus, as supplemented, and may differ from other expense ratios disclosed in this report. |
| Benchmark Performance | Six
Months | One
Year | Five
Years | Ten
Years |
| Russell Midcap® Index1 | 16.25% | 49.80% | 15.62% | 13.24% |
| S&P MidCap 400® Index2 | 17.59 | 53.24 | 14.29 | 12.40 |
| Morningstar Mid-Cap Blend Category Average3 | 17.00 | 50.12 | 13.42 | 10.72 |
| 1. | The Russell Midcap® Index is the Portfolio's primary benchmark. The Russell Midcap® Index measures the performance of the mid-cap segment of the U.S. equity universe. The Russell Midcap® Index is a subset of the Russell 1000® Index and it includes approximately 800 of the smallest securities based on a combination of their market cap and current index membership. The Russell Midcap® Index represents approximately 31% of the total market capitalization of the Russell 1000® Index companies. Results assume reinvestment of all dividends and capital gains. An investment cannot be made directly in an index. |
| 2. | The Portfolio has selected the S&P MidCap 400® Index as its secondary benchmark. The S&P MidCap 400® Index is a market capitalization weighted index of common stocks representing the mid-cap U.S. equity market. |
| 3. | The Morningstar Mid-Cap Blend Category Average is representative of funds that invest primarily in U.S. stocks of various sizes and styles, giving it a middle-of-the-road profile. The U.S. mid-cap range for market capitalization typically falls between $1 billion and $8 billion and represents 20% of the total capitalization of the U.S. equity market. The blend style is assigned to funds where neither growth nor value characteristics predominate. Results are based on average total returns of similar funds with all dividends and capital gain distributions reinvested. |
Cost in Dollars of a $1,000 Investment in MainStay VP Wellington Mid Cap Portfolio (Unaudited)
The example below is intended to describe the fees and expenses borne by shareholders during the six-month period from January 1, 2021 to June 30, 2021, and the impact of those costs on your investment.
Example
As a shareholder of the Portfolio you incur two types of costs: (1) transaction costs, including exchange fees and sales charges (loads) on purchases (as applicable), and (2) ongoing costs, including management fees, distribution and/or service (12b-1) fees, and other Portfolio expenses (as applicable). This example is intended to help you understand your ongoing costs (in dollars) of investing in the Portfolio and to compare these costs with the ongoing costs of investing in other mutual funds. The example is based on an investment of $1,000 made at the beginning of the six-month period and held for the entire period from January 1, 2021 to June 30, 2021. Shares are only sold in connection with variable life and annuity contracts and the example does not reflect any contract level or transactional fees or expenses. If these costs had been included, your costs would have been higher.
This example illustrates your Portfolio’s ongoing costs in two ways:
Actual Expenses
The second and third data columns in the table below provide information about actual account values and actual expenses. You may use the information in these columns, together with the amount you invested, to estimate the expenses that you paid during the six months ended June
30, 2021. Simply divide your account value by $1,000 (for example, an $8,600 account value divided by $1,000 = 8.6), then multiply the result by the number under the heading entitled “Expenses Paid During Period” to estimate the expenses you paid on your account during this period.
Hypothetical Example for Comparison Purposes
The fourth and fifth data columns in the table below provide information about hypothetical account values and hypothetical expenses based on the Portfolio’s actual expense ratio and an assumed rate of return of 5% per year before expenses, which is not the Portfolio’s actual return. The hypothetical account values and expenses may not be used to estimate the actual ending account balances or expenses you paid for the six-month period shown. You may use this information to compare the ongoing costs of investing in the Portfolio with the ongoing costs of investing in other mutual funds. To do so, compare this 5% hypothetical example with the 5% hypothetical examples that appear in the shareholder reports of the other mutual funds.
Please note that the expenses shown in the table are meant to highlight your ongoing costs only and do not reflect any transactional costs, such as exchange fees or sales charges (loads). Therefore, the fourth and fifth data columns of the table are useful in comparing ongoing costs only and will not help you determine the relative total costs of owning different funds. In addition, if these transactional costs were included, your costs would have been higher.
| Share Class | Beginning
Account
Value
1/1/21 | Ending Account
Value (Based
on Actual
Returns and
Expenses)
6/30/21 | Expenses
Paid
During
Period1 | Ending Account
Value (Based
on Hypothetical
5% Annualized
Return and
Actual Expenses)
6/30/21 | Expenses
Paid
During
Period1 | Net Expense
Ratio
During
Period2 |
| Initial Class Shares | $1,000.00 | $1,160.40 | $4.61 | $1,020.53 | $4.31 | 0.86% |
| Service Class Shares | $1,000.00 | $1,159.00 | $5.94 | $1,019.29 | $5.56 | 1.11% |
| 1. | Expenses are equal to the Portfolio’s annualized expense ratio of each class multiplied by the average account value over the period, divided by 365 and multiplied by 181 (to reflect the six-month period). The table above represents the actual expenses incurred during the six-month period. In addition to the fees and expenses which the Portfolio bears directly, it also indirectly bears a pro rata share of the fees and expenses of the underlying funds in which it invests. Such indirect expenses are not included in the above-reported expense figures. |
| 2. | Expenses are equal to the Portfolio's annualized expense ratio to reflect the six-month period. |
| 6 | MainStay VP Wellington Mid Cap Portfolio |
Industry Composition as of June 30, 2021 (Unaudited)
| Machinery | 8.4% |
| Banks | 6.1 |
| Insurance | 5.8 |
| Equity Real Estate Investment Trusts | 5.7 |
| Communications Equipment | 5.5 |
| Electronic Equipment, Instruments & Components | 5.1 |
| Health Care Providers & Services | 4.8 |
| Biotechnology | 4.5 |
| IT Services | 4.4 |
| Semiconductors & Semiconductor Equipment | 4.2 |
| Health Care Equipment & Supplies | 4.0 |
| Textiles, Apparel & Luxury Goods | 3.6 |
| Software | 2.9 |
| Hotels, Restaurants & Leisure | 2.9 |
| Commercial Services & Supplies | 2.8 |
| Chemicals | 2.1 |
| Life Sciences Tools & Services | 1.9 |
| Road & Rail | 1.9 |
| Professional Services | 1.8 |
| Building Products | 1.7 |
| Pharmaceuticals | 1.7 |
| Food & Staples Retailing | 1.5 |
| Internet & Direct Marketing Retail | 1.4 |
| Household Durables | 1.3% |
| Leisure Products | 1.3 |
| Trading Companies & Distributors | 1.2 |
| Gas Utilities | 1.2 |
| Consumer Finance | 1.1 |
| Media | 1.0 |
| Food Products | 0.9 |
| Diversified Financial Services | 0.9 |
| Entertainment | 0.8 |
| Oil, Gas & Consumable Fuels | 0.8 |
| Multi–Utilities | 0.7 |
| Containers & Packaging | 0.7 |
| Specialty Retail | 0.7 |
| Real Estate Management & Development | 0.6 |
| Electric Utilities | 0.5 |
| Interactive Media & Services | 0.4 |
| Metals & Mining | 0.4 |
| Capital Markets | 0.3 |
| Short–Term Investments | 1.8 |
| Other Assets, Less Liabilities | –1.3 |
| | 100.0% |
See Portfolio of Investments beginning on page 11 for specific holdings within these categories. The Portfolio's holdings are subject to change.
Top Ten Holdings as of June 30, 2021 (excluding short-term investments) (Unaudited)
| 1. | F5 Networks, Inc. |
| 2. | Ingersoll Rand, Inc. |
| 3. | MKS Instruments, Inc. |
| 4. | Lumentum Holdings, Inc. |
| 5. | II-VI, Inc. |
| 6. | Molina Healthcare, Inc. |
| 7. | Genpact Ltd. |
| 8. | WEX, Inc. |
| 9. | CommScope Holding Co., Inc. |
| 10. | Encompass Health Corp. |
Portfolio Management Discussion and Analysis (Unaudited)
Answers to the questions reflect the views of portfolio managers Migene Kim, CFA, and Mona Patni of MacKay Shields LLC (“MacKay Shields”), the Portfolio’s former Subadvisor, and Gregory J. Garabedian, Mark A. Whitaker, and Philip W. Ruedi of Wellington Management Company LLP (“Wellington”), the Portfolio's current Subadvisor.
How did MainStay VP Wellington Mid Cap Portfolio perform relative to its benchmarks and peers during the six months ended June 30, 2021?
For the six months ended June 30, 2021, MainStay VP Wellington Mid Cap Portfolio returned 16.04% for Initial Class shares and 15.90% for Service Class shares. Over the same period, both share classes underperformed the 16.25% return of the Russell Midcap® Index, which is the Portfolio’s primary benchmark, and the 17.59% return of the S&P MidCap 400® Index, which is the Portfolio’s secondary benchmark. For the six months ended June 30, 2021, both share classes underperformed the 17.00% return of the Morningstar Mid-Cap Blend Category Average.1
Were there any changes to the Fund during the reporting period?
At meetings held on January 21, January 25 and February 3, 2021, the Board of Trustees of MainStay VP Funds Trust considered and approved, among other related proposals: (i) appointing Wellington Management Company LLP as the Portfolio’s subadvisor, and the related subadvisory agreement; (ii) changing the Portfolio’s name; and (iii) modifying the Portfolio’s principal investment strategies and investment process. For more information on these and other changes refer to the supplement dated February 5, 2021.
In the process of implementing the new principal investment strategies and investment process, the Portfolio may have experienced a high level of portfolio turnover. Also during this transition period, the Portfolio may not have been pursuing its investment objective or may not have been managed consistent with its investment strategies as stated in the Prospectus. This may have impacted the Portfolio’s performance.
What factors affected the Portfolio’s relative performance during the reporting period?
MacKay Shields
During the time MacKay Shields managed the Portfolio, the Portfolio significantly outperformed the Russell Midcap® Index, helped by robust stock selection, with no sectors detracting from the relative performance. In terms of stock-selection model efficacy, the combination of signals used by the quantitative stock selection model was primarily rewarded by valuation measures.
Wellington
During the time Wellington managed the Portfolio, the Portfolio underperformed the Russell Midcap® Index primarily due to security selection, particularly in the health care and information technology sectors.
Which sectors were the strongest positive contributors to the Portfolio’s relative performance, and which sectors were particularly weak?
MacKay Shields
During the time MacKay Shields managed the Portfolio, the strongest positive contributors to the Portfolio’s performance relative to the Russell Midcap® Index were the information technology, consumer discretionary and industrials sectors. (Contributions take weightings and total returns into account.) During the same period, the weakest contributor to relative performance was the energy sector.
Wellington
Under Wellington’s management, the Portfolio employs two investment strategies with different investment styles: mid-cap opportunities and select mid-cap value. Each of these investment strategies has a distinct investment philosophy and analytical process to identify securities for purchase or sale.
During the time Wellington managed the Portfolio, the mid-cap opportunities strategy outperformed its benchmark, the S&P MidCap 400® Index, due primarily to security selection and, to a lesser extent, sector allocation. Security selection in information technology, consumer discretionary and financials made the strongest positive contributions to relative performance. Relatively weak relative contributions to performance came from security selection in the health care, real estate and consumer staples sectors. From a sector allocation perspective, the strongest contributions to relative performance came from the Portfolio’s overweight positions in information technology and health care, and its underweight position in consumer discretionary. The most significant detractors to relative performance from a sector allocation perspective came from the Portfolio’s underweight positions in energy, real estate and materials.
During the same period, the Portfolio’s select mid-cap value strategy underperformed the Russell 2500™ Value Index, the yardstick by which Wellington measures this strategy. Security selection in financials, industrials and materials sectors detracted most from relative performance. From a sector allocation perspective, the Portfolio’s lack of exposure to communication services and underweight exposure to energy weighed on relative results. These detractors were partially offset by the positive effect of the Portfolio’s underweight exposure to the consumer discretionary sector.
For the Portfolio as a whole, during the time it was managed by Wellington, security selection in the health care and information technology sectors detracted most from performance relative to the Russell Midcap® Index. This was partially offset by positive contributions to relative performance from the utilities sector.
| 1. | See page 5 for more information on benchmark and peer group returns. |
| 8 | MainStay VP Wellington Mid Cap Portfolio |
During the reporting period, which individual stocks made the strongest positive contributions to the Portfolio’s absolute performance and which stocks detracted the most?
MacKay Shields
The stocks providing the strongest positive contributions to the Portfolio’s absolute performance during the time MacKay Shields managed the Portfolio included regional banking firm Signature Bank; apparel retailer L Brands; and technology hardware, storage & peripherals maker HP. During the same period, the most significant detractors from absolute performance were shares in leisure products maker Peloton Interactive, online music streaming service Spotify Technology, and interactive home entertainment company Take-Two Interactive Software.
Wellington
The strongest positive contributors to absolute performance during the time Wellington managed the Portfolio were holdings in communications equipment and technology company CommScope, biopharmaceutical developer Reata Pharmaceutical, and solar panel manufacturer First Solar. CommScope shares rose after the company announced plans to spin off its Home Networks business as part of a strategy to reduce operating costs, a move investors viewed favorably. Shares rose further after the company reported first-quarter 2021 results that exceeded consensus revenue and EPS (earnings-per-share estimates), driven by strong growth in the company’s broadband networks segment. Shares of Reata rose after the company announced that the Food and Drug Administration had suggested a pre-NDA (new drug application) meeting regarding Reata’s drug for the treatment of Friedreich’s ataxia, omaveloxolone. Shares of First Solar rose after the company announced it would invest $680 million to fund construction of its third U.S. manufacturing facility. In addition, the Biden administration banned silicon imports used in the manufacturing of solar panels from a Chinese producer.
The most significant detractors from the Portfolio’s absolute performance were holdings in biopharmaceutical companies ChemoCentryx and Sage Therapeutics, and food distributor Performance Food Group. Shares of ChemoCentryx fell sharply after the U.S. Food and Drug Administration (FDA) Arthritis Advisory Committee split on its recommendation for the company’s new drug application for avacopan, a candidate for the treatment of anti-neutrophil cytoplasmic autoantibody-associated vasculitis. While the panel narrowly supported a positive recommendation on safety and risk-benefit grounds, panelists were evenly divided on whether the drug’s efficacy data supported approval. The close vote prompted concern about the drug’s prospects before the FDA. Shares of Sage Therapeutics declined after the company reported first-quarter 2021 revenue below expectations. Shares of Performance Food Group fell in the second quarter of 2021 after posting quarterly results that missed adjusted EPS expectations.
Did the Portfolio make any significant purchases or sales during the reporting period?
MacKay Shields
The Portfolio’s largest initial purchase during the time MacKay Shields managed the Portfolio was in shares of petroleum refining and transport company Marathon Petroleum, while its largest increase in position size was in information technology services provider Gartner. The Portfolio's largest sale was its position in biotechnology developer Alexion Pharmaceuticals, while its most significantly decreased position size was in cloud services provider Akamai Technologies.
Wellington
During the time Wellington managed the Portfolio, we initiated a position in Mirati Therapeutics, a clinical-stage oncology biotechnology company. During the same period, Wellington eliminated the Portfolio’s position in ChemoCentryx over concerns of turnover at the FDA. Additionally, the Portfolio’s position in Lennar, a U.S. homebuilder, was eliminated on strong performance as well as broad trends in the housing market.
How did the Portfolio’s sector weightings change during the reporting period?
MacKay Shields
During the time MacKay Shields managed the Portfolio, the largest increases in sector exposures relative to the Russell Midcap® Index were in the financials and industrials sectors. Conversely, the Portfolio's largest decreases in benchmark-relative sector exposures were in the information technology and consumer discretionary sectors.
Wellington
During the time Wellington managed the Portfolio, the most notable increases in absolute sector exposures through the mid-cap opportunities strategy were to industrials and financials, while the most notable reductions were to real estate and information technology. The most notable increases in absolute sector exposure through the select mid-cap value strategy were to industrials and energy, while the most significant reductions were to consumer discretionary and financials.
How was the Portfolio positioned at the end of the reporting period?
MacKay Shields
At the end of the period when MacKay managed the Portfolio, the Portfolio held its largest overweight positions relative to the Russell Midcap® Index in the health care and consumer discretionary sectors. As of the same date, the Portfolio’s most significantly underweight sector positions were in materials and real estate.
Wellington
As of June 30, 2021, the Portfolio’s mid-cap opportunities
strategy had its most overweight exposures relative to the S&P MidCap 400® Index to the information technology and health care sectors, while its most underweight exposures were to materials and financials. Relative to the Russell Midcap® Index, the Portfolio has its most overweight exposures to health care and information technology, while its most underweight exposures were to energy and communication services. As of the same date, the Portfolio’s select mid-cap value strategy had its most overweight exposures relative to the Russell 2500™ Value Index to industrials and financials, while its most underweight exposures were to real estate and utilities.
The opinions expressed are those of the portfolio managers as of the date of this report and are subject to change. There is no guarantee that any forecasts will come to pass. This material does not constitute investment advice and is not intended as an endorsement of any specific investment.
Not all MainStay VP Portfolios and/or share classes are available under all policies.
| 10 | MainStay VP Wellington Mid Cap Portfolio |
Portfolio of Investments June 30, 2021† (Unaudited)
| | Shares | Value |
| Common Stocks 99.5% |
| Banks 6.1% |
| Cullen | 52,389 | $ 5,867,568 |
| First Citizens BancShares, Inc., Class A (a) | 9,804 | 8,164,183 |
| First Republic Bank | 42,008 | 7,862,638 |
| M&T Bank Corp. | 49,026 | 7,123,968 |
| Prosperity Bancshares, Inc. | 73,641 | 5,287,424 |
| South State Corp. | 40,641 | 3,322,808 |
| Western Alliance Bancorp | 104,132 | 9,668,656 |
| Zions Bancorp NA | 178,969 | 9,460,301 |
| | | 56,757,546 |
| Biotechnology 4.5% |
| Allakos, Inc. (b) | 51,766 | 4,419,264 |
| Apellis Pharmaceuticals, Inc. (b) | 129,058 | 8,156,466 |
| Arena Pharmaceuticals, Inc. (b) | 75,749 | 5,166,082 |
| Iovance Biotherapeutics, Inc. (b) | 197,316 | 5,134,162 |
| Kodiak Sciences, Inc. (b) | 47,499 | 4,417,407 |
| Mirati Therapeutics, Inc. (b) | 21,463 | 3,466,918 |
| PTC Therapeutics, Inc. (b) | 136,411 | 5,766,093 |
| Sage Therapeutics, Inc. (b) | 95,267 | 5,412,118 |
| | | 41,938,510 |
| Building Products 1.7% |
| Jeld-Wen Holding, Inc. (b) | 199,392 | 5,236,034 |
| Lennox International, Inc. | 30,739 | 10,783,241 |
| | | 16,019,275 |
| Capital Markets 0.3% |
| Hamilton Lane, Inc., Class A | 35,848 | 3,266,470 |
| Chemicals 2.1% |
| Celanese Corp. | 45,768 | 6,938,429 |
| Element Solutions, Inc. | 321,126 | 7,507,926 |
| FMC Corp. | 43,346 | 4,690,037 |
| | | 19,136,392 |
| Commercial Services & Supplies 2.8% |
| Clean Harbors, Inc. (b) | 82,200 | 7,656,108 |
| GFL Environmental, Inc. | 234,843 | 7,496,189 |
| IAA, Inc. (b) | 113,239 | 6,176,055 |
| KAR Auction Services, Inc. (b) | 247,944 | 4,351,417 |
| | | 25,679,769 |
| Communications Equipment 5.5% |
| CommScope Holding Co., Inc. (b) | 609,779 | 12,994,390 |
| F5 Networks, Inc. (b) | 110,540 | 20,633,396 |
| Lumentum Holdings, Inc. (b) | 213,852 | 17,542,280 |
| | | 51,170,066 |
| | Shares | Value |
| |
| Consumer Finance 1.1% |
| Credit Acceptance Corp. (a)(b) | 21,904 | $ 9,946,825 |
| Containers & Packaging 0.7% |
| Packaging Corp. of America | 19,445 | 2,633,242 |
| Silgan Holdings, Inc. | 100,065 | 4,152,697 |
| | | 6,785,939 |
| Diversified Financial Services 0.9% |
| Voya Financial, Inc. | 129,300 | 7,951,950 |
| Electric Utilities 0.5% |
| Pinnacle West Capital Corp. | 53,426 | 4,379,329 |
| Electronic Equipment, Instruments & Components 5.1% |
| CDW Corp. | 47,764 | 8,341,982 |
| Coherent, Inc. (b) | 6,414 | 1,695,477 |
| Flex Ltd. (b) | 577,593 | 10,321,587 |
| II-VI, Inc. (b) | 214,209 | 15,549,431 |
| National Instruments Corp. | 116,899 | 4,942,490 |
| Rogers Corp. (b) | 29,510 | 5,925,608 |
| | | 46,776,575 |
| Entertainment 0.8% |
| Zynga, Inc., Class A (b) | 694,376 | 7,381,217 |
| Equity Real Estate Investment Trusts 5.7% |
| Douglas Emmett, Inc. | 93,247 | 3,134,964 |
| Equity Commonwealth | 97,632 | 2,557,959 |
| Gaming and Leisure Properties, Inc. | 160,500 | 7,435,965 |
| Life Storage, Inc. | 107,457 | 11,535,509 |
| PS Business Parks, Inc. | 15,800 | 2,339,664 |
| Rexford Industrial Realty, Inc. | 139,026 | 7,917,531 |
| Ryman Hospitality Properties, Inc. (b) | 102,093 | 8,061,263 |
| STORE Capital Corp. | 268,208 | 9,255,858 |
| | | 52,238,713 |
| Food & Staples Retailing 1.5% |
| Performance Food Group Co. (b) | 124,949 | 6,058,777 |
| US Foods Holding Corp. (b) | 192,700 | 7,391,972 |
| | | 13,450,749 |
| Food Products 0.9% |
| Lamb Weston Holdings, Inc. | 102,052 | 8,231,514 |
| Gas Utilities 1.2% |
| UGI Corp. | 240,181 | 11,122,782 |
The notes to the financial statements are an integral part of, and should be read in conjunction with, the financial statements.
11
Portfolio of Investments June 30, 2021† (Unaudited) (continued)
| | Shares | Value |
| Common Stocks (continued) |
| Health Care Equipment & Supplies 4.0% |
| Hill-Rom Holdings, Inc. | 102,080 | $ 11,595,267 |
| Integra LifeSciences Holdings Corp. (b) | 151,569 | 10,343,069 |
| NuVasive, Inc. (b) | 102,594 | 6,953,821 |
| Teleflex, Inc. | 19,608 | 7,878,298 |
| | | 36,770,455 |
| Health Care Providers & Services 4.8% |
| Acadia Healthcare Co., Inc. (b) | 83,900 | 5,264,725 |
| Amedisys, Inc. (b) | 21,215 | 5,196,190 |
| Encompass Health Corp. | 164,603 | 12,843,972 |
| LHC Group, Inc. (b) | 33,262 | 6,661,048 |
| Molina Healthcare, Inc. (b) | 56,752 | 14,361,661 |
| | | 44,327,596 |
| Hotels, Restaurants & Leisure 2.9% |
| Bloomin' Brands, Inc. (b) | 135,476 | 3,676,819 |
| Choice Hotels International, Inc. | 79,336 | 9,429,877 |
| Hyatt Hotels Corp., Class A (b) | 41,607 | 3,230,367 |
| Six Flags Entertainment Corp. (b) | 127,379 | 5,512,963 |
| Wyndham Hotels & Resorts, Inc. | 63,552 | 4,594,174 |
| | | 26,444,200 |
| Household Durables 1.3% |
| NVR, Inc. (b) | 2,375 | 11,811,587 |
| Insurance 5.8% |
| Alleghany Corp. (b) | 8,482 | 5,658,088 |
| Assurant, Inc. | 56,164 | 8,771,693 |
| CNO Financial Group, Inc. | 204,318 | 4,825,991 |
| Erie Indemnity Co., Class A | 11,206 | 2,166,680 |
| Fidelity National Financial, Inc. | 110,269 | 4,792,291 |
| Globe Life, Inc. | 42,921 | 4,088,225 |
| Hanover Insurance Group, Inc. (The) | 42,400 | 5,751,136 |
| Markel Corp. (b) | 7,277 | 8,635,689 |
| W R Berkley Corp. | 49,663 | 3,696,417 |
| White Mountains Insurance Group Ltd. | 4,400 | 5,051,332 |
| | | 53,437,542 |
| Interactive Media & Services 0.4% |
| Cargurus, Inc. (b) | 158,899 | 4,167,921 |
| Internet & Direct Marketing Retail 1.4% |
| Etsy, Inc. (b) | 62,338 | 12,831,654 |
| IT Services 4.4% |
| Black Knight, Inc. (b) | 34,800 | 2,713,704 |
| Genpact Ltd. | 315,387 | 14,328,031 |
| | Shares | Value |
| |
| IT Services (continued) |
| LiveRamp Holdings, Inc. (b) | 72,686 | $ 3,405,339 |
| Shift4 Payments, Inc., Class A (b) | 71,527 | 6,703,511 |
| WEX, Inc. (b) | 71,763 | 13,914,846 |
| | | 41,065,431 |
| Leisure Products 1.3% |
| YETI Holdings, Inc. (b) | 126,575 | 11,622,117 |
| Life Sciences Tools & Services 1.9% |
| ICON plc (a)(b) | 7,661 | 1,583,605 |
| PRA Health Sciences, Inc. (b) | 62,023 | 10,246,820 |
| Syneos Health, Inc. (b) | 67,049 | 6,000,215 |
| | | 17,830,640 |
| Machinery 8.4% |
| Colfax Corp. (b) | 175,017 | 8,017,529 |
| Graco, Inc. | 49,845 | 3,773,266 |
| IDEX Corp. | 49,601 | 10,914,700 |
| Ingersoll Rand, Inc. (b) | 417,948 | 20,400,042 |
| Kennametal, Inc. | 126,036 | 4,527,213 |
| Lincoln Electric Holdings, Inc. | 58,680 | 7,728,743 |
| Middleby Corp. (The) (b) | 57,605 | 9,980,642 |
| SPX FLOW, Inc. | 100,896 | 6,582,455 |
| Westinghouse Air Brake Technologies Corp. | 65,049 | 5,353,533 |
| | | 77,278,123 |
| Media 1.0% |
| Cable One, Inc. | 4,743 | 9,072,458 |
| Metals & Mining 0.4% |
| Steel Dynamics, Inc. | 56,718 | 3,380,393 |
| Multi-Utilities 0.7% |
| Black Hills Corp. | 65,552 | 4,302,178 |
| NiSource, Inc. | 106,100 | 2,599,450 |
| | | 6,901,628 |
| Oil, Gas & Consumable Fuels 0.8% |
| Cabot Oil & Gas Corp. | 40,890 | 713,939 |
| Diamondback Energy, Inc. | 70,192 | 6,590,327 |
| | | 7,304,266 |
| Pharmaceuticals 1.7% |
| Jazz Pharmaceuticals plc (b) | 43,485 | 7,724,675 |
| Reata Pharmaceuticals, Inc., Class A (a)(b) | 56,965 | 8,062,257 |
| | | 15,786,932 |
The notes to the financial statements are an integral part of, and should be read in conjunction with, the financial statements.
| 12 | MainStay VP Wellington Mid Cap Portfolio |
| | Shares | Value |
| Common Stocks (continued) |
| Professional Services 1.8% |
| Dun & Bradstreet Holdings, Inc. (b) | 188,086 | $ 4,019,398 |
| Leidos Holdings, Inc. | 61,919 | 6,260,011 |
| Science Applications International Corp. | 71,822 | 6,300,944 |
| | | 16,580,353 |
| Real Estate Management & Development 0.6% |
| Redfin Corp. (b) | 92,873 | 5,889,077 |
| Road & Rail 1.9% |
| AMERCO | 12,266 | 7,229,580 |
Knight-Swift Transportation
Holdings, Inc. | 228,014 | 10,365,517 |
| | | 17,595,097 |
| Semiconductors & Semiconductor Equipment 4.2% |
| First Solar, Inc. (b) | 141,489 | 12,806,170 |
| MKS Instruments, Inc. | 103,173 | 18,359,635 |
| Silicon Laboratories, Inc. (b) | 51,064 | 7,825,558 |
| | | 38,991,363 |
| Software 2.9% |
| Aspen Technology, Inc. (b) | 36,938 | 5,080,453 |
| Guidewire Software, Inc. (b) | 61,115 | 6,888,883 |
| Q2 Holdings, Inc. (b) | 60,492 | 6,205,269 |
| Teradata Corp. (b) | 167,931 | 8,391,512 |
| | | 26,566,117 |
| Specialty Retail 0.7% |
| CarMax, Inc. (b) | 48,970 | 6,324,476 |
| Textiles, Apparel & Luxury Goods 3.6% |
| Carter's, Inc. | 114,419 | 11,804,608 |
| PVH Corp. (b) | 92,873 | 9,992,206 |
| Steven Madden Ltd. | 137,824 | 6,031,178 |
| Under Armour, Inc., Class C (b) | 297,282 | 5,520,527 |
| | | 33,348,519 |
| | Shares | | Value |
| |
| Trading Companies & Distributors 1.2% |
| AerCap Holdings NV (b) | 121,542 | | $ 6,224,166 |
| Watsco, Inc. | 17,553 | | 5,031,392 |
| | | | 11,255,558 |
Total Common Stocks
(Cost $901,909,548) | | | 918,817,124 |
| Short-Term Investments 1.8% |
| Affiliated Investment Company 0.6% |
| MainStay U.S. Government Liquidity Fund, 0.01% (c) | 5,569,706 | | 5,569,706 |
| Unaffiliated Investment Company 1.2% |
| Wells Fargo Government Money Market Fund, 0.025% (c)(d) | 11,079,428 | | 11,079,428 |
Total Short-Term Investments
(Cost $16,649,134) | | | 16,649,134 |
Total Investments
(Cost $918,558,682) | 101.3% | | 935,466,258 |
| Other Assets, Less Liabilities | (1.3) | | (11,564,436) |
| Net Assets | 100.0% | | $ 923,901,822 |
| † | Percentages indicated are based on Portfolio net assets. |
| (a) | All or a portion of this security was held on loan. As of June 30, 2021, the aggregate market value of securities on loan was $13,032,535; the total market value of collateral held by the Portfolio was $13,334,610. The market value of the collateral held included non-cash collateral in the form of U.S. Treasury securities with a value of $2,255,182. The Portfolio received cash collateral with a value of $11,079,428. (See Note 2(H)) |
| (b) | Non-income producing security. |
| (c) | Current yield as of June 30, 2021. |
| (d) | Represents a security purchased with cash collateral received for securities on loan. |
The notes to the financial statements are an integral part of, and should be read in conjunction with, the financial statements.
13
Portfolio of Investments June 30, 2021† (Unaudited) (continued)
The following is a summary of the fair valuations according to the inputs used as of June 30, 2021, for valuing the Portfolio’s assets:
| Description | Quoted
Prices in
Active
Markets for
Identical
Assets
(Level 1) | | Significant
Other
Observable
Inputs
(Level 2) | | Significant
Unobservable
Inputs
(Level 3) | | Total |
| Asset Valuation Inputs | | | | | | | |
| Investments in Securities (a) | | | | | | | |
| Common Stocks | $ 918,817,124 | | $ — | | $ — | | $ 918,817,124 |
| Short-Term Investments | | | | | | | |
| Affiliated Investment Company | 5,569,706 | | — | | — | | 5,569,706 |
| Unaffiliated Investment Company | 11,079,428 | | — | | — | | 11,079,428 |
| Total Short-Term Investments | 16,649,134 | | — | | — | | 16,649,134 |
| Total Investments in Securities | $ 935,466,258 | | $ — | | $ — | | $ 935,466,258 |
| (a) | For a complete listing of investments and their industries, see the Portfolio of Investments. |
The notes to the financial statements are an integral part of, and should be read in conjunction with, the financial statements.
| 14 | MainStay VP Wellington Mid Cap Portfolio |
Statement of Assets and Liabilities as of June 30, 2021 (Unaudited)
| Assets |
Investment in unaffiliated securities, at value
(identified cost $912,988,976) including securities on loan of $13,032,535 | $929,896,552 |
Investment in affiliated investment companies, at value
(identified cost $5,569,706) | 5,569,706 |
| Receivables: | |
| Dividends | 512,359 |
| Securities lending | 3,044 |
| Other assets | 24,719 |
| Total assets | 936,006,380 |
| Liabilities |
| Cash collateral received for securities on loan | 11,079,428 |
| Payables: | |
| Manager (See Note 3) | 630,404 |
| Portfolio shares redeemed | 259,850 |
| NYLIFE Distributors (See Note 3) | 117,394 |
| Custodian | 17,482 |
| Total liabilities | 12,104,558 |
| Net assets | $923,901,822 |
| Composition of Net Assets |
| Shares of beneficial interest outstanding (par value of $.001 per share) unlimited number of shares authorized | $ 57,788 |
| Additional paid-in-capital | 592,537,183 |
| | 592,594,971 |
| Total distributable earnings (loss) | 331,306,851 |
| Net assets | $923,901,822 |
| Initial Class | |
| Net assets applicable to outstanding shares | $352,706,716 |
| Shares of beneficial interest outstanding | 21,774,281 |
| Net asset value per share outstanding | $ 16.20 |
| Service Class | |
| Net assets applicable to outstanding shares | $571,195,106 |
| Shares of beneficial interest outstanding | 36,013,482 |
| Net asset value per share outstanding | $ 15.86 |
The notes to the financial statements are an integral part of, and should be read in conjunction with, the financial statements.
15
Statement of Operations for the six months ended June 30, 2021 (Unaudited)
| Investment Income (Loss) |
| Income | |
| Dividends-unaffiliated | $ 4,292,863 |
| Securities lending | 12,479 |
| Dividends-affiliated | 102 |
| Interest | 95 |
| Other | 18 |
| Total income | 4,305,557 |
| Expenses | |
| Manager (See Note 3) | 3,904,262 |
| Distribution/Service—Service Class (See Note 3) | 710,788 |
| Professional fees | 54,177 |
| Shareholder communication | 42,283 |
| Custodian | 15,296 |
| Trustees | 9,236 |
| Miscellaneous | 12,288 |
| Total expenses before waiver/reimbursement | 4,748,330 |
| Expense waiver/reimbursement from Manager (See Note 3) | (87,346) |
| Net expenses | 4,660,984 |
| Net investment income (loss) | (355,427) |
| Realized and Unrealized Gain (Loss) |
| Net realized gain (loss) on unaffiliated investments | 304,360,560 |
| Net change in unrealized appreciation (depreciation) on unaffiliated investments | (166,660,586) |
| Net realized and unrealized gain (loss) | 137,699,974 |
| Net increase (decrease) in net assets resulting from operations | $ 137,344,547 |
The notes to the financial statements are an integral part of, and should be read in conjunction with, the financial statements.
| 16 | MainStay VP Wellington Mid Cap Portfolio |
Statements of Changes in Net Assets
for the six months ended June 30, 2021 (Unaudited) and the year ended December 31, 2020
| | 2021 | 2020 |
| Increase (Decrease) in Net Assets |
| Operations: | | |
| Net investment income (loss) | $ (355,427) | $ 4,171,226 |
| Net realized gain (loss) | 304,360,560 | 12,548,378 |
| Net change in unrealized appreciation (depreciation) | (166,660,586) | 78,527,857 |
| Net increase (decrease) in net assets resulting from operations | 137,344,547 | 95,247,461 |
| Distributions to shareholders: | | |
| Initial Class | — | (25,918,174) |
| Service Class | — | (38,008,170) |
| Total distributions to shareholders | — | (63,926,344) |
| Capital share transactions: | | |
| Net proceeds from sales of shares | 6,253,682 | 74,832,263 |
| Net asset value of shares issued to shareholder in reinvestment of distributions | — | 63,926,344 |
| Cost of shares redeemed | (117,931,283) | (186,530,560) |
| Increase (decrease) in net assets derived from capital share transactions | (111,677,601) | (47,771,953) |
| Net increase (decrease) in net assets | 25,666,946 | (16,450,836) |
| Net Assets |
| Beginning of period | 898,234,876 | 914,685,712 |
| End of period | $ 923,901,822 | $ 898,234,876 |
The notes to the financial statements are an integral part of, and should be read in conjunction with, the financial statements.
17
Financial Highlights selected per share data and ratios
| | Six months ended
June 30,
2021* | | Year Ended December 31, |
| Initial Class | 2020 | | 2019 | | 2018 | | 2017 | | 2016 |
| Net asset value at beginning of period | $ 13.96 | | $ 13.56 | | $ 11.94 | | $ 15.57 | | $ 13.37 | | $ 13.00 |
| Net investment income (loss) (a) | (0.01) | | 0.08 | | 0.11 | | 0.16 | | 0.12 | | 0.13 |
| Net realized and unrealized gain (loss) on investments | 2.25 | | 1.32 | | 2.54 | | (1.68) | | 2.42 | | 1.28 |
| Total from investment operations | 2.24 | | 1.40 | | 2.65 | | (1.52) | | 2.54 | | 1.41 |
| Less distributions: | | | | | | | | | | | |
| From net investment income | — | | (0.12) | | (0.16) | | (0.15) | | (0.16) | | (0.11) |
| From net realized gain on investments | — | | (0.88) | | (0.87) | | (1.96) | | (0.18) | | (0.93) |
| Total distributions | — | | (1.00) | | (1.03) | | (2.11) | | (0.34) | | (1.04) |
| Net asset value at end of period | $ 16.20 | | $ 13.96 | | $ 13.56 | | $ 11.94 | | $ 15.57 | | $ 13.37 |
| Total investment return (b) | 16.05%(c) | | 11.28% | | 22.88% | | (11.98)% | | 19.14% | | 11.17% |
| Ratios (to average net assets)/Supplemental Data: | | | | | | | | | | | |
| Net investment income (loss) | (0.07)%†† | | 0.65% | | 0.84% | | 1.08% | | 0.87% | | 1.09% |
| Net expenses (d) | 0.86%†† | | 0.86% | | 0.86% | | 0.86% | | 0.86% | | 0.86% |
| Expenses (before waiver/reimbursement) (d) | 0.88%†† | | 0.89% | | 0.88% | | 0.88% | | 0.88% | | 0.89% |
| Portfolio turnover rate | 34% | | 178% | | 174% | | 181% | | 155% | | 164% |
| Net assets at end of period (in 000’s) | $ 352,707 | | $ 346,379 | | $ 398,240 | | $ 453,343 | | $ 503,364 | | $ 558,783 |
| * | Unaudited. |
| †† | Annualized. |
| (a) | Per share data based on average shares outstanding during the period. |
| (b) | Total return does not reflect any deduction of sales charges, mortality and expense charges, contract charges or administrative charges. For periods of less than one year, total return is not annualized. |
| (c) | Total investment return may reflect adjustments to conform to generally accepted accounting principles. |
| (d) | In addition to the fees and expenses which the Portfolio bears directly, it also indirectly bears a pro-rata share of the fees and expenses of the underlying funds in which it invests. Such indirect expenses are not included in the above expense ratios. |
The notes to the financial statements are an integral part of, and should be read in conjunction with, the financial statements.
| 18 | MainStay VP Wellington Mid Cap Portfolio |
Financial Highlights selected per share data and ratios
| | Six months ended
June 30,
2021* | | Year Ended December 31, |
| Service Class | 2020 | | 2019 | | 2018 | | 2017 | | 2016 |
| Net asset value at beginning of period | $ 13.68 | | $ 13.32 | | $ 11.74 | | $ 15.35 | | $ 13.18 | | $ 12.83 |
| Net investment income (loss) (a) | (0.01) | | 0.05 | | 0.08 | | 0.12 | | 0.09 | | 0.12 |
| Net realized and unrealized gain (loss) on investments | 2.19 | | 1.28 | | 2.49 | | (1.66) | | 2.38 | | 1.24 |
| Total from investment operations | 2.18 | | 1.33 | | 2.57 | | (1.54) | | 2.47 | | 1.36 |
| Less distributions: | | | | | | | | | | | |
| From net investment income | — | | (0.09) | | (0.12) | | (0.11) | | (0.12) | | (0.08) |
| From net realized gain on investments | — | | (0.88) | | (0.87) | | (1.96) | | (0.18) | | (0.93) |
| Total distributions | — | | (0.97) | | (0.99) | | (2.07) | | (0.30) | | (1.01) |
| Net asset value at end of period | $ 15.86 | | $ 13.68 | | $ 13.32 | | $ 11.74 | | $ 15.35 | | $ 13.18 |
| Total investment return (b) | 15.94%(c) | | 11.00% | | 22.57% | | (12.20)% | | 18.85% | | 10.89% |
| Ratios (to average net assets)/Supplemental Data: | | | | | | | | | | | |
| Net investment income (loss) | (0.08)%†† | | 0.42% | | 0.58% | | 0.83% | | 0.64% | | 0.83% |
| Net expenses (d) | 1.11%†† | | 1.11% | | 1.11% | | 1.11% | | 1.11% | | 1.11% |
| Expenses (before waiver/reimbursement) (d) | 1.13%†† | | 1.14% | | 1.13% | | 1.13% | | 1.13% | | 1.14% |
| Portfolio turnover rate | 34% | | 178% | | 174% | | 181% | | 155% | | 164% |
| Net assets at end of period (in 000’s) | $ 571,195 | | $ 551,856 | | $ 516,445 | | $ 395,800 | | $ 477,253 | | $ 435,287 |
| * | Unaudited. |
| †† | Annualized. |
| (a) | Per share data based on average shares outstanding during the period. |
| (b) | Total return does not reflect any deduction of sales charges, mortality and expense charges, contract charges or administrative charges. For periods of less than one year, total return is not annualized. |
| (c) | Total investment return may reflect adjustments to conform to generally accepted accounting principles. |
| (d) | In addition to the fees and expenses which the Portfolio bears directly, it also indirectly bears a pro-rata share of the fees and expenses of the underlying funds in which it invests. Such indirect expenses are not included in the above expense ratios. |
The notes to the financial statements are an integral part of, and should be read in conjunction with, the financial statements.
19
Notes to Financial Statements (Unaudited)
Note 1–Organization and Business
MainStay VP Funds Trust (the “Fund”) was organized as a Delaware statutory trust on February 1, 2011. The Fund is registered under the Investment Company Act of 1940, as amended (the “1940 Act”), as an open-end management investment company. The Fund is comprised of thirty-one separate series (collectively referred to as the “Portfolios”). These financial statements and notes relate to the MainStay VP Wellington Mid Cap Portfolio (formerly known as MainStay VP MacKay Mid Cap Core Portfolio) (the "Portfolio"), a "diversified” portfolio, as that term is defined in the 1940 Act, as interpreted or modified by regulatory authorities having jurisdiction, from time to time.
Shares of the Portfolio are currently offered to certain separate accounts to fund variable annuity policies and variable universal life insurance policies issued by New York Life Insurance and Annuity Corporation (“NYLIAC”), a wholly-owned subsidiary of New York Life Insurance Company (“New York Life”) and may also be offered to fund variable annuity policies and variable universal life insurance policies issued by other insurance companies. NYLIAC allocates shares of the Portfolios to, among others, certain NYLIAC separate accounts. Shares of the Portfolio are also offered to the MainStay VP Conservative Allocation Portfolio, MainStay VP Moderate Allocation Portfolio, MainStay VP Growth Allocation Portfolio (formerly known as MainStay VP Moderate Growth Allocation Portfolio) and MainStay VP Equity Allocation Portfolio (formerly known as MainStay VP Growth Allocation Portfolio), which operate as “funds-of-funds," and other variable insurance funds.
The following table lists the Portfolio's share classes that have been registered and commenced operations:
| Class | Commenced Operations |
| Initial Class | July 2, 2001 |
| Service Class | June 5, 2003 |
Shares of the Portfolio are offered and are redeemed at a price equal to their respective net asset value (“NAV”) per share. No sales or redemption charge is applicable to the purchase or redemption of the Portfolio's shares. Under the terms of the Fund’s multiple class plan, adopted pursuant to Rule 18f-3 under the 1940 Act, the classes differ in that, among other things, Service Class shares of the Portfolio pay a combined distribution and service fee of 0.25% of average daily net assets attributable to Service Class shares of the Portfolio to the Distributor (as defined in Note 3(B)) pursuant to a plan adopted in accordance with Rule 12b-1 under the 1940 Act. Contract owners of variable annuity contracts purchased after June 2, 2003, are permitted to invest only in the Service Class shares.
The Portfolio's investment objective is to seek long-term growth of capital.
Note 2–Significant Accounting Policies
The Portfolio is an investment company and accordingly follows the investment company accounting and reporting guidance of the Financial Accounting Standards Board (“FASB”) Accounting Standard Codification Topic 946 Financial Services—Investment Companies. The Portfolio prepares its financial statements in accordance with generally accepted accounting principles (“GAAP”) in the United States of America and follows the significant accounting policies described below.
(A) Securities Valuation. Investments are usually valued as of the close of regular trading on the New York Stock Exchange (the "Exchange") (usually 4:00 p.m. Eastern time) on each day the Portfolio is open for business ("valuation date").
The Board of Trustees of the Fund (the "Board") adopted procedures establishing methodologies for the valuation of the Portfolio's securities and other assets and delegated the responsibility for valuation determinations under those procedures to the Valuation Committee of the Fund (the “Valuation Committee”). The procedures state that, subject to the oversight of the Board and unless otherwise noted, the responsibility for the day-to-day valuation of portfolio assets (including fair value measurements for the Portfolio's assets and liabilities) rests with New York Life Investment Management LLC (“New York Life Investments” or the "Manager"), aided to whatever extent necessary by the Subadvisor (as defined in Note 3(A)). To assess the appropriateness of security valuations, the Manager, the Subadvisor or the Portfolio's third-party service provider, who is subject to oversight by the Manager, regularly compares prior day prices, prices on comparable securities and the sale prices to the prior and current day prices and challenges prices with changes exceeding certain tolerance levels with third-party pricing services or broker sources.
The Board authorized the Valuation Committee to appoint a Valuation Subcommittee (the “Subcommittee”) to establish the prices of securities for which market quotations are not readily available or the prices of which are not otherwise readily determinable under the procedures. The Subcommittee meets (in person, via electronic mail or via teleconference) on an as-needed basis. The Valuation Committee meets to ensure that actions taken by the Subcommittee were appropriate.
For those securities valued through either a standardized fair valuation methodology or a fair valuation measurement, the Subcommittee deals with such valuation and the Valuation Committee reviews and affirms, if appropriate, the reasonableness of the valuation based on such methodologies and measurements on a regular basis after considering information that is reasonably available and deemed relevant by the Valuation Committee. Any action taken by the Subcommittee with respect to the valuation of a portfolio security or other asset is submitted for review and ratification (if appropriate) to the Valuation Committee and the Board at the next regularly scheduled meeting.
"Fair value" is defined as the price the Portfolio would reasonably expect to receive upon selling an asset or liability in an orderly transaction to an independent buyer in the principal or most advantageous market for the
| 20 | MainStay VP Wellington Mid Cap Portfolio |
asset or liability. Fair value measurements are determined within a framework that establishes a three-tier hierarchy that maximizes the use of observable market data and minimizes the use of unobservable inputs to establish a classification of fair value measurements for disclosure purposes. "Inputs" refer broadly to the assumptions that market participants would use in pricing the asset or liability, including assumptions about risk, such as the risk inherent in a particular valuation technique used to measure fair value using a pricing model and/or the risk inherent in the inputs for the valuation technique. Inputs may be observable or unobservable. Observable inputs reflect the assumptions market participants would use in pricing the asset or liability based on market data obtained from sources independent of the Portfolio. Unobservable inputs reflect the Portfolio’s own assumptions about the assumptions market participants would use in pricing the asset or liability based on the information available. The inputs or methodology used for valuing assets or liabilities may not be an indication of the risks associated with investing in those assets or liabilities. The three-tier hierarchy of inputs is summarized below.
| • | Level 1—quoted prices in active markets for an identical asset or liability |
| • | Level 2—other significant observable inputs (including quoted prices for a similar asset or liability in active markets, interest rates and yield curves, prepayment speeds, credit risk, etc.) |
| • | Level 3—significant unobservable inputs (including the Portfolio's own assumptions about the assumptions that market participants would use in measuring fair value of an asset or liability) |
The level of an asset or liability within the fair value hierarchy is based on the lowest level of an input, both individually and in the aggregate, that is significant to the fair value measurement. The aggregate value by input level of the Portfolio’s assets and liabilities as of June 30, 2021, is included at the end of the Portfolio of Investments.
The Portfolio may use third-party vendor evaluations, whose prices may be derived from one or more of the following standard inputs, among others:
| • Broker/dealer quotes | • Benchmark securities |
| • Two-sided markets | • Reference data (corporate actions or material event notices) |
| • Bids/offers | • Monthly payment information |
| • Industry and economic events | • Reported trades |
An asset or liability for which market values cannot be measured using the methodologies described above is valued by methods deemed reasonable in good faith by the Valuation Committee, following the procedures established by the Board, to represent fair value. Under these procedures, the Portfolio generally uses a market-based approach which may use related or comparable assets or liabilities, recent transactions, market multiples, book values and other relevant information. The Portfolio may also use an income-based valuation approach in which the anticipated future cash flows of the asset or liability are discounted to
calculate fair value. Discounts may also be applied due to the nature and/or duration of any restrictions on the disposition of the asset or liability. Fair value represents a good faith approximation of the value of a security. Fair value determinations involve the consideration of a number of subjective factors, an analysis of applicable facts and circumstances and the exercise of judgment. As a result, it is possible that the fair value for a security determined in good faith in accordance with the Portfolio's valuation procedures may differ from valuations for the same security determined by other funds using their own valuation procedures. Although the Portfolio's valuation procedures are designed to value a security at the price the Portfolio may reasonably expect to receive upon the security's sale in an orderly transaction, there can be no assurance that any fair value determination thereunder would, in fact, approximate the amount that the Portfolio would actually realize upon the sale of the security or the price at which the security would trade if a reliable market price were readily available. During the six-month period ended June 30, 2021, there were no material changes to the fair value methodologies.
Securities which may be valued in this manner include, but are not limited to: (i) a security for which trading has been halted or suspended; (ii) a debt security that has recently gone into default and for which there is not a current market quotation; (iii) a security of an issuer that has entered into a restructuring; (iv) a security that has been delisted from a national exchange; (v) a security for which the market price is not readily available from a third-party pricing source or, if so provided, does not, in the opinion of the Manager or the Subadvisor, reflect the security's market value; (vi) a security subject to trading collars for which no or limited trading takes place; and (vii) a security whose principal market has been temporarily closed at a time when, under normal conditions, it would be open. Securities valued in this manner are generally categorized as Level 3 in the hierarchy. No securities held by the Portfolio as of June 30, 2021 were fair valued in such a manner.
Certain securities held by the Portfolio may principally trade in foreign markets. Events may occur between the time the foreign markets close and the time at which the Portfolio's NAVs are calculated. These events may include, but are not limited to, situations relating to a single issuer in a market sector, significant fluctuations in U.S. or foreign markets, natural disasters, armed conflicts, governmental actions or other developments not tied directly to the securities markets. Should the Manager or the Subadvisor conclude that such events may have affected the accuracy of the last price of such securities reported on the local foreign market, the Subcommittee may, pursuant to procedures adopted by the Board, adjust the value of the local price to reflect the estimated impact on the price of such securities as a result of such events. In this instance, securities are generally categorized as Level 3 in the hierarchy. Additionally, certain foreign equity securities are also fair valued whenever the movement of a particular index exceeds certain thresholds. In such cases, the securities are fair valued by applying factors provided by a third-party vendor in accordance with valuation procedures adopted by the Board and are generally categorized as Level 2 in the hierarchy. No foreign equity securities held by the Portfolio as of June 30, 2021 were fair valued in such a manner.
Notes to Financial Statements (Unaudited) (continued)
Equity securities are valued at the last quoted sales prices as of the close of regular trading on the relevant exchange on each valuation date. Securities that are not traded on the valuation date are valued at the mean of the last quoted bid and ask prices. Prices are normally taken from the principal market in which each security trades. These securities are generally categorized as Level 1 in the hierarchy.
Investments in mutual funds, including money market funds, are valued at their respective NAVs at the close of business each day on the valuation date. These securities are generally categorized as Level 1 in the hierarchy.
Temporary cash investments acquired in excess of 60 days to maturity at the time of purchase are valued using the latest bid prices or using valuations based on a matrix system (which considers such factors as security prices, yields, maturities and ratings), both as furnished by independent pricing services. Temporary cash investments that mature in 60 days or less at the time of purchase ("Short-Term Investments") are valued using the amortized cost method of valuation, unless the use of such method would be inappropriate. The amortized cost method involves valuing a security at its cost on the date of purchase and thereafter assuming a constant amortization to maturity of the difference between such cost and the value on maturity date. Amortized cost approximates the current fair value of a security. Securities valued using the amortized cost method are not valued using quoted prices in an active market and are generally categorized as Level 2 in the hierarchy.
The information above is not intended to reflect an exhaustive list of the methodologies that may be used to value portfolio investments. The valuation procedures permit the use of a variety of valuation methodologies in connection with valuing portfolio investments. The methodology used for a specific type of investment may vary based on the market data available or other considerations. The methodologies summarized above may not represent the specific means by which portfolio investments are valued on any particular business day.
(B) Income Taxes. The Portfolio's policy is to comply with the requirements of the Internal Revenue Code of 1986, as amended (the “Internal Revenue Code”), applicable to regulated investment companies and to distribute all of its taxable income to the shareholders of the Portfolio within the allowable time limits.
The Manager evaluates the Portfolio’s tax positions to determine if the tax positions taken meet the minimum recognition threshold in connection with accounting for uncertainties in income tax positions taken or expected to be taken for the purposes of measuring and recognizing tax liabilities in the financial statements. Recognition of tax benefits of an uncertain tax position is permitted only to the extent the position is “more likely than not” to be sustained assuming examination by taxing authorities. The Manager analyzed the Portfolio's tax positions taken on federal, state and local income tax returns for all open tax years (for up to three tax years) and has concluded that no provisions for federal, state and local income tax are required in the Portfolio's financial statements. The Portfolio's federal, state and local income tax and federal excise tax
returns for tax years for which the applicable statutes of limitations have not expired are subject to examination by the Internal Revenue Service and state and local departments of revenue.
(C) Foreign Taxes. The Portfolio may be subject to foreign taxes on income and other transaction-based taxes imposed by certain countries in which it invests. A portion of the taxes on gains on investments or currency purchases/repatriation may be reclaimable. The Portfolio will accrue such taxes and reclaims as applicable, based upon its current interpretation of tax rules and regulations that exist in the markets in which it invests.
The Portfolio may be subject to taxation on realized capital gains, repatriation proceeds and other transaction-based taxes imposed by certain countries in which it invests. The Portfolio will accrue such taxes as applicable based upon its current interpretation of tax rules and regulations that exist in the market in which it invests. Capital gains taxes relating to positions still held are reflected as a liability in the Statement of Assets and Liabilities, as well as an adjustment to the Portfolio's net unrealized appreciation (depreciation). Taxes related to capital gains realized, if any, are reflected as part of net realized gain (loss) in the Statement of Operations. Changes in tax liabilities related to capital gains taxes on unrealized investment gains, if any, are reflected as part of the change in net unrealized appreciation (depreciation) on investments in the Statement of Operations. Transaction-based charges are generally assessed as a percentage of the transaction amount.
(D) Dividends and Distributions to Shareholders. Dividends and distributions are recorded on the ex-dividend date. The Portfolio intends to declare and pay dividends from net investment income and distributions from net realized capital and currency gains, if any, at least annually. Unless a shareholder elects otherwise, all dividends and distributions are reinvested at NAV in the same class of shares of the Portfolio. Dividends and distributions to shareholders are determined in accordance with federal income tax regulations and may differ from determinations using GAAP.
(E) Security Transactions and Investment Income. The Portfolio records security transactions on the trade date. Realized gains and losses on security transactions are determined using the identified cost method. Dividend income is recognized on the ex-dividend date, net of any foreign tax withheld at the source, and interest income is accrued as earned using the effective interest rate method. Distributions received from real estate investment trusts may be classified as dividends, capital gains and/or return of capital.
Investment income and realized and unrealized gains and losses on investments of the Portfolio are allocated pro rata to the separate classes of shares based upon their relative net assets on the date the income is earned or realized and unrealized gains and losses are incurred.
(F) Expenses. Expenses of the Fund are allocated to the individual Portfolios in proportion to the net assets of the respective Portfolios when the expenses are incurred, except where direct allocations of expenses can be made. Expenses (other than fees incurred under the distribution
| 22 | MainStay VP Wellington Mid Cap Portfolio |
and service plans, further discussed in Note 3(B), which are charged directly to the Service Class shares) are allocated to separate classes of shares pro rata based upon their relative net assets on the date the expenses are incurred. The expenses borne by the Portfolio, including those of related parties to the Portfolio, are shown in the Statement of Operations.
Additionally, the Portfolio may invest in mutual funds, which are subject to management fees and other fees that may cause the costs of investing in mutual funds to be greater than the costs of owning the underlying securities directly. These indirect expenses of mutual funds are not included in the amounts shown as expenses in the Statement of Operations or in the expense ratios included in the Financial Highlights.
(G) Use of Estimates. In preparing financial statements in conformity with GAAP, the Manager makes estimates and assumptions that affect the reported amounts and disclosures in the financial statements. Actual results could differ from those estimates and assumptions.
(H) Securities Lending. In order to realize additional income, the Portfolio may engage in securities lending, subject to the limitations set forth in the 1940 Act and relevant guidance by the staff of the Securities and Exchange Commission (“SEC”). If the Portfolio engages in securities lending, the Portfolio will lend through its custodian, JPMorgan Chase Bank, N.A., ("JPMorgan"), acting as securities lending agent on behalf of the Portfolio. Under the current arrangement, JPMorgan will manage the Portfolio's collateral in accordance with the securities lending agency agreement between the Portfolio and JPMorgan, and indemnify the Portfolio against counterparty risk. The loans will be collateralized by cash (which may be invested in a money market fund) and/or non-cash collateral (which may include U.S. Treasury securities and/or U.S. government agency securities issued or guaranteed by the United States government or its agencies or instrumentalities) at least equal at all times to the market value of the securities loaned. The Portfolio bears the risk of delay in recovery of, or loss of rights in, the securities loaned. The Portfolio may also record a realized gain or loss on securities deemed sold due to a borrower’s inability to return securities on loan. The Portfolio bears the risk of any loss on investment of cash collateral. The Portfolio will receive compensation for lending its securities in the form of fees or it will retain a portion of interest earned on the investment of any cash collateral. The Portfolio will also continue to receive interest and dividends on the securities loaned and any gain or loss in the market price of the securities loaned that may occur during the term of the loan will be for the account of the Portfolio. Income earned from securities lending activities, if any, is reflected in the Statement of Operations. Securities on loan as of June 30, 2021, are shown in the Portfolio of Investments.
Prior to February 22, 2021, these services were provided by State Street Bank and Trust Company (“State Street”).
(I) Indemnifications. Under the Fund’s organizational documents, its officers and trustees are indemnified against certain liabilities that may arise out of performance of their duties to the Fund. Additionally, in the normal course of business, the Portfolio enters into contracts with
third-party service providers that contain a variety of representations and warranties and that may provide general indemnifications. The Portfolio's maximum exposure under these arrangements is unknown, as this would involve future claims that may be made against the Portfolio that have not yet occurred. The Manager believes that the risk of loss in connection with these potential indemnification obligations is remote. However, there can be no assurance that material liabilities related to such obligations will not arise in the future, which could adversely impact the Portfolio.
Note 3–Fees and Related Party Transactions
(A) Manager and Subadvisor. New York Life Investments, a registered investment adviser and an indirect, wholly-owned subsidiary of New York Life, serves as the Portfolio's Manager, pursuant to an Amended and Restated Management Agreement ("Management Agreement"). The Manager provides offices, conducts clerical, recordkeeping and bookkeeping services and keeps most of the financial and accounting records required to be maintained by the Portfolio. Except for the portion of salaries and expenses that are the responsibility of the Portfolio, the Manager pays the salaries and expenses of all personnel affiliated with the Portfolio and certain operational expenses of the Portfolio. The Portfolio reimburses New York Life Investments in an amount equal to the portion of the compensation of the Chief Compliance Officer attributable to the Portfolio. The Portfolio’s subadvisor changed effective May 1, 2021, due to the replacement of MacKay Shields LLC ("MacKay Shields") as the Portfolio’s subadvisor and the appointment of Wellington Management Company LLP (“Wellington” or the “Subadvisor”) as the Portfolio’s subadvisor. Wellington, a registered investment adviser, is responsible for the day-to-day portfolio management of the Portfolio. Pursuant to the terms of a Subadvisory Agreement ("Subadvisory Agreement") between New York Life Investments and Wellington, New York Life Investments pays for the services of the Subadvisor.
Pursuant to the Management Agreement, the Fund pays the Manager, on behalf of the Portfolio, a monthly fee for the services performed and the facilities furnished at an annual rate of the Portfolio's average daily net assets as follows: 0.85% up to $1 billion; 0.80% from $1 billion to $2 billion; and 0.775% in excess of $2 billion. During the six-month period ended June 30, 2021, the effective management fee rate was 0.85% (exclusive of any applicable waivers/reimbursements).
New York Life Investments has contractually agreed to waive fees and/or reimburse expenses so that the Total Annual Portfolio Operating Expenses (excluding taxes, interest, litigation, extraordinary expenses, brokerage and other transaction expenses relating to the purchase or sale of portfolio investments and acquired (underlying) portfolio/fund fees and expenses) of Initial Class shares and Service Class shares do not exceed 0.86% and 1.11%, respectively, of the Portfolio's average daily net assets. This agreement will remain in effect until May 1, 2022, and shall renew automatically for one-year terms unless New York Life Investments provides written notice of termination prior to the start of the next term or upon approval of the Board.
Notes to Financial Statements (Unaudited) (continued)
During the six-month period ended June 30, 2021, New York Life Investments earned fees from the Portfolio in the amount of $3,904,262 and waived fees and/or reimbursed certain class specific expenses in the amount of $87,346 and paid MacKay Shields and Wellington $1,269,247 and $573,498, respectively.
JPMorgan provides sub-administration and sub-accounting services to the Portfolio pursuant to an agreement with New York Life Investments. These services include calculating the daily NAVs of the Portfolio, maintaining the general ledger and sub-ledger accounts for the calculation of the Portfolio's NAVs, and assisting New York Life Investments in conducting various aspects of the Portfolio's administrative operations. For providing these services to the Portfolio, JPMorgan is compensated by New York Life Investments.
Prior to February 22, 2021, these services were provided by State Street.
Pursuant to an agreement between the Fund and New York Life Investments, New York Life Investments is responsible for providing or
procuring certain regulatory reporting services for the Portfolio. The Portfolio will reimburse New York Life Investments for the actual costs incurred by New York Life Investments in connection with providing or procuring these services for the Portfolio.
(B) Distribution and Service Fees. The Fund, on behalf of the Portfolio, has entered into a distribution agreement with NYLIFE Distributors LLC (the “Distributor”), an affiliate of New York Life Investments. The Portfolio has adopted a distribution plan (the “Plan”) in accordance with the provisions of Rule 12b-1 under the 1940 Act. Under the Plan, the Distributor has agreed to provide, through its affiliates or independent third parties, various distribution-related, shareholder and administrative support services to the Service Class shareholders. For its services, the Distributor is entitled to a combined distribution and service fee accrued daily and paid monthly at an annual rate of 0.25% of the average daily net assets attributable to the Service Class shares of the Portfolio.
(C) Investments in Affiliates (in 000’s). During the six-month period ended June 30, 2021, purchases and sales transactions, income earned from investments and shares held of investment companies managed by New York Life Investments or its affiliates were as follows:
| Affiliated Investment Companies | Value,
Beginning
of Period | Purchases
at Cost | Proceeds
from
Sales | Net
Realized
Gain/(Loss)
on Sales | Change in
Unrealized
Appreciation/
(Depreciation) | Value,
End of
Period | Dividend
Income | Other
Distributions | Shares
End of
Period |
| MainStay U.S. Government Liquidity Fund | $ — | $ 46,905 | $ (41,335) | $ — | $ — | $ 5,570 | $ —(a) | $ — | 5,570 |
Note 4-Federal Income Tax
As of June 30, 2021, the cost and unrealized appreciation (depreciation) of the Portfolio’s investment portfolio, including applicable derivative contracts and other financial instruments, as determined on a federal income tax basis, were as follows:
| | Federal Tax
Cost | Gross
Unrealized
Appreciation | Gross
Unrealized
(Depreciation) | Net
Unrealized
Appreciation/
(Depreciation) |
| Investments in Securities | $930,008,977 | $35,877,575 | $(30,420,294) | $5,457,281 |
During the year ended December 31, 2020, the tax character of distributions paid as reflected in the Statements of Changes in Net Assets was as follows:
| | 2020 |
| Distributions paid from: | |
| Ordinary Income | $26,437,525 |
| Long-Term Capital Gains | 37,488,819 |
| Total | $63,926,344 |
Note 5–Custodian
JPMorgan is the custodian of cash and securities held by the Portfolio. Custodial fees are charged to the Portfolio based on the Portfolio's net assets and/or the market value of securities held by the Portfolio and the number of certain transactions incurred by the Portfolio.
Prior to February 22, 2021, these services were provided by State Street. The services provided by State Street were a direct expense of the Portfolio and are included in the Statement of Operations as Custodian fees which totaled $4,226 for the period January 1, 2021 through February 21, 2021.
Note 6–Line of Credit
The Portfolio and certain other funds managed by New York Life Investments maintain a line of credit with a syndicate of banks in order to secure a source of funds for temporary purposes to meet unanticipated or excessive redemption requests.
Effective July 27, 2021, under the credit agreement (the “Credit Agreement”), the aggregate commitment amount is $600,000,000 with an additional uncommitted amount of $100,000,000. The commitment fee is an annual rate of 0.15% of the average commitment amount payable quarterly, regardless of usage, to JPMorgan, who serves as the
| 24 | MainStay VP Wellington Mid Cap Portfolio |
agent to the syndicate. The commitment fee is allocated among the Portfolio and certain other funds managed by New York Life Investments based upon their respective net assets and other factors. Interest on any revolving credit loan is charged based upon the Federal Funds Rate or the one-month London Interbank Offered Rate ("LIBOR"), whichever is higher. The Credit Agreement expires on July 26, 2022, although the Portfolio, certain other funds managed by New York Life Investments and the syndicate of banks may renew the Credit Agreement for an additional year on the same or different terms or enter into a credit agreement with a different syndicate of banks. Prior to July 27, 2021, the aggregate commitment amount and the commitment fee were the same as those under the current Credit Agreement. During the six-month period ended June 30, 2021, there were no borrowings made or outstanding with respect to the Portfolio under the Credit Agreement.
Note 7–Interfund Lending Program
Pursuant to an exemptive order issued by the SEC, the Portfolio, along with certain other funds managed by New York Life Investments, may participate in an interfund lending program. The interfund lending program provides an alternative credit facility that permits the Portfolio and certain other funds managed by New York Life Investments to lend or borrow money for temporary purposes directly to or from one another, subject to the conditions of the exemptive order. During the six-month period ended June 30, 2021, there were no interfund loans made or outstanding with respect to the Portfolio.
Note 8–Purchases and Sales of Securities (in 000’s)
During the six-month period ended June 30, 2021, purchases and sales of securities, other than short-term securities, were $309,900 and $404,608, respectively.
Note 9–Capital Share Transactions
Transactions in capital shares for the six-month period ended June 30, 2021 and the year ended December 31, 2020, were as follows:
| Initial Class | Shares | Amount |
| Period ended June 30, 2021: | | |
| Shares sold | 275,196 | $ 4,276,281 |
| Shares redeemed | (3,314,994) | (50,996,595) |
| Net increase (decrease) | (3,039,798) | $(46,720,314) |
| Year ended December 31, 2020: | | |
| Shares sold | 541,033 | $ 6,496,484 |
| Shares issued to shareholders in reinvestment of distributions | 2,114,906 | 25,918,174 |
| Shares redeemed | (7,201,123) | (92,080,310) |
| Net increase (decrease) | (4,545,184) | $(59,665,652) |
| |
| Service Class | Shares | Amount |
| Period ended June 30, 2021: | | |
| Shares sold | 131,759 | $ 1,977,401 |
| Shares redeemed | (4,444,241) | (66,934,688) |
| Net increase (decrease) | (4,312,482) | $(64,957,287) |
| Year ended December 31, 2020: | | |
| Shares sold | 6,166,167 | $ 68,335,779 |
| Shares issued to shareholders in reinvestment of distributions | 3,161,762 | 38,008,170 |
| Shares redeemed | (7,776,625) | (94,450,250) |
| Net increase (decrease) | 1,551,304 | $ 11,893,699 |
Note 10-Litigation
The Portfolio has been named as a defendant in the case entitled Kirschner v. FitzSimons, No. 12-2652 (S.D.N.Y.) (the “FitzSimons action”) as a result of its ownership of shares in the Tribune Company (“Tribune”) in 2007 when Tribune effected a leveraged buyout transaction (“LBO”) by which Tribune converted to a privately-held company. In its complaint, the plaintiff asserts claims against certain insiders, shareholders, professional advisers, and others involved in the LBO.
Separately, the complaint also seeks to obtain from former Tribune shareholders, including the Portfolio, any proceeds they received in connection with the LBO. The sole claim and cause of action brought against the Portfolio is for fraudulent conveyance pursuant to United States Bankruptcy Code Section 548(a)(1)(A).
In June 2011, certain Tribune creditors filed numerous additional actions asserting state law constructive fraudulent conveyance claims (the “SLCFC actions”) against specifically-named former Tribune shareholders and, in some cases, putative defendant classes comprised of former Tribune shareholders. One of the SLCFC actions, entitled Deutsche Bank Trust Co. Americas v. Blackrock Institutional Trust Co., No. 11-9319 (S.D.N.Y.) (the “Deutsche Bank action”), named the Portfolio as a defendant.
The FitzSimons action and Deutsche Bank action have been consolidated with the majority of the other Tribune LBO-related lawsuits in a multidistrict litigation proceeding entitled In re Tribune Co. Fraudulent Conveyance Litig., No. 11-md-2296 (S.D.N.Y.) (the “MDL Proceeding”).
On September 23, 2013, the District Court granted the defendants’ motion to dismiss the SLCFC actions, including the Deutsche Bank action, on the basis that the plaintiffs did not have standing to pursue their claims. On September 30, 2013, the plaintiffs in the SLCFC actions filed a notice of appeal to the United States Court of Appeals for the Second Circuit. On October 28, 2013, the defendants filed a joint notice of cross-appeal of that same order. On November 5, 2014, the Second Circuit Court of Appeals held an oral argument on appeal. On March 29, 2016, the United States Court of Appeals for the Second Circuit issued its opinion on the appeal of the SLCFC actions. The appeals court affirmed the District Court’s dismissal of those lawsuits, but on different grounds than the District Court. The appeals court held that while the plaintiffs
Notes to Financial Statements (Unaudited) (continued)
have standing under the U.S. Bankruptcy Code, their claims were pre-empted by Section 546(e) of the Bankruptcy Code—the statutory safe harbor for settlement payments. On April 12, 2016, the plaintiffs in the SLCFC actions filed a petition seeking rehearing en banc before the appeals court. On July 22, 2016, the appeals court denied the petition. On September 9, 2016, the plaintiffs filed a petition for writ of certiorari in the U.S. Supreme Court challenging the Second Circuit’s decision that the safe harbor of Section 546(e) applied to their claims. Certain shareholder defendants filed a joint brief in opposition to the petition for certiorari on October 24, 2016. The plaintiffs filed a reply in support of the petition on November 4, 2016. On April 3, 2018, Justice Kennedy and Justice Thomas issued a “Statement” related to the petition for certiorari suggesting that the Second Circuit and/or District Court may want to take steps to reexamine the application of the Section 546(e) safe harbor to the previously dismissed state law constructive fraudulent transfer claims based on the Supreme Court’s decision in Merit Management Group LP v. FTI Consulting, Inc. On April 10, 2018, the plaintiffs filed in the Second Circuit a motion for that court to recall its mandate, vacate its prior decision, and remand to the District Court for further proceedings consistent with Merit Management. On April 20, 2018, the shareholder defendants filed a response to the plaintiffs’ motion to recall the mandate. On May 15, 2018, the Second Circuit issued an order recalling the mandate “in anticipation of further panel review.” On December 19, 2019, the Second Circuit issued an amended opinion that again affirmed the district court’s ruling on the basis that plaintiffs’ claims were preempted by Section 546(e) of the Bankruptcy Code. Plaintiffs filed a motion for rehearing and rehearing en banc on January 2, 2020, which was denied on February 6, 2020. Plaintiffs filed a new petition for certiorari with the Supreme Court on July 6, 2020. In that petition, plaintiffs stated that “[t]o make it more likely that there will be a quorum for this petition,” they have “abandon[ed] the case and let the judgment below stand” with respect to certain defendants. That list did not include the Portfolio. Defendants filed an opposition to the certiorari petition on August 26, 2020. Plaintiffs filed a reply in support of the petition for certiorari on September 8, 2020. On March 12, 2021, the Solicitor General filed an amicus brief recommending that certiorari be denied. Plaintiffs filed a supplemental brief in response to the Solicitor General’s amicus brief on March 31, 2021, and Defendants filed a supplemental brief on April 1, 2021. The Supreme Court denied the petition for certiorari on April 19, 2021.
On August 2, 2013, the plaintiff in the FitzSimons action filed a Fifth Amended Complaint. On May 23, 2014, the defendants filed motions to dismiss the FitzSimons action, including a global motion to dismiss Count I, which is the claim brought against former Tribune shareholders for intentional fraudulent conveyance under U.S. federal law. On January 6, 2017, the United States District Court for the Southern District of New York granted the shareholder defendants’ motion to dismiss the intentional fraudulent conveyance claim in the FitzSimons action. In dismissing the intentional fraudulent conveyance claim, the Court denied the plaintiff’s request to amend the complaint. The Court’s order is not immediately appealable, but the plaintiff has asked the Court to direct entry of a final judgment in order to make the order immediately
appealable. On February 23, 2017, the Court issued an order stating that it intends to permit an interlocutory appeal of the dismissal order, but will wait to do so until it has resolved outstanding motions to dismiss filed by other defendants.
On July 18, 2017, the plaintiff submitted a letter to the District Court seeking leave to amend its complaint to add a constructive fraudulent transfer claim. The shareholder defendants opposed that request.
On August 24, 2017, the Court denied the plaintiff’s request without prejudice to renewal of the request in the event of an intervening change in the law. On March 8, 2018, the plaintiff renewed his request for leave to file a motion to amend the complaint to assert a constructive fraudulent transfer claim based on the Supreme Court’s ruling in Merit Management. The shareholder defendants opposed that request. On June 18, 2018, the District Court ordered that the request would be stayed pending further action by the Second Circuit in the still-pending appeal, discussed above. On December 18, 2018, the plaintiff filed a letter with the District Court requesting that the stay be dissolved in order to permit briefing on the motion to amend the complaint and indicating the plaintiff’s intention to file another motion to amend the complaint to reinstate claims for intentional fraudulent transfer. The shareholder defendants opposed that request. On January 14, 2019, the Court held a case management conference, during which the Court stated that it would not lift the stay prior to further action from the Second Circuit. The Court stated that it would allow the plaintiff to file a motion to amend to try to reinstate its intentional fraudulent transfer claim. On January 23, 2019, the Court ordered the parties still facing pending claims to participate in a mediation. On March 27, 2019, the Court held a telephone conference and decided to allow the plaintiff to file a motion for leave to amend. On April 4, 2019, the plaintiff filed a motion to amend the Fifth Amended Complaint to assert a federal constructive fraudulent transfer claim against certain shareholder defendants. On April 10, 2019, the shareholder defendants filed a brief in opposition to the plaintiff’s motion to amend. On April 12, 2019, the plaintiff filed a reply brief. The Court denied leave to amend the complaint on April 23, 2019. On June 13, 2019, the Court entered judgment pursuant to Rule 54(b), which would permit an appeal of the Court’s dismissal of the claim against the shareholder defendants. On July 15, 2019, the Trustee filed a notice of appeal to the Second Circuit. Appellant filed his brief on January 7, 2020. The shareholder defendants filed an opposition brief on April 27, 2020, and Appellant filed a reply brief on May 18, 2020. The Court held oral argument on August 24, 2020. In addition, the District Court has entered two bar orders in connection with the plaintiff’s settlement with certain non-shareholder defendants. The orders bar claims against the settling defendants, but contain a judgment reduction provision that preserves the value of any potential claim by a shareholder defendant against a settling defendant. Specifically, the judgment reduction provision reduces the amount of money recoverable against a shareholder defendant to the extent the shareholder defendant could have recovered on a claim against a settling defendant.
| 26 | MainStay VP Wellington Mid Cap Portfolio |
The value of the proceeds received by the Portfolio in connection with the LBO and the Portfolio's cost basis in shares of Tribune was as follows:
| Portfolio | Proceeds | Cost Basis |
| MainStay VP Wellington Mid Cap Portfolio | $808,180 | $790,269 |
At this stage of the proceedings, it would be difficult to assess with any reasonable certainty the probable outcome of the pending litigation or the effect, if any, on the Portfolio's net asset value.
Note 11–Other Matters
An outbreak of COVID-19, first detected in December 2019, has developed into a global pandemic and has resulted in travel restrictions, closure of international borders, certain businesses and securities markets, restrictions on securities trading activities, prolonged quarantines, supply chain disruptions, and lower consumer demand, as well as general concern and uncertainty. The continued impact of COVID-19 and related new variants is uncertain and could further adversely affect the global economy, national economies, individual issuers and capital markets in unforeseeable ways and result in a substantial and extended economic downturn. Developments that disrupt global economies and financial markets, such as COVID-19, may magnify factors that affect the Portfolio's performance.
Note 12–Subsequent Events
In connection with the preparation of the financial statements of the Portfolio as of and for the six-month period ended June 30, 2021, events and transactions subsequent to June 30, 2021, through the date the financial statements were issued have been evaluated by the Manager for possible adjustment and/or disclosure. No subsequent events requiring financial statement adjustment or disclosure have been identified.
Board Consideration and Approval of Subadvisory Agreement with Wellington Management Company LLP (Unaudited)
The Subadvisory Agreement between New York Life Investment Management LLC (“New York Life Investments”) and Wellington Management Company LLP (“Wellington”) with respect to the MainStay VP Wellington Mid Cap Portfolio (formerly known as the MainStay VP MacKay Mid Cap Core Portfolio) (“Portfolio”) (“New Subadvisory Agreement”), must be approved initially and, following an initial term of up to two years, is subject to annual review and approval by the Board of Trustees of MainStay VP Funds Trust (“Board” of the “Trust”) in accordance with Section 15 of the Investment Company Act of 1940, as amended (“1940 Act”). At its February 3, 2021 meeting, the Board, including the Trustees who are not an “interested person” (as such term is defined in the 1940 Act) of the Trust (“Independent Trustees”) voting separately, unanimously approved the New Subadvisory Agreement for an initial two-year period.
At meetings held on January 21, January 25 and February 3, 2021, the Board considered and approved New York Life Investments’ recommendations to appoint Wellington as the subadvisor to the Portfolio, to approve the New Subadvisory Agreement and to approve the related changes to the Portfolio’s principal investment strategies, name and investment process (the “Repositioning”), all effective on or about May 1, 2021. The Board noted that the material terms of the New Subadvisory Agreement are substantially identical to the terms of the then-current subadvisory agreement with MacKay Shields LLC (“MacKay”) with respect to the Portfolio, but that the subadvisory fee schedule under the New Subadvisory Agreement with Wellington includes fees that are lower at every level of assets than the subadvisory fees paid to MacKay under the then-current subadvisory agreement.
In reaching the decisions to approve the Repositioning and New Subadvisory Agreement, the Board considered information furnished by New York Life Investments and Wellington in connection with meetings of the Board and its Contracts, Investment and Risk and Compliance Oversight Committees held on January 21, January 25 and February 3, 2021, as well as other information furnished to the Board and its Committees throughout the year, as deemed relevant by the Trustees. In addition, the Board considered information previously provided to the Board in connection with its review of the subadvisory agreements for other funds in the MainStay Group of Funds, as deemed relevant to each Trustee. The Board also considered information furnished by Wellington in response to requests prepared on behalf of the Board, and in consultation with the Independent Trustees, by independent legal counsel to the Independent Trustees, which encompassed a variety of topics, including those summarized below.
The Board took into account information provided in connection with its meetings throughout the year, including, among other items, information regarding the legal standards and fiduciary obligations applicable to its consideration of the New Subadvisory Agreement and investment performance reports on the Portfolio as well as presentations from New York Life Investments and Wellington personnel. The contract review process, including the structure and format for materials provided to the Board, has been developed in consultation with the Board. The
Independent Trustees also met in executive sessions with their independent legal counsel and, for a portion thereof, with senior management of New York Life Investments.
In considering the Repositioning and the New Subadvisory Agreement, the Trustees reviewed and evaluated the information and factors they believed to reasonably be necessary and appropriate in light of legal advice furnished to them by independent legal counsel and through the exercise of their own business judgment. Although individual Trustees may have weighed certain factors or information differently, the factors considered by the Board are described in greater detail below and include, among other factors: (i) the nature, extent and quality of the services to be provided to the Portfolio by Wellington; (ii) the investment performance of the Portfolio, the qualifications of the proposed portfolio managers of the Portfolio and the historical investment performance of products managed by such portfolio managers with investment strategies similar to those of the Portfolio, as repositioned; (iii) the anticipated costs of the services to be provided, and profits expected to be realized, by Wellington from its relationship with the Portfolio; (iv) the extent to which economies of scale may be realized if the Portfolio grows and the extent to which economies of scale may benefit the Portfolio’s shareholders; and (v) the reasonableness of the Portfolio’s proposed subadvisory fee to be paid by New York Life Investments to Wellington and estimated total ordinary operating expenses. Although the Board recognized that comparisons between the Portfolio’s proposed fees and estimated expenses and those of other funds are imprecise given different terms of agreements, variations in fund strategies and other factors, the Board considered the reasonableness of the Portfolio’s proposed fees and estimated total ordinary operating expenses as compared to the peer funds identified by New York Life Investments.
Although individual Trustees may have weighed certain factors or information differently, the Board’s decisions to approve the Repositioning and the New Subadvisory Agreement were based on a consideration of the information provided to the Trustees throughout the year, such as presentations from Wellington personnel, as well as information furnished specifically in connection with the contract review process for the Portfolio, in each case as deemed relevant to each Trustee. The Trustees noted that, throughout the year, the Trustees would be afforded an opportunity to ask questions of, and request additional information or materials from, New York Life Investments and Wellington with respect to the Portfolio. The Board took note of New York Life Investments’ belief that Wellington, with its resources and historical investment performance track record for strategies similar to those of the Portfolio, as repositioned, is well qualified to serve as the Portfolio’s subadvisor. In addition to considering the above-referenced factors, the Board observed that in the marketplace, notably under variable life insurance policies and variable annuity contracts for which the Portfolio serves as an investment option, there are a range of investment options available to the Portfolio’s shareholders and such shareholders, having had the opportunity to consider other investment options, have chosen to invest in the Portfolio.
| 28 | MainStay VP Wellington Mid Cap Portfolio |
The factors that figured prominently in the Board’s decisions to approve the Repositioning and the New Subadvisory Agreement are summarized in more detail below, and the Board did not consider any factor or information controlling in reaching such decisions.
Nature, Extent and Quality of Services to be Provided by Wellington
In considering the Repositioning and the New Subadvisory Agreement, the Board considered New York Life Investments’ responsibilities as manager of the Portfolio, noting that New York Life Investments is responsible for supervising the Portfolio’s subadvisor. The Board examined the nature, extent and quality of the investment advisory services that Wellington proposed to provide to the Portfolio. Further, the Board evaluated and/or examined the following with regard to Wellington:
| • | experience in providing investment advisory services; |
| • | experience in serving as advisor or subadvisor to other funds with similar strategies as those of the Portfolio, as repositioned, and the performance track record of those funds; |
| • | experience of investment advisory, senior management and administrative personnel; |
| • | overall legal and compliance environment, resources and history and policies and procedures in place with respect to matters that may involve conflicts of interest between the Portfolio’s investments and those of other accounts managed by Wellington; |
| • | New York Life Investments’ and Wellington’s belief that their respective compliance policies, procedures and systems are reasonably designed to prevent violation of the federal securities laws and their commitment to further developing and strengthening compliance programs relating to the MainStay Group of Funds generally and the Portfolio specifically; |
| • | ability to attract and retain qualified investment professionals and willingness to invest in personnel to service and support the Portfolio; |
| • | portfolio construction and risk management processes; |
| • | experience of the Portfolio’s proposed portfolio managers, including with respect to investment strategies similar to those of the Portfolio, as repositioned, the number of accounts managed by the portfolio managers and the method for compensating the portfolio managers; and |
| • | overall reputation, financial condition and assets under management. |
Based on these considerations, the Board concluded that the Portfolio would likely benefit from the nature, extent and quality of the proposed investment advisory services to be provided by Wellington.
Investment Performance
In evaluating the Portfolio’s investment performance, the Board considered investment performance results over various periods in light of the Portfolio’s investment objective, strategies and risks. The Board considered investment reports on, and analysis of, the Portfolio’s
performance provided to the Board throughout the year. These reports include, among other items, information on the Portfolio’s gross and net returns, the Portfolio’s investment performance compared to relevant investment categories and the Portfolio’s benchmark, the Portfolio’s risk-adjusted investment performance and the Portfolio’s investment performance as compared to peer funds, as appropriate, as well as portfolio attribution information and commentary on the effect of market conditions.
The Board also gave weight to its discussions with senior management at New York Life Investments concerning the Portfolio’s investment performance and remediation efforts undertaken by New York Life Investments, and other alternatives to the Repositioning, and the New Subadvisory Agreement considered by New York Life Investments. In addition, the Board considered steps taken to seek to improve the Portfolio’s investment performance and discussions between the Portfolio’s current portfolio management team and the Investment Committee of the Board. The Board further considered that shareholders may benefit from Wellington’s investment process, including its portfolio construction and risk management processes. The Board noted that the Repositioning had not yet been implemented so an investment performance track record for the Portfolio, as repositioned, was not available.
The Board evaluated the Portfolio’s proposed portfolio management team, investment process, strategies and risks. The Board noted that Wellington currently manages one or more portfolios with investment strategies similar to those of the Portfolio, as repositioned. Additionally, the Board considered the historical performance of such portfolio or portfolios and other portfolios managed by the proposed portfolio managers for the Portfolio. Based on these considerations, the Board concluded that the Portfolio was likely to be managed responsibly and capably by Wellington.
Based on these considerations, the Board concluded that the selection of Wellington as the subadvisor to the Portfolio is likely to benefit the Portfolio’s long-term investment performance.
Costs of the Services to be Provided, and Profits to be Realized, by Wellington
The Board considered the anticipated costs of the services to be provided by Wellington under the New Subadvisory Agreement and the profits expected to be realized by Wellington due to its relationship with the Portfolio. The Board considered that Wellington’s subadvisory fee had been negotiated at arm’s-length by New York Life Investments and that these fees would be paid by New York Life Investments, not the Portfolio.
In evaluating the anticipated costs of the services to be provided by Wellington and profits expected to be realized by Wellington, the Board considered, among other factors, Wellington’s investments in, or willingness to invest in, personnel, systems, equipment and other resources and infrastructure to support and further enhance the services proposed to be provided to the Portfolio, and that New York Life Investments would be responsible for paying the subadvisory fee to Wellington. The Board also considered the financial resources of
Board Consideration and Approval of Subadvisory Agreement with Wellington Management Company LLP (Unaudited) (continued)
Wellington and acknowledged that Wellington must be in a position to attract and retain experienced professional personnel and to maintain a strong financial position for Wellington to be able to provide high-quality services to the Portfolio.
In considering anticipated costs and profitability, the Board also considered certain fall-out benefits that may be realized by Wellington due to its relationship with the Portfolio, including reputational and other indirect benefits. The Board recognized, for example, the potential benefits to Wellington from legally permitted “soft-dollar” arrangements by which brokers would provide research and other services to Wellington in exchange for commissions paid by the Portfolio with respect to trades in the Portfolio’s holdings. In addition, the Board requested and received information from New York Life Investments concerning other material business relationships between Wellington and its affiliates and New York Life Investments and its affiliates, and considered the existence of a strategic partnership between New York Life Investments and Wellington that relates to certain current and future products that represented a conflict of interest associated with New York Life Investments’ recommendation to approve the Repositioning and the New Subadvisory Agreement.
The Board took into account the fact that the Portfolio would undergo changes to its principal investment strategies in connection with the Repositioning. The Board noted estimates from New York Life Investments and Wellington that a significant portion of the holdings of the Portfolio would be sold to align the Portfolio’s holdings with the strategies that would be pursued by Wellington. Additionally, the Board considered New York Life Investments’ representation that New York Life Investments would work closely with Wellington to seek to execute the optimal transition strategy and that New York Life Investments would make every effort to minimize potential direct and indirect costs associated with the Repositioning.
The Board considered that any profits realized by Wellington due to its relationship with the Portfolio would be the result of arm’s-length negotiations between New York Life Investments and Wellington, acknowledging that any such profits would be based on fees paid to Wellington by New York Life Investments, not the Portfolio.
Subadvisory Fee and Estimated Total Ordinary Operating Expenses
The Board evaluated the reasonableness of the fee to be paid under the New Subadvisory Agreement and the Portfolio’s estimated total ordinary operating expenses. The Board primarily considered the reasonableness of the management fee to be paid by the Portfolio to New York Life Investments because the subadvisory fee to be paid to Wellington would be paid by New York Life Investments, not the Portfolio. The Board also considered the reasonableness of the subadvisory fee to be paid by New York Life Investments and the amount of the management fee expected to be retained by New York Life Investments.
In assessing the reasonableness of the Portfolio’s proposed fees and estimated expenses, the Board considered information provided by New York Life Investments on fees and expenses of peer funds. The Board also considered that in proposing fees for the Portfolio, New York Life Investments considers the competitive marketplace for mutual funds.
Based on the factors outlined above, the Board concluded that the Portfolio’s management fee and total ordinary operating expenses were within a range that is competitive and support a conclusion that these fees and expenses are reasonable.
Economies of Scale
The Board considered information regarding economies of scale, including whether the Portfolio’s proposed expense structure would permit economies of scale to be appropriately shared with the Portfolio’s beneficial shareholders. The Board also considered a report from New York Life Investments, previously prepared at the request of the Board, that addressed economies of scale, including with respect to the mutual fund business generally and the various ways in which the benefits of economies of scale may be shared with the funds in the MainStay Group of Funds. Although the Board recognized the difficulty of determining economies of scale with precision, the Board acknowledged that economies of scale may be shared with the Portfolio in a number of ways, including, for example, through the imposition of fee breakpoints, initially setting management fee rates at scale or making additional investments to enhance services.
Based on this information, the Board concluded that economies of scale are appropriately reflected for the benefit of the Portfolio’s beneficial shareholders through the Portfolio’s proposed expense structure and other methods to share benefits from economies of scale.
Conclusion
On the basis of the information and factors summarized above, among other information and factors deemed relevant by the Trustees, and the evaluation thereof, the Board, including the Independent Trustees voting separately, unanimously voted to approve the Repositioning and the New Subadvisory Agreement.
| 30 | MainStay VP Wellington Mid Cap Portfolio |
Discussion of the Operation and Effectiveness of the Portfolio's Liquidity Risk Management Program (Unaudited)
In compliance with Rule 22e-4 under the Investment Company Act of 1940, as amended (the “Liquidity Rule”), the Portfolio has adopted and implemented a liquidity risk management program (the “Program”), which New York Life Investment Management LLC believes is reasonably designed to assess and manage the Portfolio's liquidity risk (the risk that the Portfolio could not meet requests to redeem shares issued by the Portfolio without significant dilution of remaining investors’ interests in the Portfolio). The Board of Trustees of MainStay VP Funds Trust (the "Board") designated New York Life Investment Management LLC as administrator of the Program (the “Administrator”). The Administrator has established a Liquidity Risk Management Committee to assist the Administrator in the implementation and day-to-day administration of the Program and to otherwise support the Administrator in fulfilling its responsibilities under the Program.
At a meeting of the Board held on March 8, 2021, the Administrator provided the Board with a written report addressing the Program’s operation and assessing its adequacy and effectiveness of implementation for the period from January 1, 2020 through December 31, 2020 (the "Review Period"), as required under the Liquidity Rule. The report noted that the Administrator concluded that (i) the Program operated effectively to assess and manage the Portfolio's liquidity risk, (ii) the Program has been adequately and effectively implemented to monitor and, as applicable, respond to the Portfolio's liquidity developments and (iii) the Portfolio's investment strategy continues to be appropriate for an open-end fund. In addition, the report discussed notable events that impacted liquidity risk during the Review Period, including the COVID-19 pandemic and the resulting economic shutdown.
In accordance with the Program, the Portfolio's liquidity risk is assessed no less frequently than annually taking into consideration certain factors, as applicable, such as (i) investment strategy and liquidity of portfolio investments, (ii) short-term and long-term cash flow projections and (iii) holdings of cash and cash equivalents, as well as borrowing arrangements and other funding sources. Certain factors are considered under both normal and reasonably foreseeable stressed conditions.
Each Portfolio portfolio investment is classified into one of four liquidity categories. The classification is based on a determination of the number of days it is reasonably expected to take to convert the investment into cash, or sell or dispose of the investment, in current market conditions without significantly changing the market value of the investment. The Administrator has delegated liquidity classification determinations to the Portfolio’s subadvisors, subject to appropriate oversight by the Administrator, and classification determinations are made by taking into account the Portfolio's reasonably anticipated trade size, various market, trading and investment-specific considerations, as well as market depth, and, in certain cases, third-party vendor data.
The Liquidity Rule requires portfolios that do not primarily hold assets that are highly liquid investments to adopt a minimum amount of net assets that must be invested in highly liquid investments that are assets (an “HLIM”). In addition, the Liquidity Rule limits a portfolio's investments in illiquid investments. Specifically, the Liquidity Rule prohibits acquisition of illiquid investments if doing so would result in a portfolio holding more than 15% of its net assets in illiquid investments that are assets. The Program includes provisions reasonably designed to determine, periodically review and comply with the HLIM requirement, as applicable, and to comply with the 15% limit on illiquid investments.
There can be no assurance that the Program will achieve its objectives under all circumstances in the future. Please refer to the Portfolio's prospectus for more information regarding the Portfolio's exposure to liquidity risk and other risks to which it may be subject.
Proxy Voting Record
The Portfolio is required to file with the SEC its proxy voting records for the 12-month period ending June 30 on Form N-PX. The Portfolio's most recent Form N-PX or proxy voting record is available free of charge upon request (i) by calling 800-598-2019; (ii) by visiting New York Life Investments’ website at https://www.nylinvestments.com/mainstay/
products-and-performance/mainstay-vp-funds-trust; or (iii) by visiting the SEC’s website at www.sec.gov.
Shareholder Reports and Quarterly Portfolio Disclosure
The Portfolio is required to file its complete schedule of portfolio holdings with the SEC 60 days after its first and third fiscal quarter on Form N-PORT. The Portfolio's holdings report is available free of charge upon request by calling 800-598-2019 or by visiting the SEC’s website at www.sec.gov.
| 32 | MainStay VP Wellington Mid Cap Portfolio |
This page intentionally left blank
This page intentionally left blank.
MainStay VP Portfolios
MainStay VP offers a wide range of Portfolios. The full array of MainStay VP offerings is listed here, with information about the manager, subadvisors, legal counsel, and independent registered public accounting firm.
Equity
MainStay VP Candriam Emerging Markets Equity Portfolio
MainStay VP Epoch U.S. Equity Yield Portfolio
MainStay VP Fidelity Institutional AM® Utilities Portfolio†
MainStay VP MacKay International Equity Portfolio
MainStay VP MacKay S&P 500 Index Portfolio
MainStay VP Natural Resources Portfolio
MainStay VP Small Cap Growth Portfolio
MainStay VP T. Rowe Price Equity Income Portfolio
MainStay VP Wellington Growth Portfolio
MainStay VP Wellington Mid Cap Portfolio
MainStay VP Wellington Small Cap Portfolio
MainStay VP Wellington U.S. Equity Portfolio
MainStay VP Winslow Large Cap Growth Portfolio
Mixed Asset
MainStay VP Balanced Portfolio
MainStay VP Income Builder Portfolio
MainStay VP Janus Henderson Balanced Portfolio
MainStay VP MacKay Convertible Portfolio
Income
MainStay VP Bond Portfolio
MainStay VP Floating Rate Portfolio
MainStay VP Indexed Bond Portfolio
MainStay VP MacKay Government Portfolio
MainStay VP MacKay High Yield Corporate Bond Portfolio
MainStay VP MacKay Strategic Bond Portfolio
MainStay VP PIMCO Real Return Portfolio
Money Market
MainStay VP U.S. Government Money Market Portfolio
Alternative
MainStay VP CBRE Global Infrastructure Portfolio
MainStay VP IQ Hedge Multi-Strategy Portfolio
Asset Allocation
MainStay VP Conservative Allocation Portfolio
MainStay VP Equity Allocation Portfolio
MainStay VP Growth Allocation Portfolio
MainStay VP Moderate Allocation Portfolio
Manager
New York Life Investment Management LLC
New York, New York
Subadvisors
Brown Advisory LLC
Baltimore, Maryland
Candriam Belgium S.A.*
Brussels, Belgium
CBRE Clarion Securities LLC
Radnor, Pennsylvania
Epoch Investment Partners, Inc.
New York, New York
FIAM LLC
Smithfield, Rhode Island
IndexIQ Advisors LLC*
New York, New York
Janus Capital Management LLC
Denver, Colorado
MacKay Shields LLC*
New York, New York
Mellon Investments Corporation
Boston, Massachusetts
NYL Investors LLC*
New York, New York
Pacific Investment Management Company LLC
Newport Beach, California
Segall Bryant & Hamill, LLC
Chicago, Illinois
T. Rowe Price Associates, Inc.
Baltimore, Maryland
Wellington Management Company LLP
Boston, Massachusetts
Winslow Capital Management, LLC
Minneapolis, Minnesota
Legal Counsel
Dechert LLP
Washington, District of Columbia
Independent Registered Public Accounting Firm
PricewaterhouseCoopers LLP
New York, New York
Distributor
NYLIFE Distributors LLC*
Jersey City, New Jersey
Custodian
JPMorgan Chase Bank, N.A.
New York, New York
Some Portfolios may not be available in all products.
† Fidelity Institutional AM is a registered trade mark of FMR LLC. Used with permission.
* An affiliate of New York Life Investment Management LLC
Not part of the Semiannual Report
2021 Semiannual Report
This report is for the general information of New York Life Variable Annuities and NYLIAC Variable Universal Life Insurance Products policyowners. It must be preceded or accompanied by the appropriate product(s) and funds prospectuses if it is given to anyone who is not an owner of a New York Life variable annuity policy or a NYLIAC Variable Universal Life Insurance Product. This report does not offer for sale or solicit orders to purchase securities.
The performance data quoted in this report represents past performance. Past performance is no guarantee of future results. Due to market volatility and other factors, current performance may be lower or higher than the figures shown. The most recent month-end performance summary for your variable annuity or variable life policy is available by calling 800-598-2019 and is updated periodically on newyorklife.com.
The New York Life Variable Annuities and NYLIAC Variable Universal Life Insurance Products are issued by New York Life Insurance and Annuity Corporation (a Delaware Corporation) and distributed by NYLIFE Distributors LLC (Member FINRA/SIPC).
New York Life Insurance Company
New York Life Insurance and Annuity
Corporation (NYLIAC) (A Delaware Corporation)
51 Madison Avenue, Room 551
New York, NY 10010
newyorklife.com
nylinvestments.com
NYLIFE Distributors LLC, 30 Hudson Street, Jersey City, NJ 07302
New York Life Investment Management LLC is the investment manager to the MainStay VP Funds Trust
©2021 by NYLIFE Distributors LLC. All rights reserved.
You may obtain copies of the Prospectus and the Statement of Additional Information free of charge, upon request, by calling toll-free 800-598-2019 or writing to New York Life Insurance and Annuity Corporation, 51 Madison Avenue, New York, NY 10010.
| Not FDIC Insured | No Bank Guarantee | May Lose Value |
(NYLIAC) NI527
MainStay VP U.S. Government Money Market Portfolio
Message from the President and Semiannual Report
Unaudited | June 30, 2021
Sign up for e-delivery of your shareholder reports. For full details on e-delivery, including who can participate and what you can receive via e-delivery,
please log in to newyorklifeinvestments.com/accounts.
| Not FDIC/NCUA Insured | Not a Deposit | May Lose Value | No Bank Guarantee | Not Insured by Any Government Agency |
This page intentionally left blank
Message from the President
The COVID-19 pandemic continued to afflict our personal lives and broad segments of the U.S. and global economy throughout the six-month reporting period ended June 30, 2021. However, with the deployment of multiple vaccines around the world, including three highly effective versions approved for emergency use in the United States, investors began to turn their attention toward the gradual reopening of the economy and the shape the “new normal” would take.
The first half of the reporting period saw increasing inflationary concerns as fiscal stimulus business reopenings drove accelerating economic growth, rising commodity prices and increased consumer spending. However, the U.S. Federal Reserve noted that price increases were likely to prove temporary and made clear their intention to remain accommodative for the foreseeable future. Accordingly, after moving higher in the first quarter of 2021, interest rates declined in the second quarter.
In response to the uncertain inflation outlook, equity market leadership shifted from value in the first quarter of the year to growth in the second quarter. Nevertheless, investor sentiment remained buoyant throughout the reporting period, with all eleven sectors in the S&P 500® Index, a widely regarded benchmark of market performance, producing positive returns. Energy led the market’s rise fueled by rapidly increasing oil and gas prices, followed by financials and real estate, which benefited from rising interest rates and the economic reopening, respectively. Communication services produced the slowest growth, followed by the traditionally defensive utilities and consumer staples
sectors. In the fixed income market, lower-credit-quality issues tended to outperform their higher-grade counterparts, with high-yield corporate bonds generating the strongest performance. Among securitized products, commercial mortgage-backed securities generally produced the strongest returns, followed by mortgage-backed securities and asset-backed securities, while Treasury securities lagged.
Despite the tremendous progress we’ve seen so far this year, the United States and the world continue to face significant pandemic-related challenges. Newer, more contagious variants of COVID-19 threaten the return of restrictions and lockdowns that could stall the economic recovery. At the same time, supply chain shortages have led to rising prices on everything from laptops to autos, stoking fears of uncontrolled inflation despite reassurance from the U.S. Federal Reserve. At New York Life Investments, we recognize that the shape that the “new normal” eventually takes may differ from our expectations. You can depend on us to keep a sharp watch for the unexpected, and to continue to help you find your way through this rapidly evolving investment landscape.
Sincerely,
Kirk C. Lehneis
President
The opinions expressed are as of the date of this report and are subject to change. There is no guarantee that any forecast made will come to pass. This material does not constitute investment advice and is not intended as an endorsement of any specific investment. Past performance is no guarantee of future results.
Not part of the Semiannual Report
Investors should refer to the Portfolio’s Summary Prospectus and/or Prospectus and consider the Portfolio’s investment objectives, strategies, risks, charges and expenses carefully before investing. The Summary Prospectus and/or Prospectus contain this and other information about the Portfolio. You may obtain copies of the Portfolio’s Summary Prospectus and/or the Prospectus and the Statement of Additional Information free of charge, upon request, by calling toll-free 800-598-2019, by writing to New York Life Insurance and Annuity Corporation, 51 Madison Avenue, Room 251, New York, New York 10010 or by sending an email to MainStayShareholdersServices@nylim.com. These documents are also available at nylinvestments.com/vpdocuments. Please read the Portfolio's Summary Prospectus and/or Prospectus carefully before investing. MainStay VP Funds Trust portfolios are separate account options which are purchased through a variable insurance or variable annuity contract.
Investment and Performance Comparison (Unaudited)
Performance data quoted represents past performance. Past performance is no guarantee of future results. Because of market volatility and other factors, current performance may be lower or higher than the figures shown. Investment return and principal value will fluctuate, and as a result, when shares are redeemed, they may be worth more or less than their original cost. The performance table and graph do not reflect any deduction of sales charges, mortality and expense charges, contract charges or administrative charges. Please refer to the Performance Summary appropriate for your policy. For performance information current to the most recent month-end, please call 800-598-2019 or visit www.newyorklife.com.
An investment in the Portfolio is not insured or guaranteed by the Federal Deposit Insurance Corporation or any other government agency. Although the Portfolio seeks to preserve the value of your investment at $1.00 per share, it is possible to lose money by investing in the Portfolio.
Performance figures may reflect certain fee waivers and/or expense limitations, without which total returns may have been different. For information on current fee waivers and/or expense limitations (if any), please refer to the Notes to Financial Statements.
| Average Annual Total Returns for the Period-Ended June 30, 2021 |
| Class | Inception
Date1 | Six
Months | One
Year | Five
Years | Ten
Years | Gross
Expense
Ratio2 |
| Initial Class Shares | 1/29/1993 | 0.00% | 0.01% | 0.77% | 0.39% | 0.42% |
| | | | | | | |
| 7-Day Current Yield = 0.01%; 7-Day Effective Yield = 0.01%.3 | | | | | | |
| 1. | Effective August 26, 2016 and October 14, 2016, the Portfolio modified its principal investment strategies in connection with commencing operations as a "government money market fund." Consequently the performance information may have been different if the current investment strategies had been in effect during the period prior to the Portfolio commencing operations as a "government money market fund." |
| 2. | The gross expense ratios presented reflect the Portfolio’s “Total Annual Portfolio Operating Expenses” from the most recent Prospectus, as supplemented, and may differ from other expense ratios disclosed in this report. |
3. As of June 30, 2021, MainStay VP U.S. Government Money Market Portfolio had an effective 7-day current yield = 0.01%; 7-day effective yield = 0.01%. The current yield is more reflective of the Portfolio’s earnings than the total return.
| Benchmark Performance | Six
Months | One
Year | Five
Years | Ten
Years |
| Average Lipper Variable Products U.S. Government Money Market Portfolio1 | 0.00% | 0.01% | 0.73% | 0.37% |
| Morningstar Prime Money Market Category Average2 | 0.00 | 0.02 | 0.96 | 0.50 |
| 1. | The Portfolio has selected the Average Variable Products U.S. Government Money Market Portfolio as its primary benchmark. The Average Lipper VP U.S. Government Money Market Portfolio is an equally weighted performance average consisting of funds that invest 99.5% of their assets in cash, government securities and/or repurchase agreements that are collateralized solely by government securities or cash, and have a weighted average maturity of 60 days or less. These funds intend to keep a constant net asset value. |
| 2. | The Morningstar Prime Money Market Category Average is representative of funds that invest in short-term money market securities in order to provide a level of current income that is consistent with the preservation of capital. Results are based on average total returns of similar funds with all dividends and capital gain distributions reinvested. |
Cost in Dollars of a $1,000 Investment in MainStay VP U.S. Government Money Market Portfolio (Unaudited)
The example below is intended to describe the fees and expenses borne by shareholders during the six-month period from January 1, 2021 to June 30, 2021, and the impact of those costs on your investment.
Example
As a shareholder of the Portfolio you incur two types of costs: (1) transaction costs, including exchange fees and sales charges (loads) on purchases (as applicable), and (2) ongoing costs, including management fees, distribution and/or service (12b-1) fees, and other Portfolio expenses (as applicable). This example is intended to help you understand your ongoing costs (in dollars) of investing in the Portfolio and to compare these costs with the ongoing costs of investing in other mutual funds. The example is based on an investment of $1,000 made at the beginning of the six-month period and held for the entire period from January 1, 2021 to June 30, 2021. Shares are only sold in connection with variable life and annuity contracts and the example does not reflect any contract level or transactional fees or expenses. If these costs had been included, your costs would have been higher.
This example illustrates your Portfolio’s ongoing costs in two ways:
Actual Expenses
The second and third data columns in the table below provide information about actual account values and actual expenses. You may use the information in these columns, together with the amount you invested, to estimate the expenses that you paid during the six months ended June
30, 2021. Simply divide your account value by $1,000 (for example, an $8,600 account value divided by $1,000 = 8.6), then multiply the result by the number under the heading entitled “Expenses Paid During Period” to estimate the expenses you paid on your account during this period.
Hypothetical Example for Comparison Purposes
The fourth and fifth data columns in the table below provide information about hypothetical account values and hypothetical expenses based on the Portfolio’s actual expense ratio and an assumed rate of return of 5% per year before expenses, which is not the Portfolio’s actual return. The hypothetical account values and expenses may not be used to estimate the actual ending account balances or expenses you paid for the six-month period shown. You may use this information to compare the ongoing costs of investing in the Portfolio with the ongoing costs of investing in other mutual funds. To do so, compare this 5% hypothetical example with the 5% hypothetical examples that appear in the shareholder reports of the other mutual funds.
Please note that the expenses shown in the table are meant to highlight your ongoing costs only and do not reflect any transactional costs, such as exchange fees or sales charges (loads). Therefore, the fourth and fifth data columns of the table are useful in comparing ongoing costs only and will not help you determine the relative total costs of owning different funds. In addition, if these transactional costs were included, your costs would have been higher.
| Share Class | Beginning
Account
Value
1/1/21 | Ending Account
Value (Based
on Actual
Returns and
Expenses)
6/30/21 | Expenses
Paid
During
Period1 | Ending Account
Value (Based
on Hypothetical
5% Annualized
Return and
Actual Expenses)
6/30/21 | Expenses
Paid
During
Period1 | Net Expense
Ratio
During
Period2 |
| Initial Class Shares | $1,000.00 | $1,000.00 | $0.25 | $1,024.55 | $0.25 | 0.05% |
| 1. | Expenses are equal to the Portfolio’s annualized expense ratio of each class multiplied by the average account value over the period, divided by 365 and multiplied by 181 (to reflect the six-month period). The table above represents the actual expenses incurred during the six-month period. |
| 2. | Expenses are equal to the Portfolio's annualized expense ratio to reflect the six-month period. |
| 6 | MainStay VP U.S. Government Money Market Portfolio |
Portfolio Composition as of June 30, 2021 (Unaudited)
‡ Less than one-tenth of percent.
See Portfolio of Investments beginning on page 9 for specific holdings within these categories. The Portfolio's holdings are subject to change.
Portfolio Management Discussion and Analysis (Unaudited)
Questions answered by NYL Investors LLC, the Portfolio’s Subadvisor.
How did MainStay VP U.S. Government Money Market Portfolio perform relative to its peers during the six months ended June 30, 2021?
For the six months ended June 30, 2021, Initial Class shares of MainStay VP U.S. Government Money Market Portfolio provided a 7-day current yield of 0.01% and a 7-day effective yield of 0.01%. For the six months ended June 30, 2021, Initial Class shares of MainStay VP U.S. Government Money Market Portfolio returned 0.00%. For the same period, the Portfolio performed in line with the 0.00% return of the Average Lipper Variable Products U.S. Government Money Market Portfolio and outperformed the −0.01% return of the Average Lipper Variable Products Money Market Portfolio. For the six months ended June 30, 2021, the Portfolio performed in line with the 0.00% return of the Morningstar Prime Money Market Category.1
What was the Portfolio’s duration2 strategy during the reporting period?
The Portfolio’s strategy was to continue to look for term premium in the market. The duration at the end of the reporting period was 42 days (up from 33 days in December 2020).
What specific factors, risks or market forces prompted significant decisions for the Portfolio during the reporting period?
Because markets remained stable during the reporting period, the Portfolio was not forced to make significant changes to the allocation or strategy.
During the reporting period, which market segments were the strongest contributors to the Portfolio’s performance and which market segments were particularly weak?
The strongest positive contribution to the Portfolio’s performance during the reporting period came from agency discount notes. (Contributions take weightings and total returns into account.) The weakest performing market segment during the same period was repurchase agreements.
Did the Portfolio make any significant purchases or sales during the reporting period?
The Portfolio made no significant purchases or sales during the reporting period.
How did the Portfolio’s sector weightings change during the reporting period?
The Portfolio’s allocation to agency discount notes increased at the expense of its allocation to U.S. Treasury bills.
| 1. | See page 5 for more information on benchmark and peer group returns. |
| 2. | Duration is a measure of the price sensitivity of a fixed-income investment to changes in interest rates. Duration is expressed as a number of years and is considered a more accurate sensitivity gauge than average maturity. |
The opinions expressed are those of the Subadvisor as of the date of this report and are subject to change. There is no guarantee that any forecasts will come to pass. This material does not constitute investment advice and is not intended as an endorsement of any specific investment.
Not all MainStay VP Portfolios and/or share classes are available under all policies.
| 8 | MainStay VP U.S. Government Money Market Portfolio |
Portfolio of Investments June 30, 2021† (Unaudited)
| | Principal
Amount | Value |
| Short-Term Investments 100.0% |
| Government Agency Debt 45.6% |
| Federal Agricultural Mortgage Corp. | | |
| 0.08%, due 7/29/21 | $ 13,000,000 | $ 12,999,191 |
| 0.13%, due 7/30/21 | 21,000,000 | 20,997,801 |
| 0.015%, due 8/17/21 | 30,000,000 | 29,999,412 |
| Federal Farm Credit Banks | | |
| 0.01%, due 7/15/21 | 2,000,000 | 1,999,992 |
| 0.08%, due 7/20/21 | 10,000,000 | 9,999,578 |
| 0.02%, due 8/6/21 | 7,000,000 | 6,999,860 |
| 0.06%, due 8/23/21 | 14,000,000 | 13,998,763 |
| 0.02%, due 8/26/21 | 10,000,000 | 9,999,689 |
| 0.02%, due 8/31/21 | 7,000,000 | 6,999,763 |
| Federal Home Loan Banks | | |
| 0.045%, due 8/4/21 | 27,809,000 | 27,807,818 |
| 0.016%, due 8/11/21 | 6,000,000 | 5,999,891 |
| 0.005%, due 8/13/21 | 47,000,000 | 46,999,719 |
| 0.033%, due 10/27/21 | 20,000,000 | 19,997,837 |
| Federal National Mortgage Association | | |
| 0.04%, due 9/15/21 | 25,000,000 | 24,997,889 |
| Tennessee Valley Authority | | |
| 0.01%, due 7/21/21 | 61,100,000 | 61,099,661 |
Total Government Agency Debt
(Cost $300,896,864) | | 300,896,864 |
| Treasury Debt 41.5% |
| U.S. Treasury Bills (a) | | |
| 0.023%, due 7/13/21 | 83,000,000 | 82,999,361 |
| 0.045%, due 7/20/21 | 3,000,000 | 2,999,928 |
| 0.01%, due 7/22/21 | 45,000,000 | 44,999,737 |
| 0.007%, due 9/7/21 | 14,000,000 | 13,999,802 |
| 0.008%, due 9/14/21 | 52,000,000 | 51,999,129 |
| 0.024%, due 9/28/21 | 77,000,000 | 76,995,527 |
Total Treasury Debt
(Cost $273,993,484) | | 273,993,484 |
| | Principal
Amount | | Value |
| |
| Treasury Repurchase Agreements 12.9% |
RBC Capital Markets LLC
0.05%, dated 6/30/21
due 7/1/21
Proceeds at Maturity $60,246,084
(Collateralized by United States Treasury securities with rates between 0.13% and 2.23% and maturity dates between 10/15/25 and 08/15/46, with a Principal Amount of $56,409,400 and a Market Value of $61,451,107) | 60,246,000 | | $ 60,246,000 |
TD Securities, Inc.
0.05%, dated 6/30/21
due 7/1/21
Proceeds at Maturity $25,000,035
(Collateralized by United States Treasury securities with rates between 1.38% and 2.63% and maturity dates between 10/15/22 and 02/28/23, with a Principal Amount of $24,932,500 and a Market Value of $25,500,073) | 25,000,000 | | 25,000,000 |
Total Treasury Repurchase Agreements
(Cost $85,246,000) | | | 85,246,000 |
Total Short-Term Investments
(Cost $660,136,348) | 100.0% | | 660,136,348 |
| Other Assets, Less Liabilities | (0.0)‡ | | (171,537) |
| Net Assets | 100.0% | | $ 659,964,811 |
| † | Percentages indicated are based on Portfolio net assets. |
| ‡ | Less than one-tenth of a percent. |
| (a) | Interest rate shown represents yield to maturity. |
The notes to the financial statements are an integral part of, and should be read in conjunction with, the financial statements.
9
Portfolio of Investments June 30, 2021† (Unaudited) (continued)
The following is a summary of the fair valuations according to the inputs used as of June 30, 2021, for valuing the Portfolio’s assets:
| Description | Quoted
Prices in
Active
Markets for
Identical
Assets
(Level 1) | | Significant
Other
Observable
Inputs
(Level 2) | | Significant
Unobservable
Inputs
(Level 3) | | Total |
| Asset Valuation Inputs | | | | | | | |
| Investments in Securities (a) | | | | | | | |
| Short-Term Investments | | | | | | | |
| Government Agency Debt | $ — | | $ 300,896,864 | | $ — | | $ 300,896,864 |
| Treasury Debt | — | | 273,993,484 | | — | | 273,993,484 |
| Treasury Repurchase Agreements | — | | 85,246,000 | | — | | 85,246,000 |
| Total Investments in Securities | $ — | | $ 660,136,348 | | $ — | | $ 660,136,348 |
| (a) | For a complete listing of investments and their industries, see the Portfolio of Investments. |
The notes to the financial statements are an integral part of, and should be read in conjunction with, the financial statements.
| 10 | MainStay VP U.S. Government Money Market Portfolio |
Statement of Assets and Liabilities as of June 30, 2021 (Unaudited)
| Assets |
Investment in securities, at value
(amortized cost $574,890,348) | $574,890,348 |
Repurchase agreements, at value
(amortized cost $85,246,000) | 85,246,000 |
| Cash | 696 |
| Receivables: | |
| Interest | 118 |
| Other assets | 156,721 |
| Total assets | 660,293,883 |
| Liabilities |
| Payables: | |
| Manager (See Note 3) | 136,959 |
| Shareholder communication | 59,000 |
| Portfolio shares redeemed | 57,845 |
| Professional fees | 44,532 |
| Custodian | 24,403 |
| Trustees | 753 |
| Dividends payable | 5,580 |
| Total liabilities | 329,072 |
| Net assets | $659,964,811 |
| Composition of Net Assets |
| Shares of beneficial interest outstanding (par value of $.001 per share) unlimited number of shares authorized | $ 659,895 |
| Additional paid-in-capital | 659,289,390 |
| | 659,949,285 |
| Total distributable earnings (loss) | 15,526 |
| Net assets | $659,964,811 |
| Initial Class | |
| Net assets applicable to outstanding shares | $659,964,811 |
| Shares of beneficial interest outstanding | 659,895,481 |
| Net asset value per share outstanding | $ 1.00 |
The notes to the financial statements are an integral part of, and should be read in conjunction with, the financial statements.
11
Statement of Operations for the six months ended June 30, 2021 (Unaudited)
| Investment Income (Loss) |
| Income | |
| Interest | $ 215,435 |
| Other | 72 |
| Total income | 215,507 |
| Expenses | |
| Manager (See Note 3) | 1,461,384 |
| Professional fees | 49,225 |
| Shareholder communication | 32,837 |
| Custodian | 20,898 |
| Trustees | 8,949 |
| Miscellaneous | 4,427 |
| Total expenses before waiver/reimbursement | 1,577,720 |
| Expense waiver/reimbursement from Manager (See Note 3) | (1,400,406) |
| Net expenses | 177,314 |
| Net investment income (loss) | 38,193 |
| Realized Gain (Loss) |
| Net realized gain (loss) on investments | 3,260 |
| Net increase (decrease) in net assets resulting from operations | $ 41,453 |
The notes to the financial statements are an integral part of, and should be read in conjunction with, the financial statements.
| 12 | MainStay VP U.S. Government Money Market Portfolio |
Statements of Changes in Net Assets
for the six months ended June 30, 2021 (Unaudited) and the year ended December 31, 2020
| | 2021 | 2020 |
| Increase (Decrease) in Net Assets |
| Operations: | | |
| Net investment income (loss) | $ 38,193 | $ 1,012,893 |
| Net realized gain (loss) | 3,260 | 7,864 |
| Net increase (decrease) in net assets resulting from operations | 41,453 | 1,020,757 |
| Distributions to shareholders: | | |
| Initial Class | (38,211) | (1,012,896) |
| Capital share transactions: | | |
| Net proceeds from sales of shares | 303,100,606 | 1,078,323,719 |
| Net asset value of shares issued to shareholder in reinvestment of distributions | 32,628 | 1,012,896 |
| Cost of shares redeemed | (470,221,825) | (648,548,415) |
| Increase (decrease) in net assets derived from capital share transactions | (167,088,591) | 430,788,200 |
| Net increase (decrease) in net assets | (167,085,349) | 430,796,061 |
| Net Assets |
| Beginning of period | 827,050,160 | 396,254,099 |
| End of period | $ 659,964,811 | $ 827,050,160 |
The notes to the financial statements are an integral part of, and should be read in conjunction with, the financial statements.
13
Financial Highlights selected per share data and ratios
| | Six months ended
June 30,
2021* | | Year Ended December 31, |
| Initial Class | 2020 | | 2019 | | 2018 | | 2017 | | 2016 |
| Net asset value at beginning of period | $ 1.00 | | $ 1.00 | | $ 1.00 | | $ 1.00 | | $ 1.00 | | $ 1.00 |
| Net investment income (loss) | 0.00‡ | | 0.00‡ | | 0.02 | | 0.01 | | 0.00‡ | | 0.00‡ |
| Net realized and unrealized gain (loss) on investments‡ | 0.00 | | 0.00 | | 0.00 | | 0.00 | | 0.00 | | (0.00) |
| Total from investment operations | 0.00‡ | | 0.00‡ | | 0.02 | | 0.01 | | 0.00‡ | | 0.00‡ |
| Less distributions: | | | | | | | | | | | |
| From net investment income | (0.00)‡ | | 0.00‡ | | (0.02) | | (0.01) | | (0.00)‡ | | (0.00)‡ |
| Net asset value at end of period | $ 1.00 | | $ 1.00 | | $ 1.00 | | $ 1.00 | | $ 1.00 | | $ 1.00 |
| Total investment return (a) | 0.00%‡‡ | | 0.24% | | 1.78% | | 1.38% | | 0.42% | | 0.02% |
| Ratios (to average net assets)/Supplemental Data: | | | | | | | | | | | |
| Net investment income (loss) | 0.01%†† | | 0.15% | | 1.78% | | 1.37% | | 0.41% | | 0.02%(b) |
| Net expenses | 0.05%†† | | 0.16% | | 0.44% | | 0.44% | | 0.44% | | 0.39%(c) |
| Expenses (before waiver/reimbursement) | 0.41%†† | | 0.42% | | 0.44% | | 0.44% | | 0.44% | | 0.49% |
| Net assets at end of period (in 000’s) | $ 659,965 | | $ 827,050 | | $ 396,254 | | $ 512,490 | | $ 496,871 | | $ 657,487 |
| * | Unaudited. |
| ‡‡ | Less than one-tenth percent. |
| ‡ | Less than one cent per share. |
| †† | Annualized. |
| (a) | Total return does not reflect any deduction of sales charges, mortality and expense charges, contract charges or administrative charges. For periods of less than one year, total return is not annualized. |
| (b) | Without the custody fee reimbursement, net investment income (loss) would have been 0.01%. |
| (c) | Without the custody fee reimbursement, net expenses would have been 0.40%. |
The notes to the financial statements are an integral part of, and should be read in conjunction with, the financial statements.
| 14 | MainStay VP U.S. Government Money Market Portfolio |
Notes to Financial Statements (Unaudited)
Note 1–Organization and Business
MainStay VP Funds Trust (the “Fund”) was organized as a Delaware statutory trust on February 1, 2011. The Fund is registered under the Investment Company Act of 1940, as amended (the “1940 Act”), as an open-end management investment company. The Fund is comprised of thirty-one separate series (collectively referred to as the “Portfolios”). These financial statements and notes relate to the MainStay VP U.S. Government Money Market Portfolio (the "Portfolio"), a "diversified” portfolio, as that term is defined in the 1940 Act, as interpreted or modified by regulatory authorities having jurisdiction, from time to time.
Shares of the Portfolio are currently offered to certain separate accounts to fund variable annuity policies and variable universal life insurance policies issued by New York Life Insurance and Annuity Corporation (“NYLIAC”), a wholly-owned subsidiary of New York Life Insurance Company (“New York Life”) and may also be offered to fund variable annuity policies and variable universal life insurance policies issued by other insurance companies. NYLIAC allocates shares of the Portfolios to, among others, certain NYLIAC separate accounts. Shares of the Portfolio are also offered to the MainStay VP Conservative Allocation Portfolio, MainStay VP Moderate Allocation Portfolio, MainStay VP Growth Allocation Portfolio (formerly known as MainStay VP Moderate Growth Allocation Portfolio) and MainStay VP Equity Allocation Portfolio (formerly known as MainStay VP Growth Allocation Portfolio), which operate as “funds-of-funds," and other variable insurance funds.
The following table lists the Portfolio's share class that has been registered and commenced operations:
| Class | Commenced Operations |
| Initial Class | January 29, 1993 |
Shares of the Portfolio are offered and are redeemed at a price equal to their respective net asset value (“NAV”) per share. No sales or redemption charge is applicable to the purchase or redemption of the Portfolio's shares.
The Portfolio's investment objective is to seek a high level of current income while preserving capital and maintaining liquidity.
Note 2–Significant Accounting Policies
The Portfolio is an investment company and accordingly follows the investment company accounting and reporting guidance of the Financial Accounting Standards Board (“FASB”) Accounting Standard Codification Topic 946 Financial Services—Investment Companies. The Portfolio prepares its financial statements in accordance with generally accepted accounting principles (“GAAP”) in the United States of America and follows the significant accounting policies described below.
(A) Valuation of Shares. The Portfolio seeks to maintain a NAV of $1.00 per share, although there is no assurance that it will be able to do so. An investment in the Portfolio, is not insured or guaranteed by the Federal Deposit Insurance Corporation or any other government agency. The Portfolio’s sponsor has no legal obligation to provide financial support
to the Portfolio, and you should not expect that the sponsor will provide financial support to the Portfolio at any time.
(B) Securities Valuation. Securities are valued using the amortized cost method of valuation, unless the use of such method would be inappropriate per the requirements of Rule 2a-7 under the 1940 Act. The amortized cost method involves valuing a security at its cost on the date of purchase and thereafter assuming a constant amortization to maturity of the difference between such cost and the value on maturity date. Amortized cost approximates the current fair value of a security.
The Board of Trustees of the Fund (the "Board") adopted procedures establishing methodologies for the valuation of the Portfolio's securities and other assets and delegated the responsibility for valuation determinations under those procedures to the Valuation Committee of the Fund (the “Valuation Committee”). The procedures state that, subject to the oversight of the Board and unless otherwise noted, the responsibility for the day-to-day valuation of portfolio assets (including fair value measurements for the Portfolio's assets and liabilities) rests with New York Life Investment Management LLC (“New York Life Investments” or the "Manager"), aided to whatever extent necessary by the Subadvisor (as defined in Note 3(A)). To assess the appropriateness of security valuations, the Manager, the Subadvisor or the Portfolio's third-party service provider, who is subject to oversight by the Manager, regularly compares prior day prices, prices on comparable securities and the sale prices to the prior and current day prices and challenges prices with changes exceeding certain tolerance levels with third-party pricing services or broker sources.
The Board authorized the Valuation Committee to appoint a Valuation Subcommittee (the “Subcommittee”) to establish the prices of securities for which market quotations are not readily available or the prices of which are not otherwise readily determinable under the procedures. The Subcommittee meets (in person, via electronic mail or via teleconference) on an as-needed basis. The Valuation Committee meets to ensure that actions taken by the Subcommittee were appropriate.
For those securities valued through either a standardized fair valuation methodology or a fair valuation measurement, the Subcommittee deals with such valuation and the Valuation Committee reviews and affirms, if appropriate, the reasonableness of the valuation based on such methodologies and measurements on a regular basis after considering information that is reasonably available and deemed relevant by the Valuation Committee. Any action taken by the Subcommittee with respect to the valuation of a portfolio security or other asset is submitted for review and ratification (if appropriate) to the Valuation Committee and the Board at the next regularly scheduled meeting.
"Fair value" is defined as the price the Portfolio would reasonably expect to receive upon selling an asset or liability in an orderly transaction to an independent buyer in the principal or most advantageous market for the asset or liability. Fair value measurements are determined within a framework that establishes a three-tier hierarchy that maximizes the use of observable market data and minimizes the use of unobservable inputs
Notes to Financial Statements (Unaudited) (continued)
to establish a classification of fair value measurements for disclosure purposes. "Inputs" refer broadly to the assumptions that market participants would use in pricing the asset or liability, including assumptions about risk, such as the risk inherent in a particular valuation technique used to measure fair value using a pricing model and/or the risk inherent in the inputs for the valuation technique. Inputs may be observable or unobservable. Observable inputs reflect the assumptions market participants would use in pricing the asset or liability based on market data obtained from sources independent of the Portfolio. Unobservable inputs reflect the Portfolio’s own assumptions about the assumptions market participants would use in pricing the asset or liability based on the information available. The inputs or methodology used for valuing assets or liabilities may not be an indication of the risks associated with investing in those assets or liabilities. The three-tier hierarchy of inputs is summarized below.
| • | Level 1—quoted prices in active markets for an identical asset or liability |
| • | Level 2—other significant observable inputs (including quoted prices for a similar asset or liability in active markets, interest rates and yield curves, prepayment speeds, credit risk, etc.) |
| • | Level 3—significant unobservable inputs (including the Portfolio's own assumptions about the assumptions that market participants would use in measuring fair value of an asset or liability) |
Securities valued at amortized cost are not obtained from a quoted price in an active market and are generally categorized as Level 2 in the hierarchy. The level of an asset or liability within the fair value hierarchy is based on the lowest level of an input, both individually and in the aggregate, that is significant to the fair value measurement. As of June 30, 2021, the aggregate value by input level of the Portfolio’s assets and liabilities is included at the end of the Portfolio of Investments.
The Portfolio may use third-party vendor evaluations, whose prices may be derived from one or more of the following standard inputs, among others:
| • Benchmark yields | • Reported trades |
| • Broker/dealer quotes | • Issuer spreads |
| • Two-sided markets | • Benchmark securities |
| • Bids/offers | • Reference data (corporate actions or material event notices) |
| • Industry and economic events | • Comparable bonds |
| • Monthly payment information | |
An asset or liability for which market values cannot be measured using the methodologies described above is valued by methods deemed reasonable in good faith by the Valuation Committee, following the procedures established by the Board, to represent fair value. Under these procedures, the Portfolio may utilize some of the following fair value techniques: multi-dimensional relational pricing models and option adjusted spread pricing. During the six-month period ended June 30, 2021, there were no material changes to the fair value methodologies.
Securities valued in this manner are generally categorized as Level 3 in the hierarchy. No securities held by the Portfolio as of June 30, 2021, were fair valued in such a manner.
Temporary cash investments acquired in excess of 60 days to maturity at the time of purchase are valued using the latest bid prices or using valuations based on a matrix system (which considers such factors as security prices, yields, maturities and ratings), both as furnished by independent pricing services. Temporary cash investments that mature in 60 days or less at the time of purchase ("Short-Term Investments") are valued using the amortized cost method of valuation, unless the use of such method would be inappropriate. The amortized cost method involves valuing a security at its cost on the date of purchase and thereafter assuming a constant amortization to maturity of the difference between such cost and the value on maturity date. Amortized cost approximates the current fair value of a security. Securities valued using the amortized cost method are not valued using quoted prices in an active market and are generally categorized as Level 2 in the hierarchy.
The information above is not intended to reflect an exhaustive list of the methodologies that may be used to value portfolio investments. The valuation procedures permit the use of a variety of valuation methodologies in connection with valuing portfolio investments. The methodology used for a specific type of investment may vary based on the market data available or other considerations. The methodologies summarized above may not represent the specific means by which portfolio investments are valued on any particular business day.
(C) Income Taxes. The Portfolio's policy is to comply with the requirements of the Internal Revenue Code of 1986, as amended (the “Internal Revenue Code”), applicable to regulated investment companies and to distribute all of its taxable income to the shareholders of the Portfolio within the allowable time limits.
The Manager evaluates the Portfolio’s tax positions to determine if the tax positions taken meet the minimum recognition threshold in connection with accounting for uncertainties in income tax positions taken or expected to be taken for the purposes of measuring and recognizing tax liabilities in the financial statements. Recognition of tax benefits of an uncertain tax position is permitted only to the extent the position is “more likely than not” to be sustained assuming examination by taxing authorities. The Manager analyzed the Portfolio's tax positions taken on federal, state and local income tax returns for all open tax years (for up to three tax years) and has concluded that no provisions for federal, state and local income tax are required in the Portfolio's financial statements. The Portfolio's federal, state and local income tax and federal excise tax returns for tax years for which the applicable statutes of limitations have not expired are subject to examination by the Internal Revenue Service and state and local departments of revenue.
(D) Dividends and Distributions to Shareholders. Dividends and distributions are recorded on the ex-dividend date. The Portfolio intends to declare dividends from net investment income, if any, daily and intends to pay them at least monthly and declares and pays distributions from net
| 16 | MainStay VP U.S. Government Money Market Portfolio |
realized capital and currency gains, if any, at least annually. Unless a shareholder elects otherwise, all dividends and distributions are reinvested at NAV in the same class of shares of the Portfolio. Dividends and distributions to shareholders are determined in accordance with federal income tax regulations and may differ from determinations using GAAP.
(E) Security Transactions and Investment Income. The Portfolio records security transactions on the trade date. Realized gains and losses on security transactions are determined using the identified cost method. Dividend income is recognized on the ex-dividend date, net of any foreign tax withheld at the source, and interest income is accrued as earned using the effective interest rate method. Distributions received from real estate investment trusts may be classified as dividends, capital gains and/or return of capital.
(F) Expenses. Expenses of the Fund are allocated to the individual Funds in proportion to the net assets of the respective Portfolios when the expenses are incurred, except where direct allocations of expenses can be made. The expenses borne by the Portfolio, including those of related parties to the Portfolio, are shown in the Statement of Operations.
(G) Use of Estimates. In preparing financial statements in conformity with GAAP, the Manager makes estimates and assumptions that affect the reported amounts and disclosures in the financial statements. Actual results could differ from those estimates and assumptions.
(H) Repurchase Agreements. The Portfolio may enter into repurchase agreements (i.e., buy a security from another party with the agreement that it will be sold back in the future) to earn income. The Portfolio may enter into repurchase agreements only with counterparties, usually financial institutions, that are deemed by the Manager or the Subadvisor to be creditworthy, pursuant to guidelines established by the Board. During the term of any repurchase agreement, the Manager or the Subadvisor will continue to monitor the creditworthiness of the counterparty. Under the 1940 Act, repurchase agreements are considered to be collateralized loans by the Portfolio to the counterparty secured by the securities transferred to the Portfolio.
Repurchase agreements are subject to counterparty risk, meaning the Portfolio could lose money by the counterparty’s failure to perform under the terms of the agreement. The Portfolio mitigates this risk by ensuring the repurchase agreement is collateralized by cash, U.S. government securities, fixed income securities and/or other securities. The collateral is held by the Portfolio's custodian and valued daily on a mark to market basis to determine if the value, including accrued interest, exceeds the repurchase price. In the event of the counterparty’s default on the obligation to repurchase, the Portfolio has the right to liquidate the collateral and apply the proceeds in satisfaction of the obligation. Under certain circumstances, such as in the event of default or bankruptcy by the counterparty, realization and/or retention of the collateral may be limited or subject to delay, to legal proceedings and possible realized loss to the Portfolio. As of June 30, 2021, the Portfolio did not hold any repurchase agreements.
(I) Debt Securities Risk. The ability of issuers of debt securities held by the Portfolio to meet their obligations may be affected by, among other things, economic or political developments in a specific country, industry or region. Debt securities are also subject to the risks associated with changes in interest rates.
Investments in the Portfolio are not guaranteed, even though some of the Portfolio’s underlying investments are guaranteed by the U.S. government or its agencies or instrumentalities. The principal risk of mortgage-related and asset-backed securities is that the underlying debt may be prepaid ahead of schedule, if interest rates fall, thereby reducing the value of the Portfolio’s investment. If interest rates rise, less of the debt may be prepaid and the Portfolio may lose money because the Portfolio may be unable to invest in higher yielding assets. The Portfolio is subject to interest-rate risk and can lose principal value when interest rates rise. Bonds are also subject to credit risk, in which the bond issuer may fail to pay interest and principal in a timely manner.
(J) LIBOR Replacement Risk. The Portfolio may invest in certain debt securities, derivatives or other financial instruments that utilize the London Interbank Offered Rate ("LIBOR"), as a “benchmark” or “reference rate” for various interest rate calculations. The United Kingdom Financial Conduct Authority, which regulates LIBOR, announced that after 2021 it will cease its active encouragement of banks to provide the quotations needed to sustain LIBOR. However, it is possible that certain LIBOR tenors may continue beyond 2021 and the most widely used LIBOR tenors may continue until mid-2023. As a result, it is anticipated that LIBOR will be discontinued or will no longer be sufficiently robust to be representative of its underlying market around that time. Although financial regulators and industry working groups have suggested alternative reference rates, such as European Interbank Offer Rate (“EURIBOR”), Sterling Overnight Interbank Average Rate (“SONIA”) and Secured Overnight Financing Rate (“SOFR”), there are challenges to converting certain contracts and transactions to a new benchmark and neither the full effects of the transition process nor its ultimate outcome is known. New York Life Investments is currently working to assess exposure and will modify contracts as necessary.
The elimination of LIBOR or changes to other reference rates or any other changes or reforms to the determination or supervision of reference rates could have an adverse impact on the market for, or value of, any securities or payments linked to those reference rates, which may adversely affect the Portfolio's performance and/or net asset value. Uncertainty and risk also remain regarding the willingness and ability of issuers and lenders to include revised provisions in new and existing contracts or instruments. Consequently, the transition away from LIBOR to other reference rates may lead to increased volatility and illiquidity in markets that are tied to LIBOR, fluctuations in values of LIBOR-related investments or investments in issuers that utilize LIBOR, increased difficulty in borrowing or refinancing and diminished effectiveness of hedging strategies, adversely affecting the Portfolio's performance. Furthermore, the risks associated with the expected discontinuation of LIBOR and transition may be exacerbated if the work necessary to effect
Notes to Financial Statements (Unaudited) (continued)
an orderly transition to an alternative reference rate is not completed in a timely manner. Because the usefulness of LIBOR as a benchmark could deteriorate during the transition period, these effects could occur prior to the end of 2021 with respect to certain LIBOR tenors or mid-2023 for the remaining LIBOR tenors.
(K) Indemnifications. Under the Fund’s organizational documents, its officers and trustees are indemnified against certain liabilities that may arise out of performance of their duties to the Fund. Additionally, in the normal course of business, the Portfolio enters into contracts with third-party service providers that contain a variety of representations and warranties and that may provide general indemnifications. The Portfolio's maximum exposure under these arrangements is unknown, as this would involve future claims that may be made against the Portfolio that have not yet occurred. The Manager believes that the risk of loss in connection with these potential indemnification obligations is remote. However, there can be no assurance that material liabilities related to such obligations will not arise in the future, which could adversely impact the Portfolio.
Note 3–Fees and Related Party Transactions
(A) Manager and Subadvisor. New York Life Investments, a registered investment adviser and an indirect, wholly-owned subsidiary of New York Life, serves as the Portfolio's Manager pursuant to an Amended and Restated Management Agreement ("Management Agreement"). The Manager provides offices, conducts clerical, recordkeeping and bookkeeping services and keeps most of the financial and accounting records required to be maintained by the Portfolio. Except for the portion of salaries and expenses that are the responsibility of the Portfolio, the Manager pays the salaries and expenses of all personnel affiliated with the Portfolio and certain operational expenses of the Portfolio. The Portfolio reimburses New York Life Investments in an amount equal to the portion of the compensation of the Chief Compliance Officer attributable to the Portfolio. NYL Investors LLC ("NYL Investors" or ''Subadvisor''), a registered investment adviser and a direct, wholly-owned subsidiary of New York Life, serves as Subadvisor to the Portfolio and is responsible for the day-to-day portfolio management of the Portfolio. Pursuant to the terms of a Subadvisory Agreement ("Subadvisory Agreement") between New York Life Investments and NYL Investors, New York Life Investments pays for the services of the Subadvisor.
The Fund, on behalf of the Portfolio, pays New York Life Investments in its capacity as the Portfolio’s investment manager and administrator, pursuant to the Management Agreement, a monthly fee for the services performed and the facilities furnished at an annual rate of 0.40% up to $500 million; 0.35% from $500 million to $1 billion; and 0.30% in excess of $1 billion.
Effective May 1, 2020, New York Life Investments has contractually agreed to waive fees and/or reimburse expenses so that total annual operating expenses (excluding taxes, interest, litigation, extraordinary expenses, brokerage and other transaction expenses relating to the purchase or sale of portfolio investments and acquired (underlying) fund fees and expenses) of Initial Class shares do not exceed 0.28% of
average daily net assets. This agreement will remain in effect until May 1, 2022 and shall renew automatically for one-year terms unless New York Life Investments provides written notice of termination prior to the start of the next term or upon approval of the Board. During the six-month period ended June 30, 2021, the effective management fee rate was 0.38%.
New York Life Investments may voluntarily waive or reimburse expenses of the Fund to the extent it deems appropriate to enhance the yield of the Fund’s during periods when expenses have a significant impact on the yield of the Fund, as applicable, because of low interest rates. This expense limitation policy is voluntary and in addition to any contractual arrangements that may be in place with respect to the Fund and described in the Fund’s prospectus.
During the six-month period ended June 30, 2021, New York Life Investments earned fees from the Portfolio in the amount of $1,461,384 and waived fees and/or reimbursed expenses in the amount of $1,400,406 and paid the Subadvisor fees in the amount of $476,796.
JPMorgan provides sub-administration and sub-accounting services to the Portfolio pursuant to an agreement with New York Life Investments. These services include calculating the daily NAVs of the Portfolio, maintaining the general ledger and sub-ledger accounts for the calculation of the Portfolio's NAVs, and assisting New York Life Investments in conducting various aspects of the Portfolio's administrative operations. For providing these services to the Portfolio, JPMorgan is compensated by New York Life Investments.
Prior to February 22, 2021, these services were provided by State Street.
Pursuant to an agreement between the Fund and New York Life Investments, New York Life Investments is responsible for providing or procuring certain regulatory reporting services for the Portfolio. The Portfolio will reimburse New York Life Investments for the actual costs incurred by New York Life Investments in connection with providing or procuring these services for the Portfolio.
Note 4-Federal Income Tax
The amortized cost also represents the aggregate cost for federal income tax purposes.
During the year ended December 31, 2020, the tax character of distributions paid as reflected in the Statements of Changes in Net Assets was as follows:
| | 2020 |
| Distributions paid from: | |
| Ordinary Income | $1,012,551 |
| Long-Term Capital Gains | 345 |
| Total | $1,012,896 |
| 18 | MainStay VP U.S. Government Money Market Portfolio |
Note 5–Custodian
JPMorgan is the custodian of cash and securities held by the Portfolio. Custodial fees are charged to the Portfolio based on the Portfolio's net assets and/or the market value of securities held by the Portfolio and the number of certain transactions incurred by the Portfolio.
Prior to February 22, 2021, these services were provided by State Street. The services provided by State Street were a direct expense of the Portfolio and are included in the Statement of Operations as Custodian fees which totaled $6,004 for the period January 1, 2021 through February 21, 2021.
Note 6–Capital Share Transactions
Transactions in capital shares for the six-month period ended June 30, 2021 and the year ended December 31, 2020, were as follows:
| Initial Class (at $1 per share) | Shares |
| Six-month period ended June 30, 2021: | |
| Shares sold | 303,070,299 |
| Shares issued to shareholders in reinvestment of distributions | 32,625 |
| Shares redeemed | (470,174,808) |
| Net increase (decrease) | (167,071,884) |
| Year ended December 31, 2020 : | |
| Shares sold | 1,078,220,316 |
| Shares issued to shareholders in reinvestment of distributions | 1,012,804 |
| Shares redeemed | (648,484,735) |
| Net increase (decrease) | 430,748,385 |
Note 7–Other Matters
An outbreak of COVID-19, first detected in December 2019, has developed into a global pandemic and has resulted in travel restrictions, closure of international borders, certain businesses and securities markets, restrictions on securities trading activities, prolonged quarantines, supply chain disruptions, and lower consumer demand, as well as general concern and uncertainty. The continued impact of COVID-19 and related new variants is uncertain and could further adversely affect the global economy, national economies, individual issuers and capital markets in unforeseeable ways and result in a substantial and extended economic downturn. Developments that disrupt global economies and financial markets, such as COVID-19, may magnify factors that affect the Portfolio's performance.
Note 8–Subsequent Events
In connection with the preparation of the financial statements of the Portfolio as of and for the six-month period ended June 30, 2021, events and transactions subsequent to June 30, 2021, through the date the financial statements were issued have been evaluated by the Manager for possible adjustment and/or disclosure. No subsequent events requiring financial statement adjustment or disclosure have been identified.
Proxy Voting Record
The Portfolio is required to file with the SEC its proxy voting records for the 12-month period ending June 30 on Form N-PX. The Portfolio's most recent Form N-PX or proxy voting record is available free of charge upon request (i) by calling 800-598-2019; (ii) by visiting New York Life Investments’ website at https://www.nylinvestments.com/mainstay/
products-and-performance/mainstay-vp-funds-trust; or (iii) by visiting the SEC’s website at www.sec.gov.
Shareholder Reports and Quarterly Portfolio Disclosure
The Portfolio is required to file a Form N-MFP every month disclosing its portfolio holdings. The Portfolio's Form N-MFP is available free of charge upon request by calling 800-598-2019 or by visiting the SEC’s website at www.sec.gov.
| 20 | MainStay VP U.S. Government Money Market Portfolio |
This page intentionally left blank
This page intentionally left blank.
MainStay VP Portfolios
MainStay VP offers a wide range of Portfolios. The full array of MainStay VP offerings is listed here, with information about the manager, subadvisors, legal counsel, and independent registered public accounting firm.
Equity
MainStay VP Candriam Emerging Markets Equity Portfolio
MainStay VP Epoch U.S. Equity Yield Portfolio
MainStay VP Fidelity Institutional AM® Utilities Portfolio†
MainStay VP MacKay International Equity Portfolio
MainStay VP MacKay S&P 500 Index Portfolio
MainStay VP Natural Resources Portfolio
MainStay VP Small Cap Growth Portfolio
MainStay VP T. Rowe Price Equity Income Portfolio
MainStay VP Wellington Growth Portfolio
MainStay VP Wellington Mid Cap Portfolio
MainStay VP Wellington Small Cap Portfolio
MainStay VP Wellington U.S. Equity Portfolio
MainStay VP Winslow Large Cap Growth Portfolio
Mixed Asset
MainStay VP Balanced Portfolio
MainStay VP Income Builder Portfolio
MainStay VP Janus Henderson Balanced Portfolio
MainStay VP MacKay Convertible Portfolio
Income
MainStay VP Bond Portfolio
MainStay VP Floating Rate Portfolio
MainStay VP Indexed Bond Portfolio
MainStay VP MacKay Government Portfolio
MainStay VP MacKay High Yield Corporate Bond Portfolio
MainStay VP MacKay Strategic Bond Portfolio
MainStay VP PIMCO Real Return Portfolio
Money Market
MainStay VP U.S. Government Money Market Portfolio
Alternative
MainStay VP CBRE Global Infrastructure Portfolio
MainStay VP IQ Hedge Multi-Strategy Portfolio
Asset Allocation
MainStay VP Conservative Allocation Portfolio
MainStay VP Equity Allocation Portfolio
MainStay VP Growth Allocation Portfolio
MainStay VP Moderate Allocation Portfolio
Manager
New York Life Investment Management LLC
New York, New York
Subadvisors
Brown Advisory LLC
Baltimore, Maryland
Candriam Belgium S.A.*
Brussels, Belgium
CBRE Clarion Securities LLC
Radnor, Pennsylvania
Epoch Investment Partners, Inc.
New York, New York
FIAM LLC
Smithfield, Rhode Island
IndexIQ Advisors LLC*
New York, New York
Janus Capital Management LLC
Denver, Colorado
MacKay Shields LLC*
New York, New York
Mellon Investments Corporation
Boston, Massachusetts
NYL Investors LLC*
New York, New York
Pacific Investment Management Company LLC
Newport Beach, California
Segall Bryant & Hamill, LLC
Chicago, Illinois
T. Rowe Price Associates, Inc.
Baltimore, Maryland
Wellington Management Company LLP
Boston, Massachusetts
Winslow Capital Management, LLC
Minneapolis, Minnesota
Legal Counsel
Dechert LLP
Washington, District of Columbia
Independent Registered Public Accounting Firm
PricewaterhouseCoopers LLP
New York, New York
Distributor
NYLIFE Distributors LLC*
Jersey City, New Jersey
Custodian
JPMorgan Chase Bank, N.A.
New York, New York
Some Portfolios may not be available in all products.
† Fidelity Institutional AM is a registered trade mark of FMR LLC. Used with permission.
* An affiliate of New York Life Investment Management LLC
Not part of the Semiannual Report
2021 Semiannual Report
This report is for the general information of New York Life Variable Annuities and NYLIAC Variable Universal Life Insurance Products policyowners. It must be preceded or accompanied by the appropriate product(s) and funds prospectuses if it is given to anyone who is not an owner of a New York Life variable annuity policy or a NYLIAC Variable Universal Life Insurance Product. This report does not offer for sale or solicit orders to purchase securities.
The performance data quoted in this report represents past performance. Past performance is no guarantee of future results. Due to market volatility and other factors, current performance may be lower or higher than the figures shown. The most recent month-end performance summary for your variable annuity or variable life policy is available by calling 800-598-2019 and is updated periodically on newyorklife.com.
The New York Life Variable Annuities and NYLIAC Variable Universal Life Insurance Products are issued by New York Life Insurance and Annuity Corporation (a Delaware Corporation) and distributed by NYLIFE Distributors LLC (Member FINRA/SIPC).
New York Life Insurance Company
New York Life Insurance and Annuity
Corporation (NYLIAC) (A Delaware Corporation)
51 Madison Avenue, Room 551
New York, NY 10010
newyorklife.com
nylinvestments.com
NYLIFE Distributors LLC, 30 Hudson Street, Jersey City, NJ 07302
New York Life Investment Management LLC is the investment manager to the MainStay VP Funds Trust
©2021 by NYLIFE Distributors LLC. All rights reserved.
You may obtain copies of the Prospectus and the Statement of Additional Information free of charge, upon request, by calling toll-free 800-598-2019 or writing to New York Life Insurance and Annuity Corporation, 51 Madison Avenue, New York, NY 10010.
| Not FDIC Insured | No Bank Guarantee | May Lose Value |
| 1781646 | MSVPUSGMM10-08/21 |
(NYLIAC) NI510
MainStay VP MacKay Convertible Portfolio
Message from the President and Semiannual Report
Unaudited | June 30, 2021
Sign up for e-delivery of your shareholder reports. For full details on e-delivery, including who can participate and what you can receive via e-delivery,
please log in to newyorklifeinvestments.com/accounts.
| Not FDIC/NCUA Insured | Not a Deposit | May Lose Value | No Bank Guarantee | Not Insured by Any Government Agency |
This page intentionally left blank
Message from the President
The COVID-19 pandemic continued to afflict our personal lives and broad segments of the U.S. and global economy throughout the six-month reporting period ended June 30, 2021. However, with the deployment of multiple vaccines around the world, including three highly effective versions approved for emergency use in the United States, investors began to turn their attention toward the gradual reopening of the economy and the shape the “new normal” would take.
The first half of the reporting period saw increasing inflationary concerns as fiscal stimulus business reopenings drove accelerating economic growth, rising commodity prices and increased consumer spending. However, the U.S. Federal Reserve noted that price increases were likely to prove temporary and made clear their intention to remain accommodative for the foreseeable future. Accordingly, after moving higher in the first quarter of 2021, interest rates declined in the second quarter.
In response to the uncertain inflation outlook, equity market leadership shifted from value in the first quarter of the year to growth in the second quarter. Nevertheless, investor sentiment remained buoyant throughout the reporting period, with all eleven sectors in the S&P 500® Index, a widely regarded benchmark of market performance, producing positive returns. Energy led the market’s rise fueled by rapidly increasing oil and gas prices, followed by financials and real estate, which benefited from rising interest rates and the economic reopening, respectively. Communication services produced the slowest growth, followed by the traditionally defensive utilities and consumer staples
sectors. In the fixed income market, lower-credit-quality issues tended to outperform their higher-grade counterparts, with high-yield corporate bonds generating the strongest performance. Among securitized products, commercial mortgage-backed securities generally produced the strongest returns, followed by mortgage-backed securities and asset-backed securities, while Treasury securities lagged.
Despite the tremendous progress we’ve seen so far this year, the United States and the world continue to face significant pandemic-related challenges. Newer, more contagious variants of COVID-19 threaten the return of restrictions and lockdowns that could stall the economic recovery. At the same time, supply chain shortages have led to rising prices on everything from laptops to autos, stoking fears of uncontrolled inflation despite reassurance from the U.S. Federal Reserve. At New York Life Investments, we recognize that the shape that the “new normal” eventually takes may differ from our expectations. You can depend on us to keep a sharp watch for the unexpected, and to continue to help you find your way through this rapidly evolving investment landscape.
Sincerely,
Kirk C. Lehneis
President
The opinions expressed are as of the date of this report and are subject to change. There is no guarantee that any forecast made will come to pass. This material does not constitute investment advice and is not intended as an endorsement of any specific investment. Past performance is no guarantee of future results.
Not part of the Semiannual Report
Investors should refer to the Portfolio’s Summary Prospectus and/or Prospectus and consider the Portfolio’s investment objectives, strategies, risks, charges and expenses carefully before investing. The Summary Prospectus and/or Prospectus contain this and other information about the Portfolio. You may obtain copies of the Portfolio’s Summary Prospectus and/or the Prospectus and the Statement of Additional Information free of charge, upon request, by calling toll-free 800-598-2019, by writing to New York Life Insurance and Annuity Corporation, 51 Madison Avenue, Room 251, New York, New York 10010 or by sending an email to MainStayShareholdersServices@nylim.com. These documents are also available at nylinvestments.com/vpdocuments. Please read the Portfolio's Summary Prospectus and/or Prospectus carefully before investing. MainStay VP Funds Trust portfolios are separate account options which are purchased through a variable insurance or variable annuity contract.
MainStay VP MacKay Convertible Portfolio
Investment and Performance Comparison (Unaudited)
Performance data quoted represents past performance. Past performance is no guarantee of future results. Because of market volatility and other factors, current performance may be lower or higher than the figures shown. Investment return and principal value will fluctuate, and as a result, when shares are redeemed, they may be worth more or less than their original cost. The performance table and graph do not reflect any deduction of sales charges, mortality and expense charges, contract charges or administrative charges. Please refer to the Performance Summary appropriate for your policy. For performance information current to the most recent month-end, please call 800-598-2019 or visit www.newyorklife.com.
Performance figures may reflect certain fee waivers and/or expense limitations, without which total returns may have been different. For information on current fee waivers and/or expense limitations (if any), please refer to the Notes to Financial Statements.
| Average Annual Total Returns for the Period-Ended June 30, 2021 |
| Class | Inception
Date | Six
Months | One
Year | Five
Years | Ten Years
or Since
Inception | Gross
Expense
Ratio1 |
| Initial Class Shares | 10/1/1996 | 6.01% | 35.53% | 16.26% | 11.12% | 0.61% |
| Service Class Shares | 6/5/2003 | 5.88 | 35.19 | 15.97 | 10.84 | 0.86 |
| Service 2 Class Shares | 4/26/2016 | 5.82 | 35.06 | 15.86 | 15.32 | 0.96 |
| 1. | The gross expense ratios presented reflect the Portfolio’s “Total Annual Portfolio Operating Expenses” from the most recent Prospectus, as supplemented, and may differ from other expense ratios disclosed in this report. |
| Benchmark Performance | Six
Months | One
Year | Five
Years | Ten
Years |
| ICE BofA U.S. Convertible Index1 | 6.90% | 45.75% | 18.86% | 12.85% |
| Morningstar Convertibles Category Average2 | 4.64 | 34.23 | 15.42 | 9.98 |
| 1. | The ICE BofA U.S. Convertible Index is the Portfolio’s primary benchmark. The ICE BofA U.S. Convertible Index is a market-capitalization weighted index of domestic corporate convertible securities. In order to be included in this Index, bonds and preferred stocks must be convertible only to common stock. Results assume reinvestment of all income and capital gains. An investment cannot be made directly in an index. |
| 2. | The Morningstar Convertibles Category Average is representative of funds that are designed to offer some of the capital-appreciation potential of stock portfolios while also supplying some of the safety and yield of bond portfolios. Results are based on average total returns of similar funds with all dividends and capital gain distributions reinvested. |
| 6 | MainStay VP MacKay Convertible Portfolio |
Cost in Dollars of a $1,000 Investment in MainStay VP MacKay Convertible Portfolio (Unaudited)
The example below is intended to describe the fees and expenses borne by shareholders during the six-month period from January 1, 2021 to June 30, 2021, and the impact of those costs on your investment.
Example
As a shareholder of the Portfolio you incur two types of costs: (1) transaction costs, including exchange fees and sales charges (loads) on purchases (as applicable), and (2) ongoing costs, including management fees, distribution and/or service (12b-1) fees, and other Portfolio expenses (as applicable). This example is intended to help you understand your ongoing costs (in dollars) of investing in the Portfolio and to compare these costs with the ongoing costs of investing in other mutual funds. The example is based on an investment of $1,000 made at the beginning of the six-month period and held for the entire period from January 1, 2021 to June 30, 2021. Shares are only sold in connection with variable life and annuity contracts and the example does not reflect any contract level or transactional fees or expenses. If these costs had been included, your costs would have been higher.
This example illustrates your Portfolio’s ongoing costs in two ways:
Actual Expenses
The second and third data columns in the table below provide information about actual account values and actual expenses. You may use the information in these columns, together with the amount you invested, to estimate the expenses that you paid during the six months ended June
30, 2021. Simply divide your account value by $1,000 (for example, an $8,600 account value divided by $1,000 = 8.6), then multiply the result by the number under the heading entitled “Expenses Paid During Period” to estimate the expenses you paid on your account during this period.
Hypothetical Example for Comparison Purposes
The fourth and fifth data columns in the table below provide information about hypothetical account values and hypothetical expenses based on the Portfolio’s actual expense ratio and an assumed rate of return of 5% per year before expenses, which is not the Portfolio’s actual return. The hypothetical account values and expenses may not be used to estimate the actual ending account balances or expenses you paid for the six-month period shown. You may use this information to compare the ongoing costs of investing in the Portfolio with the ongoing costs of investing in other mutual funds. To do so, compare this 5% hypothetical example with the 5% hypothetical examples that appear in the shareholder reports of the other mutual funds.
Please note that the expenses shown in the table are meant to highlight your ongoing costs only and do not reflect any transactional costs, such as exchange fees or sales charges (loads). Therefore, the fourth and fifth data columns of the table are useful in comparing ongoing costs only and will not help you determine the relative total costs of owning different funds. In addition, if these transactional costs were included, your costs would have been higher.
| Share Class | Beginning
Account
Value
1/1/21 | Ending Account
Value (Based
on Actual
Returns and
Expenses)
6/30/21 | Expenses
Paid
During
Period1 | Ending Account
Value (Based
on Hypothetical
5% Annualized
Return and
Actual Expenses)
6/30/21 | Expenses
Paid
During
Period1 | Net Expense
Ratio
During
Period2 |
| Initial Class Shares | $1,000.00 | $1,060.10 | $2.86 | $1,022.02 | $2.81 | 0.56% |
| Service Class Shares | $1,000.00 | $1,058.80 | $4.13 | $1,020.78 | $4.06 | 0.81% |
| Service 2 Class Shares | $1,000.00 | $1,058.20 | $4.64 | $1,020.28 | $4.56 | 0.91% |
| 1. | Expenses are equal to the Portfolio’s annualized expense ratio of each class multiplied by the average account value over the period, divided by 365 and multiplied by 181 (to reflect the six-month period). The table above represents the actual expenses incurred during the six-month period. In addition to the fees and expenses which the Portfolio bears directly, it also indirectly bears a pro rata share of the fees and expenses of the underlying funds in which it invests. Such indirect expenses are not included in the above-reported expense figures. |
| 2. | Expenses are equal to the Portfolio's annualized expense ratio to reflect the six-month period. |
Portfolio Composition as of June 30, 2021 (Unaudited)
See Portfolio of Investments beginning on page 11 for specific holdings within these categories. The Portfolio's holdings are subject to change.
Top Ten Holdings or Issuers Held as of June 30, 2021 (excluding short-term investments) (Unaudited)
| 1. | Danaher Corp., 4.75%-5.00% |
| 2. | Anthem, Inc., 2.75%, due 10/15/42 |
| 3. | Pioneer Natural Resources Co., 0.25%, due 5/15/25 |
| 4. | Microchip Technology, Inc., 1.625%, due 2/15/25–2/15/27 |
| 5. | EQT Corp., 1.75%, due 5/1/26 |
| 6. | Southwest Airlines Co., 1.25%, due 5/1/25 |
| 7. | BioMarin Pharmaceutical, Inc., 0.599%-1.25%, due 8/1/24–5/15/27 |
| 8. | Nice Ltd., (zero coupon), due 9/15/25 |
| 9. | Lumentum Holdings, Inc., 0.25%, due 3/15/24 |
| 10. | NRG Energy, Inc., 2.75%, due 6/1/48 |
| 8 | MainStay VP MacKay Convertible Portfolio |
Portfolio Management Discussion and Analysis (Unaudited)
Answers to the questions reflect the views of portfolio manager Edward Silverstein, CFA, of MacKay Shields LLC, the Portfolio’s Subadvisor.
How did MainStay VP MacKay Convertible Portfolio perform relative to its benchmark and peers during the six months ended June 30, 2021?
For the six months ended June 30, 2021, MainStay VP MacKay Convertible Portfolio returned 6.01% for Initial Class shares, 5.88% for Service Class shares and 5.82% for Service 2 Class shares. Over the same period, all share classes underperformed the 6.90% return of the ICE BofA U.S. Convertible Index (“the Index”), which is the Portfolio’s primary benchmark, and outperformed the 4.64% return of the Morningstar Convertibles Category Average.1
What factors affected the Portfolio’s relative performance during the reporting period?
The Portfolio underperformed the Index largely due to its relatively underweight exposure to the consumer discretionary sector, which included several securities not owned by the Portfolio that made strong positive contributions to the performance of the Index.
During the reporting period, which sectors were the strongest positive contributors to the Portfolio’s relative performance, and which sectors were particularly weak?
The two sectors making the strongest contributions to the Portfolio’s performance relative to the Index were energy and health care. (Contributions take weightings and total returns into account.) The Portfolio held overweight exposure to energy, which benefited from a sharp rise in the price of crude oil and natural gas. Demand for crude increased as global economies began to reopen and travel restrictions were reduced. Natural gas prices rose following bitterly cold weather in the mid-United States in February 2021, followed by record early-summer heat in June that drove increased demand for natural gas to generate power for cooling. In health care, the Portfolio benefited from gains in its two largest holdings, convertible securities of equipment maker Danaher and health plan provider Anthem. Danaher convertibles rose following the company’s announcement of an accretive acquisition, described in greater detail below. Anthem convertibles rose in the absence of significant company-specific news, likely driven higher by increased investor appetite for value-oriented companies, as Anthem is arguably inexpensively valued on a price-to-earnings and free-cash-flow basis.
Relative to the Index, the Portfolio’s two weakest sectors were consumer discretionary and information technology. In the consumer discretionary sector, underweight exposure to electric car maker Tesla hurt the Portfolio’s relative performance. Tesla’s common shares and convertible bonds rose sharply at the beginning of the reporting period when the issuer was a very large component of the U.S. convertible benchmark. During the reporting period, Tesla retired most of its outstanding convertible bonds. As the stock fell from all-time highs, that decline had
limited impact on the Index’s performance, as the company was no longer a large constituent of the Index. The Portfolio was also hurt by not owning the convertible bonds of furniture retailer Wayfair, which contributed meaningfully to the performance of the Index. In the information technology sector, underperformance was driven by weak returns from two of the Portfolio’s largest holdings, communications equipment maker Lumentum and enterprise software solutions provider NICE Systems.
During the reporting period, which individual stocks made the strongest positive contributions to the Portfolio’s absolute performance and which stocks detracted the most?
The Portfolio’s three best-performing individual holdings included the convertible bonds of specialty retailer American Eagle Outfitters and natural gas producer EQT, and the convertible preferred shares of Danaher. American Eagle Outfitters convertible bonds rose after the company reported better-than-expected sales and earnings as pent-up consumer demand boosted results. EQT convertible bonds rose largely in tandem with the surge in natural gas prices. Danaher convertible shares rose after the company announced the $9 billion acquisition of privately held Aldevron, a manufacturer of components used to develop gene therapies.
The Portfolio’s weakest individual holdings were all information technology holdings: the convertible bonds of NICE, software-as-a-service solutions provider RingCentral, and Lumentum. NICE and RingCentral issues declined on little company-specific news. Both were very strong performers last year. We believe the recent investor preference for value over growth companies likely weighed on the performance of both securities. The convertible bonds of Lumentum declined after the company reported disappointing first-quarter 2021 results and provided a weak outlook for the remainder of the year due to slowing sales in China and a loss of market share with Apple.
Did the Portfolio make any significant purchases or sales during the reporting period?
During the reporting period, the Portfolio initiated positions in convertible securities issued by independent power producer AES, automobile maker Ford Motor and oilfield equipment & services provider Oil States International. The Portfolio’s purchase of AES convertible preferred shares was based on the company’s significant free cash flow generation and its increasing use of renewable energy as a source for power generation. The purchase of Ford convertible bonds reflected our belief that the company’s common shares were undervalued based on Ford’s solid free cash flow generation. The Portfolio exchanged holdings of Oil States International convertible bonds for a new issue sold by the company that offered a higher coupon and greater equity
| 1. | See page 5 for more information on benchmark and peer group returns. |
sensitivity. We believed that Oil States common shares were undervalued based on an expected recovery in oilfield activity as a result of higher commodity prices.
During the same period, we sold the Portfolio’s remaining position in Tesla, as the company’s common shares rose to levels we did not believe were supported by fundamentals and valuation. We also trimmed the Portfolio’s holdings of Chart Industries and Enphase Energy, as both companies reached their respective target prices. Finally, we sold the Portfolio’s holding in Aerojet Rocketdyne following the announcement that the company would be acquired by Lockheed-Martin.
How did the Portfolio’s sector weightings change during the reporting period?
During the reporting period, there were no material changes in sector weights. The Portfolio’s largest increases in sector exposure were in energy, utilities and consumer staples. Conversely, there were reductions in exposure to the materials, consumer discretionary and information technology sectors.
How was the Portfolio positioned at the end of the reporting period?
As of June 30, 2021, the Portfolio held overweight exposure relative to the Index in health care, information technology, industrials and energy; and held underweight exposure to financials, real estate, utilities, communication services, materials and consumer discretionary. As of the same date, the Portfolio held market-weight exposure to the consumer staples sector.
The opinions expressed are those of the portfolio manager as of the date of this report and are subject to change. There is no guarantee that any forecasts will come to pass. This material does not constitute investment advice and is not intended as an endorsement of any specific investment.
Not all MainStay VP Portfolios and/or share classes are available under all policies.
| 10 | MainStay VP MacKay Convertible Portfolio |
Portfolio of Investments June 30, 2021† (Unaudited)
| | Principal
Amount | Value |
| Long-Term Bonds 1.5% |
| Corporate Bonds 1.5% |
| Biotechnology 0.6% |
| Bridgebio Pharma, Inc. | | |
| 2.50%, due 3/15/27 | $ 6,895,000 | $ 11,342,275 |
| Oil & Gas 0.0% ‡ |
| Valaris Ltd. | | |
| Series 1145 | | |
| 8.25%, due 4/30/28 | 801,000 | 831,037 |
| Oil & Gas Services 0.1% |
| Weatherford International Ltd. | | |
| 11.00%, due 12/1/24 (a) | 1,137,000 | 1,182,480 |
| Semiconductors 0.8% |
| Silicon Laboratories, Inc. | | |
| 0.625%, due 6/15/25 | 11,949,000 | 16,564,899 |
Total Corporate Bonds
(Cost $37,163,568) | | 29,920,691 |
Total Long-Term Bonds
(Cost $37,163,568) | | 29,920,691 |
| Convertible Securities 90.5% |
| Convertible Bonds 79.8% |
| Airlines 2.8% |
| American Airlines Group, Inc. | | |
| 6.50%, due 7/1/25 | 6,895,000 | 10,842,387 |
| JetBlue Airways Corp. | | |
| 0.50%, due 4/1/26 (a)(b) | 4,623,000 | 4,629,934 |
| Southwest Airlines Co. | | |
| 1.25%, due 5/1/25 | 25,423,000 | 38,627,071 |
| Spirit Airlines, Inc. | | |
| 1.00%, due 5/15/26 | 3,235,000 | 3,099,454 |
| | | 57,198,846 |
| Auto Manufacturers 1.4% |
| Ford Motor Co. | | |
| (zero coupon), due 3/15/26 (a) | 25,312,000 | 28,112,140 |
| Biotechnology 5.7% |
| Apellis Pharmaceuticals, Inc. | | |
| 3.50%, due 9/15/26 | 4,715,000 | 8,728,644 |
| BioMarin Pharmaceutical, Inc. | | |
| 0.599%, due 8/1/24 | 25,312,000 | 26,294,106 |
| 1.25%, due 5/15/27 | 11,674,000 | 11,754,867 |
| | Principal
Amount | Value |
| |
| Biotechnology (continued) |
| Exact Sciences Corp. | | |
| 0.375%, due 3/1/28 | $ 21,770,000 | $ 27,022,012 |
| Guardant Health, Inc. | | |
| (zero coupon), due 11/15/27 (a) | 7,494,000 | 8,566,579 |
| Halozyme Therapeutics, Inc. | | |
| 0.25%, due 3/1/27 (a) | 3,493,000 | 3,259,406 |
| Illumina, Inc. | | |
| (zero coupon), due 8/15/23 (b) | 15,498,000 | 19,585,597 |
| Ionis Pharmaceuticals, Inc. | | |
| (zero coupon), due 4/1/26 (a) | 9,307,000 | 9,164,603 |
| | | 114,375,814 |
| Building Materials 0.9% |
| Patrick Industries, Inc. | | |
| 1.00%, due 2/1/23 | 16,885,000 | 18,383,544 |
| Commercial Services 3.3% |
| Alarm.com Holdings, Inc. | | |
| (zero coupon), due 1/15/26 (a) | 3,250,000 | 2,996,500 |
| Chegg, Inc. | | |
| (zero coupon), due 9/1/26 (a) | 10,000,000 | 10,440,000 |
| Euronet Worldwide, Inc. | | |
| 0.75%, due 3/15/49 | 11,685,000 | 13,364,719 |
| Repay Holdings Corp. | | |
| (zero coupon), due 2/1/26 (a) | 2,180,000 | 2,169,100 |
| Sabre GLBL, Inc. | | |
| 4.00%, due 4/15/25 | 1,185,000 | 2,162,625 |
| Shift4 Payments, Inc. | | |
| (zero coupon), due 12/15/25 (a) | 2,300,000 | 3,112,130 |
| Square, Inc. (a) | | |
| (zero coupon), due 5/1/26 | 14,812,000 | 16,783,847 |
| 0.25%, due 11/1/27 | 13,105,000 | 15,267,325 |
| | | 66,296,246 |
| Computers 2.7% |
| Lumentum Holdings, Inc. | | |
| 0.25%, due 3/15/24 | 24,689,000 | 36,030,677 |
| Parsons Corp. | | |
| 0.25%, due 8/15/25 (a) | 2,878,000 | 3,060,753 |
| Western Digital Corp. | | |
| 1.50%, due 2/1/24 (b)(c) | 4,634,000 | 4,972,861 |
| Zscaler, Inc. | | |
| 0.125%, due 7/1/25 (a) | 6,293,000 | 9,820,113 |
| | | 53,884,404 |
| Diversified Financial Services 0.4% |
| LendingTree, Inc. | | |
| 0.625%, due 6/1/22 | 7,200,000 | 8,536,500 |
The notes to the financial statements are an integral part of, and should be read in conjunction with, the financial statements.
11
Portfolio of Investments June 30, 2021† (Unaudited) (continued)
| | Principal
Amount | Value |
| Convertible Bonds (continued) |
| Electric 1.7% |
| NRG Energy, Inc. | | |
| 2.75%, due 6/1/48 | $ 29,752,000 | $ 34,720,584 |
| Energy-Alternate Sources 2.1% |
| Enphase Energy, Inc. | | |
| (zero coupon), due 3/1/26 (a) | 9,315,000 | 9,151,987 |
| NextEra Energy Partners LP | | |
| (zero coupon), due 11/15/25 (a) | 10,860,000 | 11,739,660 |
| SolarEdge Technologies, Inc. | | |
| (zero coupon), due 9/15/25 (a) | 16,283,000 | 20,435,165 |
| | | 41,326,812 |
| Entertainment 2.2% |
| Live Nation Entertainment, Inc. | | |
| 2.50%, due 3/15/23 | 9,704,000 | 13,598,215 |
| Marriott Vacations Worldwide Corp. | | |
| (zero coupon), due 1/15/26 (a) | 3,060,000 | 3,423,528 |
| Vail Resorts, Inc. | | |
| (zero coupon), due 1/1/26 (a) | 25,384,000 | 26,462,820 |
| | | 43,484,563 |
| Food 0.6% |
| Chefs' Warehouse, Inc. (The) | | |
| 1.875%, due 12/1/24 | 11,724,000 | 12,280,890 |
| Healthcare-Products 3.2% |
| Cantel Medical Corp. | | |
| 3.25%, due 5/15/25 | 2,749,000 | 5,967,048 |
| CONMED Corp. | | |
| 2.625%, due 2/1/24 | 14,887,000 | 24,061,114 |
| Haemonetics Corp. | | |
| (zero coupon), due 3/1/26 (a) | 4,580,000 | 3,864,375 |
| Integra LifeSciences Holdings Corp. | | |
| 0.50%, due 8/15/25 | 8,831,000 | 9,792,696 |
| NuVasive, Inc. | | |
| 0.375%, due 3/15/25 | 12,958,000 | 12,836,519 |
| Omnicell, Inc. | | |
| 0.25%, due 9/15/25 (a) | 1,735,000 | 2,818,507 |
| SmileDirectClub, Inc. | | |
| (zero coupon), due 2/1/26 (a) | 5,580,000 | 4,596,525 |
| | | 63,936,784 |
| Healthcare-Services 4.1% |
| Anthem, Inc. | | |
| 2.75%, due 10/15/42 | 9,296,000 | 50,223,499 |
| | Principal
Amount | Value |
| |
| Healthcare-Services (continued) |
| Teladoc Health, Inc. | | |
| 1.25%, due 6/1/27 | $ 28,389,000 | $ 31,920,592 |
| | | 82,144,091 |
| Internet 8.9% |
| Booking Holdings, Inc. | | |
| 0.90%, due 9/15/21 | 13,680,000 | 14,890,680 |
| Etsy, Inc. | | |
| 0.125%, due 10/1/26 | 9,415,000 | 22,605,415 |
| Expedia Group, Inc. | | |
| (zero coupon), due 2/15/26 (a)(b) | 2,758,000 | 2,992,430 |
| Match Group Financeco 2, Inc. | | |
| 0.875%, due 6/15/26 (a) | 11,153,000 | 21,420,731 |
| Okta, Inc. | | |
| 0.125%, due 9/1/25 | 7,194,000 | 10,391,733 |
| Palo Alto Networks, Inc. | | |
| 0.375%, due 6/1/25 | 8,438,000 | 11,517,870 |
| 0.75%, due 7/1/23 | 13,152,000 | 19,201,920 |
| Q2 Holdings, Inc. | | |
| 0.75%, due 6/1/26 (b) | 2,800,000 | 3,673,600 |
| Shopify, Inc. | | |
| 0.125%, due 11/1/25 | 14,522,000 | 18,980,254 |
| Snap, Inc. | | |
| (zero coupon), due 5/1/27 (a) | 4,625,000 | 4,967,250 |
| 0.75%, due 8/1/26 | 1,000 | 3,015 |
| Twitter, Inc. | | |
| (zero coupon), due 3/15/26 (a) | 6,865,000 | 6,581,819 |
| Uber Technologies, Inc. | | |
| (zero coupon), due 12/15/25 (a) | 12,588,000 | 12,827,172 |
| Wix.com Ltd. | | |
| (zero coupon), due 7/1/23 | 9,769,000 | 20,119,255 |
| Zendesk, Inc. | | |
| 0.625%, due 6/15/25 | 5,370,000 | 7,847,181 |
| | | 178,020,325 |
| Leisure Time 1.4% |
| Carnival Corp. | | |
| 5.75%, due 4/1/23 | 5,612,000 | 15,404,940 |
| NCL Corp. Ltd. | | |
| 5.375%, due 8/1/25 (a) | 2,860,000 | 5,215,210 |
| 6.00%, due 5/15/24 | 1,756,000 | 4,084,456 |
| Royal Caribbean Cruises Ltd. | | |
| 4.25%, due 6/15/23 (a) | 3,070,000 | 4,198,452 |
| | | 28,903,058 |
| Machinery-Diversified 1.3% |
| Chart Industries, Inc. | | |
| 1.00%, due 11/15/24 (a) | 10,278,000 | 26,061,154 |
The notes to the financial statements are an integral part of, and should be read in conjunction with, the financial statements.
| 12 | MainStay VP MacKay Convertible Portfolio |
| | Principal
Amount | Value |
| Convertible Bonds (continued) |
| Media 2.7% |
| Cable One, Inc. | | |
| 1.125%, due 3/15/28 (a) | $ 11,625,000 | $ 11,880,939 |
| DISH Network Corp. | | |
| (zero coupon), due 12/15/25 (a) | 22,607,000 | 26,438,887 |
| Liberty Media Corp. | | |
| 1.375%, due 10/15/23 | 5,512,000 | 7,351,567 |
| Liberty Media Corp-Liberty Formula One | | |
| 1.00%, due 1/30/23 | 6,664,000 | 9,088,863 |
| | | 54,760,256 |
| Oil & Gas 5.0% |
| Centennial Resource Production LLC | | |
| 3.25%, due 4/1/28 | 14,611,000 | 19,295,287 |
| EQT Corp. | | |
| 1.75%, due 5/1/26 | 23,557,000 | 39,354,324 |
| Pioneer Natural Resources Co. | | |
| 0.25%, due 5/15/25 | 25,668,000 | 41,081,634 |
| | | 99,731,245 |
| Oil & Gas Services 2.5% |
| Helix Energy Solutions Group, Inc. | | |
| 6.75%, due 2/15/26 | 18,071,000 | 22,202,031 |
| Oil States International, Inc. | | |
| 1.50%, due 2/15/23 | 1,013,000 | 952,865 |
| 4.75%, due 4/1/26 (a)(b) | 25,625,000 | 27,799,180 |
| | | 50,954,076 |
| Pharmaceuticals 2.9% |
| Dexcom, Inc. | | |
| 0.25%, due 11/15/25 | 28,123,000 | 29,511,573 |
| Neurocrine Biosciences, Inc. | | |
| 2.25%, due 5/15/24 | 11,238,000 | 15,136,462 |
| Pacira BioSciences, Inc. | | |
| 0.75%, due 8/1/25 (a) | 10,608,000 | 11,682,060 |
| 2.375%, due 4/1/22 | 1,094,000 | 1,197,247 |
| | | 57,527,342 |
| Real Estate Investment Trusts 0.6% |
| Pebblebrook Hotel Trust | | |
| 1.75%, due 12/15/26 | 5,863,000 | 6,677,957 |
| Summit Hotel Properties, Inc. | | |
| 1.50%, due 2/15/26 | 6,165,000 | 6,383,857 |
| | | 13,061,814 |
| Retail 3.3% |
| American Eagle Outfitters, Inc. | | |
| 3.75%, due 4/15/25 | 5,261,000 | 22,985,309 |
| | Principal
Amount | Value |
| |
| Retail (continued) |
| Burlington Stores, Inc. | | |
| 2.25%, due 4/15/25 | $ 20,948,000 | $ 33,385,875 |
| Cheesecake Factory, Inc. (The) | | |
| 0.375%, due 6/15/26 | 9,488,000 | 9,387,190 |
| | | 65,758,374 |
| Semiconductors 4.5% |
| Cree, Inc. | | |
| 1.75%, due 5/1/26 | 1,495,000 | 3,252,372 |
| Microchip Technology, Inc. | | |
| 1.625%, due 2/15/25 | 6,103,000 | 20,151,496 |
| 1.625%, due 2/15/27 | 9,215,000 | 20,554,979 |
| Micron Technology, Inc. | | |
| Series D | | |
| 3.125%, due 5/1/32 | 2,310,000 | 19,665,723 |
| ON Semiconductor Corp. | | |
| 1.625%, due 10/15/23 | 8,983,000 | 17,118,791 |
| Rambus, Inc. | | |
| 1.375%, due 2/1/23 | 6,552,000 | 8,657,158 |
| | | 89,400,519 |
| Software 10.9% |
| Akamai Technologies, Inc. | | |
| 0.375%, due 9/1/27 | 18,297,000 | 21,261,114 |
| Atlassian, Inc. | | |
| 0.625%, due 5/1/23 | 7,925,000 | 24,906,700 |
| Bentley Systems, Inc. | | |
| 0.125%, due 1/15/26 (a) | 3,445,000 | 4,121,254 |
| Bill.com Holdings, Inc. | | |
| (zero coupon), due 12/1/25 (a) | 2,885,000 | 3,865,900 |
| Coupa Software, Inc. | | |
| 0.375%, due 6/15/26 | 8,365,000 | 9,691,898 |
| Datadog, Inc. | | |
| 0.125%, due 6/15/25 | 8,148,000 | 10,892,857 |
| Envestnet, Inc. | | |
| 1.75%, due 6/1/23 | 15,677,000 | 19,272,912 |
| Everbridge, Inc. | | |
| 0.125%, due 12/15/24 | 10,466,000 | 14,331,879 |
| Five9, Inc. | | |
| 0.50%, due 6/1/25 (a) | 2,865,000 | 4,249,153 |
| J2 Global, Inc. | | |
| 1.75%, due 11/1/26 (a) | 3,285,000 | 4,202,829 |
| MongoDB, Inc. | | |
| 0.25%, due 1/15/26 | 5,853,000 | 10,590,272 |
| RingCentral, Inc. | | |
| (zero coupon), due 3/1/25 | 28,729,000 | 31,871,234 |
| Slack Technologies, Inc. | | |
| 0.50%, due 4/15/25 | 10,546,000 | 16,023,329 |
The notes to the financial statements are an integral part of, and should be read in conjunction with, the financial statements.
13
Portfolio of Investments June 30, 2021† (Unaudited) (continued)
| | Principal
Amount | Value |
| Convertible Bonds (continued) |
| Software (continued) |
| Splunk, Inc. | | |
| 0.50%, due 9/15/23 | $ 14,072,000 | $ 16,446,650 |
| Workday, Inc. | | |
| 0.25%, due 10/1/22 | 10,554,000 | 17,499,587 |
| Zynga, Inc. | | |
| (zero coupon), due 12/15/26 (a) | 8,495,000 | 9,100,269 |
| | | 218,327,837 |
| Telecommunications 3.6% |
| Infinera Corp. | | |
| 2.50%, due 3/1/27 | 4,490,000 | 6,837,205 |
| InterDigital, Inc. | | |
| 2.00%, due 6/1/24 | 2,860,000 | 3,183,537 |
| Nice Ltd. | | |
| (zero coupon), due 9/15/25 (a)(b) | 34,334,000 | 36,840,107 |
| Viavi Solutions, Inc. | | |
| 1.00%, due 3/1/24 | 14,133,000 | 19,971,696 |
| Vonage Holdings Corp. | | |
| 1.75%, due 6/1/24 | 5,148,000 | 5,763,908 |
| | | 72,596,453 |
| Transportation 0.9% |
| Atlas Air Worldwide Holdings, Inc. | | |
| 2.25%, due 6/1/22 | 16,769,000 | 18,341,932 |
| Trucking & Leasing 0.2% |
| Greenbrier Cos., Inc. (The) | | |
| 2.875%, due 4/15/28 (a) | 3,235,000 | 3,383,810 |
Total Convertible Bonds
(Cost $1,357,659,245) | | 1,601,509,413 |
| |
| | Shares | |
| Convertible Preferred Stocks 10.7% |
| Banks 1.7% |
| Bank of America Corp. | | |
| Series L | | |
| 7.25% (d) | 11,636 | 16,476,576 |
| Wells Fargo & Co. | | |
| Series L | | |
| 7.50% (d) | 12,264 | 18,717,439 |
| | | 35,194,015 |
| | Shares | Value |
| |
| Capital Markets 1.1% |
| KKR & Co., Inc. | | |
| Series C | | |
| 6.00% (e) | 283,400 | $ 21,838,804 |
| Chemicals 0.2% |
| Lyondellbasell Advanced Polymers, Inc. | | |
| 6.00% (d) | 4,110 | 4,315,500 |
| Electric Utilities 0.8% |
| PG&E Corp. | | |
| 5.50% | 154,100 | 15,621,117 |
| Health Care Equipment & Supplies 4.2% |
| Becton Dickinson and Co. | | |
| Series B | | |
| 6.00% (b) | 106,750 | 5,712,192 |
| Danaher Corp. (b) | | |
| Series A | | |
| 4.75% | 34,270 | 61,638,365 |
| Series B | | |
| 5.00% | 11,280 | 16,641,046 |
| | | 83,991,603 |
| Independent Power and Renewable Electricity Producers 0.8% |
| AES Corp. (The) | | |
| 6.87% (b) | 150,600 | 16,200,042 |
| Machinery 1.0% |
| Stanley Black & Decker, Inc. | | |
| 5.25% (b) | 164,200 | 19,823,866 |
| Semiconductors & Semiconductor Equipment 0.9% |
| Broadcom, Inc. | | |
| Series A | | |
| 8.00% (e) | 12,125 | 18,428,424 |
Total Convertible Preferred Stocks
(Cost $192,703,477) | | 215,413,371 |
Total Convertible Securities
(Cost $1,550,362,722) | | 1,816,922,784 |
| Common Stocks 1.6% |
| Banks 0.6% |
| Bank of America Corp. | 267,678 | 11,036,364 |
The notes to the financial statements are an integral part of, and should be read in conjunction with, the financial statements.
| 14 | MainStay VP MacKay Convertible Portfolio |
| | Shares | | Value |
| Common Stocks (continued) |
| Energy Equipment & Services 0.3% |
| Valaris Ltd. (e) | 111,802 | | $ 3,228,842 |
| Weatherford International plc (e) | 157,538 | | 2,867,191 |
| | | | 6,096,033 |
| Semiconductors & Semiconductor Equipment 0.7% |
| Lam Research Corp. | 21,836 | | 14,208,685 |
Total Common Stocks
(Cost $24,231,816) | | | 31,341,082 |
| Short-Term Investments 9.1% |
| Affiliated Investment Company 6.3% |
| MainStay U.S. Government Liquidity Fund, 0.01% (f)(g) | 126,164,447 | | 126,164,447 |
| Unaffiliated Investment Companies 2.8% |
| BlackRock Liquidity FedFund, 0.025% (g)(h) | 35,000,000 | | 35,000,000 |
| Wells Fargo Government Money Market Fund, 0.025% (g)(h) | 21,616,984 | | 21,616,984 |
| | | | 56,616,984 |
Total Short-Term Investments
(Cost $182,781,431) | | | 182,781,431 |
Total Investments
(Cost $1,794,539,537) | 102.7% | | 2,060,965,988 |
| Other Assets, Less Liabilities | (2.7) | | (53,281,333) |
| Net Assets | 100.0% | | $ 2,007,684,655 |
| † | Percentages indicated are based on Portfolio net assets. |
| ‡ | Less than one-tenth of a percent. |
| (a) | May be sold to institutional investors only under Rule 144A or securities offered pursuant to Section 4(a)(2) of the Securities Act of 1933, as amended. |
| (b) | All or a portion of this security was held on loan. As of June 30, 2021, the aggregate market value of securities on loan was $55,809,467; the total market value of collateral held by the Portfolio was $57,073,334. The market value of the collateral held included non-cash collateral in the form of U.S. Treasury securities with a value of $456,350. The Portfolio received cash collateral with a value of $56,616,984. (See Note 2(H)) |
| (c) | Step coupon—Rate shown was the rate in effect as of June 30, 2021. |
| (d) | Security is perpetual and, thus, does not have a predetermined maturity date. The date shown, if applicable, reflects the next call date. |
| (e) | Non-income producing security. |
| (f) | As of June 30, 2021, the Portfolio’s ownership exceeds 5% of the outstanding shares of the Underlying Portfolio's share class. |
| (g) | Current yield as of June 30, 2021. |
| (h) | Represents a security purchased with cash collateral received for securities on loan. |
The notes to the financial statements are an integral part of, and should be read in conjunction with, the financial statements.
15
Portfolio of Investments June 30, 2021† (Unaudited) (continued)
The following is a summary of the fair valuations according to the inputs used as of June 30, 2021, for valuing the Portfolio’s assets:
| Description | Quoted
Prices in
Active
Markets for
Identical
Assets
(Level 1) | | Significant
Other
Observable
Inputs
(Level 2) | | Significant
Unobservable
Inputs
(Level 3) | | Total |
| Asset Valuation Inputs | | | | | | | |
| Investments in Securities (a) | | | | | | | |
| Long-Term Bonds | | | | | | | |
| Corporate Bonds | $ — | | $ 29,920,691 | | $ — | | $ 29,920,691 |
| Total Corporate Bonds | — | | 29,920,691 | | — | | 29,920,691 |
| Convertible Securities | | | | | | | |
| Convertible Bonds | — | | 1,601,509,413 | | — | | 1,601,509,413 |
| Convertible Preferred Stocks | 215,413,371 | | — | | — | | 215,413,371 |
| Total Convertible Securities | 215,413,371 | | 1,601,509,413 | | — | | 1,816,922,784 |
| Common Stocks | 31,341,082 | | — | | — | | 31,341,082 |
| Short-Term Investments | | | | | | | |
| Affiliated Investment Company | 126,164,447 | | — | | — | | 126,164,447 |
| Unaffiliated Investment Companies | 56,616,984 | | — | | — | | 56,616,984 |
| Total Short-Term Investments | 182,781,431 | | — | | — | | 182,781,431 |
| Total Investments in Securities | $ 429,535,884 | | $ 1,631,430,104 | | $ — | | $ 2,060,965,988 |
| (a) | For a complete listing of investments and their industries, see the Portfolio of Investments. |
The notes to the financial statements are an integral part of, and should be read in conjunction with, the financial statements.
| 16 | MainStay VP MacKay Convertible Portfolio |
Statement of Assets and Liabilities as of June 30, 2021 (Unaudited)
| Assets |
Investment in unaffiliated securities, at value
(identified cost $1,668,375,090) including securities on loan of $55,809,467 | $1,934,801,541 |
Investment in affiliated investment companies, at value
(identified cost $126,164,447) | 126,164,447 |
| Receivables: | |
| Dividends and interest | 4,018,383 |
| Portfolio shares sold | 514,726 |
| Securities lending | 36,106 |
| Other assets | 34,853 |
| Total assets | 2,065,570,056 |
| Liabilities |
| Cash collateral received for securities on loan | 56,616,984 |
| Due to custodian | 19,000 |
| Payables: | |
| Manager (See Note 3) | 873,991 |
| NYLIFE Distributors (See Note 3) | 221,218 |
| Shareholder communication | 82,593 |
| Professional fees | 53,546 |
| Custodian | 17,039 |
| Portfolio shares redeemed | 1,030 |
| Total liabilities | 57,885,401 |
| Net assets | $2,007,684,655 |
| Composition of Net Assets |
| Shares of beneficial interest outstanding (par value of $.001 per share) unlimited number of shares authorized | $ 105,705 |
| Additional paid-in-capital | 1,487,027,615 |
| | 1,487,133,320 |
| Total distributable earnings (loss) | 520,551,335 |
| Net assets | $2,007,684,655 |
| Initial Class | |
| Net assets applicable to outstanding shares | $ 916,464,810 |
| Shares of beneficial interest outstanding | 47,990,284 |
| Net asset value per share outstanding | $ 19.10 |
| Service Class | |
| Net assets applicable to outstanding shares | $1,081,288,457 |
| Shares of beneficial interest outstanding | 57,189,631 |
| Net asset value per share outstanding | $ 18.91 |
| Service 2 Class | |
| Net assets applicable to outstanding shares | $ 9,931,388 |
| Shares of beneficial interest outstanding | 525,268 |
| Net asset value and offering price per share outstanding | $ 18.91 |
The notes to the financial statements are an integral part of, and should be read in conjunction with, the financial statements.
17
Statement of Operations for the six months ended June 30, 2021 (Unaudited)
| Investment Income (Loss) |
| Income | |
| Interest | $ 5,688,358 |
| Dividends-unaffiliated | 4,209,796 |
| Securities lending | 162,543 |
| Dividends-affiliated | 8,863 |
| Other | 33 |
| Total income | 10,069,593 |
| Expenses | |
| Manager (See Note 3) | 5,053,850 |
| Distribution/Service—Service Class (See Note 3) | 1,283,282 |
| Distribution/Service—Service 2 Class (See Note 3) | 10,521 |
| Professional fees | 75,182 |
| Shareholder communication | 46,953 |
| Custodian | 14,440 |
| Trustees | 11,787 |
| Shareholder service (See Note 3) | 4,209 |
| Miscellaneous | 13,541 |
| Total expenses | 6,513,765 |
| Net investment income (loss) | 3,555,828 |
| Realized and Unrealized Gain (Loss) |
| Net realized gain (loss) on unaffiliated investments | 163,361,432 |
| Net change in unrealized appreciation (depreciation) on unaffiliated investments | (69,879,181) |
| Net realized and unrealized gain (loss) | 93,482,251 |
| Net increase (decrease) in net assets resulting from operations | $ 97,038,079 |
The notes to the financial statements are an integral part of, and should be read in conjunction with, the financial statements.
| 18 | MainStay VP MacKay Convertible Portfolio |
Statements of Changes in Net Assets
for the six months ended June 30, 2021 (Unaudited) and the year ended December 31, 2020
| | 2021 | 2020 |
| Increase (Decrease) in Net Assets |
| Operations: | | |
| Net investment income (loss) | $ 3,555,828 | $ 4,734,545 |
| Net realized gain (loss) | 163,361,432 | 113,765,608 |
| Net change in unrealized appreciation (depreciation) | (69,879,181) | 186,348,336 |
| Net increase (decrease) in net assets resulting from operations | 97,038,079 | 304,848,489 |
| Distributions to shareholders: | | |
| Initial Class | (7,545,815) | (3,134,899) |
| Service Class | (7,794,509) | (12,798,176) |
| Service 2 Class | (55,976) | (113,691) |
| Total distributions to shareholders | (15,396,300) | (16,046,766) |
| Capital share transactions: | | |
| Net proceeds from sales of shares | 603,372,984 | 347,963,493 |
| Net asset value of shares issued to shareholder in reinvestment of distributions | 15,396,300 | 16,046,766 |
| Cost of shares redeemed | (54,518,222) | (252,348,769) |
| Increase (decrease) in net assets derived from capital share transactions | 564,251,062 | 111,661,490 |
| Net increase (decrease) in net assets | 645,892,841 | 400,463,213 |
| Net Assets |
| Beginning of period | 1,361,791,814 | 961,328,601 |
| End of period | $2,007,684,655 | $1,361,791,814 |
The notes to the financial statements are an integral part of, and should be read in conjunction with, the financial statements.
19
Financial Highlights selected per share data and ratios
| | Six months ended
June 30,
2021* | | Year Ended December 31, |
| Initial Class | 2020 | | 2019 | | 2018 | | 2017 | | 2016 |
| Net asset value at beginning of period | $ 18.17 | | $ 13.60 | | $ 12.31 | | $ 13.29 | | $ 12.28 | | $ 11.86 |
| Net investment income (loss) (a) | 0.05 | | 0.10 | | 0.13 | | 0.17 | | 0.18 | | 0.19 |
| Net realized and unrealized gain (loss) on investments | 1.04 | | 4.74 | | 2.56 | | (0.41) | | 1.28 | | 1.18 |
| Total from investment operations | 1.09 | | 4.84 | | 2.69 | | (0.24) | | 1.46 | | 1.37 |
| Less distributions: | | | | | | | | | | | |
| From net investment income | (0.16) | | (0.11) | | (0.20) | | (0.23) | | (0.23) | | (0.47) |
| From net realized gain on investments | — | | (0.16) | | (1.20) | | (0.51) | | (0.22) | | (0.48) |
| Total distributions | (0.16) | | (0.27) | | (1.40) | | (0.74) | | (0.45) | | (0.95) |
| Net asset value at end of period | $ 19.10 | | $ 18.17 | | $ 13.60 | | $ 12.31 | | $ 13.29 | | $ 12.28 |
| Total investment return (b) | 6.01% | | 36.04% | | 22.46% | | (2.27)% | | 11.99% | | 12.07% |
| Ratios (to average net assets)/Supplemental Data: | | | | | | | | | | | |
| Net investment income (loss) | 0.53%†† | | 0.70% | | 0.94% | | 1.24% | | 1.40% | | 1.59% |
| Net expenses (c) | 0.56%†† | | 0.61% | | 0.61% | | 0.61% | | 0.62% | | 0.64% |
| Portfolio turnover rate | 20% | | 49% | | 26% | | 43% | | 34% | | 39% |
| Net assets at end of period (in 000’s) | $ 916,465 | | $ 370,733 | | $ 202,104 | | $ 177,136 | | $ 227,285 | | $ 162,462 |
| * | Unaudited. |
| †† | Annualized. |
| (a) | Per share data based on average shares outstanding during the period. |
| (b) | Total return does not reflect any deduction of sales charges, mortality and expense charges, contract charges or administrative charges. For periods of less than one year, total return is not annualized. |
| (c) | In addition to the fees and expenses which the Portfolio bears directly, it also indirectly bears a pro-rata share of the fees and expenses of the underlying funds in which it invests. Such indirect expenses are not included in the above expense ratios. |
| | Six months ended
June 30,
2021* | | Year Ended December 31, |
| Service Class | 2020 | | 2019 | | 2018 | | 2017 | | 2016 |
| Net asset value at beginning of period | $ 17.99 | | $ 13.47 | | $ 12.21 | | $ 13.18 | | $ 12.18 | | $ 11.77 |
| Net investment income (loss) (a) | 0.02 | | 0.06 | | 0.09 | | 0.13 | | 0.15 | | 0.16 |
| Net realized and unrealized gain (loss) on investments | 1.04 | | 4.69 | | 2.53 | | (0.40) | | 1.26 | | 1.17 |
| Total from investment operations | 1.06 | | 4.75 | | 2.62 | | (0.27) | | 1.41 | | 1.33 |
| Less distributions: | | | | | | | | | | | |
| From net investment income | (0.14) | | (0.07) | | (0.16) | | (0.19) | | (0.19) | | (0.44) |
| From net realized gain on investments | — | | (0.16) | | (1.20) | | (0.51) | | (0.22) | | (0.48) |
| Total distributions | (0.14) | | (0.23) | | (1.36) | | (0.70) | | (0.41) | | (0.92) |
| Net asset value at end of period | $ 18.91 | | $ 17.99 | | $ 13.47 | | $ 12.21 | | $ 13.18 | | $ 12.18 |
| Total investment return (b) | 5.88% | | 35.70% | | 22.15% | | (2.52)% | | 11.72% | | 11.79% |
| Ratios (to average net assets)/Supplemental Data: | | | | | | | | | | | |
| Net investment income (loss) | 0.26%†† | | 0.44% | | 0.69% | | 0.99% | | 1.15% | | 1.35% |
| Net expenses (c) | 0.81%†† | | 0.86% | | 0.86% | | 0.86% | | 0.87% | | 0.89% |
| Portfolio turnover rate | 20% | | 49% | | 26% | | 43% | | 34% | | 39% |
| Net assets at end of period (in 000’s) | $ 1,081,288 | | $ 982,863 | | $ 752,670 | | $ 592,673 | | $ 565,974 | | $ 476,926 |
| * | Unaudited. |
| †† | Annualized. |
| (a) | Per share data based on average shares outstanding during the period. |
| (b) | Total return does not reflect any deduction of sales charges, mortality and expense charges, contract charges or administrative charges. For periods of less than one year, total return is not annualized. |
| (c) | In addition to the fees and expenses which the Portfolio bears directly, it also indirectly bears a pro-rata share of the fees and expenses of the underlying funds in which it invests. Such indirect expenses are not included in the above expense ratios. |
The notes to the financial statements are an integral part of, and should be read in conjunction with, the financial statements.
| 20 | MainStay VP MacKay Convertible Portfolio |
Financial Highlights selected per share data and ratios
| | Six months ended
June 30,
2021* | | Year Ended December 31, | | April 26, 2016^ through
December 31,
2016 |
| Service Class 2 | 2020 | | 2019 | | 2018 | | 2017 | |
| Net asset value at beginning of period | $ 18.00 | | $ 13.47 | | $ 12.21 | | $ 13.18 | | $ 12.18 | | $ 11.63 |
| Net investment income (loss) (a) | 0.02 | | 0.05 | | 0.08 | | 0.12 | | 0.14 | | 0.11 |
| Net realized and unrealized gain (loss) on investments | 1.02 | | 4.70 | | 2.53 | | (0.40) | | 1.26 | | 1.04 |
| Total from investment operations | 1.04 | | 4.75 | | 2.61 | | (0.28) | | 1.40 | | 1.15 |
| Less distributions: | | | | | | | | | | | |
| From net investment income | (0.13) | | (0.06) | | (0.15) | | (0.18) | | (0.18) | | (0.12) |
| From net realized gain on investments | — | | (0.16) | | (1.20) | | (0.51) | | (0.22) | | (0.48) |
| Total distributions | (0.13) | | (0.22) | | (1.35) | | (0.69) | | (0.40) | | (0.60) |
| Net asset value at end of period | $ 18.91 | | $ 18.00 | | $ 13.47 | | $ 12.21 | | $ 13.18 | | $ 12.18 |
| Total investment return (b) | 5.82% | | 35.57% | | 22.03% | | (2.59)% | | 11.60% | | 10.01% |
| Ratios (to average net assets)/Supplemental Data: | | | | | | | | | | | |
| Net investment income (loss) | 0.17%†† | | 0.32% | | 0.56% | | 0.88% | | 1.05% | | 1.33%†† |
| Net expenses (c) | 0.91%†† | | 0.96% | | 0.96% | | 0.96% | | 0.97% | | 1.00%†† |
| Portfolio turnover rate | $ 20% | | $ 49% | | $ 26% | | $ 43% | | $ 34% | | $ 39% |
| Net assets at end of period (in 000’s) | $ 9,931 | | $ 8,196 | | $ 6,555 | | $ 3,016 | | $ 2,179 | | $ 797 |
| * | Unaudited. |
| ^ | Inception date. |
| †† | Annualized. |
| (a) | Per share data based on average shares outstanding during the period. |
| (b) | Total return does not reflect any deduction of sales charges, mortality and expense charges, contract charges or administrative charges. For periods of less than one year, total return is not annualized. |
| (c) | In addition to the fees and expenses which the Portfolio bears directly, it also indirectly bears a pro-rata share of the fees and expenses of the underlying funds in which it invests. Such indirect expenses are not included in the above expense ratios. |
The notes to the financial statements are an integral part of, and should be read in conjunction with, the financial statements.
21
Notes to Financial Statements (Unaudited)
Note 1–Organization and Business
MainStay VP Funds Trust (the “Fund”) was organized as a Delaware statutory trust on February 1, 2011. The Fund is registered under the Investment Company Act of 1940, as amended (the “1940 Act”), as an open-end management investment company. The Fund is comprised of thirty-one separate series (collectively referred to as the “Portfolios”). These financial statements and notes relate to the MainStay VP MacKay Convertible Portfolio (the "Portfolio"), a "diversified” portfolio, as that term is defined in the 1940 Act, as interpreted or modified by regulatory authorities having jurisdiction, from time to time.
Shares of the Portfolio are currently offered to certain separate accounts to fund variable annuity policies and variable universal life insurance policies issued by New York Life Insurance and Annuity Corporation (“NYLIAC”), a wholly-owned subsidiary of New York Life Insurance Company (“New York Life”) and may also be offered to fund variable annuity policies and variable universal life insurance policies issued by other insurance companies. NYLIAC allocates shares of the Portfolios to, among others, certain NYLIAC separate accounts. Service 2 Class shares of the Portfolio are currently offered to certain separate accounts to fund variable annuity policies and variable universal life insurance policies issued by participating insurance companies. Shares of the Portfolio are also offered to the MainStay VP Conservative Allocation Portfolio, MainStay VP Moderate Allocation Portfolio, MainStay VP Growth Allocation Portfolio (formerly known as MainStay VP Moderate Growth Allocation Portfolio) and MainStay VP Equity Allocation Portfolio (formerly known as MainStay VP Growth Allocation Portfolio), which operate as “funds-of-funds," and other variable insurance funds.
The following table lists the Portfolio's share classes that have been registered and commenced operations:
| Class | Commenced Operations |
| Initial Class | October 1, 1996 |
| Service Class | June 5, 2003 |
| Service 2 Class | April 26, 2016 |
Shares of the Portfolio are offered and are redeemed at a price equal to their respective net asset value (“NAV”) per share. No sales or redemption charge is applicable to the purchase or redemption of the Portfolio's shares. Under the terms of the Fund’s multiple class plan, adopted pursuant to Rule 18f-3 under the 1940 Act, the classes differ in that, among other things, Service Class and Service 2 Class shares of the Portfolio pay a combined distribution and service fee of 0.25% of average daily net assets attributable to Service Class shares of the Portfolio to the Distributor (as defined in Note 3(B)) pursuant to a plan adopted in accordance with Rule 12b-1 under the 1940 Act. Contract owners of variable annuity contracts purchased after June 2, 2003, are permitted to invest only in the Service Class and Service 2 Class shares.
The Portfolio's investment objective is to seek capital appreciation together with current income.
Note 2–Significant Accounting Policies
The Portfolio is an investment company and accordingly follows the investment company accounting and reporting guidance of the Financial Accounting Standards Board (“FASB”) Accounting Standard Codification Topic 946 Financial Services—Investment Companies. The Portfolio prepares its financial statements in accordance with generally accepted accounting principles (“GAAP”) in the United States of America and follows the significant accounting policies described below.
(A) Securities Valuation. Investments are usually valued as of the close of regular trading on the New York Stock Exchange (the "Exchange") (usually 4:00 p.m. Eastern time) on each day the Portfolio is open for business ("valuation date").
The Board of Trustees of the Fund (the "Board") adopted procedures establishing methodologies for the valuation of the Portfolio's securities and other assets and delegated the responsibility for valuation determinations under those procedures to the Valuation Committee of the Fund (the “Valuation Committee”). The procedures state that, subject to the oversight of the Board and unless otherwise noted, the responsibility for the day-to-day valuation of portfolio assets (including fair value measurements for the Portfolio's assets and liabilities) rests with New York Life Investment Management LLC (“New York Life Investments” or the "Manager"), aided to whatever extent necessary by the Subadvisor (as defined in Note 3(A)). To assess the appropriateness of security valuations, the Manager, the Subadvisor or the Portfolio's third-party service provider, who is subject to oversight by the Manager, regularly compares prior day prices, prices on comparable securities and the sale prices to the prior and current day prices and challenges prices with changes exceeding certain tolerance levels with third-party pricing services or broker sources.
The Board authorized the Valuation Committee to appoint a Valuation Subcommittee (the “Subcommittee”) to establish the prices of securities for which market quotations are not readily available or the prices of which are not otherwise readily determinable under the procedures. The Subcommittee meets (in person, via electronic mail or via teleconference) on an as-needed basis. The Valuation Committee meets to ensure that actions taken by the Subcommittee were appropriate.
For those securities valued through either a standardized fair valuation methodology or a fair valuation measurement, the Subcommittee deals with such valuation and the Valuation Committee reviews and affirms, if appropriate, the reasonableness of the valuation based on such methodologies and measurements on a regular basis after considering information that is reasonably available and deemed relevant by the Valuation Committee. Any action taken by the Subcommittee with respect to the valuation of a portfolio security or other asset is submitted for review and ratification (if appropriate) to the Valuation Committee and the Board at the next regularly scheduled meeting.
"Fair value" is defined as the price the Portfolio would reasonably expect to receive upon selling an asset or liability in an orderly transaction to an independent buyer in the principal or most advantageous market for the
| 22 | MainStay VP MacKay Convertible Portfolio |
asset or liability. Fair value measurements are determined within a framework that establishes a three-tier hierarchy that maximizes the use of observable market data and minimizes the use of unobservable inputs to establish a classification of fair value measurements for disclosure purposes. "Inputs" refer broadly to the assumptions that market participants would use in pricing the asset or liability, including assumptions about risk, such as the risk inherent in a particular valuation technique used to measure fair value using a pricing model and/or the risk inherent in the inputs for the valuation technique. Inputs may be observable or unobservable. Observable inputs reflect the assumptions market participants would use in pricing the asset or liability based on market data obtained from sources independent of the Portfolio. Unobservable inputs reflect the Portfolio’s own assumptions about the assumptions market participants would use in pricing the asset or liability based on the information available. The inputs or methodology used for valuing assets or liabilities may not be an indication of the risks associated with investing in those assets or liabilities. The three-tier hierarchy of inputs is summarized below.
| • | Level 1—quoted prices in active markets for an identical asset or liability |
| • | Level 2—other significant observable inputs (including quoted prices for a similar asset or liability in active markets, interest rates and yield curves, prepayment speeds, credit risk, etc.) |
| • | Level 3—significant unobservable inputs (including the Portfolio's own assumptions about the assumptions that market participants would use in measuring fair value of an asset or liability) |
The level of an asset or liability within the fair value hierarchy is based on the lowest level of an input, both individually and in the aggregate, that is significant to the fair value measurement. The aggregate value by input level of the Portfolio’s assets and liabilities as of June 30, 2021, is included at the end of the Portfolio of Investments.
The Portfolio may use third-party vendor evaluations, whose prices may be derived from one or more of the following standard inputs, among others:
| • Benchmark yields | • Reported trades |
| • Broker/dealer quotes | • Issuer spreads |
| • Two-sided markets | • Benchmark securities |
| • Bids/offers | • Reference data (corporate actions or material event notices) |
| • Industry and economic events | • Comparable bonds |
| • Monthly payment information | |
An asset or liability for which market values cannot be measured using the methodologies described above is valued by methods deemed reasonable in good faith by the Valuation Committee, following the procedures established by the Board, to represent fair value. Under these procedures, the Portfolio generally uses a market-based approach which may use related or comparable assets or liabilities, recent transactions, market multiples, book values and other relevant information. The
Portfolio may also use an income-based valuation approach in which the anticipated future cash flows of the asset or liability are discounted to calculate fair value. Discounts may also be applied due to the nature and/or duration of any restrictions on the disposition of the asset or liability. Fair value represents a good faith approximation of the value of a security. Fair value determinations involve the consideration of a number of subjective factors, an analysis of applicable facts and circumstances and the exercise of judgment. As a result, it is possible that the fair value for a security determined in good faith in accordance with the Portfolio's valuation procedures may differ from valuations for the same security determined by other funds using their own valuation procedures. Although the Portfolio's valuation procedures are designed to value a security at the price the Portfolio may reasonably expect to receive upon the security's sale in an orderly transaction, there can be no assurance that any fair value determination thereunder would, in fact, approximate the amount that the Portfolio would actually realize upon the sale of the security or the price at which the security would trade if a reliable market price were readily available. During the six-month period ended June 30, 2021, there were no material changes to the fair value methodologies.
Securities which may be valued in this manner include, but are not limited to: (i) a security for which trading has been halted or suspended; (ii) a debt security that has recently gone into default and for which there is not a current market quotation; (iii) a security of an issuer that has entered into a restructuring; (iv) a security that has been delisted from a national exchange; (v) a security for which the market price is not readily available from a third-party pricing source or, if so provided, does not, in the opinion of the Manager or the Subadvisor, reflect the security's market value; (vi) a security subject to trading collars for which no or limited trading takes place; and (vii) a security whose principal market has been temporarily closed at a time when, under normal conditions, it would be open. Securities valued in this manner are generally categorized as Level 3 in the hierarchy. No securities held by the Portfolio as of June 30, 2021 were fair valued in such a manner.
Equity securities are valued at the last quoted sales prices as of the close of regular trading on the relevant exchange on each valuation date. Securities that are not traded on the valuation date are valued at the mean of the last quoted bid and ask prices. Prices are normally taken from the principal market in which each security trades. These securities are generally categorized as Level 1 in the hierarchy.
Investments in mutual funds, including money market funds, are valued at their respective NAVs at the close of business each day on the valuation date. These securities are generally categorized as Level 1 in the hierarchy.
Debt securities (other than convertible and municipal bonds) are valued at the evaluated bid prices (evaluated mean prices in the case of convertible and municipal bonds) supplied by a pricing agent or broker selected by the Manager, in consultation with the Subadvisor. The evaluations are market-based measurements processed through a pricing application and represents the pricing agent’s good faith determination as to what a holder may receive in an orderly transaction under market conditions. The
Notes to Financial Statements (Unaudited) (continued)
rules-based logic utilizes valuation techniques that reflect participants’ assumptions and vary by asset class and per methodology, maximizing the use of relevant observable data including quoted prices for similar assets, benchmark yield curves and market corroborated inputs. The evaluated bid or mean prices are deemed by the Manager, in consultation with the Subadvisor, to be representative of market values at the regular close of trading of the Exchange on each valuation date. Debt securities purchased on a delayed delivery basis are marked to market daily until settlement at the forward settlement date. Debt securities, including corporate bonds, U.S. government and federal agency bonds, municipal bonds, foreign bonds, convertible bonds, asset-backed securities and mortgage-backed securities are generally categorized as Level 2 in the hierarchy.
Temporary cash investments acquired in excess of 60 days to maturity at the time of purchase are valued using the latest bid prices or using valuations based on a matrix system (which considers such factors as security prices, yields, maturities and ratings), both as furnished by independent pricing services. Temporary cash investments that mature in 60 days or less at the time of purchase ("Short-Term Investments") are valued using the amortized cost method of valuation, unless the use of such method would be inappropriate. The amortized cost method involves valuing a security at its cost on the date of purchase and thereafter assuming a constant amortization to maturity of the difference between such cost and the value on maturity date. Amortized cost approximates the current fair value of a security. Securities valued using the amortized cost method are not valued using quoted prices in an active market and are generally categorized as Level 2 in the hierarchy.
The information above is not intended to reflect an exhaustive list of the methodologies that may be used to value portfolio investments. The valuation procedures permit the use of a variety of valuation methodologies in connection with valuing portfolio investments. The methodology used for a specific type of investment may vary based on the market data available or other considerations. The methodologies summarized above may not represent the specific means by which portfolio investments are valued on any particular business day.
(B) Income Taxes. The Portfolio's policy is to comply with the requirements of the Internal Revenue Code of 1986, as amended (the “Internal Revenue Code”), applicable to regulated investment companies and to distribute all of its taxable income to the shareholders of the Portfolio within the allowable time limits.
The Manager evaluates the Portfolio’s tax positions to determine if the tax positions taken meet the minimum recognition threshold in connection with accounting for uncertainties in income tax positions taken or expected to be taken for the purposes of measuring and recognizing tax liabilities in the financial statements. Recognition of tax benefits of an uncertain tax position is permitted only to the extent the position is “more likely than not” to be sustained assuming examination by taxing authorities. The Manager analyzed the Portfolio's tax positions taken on federal, state and local income tax returns for all open tax years (for up to three tax years) and has concluded that no provisions for federal, state
and local income tax are required in the Portfolio's financial statements. The Portfolio's federal, state and local income tax and federal excise tax returns for tax years for which the applicable statutes of limitations have not expired are subject to examination by the Internal Revenue Service and state and local departments of revenue.
(C) Foreign Taxes. The Portfolio may be subject to foreign taxes on income and other transaction-based taxes imposed by certain countries in which it invests. A portion of the taxes on gains on investments or currency purchases/repatriation may be reclaimable. The Portfolio will accrue such taxes and reclaims as applicable, based upon its current interpretation of tax rules and regulations that exist in the markets in which it invests.
The Portfolio may be subject to taxation on realized capital gains, repatriation proceeds and other transaction-based taxes imposed by certain countries in which it invests. The Portfolio will accrue such taxes as applicable based upon its current interpretation of tax rules and regulations that exist in the market in which it invests. Capital gains taxes relating to positions still held are reflected as a liability in the Statement of Assets and Liabilities, as well as an adjustment to the Portfolio's net unrealized appreciation (depreciation). Taxes related to capital gains realized, if any, are reflected as part of net realized gain (loss) in the Statement of Operations. Changes in tax liabilities related to capital gains taxes on unrealized investment gains, if any, are reflected as part of the change in net unrealized appreciation (depreciation) on investments in the Statement of Operations. Transaction-based charges are generally assessed as a percentage of the transaction amount.
(D) Dividends and Distributions to Shareholders. Dividends and distributions are recorded on the ex-dividend date. The Portfolio intends to declare and pay dividends from net investment income, if any, at least quarterly and distributions from net realized capital and currency gains, if any, at least annually. Unless a shareholder elects otherwise, all dividends and distributions are reinvested at NAV in the same class of shares of the Portfolio. Dividends and distributions to shareholders are determined in accordance with federal income tax regulations and may differ from determinations using GAAP.
(E) Security Transactions and Investment Income. The Portfolio records security transactions on the trade date. Realized gains and losses on security transactions are determined using the identified cost method. Dividend income is recognized on the ex-dividend date, net of any foreign tax withheld at the source, and interest income is accrued as earned using the effective interest rate method. Distributions received from real estate investment trusts may be classified as dividends, capital gains and/or return of capital. Discounts and premiums on securities purchased for the Portfolio are accreted and amortized, respectively, on the effective interest rate method.
Investment income and realized and unrealized gains and losses on investments of the Portfolio are allocated pro rata to the separate classes of shares based upon their relative net assets on the date the income is earned or realized and unrealized gains and losses are incurred.
| 24 | MainStay VP MacKay Convertible Portfolio |
The Portfolio may place a debt security on non-accrual status and reduce related interest income by ceasing current accruals and writing off all or a portion of any interest receivables when the collection of all or a portion of such interest has become doubtful. A debt security is removed from non-accrual status when the issuer resumes interest payments or when collectability of interest is reasonably assured.
(F) Expenses. Expenses of the Fund are allocated to the individual Portfolios in proportion to the net assets of the respective Portfolios when the expenses are incurred, except where direct allocations of expenses can be made. Expenses (other than fees incurred under the distribution and service plans and shareholder service plans, further discussed in Note 3(B), which are charged directly to the Service Class and Service 2 Class shares, as applicable) are allocated to separate classes of shares pro rata based upon their relative net assets on the date the expenses are incurred. The expenses borne by the Portfolio, including those of related parties to the Portfolio, are shown in the Statement of Operations.
Additionally, the Portfolio may invest in mutual funds, which are subject to management fees and other fees that may cause the costs of investing in mutual funds to be greater than the costs of owning the underlying securities directly. These indirect expenses of mutual funds are not included in the amounts shown as expenses in the Statement of Operations or in the expense ratios included in the Financial Highlights.
(G) Use of Estimates. In preparing financial statements in conformity with GAAP, the Manager makes estimates and assumptions that affect the reported amounts and disclosures in the financial statements. Actual results could differ from those estimates and assumptions.
(H) Securities Lending. In order to realize additional income, the Portfolio may engage in securities lending, subject to the limitations set forth in the 1940 Act and relevant guidance by the staff of the Securities and Exchange Commission (“SEC”). If the Portfolio engages in securities lending, the Portfolio will lend through its custodian, JPMorgan Chase Bank, N.A., ("JPMorgan"), acting as securities lending agent on behalf of the Portfolio. Under the current arrangement, JPMorgan will manage the Portfolio's collateral in accordance with the securities lending agency agreement between the Portfolio and JPMorgan, and indemnify the Portfolio against counterparty risk. The loans will be collateralized by cash (which may be invested in a money market fund) and/or non-cash collateral (which may include U.S. Treasury securities and/or U.S. government agency securities issued or guaranteed by the United States government or its agencies or instrumentalities) at least equal at all times to the market value of the securities loaned. The Portfolio bears the risk of delay in recovery of, or loss of rights in, the securities loaned. The Portfolio may also record a realized gain or loss on securities deemed sold due to a borrower’s inability to return securities on loan. The Portfolio bears the risk of any loss on investment of cash collateral. The Portfolio will receive compensation for lending its securities in the form of fees or it will retain a portion of interest earned on the investment of any cash collateral. The Portfolio will also continue to receive interest and dividends on the securities loaned and any gain or loss in the market price of the securities loaned that may occur during the term of the loan will be for
the account of the Portfolio. Income earned from securities lending activities, if any, is reflected in the Statement of Operations. Securities on loan as of June 30, 2021, are shown in the Portfolio of Investments.
Prior to February 22, 2021, these services were provided by State Street Bank and Trust Company (“State Street”).
(I) Debt and Convertible Securities Risk. The ability of issuers of debt securities held by the Portfolio to meet their obligations may be affected by, among other things, economic or political developments in a specific country, industry or region. Debt securities are also subject to the risks associated with changes in interest rates.
Convertible securities may be subordinate to other securities. In part, the total return for a convertible security depends upon the performance of the underlying stock into which it can be converted. Also, issuers of convertible securities are often not as strong financially as those issuing securities with higher credit ratings, are more likely to encounter financial difficulties and typically are more vulnerable to changes in the economy, such as a recession or a sustained period of rising interest rates, which could affect their ability to make interest and principal payments.
(J) Indemnifications. Under the Fund’s organizational documents, its officers and trustees are indemnified against certain liabilities that may arise out of performance of their duties to the Fund. Additionally, in the normal course of business, the Portfolio enters into contracts with third-party service providers that contain a variety of representations and warranties and that may provide general indemnifications. The Portfolio's maximum exposure under these arrangements is unknown, as this would involve future claims that may be made against the Portfolio that have not yet occurred. The Manager believes that the risk of loss in connection with these potential indemnification obligations is remote. However, there can be no assurance that material liabilities related to such obligations will not arise in the future, which could adversely impact the Portfolio.
Note 3–Fees and Related Party Transactions
(A) Manager and Subadvisor. New York Life Investments, a registered investment adviser and an indirect, wholly-owned subsidiary of New York Life, serves as the Portfolio's Manager, pursuant to an Amended and Restated Management Agreement ("Management Agreement"). The Manager provides offices, conducts clerical, recordkeeping and bookkeeping services and keeps most of the financial and accounting records required to be maintained by the Portfolio. Except for the portion of salaries and expenses that are the responsibility of the Portfolio, the Manager pays the salaries and expenses of all personnel affiliated with the Portfolio and certain operational expenses of the Portfolio. The Portfolio reimburses New York Life Investments in an amount equal to the portion of the compensation of the Chief Compliance Officer attributable to the Portfolio. MacKay Shields LLC ("MacKay Shields" or the "Subadvisor"), a registered investment adviser and an indirect, wholly-owned subsidiary of New York Life, serves as Subadvisor to the Portfolio and is responsible for the day-to-day portfolio management of the Portfolio. Pursuant to the terms of an Amended and Restated
Notes to Financial Statements (Unaudited) (continued)
Subadvisory Agreement ("Subadvisory Agreement") between New York Life Investments and MacKay Shields, New York Life Investments pays for the services of the Subadvisor.
Pursuant to the Management Agreement, the Fund pays the Manager, on behalf of the Portfolio, a monthly fee for the services performed and the facilities furnished at an annual rate of the Portfolio's average daily net assets as follows: 0.60% up to $500 million; 0.55% from $500 million to $1 billion; 0.50% from $1 billion to $2 billion; and 0.49% in excess of $2 billion. During the six-month period ended June 30, 2021, the effective management fee rate was 0.54%.
During the six-month period ended June 30, 2021, New York Life Investments earned fees from the Portfolio in the amount of $5,053,850 and paid the Subadvisor fees in the amount of $2,528,597.
JPMorgan provides sub-administration and sub-accounting services to the Portfolio pursuant to an agreement with New York Life Investments. These services include calculating the daily NAVs of the Portfolio, maintaining the general ledger and sub-ledger accounts for the calculation of the Portfolio's NAVs, and assisting New York Life Investments in conducting various aspects of the Portfolio's administrative operations. For providing these services to the Portfolio, JPMorgan is compensated by New York Life Investments.
Prior to February 22, 2021, these services were provided by State Street.
Pursuant to an agreement between the Fund and New York Life Investments, New York Life Investments is responsible for providing or procuring certain regulatory reporting services for the Portfolio. The Portfolio will reimburse New York Life Investments for the actual costs incurred by New York Life Investments in connection with providing or procuring these services for the Portfolio.
(B) Distribution, Service and Shareholder Service Fees. The Fund, on behalf of the Portfolio, has entered into a distribution agreement with NYLIFE Distributors LLC (the “Distributor”), an affiliate of New York
Life Investments. The Portfolio has adopted a distribution plan (the “Plan”) in accordance with the provisions of Rule 12b-1 under the 1940 Act. Under the Plan, the Distributor has agreed to provide, through its affiliates or independent third parties, various distribution-related, shareholder and administrative support services to the Service Class and Service 2 Class shareholders. For its services, the Distributor is entitled to a combined distribution and service fee accrued daily and paid monthly at an annual rate of 0.25% of the average daily net assets attributable to the Service Class and Service 2 Class shares of the Portfolio.
The Board has adopted a shareholder services plan (the “Service Plan”) with respect to the Service 2 Class shares of the Portfolio. Under the terms of the Services Plan, the Portfolio is authorized to pay to New York Life Investments, its affiliates or independent third-party service providers, as compensation for services rendered to shareholders of the Service 2 Class shares, in connection with the administration of plans or programs that use Portfolio shares as their funding medium a shareholder servicing fee at the rate of 0.10% on an annualized basis of the average daily net assets of the Service 2 Class shares.
(C) Transfer and Dividend Disbursing Agent. NYLIM Service Company LLC, an affiliate of New York Life Investments, serves as the transfer agent and dividend disbursing agent for Service Class and Service 2 Class shares of the Portfolio. NYLIM Service Company LLC has entered into an agreement with DST Asset Manager Solutions, Inc.(“DST”), pursuant to which DST performs certain transfer agent services on behalf of NYLIM Service Company LLC. During the six-month period ended June 30, 2021, all associated fees were paid by the Manager.
(D) Investments in Affiliates (in 000’s). During the six-month period ended June 30, 2021, purchases and sales transactions, income earned from investments and shares held of investment companies managed by New York Life Investments or its affiliates were as follows:
| Affiliated Investment Companies | Value,
Beginning
of Period | Purchases
at Cost | Proceeds
from
Sales | Net
Realized
Gain/(Loss)
on Sales | Change in
Unrealized
Appreciation/
(Depreciation) | Value,
End of
Period | Dividend
Income | Other
Distributions | Shares
End of
Period |
| MainStay U.S. Government Liquidity Fund | $ 163,347 | $ 622,841 | $ (660,024) | $ — | $ — | $ 126,164 | $ 9 | $ — | 126,164 |
| 26 | MainStay VP MacKay Convertible Portfolio |
Note 4-Federal Income Tax
As of June 30, 2021, the cost and unrealized appreciation (depreciation) of the Portfolio’s investment portfolio, including applicable derivative contracts and other financial instruments, as determined on a federal income tax basis, were as follows:
| | Federal Tax
Cost | Gross
Unrealized
Appreciation | Gross
Unrealized
(Depreciation) | Net
Unrealized
Appreciation/
(Depreciation) |
| Investments in Securities | $1,803,758,855 | $291,195,853 | $(33,988,720) | $257,207,133 |
During the year ended December 31, 2020, the tax character of distributions paid as reflected in the Statements of Changes in Net Assets was as follows:
| | 2020 |
| Distributions paid from: | |
| Ordinary Income | $ 5,745,857 |
| Long-Term Capital Gains | 10,300,909 |
| Total | $16,046,766 |
Note 5–Custodian
JPMorgan is the custodian of cash and securities held by the Portfolio. Custodial fees are charged to the Portfolio based on the Portfolio's net assets and/or the market value of securities held by the Portfolio and the number of certain transactions incurred by the Portfolio.
Prior to February 22, 2021, these services were provided by State Street. The services provided by State Street were a direct expense of the Portfolio and are included in the Statement of Operations as Custodian fees which totaled $3,989 for the period January 1, 2021 through February 21, 2021.
Note 6–Line of Credit
The Portfolio and certain other funds managed by New York Life Investments maintain a line of credit with a syndicate of banks in order to secure a source of funds for temporary purposes to meet unanticipated or excessive redemption requests.
Effective July 27, 2021, under the credit agreement (the “Credit Agreement”), the aggregate commitment amount is $600,000,000 with an additional uncommitted amount of $100,000,000. The commitment fee is an annual rate of 0.15% of the average commitment amount payable quarterly, regardless of usage, to JPMorgan, who serves as the agent to the syndicate. The commitment fee is allocated among the Portfolio and certain other funds managed by New York Life Investments based upon their respective net assets and other factors. Interest on any revolving credit loan is charged based upon the Federal Funds Rate or the one-month London Interbank Offered Rate ("LIBOR"), whichever is higher. The Credit Agreement expires on July 26, 2022, although the Portfolio, certain other funds managed by New York Life Investments and the
syndicate of banks may renew the Credit Agreement for an additional year on the same or different terms or enter into a credit agreement with a different syndicate of banks. Prior to July 27, 2021, the aggregate commitment amount and the commitment fee were the same as those under the current Credit Agreement. During the six-month period ended June 30, 2021, there were no borrowings made or outstanding with respect to the Portfolio under the Credit Agreement.
Note 7–Interfund Lending Program
Pursuant to an exemptive order issued by the SEC, the Portfolio, along with certain other funds managed by New York Life Investments, may participate in an interfund lending program. The interfund lending program provides an alternative credit facility that permits the Portfolio and certain other funds managed by New York Life Investments to lend or borrow money for temporary purposes directly to or from one another, subject to the conditions of the exemptive order. During the six-month period ended June 30, 2021, there were no interfund loans made or outstanding with respect to the Portfolio.
Note 8–Purchases and Sales of Securities (in 000’s)
During the six-month period ended June 30, 2021, purchases and sales of securities, other than short-term securities, were $922,426 and $338,262, respectively.
Note 9–Capital Share Transactions
Transactions in capital shares for the six-month period ended June 30, 2021 and the year ended December 31, 2020, were as follows:
| Initial Class | Shares | Amount |
| Period ended June 30, 2021: | | |
| Shares sold | 27,800,586 | $ 518,981,260 |
| Shares issued to shareholders in reinvestment of distributions | 407,078 | 7,545,815 |
| Shares redeemed | (616,851) | (11,585,893) |
| Net increase (decrease) | 27,590,813 | $ 514,941,182 |
| Year ended December 31, 2020: | | |
| Shares sold | 10,584,369 | $ 189,502,221 |
| Shares issued to shareholders in reinvestment of distributions | 209,351 | 3,134,899 |
| Shares redeemed | (5,252,451) | (69,916,218) |
| Net increase (decrease) | 5,541,269 | $ 122,720,902 |
| |
Notes to Financial Statements (Unaudited) (continued)
| Service Class | Shares | Amount |
| Period ended June 30, 2021: | | |
| Shares sold | 4,347,786 | $ 81,113,545 |
| Shares issued to shareholders in reinvestment of distributions | 425,549 | 7,794,509 |
| Shares redeemed | (2,202,999) | (40,889,706) |
| Net increase (decrease) | 2,570,336 | $ 48,018,348 |
| Year ended December 31, 2020: | | |
| Shares sold | 10,432,501 | $ 151,830,845 |
| Shares issued to shareholders in reinvestment of distributions | 853,201 | 12,798,176 |
| Shares redeemed | (12,539,552) | (175,639,923) |
| Net increase (decrease) | (1,253,850) | $ (11,010,902) |
| |
| Service 2 Class | Shares | Amount |
| Period ended June 30, 2021: | | |
| Shares sold | 176,002 | $ 3,278,179 |
| Shares issued to shareholders in reinvestment of distributions | 3,056 | 55,976 |
| Shares redeemed | (109,223) | (2,042,623) |
| Net increase (decrease) | 69,835 | $ 1,291,532 |
| Year ended December 31, 2020: | | |
| Shares sold | 456,713 | $ 6,630,427 |
| Shares issued to shareholders in reinvestment of distributions | 7,438 | 113,691 |
| Shares redeemed | (495,342) | (6,792,628) |
| Net increase (decrease) | (31,191) | $ (48,510) |
Note 10–Other Matters
An outbreak of COVID-19, first detected in December 2019, has developed into a global pandemic and has resulted in travel restrictions, closure of international borders, certain businesses and securities markets, restrictions on securities trading activities, prolonged quarantines, supply chain disruptions, and lower consumer demand, as well as general concern and uncertainty. The continued impact of COVID-19 and related new variants is uncertain and could further adversely affect the global economy, national economies, individual issuers and capital markets in unforeseeable ways and result in a substantial and extended economic downturn. Developments that disrupt global economies and financial markets, such as COVID-19, may magnify factors that affect the Fund's performance.
Note 11–Subsequent Events
In connection with the preparation of the financial statements of the Portfolio as of and for the six-month period ended June 30, 2021, events and transactions subsequent to June 30, 2021, through the date the financial statements were issued have been evaluated by the Manager for possible adjustment and/or disclosure. No subsequent events requiring financial statement adjustment or disclosure have been identified.
| 28 | MainStay VP MacKay Convertible Portfolio |
Discussion of the Operation and Effectiveness of the Portfolio's Liquidity Risk Management Program (Unaudited)
In compliance with Rule 22e-4 under the Investment Company Act of 1940, as amended (the “Liquidity Rule”), the Portfolio has adopted and implemented a liquidity risk management program (the “Program”), which New York Life Investment Management LLC believes is reasonably designed to assess and manage the Portfolio's liquidity risk (the risk that the Portfolio could not meet requests to redeem shares issued by the Portfolio without significant dilution of remaining investors’ interests in the Portfolio). The Board of Trustees of MainStay VP Funds Trust (the "Board") designated New York Life Investment Management LLC as administrator of the Program (the “Administrator”). The Administrator has established a Liquidity Risk Management Committee to assist the Administrator in the implementation and day-to-day administration of the Program and to otherwise support the Administrator in fulfilling its responsibilities under the Program.
At a meeting of the Board held on March 8, 2021, the Administrator provided the Board with a written report addressing the Program’s operation and assessing its adequacy and effectiveness of implementation for the period from January 1, 2020 through December 31, 2020 (the "Review Period"), as required under the Liquidity Rule. The report noted that the Administrator concluded that (i) the Program operated effectively to assess and manage the Portfolio's liquidity risk, (ii) the Program has been adequately and effectively implemented to monitor and, as applicable, respond to the Portfolio's liquidity developments and (iii) the Portfolio's investment strategy continues to be appropriate for an open-end fund. In addition, the report discussed notable events that impacted liquidity risk during the Review Period, including the COVID-19 pandemic and the resulting economic shutdown.
In accordance with the Program, the Portfolio's liquidity risk is assessed no less frequently than annually taking into consideration certain factors, as applicable, such as (i) investment strategy and liquidity of portfolio investments, (ii) short-term and long-term cash flow projections and (iii) holdings of cash and cash equivalents, as well as borrowing arrangements and other funding sources. Certain factors are considered under both normal and reasonably foreseeable stressed conditions.
Each Portfolio portfolio investment is classified into one of four liquidity categories. The classification is based on a determination of the number of days it is reasonably expected to take to convert the investment into cash, or sell or dispose of the investment, in current market conditions without significantly changing the market value of the investment. The Administrator has delegated liquidity classification determinations to the Portfolio’s subadvisor, subject to appropriate oversight by the Administrator, and classification determinations are made by taking into account the Portfolio's reasonably anticipated trade size, various market, trading and investment-specific considerations, as well as market depth, and, in certain cases, third-party vendor data.
The Liquidity Rule requires portfolios that do not primarily hold assets that are highly liquid investments to adopt a minimum amount of net assets that must be invested in highly liquid investments that are assets (an “HLIM”). In addition, the Liquidity Rule limits a portfolio's investments in illiquid investments. Specifically, the Liquidity Rule prohibits acquisition of illiquid investments if doing so would result in a portfolio holding more than 15% of its net assets in illiquid investments that are assets. The Program includes provisions reasonably designed to determine, periodically review and comply with the HLIM requirement, as applicable, and to comply with the 15% limit on illiquid investments.
There can be no assurance that the Program will achieve its objectives under all circumstances in the future. Please refer to the Portfolio's prospectus for more information regarding the Portfolio's exposure to liquidity risk and other risks to which it may be subject.
Proxy Voting Record
The Portfolio is required to file with the SEC its proxy voting records for the 12-month period ending June 30 on Form N-PX. The Portfolio's most recent Form N-PX or proxy voting record is available free of charge upon request (i) by calling 800-598-2019; (ii) by visiting New York Life Investments’ website at https://www.nylinvestments.com/mainstay/
products-and-performance/mainstay-vp-funds-trust; or (iii) by visiting the SEC’s website at www.sec.gov.
Shareholder Reports and Quarterly Portfolio Disclosure
The Portfolio is required to file its complete schedule of portfolio holdings with the SEC 60 days after its first and third fiscal quarter on Form N-PORT. The Portfolio's holdings report is available free of charge upon request by calling 800-598-2019 or by visiting the SEC’s website at www.sec.gov.
| 30 | MainStay VP MacKay Convertible Portfolio |
MainStay VP Portfolios
MainStay VP offers a wide range of Portfolios. The full array of MainStay VP offerings is listed here, with information about the manager, subadvisors, legal counsel, and independent registered public accounting firm.
Equity
MainStay VP Candriam Emerging Markets Equity Portfolio
MainStay VP Epoch U.S. Equity Yield Portfolio
MainStay VP Fidelity Institutional AM® Utilities Portfolio†
MainStay VP MacKay International Equity Portfolio
MainStay VP MacKay S&P 500 Index Portfolio
MainStay VP Natural Resources Portfolio
MainStay VP Small Cap Growth Portfolio
MainStay VP T. Rowe Price Equity Income Portfolio
MainStay VP Wellington Growth Portfolio
MainStay VP Wellington Mid Cap Portfolio
MainStay VP Wellington Small Cap Portfolio
MainStay VP Wellington U.S. Equity Portfolio
MainStay VP Winslow Large Cap Growth Portfolio
Mixed Asset
MainStay VP Balanced Portfolio
MainStay VP Income Builder Portfolio
MainStay VP Janus Henderson Balanced Portfolio
MainStay VP MacKay Convertible Portfolio
Income
MainStay VP Bond Portfolio
MainStay VP Floating Rate Portfolio
MainStay VP Indexed Bond Portfolio
MainStay VP MacKay Government Portfolio
MainStay VP MacKay High Yield Corporate Bond Portfolio
MainStay VP MacKay Strategic Bond Portfolio
MainStay VP PIMCO Real Return Portfolio
Money Market
MainStay VP U.S. Government Money Market Portfolio
Alternative
MainStay VP CBRE Global Infrastructure Portfolio
MainStay VP IQ Hedge Multi-Strategy Portfolio
Asset Allocation
MainStay VP Conservative Allocation Portfolio
MainStay VP Equity Allocation Portfolio
MainStay VP Growth Allocation Portfolio
MainStay VP Moderate Allocation Portfolio
Manager
New York Life Investment Management LLC
New York, New York
Subadvisors
Brown Advisory LLC
Baltimore, Maryland
Candriam Belgium S.A.*
Brussels, Belgium
CBRE Clarion Securities LLC
Radnor, Pennsylvania
Epoch Investment Partners, Inc.
New York, New York
FIAM LLC
Smithfield, Rhode Island
IndexIQ Advisors LLC*
New York, New York
Janus Capital Management LLC
Denver, Colorado
MacKay Shields LLC*
New York, New York
Mellon Investments Corporation
Boston, Massachusetts
NYL Investors LLC*
New York, New York
Pacific Investment Management Company LLC
Newport Beach, California
Segall Bryant & Hamill, LLC
Chicago, Illinois
T. Rowe Price Associates, Inc.
Baltimore, Maryland
Wellington Management Company LLP
Boston, Massachusetts
Winslow Capital Management, LLC
Minneapolis, Minnesota
Legal Counsel
Dechert LLP
Washington, District of Columbia
Independent Registered Public Accounting Firm
PricewaterhouseCoopers LLP
New York, New York
Distributor
NYLIFE Distributors LLC*
Jersey City, New Jersey
Custodian
JPMorgan Chase Bank, N.A.
New York, New York
Some Portfolios may not be available in all products.
† Fidelity Institutional AM is a registered trade mark of FMR LLC. Used with permission.
* An affiliate of New York Life Investment Management LLC
Not part of the Semiannual Report
2021 Semiannual Report
This report is for the general information of New York Life Variable Annuities and NYLIAC Variable Universal Life Insurance Products policyowners. It must be preceded or accompanied by the appropriate product(s) and funds prospectuses if it is given to anyone who is not an owner of a New York Life variable annuity policy or a NYLIAC Variable Universal Life Insurance Product. This report does not offer for sale or solicit orders to purchase securities.
The performance data quoted in this report represents past performance. Past performance is no guarantee of future results. Due to market volatility and other factors, current performance may be lower or higher than the figures shown. The most recent month-end performance summary for your variable annuity or variable life policy is available by calling 800-598-2019 and is updated periodically on newyorklife.com.
The New York Life Variable Annuities and NYLIAC Variable Universal Life Insurance Products are issued by New York Life Insurance and Annuity Corporation (a Delaware Corporation) and distributed by NYLIFE Distributors LLC (Member FINRA/SIPC).
New York Life Insurance Company
New York Life Insurance and Annuity
Corporation (NYLIAC) (A Delaware Corporation)
51 Madison Avenue, Room 551
New York, NY 10010
newyorklife.com
nylinvestments.com
NYLIFE Distributors LLC, 30 Hudson Street, Jersey City, NJ 07302
New York Life Investment Management LLC is the investment manager to the MainStay VP Funds Trust
©2021 by NYLIFE Distributors LLC. All rights reserved.
You may obtain copies of the Prospectus and the Statement of Additional Information free of charge, upon request, by calling toll-free 800-598-2019 or writing to New York Life Insurance and Annuity Corporation, 51 Madison Avenue, New York, NY 10010.
| Not FDIC Insured | No Bank Guarantee | May Lose Value |
(NYLIAC) NI512
MainStay VP Wellington Growth Portfolio
(formerly known as MainStay VP MacKay Growth Portfolio)
Message from the President and Semiannual Report
Unaudited | June 30, 2021
Sign up for e-delivery of your shareholder reports. For full details on e-delivery, including who can participate and what you can receive via e-delivery,
please log in to newyorklifeinvestments.com/accounts.
| Not FDIC/NCUA Insured | Not a Deposit | May Lose Value | No Bank Guarantee | Not Insured by Any Government Agency |
This page intentionally left blank
Message from the President
The COVID-19 pandemic continued to afflict our personal lives and broad segments of the U.S. and global economy throughout the six-month reporting period ended June 30, 2021. However, with the deployment of multiple vaccines around the world, including three highly effective versions approved for emergency use in the United States, investors began to turn their attention toward the gradual reopening of the economy and the shape the “new normal” would take.
The first half of the reporting period saw increasing inflationary concerns as fiscal stimulus business reopenings drove accelerating economic growth, rising commodity prices and increased consumer spending. However, the U.S. Federal Reserve noted that price increases were likely to prove temporary and made clear their intention to remain accommodative for the foreseeable future. Accordingly, after moving higher in the first quarter of 2021, interest rates declined in the second quarter.
In response to the uncertain inflation outlook, equity market leadership shifted from value in the first quarter of the year to growth in the second quarter. Nevertheless, investor sentiment remained buoyant throughout the reporting period, with all eleven sectors in the S&P 500® Index, a widely regarded benchmark of market performance, producing positive returns. Energy led the market’s rise fueled by rapidly increasing oil and gas prices, followed by financials and real estate, which benefited from rising interest rates and the economic reopening, respectively. Communication services produced the slowest growth, followed by the traditionally defensive utilities and consumer staples
sectors. In the fixed income market, lower-credit-quality issues tended to outperform their higher-grade counterparts, with high-yield corporate bonds generating the strongest performance. Among securitized products, commercial mortgage-backed securities generally produced the strongest returns, followed by mortgage-backed securities and asset-backed securities, while Treasury securities lagged.
Despite the tremendous progress we’ve seen so far this year, the United States and the world continue to face significant pandemic-related challenges. Newer, more contagious variants of COVID-19 threaten the return of restrictions and lockdowns that could stall the economic recovery. At the same time, supply chain shortages have led to rising prices on everything from laptops to autos, stoking fears of uncontrolled inflation despite reassurance from the U.S. Federal Reserve. At New York Life Investments, we recognize that the shape that the “new normal” eventually takes may differ from our expectations. You can depend on us to keep a sharp watch for the unexpected, and to continue to help you find your way through this rapidly evolving investment landscape.
Sincerely,
Kirk C. Lehneis
President
The opinions expressed are as of the date of this report and are subject to change. There is no guarantee that any forecast made will come to pass. This material does not constitute investment advice and is not intended as an endorsement of any specific investment. Past performance is no guarantee of future results.
Not part of the Semiannual Report
Investors should refer to the Portfolio’s Summary Prospectus and/or Prospectus and consider the Portfolio’s investment objectives, strategies, risks, charges and expenses carefully before investing. The Summary Prospectus and/or Prospectus contain this and other information about the Portfolio. You may obtain copies of the Portfolio’s Summary Prospectus and/or the Prospectus and the Statement of Additional Information free of charge, upon request, by calling toll-free 800-598-2019, by writing to New York Life Insurance and Annuity Corporation, 51 Madison Avenue, Room 251, New York, New York 10010 or by sending an email to MainStayShareholdersServices@nylim.com. These documents are also available at nylinvestments.com/vpdocuments. Please read the Portfolio's Summary Prospectus and/or Prospectus carefully before investing. MainStay VP Funds Trust portfolios are separate account options which are purchased through a variable insurance or variable annuity contract.
MainStay VP Wellington Growth Portfolio
Investment and Performance Comparison (Unaudited)
Performance data quoted represents past performance. Past performance is no guarantee of future results. Because of market volatility and other factors, current performance may be lower or higher than the figures shown. Investment return and principal value will fluctuate, and as a result, when shares are redeemed, they may be worth more or less than their original cost. The performance table and graph do not reflect any deduction of sales charges, mortality and expense charges, contract charges or administrative charges. Please refer to the Performance Summary appropriate for your policy. For performance information current to the most recent month-end, please call 800-598-2019 or visit www.newyorklife.com.
Performance figures may reflect certain fee waivers and/or expense limitations, without which total returns may have been different. For information on current fee waivers and/or expense limitations (if any), please refer to the Notes to Financial Statements.
| Average Annual Total Returns for the Period-Ended June 30, 2021 |
| Class | Inception
Date1, 2, 3 | Six
Months | One
Year | Five
Years | Ten
Years | Gross
Expense
Ratio4 |
| Initial Class Shares | 1/29/1993 | 13.68% | 40.90% | 20.87% | 14.00% | 0.73% |
| Service Class Shares | 6/5/2003 | 13.54 | 40.54 | 20.57 | 13.72 | 0.98 |
| 1. | Effective January 11, 2013 and July 29, 2016, the Portfolio modified its principal investment strategies in connection with changes in the Portfolio’s Subadvisor. The past performance in the chart and table reflect the Subadvisors and strategies in place during their respective time periods. |
| 2. | Effective January 1, 2018 due to an organizational restructuring whereby all investment personnel of Cornerstone Capital Management Holdings LLC, a former subadvisor, transitioned to MacKay Shields LLC, a former subadvisor. The past performance in the chart and table prior to that date reflects the Portfolio’s prior subadvisor and principal investment strategies. |
| 3. | Effective May 1, 2021, the Portfolio replaced its subadvisor and modified its principal investment strategies. The past performance in the graph and table prior to that date reflects the Portfolio's prior subadvisor and principal investment strategies. |
| 4. | The gross expense ratios presented reflect the Portfolio’s “Total Annual Portfolio Operating Expenses” from the most recent Prospectus, as supplemented, and may differ from other expense ratios disclosed in this report. |
| Benchmark Performance | Six
Months | One
Year | Five
Years | Ten
Years |
| Russell 1000® Growth Index1 | 12.99% | 42.50% | 23.66% | 17.87% |
| Morningstar Large Growth Category Average2 | 12.82 | 41.56 | 21.40 | 15.41 |
| 1. | The Russell 1000® Growth Index is the Portfolio's primary benchmark. The Russell 1000® Growth Index is a broad-based benchmark that measures the performance of the large-cap growth segment of the U.S. equity universe. It includes those Russell 1000® Index companies with higher price-to-book ratios and higher forecasted growth values. Results assume reinvestment of all dividends and capital gains. An investment cannot be made directly in an index. |
| 2. | The Morningstar Large Growth Category Average is representative of funds that invest primarily in big U.S. companies that are projected to grow faster than other large-cap stocks. Stocks in the top 70% of the capitalization of the U.S. equity market are defined as large cap. Growth is defined based on fast growth and high valuations. Most of these funds focus on companies in rapidly expanding industries. Results are based on average total returns of similar funds with all dividends and capital gain distributions reinvested. |
Cost in Dollars of a $1,000 Investment in MainStay VP Wellington Growth Portfolio (Unaudited)
The example below is intended to describe the fees and expenses borne by shareholders during the six-month period from January 1, 2021 to June 30, 2021, and the impact of those costs on your investment.
Example
As a shareholder of the Portfolio you incur two types of costs: (1) transaction costs, including exchange fees and sales charges (loads) on purchases (as applicable), and (2) ongoing costs, including management fees, distribution and/or service (12b-1) fees, and other Portfolio expenses (as applicable). This example is intended to help you understand your ongoing costs (in dollars) of investing in the Portfolio and to compare these costs with the ongoing costs of investing in other mutual funds. The example is based on an investment of $1,000 made at the beginning of the six-month period and held for the entire period from January 1, 2021 to June 30, 2021. Shares are only sold in connection with variable life and annuity contracts and the example does not reflect any contract level or transactional fees or expenses. If these costs had been included, your costs would have been higher.
This example illustrates your Portfolio’s ongoing costs in two ways:
Actual Expenses
The second and third data columns in the table below provide information about actual account values and actual expenses. You may use the information in these columns, together with the amount you invested, to estimate the expenses that you paid during the six months ended June
30, 2021. Simply divide your account value by $1,000 (for example, an $8,600 account value divided by $1,000 = 8.6), then multiply the result by the number under the heading entitled “Expenses Paid During Period” to estimate the expenses you paid on your account during this period.
Hypothetical Example for Comparison Purposes
The fourth and fifth data columns in the table below provide information about hypothetical account values and hypothetical expenses based on the Portfolio’s actual expense ratio and an assumed rate of return of 5% per year before expenses, which is not the Portfolio’s actual return. The hypothetical account values and expenses may not be used to estimate the actual ending account balances or expenses you paid for the six-month period shown. You may use this information to compare the ongoing costs of investing in the Portfolio with the ongoing costs of investing in other mutual funds. To do so, compare this 5% hypothetical example with the 5% hypothetical examples that appear in the shareholder reports of the other mutual funds.
Please note that the expenses shown in the table are meant to highlight your ongoing costs only and do not reflect any transactional costs, such as exchange fees or sales charges (loads). Therefore, the fourth and fifth data columns of the table are useful in comparing ongoing costs only and will not help you determine the relative total costs of owning different funds. In addition, if these transactional costs were included, your costs would have been higher.
| Share Class | Beginning
Account
Value
1/1/21 | Ending Account
Value (Based
on Actual
Returns and
Expenses)
6/30/21 | Expenses
Paid
During
Period1 | Ending Account
Value (Based
on Hypothetical
5% Annualized
Return and
Actual Expenses)
6/30/21 | Expenses
Paid
During
Period1 | Net Expense
Ratio
During
Period2 |
| Initial Class Shares | $1,000.00 | $1,136.80 | $3.81 | $1,021.22 | $3.61 | 0.72% |
| Service Class Shares | $1,000.00 | $1,135.40 | $5.14 | $1,019.98 | $4.86 | 0.97% |
| 1. | Expenses are equal to the Portfolio’s annualized expense ratio of each class multiplied by the average account value over the period, divided by 365 and multiplied by 181 (to reflect the six-month period). The table above represents the actual expenses incurred during the six-month period. In addition to the fees and expenses which the Portfolio bears directly, it also indirectly bears a pro rata share of the fees and expenses of the underlying funds in which it invests. Such indirect expenses are not included in the above-reported expense figures. |
| 2. | Expenses are equal to the Portfolio's annualized expense ratio to reflect the six-month period. |
| 6 | MainStay VP Wellington Growth Portfolio |
Industry Composition as of June 30, 2021 (Unaudited)
| Software | 20.5% |
| IT Services | 14.9 |
| Interactive Media & Services | 12.4 |
| Internet & Direct Marketing Retail | 7.3 |
| Technology Hardware, Storage & Peripherals | 7.3 |
| Semiconductors & Semiconductor Equipment | 5.7 |
| Hotels, Restaurants & Leisure | 3.9 |
| Professional Services | 2.8 |
| Beverages | 2.8 |
| Capital Markets | 2.8 |
| Health Care Equipment & Supplies | 2.4 |
| Specialty Retail | 2.2 |
| Life Sciences Tools & Services | 2.0 |
| Health Care Providers & Services | 1.6 |
| Consumer Finance | 1.6 |
| Aerospace & Defense | 1.3 |
| Commercial Services & Supplies | 1.3% |
| Insurance | 1.3 |
| Textiles, Apparel & Luxury Goods | 1.1 |
| Biotechnology | 0.9 |
| Road & Rail | 0.9 |
| Entertainment | 0.8 |
| Electronic Equipment, Instruments & Components | 0.6 |
| Equity Real Estate Investment Trusts | 0.5 |
| Energy Equipment & Services | 0.4 |
| Pharmaceuticals | 0.3 |
| Machinery | 0.2 |
| Media | 0.0‡ |
| Short–Term Investment | 0.2 |
| Other Assets, Less Liabilities | 0.0‡ |
| | 100.0% |
‡ Less than one-tenth of percent.
See Portfolio of Investments beginning on page 10 for specific holdings within these categories. The Portfolio's holdings are subject to change.
Top Ten Holdings as of June 30, 2021 (excluding short-term investments) (Unaudited)
| 1. | Microsoft Corp. |
| 2. | Amazon.com, Inc. |
| 3. | Apple, Inc. |
| 4. | Alphabet, Inc., Class C |
| 5. | Facebook, Inc., Class A |
| 6. | Mastercard, Inc., Class A |
| 7. | PayPal Holdings, Inc. |
| 8. | Adobe, Inc. |
| 9. | salesforce.com, Inc. |
| 10. | Advanced Micro Devices, Inc. |
Portfolio Management Discussion and Analysis (Unaudited)
Answers to the questions reflect the views of portfolio managers Migene Kim, CFA, and Mona Patni of MacKay Shields LLC (“MacKay Shields”), the Portfolio’s former Subadvisor and Andrew J. Shilling, CFA, of Wellington Management Company LLP (“Wellington”), the Portfolio's current Subadvisor.
How did MainStay VP Wellington Growth Portfolio perform relative to its benchmark and peers during the six months ended June 30, 2021?
For the six months ended June 30, 2021, MainStay VP Wellington Growth Portfolio returned 13.68% for Initial Class shares and 13.54% for Service Class shares. Over the same period, both share classes outperformed the 12.99% return of the Russell 1000® Growth Index (“the Index”), which is the Portfolio’s benchmark, and the 12.82% return of the Morningstar Large Growth Category Average.1
Were there any changes to the Fund during the reporting period?
At meetings held on January 21, January 25 and February 3, 2021, the Board of Trustees of MainStay VP Funds Trust considered and approved, among other related proposals: (i) appointing Wellington Management Company LLP as the Portfolio’s subadvisor, and the related subadvisory agreement; (ii) changing the Portfolio’s name; and (iii) modifying the Portfolio’s principal investment strategies and investment process. For more information on these and other changes refer to the supplement dated February 5, 2021.
In the process of implementing the new principal investment strategies and investment process, the Portfolio may have experienced a high level of portfolio turnover. Also during this transition period, the Portfolio may not have been pursuing its investment objective or may not have been managed consistent with its investment strategies as stated in the Prospectus. This may have impacted the Portfolio’s performance.
What factors affected the Portfolio’s relative performance during the reporting period?
MacKay Shields
During the time MacKay Shields managed the Portfolio, the Portfolio outperformed the Index, helped by strong stock selection, most notably among consumer discretionary and health care issues. Sector allocation effect also made a positive contribution to relative returns due to the Portfolio’s underweight exposure to consumer staples and overweight exposure to communication services. (Contributions take weightings and total returns into account.) In terms of stock-selection model efficacy, the combination of signals used by the Portfolio’s quantitative stock selection model was rewarded primarily by valuation measures.
Wellington
During the time Wellington managed the Portfolio, the Portfolio underperformed the Index primarily due to security selection, with many of the most notable detractors coming from the information technology sector. Sector allocation, a result of Wellington's
bottom-up stock selection process, did not have a meaningful impact on relative performance.
Which sectors were the strongest positive contributors to the Portfolio’s relative performance, and which sectors were particularly weak?
MacKay Shields
During the time MacKay Shields managed the Portfolio, the strongest positive contributors to the Portfolio’s performance relative to the Index were the health care, consumer discretionary and information technology sectors. During the same period, the most significant detractors from relative performance were the real estate, communication services and energy sectors.
Wellington
During the time Wellington managed the Portfolio, security selection in the industrials, communication services and real estate sectors contributed positively to performance relative to the Index. The sectors that detracted most significantly from relative performance were information technology, consumer discretionary and consumer staples. From a sector allocation perspective, the Portfolio’s underweight allocation to health care weighed on results. This was partially offset by the Portfolio’s lack of exposure to materials.
During the reporting period, which individual stocks made the strongest positive contributions to the Portfolio’s absolute performance and which stocks detracted the most?
MacKay Shields
The stocks providing the strongest positive contributions to the Portfolio’s absolute performance during the time MacKay Shields managed the Portfolio included shares in systems software company Microsoft and interactive media & services provider Alphabet. During the same period, the most significant detractors from absolute returns were wireless technology company Qualcomm, interactive home entertainment developer Take-Two Interactive Software, and athletic footwear & apparel firm Nike.
Wellington
The strongest positive contributors to absolute performance during the time Wellington managed the Portfolio were holdings in Microsoft, visual computing company NVIDIA and professional creative software company Adobe. Microsoft shares rose with other technology stocks as hawkish rhetoric from the U.S. Federal Reserve prompted a market rotation away from cyclically sensitive value stocks into growth stocks. Shares of NVIDIA rose after the company announced that first-quarter revenue for fiscal year 2022 was likely to be above its previously provided outlook, with broad-based outperformance across each of its market platforms. Shares of Adobe rose after the company reported strong fiscal
| 1. | See page 5 for more information on benchmark and peer group returns. |
| 8 | MainStay VP Wellington Growth Portfolio |
second-quarter results, beating consensus estimates. Management also forecast strong profits for the next quarter, exceeding consensus estimates.
The most significant detractors from the Portfolio’s absolute performance were holdings in business payment solutions provider FleetCor Technologies, financial technology company Global Payments, and digital payments company Mastercard. FleetCor shares ended the reporting period lower despite the company releasing first-quarter 2021 results that exceeded consensus EPS (earnings per share) and revenue estimates. Later in the reporting period, the company raised its full-year 2021 EPS guidance. The adjustment to guidance was announced following the completion of FleetCor’s acquisition of Associated Foreign Exchange, an international cross-border payments provider. Global Payments shares lost ground despite posting first-quarter 2021 earnings that exceeded consensus estimates. Rather than reward this positive news, market participants appeared more focused on increasing competition in the space, while also reacting skeptically to the company’s two announced acquisitions. Mastercard shares lost ground after reaching new all-time highs in April 2021.
Did the Portfolio make any significant purchases or sales during the reporting period?
MacKay Shields
The Portfolio’s largest initial purchase during the time MacKay Shields managed the Portfolio was in auto parts and equipment retailer O'Reilly Automotive, while the largest increase in position size was in Microsoft, described above. The Portfolio's largest full sale was in information technology services provider DXC Technology, while its most significantly decreased position size was in social media platform Facebook.
Wellington
During the time Wellington managed the Portfolio, the most notable initial purchases included shares in software-as-a-service provider RingCentral and global oilfield services company Schlumberger. In Wellington's view, RingCentral has potential to be a long-term secular winner. The company has been taking share in a growing addressable market and, we believe, has a superior go-to-market strategy versus its peers. Schlumberger appears well positioned to benefit from a need for increased capital spending by large exploration & production companies after years of underinvestment.
The Portfolio’s most notable sales during the same period included full positions in public sector software provider Tyler Technologies and medical device company Penumbra. In Wellington's opinion, Tyler Technologies no longer offered
compelling risk-adjusted upside relative to other opportunities. Regarding Penumbra, while Wellington retained a positive outlook for the company’s product innovation and expansion into new markets, its valuation appeared to be getting ahead of fundamentals.
How did the Portfolio’s sector weightings change during the reporting period?
MacKay Shields
During the time MacKay Shields managed the Portfolio, the largest increases in sector exposures relative to the Index were in the health care and financials sectors. Conversely, the Portfolio's largest decreases in relative sector exposures were in the information technology and communication services sectors.
Wellington
During the time Wellington managed the Portfolio, the most notable increases in absolute sector exposures were to communication services and information technology, both of which represented overweight positions relative to the Index at the end of the reporting period. Notable reductions in the Portfolio’s absolute sector exposures included consumer discretionary and health care.
How was the Portfolio positioned at the end of the reporting period?
MacKay Shields
At the end of the period when MacKay Shields managed the Portfolio, the Portfolio held its largest overweight positions relative to the Index in the information technology and consumer discretionary sectors. As of the same date, the Portfolio’s most significantly underweight sector positions were in real estate and utilities.
Wellington
As of June 30, 2021, the Portfolio held its most overweight positions relative to the Index in the information technology and financials sectors, and its most underweight positions in consumer discretionary and health care.
The opinions expressed are those of the portfolio managers as of the date of this report and are subject to change. There is no guarantee that any forecasts will come to pass. This material does not constitute investment advice and is not intended as an endorsement of any specific investment.
Not all MainStay VP Portfolios and/or share classes are available under all policies.
Portfolio of Investments June 30, 2021† (Unaudited)
| | Shares | Value |
| Common Stocks 99.8% |
| Aerospace & Defense 1.3% |
| Airbus SE, ADR | 110,456 | $ 3,556,683 |
| Northrop Grumman Corp. | 16,683 | 6,063,103 |
| | | 9,619,786 |
| Beverages 2.8% |
| Constellation Brands, Inc., Class A | 53,693 | 12,558,256 |
| Monster Beverage Corp. (a) | 80,856 | 7,386,195 |
| | | 19,944,451 |
| Biotechnology 0.9% |
| Seagen, Inc. (a) | 41,620 | 6,570,966 |
| Capital Markets 2.8% |
| Blackstone Group, Inc. (The) | 56,077 | 5,447,320 |
| Coinbase Global, Inc., Class A (a) | 9,275 | 2,349,358 |
| MarketAxess Holdings, Inc. | 15,598 | 7,231,077 |
| S&P Global, Inc. | 11,812 | 4,848,235 |
| | | 19,875,990 |
| Commercial Services & Supplies 1.3% |
| Copart, Inc. (a) | 67,313 | 8,873,873 |
| Legalzoom.com, Inc. (a) | 10,200 | 386,070 |
| | | 9,259,943 |
| Consumer Finance 1.6% |
| American Express Co. | 68,084 | 11,249,519 |
| Electronic Equipment, Instruments & Components 0.6% |
| CDW Corp. | 25,622 | 4,474,882 |
| Energy Equipment & Services 0.4% |
| Schlumberger NV | 91,553 | 2,930,612 |
| Entertainment 0.8% |
| Walt Disney Co. (The) (a) | 31,072 | 5,461,525 |
| Equity Real Estate Investment Trusts 0.5% |
| Equinix, Inc. | 4,290 | 3,443,154 |
| Health Care Equipment & Supplies 2.4% |
| ABIOMED, Inc. (a) | 27,078 | 8,451,315 |
| Boston Scientific Corp. (a) | 211,020 | 9,023,215 |
| | | 17,474,530 |
| Health Care Providers & Services 1.6% |
| UnitedHealth Group, Inc. | 28,739 | 11,508,245 |
| | Shares | Value |
| |
| Hotels, Restaurants & Leisure 3.9% |
| Airbnb, Inc., Class A (a) | 59,091 | $ 9,049,196 |
| Booking Holdings, Inc. (a) | 2,882 | 6,306,075 |
| DraftKings, Inc., Class A (a)(b) | 148,286 | 7,736,080 |
| Hilton Worldwide Holdings, Inc. (a) | 40,898 | 4,933,117 |
| | | 28,024,468 |
| Insurance 1.3% |
| Markel Corp. (a) | 3,545 | 4,206,887 |
| Marsh & McLennan Cos., Inc. | 34,315 | 4,827,434 |
| | | 9,034,321 |
| Interactive Media & Services 12.4% |
| Alphabet, Inc., Class C (a) | 13,485 | 33,797,725 |
| Facebook, Inc., Class A (a) | 90,508 | 31,470,537 |
| Match Group, Inc. (a) | 38,678 | 6,236,828 |
| Snap, Inc., Class A (a) | 114,200 | 7,781,588 |
| ZoomInfo Technologies, Inc., Class A (a) | 182,584 | 9,525,407 |
| | | 88,812,085 |
| Internet & Direct Marketing Retail 7.3% |
| Amazon.com, Inc. (a) | 15,225 | 52,376,436 |
| IT Services 14.9% |
| Affirm Holdings, Inc. (a) | 57,678 | 3,884,613 |
| Fidelity National Information Services, Inc. | 61,872 | 8,765,406 |
| FleetCor Technologies, Inc. (a) | 41,247 | 10,561,707 |
| Global Payments, Inc. | 43,760 | 8,206,750 |
| Mastercard, Inc., Class A | 60,974 | 22,260,998 |
| PayPal Holdings, Inc. (a) | 72,249 | 21,059,139 |
| Shopify, Inc., Class A (a) | 3,318 | 4,847,532 |
| Snowflake, Inc., Class A (a) | 18,274 | 4,418,653 |
| Square, Inc., Class A (a) | 53,664 | 13,083,283 |
| Visa, Inc., Class A | 40,279 | 9,418,036 |
| | | 106,506,117 |
| Life Sciences Tools & Services 2.0% |
| Illumina, Inc. (a) | 22,172 | 10,492,012 |
| Mettler-Toledo International, Inc. (a) | 2,563 | 3,550,627 |
| | | 14,042,639 |
| Machinery 0.2% |
| IDEX Corp. | 7,336 | 1,614,287 |
| Media 0.0% ‡ |
| Interpublic Group of Cos., Inc. (The) | 7,626 | 247,769 |
| Pharmaceuticals 0.3% |
| Zoetis, Inc. | 9,779 | 1,822,414 |
The notes to the financial statements are an integral part of, and should be read in conjunction with, the financial statements.
| 10 | MainStay VP Wellington Growth Portfolio |
| | Shares | Value |
| Common Stocks (continued) |
| Professional Services 2.8% |
| IHS Markit Ltd. | 68,465 | $ 7,713,267 |
| TransUnion | 115,020 | 12,630,346 |
| | | 20,343,613 |
| Road & Rail 0.9% |
| DiDi Global, Inc., ADR (a) | 50,176 | 709,489 |
| Uber Technologies, Inc. (a) | 109,518 | 5,489,042 |
| | | 6,198,531 |
| Semiconductors & Semiconductor Equipment 5.7% |
| Advanced Micro Devices, Inc. (a) | 151,206 | 14,202,779 |
| Microchip Technology, Inc. | 75,577 | 11,316,900 |
| Monolithic Power Systems, Inc. | 5,517 | 2,060,324 |
| NVIDIA Corp. | 16,499 | 13,200,850 |
| | | 40,780,853 |
| Software 20.5% |
| Adobe, Inc. (a) | 28,793 | 16,862,333 |
| Autodesk, Inc. (a) | 37,168 | 10,849,339 |
| Avalara, Inc. (a) | 48,328 | 7,819,470 |
| DocuSign, Inc. (a) | 13,254 | 3,705,421 |
| Intuit, Inc. | 15,904 | 7,795,664 |
| Microsoft Corp. | 212,256 | 57,500,150 |
| nCino, Inc. (a) | 83,147 | 4,982,168 |
| RingCentral, Inc., Class A (a) | 12,145 | 3,529,094 |
| salesforce.com, Inc. (a) | 60,628 | 14,809,602 |
| ServiceNow, Inc. (a) | 18,124 | 9,960,044 |
| Workday, Inc., Class A (a) | 37,484 | 8,948,930 |
| | | 146,762,215 |
| Specialty Retail 2.2% |
| Burlington Stores, Inc. (a) | 21,385 | 6,885,756 |
| TJX Cos., Inc. (The) | 131,857 | 8,889,799 |
| | | 15,775,555 |
| | Shares | | Value |
| |
| Technology Hardware, Storage & Peripherals 7.3% |
| Apple, Inc. | 379,718 | | $ 52,006,177 |
| Textiles, Apparel & Luxury Goods 1.1% |
| Lululemon Athletica, Inc. (a) | 22,529 | | 8,222,409 |
Total Common Stocks
(Cost $571,612,795) | | | 714,383,492 |
| Short-Term Investment 0.2% |
| Affiliated Investment Company 0.2% |
| MainStay U.S. Government Liquidity Fund, 0.01% (c) | 1,095,390 | | 1,095,390 |
Total Short-Term Investment
(Cost $1,095,390) | | | 1,095,390 |
Total Investments
(Cost $572,708,185) | 100.0% | | 715,478,882 |
| Other Assets, Less Liabilities | 0.0‡ | | 189,846 |
| Net Assets | 100.0% | | $ 715,668,728 |
| † | Percentages indicated are based on Portfolio net assets. |
| ‡ | Less than one-tenth of a percent. |
| (a) | Non-income producing security. |
| (b) | All or a portion of this security was held on loan. As of June 30, 2021, the aggregate market value of securities on loan was $7,736,081. The market value of the collateral held included non-cash collateral in the form of U.S. Treasury securities with a value of $7,870,129. (See Note 2(H)) |
| (c) | Current yield as of June 30, 2021. |
| Abbreviation(s): |
| ADR—American Depositary Receipt |
The notes to the financial statements are an integral part of, and should be read in conjunction with, the financial statements.
11
Portfolio of Investments June 30, 2021† (Unaudited) (continued)
The following is a summary of the fair valuations according to the inputs used as of June 30, 2021, for valuing the Portfolio’s assets:
| Description | Quoted
Prices in
Active
Markets for
Identical
Assets
(Level 1) | | Significant
Other
Observable
Inputs
(Level 2) | | Significant
Unobservable
Inputs
(Level 3) | | Total |
| Asset Valuation Inputs | | | | | | | |
| Investments in Securities (a) | | | | | | | |
| Common Stocks | $ 714,383,492 | | $ — | | $ — | | $ 714,383,492 |
| Short-Term Investment | | | | | | | |
| Affiliated Investment Company | 1,095,390 | | — | | — | | 1,095,390 |
| Total Investments in Securities | $ 715,478,882 | | $ — | | $ — | | $ 715,478,882 |
| (a) | For a complete listing of investments and their industries, see the Portfolio of Investments. |
The notes to the financial statements are an integral part of, and should be read in conjunction with, the financial statements.
| 12 | MainStay VP Wellington Growth Portfolio |
Statement of Assets and Liabilities as of June 30, 2021 (Unaudited)
| Assets |
Investment in unaffiliated securities, at value
(identified cost $571,612,795) including securities on loan of $7,736,081 | $714,383,492 |
Investment in affiliated investment companies, at value
(identified cost $1,095,390) | 1,095,390 |
| Cash | 17,896 |
| Receivables: | |
| Investment securities sold | 2,170,638 |
| Dividends | 25,198 |
| Securities lending | 1,688 |
| Other assets | 6,512 |
| Total assets | 717,700,814 |
| Liabilities |
| Payables: | |
| Investment securities purchased | 1,464,280 |
| Manager (See Note 3) | 391,189 |
| Portfolio shares redeemed | 91,814 |
| Shareholder communication | 34,147 |
| Professional fees | 21,904 |
| Custodian | 16,570 |
| NYLIFE Distributors (See Note 3) | 11,903 |
| Trustees | 279 |
| Total liabilities | 2,032,086 |
| Net assets | $715,668,728 |
| Composition of Net Assets |
| Shares of beneficial interest outstanding (par value of $.001 per share) unlimited number of shares authorized | $ 16,094 |
| Additional paid-in-capital | 314,669,555 |
| | 314,685,649 |
| Total distributable earnings (loss) | 400,983,079 |
| Net assets | $715,668,728 |
| Initial Class | |
| Net assets applicable to outstanding shares | $656,512,706 |
| Shares of beneficial interest outstanding | 14,744,014 |
| Net asset value per share outstanding | $ 44.53 |
| Service Class | |
| Net assets applicable to outstanding shares | $ 59,156,022 |
| Shares of beneficial interest outstanding | 1,350,266 |
| Net asset value per share outstanding | $ 43.81 |
The notes to the financial statements are an integral part of, and should be read in conjunction with, the financial statements.
13
Statement of Operations for the six months ended June 30, 2021 (Unaudited)
| Investment Income (Loss) |
| Income | |
| Dividends-unaffiliated | $ 1,801,914 |
| Securities lending | 6,091 |
| Dividends-affiliated | 113 |
| Total income | 1,808,118 |
| Expenses | |
| Manager (See Note 3) | 2,250,568 |
| Distribution/Service—Service Class (See Note 3) | 71,100 |
| Professional fees | 67,014 |
| Shareholder communication | 60,498 |
| Custodian | 13,761 |
| Trustees | 6,862 |
| Miscellaneous | 10,290 |
| Total expenses before waiver/reimbursement | 2,480,093 |
| Expense waiver/reimbursement from Manager (See Note 3) | (46,857) |
| Net expenses | 2,433,236 |
| Net investment income (loss) | (625,118) |
| Realized and Unrealized Gain (Loss) |
| Net realized gain (loss) on unaffiliated investments | 155,227,383 |
| Net change in unrealized appreciation (depreciation) on unaffiliated investments | (67,369,876) |
| Net realized and unrealized gain (loss) | 87,857,507 |
| Net increase (decrease) in net assets resulting from operations | $ 87,232,389 |
The notes to the financial statements are an integral part of, and should be read in conjunction with, the financial statements.
| 14 | MainStay VP Wellington Growth Portfolio |
Statements of Changes in Net Assets
for the six months ended June 30, 2021 (Unaudited) and the year ended December 31, 2020
| | 2021 | 2020 |
| Increase (Decrease) in Net Assets |
| Operations: | | |
| Net investment income (loss) | $ (625,118) | $ 2,215,651 |
| Net realized gain (loss) | 155,227,383 | 103,480,396 |
| Net change in unrealized appreciation (depreciation) | (67,369,876) | 78,489,040 |
| Net increase (decrease) in net assets resulting from operations | 87,232,389 | 184,185,087 |
| Distributions to shareholders: | | |
| Initial Class | — | (59,754,524) |
| Service Class | — | (5,072,008) |
| Total distributions to shareholders | — | (64,826,532) |
| Capital share transactions: | | |
| Net proceeds from sales of shares | 30,857,044 | 8,061,237 |
| Net asset value of shares issued to shareholder in reinvestment of distributions | — | 64,826,532 |
| Cost of shares redeemed | (50,612,465) | (252,257,221) |
| Increase (decrease) in net assets derived from capital share transactions | (19,755,421) | (179,369,452) |
| Net increase (decrease) in net assets | 67,476,968 | (60,010,897) |
| Net Assets |
| Beginning of period | 648,191,760 | 708,202,657 |
| End of period | $715,668,728 | $ 648,191,760 |
The notes to the financial statements are an integral part of, and should be read in conjunction with, the financial statements.
15
Financial Highlights selected per share data and ratios
| | Six months ended
June 30,
2021* | | Year Ended December 31, |
| Initial Class | 2020 | | 2019 | | 2018 | | 2017 | | 2016 |
| Net asset value at beginning of period | $ 39.15 | | $ 32.64 | | $ 27.74 | | $ 30.87 | | $ 23.90 | | $ 26.09 |
| Net investment income (loss) (a) | (0.03) | | 0.12 | | 0.18 | | 0.19 | | 0.19 | | 0.09 |
| Net realized and unrealized gain (loss) on investments | 5.41 | | 10.08 | | 7.77 | | (1.10) | | 7.05 | | (0.02) |
| Total from investment operations | 5.38 | | 10.20 | | 7.95 | | (0.91) | | 7.24 | | 0.07 |
| Less distributions: | | | | | | | | | | | |
| From net investment income | — | | (0.21) | | (0.19) | | (0.21) | | (0.07) | | (0.04) |
| From net realized gain on investments | — | | (3.48) | | (2.86) | | (2.01) | | (0.20) | | (2.22) |
| Total distributions | — | | (3.69) | | (3.05) | | (2.22) | | (0.27) | | (2.26) |
| Net asset value at end of period | $ 44.53 | | $ 39.15 | | $ 32.64 | | $ 27.74 | | $ 30.87 | | $ 23.90 |
| Total investment return (b) | 13.74%(c) | | 32.30% | | 30.01% | | (4.24)% | | 30.41% | | 0.40% |
| Ratios (to average net assets)/Supplemental Data: | | | | | | | | | | | |
| Net investment income (loss) | (0.17)%†† | | 0.35% | | 0.56% | | 0.60% | | 0.71% | | 0.35%(d) |
| Net expenses (e) | 0.72%†† | | 0.73% | | 0.72% | | 0.73% | | 0.74% | | 0.76%(f) |
| Expenses (before waiver/reimbursement) (e) | 0.74%†† | | 0.73% | | 0.72% | | 0.73% | | 0.74% | | 0.76% |
| Portfolio turnover rate | 26% | | 144% | | 156% | | 127% | | 141% | | 177% |
| Net assets at end of period (in 000’s) | $ 656,513 | | $ 590,841 | | $ 652,081 | | $ 461,537 | | $ 525,483 | | $ 337,401 |
| * | Unaudited. |
| †† | Annualized. |
| (a) | Per share data based on average shares outstanding during the period. |
| (b) | Total return does not reflect any deduction of sales charges, mortality and expense charges, contract charges or administrative charges. For periods of less than one year, total return is not annualized. |
| (c) | Total investment return may reflect adjustments to conform to generally accepted accounting principles. |
| (d) | Without the custody fee reimbursement, net investment income (loss) would have been 0.34%. |
| (e) | In addition to the fees and expenses which the Portfolio bears directly, it also indirectly bears a pro-rata share of the fees and expenses of the underlying funds in which it invests. Such indirect expenses are not included in the above expense ratios. |
| (f) | Without the custody fee reimbursement, net expenses would have been 0.77%. |
The notes to the financial statements are an integral part of, and should be read in conjunction with, the financial statements.
| 16 | MainStay VP Wellington Growth Portfolio |
Financial Highlights selected per share data and ratios
| | Six months ended
June 30,
2021* | | Year Ended December 31, |
| Service Class | 2020 | | 2019 | | 2018 | | 2017 | | 2016 |
| Net asset value at beginning of period | $ 38.57 | | $ 32.19 | | $ 27.38 | | $ 30.50 | | $ 23.62 | | $ 25.83 |
| Net investment income (loss) (a) | (0.08) | | 0.04 | | 0.10 | | 0.11 | | 0.12 | | 0.02 |
| Net realized and unrealized gain (loss) on investments | 5.32 | | 9.93 | | 7.66 | | (1.10) | | 6.97 | | (0.01) |
| Total from investment operations | 5.24 | | 9.97 | | 7.76 | | (0.99) | | 7.09 | | 0.01 |
| Less distributions: | | | | | | | | | | | |
| From net investment income | — | | (0.11) | | (0.09) | | (0.12) | | (0.01) | | — |
| From net realized gain on investments | — | | (3.48) | | (2.86) | | (2.01) | | (0.20) | | (2.22) |
| Total distributions | — | | (3.59) | | (2.95) | | (2.13) | | (0.21) | | (2.22) |
| Net asset value at end of period | $ 43.81 | | $ 38.57 | | $ 32.19 | | $ 27.38 | | $ 30.50 | | $ 23.62 |
| Total investment return (b) | 13.59%(c) | | 31.97% | | 29.69% | | (4.48)% | | 30.09% | | 0.15% |
| Ratios (to average net assets)/Supplemental Data: | | | | | | | | | | | |
| Net investment income (loss) | (0.42)%†† | | 0.11% | | 0.32% | | 0.35% | | 0.46% | | 0.10%(d) |
| Net expenses (e) | 0.97%†† | | 0.98% | | 0.97% | | 0.98% | | 0.99% | | 1.01%(f) |
| Expenses (before waiver/reimbursement) (e) | 0.99%†† | | 0.98% | | 0.97% | | 0.98% | | 0.99% | | 1.01% |
| Portfolio turnover rate | 26% | | 144% | | 156% | | 127% | | 141% | | 177% |
| Net assets at end of period (in 000’s) | $ 59,156 | | $ 57,351 | | $ 56,122 | | $ 51,674 | | $ 66,735 | | $ 58,448 |
| * | Unaudited. |
| †† | Annualized. |
| (a) | Per share data based on average shares outstanding during the period. |
| (b) | Total return does not reflect any deduction of sales charges, mortality and expense charges, contract charges or administrative charges. For periods of less than one year, total return is not annualized. |
| (c) | Total investment return may reflect adjustments to conform to generally accepted accounting principles. |
| (d) | Without the custody fee reimbursement, net investment income (loss) would have been 0.09%. |
| (e) | In addition to the fees and expenses which the Portfolio bears directly, it also indirectly bears a pro-rata share of the fees and expenses of the underlying funds in which it invests. Such indirect expenses are not included in the above expense ratios. |
| (f) | Without the custody fee reimbursement, net expenses would have been 1.02%. |
The notes to the financial statements are an integral part of, and should be read in conjunction with, the financial statements.
17
Notes to Financial Statements (Unaudited)
Note 1–Organization and Business
MainStay VP Funds Trust (the “Fund”) was organized as a Delaware statutory trust on February 1, 2011. The Fund is registered under the Investment Company Act of 1940, as amended (the “1940 Act”), as an open-end management investment company. The Fund is comprised of thirty-one separate series (collectively referred to as the “Portfolios”). These financial statements and notes relate to the MainStay VP Wellington Growth Portfolio (formerly known as MainStay VP MacKay Growth Portfolio) (the "Portfolio"), a "diversified” portfolio, as that term is defined in the 1940 Act, as interpreted or modified by regulatory authorities having jurisdiction, from time to time.
Shares of the Portfolio are currently offered to certain separate accounts to fund variable annuity policies and variable universal life insurance policies issued by New York Life Insurance and Annuity Corporation (“NYLIAC”), a wholly-owned subsidiary of New York Life Insurance Company (“New York Life”) and may also be offered to fund variable annuity policies and variable universal life insurance policies issued by other insurance companies. NYLIAC allocates shares of the Portfolios to, among others, certain NYLIAC separate accounts. Shares of the Portfolio are also offered to the MainStay VP Conservative Allocation Portfolio, MainStay VP Moderate Allocation Portfolio, MainStay VP Growth Allocation Portfolio (formerly known as MainStay VP Moderate Growth Allocation Portfolio) and MainStay VP Equity Allocation Portfolio (formerly known as MainStay VP Growth Allocation Portfolio), which operate as “funds-of-funds," and other variable insurance funds.
The following table lists the Portfolio's share classes that have been registered and commenced operations:
| Class | Commenced Operations |
| Initial Class | January 29, 1993 |
| Service Class | June 5, 2003 |
Shares of the Portfolio are offered and are redeemed at a price equal to their respective net asset value (“NAV”) per share. No sales or redemption charge is applicable to the purchase or redemption of the Portfolio's shares. Under the terms of the Fund’s multiple class plan, adopted pursuant to Rule 18f-3 under the 1940 Act, the classes differ in that, among other things, Service Class shares of the Portfolio pay a combined distribution and service fee of 0.25% of average daily net assets attributable to Service Class shares of the Portfolio to the Distributor (as defined in Note 3(B)) pursuant to a plan adopted in accordance with Rule 12b-1 under the 1940 Act. Contract owners of variable annuity contracts purchased after June 2, 2003, are permitted to invest only in the Service Class shares.
The Portfolio's investment objective is to seek long-term growth of capital.
Note 2–Significant Accounting Policies
The Portfolio is an investment company and accordingly follows the investment company accounting and reporting guidance of the Financial Accounting Standards Board (“FASB”) Accounting Standard Codification Topic 946 Financial Services—Investment Companies. The Portfolio prepares its financial statements in accordance with generally accepted accounting principles (“GAAP”) in the United States of America and follows the significant accounting policies described below.
(A) Securities Valuation. Investments are usually valued as of the close of regular trading on the New York Stock Exchange (the "Exchange") (usually 4:00 p.m. Eastern time) on each day the Portfolio is open for business ("valuation date").
The Board of Trustees of the Fund (the "Board") adopted procedures establishing methodologies for the valuation of the Portfolio's securities and other assets and delegated the responsibility for valuation determinations under those procedures to the Valuation Committee of the Fund (the “Valuation Committee”). The procedures state that, subject to the oversight of the Board and unless otherwise noted, the responsibility for the day-to-day valuation of portfolio assets (including fair value measurements for the Portfolio's assets and liabilities) rests with New York Life Investment Management LLC (“New York Life Investments” or the "Manager"), aided to whatever extent necessary by the Subadvisor (as defined in Note 3(A)). To assess the appropriateness of security valuations, the Manager, the Subadvisor or the Portfolio's third-party service provider, who is subject to oversight by the Manager, regularly compares prior day prices, prices on comparable securities and the sale prices to the prior and current day prices and challenges prices with changes exceeding certain tolerance levels with third-party pricing services or broker sources.
The Board authorized the Valuation Committee to appoint a Valuation Subcommittee (the “Subcommittee”) to establish the prices of securities for which market quotations are not readily available or the prices of which are not otherwise readily determinable under the procedures. The Subcommittee meets (in person, via electronic mail or via teleconference) on an as-needed basis. The Valuation Committee meets to ensure that actions taken by the Subcommittee were appropriate.
For those securities valued through either a standardized fair valuation methodology or a fair valuation measurement, the Subcommittee deals with such valuation and the Valuation Committee reviews and affirms, if appropriate, the reasonableness of the valuation based on such methodologies and measurements on a regular basis after considering information that is reasonably available and deemed relevant by the Valuation Committee. Any action taken by the Subcommittee with respect to the valuation of a portfolio security or other asset is submitted for review and ratification (if appropriate) to the Valuation Committee and the Board at the next regularly scheduled meeting.
"Fair value" is defined as the price the Portfolio would reasonably expect to receive upon selling an asset or liability in an orderly transaction to an independent buyer in the principal or most advantageous market for the
| 18 | MainStay VP Wellington Growth Portfolio |
asset or liability. Fair value measurements are determined within a framework that establishes a three-tier hierarchy that maximizes the use of observable market data and minimizes the use of unobservable inputs to establish a classification of fair value measurements for disclosure purposes. "Inputs" refer broadly to the assumptions that market participants would use in pricing the asset or liability, including assumptions about risk, such as the risk inherent in a particular valuation technique used to measure fair value using a pricing model and/or the risk inherent in the inputs for the valuation technique. Inputs may be observable or unobservable. Observable inputs reflect the assumptions market participants would use in pricing the asset or liability based on market data obtained from sources independent of the Portfolio. Unobservable inputs reflect the Portfolio’s own assumptions about the assumptions market participants would use in pricing the asset or liability based on the information available. The inputs or methodology used for valuing assets or liabilities may not be an indication of the risks associated with investing in those assets or liabilities. The three-tier hierarchy of inputs is summarized below.
| • | Level 1—quoted prices in active markets for an identical asset or liability |
| • | Level 2—other significant observable inputs (including quoted prices for a similar asset or liability in active markets, interest rates and yield curves, prepayment speeds, credit risk, etc.) |
| • | Level 3—significant unobservable inputs (including the Portfolio's own assumptions about the assumptions that market participants would use in measuring fair value of an asset or liability) |
The level of an asset or liability within the fair value hierarchy is based on the lowest level of an input, both individually and in the aggregate, that is significant to the fair value measurement. The aggregate value by input level of the Portfolio’s assets and liabilities as of June 30, 2021, is included at the end of the Portfolio of Investments.
The Portfolio may use third-party vendor evaluations, whose prices may be derived from one or more of the following standard inputs, among others:
| • Broker/dealer quotes | • Benchmark securities |
| • Two-sided markets | • Reference data (corporate actions or material event notices) |
| • Bids/offers | • Monthly payment information |
| • Industry and economic events | • Reported trades |
An asset or liability for which market values cannot be measured using the methodologies described above is valued by methods deemed reasonable in good faith by the Valuation Committee, following the procedures established by the Board, to represent fair value. Under these procedures, the Portfolio generally uses a market-based approach which may use related or comparable assets or liabilities, recent transactions, market multiples, book values and other relevant information. The Portfolio may also use an income-based valuation approach in which the anticipated future cash flows of the asset or liability are discounted to
calculate fair value. Discounts may also be applied due to the nature and/or duration of any restrictions on the disposition of the asset or liability. Fair value represents a good faith approximation of the value of a security. Fair value determinations involve the consideration of a number of subjective factors, an analysis of applicable facts and circumstances and the exercise of judgment. As a result, it is possible that the fair value for a security determined in good faith in accordance with the Portfolio's valuation procedures may differ from valuations for the same security determined by other funds using their own valuation procedures. Although the Portfolio's valuation procedures are designed to value a security at the price the Portfolio may reasonably expect to receive upon the security's sale in an orderly transaction, there can be no assurance that any fair value determination thereunder would, in fact, approximate the amount that the Portfolio would actually realize upon the sale of the security or the price at which the security would trade if a reliable market price were readily available. During the six-month period ended June 30, 2021, there were no material changes to the fair value methodologies.
Securities which may be valued in this manner include, but are not limited to: (i) a security for which trading has been halted or suspended; (ii) a debt security that has recently gone into default and for which there is not a current market quotation; (iii) a security of an issuer that has entered into a restructuring; (iv) a security that has been delisted from a national exchange; (v) a security for which the market price is not readily available from a third-party pricing source or, if so provided, does not, in the opinion of the Manager or the Subadvisor, reflect the security's market value; (vi) a security subject to trading collars for which no or limited trading takes place; and (vii) a security whose principal market has been temporarily closed at a time when, under normal conditions, it would be open. Securities valued in this manner are generally categorized as Level 3 in the hierarchy. No securities held by the Portfolio as of June 30, 2021 were fair valued in such a manner.
Certain securities held by the Portfolio may principally trade in foreign markets. Events may occur between the time the foreign markets close and the time at which the Portfolio's NAVs are calculated. These events may include, but are not limited to, situations relating to a single issuer in a market sector, significant fluctuations in U.S. or foreign markets, natural disasters, armed conflicts, governmental actions or other developments not tied directly to the securities markets. Should the Manager or the Subadvisor conclude that such events may have affected the accuracy of the last price of such securities reported on the local foreign market, the Subcommittee may, pursuant to procedures adopted by the Board, adjust the value of the local price to reflect the estimated impact on the price of such securities as a result of such events. In this instance, securities are generally categorized as Level 3 in the hierarchy. Additionally, certain foreign equity securities are also fair valued whenever the movement of a particular index exceeds certain thresholds. In such cases, the securities are fair valued by applying factors provided by a third-party vendor in accordance with valuation procedures adopted by the Board and are generally categorized as Level 2 in the hierarchy. No foreign equity securities held by the Portfolio as of June 30, 2021 were fair valued in such a manner.
Notes to Financial Statements (Unaudited) (continued)
Equity securities are valued at the last quoted sales prices as of the close of regular trading on the relevant exchange on each valuation date. Securities that are not traded on the valuation date are valued at the mean of the last quoted bid and ask prices. Prices are normally taken from the principal market in which each security trades. These securities are generally categorized as Level 1 in the hierarchy.
Investments in mutual funds, including money market funds, are valued at their respective NAVs at the close of business each day on the valuation date. These securities are generally categorized as Level 1 in the hierarchy.
Temporary cash investments acquired in excess of 60 days to maturity at the time of purchase are valued using the latest bid prices or using valuations based on a matrix system (which considers such factors as security prices, yields, maturities and ratings), both as furnished by independent pricing services. Temporary cash investments that mature in 60 days or less at the time of purchase ("Short-Term Investments") are valued using the amortized cost method of valuation, unless the use of such method would be inappropriate. The amortized cost method involves valuing a security at its cost on the date of purchase and thereafter assuming a constant amortization to maturity of the difference between such cost and the value on maturity date. Amortized cost approximates the current fair value of a security. Securities valued using the amortized cost method are not valued using quoted prices in an active market and are generally categorized as Level 2 in the hierarchy.
The information above is not intended to reflect an exhaustive list of the methodologies that may be used to value portfolio investments. The valuation procedures permit the use of a variety of valuation methodologies in connection with valuing portfolio investments. The methodology used for a specific type of investment may vary based on the market data available or other considerations. The methodologies summarized above may not represent the specific means by which portfolio investments are valued on any particular business day.
(B) Income Taxes. The Portfolio's policy is to comply with the requirements of the Internal Revenue Code of 1986, as amended (the “Internal Revenue Code”), applicable to regulated investment companies and to distribute all of its taxable income to the shareholders of the Portfolio within the allowable time limits.
The Manager evaluates the Portfolio’s tax positions to determine if the tax positions taken meet the minimum recognition threshold in connection with accounting for uncertainties in income tax positions taken or expected to be taken for the purposes of measuring and recognizing tax liabilities in the financial statements. Recognition of tax benefits of an uncertain tax position is permitted only to the extent the position is “more likely than not” to be sustained assuming examination by taxing authorities. The Manager analyzed the Portfolio's tax positions taken on federal, state and local income tax returns for all open tax years (for up to three tax years) and has concluded that no provisions for federal, state and local income tax are required in the Portfolio's financial statements. The Portfolio's federal, state and local income tax and federal excise tax
returns for tax years for which the applicable statutes of limitations have not expired are subject to examination by the Internal Revenue Service and state and local departments of revenue.
(C) Foreign Taxes. The Portfolio may be subject to foreign taxes on income and other transaction-based taxes imposed by certain countries in which it invests. A portion of the taxes on gains on investments or currency purchases/repatriation may be reclaimable. The Portfolio will accrue such taxes and reclaims as applicable, based upon its current interpretation of tax rules and regulations that exist in the markets in which it invests.
The Portfolio may be subject to taxation on realized capital gains, repatriation proceeds and other transaction-based taxes imposed by certain countries in which it invests. The Portfolio will accrue such taxes as applicable based upon its current interpretation of tax rules and regulations that exist in the market in which it invests. Capital gains taxes relating to positions still held are reflected as a liability in the Statement of Assets and Liabilities, as well as an adjustment to the Portfolio's net unrealized appreciation (depreciation). Taxes related to capital gains realized, if any, are reflected as part of net realized gain (loss) in the Statement of Operations. Changes in tax liabilities related to capital gains taxes on unrealized investment gains, if any, are reflected as part of the change in net unrealized appreciation (depreciation) on investments in the Statement of Operations. Transaction-based charges are generally assessed as a percentage of the transaction amount.
(D) Dividends and Distributions to Shareholders. Dividends and distributions are recorded on the ex-dividend date. The Portfolio intends to declare and pay dividends from net investment income and distributions from net realized capital and currency gains, if any, at least annually. Unless a shareholder elects otherwise, all dividends and distributions are reinvested at NAV in the same class of shares of the Portfolio. Dividends and distributions to shareholders are determined in accordance with federal income tax regulations and may differ from determinations using GAAP.
(E) Security Transactions and Investment Income. The Portfolio records security transactions on the trade date. Realized gains and losses on security transactions are determined using the identified cost method. Dividend income is recognized on the ex-dividend date, net of any foreign tax withheld at the source, and interest income is accrued as earned using the effective interest rate method. Distributions received from real estate investment trusts may be classified as dividends, capital gains and/or return of capital.
Investment income and realized and unrealized gains and losses on investments of the Portfolio are allocated pro rata to the separate classes of shares based upon their relative net assets on the date the income is earned or realized and unrealized gains and losses are incurred.
(F) Expenses. Expenses of the Fund are allocated to the individual Portfolios in proportion to the net assets of the respective Portfolios when the expenses are incurred, except where direct allocations of expenses can be made. Expenses (other than fees incurred under the distribution
| 20 | MainStay VP Wellington Growth Portfolio |
and service plans, further discussed in Note 3(B), which are charged directly to the Service Class shares) are allocated to separate classes of shares pro rata based upon their relative net assets on the date the expenses are incurred. The expenses borne by the Portfolio, including those of related parties to the Portfolio, are shown in the Statement of Operations.
Additionally, the Portfolio may invest in mutual funds, which are subject to management fees and other fees that may cause the costs of investing in mutual funds to be greater than the costs of owning the underlying securities directly. These indirect expenses of mutual funds are not included in the amounts shown as expenses in the Statement of Operations or in the expense ratios included in the Financial Highlights.
(G) Use of Estimates. In preparing financial statements in conformity with GAAP, the Manager makes estimates and assumptions that affect the reported amounts and disclosures in the financial statements. Actual results could differ from those estimates and assumptions.
(H) Securities Lending. In order to realize additional income, the Portfolio may engage in securities lending, subject to the limitations set forth in the 1940 Act and relevant guidance by the staff of the Securities and Exchange Commission (“SEC”). If the Portfolio engages in securities lending, the Portfolio will lend through its custodian, JPMorgan Chase Bank, N.A., ("JPMorgan"), acting as securities lending agent on behalf of the Portfolio. Under the current arrangement, JPMorgan will manage the Portfolio's collateral in accordance with the securities lending agency agreement between the Portfolio and JPMorgan, and indemnify the Portfolio against counterparty risk. The loans will be collateralized by cash (which may be invested in a money market fund) and/or non-cash collateral (which may include U.S. Treasury securities and/or U.S. government agency securities issued or guaranteed by the United States government or its agencies or instrumentalities) at least equal at all times to the market value of the securities loaned. The Portfolio bears the risk of delay in recovery of, or loss of rights in, the securities loaned. The Portfolio may also record a realized gain or loss on securities deemed sold due to a borrower’s inability to return securities on loan. The Portfolio bears the risk of any loss on investment of cash collateral. The Portfolio will receive compensation for lending its securities in the form of fees or it will retain a portion of interest earned on the investment of any cash collateral. The Portfolio will also continue to receive interest and dividends on the securities loaned and any gain or loss in the market price of the securities loaned that may occur during the term of the loan will be for the account of the Portfolio. Income earned from securities lending activities, if any, is reflected in the Statement of Operations. Securities on loan as of June 30, 2021, are shown in the Portfolio of Investments.
Prior to February 22, 2021, these services were provided by State Street Bank and Trust Company (“State Street”).
(I) Indemnifications. Under the Fund’s organizational documents, its officers and trustees are indemnified against certain liabilities that may arise out of performance of their duties to the Fund. Additionally, in the normal course of business, the Portfolio enters into contracts with
third-party service providers that contain a variety of representations and warranties and that may provide general indemnifications. The Portfolio's maximum exposure under these arrangements is unknown, as this would involve future claims that may be made against the Portfolio that have not yet occurred. The Manager believes that the risk of loss in connection with these potential indemnification obligations is remote. However, there can be no assurance that material liabilities related to such obligations will not arise in the future, which could adversely impact the Portfolio.
Note 3–Fees and Related Party Transactions
(A) Manager and Subadvisor. New York Life Investments, a registered investment adviser and an indirect, wholly-owned subsidiary of New York Life, serves as the Portfolio's Manager, pursuant to an Amended and Restated Management Agreement ("Management Agreement"). The Manager provides offices, conducts clerical, recordkeeping and bookkeeping services and keeps most of the financial and accounting records required to be maintained by the Portfolio. Except for the portion of salaries and expenses that are the responsibility of the Portfolio, the Manager pays the salaries and expenses of all personnel affiliated with the Portfolio and certain operational expenses of the Portfolio. The Portfolio reimburses New York Life Investments in an amount equal to the portion of the compensation of the Chief Compliance Officer attributable to the Portfolio. The Portfolio’s subadvisor changed effective May 1, 2021, due to the replacement of MacKay Shields LLC ("MacKay Shields") as the Portfolio’s subadvisor and the appointment of Wellington Management Company LLP (“Wellington” or the “Subadvisor”) as the Portfolio’s subadvisor. Wellington, a registered investment adviser, is responsible for the day-to-day portfolio management of the Portfolio. Pursuant to the terms of a Subadvisory Agreement ("Subadvisory Agreement") between New York Life Investments and Wellington, New York Life Investments pays for the services of the Subadvisor.
Pursuant to the Management Agreement, the Fund pays the Manager, on behalf of the Portfolio, a monthly fee for the services performed and the facilities furnished at an annual rate of the Portfolio's average daily net assets as follows: 0.70% up to $500 million; 0.65% from $500 million to $1 billion; 0.625% from $1 billion to $2 billion; and 0.60% in excess of $2 billion. During the six-month period ended June 30, 2021, the effective management fee rate was 0.69%.
During the six-month period ended June 30, 2021, New York Life Investments earned fees from the Portfolio in the amount of $2,250,568 and waived fees/reimbursed expenses in the amount of $46,857 and paid MacKay Shields and Wellington fees in the amount of $738,905 and $319,649, respectively.
JPMorgan provides sub-administration and sub-accounting services to the Portfolio pursuant to an agreement with New York Life Investments. These services include calculating the daily NAVs of the Portfolio, maintaining the general ledger and sub-ledger accounts for the calculation of the Portfolio's NAVs, and assisting New York Life Investments in conducting various aspects of the Portfolio's
Notes to Financial Statements (Unaudited) (continued)
administrative operations. For providing these services to the Portfolio, JPMorgan is compensated by New York Life Investments.
Prior to February 22, 2021, these services were provided by State Street.
Pursuant to an agreement between the Fund and New York Life Investments, New York Life Investments is responsible for providing or procuring certain regulatory reporting services for the Portfolio. The Portfolio will reimburse New York Life Investments for the actual costs incurred by New York Life Investments in connection with providing or procuring these services for the Portfolio.
(B) Distribution and Service Fees. The Fund, on behalf of the Portfolio, has entered into a distribution agreement with NYLIFE Distributors LLC (the “Distributor”), an affiliate of New York Life
Investments. The Portfolio has adopted a distribution plan (the “Plan”) in accordance with the provisions of Rule 12b-1 under the 1940 Act. Under the Plan, the Distributor has agreed to provide, through its affiliates or independent third parties, various distribution-related, shareholder and administrative support services to the Service Class shareholders. For its services, the Distributor is entitled to a combined distribution and service fee accrued daily and paid monthly at an annual rate of 0.25% of the average daily net assets attributable to the Service Class shares of the Portfolio.
(C) Investments in Affiliates (in 000’s). During the six-month period ended June 30, 2021, purchases and sales transactions, income earned from investments and shares held of investment companies managed by New York Life Investments or its affiliates were as follows:
| Affiliated Investment Companies | Value,
Beginning
of Period | Purchases
at Cost | Proceeds
from
Sales | Net
Realized
Gain/(Loss)
on Sales | Change in
Unrealized
Appreciation/
(Depreciation) | Value,
End of
Period | Dividend
Income | Other
Distributions | Shares
End of
Period |
| MainStay U.S. Government Liquidity Fund | $ 32 | $ 65,788 | $ (64,725) | $ — | $ — | $ 1,095 | $ —(a) | $ — | 1,095 |
Note 4-Federal Income Tax
As of June 30, 2021, the cost and unrealized appreciation (depreciation) of the Portfolio’s investment portfolio, including applicable derivative contracts and other financial instruments, as determined on a federal income tax basis, were as follows:
| | Federal Tax
Cost | Gross
Unrealized
Appreciation | Gross
Unrealized
(Depreciation) | Net
Unrealized
Appreciation/
(Depreciation) |
| Investments in Securities | $575,142,747 | $151,240,411 | $(10,904,276) | $140,336,135 |
During the year ended December 31, 2020, the tax character of distributions paid as reflected in the Statements of Changes in Net Assets was as follows:
| | 2020 |
| Distributions paid from: | |
| Ordinary Income | $21,811,757 |
| Long-Term Capital Gains | 43,014,775 |
| Total | $64,826,532 |
Note 5–Custodian
JPMorgan is the custodian of cash and securities held by the Portfolio. Custodial fees are charged to the Portfolio based on the Portfolio's net assets and/or the market value of securities held by the Portfolio and the number of certain transactions incurred by the Portfolio.
Prior to February 22, 2021, these services were provided by State Street. The services provided by State Street were a direct expense of the Portfolio and are included in the Statement of Operations as Custodian fees which totaled $3,802 for the period January 1, 2021 through February 21, 2021.
Note 6–Line of Credit
The Portfolio and certain other funds managed by New York Life Investments maintain a line of credit with a syndicate of banks in order to secure a source of funds for temporary purposes to meet unanticipated or excessive redemption requests.
Effective July 27, 2021, under the credit agreement (the “Credit Agreement”), the aggregate commitment amount is $600,000,000 with an additional uncommitted amount of $100,000,000. The commitment fee is an annual rate of 0.15% of the average commitment amount payable quarterly, regardless of usage, to JPMorgan, who serves as the agent to the syndicate. The commitment fee is allocated among the Portfolio and certain other funds managed by New York Life Investments based upon their respective net assets and other factors. Interest on any revolving credit loan is charged based upon the Federal Funds Rate or the one-month London Interbank Offered Rate ("LIBOR"), whichever is higher. The Credit Agreement expires on July 26, 2022, although the Portfolio, certain other funds managed by New York Life Investments and the syndicate of banks may renew the Credit Agreement for an additional year on the same or different terms or enter into a credit agreement with a different syndicate of banks. Prior to July 27, 2021, the aggregate commitment amount and the commitment fee were the same as those
| 22 | MainStay VP Wellington Growth Portfolio |
under the current Credit Agreement. During the six-month period ended June 30, 2021, there were no borrowings made or outstanding with respect to the Portfolio under the Credit Agreement.
Note 7–Interfund Lending Program
Pursuant to an exemptive order issued by the SEC, the Portfolio, along with certain other funds managed by New York Life Investments, may participate in an interfund lending program. The interfund lending program provides an alternative credit facility that permits the Portfolio and certain other funds managed by New York Life Investments to lend or borrow money for temporary purposes directly to or from one another, subject to the conditions of the exemptive order. During the six-month period ended June 30, 2021, there were no interfund loans made or outstanding with respect to the Portfolio.
Note 8–Purchases and Sales of Securities (in 000’s)
During the six-month period ended June 30, 2021, purchases and sales of securities, other than short-term securities, were $172,523 and $187,228, respectively.
Note 9–Capital Share Transactions
Transactions in capital shares for the six-month period ended June 30, 2021 and the year ended December 31, 2020, were as follows:
| Initial Class | Shares | Amount |
| Period ended June 30, 2021: | | |
| Shares sold | 739,411 | $ 30,714,390 |
| Shares redeemed | (1,085,636) | (44,902,054) |
| Net increase (decrease) | (346,225) | $ (14,187,664) |
| Year ended December 31, 2020: | | |
| Shares sold | 270,749 | $ 7,421,176 |
| Shares issued to shareholders in reinvestment of distributions | 1,663,929 | 59,754,524 |
| Shares redeemed | (6,824,924) | (238,125,894) |
| Net increase (decrease) | (4,890,246) | $(170,950,194) |
| |
| Service Class | Shares | Amount |
| Period ended June 30, 2021: | | |
| Shares sold | 3,593 | $ 142,654 |
| Shares redeemed | (140,200) | (5,710,411) |
| Net increase (decrease) | (136,607) | $ (5,567,757) |
| Year ended December 31, 2020: | | |
| Shares sold | 19,462 | $ 640,061 |
| Shares issued to shareholders in reinvestment of distributions | 143,286 | 5,072,008 |
| Shares redeemed | (419,134) | (14,131,327) |
| Net increase (decrease) | (256,386) | $ (8,419,258) |
Note 10–Other Matters
An outbreak of COVID-19, first detected in December 2019, has developed into a global pandemic and has resulted in travel restrictions, closure of international borders, certain businesses and securities markets, restrictions on securities trading activities, prolonged quarantines, supply chain disruptions, and lower consumer demand, as well as general concern and uncertainty. The continued impact of COVID-19 and related new variants is uncertain and could further adversely affect the global economy, national economies, individual issuers and capital markets in unforeseeable ways and result in a substantial and extended economic downturn. Developments that disrupt global economies and financial markets, such as COVID-19, may magnify factors that affect the Portfolio's performance.
Note 11–Subsequent Events
In connection with the preparation of the financial statements of the Portfolio as of and for the six-month period ended June 30, 2021, events and transactions subsequent to June 30, 2021, through the date the financial statements were issued have been evaluated by the Manager for possible adjustment and/or disclosure. No subsequent events requiring financial statement adjustment or disclosure have been identified.
Board Consideration and Approval of Subadvisory Agreement with Wellington Management Company LLP (Unaudited)
The Subadvisory Agreement between New York Life Investment Management LLC (“New York Life Investments”) and Wellington Management Company LLP (“Wellington”) with respect to the MainStay VP Wellington Growth Portfolio (formerly known as the MainStay VP MacKay Growth Portfolio) (“Portfolio”) (“New Subadvisory Agreement”), must be approved initially and, following an initial term of up to two years, is subject to annual review and approval by the Board of Trustees of MainStay VP Funds Trust (“Board” of the “Trust”) in accordance with Section 15 of the Investment Company Act of 1940, as amended (“1940 Act”). At its February 3, 2021 meeting, the Board, including the Trustees who are not an “interested person” (as such term is defined in the 1940 Act) of the Trust (“Independent Trustees”) voting separately, unanimously approved the New Subadvisory Agreement for an initial two-year period.
At meetings held on January 21, January 25 and February 3, 2021, the Board considered and approved New York Life Investments’ recommendations to appoint Wellington as the subadvisor to the Portfolio, to approve the New Subadvisory Agreement and to approve the related changes to the Portfolio’s principal investment strategies, name and investment process (the “Repositioning”), all effective on or about May 1, 2021. The Board noted that the material terms of the New Subadvisory Agreement are substantially identical to the terms of the then-current subadvisory agreement with MacKay Shields LLC (“MacKay”) with respect to the Portfolio, but that the subadvisory fee schedule under the New Subadvisory Agreement with Wellington includes fees that are lower at every level of assets than the subadvisory fees paid to MacKay under the then-current subadvisory agreement.
In reaching the decisions to approve the Repositioning and New Subadvisory Agreement, the Board considered information furnished by New York Life Investments and Wellington in connection with meetings of the Board and its Contracts, Investment and Risk and Compliance Oversight Committees held on January 21, January 25 and February 3, 2021, as well as other information furnished to the Board and its Committees throughout the year, as deemed relevant by the Trustees. The Board also considered information on the fees charged to other investment advisory clients of Wellington that follow investment strategies similar to those proposed for the Portfolio, as repositioned, and, when applicable, the rationale for any differences in the Portfolio’s proposed subadvisory fee and the fees charged to those other investment advisory clients. In addition, the Board considered information previously provided to the Board in connection with its review of the subadvisory agreements for other funds in the MainStay Group of Funds, as deemed relevant to each Trustee. The Board also considered information furnished by Wellington in response to requests prepared on behalf of the Board, and in consultation with the Independent Trustees, by independent legal counsel to the Independent Trustees, which encompassed a variety of topics, including those summarized below.
The Board took into account information provided in connection with its meetings throughout the year, including, among other items, information regarding the legal standards and fiduciary obligations applicable to its consideration of the New Subadvisory Agreement and investment performance reports on the Portfolio as well as presentations from New
York Life Investments and Wellington personnel. The contract review process, including the structure and format for materials provided to the Board, has been developed in consultation with the Board. The Independent Trustees also met in executive sessions with their independent legal counsel and, for a portion thereof, with senior management of New York Life Investments.
In considering the Repositioning and the New Subadvisory Agreement, the Trustees reviewed and evaluated the information and factors they believed to reasonably be necessary and appropriate in light of legal advice furnished to them by independent legal counsel and through the exercise of their own business judgment. Although individual Trustees may have weighed certain factors or information differently, the factors considered by the Board are described in greater detail below and include, among other factors: (i) the nature, extent and quality of the services to be provided to the Portfolio by Wellington; (ii) the investment performance of the Portfolio, the qualifications of the proposed portfolio managers of the Portfolio and the historical investment performance of products managed by such portfolio managers with investment strategies similar to those of the Portfolio, as repositioned; (iii) the anticipated costs of the services to be provided, and profits expected to be realized, by Wellington from its relationship with the Portfolio; (iv) the extent to which economies of scale may be realized if the Portfolio grows and the extent to which economies of scale may benefit the Portfolio’s shareholders; and (v) the reasonableness of the Portfolio’s proposed subadvisory fee to be paid by New York Life Investments to Wellington and estimated total ordinary operating expenses. Although the Board recognized that comparisons between the Portfolio’s proposed fees and estimated expenses and those of other funds are imprecise given different terms of agreements, variations in fund strategies and other factors, the Board considered the reasonableness of the Portfolio’s proposed fees and estimated total ordinary operating expenses as compared to the peer funds identified by New York Life Investments.
Although individual Trustees may have weighed certain factors or information differently, the Board’s decisions to approve the Repositioning and the New Subadvisory Agreement were based on a consideration of the information provided to the Trustees throughout the year, such as presentations from Wellington personnel, as well as information furnished specifically in connection with the contract review process for the Portfolio, in each case as deemed relevant to each Trustee. The Trustees noted that, throughout the year, the Trustees would be afforded an opportunity to ask questions of, and request additional information or materials from, New York Life Investments and Wellington with respect to the Portfolio. The Board took note of New York Life Investments’ belief that Wellington, with its resources and historical investment performance track record for strategies similar to those of the Portfolio, as repositioned, is well qualified to serve as the Portfolio’s subadvisor. In addition to considering the above-referenced factors, the Board observed that in the marketplace, notably under variable life insurance policies and variable annuity contracts for which the Portfolio serves as an investment
| 24 | MainStay VP Wellington Growth Portfolio |
option, there are a range of investment options available to the Portfolio’s shareholders and such shareholders, having had the opportunity to consider other investment options, have chosen to invest in the Portfolio.
The factors that figured prominently in the Board’s decisions to approve the Repositioning and the New Subadvisory Agreement are summarized in more detail below, and the Board did not consider any factor or information controlling in reaching such decisions.
Nature, Extent and Quality of Services to be Provided by Wellington
In considering the Repositioning and the New Subadvisory Agreement, the Board considered New York Life Investments’ responsibilities as manager of the Portfolio, noting that New York Life Investments is responsible for supervising the Portfolio’s subadvisor. The Board examined the nature, extent and quality of the investment advisory services that Wellington proposed to provide to the Portfolio. Further, the Board evaluated and/or examined the following with regard to Wellington:
| • | experience in providing investment advisory services; |
| • | experience in serving as advisor or subadvisor to other funds with similar strategies as those of the Portfolio, as repositioned, and the performance track record of those funds; |
| • | experience of investment advisory, senior management and administrative personnel; |
| • | overall legal and compliance environment, resources and history and policies and procedures in place with respect to matters that may involve conflicts of interest between the Portfolio’s investments and those of other accounts managed by Wellington; |
| • | New York Life Investments’ and Wellington’s belief that their respective compliance policies, procedures and systems are reasonably designed to prevent violation of the federal securities laws and their commitment to further developing and strengthening compliance programs relating to the MainStay Group of Funds generally and the Portfolio specifically; |
| • | ability to attract and retain qualified investment professionals and willingness to invest in personnel to service and support the Portfolio; |
| • | portfolio construction and risk management processes; |
| • | experience of the Portfolio’s proposed portfolio managers, including with respect to investment strategies similar to those of the Portfolio, as repositioned, the number of accounts managed by the portfolio managers and the method for compensating the portfolio managers; and |
| • | overall reputation, financial condition and assets under management. |
Based on these considerations, the Board concluded that the Portfolio would likely benefit from the nature, extent and quality of the proposed investment advisory services to be provided by Wellington.
Investment Performance
In evaluating the Portfolio’s investment performance, the Board considered investment performance results over various periods in light of the Portfolio’s investment objective, strategies and risks. The Board considered investment reports on, and analysis of, the Portfolio’s performance provided to the Board throughout the year. These reports include, among other items, information on the Portfolio’s gross and net returns, the Portfolio’s investment performance compared to relevant investment categories and the Portfolio’s benchmarks, the Portfolio’s risk-adjusted investment performance and the Portfolio’s investment performance as compared to peer funds, as appropriate, as well as portfolio attribution information and commentary on the effect of market conditions.
The Board also gave weight to its discussions with senior management at New York Life Investments concerning the Portfolio’s investment performance and remediation efforts undertaken by New York Life Investments, and other alternatives to the Repositioning, and the New Subadvisory Agreement considered by New York Life Investments. In addition, the Board considered steps taken to seek to improve the Portfolio’s investment performance and discussions between the Portfolio’s current portfolio management team and the Investment Committee of the Board. The Board further considered that shareholders may benefit from Wellington’s investment process, including its portfolio construction and risk management processes. The Board noted that the Repositioning had not yet been implemented so an investment performance track record for the Portfolio, as repositioned, was not available.
The Board evaluated the Portfolio’s proposed portfolio management team, investment process, strategies and risks. The Board noted that Wellington currently manages one or more portfolios with investment strategies similar to those of the Portfolio, as repositioned. Additionally, the Board considered the historical performance of such portfolio or portfolios and other portfolios managed by the proposed portfolio managers for the Portfolio. Based on these considerations, the Board concluded that the Portfolio was likely to be managed responsibly and capably by Wellington.
Based on these considerations, the Board concluded that the selection of Wellington as the subadvisor to the Portfolio is likely to benefit the Portfolio’s long-term investment performance.
Costs of the Services to be Provided, and Profits to be Realized, by Wellington
The Board considered the anticipated costs of the services to be provided by Wellington under the New Subadvisory Agreement and the profits expected to be realized by Wellington due to its relationship with the Portfolio. The Board considered that Wellington’s subadvisory fee had been negotiated at arm’s-length by New York Life Investments and that these fees would be paid by New York Life Investments, not the Portfolio.
Board Consideration and Approval of Subadvisory Agreement with Wellington Management Company LLP (Unaudited) (continued)
In evaluating the anticipated costs of the services to be provided by Wellington and profits expected to be realized by Wellington, the Board considered, among other factors, Wellington’s investments in, or willingness to invest in, personnel, systems, equipment and other resources and infrastructure to support and further enhance the services proposed to be provided to the Portfolio, and that New York Life Investments would be responsible for paying the subadvisory fee to Wellington. The Board also considered the financial resources of Wellington and acknowledged that Wellington must be in a position to attract and retain experienced professional personnel and to maintain a strong financial position for Wellington to be able to provide high-quality services to the Portfolio.
In considering anticipated costs and profitability, the Board also considered certain fall-out benefits that may be realized by Wellington due to its relationship with the Portfolio, including reputational and other indirect benefits. The Board recognized, for example, the potential benefits to Wellington from legally permitted “soft-dollar” arrangements by which brokers would provide research and other services to Wellington in exchange for commissions paid by the Portfolio with respect to trades in the Portfolio’s portfolio securities. In addition, the Board also requested and received information from New York Life Investments concerning other material business relationships between Wellington and its affiliates and New York Life Investments and its affiliates, and considered the existence of a strategic partnership between New York Life Investments and Wellington that relates to certain current and future products that represented a conflict of interest associated with New York Life Investments’ recommendation to approve the Repositioning and the New Subadvisory Agreement.
The Board took into account the fact that the Portfolio would undergo changes to its principal investment strategies in connection with the Repositioning. The Board noted estimates from New York Life Investments and Wellington that a significant portion of the holdings of the Portfolio would be sold to align the Portfolio’s holdings with the strategies that would be pursued by Wellington. Additionally, the Board considered New York Life Investments’ representation that New York Life Investments would work closely with Wellington to seek to execute the optimal transition strategy and that New York Life Investments would make every effort to minimize potential direct and indirect costs associated with the Repositioning.
The Board considered that any profits realized by Wellington due to its relationship with the Portfolio would be the result of arm’s-length negotiations between New York Life Investments and Wellington, acknowledging that any such profits would be based on fees paid to Wellington by New York Life Investments, not the Portfolio.
Subadvisory Fee and Estimated Total Ordinary Operating Expenses
The Board evaluated the reasonableness of the fee to be paid under the New Subadvisory Agreement and the Portfolio’s estimated total ordinary operating expenses. The Board primarily considered the reasonableness
of the management fee to be paid by the Portfolio to New York Life Investments because the subadvisory fee to be paid to Wellington would be paid by New York Life Investments, not the Portfolio. The Board also considered the reasonableness of the subadvisory fee to be paid by New York Life Investments and the amount of the management fee expected to be retained by New York Life Investments.
In assessing the reasonableness of the Portfolio’s proposed fees and estimated expenses, the Board considered information provided by New York Life Investments on fees and expenses of peer funds, and the Board considered information provided by Wellington on fees charged to other investment advisory clients, including institutional separate accounts and/or other funds that follow investment strategies similar to those of the Portfolio, as repositioned. The Board considered the similarities and differences in the contractual fee schedules of the Portfolio and these similarly-managed accounts and/or funds, taking into account the rationale for any differences in fee schedules. The Board also considered that in proposing fees for the Portfolio, New York Life Investments considers the competitive marketplace for mutual funds.
Based on the factors outlined above, the Board concluded that the Portfolio’s management fee and total ordinary operating expenses were within a range that is competitive and support a conclusion that these fees and expenses are reasonable.
Economies of Scale
The Board considered information regarding economies of scale, including whether the Portfolio’s proposed expense structure would permit economies of scale to be appropriately shared with the Portfolio’s beneficial shareholders. The Board also considered a report from New York Life Investments, previously prepared at the request of the Board, that addressed economies of scale, including with respect to the mutual fund business generally and the various ways in which the benefits of economies of scale may be shared with the funds in the MainStay Group of Funds. Although the Board recognized the difficulty of determining economies of scale with precision, the Board acknowledged that economies of scale may be shared with the Portfolio in a number of ways, including, for example, through the imposition of fee breakpoints, initially setting management fee rates at scale or making additional investments to enhance services.
Based on this information, the Board concluded that economies of scale are appropriately reflected for the benefit of the Portfolio’s beneficial shareholders through the Portfolio’s proposed expense structure and other methods to share benefits from economies of scale.
Conclusion
On the basis of the information and factors summarized above, among other information and factors deemed relevant by the Trustees, and the evaluation thereof, the Board, including the Independent Trustees voting separately, unanimously voted to approve the Repositioning and the New Subadvisory Agreement.
| 26 | MainStay VP Wellington Growth Portfolio |
Discussion of the Operation and Effectiveness of the Portfolio's Liquidity Risk Management Program (Unaudited)
In compliance with Rule 22e-4 under the Investment Company Act of 1940, as amended (the “Liquidity Rule”), the Portfolio has adopted and implemented a liquidity risk management program (the “Program”), which New York Life Investment Management LLC believes is reasonably designed to assess and manage the Portfolio's liquidity risk (the risk that the Portfolio could not meet requests to redeem shares issued by the Portfolio without significant dilution of remaining investors’ interests in the Portfolio). The Board of Trustees of MainStay VP Funds Trust (the "Board") designated New York Life Investment Management LLC as administrator of the Program (the “Administrator”). The Administrator has established a Liquidity Risk Management Committee to assist the Administrator in the implementation and day-to-day administration of the Program and to otherwise support the Administrator in fulfilling its responsibilities under the Program.
At a meeting of the Board held on March 8, 2021, the Administrator provided the Board with a written report addressing the Program’s operation and assessing its adequacy and effectiveness of implementation for the period from January 1, 2020 through December 31, 2020 (the "Review Period"), as required under the Liquidity Rule. The report noted that the Administrator concluded that (i) the Program operated effectively to assess and manage the Portfolio's liquidity risk, (ii) the Program has been adequately and effectively implemented to monitor and, as applicable, respond to the Portfolio's liquidity developments and (iii) the Portfolio's investment strategy continues to be appropriate for an open-end fund. In addition, the report discussed notable events that impacted liquidity risk during the Review Period, including the COVID-19 pandemic and the resulting economic shutdown.
In accordance with the Program, the Portfolio's liquidity risk is assessed no less frequently than annually taking into consideration certain factors, as applicable, such as (i) investment strategy and liquidity of portfolio investments, (ii) short-term and long-term cash flow projections and (iii) holdings of cash and cash equivalents, as well as borrowing arrangements and other funding sources. Certain factors are considered under both normal and reasonably foreseeable stressed conditions.
Each Portfolio portfolio investment is classified into one of four liquidity categories. The classification is based on a determination of the number of days it is reasonably expected to take to convert the investment into cash, or sell or dispose of the investment, in current market conditions without significantly changing the market value of the investment. The Administrator has delegated liquidity classification determinations to the Portfolio’s subadvisor, subject to appropriate oversight by the Administrator, and classification determinations are made by taking into account the Portfolio's reasonably anticipated trade size, various market, trading and investment-specific considerations, as well as market depth, and, in certain cases, third-party vendor data.
The Liquidity Rule requires portfolios that do not primarily hold assets that are highly liquid investments to adopt a minimum amount of net assets that must be invested in highly liquid investments that are assets (an “HLIM”). In addition, the Liquidity Rule limits a portfolio's investments in illiquid investments. Specifically, the Liquidity Rule prohibits acquisition of illiquid investments if doing so would result in a portfolio holding more than 15% of its net assets in illiquid investments that are assets. The Program includes provisions reasonably designed to determine, periodically review and comply with the HLIM requirement, as applicable, and to comply with the 15% limit on illiquid investments.
There can be no assurance that the Program will achieve its objectives under all circumstances in the future. Please refer to the Portfolio's prospectus for more information regarding the Portfolio's exposure to liquidity risk and other risks to which it may be subject.
Proxy Voting Record
The Portfolio is required to file with the SEC its proxy voting records for the 12-month period ending June 30 on Form N-PX. The Portfolio's most recent Form N-PX or proxy voting record is available free of charge upon request (i) by calling 800-598-2019; (ii) by visiting New York Life Investments’ website at https://www.nylinvestments.com/mainstay/
products-and-performance/mainstay-vp-funds-trust; or (iii) by visiting the SEC’s website at www.sec.gov.
Shareholder Reports and Quarterly Portfolio Disclosure
The Portfolio is required to file its complete schedule of portfolio holdings with the SEC 60 days after its first and third fiscal quarter on Form N-PORT. The Portfolio's holdings report is available free of charge upon request by calling 800-598-2019 or by visiting the SEC’s website at www.sec.gov.
| 28 | MainStay VP Wellington Growth Portfolio |
This page intentionally left blank
This page intentionally left blank.
MainStay VP Portfolios
MainStay VP offers a wide range of Portfolios. The full array of MainStay VP offerings is listed here, with information about the manager, subadvisors, legal counsel, and independent registered public accounting firm.
Equity
MainStay VP Candriam Emerging Markets Equity Portfolio
MainStay VP Epoch U.S. Equity Yield Portfolio
MainStay VP Fidelity Institutional AM® Utilities Portfolio†
MainStay VP MacKay International Equity Portfolio
MainStay VP MacKay S&P 500 Index Portfolio
MainStay VP Natural Resources Portfolio
MainStay VP Small Cap Growth Portfolio
MainStay VP T. Rowe Price Equity Income Portfolio
MainStay VP Wellington Growth Portfolio
MainStay VP Wellington Mid Cap Portfolio
MainStay VP Wellington Small Cap Portfolio
MainStay VP Wellington U.S. Equity Portfolio
MainStay VP Winslow Large Cap Growth Portfolio
Mixed Asset
MainStay Balanced Fund
MainStay Income Builder Fund
MainStay MacKay Convertible Fund
Income
MainStay VP Bond Portfolio
MainStay VP Floating Rate Portfolio
MainStay VP Indexed Bond Portfolio
MainStay VP MacKay Government Portfolio
MainStay VP MacKay High Yield Corporate Bond Portfolio
MainStay VP MacKay Strategic Bond Portfolio
MainStay VP PIMCO Real Return Portfolio
Money Market
MainStay VP U.S. Government Money Market Portfolio
Alternative
MainStay VP CBRE Global Infrastructure Portfolio
MainStay VP IQ Hedge Multi-Strategy Portfolio
Asset Allocation
MainStay VP Conservative Allocation Portfolio
MainStay VP Equity Allocation Portfolio
MainStay VP Growth Allocation Portfolio
MainStay VP Moderate Allocation Portfolio
Manager
New York Life Investment Management LLC
New York, New York
Subadvisors
Brown Advisory LLC
Baltimore, Maryland
Candriam Belgium S.
Brussels, Belgium
CBRE Clarion Securities LLC
Radnor, Pennsylvania
Epoch Investment Partners, Inc.
New York, New York
FIAM LLC
Smithfield, Rhode Island
IndexIQ Advisors LLC*
New York, New York
Janus Capital Management LLC
Denver, Colorado
MacKay Shields LLC*
New York, New York
Mellon Investments Corporation
Boston, Massachusetts
NYL Investors LLC*
New York, New York
Pacific Investment Management Company LLC
Newport Beach, California
Segall Bryant & Hamill, LLC
Chicago, Illinois
T. Rowe Price Associates, Inc.
Baltimore, Maryland
Wellington Management Company LLP
Boston, Massachusetts
Winslow Capital Management, LLC
Minneapolis, Minnesota
Legal Counsel
Dechert LLP
Washington, District of Columbia
Independent Registered Public Accounting Firm
KPMG LLP
Philadelphia, Pennsylvania
Distributor
NYLIFE Distributors LLC*
Jersey City, New Jersey
Custodian
JPMorgan Chase Bank, N.A.
New York, New York
Some Portfolios may not be available in all products.
† Fidelity Institutional AM is a registered trade mark of FMR LLC. Used with permission.
* An affiliate of New York Life Investment Management LLC
Not part of the Semiannual Report
2021 Semiannual Report
This report is for the general information of New York Life Variable Annuities and NYLIAC Variable Universal Life Insurance Products policyowners. It must be preceded or accompanied by the appropriate product(s) and funds prospectuses if it is given to anyone who is not an owner of a New York Life variable annuity policy or a NYLIAC Variable Universal Life Insurance Product. This report does not offer for sale or solicit orders to purchase securities.
The performance data quoted in this report represents past performance. Past performance is no guarantee of future results. Due to market volatility and other factors, current performance may be lower or higher than the figures shown. The most recent month-end performance summary for your variable annuity or variable life policy is available by calling 800-598-2019 and is updated periodically on newyorklife.com.
The New York Life Variable Annuities and NYLIAC Variable Universal Life Insurance Products are issued by New York Life Insurance and Annuity Corporation (a Delaware Corporation) and distributed by NYLIFE Distributors LLC (Member FINRA/SIPC).
New York Life Insurance Company
New York Life Insurance and Annuity
Corporation (NYLIAC) (A Delaware Corporation)
51 Madison Avenue, Room 551
New York, NY 10010
newyorklife.com
nylinvestments.com
NYLIFE Distributors LLC, 30 Hudson Street, Jersey City, NJ 07302
New York Life Investment Management LLC is the investment manager to the MainStay VP Funds Trust
©2021 by NYLIFE Distributors LLC. All rights reserved.
You may obtain copies of the Prospectus and the Statement of Additional Information free of charge, upon request, by calling toll-free 800-598-2019 or writing to New York Life Insurance and Annuity Corporation, 51 Madison Avenue, New York, NY 10010.
| Not FDIC Insured | No Bank Guarantee | May Lose Value |
(NYLIAC) NI513
MainStay VP Epoch U.S. Equity Yield Portfolio
Message from the President and Semiannual Report
Unaudited | June 30, 2021
Sign up for e-delivery of your shareholder reports. For full details on e-delivery, including who can participate and what you can receive via e-delivery,
please log in to newyorklifeinvestments.com/accounts.
| Not FDIC/NCUA Insured | Not a Deposit | May Lose Value | No Bank Guarantee | Not Insured by Any Government Agency |
This page intentionally left blank
Message from the President
The COVID-19 pandemic continued to afflict our personal lives and broad segments of the U.S. and global economy throughout the six-month reporting period ended June 30, 2021. However, with the deployment of multiple vaccines around the world, including three highly effective versions approved for emergency use in the United States, investors began to turn their attention toward the gradual reopening of the economy and the shape the “new normal” would take.
The first half of the reporting period saw increasing inflationary concerns as fiscal stimulus business reopenings drove accelerating economic growth, rising commodity prices and increased consumer spending. However, the U.S. Federal Reserve noted that price increases were likely to prove temporary and made clear their intention to remain accommodative for the foreseeable future. Accordingly, after moving higher in the first quarter of 2021, interest rates declined in the second quarter.
In response to the uncertain inflation outlook, equity market leadership shifted from value in the first quarter of the year to growth in the second quarter. Nevertheless, investor sentiment remained buoyant throughout the reporting period, with all eleven sectors in the S&P 500® Index, a widely regarded benchmark of market performance, producing positive returns. Energy led the market’s rise fueled by rapidly increasing oil and gas prices, followed by financials and real estate, which benefited from rising interest rates and the economic reopening, respectively. Communication services produced the slowest growth, followed by the traditionally defensive utilities and consumer staples
sectors. In the fixed income market, lower-credit-quality issues tended to outperform their higher-grade counterparts, with high-yield corporate bonds generating the strongest performance. Among securitized products, commercial mortgage-backed securities generally produced the strongest returns, followed by mortgage-backed securities and asset-backed securities, while Treasury securities lagged.
Despite the tremendous progress we’ve seen so far this year, the United States and the world continue to face significant pandemic-related challenges. Newer, more contagious variants of COVID-19 threaten the return of restrictions and lockdowns that could stall the economic recovery. At the same time, supply chain shortages have led to rising prices on everything from laptops to autos, stoking fears of uncontrolled inflation despite reassurance from the U.S. Federal Reserve. At New York Life Investments, we recognize that the shape that the “new normal” eventually takes may differ from our expectations. You can depend on us to keep a sharp watch for the unexpected, and to continue to help you find your way through this rapidly evolving investment landscape.
Sincerely,
Kirk C. Lehneis
President
The opinions expressed are as of the date of this report and are subject to change. There is no guarantee that any forecast made will come to pass. This material does not constitute investment advice and is not intended as an endorsement of any specific investment. Past performance is no guarantee of future results.
Not part of the Semiannual Report
Investors should refer to the Portfolio’s Summary Prospectus and/or Prospectus and consider the Portfolio’s investment objectives, strategies, risks, charges and expenses carefully before investing. The Summary Prospectus and/or Prospectus contain this and other information about the Portfolio. You may obtain copies of the Portfolio’s Summary Prospectus and/or the Prospectus and the Statement of Additional Information free of charge, upon request, by calling toll-free 800-598-2019, by writing to New York Life Insurance and Annuity Corporation, 51 Madison Avenue, Room 251, New York, New York 10010 or by sending an email to MainStayShareholdersServices@nylim.com. These documents are also available at nylinvestments.com/vpdocuments. Please read the Portfolio's Summary Prospectus and/or Prospectus carefully before investing. MainStay VP Funds Trust portfolios are separate account options which are purchased through a variable insurance or variable annuity contract.
Investment and Performance Comparison (Unaudited)
Performance data quoted represents past performance. Past performance is no guarantee of future results. Because of market volatility and other factors, current performance may be lower or higher than the figures shown. Investment return and principal value will fluctuate, and as a result, when shares are redeemed, they may be worth more or less than their original cost. The performance table and graph do not reflect any deduction of sales charges, mortality and expense charges, contract charges or administrative charges. Please refer to the Performance Summary appropriate for your policy. For performance information current to the most recent month-end, please call 800-598-2019 or visit www.newyorklife.com.
Performance figures may reflect certain fee waivers and/or expense limitations, without which total returns may have been different. For information on current fee waivers and/or expense limitations (if any), please refer to the Notes to Financial Statements.
| Average Annual Total Returns for the Period-Ended June 30, 2021 |
| Class | Inception
Date1 | Six
Months | One
Year | Five
Years | Ten
Years | Gross
Expense
Ratio2 |
| Initial Class Shares | 5/1/1998 | 13.53% | 32.88% | 10.95% | 9.45% | 0.73% |
| Service Class Shares | 6/5/2003 | 13.39 | 32.55 | 10.67 | 9.17 | 0.98 |
| 1. | Effective January 9, 2017, the Portfolio replaced its subadvisor and modified its principal investment as of March 13, 2017. The past performance in the bar chart and table prior to those dates reflects the Portfolio’s prior subadvisor and principal investment strategies. |
| 2. | The gross expense ratios presented reflect the Portfolio’s “Total Annual Portfolio Operating Expenses” from the most recent Prospectus, as supplemented, and may differ from other expense ratios disclosed in this report. |
| Benchmark Performance | Six
Months | One
Year | Five
Years | Ten
Years |
| Russell 1000® Value Index1 | 17.05% | 43.68% | 11.87% | 11.61% |
| U.S. Equity Yield Composite Index2 | 10.59 | 25.65 | 10.74 | 11.91 |
| Morningstar Large Value Category Average3 | 17.48 | 42.51 | 12.02 | 10.57 |
| 1. | The Portfolio has selected the Russell 1000® Value Index as its primary benchmark. The Russell 1000® Value Index measures the performance of the large-cap value segment of the U.S. equity universe. It includes those Russell 1000® Index companies with lower price-to-book ratios and lower expected growth values. Results assume reinvestment of all dividends and capital gains. An investment cannot be made directly in an index. |
| 2. | The Portfolio has selected the U.S. Equity Yield Composite Index as its secondary benchmark. The U.S. Equity Yield Composite Index consists of the MSCI USA High Dividend Yield Index and the MSCI USA Minimum Volatility (USD) Index weighted at 60% and 40%, respectively. The MSCI USA High Dividend Yield Index is based on the MSCI USA Index and includes large and mid-cap stocks. The MSCI USA High Dividend Yield Index is designed to reflect the performance of equities in the MSCI USA Index (excluding real estate investment trusts) with higher dividend income and quality characteristics than average dividend yields that are both sustainable and persistent. The MSCI USA Minimum Volatility (USD) Index aims to reflect the performance characteristics of a minimum variance strategy applied to the large and mid-cap USA equity universe. The MSCI USA Minimum Volatility (USD) Index is calculated by optimizing the MSCI USA Index in USD for the lowest absolute risk (within a given set of constraints). Results assume reinvestment of all dividends and capital gains. An investment cannot be made directly in an index. |
| 3. | The Morningstar Large Value Category Average is representative of funds that invest primarily in big U.S. companies that are less expensive or growing more slowly than other large-cap stocks. Results are based on average total returns of similar funds with all dividends and capital gain distributions reinvested. |
Cost in Dollars of a $1,000 Investment in MainStay VP Epoch U.S. Equity Yield Portfolio (Unaudited)
The example below is intended to describe the fees and expenses borne by shareholders during the six-month period from January 1, 2021 to June 30, 2021, and the impact of those costs on your investment.
Example
As a shareholder of the Portfolio you incur two types of costs: (1) transaction costs, including exchange fees and sales charges (loads) on purchases (as applicable), and (2) ongoing costs, including management fees, distribution and/or service (12b-1) fees, and other Portfolio expenses (as applicable). This example is intended to help you understand your ongoing costs (in dollars) of investing in the Portfolio and to compare these costs with the ongoing costs of investing in other mutual funds. The example is based on an investment of $1,000 made at the beginning of the six-month period and held for the entire period from January 1, 2021 to June 30, 2021. Shares are only sold in connection with variable life and annuity contracts and the example does not reflect any contract level or transactional fees or expenses. If these costs had been included, your costs would have been higher.
This example illustrates your Portfolio’s ongoing costs in two ways:
Actual Expenses
The second and third data columns in the table below provide information about actual account values and actual expenses. You may use the information in these columns, together with the amount you invested, to estimate the expenses that you paid during the six months ended June
30, 2021. Simply divide your account value by $1,000 (for example, an $8,600 account value divided by $1,000 = 8.6), then multiply the result by the number under the heading entitled “Expenses Paid During Period” to estimate the expenses you paid on your account during this period.
Hypothetical Example for Comparison Purposes
The fourth and fifth data columns in the table below provide information about hypothetical account values and hypothetical expenses based on the Portfolio’s actual expense ratio and an assumed rate of return of 5% per year before expenses, which is not the Portfolio’s actual return. The hypothetical account values and expenses may not be used to estimate the actual ending account balances or expenses you paid for the six-month period shown. You may use this information to compare the ongoing costs of investing in the Portfolio with the ongoing costs of investing in other mutual funds. To do so, compare this 5% hypothetical example with the 5% hypothetical examples that appear in the shareholder reports of the other mutual funds.
Please note that the expenses shown in the table are meant to highlight your ongoing costs only and do not reflect any transactional costs, such as exchange fees or sales charges (loads). Therefore, the fourth and fifth data columns of the table are useful in comparing ongoing costs only and will not help you determine the relative total costs of owning different funds. In addition, if these transactional costs were included, your costs would have been higher.
| Share Class | Beginning
Account
Value
1/1/21 | Ending Account
Value (Based
on Actual
Returns and
Expenses)
6/30/21 | Expenses
Paid
During
Period1 | Ending Account
Value (Based
on Hypothetical
5% Annualized
Return and
Actual Expenses)
6/30/21 | Expenses
Paid
During
Period1 | Net Expense
Ratio
During
Period2 |
| Initial Class Shares | $1,000.00 | $1,135.30 | $3.60 | $1,021.42 | $3.41 | 0.68% |
| Service Class Shares | $1,000.00 | $1,133.90 | $4.92 | $1,020.18 | $4.66 | 0.93% |
| 1. | Expenses are equal to the Portfolio’s annualized expense ratio of each class multiplied by the average account value over the period, divided by 365 and multiplied by 181 (to reflect the six-month period). The table above represents the actual expenses incurred during the six-month period. In addition to the fees and expenses which the Portfolio bears directly, it also indirectly bears a pro rata share of the fees and expenses of the underlying funds in which it invests. Such indirect expenses are not included in the above-reported expense figures. |
| 2. | Expenses are equal to the Portfolio's annualized expense ratio to reflect the six-month period. |
| 6 | MainStay VP Epoch U.S. Equity Yield Portfolio |
Industry Composition as of June 30, 2021 (Unaudited)
| Semiconductors & Semiconductor Equipment | 6.7% |
| Banks | 6.6 |
| Insurance | 6.0 |
| Pharmaceuticals | 5.5 |
| Chemicals | 5.4 |
| Electric Utilities | 5.2 |
| Capital Markets | 4.2 |
| Oil, Gas & Consumable Fuels | 4.0 |
| Equity Real Estate Investment Trusts | 3.5 |
| Multi–Utilities | 3.3 |
| Electrical Equipment | 3.3 |
| Household Products | 3.2 |
| Biotechnology | 3.1 |
| Aerospace & Defense | 2.9 |
| Beverages | 2.9 |
| Tobacco | 2.9 |
| Media | 2.2 |
| Diversified Telecommunication Services | 2.1 |
| Hotels, Restaurants & Leisure | 2.0 |
| Health Care Equipment & Supplies | 2.0 |
| Health Care Providers & Services | 2.0% |
| Software | 1.9 |
| Commercial Services & Supplies | 1.8 |
| IT Services | 1.8 |
| Trading Companies & Distributors | 1.5 |
| Food & Staples Retailing | 1.4 |
| Specialty Retail | 1.4 |
| Communications Equipment | 1.4 |
| Industrial Conglomerates | 1.4 |
| Multiline Retail | 1.3 |
| Air Freight & Logistics | 1.0 |
| Leisure Products | 1.0 |
| Technology Hardware, Storage & Peripherals | 1.0 |
| Containers & Packaging | 0.9 |
| Household Durables | 0.7 |
| Textiles, Apparel & Luxury Goods | 0.6 |
| Short–Term Investment | 2.0 |
| Other Assets, Less Liabilities | –0.1 |
| | 100.0% |
See Portfolio of Investments beginning on page 10 for specific holdings within these categories. The Portfolio's holdings are subject to change.
Top Ten Holdings as of June 30, 2021 (excluding short-term investments) (Unaudited)
| 1. | Medtronic plc |
| 2. | Microsoft Corp. |
| 3. | MetLife, Inc. |
| 4. | Emerson Electric Co. |
| 5. | Nutrien Ltd. |
| 6. | BlackRock, Inc. |
| 7. | JPMorgan Chase & Co. |
| 8. | Truist Financial Corp. |
| 9. | AbbVie, Inc. |
| 10. | Johnson & Johnson |
Portfolio Management Discussion and Analysis (Unaudited)
Answers to the questions reflect the views of portfolio managers Michael A. Welhoelter, CFA, William W. Priest, CFA, John M. Tobin, PhD, CFA, and Kera Van Valen, CFA, of Epoch Investment Partners, Inc. (“Epoch”), the Portfolio’s Subadvisor.
How did MainStay VP Epoch U.S. Equity Yield Portfolio perform relative to its benchmarks and peers during the six months ended June 30, 2021?
For the six months ended June 30, 2021, MainStay VP Epoch U.S. Equity Yield Portfolio returned 13.53% for Initial Class shares and 13.39% for Service Class shares. Over the same period, both share classes underperformed the 17.05% return of the Russell 1000® Value Index, which is the Portfolio’s primary benchmark, and outperformed the 10.59% return of the U.S. Equity Yield Composite Index, which is the Portfolio’s secondary benchmark. For the six months ended June 30, 2021, both share classes underperformed the 17.48% return of the Morningstar Large Value Category Average.1
What factors affected the Portfolio’s relative performance during the reporting period?
The Portfolio’s performance relative to the Russell 1000® Value Index was held back by stock selection in the financials and energy sectors. Overweight exposure to the lagging utilities sector also hindered relative performance.
During the reporting period, were there any market events that materially impacted the Portfolio’s performance or liquidity?
Stocks advanced as the vaccination rollout accelerated, businesses reopened, and a rapid economic recovery supported a rebound in earnings. The first quarter of 2021 was marked by a spike in bond yields, concerns about inflation, and market leadership by cyclical stocks—with value indexes outperforming growth indexes. The second quarter saw bond yields ease, with growth indexes outpacing value indexes, and a handful of large information technology, communication services and e-commerce stocks again showing strong performance.
Which sectors were the strongest positive contributors to the Portfolio’s relative performance, and which sectors were particularly weak?
During the reporting period, the strongest positive sector contributions to the Portfolio’s performance relative to the Russell 1000® Value Index came from information technology and real estate, resulting from strong stock selection in both sectors. (Contributions take weightings and total returns into account.) The next-strongest sector was communication services, primarily due to underweight exposure. Conversely, the weakest contributors to the Portfolio’s relative performance were financials and energy sectors, due to disappointing stock selection and overweight exposure. The next-weakest performing sector was consumer staples due to stock selection and overweight exposure.
During the reporting period, which individual stocks made the strongest positive contributions to the Portfolio’s absolute performance and which stocks detracted the most?
The strongest positive contributions to the Portfolio’s absolute performance came from positions in insurer MetLife, data and records management company Iron Mountain, and fertilizer provider Nutrien. MetLife shares traded higher on strong results. The company executed well and delivered along multiple fronts with top-line growth across business lines and geographies, limited pandemic impacts and good expense control. It also approved a $3 billion share buyback program and stated the intention to complete the program in 2021. Iron Mountain shares rose in response to a favorable earnings report that included modest upward revisions to full-year guidance for revenues, EBITDA (earnings before interest, taxes, depreciation and amortization) and funds from operations. Nutrien shares outperformed as fundamentals in the agriculture sector recovered and improved, with higher crop prices supporting farmer income and lifting prices for key crop nutrients like potash.
The most significant detractors from the Portfolio’s absolute returns were telecommunications conglomerate Verizon Communications, consumer goods company Procter & Gamble and regulated electric utility Eversource Energy. Verizon underperformed on the announcement by AT&T that it was spinning off its media business, potentially making market share capture more difficult for Verizon with AT&T as a more focused competitor. P&G shares traded lower as investors shifted focus to concerns over rising input costs, increased competitive intensity and more difficult competition ahead. Eversource underperformed as the company revised down its 2021 EPS (earnings per share) target to the lower end of the guidance range after taking a regulatory charge in Connecticut for the first quarter of 2021.
Did the Portfolio make any significant purchases or sales during the reporting period?
The Portfolio initiated positions in industrial gas company Linde and real estate investment trust W.P. Carey during the reporting period. Linde generates strong cash flow by distributing its products through various profitable methods, such as on-site, merchant and packaged gases. Cash flow growth comes from exposure to high-growth markets, such as health care and electronics, and from expansions in geographies with strong industrial growth. The company has a strong project backlog and, in our opinion, is well-positioned to offer clean energy solutions with its expertise in carbon dioxide and hydrogen. Linde has historically rewarded its shareholders with an attractive and growing dividend and regular share buybacks. W.P. Carey has experienced growth organically due to built-in rent escalations, and inorganically through the acquisition and development of new
| 1. | See page 5 for more information on benchmark and peer group returns. |
| 8 | MainStay VP Epoch U.S. Equity Yield Portfolio |
properties. The company has historically maintained a strong, investment-grade balance sheet and paid an attractive, growing dividend.
The Portfolio’s position in McCormick, a maker of flavorings and seasonings, was closed during the reporting period. We sold the Portfolio’s shares on concerns surrounding sustainability of the company’s cash flow growth as the economy reopens post-COVID-19.
How did the Portfolio’s sector weightings change during the reporting period?
The Portfolio's health care position went from being roughly in line with the Russell 1000® Value Index to meaningfully underweight as the Index rebalanced in June 2021, giving more weight to that sector. The Portfolio added to positions in industrials and materials, moving from an underweight to a neutral position in industrials and moving from a slightly overweight to a meaningfully overweight position in materials.
How was the Portfolio positioned at the end of the reporting period?
Relative to the Russell 1000® Value Index, the Portfolio held overweight positions in utilities, consumer staples, information technology and materials sectors as of June 30, 2021. As of the same date, it held underweight positions in health care, communication services and financials sectors. These positions were the result of individual stock selection rather than a top-down macroeconomic view.
The opinions expressed are those of the portfolio managers as of the date of this report and are subject to change. There is no guarantee that any forecasts will come to pass. This material does not constitute investment advice and is not intended as an endorsement of any specific investment.
Not all MainStay VP Portfolios and/or share classes are available under all policies.
Portfolio of Investments June 30, 2021† (Unaudited)
| | Shares | Value |
| Common Stocks 98.1% |
| Aerospace & Defense 2.9% |
| General Dynamics Corp. | 34,247 | $ 6,447,340 |
| Lockheed Martin Corp. | 31,283 | 11,835,923 |
| Raytheon Technologies Corp. | 125,461 | 10,703,078 |
| | | 28,986,341 |
| Air Freight & Logistics 1.0% |
| United Parcel Service, Inc., Class B | 48,736 | 10,135,626 |
| Banks 6.6% |
| Bank of America Corp. | 254,545 | 10,494,890 |
| JPMorgan Chase & Co. | 114,595 | 17,824,106 |
| PNC Financial Services Group, Inc. (The) | 50,053 | 9,548,110 |
| Truist Financial Corp. | 319,014 | 17,705,277 |
| U.S. Bancorp | 195,151 | 11,117,753 |
| | | 66,690,136 |
| Beverages 2.9% |
| Coca-Cola Co. (The) | 173,539 | 9,390,195 |
| Coca-Cola Europacific Partners plc | 138,304 | 8,204,193 |
| PepsiCo, Inc. | 76,726 | 11,368,492 |
| | | 28,962,880 |
| Biotechnology 3.1% |
| AbbVie, Inc. | 155,530 | 17,518,899 |
| Amgen, Inc. | 58,211 | 14,188,932 |
| | | 31,707,831 |
| Capital Markets 4.2% |
| BlackRock, Inc. | 20,463 | 17,904,511 |
| CME Group, Inc. | 37,540 | 7,984,007 |
| Lazard Ltd., Class A | 220,395 | 9,972,874 |
| T. Rowe Price Group, Inc. | 32,600 | 6,453,822 |
| | | 42,315,214 |
| Chemicals 5.4% |
| Dow, Inc. | 193,773 | 12,261,955 |
| Linde plc | 25,359 | 7,331,287 |
| LyondellBasell Industries NV, Class A | 92,861 | 9,552,611 |
| Nutrien Ltd. | 307,891 | 18,661,274 |
| PPG Industries, Inc. | 42,528 | 7,219,979 |
| | | 55,027,106 |
| Commercial Services & Supplies 1.8% |
| Republic Services, Inc. | 91,544 | 10,070,756 |
| Waste Management, Inc. | 61,465 | 8,611,861 |
| | | 18,682,617 |
| | Shares | Value |
| |
| Communications Equipment 1.4% |
| Cisco Systems, Inc. | 259,485 | $ 13,752,705 |
| Containers & Packaging 0.9% |
| Amcor plc | 806,114 | 9,238,066 |
| Diversified Telecommunication Services 2.1% |
| AT&T, Inc. | 293,229 | 8,439,131 |
| Verizon Communications, Inc. | 224,804 | 12,595,768 |
| | | 21,034,899 |
| Electric Utilities 5.2% |
| Alliant Energy Corp. | 103,728 | 5,783,873 |
| American Electric Power Co., Inc. | 96,483 | 8,161,497 |
| Duke Energy Corp. | 60,148 | 5,937,810 |
| Entergy Corp. | 122,498 | 12,213,051 |
| Evergy, Inc. | 134,023 | 8,099,010 |
| Eversource Energy | 83,312 | 6,684,955 |
| NextEra Energy, Inc. | 75,878 | 5,560,340 |
| | | 52,440,536 |
| Electrical Equipment 3.3% |
| Eaton Corp. plc | 101,374 | 15,021,599 |
| Emerson Electric Co. | 195,528 | 18,817,615 |
| | | 33,839,214 |
| Equity Real Estate Investment Trusts 3.5% |
| American Tower Corp. | 28,680 | 7,747,615 |
| Iron Mountain, Inc. | 351,493 | 14,875,184 |
| Welltower, Inc. | 72,790 | 6,048,849 |
| WP Carey, Inc. | 89,568 | 6,683,564 |
| | | 35,355,212 |
| Food & Staples Retailing 1.4% |
| Walmart, Inc. | 100,106 | 14,116,948 |
| Health Care Equipment & Supplies 2.0% |
| Medtronic plc | 162,671 | 20,192,351 |
| Health Care Providers & Services 2.0% |
| CVS Health Corp. | 117,558 | 9,809,039 |
| UnitedHealth Group, Inc. | 25,356 | 10,153,557 |
| | | 19,962,596 |
| Hotels, Restaurants & Leisure 2.0% |
| Las Vegas Sands Corp. (a) | 97,960 | 5,161,512 |
| McDonald's Corp. | 43,624 | 10,076,708 |
| Vail Resorts, Inc. | 16,465 | 5,211,502 |
| | | 20,449,722 |
The notes to the financial statements are an integral part of, and should be read in conjunction with, the financial statements.
| 10 | MainStay VP Epoch U.S. Equity Yield Portfolio |
| | Shares | Value |
| Common Stocks (continued) |
| Household Durables 0.7% |
| Leggett & Platt, Inc. | 146,790 | $ 7,605,190 |
| Household Products 3.2% |
| Colgate-Palmolive Co. | 67,737 | 5,510,405 |
| Kimberly-Clark Corp. | 95,825 | 12,819,468 |
| Procter & Gamble Co. (The) | 104,387 | 14,084,938 |
| | | 32,414,811 |
| Industrial Conglomerates 1.4% |
| Honeywell International, Inc. | 62,566 | 13,723,852 |
| Insurance 6.0% |
| Allianz SE, ADR | 391,371 | 9,780,361 |
| Arthur J. Gallagher & Co. | 109,635 | 15,357,671 |
| Marsh & McLennan Cos., Inc. | 54,004 | 7,597,282 |
| MetLife, Inc. | 321,721 | 19,255,002 |
| Travelers Cos., Inc. (The) | 57,956 | 8,676,593 |
| | | 60,666,909 |
| IT Services 1.8% |
| Automatic Data Processing, Inc. | 27,990 | 5,559,374 |
| International Business Machines Corp. | 49,394 | 7,240,666 |
| Paychex, Inc. | 53,346 | 5,724,026 |
| | | 18,524,066 |
| Leisure Products 1.0% |
| Hasbro, Inc. | 106,886 | 10,102,865 |
| Media 2.2% |
| Comcast Corp., Class A | 278,584 | 15,884,860 |
| Omnicom Group, Inc. | 77,055 | 6,163,629 |
| | | 22,048,489 |
| Multiline Retail 1.3% |
| Target Corp. | 56,309 | 13,612,138 |
| Multi-Utilities 3.3% |
| Ameren Corp. | 126,779 | 10,147,391 |
| CMS Energy Corp. | 84,629 | 4,999,881 |
| Dominion Energy, Inc. | 84,077 | 6,185,545 |
| NiSource, Inc. | 217,335 | 5,324,708 |
| WEC Energy Group, Inc. | 80,881 | 7,194,365 |
| | | 33,851,890 |
| Oil, Gas & Consumable Fuels 4.0% |
| Chevron Corp. | 124,803 | 13,071,866 |
| Enterprise Products Partners LP | 469,246 | 11,322,906 |
| | Shares | Value |
| |
| Oil, Gas & Consumable Fuels (continued) |
| Magellan Midstream Partners LP | 171,563 | $ 8,391,146 |
| Phillips 66 | 93,520 | 8,025,887 |
| | | 40,811,805 |
| Pharmaceuticals 5.5% |
| Eli Lilly and Co. | 40,833 | 9,371,990 |
| Johnson & Johnson | 103,716 | 17,086,174 |
| Merck & Co., Inc. | 212,154 | 16,499,217 |
| Pfizer, Inc. | 325,344 | 12,740,471 |
| | | 55,697,852 |
| Semiconductors & Semiconductor Equipment 6.7% |
| Analog Devices, Inc. | 95,166 | 16,383,779 |
| Broadcom, Inc. | 35,123 | 16,748,051 |
| Intel Corp. | 182,100 | 10,223,094 |
| KLA Corp. | 39,600 | 12,838,716 |
| Texas Instruments, Inc. | 58,655 | 11,279,356 |
| | | 67,472,996 |
| Software 1.9% |
| Microsoft Corp. | 71,740 | 19,434,366 |
| Specialty Retail 1.4% |
| Home Depot, Inc. (The) | 43,796 | 13,966,107 |
| Technology Hardware, Storage & Peripherals 1.0% |
| Apple, Inc. | 72,774 | 9,967,127 |
| Textiles, Apparel & Luxury Goods 0.6% |
| Hanesbrands, Inc. | 322,051 | 6,012,692 |
| Tobacco 2.9% |
| Altria Group, Inc. | 203,047 | 9,681,281 |
| British American Tobacco plc, Sponsored ADR | 182,052 | 7,156,464 |
| Philip Morris International, Inc. | 121,869 | 12,078,437 |
| | | 28,916,182 |
| Trading Companies & Distributors 1.5% |
| MSC Industrial Direct Co., Inc., Class A | 80,348 | 7,209,626 |
| Watsco, Inc. | 27,661 | 7,928,749 |
| | | 15,138,375 |
Total Common Stocks
(Cost $761,129,876) | | 992,857,712 |
The notes to the financial statements are an integral part of, and should be read in conjunction with, the financial statements.
11
Portfolio of Investments June 30, 2021† (Unaudited) (continued)
| | Shares | | Value |
| Short-Term Investment 2.0% |
| Affiliated Investment Company 2.0% |
| MainStay U.S. Government Liquidity Fund, 0.01% (b) | 20,405,166 | | $ 20,405,166 |
Total Short-Term Investment
(Cost $20,405,166) | | | 20,405,166 |
Total Investments
(Cost $781,535,042) | 100.1% | | 1,013,262,878 |
| Other Assets, Less Liabilities | (0.1) | | (965,784) |
| Net Assets | 100.0% | | $ 1,012,297,094 |
| † | Percentages indicated are based on Portfolio net assets. |
| (a) | Non-income producing security. |
| (b) | Current yield as of June 30, 2021. |
| Abbreviation(s): |
| ADR—American Depositary Receipt |
The following is a summary of the fair valuations according to the inputs used as of June 30, 2021, for valuing the Portfolio’s assets:
| Description | Quoted
Prices in
Active
Markets for
Identical
Assets
(Level 1) | | Significant
Other
Observable
Inputs
(Level 2) | | Significant
Unobservable
Inputs
(Level 3) | | Total |
| Asset Valuation Inputs | | | | | | | |
| Investments in Securities (a) | | | | | | | |
| Common Stocks | $ 992,857,712 | | $ — | | $ — | | $ 992,857,712 |
| Short-Term Investment | | | | | | | |
| Affiliated Investment Company | 20,405,166 | | — | | — | | 20,405,166 |
| Total Investments in Securities | $ 1,013,262,878 | | $ — | | $ — | | $ 1,013,262,878 |
| (a) | For a complete listing of investments and their industries, see the Portfolio of Investments. |
The notes to the financial statements are an integral part of, and should be read in conjunction with, the financial statements.
| 12 | MainStay VP Epoch U.S. Equity Yield Portfolio |
Statement of Assets and Liabilities as of June 30, 2021 (Unaudited)
| Assets |
Investment in unaffiliated securities, at value
(identified cost $761,129,876) | $ 992,857,712 |
Investment in affiliated investment companies, at value
(identified cost $20,405,166) | 20,405,166 |
| Receivables: | |
| Investment securities sold | 4,133,502 |
| Dividends and interest | 1,870,725 |
| Portfolio shares sold | 850,000 |
| Other assets | 10,062 |
| Total assets | 1,020,127,167 |
| Liabilities |
| Payables: | |
| Investment securities purchased | 6,589,602 |
| Manager (See Note 3) | 544,111 |
| Portfolio shares redeemed | 452,385 |
| NYLIFE Distributors (See Note 3) | 92,789 |
| Shareholder communication | 83,622 |
| Professional fees | 52,786 |
| Custodian | 14,778 |
| Total liabilities | 7,830,073 |
| Net assets | $1,012,297,094 |
| Composition of Net Assets |
| Shares of beneficial interest outstanding (par value of $.001 per share) unlimited number of shares authorized | $ 59,377 |
| Additional paid-in-capital | 755,431,715 |
| | 755,491,092 |
| Total distributable earnings (loss) | 256,806,002 |
| Net assets | $1,012,297,094 |
| Initial Class | |
| Net assets applicable to outstanding shares | $565,492,452 |
| Shares of beneficial interest outstanding | 32,928,558 |
| Net asset value per share outstanding | $ 17.17 |
| Service Class | |
| Net assets applicable to outstanding shares | $446,804,642 |
| Shares of beneficial interest outstanding | 26,448,672 |
| Net asset value per share outstanding | $ 16.89 |
The notes to the financial statements are an integral part of, and should be read in conjunction with, the financial statements.
13
Statement of Operations for the six months ended June 30, 2021 (Unaudited)
| Investment Income (Loss) |
| Income | |
| Dividends-unaffiliated (net of foreign tax withholding of $91,825) | $ 14,385,334 |
| Dividends-affiliated | 877 |
| Securities lending | 133 |
| Total income | 14,386,344 |
| Expenses | |
| Manager (See Note 3) | 3,311,736 |
| Distribution/Service—Service Class (See Note 3) | 545,460 |
| Professional fees | 61,283 |
| Shareholder communication | 45,226 |
| Custodian | 12,408 |
| Trustees | 9,627 |
| Miscellaneous | 13,785 |
| Total expenses before waiver/reimbursement | 3,999,525 |
| Expense waiver/reimbursement from Manager (See Note 3) | (191,411) |
| Net expenses | 3,808,114 |
| Net investment income (loss) | 10,578,230 |
| Realized and Unrealized Gain (Loss) |
| Net realized gain (loss) on unaffiliated investments | 28,871,836 |
| Net change in unrealized appreciation (depreciation) on unaffiliated investments | 81,426,459 |
| Net realized and unrealized gain (loss) | 110,298,295 |
| Net increase (decrease) in net assets resulting from operations | $120,876,525 |
The notes to the financial statements are an integral part of, and should be read in conjunction with, the financial statements.
| 14 | MainStay VP Epoch U.S. Equity Yield Portfolio |
Statements of Changes in Net Assets
for the six months ended June 30, 2021 (Unaudited) and the year ended December 31, 2020
| | 2021 | 2020 |
| Increase (Decrease) in Net Assets |
| Operations: | | |
| Net investment income (loss) | $ 10,578,230 | $ 21,227,734 |
| Net realized gain (loss) | 28,871,836 | (32,499,703) |
| Net change in unrealized appreciation (depreciation) | 81,426,459 | (972,217) |
| Net increase (decrease) in net assets resulting from operations | 120,876,525 | (12,244,186) |
| Distributions to shareholders: | | |
| Initial Class | — | (30,366,836) |
| Service Class | — | (24,324,032) |
| Total distributions to shareholders | — | (54,690,868) |
| Capital share transactions: | | |
| Net proceeds from sales of shares | 56,556,146 | 68,376,620 |
| Net asset value of shares issued to shareholder in reinvestment of distributions | — | 54,690,868 |
| Cost of shares redeemed | (82,381,189) | (190,864,938) |
| Increase (decrease) in net assets derived from capital share transactions | (25,825,043) | (67,797,450) |
| Net increase (decrease) in net assets | 95,051,482 | (134,732,504) |
| Net Assets |
| Beginning of period | 917,245,612 | 1,051,978,116 |
| End of period | $1,012,297,094 | $ 917,245,612 |
The notes to the financial statements are an integral part of, and should be read in conjunction with, the financial statements.
15
Financial Highlights selected per share data and ratios
| | Six months ended
June 30,
2021* | | Year Ended December 31, |
| Initial Class | 2020 | | 2019 | | 2018 | | 2017 | | 2016 |
| Net asset value at beginning of period | $ 15.13 | | $ 16.12 | | $ 14.01 | | $ 16.15 | | $ 13.79 | | $ 15.58 |
| Net investment income (loss) (a) | 0.19 | | 0.35 | | 0.38 | | 0.39 | | 0.30 | | 0.21 |
| Net realized and unrealized gain (loss) on investments | 1.85 | | (0.41) | | 2.92 | | (1.12) | | 2.26 | | 0.47 |
| Net realized and unrealized gain (loss) on foreign currency transactions | — | | — | | 0.00‡ | | — | | — | | — |
| Total from investment operations | 2.04 | | (0.06) | | 3.30 | | (0.73) | | 2.56 | | 0.68 |
| Less distributions: | | | | | | | | | | | |
| From net investment income | — | | (0.41) | | (0.52) | | (0.35) | | (0.20) | | (0.18) |
| From net realized gain on investments | — | | (0.52) | | (0.67) | | (1.06) | | — | | (2.29) |
| Total distributions | — | | (0.93) | | (1.19) | | (1.41) | | (0.20) | | (2.47) |
| Net asset value at end of period | $ 17.17 | | $ 15.13 | | $ 16.12 | | $ 14.01 | | $ 16.15 | | $ 13.79 |
| Total investment return (b) | 13.48%(c) | | 0.03% | | 24.18% | | (5.23)% | | 18.66% | | 4.90% |
| Ratios (to average net assets)/Supplemental Data: | | | | | | | | | | | |
| Net investment income (loss) | 2.32%†† | | 2.47% | | 2.43% | | 2.49% | | 2.01% | | 1.41% |
| Net expenses (d) | 0.68%†† | | 0.68% | | 0.68% | | 0.68% | | 0.73% | | 0.79% |
| Expenses (before waiver/reimbursement) (d) | 0.72%†† | | 0.73% | | 0.72% | | 0.71% | | 0.74% | | 0.79% |
| Portfolio turnover rate | 10% | | 26% | | 22% | | 25% | | 122% | | 99% |
| Net assets at end of period (in 000’s) | $ 565,492 | | $ 495,193 | | $ 591,185 | | $ 548,881 | | $ 791,462 | | $ 637,936 |
| * | Unaudited. |
| ‡ | Less than one cent per share. |
| †† | Annualized. |
| (a) | Per share data based on average shares outstanding during the period. |
| (b) | Total return does not reflect any deduction of sales charges, mortality and expense charges, contract charges or administrative charges. For periods of less than one year, total return is not annualized. |
| (c) | Total investment return may reflect adjustments to conform to generally accepted accounting principles. |
| (d) | In addition to the fees and expenses which the Portfolio bears directly, it also indirectly bears a pro-rata share of the fees and expenses of the underlying funds in which it invests. Such indirect expenses are not included in the above expense ratios. |
The notes to the financial statements are an integral part of, and should be read in conjunction with, the financial statements.
| 16 | MainStay VP Epoch U.S. Equity Yield Portfolio |
Financial Highlights selected per share data and ratios
| | Six months ended
June 30,
2021* | | Year Ended December 31, |
| Service Class | 2020 | | 2019 | | 2018 | | 2017 | | 2016 |
| Net asset value at beginning of period | $ 14.90 | | $ 15.89 | | $ 13.81 | | $ 15.94 | | $ 13.61 | | $ 15.40 |
| Net investment income (loss) (a) | 0.16 | | 0.31 | | 0.34 | | 0.35 | | 0.26 | | 0.17 |
| Net realized and unrealized gain (loss) on investments | 1.83 | | (0.42) | | 2.88 | | (1.12) | | 2.24 | | 0.46 |
| Net realized and unrealized gain (loss) on foreign currency transactions | — | | — | | 0.00‡ | | — | | — | | — |
| Total from investment operations | 1.99 | | (0.11) | | 3.22 | | (0.77) | | 2.50 | | 0.63 |
| Less distributions: | | | | | | | | | | | |
| From net investment income | — | | (0.36) | | (0.47) | | (0.30) | | (0.17) | | (0.13) |
| From net realized gain on investments | — | | (0.52) | | (0.67) | | (1.06) | | — | | (2.29) |
| Total distributions | — | | (0.88) | | (1.14) | | (1.36) | | (0.17) | | (2.42) |
| Net asset value at end of period | $ 16.89 | | $ 14.90 | | $ 15.89 | | $ 13.81 | | $ 15.94 | | $ 13.61 |
| Total investment return (b) | 13.36%(c) | | (0.22)% | | 23.87% | | (5.46)% | | 18.37% | | 4.63% |
| Ratios (to average net assets)/Supplemental Data: | | | | | | | | | | | |
| Net investment income (loss) | 2.07%†† | | 2.21% | | 2.18% | | 2.23% | | 1.73% | | 1.16% |
| Net expenses (d) | 0.93%†† | | 0.93% | | 0.93% | | 0.93% | | 0.98% | | 1.04% |
| Expenses (before waiver/reimbursement) (d) | 0.97%†† | | 0.98% | | 0.97% | | 0.96% | | 0.99% | | 1.04% |
| Portfolio turnover rate | 10% | | 26% | | 22% | | 25% | | 122% | | 99% |
| Net assets at end of period (in 000’s) | $ 446,805 | | $ 422,053 | | $ 460,793 | | $ 431,635 | | $ 536,044 | | $ 526,452 |
| * | Unaudited. |
| ‡ | Less than one cent per share. |
| †† | Annualized. |
| (a) | Per share data based on average shares outstanding during the period. |
| (b) | Total return does not reflect any deduction of sales charges, mortality and expense charges, contract charges or administrative charges. For periods of less than one year, total return is not annualized. |
| (c) | Total investment return may reflect adjustments to conform to generally accepted accounting principles. |
| (d) | In addition to the fees and expenses which the Portfolio bears directly, it also indirectly bears a pro-rata share of the fees and expenses of the underlying funds in which it invests. Such indirect expenses are not included in the above expense ratios. |
The notes to the financial statements are an integral part of, and should be read in conjunction with, the financial statements.
17
Notes to Financial Statements (Unaudited)
Note 1–Organization and Business
MainStay VP Funds Trust (the “Fund”) was organized as a Delaware statutory trust on February 1, 2011. The Fund is registered under the Investment Company Act of 1940, as amended (the “1940 Act”), as an open-end management investment company. The Fund is comprised of thirty-one separate series (collectively referred to as the “Portfolios”). These financial statements and notes relate to the MainStay VP Epoch U.S. Equity Yield Portfolio (the "Portfolio"), a "diversified” portfolio, as that term is defined in the 1940 Act, as interpreted or modified by regulatory authorities having jurisdiction, from time to time.
Shares of the Portfolio are currently offered to certain separate accounts to fund variable annuity policies and variable universal life insurance policies issued by New York Life Insurance and Annuity Corporation (“NYLIAC”), a wholly-owned subsidiary of New York Life Insurance Company (“New York Life”) and may also be offered to fund variable annuity policies and variable universal life insurance policies issued by other insurance companies. NYLIAC allocates shares of the Portfolios to, among others, certain NYLIAC separate accounts. Shares of the Portfolio are also offered to the MainStay VP Conservative Allocation Portfolio, MainStay VP Moderate Allocation Portfolio, MainStay VP Growth Allocation Portfolio (formerly known as MainStay VP Moderate Growth Allocation Portfolio) and MainStay VP Equity Allocation Portfolio (formerly known as MainStay VP Growth Allocation Portfolio), which operate as “funds-of-funds," and other variable insurance funds.
The following table lists the Portfolio's share classes that have been registered and commenced operations:
| Class | Commenced Operations |
| Initial Class | May 1, 1998 |
| Service Class | June 5, 2003 |
Shares of the Portfolio are offered and are redeemed at a price equal to their respective net asset value (“NAV”) per share. No sales or redemption charge is applicable to the purchase or redemption of the Portfolio's shares. Under the terms of the Fund’s multiple class plan, adopted pursuant to Rule 18f-3 under the 1940 Act, the classes differ in that, among other things, Service Class shares of the Portfolio pay a combined distribution and service fee of 0.25% of average daily net assets attributable to Service Class shares of the Portfolio to the Distributor (as defined in Note 3(B)) pursuant to a plan adopted in accordance with Rule 12b-1 under the 1940 Act. Contract owners of variable annuity contracts purchased after June 2, 2003, are permitted to invest only in the Service Class shares.
The Portfolio's investment objective is to seek current income and capital appreciation.
Note 2–Significant Accounting Policies
The Portfolio is an investment company and accordingly follows the investment company accounting and reporting guidance of the Financial Accounting Standards Board (“FASB”) Accounting Standard Codification
Topic 946 Financial Services—Investment Companies. The Portfolio prepares its financial statements in accordance with generally accepted accounting principles (“GAAP”) in the United States of America and follows the significant accounting policies described below.
(A) Securities Valuation. Investments are usually valued as of the close of regular trading on the New York Stock Exchange (the "Exchange") (usually 4:00 p.m. Eastern time) on each day the Portfolio is open for business ("valuation date").
The Board of Trustees of the Fund (the "Board") adopted procedures establishing methodologies for the valuation of the Portfolio's securities and other assets and delegated the responsibility for valuation determinations under those procedures to the Valuation Committee of the Fund (the “Valuation Committee”). The procedures state that, subject to the oversight of the Board and unless otherwise noted, the responsibility for the day-to-day valuation of portfolio assets (including fair value measurements for the Portfolio's assets and liabilities) rests with New York Life Investment Management LLC (“New York Life Investments” or the "Manager"), aided to whatever extent necessary by the Subadvisor (as defined in Note 3(A)). To assess the appropriateness of security valuations, the Manager, the Subadvisor or the Portfolio's third-party service provider, who is subject to oversight by the Manager, regularly compares prior day prices, prices on comparable securities and the sale prices to the prior and current day prices and challenges prices with changes exceeding certain tolerance levels with third-party pricing services or broker sources.
The Board authorized the Valuation Committee to appoint a Valuation Subcommittee (the “Subcommittee”) to establish the prices of securities for which market quotations are not readily available or the prices of which are not otherwise readily determinable under the procedures. The Subcommittee meets (in person, via electronic mail or via teleconference) on an as-needed basis. The Valuation Committee meets to ensure that actions taken by the Subcommittee were appropriate.
For those securities valued through either a standardized fair valuation methodology or a fair valuation measurement, the Subcommittee deals with such valuation and the Valuation Committee reviews and affirms, if appropriate, the reasonableness of the valuation based on such methodologies and measurements on a regular basis after considering information that is reasonably available and deemed relevant by the Valuation Committee. Any action taken by the Subcommittee with respect to the valuation of a portfolio security or other asset is submitted for review and ratification (if appropriate) to the Valuation Committee and the Board at the next regularly scheduled meeting.
"Fair value" is defined as the price the Portfolio would reasonably expect to receive upon selling an asset or liability in an orderly transaction to an independent buyer in the principal or most advantageous market for the asset or liability. Fair value measurements are determined within a framework that establishes a three-tier hierarchy that maximizes the use of observable market data and minimizes the use of unobservable inputs to establish a classification of fair value measurements for disclosure
| 18 | MainStay VP Epoch U.S. Equity Yield Portfolio |
purposes. "Inputs" refer broadly to the assumptions that market participants would use in pricing the asset or liability, including assumptions about risk, such as the risk inherent in a particular valuation technique used to measure fair value using a pricing model and/or the risk inherent in the inputs for the valuation technique. Inputs may be observable or unobservable. Observable inputs reflect the assumptions market participants would use in pricing the asset or liability based on market data obtained from sources independent of the Portfolio. Unobservable inputs reflect the Portfolio’s own assumptions about the assumptions market participants would use in pricing the asset or liability based on the information available. The inputs or methodology used for valuing assets or liabilities may not be an indication of the risks associated with investing in those assets or liabilities. The three-tier hierarchy of inputs is summarized below.
| • | Level 1—quoted prices in active markets for an identical asset or liability |
| • | Level 2—other significant observable inputs (including quoted prices for a similar asset or liability in active markets, interest rates and yield curves, prepayment speeds, credit risk, etc.) |
| • | Level 3—significant unobservable inputs (including the Portfolio's own assumptions about the assumptions that market participants would use in measuring fair value of an asset or liability) |
The level of an asset or liability within the fair value hierarchy is based on the lowest level of an input, both individually and in the aggregate, that is significant to the fair value measurement. The aggregate value by input level of the Portfolio’s assets and liabilities as of June 30, 2021, is included at the end of the Portfolio of Investments.
The Portfolio may use third-party vendor evaluations, whose prices may be derived from one or more of the following standard inputs, among others:
| • Broker/dealer quotes | • Benchmark securities |
| • Two-sided markets | • Reference data (corporate actions or material event notices) |
| • Bids/offers | • Monthly payment information |
| • Industry and economic events | • Reported trades |
An asset or liability for which market values cannot be measured using the methodologies described above is valued by methods deemed reasonable in good faith by the Valuation Committee, following the procedures established by the Board, to represent fair value. Under these procedures, the Portfolio generally uses a market-based approach which may use related or comparable assets or liabilities, recent transactions, market multiples, book values and other relevant information. The Portfolio may also use an income-based valuation approach in which the anticipated future cash flows of the asset or liability are discounted to calculate fair value. Discounts may also be applied due to the nature and/or duration of any restrictions on the disposition of the asset or liability. Fair value represents a good faith approximation of the value of a security. Fair value determinations involve the consideration of a number
of subjective factors, an analysis of applicable facts and circumstances and the exercise of judgment. As a result, it is possible that the fair value for a security determined in good faith in accordance with the Portfolio's valuation procedures may differ from valuations for the same security determined by other funds using their own valuation procedures. Although the Portfolio's valuation procedures are designed to value a security at the price the Portfolio may reasonably expect to receive upon the security's sale in an orderly transaction, there can be no assurance that any fair value determination thereunder would, in fact, approximate the amount that the Portfolio would actually realize upon the sale of the security or the price at which the security would trade if a reliable market price were readily available. During the six-month period ended June 30, 2021, there were no material changes to the fair value methodologies.
Securities which may be valued in this manner include, but are not limited to: (i) a security for which trading has been halted or suspended; (ii) a debt security that has recently gone into default and for which there is not a current market quotation; (iii) a security of an issuer that has entered into a restructuring; (iv) a security that has been delisted from a national exchange; (v) a security for which the market price is not readily available from a third-party pricing source or, if so provided, does not, in the opinion of the Manager or the Subadvisor, reflect the security's market value; (vi) a security subject to trading collars for which no or limited trading takes place; and (vii) a security whose principal market has been temporarily closed at a time when, under normal conditions, it would be open. Securities valued in this manner are generally categorized as Level 3 in the hierarchy. No securities held by the Portfolio as of June 30, 2021 were fair valued in such a manner.
Certain securities held by the Portfolio may principally trade in foreign markets. Events may occur between the time the foreign markets close and the time at which the Portfolio's NAVs are calculated. These events may include, but are not limited to, situations relating to a single issuer in a market sector, significant fluctuations in U.S. or foreign markets, natural disasters, armed conflicts, governmental actions or other developments not tied directly to the securities markets. Should the Manager or the Subadvisor conclude that such events may have affected the accuracy of the last price of such securities reported on the local foreign market, the Subcommittee may, pursuant to procedures adopted by the Board, adjust the value of the local price to reflect the estimated impact on the price of such securities as a result of such events. In this instance, securities are generally categorized as Level 3 in the hierarchy. Additionally, certain foreign equity securities are also fair valued whenever the movement of a particular index exceeds certain thresholds. In such cases, the securities are fair valued by applying factors provided by a third-party vendor in accordance with valuation procedures adopted by the Board and are generally categorized as Level 2 in the hierarchy. No foreign equity securities held by the Portfolio as of June 30, 2021 were fair valued in such a manner.
Equity securities are valued at the last quoted sales prices as of the close of regular trading on the relevant exchange on each valuation date. Securities that are not traded on the valuation date are valued at the mean of the last quoted bid and ask prices. Prices are normally taken
Notes to Financial Statements (Unaudited) (continued)
from the principal market in which each security trades. These securities are generally categorized as Level 1 in the hierarchy.
Investments in mutual funds, including money market funds, are valued at their respective NAVs at the close of business each day on the valuation date. These securities are generally categorized as Level 1 in the hierarchy.
Temporary cash investments acquired in excess of 60 days to maturity at the time of purchase are valued using the latest bid prices or using valuations based on a matrix system (which considers such factors as security prices, yields, maturities and ratings), both as furnished by independent pricing services. Temporary cash investments that mature in 60 days or less at the time of purchase ("Short-Term Investments") are valued using the amortized cost method of valuation, unless the use of such method would be inappropriate. The amortized cost method involves valuing a security at its cost on the date of purchase and thereafter assuming a constant amortization to maturity of the difference between such cost and the value on maturity date. Amortized cost approximates the current fair value of a security. Securities valued using the amortized cost method are not valued using quoted prices in an active market and are generally categorized as Level 2 in the hierarchy.
The information above is not intended to reflect an exhaustive list of the methodologies that may be used to value portfolio investments. The valuation procedures permit the use of a variety of valuation methodologies in connection with valuing portfolio investments. The methodology used for a specific type of investment may vary based on the market data available or other considerations. The methodologies summarized above may not represent the specific means by which portfolio investments are valued on any particular business day.
(B) Income Taxes. The Portfolio's policy is to comply with the requirements of the Internal Revenue Code of 1986, as amended (the “Internal Revenue Code”), applicable to regulated investment companies and to distribute all of its taxable income to the shareholders of the Portfolio within the allowable time limits.
The Manager evaluates the Portfolio’s tax positions to determine if the tax positions taken meet the minimum recognition threshold in connection with accounting for uncertainties in income tax positions taken or expected to be taken for the purposes of measuring and recognizing tax liabilities in the financial statements. Recognition of tax benefits of an uncertain tax position is permitted only to the extent the position is “more likely than not” to be sustained assuming examination by taxing authorities. The Manager analyzed the Portfolio's tax positions taken on federal, state and local income tax returns for all open tax years (for up to three tax years) and has concluded that no provisions for federal, state and local income tax are required in the Portfolio's financial statements. The Portfolio's federal, state and local income tax and federal excise tax returns for tax years for which the applicable statutes of limitations have not expired are subject to examination by the Internal Revenue Service and state and local departments of revenue.
(C) Foreign Taxes. The Portfolio may be subject to foreign taxes on income and other transaction-based taxes imposed by certain countries in which it invests. A portion of the taxes on gains on investments or currency purchases/repatriation may be reclaimable. The Portfolio will accrue such taxes and reclaims as applicable, based upon its current interpretation of tax rules and regulations that exist in the markets in which it invests.
The Portfolio may be subject to taxation on realized capital gains, repatriation proceeds and other transaction-based taxes imposed by certain countries in which it invests. The Portfolio will accrue such taxes as applicable based upon its current interpretation of tax rules and regulations that exist in the market in which it invests. Capital gains taxes relating to positions still held are reflected as a liability in the Statement of Assets and Liabilities, as well as an adjustment to the Portfolio's net unrealized appreciation (depreciation). Taxes related to capital gains realized, if any, are reflected as part of net realized gain (loss) in the Statement of Operations. Changes in tax liabilities related to capital gains taxes on unrealized investment gains, if any, are reflected as part of the change in net unrealized appreciation (depreciation) on investments in the Statement of Operations. Transaction-based charges are generally assessed as a percentage of the transaction amount.
(D) Dividends and Distributions to Shareholders. Dividends and distributions are recorded on the ex-dividend date. The Portfolio intends to declare and pay dividends from net investment income and distributions from net realized capital and currency gains, if any, at least annually. Unless a shareholder elects otherwise, all dividends and distributions are reinvested at NAV in the same class of shares of the Portfolio. Dividends and distributions to shareholders are determined in accordance with federal income tax regulations and may differ from determinations using GAAP.
(E) Security Transactions and Investment Income. The Portfolio records security transactions on the trade date. Realized gains and losses on security transactions are determined using the identified cost method. Dividend income is recognized on the ex-dividend date, net of any foreign tax withheld at the source, and interest income is accrued as earned using the effective interest rate method. Distributions received from real estate investment trusts may be classified as dividends, capital gains and/or return of capital.
Investment income and realized and unrealized gains and losses on investments of the Portfolio are allocated pro rata to the separate classes of shares based upon their relative net assets on the date the income is earned or realized and unrealized gains and losses are incurred.
(F) Expenses. Expenses of the Fund are allocated to the individual Portfolios in proportion to the net assets of the respective Portfolios when the expenses are incurred, except where direct allocations of expenses can be made. Expenses (other than fees incurred under the distribution and service plans, further discussed in Note 3(B), which are charged directly to the Service Class shares) are allocated to separate classes of shares pro rata based upon their relative net assets on the date the
| 20 | MainStay VP Epoch U.S. Equity Yield Portfolio |
expenses are incurred. The expenses borne by the Portfolio, including those of related parties to the Portfolio, are shown in the Statement of Operations.
Additionally, the Portfolio may invest in mutual funds, which are subject to management fees and other fees that may cause the costs of investing in mutual funds to be greater than the costs of owning the underlying securities directly. These indirect expenses of mutual funds are not included in the amounts shown as expenses in the Statement of Operations or in the expense ratios included in the Financial Highlights.
(G) Use of Estimates. In preparing financial statements in conformity with GAAP, the Manager makes estimates and assumptions that affect the reported amounts and disclosures in the financial statements. Actual results could differ from those estimates and assumptions.
(H) Securities Lending. In order to realize additional income, the Portfolio may engage in securities lending, subject to the limitations set forth in the 1940 Act and relevant guidance by the staff of the Securities and Exchange Commission (“SEC”). If the Portfolio engages in securities lending, the Portfolio will lend through its custodian, JPMorgan Chase Bank, N.A., ("JPMorgan"), acting as securities lending agent on behalf of the Portfolio. Under the current arrangement, JPMorgan will manage the Portfolio's collateral in accordance with the securities lending agency agreement between the Portfolio and JPMorgan, and indemnify the Portfolio against counterparty risk. The loans will be collateralized by cash (which may be invested in a money market fund) and/or non-cash collateral (which may include U.S. Treasury securities and/or U.S. government agency securities issued or guaranteed by the United States government or its agencies or instrumentalities) at least equal at all times to the market value of the securities loaned. The Portfolio bears the risk of delay in recovery of, or loss of rights in, the securities loaned. The Portfolio may also record a realized gain or loss on securities deemed sold due to a borrower’s inability to return securities on loan. The Portfolio bears the risk of any loss on investment of cash collateral. The Portfolio will receive compensation for lending its securities in the form of fees or it will retain a portion of interest earned on the investment of any cash collateral. The Portfolio will also continue to receive interest and dividends on the securities loaned and any gain or loss in the market price of the securities loaned that may occur during the term of the loan will be for the account of the Portfolio. Income earned from securities lending activities, if any, is reflected in the Statement of Operations. As of June 30, 2021, the Portfolio did not have any portfolio securities on loan.
Prior to February 22, 2021, these services were provided by State Street Bank and Trust Company (“State Street”).
(I) Indemnifications. Under the Fund’s organizational documents, its officers and trustees are indemnified against certain liabilities that may arise out of performance of their duties to the Fund. Additionally, in the normal course of business, the Portfolio enters into contracts with third-party service providers that contain a variety of representations and warranties and that may provide general indemnifications. The Portfolio's maximum exposure under these arrangements is unknown, as this would
involve future claims that may be made against the Portfolio that have not yet occurred. The Manager believes that the risk of loss in connection with these potential indemnification obligations is remote. However, there can be no assurance that material liabilities related to such obligations will not arise in the future, which could adversely impact the Portfolio.
Note 3–Fees and Related Party Transactions
(A) Manager and Subadvisor. New York Life Investments, a registered investment adviser and an indirect, wholly-owned subsidiary of New York Life, serves as the Portfolio's Manager, pursuant to an Amended and Restated Management Agreement (“Management Agreement”). The Manager provides offices, conducts clerical, recordkeeping and bookkeeping services and keeps most of the financial and accounting records required to be maintained by the Portfolio. Except for the portion of salaries and expenses that are the responsibility of the Portfolio, the Manager pays the salaries and expenses of all personnel affiliated with the Portfolio and certain operational expenses of the Portfolio. The Portfolio reimburses New York Life Investments in an amount equal to the portion of the compensation of the Chief Compliance Officer attributable to the Portfolio. Epoch Investment Partners, Inc. (“Epoch” or the “Subadvisor”), a registered investment adviser, serves as Subadvisor to thePortfolio and is responsible for the day-to-day portfolio management of the Portfolio. Pursuant to the terms of an Amended and Restated Subadvisory Agreement (“Subadvisory Agreement”) between New York Life Investments and Epoch, New York Life Investments pays for the services of the Subadvisor.
Pursuant to the Management Agreement, the Fund pays the Manager, on behalf of the Portfolio, a monthly fee for the services performed and the facilities furnished at an annual rate of the Portfolio's average daily net assets as follows: 0.70% up to $500 million; 0.68% from $500 million to $1 billion; 0.66% from $1 billion to $2 billion; and 0.65% in excess of $2 billion. During the six-month period ended June 30, 2021, the effective management fee rate was 0.69% (exclusive of any applicable waivers/reimbursements).
New York Life Investments has contractually agreed to waive fees and/or reimburse expenses so that Total Annual Portfolio Operating Expenses (excluding taxes, interest, litigation, extraordinary expenses, brokerage and other transaction expenses relating to the purchase or sale of portfolio investments and acquired (underlying) portfolio/fund fees and expenses) of of Service Class shares do not exceed 0.93% of its average daily net assets. New York Life Investments will apply an equivalent waiver or reimbursement to Initial Class shares. This agreement will remain in effect until May 1, 2022, and shall renew automatically for one-year terms unless New York Life Investments provides written notice of termination prior to the start of the next term or upon approval of the Board.
During the six-month period ended June 30, 2021, New York Life Investments earned fees from the Portfolio in the amount of $3,311,736 and waived fees and/or reimbursed expenses in the amount of $191,411 and paid the Subadvisor fees in the amount of $1,560,985.
Notes to Financial Statements (Unaudited) (continued)
JPMorgan provides sub-administration and sub-accounting services to the Portfolio pursuant to an agreement with New York Life Investments. These services include calculating the daily NAVs of the Portfolio, maintaining the general ledger and sub-ledger accounts for the calculation of the Portfolio's NAVs, and assisting New York Life Investments in conducting various aspects of the Portfolio's administrative operations. For providing these services to the Portfolio, JPMorgan is compensated by New York Life Investments.
Prior to February 22, 2021, these services were provided by State Street.
Pursuant to an agreement between the Fund and New York Life Investments, New York Life Investments is responsible for providing or procuring certain regulatory reporting services for the Portfolio. The Portfolio will reimburse New York Life Investments for the actual costs incurred by New York Life Investments in connection with providing or procuring these services for the Portfolio.
(B) Distribution and Service Fees. The Fund, on behalf of the Portfolio, has entered into a distribution agreement with NYLIFE Distributors LLC (the “Distributor”), an affiliate of New York Life Investments. The Portfolio has adopted a distribution plan (the “Plan”) in accordance with the provisions of Rule 12b-1 under the 1940 Act. Under the Plan, the Distributor has agreed to provide, through its affiliates or independent third parties, various distribution-related, shareholder and administrative support services to the Service Class shareholders. For its services, the Distributor is entitled to a combined distribution and service fee accrued daily and paid monthly at an annual rate of 0.25% of the average daily net assets attributable to the Service Class shares of the Portfolio.
(C) Investments in Affiliates (in 000’s). During the six-month period ended June 30, 2021, purchases and sales transactions, income earned from investments and shares held of investment companies managed by New York Life Investments or its affiliates were as follows:
| Affiliated Investment Companies | Value,
Beginning
of Period | Purchases
at Cost | Proceeds
from
Sales | Net
Realized
Gain/(Loss)
on Sales | Change in
Unrealized
Appreciation/
(Depreciation) | Value,
End of
Period | Dividend
Income | Other
Distributions | Shares
End of
Period |
| MainStay U.S. Government Liquidity Fund | $ 21,984 | $ 106,651 | $ (108,230) | $ — | $ — | $ 20,405 | $ 1 | $ — | 20,405 |
Note 4-Federal Income Tax
As of June 30, 2021, the cost and unrealized appreciation (depreciation) of the Portfolio’s investment portfolio, including applicable derivative contracts and other financial instruments, as determined on a federal income tax basis, were as follows:
| | Federal Tax
Cost | Gross
Unrealized
Appreciation | Gross
Unrealized
(Depreciation) | Net
Unrealized
Appreciation/
(Depreciation) |
| Investments in Securities | $787,025,669 | $241,014,853 | $(14,777,644) | $226,237,209 |
As of December 31, 2020, for federal income tax purposes, capital loss carryforwards of $32,527,514, as shown in the table below, were available to the extent provided by the regulations to offset future realized gains of the Portfolio. Accordingly, no capital gains distributions are expected to be paid to shareholders until net gains have been realized in excess of such amounts.
Capital Loss
Available Through | Short-Term
Capital Loss
Amounts (000’s) | Long-Term
Capital Loss
Amounts (000’s) |
| Unlimited | $27,728 | $4,800 |
During the year ended December 31, 2020, the tax character of distributions paid as reflected in the Statements of Changes in Net Assets was as follows:
| | 2020 |
| Distributions paid from: | |
| Ordinary Income | $23,317,781 |
| Long-Term Capital Gains | 31,373,087 |
| Total | $54,690,868 |
Note 5–Custodian
JPMorgan is the custodian of cash and securities held by the Portfolio. Custodial fees are charged to the Portfolio based on the Portfolio's net assets and/or the market value of securities held by the Portfolio and the number of certain transactions incurred by the Portfolio.
Prior to February 22, 2021, these services were provided by State Street. The services provided by State Street were a direct expense of the Portfolio and are included in the Statement of Operations as Custodian fees which totaled $3,428 for the period January 1, 2021 through February 21, 2021.
Note 6–Line of Credit
The Portfolio and certain other funds managed by New York Life Investments maintain a line of credit with a syndicate of banks in order to secure a source of funds for temporary purposes to meet unanticipated or excessive redemption requests.
| 22 | MainStay VP Epoch U.S. Equity Yield Portfolio |
Effective July 27, 2021, under the credit agreement (the “Credit Agreement”), the aggregate commitment amount is $600,000,000 with an additional uncommitted amount of $100,000,000. The commitment fee is an annual rate of 0.15% of the average commitment amount payable quarterly, regardless of usage, to JPMorgan, who serves as the agent to the syndicate. The commitment fee is allocated among the Portfolio and certain other funds managed by New York Life Investments based upon their respective net assets and other factors. Interest on any revolving credit loan is charged based upon the Federal Funds Rate or the one-month London Interbank Offered Rate ("LIBOR"), whichever is higher. The Credit Agreement expires on July 26, 2022, although the Portfolio, certain other funds managed by New York Life Investments and the syndicate of banks may renew the Credit Agreement for an additional year on the same or different terms or enter into a credit agreement with a different syndicate of banks. Prior to July 27, 2021, the aggregate commitment amount and the commitment fee were the same as those under the current Credit Agreement. During the six-month period ended June 30, 2021, there were no borrowings made or outstanding with respect to the Portfolio under the Credit Agreement.
Note 7–Interfund Lending Program
Pursuant to an exemptive order issued by the SEC, the Portfolio, along with certain other funds managed by New York Life Investments, may participate in an interfund lending program. The interfund lending program provides an alternative credit facility that permits the Portfolio and certain other funds managed by New York Life Investments to lend or borrow money for temporary purposes directly to or from one another, subject to the conditions of the exemptive order. During the six-month period ended June 30, 2021, there were no interfund loans made or outstanding with respect to the Portfolio.
Note 8–Purchases and Sales of Securities (in 000’s)
During the six-month period ended June 30, 2021, purchases and sales of securities, other than short-term securities, were $91,994 and $103,289, respectively.
Note 9–Capital Share Transactions
Transactions in capital shares for the six-month period ended June 30, 2021 and the year ended December 31, 2020, were as follows:
| Initial Class | Shares | Amount |
| Period ended June 30, 2021: | | |
| Shares sold | 3,122,819 | $ 52,059,530 |
| Shares redeemed | (2,931,007) | (47,516,237) |
| Net increase (decrease) | 191,812 | $ 4,543,293 |
| Year ended December 31, 2020: | | |
| Shares sold | 2,458,147 | $ 35,425,531 |
| Shares issued to shareholders in reinvestment of distributions | 2,166,877 | 30,366,836 |
| Shares redeemed | (8,562,407) | (122,749,006) |
| Net increase (decrease) | (3,937,383) | $ (56,956,639) |
| |
| Service Class | Shares | Amount |
| Period ended June 30, 2021: | | |
| Shares sold | 296,210 | $ 4,496,616 |
| Shares redeemed | (2,176,491) | (34,864,952) |
| Net increase (decrease) | (1,880,281) | $ (30,368,336) |
| Year ended December 31, 2020: | | |
| Shares sold | 2,391,552 | $ 32,951,089 |
| Shares issued to shareholders in reinvestment of distributions | 1,761,258 | 24,324,032 |
| Shares redeemed | (4,829,707) | (68,115,932) |
| Net increase (decrease) | (676,897) | $ (10,840,811) |
Note 10–Other Matters
An outbreak of COVID-19, first detected in December 2019, has developed into a global pandemic and has resulted in travel restrictions, closure of international borders, certain businesses and securities markets, restrictions on securities trading activities, prolonged quarantines, supply chain disruptions, and lower consumer demand, as well as general concern and uncertainty. The continued impact of COVID-19 and related new variants is uncertain and could further adversely affect the global economy, national economies, individual issuers and capital markets in unforeseeable ways and result in a substantial and extended economic downturn. Developments that disrupt global economies and financial markets, such as COVID-19, may magnify factors that affect the Portfolio's performance.
Note 11–Subsequent Events
In connection with the preparation of the financial statements of the Portfolio as of and for the six-month period ended June 30, 2021, events and transactions subsequent to June 30, 2021, through the date the financial statements were issued have been evaluated by the Manager for possible adjustment and/or disclosure. No subsequent events requiring financial statement adjustment or disclosure have been identified.
Discussion of the Operation and Effectiveness of the Portfolio's Liquidity Risk Management Program (Unaudited)
In compliance with Rule 22e-4 under the Investment Company Act of 1940, as amended (the “Liquidity Rule”), the Portfolio has adopted and implemented a liquidity risk management program (the “Program”), which New York Life Investment Management LLC believes is reasonably designed to assess and manage the Portfolio's liquidity risk (the risk that the Portfolio could not meet requests to redeem shares issued by the Portfolio without significant dilution of remaining investors’ interests in the Portfolio). The Board of Trustees of MainStay VP Funds Trust (the "Board") designated New York Life Investment Management LLC as administrator of the Program (the “Administrator”). The Administrator has established a Liquidity Risk Management Committee to assist the Administrator in the implementation and day-to-day administration of the Program and to otherwise support the Administrator in fulfilling its responsibilities under the Program.
At a meeting of the Board held on March 8, 2021, the Administrator provided the Board with a written report addressing the Program’s operation and assessing its adequacy and effectiveness of implementation for the period from January 1, 2020 through December 31, 2020 (the "Review Period"), as required under the Liquidity Rule. The report noted that the Administrator concluded that (i) the Program operated effectively to assess and manage the Portfolio's liquidity risk, (ii) the Program has been adequately and effectively implemented to monitor and, as applicable, respond to the Portfolio's liquidity developments and (iii) the Portfolio's investment strategy continues to be appropriate for an open-end fund. In addition, the report discussed notable events that impacted liquidity risk during the Review Period, including the COVID-19 pandemic and the resulting economic shutdown.
In accordance with the Program, the Portfolio's liquidity risk is assessed no less frequently than annually taking into consideration certain factors, as applicable, such as (i) investment strategy and liquidity of portfolio investments, (ii) short-term and long-term cash flow projections and (iii) holdings of cash and cash equivalents, as well as borrowing arrangements and other funding sources. Certain factors are considered under both normal and reasonably foreseeable stressed conditions.
Each Portfolio portfolio investment is classified into one of four liquidity categories. The classification is based on a determination of the number of days it is reasonably expected to take to convert the investment into cash, or sell or dispose of the investment, in current market conditions without significantly changing the market value of the investment. The Administrator has delegated liquidity classification determinations to the Portfolio’s subadvisor, subject to appropriate oversight by the Administrator, and classification determinations are made by taking into account the Portfolio's reasonably anticipated trade size, various market, trading and investment-specific considerations, as well as market depth, and, in certain cases, third-party vendor data.
The Liquidity Rule requires portfolios that do not primarily hold assets that are highly liquid investments to adopt a minimum amount of net assets that must be invested in highly liquid investments that are assets (an “HLIM”). In addition, the Liquidity Rule limits a portfolio's investments in illiquid investments. Specifically, the Liquidity Rule prohibits acquisition of illiquid investments if doing so would result in a portfolio holding more than 15% of its net assets in illiquid investments that are assets. The Program includes provisions reasonably designed to determine, periodically review and comply with the HLIM requirement, as applicable, and to comply with the 15% limit on illiquid investments.
There can be no assurance that the Program will achieve its objectives under all circumstances in the future. Please refer to the Portfolio's prospectus for more information regarding the Portfolio's exposure to liquidity risk and other risks to which it may be subject.
| 24 | MainStay VP Epoch U.S. Equity Yield Portfolio |
Proxy Voting Record
The Portfolio is required to file with the SEC its proxy voting records for the 12-month period ending June 30 on Form N-PX. The Portfolio's most recent Form N-PX or proxy voting record is available free of charge upon request (i) by calling 800-598-2019; (ii) by visiting New York Life Investments’ website at https://www.nylinvestments.com/mainstay/
products-and-performance/mainstay-vp-funds-trust; or (iii) by visiting the SEC’s website at www.sec.gov.
Shareholder Reports and Quarterly Portfolio Disclosure
The Portfolio is required to file its complete schedule of portfolio holdings with the SEC 60 days after its first and third fiscal quarter on Form N-PORT. The Portfolio's holdings report is available free of charge upon request by calling 800-598-2019 or by visiting the SEC’s website at www.sec.gov.
This page intentionally left blank
MainStay VP Portfolios
MainStay VP offers a wide range of Portfolios. The full array of MainStay VP offerings is listed here, with information about the manager, subadvisors, legal counsel, and independent registered public accounting firm.
Equity
MainStay VP Candriam Emerging Markets Equity Portfolio
MainStay VP Epoch U.S. Equity Yield Portfolio
MainStay VP Fidelity Institutional AM® Utilities Portfolio†
MainStay VP MacKay International Equity Portfolio
MainStay VP MacKay S&P 500 Index Portfolio
MainStay VP Natural Resources Portfolio
MainStay VP Small Cap Growth Portfolio
MainStay VP T. Rowe Price Equity Income Portfolio
MainStay VP Wellington Growth Portfolio
MainStay VP Wellington Mid Cap Portfolio
MainStay VP Wellington Small Cap Portfolio
MainStay VP Wellington U.S. Equity Portfolio
MainStay VP Winslow Large Cap Growth Portfolio
Mixed Asset
MainStay VP Balanced Portfolio
MainStay VP Income Builder Portfolio
MainStay VP Janus Henderson Balanced Portfolio
MainStay VP MacKay Convertible Portfolio
Income
MainStay VP Bond Portfolio
MainStay VP Floating Rate Portfolio
MainStay VP Indexed Bond Portfolio
MainStay VP MacKay Government Portfolio
MainStay VP MacKay High Yield Corporate Bond Portfolio
MainStay VP MacKay Strategic Bond Portfolio
MainStay VP PIMCO Real Return Portfolio
Money Market
MainStay VP U.S. Government Money Market Portfolio
Alternative
MainStay VP CBRE Global Infrastructure Portfolio
MainStay VP IQ Hedge Multi-Strategy Portfolio
Asset Allocation
MainStay VP Conservative Allocation Portfolio
MainStay VP Equity Allocation Portfolio
MainStay VP Growth Allocation Portfolio
MainStay VP Moderate Allocation Portfolio
Manager
New York Life Investment Management LLC
New York, New York
Subadvisors
Brown Advisory LLC
Baltimore, Maryland
Candriam Belgium S.A.*
Brussels, Belgium
CBRE Clarion Securities LLC
Radnor, Pennsylvania
Epoch Investment Partners, Inc.
New York, New York
FIAM LLC
Smithfield, Rhode Island
IndexIQ Advisors LLC*
New York, New York
Janus Capital Management LLC
Denver, Colorado
MacKay Shields LLC*
New York, New York
Mellon Investments Corporation
Boston, Massachusetts
NYL Investors LLC*
New York, New York
Pacific Investment Management Company LLC
Newport Beach, California
Segall Bryant & Hamill, LLC
Chicago, Illinois
T. Rowe Price Associates, Inc.
Baltimore, Maryland
Wellington Management Company LLP
Boston, Massachusetts
Winslow Capital Management, LLC
Minneapolis, Minnesota
Legal Counsel
Dechert LLP
Washington, District of Columbia
Independent Registered Public Accounting Firm
KPMG LLP
Philadelphia, Pennsylvania
Distributor
NYLIFE Distributors LLC*
Jersey City, New Jersey
Custodian
JPMorgan Chase Bank, N.A.
New York, New York
Some Portfolios may not be available in all products.
† Fidelity Institutional AM is a registered trade mark of FMR LLC. Used with permission.
* An affiliate of New York Life Investment Management LLC
Not part of the Semiannual Report
2021 Semiannual Report
This report is for the general information of New York Life Variable Annuities and NYLIAC Variable Universal Life Insurance Products policyowners. It must be preceded or accompanied by the appropriate product(s) and funds prospectuses if it is given to anyone who is not an owner of a New York Life variable annuity policy or a NYLIAC Variable Universal Life Insurance Product. This report does not offer for sale or solicit orders to purchase securities.
The performance data quoted in this report represents past performance. Past performance is no guarantee of future results. Due to market volatility and other factors, current performance may be lower or higher than the figures shown. The most recent month-end performance summary for your variable annuity or variable life policy is available by calling 800-598-2019 and is updated periodically on newyorklife.com.
The New York Life Variable Annuities and NYLIAC Variable Universal Life Insurance Products are issued by New York Life Insurance and Annuity Corporation (a Delaware Corporation) and distributed by NYLIFE Distributors LLC (Member FINRA/SIPC).
New York Life Insurance Company
New York Life Insurance and Annuity
Corporation (NYLIAC) (A Delaware Corporation)
51 Madison Avenue, Room 551
New York, NY 10010
newyorklife.com
nylinvestments.com
NYLIFE Distributors LLC, 30 Hudson Street, Jersey City, NJ 07302
New York Life Investment Management LLC is the investment manager to the MainStay VP Funds Trust
©2021 by NYLIFE Distributors LLC. All rights reserved.
You may obtain copies of the Prospectus and the Statement of Additional Information free of charge, upon request, by calling toll-free 800-598-2019 or writing to New York Life Insurance and Annuity Corporation, 51 Madison Avenue, New York, NY 10010.
| Not FDIC Insured | No Bank Guarantee | May Lose Value |
(NYLIAC) NI521
MainStay VP T. Rowe Price Equity Income Portfolio
Message from the President and Semiannual Report
Unaudited | June 30, 2021
Sign up for e-delivery of your shareholder reports. For full details on e-delivery, including who can participate and what you can receive via e-delivery,
please log in to newyorklifeinvestments.com/accounts.
| Not FDIC/NCUA Insured | Not a Deposit | May Lose Value | No Bank Guarantee | Not Insured by Any Government Agency |
This page intentionally left blank
Message from the President
The COVID-19 pandemic continued to afflict our personal lives and broad segments of the U.S. and global economy throughout the six-month reporting period ended June 30, 2021. However, with the deployment of multiple vaccines around the world, including three highly effective versions approved for emergency use in the United States, investors began to turn their attention toward the gradual reopening of the economy and the shape the “new normal” would take.
The first half of the reporting period saw increasing inflationary concerns as fiscal stimulus business reopenings drove accelerating economic growth, rising commodity prices and increased consumer spending. However, the U.S. Federal Reserve noted that price increases were likely to prove temporary and made clear their intention to remain accommodative for the foreseeable future. Accordingly, after moving higher in the first quarter of 2021, interest rates declined in the second quarter.
In response to the uncertain inflation outlook, equity market leadership shifted from value in the first quarter of the year to growth in the second quarter. Nevertheless, investor sentiment remained buoyant throughout the reporting period, with all eleven sectors in the S&P 500® Index, a widely regarded benchmark of market performance, producing positive returns. Energy led the market’s rise fueled by rapidly increasing oil and gas prices, followed by financials and real estate, which benefited from rising interest rates and the economic reopening, respectively. Communication services produced the slowest growth, followed by the traditionally defensive utilities and consumer staples
sectors. In the fixed income market, lower-credit-quality issues tended to outperform their higher-grade counterparts, with high-yield corporate bonds generating the strongest performance. Among securitized products, commercial mortgage-backed securities generally produced the strongest returns, followed by mortgage-backed securities and asset-backed securities, while Treasury securities lagged.
Despite the tremendous progress we’ve seen so far this year, the United States and the world continue to face significant pandemic-related challenges. Newer, more contagious variants of COVID-19 threaten the return of restrictions and lockdowns that could stall the economic recovery. At the same time, supply chain shortages have led to rising prices on everything from laptops to autos, stoking fears of uncontrolled inflation despite reassurance from the U.S. Federal Reserve. At New York Life Investments, we recognize that the shape that the “new normal” eventually takes may differ from our expectations. You can depend on us to keep a sharp watch for the unexpected, and to continue to help you find your way through this rapidly evolving investment landscape.
Sincerely,
Kirk C. Lehneis
President
The opinions expressed are as of the date of this report and are subject to change. There is no guarantee that any forecast made will come to pass. This material does not constitute investment advice and is not intended as an endorsement of any specific investment. Past performance is no guarantee of future results.
Not part of the Semiannual Report
Investors should refer to the Portfolio’s Summary Prospectus and/or Prospectus and consider the Portfolio’s investment objectives, strategies, risks, charges and expenses carefully before investing. The Summary Prospectus and/or Prospectus contain this and other information about the Portfolio. You may obtain copies of the Portfolio’s Summary Prospectus and/or the Prospectus and the Statement of Additional Information free of charge, upon request, by calling toll-free 800-598-2019, by writing to New York Life Insurance and Annuity Corporation, 51 Madison Avenue, Room 251, New York, New York 10010 or by sending an email to MainStayShareholdersServices@nylim.com. These documents are also available at nylinvestments.com/vpdocuments. Please read the Portfolio's Summary Prospectus and/or Prospectus carefully before investing. MainStay VP Funds Trust portfolios are separate account options which are purchased through a variable insurance or variable annuity contract.
Investment and Performance Comparison (Unaudited)
Performance data quoted represents past performance. Past performance is no guarantee of future results. Because of market volatility and other factors, current performance may be lower or higher than the figures shown. Investment return and principal value will fluctuate, and as a result, when shares are redeemed, they may be worth more or less than their original cost. The performance table and graph do not reflect any deduction of sales charges, mortality and expense charges, contract charges or administrative charges. Please refer to the Performance Summary appropriate for your policy. For performance information current to the most recent month-end, please call 800-598-2019 or visit www.newyorklife.com.
Performance figures may reflect certain fee waivers and/or expense limitations, without which total returns may have been different. For information on current fee waivers and/or expense limitations (if any), please refer to the Notes to Financial Statements.
| Average Annual Total Returns for the Period-Ended June 30, 2021 |
| Class | Inception
Date | Six
Months | One
Year | Five
Years | Since
Inception | Gross
Expense
Ratio1 |
| Initial Class Shares | 2/17/2012 | 18.36% | 47.67% | 12.16% | 11.04% | 0.76% |
| Service Class Shares | 2/17/2012 | 18.22 | 47.30 | 11.88 | 10.76 | 1.01 |
| 1. | The gross expense ratios presented reflect the Portfolio’s “Total Annual Portfolio Operating Expenses” from the most recent Prospectus, as supplemented, and may differ from other expense ratios disclosed in this report. |
| Benchmark Performance | Six
Months | One
Year | Five
Years | Since
Inception |
| Russell 1000® Value Index1 | 17.05% | 43.68% | 11.87% | 12.15% |
| S&P 500® Index2 | 15.25 | 40.79 | 17.65 | 15.37 |
| Morningstar Large Value Category Average3 | 17.48 | 42.51 | 12.02 | 11.08 |
| 1. | The Russell 1000® Value Index is the Portfolio’s primary benchmark. The Russell 1000® Value Index measures the performance of the large-cap value segment of the U.S. equity universe. It includes those Russell 1000® Index companies with lower price-to-book ratios and lower expected growth values. Results assume reinvestment of all dividends and capital gains. An investment cannot be made directly in an index. |
| 2. | The S&P 500® Index is the Portfolio's secondary benchmark. “S&P 500®" is a trademark of The McGraw-Hill Companies, Inc. The S&P 500® Index is widely regarded as the standard index for measuring large-cap U.S. stock market performance. Results assume reinvestment of all dividends and capital gains. An investment cannot be made directly in an index. |
| 3. | The Morningstar Large Value Category Average is representative of funds that invest primarily in big U.S. companies that are less expensive or growing more slowly than other large-cap stocks. Results are based on average total returns of similar funds with all dividends and capital gain distributions reinvested. |
Cost in Dollars of a $1,000 Investment in MainStay VP T. Rowe Price Equity Income Portfolio (Unaudited)
The example below is intended to describe the fees and expenses borne by shareholders during the six-month period from January 1, 2021 to June 30, 2021, and the impact of those costs on your investment.
Example
As a shareholder of the Portfolio you incur two types of costs: (1) transaction costs, including exchange fees and sales charges (loads) on purchases (as applicable), and (2) ongoing costs, including management fees, distribution and/or service (12b-1) fees, and other Portfolio expenses (as applicable). This example is intended to help you understand your ongoing costs (in dollars) of investing in the Portfolio and to compare these costs with the ongoing costs of investing in other mutual funds. The example is based on an investment of $1,000 made at the beginning of the six-month period and held for the entire period from January 1, 2021 to June 30, 2021. Shares are only sold in connection with variable life and annuity contracts and the example does not reflect any contract level or transactional fees or expenses. If these costs had been included, your costs would have been higher.
This example illustrates your Portfolio’s ongoing costs in two ways:
Actual Expenses
The second and third data columns in the table below provide information about actual account values and actual expenses. You may use the information in these columns, together with the amount you invested, to estimate the expenses that you paid during the six months ended June
30, 2021. Simply divide your account value by $1,000 (for example, an $8,600 account value divided by $1,000 = 8.6), then multiply the result by the number under the heading entitled “Expenses Paid During Period” to estimate the expenses you paid on your account during this period.
Hypothetical Example for Comparison Purposes
The fourth and fifth data columns in the table below provide information about hypothetical account values and hypothetical expenses based on the Portfolio’s actual expense ratio and an assumed rate of return of 5% per year before expenses, which is not the Portfolio’s actual return. The hypothetical account values and expenses may not be used to estimate the actual ending account balances or expenses you paid for the six-month period shown. You may use this information to compare the ongoing costs of investing in the Portfolio with the ongoing costs of investing in other mutual funds. To do so, compare this 5% hypothetical example with the 5% hypothetical examples that appear in the shareholder reports of the other mutual funds.
Please note that the expenses shown in the table are meant to highlight your ongoing costs only and do not reflect any transactional costs, such as exchange fees or sales charges (loads). Therefore, the fourth and fifth data columns of the table are useful in comparing ongoing costs only and will not help you determine the relative total costs of owning different funds. In addition, if these transactional costs were included, your costs would have been higher.
| Share Class | Beginning
Account
Value
1/1/21 | Ending Account
Value (Based
on Actual
Returns and
Expenses)
6/30/21 | Expenses
Paid
During
Period1 | Ending Account
Value (Based
on Hypothetical
5% Annualized
Return and
Actual Expenses)
6/30/21 | Expenses
Paid
During
Period1 | Net Expense
Ratio
During
Period2 |
| Initial Class Shares | $1,000.00 | $1,183.60 | $4.11 | $1,021.03 | $3.81 | 0.76% |
| Service Class Shares | $1,000.00 | $1,182.20 | $5.46 | $1,019.79 | $5.06 | 1.01% |
| 1. | Expenses are equal to the Portfolio’s annualized expense ratio of each class multiplied by the average account value over the period, divided by 365 and multiplied by 181 (to reflect the six-month period). The table above represents the actual expenses incurred during the six-month period. In addition to the fees and expenses which the Portfolio bears directly, it also indirectly bears a pro rata share of the fees and expenses of the underlying funds in which it invests. Such indirect expenses are not included in the above-reported expense figures. |
| 2. | Expenses are equal to the Portfolio's annualized expense ratio to reflect the six-month period. |
| 6 | MainStay VP T. Rowe Price Equity Income Portfolio |
Industry Composition as of June 30, 2021 (Unaudited)
| Banks | 8.7% |
| Insurance | 8.0 |
| Oil, Gas & Consumable Fuels | 5.8 |
| Semiconductors & Semiconductor Equipment | 5.4 |
| Capital Markets | 4.9 |
| Health Care Providers & Services | 4.8 |
| Electric Utilities | 4.3 |
| Equity Real Estate Investment Trusts | 4.1 |
| Multi–Utilities | 4.0 |
| Chemicals | 3.9 |
| Health Care Equipment & Supplies | 3.9 |
| Pharmaceuticals | 3.7 |
| Media | 3.6 |
| Industrial Conglomerates | 3.4 |
| Food Products | 3.1 |
| Aerospace & Defense | 2.7 |
| Air Freight & Logistics | 2.6 |
| Biotechnology | 2.3 |
| Software | 2.3 |
| Containers & Packaging | 1.8 |
| Tobacco | 1.6 |
| Machinery | 1.4 |
| Automobiles | 1.2% |
| Household Products | 1.2 |
| Diversified Financial Services | 1.1 |
| Hotels, Restaurants & Leisure | 1.1 |
| Communications Equipment | 0.9 |
| Entertainment | 0.9 |
| Multiline Retail | 0.8 |
| Professional Services | 0.8 |
| Commercial Services & Supplies | 0.7 |
| Leisure Products | 0.7 |
| Beverages | 0.6 |
| Specialty Retail | 0.6 |
| Diversified Telecommunication Services | 0.5 |
| Energy Equipment & Services | 0.4 |
| Food & Staples Retailing | 0.4 |
| Airlines | 0.3 |
| Electronic Equipment, Instruments & Components | 0.3 |
| Short–Term Investments | 1.4 |
| Other Assets, Less Liabilities | –0.2 |
| | 100.0% |
‡ Less than one-tenth of percent.
See Portfolio of Investments beginning on page 11 for specific holdings within these categories. The Portfolio's holdings are subject to change.
Top Ten Holdings as of June 30, 2021 (excluding short-term investments) (Unaudited)
| 1. | Wells Fargo & Co. |
| 2. | General Electric Co. |
| 3. | Southern Co. (The) |
| 4. | United Parcel Service, Inc., Class B |
| 5. | QUALCOMM, Inc. |
| 6. | American International Group, Inc. |
| 7. | MetLife, Inc. |
| 8. | TotalEnergies SE |
| 9. | Anthem, Inc. |
| 10. | Becton Dickinson and Co. |
Portfolio Management Discussion and Analysis (Unaudited)
Answers to the questions reflect the views of portfolio manager John D. Linehan, CFA, of T. Rowe Price Associates, Inc., the Portfolio’s Subadvisor.
How did MainStay VP T. Rowe Price Equity Income Portfolio perform relative to its benchmarks and peers during the six months ended June 30, 2021?
For the six months ended June 30, 2021, MainStay VP T. Rowe Price Equity Income Portfolio returned 18.36% for Initial Class shares and 18.22% for Service Class shares. Over the same period, both share classes outperformed the 17.05% return of the Russell 1000® Value Index, which is the Portfolio’s primary benchmark, and the 15.25% return of the S&P 500® Index, which is the Portfolio’s secondary benchmark. For the six months ended June 30, 2021, both share classes also outperformed the 17.48% return of the Morningstar Large Value Category Average.1
During the reporting period, were there any market events that materially impacted the Portfolio’s performance or liquidity?
The market environment in 2020 was bifurcated and particularly difficult for value investors, with large-cap growth leading large-cap value throughout most of the year, as measured by the Russell 1000 Indices. Dividend yield was also a headwind, as non-dividend-paying stocks outperformed the top quintile of dividend-paying stocks in the Russell 1000® Value Index.
During the reporting period, however, we saw a reversal with the highest dividend-paying stocks outperforming non-dividend-paying stocks. Value stocks also outpaced growth in response to stimulus measures and progress in controlling the COVID-19 pandemic. While market conditions can have a meaningful impact on returns in the short run, we believe the consistent application of our philosophy and process will continue to result in superior long-term, risk-adjusted performance.
What factors affected the Portfolio’s relative performance during the reporting period?
The Portfolio outperformed the Russell 1000® Value Index during the reporting period largely due to strong stock selection.
Which sectors were the strongest positive contributors to the Portfolio’s relative performance, and which sectors were particularly weak?
The materials sector made the strongest positive contribution to the Portfolio’s performance relative to the Russell 1000® Value Index due to stock selection. (Contributions take weightings and total returns into account.) The financials sector also bolstered relative results due to stock choices. The communication services sector contributed positively to relative returns due to security selection and the Portfolio’s underweight allocation.
Conversely, the lagging utilities sector was the most significant detractor from the Portfolio’s relative returns due to an overweight allocation. The consumer discretionary sector undermined relative
results due to security choices and an underweight allocation. The energy sector also hurt relative performance due to stock selection, although an overweight allocation tempered losses.
During the reporting period, which individual stocks made the strongest positive contributions to the Portfolio’s absolute performance and which stocks detracted the most?
Leading positive contributors to the Portfolio’s absolute performance during the reporting period included positions in multinational financial services company Wells Fargo & Company, semiconductor capital equipment provider Applied Materials and multi-industrial and financial services company General Electric.
Wells Fargo shares benefited from rising interest rates, consumer credit resilience and action by the U.S. Federal Reserve (“Fed”) that cleared banks to resume returning capital to shareholders. Reported financial results showed that the $1.95 trillion asset cap imposed on the company by the Fed in 2018 continued to constrain performance. We continued to believe Wells Fargo had significant room for improvement in its results and an attractive valuation. Furthermore, the prospect of the asset cap eventually being removed could prove to be a tailwind for shares. We trimmed the Portfolio’s position throughout the reporting period as the stock rallied.
Applied Materials shares rose on several impressive earnings reports as the company continued to benefit from the semiconductor industry’s cyclical strength. While we continued to appreciate Applied Materials’ strong market position, we moderated the Portfolio’s position size over the reporting period as we expected fundamentals will likely peak in 2021.
General Electric shares generated gains as investors warmed to the company’s better-than-expected revenue growth in its renewable energy and health care segments, wider margins, and free cash flow generation. Shares also benefited later in the reporting period after Airbus, the world’s largest plane-maker, confirmed an increase in the near-term production target for its A320neo aircraft, which uses engines made by GE Aviation and Safran. While we remained confident in the company’s talented management team, commitment to cost-cutting measures and focus on free cash flow generation, we reduced the Portfolio’s position size on strength.
The most significant detractors from the Portfolio’s absolute performance during the reporting period included wireless chipset maker Qualcomm, casino and resort company Las Vegas Sands, and multinational software company Citrix Systems.
Qualcomm shares registered negative total returns as investors turned from technology stocks early in the reporting period to invest in companies perceived to have more direct exposure to the
| 1. | See page 5 for more information on benchmark and peer group returns. |
| 8 | MainStay VP T. Rowe Price Equity Income Portfolio |
post-pandemic reopening economy. A global chip supply shortage also hampered performance initially. However, as the reporting period progressed, the company’s reported financials showed supply constraints clearing, and the stock’s performance improved, at which time we began to moderate the Portfolio’s position size.
Las Vegas Sands stock posted negative total returns due to coronavirus-driven uncertainty about a return to leisure travel early in the reporting period. Concerns persisted later in the reporting period regarding when Macau and Singapore, from which Las Vegas Sands derives much of its revenue, would resume more normal operations. Despite the uncertainty, we continued to believe the company was well positioned to navigate an uncertain environment and began to see the early stages of recovery in its key markets. We added to the Portfolio’s position.
Citrix Systems shares fell sharply into negative territory toward the end of the reporting period after the company reported revenues that failed to meet expectations due to headwinds that included networking system supply constraints. We continued to value Citrix Systems’ sustained momentum with its cloud management platform and believed that revenue growth was set to improve as the company continued its business model transition. We added to the Portfolio’s position throughout the reporting period.
Did the Portfolio make any significant purchases or sales during the reporting period?
The Portfolio established a position in regional bank Huntington Bancshares late in the reporting period. While the bank continued to aggressively invest to grow market share, creating a temporary headwind to expenses, we believed this would set Huntington up as a leader among regional banks this cycle, positioning it to take advantage of peers that moderated spending. We also believed the potential for surprising economic strength and corresponding loan growth were underappreciated by the market. The Portfolio also established a position in managed health care and insurance company Cigna late in the reporting period following relative weakness in the stock. We believed Cigna to be a well-managed company able to drive higher margins versus peers, particularly in its specialty and retail networks. We also believed its Pharmacy Benefit Management contract with Prime Therapeutics would continue to increase in profitability over time.
Throughout the reporting period, the Portfolio sold shares of specialty chemical conglomerate DuPont de Nemours. We continued to appreciate the attractive end markets the company serves but used the stock’s relative strength to reduce the Portfolio’s position size. We also trimmed the Portfolio’s position in global investment bank Morgan Stanley on continued relative outperformance. We remained appreciative of Morgan Stanley’s combination of lower capital requirements and amassing capital levels, as well as its progress on the company’s business
transformation to a less capital-intensive wealth and asset management business model.
How did the Portfolio’s sector weightings change during the reporting period?
At the beginning of the reporting period, the Portfolio's most substantially overweight positions relative to the Index were utilities and energy. At the end of the reporting period, utilities and financials were the most substantially overweight positions. The most substantial increases in relative weighting in the Portfolio during the reporting period were in the consumer discretionary and industrials sectors.
It is important to note that the Portfolio uses a diversified, bottom-up investment strategy with a long-term focus that has historically resulted in lower turnover relative to peers. Changes to our sector positioning are residual of our stock-selection process. In addition, the Russell 1000® Value Index was reconstituted in late June 2021. Accordingly, the changes in the Portfolio's sector weighting relative to the Index in part reflect the reconstitution of the Index, rather than solely investment decisions made within the Portfolio.
How was the Portfolio positioned at the end of the reporting period?
As of June 30, 2021, the Portfolio’s largest sector positions relative to the Russell 1000® Value Index included utilities, financials and materials. The utilities sector contains several companies that deliver durable cash flows and relatively high dividend yields. We were attracted to the durability of utility earnings and believed efforts to modernize the U.S. electric grid while shifting more power production to renewables offered a multiyear rate-base growth opportunity. In the financials sector, which represented a significant absolute weighting in the Portfolio, we tended to favor defensively positioned names with solid balance sheets and diversified revenue streams that were trading at attractive relative valuations. The cyclical industries within the materials sector faced challenges due to large swings in raw materials costs, supply challenges, and uncertainty amid the coronavirus pandemic. More recently, many of these same industries experienced surging demand.
As of the same date, the Portfolio’s most significantly underweight sector positions relative to the Index included communication services, health care and consumer discretionary. In communication services, the Portfolio’s main exposure was to the media industry, with an emphasis on companies producing or distributing must-see content and generating strong cash flow. The Portfolio also held positions in the entertainment and diversified telecommunication services industries. In health care, we identified pockets of opportunity in which relative valuations appeared attractive, particularly among health care providers and the services industry following coronavirus-driven uncertainty for
demand. In consumer discretionary, we remained cautious regarding industries that we believed were exposed to short- and long-term headwinds, such as the shift toward online shopping. At the same time, we were optimistic toward other industries that stood to benefit from the continuing normalization of economic activity.
The opinions expressed are those of the portfolio manager as of the date of this report and are subject to change. There is no guarantee that any forecasts will come to pass. This material does not constitute investment advice and is not intended as an endorsement of any specific investment.
Not all MainStay VP Portfolios and/or share classes are available under all policies.
| 10 | MainStay VP T. Rowe Price Equity Income Portfolio |
Portfolio of Investments June 30, 2021† (Unaudited)
| | Shares | Value |
| Common Stocks 96.2% |
| Aerospace & Defense 2.7% |
| Airbus SE (a) | 2,310 | $ 297,026 |
| Boeing Co. (The) (a) | 25,589 | 6,130,101 |
| L3Harris Technologies, Inc. | 37,993 | 8,212,187 |
| | | 14,639,314 |
| Air Freight & Logistics 2.6% |
| United Parcel Service, Inc., Class B | 66,254 | 13,778,844 |
| Airlines 0.3% |
| Alaska Air Group, Inc. (a) | 11,142 | 671,974 |
| Southwest Airlines Co. (a) | 21,534 | 1,143,240 |
| | | 1,815,214 |
| Automobiles 0.1% |
| General Motors Co. (a) | 13,575 | 803,233 |
| Banks 8.7% |
| Bank of America Corp. | 49,142 | 2,026,125 |
| Citizens Financial Group, Inc. | 48,400 | 2,220,108 |
| Fifth Third Bancorp | 219,794 | 8,402,724 |
| Huntington Bancshares, Inc. | 289,800 | 4,135,446 |
| JPMorgan Chase & Co. | 30,528 | 4,748,325 |
| PNC Financial Services Group, Inc. (The) | 24,426 | 4,659,504 |
| Wells Fargo & Co. | 448,665 | 20,320,038 |
| | | 46,512,270 |
| Beverages 0.6% |
| Coca-Cola Co. (The) | 55,472 | 3,001,590 |
| Biotechnology 2.3% |
| AbbVie, Inc. | 77,176 | 8,693,104 |
| Biogen, Inc. (a) | 5,300 | 1,835,231 |
| Gilead Sciences, Inc. | 28,745 | 1,979,381 |
| | | 12,507,716 |
| Capital Markets 4.9% |
| Bank of New York Mellon Corp. (The) | 59,437 | 3,044,958 |
| Charles Schwab Corp. (The) | 39,115 | 2,847,963 |
| Franklin Resources, Inc. | 42,460 | 1,358,295 |
| Goldman Sachs Group, Inc. (The) | 12,616 | 4,788,151 |
| Morgan Stanley | 88,383 | 8,103,837 |
| Raymond James Financial, Inc. | 24,395 | 3,168,911 |
| State Street Corp. | 35,280 | 2,902,838 |
| | | 26,214,953 |
| Chemicals 3.9% |
| Akzo Nobel NV | 15,889 | 1,963,168 |
| | Shares | Value |
| |
| Chemicals (continued) |
| CF Industries Holdings, Inc. | 184,038 | $ 9,468,755 |
| DuPont de Nemours, Inc. | 38,182 | 2,955,669 |
| International Flavors & Fragrances, Inc. | 38,731 | 5,786,411 |
| PPG Industries, Inc. | 5,722 | 971,424 |
| | | 21,145,427 |
| Commercial Services & Supplies 0.7% |
| Stericycle, Inc. (a) | 50,664 | 3,625,009 |
| Communications Equipment 0.9% |
| Cisco Systems, Inc. | 94,147 | 4,989,791 |
| Containers & Packaging 1.8% |
| International Paper Co. | 161,197 | 9,882,988 |
| Diversified Financial Services 1.1% |
| Equitable Holdings, Inc. | 198,243 | 6,036,499 |
| Diversified Telecommunication Services 0.5% |
| AT&T, Inc. | 56,137 | 1,615,623 |
| Verizon Communications, Inc. | 20,353 | 1,140,378 |
| | | 2,756,001 |
| Electric Utilities 3.6% |
| Edison International | 39,336 | 2,274,408 |
| Entergy Corp. | 15,074 | 1,502,878 |
| NextEra Energy, Inc. | 40,358 | 2,957,434 |
| Southern Co. (The) | 203,638 | 12,322,135 |
| | | 19,056,855 |
| Electronic Equipment, Instruments & Components 0.3% |
| TE Connectivity Ltd. | 11,800 | 1,595,478 |
| Energy Equipment & Services 0.4% |
| Halliburton Co. | 97,632 | 2,257,252 |
| Entertainment 0.9% |
| Walt Disney Co. (The) (a) | 26,592 | 4,674,076 |
| Equity Real Estate Investment Trusts 4.1% |
| CyrusOne, Inc. | 8,000 | 572,160 |
| Equity Residential | 95,389 | 7,344,953 |
| Rayonier, Inc. | 117,129 | 4,208,445 |
| Welltower, Inc. | 19,675 | 1,634,993 |
| Weyerhaeuser Co. | 240,141 | 8,265,653 |
| | | 22,026,204 |
The notes to the financial statements are an integral part of, and should be read in conjunction with, the financial statements.
11
Portfolio of Investments June 30, 2021† (Unaudited) (continued)
| | Shares | Value |
| Common Stocks (continued) |
| Food & Staples Retailing 0.4% |
| Walmart, Inc. | 15,132 | $ 2,133,915 |
| Food Products 3.1% |
| Bunge Ltd. | 13,270 | 1,037,050 |
| Conagra Brands, Inc. | 174,151 | 6,335,613 |
| Mondelez International, Inc., Class A | 4,163 | 259,938 |
| Tyson Foods, Inc., Class A | 120,247 | 8,869,419 |
| | | 16,502,020 |
| Health Care Equipment & Supplies 3.5% |
| Becton Dickinson and Co. | 32,731 | 7,959,852 |
| Medtronic plc | 66,808 | 8,292,877 |
| Zimmer Biomet Holdings, Inc. | 16,939 | 2,724,130 |
| | | 18,976,859 |
| Health Care Providers & Services 4.8% |
| Anthem, Inc. | 27,709 | 10,579,296 |
| Cardinal Health, Inc. | 30,000 | 1,712,700 |
| Centene Corp. (a) | 20,100 | 1,465,893 |
| Cigna Corp. | 11,915 | 2,824,689 |
| CVS Health Corp. | 84,942 | 7,087,561 |
| UnitedHealth Group, Inc. | 4,800 | 1,922,112 |
| | | 25,592,251 |
| Hotels, Restaurants & Leisure 1.1% |
| Las Vegas Sands Corp. (a) | 92,491 | 4,873,351 |
| McDonald's Corp. | 4,600 | 1,062,554 |
| | | 5,935,905 |
| Household Products 1.2% |
| Kimberly-Clark Corp. | 48,507 | 6,489,266 |
| Industrial Conglomerates 3.4% |
| 3M Co. | 5,900 | 1,171,917 |
| General Electric Co. | 1,159,655 | 15,608,956 |
| Siemens AG, Sponsored ADR (b) | 16,909 | 1,346,616 |
| | | 18,127,489 |
| Insurance 8.0% |
| American International Group, Inc. | 236,144 | 11,240,455 |
| Chubb Ltd. | 60,641 | 9,638,281 |
| Hartford Financial Services Group, Inc. (The) | 24,000 | 1,487,280 |
| Loews Corp. | 152,394 | 8,328,332 |
| Marsh & McLennan Cos., Inc. | 10,012 | 1,408,488 |
| MetLife, Inc. | 185,218 | 11,085,297 |
| | | 43,188,133 |
| | Shares | Value |
| |
| Leisure Products 0.7% |
| Mattel, Inc. (a) | 173,865 | $ 3,494,687 |
| Machinery 1.4% |
| Caterpillar, Inc. | 6,064 | 1,319,709 |
| Cummins, Inc. | 2,121 | 517,121 |
| Flowserve Corp. | 14,635 | 590,083 |
| PACCAR, Inc. | 21,789 | 1,944,668 |
| Snap-on, Inc. | 14,889 | 3,326,649 |
| | | 7,698,230 |
| Media 3.6% |
| Comcast Corp., Class A | 160,756 | 9,166,307 |
| Fox Corp., Class B | 104,891 | 3,692,163 |
| News Corp., Class A | 257,976 | 6,648,042 |
| | | 19,506,512 |
| Multiline Retail 0.8% |
| Kohl's Corp. | 73,921 | 4,073,786 |
| Multi-Utilities 3.6% |
| Ameren Corp. | 38,975 | 3,119,559 |
| Dominion Energy, Inc. | 22,600 | 1,662,682 |
| NiSource, Inc. | 264,683 | 6,484,733 |
| Sempra Energy | 59,987 | 7,947,078 |
| | | 19,214,052 |
| Oil, Gas & Consumable Fuels 5.8% |
| Chevron Corp. | 11,149 | 1,167,746 |
| ConocoPhillips | 9,095 | 553,885 |
| EOG Resources, Inc. | 71,734 | 5,985,485 |
| Exxon Mobil Corp. | 78,995 | 4,983,004 |
| Hess Corp. | 6,780 | 592,030 |
| Occidental Petroleum Corp. | 36,463 | 1,140,198 |
| Targa Resources Corp. | 35,711 | 1,587,354 |
| TC Energy Corp. | 83,557 | 4,137,743 |
| TotalEnergies SE (b) | 202,899 | 9,179,616 |
| TotalEnergies SE, Sponsored ADR | 39,600 | 1,792,296 |
| | | 31,119,357 |
| Pharmaceuticals 3.7% |
| AstraZeneca plc, Sponsored ADR (b) | 23,100 | 1,383,690 |
| GlaxoSmithKline plc | 49,432 | 970,576 |
| Johnson & Johnson | 39,794 | 6,555,663 |
| Merck & Co., Inc. | 32,811 | 2,551,711 |
| Organon & Co. (a) | 2,381 | 72,049 |
| Pfizer, Inc. | 119,899 | 4,695,245 |
| Sanofi | 29,773 | 3,119,403 |
The notes to the financial statements are an integral part of, and should be read in conjunction with, the financial statements.
| 12 | MainStay VP T. Rowe Price Equity Income Portfolio |
| | Shares | Value |
| Common Stocks (continued) |
| Pharmaceuticals (continued) |
| Sanofi, ADR | 13,763 | $ 724,760 |
| | | 20,073,097 |
| Professional Services 0.8% |
| Nielsen Holdings plc | 163,561 | 4,035,050 |
| Semiconductors & Semiconductor Equipment 5.4% |
| Applied Materials, Inc. | 49,315 | 7,022,456 |
| NXP Semiconductors NV | 11,002 | 2,263,331 |
| QUALCOMM, Inc. | 94,063 | 13,444,425 |
| Texas Instruments, Inc. | 31,346 | 6,027,836 |
| | | 28,758,048 |
| Software 2.3% |
| Citrix Systems, Inc. | 39,602 | 4,644,126 |
| Microsoft Corp. | 28,061 | 7,601,725 |
| | | 12,245,851 |
| Specialty Retail 0.6% |
| TJX Cos., Inc. (The) | 44,459 | 2,997,426 |
| Tobacco 1.6% |
| Altria Group, Inc. | 39,916 | 1,903,195 |
| Philip Morris International, Inc. | 69,051 | 6,843,644 |
| | | 8,746,839 |
Total Common Stocks
(Cost $368,440,788) | | 516,227,487 |
| Convertible Preferred Stocks 1.1% |
| Electric Utilities 0.7% |
| NextEra Energy, Inc., 5.28% | 33,097 | 1,620,429 |
| Southern Co. (The), 6.75% | 41,886 | 2,120,689 |
| | | 3,741,118 |
| Multi-Utilities 0.4% |
| NiSource, Inc., 7.75% | 15,018 | 1,543,700 |
| Sempra Energy, 6.75% | 8,631 | 852,484 |
| | | 2,396,184 |
Total Convertible Preferred Stocks
(Cost $6,077,176) | | 6,137,302 |
| | Shares | | Value |
| Preferred Stocks 1.5% |
| Automobiles 1.1% |
| Volkswagen AG ADR (zero coupon) | 245,092 | | $ 6,137,103 |
| Health Care Equipment & Supplies 0.4% |
| Becton Dickinson and Co., 6.00% | 37,419 | | 2,002,291 |
Total Preferred Stocks
(Cost $5,800,535) | | | 8,139,394 |
| Short-Term Investments 1.4% |
| Affiliated Investment Company 1.1% |
| MainStay U.S. Government Liquidity Fund, 0.01% (c) | 5,773,973 | | 5,773,973 |
| Unaffiliated Investment Company 0.3% |
| Wells Fargo Government Money Market Fund, 0.025% (c)(d) | 1,599,035 | | 1,599,035 |
Total Short-Term Investments
(Cost $7,373,008) | | | 7,373,008 |
Total Investments
(Cost $387,691,507) | 100.2% | | 537,877,191 |
| Other Assets, Less Liabilities | (0.2) | | (1,238,117) |
| Net Assets | 100.0% | | $ 536,639,074 |
| † | Percentages indicated are based on Portfolio net assets. |
| (a) | Non-income producing security. |
| (b) | All or a portion of this security was held on loan. As of June 30, 2021, the aggregate market value of securities on loan was $10,897,789; the total market value of collateral held by the Portfolio was $11,713,516. The market value of the collateral held included non-cash collateral in the form of U.S. Treasury securities with a value of $10,114,481. The Portfolio received cash collateral with a value of $1,599,035. (See Note 2(I)) |
| (c) | Current yield as of June 30, 2021. |
| (d) | Represents a security purchased with cash collateral received for securities on loan. |
| Abbreviation(s): |
| ADR—American Depositary Receipt |
The notes to the financial statements are an integral part of, and should be read in conjunction with, the financial statements.
13
Portfolio of Investments June 30, 2021† (Unaudited) (continued)
The following is a summary of the fair valuations according to the inputs used as of June 30, 2021, for valuing the Portfolio’s assets:
| Description | Quoted
Prices in
Active
Markets for
Identical
Assets
(Level 1) | | Significant
Other
Observable
Inputs
(Level 2) | | Significant
Unobservable
Inputs
(Level 3) | | Total |
| Asset Valuation Inputs | | | | | | | |
| Investments in Securities (a) | | | | | | | |
| Common Stocks | $ 516,227,487 | | $ — | | $ — | | $ 516,227,487 |
| Convertible Preferred Stocks | 6,137,302 | | — | | — | | 6,137,302 |
| Preferred Stocks | 8,139,394 | | — | | — | | 8,139,394 |
| Short-Term Investments | | | | | | | |
| Affiliated Investment Company | 5,773,973 | | — | | — | | 5,773,973 |
| Unaffiliated Investment Company | 1,599,035 | | — | | — | | 1,599,035 |
| Total Short-Term Investments | 7,373,008 | | — | | — | | 7,373,008 |
| Total Investments in Securities | $ 537,877,191 | | $ — | | $ — | | $ 537,877,191 |
| (a) | For a complete listing of investments and their industries, see the Portfolio of Investments. |
The notes to the financial statements are an integral part of, and should be read in conjunction with, the financial statements.
| 14 | MainStay VP T. Rowe Price Equity Income Portfolio |
Statement of Assets and Liabilities as of June 30, 2021 (Unaudited)
| Assets |
Investment in unaffiliated securities, at value
(identified cost $381,917,534) including securities on loan of $10,897,789 | $532,103,218 |
Investment in affiliated investment companies, at value
(identified cost $5,773,973) | 5,773,973 |
| Receivables: | |
| Investment securities sold | 1,448,636 |
| Dividends and interest | 795,524 |
| Securities lending | 2,163 |
| Other assets | 5,691 |
| Total assets | 540,129,205 |
| Liabilities |
| Cash collateral received for securities on loan | 1,599,035 |
| Payables: | |
| Investment securities purchased | 1,287,020 |
| Manager (See Note 3) | 323,979 |
| Portfolio shares redeemed | 115,092 |
| Shareholder communication | 52,976 |
| NYLIFE Distributors (See Note 3) | 48,768 |
| Professional fees | 44,693 |
| Custodian | 17,111 |
| Trustees | 101 |
| Accrued expenses | 1,356 |
| Total liabilities | 3,490,131 |
| Net assets | $536,639,074 |
| Composition of Net Assets |
| Shares of beneficial interest outstanding (par value of $.001 per share) unlimited number of shares authorized | $ 39,310 |
| Additional paid-in-capital | 333,549,114 |
| | 333,588,424 |
| Total distributable earnings (loss) | 203,050,650 |
| Net assets | $536,639,074 |
| Initial Class | |
| Net assets applicable to outstanding shares | $303,952,371 |
| Shares of beneficial interest outstanding | 22,216,330 |
| Net asset value per share outstanding | $ 13.68 |
| Service Class | |
| Net assets applicable to outstanding shares | $232,686,703 |
| Shares of beneficial interest outstanding | 17,093,590 |
| Net asset value per share outstanding | $ 13.61 |
The notes to the financial statements are an integral part of, and should be read in conjunction with, the financial statements.
15
Statement of Operations for the six months ended June 30, 2021 (Unaudited)
| Investment Income (Loss) |
| Income | |
| Dividends-unaffiliated (net of foreign tax withholding of $146,720) | $ 6,491,690 |
| Interest | 34,060 |
| Securities lending | 7,025 |
| Dividends-affiliated | 230 |
| Other | 1,347 |
| Total income | 6,534,352 |
| Expenses | |
| Manager (See Note 3) | 1,942,172 |
| Distribution/Service—Service Class (See Note 3) | 293,243 |
| Professional fees | 46,979 |
| Shareholder communication | 28,982 |
| Custodian | 14,661 |
| Trustees | 5,698 |
| Miscellaneous | 10,424 |
| Total expenses | 2,342,159 |
| Net investment income (loss) | 4,192,193 |
| Realized and Unrealized Gain (Loss) |
| Net realized gain (loss) on: | |
| Unaffiliated investment transactions | 36,982,411 |
| Foreign currency transactions | 7,492 |
| Net realized gain (loss) | 36,989,903 |
| Net change in unrealized appreciation (depreciation) on: | |
| Unaffiliated investments | 49,923,251 |
| Translation of other assets and liabilities in foreign currencies | (1,321) |
| Net change in unrealized appreciation (depreciation) | 49,921,930 |
| Net realized and unrealized gain (loss) | 86,911,833 |
| Net increase (decrease) in net assets resulting from operations | $91,104,026 |
The notes to the financial statements are an integral part of, and should be read in conjunction with, the financial statements.
| 16 | MainStay VP T. Rowe Price Equity Income Portfolio |
Statements of Changes in Net Assets
for the six months ended June 30, 2021 (Unaudited) and the year ended December 31, 2020
| | 2021 | 2020 |
| Increase (Decrease) in Net Assets |
| Operations: | | |
| Net investment income (loss) | $ 4,192,193 | $ 12,775,127 |
| Net realized gain (loss) | 36,989,903 | 2,096,702 |
| Net change in unrealized appreciation (depreciation) | 49,921,930 | (30,283,571) |
| Net increase (decrease) in net assets resulting from operations | 91,104,026 | (15,411,742) |
| Distributions to shareholders: | | |
| Initial Class | — | (35,016,325) |
| Service Class | — | (22,876,840) |
| Total distributions to shareholders | — | (57,893,165) |
| Capital share transactions: | | |
| Net proceeds from sales of shares | 740,397 | 38,760,574 |
| Net asset value of shares issued to shareholder in reinvestment of distributions | — | 57,893,165 |
| Cost of shares redeemed | (84,625,285) | (220,766,449) |
| Increase (decrease) in net assets derived from capital share transactions | (83,884,888) | (124,112,710) |
| Net increase (decrease) in net assets | 7,219,138 | (197,417,617) |
| Net Assets |
| Beginning of period | 529,419,936 | 726,837,553 |
| End of period | $536,639,074 | $ 529,419,936 |
The notes to the financial statements are an integral part of, and should be read in conjunction with, the financial statements.
17
Financial Highlights selected per share data and ratios
| | Six months ended
June 30,
2021* | | Year Ended December 31, |
| Initial Class | 2020 | | 2019 | | 2018 | | 2017 | | 2016 |
| Net asset value at beginning of period | $ 11.56 | | $ 12.89 | | $ 11.39 | | $ 14.10 | | $ 12.99 | | $ 11.97 |
| Net investment income (loss) (a) | 0.11 | | 0.25 | | 0.29 | | 0.29 | | 0.24 | | 0.27 |
| Net realized and unrealized gain (loss) on investments | 2.01 | | (0.33) | | 2.58 | | (1.40) | | 1.83 | | 1.90 |
| Net realized and unrealized gain (loss) on foreign currency transactions‡ | 0.00 | | 0.00 | | 0.00 | | (0.00) | | 0.00 | | (0.00) |
| Total from investment operations | 2.12 | | (0.08) | | 2.87 | | (1.11) | | 2.07 | | 2.17 |
| Less distributions: | | | | | | | | | | | |
| From net investment income | — | | (0.40) | | (0.31) | | (0.29) | | (0.30) | | (0.25) |
| From net realized gain on investments | — | | (0.85) | | (1.06) | | (1.31) | | (0.66) | | (0.90) |
| Total distributions | — | | (1.25) | | (1.37) | | (1.60) | | (0.96) | | (1.15) |
| Net asset value at end of period | $ 13.68 | | $ 11.56 | | $ 12.89 | | $ 11.39 | | $ 14.10 | | $ 12.99 |
| Total investment return (b) | 18.34%(c) | | 0.96% | | 26.36%(d) | | (9.38)% | | 16.20% | | 18.82% |
| Ratios (to average net assets)/Supplemental Data: | | | | | | | | | | | |
| Net investment income (loss) | 1.67%†† | | 2.32% | | 2.30% | | 2.11% | | 1.78% | | 2.18% |
| Net expenses (e) | 0.76%†† | | 0.76% | | 0.75% | | 0.77% | | 0.77% | | 0.78% |
| Portfolio turnover rate | 9% | | 28% | | 16% | | 22% | | 24% | | 23% |
| Net assets at end of period (in 000’s) | $ 303,952 | | $ 302,584 | | $ 464,120 | | $ 431,672 | | $ 469,556 | | $ 472,125 |
| * | Unaudited. |
| ‡ | Less than one cent per share. |
| †† | Annualized. |
| (a) | Per share data based on average shares outstanding during the period. |
| (b) | Total return does not reflect any deduction of sales charges, mortality and expense charges, contract charges or administrative charges. For periods of less than one year, total return is not annualized. |
| (c) | Total investment return may reflect adjustments to conform to generally accepted accounting principles. |
| (d) | In 2019, the Portfolio’s total investment return includes impact of payments from affiliates due to trade communications error. Excluding these items, total return would have been 26.36%. |
| (e) | In addition to the fees and expenses which the Portfolio bears directly, it also indirectly bears a pro-rata share of the fees and expenses of the underlying funds in which it invests. Such indirect expenses are not included in the above expense ratios. |
The notes to the financial statements are an integral part of, and should be read in conjunction with, the financial statements.
| 18 | MainStay VP T. Rowe Price Equity Income Portfolio |
Financial Highlights selected per share data and ratios
| | Six months ended
June 30,
2021* | | Year Ended December 31, |
| Service Class | 2020 | | 2019 | | 2018 | | 2017 | | 2016 |
| Net asset value at beginning of period | $ 11.51 | | $ 12.83 | | $ 11.34 | | $ 14.04 | | $ 12.94 | | $ 11.93 |
| Net investment income (loss) (a) | 0.09 | | 0.22 | | 0.26 | | 0.25 | | 0.21 | | 0.24 |
| Net realized and unrealized gain (loss) on investments | 2.01 | | (0.33) | | 2.56 | | (1.39) | | 1.82 | | 1.89 |
| Net realized and unrealized gain (loss) on foreign currency transactions‡ | 0.00 | | 0.00 | | 0.00 | | (0.00) | | 0.00 | | (0.00) |
| Total from investment operations | 2.10 | | (0.11) | | 2.82 | | (1.14) | | 2.03 | | 2.13 |
| Less distributions: | | | | | | | | | | | |
| From net investment income | — | | (0.36) | | (0.27) | | (0.25) | | (0.27) | | (0.22) |
| From net realized gain on investments | — | | (0.85) | | (1.06) | | (1.31) | | (0.66) | | (0.90) |
| Total distributions | — | | (1.21) | | (1.33) | | (1.56) | | (0.93) | | (1.12) |
| Net asset value at end of period | $ 13.61 | | $ 11.51 | | $ 12.83 | | $ 11.34 | | $ 14.04 | | $ 12.94 |
| Total investment return (b) | 18.25%(c) | | 0.71% | | 26.04%(d) | | (9.61)% | | 15.91% | | 18.53% |
| Ratios (to average net assets)/Supplemental Data: | | | | | | | | | | | |
| Net investment income (loss) | 1.42%†† | | 2.05% | | 2.05% | | 1.84% | | 1.54% | | 1.93% |
| Net expenses (e) | 1.01%†† | | 1.01% | | 1.00% | | 1.02% | | 1.02% | | 1.03% |
| Portfolio turnover rate | 9% | | 28% | | 16% | | 22% | | 24% | | 23% |
| Net assets at end of period (in 000’s) | $ 232,687 | | $ 226,836 | | $ 262,717 | | $ 257,159 | | $ 348,450 | | $ 318,059 |
| * | Unaudited. |
| ‡ | Less than one cent per share. |
| †† | Annualized. |
| (a) | Per share data based on average shares outstanding during the period. |
| (b) | Total return does not reflect any deduction of sales charges, mortality and expense charges, contract charges or administrative charges. For periods of less than one year, total return is not annualized. |
| (c) | Total investment return may reflect adjustments to conform to generally accepted accounting principles. |
| (d) | In 2019, the Portfolio’s total investment return includes impact of payments from affiliates due to trade communications error. Excluding these items, total return would have been 26.04%. |
| (e) | In addition to the fees and expenses which the Portfolio bears directly, it also indirectly bears a pro-rata share of the fees and expenses of the underlying funds in which it invests. Such indirect expenses are not included in the above expense ratios. |
The notes to the financial statements are an integral part of, and should be read in conjunction with, the financial statements.
19
Notes to Financial Statements (Unaudited)
Note 1–Organization and Business
MainStay VP Funds Trust (the “Fund”) was organized as a Delaware statutory trust on February 1, 2011. The Fund is registered under the Investment Company Act of 1940, as amended (the “1940 Act”), as an open-end management investment company. The Fund is comprised of thirty-one separate series (collectively referred to as the “Portfolios”). These financial statements and notes relate to the MainStay VP T. Rowe Price Equity Income Portfolio (the "Portfolio"), a "diversified” portfolio, as that term is defined in the 1940 Act, as interpreted or modified by regulatory authorities having jurisdiction, from time to time.
Shares of the Portfolio are currently offered to certain separate accounts to fund variable annuity policies and variable universal life insurance policies issued by New York Life Insurance and Annuity Corporation (“NYLIAC”), a wholly-owned subsidiary of New York Life Insurance Company (“New York Life”) and may also be offered to fund variable annuity policies and variable universal life insurance policies issued by other insurance companies. NYLIAC allocates shares of the Portfolios to, among others, certain NYLIAC separate accounts. Shares of the Portfolio are also offered to the MainStay VP Conservative Allocation Portfolio, MainStay VP Moderate Allocation Portfolio, MainStay VP Growth Allocation Portfolio (formerly known as MainStay VP Moderate Growth Allocation Portfolio) and MainStay VP Equity Allocation Portfolio (formerly known as MainStay VP Growth Allocation Portfolio), which operate as “funds-of-funds," and other variable insurance funds.
The following table lists the Portfolio's share classes that have been registered and commenced operations:
| Class | Commenced Operations |
| Initial Class | February 17, 2012 |
| Service Class | February 17, 2012 |
Shares of the Portfolio are offered and are redeemed at a price equal to their respective net asset value (“NAV”) per share. No sales or redemption charge is applicable to the purchase or redemption of the Portfolio's shares. Under the terms of the Fund’s multiple class plan, adopted pursuant to Rule 18f-3 under the 1940 Act, the classes differ in that, among other things, Service Class shares of the Portfolio pay a combined distribution and service fee of 0.25% of average daily net assets attributable to Service Class shares of the Portfolio to the Distributor (as defined in Note 3(B)) pursuant to a plan adopted in accordance with Rule 12b-1 under the 1940 Act. Contract owners of variable annuity contracts purchased after June 2, 2003, are permitted to invest only in the Service Class shares.
The Portfolio's investment objective is to seek a high level of dividend income and long-term capital growth primarily through investments in stocks.
Note 2–Significant Accounting Policies
The Portfolio is an investment company and accordingly follows the investment company accounting and reporting guidance of the Financial Accounting Standards Board (“FASB”) Accounting Standard Codification Topic 946 Financial Services—Investment Companies. The Portfolio prepares its financial statements in accordance with generally accepted accounting principles (“GAAP”) in the United States of America and follows the significant accounting policies described below.
(A) Securities Valuation. Investments are usually valued as of the close of regular trading on the New York Stock Exchange (the "Exchange") (usually 4:00 p.m. Eastern time) on each day the Portfolio is open for business ("valuation date").
The Board of Trustees of the Fund (the "Board") adopted procedures establishing methodologies for the valuation of the Portfolio's securities and other assets and delegated the responsibility for valuation determinations under those procedures to the Valuation Committee of the Fund (the “Valuation Committee”). The procedures state that, subject to the oversight of the Board and unless otherwise noted, the responsibility for the day-to-day valuation of portfolio assets (including fair value measurements for the Portfolio's assets and liabilities) rests with New York Life Investment Management LLC (“New York Life Investments” or the "Manager"), aided to whatever extent necessary by the Subadvisor (as defined in Note 3(A)). To assess the appropriateness of security valuations, the Manager, the Subadvisor or the Portfolio's third-party service provider, who is subject to oversight by the Manager, regularly compares prior day prices, prices on comparable securities and the sale prices to the prior and current day prices and challenges prices with changes exceeding certain tolerance levels with third-party pricing services or broker sources.
The Board authorized the Valuation Committee to appoint a Valuation Subcommittee (the “Subcommittee”) to establish the prices of securities for which market quotations are not readily available or the prices of which are not otherwise readily determinable under the procedures. The Subcommittee meets (in person, via electronic mail or via teleconference) on an as-needed basis. The Valuation Committee meets to ensure that actions taken by the Subcommittee were appropriate.
For those securities valued through either a standardized fair valuation methodology or a fair valuation measurement, the Subcommittee deals with such valuation and the Valuation Committee reviews and affirms, if appropriate, the reasonableness of the valuation based on such methodologies and measurements on a regular basis after considering information that is reasonably available and deemed relevant by the Valuation Committee. Any action taken by the Subcommittee with respect to the valuation of a portfolio security or other asset is submitted for review and ratification (if appropriate) to the Valuation Committee and the Board at the next regularly scheduled meeting.
"Fair value" is defined as the price the Portfolio would reasonably expect to receive upon selling an asset or liability in an orderly transaction to an independent buyer in the principal or most advantageous market for the
| 20 | MainStay VP T. Rowe Price Equity Income Portfolio |
asset or liability. Fair value measurements are determined within a framework that establishes a three-tier hierarchy that maximizes the use of observable market data and minimizes the use of unobservable inputs to establish a classification of fair value measurements for disclosure purposes. "Inputs" refer broadly to the assumptions that market participants would use in pricing the asset or liability, including assumptions about risk, such as the risk inherent in a particular valuation technique used to measure fair value using a pricing model and/or the risk inherent in the inputs for the valuation technique. Inputs may be observable or unobservable. Observable inputs reflect the assumptions market participants would use in pricing the asset or liability based on market data obtained from sources independent of the Portfolio. Unobservable inputs reflect the Portfolio’s own assumptions about the assumptions market participants would use in pricing the asset or liability based on the information available. The inputs or methodology used for valuing assets or liabilities may not be an indication of the risks associated with investing in those assets or liabilities. The three-tier hierarchy of inputs is summarized below.
| • | Level 1—quoted prices in active markets for an identical asset or liability |
| • | Level 2—other significant observable inputs (including quoted prices for a similar asset or liability in active markets, interest rates and yield curves, prepayment speeds, credit risk, etc.) |
| • | Level 3—significant unobservable inputs (including the Portfolio's own assumptions about the assumptions that market participants would use in measuring fair value of an asset or liability) |
The level of an asset or liability within the fair value hierarchy is based on the lowest level of an input, both individually and in the aggregate, that is significant to the fair value measurement. The aggregate value by input level of the Portfolio’s assets and liabilities as of June 30, 2021, is included at the end of the Portfolio of Investments.
The Portfolio may use third-party vendor evaluations, whose prices may be derived from one or more of the following standard inputs, among others:
| • Benchmark yields | • Reported trades |
| • Broker/dealer quotes | • Issuer spreads |
| • Two-sided markets | • Benchmark securities |
| • Bids/offers | • Reference data (corporate actions or material event notices) |
| • Industry and economic events | • Comparable bonds |
| • Monthly payment information | |
An asset or liability for which market values cannot be measured using the methodologies described above is valued by methods deemed reasonable in good faith by the Valuation Committee, following the procedures established by the Board, to represent fair value. Under these procedures, the Portfolio generally uses a market-based approach which may use related or comparable assets or liabilities, recent transactions, market multiples, book values and other relevant information. The
Portfolio may also use an income-based valuation approach in which the anticipated future cash flows of the asset or liability are discounted to calculate fair value. Discounts may also be applied due to the nature and/or duration of any restrictions on the disposition of the asset or liability. Fair value represents a good faith approximation of the value of a security. Fair value determinations involve the consideration of a number of subjective factors, an analysis of applicable facts and circumstances and the exercise of judgment. As a result, it is possible that the fair value for a security determined in good faith in accordance with the Portfolio's valuation procedures may differ from valuations for the same security determined by other funds using their own valuation procedures. Although the Portfolio's valuation procedures are designed to value a security at the price the Portfolio may reasonably expect to receive upon the security's sale in an orderly transaction, there can be no assurance that any fair value determination thereunder would, in fact, approximate the amount that the Portfolio would actually realize upon the sale of the security or the price at which the security would trade if a reliable market price were readily available. During the six-month period ended June 30, 2021, there were no material changes to the fair value methodologies.
Securities which may be valued in this manner include, but are not limited to: (i) a security for which trading has been halted or suspended; (ii) a debt security that has recently gone into default and for which there is not a current market quotation; (iii) a security of an issuer that has entered into a restructuring; (iv) a security that has been delisted from a national exchange; (v) a security for which the market price is not readily available from a third-party pricing source or, if so provided, does not, in the opinion of the Manager or the Subadvisor, reflect the security's market value; (vi) a security subject to trading collars for which no or limited trading takes place; and (vii) a security whose principal market has been temporarily closed at a time when, under normal conditions, it would be open. Securities valued in this manner are generally categorized as Level 3 in the hierarchy. No securities held by the Portfolio as of June 30, 2021 were fair valued in such a manner.
Certain securities held by the Portfolio may principally trade in foreign markets. Events may occur between the time the foreign markets close and the time at which the Portfolio's NAVs are calculated. These events may include, but are not limited to, situations relating to a single issuer in a market sector, significant fluctuations in U.S. or foreign markets, natural disasters, armed conflicts, governmental actions or other developments not tied directly to the securities markets. Should the Manager or the Subadvisor conclude that such events may have affected the accuracy of the last price of such securities reported on the local foreign market, the Subcommittee may, pursuant to procedures adopted by the Board, adjust the value of the local price to reflect the estimated impact on the price of such securities as a result of such events. In this instance, securities are generally categorized as Level 3 in the hierarchy. Additionally, certain foreign equity securities are also fair valued whenever the movement of a particular index exceeds certain thresholds. In such cases, the securities are fair valued by applying factors provided by a third-party vendor in accordance with valuation procedures adopted by the Board and are generally categorized as Level 2 in the hierarchy. No foreign equity
Notes to Financial Statements (Unaudited) (continued)
securities held by the Portfolio as of June 30, 2021 were fair valued in such a manner.
Equity securities are valued at the last quoted sales prices as of the close of regular trading on the relevant exchange on each valuation date. Securities that are not traded on the valuation date are valued at the mean of the last quoted bid and ask prices. Prices are normally taken from the principal market in which each security trades. These securities are generally categorized as Level 1 in the hierarchy.
Investments in mutual funds, including money market funds, are valued at their respective NAVs at the close of business each day on the valuation date. These securities are generally categorized as Level 1 in the hierarchy.
Temporary cash investments acquired in excess of 60 days to maturity at the time of purchase are valued using the latest bid prices or using valuations based on a matrix system (which considers such factors as security prices, yields, maturities and ratings), both as furnished by independent pricing services. Temporary cash investments that mature in 60 days or less at the time of purchase ("Short-Term Investments") are valued using the amortized cost method of valuation, unless the use of such method would be inappropriate. The amortized cost method involves valuing a security at its cost on the date of purchase and thereafter assuming a constant amortization to maturity of the difference between such cost and the value on maturity date. Amortized cost approximates the current fair value of a security. Securities valued using the amortized cost method are not valued using quoted prices in an active market and are generally categorized as Level 2 in the hierarchy.
The information above is not intended to reflect an exhaustive list of the methodologies that may be used to value portfolio investments. The valuation procedures permit the use of a variety of valuation methodologies in connection with valuing portfolio investments. The methodology used for a specific type of investment may vary based on the market data available or other considerations. The methodologies summarized above may not represent the specific means by which portfolio investments are valued on any particular business day.
(B) Income Taxes. The Portfolio's policy is to comply with the requirements of the Internal Revenue Code of 1986, as amended (the “Internal Revenue Code”), applicable to regulated investment companies and to distribute all of its taxable income to the shareholders of the Portfolio within the allowable time limits.
The Manager evaluates the Portfolio’s tax positions to determine if the tax positions taken meet the minimum recognition threshold in connection with accounting for uncertainties in income tax positions taken or expected to be taken for the purposes of measuring and recognizing tax liabilities in the financial statements. Recognition of tax benefits of an uncertain tax position is permitted only to the extent the position is “more likely than not” to be sustained assuming examination by taxing authorities. The Manager analyzed the Portfolio's tax positions taken on federal, state and local income tax returns for all open tax years (for up to three tax years) and has concluded that no provisions for federal, state
and local income tax are required in the Portfolio's financial statements. The Portfolio's federal, state and local income tax and federal excise tax returns for tax years for which the applicable statutes of limitations have not expired are subject to examination by the Internal Revenue Service and state and local departments of revenue.
(C) Foreign Taxes. The Portfolio may be subject to foreign taxes on income and other transaction-based taxes imposed by certain countries in which it invests. A portion of the taxes on gains on investments or currency purchases/repatriation may be reclaimable. The Portfolio will accrue such taxes and reclaims as applicable, based upon its current interpretation of tax rules and regulations that exist in the markets in which it invests.
The Portfolio may be subject to taxation on realized capital gains, repatriation proceeds and other transaction-based taxes imposed by certain countries in which it invests. The Portfolio will accrue such taxes as applicable based upon its current interpretation of tax rules and regulations that exist in the market in which it invests. Capital gains taxes relating to positions still held are reflected as a liability in the Statement of Assets and Liabilities, as well as an adjustment to the Portfolio's net unrealized appreciation (depreciation). Taxes related to capital gains realized, if any, are reflected as part of net realized gain (loss) in the Statement of Operations. Changes in tax liabilities related to capital gains taxes on unrealized investment gains, if any, are reflected as part of the change in net unrealized appreciation (depreciation) on investments in the Statement of Operations. Transaction-based charges are generally assessed as a percentage of the transaction amount.
(D) Dividends and Distributions to Shareholders. Dividends and distributions are recorded on the ex-dividend date. The Portfolio intends to declare and pay dividends from net investment income and distributions from net realized capital and currency gains, if any, at least annually. Unless a shareholder elects otherwise, all dividends and distributions are reinvested at NAV in the same class of shares of the Portfolio. Dividends and distributions to shareholders are determined in accordance with federal income tax regulations and may differ from determinations using GAAP.
(E) Security Transactions and Investment Income. The Portfolio records security transactions on the trade date. Realized gains and losses on security transactions are determined using the identified cost method. Dividend income is recognized on the ex-dividend date, net of any foreign tax withheld at the source, and interest income is accrued as earned using the effective interest rate method and includes any realized gains and losses from repayments of principal on mortgage-backed securities. Distributions received from real estate investment trusts may be classified as dividends, capital gains and/or return of capital. Discounts and premiums on securities purchased for the Portfolio are accreted and amortized, respectively, on the effective interest rate method.
Investment income and realized and unrealized gains and losses on investments of the Portfolio are allocated pro rata to the separate classes
| 22 | MainStay VP T. Rowe Price Equity Income Portfolio |
of shares based upon their relative net assets on the date the income is earned or realized and unrealized gains and losses are incurred.
(F) Expenses. Expenses of the Fund are allocated to the individual Portfolios in proportion to the net assets of the respective Portfolios when the expenses are incurred, except where direct allocations of expenses can be made. Expenses (other than fees incurred under the distribution and service plans, further discussed in Note 3(B), which are charged directly to the Service Class shares) are allocated to separate classes of shares pro rata based upon their relative net assets on the date the expenses are incurred. The expenses borne by the Portfolio, including those of related parties to the Portfolio, are shown in the Statement of Operations.
Additionally, the Portfolio may invest in mutual funds, which are subject to management fees and other fees that may cause the costs of investing in mutual funds to be greater than the costs of owning the underlying securities directly. These indirect expenses of mutual funds are not included in the amounts shown as expenses in the Statement of Operations or in the expense ratios included in the Financial Highlights.
(G) Use of Estimates. In preparing financial statements in conformity with GAAP, the Manager makes estimates and assumptions that affect the reported amounts and disclosures in the financial statements. Actual results could differ from those estimates and assumptions.
(H) Foreign Currency Transactions. The Portfolio's books and records are maintained in U.S. dollars. Prices of securities denominated in foreign currency amounts are translated into U.S. dollars at the mean between the buying and selling rates last quoted by any major U.S. bank at the following dates:
(i) market value of investment securities, other assets and liabilities— at the valuation date; and
(ii) purchases and sales of investment securities, income and expenses—at the date of such transactions.
The assets and liabilities that are denominated in foreign currency amounts are presented at the exchange rates and market values at the close of the period. The realized and unrealized changes in net assets arising from fluctuations in exchange rates and market prices of securities are not separately presented.
Net realized gain (loss) on foreign currency transactions represents net currency gains or losses realized as a result of differences between the amounts of securities sale proceeds or purchase cost, dividends, interest and withholding taxes as recorded on the Portfolio's books, and the U.S. dollar equivalent amount actually received or paid. Net currency gains or losses from valuing such foreign currency denominated assets and liabilities, other than investments at valuation date exchange rates, are reflected in unrealized foreign exchange gains or losses.
(I) Securities Lending. In order to realize additional income, the Portfolio may engage in securities lending, subject to the limitations set forth in the 1940 Act and relevant guidance by the staff of the Securities
and Exchange Commission (“SEC”). If the Portfolio engages in securities lending, the Portfolio will lend through its custodian, JPMorgan Chase Bank, N.A., ("JPMorgan"), acting as securities lending agent on behalf of the Portfolio. Under the current arrangement, JPMorgan will manage the Portfolio's collateral in accordance with the securities lending agency agreement between the Portfolio and JPMorgan, and indemnify the Portfolio against counterparty risk. The loans will be collateralized by cash (which may be invested in a money market fund) and/or non-cash collateral (which may include U.S. Treasury securities and/or U.S. government agency securities issued or guaranteed by the United States government or its agencies or instrumentalities) at least equal at all times to the market value of the securities loaned. The Portfolio bears the risk of delay in recovery of, or loss of rights in, the securities loaned. The Portfolio may also record a realized gain or loss on securities deemed sold due to a borrower’s inability to return securities on loan. The Portfolio bears the risk of any loss on investment of cash collateral. The Portfolio will receive compensation for lending its securities in the form of fees or it will retain a portion of interest earned on the investment of any cash collateral. The Portfolio will also continue to receive interest and dividends on the securities loaned and any gain or loss in the market price of the securities loaned that may occur during the term of the loan will be for the account of the Portfolio. Income earned from securities lending activities, if any, is reflected in the Statement of Operations. Securities on loan as of June 30, 2021, are shown in the Portfolio of Investments.
Prior to February 22, 2021, these services were provided by State Street Bank and Trust Company (“State Street”).
(J) Securities Risk. The ability of issuers of debt securities held by the Portfolio to meet their obligations may be affected by, among other things, economic or political developments in a specific country, industry or region. Debt securities are also subject to the risks associated with changes in interest rates.
Convertible securities may be subordinate to other securities. In part, the total return for a convertible security depends upon the performance of the underlying stock into which it can be converted. Also, issuers of convertible securities are often not as strong financially as those issuing securities with higher credit ratings, are more likely to encounter financial difficulties and typically are more vulnerable to changes in the economy, such as a recession or a sustained period of rising interest rates, which could affect their ability to make interest and principal payments.
The Portfolio invests in foreign securities, which carry certain risks that are in addition to the usual risks inherent in domestic securities. These risks include those resulting from currency fluctuations, future adverse political or economic developments and possible imposition of currency exchange blockages or other foreign governmental laws or restrictions. These risks are likely to be greater in emerging markets than in developed markets. The ability of issuers of securities held by the Portfolio to meet their obligations may be affected by, among other things, economic or political developments in a specific country, industry or region.
Notes to Financial Statements (Unaudited) (continued)
(K) Indemnifications. Under the Fund’s organizational documents, its officers and trustees are indemnified against certain liabilities that may arise out of performance of their duties to the Fund. Additionally, in the normal course of business, the Portfolio enters into contracts with third-party service providers that contain a variety of representations and warranties and that may provide general indemnifications. The Portfolio's maximum exposure under these arrangements is unknown, as this would involve future claims that may be made against the Portfolio that have not yet occurred. The Manager believes that the risk of loss in connection with these potential indemnification obligations is remote. However, there can be no assurance that material liabilities related to such obligations will not arise in the future, which could adversely impact the Portfolio.
Note 3–Fees and Related Party Transactions
(A) Manager and Subadvisor. New York Life Investments, a registered investment adviser and an indirect, wholly-owned subsidiary of New York Life, serves as the Portfolio’s Manager pursuant to an Amended and Restated Management Agreement (“Management Agreement”). The Manager provides offices, conducts clerical, recordkeeping and bookkeeping services, and keeps most of the financial and accounting records required to be maintained by the Portfolio. Except for the portion of salaries and expenses that are the responsibility of the Portfolio, the Manager pays the salaries and expenses of all personnel affiliated with the Portfolio and certain operational expenses of the Portfolio. The Portfolio reimburses New York Life Investments in an amount equal to the portion of the compensation of the Chief Com-pliance Officer attributable to the Portfolio. T. Rowe Price Associates, Inc. (“T. Rowe” or “Subadvisor”), a registered investment adviser, serves as Subadvisor to the Portfolio and is responsible for the day-to-day portfolio management of the Portfolio. Pursuant to the terms of a Subadvisory Agreement (“Subadvisory Agreement”) between New York Life Investments and T. Rowe, New York Life Investments pays for the services of the Subadvisor.
Pursuant to the Management Agreement, the Fund pays the Manager, on behalf of the Portfolio, a monthly fee for the services performed and the facilities furnished at an annual rate of the Portfolio's average daily net assets as follows: 0.725% up to $500 million; 0.70% from $500 million
to $1 billion; and 0.675% in excess of $1 billion. During the six-month period ended June 30, 2021, the effective management fee rate was 0.72%.
During the six-month period ended June 30, 2021, New York Life Investments earned fees from the Portfolio in the amount of $1,942,172 and paid the Subadvisor fees in the amount of $801,182.
JPMorgan provides sub-administration and sub-accounting services to the Portfolio pursuant to an agreement with New York Life Investments. These services include calculating the daily NAVs of the Portfolio, maintaining the general ledger and sub-ledger accounts for the calculation of the Portfolio's NAVs, and assisting New York Life Investments in conducting various aspects of the Portfolio's administrative operations. For providing these services to the Portfolio, JPMorgan is compensated by New York Life Investments.
Prior to February 22, 2021, these services were provided by State Street.
Pursuant to an agreement between the Fund and New York Life Investments, New York Life Investments is responsible for providing or procuring certain regulatory reporting services for the Portfolio. The Portfolio will reimburse New York Life Investments for the actual costs incurred by New York Life Investments in connection with providing or procuring these services for the Portfolio.
(B) Distribution and Service Fees. The Fund, on behalf of the Portfolio, has entered into a distribution agreement with NYLIFE Distributors LLC (the “Distributor”), an affiliate of New York Life Investments. The Portfolio has adopted a distribution plan (the “Plan”) in accordance with the provisions of Rule 12b-1 under the 1940 Act. Under the Plan, the Distributor has agreed to provide, through its affiliates or independent third parties, various distribution-related, shareholder and administrative support services to the Service Class shareholders. For its services, the Distributor is entitled to a combined distribution and service fee accrued daily and paid monthly at an annual rate of 0.25% of the average daily net assets attributable to the Service Class shares of the Portfolio.
(C) Investments in Affiliates (in 000’s). During the six-month period ended June 30, 2021, purchases and sales transactions, income earned from investments and shares held of investment companies managed by New York Life Investments or its affiliates were as follows:
| Affiliated Investment Companies | Value,
Beginning
of Period | Purchases
at Cost | Proceeds
from
Sales | Net
Realized
Gain/(Loss)
on Sales | Change in
Unrealized
Appreciation/
(Depreciation) | Value,
End of
Period | Dividend
Income | Other
Distributions | Shares
End of
Period |
| MainStay U.S. Government Liquidity Fund | $ 4,433 | $ 72,231 | $ (70,890) | $ — | $ — | $ 5,774 | $ —(a) | $ — | 5,774 |
| 24 | MainStay VP T. Rowe Price Equity Income Portfolio |
Note 4-Federal Income Tax
As of June 30, 2021, the cost and unrealized appreciation (depreciation) of the Portfolio’s investment portfolio, including applicable derivative contracts and other financial instruments, as determined on a federal income tax basis, were as follows:
| | Federal Tax
Cost | Gross
Unrealized
Appreciation | Gross
Unrealized
(Depreciation) | Net
Unrealized
Appreciation/
(Depreciation) |
| Investments in Securities | $396,984,304 | $144,849,426 | $(3,956,539) | $140,892,887 |
During the year ended December 31, 2020, the tax character of distributions paid as reflected in the Statements of Changes in Net Assets was as follows:
| | 2020 |
| Distributions paid from: | |
| Ordinary Income | $19,264,249 |
| Long-Term Capital Gains | 38,628,916 |
| Total | $57,893,165 |
Note 5–Custodian
JPMorgan is the custodian of cash and securities held by the Portfolio. Custodial fees are charged to the Portfolio based on the Portfolio's net assets and/or the market value of securities held by the Portfolio and the number of certain transactions incurred by the Portfolio.
Prior to February 22, 2021, these services were provided by State Street. The services provided by State Street were a direct expense of the Portfolio and are included in the Statement of Operations as Custodian fees which totaled $4,050 for the period January 1, 2021 through February 21, 2021.
Note 6–Line of Credit
The Portfolio and certain other funds managed by New York Life Investments maintain a line of credit with a syndicate of banks in order to secure a source of funds for temporary purposes to meet unanticipated or excessive redemption requests.
Effective July 27, 2021, under the credit agreement (the “Credit Agreement”), the aggregate commitment amount is $600,000,000 with an additional uncommitted amount of $100,000,000. The commitment fee is an annual rate of 0.15% of the average commitment amount payable quarterly, regardless of usage, to JPMorgan, who serves as the agent to the syndicate. The commitment fee is allocated among the Portfolio and certain other funds managed by New York Life Investments based upon their respective net assets and other factors. Interest on any revolving credit loan is charged based upon the Federal Funds Rate or the one-month London Interbank Offered Rate ("LIBOR"), whichever is higher. The Credit Agreement expires on July 26, 2022, although the Portfolio, certain other funds managed by New York Life Investments and the
syndicate of banks may renew the Credit Agreement for an additional year on the same or different terms or enter into a credit agreement with a different syndicate of banks. Prior to July 27, 2021, the aggregate commitment amount and the commitment fee were the same as those under the current Credit Agreement. During the six-month period ended June 30, 2021, there were no borrowings made or outstanding with respect to the Portfolio under the Credit Agreement.
Note 7–Interfund Lending Program
Pursuant to an exemptive order issued by the SEC, the Portfolio, along with certain other funds managed by New York Life Investments, may participate in an interfund lending program. The interfund lending program provides an alternative credit facility that permits the Portfolio and certain other funds managed by New York Life Investments to lend or borrow money for temporary purposes directly to or from one another, subject to the conditions of the exemptive order. During the six-month period ended June 30, 2021, there were no interfund loans made or outstanding with respect to the Portfolio.
Note 8–Purchases and Sales of Securities (in 000’s)
During the six-month period ended June 30, 2021, purchases and sales of securities, other than short-term securities, were $49,184 and $127,932, respectively.
Note 9–Capital Share Transactions
Transactions in capital shares for the six-month period ended June 30, 2021 and the year ended December 31, 2020, were as follows:
| Initial Class | Shares | Amount |
| Period ended June 30, 2021: | | |
| Shares sold | 33,110 | $ 434,011 |
| Shares redeemed | (3,994,170) | (50,711,528) |
| Net increase (decrease) | (3,961,060) | $ (50,277,517) |
| Year ended December 31, 2020: | | |
| Shares sold | 3,081,157 | $ 28,201,342 |
| Shares issued to shareholders in reinvestment of distributions | 3,500,827 | 35,016,325 |
| Shares redeemed | (16,423,541) | (175,944,865) |
| Net increase (decrease) | (9,841,557) | $(112,727,198) |
| |
Notes to Financial Statements (Unaudited) (continued)
| Service Class | Shares | Amount |
| Period ended June 30, 2021: | | |
| Shares sold | 25,638 | $ 306,386 |
| Shares redeemed | (2,631,275) | (33,913,757) |
| Net increase (decrease) | (2,605,637) | $ (33,607,371) |
| Year ended December 31, 2020: | | |
| Shares sold | 1,070,152 | $ 10,559,232 |
| Shares issued to shareholders in reinvestment of distributions | 2,294,568 | 22,876,840 |
| Shares redeemed | (4,138,334) | (44,821,584) |
| Net increase (decrease) | (773,614) | $ (11,385,512) |
Note 10–Other Matters
An outbreak of COVID-19, first detected in December 2019, has developed into a global pandemic and has resulted in travel restrictions, closure of international borders, certain businesses and securities markets, restrictions on securities trading activities, prolonged quarantines, supply chain disruptions, and lower consumer demand, as well as general concern and uncertainty. The continued impact of COVID-19 and related new variants is uncertain and could further adversely affect the global economy, national economies, individual issuers and capital markets in unforeseeable ways and result in a substantial and extended economic downturn. Developments that disrupt global economies and financial markets, such as COVID-19, may magnify factors that affect the Portfolio's performance.
Note 11–Subsequent Events
In connection with the preparation of the financial statements of the Portfolio as of and for the six-month period ended June 30, 2021, events and transactions subsequent to June 30, 2021, through the date the financial statements were issued have been evaluated by the Manager for possible adjustment and/or disclosure. No subsequent events requiring financial statement adjustment or disclosure have been identified.
| 26 | MainStay VP T. Rowe Price Equity Income Portfolio |
Discussion of the Operation and Effectiveness of the Portfolio's Liquidity Risk Management Program (Unaudited)
In compliance with Rule 22e-4 under the Investment Company Act of 1940, as amended (the “Liquidity Rule”), the Portfolio has adopted and implemented a liquidity risk management program (the “Program”), which New York Life Investment Management LLC believes is reasonably designed to assess and manage the Portfolio's liquidity risk (the risk that the Portfolio could not meet requests to redeem shares issued by the Portfolio without significant dilution of remaining investors’ interests in the Portfolio). The Board of Trustees of MainStay VP Funds Trust (the "Board") designated New York Life Investment Management LLC as administrator of the Program (the “Administrator”). The Administrator has established a Liquidity Risk Management Committee to assist the Administrator in the implementation and day-to-day administration of the Program and to otherwise support the Administrator in fulfilling its responsibilities under the Program.
At a meeting of the Board held on March 8, 2021, the Administrator provided the Board with a written report addressing the Program’s operation and assessing its adequacy and effectiveness of implementation for the period from January 1, 2020 through December 31, 2020 (the "Review Period"), as required under the Liquidity Rule. The report noted that the Administrator concluded that (i) the Program operated effectively to assess and manage the Portfolio's liquidity risk, (ii) the Program has been adequately and effectively implemented to monitor and, as applicable, respond to the Portfolio's liquidity developments and (iii) the Portfolio's investment strategy continues to be appropriate for an open-end fund. In addition, the report discussed notable events that impacted liquidity risk during the Review Period, including the COVID-19 pandemic and the resulting economic shutdown.
In accordance with the Program, the Portfolio's liquidity risk is assessed no less frequently than annually taking into consideration certain factors, as applicable, such as (i) investment strategy and liquidity of portfolio investments, (ii) short-term and long-term cash flow projections and (iii) holdings of cash and cash equivalents, as well as borrowing arrangements and other funding sources. Certain factors are considered under both normal and reasonably foreseeable stressed conditions.
Each Portfolio portfolio investment is classified into one of four liquidity categories. The classification is based on a determination of the number of days it is reasonably expected to take to convert the investment into cash, or sell or dispose of the investment, in current market conditions without significantly changing the market value of the investment. The Administrator has delegated liquidity classification determinations to the Portfolio’s subadvisor, subject to appropriate oversight by the Administrator, and classification determinations are made by taking into account the Portfolio's reasonably anticipated trade size, various market, trading and investment-specific considerations, as well as market depth, and, in certain cases, third-party vendor data.
The Liquidity Rule requires portfolios that do not primarily hold assets that are highly liquid investments to adopt a minimum amount of net assets that must be invested in highly liquid investments that are assets (an “HLIM”). In addition, the Liquidity Rule limits a portfolio's investments in illiquid investments. Specifically, the Liquidity Rule prohibits acquisition of illiquid investments if doing so would result in a portfolio holding more than 15% of its net assets in illiquid investments that are assets. The Program includes provisions reasonably designed to determine, periodically review and comply with the HLIM requirement, as applicable, and to comply with the 15% limit on illiquid investments.
There can be no assurance that the Program will achieve its objectives under all circumstances in the future. Please refer to the Portfolio's prospectus for more information regarding the Portfolio's exposure to liquidity risk and other risks to which it may be subject.
Proxy Voting Record
The Portfolio is required to file with the SEC its proxy voting records for the 12-month period ending June 30 on Form N-PX. The Portfolio's most recent Form N-PX or proxy voting record is available free of charge upon request (i) by calling 800-598-2019; (ii) by visiting New York Life Investments’ website at https://www.nylinvestments.com/mainstay/
products-and-performance/mainstay-vp-funds-trust; or (iii) by visiting the SEC’s website at www.sec.gov.
Shareholder Reports and Quarterly Portfolio Disclosure
The Portfolio is required to file its complete schedule of portfolio holdings with the SEC 60 days after its first and third fiscal quarter on Form N-PORT. The Portfolio's holdings report is available free of charge upon request by calling 800-598-2019 or by visiting the SEC’s website at www.sec.gov.
| 28 | MainStay VP T. Rowe Price Equity Income Portfolio |
This page intentionally left blank
This page intentionally left blank.
MainStay VP Portfolios
MainStay VP offers a wide range of Portfolios. The full array of MainStay VP offerings is listed here, with information about the manager, subadvisors, legal counsel, and independent registered public accounting firm.
Equity
MainStay VP Candriam Emerging Markets Equity Portfolio
MainStay VP Epoch U.S. Equity Yield Portfolio
MainStay VP Fidelity Institutional AM® Utilities Portfolio†
MainStay VP MacKay International Equity Portfolio
MainStay VP MacKay S&P 500 Index Portfolio
MainStay VP Natural Resources Portfolio
MainStay VP Small Cap Growth Portfolio
MainStay VP T. Rowe Price Equity Income Portfolio
MainStay VP Wellington Growth Portfolio
MainStay VP Wellington Mid Cap Portfolio
MainStay VP Wellington Small Cap Portfolio
MainStay VP Wellington U.S. Equity Portfolio
MainStay VP Winslow Large Cap Growth Portfolio
Mixed Asset
MainStay VP Balanced Portfolio
MainStay VP Income Builder Portfolio
MainStay VP Janus Henderson Balanced Portfolio
MainStay VP MacKay Convertible Portfolio
Income
MainStay VP Bond Portfolio
MainStay VP Floating Rate Portfolio
MainStay VP Indexed Bond Portfolio
MainStay VP MacKay Government Portfolio
MainStay VP MacKay High Yield Corporate Bond Portfolio
MainStay VP MacKay Strategic Bond Portfolio
MainStay VP PIMCO Real Return Portfolio
Money Market
MainStay VP U.S. Government Money Market Portfolio
Alternative
MainStay VP CBRE Global Infrastructure Portfolio
MainStay VP IQ Hedge Multi-Strategy Portfolio
Asset Allocation
MainStay VP Conservative Allocation Portfolio
MainStay VP Equity Allocation Portfolio
MainStay VP Growth Allocation Portfolio
MainStay VP Moderate Allocation Portfolio
Manager
New York Life Investment Management LLC
New York, New York
Subadvisors
Brown Advisory LLC
Baltimore, Maryland
Candriam Belgium S.A.*
Brussels, Belgium
CBRE Clarion Securities LLC
Radnor, Pennsylvania
Epoch Investment Partners, Inc.
New York, New York
FIAM LLC
Smithfield, Rhode Island
IndexIQ Advisors LLC*
New York, New York
Janus Capital Management LLC
Denver, Colorado
MacKay Shields LLC*
New York, New York
Mellon Investments Corporation
Boston, Massachusetts
NYL Investors LLC*
New York, New York
Pacific Investment Management Company LLC
Newport Beach, California
Segall Bryant & Hamill, LLC
Chicago, Illinois
T. Rowe Price Associates, Inc.
Baltimore, Maryland
Wellington Management Company LLP
Boston, Massachusetts
Winslow Capital Management, LLC
Minneapolis, Minnesota
Legal Counsel
Dechert LLP
Washington, District of Columbia
Independent Registered Public Accounting Firm
PricewaterhouseCoopers LLP
New York, New York
Distributor
NYLIFE Distributors LLC*
Jersey City, New Jersey
Custodian
JPMorgan Chase Bank, N.A.
New York, New York
Some Portfolios may not be available in all products.
† Fidelity Institutional AM is a registered trade mark of FMR LLC. Used with permission.
* An affiliate of New York Life Investment Management LLC
Not part of the Semiannual Report
2021 Semiannual Report
This report is for the general information of New York Life Variable Annuities and NYLIAC Variable Universal Life Insurance Products policyowners. It must be preceded or accompanied by the appropriate product(s) and funds prospectuses if it is given to anyone who is not an owner of a New York Life variable annuity policy or a NYLIAC Variable Universal Life Insurance Product. This report does not offer for sale or solicit orders to purchase securities.
The performance data quoted in this report represents past performance. Past performance is no guarantee of future results. Due to market volatility and other factors, current performance may be lower or higher than the figures shown. The most recent month-end performance summary for your variable annuity or variable life policy is available by calling 800-598-2019 and is updated periodically on newyorklife.com.
The New York Life Variable Annuities and NYLIAC Variable Universal Life Insurance Products are issued by New York Life Insurance and Annuity Corporation (a Delaware Corporation) and distributed by NYLIFE Distributors LLC (Member FINRA/SIPC).
New York Life Insurance Company
New York Life Insurance and Annuity
Corporation (NYLIAC) (A Delaware Corporation)
51 Madison Avenue, Room 551
New York, NY 10010
newyorklife.com
nylinvestments.com
NYLIFE Distributors LLC, 30 Hudson Street, Jersey City, NJ 07302
New York Life Investment Management LLC is the investment manager to the MainStay VP Funds Trust
©2021 by NYLIFE Distributors LLC. All rights reserved.
You may obtain copies of the Prospectus and the Statement of Additional Information free of charge, upon request, by calling toll-free 800-598-2019 or writing to New York Life Insurance and Annuity Corporation, 51 Madison Avenue, New York, NY 10010.
| Not FDIC Insured | No Bank Guarantee | May Lose Value |
(NYLIAC) NI531
MainStay VP Natural Resources Portfolio
(formerly known as MainStay VP Mellon Natural Resources Portfolio)
Message from the President and Semiannual Report
Unaudited | June 30, 2021
Sign up for e-delivery of your shareholder reports. For full details on e-delivery, including who can participate and what you can receive via e-delivery,
please log in to newyorklifeinvestments.com/accounts.
| Not FDIC/NCUA Insured | Not a Deposit | May Lose Value | No Bank Guarantee | Not Insured by Any Government Agency |
This page intentionally left blank
Message from the President
The COVID-19 pandemic continued to afflict our personal lives and broad segments of the U.S. and global economy throughout the six-month reporting period ended June 30, 2021. However, with the deployment of multiple vaccines around the world, including three highly effective versions approved for emergency use in the United States, investors began to turn their attention toward the gradual reopening of the economy and the shape the “new normal” would take.
The first half of the reporting period saw increasing inflationary concerns as fiscal stimulus business reopenings drove accelerating economic growth, rising commodity prices and increased consumer spending. However, the U.S. Federal Reserve noted that price increases were likely to prove temporary and made clear their intention to remain accommodative for the foreseeable future. Accordingly, after moving higher in the first quarter of 2021, interest rates declined in the second quarter.
In response to the uncertain inflation outlook, equity market leadership shifted from value in the first quarter of the year to growth in the second quarter. Nevertheless, investor sentiment remained buoyant throughout the reporting period, with all eleven sectors in the S&P 500® Index, a widely regarded benchmark of market performance, producing positive returns. Energy led the market’s rise fueled by rapidly increasing oil and gas prices, followed by financials and real estate, which benefited from rising interest rates and the economic reopening, respectively. Communication services produced the slowest growth, followed by the traditionally defensive utilities and consumer staples
sectors. In the fixed income market, lower-credit-quality issues tended to outperform their higher-grade counterparts, with high-yield corporate bonds generating the strongest performance. Among securitized products, commercial mortgage-backed securities generally produced the strongest returns, followed by mortgage-backed securities and asset-backed securities, while Treasury securities lagged.
Despite the tremendous progress we’ve seen so far this year, the United States and the world continue to face significant pandemic-related challenges. Newer, more contagious variants of COVID-19 threaten the return of restrictions and lockdowns that could stall the economic recovery. At the same time, supply chain shortages have led to rising prices on everything from laptops to autos, stoking fears of uncontrolled inflation despite reassurance from the Fed. At New York Life Investments, we recognize that the shape that the “new normal” eventually takes may differ from our expectations. You can depend on us to keep a sharp watch for the unexpected, and to continue to help you find your way through this rapidly evolving investment landscape.
Sincerely,
Kirk C. Lehneis
President
The opinions expressed are as of the date of this report and are subject to change. There is no guarantee that any forecast made will come to pass. This material does not constitute investment advice and is not intended as an endorsement of any specific investment. Past performance is no guarantee of future results.
Not part of the Semiannual Report
Investors should refer to the Portfolio’s Summary Prospectus and/or Prospectus and consider the Portfolio’s investment objectives, strategies, risks, charges and expenses carefully before investing. The Summary Prospectus and/or Prospectus contain this and other information about the Portfolio. You may obtain copies of the Portfolio’s Summary Prospectus and/or the Prospectus and the Statement of Additional Information free of charge, upon request, by calling toll-free 800-598-2019, by writing to New York Life Insurance and Annuity Corporation, 51 Madison Avenue, Room 251, New York, New York 10010 or by sending an email to MainStayShareholdersServices@nylim.com. These documents are also available at nylinvestments.com/vpdocuments. Please read the Portfolio's Summary Prospectus and/or Prospectus carefully before investing. MainStay VP Funds Trust portfolios are separate account options which are purchased through a variable insurance or variable annuity contract.
Investment and Performance Comparison (Unaudited)
Performance data quoted represents past performance. Past performance is no guarantee of future results. Because of market volatility and other factors, current performance may be lower or higher than the figures shown. Investment return and principal value will fluctuate, and as a result, when shares are redeemed, they may be worth more or less than their original cost. The performance table and graph do not reflect any deduction of sales charges, mortality and expense charges, contract charges or administrative charges. Please refer to the Performance Summary appropriate for your policy. For performance information current to the most recent month-end, please call 800-598-2019 or visit www.newyorklife.com.
Performance figures may reflect certain fee waivers and/or expense limitations, without which total returns may have been different. For information on current fee waivers and/or expense limitations (if any), please refer to the Notes to Financial Statements.
| Average Annual Total Returns for the Period-Ended June 30, 2021 |
| Class | Inception
Date1 | Six
Months | One
Year | Five
Years | Since
Inception | Gross
Expense
Ratio2 |
| Initial Class Shares | 2/17/2012 | 25.12% | 65.20% | 4.27% | -1.49% | 0.86% |
| 1. | The Portfolio replaced its subadvisor and modified its principal investment strategies and changed its classification from a diversified fund to a non-diversified fund as of November 30, 2018. Therefore, the performance information shown in this report prior to November 30, 2018 reflects the Portfolio’s prior subadvisor, investment objective and principal investment strategies. |
| 2. | The gross expense ratios presented reflect the Portfolio’s “Total Annual Portfolio Operating Expenses” from the most recent Prospectus, as supplemented, and may differ from other expense ratios disclosed in this report. |
| Benchmark Performance | Six
Months | One
Year | Five
Years | Since
Inception |
| S&P Global Natural Resources Index1 | 19.94% | 49.35% | 11.42% | 3.31% |
| Morningstar Natural Resources Category Average2 | 20.52 | 62.91 | 9.73 | 2.40 |
| 1. | The Portfolio has selected the S&P Global Natural Resources Index as its primary benchmark. The S&P Global Natural Resources Index includes 90 of the largest publicly-traded companies in natural resources and commodities businesses that meet specific investability requirements, offering investors diversified and investable equity exposure across 3 primary commodity-related sectors: agribusiness, energy, and metals & mining. Results assume reinvestment of all dividends and capital gains. An investment cannot be made directly in an index. |
| 2. | The Morningstar Natural Resources Category Average is representative of funds that invest primarily on commodity-based industries such as energy, chemicals, minerals, and forest products in the United States or outside of the United States. Some funds invest across this spectrum to offer broad natural-resources exposure. Others concentrate heavily or even exclusively in specific industries. Funds that concentrate primarily in energy-related industries are part of the equity energy category. Results are based on average total returns of similar funds with all dividends and capital gain distributions reinvested. |
Cost in Dollars of a $1,000 Investment in MainStay VP Natural Resources Portfolio (Unaudited)
The example below is intended to describe the fees and expenses borne by shareholders during the six-month period from January 1, 2021 to June 30, 2021, and the impact of those costs on your investment.
Example
As a shareholder of the Portfolio you incur two types of costs: (1) transaction costs, including exchange fees and sales charges (loads) on purchases (as applicable), and (2) ongoing costs, including management fees, distribution and/or service (12b-1) fees, and other Portfolio expenses (as applicable). This example is intended to help you understand your ongoing costs (in dollars) of investing in the Portfolio and to compare these costs with the ongoing costs of investing in other mutual funds. The example is based on an investment of $1,000 made at the beginning of the six-month period and held for the entire period from January 1, 2021 to June 30, 2021. Shares are only sold in connection with variable life and annuity contracts and the example does not reflect any contract level or transactional fees or expenses. If these costs had been included, your costs would have been higher.
This example illustrates your Portfolio’s ongoing costs in two ways:
Actual Expenses
The second and third data columns in the table below provide information about actual account values and actual expenses. You may use the information in these columns, together with the amount you invested, to estimate the expenses that you paid during the six months ended June
30, 2021. Simply divide your account value by $1,000 (for example, an $8,600 account value divided by $1,000 = 8.6), then multiply the result by the number under the heading entitled “Expenses Paid During Period” to estimate the expenses you paid on your account during this period.
Hypothetical Example for Comparison Purposes
The fourth and fifth data columns in the table below provide information about hypothetical account values and hypothetical expenses based on the Portfolio’s actual expense ratio and an assumed rate of return of 5% per year before expenses, which is not the Portfolio’s actual return. The hypothetical account values and expenses may not be used to estimate the actual ending account balances or expenses you paid for the six-month period shown. You may use this information to compare the ongoing costs of investing in the Portfolio with the ongoing costs of investing in other mutual funds. To do so, compare this 5% hypothetical example with the 5% hypothetical examples that appear in the shareholder reports of the other mutual funds.
Please note that the expenses shown in the table are meant to highlight your ongoing costs only and do not reflect any transactional costs, such as exchange fees or sales charges (loads). Therefore, the fourth and fifth data columns of the table are useful in comparing ongoing costs only and will not help you determine the relative total costs of owning different funds. In addition, if these transactional costs were included, your costs would have been higher.
| Share Class | Beginning
Account
Value
1/1/21 | Ending Account
Value (Based
on Actual
Returns and
Expenses)
6/30/21 | Expenses
Paid
During
Period1 | Ending Account
Value (Based
on Hypothetical
5% Annualized
Return and
Actual Expenses)
6/30/21 | Expenses
Paid
During
Period1 | Net Expense
Ratio
During
Period2 |
| Initial Class Shares | $1,000.00 | $1,251.20 | $4.74 | $1,020.58 | $4.26 | 0.85% |
| 1. | Expenses are equal to the Portfolio’s annualized expense ratio of each class multiplied by the average account value over the period, divided by 365 and multiplied by 181 (to reflect the six-month period). The table above represents the actual expenses incurred during the six-month period. In addition to the fees and expenses which the Portfolio bears directly, it also indirectly bears a pro rata share of the fees and expenses of the underlying funds in which it invests. Such indirect expenses are not included in the above-reported expense figures. |
| 2. | Expenses are equal to the Portfolio's annualized expense ratio to reflect the six-month period. |
| 6 | MainStay VP Natural Resources Portfolio |
Country Composition as of June 30, 2021 (Unaudited)
| United States | 82.8% |
| Canada | 7.1 |
| South Africa | 4.3 |
| Norway | 2.9 |
| Zambia | 2.0 |
| Italy | 1.7% |
| Denmark | 0.7 |
| Other Assets, Less Liabilities | –1.5 |
| | 100.0% |
See Portfolio of Investments beginning on page 10 for specific holdings within these categories. The Portfolio's holdings are subject to change.
Top Ten Holdings as of June 30, 2021 (excluding short-term investments) (Unaudited)
| 1. | ConocoPhillips |
| 2. | Hess Corp. |
| 3. | CF Industries Holdings, Inc. |
| 4. | Marathon Petroleum Corp. |
| 5. | EQT Corp. |
| 6. | Valero Energy Corp. |
| 7. | Pioneer Natural Resources Co. |
| 8. | Occidental Petroleum Corp. |
| 9. | Mosaic Co. (The) |
| 10. | Devon Energy Corp. |
Portfolio Management Discussion and Analysis (Unaudited)
Answers to the questions reflect the views of portfolio manager Albert Chu, CFA, Brock Campbell, CFA, and David S. Intoppa, CFA of Mellon Investments Corporation, the Portfolio’s Subadvisor.
How did MainStay VP Natural Resources Portfolio perform relative to its benchmark and peers during the six months ended June 30, 2021?
For the six months ended June 30, 2021, MainStay VP Natural Resources Portfolio returned 25.12% for Initial Class shares. Over the same period, Initial Class shares of the Portfolio outperformed the 19.94% return of the S&P Global Natural Resources Sector Index (“the Index”), which is the Portfolio’s primary benchmark, and the 20.52% return of the Morningstar Natural Resources Category Average.1
Were there any changes to the Portfolio during the reporting period?
Effective May 1, 2021 the Portfolio name changed to MainStay VP Natural Resources Portfolio.
What factors affected the Portfolio’s relative performance during the reporting period?
The continued impact of the COVID-19 pandemic materially impacted the Portfolio’s performance during the reporting period. Economic reopening as the COVID-19 pandemic wound down set the stage for commodity price increases and growing industrial demand for natural resources, creating a favorable environment for the Portfolio’s investment universe. The Portfolio outperformed the Index, largely on the strength of relatively strong returns in the areas of U.S./onshore upstream and natural gas exploration & production.
Which market segments were the strongest positive contributors to the Portfolio’s relative performance, and which market segments were particularly weak?
The strongest positive sector contributions to the Portfolio’s relative performance during the reporting period came from U.S./onshore upstream and natural gas exploration & production. (Contributions take weightings and total returns into account.) During the same period, the weakest contributors to relative performance were integrated energy and next-gen energy.
During the reporting period, which individual stocks made the strongest positive contributions to the Portfolio’s absolute performance and which stocks detracted the most?
The strongest positive contributions to the Portfolio’s absolute performance came from oil & gas exploration companies Hess, ConocoPhillips and Devon Energy. Hess shares represented a unique story, with the company leveraged to higher crude prices and benefiting from successful exploration in a low-cost oilfield. ConocoPhillips continued to outperform, as investors started to recognize the value generated by the company’s management team. Under strong leadership, the company was one of the first
producers to adopt a capital discipline and shareholder return management approach. Furthermore, the company’s acquisition of Concho Resources, announced in late 2020, appears in retrospect to have been very timely, adding a world-class resource at the bottom of the cycle. Devon Energy stock outperformed on strong crude prices as global inventories tightened. Management actively engaged with shareholders, and the introduction of the company’s variable dividend gained traction with investors.
The most significant detractors from the Portfolio’s absolute performance during the same period included positions in integrated oil & gas company Petroleo Brasileiro (Petrobras), gold miner Kinross Gold and solar energy equipment firm Array Technologies. Petrobras stock underperformed despite a solid crude oil rally, as Brazilian President Bolsonaro restructured the company’s highly regarded management team and pressured the company to lower domestic diesel prices. Kinross Gold shares declined on falling gold prices, rising interest rates and a strengthening U.S. dollar, as investors gained optimism on the reopening of the economy. Array Technologies underperformed, as the company was forced to guide revenue projections lower due to shortages and supply chain disruptions, as well as inflation.
Did the Portfolio make any significant purchases or sales during the reporting period?
Key additions to the Portfolio during the reporting period included positions in oil & gas exploration & production company Occidental Petroleum, engineering and construction firm Fluor and chemical producer Tronox Holdings. In our opinion, Occidental is well positioned, and we believe higher commodity prices will allow it to delever in the wake of its Anadarko acquisition. The Portfolio initiated a position in Fluor in the belief that the company should benefit from higher commodity prices and infrastructure stimulus, leading to new construction. In our opinion, the company is uniquely positioned to benefit from cyclical areas like mining, as well as secular growth areas like renewables and energy transition. The Portfolio added a position in Tronox, a key producer of titanium dioxide (TiO2), as we believe that fundamentals are aligned to drive the next TiO2 bull market.
During the same period, the Portfolio eliminated its entire positions in Petrobras, copper mining company Lundin Mining and steel producer ArcelorMittal in favor of more compelling risk/reward opportunities.
How did the Portfolio’s subsector and subindustry weightings change during the reporting period?
During the reporting period, the Portfolio exited the forest products & other space, and initiated a position in the industrials subsector through the purchase of Fluor. Exposure to copper was trimmed via the sale of Lundin Mining and Southern Copper positions as prices reached a new near-term high. Exposure to
| 1. | See page 5 for more information on benchmark and peer group returns. |
| 8 | MainStay VP Natural Resources Portfolio |
international/offshore upstream was reduced as well through the sale of shares in Petrobras. Finally, the Portfolio eliminated its steel exposure and reduced its exposure to U.S./onshore upstream.
How was the Fund positioned at the end of the reporting period?
As of June 30, 2021, our outlook for the natural resources sector remains very positive for the remainder of 2021 and beyond. Inflation has started to set in. as evidenced by a higher consumer price index, and the sector is supported by both a positive macro environment as well as positive commodity supply/demand dynamics. While we view the Portfolio as style agnostic, we believe that the cyclical global natural resources sector is in a uniquely bullish environment. Macroeconomic and policy factors appear to be lined up with favorable commodity supply and demand stories. Company-level valuations and free cash flow generation potential should be attractive to new investors and capital. Accordingly, we believe that volatility and weakness in the sector should be viewed as entry opportunities.
The opinions expressed are those of the portfolio managers as of the date of this report and are subject to change. There is no guarantee that any forecasts will come to pass. This material does not constitute investment advice and is not intended as an endorsement of any specific investment.
Not all MainStay VP Portfolios and/or share classes are available under all policies.
Portfolio of Investments June 30, 2021† (Unaudited)
| | Shares | Value |
| Common Stocks 98.7% |
| Canada 7.1% |
| Alamos Gold, Inc. Class A (Metals & Mining) | 590,521 | $ 4,517,486 |
| Kinross Gold Corp. (Metals & Mining) | 1,573,477 | 9,977,032 |
| Nutrien Ltd. (Chemicals) | 81,882 | 4,962,868 |
| | | 19,457,386 |
| Denmark 0.7% |
| Orsted A/S (Electric Utilities) (a) | 14,397 | 2,020,229 |
| Italy 1.7% |
| Enel SpA (Electric Utilities) | 489,871 | 4,549,331 |
| Norway 2.9% |
| Equinor ASA (Oil, Gas & Consumable Fuels) | 328,663 | 6,954,098 |
| NEL ASA (Electrical Equipment) (b) | 396,780 | 925,343 |
| | | 7,879,441 |
| South Africa 4.3% |
| Anglo American plc (Metals & Mining) | 198,605 | 7,891,628 |
| Sibanye Stillwater Ltd. (Metals & Mining) | 913,995 | 3,818,553 |
| | | 11,710,181 |
| United States 80.0% |
| Array Technologies, Inc. (Electrical Equipment) (b) | 69,616 | 1,086,010 |
| Bunge Ltd. (Food Products) | 112,061 | 8,757,567 |
| CF Industries Holdings, Inc. (Chemicals) | 246,276 | 12,670,900 |
| Clean Harbors, Inc. (Commercial Services & Supplies) (b) | 29,189 | 2,718,663 |
| CNX Resources Corp. (Oil, Gas & Consumable Fuels) (b) | 208,596 | 2,849,421 |
| Coeur Mining, Inc. (Metals & Mining) (b) | 650,044 | 5,772,391 |
| Comstock Resources, Inc. (Oil, Gas & Consumable Fuels) (b) | 567,353 | 3,784,245 |
| ConocoPhillips (Oil, Gas & Consumable Fuels) | 227,753 | 13,870,158 |
| Corteva, Inc. (Chemicals) | 219,262 | 9,724,270 |
| Covanta Holding Corp. (Commercial Services & Supplies) | 208,646 | 3,674,256 |
| Devon Energy Corp. (Oil, Gas & Consumable Fuels) | 379,404 | 11,074,803 |
| Diamondback Energy, Inc. (Oil, Gas & Consumable Fuels) | 52,588 | 4,937,487 |
| EQT Corp. (Oil, Gas & Consumable Fuels) (b) | 533,486 | 11,875,398 |
| Fluor Corp. (Construction & Engineering) (b) | 251,325 | 4,448,453 |
| | Shares | Value |
| |
| United States (continued) |
| Freeport-McMoRan, Inc. (Metals & Mining) | 239,119 | $ 8,873,706 |
| Hess Corp. (Oil, Gas & Consumable Fuels) | 157,746 | 13,774,381 |
| Marathon Petroleum Corp. (Oil, Gas & Consumable Fuels) | 202,213 | 12,217,709 |
| Mosaic Co. (The) (Chemicals) | 350,451 | 11,182,891 |
| MP Materials Corp. (Metals & Mining) (b)(c) | 84,075 | 3,099,005 |
| Newmont Corp. (Metals & Mining) | 124,267 | 7,876,042 |
| NextEra Energy Partners LP (Independent Power and Renewable Electricity Producers) (c) | 51,006 | 3,894,818 |
| Occidental Petroleum Corp. (Oil, Gas & Consumable Fuels) | 364,398 | 11,394,725 |
| Peridot Acquisition Corp. Class A (Capital Markets) (b)(c) | 68,525 | 834,635 |
| Phillips 66 (Oil, Gas & Consumable Fuels) | 113,961 | 9,780,133 |
| Pioneer Natural Resources Co. (Oil, Gas & Consumable Fuels) | 71,159 | 11,564,761 |
| Range Resources Corp. (Oil, Gas & Consumable Fuels) (b) | 320,180 | 5,366,217 |
| Stem, Inc. (Electrical Equipment) (b)(c) | 53,947 | 1,942,631 |
| Sunnova Energy International, Inc. (Independent Power and Renewable Electricity Producers) (b) | 117,573 | 4,427,799 |
| Tronox Holdings plc Class A (Chemicals) | 175,849 | 3,939,018 |
| Valero Energy Corp. (Oil, Gas & Consumable Fuels) | 150,358 | 11,739,953 |
| | | 219,152,446 |
| Zambia 2.0% |
| First Quantum Minerals Ltd. (Metals & Mining) | 242,487 | 5,588,781 |
Total Common Stocks
(Cost $212,099,150) | | 270,357,795 |
| Short-Term Investments 2.8% |
| Affiliated Investment Company 0.7% |
| United States 0.7% |
| MainStay U.S. Government Liquidity Fund, 0.01% (d) | 1,820,389 | 1,820,389 |
The notes to the financial statements are an integral part of, and should be read in conjunction with, the financial statements.
| 10 | MainStay VP Natural Resources Portfolio |
| | Shares | | Value |
| Short-Term Investments (continued) |
| Unaffiliated Investment Company 2.1% |
| United States 2.1% |
| Wells Fargo Government Money Market Fund, 0.025% (d)(e) | 5,901,060 | | $ 5,901,060 |
Total Short-Term Investments
(Cost $7,721,449) | | | 7,721,449 |
Total Investments
(Cost $219,820,599) | 101.5% | | 278,079,244 |
| Other Assets, Less Liabilities | (1.5) | | (4,095,403) |
| Net Assets | 100.0% | | $ 273,983,841 |
| † | Percentages indicated are based on Portfolio net assets. |
| (a) | May be sold to institutional investors only under Rule 144A or securities offered pursuant to Section 4(a)(2) of the Securities Act of 1933, as amended. |
| (b) | Non-income producing security. |
| (c) | All or a portion of this security was held on loan. As of June 30, 2021, the aggregate market value of securities on loan was $8,061,081; the total market value of collateral held by the Portfolio was $8,244,990. The market value of the collateral held included non-cash collateral in the form of U.S. Treasury securities with a value of $2,343,930. The Portfolio received cash collateral with a value of $5,901,060. (See Note 2(I)) |
| (d) | Current yield as of June 30, 2021. |
| (e) | Represents a security purchased with cash collateral received for securities on loan. |
The following is a summary of the fair valuations according to the inputs used as of June 30, 2021, for valuing the Portfolio’s assets:
| Description | Quoted
Prices in
Active
Markets for
Identical
Assets
(Level 1) | | Significant
Other
Observable
Inputs
(Level 2) | | Significant
Unobservable
Inputs
(Level 3) | | Total |
| Asset Valuation Inputs | | | | | | | |
| Investments in Securities (a) | | | | | | | |
| Common Stocks | $ 270,357,795 | | $ — | | $ — | | $ 270,357,795 |
| Short-Term Investments | | | | | | | |
| Affiliated Investment Company | 1,820,389 | | — | | — | | 1,820,389 |
| Unaffiliated Investment Company | 5,901,060 | | — | | — | | 5,901,060 |
| Total Short-Term Investments | 7,721,449 | | — | | — | | 7,721,449 |
| Total Investments in Securities | $ 278,079,244 | | $ — | | $ — | | $ 278,079,244 |
| (a) | For a complete listing of investments and their industries, see the Portfolio of Investments. |
The notes to the financial statements are an integral part of, and should be read in conjunction with, the financial statements.
11
Portfolio of Investments June 30, 2021† (Unaudited) (continued)
The table below sets forth the diversification of the Portfolio’s investments by industry.
Industry Diversification
| | Value | | Percent |
| Capital Markets | $ 834,635 | | 0.3% |
| Chemicals | 42,479,947 | | 15.5 |
| Commercial Services & Supplies | 6,392,919 | | 2.3 |
| Construction & Engineering | 4,448,453 | | 1.6 |
| Electric Utilities | 6,569,560 | | 2.4 |
| Electrical Equipment | 3,953,984 | | 1.4 |
| Food Products | 8,757,567 | | 3.2 |
| Independent Power and Renewable Electricity Producers | 8,322,617 | | 3.0 |
| Metals & Mining | 57,414,624 | | 20.9 |
| Oil, Gas & Consumable Fuels | 131,183,489 | | 48.1 |
| | 270,357,795 | | 98.7 |
| Short-Term Investments | 7,721,449 | | 2.8 |
| Other Assets, Less Liabilities | (4,095,403) | | (1.5) |
| Net Assets | $273,983,841 | | 100.0% |
| † | Percentages indicated are based on Portfolio net assets. |
The notes to the financial statements are an integral part of, and should be read in conjunction with, the financial statements.
| 12 | MainStay VP Natural Resources Portfolio |
Statement of Assets and Liabilities as of June 30, 2021 (Unaudited)
| Assets |
Investment in unaffiliated securities, at value
(identified cost $218,000,210) including securities on loan of $8,061,081 | $ 276,258,855 |
Investment in affiliated investment companies, at value
(identified cost $1,820,389) | 1,820,389 |
Cash denominated in foreign currencies
(identified cost $234,576) | 238,525 |
| Receivables: | |
| Investment securities sold | 3,604,845 |
| Dividends and interest | 293,384 |
| Securities lending | 47,021 |
| Portfolio shares sold | 26,136 |
| Other assets | 1,979 |
| Total assets | 282,291,134 |
| Liabilities |
| Cash collateral received for securities on loan | 5,901,060 |
| Payables: | |
| Investment securities purchased | 2,139,039 |
| Manager (See Note 3) | 181,155 |
| Professional fees | 33,595 |
| Custodian | 23,956 |
| Shareholder communication | 22,041 |
| Accrued expenses | 6,447 |
| Total liabilities | 8,307,293 |
| Net assets | $ 273,983,841 |
| Composition of Net Assets |
| Shares of beneficial interest outstanding (par value of $.001 per share) unlimited number of shares authorized | $ 33,452 |
| Additional paid-in-capital | 407,923,780 |
| | 407,957,232 |
| Total distributable earnings (loss) | (133,973,391) |
| Net assets | $ 273,983,841 |
| Initial Class | |
| Net assets applicable to outstanding shares | $273,983,841 |
| Shares of beneficial interest outstanding | 33,452,395 |
| Net asset value per share outstanding | $ 8.19 |
The notes to the financial statements are an integral part of, and should be read in conjunction with, the financial statements.
13
Statement of Operations for the six months ended June 30, 2021 (Unaudited)
| Investment Income (Loss) |
| Income | |
| Dividends-unaffiliated (net of foreign tax withholding of $92,302) | $ 2,679,524 |
| Securities lending | 93,295 |
| Dividends-affiliated | 115 |
| Other | 215 |
| Total income | 2,773,149 |
| Expenses | |
| Manager (See Note 3) | 1,033,105 |
| Professional fees | 33,646 |
| Custodian | 20,348 |
| Shareholder communication | 12,855 |
| Trustees | 2,405 |
| Miscellaneous | 13,785 |
| Total expenses | 1,116,144 |
| Net investment income (loss) | 1,657,005 |
| Realized and Unrealized Gain (Loss) |
| Net realized gain (loss) on: | |
| Unaffiliated investment transactions | 30,372,027 |
| Foreign currency transactions | (14,522) |
| Net realized gain (loss) | 30,357,505 |
| Net change in unrealized appreciation (depreciation) on: | |
| Unaffiliated investments | 25,468,453 |
| Translation of other assets and liabilities in foreign currencies | (1,807) |
| Net change in unrealized appreciation (depreciation) | 25,466,646 |
| Net realized and unrealized gain (loss) | 55,824,151 |
| Net increase (decrease) in net assets resulting from operations | $57,481,156 |
The notes to the financial statements are an integral part of, and should be read in conjunction with, the financial statements.
| 14 | MainStay VP Natural Resources Portfolio |
Statements of Changes in Net Assets
for the six months ended June 30, 2021 (Unaudited) and the year ended December 31, 2020
| | 2021 | 2020 |
| Increase (Decrease) in Net Assets |
| Operations: | | |
| Net investment income (loss) | $ 1,657,005 | $ 3,497,346 |
| Net realized gain (loss) | 30,357,505 | 1,573,874 |
| Net change in unrealized appreciation (depreciation) | 25,466,646 | 11,424,951 |
| Net increase (decrease) in net assets resulting from operations | 57,481,156 | 16,496,171 |
| Distributions to shareholders: | | |
| Initial Class | — | (5,462,396) |
| Capital share transactions: | | |
| Net proceeds from sales of shares | 8,357,046 | 21,659,133 |
| Net asset value of shares issued to shareholder in reinvestment of distributions | — | 5,462,396 |
| Cost of shares redeemed | (30,762,664) | (48,522,616) |
| Increase (decrease) in net assets derived from capital share transactions | (22,405,618) | (21,401,087) |
| Net increase (decrease) in net assets | 35,075,538 | (10,367,312) |
| Net Assets |
| Beginning of period | 238,908,303 | 249,275,615 |
| End of period | $273,983,841 | $238,908,303 |
The notes to the financial statements are an integral part of, and should be read in conjunction with, the financial statements.
15
Financial Highlights selected per share data and ratios
| | Six months ended
June 30,
2021* | | Year Ended December 31, |
| Initial Class | 2020 | | 2019 | | 2018 | | 2017 | | 2016 |
| Net asset value at beginning of period | $ 6.55 | | $ 6.29 | | $ 5.43 | | $ 7.61 | | $ 7.67 | | $ 5.38 |
| Net investment income (loss) | 0.05(a) | | 0.09(a) | | 0.13(a) | | 0.04 | | (0.01) | | (0.01) |
| Net realized and unrealized gain (loss) on investments | 1.59 | | 0.32 | | 0.78 | | (2.22) | | (0.05) | | 2.34 |
| Net realized and unrealized gain (loss) on foreign currency transactions‡ | (0.00) | | (0.00) | | (0.00) | | 0.00 | | (0.00) | | (0.00) |
| Total from investment operations | 1.64 | | 0.41 | | 0.91 | | (2.18) | | (0.06) | | 2.33 |
| Less distributions: | | | | | | | | | | | |
| From net investment income | — | | (0.15) | | (0.05) | | — | | — | | (0.04) |
| Net asset value at end of period | $ 8.19 | | $ 6.55 | | $ 6.29 | | $ 5.43 | | $ 7.61 | | $ 7.67 |
| Total investment return (b) | 25.04%(c) | | 6.89% | | 16.62% | | (28.65)%(c) | | (0.78)%(c) | | 43.33% |
| Ratios (to average net assets)/Supplemental Data: | | | | | | | | | | | |
| Net investment income (loss) | 1.27%†† | | 1.68% | | 2.17% | | 0.59% | | (0.10)% | | (0.12)%(d) |
| Net expenses (e) | 0.85%†† | | 0.86% | | 0.96% | | 0.94% | | 0.94% | | 0.93%(f) |
| Portfolio turnover rate | 36% | | 68% | | 87% | | 78% | | 17% | | 40% |
| Net assets at end of period (in 000’s) | $ 273,984 | | $ 238,908 | | $ 249,276 | | $ 240,067 | | $ 379,253 | | $ 432,891 |
��
| * | Unaudited. |
| ‡ | Less than one cent per share. |
| †† | Annualized. |
| (a) | Per share data based on average shares outstanding during the period. |
| (b) | Total return does not reflect any deduction of sales charges, mortality and expense charges, contract charges or administrative charges. For periods of less than one year, total return is not annualized. |
| (c) | Total investment return may reflect adjustments to conform to generally accepted accounting principles. |
| (d) | Without the custody fee reimbursement, net investment income (loss) would have been (0.13)%. |
| (e) | In addition to the fees and expenses which the Portfolio bears directly, it also indirectly bears a pro-rata share of the fees and expenses of the underlying funds in which it invests. Such indirect expenses are not included in the above expense ratios. |
| (f) | Without the custody fee reimbursement, net expenses would have been 0.94%. |
The notes to the financial statements are an integral part of, and should be read in conjunction with, the financial statements.
| 16 | MainStay VP Natural Resources Portfolio |
Notes to Financial Statements (Unaudited)
Note 1–Organization and Business
MainStay VP Funds Trust (the “Fund”) was organized as a Delaware statutory trust on February 1, 2011. The Fund is registered under the Investment Company Act of 1940, as amended (the “1940 Act”), as an open-end management investment company. The Fund is comprised of thirty-one separate series (collectively referred to as the “Portfolios”). These financial statements and notes relate to the MainStay VP Natural Resources Portfolio (formerly known as MainStay VP Mellon Natural Resources Portfolio) (the "Portfolio"), a "non-diversified” portfolio, as that term is defined in the 1940 Act, as interpreted or modified by regulatory authorities having jurisdiction, from time to time. Since the Portfolio has historically operated as a “diversified” portfolio, it will not operate as “non-diversified” without first obtaining shareholder approval.
Shares of the Portfolio are currently offered to certain separate accounts to fund variable annuity policies and variable universal life insurance policies issued by New York Life Insurance and Annuity Corporation (“NYLIAC”), a wholly-owned subsidiary of New York Life Insurance Company (“New York Life”) and may also be offered to fund variable annuity policies and variable universal life insurance policies issued by other insurance companies. NYLIAC allocates shares of the Portfolios to, among others, certain NYLIAC separate accounts. Shares of the Portfolio are also offered to the MainStay VP Conservative Allocation Portfolio, MainStay VP Moderate Allocation Portfolio, MainStay VP Growth Allocation Portfolio (formerly known as MainStay VP Moderate Growth Allocation Portfolio) and MainStay VP Equity Allocation Portfolio (formerly known as MainStay VP Growth Allocation Portfolio), which operate as “funds-of-funds," and other variable insurance funds.
The following table lists the Portfolio's share class that has been registered and commenced operations:
| Class | Commenced Operations |
| Initial Class | February 17, 2012 |
Shares of the Portfolio are offered and are redeemed at a price equal to their respective net asset value (“NAV”) per share. No sales or redemption charge is applicable to the purchase or redemption of the Portfolio's shares.
The Portfolio's investment objective is to seek long-term capital appreciation.
Note 2–Significant Accounting Policies
The Portfolio is an investment company and accordingly follows the investment company accounting and reporting guidance of the Financial Accounting Standards Board (“FASB”) Accounting Standard Codification Topic 946 Financial Services—Investment Companies. The Portfolio prepares its financial statements in accordance with generally accepted accounting principles (“GAAP”) in the United States of America and follows the significant accounting policies described below.
(A) Securities Valuation. Investments are usually valued as of the close of regular trading on the New York Stock Exchange (the "Exchange") (usually 4:00 p.m. Eastern time) on each day the Portfolio is open for business ("valuation date").
The Board of Trustees of the Fund (the "Board") adopted procedures establishing methodologies for the valuation of the Portfolio's securities and other assets and delegated the responsibility for valuation determinations under those procedures to the Valuation Committee of the Fund (the “Valuation Committee”). The procedures state that, subject to the oversight of the Board and unless otherwise noted, the responsibility for the day-to-day valuation of portfolio assets (including fair value measurements for the Portfolio's assets and liabilities) rests with New York Life Investment Management LLC (“New York Life Investments” or the "Manager"), aided to whatever extent necessary by the Subadvisor (as defined in Note 3(A)). To assess the appropriateness of security valuations, the Manager, the Subadvisor or the Portfolio's third-party service provider, who is subject to oversight by the Manager, regularly compares prior day prices, prices on comparable securities and the sale prices to the prior and current day prices and challenges prices with changes exceeding certain tolerance levels with third-party pricing services or broker sources.
The Board authorized the Valuation Committee to appoint a Valuation Subcommittee (the “Subcommittee”) to establish the prices of securities for which market quotations are not readily available or the prices of which are not otherwise readily determinable under the procedures. The Subcommittee meets (in person, via electronic mail or via teleconference) on an as-needed basis. The Valuation Committee meets to ensure that actions taken by the Subcommittee were appropriate.
For those securities valued through either a standardized fair valuation methodology or a fair valuation measurement, the Subcommittee deals with such valuation and the Valuation Committee reviews and affirms, if appropriate, the reasonableness of the valuation based on such methodologies and measurements on a regular basis after considering information that is reasonably available and deemed relevant by the Valuation Committee. Any action taken by the Subcommittee with respect to the valuation of a portfolio security or other asset is submitted for review and ratification (if appropriate) to the Valuation Committee and the Board at the next regularly scheduled meeting.
"Fair value" is defined as the price the Portfolio would reasonably expect to receive upon selling an asset or liability in an orderly transaction to an independent buyer in the principal or most advantageous market for the asset or liability. Fair value measurements are determined within a framework that establishes a three-tier hierarchy that maximizes the use of observable market data and minimizes the use of unobservable inputs to establish a classification of fair value measurements for disclosure purposes. "Inputs" refer broadly to the assumptions that market participants would use in pricing the asset or liability, including assumptions about risk, such as the risk inherent in a particular valuation technique used to measure fair value using a pricing model and/or the risk inherent in the inputs for the valuation technique. Inputs may be
Notes to Financial Statements (Unaudited) (continued)
observable or unobservable. Observable inputs reflect the assumptions market participants would use in pricing the asset or liability based on market data obtained from sources independent of the Portfolio. Unobservable inputs reflect the Portfolio’s own assumptions about the assumptions market participants would use in pricing the asset or liability based on the information available. The inputs or methodology used for valuing assets or liabilities may not be an indication of the risks associated with investing in those assets or liabilities. The three-tier hierarchy of inputs is summarized below.
| • | Level 1—quoted prices in active markets for an identical asset or liability |
| • | Level 2—other significant observable inputs (including quoted prices for a similar asset or liability in active markets, interest rates and yield curves, prepayment speeds, credit risk, etc.) |
| • | Level 3—significant unobservable inputs (including the Portfolio's own assumptions about the assumptions that market participants would use in measuring fair value of an asset or liability) |
The level of an asset or liability within the fair value hierarchy is based on the lowest level of an input, both individually and in the aggregate, that is significant to the fair value measurement. The aggregate value by input level of the Portfolio’s assets and liabilities as of June 30, 2021, is included at the end of the Portfolio of Investments.
The Portfolio may use third-party vendor evaluations, whose prices may be derived from one or more of the following standard inputs, among others:
| • Broker/dealer quotes | • Benchmark securities |
| • Two-sided markets | • Reference data (corporate actions or material event notices) |
| • Bids/offers | • Monthly payment information |
| • Industry and economic events | • Reported trades |
An asset or liability for which market values cannot be measured using the methodologies described above is valued by methods deemed reasonable in good faith by the Valuation Committee, following the procedures established by the Board, to represent fair value. Under these procedures, the Portfolio generally uses a market-based approach which may use related or comparable assets or liabilities, recent transactions, market multiples, book values and other relevant information. The Portfolio may also use an income-based valuation approach in which the anticipated future cash flows of the asset or liability are discounted to calculate fair value. Discounts may also be applied due to the nature and/or duration of any restrictions on the disposition of the asset or liability. Fair value represents a good faith approximation of the value of a security. Fair value determinations involve the consideration of a number of subjective factors, an analysis of applicable facts and circumstances and the exercise of judgment. As a result, it is possible that the fair value for a security determined in good faith in accordance with the Portfolio's valuation procedures may differ from valuations for the same security determined by other funds using their own valuation procedures. Although
the Portfolio's valuation procedures are designed to value a security at the price the Portfolio may reasonably expect to receive upon the security's sale in an orderly transaction, there can be no assurance that any fair value determination thereunder would, in fact, approximate the amount that the Portfolio would actually realize upon the sale of the security or the price at which the security would trade if a reliable market price were readily available. During the six-month period ended June 30, 2021, there were no material changes to the fair value methodologies.
Securities which may be valued in this manner include, but are not limited to: (i) a security for which trading has been halted or suspended; (ii) a debt security that has recently gone into default and for which there is not a current market quotation; (iii) a security of an issuer that has entered into a restructuring; (iv) a security that has been delisted from a national exchange; (v) a security for which the market price is not readily available from a third-party pricing source or, if so provided, does not, in the opinion of the Manager or the Subadvisor, reflect the security's market value; (vi) a security subject to trading collars for which no or limited trading takes place; and (vii) a security whose principal market has been temporarily closed at a time when, under normal conditions, it would be open. Securities valued in this manner are generally categorized as Level 3 in the hierarchy. No securities held by the Portfolio as of June 30, 2021 were fair valued in such a manner.
Certain securities held by the Portfolio may principally trade in foreign markets. Events may occur between the time the foreign markets close and the time at which the Portfolio's NAVs are calculated. These events may include, but are not limited to, situations relating to a single issuer in a market sector, significant fluctuations in U.S. or foreign markets, natural disasters, armed conflicts, governmental actions or other developments not tied directly to the securities markets. Should the Manager or the Subadvisor conclude that such events may have affected the accuracy of the last price of such securities reported on the local foreign market, the Subcommittee may, pursuant to procedures adopted by the Board, adjust the value of the local price to reflect the estimated impact on the price of such securities as a result of such events. In this instance, securities are generally categorized as Level 3 in the hierarchy. Additionally, certain foreign equity securities are also fair valued whenever the movement of a particular index exceeds certain thresholds. In such cases, the securities are fair valued by applying factors provided by a third-party vendor in accordance with valuation procedures adopted by the Board and are generally categorized as Level 2 in the hierarchy. No foreign equity securities held by the Portfolio as of June 30, 2021 were fair valued in such a manner.
Equity securities are valued at the last quoted sales prices as of the close of regular trading on the relevant exchange on each valuation date. Securities that are not traded on the valuation date are valued at the mean of the last quoted bid and ask prices. Prices are normally taken from the principal market in which each security trades. These securities are generally categorized as Level 1 in the hierarchy.
| 18 | MainStay VP Natural Resources Portfolio |
Investments in mutual funds, including money market funds, are valued at their respective NAVs at the close of business each day on the valuation date. These securities are generally categorized as Level 1 in the hierarchy.
Temporary cash investments acquired in excess of 60 days to maturity at the time of purchase are valued using the latest bid prices or using valuations based on a matrix system (which considers such factors as security prices, yields, maturities and ratings), both as furnished by independent pricing services. Temporary cash investments that mature in 60 days or less at the time of purchase ("Short-Term Investments") are valued using the amortized cost method of valuation, unless the use of such method would be inappropriate. The amortized cost method involves valuing a security at its cost on the date of purchase and thereafter assuming a constant amortization to maturity of the difference between such cost and the value on maturity date. Amortized cost approximates the current fair value of a security. Securities valued using the amortized cost method are not valued using quoted prices in an active market and are generally categorized as Level 2 in the hierarchy.
The information above is not intended to reflect an exhaustive list of the methodologies that may be used to value portfolio investments. The valuation procedures permit the use of a variety of valuation methodologies in connection with valuing portfolio investments. The methodology used for a specific type of investment may vary based on the market data available or other considerations. The methodologies summarized above may not represent the specific means by which portfolio investments are valued on any particular business day.
(B) Income Taxes. The Portfolio's policy is to comply with the requirements of the Internal Revenue Code of 1986, as amended (the “Internal Revenue Code”), applicable to regulated investment companies and to distribute all of its taxable income to the shareholders of the Portfolio within the allowable time limits.
The Manager evaluates the Portfolio’s tax positions to determine if the tax positions taken meet the minimum recognition threshold in connection with accounting for uncertainties in income tax positions taken or expected to be taken for the purposes of measuring and recognizing tax liabilities in the financial statements. Recognition of tax benefits of an uncertain tax position is permitted only to the extent the position is “more likely than not” to be sustained assuming examination by taxing authorities. The Manager analyzed the Portfolio's tax positions taken on federal, state and local income tax returns for all open tax years (for up to three tax years) and has concluded that no provisions for federal, state and local income tax are required in the Portfolio's financial statements. The Portfolio's federal, state and local income tax and federal excise tax returns for tax years for which the applicable statutes of limitations have not expired are subject to examination by the Internal Revenue Service and state and local departments of revenue.
(C) Foreign Taxes. The Portfolio may be subject to foreign taxes on income and other transaction-based taxes imposed by certain countries in which it invests. A portion of the taxes on gains on investments or
currency purchases/repatriation may be reclaimable. The Portfolio will accrue such taxes and reclaims as applicable, based upon its current interpretation of tax rules and regulations that exist in the markets in which it invests.
The Portfolio may be subject to taxation on realized capital gains, repatriation proceeds and other transaction-based taxes imposed by certain countries in which it invests. The Portfolio will accrue such taxes as applicable based upon its current interpretation of tax rules and regulations that exist in the market in which it invests. Capital gains taxes relating to positions still held are reflected as a liability in the Statement of Assets and Liabilities, as well as an adjustment to the Portfolio's net unrealized appreciation (depreciation). Taxes related to capital gains realized, if any, are reflected as part of net realized gain (loss) in the Statement of Operations. Changes in tax liabilities related to capital gains taxes on unrealized investment gains, if any, are reflected as part of the change in net unrealized appreciation (depreciation) on investments in the Statement of Operations. Transaction-based charges are generally assessed as a percentage of the transaction amount.
(D) Dividends and Distributions to Shareholders. Dividends and distributions are recorded on the ex-dividend date. The Portfolio intends to declare and pay dividends from net investment income and distributions from net realized capital and currency gains, if any, at least annually. Unless a shareholder elects otherwise, all dividends and distributions are reinvested at NAV in the same class of shares of the Portfolio. Dividends and distributions to shareholders are determined in accordance with federal income tax regulations and may differ from determinations using GAAP.
(E) Security Transactions and Investment Income. The Portfolio records security transactions on the trade date. Realized gains and losses on security transactions are determined using the identified cost method. Dividend income is recognized on the ex-dividend date, net of any foreign tax withheld at the source, and interest income is accrued as earned using the effective interest rate method. Distributions received from real estate investment trusts may be classified as dividends, capital gains and/or return of capital. Discounts and premiums on securities purchased for the Portfolio are accreted and amortized, respectively, on the effective interest rate method.
(F) Expenses. Expenses of the Fund are allocated to the individual Portfolios in proportion to the net assets of the respective Portfolios when the expenses are incurred, except where direct allocations of expenses can be made. The expenses borne by the Portfolio, including those of related parties to the Portfolio, are shown in the Statement of Operations.
Additionally, the Portfolio may invest in mutual funds, which are subject to management fees and other fees that may cause the costs of investing in mutual funds to be greater than the costs of owning the underlying securities directly. These indirect expenses of mutual funds are not included in the amounts shown as expenses in the Statement of Operations or in the expense ratios included in the Financial Highlights.
Notes to Financial Statements (Unaudited) (continued)
(G) Use of Estimates. In preparing financial statements in conformity with GAAP, the Manager makes estimates and assumptions that affect the reported amounts and disclosures in the financial statements. Actual results could differ from those estimates and assumptions.
(H) Foreign Currency Transactions. The Portfolio's books and records are maintained in U.S. dollars. Prices of securities denominated in foreign currency amounts are translated into U.S. dollars at the mean between the buying and selling rates last quoted by any major U.S. bank at the following dates:
(i) market value of investment securities, other assets and liabilities— at the valuation date; and
(ii) purchases and sales of investment securities, income and expenses—at the date of such transactions.
The assets and liabilities that are denominated in foreign currency amounts are presented at the exchange rates and market values at the close of the period. The realized and unrealized changes in net assets arising from fluctuations in exchange rates and market prices of securities are not separately presented.
Net realized gain (loss) on foreign currency transactions represents net currency gains or losses realized as a result of differences between the amounts of securities sale proceeds or purchase cost, dividends, interest and withholding taxes as recorded on the Portfolio's books, and the U.S. dollar equivalent amount actually received or paid. Net currency gains or losses from valuing such foreign currency denominated assets and liabilities, other than investments at valuation date exchange rates, are reflected in unrealized foreign exchange gains or losses.
(I) Securities Lending. In order to realize additional income, the Portfolio may engage in securities lending, subject to the limitations set forth in the 1940 Act and relevant guidance by the staff of the Securities and Exchange Commission (“SEC”). If the Portfolio engages in securities lending, the Portfolio will lend through its custodian, JPMorgan Chase Bank, N.A., ("JPMorgan"), acting as securities lending agent on behalf of the Portfolio. Under the current arrangement, JPMorgan will manage the Portfolio's collateral in accordance with the securities lending agency agreement between the Portfolio and JPMorgan, and indemnify the Portfolio against counterparty risk. The loans will be collateralized by cash (which may be invested in a money market fund) and/or non-cash collateral (which may include U.S. Treasury securities and/or U.S. government agency securities issued or guaranteed by the United States government or its agencies or instrumentalities) at least equal at all times to the market value of the securities loaned. The Portfolio bears the risk of delay in recovery of, or loss of rights in, the securities loaned. The Portfolio may also record a realized gain or loss on securities deemed sold due to a borrower’s inability to return securities on loan. The Portfolio bears the risk of any loss on investment of cash collateral. The Portfolio will receive compensation for lending its securities in the form of fees or it will retain a portion of interest earned on the investment of any cash collateral. The Portfolio will also continue to receive interest and dividends on the securities loaned and any gain or loss in the market price of the
securities loaned that may occur during the term of the loan will be for the account of the Portfolio. Income earned from securities lending activities, if any, is reflected in the Statement of Operations. Securities on loan as of June 30, 2021, are shown in the Portfolio of Investments.
Prior to February 22, 2021, these services were provided by State Street Bank and Trust Company (“State Street”).
(J) Foreign Securities Risk. The Portfolio may invest in foreign securities, which carry certain risks that are in addition to the usual risks inherent in domestic securities. These risks include those resulting from currency fluctuations, future adverse political or economic developments and possible imposition of currency exchange blockages or other foreign governmental laws or restrictions. These risks are likely to be greater in emerging markets than in developed markets. The ability of issuers of debt securities held by the Portfolio to meet their obligations may be affected by, among other things, economic or political developments in a specific country, industry or region.
(K) Indemnifications. Under the Fund’s organizational documents, its officers and trustees are indemnified against certain liabilities that may arise out of performance of their duties to the Fund. Additionally, in the normal course of business, the Portfolio enters into contracts with third-party service providers that contain a variety of representations and warranties and that may provide general indemnifications. The Portfolio's maximum exposure under these arrangements is unknown, as this would involve future claims that may be made against the Portfolio that have not yet occurred. The Manager believes that the risk of loss in connection with these potential indemnification obligations is remote. However, there can be no assurance that material liabilities related to such obligations will not arise in the future, which could adversely impact the Portfolio.
Note 3–Fees and Related Party Transactions
(A) Manager and Subadvisor. New York Life Investments, a registered investment adviser and an indirect, wholly-owned subsidiary of New York Life, serves as the Portfolio’s Manager, pursuant to an Amended and Restated Management Agreement (“Management Agreement”). The Manager provides offices, conducts clerical, recordkeeping and bookkeeping services, and keeps most of the financial and accounting records required to be maintained by the Portfolio. Except for the portion of salaries and expenses that are the responsibility of the Portfolio, the Manager pays the salaries and expenses of all personnel affiliated with the Portfolio and certain operational expenses of the Portfolio. The Portfolio reimburses New York Life Investments in an amount equal to the portion of the compensation of the Chief Compliance Officer attributable to the Portfolio. Mellon Investments Corporation (“Mellon” or the “Subadvisor”), a registered investment adviser, serves as Subadvisor to the Portfolio and is responsible for the day-to-day portfolio management of the Portfolio. Pursuant to the terms of a Subadvisory Agreement (“Subadvisory Agreement”) between New York Life Investments and Mellon, New York Life Investments pays for the services of the Subadvisor.
| 20 | MainStay VP Natural Resources Portfolio |
Pursuant to the Management Agreement, the Fund pays the Manager, on behalf of the Portfolio, a monthly fee for the services performed and the facilities furnished at an annual rate of the Portfolio's average daily net assets as follows: 0.79% up to $1 billion; and 0.78% in excess of $1 billion. During the six-month period ended June 30, 2021, the effective management fee rate was 0.79%.
During the six-month period ended June 30, 2021, New York Life Investments earned fees from the Portfolio in the amount of $1,033,105 and paid the Subadvisor fees in the amount of $495,443.
JPMorgan provides sub-administration and sub-accounting services to the Portfolio pursuant to an agreement with New York Life Investments. These services include calculating the daily NAVs of the Portfolio,
maintaining the general ledger and sub-ledger accounts for the calculation of the Portfolio's NAVs, and assisting New York Life Investments in conducting various aspects of the Portfolio's administrative operations. For providing these services to the Portfolio, JPMorgan is compensated by New York Life Investments.
Prior to February 22, 2021, these services were provided by State Street.
Pursuant to an agreement between the Fund and New York Life Investments, New York Life Investments is responsible for providing or procuring certain regulatory reporting services for the Portfolio. The Portfolio will reimburse New York Life Investments for the actual costs incurred by New York Life Investments in connection with providing or procuring these services for the Portfolio.
(B) Investments in Affiliates (in 000’s). During the six-month period ended June 30, 2021, purchases and sales transactions, income earned from investments and shares held of investment companies managed by New York Life Investments or its affiliates were as follows:
| Affiliated Investment Companies | Value,
Beginning
of Period | Purchases
at Cost | Proceeds
from
Sales | Net
Realized
Gain/(Loss)
on Sales | Change in
Unrealized
Appreciation/
(Depreciation) | Value,
End of
Period | Dividend
Income | Other
Distributions | Shares
End of
Period |
| MainStay U.S. Government Liquidity Fund | $ 1,065 | $ 42,087 | $ (41,332) | $ — | $ — | $ 1,820 | $ —(a) | $ — | 1,820 |
Note 4-Federal Income Tax
As of June 30, 2021, the cost and unrealized appreciation (depreciation) of the Portfolio’s investment portfolio, including applicable derivative contracts and other financial instruments, as determined on a federal income tax basis, were as follows:
| | Federal Tax
Cost | Gross
Unrealized
Appreciation | Gross
Unrealized
(Depreciation) | Net
Unrealized
Appreciation/
(Depreciation) |
| Investments in Securities | $221,771,070 | $61,348,949 | $(5,040,775) | $56,308,174 |
As of December 31, 2020, for federal income tax purposes, capital loss carryforwards of $225,676,269, as shown in the table below, were available to the extent provided by the regulations to offset future realized gains of the Portfolio. Accordingly, no capital gains distributions are expected to be paid to shareholders until net gains have been realized in excess of such amounts.
Capital Loss
Available Through | Short-Term
Capital Loss
Amounts (000’s) | Long-Term
Capital Loss
Amounts (000’s) |
| Unlimited | $37,930 | $187,746 |
During the year ended December 31, 2020, the tax character of distributions paid as reflected in the Statements of Changes in Net Assets was as follows:
| | 2020 |
| Distributions paid from: | |
| Ordinary Income | $5,462,396 |
Note 5–Custodian
JPMorgan is the custodian of cash and securities held by the Portfolio. Custodial fees are charged to the Portfolio based on the Portfolio's net assets and/or the market value of securities held by the Portfolio and the number of certain transactions incurred by the Portfolio.
Prior to February 22, 2021, these services were provided by State Street. The services provided by State Street were a direct expense of the Portfolio and are included in the Statement of Operations as Custodian fees which totaled $5,621 for the period January 1, 2021 through February 21, 2021.
Note 6–Line of Credit
The Portfolio and certain other funds managed by New York Life Investments maintain a line of credit with a syndicate of banks in order to secure a source of funds for temporary purposes to meet unanticipated or excessive redemption requests.
Effective July 27, 2021, under the credit agreement (the “Credit Agreement”), the aggregate commitment amount is $600,000,000 with
Notes to Financial Statements (Unaudited) (continued)
an additional uncommitted amount of $100,000,000. The commitment fee is an annual rate of 0.15% of the average commitment amount payable quarterly, regardless of usage, to JPMorgan, who serves as the agent to the syndicate. The commitment fee is allocated among the Portfolio and certain other funds managed by New York Life Investments based upon their respective net assets and other factors. Interest on any revolving credit loan is charged based upon the Federal Funds Rate or the one-month London Interbank Offered Rate ("LIBOR"), whichever is higher. The Credit Agreement expires on July 26, 2022, although the Portfolio, certain other funds managed by New York Life Investments and the syndicate of banks may renew the Credit Agreement for an additional year on the same or different terms or enter into a credit agreement with a different syndicate of banks. Prior to July 27, 2021, the aggregate commitment amount and the commitment fee were the same as those under the current Credit Agreement. During the six-month period ended June 30, 2021, there were no borrowings made or outstanding with respect to the Portfolio under the Credit Agreement.
Note 7–Interfund Lending Program
Pursuant to an exemptive order issued by the SEC, the Portfolio, along with certain other funds managed by New York Life Investments, may participate in an interfund lending program. The interfund lending program provides an alternative credit facility that permits the Portfolio and certain other funds managed by New York Life Investments to lend or borrow money for temporary purposes directly to or from one another, subject to the conditions of the exemptive order. During the six-month period ended June 30, 2021, there were no interfund loans made or outstanding with respect to the Portfolio.
Note 8–Purchases and Sales of Securities (in 000’s)
During the six-month period ended June 30, 2021, purchases and sales of securities, other than short-term securities, were $90,661 and $114,015, respectively.
Note 9–Capital Share Transactions
Transactions in capital shares for the six-month period ended June 30, 2021 and the year ended December 31, 2020, were as follows:
| Initial Class | Shares | Amount |
| Period ended June 30, 2021: | | |
| Shares sold | 1,083,775 | $ 8,357,046 |
| Shares redeemed | (4,130,744) | (30,762,664) |
| Net increase (decrease) | (3,046,969) | $(22,405,618) |
| Year ended December 31, 2020: | | |
| Shares sold | 4,689,954 | $ 21,659,133 |
| Shares issued to shareholders in reinvestment of distributions | 997,534 | 5,462,396 |
| Shares redeemed | (8,836,986) | (48,522,616) |
| Net increase (decrease) | (3,149,498) | $(21,401,087) |
Note 10–Other Matters
An outbreak of COVID-19, first detected in December 2019, has developed into a global pandemic and has resulted in travel restrictions, closure of international borders, certain businesses and securities markets, restrictions on securities trading activities, prolonged quarantines, supply chain disruptions, and lower consumer demand, as well as general concern and uncertainty. The continued impact of COVID-19 and related new variants is uncertain and could further adversely affect the global economy, national economies, individual issuers and capital markets in unforeseeable ways and result in a substantial and extended economic downturn. Developments that disrupt global economies and financial markets, such as COVID-19, may magnify factors that affect the Portfolio's performance.
Note 11–Subsequent Events
In connection with the preparation of the financial statements of the Portfolio as of and for the six-month period ended June 30, 2021, events and transactions subsequent to June 30, 2021, through the date the financial statements were issued have been evaluated by the Manager for possible adjustment and/or disclosure. No subsequent events requiring financial statement adjustment or disclosure have been identified.
| 22 | MainStay VP Natural Resources Portfolio |
Discussion of the Operation and Effectiveness of the Portfolio's Liquidity Risk Management Program (Unaudited)
In compliance with Rule 22e-4 under the Investment Company Act of 1940, as amended (the “Liquidity Rule”), the Portfolio has adopted and implemented a liquidity risk management program (the “Program”), which New York Life Investment Management LLC believes is reasonably designed to assess and manage the Portfolio's liquidity risk (the risk that the Portfolio could not meet requests to redeem shares issued by the Portfolio without significant dilution of remaining investors’ interests in the Portfolio). The Board of Trustees of MainStay VP Funds Trust (the "Board") designated New York Life Investment Management LLC as administrator of the Program (the “Administrator”). The Administrator has established a Liquidity Risk Management Committee to assist the Administrator in the implementation and day-to-day administration of the Program and to otherwise support the Administrator in fulfilling its responsibilities under the Program.
At a meeting of the Board held on March 8, 2021, the Administrator provided the Board with a written report addressing the Program’s operation and assessing its adequacy and effectiveness of implementation for the period from January 1, 2020 through December 31, 2020 (the "Review Period"), as required under the Liquidity Rule. The report noted that the Administrator concluded that (i) the Program operated effectively to assess and manage the Portfolio's liquidity risk, (ii) the Program has been adequately and effectively implemented to monitor and, as applicable, respond to the Portfolio's liquidity developments and (iii) the Portfolio's investment strategy continues to be appropriate for an open-end fund. In addition, the report discussed notable events that impacted liquidity risk during the Review Period, including the COVID-19 pandemic and the resulting economic shutdown.
In accordance with the Program, the Portfolio's liquidity risk is assessed no less frequently than annually taking into consideration certain factors, as applicable, such as (i) investment strategy and liquidity of portfolio investments, (ii) short-term and long-term cash flow projections and (iii) holdings of cash and cash equivalents, as well as borrowing arrangements and other funding sources. Certain factors are considered under both normal and reasonably foreseeable stressed conditions.
Each Portfolio portfolio investment is classified into one of four liquidity categories. The classification is based on a determination of the number of days it is reasonably expected to take to convert the investment into cash, or sell or dispose of the investment, in current market conditions without significantly changing the market value of the investment. The Administrator has delegated liquidity classification determinations to the Portfolio’s subadvisor, subject to appropriate oversight by the Administrator, and classification determinations are made by taking into account the Portfolio's reasonably anticipated trade size, various market, trading and investment-specific considerations, as well as market depth, and, in certain cases, third-party vendor data.
The Liquidity Rule requires portfolios that do not primarily hold assets that are highly liquid investments to adopt a minimum amount of net assets that must be invested in highly liquid investments that are assets (an “HLIM”). In addition, the Liquidity Rule limits a portfolio's investments in illiquid investments. Specifically, the Liquidity Rule prohibits acquisition of illiquid investments if doing so would result in a portfolio holding more than 15% of its net assets in illiquid investments that are assets. The Program includes provisions reasonably designed to determine, periodically review and comply with the HLIM requirement, as applicable, and to comply with the 15% limit on illiquid investments.
There can be no assurance that the Program will achieve its objectives under all circumstances in the future. Please refer to the Portfolio's prospectus for more information regarding the Portfolio's exposure to liquidity risk and other risks to which it may be subject.
Proxy Voting Record
The Portfolio is required to file with the SEC its proxy voting records for the 12-month period ending June 30 on Form N-PX. The Portfolio's most recent Form N-PX or proxy voting record is available free of charge upon request (i) by calling 800-598-2019; (ii) by visiting New York Life Investments’ website at https://www.nylinvestments.com/mainstay/
products-and-performance/mainstay-vp-funds-trust; or (iii) by visiting the SEC’s website at www.sec.gov.
Shareholder Reports and Quarterly Portfolio Disclosure
The Portfolio is required to file its complete schedule of portfolio holdings with the SEC 60 days after its first and third fiscal quarter on Form N-PORT. The Portfolio's holdings report is available free of charge upon request by calling 800-598-2019 or by visiting the SEC’s website at www.sec.gov.
| 24 | MainStay VP Natural Resources Portfolio |
This page intentionally left blank
This page intentionally left blank.
MainStay VP Portfolios
MainStay VP offers a wide range of Portfolios. The full array of MainStay VP offerings is listed here, with information about the manager, subadvisors, legal counsel, and independent registered public accounting firm.
Equity
MainStay VP Candriam Emerging Markets Equity Portfolio
MainStay VP Epoch U.S. Equity Yield Portfolio
MainStay VP Fidelity Institutional AM® Utilities Portfolio†
MainStay VP MacKay International Equity Portfolio
MainStay VP MacKay S&P 500 Index Portfolio
MainStay VP Natural Resources Portfolio
MainStay VP Small Cap Growth Portfolio
MainStay VP T. Rowe Price Equity Income Portfolio
MainStay VP Wellington Growth Portfolio
MainStay VP Wellington Mid Cap Portfolio
MainStay VP Wellington Small Cap Portfolio
MainStay VP Wellington U.S. Equity Portfolio
MainStay VP Winslow Large Cap Growth Portfolio
Mixed Asset
MainStay VP Balanced Portfolio
MainStay VP Income Builder Portfolio
MainStay VP Janus Henderson Balanced Portfolio
MainStay VP MacKay Convertible Portfolio
Income
MainStay VP Bond Portfolio
MainStay VP Floating Rate Portfolio
MainStay VP Indexed Bond Portfolio
MainStay VP MacKay Government Portfolio
MainStay VP MacKay High Yield Corporate Bond Portfolio
MainStay VP MacKay Strategic Bond Portfolio
MainStay VP PIMCO Real Return Portfolio
Money Market
MainStay VP U.S. Government Money Market Portfolio
Alternative
MainStay VP CBRE Global Infrastructure Portfolio
MainStay VP IQ Hedge Multi-Strategy Portfolio
Asset Allocation
MainStay VP Conservative Allocation Portfolio
MainStay VP Equity Allocation Portfolio
MainStay VP Growth Allocation Portfolio
MainStay VP Moderate Allocation Portfolio
Manager
New York Life Investment Management LLC
New York, New York
Subadvisors
Brown Advisory LLC
Baltimore, Maryland
Candriam Belgium S.A.*
Brussels, Belgium
CBRE Clarion Securities LLC
Radnor, Pennsylvania
Epoch Investment Partners, Inc.
New York, New York
FIAM LLC
Smithfield, Rhode Island
IndexIQ Advisors LLC*
New York, New York
Janus Capital Management LLC
Denver, Colorado
MacKay Shields LLC*
New York, New York
Mellon Investments Corporation
Boston, Massachusetts
NYL Investors LLC*
New York, New York
Pacific Investment Management Company LLC
Newport Beach, California
Segall Bryant & Hamill, LLC
Chicago, Illinois
T. Rowe Price Associates, Inc.
Baltimore, Maryland
Wellington Management Company LLP
Boston, Massachusetts
Winslow Capital Management, LLC
Minneapolis, Minnesota
Legal Counsel
Dechert LLP
Washington, District of Columbia
Independent Registered Public Accounting Firm
PricewaterhouseCoopers LLP
New York, New York
Distributor
NYLIFE Distributors LLC*
Jersey City, New Jersey
Custodian
JPMorgan Chase Bank, N.A.
New York, New York
Some Portfolios may not be available in all products.
† Fidelity Institutional AM is a registered trade mark of FMR LLC. Used with permission.
* An affiliate of New York Life Investment Management LLC
Not part of the Semiannual Report
2021 Semiannual Report
This report is for the general information of New York Life Variable Annuities and NYLIAC Variable Universal Life Insurance Products policyowners. It must be preceded or accompanied by the appropriate product(s) and funds prospectuses if it is given to anyone who is not an owner of a New York Life variable annuity policy or a NYLIAC Variable Universal Life Insurance Product. This report does not offer for sale or solicit orders to purchase securities.
The performance data quoted in this report represents past performance. Past performance is no guarantee of future results. Due to market volatility and other factors, current performance may be lower or higher than the figures shown. The most recent month-end performance summary for your variable annuity or variable life policy is available by calling 800-598-2019 and is updated periodically on newyorklife.com.
The New York Life Variable Annuities and NYLIAC Variable Universal Life Insurance Products are issued by New York Life Insurance and Annuity Corporation (a Delaware Corporation) and distributed by NYLIFE Distributors LLC (Member FINRA/SIPC).
New York Life Insurance Company
New York Life Insurance and Annuity
Corporation (NYLIAC) (A Delaware Corporation)
51 Madison Avenue, Room 551
New York, NY 10010
newyorklife.com
nylinvestments.com
NYLIFE Distributors LLC, 30 Hudson Street, Jersey City, NJ 07302
New York Life Investment Management LLC is the investment manager to the MainStay VP Funds Trust
©2021 by NYLIFE Distributors LLC. All rights reserved.
You may obtain copies of the Prospectus and the Statement of Additional Information free of charge, upon request, by calling toll-free 800-598-2019 or writing to New York Life Insurance and Annuity Corporation, 51 Madison Avenue, New York, NY 10010.
| Not FDIC Insured | No Bank Guarantee | May Lose Value |
(NYLIAC) NI533
MainStay VP MacKay S&P 500 Index Portfolio
Message from the President and Semiannual Report
Unaudited | June 30, 2021
Sign up for e-delivery of your shareholder reports. For full details on e-delivery, including who can participate and what you can receive via e-delivery,
please log in to newyorklifeinvestments.com/accounts.
| Not FDIC/NCUA Insured | Not a Deposit | May Lose Value | No Bank Guarantee | Not Insured by Any Government Agency |
This page intentionally left blank
Message from the President
The COVID-19 pandemic continued to afflict our personal lives and broad segments of the U.S. and global economy throughout the six-month reporting period ended June 30, 2021. However, with the deployment of multiple vaccines around the world, including three highly effective versions approved for emergency use in the United States, investors began to turn their attention toward the gradual reopening of the economy and the shape the “new normal” would take.
The first half of the reporting period saw increasing inflationary concerns as fiscal stimulus business reopenings drove accelerating economic growth, rising commodity prices and increased consumer spending. However, the U.S. Federal Reserve noted that price increases were likely to prove temporary and made clear their intention to remain accommodative for the foreseeable future. Accordingly, after moving higher in the first quarter of 2021, interest rates declined in the second quarter.
In response to the uncertain inflation outlook, equity market leadership shifted from value in the first quarter of the year to growth in the second quarter. Nevertheless, investor sentiment remained buoyant throughout the reporting period, with all eleven sectors in the S&P 500® Index, a widely regarded benchmark of market performance, producing positive returns. Energy led the market’s rise fueled by rapidly increasing oil and gas prices, followed by financials and real estate, which benefited from rising interest rates and the economic reopening, respectively. Communication services produced the slowest growth, followed by the traditionally defensive utilities and consumer staples
sectors. In the fixed income market, lower-credit-quality issues tended to outperform their higher-grade counterparts, with high-yield corporate bonds generating the strongest performance. Among securitized products, commercial mortgage-backed securities generally produced the strongest returns, followed by mortgage-backed securities and asset-backed securities, while Treasury securities lagged.
Despite the tremendous progress we’ve seen so far this year, the United States and the world continue to face significant pandemic-related challenges. Newer, more contagious variants of COVID-19 threaten the return of restrictions and lockdowns that could stall the economic recovery. At the same time, supply chain shortages have led to rising prices on everything from laptops to autos, stoking fears of uncontrolled inflation despite reassurance from the U.S. Federal Reserve. At New York Life Investments, we recognize that the shape that the “new normal” eventually takes may differ from our expectations. You can depend on us to keep a sharp watch for the unexpected, and to continue to help you find your way through this rapidly evolving investment landscape.
Sincerely,
Kirk C. Lehneis
President
The opinions expressed are as of the date of this report and are subject to change. There is no guarantee that any forecast made will come to pass. This material does not constitute investment advice and is not intended as an endorsement of any specific investment. Past performance is no guarantee of future results.
Not part of the Semiannual Report
Investors should refer to the Portfolio’s Summary Prospectus and/or Prospectus and consider the Portfolio’s investment objectives, strategies, risks, charges and expenses carefully before investing. The Summary Prospectus and/or Prospectus contain this and other information about the Portfolio. You may obtain copies of the Portfolio’s Summary Prospectus and/or the Prospectus and the Statement of Additional Information free of charge, upon request, by calling toll-free 800-598-2019, by writing to New York Life Insurance and Annuity Corporation, 51 Madison Avenue, Room 251, New York, New York 10010 or by sending an email to MainStayShareholdersServices@nylim.com. These documents are also available at nylinvestments.com/vpdocuments. Please read the Portfolio's Summary Prospectus and/or Prospectus carefully before investing. MainStay VP Funds Trust portfolios are separate account options which are purchased through a variable insurance or variable annuity contract.
Investment and Performance Comparison (Unaudited)
Performance data quoted represents past performance. Past performance is no guarantee of future results. Because of market volatility and other factors, current performance may be lower or higher than the figures shown. Investment return and principal value will fluctuate, and as a result, when shares are redeemed, they may be worth more or less than their original cost. The performance table and graph do not reflect any deduction of sales charges, mortality and expense charges, contract charges or administrative charges. Please refer to the Performance Summary appropriate for your policy. For performance information current to the most recent month-end, please call 800-598-2019 or visit www.newyorklife.com.
Performance figures may reflect certain fee waivers and/or expense limitations, without which total returns may have been different. For information on current fee waivers and/or expense limitations (if any), please refer to the Notes to Financial Statements.
| Average Annual Total Returns for the Period-Ended June 30, 2021 |
| Class | Inception
Date | Six
Months | One
Year | Five
Years | Ten
Years | Gross
Expense
Ratio1 |
| Initial Class Shares | 1/29/1993 | 15.16% | 40.57% | 17.42% | 14.56% | 0.20% |
| Service Class Shares | 6/5/2003 | 15.02 | 40.22 | 17.13 | 14.28 | 0.45 |
| 1. | The gross expense ratios presented reflect the Portfolio’s “Total Annual Portfolio Operating Expenses” from the most recent Prospectus, as supplemented, and may differ from other expense ratios disclosed in this report. |
| Benchmark Performance | Six
Months | One
Year | Five
Years | Ten
Years |
| S&P 500® Index1 | 15.25% | 40.79% | 17.65% | 14.84% |
| Morningstar Large Blend Category Average2 | 14.78 | 39.87 | 15.65 | 12.51 |
| 1. | The S&P 500® Index is the Portfolio's primary benchmark. “S&P 500®" is a trademark of The McGraw-Hill Companies, Inc. The S&P 500® Index is widely regarded as the standard index for measuring large-cap U.S. stock market performance. Results assume reinvestment of all dividends and capital gains. An investment cannot be made directly in an index. |
| 2. | The Morningstar Large Blend Category Average is representative of funds that represent the overall U.S. stock market in size, growth rates and price. Stocks in the top 70% of the capitalization of the U.S. equity market are defined as large cap. The blend style is assigned to funds' where neither growth nor value characteristics predominate. These funds tend to invest across the spectrum of U.S. industries, and owing to their broad exposure, the funds' returns are often similar to those of the S&P 500® Index. Results are based on average total returns of similar funds with all dividends and capital gain distributions reinvested. |
Cost in Dollars of a $1,000 Investment in MainStay VP MacKay S&P 500 Index Portfolio (Unaudited)
The example below is intended to describe the fees and expenses borne by shareholders during the six-month period from January 1, 2021 to June 30, 2021, and the impact of those costs on your investment.
Example
As a shareholder of the Portfolio you incur two types of costs: (1) transaction costs, including exchange fees and sales charges (loads) on purchases (as applicable), and (2) ongoing costs, including management fees, distribution and/or service (12b-1) fees, and other Portfolio expenses (as applicable). This example is intended to help you understand your ongoing costs (in dollars) of investing in the Portfolio and to compare these costs with the ongoing costs of investing in other mutual funds. The example is based on an investment of $1,000 made at the beginning of the six-month period and held for the entire period from January 1, 2021 to June 30, 2021. Shares are only sold in connection with variable life and annuity contracts and the example does not reflect any contract level or transactional fees or expenses. If these costs had been included, your costs would have been higher.
This example illustrates your Portfolio’s ongoing costs in two ways:
Actual Expenses
The second and third data columns in the table below provide information about actual account values and actual expenses. You may use the information in these columns, together with the amount you invested, to estimate the expenses that you paid during the six months ended June
30, 2021. Simply divide your account value by $1,000 (for example, an $8,600 account value divided by $1,000 = 8.6), then multiply the result by the number under the heading entitled “Expenses Paid During Period” to estimate the expenses you paid on your account during this period.
Hypothetical Example for Comparison Purposes
The fourth and fifth data columns in the table below provide information about hypothetical account values and hypothetical expenses based on the Portfolio’s actual expense ratio and an assumed rate of return of 5% per year before expenses, which is not the Portfolio’s actual return. The hypothetical account values and expenses may not be used to estimate the actual ending account balances or expenses you paid for the six-month period shown. You may use this information to compare the ongoing costs of investing in the Portfolio with the ongoing costs of investing in other mutual funds. To do so, compare this 5% hypothetical example with the 5% hypothetical examples that appear in the shareholder reports of the other mutual funds.
Please note that the expenses shown in the table are meant to highlight your ongoing costs only and do not reflect any transactional costs, such as exchange fees or sales charges (loads). Therefore, the fourth and fifth data columns of the table are useful in comparing ongoing costs only and will not help you determine the relative total costs of owning different funds. In addition, if these transactional costs were included, your costs would have been higher.
| Share Class | Beginning
Account
Value
1/1/21 | Ending Account
Value (Based
on Actual
Returns and
Expenses)
6/30/21 | Expenses
Paid
During
Period1 | Ending Account
Value (Based
on Hypothetical
5% Annualized
Return and
Actual Expenses)
6/30/21 | Expenses
Paid
During
Period1 | Net Expense
Ratio
During
Period2 |
| Initial Class Shares | $1,000.00 | $1,151.60 | $0.64 | $1,024.20 | $0.60 | 0.12% |
| Service Class Shares | $1,000.00 | $1,150.20 | $1.97 | $1,022.96 | $1.86 | 0.37% |
| 1. | Expenses are equal to the Portfolio’s annualized expense ratio of each class multiplied by the average account value over the period, divided by 365 and multiplied by 181 (to reflect the six-month period). The table above represents the actual expenses incurred during the six-month period. In addition to the fees and expenses which the Portfolio bears directly, it also indirectly bears a pro rata share of the fees and expenses of the underlying funds in which it invests. Such indirect expenses are not included in the above-reported expense figures. |
| 2. | Expenses are equal to the Portfolio's annualized expense ratio to reflect the six-month period. |
| 6 | MainStay VP MacKay S&P 500 Index Portfolio |
Industry Composition as of June 30, 2021 (Unaudited)
| Software | 8.8% |
| Interactive Media & Services | 6.4 |
| Technology Hardware, Storage & Peripherals | 6.2 |
| Semiconductors & Semiconductor Equipment | 5.7 |
| IT Services | 5.1 |
| Banks | 4.3 |
| Internet & Direct Marketing Retail | 4.2 |
| Pharmaceuticals | 3.6 |
| Health Care Equipment & Supplies | 3.6 |
| Capital Markets | 3.0 |
| Health Care Providers & Services | 2.6 |
| Oil, Gas & Consumable Fuels | 2.6 |
| Equity Real Estate Investment Trusts | 2.5 |
| Specialty Retail | 2.2 |
| Hotels, Restaurants & Leisure | 2.0 |
| Entertainment | 1.9 |
| Insurance | 1.8 |
| Automobiles | 1.8 |
| Biotechnology | 1.8 |
| Chemicals | 1.8 |
| Machinery | 1.7 |
| Aerospace & Defense | 1.6 |
| Electric Utilities | 1.5 |
| Diversified Financial Services | 1.4 |
| Beverages | 1.4 |
| Household Products | 1.3 |
| Food & Staples Retailing | 1.3 |
| Media | 1.3 |
| Life Sciences Tools & Services | 1.3 |
| Diversified Telecommunication Services | 1.2 |
| Industrial Conglomerates | 1.2 |
| Road & Rail | 1.0 |
| Food Products | 0.9 |
| Communications Equipment | 0.8 |
| Multi–Utilities | 0.7% |
| Textiles, Apparel & Luxury Goods | 0.7 |
| Air Freight & Logistics | 0.7 |
| Tobacco | 0.7 |
| Consumer Finance | 0.7 |
| Electronic Equipment, Instruments & Components | 0.6 |
| Electrical Equipment | 0.6 |
| Multiline Retail | 0.5 |
| Building Products | 0.5 |
| Household Durables | 0.4 |
| Professional Services | 0.4 |
| Commercial Services & Supplies | 0.4 |
| Metals & Mining | 0.4 |
| Containers & Packaging | 0.3 |
| Airlines | 0.3 |
| Energy Equipment & Services | 0.2 |
| Wireless Telecommunication Services | 0.2 |
| Personal Products | 0.2 |
| Trading Companies & Distributors | 0.2 |
| Auto Components | 0.2 |
| Distributors | 0.1 |
| Construction Materials | 0.1 |
| Real Estate Management & Development | 0.1 |
| Water Utilities | 0.1 |
| Health Care Technology | 0.1 |
| Independent Power and Renewable Electricity Producers | 0.1 |
| Construction & Engineering | 0.0‡ |
| Gas Utilities | 0.0‡ |
| Leisure Products | 0.0‡ |
| Short–Term Investments | 0.7 |
| Other Assets, Less Liabilities | –0.0‡ |
| | 100.0% |
| ‡ | Less than one–tenth of a percent. |
See Portfolio of Investments beginning on page 9 for specific holdings within these categories. The Portfolio's holdings are subject to change.
Top Ten Holdings as of June 30, 2021 (excluding short-term investments) (Unaudited)
| 1. | Apple, Inc. |
| 2. | Microsoft Corp. |
| 3. | Amazon.com, Inc. |
| 4. | Alphabet, Inc. |
| 5. | Facebook, Inc., Class A |
| 6. | Berkshire Hathaway, Inc., Class B |
| 7. | Tesla, Inc. |
| 8. | NVIDIA Corp. |
| 9. | JPMorgan Chase & Co. |
| 10. | Johnson & Johnson |
Portfolio Management Discussion and Analysis (Unaudited)
Answers to the questions reflect the views of portfolio managers Francis J. Ok and Lee Baker1 of MacKay Shields LLC, the Portfolio’s Subadvisor.
How did MainStay VP MacKay S&P 500® Index Portfolio perform relative to its benchmark and peers during the six months ended June 30, 2021?
For the six months ended June 30, 2021, MainStay VP MacKay S&P 500® Index Portfolio returned 15.16% for Initial Class shares and 15.02% for Service Class shares. Over the same period, both share classes underperformed the 15.25% return of the S&P 500® Index (“the Index”), which is the Portfolio’s benchmark. Although the Portfolio seeks investment results that correspond to the total return performance of common stocks in the aggregate as represented by the S&P 500® Index, the Portfolio’s net performance will typically lag that of the Index because the Portfolio incurs operating expenses that the Index does not. For the six months ended June 30, 2021, both share classes outperformed the 14.78% return of the Morningstar Large Blend Category Average.2
During the reporting period, which S&P 500® industries had the highest total returns and which industries had the lowest total returns?
The Index industry groups with the highest total returns during the reporting period included oil, gas & consumable fuels, consumer finance and real estate management & development. Conversely, the industry groups that had the lowest total returns were household products and entertainment, both of which produced negative returns, and health care technology, which lagged but produced a positive absolute return.
During the reporting period, which S&P 500® industries made the strongest positive contributions to the Portfolio’s absolute performance and which industries made the weakest contributions?
The Index industries that made the strongest positive contributions to the Portfolio’s absolute performance during the reporting period included interactive media & services, software and banks. (Contributions take weightings and total returns into account.) During the same period, the industries that made the weakest contributions to the Portfolio’s absolute performance included household products and entertainment.
During the reporting period, which individual stocks in the S&P 500® Index had the highest total returns and which individual stocks had the lowest total returns?
The Index stocks with the highest total returns during the reporting period were vehicle manufacturer Ford Motor, oil & gas exploration & production company EOG Resources and steel
producer Nucor. Conversely, the stocks with the lowest total returns were biotechnology developer Vertex Pharmaceuticals, digital payment company Global Payments and professional services provider Cognizant Technology Solution.
During the reporting period, which S&P 500® stocks made the strongest positive contributions to the Portfolio’s absolute performance and which S&P 500® stocks made the weakest contributions?
The Index stocks that made the strongest positive contributions to the Portfolio’s absolute performance during the reporting period included software company Microsoft, online advertiser and Internet services provider Alphabet, and social media platform Facebook. The stocks making the weakest contributions were electric car maker Tesla, wireless technology company Qualcomm and Vertex Pharmaceuticals.
Were there any changes in the S&P 500® Index during the reporting period?
During the reporting period, there were ten additions to and ten deletions from the S&P 500® Index. In terms of Index weight, significant additions to the S&P 500® Index included semiconductor manufacturer NXP Semiconductor NV and energy technology company Enphase Energy. Significant deletions included Xerox Corporation, which sells print and digital document products and oil and gas company Technipfmc Plc.
| 1. | Mr. Baker served as a portfolio manager for the Portfolio until June 2021. |
| 2. | See page 5 for more information on benchmark and peer group returns. |
The opinions expressed are those of the portfolio managers as of the date of this report and are subject to change. There is no guarantee that any forecasts will come to pass. This material does not constitute investment advice and is not intended as an endorsement of any specific investment.
Not all MainStay VP Portfolios and/or share classes are available under all policies.
| 8 | MainStay VP MacKay S&P 500 Index Portfolio |
Portfolio of Investments June 30, 2021† (Unaudited)
| | Shares | Value |
| Common Stocks 99.3% |
| Aerospace & Defense 1.6% |
| Boeing Co. (The) (a) | 54,316 | $ 13,011,941 |
| General Dynamics Corp. | 22,617 | 4,257,877 |
| Howmet Aerospace, Inc. (a) | 38,622 | 1,331,300 |
| Huntington Ingalls Industries, Inc. | 3,971 | 836,888 |
| L3Harris Technologies, Inc. | 20,254 | 4,377,902 |
| Lockheed Martin Corp. | 24,166 | 9,143,206 |
| Northrop Grumman Corp. | 14,791 | 5,375,493 |
| Raytheon Technologies Corp. | 149,700 | 12,770,907 |
| Teledyne Technologies, Inc. (a) | 4,589 | 1,922,011 |
| Textron, Inc. | 22,301 | 1,533,640 |
| TransDigm Group, Inc. (a) | 5,424 | 3,510,901 |
| | | 58,072,066 |
| Air Freight & Logistics 0.7% |
| CH Robinson Worldwide, Inc. | 13,140 | 1,230,824 |
| Expeditors International of Washington, Inc. | 16,707 | 2,115,106 |
| FedEx Corp. | 24,120 | 7,195,720 |
| United Parcel Service, Inc., Class B | 71,468 | 14,863,200 |
| | | 25,404,850 |
| Airlines 0.3% |
| Alaska Air Group, Inc. (a) | 12,253 | 738,978 |
| American Airlines Group, Inc. (a) | 63,373 | 1,344,141 |
| Delta Air Lines, Inc. (a) | 63,201 | 2,734,075 |
| Southwest Airlines Co. (a) | 58,431 | 3,102,102 |
| United Airlines Holdings, Inc. (a) | 31,971 | 1,671,764 |
| | | 9,591,060 |
| Auto Components 0.2% |
| Aptiv plc (a) | 26,723 | 4,204,330 |
| BorgWarner, Inc. | 23,699 | 1,150,349 |
| | | 5,354,679 |
| Automobiles 1.8% |
| Ford Motor Co. (a) | 387,397 | 5,756,719 |
| General Motors Co. (a) | 126,134 | 7,463,349 |
| Tesla, Inc. (a) | 76,146 | 51,756,436 |
| | | 64,976,504 |
| Banks 4.3% |
| Bank of America Corp. | 745,095 | 30,720,267 |
| Citigroup, Inc. | 204,236 | 14,449,697 |
| Citizens Financial Group, Inc. | 42,084 | 1,930,393 |
| Comerica, Inc. | 13,795 | 984,135 |
| Fifth Third Bancorp | 69,556 | 2,659,126 |
| First Republic Bank | 17,389 | 3,254,699 |
| Huntington Bancshares, Inc. | 145,787 | 2,080,381 |
| | Shares | Value |
| |
| Banks (continued) |
| JPMorgan Chase & Co. | 299,098 | $ 46,521,703 |
| KeyCorp | 95,894 | 1,980,211 |
| M&T Bank Corp. | 12,712 | 1,847,181 |
| People's United Financial, Inc. | 42,252 | 724,199 |
| PNC Financial Services Group, Inc. (The) | 41,978 | 8,007,723 |
| Regions Financial Corp. | 94,980 | 1,916,696 |
| SVB Financial Group (a) | 5,367 | 2,986,360 |
| Truist Financial Corp. | 132,885 | 7,375,118 |
| U.S. Bancorp | 133,942 | 7,630,676 |
| Wells Fargo & Co. | 408,421 | 18,497,387 |
| Zions Bancorp NA | 16,199 | 856,279 |
| | | 154,422,231 |
| Beverages 1.4% |
| Brown-Forman Corp., Class B | 18,017 | 1,350,194 |
| Coca-Cola Co. (The) | 383,417 | 20,746,694 |
| Constellation Brands, Inc., Class A | 16,698 | 3,905,495 |
| Molson Coors Beverage Co., Class B (a) | 18,567 | 996,862 |
| Monster Beverage Corp. (a) | 36,557 | 3,339,482 |
| PepsiCo, Inc. | 136,513 | 20,227,131 |
| | | 50,565,858 |
| Biotechnology 1.8% |
| AbbVie, Inc. | 174,513 | 19,657,144 |
| Alexion Pharmaceuticals, Inc. (a) | 21,838 | 4,011,859 |
| Amgen, Inc. | 56,769 | 13,837,444 |
| Biogen, Inc. (a) | 14,876 | 5,151,113 |
| Gilead Sciences, Inc. | 123,920 | 8,533,131 |
| Incyte Corp. (a) | 18,432 | 1,550,684 |
| Regeneron Pharmaceuticals, Inc. (a) | 10,344 | 5,777,538 |
| Vertex Pharmaceuticals, Inc. (a) | 25,577 | 5,157,090 |
| | | 63,676,003 |
| Building Products 0.5% |
| Allegion plc | 8,890 | 1,238,377 |
| AO Smith Corp. | 13,286 | 957,389 |
| Carrier Global Corp. | 80,710 | 3,922,506 |
| Fortune Brands Home & Security, Inc. | 13,679 | 1,362,566 |
| Johnson Controls International plc | 70,816 | 4,860,102 |
| Masco Corp. | 25,076 | 1,477,227 |
| Trane Technologies plc | 23,629 | 4,351,044 |
| | | 18,169,211 |
| Capital Markets 3.0% |
| Ameriprise Financial, Inc. | 11,452 | 2,850,174 |
| Bank of New York Mellon Corp. (The) | 79,716 | 4,083,851 |
| BlackRock, Inc. | 14,016 | 12,263,580 |
| Cboe Global Markets, Inc. | 10,541 | 1,254,906 |
The notes to the financial statements are an integral part of, and should be read in conjunction with, the financial statements.
9
Portfolio of Investments June 30, 2021† (Unaudited) (continued)
| | Shares | Value |
| Common Stocks (continued) |
| Capital Markets (continued) |
| Charles Schwab Corp. (The) | 148,194 | $ 10,790,005 |
| CME Group, Inc. | 35,481 | 7,546,099 |
| Franklin Resources, Inc. | 26,920 | 861,171 |
| Goldman Sachs Group, Inc. (The) | 33,615 | 12,757,901 |
| Intercontinental Exchange, Inc. | 55,605 | 6,600,313 |
| Invesco Ltd. | 37,387 | 999,354 |
| MarketAxess Holdings, Inc. | 3,748 | 1,737,535 |
| Moody's Corp. | 15,907 | 5,764,220 |
| Morgan Stanley | 147,070 | 13,484,848 |
| MSCI, Inc. | 8,146 | 4,342,470 |
| Nasdaq, Inc. | 11,349 | 1,995,154 |
| Northern Trust Corp. | 20,548 | 2,375,760 |
| Raymond James Financial, Inc. | 12,089 | 1,570,361 |
| S&P Global, Inc. | 23,802 | 9,769,531 |
| State Street Corp. | 34,362 | 2,827,305 |
| T. Rowe Price Group, Inc. | 22,415 | 4,437,498 |
| | | 108,312,036 |
| Chemicals 1.8% |
| Air Products and Chemicals, Inc. | 21,867 | 6,290,699 |
| Albemarle Corp. | 11,533 | 1,942,849 |
| Celanese Corp. | 11,129 | 1,687,156 |
| CF Industries Holdings, Inc. | 21,195 | 1,090,483 |
| Corteva, Inc. | 72,830 | 3,230,010 |
| Dow, Inc. | 73,807 | 4,670,507 |
| DuPont de Nemours, Inc. | 52,579 | 4,070,140 |
| Eastman Chemical Co. | 13,488 | 1,574,724 |
| Ecolab, Inc. | 24,579 | 5,062,537 |
| FMC Corp. | 12,759 | 1,380,524 |
| International Flavors & Fragrances, Inc. | 24,595 | 3,674,493 |
| Linde plc | 51,400 | 14,859,740 |
| LyondellBasell Industries NV, Class A | 25,438 | 2,616,807 |
| Mosaic Co. (The) | 34,148 | 1,089,663 |
| PPG Industries, Inc. | 23,426 | 3,977,032 |
| Sherwin-Williams Co. (The) | 23,650 | 6,443,442 |
| | | 63,660,806 |
| Commercial Services & Supplies 0.4% |
| Cintas Corp. | 8,719 | 3,330,658 |
| Copart, Inc. (a) | 20,570 | 2,711,743 |
| Republic Services, Inc. | 20,805 | 2,288,758 |
| Rollins, Inc. | 21,845 | 747,099 |
| Waste Management, Inc. | 38,372 | 5,376,301 |
| | | 14,454,559 |
| Communications Equipment 0.8% |
| Arista Networks, Inc. (a) | 5,421 | 1,964,083 |
| Cisco Systems, Inc. | 416,388 | 22,068,564 |
| | Shares | Value |
| |
| Communications Equipment (continued) |
| F5 Networks, Inc. (a) | 5,890 | $ 1,099,427 |
| Juniper Networks, Inc. | 32,369 | 885,292 |
| Motorola Solutions, Inc. | 16,764 | 3,635,273 |
| | | 29,652,639 |
| Construction & Engineering 0.0% ‡ |
| Quanta Services, Inc. | 13,768 | 1,246,968 |
| Construction Materials 0.1% |
| Martin Marietta Materials, Inc. | 6,162 | 2,167,853 |
| Vulcan Materials Co. | 13,108 | 2,281,710 |
| | | 4,449,563 |
| Consumer Finance 0.7% |
| American Express Co. | 64,291 | 10,622,802 |
| Capital One Financial Corp. | 44,610 | 6,900,721 |
| Discover Financial Services | 30,125 | 3,563,486 |
| Synchrony Financial | 53,443 | 2,593,054 |
| | | 23,680,063 |
| Containers & Packaging 0.3% |
| Amcor plc | 152,337 | 1,745,782 |
| Avery Dennison Corp. | 8,189 | 1,721,655 |
| Ball Corp. | 32,433 | 2,627,722 |
| International Paper Co. | 38,706 | 2,373,065 |
| Packaging Corp. of America | 9,386 | 1,271,052 |
| Sealed Air Corp. | 15,018 | 889,816 |
| Westrock Co. | 26,294 | 1,399,367 |
| | | 12,028,459 |
| Distributors 0.1% |
| Genuine Parts Co. | 14,275 | 1,805,359 |
| LKQ Corp. (a) | 27,525 | 1,354,781 |
| Pool Corp. | 3,970 | 1,820,880 |
| | | 4,981,020 |
| Diversified Financial Services 1.4% |
| Berkshire Hathaway, Inc., Class B (a) | 187,272 | 52,046,634 |
| Diversified Telecommunication Services 1.2% |
| AT&T, Inc. | 705,473 | 20,303,513 |
| Lumen Technologies, Inc. | 98,289 | 1,335,747 |
| Verizon Communications, Inc. | 409,063 | 22,919,800 |
| | | 44,559,060 |
| Electric Utilities 1.5% |
| Alliant Energy Corp. | 24,715 | 1,378,108 |
| American Electric Power Co., Inc. | 49,378 | 4,176,885 |
| Duke Energy Corp. | 76,003 | 7,503,016 |
The notes to the financial statements are an integral part of, and should be read in conjunction with, the financial statements.
| 10 | MainStay VP MacKay S&P 500 Index Portfolio |
| | Shares | Value |
| Common Stocks (continued) |
| Electric Utilities (continued) |
| Edison International | 37,490 | $ 2,167,672 |
| Entergy Corp. | 19,826 | 1,976,652 |
| Evergy, Inc. | 22,653 | 1,368,921 |
| Eversource Energy | 33,936 | 2,723,025 |
| Exelon Corp. | 96,550 | 4,278,130 |
| FirstEnergy Corp. | 53,740 | 1,999,665 |
| NextEra Energy, Inc. | 193,802 | 14,201,811 |
| NRG Energy, Inc. | 24,143 | 972,963 |
| Pinnacle West Capital Corp. | 11,115 | 911,097 |
| PPL Corp. | 76,024 | 2,126,391 |
| Southern Co. (The) | 104,599 | 6,329,285 |
| Xcel Energy, Inc. | 53,178 | 3,503,367 |
| | | 55,616,988 |
| Electrical Equipment 0.6% |
| AMETEK, Inc. | 22,816 | 3,045,936 |
| Eaton Corp. plc | 39,374 | 5,834,439 |
| Emerson Electric Co. | 59,254 | 5,702,605 |
| Generac Holdings, Inc. (a) | 6,220 | 2,582,233 |
| Rockwell Automation, Inc. | 11,457 | 3,276,931 |
| | | 20,442,144 |
| Electronic Equipment, Instruments & Components 0.6% |
| Amphenol Corp., Class A | 59,048 | 4,039,474 |
| CDW Corp. | 13,853 | 2,419,426 |
| Corning, Inc. | 76,548 | 3,130,813 |
| IPG Photonics Corp. (a) | 3,538 | 745,704 |
| Keysight Technologies, Inc. (a) | 18,202 | 2,810,571 |
| TE Connectivity Ltd. | 32,638 | 4,412,984 |
| Trimble, Inc. (a) | 24,756 | 2,025,784 |
| Zebra Technologies Corp., Class A (a) | 5,287 | 2,799,414 |
| | | 22,384,170 |
| Energy Equipment & Services 0.2% |
| Baker Hughes Co. | 71,904 | 1,644,445 |
| Halliburton Co. | 87,910 | 2,032,479 |
| NOV, Inc. (a) | 38,598 | 591,321 |
| Schlumberger NV | 138,163 | 4,422,598 |
| | | 8,690,843 |
| Entertainment 1.9% |
| Activision Blizzard, Inc. | 76,774 | 7,327,311 |
| Electronic Arts, Inc. | 28,277 | 4,067,081 |
| Live Nation Entertainment, Inc. (a) | 14,275 | 1,250,347 |
| Netflix, Inc. (a) | 43,811 | 23,141,408 |
| Take-Two Interactive Software, Inc. (a) | 11,427 | 2,022,807 |
| Walt Disney Co. (The) (a) | 179,523 | 31,554,758 |
| | | 69,363,712 |
| | Shares | Value |
| |
| Equity Real Estate Investment Trusts 2.5% |
| Alexandria Real Estate Equities, Inc. | 13,554 | $ 2,466,015 |
| American Tower Corp. | 44,927 | 12,136,580 |
| AvalonBay Communities, Inc. | 13,794 | 2,878,670 |
| Boston Properties, Inc. | 14,033 | 1,608,041 |
| Crown Castle International Corp. | 42,703 | 8,331,355 |
| Digital Realty Trust, Inc. | 27,823 | 4,186,249 |
| Duke Realty Corp. | 37,051 | 1,754,365 |
| Equinix, Inc. | 8,851 | 7,103,813 |
| Equity Residential | 33,998 | 2,617,846 |
| Essex Property Trust, Inc. | 6,411 | 1,923,364 |
| Extra Space Storage, Inc. | 13,213 | 2,164,554 |
| Federal Realty Investment Trust | 6,991 | 819,135 |
| Healthpeak Properties, Inc. | 53,250 | 1,772,693 |
| Host Hotels & Resorts, Inc. (a) | 69,577 | 1,189,071 |
| Iron Mountain, Inc. | 28,450 | 1,204,004 |
| Kimco Realty Corp. | 42,828 | 892,964 |
| Mid-America Apartment Communities, Inc. | 11,312 | 1,905,167 |
| Prologis, Inc. | 73,094 | 8,736,926 |
| Public Storage | 15,041 | 4,522,678 |
| Realty Income Corp. | 36,911 | 2,463,440 |
| Regency Centers Corp. | 15,578 | 998,082 |
| SBA Communications Corp. | 10,804 | 3,443,235 |
| Simon Property Group, Inc. | 32,461 | 4,235,511 |
| UDR, Inc. | 29,278 | 1,434,036 |
| Ventas, Inc. | 37,066 | 2,116,469 |
| Vornado Realty Trust | 15,479 | 722,405 |
| Welltower, Inc. | 41,254 | 3,428,207 |
| Weyerhaeuser Co. | 74,027 | 2,548,009 |
| | | 89,602,884 |
| Food & Staples Retailing 1.3% |
| Costco Wholesale Corp. | 43,662 | 17,275,744 |
| Kroger Co. (The) | 74,806 | 2,865,818 |
| Sysco Corp. | 50,547 | 3,930,029 |
| Walgreens Boots Alliance, Inc. | 70,888 | 3,729,418 |
| Walmart, Inc. | 135,665 | 19,131,478 |
| | | 46,932,487 |
| Food Products 0.9% |
| Archer-Daniels-Midland Co. | 55,203 | 3,345,302 |
| Campbell Soup Co. | 20,021 | 912,757 |
| Conagra Brands, Inc. | 47,422 | 1,725,212 |
| General Mills, Inc. | 60,311 | 3,674,749 |
| Hershey Co. (The) | 14,456 | 2,517,946 |
| Hormel Foods Corp. | 27,851 | 1,329,885 |
| J M Smucker Co. (The) | 10,810 | 1,400,652 |
| Kellogg Co. | 24,896 | 1,601,560 |
| Kraft Heinz Co. (The) | 64,052 | 2,612,041 |
The notes to the financial statements are an integral part of, and should be read in conjunction with, the financial statements.
11
Portfolio of Investments June 30, 2021† (Unaudited) (continued)
| | Shares | Value |
| Common Stocks (continued) |
| Food Products (continued) |
| Lamb Weston Holdings, Inc. | 14,437 | $ 1,164,488 |
| McCormick & Co., Inc. (Non-Voting) | 24,603 | 2,172,937 |
| Mondelez International, Inc., Class A | 138,793 | 8,666,235 |
| Tyson Foods, Inc., Class A | 29,077 | 2,144,720 |
| | | 33,268,484 |
| Gas Utilities 0.0% ‡ |
| Atmos Energy Corp. | 12,911 | 1,240,876 |
| Health Care Equipment & Supplies 3.6% |
| Abbott Laboratories | 175,560 | 20,352,671 |
| ABIOMED, Inc. (a) | 4,468 | 1,394,507 |
| Align Technology, Inc. (a) | 7,115 | 4,347,265 |
| Baxter International, Inc. | 49,685 | 3,999,642 |
| Becton Dickinson and Co. | 28,735 | 6,988,065 |
| Boston Scientific Corp. (a) | 140,394 | 6,003,247 |
| Cooper Cos., Inc. (The) | 4,866 | 1,928,250 |
| Danaher Corp. | 62,724 | 16,832,613 |
| Dentsply Sirona, Inc. | 21,607 | 1,366,859 |
| Dexcom, Inc. (a) | 9,555 | 4,079,985 |
| Edwards Lifesciences Corp. (a) | 61,421 | 6,361,373 |
| Hologic, Inc. (a) | 25,318 | 1,689,217 |
| IDEXX Laboratories, Inc. (a) | 8,427 | 5,322,072 |
| Intuitive Surgical, Inc. (a) | 11,700 | 10,759,788 |
| Medtronic plc | 132,933 | 16,500,973 |
| ResMed, Inc. | 14,378 | 3,544,465 |
| STERIS plc | 9,647 | 1,990,176 |
| Stryker Corp. | 32,386 | 8,411,616 |
| Teleflex, Inc. | 4,618 | 1,855,466 |
| West Pharmaceutical Services, Inc. | 7,294 | 2,619,275 |
| Zimmer Biomet Holdings, Inc. | 20,599 | 3,312,731 |
| | | 129,660,256 |
| Health Care Providers & Services 2.6% |
| AmerisourceBergen Corp. | 14,613 | 1,673,042 |
| Anthem, Inc. | 24,192 | 9,236,506 |
| Cardinal Health, Inc. | 28,668 | 1,636,656 |
| Centene Corp. (a) | 57,578 | 4,199,164 |
| Cigna Corp. | 33,905 | 8,037,858 |
| CVS Health Corp. | 130,085 | 10,854,292 |
| DaVita, Inc. (a) | 6,926 | 834,098 |
| HCA Healthcare, Inc. | 25,967 | 5,368,418 |
| Henry Schein, Inc. (a) | 13,902 | 1,031,389 |
| Humana, Inc. | 12,747 | 5,643,352 |
| Laboratory Corp. of America Holdings (a) | 9,647 | 2,661,125 |
| McKesson Corp. | 15,630 | 2,989,081 |
| | Shares | Value |
| |
| Health Care Providers & Services (continued) |
| Quest Diagnostics, Inc. | 12,908 | $ 1,703,469 |
| UnitedHealth Group, Inc. | 93,243 | 37,338,227 |
| Universal Health Services, Inc., Class B | 7,684 | 1,125,168 |
| | | 94,331,845 |
| Health Care Technology 0.1% |
| Cerner Corp. | 29,772 | 2,326,980 |
| Hotels, Restaurants & Leisure 2.0% |
| Booking Holdings, Inc. (a) | 4,056 | 8,874,893 |
| Caesars Entertainment, Inc. (a) | 20,621 | 2,139,429 |
| Carnival Corp. (a) | 78,877 | 2,079,198 |
| Chipotle Mexican Grill, Inc. (a) | 2,781 | 4,311,495 |
| Darden Restaurants, Inc. | 12,928 | 1,887,359 |
| Domino's Pizza, Inc. | 3,836 | 1,789,456 |
| Expedia Group, Inc. (a) | 13,976 | 2,288,011 |
| Hilton Worldwide Holdings, Inc. (a) | 27,521 | 3,319,583 |
| Las Vegas Sands Corp. (a) | 32,398 | 1,707,050 |
| Marriott International, Inc., Class A (a) | 26,384 | 3,601,944 |
| McDonald's Corp. | 73,726 | 17,029,969 |
| MGM Resorts International | 40,228 | 1,715,724 |
| Norwegian Cruise Line Holdings Ltd. (a) | 36,552 | 1,074,994 |
| Penn National Gaming, Inc. (a) | 14,663 | 1,121,573 |
| Royal Caribbean Cruises Ltd. (a) | 21,593 | 1,841,451 |
| Starbucks Corp. | 116,423 | 13,017,256 |
| Wynn Resorts Ltd. (a) | 10,377 | 1,269,107 |
| Yum! Brands, Inc. | 29,434 | 3,385,793 |
| | | 72,454,285 |
| Household Durables 0.4% |
| DR Horton, Inc. | 32,412 | 2,929,073 |
| Garmin Ltd. | 14,808 | 2,141,829 |
| Leggett & Platt, Inc. | 13,118 | 679,644 |
| Lennar Corp., Class A | 27,247 | 2,706,990 |
| Mohawk Industries, Inc. (a) | 5,786 | 1,112,011 |
| Newell Brands, Inc. | 37,275 | 1,023,944 |
| NVR, Inc. (a) | 338 | 1,680,975 |
| PulteGroup, Inc. | 26,132 | 1,426,023 |
| Whirlpool Corp. | 6,192 | 1,349,980 |
| | | 15,050,469 |
| Household Products 1.3% |
| Church & Dwight Co., Inc. | 24,232 | 2,065,051 |
| Clorox Co. (The) | 12,289 | 2,210,914 |
| Colgate-Palmolive Co. | 83,587 | 6,799,803 |
| Kimberly-Clark Corp. | 33,340 | 4,460,225 |
| Procter & Gamble Co. (The) | 241,900 | 32,639,567 |
| | | 48,175,560 |
The notes to the financial statements are an integral part of, and should be read in conjunction with, the financial statements.
| 12 | MainStay VP MacKay S&P 500 Index Portfolio |
| | Shares | Value |
| Common Stocks (continued) |
| Independent Power and Renewable Electricity Producers 0.1% |
| AES Corp. (The) | 65,902 | $ 1,718,065 |
| Industrial Conglomerates 1.2% |
| 3M Co. | 57,275 | 11,376,533 |
| General Electric Co. | 867,382 | 11,674,962 |
| Honeywell International, Inc. | 68,604 | 15,048,287 |
| Roper Technologies, Inc. | 10,398 | 4,889,140 |
| | | 42,988,922 |
| Insurance 1.8% |
| Aflac, Inc. | 62,454 | 3,351,282 |
| Allstate Corp. (The) | 29,576 | 3,857,893 |
| American International Group, Inc. | 84,789 | 4,035,956 |
| Aon plc, Class A | 22,291 | 5,322,199 |
| Arthur J Gallagher & Co. | 20,244 | 2,835,780 |
| Assurant, Inc. | 5,984 | 934,581 |
| Chubb Ltd. | 44,409 | 7,058,366 |
| Cincinnati Financial Corp. | 14,793 | 1,725,160 |
| Everest Re Group Ltd. | 3,951 | 995,692 |
| Globe Life, Inc. | 9,374 | 892,873 |
| Hartford Financial Services Group, Inc. (The) | 35,265 | 2,185,372 |
| Lincoln National Corp. | 17,681 | 1,111,074 |
| Loews Corp. | 22,103 | 1,207,929 |
| Marsh & McLennan Cos., Inc. | 50,246 | 7,068,607 |
| MetLife, Inc. | 73,522 | 4,400,292 |
| Principal Financial Group, Inc. | 25,008 | 1,580,256 |
| Progressive Corp. (The) | 57,778 | 5,674,377 |
| Prudential Financial, Inc. | 38,930 | 3,989,157 |
| Travelers Cos., Inc. (The) | 24,850 | 3,720,293 |
| Unum Group | 20,095 | 570,698 |
| W R Berkley Corp. | 13,820 | 1,028,623 |
| Willis Towers Watson plc | 12,744 | 2,931,375 |
| | | 66,477,835 |
| Interactive Media & Services 6.4% |
| Alphabet, Inc. (a) | | |
| Class A | 29,716 | 72,560,232 |
| Class C | 28,135 | 70,515,313 |
| |
| Facebook, Inc., Class A (a) | 236,743 | 82,317,908 |
| Twitter, Inc. (a) | 78,860 | 5,426,357 |
| | | 230,819,810 |
| Internet & Direct Marketing Retail 4.2% |
| Amazon.com, Inc. (a) | 42,356 | 145,711,417 |
| eBay, Inc. | 63,947 | 4,489,719 |
| | Shares | Value |
| |
| Internet & Direct Marketing Retail (continued) |
| Etsy, Inc. (a) | 12,559 | $ 2,585,144 |
| | | 152,786,280 |
| IT Services 5.1% |
| Accenture plc, Class A | 62,806 | 18,514,581 |
| Akamai Technologies, Inc. (a) | 16,099 | 1,877,143 |
| Automatic Data Processing, Inc. | 42,044 | 8,350,779 |
| Broadridge Financial Solutions, Inc. | 11,474 | 1,853,395 |
| Cognizant Technology Solutions Corp., Class A | 52,111 | 3,609,208 |
| DXC Technology Co. (a) | 25,113 | 977,900 |
| Fidelity National Information Services, Inc. | 61,268 | 8,679,838 |
| Fiserv, Inc. (a) | 58,848 | 6,290,263 |
| FleetCor Technologies, Inc. (a) | 8,229 | 2,107,118 |
| Gartner, Inc. (a) | 8,505 | 2,059,911 |
| Global Payments, Inc. | 29,169 | 5,470,354 |
| International Business Machines Corp. | 88,285 | 12,941,698 |
| Jack Henry & Associates, Inc. | 7,340 | 1,200,163 |
| Mastercard, Inc., Class A | 86,434 | 31,556,189 |
| Paychex, Inc. | 31,660 | 3,397,118 |
| PayPal Holdings, Inc. (a) | 116,070 | 33,832,084 |
| VeriSign, Inc. (a) | 9,792 | 2,229,541 |
| Visa, Inc., Class A | 167,160 | 39,085,351 |
| Western Union Co. (The) | 40,533 | 931,043 |
| | | 184,963,677 |
| Leisure Products 0.0% ‡ |
| Hasbro, Inc. | 12,641 | 1,194,827 |
| Life Sciences Tools & Services 1.3% |
| Agilent Technologies, Inc. | 29,982 | 4,431,639 |
| Bio-Rad Laboratories, Inc., Class A (a) | 2,128 | 1,371,049 |
| Charles River Laboratories International, Inc. (a) | 4,965 | 1,836,653 |
| Illumina, Inc. (a) | 14,426 | 6,826,527 |
| IQVIA Holdings, Inc. (a) | 18,937 | 4,588,814 |
| Mettler-Toledo International, Inc. (a) | 2,299 | 3,184,897 |
| PerkinElmer, Inc. | 11,054 | 1,706,848 |
| Thermo Fisher Scientific, Inc. | 38,833 | 19,590,084 |
| Waters Corp. (a) | 6,096 | 2,106,839 |
| | | 45,643,350 |
| Machinery 1.7% |
| Caterpillar, Inc. | 54,125 | 11,779,224 |
| Cummins, Inc. | 14,446 | 3,522,079 |
| Deere & Co. | 30,822 | 10,871,228 |
| Dover Corp. | 14,221 | 2,141,683 |
| Fortive Corp. | 33,448 | 2,332,664 |
The notes to the financial statements are an integral part of, and should be read in conjunction with, the financial statements.
13
Portfolio of Investments June 30, 2021† (Unaudited) (continued)
| | Shares | Value |
| Common Stocks (continued) |
| Machinery (continued) |
| IDEX Corp. | 7,485 | $ 1,647,074 |
| Illinois Tool Works, Inc. | 28,402 | 6,349,551 |
| Ingersoll Rand, Inc. (a) | 36,886 | 1,800,406 |
| Otis Worldwide Corp. | 39,858 | 3,259,189 |
| PACCAR, Inc. | 34,301 | 3,061,364 |
| Parker-Hannifin Corp. | 12,752 | 3,916,267 |
| Pentair plc | 16,380 | 1,105,486 |
| Snap-on, Inc. | 5,347 | 1,194,680 |
| Stanley Black & Decker, Inc. | 15,957 | 3,271,025 |
| Westinghouse Air Brake Technologies Corp. | 17,515 | 1,441,484 |
| Xylem, Inc. | 17,791 | 2,134,208 |
| | | 59,827,612 |
| Media 1.3% |
| Charter Communications, Inc., Class A (a) | 13,608 | 9,817,492 |
| Comcast Corp., Class A | 453,009 | 25,830,573 |
| Discovery, Inc. (a) | | |
| Class A (b) | 16,664 | 511,252 |
| Class C | 29,685 | 860,271 |
| |
| DISH Network Corp., Class A (a) | 24,550 | 1,026,190 |
| Fox Corp. | | |
| Class A | 32,303 | 1,199,410 |
| Class B | 15,015 | 528,528 |
| |
| Interpublic Group of Cos., Inc. (The) | 38,867 | 1,262,789 |
| News Corp. | | |
| Class A | 38,578 | 994,155 |
| Class B | 12,011 | 292,468 |
| |
| Omnicom Group, Inc. | 21,208 | 1,696,428 |
| ViacomCBS, Inc. | 59,836 | 2,704,587 |
| | | 46,724,143 |
| Metals & Mining 0.4% |
| Freeport-McMoRan, Inc. | 144,802 | 5,373,602 |
| Newmont Corp. | 79,159 | 5,017,098 |
| Nucor Corp. | 29,567 | 2,836,362 |
| | | 13,227,062 |
| Multiline Retail 0.5% |
| Dollar General Corp. | 23,338 | 5,050,110 |
| Dollar Tree, Inc. (a) | 22,918 | 2,280,341 |
| Target Corp. | 48,882 | 11,816,735 |
| | | 19,147,186 |
| Multi-Utilities 0.7% |
| Ameren Corp. | 25,250 | 2,021,010 |
| CenterPoint Energy, Inc. | 57,357 | 1,406,394 |
| | Shares | Value |
| |
| Multi-Utilities (continued) |
| CMS Energy Corp. | 28,600 | $ 1,689,688 |
| Consolidated Edison, Inc. | 33,872 | 2,429,300 |
| Dominion Energy, Inc. | 79,689 | 5,862,720 |
| DTE Energy Co. | 19,114 | 2,477,174 |
| NiSource, Inc. | 38,653 | 946,998 |
| Public Service Enterprise Group, Inc. | 49,906 | 2,981,384 |
| Sempra Energy | 31,131 | 4,124,235 |
| WEC Energy Group, Inc. | 31,167 | 2,772,305 |
| | | 26,711,208 |
| Oil, Gas & Consumable Fuels 2.6% |
| APA Corp. | 37,272 | 806,193 |
| Cabot Oil & Gas Corp. | 39,402 | 687,959 |
| Chevron Corp. | 190,968 | 20,001,988 |
| ConocoPhillips | 133,330 | 8,119,797 |
| Devon Energy Corp. | 58,856 | 1,718,007 |
| Diamondback Energy, Inc. | 17,884 | 1,679,129 |
| EOG Resources, Inc. | 57,664 | 4,811,484 |
| Exxon Mobil Corp. | 418,298 | 26,386,238 |
| Hess Corp. | 27,122 | 2,368,293 |
| Kinder Morgan, Inc. | 192,429 | 3,507,981 |
| Marathon Oil Corp. | 77,864 | 1,060,508 |
| Marathon Petroleum Corp. | 49,058 | 2,964,084 |
| Occidental Petroleum Corp. | 83,004 | 2,595,535 |
| ONEOK, Inc. | 44,021 | 2,449,328 |
| Phillips 66 | 43,264 | 3,712,917 |
| Pioneer Natural Resources Co. | 22,899 | 3,721,546 |
| Valero Energy Corp. | 40,388 | 3,153,495 |
| Williams Cos., Inc. (The) | 120,026 | 3,186,690 |
| | | 92,931,172 |
| Personal Products 0.2% |
| Estee Lauder Cos., Inc. (The), Class A | 22,913 | 7,288,167 |
| Pharmaceuticals 3.6% |
| Bristol-Myers Squibb Co. | 220,725 | 14,748,844 |
| Catalent, Inc. (a) | 16,831 | 1,819,768 |
| Eli Lilly and Co. | 78,648 | 18,051,289 |
| Johnson & Johnson | 260,195 | 42,864,524 |
| Merck & Co., Inc. | 250,182 | 19,456,654 |
| Organon & Co. (a) | 24,958 | 755,229 |
| Perrigo Co. plc | 13,129 | 601,965 |
| Pfizer, Inc. | 553,084 | 21,658,769 |
| Viatris, Inc. | 119,423 | 1,706,555 |
| Zoetis, Inc. | 46,910 | 8,742,148 |
| | | 130,405,745 |
| Professional Services 0.4% |
| Equifax, Inc. | 12,014 | 2,877,473 |
The notes to the financial statements are an integral part of, and should be read in conjunction with, the financial statements.
| 14 | MainStay VP MacKay S&P 500 Index Portfolio |
| | Shares | Value |
| Common Stocks (continued) |
| Professional Services (continued) |
| IHS Markit Ltd. | 37,014 | $ 4,169,997 |
| Jacobs Engineering Group, Inc. | 12,866 | 1,716,582 |
| Leidos Holdings, Inc. | 13,157 | 1,330,173 |
| Nielsen Holdings plc | 35,293 | 870,678 |
| Robert Half International, Inc. | 11,159 | 992,816 |
| Verisk Analytics, Inc. | 16,015 | 2,798,141 |
| | | 14,755,860 |
| Real Estate Management & Development 0.1% |
| CBRE Group, Inc., Class A (a) | 33,165 | 2,843,235 |
| Road & Rail 1.0% |
| CSX Corp. | 224,505 | 7,202,120 |
| JB Hunt Transport Services, Inc. | 8,238 | 1,342,382 |
| Kansas City Southern | 8,985 | 2,546,080 |
| Norfolk Southern Corp. | 24,725 | 6,562,262 |
| Old Dominion Freight Line, Inc. | 9,396 | 2,384,705 |
| Union Pacific Corp. | 65,637 | 14,435,545 |
| | | 34,473,094 |
| Semiconductors & Semiconductor Equipment 5.7% |
| Advanced Micro Devices, Inc. (a) | 120,051 | 11,276,390 |
| Analog Devices, Inc. | 36,442 | 6,273,855 |
| Applied Materials, Inc. | 90,670 | 12,911,408 |
| Broadcom, Inc. | 40,343 | 19,237,156 |
| Enphase Energy, Inc. (a) | 13,408 | 2,462,111 |
| Intel Corp. | 398,978 | 22,398,625 |
| KLA Corp. | 15,145 | 4,910,160 |
| Lam Research Corp. | 14,092 | 9,169,664 |
| Maxim Integrated Products, Inc. | 26,516 | 2,793,726 |
| Microchip Technology, Inc. | 27,026 | 4,046,873 |
| Micron Technology, Inc. (a) | 110,802 | 9,415,954 |
| Monolithic Power Systems, Inc. | 4,250 | 1,587,163 |
| NVIDIA Corp. | 61,556 | 49,250,956 |
| NXP Semiconductors NV | 27,246 | 5,605,047 |
| Qorvo, Inc. (a) | 11,124 | 2,176,411 |
| QUALCOMM, Inc. | 111,453 | 15,929,977 |
| Skyworks Solutions, Inc. | 16,312 | 3,127,826 |
| Teradyne, Inc. | 16,442 | 2,202,570 |
| Texas Instruments, Inc. | 91,250 | 17,547,375 |
| Xilinx, Inc. | 24,290 | 3,513,306 |
| | | 205,836,553 |
| Software 8.8% |
| Adobe, Inc. (a) | 47,229 | 27,659,191 |
| ANSYS, Inc. (a) | 8,611 | 2,988,534 |
| Autodesk, Inc. (a) | 21,739 | 6,345,614 |
| | Shares | Value |
| |
| Software (continued) |
| Cadence Design Systems, Inc. (a) | 27,494 | $ 3,761,729 |
| Citrix Systems, Inc. | 12,268 | 1,438,668 |
| Fortinet, Inc. (a) | 13,394 | 3,190,317 |
| Intuit, Inc. | 27,000 | 13,234,590 |
| Microsoft Corp. | 744,163 | 201,593,757 |
| NortonLifeLock, Inc. | 57,398 | 1,562,374 |
| Oracle Corp. | 179,493 | 13,971,735 |
| Paycom Software, Inc. (a) | 4,842 | 1,759,922 |
| PTC, Inc. (a) | 10,393 | 1,468,115 |
| salesforce.com, Inc. (a) | 91,494 | 22,349,239 |
| ServiceNow, Inc. (a) | 19,509 | 10,721,171 |
| Synopsys, Inc. (a) | 15,073 | 4,156,983 |
| Tyler Technologies, Inc. (a) | 4,025 | 1,820,789 |
| | | 318,022,728 |
| Specialty Retail 2.2% |
| Advance Auto Parts, Inc. | 6,463 | 1,325,820 |
| AutoZone, Inc. (a) | 2,136 | 3,187,382 |
| Best Buy Co., Inc. | 22,026 | 2,532,549 |
| CarMax, Inc. (a) | 16,120 | 2,081,898 |
| Gap, Inc. (The) | 20,521 | 690,532 |
| Home Depot, Inc. (The) | 105,056 | 33,501,308 |
| L Brands, Inc. | 23,148 | 1,668,045 |
| Lowe's Cos., Inc. | 69,845 | 13,547,835 |
| O'Reilly Automotive, Inc. (a) | 6,893 | 3,902,885 |
| Ross Stores, Inc. | 35,235 | 4,369,140 |
| TJX Cos., Inc. (The) | 119,159 | 8,033,700 |
| Tractor Supply Co. | 11,388 | 2,118,851 |
| Ulta Beauty, Inc. (a) | 5,410 | 1,870,616 |
| | | 78,830,561 |
| Technology Hardware, Storage & Peripherals 6.2% |
| Apple, Inc. (c) | 1,549,905 | 212,274,990 |
| Hewlett Packard Enterprise Co. | 129,033 | 1,881,301 |
| HP, Inc. | 118,691 | 3,583,281 |
| NetApp, Inc. | 21,958 | 1,796,604 |
| Seagate Technology Holdings plc | 19,674 | 1,729,935 |
| Western Digital Corp. (a) | 30,279 | 2,154,956 |
| | | 223,421,067 |
| Textiles, Apparel & Luxury Goods 0.7% |
| Hanesbrands, Inc. | 34,405 | 642,341 |
| NIKE, Inc., Class B | 125,973 | 19,461,569 |
| PVH Corp. (a) | 7,013 | 754,529 |
| Ralph Lauren Corp. | 4,757 | 560,422 |
| Tapestry, Inc. (a) | 27,553 | 1,198,004 |
| Under Armour, Inc. (a) | | |
| Class A | 18,606 | 393,517 |
| Class C | 19,222 | 356,953 |
The notes to the financial statements are an integral part of, and should be read in conjunction with, the financial statements.
15
Portfolio of Investments June 30, 2021† (Unaudited) (continued)
| | Shares | Value |
| Common Stocks (continued) |
| Textiles, Apparel & Luxury Goods (continued) |
| |
| VF Corp. | 31,772 | $ 2,606,575 |
| | | 25,973,910 |
| Tobacco 0.7% |
| Altria Group, Inc. | 182,854 | 8,718,479 |
| Philip Morris International, Inc. | 153,993 | 15,262,246 |
| | | 23,980,725 |
| Trading Companies & Distributors 0.2% |
| Fastenal Co. | 56,748 | 2,950,896 |
| United Rentals, Inc. (a) | 7,151 | 2,281,241 |
| WW Grainger, Inc. | 4,325 | 1,894,350 |
| | | 7,126,487 |
| Water Utilities 0.1% |
| American Water Works Co., Inc. | 17,930 | 2,763,551 |
| Wireless Telecommunication Services 0.2% |
| T-Mobile US, Inc. (a) | 57,902 | 8,385,947 |
Total Common Stocks (d)
(Cost $1,161,925,948) | | 3,588,115,031 |
| |
| Short-Term Investments 0.7% |
| Affiliated Investment Company 0.1% |
| MainStay U.S. Government Liquidity Fund, 0.01% (e) | 2,029,498 | 2,029,498 |
| Unaffiliated Investment Company 0.0% ‡ |
| Wells Fargo Government Money Market Fund, 0.025% (e)(f) | 515,751 | 515,751 |
| |
| | Principal
Amount | | Value |
| U.S. Treasury Debt 0.6% |
| U.S. Treasury Bills (g) | | | |
| 0.038%, due 9/16/21 (c) | $ 2,000,000 | | $ 1,999,807 |
| 0.039%, due 9/30/21 | 2,000,000 | | 1,999,734 |
| 0.043%, due 9/23/21 | 19,200,000 | | 19,197,760 |
Total U.S. Treasury Debt
(Cost $23,197,665) | | | 23,197,301 |
Total Short-Term Investments
(Cost $25,742,914) | | | 25,742,550 |
Total Investments
(Cost $1,187,668,862) | 100.0% | | 3,613,857,581 |
| Other Assets, Less Liabilities | (0.0)‡ | | (235,306) |
| Net Assets | 100.0% | | $ 3,613,622,275 |
| † | Percentages indicated are based on Portfolio net assets. |
| ‡ | Less than one-tenth of a percent. |
| (a) | Non-income producing security. |
| (b) | All or a portion of this security was held on loan. As of June 30, 2021, the aggregate market value of securities on loan was $511,252. The Portfolio received cash collateral with a value of $515,751. (See Note 2(I)) |
| (c) | Represents a security, or portion thereof, which was maintained at the broker as collateral for futures contracts. |
| (d) | The combined market value of common stocks and notional value of Standard & Poor’s 500 Index futures contracts represents 99.9% of the Portfolio’s net assets. |
| (e) | Current yield as of June 30, 2021. |
| (f) | Represents a security purchased with cash collateral received for securities on loan. |
| (g) | Interest rate shown represents yield to maturity. |
Futures Contracts
As of June 30, 2021, the Portfolio held the following futures contracts:
| Type | Number of
Contracts | Expiration
Date | Value at
Trade Date | Current
Notional
Amount | Unrealized
Appreciation
(Depreciation)1 |
| Long Contracts | | | | | |
| S&P 500 E-Mini Index | 108 | September 2021 | $ 22,708,198 | $ 23,158,440 | $ 450,242 |
| 1. | Represents the difference between the value of the contracts at the time they were opened and the value as of June 30, 2021. |
The notes to the financial statements are an integral part of, and should be read in conjunction with, the financial statements.
| 16 | MainStay VP MacKay S&P 500 Index Portfolio |
The following is a summary of the fair valuations according to the inputs used as of June 30, 2021, for valuing the Portfolio’s assets:
| Description | Quoted
Prices in
Active
Markets for
Identical
Assets
(Level 1) | | Significant
Other
Observable
Inputs
(Level 2) | | Significant
Unobservable
Inputs
(Level 3) | | Total |
| Asset Valuation Inputs | | | | | | | |
| Investments in Securities (a) | | | | | | | |
| Common Stocks | $ 3,588,115,031 | | $ — | | $ — | | $ 3,588,115,031 |
| Short-Term Investments | | | | | | | |
| Affiliated Investment Company | 2,029,498 | | — | | — | | 2,029,498 |
| Unaffiliated Investment Company | 515,751 | | — | | — | | 515,751 |
| U.S. Treasury Debt | — | | 23,197,301 | | — | | 23,197,301 |
| Total Short-Term Investments | 2,545,249 | | 23,197,301 | | — | | 25,742,550 |
| Total Investments in Securities | 3,590,660,280 | | 23,197,301 | | — | | 3,613,857,581 |
| Other Financial Instruments | | | | | | | |
| Futures Contracts (b) | 450,242 | | — | | — | | 450,242 |
| Total Investments in Securities and Other Financial Instruments | $ 3,591,110,522 | | $ 23,197,301 | | $ — | | $ 3,614,307,823 |
| (a) | For a complete listing of investments and their industries, see the Portfolio of Investments. |
| (b) | The value listed for these securities reflects unrealized appreciation (depreciation) as shown on the Portfolio of Investments. |
The notes to the financial statements are an integral part of, and should be read in conjunction with, the financial statements.
17
Statement of Assets and Liabilities as of June 30, 2021 (Unaudited)
| Assets |
Investment in unaffiliated securities, at value
(identified cost $1,185,639,364) including securities on loan of $511,252 | $3,611,828,083 |
Investment in affiliated investment companies, at value
(identified cost $2,029,498) | 2,029,498 |
| Due from custodian | 1,999,803 |
| Receivables: | |
| Dividends and interest | 2,085,301 |
| Portfolio shares sold | 1,041,715 |
| Variation margin on futures contracts | 41,884 |
| Securities lending | 556 |
| Other assets | 122,452 |
| Total assets | 3,619,149,292 |
| Liabilities |
| Cash collateral received for securities on loan | 515,751 |
| Due to custodian | 2,012,074 |
| Payables: | |
| Investment securities purchased | 1,999,803 |
| NYLIFE Distributors (See Note 3) | 374,897 |
| Manager (See Note 3) | 286,778 |
| Shareholder communication | 234,984 |
| Professional fees | 95,089 |
| Custodian | 7,641 |
| Total liabilities | 5,527,017 |
| Net assets | $3,613,622,275 |
| Composition of Net Assets |
| Shares of beneficial interest outstanding (par value of $.001 per share) unlimited number of shares authorized | $ 44,178 |
| Additional paid-in-capital | 1,070,763,694 |
| | 1,070,807,872 |
| Total distributable earnings (loss) | 2,542,814,403 |
| Net assets | $3,613,622,275 |
| Initial Class | |
| Net assets applicable to outstanding shares | $1,760,851,240 |
| Shares of beneficial interest outstanding | 21,412,940 |
| Net asset value per share outstanding | $ 82.23 |
| Service Class | |
| Net assets applicable to outstanding shares | $1,852,771,035 |
| Shares of beneficial interest outstanding | 22,765,453 |
| Net asset value per share outstanding | $ 81.39 |
The notes to the financial statements are an integral part of, and should be read in conjunction with, the financial statements.
| 18 | MainStay VP MacKay S&P 500 Index Portfolio |
Statement of Operations for the six months ended June 30, 2021 (Unaudited)
| Investment Income (Loss) |
| Income | |
| Dividends-unaffiliated (net of foreign tax withholding of $2,305) | $ 25,638,842 |
| Interest | 6,984 |
| Securities lending | 5,255 |
| Dividends-affiliated | 16 |
| Total income | 25,651,097 |
| Expenses | |
| Manager (See Note 3) | 2,766,518 |
| Distribution/Service—Service Class (See Note 3) | 2,150,550 |
| Professional fees | 128,644 |
| Shareholder communication | 128,534 |
| Trustees | 33,999 |
| Custodian | 30,006 |
| Miscellaneous | 72,691 |
| Total expenses before waiver/reimbursement | 5,310,942 |
| Expense waiver/reimbursement from Manager (See Note 3) | (1,046,354) |
| Net expenses | 4,264,588 |
| Net investment income (loss) | 21,386,509 |
| Realized and Unrealized Gain (Loss) |
| Net realized gain (loss) on: | |
| Unaffiliated investment transactions | 33,143,823 |
| Futures transactions | 5,366,828 |
| Net realized gain (loss) | 38,510,651 |
| Net change in unrealized appreciation (depreciation) on: | |
| Unaffiliated investments | 443,492,790 |
| Futures contracts | 59,503 |
| Net change in unrealized appreciation (depreciation) | 443,552,293 |
| Net realized and unrealized gain (loss) | 482,062,944 |
| Net increase (decrease) in net assets resulting from operations | $503,449,453 |
The notes to the financial statements are an integral part of, and should be read in conjunction with, the financial statements.
19
Statements of Changes in Net Assets
for the six months ended June 30, 2021 (Unaudited) and the year ended December 31, 2020
| | 2021 | 2020 |
| Increase (Decrease) in Net Assets |
| Operations: | | |
| Net investment income (loss) | $ 21,386,509 | $ 39,963,323 |
| Net realized gain (loss) | 38,510,651 | 34,324,525 |
| Net change in unrealized appreciation (depreciation) | 443,552,293 | 469,492,808 |
| Net increase (decrease) in net assets resulting from operations | 503,449,453 | 543,780,656 |
| Distributions to shareholders: | | |
| Initial Class | — | (32,014,852) |
| Service Class | — | (28,858,985) |
| Total distributions to shareholders | — | (60,873,837) |
| Capital share transactions: | | |
| Net proceeds from sales of shares | 144,901,184 | 717,352,187 |
| Net asset value of shares issued to shareholder in reinvestment of distributions | — | 60,873,837 |
| Cost of shares redeemed | (404,803,877) | (356,638,845) |
| Increase (decrease) in net assets derived from capital share transactions | (259,902,693) | 421,587,179 |
| Net increase (decrease) in net assets | 243,546,760 | 904,493,998 |
| Net Assets |
| Beginning of period | 3,370,075,515 | 2,465,581,517 |
| End of period | $3,613,622,275 | $3,370,075,515 |
The notes to the financial statements are an integral part of, and should be read in conjunction with, the financial statements.
| 20 | MainStay VP MacKay S&P 500 Index Portfolio |
Financial Highlights selected per share data and ratios
| | Six months ended
June 30,
2021* | | Year Ended December 31, |
| Initial Class | 2020 | | 2019 | | 2018 | | 2017 | | 2016 |
| Net asset value at beginning of period | $ 71.41 | | $ 61.70 | | $ 48.11 | | $ 52.02 | | $ 44.05 | | $ 41.29 |
| Net investment income (loss) (a) | 0.51 | | 1.00 | | 1.01 | | 1.04 | | 0.80 | | 0.70 |
| Net realized and unrealized gain (loss) on investments | 10.31 | | 10.13 | | 13.88 | | (3.15) | | 8.60 | | 4.02 |
| Total from investment operations | 10.82 | | 11.13 | | 14.89 | | (2.11) | | 9.40 | | 4.72 |
| Less distributions: | | | | | | | | | | | |
| From net investment income | — | | (0.91) | | (1.00) | | (0.78) | | (0.70) | | (0.70) |
| From net realized gain on investments | — | | (0.51) | | (0.30) | | (1.02) | | (0.73) | | (1.26) |
| Total distributions | — | | (1.42) | | (1.30) | | (1.80) | | (1.43) | | (1.96) |
| Net asset value at end of period | $ 82.23 | | $ 71.41 | | $ 61.70 | | $ 48.11 | | $ 52.02 | | $ 44.05 |
| Total investment return (b) | 15.15%(c) | | 18.24% | | 31.25% | | (4.52)% | | 21.49% | | 11.62% |
| Ratios (to average net assets)/Supplemental Data: | | | | | | | | | | | |
| Net investment income (loss) | 1.33%†† | | 1.61% | | 1.80% | | 1.95% | | 1.65% | | 1.66% |
| Net expenses (d) | 0.12%†† | | 0.13% | | 0.16% | | 0.16% | | 0.22% | | 0.28% |
| Expenses (before waiver/reimbursement) (d) | 0.18%†† | | 0.20% | | 0.19% | | 0.19% | | 0.23% | | 0.28% |
| Portfolio turnover rate | 1% | | 2% | | 7% | | 9% | | 3% | | 3% |
| Net assets at end of period (in 000’s) | $ 1,760,851 | | $ 1,749,834 | | $ 1,123,943 | | $ 1,001,911 | | $ 1,156,346 | | $ 899,633 |
| * | Unaudited. |
| †† | Annualized. |
| (a) | Per share data based on average shares outstanding during the period. |
| (b) | Total return does not reflect any deduction of sales charges, mortality and expense charges, contract charges or administrative charges. For periods of less than one year, total return is not annualized. |
| (c) | Total investment return may reflect adjustments to conform to generally accepted accounting principles. |
| (d) | In addition to the fees and expenses which the Portfolio bears directly, it also indirectly bears a pro-rata share of the fees and expenses of the underlying funds in which it invests. Such indirect expenses are not included in the above expense ratios. |
The notes to the financial statements are an integral part of, and should be read in conjunction with, the financial statements.
21
Financial Highlights selected per share data and ratios
| | Six months ended
June 30,
2021* | | Year Ended December 31, |
| Service Class | 2020 | | 2019 | | 2018 | | 2017 | | 2016 |
| Net asset value at beginning of period | $ 70.76 | | $ 61.19 | | $ 47.74 | | $ 51.66 | | $ 43.80 | | $ 41.08 |
| Net investment income (loss) (a) | 0.41 | | 0.83 | | 0.86 | | 0.90 | | 0.67 | | 0.59 |
| Net realized and unrealized gain (loss) on investments | 10.22 | | 10.03 | | 13.77 | | (3.13) | | 8.54 | | 4.00 |
| Total from investment operations | 10.63 | | 10.86 | | 14.63 | | (2.23) | | 9.21 | | 4.59 |
| Less distributions: | | | | | | | | | | | |
| From net investment income | — | | (0.78) | | (0.88) | | (0.67) | | (0.62) | | (0.61) |
| From net realized gain on investments | — | | (0.51) | | (0.30) | | (1.02) | | (0.73) | | (1.26) |
| Total distributions | — | | (1.29) | | (1.18) | | (1.69) | | (1.35) | | (1.87) |
| Net asset value at end of period | $ 81.39 | | $ 70.76 | | $ 61.19 | | $ 47.74 | | $ 51.66 | | $ 43.80 |
| Total investment return (b) | 15.02% | | 17.95% | | 30.92% | | (4.76)% | | 21.19% | | 11.34% |
| Ratios (to average net assets)/Supplemental Data: | | | | | | | | | | | |
| Net investment income (loss) | 1.09%†† | | 1.37% | | 1.54% | | 1.70% | | 1.40% | | 1.41% |
| Net expenses (c) | 0.37%†† | | 0.38% | | 0.41% | | 0.41% | | 0.47% | | 0.53% |
| Expenses (before waiver/reimbursement) (c) | 0.43%†† | | 0.45% | | 0.44% | | 0.44% | | 0.48% | | 0.53% |
| Portfolio turnover rate | 1% | | 2% | | 7% | | 9% | | 3% | | 3% |
| Net assets at end of period (in 000’s) | $ 1,852,771 | | $ 1,620,242 | | $ 1,341,639 | | $ 920,531 | | $ 897,611 | | $ 613,011 |
| * | Unaudited. |
| †† | Annualized. |
| (a) | Per share data based on average shares outstanding during the period. |
| (b) | Total return does not reflect any deduction of sales charges, mortality and expense charges, contract charges or administrative charges. For periods of less than one year, total return is not annualized. |
| (c) | In addition to the fees and expenses which the Portfolio bears directly, it also indirectly bears a pro-rata share of the fees and expenses of the underlying funds in which it invests. Such indirect expenses are not included in the above expense ratios. |
The notes to the financial statements are an integral part of, and should be read in conjunction with, the financial statements.
| 22 | MainStay VP MacKay S&P 500 Index Portfolio |
Notes to Financial Statements (Unaudited)
Note 1–Organization and Business
MainStay VP Funds Trust (the “Fund”) was organized as a Delaware statutory trust on February 1, 2011. The Fund is registered under the Investment Company Act of 1940, as amended (the “1940 Act”), as an open-end management investment company. The Fund is comprised of thirty-one separate series (collectively referred to as the “Portfolios”). These financial statements and notes relate to the MainStay VP MacKay S&P 500 Index Portfolio (the "Portfolio"), a "diversified” portfolio, as that term is defined in the 1940 Act, as interpreted or modified by regulatory authorities having jurisdiction, from time to time.
Shares of the Portfolio are currently offered to certain separate accounts to fund variable annuity policies and variable universal life insurance policies issued by New York Life Insurance and Annuity Corporation (“NYLIAC”), a wholly-owned subsidiary of New York Life Insurance Company (“New York Life”) and may also be offered to fund variable annuity policies and variable universal life insurance policies issued by other insurance companies. NYLIAC allocates shares of the Portfolios to, among others, certain NYLIAC separate accounts. Shares of the Portfolio are also offered to the MainStay VP Conservative Allocation Portfolio, MainStay VP Moderate Allocation Portfolio, MainStay VP Growth Allocation Portfolio (formerly known as MainStay VP Moderate Growth Allocation Portfolio) and MainStay VP Equity Allocation Portfolio (formerly known as MainStay VP Growth Allocation Portfolio), which operate as “funds-of-funds," and other variable insurance funds.
The following table lists the Portfolio's share classes that have been registered and commenced operations:
| Class | Commenced Operations |
| Initial Class | January 29, 1993 |
| Service Class | June 5, 2003 |
Shares of the Portfolio are offered and are redeemed at a price equal to their respective net asset value (“NAV”) per share. No sales or redemption charge is applicable to the purchase or redemption of the Portfolio's shares. Under the terms of the Fund’s multiple class plan, adopted pursuant to Rule 18f-3 under the 1940 Act, the classes differ in that, among other things, Service Class shares of the Portfolio pay a combined distribution and service fee of 0.25% of average daily net assets attributable to Service Class shares of the Portfolio to the Distributor (as defined in Note 3(B)) pursuant to a plan adopted in accordance with Rule 12b-1 under the 1940 Act. Contract owners of variable annuity contracts purchased after June 2, 2003, are permitted to invest only in the Service Class shares.
The Portfolio's investment objective is to seek investment results that correspond to the total return performance (reflecting reinvestment of dividends) of common stocks in the aggregate, as represented by the S&P 500® Index.
Note 2–Significant Accounting Policies
The Portfolio is an investment company and accordingly follows the investment company accounting and reporting guidance of the Financial Accounting Standards Board (“FASB”) Accounting Standard Codification Topic 946 Financial Services—Investment Companies. The Portfolio prepares its financial statements in accordance with generally accepted accounting principles (“GAAP”) in the United States of America and follows the significant accounting policies described below.
(A) Securities Valuation. Investments are usually valued as of the close of regular trading on the New York Stock Exchange (the "Exchange") (usually 4:00 p.m. Eastern time) on each day the Portfolio is open for business ("valuation date").
The Board of Trustees of the Fund (the "Board") adopted procedures establishing methodologies for the valuation of the Portfolio's securities and other assets and delegated the responsibility for valuation determinations under those procedures to the Valuation Committee of the Fund (the “Valuation Committee”). The procedures state that, subject to the oversight of the Board and unless otherwise noted, the responsibility for the day-to-day valuation of portfolio assets (including fair value measurements for the Portfolio's assets and liabilities) rests with New York Life Investment Management LLC (“New York Life Investments” or the "Manager"), aided to whatever extent necessary by the Subadvisor (as defined in Note 3(A)). To assess the appropriateness of security valuations, the Manager, the Subadvisor or the Portfolio's third-party service provider, who is subject to oversight by the Manager, regularly compares prior day prices, prices on comparable securities and the sale prices to the prior and current day prices and challenges prices with changes exceeding certain tolerance levels with third-party pricing services or broker sources.
The Board authorized the Valuation Committee to appoint a Valuation Subcommittee (the “Subcommittee”) to establish the prices of securities for which market quotations are not readily available or the prices of which are not otherwise readily determinable under the procedures. The Subcommittee meets (in person, via electronic mail or via teleconference) on an as-needed basis. The Valuation Committee meets to ensure that actions taken by the Subcommittee were appropriate.
For those securities valued through either a standardized fair valuation methodology or a fair valuation measurement, the Subcommittee deals with such valuation and the Valuation Committee reviews and affirms, if appropriate, the reasonableness of the valuation based on such methodologies and measurements on a regular basis after considering information that is reasonably available and deemed relevant by the Valuation Committee. Any action taken by the Subcommittee with respect to the valuation of a portfolio security or other asset is submitted for review and ratification (if appropriate) to the Valuation Committee and the Board at the next regularly scheduled meeting.
"Fair value" is defined as the price the Portfolio would reasonably expect to receive upon selling an asset or liability in an orderly transaction to an independent buyer in the principal or most advantageous market for the
Notes to Financial Statements (Unaudited) (continued)
asset or liability. Fair value measurements are determined within a framework that establishes a three-tier hierarchy that maximizes the use of observable market data and minimizes the use of unobservable inputs to establish a classification of fair value measurements for disclosure purposes. "Inputs" refer broadly to the assumptions that market participants would use in pricing the asset or liability, including assumptions about risk, such as the risk inherent in a particular valuation technique used to measure fair value using a pricing model and/or the risk inherent in the inputs for the valuation technique. Inputs may be observable or unobservable. Observable inputs reflect the assumptions market participants would use in pricing the asset or liability based on market data obtained from sources independent of the Portfolio. Unobservable inputs reflect the Portfolio’s own assumptions about the assumptions market participants would use in pricing the asset or liability based on the information available. The inputs or methodology used for valuing assets or liabilities may not be an indication of the risks associated with investing in those assets or liabilities. The three-tier hierarchy of inputs is summarized below.
| • | Level 1—quoted prices in active markets for an identical asset or liability |
| • | Level 2—other significant observable inputs (including quoted prices for a similar asset or liability in active markets, interest rates and yield curves, prepayment speeds, credit risk, etc.) |
| • | Level 3—significant unobservable inputs (including the Portfolio's own assumptions about the assumptions that market participants would use in measuring fair value of an asset or liability) |
The level of an asset or liability within the fair value hierarchy is based on the lowest level of an input, both individually and in the aggregate, that is significant to the fair value measurement. The aggregate value by input level of the Portfolio’s assets and liabilities as of June 30, 2021, is included at the end of the Portfolio of Investments.
The Portfolio may use third-party vendor evaluations, whose prices may be derived from one or more of the following standard inputs, among others:
| • Broker/dealer quotes | • Benchmark securities |
| • Two-sided markets | • Reference data (corporate actions or material event notices) |
| • Bids/offers | • Monthly payment information |
| • Industry and economic events | • Reported trades |
An asset or liability for which market values cannot be measured using the methodologies described above is valued by methods deemed reasonable in good faith by the Valuation Committee, following the procedures established by the Board, to represent fair value. Under these procedures, the Portfolio generally uses a market-based approach which may use related or comparable assets or liabilities, recent transactions, market multiples, book values and other relevant information. The Portfolio may also use an income-based valuation approach in which the anticipated future cash flows of the asset or liability are discounted to
calculate fair value. Discounts may also be applied due to the nature and/or duration of any restrictions on the disposition of the asset or liability. Fair value represents a good faith approximation of the value of a security. Fair value determinations involve the consideration of a number of subjective factors, an analysis of applicable facts and circumstances and the exercise of judgment. As a result, it is possible that the fair value for a security determined in good faith in accordance with the Portfolio's valuation procedures may differ from valuations for the same security determined by other funds using their own valuation procedures. Although the Portfolio's valuation procedures are designed to value a security at the price the Portfolio may reasonably expect to receive upon the security's sale in an orderly transaction, there can be no assurance that any fair value determination thereunder would, in fact, approximate the amount that the Portfolio would actually realize upon the sale of the security or the price at which the security would trade if a reliable market price were readily available. During the six-month period ended June 30, 2021, there were no material changes to the fair value methodologies.
Securities which may be valued in this manner include, but are not limited to: (i) a security for which trading has been halted or suspended; (ii) a debt security that has recently gone into default and for which there is not a current market quotation; (iii) a security of an issuer that has entered into a restructuring; (iv) a security that has been delisted from a national exchange; (v) a security for which the market price is not readily available from a third-party pricing source or, if so provided, does not, in the opinion of the Manager or the Subadvisor, reflect the security's market value; (vi) a security subject to trading collars for which no or limited trading takes place; and (vii) a security whose principal market has been temporarily closed at a time when, under normal conditions, it would be open. Securities valued in this manner are generally categorized as Level 3 in the hierarchy. No securities held by the Portfolio as of June 30, 2021 were fair valued in such a manner.
Certain securities held by the Portfolio may principally trade in foreign markets. Events may occur between the time the foreign markets close and the time at which the Portfolio's NAVs are calculated. These events may include, but are not limited to, situations relating to a single issuer in a market sector, significant fluctuations in U.S. or foreign markets, natural disasters, armed conflicts, governmental actions or other developments not tied directly to the securities markets. Should the Manager or the Subadvisor conclude that such events may have affected the accuracy of the last price of such securities reported on the local foreign market, the Subcommittee may, pursuant to procedures adopted by the Board, adjust the value of the local price to reflect the estimated impact on the price of such securities as a result of such events. In this instance, securities are generally categorized as Level 3 in the hierarchy. Additionally, certain foreign equity securities are also fair valued whenever the movement of a particular index exceeds certain thresholds. In such cases, the securities are fair valued by applying factors provided by a third-party vendor in accordance with valuation procedures adopted by the Board and are generally categorized as Level 2 in the hierarchy. No foreign equity securities held by the Portfolio as of June 30, 2021 were fair valued in such a manner.
| 24 | MainStay VP MacKay S&P 500 Index Portfolio |
Equity securities are valued at the last quoted sales prices as of the close of regular trading on the relevant exchange on each valuation date. Securities that are not traded on the valuation date are valued at the mean of the last quoted bid and ask prices. Prices are normally taken from the principal market in which each security trades. These securities are generally categorized as Level 1 in the hierarchy.
Investments in mutual funds, including money market funds, are valued at their respective NAVs at the close of business each day on the valuation date. These securities are generally categorized as Level 1 in the hierarchy.
Futures contracts are valued at the last posted settlement price on the market where such futures are primarily traded. These securities are generally categorized as Level 1 in the hierarchy.
Debt securities (other than convertible and municipal bonds) are valued at the evaluated bid prices (evaluated mean prices in the case of convertible and municipal bonds) supplied by a pricing agent or broker selected by the Manager, in consultation with the Subadvisor. The evaluations are market-based measurements processed through a pricing application and represents the pricing agent’s good faith determination as to what a holder may receive in an orderly transaction under market conditions. The rules-based logic utilizes valuation techniques that reflect participants’ assumptions and vary by asset class and per methodology, maximizing the use of relevant observable data including quoted prices for similar assets, benchmark yield curves and market corroborated inputs. The evaluated bid or mean prices are deemed by the Manager, in consultation with the Subadvisor, to be representative of market values at the regular close of trading of the Exchange on each valuation date. Debt securities purchased on a delayed delivery basis are marked to market daily until settlement at the forward settlement date. Debt securities, including corporate bonds, U.S. government and federal agency bonds, municipal bonds, foreign bonds, convertible bonds, asset-backed securities and mortgage-backed securities are generally categorized as Level 2 in the hierarchy.
Temporary cash investments acquired in excess of 60 days to maturity at the time of purchase are valued using the latest bid prices or using valuations based on a matrix system (which considers such factors as security prices, yields, maturities and ratings), both as furnished by independent pricing services. Temporary cash investments that mature in 60 days or less at the time of purchase ("Short-Term Investments") are valued using the amortized cost method of valuation, unless the use of such method would be inappropriate. The amortized cost method involves valuing a security at its cost on the date of purchase and thereafter assuming a constant amortization to maturity of the difference between such cost and the value on maturity date. Amortized cost approximates the current fair value of a security. Securities valued using the amortized cost method are not valued using quoted prices in an active market and are generally categorized as Level 2 in the hierarchy.
The information above is not intended to reflect an exhaustive list of the methodologies that may be used to value portfolio investments. The valuation procedures permit the use of a variety of valuation
methodologies in connection with valuing portfolio investments. The methodology used for a specific type of investment may vary based on the market data available or other considerations. The methodologies summarized above may not represent the specific means by which portfolio investments are valued on any particular business day.
(B) Income Taxes. The Portfolio's policy is to comply with the requirements of the Internal Revenue Code of 1986, as amended (the “Internal Revenue Code”), applicable to regulated investment companies and to distribute all of its taxable income to the shareholders of the Portfolio within the allowable time limits.
The Manager evaluates the Portfolio’s tax positions to determine if the tax positions taken meet the minimum recognition threshold in connection with accounting for uncertainties in income tax positions taken or expected to be taken for the purposes of measuring and recognizing tax liabilities in the financial statements. Recognition of tax benefits of an uncertain tax position is permitted only to the extent the position is “more likely than not” to be sustained assuming examination by taxing authorities. The Manager analyzed the Portfolio's tax positions taken on federal, state and local income tax returns for all open tax years (for up to three tax years) and has concluded that no provisions for federal, state and local income tax are required in the Portfolio's financial statements. The Portfolio's federal, state and local income tax and federal excise tax returns for tax years for which the applicable statutes of limitations have not expired are subject to examination by the Internal Revenue Service and state and local departments of revenue.
(C) Foreign Taxes. The Portfolio may be subject to foreign taxes on income and other transaction-based taxes imposed by certain countries in which it invests. A portion of the taxes on gains on investments or currency purchases/repatriation may be reclaimable. The Portfolio will accrue such taxes and reclaims as applicable, based upon its current interpretation of tax rules and regulations that exist in the markets in which it invests.
The Portfolio may be subject to taxation on realized capital gains, repatriation proceeds and other transaction-based taxes imposed by certain countries in which it invests. The Portfolio will accrue such taxes as applicable based upon its current interpretation of tax rules and regulations that exist in the market in which it invests. Capital gains taxes relating to positions still held are reflected as a liability in the Statement of Assets and Liabilities, as well as an adjustment to the Portfolio's net unrealized appreciation (depreciation). Taxes related to capital gains realized, if any, are reflected as part of net realized gain (loss) in the Statement of Operations. Changes in tax liabilities related to capital gains taxes on unrealized investment gains, if any, are reflected as part of the change in net unrealized appreciation (depreciation) on investments in the Statement of Operations. Transaction-based charges are generally assessed as a percentage of the transaction amount.
(D) Dividends and Distributions to Shareholders. Dividends and distributions are recorded on the ex-dividend date. The Portfolio intends to declare and pay dividends from net investment income and
Notes to Financial Statements (Unaudited) (continued)
distributions from net realized capital and currency gains, if any, at least annually. Unless a shareholder elects otherwise, all dividends and distributions are reinvested at NAV in the same class of shares of the Portfolio. Dividends and distributions to shareholders are determined in accordance with federal income tax regulations and may differ from determinations using GAAP.
(E) Security Transactions and Investment Income. The Portfolio records security transactions on the trade date. Realized gains and losses on security transactions are determined using the identified cost method. Dividend income is recognized on the ex-dividend date, net of any foreign tax withheld at the source, and interest income is accrued as earned using the effective interest rate method. Distributions received from real estate investment trusts may be classified as dividends, capital gains and/or return of capital.
Investment income and realized and unrealized gains and losses on investments of the Portfolio are allocated pro rata to the separate classes of shares based upon their relative net assets on the date the income is earned or realized and unrealized gains and losses are incurred.
(F) Expenses. Expenses of the Fund are allocated to the individual Portfolios in proportion to the net assets of the respective Portfolios when the expenses are incurred, except where direct allocations of expenses can be made. Expenses (other than fees incurred under the distribution and service plans, further discussed in Note 3(B), which are charged directly to the Service Class shares) are allocated to separate classes of shares pro rata based upon their relative net assets on the date the expenses are incurred. The expenses borne by the Portfolio, including those of related parties to the Portfolio, are shown in the Statement of Operations.
Additionally, the Portfolio may invest in mutual funds, which are subject to management fees and other fees that may cause the costs of investing in mutual funds to be greater than the costs of owning the underlying securities directly. These indirect expenses of mutual funds are not included in the amounts shown as expenses in the Statement of Operations or in the expense ratios included in the Financial Highlights.
(G) Use of Estimates. In preparing financial statements in conformity with GAAP, the Manager makes estimates and assumptions that affect the reported amounts and disclosures in the financial statements. Actual results could differ from those estimates and assumptions.
(H) Futures Contracts. A futures contract is an agreement to purchase or sell a specified quantity of an underlying instrument at a specified future date and price, or to make or receive a cash payment based on the value of a financial instrument (e.g., foreign currency, interest rate, security or securities index). The Portfolio is subject to risks such as market price risk and/or interest rate risk in the normal course of investing in these contracts. Upon entering into a futures contract, the Portfolio is required to pledge to the broker or futures commission merchant an amount of cash and/or U.S. government securities equal to a certain percentage of the collateral amount, known as the “initial margin.” During the period the futures contract is open, changes in the
value of the contract are recognized as unrealized appreciation or depreciation by marking to market such contract on a daily basis to reflect the market value of the contract at the end of each day’s trading. The Portfolio agrees to receive from or pay to the broker or futures commission merchant an amount of cash equal to the daily fluctuation in the value of the contract. Such receipts or payments are known as “variation margin.” When the futures contract is closed, the Portfolio records a realized gain or loss equal to the difference between the proceeds from (or cost of) the closing transaction and the Portfolio's basis in the contract.
The use of futures contracts involves, to varying degrees, elements of market risk in excess of the amount recognized in the Statement of Assets and Liabilities. The contract or notional amounts and variation margin reflect the extent of the Portfolio's involvement in open futures positions. There are several risks associated with the use of futures contracts as hedging techniques. There can be no assurance that a liquid market will exist at the time when the Portfolio seeks to close out a futures contract. If no liquid market exists, the Portfolio would remain obligated to meet margin requirements until the position is closed. Futures contracts may involve a small initial investment relative to the risk assumed, which could result in losses greater than if the Portfolio did not invest in futures contracts. Futures contracts may be more volatile than direct investments in the instrument underlying the futures and may not correlate to the underlying instrument, causing a given hedge not to achieve its objectives. The Portfolio's activities in futures contracts have minimal counterparty risk as they are conducted through regulated exchanges that guarantee the futures against default by the counterparty. In the event of a bankruptcy or insolvency of a futures commission merchant that holds margin on behalf of the Portfolio, the Portfolio may not be entitled to the return of the entire margin owed to the Portfolio, potentially resulting in a loss. The Portfolio may invest in futures contracts to seek enhanced returns or to reduce the risk of loss by hedging certain of its holdings. The Portfolio's investment in futures contracts and other derivatives may increase the volatility of the Portfolio's NAVs and may result in a loss to the Portfolio. Open futures contracts as of June 30, 2021 are shown in the Portfolio of Investments.
(I) Securities Lending. In order to realize additional income, the Portfolio may engage in securities lending, subject to the limitations set forth in the 1940 Act and relevant guidance by the staff of the Securities and Exchange Commission (“SEC”). If the Portfolio engages in securities lending, the Portfolio will lend through its custodian, JPMorgan Chase Bank, N.A., ("JPMorgan"), acting as securities lending agent on behalf of the Portfolio. Under the current arrangement, JPMorgan will manage the Portfolio's collateral in accordance with the securities lending agency agreement between the Portfolio and JPMorgan, and indemnify the Portfolio against counterparty risk. The loans will be collateralized by cash (which may be invested in a money market fund) and/or non-cash collateral (which may include U.S. Treasury securities and/or U.S. government agency securities issued or guaranteed by the United States government or its agencies or instrumentalities) at least equal at all times to the market value of the securities loaned. The Portfolio bears the risk of
| 26 | MainStay VP MacKay S&P 500 Index Portfolio |
delay in recovery of, or loss of rights in, the securities loaned. The Portfolio may also record a realized gain or loss on securities deemed sold due to a borrower’s inability to return securities on loan. The Portfolio bears the risk of any loss on investment of cash collateral. The Portfolio will receive compensation for lending its securities in the form of fees or it will retain a portion of interest earned on the investment of any cash collateral. The Portfolio will also continue to receive interest and dividends on the securities loaned and any gain or loss in the market price of the securities loaned that may occur during the term of the loan will be for the account of the Portfolio. Income earned from securities lending activities, if any, is reflected in the Statement of Operations. Securities on loan as of June 30, 2021, are shown in the Portfolio of Investments.
Prior to February 22, 2021, these services were provided by State Street Bank and Trust Company (“State Street”).
(J) Securities Risk. The ability of issuers of debt securities held by the Portfolio to meet their obligations may be affected by, among other things, economic or political developments in a specific country, industry or region. Debt securities are also subject to the risks associated with changes in interest rates.
(K) Indemnifications. Under the Fund’s organizational documents, its officers and trustees are indemnified against certain liabilities that may arise out of performance of their duties to the Fund. Additionally, in the normal course of business, the Portfolio enters into contracts with third-party service providers that contain a variety of representations and warranties and that may provide general indemnifications. The Portfolio's maximum exposure under these arrangements is unknown, as this would involve future claims that may be made against the Portfolio that have not yet occurred. The Manager believes that the risk of loss in connection with these potential indemnification obligations is remote. However, there can be no assurance that material liabilities related to such obligations will not arise in the future, which could adversely impact the Portfolio.
(L) Quantitative Disclosure of Derivative Holdings. The following tables show additional disclosures related to the Portfolio's derivative and hedging activities, including how such activities are accounted for and their effect on the Portfolio's financial positions, performance and cash flows.
The Portfolio entered into futures contracts in order to manage its exposure to the securities markets or to movements in interest rates and currency values.
Fair value of derivative instruments as of June 30, 2021:
| Asset Derivatives | Equity
Contracts
Risk | Total |
| Futures Contracts - Net Assets—Net unrealized appreciation on futures contracts (a) | $450,242 | $450,242 |
| Total Fair Value | $450,242 | $450,242 |
| (a) | Includes cumulative appreciation (depreciation) of futures contracts as reported in the Portfolio of Investments. Only current day’s variation margin is reported within the Statement of Assets and Liabilities. |
The effect of derivative instruments on the Statement of Operations for the six-month period ended June 30, 2021:
| Net Realized Gain (Loss) from: | Equity
Contracts
Risk | Total |
| Futures Contracts | $5,366,828 | $5,366,828 |
| Total Net Realized Gain (Loss) | $5,366,828 | $5,366,828 |
| Net Change in Unrealized Appreciation (Depreciation) | Equity
Contracts
Risk | Total |
| Futures Contracts | $59,503 | $59,503 |
| Total Net Change in Unrealized Appreciation (Depreciation) | $59,503 | $59,503 |
| Average Notional Amount | Total |
| Futures Contracts Long | $35,954,745 |
Note 3–Fees and Related Party Transactions
(A) Manager and Subadvisor. New York Life Investments, a registered investment adviser and an indirect, wholly-owned subsidiary of New York Life, serves as the Portfolio's Manager, pursuant to an Amended and Restated Management Agreement ("Management Agreement"). The Manager provides offices, conducts clerical, recordkeeping and bookkeeping services and keeps most of the financial and accounting records required to be maintained by the Portfolio. Except for the portion of salaries and expenses that are the responsibility of the Portfolio, the Manager pays the salaries and expenses of all personnel affiliated with the Portfolio and certain operational expenses of the Portfolio. The Portfolio reimburses New York Life Investments in an amount equal to the portion of the compensation of the Chief Compliance Officer attributable to the Portfolio. MacKay Shields LLC ("MacKay Shields" or the "Subadvisor"), a registered investment adviser and an indirect, wholly-owned subsidiary of New York Life, serves as Subadvisor to the Portfolio and is responsible for the day-to-day portfolio management of the Portfolio. Pursuant to the terms of an Amended and Restated Subadvisory Agreement ("Subadvisory Agreement") between New York Life Investments and MacKay Shields, New York Life Investments pays for the services of the Subadvisor.
Notes to Financial Statements (Unaudited) (continued)
Pursuant to the Management Agreement, the Fund pays the Manager, on behalf of the Portfolio, a monthly fee for the services performed and the facilities furnished at an annual rate of the Portfolio's average daily net assets as follows: 0.16% up to $2.5 billion; and 0.15% in excess of $2.5 billion. During the six-month period ended June 30, 2021, the effective management fee rate was 0.16% (exclusive of any applicable waivers/reimbursements).
New York Life Investments has contractually agreed to waive fees and/or reimburse expenses so that the Total Annual Portfolio Operating Expenses (excluding taxes, interest, litigation, extraordinary expenses, brokerage and other transaction expenses relating to the purchase or sale of portfolio investments and acquired (underlying) portfolio/fund fees and expenses) of Initial Class shares and Service Class shares do not exceed 0.12% and 0.37%, respectively, of the Portfolio's average daily net assets. This agreement will remain in effect until May 1, 2022, and shall renew automatically for one-year terms unless New York Life Investments provides written notice of termination prior to the start of the next term or upon approval of the Board.
During the six-month period ended June 30, 2021, New York Life Investments earned fees from the Portfolio in the amount of $2,766,518 and waived fees and/or reimbursed expenses in the amount of $1,046,354 and paid the Subadvisor fees in the amount of $861,116.
JPMorgan provides sub-administration and sub-accounting services to the Portfolio pursuant to an agreement with New York Life Investments. These services include calculating the daily NAVs of the Portfolio,
maintaining the general ledger and sub-ledger accounts for the calculation of the Portfolio's NAVs, and assisting New York Life Investments in conducting various aspects of the Portfolio's administrative operations. For providing these services to the Portfolio, JPMorgan is compensated by New York Life Investments.
Prior to February 22, 2021, these services were provided by State Street.
Pursuant to an agreement between the Fund and New York Life Investments, New York Life Investments is responsible for providing or procuring certain regulatory reporting services for the Portfolio. The Portfolio will reimburse New York Life Investments for the actual costs incurred by New York Life Investments in connection with providing or procuring these services for the Portfolio.
(B) Distribution and Service Fees. The Fund, on behalf of the Portfolio, has entered into a distribution agreement with NYLIFE Distributors LLC (the “Distributor”), an affiliate of New York Life Investments. The Portfolio has adopted a distribution plan (the “Plan”) in accordance with the provisions of Rule 12b-1 under the 1940 Act. Under the Plan, the Distributor has agreed to provide, through its affiliates or independent third parties, various distribution-related, shareholder and administrative support services to the Service Class shareholders. For its services, the Distributor is entitled to a combined distribution and service fee accrued daily and paid monthly at an annual rate of 0.25% of the average daily net assets attributable to the Service Class shares of the Portfolio.
(C) Investments in Affiliates (in 000’s). During the six-month period ended June 30, 2021, purchases and sales transactions, income earned from investments and shares held of investment companies managed by New York Life Investments or its affiliates were as follows:
| Affiliated Investment Companies | Value,
Beginning
of Period | Purchases
at Cost | Proceeds
from
Sales | Net
Realized
Gain/(Loss)
on Sales | Change in
Unrealized
Appreciation/
(Depreciation) | Value,
End of
Period | Dividend
Income | Other
Distributions | Shares
End of
Period |
| MainStay U.S. Government Liquidity Fund | $ 1,897 | $ 41,105 | $ (40,973) | $ — | $ — | $ 2,029 | $ —(a) | $ — | 2,029 |
Note 4-Federal Income Tax
As of June 30, 2021, the cost and unrealized appreciation (depreciation) of the Portfolio’s investment portfolio, including applicable derivative contracts and other financial instruments, as determined on a federal income tax basis, were as follows:
| | Federal Tax
Cost | Gross
Unrealized
Appreciation | Gross
Unrealized
(Depreciation) | Net
Unrealized
Appreciation/
(Depreciation) |
| Investments in Securities | $1,207,941,985 | $2,415,141,140 | $(9,225,544) | $2,405,915,596 |
During the year ended December 31, 2020, the tax character of distributions paid as reflected in the Statements of Changes in Net Assets was as follows:
| | 2020 |
| Distributions paid from: | |
| Ordinary Income | $47,539,689 |
| Long-Term Capital Gains | 13,334,148 |
| Total | $60,873,837 |
Note 5–Custodian
JPMorgan is the custodian of cash and securities held by the Portfolio. Custodial fees are charged to the Portfolio based on the Portfolio's net assets and/or the market value of securities held by the Portfolio and the number of certain transactions incurred by the Portfolio.
| 28 | MainStay VP MacKay S&P 500 Index Portfolio |
Prior to February 22, 2021, these services were provided by State Street. The services provided by State Street were a direct expense of the Portfolio and are included in the Statement of Operations as Custodian fees which totaled $8,289 for the period January 1, 2021 through February 21, 2021.
Note 6–Line of Credit
The Portfolio and certain other funds managed by New York Life Investments maintain a line of credit with a syndicate of banks in order to secure a source of funds for temporary purposes to meet unanticipated or excessive redemption requests.
Effective July 27, 2021, under the credit agreement (the “Credit Agreement”), the aggregate commitment amount is $600,000,000 with an additional uncommitted amount of $100,000,000. The commitment fee is an annual rate of 0.15% of the average commitment amount payable quarterly, regardless of usage, to JPMorgan, who serves as the agent to the syndicate. The commitment fee is allocated among the Portfolio and certain other funds managed by New York Life Investments based upon their respective net assets and other factors. Interest on any revolving credit loan is charged based upon the Federal Funds Rate or the one-month London Interbank Offered Rate ("LIBOR"), whichever is higher. The Credit Agreement expires on July 26, 2022, although the Portfolio, certain other funds managed by New York Life Investments and the syndicate of banks may renew the Credit Agreement for an additional year on the same or different terms or enter into a credit agreement with a different syndicate of banks. Prior to July 27, 2021, the aggregate commitment amount and the commitment fee were the same as those under the current Credit Agreement. During the six-month period ended June 30, 2021, there were no borrowings made or outstanding with respect to the Portfolio under the Credit Agreement.
Note 7–Interfund Lending Program
Pursuant to an exemptive order issued by the SEC, the Portfolio, along with certain other funds managed by New York Life Investments, may participate in an interfund lending program. The interfund lending program provides an alternative credit facility that permits the Portfolio and certain other funds managed by New York Life Investments to lend or borrow money for temporary purposes directly to or from one another, subject to the conditions of the exemptive order. During the six-month period ended June 30, 2021, there were no interfund loans made or outstanding with respect to the Portfolio.
Note 8–Purchases and Sales of Securities (in 000’s)
During the six-month period ended June 30, 2021, purchases and sales of securities, other than short-term securities, were $40,615 and $269,235, respectively.
Note 9–Capital Share Transactions
Transactions in capital shares for the six-month period ended June 30, 2021 and the year ended December 31, 2020, were as follows:
| Initial Class | Shares | Amount |
| Period ended June 30, 2021: | | |
| Shares sold | 1,162,018 | $ 87,864,184 |
| Shares redeemed | (4,254,301) | (337,036,954) |
| Net increase (decrease) | (3,092,283) | $(249,172,770) |
| Year ended December 31, 2020: | | |
| Shares sold | 7,686,597 | $ 453,164,433 |
| Shares issued to shareholders in reinvestment of distributions | 490,124 | 32,014,852 |
| Shares redeemed | (1,887,708) | (114,377,735) |
| Net increase (decrease) | 6,289,013 | $ 370,801,550 |
| |
| Service Class | Shares | Amount |
| Period ended June 30, 2021: | | |
| Shares sold | 768,324 | $ 57,037,000 |
| Shares redeemed | (901,258) | (67,766,923) |
| Net increase (decrease) | (132,934) | $ (10,729,923) |
| Year ended December 31, 2020: | | |
| Shares sold | 4,480,239 | $ 264,187,754 |
| Shares issued to shareholders in reinvestment of distributions | 445,605 | 28,858,985 |
| Shares redeemed | (3,954,679) | (242,261,110) |
| Net increase (decrease) | 971,165 | $ 50,785,629 |
Note 10-Litigation
The Portfolio has been named as a defendant in the case entitled Kirschner v. FitzSimons, No. 12-2652 (S.D.N.Y.) (the “FitzSimons action”) as a result of its ownership of shares in the Tribune Company (“Tribune”) in 2007 when Tribune effected a leveraged buyout transaction (“LBO”) by which Tribune converted to a privately-held company. In its complaint, the plaintiff asserts claims against certain insiders, shareholders, professional advisers, and others involved in the LBO.
Separately, the complaint also seeks to obtain from former Tribune shareholders, including the Portfolio, any proceeds they received in connection with the LBO. The sole claim and cause of action brought against the Portfolio is for fraudulent conveyance pursuant to United States Bankruptcy Code Section 548(a)(1)(A).
In June 2011, certain Tribune creditors filed numerous additional actions asserting state law constructive fraudulent conveyance claims (the “SLCFC actions”) against specifically-named former Tribune shareholders and, in some cases, putative defendant classes comprised of former Tribune shareholders. One of the SLCFC actions, entitled Deutsche Bank Trust Co. Americas v. Blackrock Institutional Trust Co., No. 11-9319 (S.D.N.Y.) (the “Deutsche Bank action”), named the Portfolio as a defendant.
Notes to Financial Statements (Unaudited) (continued)
The FitzSimons action and Deutsche Bank action have been consolidated with the majority of the other Tribune LBO-related lawsuits in a multidistrict litigation proceeding entitled In re Tribune Co. Fraudulent Conveyance Litig., No. 11-md-2296 (S.D.N.Y.) (the “MDL Proceeding”).
On September 23, 2013, the District Court granted the defendants’ motion to dismiss the SLCFC actions, including the Deutsche Bank action, on the basis that the plaintiffs did not have standing to pursue their claims. On September 30, 2013, the plaintiffs in the SLCFC actions filed a notice of appeal to the United States Court of Appeals for the Second Circuit. On October 28, 2013, the defendants filed a joint notice of cross-appeal of that same order. On November 5, 2014, the Second Circuit Court of Appeals held an oral argument on appeal. On March 29, 2016, the United States Court of Appeals for the Second Circuit issued its opinion on the appeal of the SLCFC actions. The appeals court affirmed the District Court’s dismissal of those lawsuits, but on different grounds than the District Court. The appeals court held that while the plaintiffs have standing under the U.S. Bankruptcy Code, their claims were pre-empted by Section 546(e) of the Bankruptcy Code—the statutory safe harbor for settlement payments. On April 12, 2016, the plaintiffs in the SLCFC actions filed a petition seeking rehearing en banc before the appeals court. On July 22, 2016, the appeals court denied the petition. On September 9, 2016, the plaintiffs filed a petition for writ of certiorari in the U.S. Supreme Court challenging the Second Circuit’s decision that the safe harbor of Section 546(e) applied to their claims. Certain shareholder defendants filed a joint brief in opposition to the petition for certiorari on October 24, 2016. The plaintiffs filed a reply in support of the petition on November 4, 2016. On April 3, 2018, Justice Kennedy and Justice Thomas issued a “Statement” related to the petition for certiorari suggesting that the Second Circuit and/or District Court may want to take steps to reexamine the application of the Section 546(e) safe harbor to the previously dismissed state law constructive fraudulent transfer claims based on the Supreme Court’s decision in Merit Management Group LP v. FTI Consulting, Inc. On April 10, 2018, the plaintiffs filed in the Second Circuit a motion for that court to recall its mandate, vacate its prior decision, and remand to the District Court for further proceedings consistent with Merit Management. On April 20, 2018, the shareholder defendants filed a response to the plaintiffs’ motion to recall the mandate. On May 15, 2018, the Second Circuit issued an order recalling the mandate “in anticipation of further panel review.” On December 19, 2019, the Second Circuit issued an amended opinion that again affirmed the district court’s ruling on the basis that plaintiffs’ claims were preempted by Section 546(e) of the Bankruptcy Code. Plaintiffs filed a motion for rehearing and rehearing en banc on January 2, 2020, which was denied on February 6, 2020. Plaintiffs filed a new petition for certiorari with the Supreme Court on July 6, 2020. In that petition, plaintiffs stated that “[t]o make it more likely that there will be a quorum for this petition,” they have “abandon[ed] the case and let the judgment below stand” with respect to certain defendants. That list did not include the Portfolio. Defendants filed an opposition to the certiorari petition on August 26, 2020. Plaintiffs filed a reply in support of the petition for certiorari on September 8, 2020. On March 12, 2021, the Solicitor General filed an amicus brief recommending that certiorari be denied.
Plaintiffs filed a supplemental brief in response to the Solicitor General’s amicus brief on March 31, 2021, and Defendants filed a supplemental brief on April 1, 2021. The Supreme Court denied the petition for certiorari on April 19, 2021.
On August 2, 2013, the plaintiff in the FitzSimons action filed a Fifth Amended Complaint. On May 23, 2014, the defendants filed motions to dismiss the FitzSimons action, including a global motion to dismiss Count I, which is the claim brought against former Tribune shareholders for intentional fraudulent conveyance under U.S. federal law. On January 6, 2017, the United States District Court for the Southern District of New York granted the shareholder defendants’ motion to dismiss the intentional fraudulent conveyance claim in the FitzSimons action. In dismissing the intentional fraudulent conveyance claim, the Court denied the plaintiff’s request to amend the complaint. The Court’s order is not immediately appealable, but the plaintiff has asked the Court to direct entry of a final judgment in order to make the order immediately appealable. On February 23, 2017, the Court issued an order stating that it intends to permit an interlocutory appeal of the dismissal order, but will wait to do so until it has resolved outstanding motions to dismiss filed by other defendants.
On July 18, 2017, the plaintiff submitted a letter to the District Court seeking leave to amend its complaint to add a constructive fraudulent transfer claim. The shareholder defendants opposed that request.
On August 24, 2017, the Court denied the plaintiff’s request without prejudice to renewal of the request in the event of an intervening change in the law. On March 8, 2018, the plaintiff renewed his request for leave to file a motion to amend the complaint to assert a constructive fraudulent transfer claim based on the Supreme Court’s ruling in Merit Management. The shareholder defendants opposed that request. On June 18, 2018, the District Court ordered that the request would be stayed pending further action by the Second Circuit in the still-pending appeal, discussed above. On December 18, 2018, the plaintiff filed a letter with the District Court requesting that the stay be dissolved in order to permit briefing on the motion to amend the complaint and indicating the plaintiff’s intention to file another motion to amend the complaint to reinstate claims for intentional fraudulent transfer. The shareholder defendants opposed that request. On January 14, 2019, the Court held a case management conference, during which the Court stated that it would not lift the stay prior to further action from the Second Circuit. The Court stated that it would allow the plaintiff to file a motion to amend to try to reinstate its intentional fraudulent transfer claim. On January 23, 2019, the Court ordered the parties still facing pending claims to participate in a mediation. On March 27, 2019, the Court held a telephone conference and decided to allow the plaintiff to file a motion for leave to amend. On April 4, 2019, the plaintiff filed a motion to amend the Fifth Amended Complaint to assert a federal constructive fraudulent transfer claim against certain shareholder defendants. On April 10, 2019, the shareholder defendants filed a brief in opposition to the plaintiff’s motion to amend. On April 12, 2019, the plaintiff filed a reply brief. The Court denied leave to amend the complaint on April 23, 2019. On June 13, 2019, the Court entered judgment pursuant to Rule 54(b), which
| 30 | MainStay VP MacKay S&P 500 Index Portfolio |
would permit an appeal of the Court’s dismissal of the claim against the shareholder defendants. On July 15, 2019, the Trustee filed a notice of appeal to the Second Circuit. Appellant filed his brief on January 7, 2020. The shareholder defendants filed an opposition brief on April 27, 2020, and Appellant filed a reply brief on May 18, 2020. The Court held oral argument on August 24, 2020. In addition, the District Court has entered two bar orders in connection with the plaintiff’s settlement with certain non-shareholder defendants. The orders bar claims against the settling defendants, but contain a judgment reduction provision that preserves the value of any potential claim by a shareholder defendant against a settling defendant. Specifically, the judgment reduction provision reduces the amount of money recoverable against a shareholder defendant to the extent the shareholder defendant could have recovered on a claim against a settling defendant.
The value of the proceeds received by the Portfolio in connection with the LBO and the Portfolio's cost basis in shares of Tribune was as follows:
| Portfolio | Proceeds | Cost Basis |
| MainStay VP MacKay S&P 500 Index Portfolio | $682,856 | $527,309 |
At this stage of the proceedings, it would be difficult to assess with any reasonable certainty the probable outcome of the pending litigation or the effect, if any, on the Portfolio's net asset value.
Note 11–Other Matters
An outbreak of COVID-19, first detected in December 2019, has developed into a global pandemic and has resulted in travel restrictions, closure of international borders, certain businesses and securities markets, restrictions on securities trading activities, prolonged quarantines, supply chain disruptions, and lower consumer demand, as well as general concern and uncertainty. The continued impact of COVID-19 and related new variants is uncertain and could further adversely affect the global economy, national economies, individual issuers and capital markets in unforeseeable ways and result in a substantial and extended economic downturn. Developments that disrupt global economies and financial markets, such as COVID-19, may magnify factors that affect the Portfolio's performance.
Note 12–Subsequent Events
In connection with the preparation of the financial statements of the Portfolio as of and for the six-month period ended June 30, 2021, events and transactions subsequent to June 30, 2021, through the date the financial statements were issued have been evaluated by the Manager for possible adjustment and/or disclosure. No subsequent events requiring financial statement adjustment or disclosure have been identified.
Discussion of the Operation and Effectiveness of the Portfolio's Liquidity Risk Management Program (Unaudited)
In compliance with Rule 22e-4 under the Investment Company Act of 1940, as amended (the “Liquidity Rule”), the Portfolio has adopted and implemented a liquidity risk management program (the “Program”), which New York Life Investment Management LLC believes is reasonably designed to assess and manage the Portfolio's liquidity risk (the risk that the Portfolio could not meet requests to redeem shares issued by the Portfolio without significant dilution of remaining investors’ interests in the Portfolio). The Board of Trustees of MainStay VP Funds Trust (the "Board") designated New York Life Investment Management LLC as administrator of the Program (the “Administrator”). The Administrator has established a Liquidity Risk Management Committee to assist the Administrator in the implementation and day-to-day administration of the Program and to otherwise support the Administrator in fulfilling its responsibilities under the Program.
At a meeting of the Board held on March 8, 2021, the Administrator provided the Board with a written report addressing the Program’s operation and assessing its adequacy and effectiveness of implementation for the period from January 1, 2020 through December 31, 2020 (the "Review Period"), as required under the Liquidity Rule. The report noted that the Administrator concluded that (i) the Program operated effectively to assess and manage the Portfolio's liquidity risk, (ii) the Program has been adequately and effectively implemented to monitor and, as applicable, respond to the Portfolio's liquidity developments and (iii) the Portfolio's investment strategy continues to be appropriate for an open-end fund. In addition, the report discussed notable events that impacted liquidity risk during the Review Period, including the COVID-19 pandemic and the resulting economic shutdown.
In accordance with the Program, the Portfolio's liquidity risk is assessed no less frequently than annually taking into consideration certain factors, as applicable, such as (i) investment strategy and liquidity of portfolio investments, (ii) short-term and long-term cash flow projections and (iii) holdings of cash and cash equivalents, as well as borrowing arrangements and other funding sources. Certain factors are considered under both normal and reasonably foreseeable stressed conditions.
Each Portfolio portfolio investment is classified into one of four liquidity categories. The classification is based on a determination of the number of days it is reasonably expected to take to convert the investment into cash, or sell or dispose of the investment, in current market conditions without significantly changing the market value of the investment. The Administrator has delegated liquidity classification determinations to the Portfolio’s subadvisor, subject to appropriate oversight by the Administrator, and classification determinations are made by taking into account the Portfolio's reasonably anticipated trade size, various market, trading and investment-specific considerations, as well as market depth, and, in certain cases, third-party vendor data.
The Liquidity Rule requires portfolios that do not primarily hold assets that are highly liquid investments to adopt a minimum amount of net assets that must be invested in highly liquid investments that are assets (an “HLIM”). In addition, the Liquidity Rule limits a portfolio's investments in illiquid investments. Specifically, the Liquidity Rule prohibits acquisition of illiquid investments if doing so would result in a portfolio holding more than 15% of its net assets in illiquid investments that are assets. The Program includes provisions reasonably designed to determine, periodically review and comply with the HLIM requirement, as applicable, and to comply with the 15% limit on illiquid investments.
There can be no assurance that the Program will achieve its objectives under all circumstances in the future. Please refer to the Portfolio's prospectus for more information regarding the Portfolio's exposure to liquidity risk and other risks to which it may be subject.
| 32 | MainStay VP MacKay S&P 500 Index Portfolio |
Proxy Voting Record
The Portfolio is required to file with the SEC its proxy voting records for the 12-month period ending June 30 on Form N-PX. The Portfolio's most recent Form N-PX or proxy voting record is available free of charge upon request (i) by calling 800-598-2019; (ii) by visiting New York Life Investments’ website at https://www.nylinvestments.com/mainstay/
products-and-performance/mainstay-vp-funds-trust; or (iii) by visiting the SEC’s website at www.sec.gov.
Shareholder Reports and Quarterly Portfolio Disclosure
The Portfolio is required to file its complete schedule of portfolio holdings with the SEC 60 days after its first and third fiscal quarter on Form N-PORT. The Portfolio's holdings report is available free of charge upon request by calling 800-598-2019 or by visiting the SEC’s website at www.sec.gov.
This page intentionally left blank
MainStay VP Portfolios
MainStay VP offers a wide range of Portfolios. The full array of MainStay VP offerings is listed here, with information about the manager, subadvisors, legal counsel, and independent registered public accounting firm.
Equity
MainStay VP Candriam Emerging Markets Equity Portfolio
MainStay VP Epoch U.S. Equity Yield Portfolio
MainStay VP Fidelity Institutional AM® Utilities Portfolio†
MainStay VP MacKay International Equity Portfolio
MainStay VP MacKay S&P 500 Index Portfolio
MainStay VP Natural Resources Portfolio
MainStay VP Small Cap Growth Portfolio
MainStay VP T. Rowe Price Equity Income Portfolio
MainStay VP Wellington Growth Portfolio
MainStay VP Wellington Mid Cap Portfolio
MainStay VP Wellington Small Cap Portfolio
MainStay VP Wellington U.S. Equity Portfolio
MainStay VP Winslow Large Cap Growth Portfolio
Mixed Asset
MainStay VP Balanced Portfolio
MainStay VP Income Builder Portfolio
MainStay VP Janus Henderson Balanced Portfolio
MainStay VP MacKay Convertible Portfolio
Income
MainStay VP Bond Portfolio
MainStay VP Floating Rate Portfolio
MainStay VP Indexed Bond Portfolio
MainStay VP MacKay Government Portfolio
MainStay VP MacKay High Yield Corporate Bond Portfolio
MainStay VP MacKay Strategic Bond Portfolio
MainStay VP PIMCO Real Return Portfolio
Money Market
MainStay VP U.S. Government Money Market Portfolio
Alternative
MainStay VP CBRE Global Infrastructure Portfolio
MainStay VP IQ Hedge Multi-Strategy Portfolio
Asset Allocation
MainStay VP Conservative Allocation Portfolio
MainStay VP Equity Allocation Portfolio
MainStay VP Growth Allocation Portfolio
MainStay VP Moderate Allocation Portfolio
Manager
New York Life Investment Management LLC
New York, New York
Subadvisors
Brown Advisory LLC
Baltimore, Maryland
Candriam Belgium S.A.*
Brussels, Belgium
CBRE Clarion Securities LLC
Radnor, Pennsylvania
Epoch Investment Partners, Inc.
New York, New York
FIAM LLC
Smithfield, Rhode Island
IndexIQ Advisors LLC*
New York, New York
Janus Capital Management LLC
Denver, Colorado
MacKay Shields LLC*
New York, New York
Mellon Investments Corporation
Boston, Massachusetts
NYL Investors LLC*
New York, New York
Pacific Investment Management Company LLC
Newport Beach, California
Segall Bryant & Hamill, LLC
Chicago, Illinois
T. Rowe Price Associates, Inc.
Baltimore, Maryland
Wellington Management Company LLP
Boston, Massachusetts
Winslow Capital Management, LLC
Minneapolis, Minnesota
Legal Counsel
Dechert LLP
Washington, District of Columbia
Independent Registered Public Accounting Firm
PricewaterhouseCoopers LLP
New York, New York
Distributor
NYLIFE Distributors LLC*
Jersey City, New Jersey
Custodian
JPMorgan Chase Bank, N.A.
New York, New York
Some Portfolios may not be available in all products.
† Fidelity Institutional AM is a registered trade mark of FMR LLC. Used with permission.
* An affiliate of New York Life Investment Management LLC
Not part of the Semiannual Report
2021 Semiannual Report
This report is for the general information of New York Life Variable Annuities and NYLIAC Variable Universal Life Insurance Products policyowners. It must be preceded or accompanied by the appropriate product(s) and funds prospectuses if it is given to anyone who is not an owner of a New York Life variable annuity policy or a NYLIAC Variable Universal Life Insurance Product. This report does not offer for sale or solicit orders to purchase securities.
The performance data quoted in this report represents past performance. Past performance is no guarantee of future results. Due to market volatility and other factors, current performance may be lower or higher than the figures shown. The most recent month-end performance summary for your variable annuity or variable life policy is available by calling 800-598-2019 and is updated periodically on newyorklife.com.
The New York Life Variable Annuities and NYLIAC Variable Universal Life Insurance Products are issued by New York Life Insurance and Annuity Corporation (a Delaware Corporation) and distributed by NYLIFE Distributors LLC (Member FINRA/SIPC).
New York Life Insurance Company
New York Life Insurance and Annuity
Corporation (NYLIAC) (A Delaware Corporation)
51 Madison Avenue, Room 551
New York, NY 10010
newyorklife.com
nylinvestments.com
NYLIFE Distributors LLC, 30 Hudson Street, Jersey City, NJ 07302
New York Life Investment Management LLC is the investment manager to the MainStay VP Funds Trust
©2021 by NYLIFE Distributors LLC. All rights reserved.
You may obtain copies of the Prospectus and the Statement of Additional Information free of charge, upon request, by calling toll-free 800-598-2019 or writing to New York Life Insurance and Annuity Corporation, 51 Madison Avenue, New York, NY 10010.
| Not FDIC Insured | No Bank Guarantee | May Lose Value |
(NYLIAC) NI529
MainStay VP CBRE Global Infrastructure Portfolio
Message from the President and Semiannual Report
Unaudited | June 30, 2021
Sign up for e-delivery of your shareholder reports. For full details on e-delivery, including who can participate and what you can receive via e-delivery,
please log in to newyorklifeinvestments.com/accounts.
| Not FDIC/NCUA Insured | Not a Deposit | May Lose Value | No Bank Guarantee | Not Insured by Any Government Agency |
This page intentionally left blank
Message from the President
The COVID-19 pandemic continued to afflict our personal lives and broad segments of the U.S. and global economy throughout the six-month reporting period ended June 30, 2021. However, with the deployment of multiple vaccines around the world, including three highly effective versions approved for emergency use in the United States, investors began to turn their attention toward the gradual reopening of the economy and the shape the “new normal” would take.
The first half of the reporting period saw increasing inflationary concerns as fiscal stimulus business reopenings drove accelerating economic growth, rising commodity prices and increased consumer spending. However, the U.S. Federal Reserve noted that price increases were likely to prove temporary and made clear their intention to remain accommodative for the foreseeable future. Accordingly, after moving higher in the first quarter of 2021, interest rates declined in the second quarter.
In response to the uncertain inflation outlook, equity market leadership shifted from value in the first quarter of the year to growth in the second quarter. Nevertheless, investor sentiment remained buoyant throughout the reporting period, with all eleven sectors in the S&P 500® Index, a widely regarded benchmark of market performance, producing positive returns. Energy led the market’s rise fueled by rapidly increasing oil and gas prices, followed by financials and real estate, which benefited from rising interest rates and the economic reopening, respectively. Communication services produced the slowest growth, followed by the traditionally defensive utilities and consumer staples
sectors. In the fixed income market, lower-credit-quality issues tended to outperform their higher-grade counterparts, with high-yield corporate bonds generating the strongest performance. Among securitized products, commercial mortgage-backed securities generally produced the strongest returns, followed by mortgage-backed securities and asset-backed securities, while Treasury securities lagged.
Despite the tremendous progress we’ve seen so far this year, the United States and the world continue to face significant pandemic-related challenges. Newer, more contagious variants of COVID-19 threaten the return of restrictions and lockdowns that could stall the economic recovery. At the same time, supply chain shortages have led to rising prices on everything from laptops to autos, stoking fears of uncontrolled inflation despite reassurance from the U.S. Federal Reserve. At New York Life Investments, we recognize that the shape that the “new normal” eventually takes may differ from our expectations. You can depend on us to keep a sharp watch for the unexpected, and to continue to help you find your way through this rapidly evolving investment landscape.
Sincerely,
Kirk C. Lehneis
President
The opinions expressed are as of the date of this report and are subject to change. There is no guarantee that any forecast made will come to pass. This material does not constitute investment advice and is not intended as an endorsement of any specific investment. Past performance is no guarantee of future results.
Not part of the Semiannual Report
Investors should refer to the Portfolio’s Summary Prospectus and/or Prospectus and consider the Portfolio’s investment objectives, strategies, risks, charges and expenses carefully before investing. The Summary Prospectus and/or Prospectus contain this and other information about the Portfolio. You may obtain copies of the Portfolio’s Summary Prospectus and/or the Prospectus and the Statement of Additional Information free of charge, upon request, by calling toll-free 800-598-2019, by writing to New York Life Insurance and Annuity Corporation, 51 Madison Avenue, Room 251, New York, New York 10010 or by sending an email to MainStayShareholdersServices@nylim.com. These documents are also available at nylinvestments.com/vpdocuments. Please read the Portfolio's Summary Prospectus and/or Prospectus carefully before investing. MainStay VP Funds Trust portfolios are separate account options which are purchased through a variable insurance or variable annuity contract.
Investment and Performance Comparison (Unaudited)
Performance data quoted represents past performance. Past performance is no guarantee of future results. Because of market volatility and other factors, current performance may be lower or higher than the figures shown. Investment return and principal value will fluctuate, and as a result, when shares are redeemed, they may be worth more or less than their original cost. The performance table and graph do not reflect any deduction of sales charges, mortality and expense charges, contract charges or administrative charges. Please refer to the Performance Summary appropriate for your policy. For performance information current to the most recent month-end, please call 800-598-2019 or visit www.newyorklife.com.
Performance figures may reflect certain fee waivers and/or expense limitations, without which total returns may have been different. For information on current fee waivers and/or expense limitations (if any), please refer to the Notes to Financial Statements.
| Average Annual Total Returns for the Period-Ended June 30, 2021 |
| Class | Inception
Date1 | Six
Months | One
Year | Five
Years | Since
Inception | Gross
Expense
Ratio2 |
| Initial Class Shares | 5/1/2015 | 8.55% | 20.33% | -1.31% | -4.24% | 1.62% |
| Service Class Shares | 5/1/2015 | 8.41 | 20.04 | -1.56 | -4.47 | 1.87 |
| 1. | Effective February 28, 2020, the Portfolio replaced its subadvisor and modified its principal investment strategies. The past performance in the bar chart and table prior to that date reflects the Portfolio’s prior subadvisor and principal investment strategies. |
| 2. | The gross expense ratios presented reflect the Portfolio’s “Total Annual Portfolio Operating Expenses” from the most recent Prospectus, as supplemented, and may differ from other expense ratios disclosed in this report. |
| Benchmark Performance | Six
Months | One
Year | Five
Years | Since
Inception |
| FTSE Global Core Infrastructure 50/50 Index (Net)1 | 7.09% | 18.51% | 7.28% | 6.38% |
| Morningstar Infrastructure Category Average2 | 7.99 | 23.97 | 7.53 | 5.60 |
| 1. | The FTSE Global Core Infrastructure 50/50 Index (Net) is the Portfolio’s primary benchmark. The FTSE Global Core Infrastructure 50/50 Index (Net) is a market-capitalization-weighted index of worldwide infrastructure and infrastructure-related securities. Constituent weights are adjusted semi-annually according to three broad industry sectors: 50% utilities, 30% transportation, and a 20% mix of other sectors. Results assume reinvestment of all dividends and capital gains. An investment cannot be made directly in an index. |
| 2. | The Morningstar Infrastructure Category Average is representative of funds that invest more than 60% of their assets in stocks of companies engaged in infrastructure activities. Industries considered to be part of the infrastructure sector include: oil & gas midstream; waste management; airports; integrated shipping; railroads; shipping & ports; trucking; engineering & construction; infrastructure operations; and the utilities sector. Results are based on average total returns of similar funds with all dividends and capital gain distributions reinvested. |
Cost in Dollars of a $1,000 Investment in MainStay VP CBRE Global Infrastructure Portfolio (Unaudited)
The example below is intended to describe the fees and expenses borne by shareholders during the six-month period from January 1, 2021 to June 30, 2021, and the impact of those costs on your investment.
Example
As a shareholder of the Portfolio you incur two types of costs: (1) transaction costs, including exchange fees and sales charges (loads) on purchases (as applicable), and (2) ongoing costs, including management fees, distribution and/or service (12b-1) fees, and other Portfolio expenses (as applicable). This example is intended to help you understand your ongoing costs (in dollars) of investing in the Portfolio and to compare these costs with the ongoing costs of investing in other mutual funds. The example is based on an investment of $1,000 made at the beginning of the six-month period and held for the entire period from January 1, 2021 to June 30, 2021. Shares are only sold in connection with variable life and annuity contracts and the example does not reflect any contract level or transactional fees or expenses. If these costs had been included, your costs would have been higher.
This example illustrates your Portfolio’s ongoing costs in two ways:
Actual Expenses
The second and third data columns in the table below provide information about actual account values and actual expenses. You may use the information in these columns, together with the amount you invested, to estimate the expenses that you paid during the six months ended June
30, 2021. Simply divide your account value by $1,000 (for example, an $8,600 account value divided by $1,000 = 8.6), then multiply the result by the number under the heading entitled “Expenses Paid During Period” to estimate the expenses you paid on your account during this period.
Hypothetical Example for Comparison Purposes
The fourth and fifth data columns in the table below provide information about hypothetical account values and hypothetical expenses based on the Portfolio’s actual expense ratio and an assumed rate of return of 5% per year before expenses, which is not the Portfolio’s actual return. The hypothetical account values and expenses may not be used to estimate the actual ending account balances or expenses you paid for the six-month period shown. You may use this information to compare the ongoing costs of investing in the Portfolio with the ongoing costs of investing in other mutual funds. To do so, compare this 5% hypothetical example with the 5% hypothetical examples that appear in the shareholder reports of the other mutual funds.
Please note that the expenses shown in the table are meant to highlight your ongoing costs only and do not reflect any transactional costs, such as exchange fees or sales charges (loads). Therefore, the fourth and fifth data columns of the table are useful in comparing ongoing costs only and will not help you determine the relative total costs of owning different funds. In addition, if these transactional costs were included, your costs would have been higher.
| Share Class | Beginning
Account
Value
1/1/21 | Ending Account
Value (Based
on Actual
Returns and
Expenses)
6/30/21 | Expenses
Paid
During
Period1 | Ending Account
Value (Based
on Hypothetical
5% Annualized
Return and
Actual Expenses)
6/30/21 | Expenses
Paid
During
Period1 | Net Expense
Ratio
During
Period2 |
| Initial Class Shares | $1,000.00 | $1,085.50 | $4.91 | $1,020.08 | $4.76 | 0.95% |
| Service Class Shares | $1,000.00 | $1,084.10 | $6.20 | $1,018.84 | $6.01 | 1.20% |
| 1. | Expenses are equal to the Portfolio’s annualized expense ratio of each class multiplied by the average account value over the period, divided by 365 and multiplied by 181 (to reflect the six-month period). The table above represents the actual expenses incurred during the six-month period. In addition to the fees and expenses which the Portfolio bears directly, it also indirectly bears a pro rata share of the fees and expenses of the underlying funds in which it invests. Such indirect expenses are not included in the above-reported expense figures. |
| 2. | Expenses are equal to the Portfolio's annualized expense ratio to reflect the six-month period. |
| 6 | MainStay VP CBRE Global Infrastructure Portfolio |
Country Composition as of June 30, 2021 (Unaudited)
| United States | 49.1% |
| France | 8.5 |
| Australia | 7.4 |
| Italy | 6.9 |
| Canada | 6.4 |
| Spain | 6.1 |
| United Kingdom | 5.2 |
| Japan | 3.1 |
| Portugal | 2.7% |
| Mexico | 2.2 |
| Germany | 1.7 |
| New Zealand | 1.2 |
| Other Assets, Less Liabilities | –0.5 |
| | 100.0% |
See Portfolio of Investments beginning on page 10 for specific holdings within these categories. The Portfolio's holdings are subject to change.
Top Ten Holdings as of June 30, 2021 (excluding short-term investments) (Unaudited)
| 1. | American Tower Corp. |
| 2. | Cellnex Telecom SA |
| 3. | Enel SpA |
| 4. | American Electric Power Co., Inc. |
| 5. | Crown Castle International Corp. |
| 6. | NextEra Energy, Inc. |
| 7. | Vinci SA |
| 8. | Union Pacific Corp. |
| 9. | Transurban Group |
| 10. | Atlas Arteria Ltd. |
Portfolio Management Discussion and Analysis (Unaudited)
Answers to the questions reflect the views of portfolio managers T. Ritson Ferguson, CFA, Jeremy Anagnos, CFA, Daniel Foley, CFA, and Hinds Howard of CBRE Clarion Securities LLC (“CBRE”), the Portfolio’s Subadvisor.
How did MainStay VP CBRE Global Infrastructure Portfolio perform relative to its benchmark and peers during the six months ended June 30, 2021?
For the six months ended June 30, 2021, MainStay VP CBRE Global Infrastructure Portfolio returned 8.55% for Initial Class shares and 8.41% for Service Class shares. Over the same period, both share classes outperformed the 7.09% return of the FTSE Global Core Infrastructure 50/50 Index (Net) (“Index”), which is the Portfolio’s primary benchmark. For the six months ended June 30, 2021, both share classes also outperformed the 7.99% return of the Morningstar Infrastructure Category Average.1
What factors affected the Portfolio’s relative performance during the reporting period?
The Portfolio outperformed the Index due to stock selection and, to a lesser extent, sector allocation. Stock selections among global transportation added the most to relative performance, followed by selections in the communications and midstream sectors. Stock selections among utilities proved particularly strong in North America but lagged in continental Europe. Sector allocation bolstered the Portfolio’s relative performance most significantly due to underweight exposure to the lagging global utilities sector, followed by overweight exposure to the communications sector, which posted strong returns. Underweight exposure to the midstream sector detracted from relative returns as the group posted strong gains amid improving commodity prices and energy sector sentiment.
During the reporting period, which sectors were the strongest positive contributors to the Portfolio’s relative performance, and which sectors were particularly weak?
The sectors providing the strongest positive contributions to the Portfolio’s performance relative to the Index included North American utilities, North American rail and global communications. (Contributions take weightings and total returns into account.) Relative performance from North American utilities benefited significantly both from strong stock selection and the Portfolio’s underweight exposure to this underperforming segment of the infrastructure universe. North America rail bolstered performance primarily due to stock selections benefiting from merger and acquisition (M&A) activity. Global communications contributed positively through both stock selection and sector allocation—a combination of strong-performing stock picks in North America and Europe, as well as overweight exposure to this outperforming group.
The weakest contributors to the Portfolio’s relative performance by far were continental European utilities, which undermined returns due to both stock selection and overweight sector allocation. Key holdings were affected by negative investor sentiment regarding the potential for decarbonization trends to erode development
returns, as well as by supply chain and inflation concerns. Underweight exposure to the outperforming midstream sector detracted from relative performance to a lesser degree. Overweight exposure to underperforming Continental European transportation also undermined relative performance, although strong stock selection in the sector more than made up for the negative effect of sector allocation.
During the reporting period, which individual stocks made the strongest positive contributions to the Portfolio’s absolute performance and which stocks detracted the most?
The holdings that contributed most to the Portfolio’s absolute returns were Cheniere Energy, Crown Castle and American Tower. Cheniere Energy is a U.S. midstream company with a set of unique, fully contracted natural gas export assets. The company benefited from improvement in the global liquid natural gas market. Crown Castle, a U.S.-based tower company that also owns a large, small-cell and fiber portfolio, appears uniquely positioned to benefit from the rollout of 5G wireless communications in North America. American Tower is a U.S.-based, global owner of cellular towers actively expanding into Europe and furthering its growth ambitions around the world. Another notably positive contributor to absolute returns, U.S.-based rail company Kansas City Southern, benefited from M&A offers that drove the company’s stock sharply higher.
The holdings that detracted the most from the Portfolio’s absolute returns all resided in the Continental European utility space: EDP/Energias de Portugal (Portugal), Enel (Italy) and Engie (France). All three produced negative returns as sentiment soured toward names exposed to decarbonization pressures.
Did the Portfolio make any significant purchases or sales during the reporting period?
The Portfolio’s most significant purchases during the reporting period included two new positions in the Australian transportation space: Transurban Group, an owner of toll road concessions primarily in the local market; and Sydney Airport, an owner of the Sydney Airport concession. In our opinion, both companies exhibited improvement in underlying fundamentals as traffic continued to recover, and both stocks were attractively valued. Another significant purchase was a position in Dominion Energy, a U.S.-based utility. At the time of purchase, a period of significant underperformance versus its peer group had left the company attractively valued despite its strong growth outlook tied to decarbonization investments, including onshore and offshore renewable developments.
The Portfolio’s most significant sales during the same period included its entire positions in U.S. midstream company Kinder Morgan and U.S. rail company Norfolk Southern. We sold the
| 1. | See page 5 for more information on benchmark and peer group returns. |
| 8 | MainStay VP CBRE Global Infrastructure Portfolio |
Portfolio’s Kinder Morgan position following a period of relatively strong returns that left shares less attractively priced yet still exposed to potential regulatory risks in the U.S. energy market. The Norfolk Southern position was sold after a period of relatively strong performance in favor of shares in more attractively priced names in the North American rail sector.
How did the Portfolio’s sector/subsector weightings change during the reporting period?
During the reporting period, the Portfolio increased its sector exposure most significantly to Asia-Pacific and Continental European transportation, including rail, toll roads and airports. We sought companies exhibiting continued improvement in underlying operating fundamentals as global economies continued to recover from the COVID-19 pandemic. We believed that the gradual resumption in traffic should offer strong valuation support while providing tailwinds to these areas of the investment universe.
During the same period, the Portfolio’s most significant reductions in sector weightings were in North American utilities, Asia-Pacific utilities, and North American midstream. Reductions in utility exposure, prompted by the sector’s relatively lofty valuations and lack of catalysts to drive prices higher, helped fund additions to the Portfolio’s transportation exposure. Reductions in midstream followed strong performance from the group and increasingly full valuations spurred on by rising commodity prices and strong sentiment in the energy complex. We remained cautious on the sector’s still-uncertain regulatory backdrop and the sustainability of the rapid rise in stock prices.
How was the Portfolio positioned at the end of the reporting period?
As of June 30, 2021, the Portfolio held overweight exposure to transportation and global communications. We believe transportation represents an attractively valued area of the investment universe where recovery in traffic volumes across rails, toll roads and airports is likely to continue, providing a tailwind to underlying growth estimates. Communications continues to experience strong growth driven by trends in data usage and the need for new infrastructure to support the digital economy. We see communications infrastructure companies as among the best positioned entities across the globe to benefit from the positive trends in this sector. We also note that both the transportation and communications sectors are particularly desirable in the private infrastructure market, where transaction activity is supportive of valuations.
As of the same date, the Portfolio held underweight exposure to emerging markets and the U.S. midstream sector. Emerging
markets remained a highly volatile segment of the investment universe where regulatory and policy risks appeared elevated and where pandemic-related risks continued to pose a threat. The Portfolio’s underweight position to the midstream sector reflected our view that, given prevailing valuations, potential rewards may not adequately compensate investors for the sector’s potential risks.
The opinions expressed are those of the portfolio managers as of the date of this report and are subject to change. There is no guarantee that any forecasts will come to pass. This material does not constitute investment advice and is not intended as an endorsement of any specific investment.
Not all MainStay VP Portfolios and/or share classes are available under all policies.
Portfolio of Investments June 30, 2021† (Unaudited)
| | Shares | Value |
| Common Stocks 99.1% |
| Australia 7.4% |
| Atlas Arteria Ltd. (Transportation) | 151,625 | $ 724,340 |
| Sydney Airport (Transportation) | 58,738 | 255,053 |
| Transurban Group (Transportation) | 71,712 | 765,295 |
| | | 1,744,688 |
| Canada 6.4% |
| Canadian National Railway Co. (Transportation) | 3,696 | 389,965 |
| Pembina Pipeline Corp. (Midstream / Pipelines) | 18,007 | 572,197 |
| TC Energy Corp. (Midstream / Pipelines) | 11,311 | 559,710 |
| | | 1,521,872 |
| France 8.5% |
| Eiffage SA (Transportation) | 4,217 | 429,027 |
| Engie SA (Utilities) | 52,110 | 713,915 |
| Vinci SA (Transportation) | 8,143 | 868,904 |
| | | 2,011,846 |
| Germany 1.7% |
| Fraport AG Frankfurt Airport Services Worldwide (Transportation) (a) | 5,722 | 389,858 |
| Italy 6.9% |
| Atlantia SpA (Transportation) | 14,057 | 254,522 |
| Enel SpA (Utilities) | 105,996 | 984,363 |
| Infrastrutture Wireless Italiane SpA (Communications) | 18,082 | 203,944 |
| Terna Rete Elettrica Nazionale SpA (Utilities) | 24,803 | 184,813 |
| | | 1,627,642 |
| Japan 3.1% |
| Central Japan Railway Co. (Transportation) | 1,635 | 247,984 |
| Chubu Electric Power Co., Inc. (Utilities) | 13,600 | 166,243 |
| West Japan Railway Co. (Transportation) | 5,380 | 306,737 |
| | | 720,964 |
| Mexico 2.2% |
| Grupo Aeroportuario del Sureste SAB de CV (Transportation) | 15,322 | 282,774 |
| Promotora y Operadora de Infraestructura SAB de CV (Transportation) | 29,100 | 232,797 |
| | | 515,571 |
| New Zealand 1.2% |
| Infratil Ltd. (Diversified) | 51,618 | 277,824 |
| Portugal 2.7% |
| EDP - Energias de Portugal SA (Utilities) | 121,382 | 643,361 |
| | Shares | Value |
| |
| Spain 6.1% |
| Aena SME SA (Transportation) (b) | 1,129 | $ 185,144 |
| Cellnex Telecom SA (Communications) | 15,471 | 985,479 |
| Iberdrola SA (Utilities) | 22,901 | 279,152 |
| | | 1,449,775 |
| United Kingdom 5.2% |
| National Grid plc (Utilities) | 55,282 | 704,150 |
| Pennon Group plc (Utilities) | 17,747 | 278,759 |
| United Utilities Group plc (Utilities) | 17,242 | 232,403 |
| | | 1,215,312 |
| United States 47.7% |
| AES Corp. (The) (Utilities) | 19,170 | 499,762 |
| Alliant Energy Corp. (Utilities) | 10,640 | 593,286 |
| Ameren Corp. (Utilities) | 7,993 | 639,760 |
| American Electric Power Co., Inc. (Utilities) | 11,528 | 975,154 |
| American Tower Corp. (Communications) | 3,831 | 1,034,906 |
| Cheniere Energy, Inc. (Midstream / Pipelines) (b) | 8,272 | 717,513 |
| CMS Energy Corp. (Utilities) | 8,268 | 488,473 |
| Crown Castle International Corp. (Communications) | 4,910 | 957,941 |
| Dominion Energy, Inc. (Utilities) | 6,447 | 474,306 |
| Equinix, Inc. (Communications) | 428 | 343,513 |
| Essential Utilities, Inc. (Utilities) | 4,620 | 211,134 |
| Exelon Corp. (Utilities) | 13,170 | 583,563 |
| FirstEnergy Corp. (Utilities) | 12,486 | 464,604 |
| Kansas City Southern (Transportation) | 1,661 | 470,678 |
| NextEra Energy, Inc. (Utilities) | 12,140 | 889,619 |
| NiSource, Inc. (Utilities) | 18,932 | 463,834 |
| Public Service Enterprise Group, Inc. (Utilities) | 9,900 | 591,426 |
| Union Pacific Corp. (Transportation) | 3,894 | 856,407 |
| | | 11,255,879 |
Total Common Stocks
(Cost $20,932,802) | | 23,374,592 |
The notes to the financial statements are an integral part of, and should be read in conjunction with, the financial statements.
| 10 | MainStay VP CBRE Global Infrastructure Portfolio |
| | Shares | | Value |
| Short-Term Investment 1.4% |
| Affiliated Investment Company 1.4% |
| United States 1.4% |
| MainStay U.S. Government Liquidity Fund, 0.01% (c) | 340,025 | | $ 340,025 |
Total Short-Term Investment
(Cost $340,025) | | | 340,025 |
Total Investments
(Cost $21,272,827) | 100.5% | | 23,714,617 |
| Other Assets, Less Liabilities | (0.5) | | (124,649) |
| Net Assets | 100.0% | | $ 23,589,968 |
| † | Percentages indicated are based on Portfolio net assets. |
| (a) | All or a portion of this security was held on loan. As of June 30, 2021, the aggregate market value of securities on loan was $156,979. The market value of the collateral held included non-cash collateral in the form of U.S. Treasury securities with a value of $175,065. (See Note 2(I)) |
| (b) | Non-income producing security. |
| (c) | Current yield as of June 30, 2021. |
The following is a summary of the fair valuations according to the inputs used as of June 30, 2021, for valuing the Portfolio’s assets:
| Description | Quoted
Prices in
Active
Markets for
Identical
Assets
(Level 1) | | Significant
Other
Observable
Inputs
(Level 2) | | Significant
Unobservable
Inputs
(Level 3) | | Total |
| Asset Valuation Inputs | | | | | | | |
| Investments in Securities (a) | | | | | | | |
| Common Stocks | $ 23,374,592 | | $ — | | $ — | | $ 23,374,592 |
| Short-Term Investment | | | | | | | |
| Affiliated Investment Company | 340,025 | | — | | — | | 340,025 |
| Total Investments in Securities | $ 23,714,617 | | $ — | | $ — | | $ 23,714,617 |
| (a) | For a complete listing of investments and their industries, see the Portfolio of Investments. |
The table below sets forth the diversification of the Portfolio’s investments by sector.
Sector Diversification
| | Value | | Percent † |
| Utilities | $11,062,080 | | 47.0% |
| Transportation | 6,659,485 | | 28.3 |
| Communications | 3,525,783 | | 14.8 |
| Midstream / Pipelines | 1,849,420 | | 7.8 |
| Diversified | 277,824 | | 1.2 |
| | 23,374,592 | | 99.1 |
| Short-Term Investment | 340,025 | | 1.4 |
| Other Assets, Less Liabilities | (124,649) | | (0.5) |
| Net Assets | $23,589,968 | | 100.0% |
| † | Percentages is indicated are based on Portfolio net assets. |
The notes to the financial statements are an integral part of, and should be read in conjunction with, the financial statements.
11
Statement of Assets and Liabilities as of June 30, 2021 (Unaudited)
| Assets |
Investment in unaffiliated securities, at value
(identified cost $20,932,802) including securities on loan of $156,979 | $ 23,374,592 |
Investment in affiliated investment companies, at value
(identified cost $340,025) | 340,025 |
Cash denominated in foreign currencies
(identified cost $476) | 471 |
| Receivables: | |
| Dividends | 66,587 |
| Investment securities sold | 37,417 |
| Portfolio shares sold | 9,525 |
| Securities lending | 132 |
| Other assets | 174 |
| Total assets | 23,828,923 |
| Liabilities |
| Due to custodian | 1,428 |
| Payables: | |
| Investment securities purchased | 130,777 |
| Professional fees | 45,460 |
| Custodian | 27,265 |
| Shareholder communication | 23,455 |
| NYLIFE Distributors (See Note 3) | 4,597 |
| Manager (See Note 3) | 3,666 |
| Accrued expenses | 2,307 |
| Total liabilities | 238,955 |
| Net assets | $ 23,589,968 |
| Composition of Net Assets |
| Shares of beneficial interest outstanding (par value of $.001 per share) unlimited number of shares authorized | $ 3,388 |
| Additional paid-in-capital | 59,713,972 |
| | 59,717,360 |
| Total distributable earnings (loss) | (36,127,392) |
| Net assets | $ 23,589,968 |
| Initial Class | |
| Net assets applicable to outstanding shares | $ 1,543,847 |
| Shares of beneficial interest outstanding | 219,463 |
| Net asset value per share outstanding | $ 7.03 |
| Service Class | |
| Net assets applicable to outstanding shares | $22,046,121 |
| Shares of beneficial interest outstanding | 3,169,007 |
| Net asset value per share outstanding | $ 6.96 |
The notes to the financial statements are an integral part of, and should be read in conjunction with, the financial statements.
| 12 | MainStay VP CBRE Global Infrastructure Portfolio |
Statement of Operations for the six months ended June 30, 2021 (Unaudited)
| Investment Income (Loss) |
| Income | |
| Dividends-unaffiliated (net of foreign tax withholding of $25,027) | $ 358,302 |
| Securities lending | 785 |
| Dividends-affiliated | 9 |
| Total income | 359,096 |
| Expenses | |
| Manager (See Note 3) | 94,048 |
| Professional fees | 43,487 |
| Distribution/Service—Service Class (See Note 3) | 26,077 |
| Custodian | 23,736 |
| Shareholder communication | 19,401 |
| Trustees | 215 |
| Miscellaneous | 3,819 |
| Total expenses before waiver/reimbursement | 210,783 |
| Expense waiver/reimbursement from Manager (See Note 3) | (79,149) |
| Net expenses | 131,634 |
| Net investment income (loss) | 227,462 |
| Realized and Unrealized Gain (Loss) |
| Net realized gain (loss) on: | |
| Unaffiliated investment transactions | 617,894 |
| Foreign currency transactions | (1,897) |
| Net realized gain (loss) | 615,997 |
| Net change in unrealized appreciation (depreciation) on: | |
| Unaffiliated investments | 954,527 |
| Translation of other assets and liabilities in foreign currencies | (1,193) |
| Net change in unrealized appreciation (depreciation) | 953,334 |
| Net realized and unrealized gain (loss) | 1,569,331 |
| Net increase (decrease) in net assets resulting from operations | $1,796,793 |
The notes to the financial statements are an integral part of, and should be read in conjunction with, the financial statements.
13
Statements of Changes in Net Assets
for the six months ended June 30, 2021 (Unaudited) and the year ended December 31, 2020
| | 2021 | 2020 |
| Increase (Decrease) in Net Assets |
| Operations: | | |
| Net investment income (loss) | $ 227,462 | $ 129,325 |
| Net realized gain (loss) | 615,997 | (4,887,575) |
| Net change in unrealized appreciation (depreciation) | 953,334 | 2,070,360 |
| Net increase (decrease) in net assets resulting from operations | 1,796,793 | (2,687,890) |
| Distributions to shareholders: | | |
| Initial Class | — | (524,797) |
| Service Class | — | (1,333,105) |
| Total distributions to shareholders | — | (1,857,902) |
| Capital share transactions: | | |
| Net proceeds from sales of shares | 2,573,082 | 11,782,193 |
| Net asset value of shares issued to shareholder in reinvestment of distributions | — | 1,857,902 |
| Cost of shares redeemed | (1,842,946) | (11,837,646) |
| Increase (decrease) in net assets derived from capital share transactions | 730,136 | 1,802,449 |
| Net increase (decrease) in net assets | 2,526,929 | (2,743,343) |
| Net Assets |
| Beginning of period | 21,063,039 | 23,806,382 |
| End of period | $23,589,968 | $ 21,063,039 |
The notes to the financial statements are an integral part of, and should be read in conjunction with, the financial statements.
| 14 | MainStay VP CBRE Global Infrastructure Portfolio |
Financial Highlights selected per share data and ratios
| | Six months ended
June 30,
2021* | | Year Ended December 31, |
| Initial Class | 2020 | | 2019 | | 2018 | | 2017 | | 2016 |
| Net asset value at beginning of period | $ 6.48 | | $ 8.01 | | $ 7.61 | | $ 10.52 | | $ 9.75 | | $ 7.59 |
| Net investment income (loss) (a) | 0.08 | | 0.03 | | 0.03 | | (0.07) | | (0.05) | | 0.00‡ |
| Net realized and unrealized gain (loss) on investments | 0.47 | | (1.08) | | 0.37 | | (2.84) | | 0.82 | | 2.18 |
| Net realized and unrealized gain (loss) on foreign currency transactions‡ | (0.00) | | (0.00) | | 0.00 | | (0.00) | | (0.00) | | 0.00 |
| Total from investment operations | 0.55 | | (1.05) | | 0.40 | | (2.91) | | 0.77 | | 2.18 |
| Less distributions: | | | | | | | | | | | |
| From net investment income | — | | (0.48) | | — | | — | | — | | (0.02) |
| Net asset value at end of period | $ 7.03 | | $ 6.48 | | $ 8.01 | | $ 7.61 | | $ 10.52 | | $ 9.75 |
| Total investment return (b) | 8.49%(c) | | (12.81)% | | 5.26%(c) | | (27.66)%(c) | | 7.90% | | 28.77% |
| Ratios (to average net assets)/Supplemental Data: | | | | | | | | | | | |
| Net investment income (loss) | 2.42%†† | | 0.41% | | 0.33% | | (0.66)% | | (0.49)% | | 0.06% |
| Net expenses (d) | 0.95%†† | | 1.05% | | 1.21% | | 1.21% | | 1.31% | | 1.38% |
| Expenses (before waiver/reimbursement) (d) | 1.67%†† | | 1.44% | | 1.21% | | 1.21% | | 1.31% | | 1.38% |
| Portfolio turnover rate | 22% | | 163% | | 119% | | 162% | | 116% | | 356% |
| Net assets at end of period (in 000’s) | $ 1,544 | | $ 1,022 | | $ 1,009 | | $ 90,681 | | $ 158,846 | | $ 71,036 |
| * | Unaudited. |
| ‡ | Less than one cent per share. |
| †† | Annualized. |
| (a) | Per share data based on average shares outstanding during the period. |
| (b) | Total return does not reflect any deduction of sales charges, mortality and expense charges, contract charges or administrative charges. For periods of less than one year, total return is not annualized. |
| (c) | Total investment return may reflect adjustments to conform to generally accepted accounting principles. |
| (d) | In addition to the fees and expenses which the Portfolio bears directly, it also indirectly bears a pro-rata share of the fees and expenses of the underlying funds in which it invests. Such indirect expenses are not included in the above expense ratios. |
The notes to the financial statements are an integral part of, and should be read in conjunction with, the financial statements.
15
Financial Highlights selected per share data and ratios
| | Six months ended
June 30,
2021* | | Year Ended December 31, |
| Service Class | 2020 | | 2019 | | 2018 | | 2017 | | 2016 |
| Net asset value at beginning of period | $ 6.42 | | $ 7.93 | | $ 7.55 | | $ 10.47 | | $ 9.73 | | $ 7.59 |
| Net investment income (loss) (a) | 0.07 | | 0.04 | | 0.01 | | (0.09) | | (0.07) | | (0.02) |
| Net realized and unrealized gain (loss) on investments | 0.47 | | (1.09) | | 0.37 | | (2.83) | | 0.81 | | 2.18 |
| Net realized and unrealized gain (loss) on foreign currency transactions‡ | (0.00) | | (0.00) | | 0.00 | | (0.00) | | (0.00) | | 0.00 |
| Total from investment operations | 0.54 | | (1.05) | | 0.38 | | (2.92) | | 0.74 | | 2.16 |
| Less distributions: | | | | | | | | | | | |
| From net investment income | — | | (0.46) | | — | | — | | — | | (0.02) |
| Net asset value at end of period | $ 6.96 | | $ 6.42 | | $ 7.93 | | $ 7.55 | | $ 10.47 | | $ 9.73 |
| Total investment return (b) | 8.41% | | (13.03)% | | 5.03%(c) | | (27.89)%(c) | | 7.61%(c) | | 28.48% |
| Ratios (to average net assets)/Supplemental Data: | | | | | | | | | | | |
| Net investment income (loss) | 2.03%†† | | 0.62% | | 0.11% | | (0.91)% | | (0.74)% | | (0.37)% |
| Net expenses (d) | 1.20%†† | | 1.52% | | 1.62% | | 1.46% | | 1.56% | | 1.64% |
| Expenses (before waiver/reimbursement) (d) | 1.92%†† | | 1.95% | | 1.62% | | 1.46% | | 1.56% | | 1.64% |
| Portfolio turnover rate | 22% | | 163% | | 119% | | 162% | | 116% | | 356% |
| Net assets at end of period (in 000’s) | $ 22,046 | | $ 20,041 | | $ 22,798 | | $ 22,133 | | $ 32,457 | | $ 26,714 |
| * | Unaudited. |
| ‡ | Less than one cent per share. |
| †† | Annualized. |
| (a) | Per share data based on average shares outstanding during the period. |
| (b) | Total return does not reflect any deduction of sales charges, mortality and expense charges, contract charges or administrative charges. For periods of less than one year, total return is not annualized. |
| (c) | Total investment return may reflect adjustments to conform to generally accepted accounting principles. |
| (d) | In addition to the fees and expenses which the Portfolio bears directly, it also indirectly bears a pro-rata share of the fees and expenses of the underlying funds in which it invests. Such indirect expenses are not included in the above expense ratios. |
The notes to the financial statements are an integral part of, and should be read in conjunction with, the financial statements.
| 16 | MainStay VP CBRE Global Infrastructure Portfolio |
Notes to Financial Statements (Unaudited)
Note 1–Organization and Business
MainStay VP Funds Trust (the “Fund”) was organized as a Delaware statutory trust on February 1, 2011. The Fund is registered under the Investment Company Act of 1940, as amended (the “1940 Act”), as an open-end management investment company. The Fund is comprised of thirty-one separate series (collectively referred to as the “Portfolios”). These financial statements and notes relate to the MainStay VP CBRE Global Infrastructure Portfolio (the "Portfolio"), a "non-diversified” portfolio, as that term is defined in the 1940 Act, as interpreted or modified by regulatory authorities having jurisdiction, from time to time. However, due to its principal investment strategies and investment processes, the Portfolio has historically operated as a "diversified" portfolio. Therefore, the Portfolio will not operate as "non-diversified" portfolio without first obtaining shareholder approval.
Shares of the Portfolio are currently offered to certain separate accounts to fund variable annuity policies and variable universal life insurance policies issued by New York Life Insurance and Annuity Corporation (“NYLIAC”), a wholly-owned subsidiary of New York Life Insurance Company (“New York Life”) and may also be offered to fund variable annuity policies and variable universal life insurance policies issued by other insurance companies. NYLIAC allocates shares of the Portfolios to, among others, certain NYLIAC separate accounts. Shares of the Portfolio are also offered to the MainStay VP Conservative Allocation Portfolio, MainStay VP Moderate Allocation Portfolio, MainStay VP Growth Allocation Portfolio (formerly known as MainStay VP Moderate Growth Allocation Portfolio) and MainStay VP Equity Allocation Portfolio (formerly known as MainStay VP Growth Allocation Portfolio), which operate as “funds-of-funds," and other variable insurance funds.
The following table lists the Portfolio's share classes that have been registered and commenced operations:
| Class | Commenced Operations |
| Initial Class | May 1, 2015 |
| Service Class | May 1, 2015 |
Shares of the Portfolio are offered and are redeemed at a price equal to their respective net asset value (“NAV”) per share. No sales or redemption charge is applicable to the purchase or redemption of the Portfolio's shares. Under the terms of the Fund’s multiple class plan, adopted pursuant to Rule 18f-3 under the 1940 Act, the classes differ in that, among other things, Service Class shares of the Portfolio pay a combined distribution and service fee of 0.25% of average daily net assets attributable to Service Class shares of the Portfolio to the Distributor (as defined in Note 3(B)) pursuant to a plan adopted in accordance with Rule 12b-1 under the 1940 Act. Contract owners of variable annuity contracts purchased after June 2, 2003, are permitted to invest only in the Service Class shares.
The Portfolio's investment objective is to seek total return.
Note 2–Significant Accounting Policies
The Portfolio is an investment company and accordingly follows the investment company accounting and reporting guidance of the Financial Accounting Standards Board (“FASB”) Accounting Standard Codification Topic 946 Financial Services—Investment Companies. The Portfolio prepares its financial statements in accordance with generally accepted accounting principles (“GAAP”) in the United States of America and follows the significant accounting policies described below.
(A) Securities Valuation. Investments are usually valued as of the close of regular trading on the New York Stock Exchange (the "Exchange") (usually 4:00 p.m. Eastern time) on each day the Portfolio is open for business ("valuation date").
The Board of Trustees of the Fund (the "Board") adopted procedures establishing methodologies for the valuation of the Portfolio's securities and other assets and delegated the responsibility for valuation determinations under those procedures to the Valuation Committee of the Fund (the “Valuation Committee”). The procedures state that, subject to the oversight of the Board and unless otherwise noted, the responsibility for the day-to-day valuation of portfolio assets (including fair value measurements for the Portfolio's assets and liabilities) rests with New York Life Investment Management LLC (“New York Life Investments” or the "Manager"), aided to whatever extent necessary by the Subadvisor (as defined in Note 3(A)). To assess the appropriateness of security valuations, the Manager, the Subadvisor or the Portfolio's third-party service provider, who is subject to oversight by the Manager, regularly compares prior day prices, prices on comparable securities and the sale prices to the prior and current day prices and challenges prices with changes exceeding certain tolerance levels with third-party pricing services or broker sources.
The Board authorized the Valuation Committee to appoint a Valuation Subcommittee (the “Subcommittee”) to establish the prices of securities for which market quotations are not readily available or the prices of which are not otherwise readily determinable under the procedures. The Subcommittee meets (in person, via electronic mail or via teleconference) on an as-needed basis. The Valuation Committee meets to ensure that actions taken by the Subcommittee were appropriate.
For those securities valued through either a standardized fair valuation methodology or a fair valuation measurement, the Subcommittee deals with such valuation and the Valuation Committee reviews and affirms, if appropriate, the reasonableness of the valuation based on such methodologies and measurements on a regular basis after considering information that is reasonably available and deemed relevant by the Valuation Committee. Any action taken by the Subcommittee with respect to the valuation of a portfolio security or other asset is submitted for review and ratification (if appropriate) to the Valuation Committee and the Board at the next regularly scheduled meeting.
"Fair value" is defined as the price the Portfolio would reasonably expect to receive upon selling an asset or liability in an orderly transaction to an independent buyer in the principal or most advantageous market for the
Notes to Financial Statements (Unaudited) (continued)
asset or liability. Fair value measurements are determined within a framework that establishes a three-tier hierarchy that maximizes the use of observable market data and minimizes the use of unobservable inputs to establish a classification of fair value measurements for disclosure purposes. "Inputs" refer broadly to the assumptions that market participants would use in pricing the asset or liability, including assumptions about risk, such as the risk inherent in a particular valuation technique used to measure fair value using a pricing model and/or the risk inherent in the inputs for the valuation technique. Inputs may be observable or unobservable. Observable inputs reflect the assumptions market participants would use in pricing the asset or liability based on market data obtained from sources independent of the Portfolio. Unobservable inputs reflect the Portfolio’s own assumptions about the assumptions market participants would use in pricing the asset or liability based on the information available. The inputs or methodology used for valuing assets or liabilities may not be an indication of the risks associated with investing in those assets or liabilities. The three-tier hierarchy of inputs is summarized below.
| • | Level 1—quoted prices in active markets for an identical asset or liability |
| • | Level 2—other significant observable inputs (including quoted prices for a similar asset or liability in active markets, interest rates and yield curves, prepayment speeds, credit risk, etc.) |
| • | Level 3—significant unobservable inputs (including the Portfolio's own assumptions about the assumptions that market participants would use in measuring fair value of an asset or liability) |
The level of an asset or liability within the fair value hierarchy is based on the lowest level of an input, both individually and in the aggregate, that is significant to the fair value measurement. The aggregate value by input level of the Portfolio’s assets and liabilities as of June 30, 2021, is included at the end of the Portfolio of Investments.
The Portfolio may use third-party vendor evaluations, whose prices may be derived from one or more of the following standard inputs, among others:
| • Broker/dealer quotes | • Benchmark securities |
| • Two-sided markets | • Reference data (corporate actions or material event notices) |
| • Bids/offers | • Monthly payment information |
| • Industry and economic events | • Reported trades |
An asset or liability for which market values cannot be measured using the methodologies described above is valued by methods deemed reasonable in good faith by the Valuation Committee, following the procedures established by the Board, to represent fair value. Under these procedures, the Portfolio generally uses a market-based approach which may use related or comparable assets or liabilities, recent transactions, market multiples, book values and other relevant information. The Portfolio may also use an income-based valuation approach in which the anticipated future cash flows of the asset or liability are discounted to
calculate fair value. Discounts may also be applied due to the nature and/or duration of any restrictions on the disposition of the asset or liability. Fair value represents a good faith approximation of the value of a security. Fair value determinations involve the consideration of a number of subjective factors, an analysis of applicable facts and circumstances and the exercise of judgment. As a result, it is possible that the fair value for a security determined in good faith in accordance with the Portfolio's valuation procedures may differ from valuations for the same security determined by other funds using their own valuation procedures. Although the Portfolio's valuation procedures are designed to value a security at the price the Portfolio may reasonably expect to receive upon the security's sale in an orderly transaction, there can be no assurance that any fair value determination thereunder would, in fact, approximate the amount that the Portfolio would actually realize upon the sale of the security or the price at which the security would trade if a reliable market price were readily available. During the six-month period ended June 30, 2021, there were no material changes to the fair value methodologies.
Securities which may be valued in this manner include, but are not limited to: (i) a security for which trading has been halted or suspended; (ii) a debt security that has recently gone into default and for which there is not a current market quotation; (iii) a security of an issuer that has entered into a restructuring; (iv) a security that has been delisted from a national exchange; (v) a security for which the market price is not readily available from a third-party pricing source or, if so provided, does not, in the opinion of the Manager or the Subadvisor, reflect the security's market value; (vi) a security subject to trading collars for which no or limited trading takes place; and (vii) a security whose principal market has been temporarily closed at a time when, under normal conditions, it would be open. Securities valued in this manner are generally categorized as Level 3 in the hierarchy. No securities held by the Portfolio as of June 30, 2021 were fair valued in such a manner.
Certain securities held by the Portfolio may principally trade in foreign markets. Events may occur between the time the foreign markets close and the time at which the Portfolio's NAVs are calculated. These events may include, but are not limited to, situations relating to a single issuer in a market sector, significant fluctuations in U.S. or foreign markets, natural disasters, armed conflicts, governmental actions or other developments not tied directly to the securities markets. Should the Manager or the Subadvisor conclude that such events may have affected the accuracy of the last price of such securities reported on the local foreign market, the Subcommittee may, pursuant to procedures adopted by the Board, adjust the value of the local price to reflect the estimated impact on the price of such securities as a result of such events. In this instance, securities are generally categorized as Level 3 in the hierarchy. Additionally, certain foreign equity securities are also fair valued whenever the movement of a particular index exceeds certain thresholds. In such cases, the securities are fair valued by applying factors provided by a third-party vendor in accordance with valuation procedures adopted by the Board and are generally categorized as Level 2 in the hierarchy. No foreign equity securities held by the Portfolio as of June 30, 2021 were fair valued in such a manner.
| 18 | MainStay VP CBRE Global Infrastructure Portfolio |
Equity securities are valued at the last quoted sales prices as of the close of regular trading on the relevant exchange on each valuation date. Securities that are not traded on the valuation date are valued at the mean of the last quoted bid and ask prices. Prices are normally taken from the principal market in which each security trades. These securities are generally categorized as Level 1 in the hierarchy.
Investments in mutual funds, including money market funds, are valued at their respective NAVs at the close of business each day on the valuation date. These securities are generally categorized as Level 1 in the hierarchy.
Temporary cash investments acquired in excess of 60 days to maturity at the time of purchase are valued using the latest bid prices or using valuations based on a matrix system (which considers such factors as security prices, yields, maturities and ratings), both as furnished by independent pricing services. Temporary cash investments that mature in 60 days or less at the time of purchase ("Short-Term Investments") are valued using the amortized cost method of valuation, unless the use of such method would be inappropriate. The amortized cost method involves valuing a security at its cost on the date of purchase and thereafter assuming a constant amortization to maturity of the difference between such cost and the value on maturity date. Amortized cost approximates the current fair value of a security. Securities valued using the amortized cost method are not valued using quoted prices in an active market and are generally categorized as Level 2 in the hierarchy.
The information above is not intended to reflect an exhaustive list of the methodologies that may be used to value portfolio investments. The valuation procedures permit the use of a variety of valuation methodologies in connection with valuing portfolio investments. The methodology used for a specific type of investment may vary based on the market data available or other considerations. The methodologies summarized above may not represent the specific means by which portfolio investments are valued on any particular business day.
(B) Income Taxes. The Portfolio's policy is to comply with the requirements of the Internal Revenue Code of 1986, as amended (the “Internal Revenue Code”), applicable to regulated investment companies and to distribute all of its taxable income to the shareholders of the Portfolio within the allowable time limits.
The Manager evaluates the Portfolio’s tax positions to determine if the tax positions taken meet the minimum recognition threshold in connection with accounting for uncertainties in income tax positions taken or expected to be taken for the purposes of measuring and recognizing tax liabilities in the financial statements. Recognition of tax benefits of an uncertain tax position is permitted only to the extent the position is “more likely than not” to be sustained assuming examination by taxing authorities. The Manager analyzed the Portfolio's tax positions taken on federal, state and local income tax returns for all open tax years (for up to three tax years) and has concluded that no provisions for federal, state and local income tax are required in the Portfolio's financial statements. The Portfolio's federal, state and local income tax and federal excise tax
returns for tax years for which the applicable statutes of limitations have not expired are subject to examination by the Internal Revenue Service and state and local departments of revenue.
(C) Foreign Taxes. The Portfolio may be subject to foreign taxes on income and other transaction-based taxes imposed by certain countries in which it invests. A portion of the taxes on gains on investments or currency purchases/repatriation may be reclaimable. The Portfolio will accrue such taxes and reclaims as applicable, based upon its current interpretation of tax rules and regulations that exist in the markets in which it invests.
The Portfolio may be subject to taxation on realized capital gains, repatriation proceeds and other transaction-based taxes imposed by certain countries in which it invests. The Portfolio will accrue such taxes as applicable based upon its current interpretation of tax rules and regulations that exist in the market in which it invests. Capital gains taxes relating to positions still held are reflected as a liability in the Statement of Assets and Liabilities, as well as an adjustment to the Portfolio's net unrealized appreciation (depreciation). Taxes related to capital gains realized, if any, are reflected as part of net realized gain (loss) in the Statement of Operations. Changes in tax liabilities related to capital gains taxes on unrealized investment gains, if any, are reflected as part of the change in net unrealized appreciation (depreciation) on investments in the Statement of Operations. Transaction-based charges are generally assessed as a percentage of the transaction amount.
(D) Dividends and Distributions to Shareholders. Dividends and distributions are recorded on the ex-dividend date. The Portfolio intends to declare and pay dividends from net investment income and distributions from net realized capital and currency gains, if any, at least annually. Unless a shareholder elects otherwise, all dividends and distributions are reinvested at NAV in the same class of shares of the Portfolio. Dividends and distributions to shareholders are determined in accordance with federal income tax regulations and may differ from determinations using GAAP.
(E) Security Transactions and Investment Income. The Portfolio records security transactions on the trade date. Realized gains and losses on security transactions are determined using the identified cost method. Dividend income is recognized on the ex-dividend date, net of any foreign tax withheld at the source, and interest income is accrued as earned using the effective interest rate method. Distributions received from real estate investment trusts may be classified as dividends, capital gains and/or return of capital.
The Portfolio may also invest up to 25% of its net assets in master limited partnerships.
Investment income and realized and unrealized gains and losses on investments of the Portfolio are allocated pro rata to the separate classes of shares based upon their relative net assets on the date the income is earned or realized and unrealized gains and losses are incurred.
Notes to Financial Statements (Unaudited) (continued)
(F) Expenses. Expenses of the Fund are allocated to the individual Portfolios in proportion to the net assets of the respective Portfolios when the expenses are incurred, except where direct allocations of expenses can be made. Expenses (other than fees incurred under the distribution and service plans, further discussed in Note 3(B), which are charged directly to the Service Class shares) are allocated to separate classes of shares pro rata based upon their relative net assets on the date the expenses are incurred. The expenses borne by the Portfolio, including those of related parties to the Portfolio, are shown in the Statement of Operations.
Additionally, the Portfolio may invest in mutual funds, which are subject to management fees and other fees that may cause the costs of investing in mutual funds to be greater than the costs of owning the underlying securities directly. These indirect expenses of mutual funds are not included in the amounts shown as expenses in the Statement of Operations or in the expense ratios included in the Financial Highlights.
(G) Use of Estimates. In preparing financial statements in conformity with GAAP, the Manager makes estimates and assumptions that affect the reported amounts and disclosures in the financial statements. Actual results could differ from those estimates and assumptions.
(H) Foreign Currency Transactions. The Portfolio's books and records are maintained in U.S. dollars. Prices of securities denominated in foreign currency amounts are translated into U.S. dollars at the mean between the buying and selling rates last quoted by any major U.S. bank at the following dates:
(i) market value of investment securities, other assets and liabilities— at the valuation date; and
(ii) purchases and sales of investment securities, income and expenses—at the date of such transactions.
The assets and liabilities that are denominated in foreign currency amounts are presented at the exchange rates and market values at the close of the period. The realized and unrealized changes in net assets arising from fluctuations in exchange rates and market prices of securities are not separately presented.
Net realized gain (loss) on foreign currency transactions represents net currency gains or losses realized as a result of differences between the amounts of securities sale proceeds or purchase cost, dividends, interest and withholding taxes as recorded on the Portfolio's books, and the U.S. dollar equivalent amount actually received or paid. Net currency gains or losses from valuing such foreign currency denominated assets and liabilities, other than investments at valuation date exchange rates, are reflected in unrealized foreign exchange gains or losses.
(I) Securities Lending. In order to realize additional income, the Portfolio may engage in securities lending, subject to the limitations set forth in the 1940 Act and relevant guidance by the staff of the Securities and Exchange Commission (“SEC”). If the Portfolio engages in securities lending, the Portfolio will lend through its custodian, JPMorgan Chase Bank, N.A., ("JPMorgan"), acting as securities lending agent on behalf of
the Portfolio. Under the current arrangement, JPMorgan will manage the Portfolio's collateral in accordance with the securities lending agency agreement between the Portfolio and JPMorgan, and indemnify the Portfolio against counterparty risk. The loans will be collateralized by cash (which may be invested in a money market fund) and/or non-cash collateral (which may include U.S. Treasury securities and/or U.S. government agency securities issued or guaranteed by the United States government or its agencies or instrumentalities) at least equal at all times to the market value of the securities loaned. The Portfolio bears the risk of delay in recovery of, or loss of rights in, the securities loaned. The Portfolio may also record a realized gain or loss on securities deemed sold due to a borrower’s inability to return securities on loan. The Portfolio bears the risk of any loss on investment of cash collateral. The Portfolio will receive compensation for lending its securities in the form of fees or it will retain a portion of interest earned on the investment of any cash collateral. The Portfolio will also continue to receive interest and dividends on the securities loaned and any gain or loss in the market price of the securities loaned that may occur during the term of the loan will be for the account of the Portfolio. Income earned from securities lending activities, if any, is reflected in the Statement of Operations. Securities on loan as of June 30, 2021, are shown in the Portfolio of Investments.
Prior to February 22, 2021, these services were provided by State Street Bank and Trust Company (“State Street”).
(J) Foreign Securities Risk. The Portfolio may invest in foreign securities, which carry certain risks that are in addition to the usual risks inherent in domestic securities. These risks include those resulting from currency fluctuations, future adverse political or economic developments and possible imposition of currency exchange blockages or other foreign governmental laws or restrictions. These risks are likely to be greater in emerging markets than in developed markets. The ability of issuers of debt securities held by the Portfolio to meet their obligations may be affected by, among other things, economic or political developments in a specific country, industry or region.
(K) Indemnifications. Under the Fund’s organizational documents, its officers and trustees are indemnified against certain liabilities that may arise out of performance of their duties to the Fund. Additionally, in the normal course of business, the Portfolio enters into contracts with third-party service providers that contain a variety of representations and warranties and that may provide general indemnifications. The Portfolio's maximum exposure under these arrangements is unknown, as this would involve future claims that may be made against the Portfolio that have not yet occurred. The Manager believes that the risk of loss in connection with these potential indemnification obligations is remote. However, there can be no assurance that material liabilities related to such obligations will not arise in the future, which could adversely impact the Portfolio.
Note 3–Fees and Related Party Transactions
(A) Manager and Subadvisor. New York Life Investments, a registered investment adviser and an indirect, wholly-owned subsidiary of New York Life, serves as the Portfolio's Manager pursuant to an Amended
| 20 | MainStay VP CBRE Global Infrastructure Portfolio |
and Restated Management Agreement ("Management Agreement"). The Manager provides offices, conducts clerical, recordkeeping and bookkeeping services and keeps most of the financial and accounting records required to be maintained by the Portfolio. Except for the portion of salaries and expenses that are the responsibility of the Portfolio, the Manager pays the salaries and expenses of all personnel affiliated with the Portfolio and certain operational expenses of the Portfolio. The Portfolio reimburses New York Life Investments in an amount equal to the portion of the compensation of the Chief Compliance Officer attributable to the Portfolio. CBRE Clarion Securities LLC ("CBRE Clarion" or "Subadvisor") a registered investment adviser, serves as Subadvisor to the Portfolio and is responsible for the day-to-day portfolio management of the Portfolio. Pursuant to the terms of a Subadvisory Agreement ("Subadvisory Agreement") between New York Life Investments and CBRE Clarion, New York Life Investments pays for the services of the Subadvisor.
Pursuant to the Management Agreement, the Fund pays the Manager, on behalf of the Portfolio, a monthly fee for the services performed and the facilities furnished at an annual rate of 0.85% of the Portfolio's average daily net assets.
New York Life Investments has contractually agreed to waive fees and/or reimburse expenses so that the Total Annual Portfolio Operating Expenses (excluding taxes, interest, litigation, extraordinary expenses, brokerage and other transaction expenses relating to the purchase or sale of portfolio investments and acquired (underlying) portfolio/fund fees and expenses) of Initial Class shares and Service Class shares do not exceed 0.95% and 1.20%, respectively, of the Portfolio's average daily net assets. This agreement will remain in effect until May 1, 2022, and shall renew automatically for one-year terms unless New York Life Investments provides written notice of termination prior to the start of the next term or upon approval of the Board.
During the six-month period ended June 30, 2021, New York Life Investments earned fees from the Portfolio in the amount of $94,048 and
waived fees and/or reimbursed expenses in the amount of $79,149 and paid the Subadvisor fees in the amount of $7,461.
JPMorgan provides sub-administration and sub-accounting services to the Portfolio pursuant to an agreement with New York Life Investments. These services include calculating the daily NAVs of the Portfolio, maintaining the general ledger and sub-ledger accounts for the calculation of the Portfolio's NAVs, and assisting New York Life Investments in conducting various aspects of the Portfolio's administrative operations. For providing these services to the Portfolio, JPMorgan is compensated by New York Life Investments.
Prior to February 22, 2021, these services were provided by State Street.
Pursuant to an agreement between the Fund and New York Life Investments, New York Life Investments is responsible for providing or procuring certain regulatory reporting services for the Portfolio. The Portfolio will reimburse New York Life Investments for the actual costs incurred by New York Life Investments in connection with providing or procuring these services for the Portfolio.
(B) Distribution and Service Fees. The Fund, on behalf of the Portfolio, has entered into a distribution agreement with NYLIFE Distributors LLC (the “Distributor”), an affiliate of New York Life Investments. The Portfolio has adopted a distribution plan (the “Plan”) in accordance with the provisions of Rule 12b-1 under the 1940 Act. Under the Plan, the Distributor has agreed to provide, through its affiliates or independent third parties, various distribution-related, shareholder and administrative support services to the Service Class shareholders. For its services, the Distributor is entitled to a combined distribution and service fee accrued daily and paid monthly at an annual rate of 0.25% of the average daily net assets attributable to the Service Class shares of the Portfolio.
(C) Investments in Affiliates (in 000’s). During the six-month period ended June 30, 2021, purchases and sales transactions, income earned from investments and shares held of investment companies managed by New York Life Investments or its affiliates were as follows:
| Affiliated Investment Companies | Value,
Beginning
of Period | Purchases
at Cost | Proceeds
from
Sales | Net
Realized
Gain/(Loss)
on Sales | Change in
Unrealized
Appreciation/
(Depreciation) | Value,
End of
Period | Dividend
Income | Other
Distributions | Shares
End of
Period |
| MainStay U.S. Government Liquidity Fund | $ 303 | $ 3,367 | $ (3,330) | $ — | $ — | $ 340 | $ —(a) | $ — | 340 |
Notes to Financial Statements (Unaudited) (continued)
Note 4-Federal Income Tax
As of June 30, 2021, the cost and unrealized appreciation (depreciation) of the Portfolio’s investment portfolio, including applicable derivative contracts and other financial instruments, as determined on a federal income tax basis, were as follows:
| | Federal Tax
Cost | Gross
Unrealized
Appreciation | Gross
Unrealized
(Depreciation) | Net
Unrealized
Appreciation/
(Depreciation) |
| Investments in Securities | $21,568,368 | $2,365,387 | $(219,138) | $2,146,249 |
As of December 31, 2020, for federal income tax purposes, capital loss carryforwards of $39,116,556, as shown in the table below, were available to the extent provided by the regulations to offset future realized gains of the Portfolio. Accordingly, no capital gains distributions are expected to be paid to shareholders until net gains have been realized in excess of such amounts.
Capital Loss
Available Through | Short-Term
Capital Loss
Amounts (000’s) | Long-Term
Capital Loss
Amounts (000’s) |
| Unlimited | $35,185 | $3,932 |
During the year ended December 31, 2020, the tax character of distributions paid as reflected in the Statements of Changes in Net Assets was as follows:
| | 2020 |
| Distributions paid from: | |
| Ordinary Income | $1,857,902 |
Note 5–Custodian
JPMorgan is the custodian of cash and securities held by the Portfolio. Custodial fees are charged to the Portfolio based on the Portfolio's net assets and/or the market value of securities held by the Portfolio and the number of certain transactions incurred by the Portfolio.
Prior to February 22, 2021, these services were provided by State Street. The services provided by State Street were a direct expense of the Portfolio and are included in the Statement of Operations as Custodian fees which totaled $6,557 for the period January 1, 2021 through February 21, 2021.
Note 6–Line of Credit
The Portfolio and certain other funds managed by New York Life Investments maintain a line of credit with a syndicate of banks in order to secure a source of funds for temporary purposes to meet unanticipated or excessive redemption requests.
Effective July 27, 2021, under the credit agreement (the “Credit Agreement”), the aggregate commitment amount is $600,000,000 with an additional uncommitted amount of $100,000,000. The commitment
fee is an annual rate of 0.15% of the average commitment amount payable quarterly, regardless of usage, to JPMorgan, who serves as the agent to the syndicate. The commitment fee is allocated among the Portfolio and certain other funds managed by New York Life Investments based upon their respective net assets and other factors. Interest on any revolving credit loan is charged based upon the Federal Funds Rate or the one-month London Interbank Offered Rate ("LIBOR"), whichever is higher. The Credit Agreement expires on July 26, 2022, although the Portfolio, certain other funds managed by New York Life Investments and the syndicate of banks may renew the Credit Agreement for an additional year on the same or different terms or enter into a credit agreement with a different syndicate of banks. Prior to July 27, 2021, the aggregate commitment amount and the commitment fee were the same as those under the current Credit Agreement. During the six-month period ended June 30, 2021, there were no borrowings made or outstanding with respect to the Portfolio under the Credit Agreement.
Note 7–Interfund Lending Program
Pursuant to an exemptive order issued by the SEC, the Portfolio, along with certain other funds managed by New York Life Investments, may participate in an interfund lending program. The interfund lending program provides an alternative credit facility that permits the Portfolio and certain other funds managed by New York Life Investments to lend or borrow money for temporary purposes directly to or from one another, subject to the conditions of the exemptive order. During the six-month period ended June 30, 2021, there were no interfund loans made or outstanding with respect to the Portfolio.
Note 8–Purchases and Sales of Securities (in 000’s)
During the six-month period ended June 30, 2021, purchases and sales of securities, other than short-term securities, were $5,787 and $4,750, respectively.
Note 9–Capital Share Transactions
Transactions in capital shares for the six-month period ended June 30, 2021 and the year ended December 31, 2020, were as follows:
| Initial Class | Shares | Amount |
| Period ended June 30, 2021: | | |
| Shares sold | 69,111 | $ 473,653 |
| Shares redeemed | (7,415) | (51,729) |
| Net increase (decrease) | 61,696 | $ 421,924 |
| Year ended December 31, 2020: | | |
| Shares sold | 1,086,806 | $ 6,916,396 |
| Shares issued to shareholders in reinvestment of distributions | 85,297 | 524,797 |
| Shares redeemed | (1,140,203) | (7,053,406) |
| Net increase (decrease) | 31,900 | $ 387,787 |
| |
| 22 | MainStay VP CBRE Global Infrastructure Portfolio |
| Service Class | Shares | Amount |
| Period ended June 30, 2021: | | |
| Shares sold | 314,375 | $ 2,099,429 |
| Shares redeemed | (268,396) | (1,791,217) |
| Net increase (decrease) | 45,979 | $ 308,212 |
| Year ended December 31, 2020: | | |
| Shares sold | 785,805 | $ 4,865,797 |
| Shares issued to shareholders in reinvestment of distributions | 218,703 | 1,333,105 |
| Shares redeemed | (754,887) | (4,784,240) |
| Net increase (decrease) | 249,621 | $ 1,414,662 |
Note 10–Other Matters
An outbreak of COVID-19, first detected in December 2019, has developed into a global pandemic and has resulted in travel restrictions, closure of international borders, certain businesses and securities markets, restrictions on securities trading activities, prolonged quarantines, supply chain disruptions, and lower consumer demand, as well as general concern and uncertainty. The continued impact of COVID-19 and related new variants is uncertain and could further adversely affect the global economy, national economies, individual issuers and capital markets in unforeseeable ways and result in a substantial and extended economic downturn. Developments that disrupt global economies and financial markets, such as COVID-19, may magnify factors that affect the Portfolio's performance.
Note 11–Subsequent Events
In connection with the preparation of the financial statements of the Portfolio as of and for the six-month period ended June 30, 2021, events and transactions subsequent to June 30, 2021, through the date the financial statements were issued have been evaluated by the Manager for possible adjustment and/or disclosure. No subsequent events requiring financial statement adjustment or disclosure have been identified.
Discussion of the Operation and Effectiveness of the Portfolio's Liquidity Risk Management Program (Unaudited)
In compliance with Rule 22e-4 under the Investment Company Act of 1940, as amended (the “Liquidity Rule”), the Portfolio has adopted and implemented a liquidity risk management program (the “Program”), which New York Life Investment Management LLC believes is reasonably designed to assess and manage the Portfolio's liquidity risk (the risk that the Portfolio could not meet requests to redeem shares issued by the Portfolio without significant dilution of remaining investors’ interests in the Portfolio). The Board of Trustees of MainStay VP Funds Trust (the "Board") designated New York Life Investment Management LLC as administrator of the Program (the “Administrator”). The Administrator has established a Liquidity Risk Management Committee to assist the Administrator in the implementation and day-to-day administration of the Program and to otherwise support the Administrator in fulfilling its responsibilities under the Program.
At a meeting of the Board held on March 8, 2021, the Administrator provided the Board with a written report addressing the Program’s operation and assessing its adequacy and effectiveness of implementation for the period from January 1, 2020 through December 31, 2020 (the "Review Period"), as required under the Liquidity Rule. The report noted that the Administrator concluded that (i) the Program operated effectively to assess and manage the Portfolio's liquidity risk, (ii) the Program has been adequately and effectively implemented to monitor and, as applicable, respond to the Portfolio's liquidity developments and (iii) the Portfolio's investment strategy continues to be appropriate for an open-end fund. In addition, the report discussed notable events that impacted liquidity risk during the Review Period, including the COVID-19 pandemic and the resulting economic shutdown.
In accordance with the Program, the Portfolio's liquidity risk is assessed no less frequently than annually taking into consideration certain factors, as applicable, such as (i) investment strategy and liquidity of portfolio investments, (ii) short-term and long-term cash flow projections and (iii) holdings of cash and cash equivalents, as well as borrowing arrangements and other funding sources. Certain factors are considered under both normal and reasonably foreseeable stressed conditions.
Each Portfolio portfolio investment is classified into one of four liquidity categories. The classification is based on a determination of the number of days it is reasonably expected to take to convert the investment into cash, or sell or dispose of the investment, in current market conditions without significantly changing the market value of the investment. The Administrator has delegated liquidity classification determinations to the Portfolio’s subadvisor, subject to appropriate oversight by the Administrator, and classification determinations are made by taking into account the Portfolio's reasonably anticipated trade size, various market, trading and investment-specific considerations, as well as market depth, and, in certain cases, third-party vendor data.
The Liquidity Rule requires portfolios that do not primarily hold assets that are highly liquid investments to adopt a minimum amount of net assets that must be invested in highly liquid investments that are assets (an “HLIM”). In addition, the Liquidity Rule limits a portfolio's investments in illiquid investments. Specifically, the Liquidity Rule prohibits acquisition of illiquid investments if doing so would result in a portfolio holding more than 15% of its net assets in illiquid investments that are assets. The Program includes provisions reasonably designed to determine, periodically review and comply with the HLIM requirement, as applicable, and to comply with the 15% limit on illiquid investments.
There can be no assurance that the Program will achieve its objectives under all circumstances in the future. Please refer to the Portfolio's prospectus for more information regarding the Portfolio's exposure to liquidity risk and other risks to which it may be subject.
| 24 | MainStay VP CBRE Global Infrastructure Portfolio |
Proxy Voting Record
The Portfolio is required to file with the SEC its proxy voting records for the 12-month period ending June 30 on Form N-PX. The Portfolio's most recent Form N-PX or proxy voting record is available free of charge upon request (i) by calling 800-598-2019; (ii) by visiting New York Life Investments’ website at https://www.nylinvestments.com/mainstay/
products-and-performance/mainstay-vp-funds-trust; or (iii) by visiting the SEC’s website at www.sec.gov.
Shareholder Reports and Quarterly Portfolio Disclosure
The Portfolio is required to file its complete schedule of portfolio holdings with the SEC 60 days after its first and third fiscal quarter on Form N-PORT. The Portfolio's holdings report is available free of charge upon request by calling 800-598-2019 or by visiting the SEC’s website at www.sec.gov.
This page intentionally left blank
MainStay VP Portfolios
MainStay VP offers a wide range of Portfolios. The full array of MainStay VP offerings is listed here, with information about the manager, subadvisors, legal counsel, and independent registered public accounting firm.
Equity
MainStay VP Candriam Emerging Markets Equity Portfolio
MainStay VP Epoch U.S. Equity Yield Portfolio
MainStay VP Fidelity Institutional AM® Utilities Portfolio†
MainStay VP MacKay International Equity Portfolio
MainStay VP MacKay S&P 500 Index Portfolio
MainStay VP Natural Resources Portfolio
MainStay VP Small Cap Growth Portfolio
MainStay VP T. Rowe Price Equity Income Portfolio
MainStay VP Wellington Growth Portfolio
MainStay VP Wellington Mid Cap Portfolio
MainStay VP Wellington Small Cap Portfolio
MainStay VP Wellington U.S. Equity Portfolio
MainStay VP Winslow Large Cap Growth Portfolio
Mixed Asset
MainStay VP Balanced Portfolio
MainStay VP Income Builder Portfolio
MainStay VP Janus Henderson Balanced Portfolio
MainStay VP MacKay Convertible Portfolio
Income
MainStay VP Bond Portfolio
MainStay VP Floating Rate Portfolio
MainStay VP Indexed Bond Portfolio
MainStay VP MacKay Government Portfolio
MainStay VP MacKay High Yield Corporate Bond Portfolio
MainStay VP MacKay Strategic Bond Portfolio
MainStay VP PIMCO Real Return Portfolio
Money Market
MainStay VP U.S. Government Money Market Portfolio
Alternative
MainStay VP CBRE Global Infrastructure Portfolio
MainStay VP IQ Hedge Multi-Strategy Portfolio
Asset Allocation
MainStay VP Conservative Allocation Portfolio
MainStay VP Equity Allocation Portfolio
MainStay VP Growth Allocation Portfolio
MainStay VP Moderate Allocation Portfolio
Manager
New York Life Investment Management LLC
New York, New York
Subadvisors
Brown Advisory LLC
Baltimore, Maryland
Candriam Belgium S.A.*
Brussels, Belgium
CBRE Clarion Securities LLC
Radnor, Pennsylvania
Epoch Investment Partners, Inc.
New York, New York
FIAM LLC
Smithfield, Rhode Island
IndexIQ Advisors LLC*
New York, New York
Janus Capital Management LLC
Denver, Colorado
MacKay Shields LLC*
New York, New York
Mellon Investments Corporation
Boston, Massachusetts
NYL Investors LLC*
New York, New York
Pacific Investment Management Company LLC
Newport Beach, California
Segall Bryant & Hamill, LLC
Chicago, Illinois
T. Rowe Price Associates, Inc.
Baltimore, Maryland
Wellington Management Company LLP
Boston, Massachusetts
Winslow Capital Management, LLC
Minneapolis, Minnesota
Legal Counsel
Dechert LLP
Washington, District of Columbia
Independent Registered Public Accounting Firm
PricewaterhouseCoopers LLP
New York, New York
Distributor
NYLIFE Distributors LLC*
Jersey City, New Jersey
Custodian
JPMorgan Chase Bank, N.A.
New York, New York
Some Portfolios may not be available in all products.
† Fidelity Institutional AM is a registered trade mark of FMR LLC. Used with permission.
* An affiliate of New York Life Investment Management LLC
Not part of the Semiannual Report
2021 Semiannual Report
This report is for the general information of New York Life Variable Annuities and NYLIAC Variable Universal Life Insurance Products policyowners. It must be preceded or accompanied by the appropriate product(s) and funds prospectuses if it is given to anyone who is not an owner of a New York Life variable annuity policy or a NYLIAC Variable Universal Life Insurance Product. This report does not offer for sale or solicit orders to purchase securities.
The performance data quoted in this report represents past performance. Past performance is no guarantee of future results. Due to market volatility and other factors, current performance may be lower or higher than the figures shown. The most recent month-end performance summary for your variable annuity or variable life policy is available by calling 800-598-2019 and is updated periodically on newyorklife.com.
The New York Life Variable Annuities and NYLIAC Variable Universal Life Insurance Products are issued by New York Life Insurance and Annuity Corporation (a Delaware Corporation) and distributed by NYLIFE Distributors LLC (Member FINRA/SIPC).
New York Life Insurance Company
New York Life Insurance and Annuity
Corporation (NYLIAC) (A Delaware Corporation)
51 Madison Avenue, Room 551
New York, NY 10010
newyorklife.com
nylinvestments.com
NYLIFE Distributors LLC, 30 Hudson Street, Jersey City, NJ 07302
New York Life Investment Management LLC is the investment manager to the MainStay VP Funds Trust
©2021 by NYLIFE Distributors LLC. All rights reserved.
You may obtain copies of the Prospectus and the Statement of Additional Information free of charge, upon request, by calling toll-free 800-598-2019 or writing to New York Life Insurance and Annuity Corporation, 51 Madison Avenue, New York, NY 10010.
| Not FDIC Insured | No Bank Guarantee | May Lose Value |
(NYLIAC) NI514
MainStay VP Fidelity Institutional AM® Utilities Portfolio*
Message from the President and Semiannual Report
Unaudited | June 30, 2021
Sign up for e-delivery of your shareholder reports. For full details on e-delivery, including who can participate and what you can receive via e-delivery,
please log in to newyorklifeinvestments.com/accounts.
| Not FDIC/NCUA Insured | Not a Deposit | May Lose Value | No Bank Guarantee | Not Insured by Any Government Agency |
* Fidelity Institutional AM is a registered trade mark of FMR LLC. Used with permission.
This page intentionally left blank
Message from the President
The COVID-19 pandemic continued to afflict our personal lives and broad segments of the U.S. and global economy throughout the six-month reporting period ended June 30, 2021. However, with the deployment of multiple vaccines around the world, including three highly effective versions approved for emergency use in the United States, investors began to turn their attention toward the gradual reopening of the economy and the shape the “new normal” would take.
The first half of the reporting period saw increasing inflationary concerns as fiscal stimulus business reopenings drove accelerating economic growth, rising commodity prices and increased consumer spending. However, the U.S. Federal Reserve noted that price increases were likely to prove temporary and made clear their intention to remain accommodative for the foreseeable future. Accordingly, after moving higher in the first quarter of 2021, interest rates declined in the second quarter.
In response to the uncertain inflation outlook, equity market leadership shifted from value in the first quarter of the year to growth in the second quarter. Nevertheless, investor sentiment remained buoyant throughout the reporting period, with all eleven sectors in the S&P 500® Index, a widely regarded benchmark of market performance, producing positive returns. Energy led the market’s rise fueled by rapidly increasing oil and gas prices, followed by financials and real estate, which benefited from rising interest rates and the economic reopening, respectively. Communication services produced the slowest growth, followed by the traditionally defensive utilities and consumer staples
sectors. In the fixed income market, lower-credit-quality issues tended to outperform their higher-grade counterparts, with high-yield corporate bonds generating the strongest performance. Among securitized products, commercial mortgage-backed securities generally produced the strongest returns, followed by mortgage-backed securities and asset-backed securities, while Treasury securities lagged.
Despite the tremendous progress we’ve seen so far this year, the United States and the world continue to face significant pandemic-related challenges. Newer, more contagious variants of COVID-19 threaten the return of restrictions and lockdowns that could stall the economic recovery. At the same time, supply chain shortages have led to rising prices on everything from laptops to autos, stoking fears of uncontrolled inflation despite reassurance from the U.S. Federal Reserve. At New York Life Investments, we recognize that the shape that the “new normal” eventually takes may differ from our expectations. You can depend on us to keep a sharp watch for the unexpected, and to continue to help you find your way through this rapidly evolving investment landscape.
Sincerely,
Kirk C. Lehneis
President
The opinions expressed are as of the date of this report and are subject to change. There is no guarantee that any forecast made will come to pass. This material does not constitute investment advice and is not intended as an endorsement of any specific investment. Past performance is no guarantee of future results.
Not part of the Semiannual Report
Investors should refer to the Portfolio’s Summary Prospectus and/or Prospectus and consider the Portfolio’s investment objectives, strategies, risks, charges and expenses carefully before investing. The Summary Prospectus and/or Prospectus contain this and other information about the Portfolio. You may obtain copies of the Portfolio’s Summary Prospectus and/or the Prospectus and the Statement of Additional Information free of charge, upon request, by calling toll-free 800-598-2019, by writing to New York Life Insurance and Annuity Corporation, 51 Madison Avenue, Room 251, New York, New York 10010 or by sending an email to MainStayShareholdersServices@nylim.com. These documents are also available at nylinvestments.com/vpdocuments. Please read the Portfolio's Summary Prospectus and/or Prospectus carefully before investing. MainStay VP Funds Trust portfolios are separate account options which are purchased through a variable insurance or variable annuity contract.
Investment and Performance Comparison (Unaudited)
Performance data quoted represents past performance. Past performance is no guarantee of future results. Because of market volatility and other factors, current performance may be lower or higher than the figures shown. Investment return and principal value will fluctuate, and as a result, when shares are redeemed, they may be worth more or less than their original cost. The performance table and graph do not reflect any deduction of sales charges, mortality and expense charges, contract charges or administrative charges. Please refer to the Performance Summary appropriate for your policy. For performance information current to the most recent month-end, please call 800-598-2019 or visit www.newyorklife.com.
Performance figures may reflect certain fee waivers and/or expense limitations, without which total returns may have been different. For information on current fee waivers and/or expense limitations (if any), please refer to the Notes to Financial Statements.
| Average Annual Total Returns for the Period-Ended June 30, 2021 |
| Class | Inception
Date1 | Six
Months | One
Year | Five
Years | Since
Inception | Gross
Expense
Ratio2 |
| Initial Class Shares | 2/17/2012 | 2.30% | 18.45% | 7.03% | 7.95% | 0.67% |
| Service Class Shares | 2/17/2012 | 2.18 | 18.15 | 6.77 | 7.68 | 0.92 |
| 1. | The Portfolio replaced its subadvisor and modified its principal investment strategies and changed its classification from a diversified fund to a non-diversified fund as of November 30, 2018. Therefore, the performance information shown in this report prior to November 30, 2018 reflects the Portfolio’s prior subadvisor, principal investment strategies and diversification status. |
| 2. | The gross expense ratios presented reflect the Portfolio’s “Total Annual Portfolio Operating Expenses” from the most recent Prospectus, as supplemented, and may differ from other expense ratios disclosed in this report. |
| Benchmark Performance | Six
Months | One
Year | Five
Years | Since
Inception |
| MSCI USA IMI Utilities 25/50 Index (Gross)1 | 2.65% | 15.78% | 7.35% | 10.60% |
| Morningstar Utilities Category Average2 | 4.19 | 18.72 | 7.27 | 9.17 |
| 1. | The MSCI USA IMI Utilities 25/50 Index (Gross) is the Portfolio's primary benchmark. The MSCI USA IMI Utilities 25/50 Index (Gross) is a modified market capitalization weighted index of stocks designed to measure the performance of utilities companies in the MSCI U.S. Investable Market 2500 Index. Results assume reinvestment of all dividends and capital gains. An investment cannot be made directly in an index. |
| 2. | The Morningstar Utilities Category Average is representative of funds that seek capital appreciation by investing primarily in equity securities of U.S. or non-U.S. public utilities including electric, gas, and telephone-service providers. Results are based on average total returns of similar funds with all dividends and capital gain distributions reinvested. |
Cost in Dollars of a $1,000 Investment in MainStay VP Fidelity Institutional AM® Utilities Portfolio (Unaudited)
The example below is intended to describe the fees and expenses borne by shareholders during the six-month period from January 1, 2021 to June 30, 2021, and the impact of those costs on your investment.
Example
As a shareholder of the Portfolio you incur two types of costs: (1) transaction costs, including exchange fees and sales charges (loads) on purchases (as applicable), and (2) ongoing costs, including management fees, distribution and/or service (12b-1) fees, and other Portfolio expenses (as applicable). This example is intended to help you understand your ongoing costs (in dollars) of investing in the Portfolio and to compare these costs with the ongoing costs of investing in other mutual funds. The example is based on an investment of $1,000 made at the beginning of the six-month period and held for the entire period from January 1, 2021 to June 30, 2021. Shares are only sold in connection with variable life and annuity contracts and the example does not reflect any contract level or transactional fees or expenses. If these costs had been included, your costs would have been higher.
This example illustrates your Portfolio’s ongoing costs in two ways:
Actual Expenses
The second and third data columns in the table below provide information about actual account values and actual expenses. You may use the information in these columns, together with the amount you invested, to estimate the expenses that you paid during the six months ended June
30, 2021. Simply divide your account value by $1,000 (for example, an $8,600 account value divided by $1,000 = 8.6), then multiply the result by the number under the heading entitled “Expenses Paid During Period” to estimate the expenses you paid on your account during this period.
Hypothetical Example for Comparison Purposes
The fourth and fifth data columns in the table below provide information about hypothetical account values and hypothetical expenses based on the Portfolio’s actual expense ratio and an assumed rate of return of 5% per year before expenses, which is not the Portfolio’s actual return. The hypothetical account values and expenses may not be used to estimate the actual ending account balances or expenses you paid for the six-month period shown. You may use this information to compare the ongoing costs of investing in the Portfolio with the ongoing costs of investing in other mutual funds. To do so, compare this 5% hypothetical example with the 5% hypothetical examples that appear in the shareholder reports of the other mutual funds.
Please note that the expenses shown in the table are meant to highlight your ongoing costs only and do not reflect any transactional costs, such as exchange fees or sales charges (loads). Therefore, the fourth and fifth data columns of the table are useful in comparing ongoing costs only and will not help you determine the relative total costs of owning different funds. In addition, if these transactional costs were included, your costs would have been higher.
| Share Class | Beginning
Account
Value
1/1/21 | Ending Account
Value (Based
on Actual
Returns and
Expenses)
6/30/21 | Expenses
Paid
During
Period1 | Ending Account
Value (Based
on Hypothetical
5% Annualized
Return and
Actual Expenses)
6/30/21 | Expenses
Paid
During
Period1 | Net Expense
Ratio
During
Period2 |
| Initial Class Shares | $1,000.00 | $1,023.00 | $3.36 | $1,021.47 | $3.36 | 0.67% |
| Service Class Shares | $1,000.00 | $1,021.80 | $4.61 | $1,020.23 | $4.61 | 0.92% |
| 1. | Expenses are equal to the Portfolio’s annualized expense ratio of each class multiplied by the average account value over the period, divided by 365 and multiplied by 181 (to reflect the six-month period). The table above represents the actual expenses incurred during the six-month period. In addition to the fees and expenses which the Portfolio bears directly, it also indirectly bears a pro rata share of the fees and expenses of the underlying funds in which it invests. Such indirect expenses are not included in the above-reported expense figures. |
| 2. | Expenses are equal to the Portfolio's annualized expense ratio to reflect the six-month period. |
| 6 | MainStay VP Fidelity Institutional AM® Utilities Portfolio |
Industry Composition as of June 30, 2021 (Unaudited)
| Electric Utilities | 64.2% |
| Multi–Utilities | 26.2 |
| Independent Power and Renewable Electricity Producers | 8.3 |
| Short–Term Investment | 1.0 |
| Other Assets, Less Liabilities | 0.3 |
| | 100.0% |
See Portfolio of Investments beginning on page 10 for specific holdings within these categories. The Portfolio's holdings are subject to change.
Top Ten Holdings as of June 30, 2021 (excluding short-term investments) (Unaudited)
| 1. | NextEra Energy, Inc. |
| 2. | Southern Co. (The) |
| 3. | Exelon Corp. |
| 4. | Sempra Energy |
| 5. | Dominion Energy, Inc. |
| 6. | Edison International |
| 7. | FirstEnergy Corp. |
| 8. | American Electric Power Co., Inc. |
| 9. | Duke Energy Corp. |
| 10. | CenterPoint Energy, Inc. |
Portfolio Management Discussion and Analysis (Unaudited)
Answers to the questions reflect the views of portfolio manager Douglas Simmons of FIAM LLC (“FIAM”) the Portfolio’s Subadvisor.
How did MainStay VP Fidelity Institutional AM® Utilities Portfolio1 perform relative to its benchmark and peers during the six months ended June 30, 2021?
For the six months ended June 30, 2021, MainStay VP Fidelity Institutional AM® Utilities Portfolio returned 2.30% for Initial Class shares and 2.18% for Service Class shares. Over the same period, both share classes underperformed the 2.65% return of the MSCI USA IMI Utilities 25/50 Index (Gross), which is the Portfolio’s benchmark. For the six months ended June 30, 2021, both share classes also underperformed the 4.19% return of the Morningstar Utilities Category Average.2
What factors affected the Portfolio’s relative performance during the reporting period?
The Portfolio underperformed the MSCI USA IMI Utilities 25/50 Index largely due to lack of exposure to gas utilities. Security selection, particularly within multi-utilities, partly offset this allocation effect.
Which subsectors were the strongest positive contributors to the Portfolio’s relative performance, and which subsectors were particularly weak?
The strongest positive contributions to the Portfolio’s relative performance from a subsector standpoint came from multi-utilities, followed by renewable electricity and independent power producers & energy traders (IPPs). (Contributions take weightings and total returns into account.) Conversely, the most significant detractor from relative performance was electric utilities, the largest subsector in the benchmark, followed by water utilities and electrical components & equipment, an out-of-index position.
During the reporting period, which individual stocks made the strongest positive contributions to the Portfolio’s absolute performance and which stocks detracted the most?
On an absolute return basis, the three largest positive contributors to the Portfolio’s overall performance were FirstEnergy, AES and CenterPoint Energy. FirstEnergy is a best-in-class utility with a premier renewable business and transmission system. Decreasing regulatory risk in the company’s home state of Ohio seemed to become better understood by the market. AES, an IPP, climbed higher as investors rewarded the company’s transformation initiatives—moving from a volatile, commodity-oriented company to a more predictable and stable growth profile. AES was also well positioned to benefit from the growth of renewable energy. CenterPoint Energy, an electric utility, was rewarded for its new CEO’s vision and plans for the future to capitalize on the
company’s diversified portfolio of high-quality assets and strong growth prospects.
The three most significant detractors from absolute performance during the reporting period were PG&E, NextEra Energy and Edison International. PG&E faced difficulties after it had been partly blamed for deadly fires over the years in northern California, despite favorable state legislation, passed in 2019, for dealing with fires. NextEra, one of the best performing utility stocks in 2020 due to the company’s renewables initiatives, gave back some of those gains during the first half of 2021. Edison International, an electric utility serving the greater Los Angeles area, saw its stock valuation remain depressed due in part to wildfire concerns in California, a risk we regard as overstated.
Did the Portfolio make any significant purchases or sales during the reporting period?
Most notably, the Portfolio increased its holdings in Dominion Energy. Dominion stock, which the Portfolio had trimmed during the prior reporting period, was selling at what we viewed as a very attractive valuation after execution and management missteps last year. During the reporting period, the company appeared to have fixed some issues and their massive offshore wind development project remained promising. The Portfolio also added meaningfully to its holdings in Southern Company. The company has nuclear plants coming online in the intermediate future and has one of the biggest rerating opportunities in the sector once investors have clear line of sight into the timeline of the plants, which we believe is likely late 2021 and 2022. The company also pays what we view as a healthy dividend that should offer downside protection while paying investors to wait.
The Portfolio significantly decreased its position in AES. AES was a meaningful contributor last year, as well as for the first six months of 2021. The Portfolio took the opportunity to reduce its holdings on relative strength. In addition, the Portfolio trimmed its holdings of NextEra Energy. NextEra was widely viewed as the premier utility in the sector with a valuation reflecting that perception. We trimmed the Portfolio’s holdings in the company to deploy the capital in opportunities we considered more attractively valued.
How did the Portfolio’s sector weightings change during the reporting period?
The biggest change in the Portfolio’s subsector positioning relative to the MSCI USA IMI Utilities 25/50 Index during the reporting period involved decreased exposure to IPPs. This group, which had been a strong contributor to Portfolio performance, was trimmed based on our perspective of increasing valuations. All three positions, AES, Vistra and Clearway Energy, were reduced, with AES remaining the Portfolio’s largest position in this group as of June 30, 2021. Conversely, the Portfolio increased its exposure
| 1. | Fidelity Institutional AM is a registered trademark of FMR LLC. Used with permission. |
| 2. | See page 5 for more information on benchmark and peer group returns. |
| 8 | MainStay VP Fidelity Institutional AM® Utilities Portfolio |
to both electric utilities and multi-utilities. As of the end of the reporting period, electric utilities represented the Portfolio’s largest overweight position relative to the Index, while multi-utilities exposure had been increased from meaningfully underweight in early 2021 to slightly below market weight.
How was the Portfolio positioned at the end of the reporting period?
As of June 30, 2021, the Portfolio’s most overweight industry position relative to the MSCI USA IMI Utilities 25/50 Index was electric utilities, followed by IPPs. As of the same date, the most significant industry underweights remained water utilities and gas utilities, with the Portfolio holding no exposure to either industry.
The opinions expressed are those of the portfolio managers as of the date of this report and are subject to change. There is no guarantee that any forecasts will come to pass. This material does not constitute investment advice and is not intended as an endorsement of any specific investment.
Not all MainStay VP Portfolios and/or share classes are available under all policies.
Portfolio of Investments June 30, 2021† (Unaudited)
| | Shares | Value |
| Common Stocks 98.7% |
| Electric Utilities 64.2% |
| American Electric Power Co., Inc. | 640,448 | $ 54,175,496 |
| Duke Energy Corp. | 548,145 | 54,112,875 |
| Edison International | 1,103,237 | 63,789,163 |
| Entergy Corp. | 272,300 | 27,148,310 |
| Evergy, Inc. | 856,121 | 51,735,392 |
| Exelon Corp. | 1,938,598 | 85,899,277 |
| FirstEnergy Corp. | 1,545,318 | 57,501,283 |
| NextEra Energy, Inc. | 1,579,332 | 115,733,449 |
| NRG Energy, Inc. | 553,795 | 22,317,939 |
| OGE Energy Corp. | 240,100 | 8,079,365 |
| PG&E Corp. (a) | 4,778,999 | 48,602,420 |
| Southern Co. (The) | 1,719,882 | 104,070,059 |
| | | 693,165,028 |
| Independent Power and Renewable Electricity Producers 8.3% |
| AES Corp. (The) | 1,920,179 | 50,059,067 |
| Clearway Energy, Inc., Class C | 83,837 | 2,220,004 |
| NextEra Energy Partners LP (b) | 234,903 | 17,937,193 |
| Sunnova Energy International, Inc. (a) | 186,423 | 7,020,690 |
| Vistra Corp. | 667,330 | 12,378,971 |
| | | 89,615,925 |
| Multi-Utilities 26.2% |
| CenterPoint Energy, Inc. | 2,135,598 | 52,364,863 |
| Dominion Energy, Inc. | 957,043 | 70,409,653 |
| NiSource, Inc. | 1,551,584 | 38,013,808 |
| | Shares | | Value |
| |
| Multi-Utilities (continued) |
| Public Service Enterprise Group, Inc. | 692,631 | | $ 41,377,776 |
| Sempra Energy | 605,843 | | 80,262,081 |
| | | | 282,428,181 |
Total Common Stocks
(Cost $967,105,951) | | | 1,065,209,134 |
| Short-Term Investment 1.0% |
| Affiliated Investment Company 1.0% |
| MainStay U.S. Government Liquidity Fund, 0.01% (c) | 10,601,974 | | 10,601,974 |
Total Short-Term Investment
(Cost $10,601,974) | | | 10,601,974 |
Total Investments
(Cost $977,707,925) | 99.7% | | 1,075,811,108 |
| Other Assets, Less Liabilities | 0.3 | | 3,712,474 |
| Net Assets | 100.0% | | $ 1,079,523,582 |
| † | Percentages indicated are based on Portfolio net assets. |
| (a) | Non-income producing security. |
| (b) | All or a portion of this security was held on loan. As of June 30, 2021, the aggregate market value of securities on loan was $14,814,756. The market value of the collateral held included non-cash collateral in the form of U.S. Treasury securities with a value of $14,881,659. (See Note 2(H)) |
| (c) | Current yield as of June 30, 2021. |
The following is a summary of the fair valuations according to the inputs used as of June 30, 2021, for valuing the Portfolio’s assets:
| Description | Quoted
Prices in
Active
Markets for
Identical
Assets
(Level 1) | | Significant
Other
Observable
Inputs
(Level 2) | | Significant
Unobservable
Inputs
(Level 3) | | Total |
| Asset Valuation Inputs | | | | | | | |
| Investments in Securities (a) | | | | | | | |
| Common Stocks | $ 1,065,209,134 | | $ — | | $ — | | $ 1,065,209,134 |
| Short-Term Investment | | | | | | | |
| Affiliated Investment Company | 10,601,974 | | — | | — | | 10,601,974 |
| Total Investments in Securities | $ 1,075,811,108 | | $ — | | $ — | | $ 1,075,811,108 |
| (a) | For a complete listing of investments and their industries, see the Portfolio of Investments. |
The notes to the financial statements are an integral part of, and should be read in conjunction with, the financial statements.
| 10 | MainStay VP Fidelity Institutional AM® Utilities Portfolio |
Statement of Assets and Liabilities as of June 30, 2021 (Unaudited)
| Assets |
Investment in unaffiliated securities, at value
(identified cost $967,105,951) including securities on loan of $14,814,756 | $1,065,209,134 |
Investment in affiliated investment companies, at value
(identified cost $10,601,974) | 10,601,974 |
| Receivables: | |
| Investment securities sold | 4,828,272 |
| Interest | 308,838 |
| Portfolio shares sold | 195,000 |
| Securities lending | 1,813 |
| Other assets | 8,989 |
| Total assets | 1,081,154,020 |
| Liabilities |
| Payables: | |
| Portfolio shares redeemed | 695,349 |
| Manager (See Note 3) | 574,476 |
| NYLIFE Distributors (See Note 3) | 191,882 |
| Shareholder communication | 96,760 |
| Professional fees | 57,612 |
| Custodian | 9,561 |
| Trustees | 2,125 |
| Accrued expenses | 2,673 |
| Total liabilities | 1,630,438 |
| Net assets | $1,079,523,582 |
| Composition of Net Assets |
| Shares of beneficial interest outstanding (par value of $.001 per share) unlimited number of shares authorized | $ 85,890 |
| Additional paid-in-capital | 886,497,394 |
| | 886,583,284 |
| Total distributable earnings (loss) | 192,940,298 |
| Net assets | $1,079,523,582 |
| Initial Class | |
| Net assets applicable to outstanding shares | $164,884,778 |
| Shares of beneficial interest outstanding | 13,053,415 |
| Net asset value per share outstanding | $ 12.63 |
| Service Class | |
| Net assets applicable to outstanding shares | $914,638,804 |
| Shares of beneficial interest outstanding | 72,836,335 |
| Net asset value per share outstanding | $ 12.56 |
The notes to the financial statements are an integral part of, and should be read in conjunction with, the financial statements.
11
Statement of Operations for the six months ended June 30, 2021 (Unaudited)
| Investment Income (Loss) |
| Income | |
| Dividends-unaffiliated | $ 15,825,918 |
| Securities lending | 1,891 |
| Dividends-affiliated | 608 |
| Interest | 328 |
| Total income | 15,828,745 |
| Expenses | |
| Manager (See Note 3) | 3,473,295 |
| Distribution/Service—Service Class (See Note 3) | 1,170,633 |
| Professional fees | 65,285 |
| Shareholder communication | 51,951 |
| Custodian | 15,669 |
| Trustees | 11,334 |
| Miscellaneous | 24,220 |
| Total expenses | 4,812,387 |
| Net investment income (loss) | 11,016,358 |
| Realized and Unrealized Gain (Loss) |
| Net realized gain (loss) on: | |
| Unaffiliated investment transactions | 47,405,586 |
| Foreign currency transactions | 26,297 |
| Net realized gain (loss) | 47,431,883 |
| Net change in unrealized appreciation (depreciation) on: | |
| Unaffiliated investments | (33,702,923) |
| Translation of other assets and liabilities in foreign currencies | (39,195) |
| Net change in unrealized appreciation (depreciation) | (33,742,118) |
| Net realized and unrealized gain (loss) | 13,689,765 |
| Net increase (decrease) in net assets resulting from operations | $ 24,706,123 |
The notes to the financial statements are an integral part of, and should be read in conjunction with, the financial statements.
| 12 | MainStay VP Fidelity Institutional AM® Utilities Portfolio |
Statements of Changes in Net Assets
for the six months ended June 30, 2021 (Unaudited) and the year ended December 31, 2020
| | 2021 | 2020 |
| Increase (Decrease) in Net Assets |
| Operations: | | |
| Net investment income (loss) | $ 11,016,358 | $ 19,441,319 |
| Net realized gain (loss) | 47,431,883 | 23,725,848 |
| Net change in unrealized appreciation (depreciation) | (33,742,118) | (58,306,186) |
| Net increase (decrease) in net assets resulting from operations | 24,706,123 | (15,139,019) |
| Distributions to shareholders: | | |
| Initial Class | — | (9,132,357) |
| Service Class | — | (76,778,772) |
| Total distributions to shareholders | — | (85,911,129) |
| Capital share transactions: | | |
| Net proceeds from sales of shares | 51,946,562 | 93,346,304 |
| Net asset value of shares issued to shareholder in reinvestment of distributions | — | 85,911,129 |
| Cost of shares redeemed | (86,598,042) | (207,898,643) |
| Increase (decrease) in net assets derived from capital share transactions | (34,651,480) | (28,641,210) |
| Net increase (decrease) in net assets | (9,945,357) | (129,691,358) |
| Net Assets |
| Beginning of period | 1,089,468,939 | 1,219,160,297 |
| End of period | $1,079,523,582 | $1,089,468,939 |
The notes to the financial statements are an integral part of, and should be read in conjunction with, the financial statements.
13
Financial Highlights selected per share data and ratios
| | Six months ended
June 30,
2021* | | Year Ended December 31, |
| Initial Class | 2020 | | 2019 | | 2018 | | 2017 | | 2016 |
| Net asset value at beginning of period | $ 12.35 | | $ 13.49 | | $ 11.68 | | $ 11.75 | | $ 10.66 | | $ 10.15 |
| Net investment income (loss) (a) | 0.14 | | 0.25 | | 0.31 | | 0.28 | | 0.25 | | 0.19 |
| Net realized and unrealized gain (loss) on investments | 0.14 | | (0.34) | | 2.39 | | (0.32) | | 1.49 | | 0.88 |
| Net realized and unrealized gain (loss) on foreign currency transactions | (0.00)‡ | | 0.00‡ | | (0.00)‡ | | 0.14 | | (0.16) | | 0.08 |
| Total from investment operations | 0.28 | | (0.09) | | 2.70 | | 0.10 | | 1.58 | | 1.15 |
| Less distributions: | | | | | | | | | | | |
| From net investment income | — | | (0.33) | | (0.34) | | (0.15) | | (0.49) | | (0.34) |
| From net realized gain on investments | — | | (0.72) | | (0.55) | | (0.02) | | — | | (0.30) |
| Total distributions | — | | (1.05) | | (0.89) | | (0.17) | | (0.49) | | (0.64) |
| Net asset value at end of period | $ 12.63 | | $ 12.35 | | $ 13.49 | | $ 11.68 | | $ 11.75 | | $ 10.66 |
| Total investment return (b) | 2.27%(c) | | (0.38)% | | 23.26% | | 0.80% | | 14.72% | | 11.43% |
| Ratios (to average net assets)/Supplemental Data: | | | | | | | | | | | |
| Net investment income (loss) | 2.24%†† | | 2.06% | | 2.41% | | 2.31% | | 2.11% | | 1.76%(d) |
| Net expenses (e) | 0.67%†† | | 0.67% | | 0.68% | | 0.76% | | 0.76% | | 0.75%(f) |
| Portfolio turnover rate | 22% | | 62% | | 47% | | 84% | | 30% | | 35% |
| Net assets at end of period (in 000’s) | $ 164,885 | | $ 135,814 | | $ 97,503 | | $ 81,716 | | $ 83,261 | | $ 75,772 |
| * | Unaudited. |
| ‡ | Less than one cent per share. |
| †† | Annualized. |
| (a) | Per share data based on average shares outstanding during the period. |
| (b) | Total return does not reflect any deduction of sales charges, mortality and expense charges, contract charges or administrative charges. For periods of less than one year, total return is not annualized. |
| (c) | Total investment return may reflect adjustments to conform to generally accepted accounting principles. |
| (d) | Without the custody fee reimbursement, net investment income (loss) would have been 1.74%. |
| (e) | In addition to the fees and expenses which the Portfolio bears directly, it also indirectly bears a pro-rata share of the fees and expenses of the underlying funds in which it invests. Such indirect expenses are not included in the above expense ratios. |
| (f) | Without the custody fee reimbursement, net expenses would have been 0.77%. |
The notes to the financial statements are an integral part of, and should be read in conjunction with, the financial statements.
| 14 | MainStay VP Fidelity Institutional AM® Utilities Portfolio |
Financial Highlights selected per share data and ratios
| | Six months ended
June 30,
2021* | | Year Ended December 31, |
| Service Class | 2020 | | 2019 | | 2018 | | 2017 | | 2016 |
| Net asset value at beginning of period | $ 12.29 | | $ 13.43 | | $ 11.63 | | $ 11.69 | | $ 10.62 | | $ 10.10 |
| Net investment income (loss) (a) | 0.12 | | 0.22 | | 0.28 | | 0.25 | | 0.22 | | 0.16 |
| Net realized and unrealized gain (loss) on investments | 0.15 | | (0.35) | | 2.37 | | (0.32) | | 1.47 | | 0.89 |
| Net realized and unrealized gain (loss) on foreign currency transactions | (0.00)‡ | | 0.00‡ | | (0.00)‡ | | 0.14 | | (0.16) | | 0.08 |
| Total from investment operations | 0.27 | | (0.13) | | 2.65 | | 0.07 | | 1.53 | | 1.13 |
| Less distributions: | | | | | | | | | | | |
| From net investment income | — | | (0.29) | | (0.30) | | (0.11) | | (0.46) | | (0.31) |
| From net realized gain on investments | — | | (0.72) | | (0.55) | | (0.02) | | — | | (0.30) |
| Total distributions | — | | (1.01) | | (0.85) | | (0.13) | | (0.46) | | (0.61) |
| Net asset value at end of period | $ 12.56 | | $ 12.29 | | $ 13.43 | | $ 11.63 | | $ 11.69 | | $ 10.62 |
| Total investment return (b) | 2.20%(c) | | (0.63)% | | 22.95% | | 0.55% | | 14.44% | | 11.15% |
| Ratios (to average net assets)/Supplemental Data: | | | | | | | | | | | |
| Net investment income (loss) | 1.99%†† | | 1.80% | | 2.15% | | 2.08% | | 1.87% | | 1.52%(d) |
| Net expenses (e) | 0.92%†† | | 0.92% | | 0.93% | | 1.01% | | 1.01% | | 1.00%(f) |
| Portfolio turnover rate | 22% | | 62% | | 47% | | 84% | | 30% | | 35% |
| Net assets at end of period (in 000’s) | $ 914,639 | | $ 953,655 | | $ 1,121,657 | | $ 1,066,963 | | $ 1,240,213 | | $ 1,160,397 |
| * | Unaudited. |
| ‡ | Less than one cent per share. |
| †† | Annualized. |
| (a) | Per share data based on average shares outstanding during the period. |
| (b) | Total return does not reflect any deduction of sales charges, mortality and expense charges, contract charges or administrative charges. For periods of less than one year, total return is not annualized. |
| (c) | Total investment return may reflect adjustments to conform to generally accepted accounting principles. |
| (d) | Without the custody fee reimbursement, net investment income (loss) would have been 1.50%. |
| (e) | In addition to the fees and expenses which the Portfolio bears directly, it also indirectly bears a pro-rata share of the fees and expenses of the underlying funds in which it invests. Such indirect expenses are not included in the above expense ratios. |
| (f) | Without the custody fee reimbursement, net expenses would have been 1.02%. |
The notes to the financial statements are an integral part of, and should be read in conjunction with, the financial statements.
15
Notes to Financial Statements (Unaudited)
Note 1–Organization and Business
MainStay VP Funds Trust (the “Fund”) was organized as a Delaware statutory trust on February 1, 2011. The Fund is registered under the Investment Company Act of 1940, as amended (the “1940 Act”), as an open-end management investment company. The Fund is comprised of thirty-one separate series (collectively referred to as the “Portfolios”). These financial statements and notes relate to the MainStay VP Fidelity Institutional AM® Utilities Portfolio (the "Portfolio"), a "non-diversified” portfolio, as that term is defined in the 1940 Act, as interpreted or modified by regulatory authorities having jurisdiction, from time to time.
Shares of the Portfolio are currently offered to certain separate accounts to fund variable annuity policies and variable universal life insurance policies issued by New York Life Insurance and Annuity Corporation (“NYLIAC”), a wholly-owned subsidiary of New York Life Insurance Company (“New York Life”) and may also be offered to fund variable annuity policies and variable universal life insurance policies issued by other insurance companies. NYLIAC allocates shares of the Portfolios to, among others, certain NYLIAC separate accounts. Shares of the Portfolio are also offered to the MainStay VP Conservative Allocation Portfolio, MainStay VP Moderate Allocation Portfolio, MainStay VP Growth Allocation Portfolio (formerly known as MainStay VP Moderate Growth Allocation Portfolio) and MainStay VP Equity Allocation Portfolio (formerly known as MainStay VP Growth Allocation Portfolio), which operate as “funds-of-funds," and other variable insurance funds.
The following table lists the Portfolio's share classes that have been registered and commenced operations:
| Class | Commenced Operations |
| Initial Class | February 17, 2012 |
| Service Class | February 17, 2012 |
Shares of the Portfolio are offered and are redeemed at a price equal to their respective net asset value (“NAV”) per share. No sales or redemption charge is applicable to the purchase or redemption of the Portfolio's shares. Under the terms of the Fund’s multiple class plan, adopted pursuant to Rule 18f-3 under the 1940 Act, the classes differ in that, among other things, Service Class shares of the Portfolio pay a combined distribution and service fee of 0.25% of average daily net assets attributable to Service Class shares of the Portfolio to the Distributor (as defined in Note 3(B)) pursuant to a plan adopted in accordance with Rule 12b-1 under the 1940 Act. Contract owners of variable annuity contracts purchased after June 2, 2003, are permitted to invest only in the Service Class shares.
The Portfolio's investment objective is to seek total return.
Note 2–Significant Accounting Policies
The Portfolio is an investment company and accordingly follows the investment company accounting and reporting guidance of the Financial Accounting Standards Board (“FASB”) Accounting Standard Codification Topic 946 Financial Services—Investment Companies. The Portfolio
prepares its financial statements in accordance with generally accepted accounting principles (“GAAP”) in the United States of America and follows the significant accounting policies described below.
(A) Securities Valuation. Investments are usually valued as of the close of regular trading on the New York Stock Exchange (the "Exchange") (usually 4:00 p.m. Eastern time) on each day the Portfolio is open for business ("valuation date").
The Board of Trustees of the Fund (the "Board") adopted procedures establishing methodologies for the valuation of the Portfolio's securities and other assets and delegated the responsibility for valuation determinations under those procedures to the Valuation Committee of the Fund (the “Valuation Committee”). The procedures state that, subject to the oversight of the Board and unless otherwise noted, the responsibility for the day-to-day valuation of portfolio assets (including fair value measurements for the Portfolio's assets and liabilities) rests with New York Life Investment Management LLC (“New York Life Investments” or the "Manager"), aided to whatever extent necessary by the Subadvisor (as defined in Note 3(A)). To assess the appropriateness of security valuations, the Manager, the Subadvisor or the Portfolio's third-party service provider, who is subject to oversight by the Manager, regularly compares prior day prices, prices on comparable securities and the sale prices to the prior and current day prices and challenges prices with changes exceeding certain tolerance levels with third-party pricing services or broker sources.
The Board authorized the Valuation Committee to appoint a Valuation Subcommittee (the “Subcommittee”) to establish the prices of securities for which market quotations are not readily available or the prices of which are not otherwise readily determinable under the procedures. The Subcommittee meets (in person, via electronic mail or via teleconference) on an as-needed basis. The Valuation Committee meets to ensure that actions taken by the Subcommittee were appropriate.
For those securities valued through either a standardized fair valuation methodology or a fair valuation measurement, the Subcommittee deals with such valuation and the Valuation Committee reviews and affirms, if appropriate, the reasonableness of the valuation based on such methodologies and measurements on a regular basis after considering information that is reasonably available and deemed relevant by the Valuation Committee. Any action taken by the Subcommittee with respect to the valuation of a portfolio security or other asset is submitted for review and ratification (if appropriate) to the Valuation Committee and the Board at the next regularly scheduled meeting.
"Fair value" is defined as the price the Portfolio would reasonably expect to receive upon selling an asset or liability in an orderly transaction to an independent buyer in the principal or most advantageous market for the asset or liability. Fair value measurements are determined within a framework that establishes a three-tier hierarchy that maximizes the use of observable market data and minimizes the use of unobservable inputs to establish a classification of fair value measurements for disclosure purposes. "Inputs" refer broadly to the assumptions that market
| 16 | MainStay VP Fidelity Institutional AM® Utilities Portfolio |
participants would use in pricing the asset or liability, including assumptions about risk, such as the risk inherent in a particular valuation technique used to measure fair value using a pricing model and/or the risk inherent in the inputs for the valuation technique. Inputs may be observable or unobservable. Observable inputs reflect the assumptions market participants would use in pricing the asset or liability based on market data obtained from sources independent of the Portfolio. Unobservable inputs reflect the Portfolio’s own assumptions about the assumptions market participants would use in pricing the asset or liability based on the information available. The inputs or methodology used for valuing assets or liabilities may not be an indication of the risks associated with investing in those assets or liabilities. The three-tier hierarchy of inputs is summarized below.
| • | Level 1—quoted prices in active markets for an identical asset or liability |
| • | Level 2—other significant observable inputs (including quoted prices for a similar asset or liability in active markets, interest rates and yield curves, prepayment speeds, credit risk, etc.) |
| • | Level 3—significant unobservable inputs (including the Portfolio's own assumptions about the assumptions that market participants would use in measuring fair value of an asset or liability) |
The level of an asset or liability within the fair value hierarchy is based on the lowest level of an input, both individually and in the aggregate, that is significant to the fair value measurement. The aggregate value by input level of the Portfolio’s assets and liabilities as of June 30, 2021, is included at the end of the Portfolio of Investments.
The Portfolio may use third-party vendor evaluations, whose prices may be derived from one or more of the following standard inputs, among others:
| • Broker/dealer quotes | • Benchmark securities |
| • Two-sided markets | • Reference data (corporate actions or material event notices) |
| • Bids/offers | • Monthly payment information |
| • Industry and economic events | • Reported trades |
An asset or liability for which market values cannot be measured using the methodologies described above is valued by methods deemed reasonable in good faith by the Valuation Committee, following the procedures established by the Board, to represent fair value. Under these procedures, the Portfolio generally uses a market-based approach which may use related or comparable assets or liabilities, recent transactions, market multiples, book values and other relevant information. The Portfolio may also use an income-based valuation approach in which the anticipated future cash flows of the asset or liability are discounted to calculate fair value. Discounts may also be applied due to the nature and/or duration of any restrictions on the disposition of the asset or liability. Fair value represents a good faith approximation of the value of a security. Fair value determinations involve the consideration of a number of subjective factors, an analysis of applicable facts and circumstances
and the exercise of judgment. As a result, it is possible that the fair value for a security determined in good faith in accordance with the Portfolio's valuation procedures may differ from valuations for the same security determined by other funds using their own valuation procedures. Although the Portfolio's valuation procedures are designed to value a security at the price the Portfolio may reasonably expect to receive upon the security's sale in an orderly transaction, there can be no assurance that any fair value determination thereunder would, in fact, approximate the amount that the Portfolio would actually realize upon the sale of the security or the price at which the security would trade if a reliable market price were readily available. During the six-month period ended June 30, 2021, there were no material changes to the fair value methodologies.
Securities which may be valued in this manner include, but are not limited to: (i) a security for which trading has been halted or suspended; (ii) a debt security that has recently gone into default and for which there is not a current market quotation; (iii) a security of an issuer that has entered into a restructuring; (iv) a security that has been delisted from a national exchange; (v) a security for which the market price is not readily available from a third-party pricing source or, if so provided, does not, in the opinion of the Manager or the Subadvisor, reflect the security's market value; (vi) a security subject to trading collars for which no or limited trading takes place; and (vii) a security whose principal market has been temporarily closed at a time when, under normal conditions, it would be open. Securities valued in this manner are generally categorized as Level 3 in the hierarchy. No securities held by the Portfolio as of June 30, 2021 were fair valued in such a manner.
Equity securities are valued at the last quoted sales prices as of the close of regular trading on the relevant exchange on each valuation date. Securities that are not traded on the valuation date are valued at the mean of the last quoted bid and ask prices. Prices are normally taken from the principal market in which each security trades. These securities are generally categorized as Level 1 in the hierarchy.
Investments in mutual funds, including money market funds, are valued at their respective NAVs at the close of business each day on the valuation date. These securities are generally categorized as Level 1 in the hierarchy.
Temporary cash investments acquired in excess of 60 days to maturity at the time of purchase are valued using the latest bid prices or using valuations based on a matrix system (which considers such factors as security prices, yields, maturities and ratings), both as furnished by independent pricing services. Temporary cash investments that mature in 60 days or less at the time of purchase ("Short-Term Investments") are valued using the amortized cost method of valuation, unless the use of such method would be inappropriate. The amortized cost method involves valuing a security at its cost on the date of purchase and thereafter assuming a constant amortization to maturity of the difference between such cost and the value on maturity date. Amortized cost approximates the current fair value of a security. Securities valued using the amortized cost method are not valued using quoted prices in an active market and are generally categorized as Level 2 in the hierarchy.
Notes to Financial Statements (Unaudited) (continued)
The information above is not intended to reflect an exhaustive list of the methodologies that may be used to value portfolio investments. The valuation procedures permit the use of a variety of valuation methodologies in connection with valuing portfolio investments. The methodology used for a specific type of investment may vary based on the market data available or other considerations. The methodologies summarized above may not represent the specific means by which portfolio investments are valued on any particular business day.
(B) Income Taxes. The Portfolio's policy is to comply with the requirements of the Internal Revenue Code of 1986, as amended (the “Internal Revenue Code”), applicable to regulated investment companies and to distribute all of its taxable income to the shareholders of the Portfolio within the allowable time limits.
The Manager evaluates the Portfolio’s tax positions to determine if the tax positions taken meet the minimum recognition threshold in connection with accounting for uncertainties in income tax positions taken or expected to be taken for the purposes of measuring and recognizing tax liabilities in the financial statements. Recognition of tax benefits of an uncertain tax position is permitted only to the extent the position is “more likely than not” to be sustained assuming examination by taxing authorities. The Manager analyzed the Portfolio's tax positions taken on federal, state and local income tax returns for all open tax years (for up to three tax years) and has concluded that no provisions for federal, state and local income tax are required in the Portfolio's financial statements. The Portfolio's federal, state and local income tax and federal excise tax returns for tax years for which the applicable statutes of limitations have not expired are subject to examination by the Internal Revenue Service and state and local departments of revenue.
(C) Dividends and Distributions to Shareholders. Dividends and distributions are recorded on the ex-dividend date. The Portfolio intends to declare and pay dividends from net investment income and distributions from net realized capital and currency gains, if any, at least annually. Unless a shareholder elects otherwise, all dividends and distributions are reinvested at NAV in the same class of shares of the Portfolio. Dividends and distributions to shareholders are determined in accordance with federal income tax regulations and may differ from determinations using GAAP.
(D) Security Transactions and Investment Income. The Portfolio records security transactions on the trade date. Realized gains and losses on security transactions are determined using the identified cost method. Dividend income is recognized on the ex-dividend date, net of any foreign tax withheld at the source, and interest income is accrued as earned using the effective interest rate method. Distributions received from real estate investment trusts may be classified as dividends, capital gains and/or return of capital.
Investment income and realized and unrealized gains and losses on investments of the Portfolio are allocated pro rata to the separate classes of shares based upon their relative net assets on the date the income is earned or realized and unrealized gains and losses are incurred.
(E) Expenses. Expenses of the Fund are allocated to the individual Portfolios in proportion to the net assets of the respective Portfolios when the expenses are incurred, except where direct allocations of expenses can be made. Expenses (other than fees incurred under the distribution and service plans, further discussed in Note 3(B), which are charged directly to the Service Class shares) are allocated to separate classes of shares pro rata based upon their relative net assets on the date the expenses are incurred. The expenses borne by the Portfolio, including those of related parties to the Portfolio, are shown in the Statement of Operations.
Additionally, the Portfolio may invest in mutual funds, which are subject to management fees and other fees that may cause the costs of investing in mutual funds to be greater than the costs of owning the underlying securities directly. These indirect expenses of mutual funds are not included in the amounts shown as expenses in the Statement of Operations or in the expense ratios included in the Financial Highlights.
(F) Use of Estimates. In preparing financial statements in conformity with GAAP, the Manager makes estimates and assumptions that affect the reported amounts and disclosures in the financial statements. Actual results could differ from those estimates and assumptions.
(G) Foreign Currency Transactions. The Portfolio's books and records are maintained in U.S. dollars. Prices of securities denominated in foreign currency amounts are translated into U.S. dollars at the mean between the buying and selling rates last quoted by any major U.S. bank at the following dates:
(i) market value of investment securities, other assets and liabilities— at the valuation date; and
(ii) purchases and sales of investment securities, income and expenses—at the date of such transactions.
The assets and liabilities that are denominated in foreign currency amounts are presented at the exchange rates and market values at the close of the period. The realized and unrealized changes in net assets arising from fluctuations in exchange rates and market prices of securities are not separately presented.
Net realized gain (loss) on foreign currency transactions represents net currency gains or losses realized as a result of differences between the amounts of securities sale proceeds or purchase cost, dividends, interest and withholding taxes as recorded on the Portfolio's books, and the U.S. dollar equivalent amount actually received or paid. Net currency gains or losses from valuing such foreign currency denominated assets and liabilities, other than investments at valuation date exchange rates, are reflected in unrealized foreign exchange gains or losses.
(H) Securities Lending. In order to realize additional income, the Portfolio may engage in securities lending, subject to the limitations set forth in the 1940 Act and relevant guidance by the staff of the Securities and Exchange Commission (“SEC”). If the Portfolio engages in securities lending, the Portfolio will lend through its custodian, JPMorgan Chase Bank, N.A., ("JPMorgan"), acting as securities lending agent on behalf of
| 18 | MainStay VP Fidelity Institutional AM® Utilities Portfolio |
the Portfolio. Under the current arrangement, JPMorgan will manage the Portfolio's collateral in accordance with the securities lending agency agreement between the Portfolio and JPMorgan, and indemnify the Portfolio against counterparty risk. The loans will be collateralized by cash (which may be invested in a money market fund) and/or non-cash collateral (which may include U.S. Treasury securities and/or U.S. government agency securities issued or guaranteed by the United States government or its agencies or instrumentalities) at least equal at all times to the market value of the securities loaned. The Portfolio bears the risk of delay in recovery of, or loss of rights in, the securities loaned. The Portfolio may also record a realized gain or loss on securities deemed sold due to a borrower’s inability to return securities on loan. The Portfolio bears the risk of any loss on investment of cash collateral. The Portfolio will receive compensation for lending its securities in the form of fees or it will retain a portion of interest earned on the investment of any cash collateral. The Portfolio will also continue to receive interest and dividends on the securities loaned and any gain or loss in the market price of the securities loaned that may occur during the term of the loan will be for the account of the Portfolio. Income earned from securities lending activities, if any, is reflected in the Statement of Operations. Securities on loan as of June 30, 2021, are shown in the Portfolio of Investments.
Prior to February 22, 2021, these services were provided by State Street Bank and Trust Company (“State Street”).
(I) Foreign Securities Risk. The Portfolio may invest in foreign securities, which carry certain risks that are in addition to the usual risks inherent in domestic securities. These risks include those resulting from currency fluctuations, future adverse political or economic developments and possible imposition of currency exchange blockages or other foreign governmental laws or restrictions. These risks are likely to be greater in emerging markets than in developed markets. The ability of issuers of debt securities held by the Portfolio to meet their obligations may be affected by, among other things, economic or political developments in a specific country, industry or region.
(J) Indemnifications. Under the Fund’s organizational documents, its officers and trustees are indemnified against certain liabilities that may arise out of performance of their duties to the Fund. Additionally, in the normal course of business, the Portfolio enters into contracts with third-party service providers that contain a variety of representations and warranties and that may provide general indemnifications. The Portfolio's maximum exposure under these arrangements is unknown, as this would involve future claims that may be made against the Portfolio that have not yet occurred. The Manager believes that the risk of loss in connection with these potential indemnification obligations is remote. However, there can be no assurance that material liabilities related to such obligations will not arise in the future, which could adversely impact the Portfolio.
Note 3–Fees and Related Party Transactions
(A) Manager and Subadvisor. New York Life Investments, a registered investment adviser and an indirect, wholly-owned subsidiary of New York Life, serves as the Portfolio’s Manager pursuant to an Amended
and Restated Management Agreement (“Management Agreement”). The Manager provides offices, conducts clerical, recordkeeping and bookkeeping services, and keeps most of the financial and accounting records required to be maintained by the Portfolio. Except for the portion of salaries and expenses that are the responsibility of the Portfolio, the Manager pays the salaries and expenses of all personnel affiliated with the Portfolio and certain operational expenses of the Portfolio. The Portfolio reimburses New York Life Investments in an amount equal to the portion of the compensation of the Chief Compliance Officer attributable to the Portfolio. FIAM LLC (“FIAM or the “Subadvisor”) a registered investment adviser, serves as Subadvisor to the Portfolio and is responsible for the day-to-day portfolio management of the Portfolio. Pursuant to the terms of a Sub-advisory Agreement (“Subadvisory Agreement”) between New York Life Investments and FIAM, New York Life Investments pays for the services of the Subadvisor.
Pursuant to the Management Agreement, the Fund pays the Manager, on behalf of the Portfolio, a monthly fee for the services performed and the facilities furnished at an annual rate of the Portfolio's average daily net assets as follows: 0.64% up to $1 billion; 0.61% from $1 billion to $3 billion; and 0.60% in excess of $3 billion. During the six-month period ended June 30, 2021, the effective management fee rate was 0.64%.
During the six-month period ended June 30, 2021, New York Life Investments earned fees from the Portfolio in the amount of $3,473,295 and paid the Subadvisor in the amount of $1,367,689.
JPMorgan provides sub-administration and sub-accounting services to the Portfolio pursuant to an agreement with New York Life Investments. These services include calculating the daily NAVs of the Portfolio, maintaining the general ledger and sub-ledger accounts for the calculation of the Portfolio's NAVs, and assisting New York Life Investments in conducting various aspects of the Portfolio's administrative operations. For providing these services to the Portfolio, JPMorgan is compensated by New York Life Investments.
Prior to February 22, 2021, these services were provided by State Street.
Pursuant to an agreement between the Fund and New York Life Investments, New York Life Investments is responsible for providing or procuring certain regulatory reporting services for the Portfolio. The Portfolio will reimburse New York Life Investments for the actual costs incurred by New York Life Investments in connection with providing or procuring these services for the Portfolio.
(B) Distribution and Service Fees. The Fund, on behalf of the Portfolio, has entered into a distribution agreement with NYLIFE Distributors LLC (the “Distributor”), an affiliate of New York Life Investments. The Portfolio has adopted a distribution plan (the “Plan”) in accordance with the provisions of Rule 12b-1 under the 1940 Act. Under the Plan, the Distributor has agreed to provide, through its affiliates or independent third parties, various distribution-related, shareholder and administrative support services to the Service Class shareholders. For its services, the Distributor is entitled to a combined distribution and service
Notes to Financial Statements (Unaudited) (continued)
fee accrued daily and paid monthly at an annual rate of 0.25% of the average daily net assets attributable to the Service Class shares of the Portfolio.
(C) Investments in Affiliates (in 000’s). During the six-month period ended June 30, 2021, purchases and sales transactions, income earned from investments and shares held of investment companies managed by New York Life Investments or its affiliates were as follows:
| Affiliated Investment Companies | Value,
Beginning
of Period | Purchases
at Cost | Proceeds
from
Sales | Net
Realized
Gain/(Loss)
on Sales | Change in
Unrealized
Appreciation/
(Depreciation) | Value,
End of
Period | Dividend
Income | Other
Distributions | Shares
End of
Period |
| MainStay U.S. Government Liquidity Fund | $ 19,834 | $ 149,870 | $ (159,102) | $ — | $ — | $ 10,602 | $ 1 | $ — | 10,602 |
Note 4-Federal Income Tax
As of June 30, 2021, the cost and unrealized appreciation (depreciation) of the Portfolio’s investment portfolio, including applicable derivative contracts and other financial instruments, as determined on a federal income tax basis, were as follows:
| | Federal Tax
Cost | Gross
Unrealized
Appreciation | Gross
Unrealized
(Depreciation) | Net
Unrealized
Appreciation/
(Depreciation) |
| Investments in Securities | $1,007,655,850 | $77,546,377 | $(9,391,119) | $68,155,258 |
During the year ended December 31, 2020, the tax character of distributions paid as reflected in the Statements of Changes in Net Assets was as follows:
| | 2020 |
| Distributions paid from: | |
| Ordinary Income | $33,504,758 |
| Long-Term Capital Gains | 52,406,371 |
| Total | $85,911,129 |
Note 5–Custodian
JPMorgan is the custodian of cash and securities held by the Portfolio. Custodial fees are charged to the Portfolio based on the Portfolio's net assets and/or the market value of securities held by the Portfolio and the number of certain transactions incurred by the Portfolio.
Prior to February 22, 2021, these services were provided by State Street. The services provided by State Street were a direct expense of the Portfolio and are included in the Statement of Operations as Custodian fees which totaled $4,329 for the period January 1, 2021 through February 21, 2021.
Note 6–Line of Credit
The Portfolio and certain other funds managed by New York Life Investments maintain a line of credit with a syndicate of banks in order to secure a source of funds for temporary purposes to meet unanticipated or excessive redemption requests.
Effective July 27, 2021, under the credit agreement (the “Credit Agreement”), the aggregate commitment amount is $600,000,000 with an additional uncommitted amount of $100,000,000. The commitment fee is an annual rate of 0.15% of the average commitment amount payable quarterly, regardless of usage, to JPMorgan, who serves as the agent to the syndicate. The commitment fee is allocated among the Portfolio and certain other funds managed by New York Life Investments based upon their respective net assets and other factors. Interest on any revolving credit loan is charged based upon the Federal Funds Rate or the one-month London Interbank Offered Rate ("LIBOR"), whichever is higher. The Credit Agreement expires on July 26, 2022, although the Portfolio, certain other funds managed by New York Life Investments and the syndicate of banks may renew the Credit Agreement for an additional year on the same or different terms or enter into a credit agreement with a different syndicate of banks. Prior to July 27, 2021, the aggregate commitment amount and the commitment fee were the same as those under the current Credit Agreement. During the six-month period ended June 30, 2021, there were no borrowings made or outstanding with respect to the Portfolio under the Credit Agreement.
Note 7–Interfund Lending Program
Pursuant to an exemptive order issued by the SEC, the Portfolio, along with certain other funds managed by New York Life Investments, may participate in an interfund lending program. The interfund lending program provides an alternative credit facility that permits the Portfolio and certain other funds managed by New York Life Investments to lend or borrow money for temporary purposes directly to or from one another, subject to the conditions of the exemptive order. During the six-month period ended June 30, 2021, there were no interfund loans made or outstanding with respect to the Portfolio.
Note 8–Purchases and Sales of Securities (in 000’s)
During the six-month period ended June 30, 2021, purchases and sales of securities, other than short-term securities, were $234,454 and $250,282, respectively.
The Portfolio may purchase securities from or sell securities to other portfolios managed by the Subadvisor. These interportfolio transactions are primarily used for cash management purposes and are made
| 20 | MainStay VP Fidelity Institutional AM® Utilities Portfolio |
pursuant to Rule 17a-7 under the 1940 Act. The Rule 17a-7 transactions during the six-month period ended June 30, 2021, were as follows:
Purchases
(000's) | Sales
(000's) | Realized
Gain / (Loss)
(000's) |
| $11,034 | $17,223 | $6,803 |
Note 9–Capital Share Transactions
Transactions in capital shares for the six-month period ended June 30, 2021 and the year ended December 31, 2020, were as follows:
| Initial Class | Shares | Amount |
| Period ended June 30, 2021: | | |
| Shares sold | 3,456,885 | $ 43,409,398 |
| Shares redeemed | (1,403,060) | (18,057,207) |
| Net increase (decrease) | 2,053,825 | $ 25,352,191 |
| Year ended December 31, 2020: | | |
| Shares sold | 3,663,908 | $ 43,908,398 |
| Shares issued to shareholders in reinvestment of distributions | 771,028 | 9,132,357 |
| Shares redeemed | (661,711) | (7,926,284) |
| Net increase (decrease) | 3,773,225 | $ 45,114,471 |
| |
| Service Class | Shares | Amount |
| Period ended June 30, 2021: | | |
| Shares sold | 692,985 | $ 8,537,164 |
| Shares redeemed | (5,452,639) | (68,540,835) |
| Net increase (decrease) | (4,759,654) | $ (60,003,671) |
| Year ended December 31, 2020: | | |
| Shares sold | 4,130,475 | $ 49,437,906 |
| Shares issued to shareholders in reinvestment of distributions | 6,508,661 | 76,778,772 |
| Shares redeemed | (16,563,106) | (199,972,359) |
| Net increase (decrease) | (5,923,970) | $ (73,755,681) |
Note 10–Other Matters
An outbreak of COVID-19, first detected in December 2019, has developed into a global pandemic and has resulted in travel restrictions, closure of international borders, certain businesses and securities markets, restrictions on securities trading activities, prolonged quarantines, supply chain disruptions, and lower consumer demand, as well as general concern and uncertainty. The continued impact of COVID-19 and related new variants is uncertain and could further adversely affect the global economy, national economies, individual issuers and capital markets in unforeseeable ways and result in a substantial and extended economic downturn. Developments that disrupt global economies and financial markets, such as COVID-19, may magnify factors that affect the Portfolio's performance.
Note 11–Subsequent Events
In connection with the preparation of the financial statements of the Portfolio as of and for the six-month period ended June 30, 2021, events and transactions subsequent to June 30, 2021, through the date the financial statements were issued have been evaluated by the Manager for possible adjustment and/or disclosure. No subsequent events requiring financial statement adjustment or disclosure have been identified.
Discussion of the Operation and Effectiveness of the Portfolio's Liquidity Risk Management Program (Unaudited)
In compliance with Rule 22e-4 under the Investment Company Act of 1940, as amended (the “Liquidity Rule”), the Portfolio has adopted and implemented a liquidity risk management program (the “Program”), which New York Life Investment Management LLC believes is reasonably designed to assess and manage the Portfolio's liquidity risk (the risk that the Portfolio could not meet requests to redeem shares issued by the Portfolio without significant dilution of remaining investors’ interests in the Portfolio). The Board of Trustees of MainStay VP Funds Trust (the "Board") designated New York Life Investment Management LLC as administrator of the Program (the “Administrator”). The Administrator has established a Liquidity Risk Management Committee to assist the Administrator in the implementation and day-to-day administration of the Program and to otherwise support the Administrator in fulfilling its responsibilities under the Program.
At a meeting of the Board held on March 8, 2021, the Administrator provided the Board with a written report addressing the Program’s operation and assessing its adequacy and effectiveness of implementation for the period from January 1, 2020 through December 31, 2020 (the "Review Period"), as required under the Liquidity Rule. The report noted that the Administrator concluded that (i) the Program operated effectively to assess and manage the Portfolio's liquidity risk, (ii) the Program has been adequately and effectively implemented to monitor and, as applicable, respond to the Portfolio's liquidity developments and (iii) the Portfolio's investment strategy continues to be appropriate for an open-end fund. In addition, the report discussed notable events that impacted liquidity risk during the Review Period, including the COVID-19 pandemic and the resulting economic shutdown.
In accordance with the Program, the Portfolio's liquidity risk is assessed no less frequently than annually taking into consideration certain factors, as applicable, such as (i) investment strategy and liquidity of portfolio investments, (ii) short-term and long-term cash flow projections and (iii) holdings of cash and cash equivalents, as well as borrowing arrangements and other funding sources. Certain factors are considered under both normal and reasonably foreseeable stressed conditions.
Each Portfolio portfolio investment is classified into one of four liquidity categories. The classification is based on a determination of the number of days it is reasonably expected to take to convert the investment into cash, or sell or dispose of the investment, in current market conditions without significantly changing the market value of the investment. The Administrator has delegated liquidity classification determinations to the Portfolio’s subadvisor, subject to appropriate oversight by the Administrator, and classification determinations are made by taking into account the Portfolio's reasonably anticipated trade size, various market, trading and investment-specific considerations, as well as market depth, and, in certain cases, third-party vendor data.
The Liquidity Rule requires portfolios that do not primarily hold assets that are highly liquid investments to adopt a minimum amount of net assets that must be invested in highly liquid investments that are assets (an “HLIM”). In addition, the Liquidity Rule limits a portfolio's investments in illiquid investments. Specifically, the Liquidity Rule prohibits acquisition of illiquid investments if doing so would result in a portfolio holding more than 15% of its net assets in illiquid investments that are assets. The Program includes provisions reasonably designed to determine, periodically review and comply with the HLIM requirement, as applicable, and to comply with the 15% limit on illiquid investments.
There can be no assurance that the Program will achieve its objectives under all circumstances in the future. Please refer to the Portfolio's prospectus for more information regarding the Portfolio's exposure to liquidity risk and other risks to which it may be subject.
| 22 | MainStay VP Fidelity Institutional AM® Utilities Portfolio |
Proxy Voting Record
The Portfolio is required to file with the SEC its proxy voting records for the 12-month period ending June 30 on Form N-PX. The Portfolio's most recent Form N-PX or proxy voting record is available free of charge upon request (i) by calling 800-598-2019; (ii) by visiting New York Life Investments’ website at https://www.nylinvestments.com/mainstay/
products-and-performance/mainstay-vp-funds-trust; or (iii) by visiting the SEC’s website at www.sec.gov.
Shareholder Reports and Quarterly Portfolio Disclosure
The Portfolio is required to file its complete schedule of portfolio holdings with the SEC 60 days after its first and third fiscal quarter on Form N-PORT. The Portfolio's holdings report is available free of charge upon request by calling 800-598-2019 or by visiting the SEC’s website at www.sec.gov.
This page intentionally left blank
This page intentionally left blank.
This page intentionally left blank.
MainStay VP Portfolios
MainStay VP offers a wide range of Portfolios. The full array of MainStay VP offerings is listed here, with information about the manager, subadvisors, legal counsel, and independent registered public accounting firm.
Equity
MainStay VP Candriam Emerging Markets Equity Portfolio
MainStay VP Epoch U.S. Equity Yield Portfolio
MainStay VP Fidelity Institutional AM® Utilities Portfolio†
MainStay VP MacKay International Equity Portfolio
MainStay VP MacKay S&P 500 Index Portfolio
MainStay VP Natural Resources Portfolio
MainStay VP Small Cap Growth Portfolio
MainStay VP T. Rowe Price Equity Income Portfolio
MainStay VP Wellington Growth Portfolio
MainStay VP Wellington Mid Cap Portfolio
MainStay VP Wellington Small Cap Portfolio
MainStay VP Wellington U.S. Equity Portfolio
MainStay VP Winslow Large Cap Growth Portfolio
Mixed Asset
MainStay VP Balanced Portfolio
MainStay VP Income Builder Portfolio
MainStay VP Janus Henderson Balanced Portfolio
MainStay VP MacKay Convertible Portfolio
Income
MainStay VP Bond Portfolio
MainStay VP Floating Rate Portfolio
MainStay VP Indexed Bond Portfolio
MainStay VP MacKay Government Portfolio
MainStay VP MacKay High Yield Corporate Bond Portfolio
MainStay VP MacKay Strategic Bond Portfolio
MainStay VP PIMCO Real Return Portfolio
Money Market
MainStay VP U.S. Government Money Market Portfolio
Alternative
MainStay VP CBRE Global Infrastructure Portfolio
MainStay VP IQ Hedge Multi-Strategy Portfolio
Asset Allocation
MainStay VP Conservative Allocation Portfolio
MainStay VP Equity Allocation Portfolio
MainStay VP Growth Allocation Portfolio
MainStay VP Moderate Allocation Portfolio
Manager
New York Life Investment Management LLC
New York, New York
Subadvisors
Brown Advisory LLC
Baltimore, Maryland
Candriam Belgium S.A.*
Brussels, Belgium
CBRE Clarion Securities LLC
Radnor, Pennsylvania
Epoch Investment Partners, Inc.
New York, New York
FIAM LLC
Smithfield, Rhode Island
IndexIQ Advisors LLC*
New York, New York
Janus Capital Management LLC
Denver, Colorado
MacKay Shields LLC*
New York, New York
Mellon Investments Corporation
Boston, Massachusetts
NYL Investors LLC*
New York, New York
Pacific Investment Management Company LLC
Newport Beach, California
Segall Bryant & Hamill, LLC
Chicago, Illinois
T. Rowe Price Associates, Inc.
Baltimore, Maryland
Wellington Management Company LLP
Boston, Massachusetts
Winslow Capital Management, LLC
Minneapolis, Minnesota
Legal Counsel
Dechert LLP
Washington, District of Columbia
Independent Registered Public Accounting Firm
PricewaterhouseCoopers LLP
New York, New York
Distributor
NYLIFE Distributors LLC*
Jersey City, New Jersey
Custodian
JPMorgan Chase Bank, N.A.
New York, New York
Some Portfolios may not be available in all products.
† Fidelity Institutional AM is a registered trade mark of FMR LLC. Used with permission.
* An affiliate of New York Life Investment Management LLC
Not part of the Semiannual Report
2021 Semiannual Report
This report is for the general information of New York Life Variable Annuities and NYLIAC Variable Universal Life Insurance Products policyowners. It must be preceded or accompanied by the appropriate product(s) and funds prospectuses if it is given to anyone who is not an owner of a New York Life variable annuity policy or a NYLIAC Variable Universal Life Insurance Product. This report does not offer for sale or solicit orders to purchase securities.
The performance data quoted in this report represents past performance. Past performance is no guarantee of future results. Due to market volatility and other factors, current performance may be lower or higher than the figures shown. The most recent month-end performance summary for your variable annuity or variable life policy is available by calling 800-598-2019 and is updated periodically on newyorklife.com.
The New York Life Variable Annuities and NYLIAC Variable Universal Life Insurance Products are issued by New York Life Insurance and Annuity Corporation (a Delaware Corporation) and distributed by NYLIFE Distributors LLC (Member FINRA/SIPC).
New York Life Insurance Company
New York Life Insurance and Annuity
Corporation (NYLIAC) (A Delaware Corporation)
51 Madison Avenue, Room 551
New York, NY 10010
newyorklife.com
nylinvestments.com
NYLIFE Distributors LLC, 30 Hudson Street, Jersey City, NJ 07302
New York Life Investment Management LLC is the investment manager to the MainStay VP Funds Trust
©2021 by NYLIFE Distributors LLC. All rights reserved.
You may obtain copies of the Prospectus and the Statement of Additional Information free of charge, upon request, by calling toll-free 800-598-2019 or writing to New York Life Insurance and Annuity Corporation, 51 Madison Avenue, New York, NY 10010.
| Not FDIC Insured | No Bank Guarantee | May Lose Value |
(NYLIAC) NI526
MainStay VP Wellington Small Cap Portfolio
(formerly known as MainStay VP MacKay Small Cap Core Portfolio)
Message from the President and Semiannual Report
Unaudited | June 30, 2021
Sign up for e-delivery of your shareholder reports. For full details on e-delivery, including who can participate and what you can receive via e-delivery,
please log in to newyorklifeinvestments.com/accounts.
| Not FDIC/NCUA Insured | Not a Deposit | May Lose Value | No Bank Guarantee | Not Insured by Any Government Agency |
This page intentionally left blank
Message from the President
The COVID-19 pandemic continued to afflict our personal lives and broad segments of the U.S. and global economy throughout the six-month reporting period ended June 30, 2021. However, with the deployment of multiple vaccines around the world, including three highly effective versions approved for emergency use in the United States, investors began to turn their attention toward the gradual reopening of the economy and the shape the “new normal” would take.
The first half of the reporting period saw increasing inflationary concerns as fiscal stimulus business reopenings drove accelerating economic growth, rising commodity prices and increased consumer spending. However, the U.S. Federal Reserve noted that price increases were likely to prove temporary and made clear their intention to remain accommodative for the foreseeable future. Accordingly, after moving higher in the first quarter of 2021, interest rates declined in the second quarter.
In response to the uncertain inflation outlook, equity market leadership shifted from value in the first quarter of the year to growth in the second quarter. Nevertheless, investor sentiment remained buoyant throughout the reporting period, with all eleven sectors in the S&P 500® Index, a widely regarded benchmark of market performance, producing positive returns. Energy led the market’s rise fueled by rapidly increasing oil and gas prices, followed by financials and real estate, which benefited from rising interest rates and the economic reopening, respectively. Communication services produced the slowest growth, followed by the traditionally defensive utilities and consumer staples
sectors. In the fixed income market, lower-credit-quality issues tended to outperform their higher-grade counterparts, with high-yield corporate bonds generating the strongest performance. Among securitized products, commercial mortgage-backed securities generally produced the strongest returns, followed by mortgage-backed securities and asset-backed securities, while Treasury securities lagged.
Despite the tremendous progress we’ve seen so far this year, the United States and the world continue to face significant pandemic-related challenges. Newer, more contagious variants of COVID-19 threaten the return of restrictions and lockdowns that could stall the economic recovery. At the same time, supply chain shortages have led to rising prices on everything from laptops to autos, stoking fears of uncontrolled inflation despite reassurance from the U.S. Federal Reserve. At New York Life Investments, we recognize that the shape that the “new normal” eventually takes may differ from our expectations. You can depend on us to keep a sharp watch for the unexpected, and to continue to help you find your way through this rapidly evolving investment landscape.
Sincerely,
Kirk C. Lehneis
President
The opinions expressed are as of the date of this report and are subject to change. There is no guarantee that any forecast made will come to pass. This material does not constitute investment advice and is not intended as an endorsement of any specific investment. Past performance is no guarantee of future results.
Not part of the Semiannual Report
Investors should refer to the Portfolio’s Summary Prospectus and/or Prospectus and consider the Portfolio’s investment objectives, strategies, risks, charges and expenses carefully before investing. The Summary Prospectus and/or Prospectus contain this and other information about the Portfolio. You may obtain copies of the Portfolio’s Summary Prospectus and/or the Prospectus and the Statement of Additional Information free of charge, upon request, by calling toll-free 800-598-2019, by writing to New York Life Insurance and Annuity Corporation, 51 Madison Avenue, Room 251, New York, New York 10010 or by sending an email to MainStayShareholdersServices@nylim.com. These documents are also available at nylinvestments.com/vpdocuments. Please read the Portfolio's Summary Prospectus and/or Prospectus carefully before investing. MainStay VP Funds Trust portfolios are separate account options which are purchased through a variable insurance or variable annuity contract.
Investment and Performance Comparison (Unaudited)
Performance data quoted represents past performance. Past performance is no guarantee of future results. Because of market volatility and other factors, current performance may be lower or higher than the figures shown. Investment return and principal value will fluctuate, and as a result, when shares are redeemed, they may be worth more or less than their original cost. The performance table and graph do not reflect any deduction of sales charges, mortality and expense charges, contract charges or administrative charges. Please refer to the Performance Summary appropriate for your policy. For performance information current to the most recent month-end, please call 800-598-2019 or visit www.newyorklife.com.
Performance figures may reflect certain fee waivers and/or expense limitations, without which total returns may have been different. For information on current fee waivers and/or expense limitations (if any), please refer to the Notes to Financial Statements.
| Average Annual Total Returns for the Period-Ended June 30, 2021 |
| Class | Inception
Date1, 2 | Six
Months | One
Year | Five
Years | Since
Inception | Gross
Expense
Ratio3 |
| Initial Class Shares | 5/2/2016 | 16.83% | 55.80% | 11.75% | 11.42% | 0.86% |
| Service Class Shares | 5/2/2016 | 16.68 | 55.41 | 11.47 | 11.15 | 1.11 |
| 1. | Effective January 1, 2018 due to an organizational restructuring whereby all investment personnel of Cornerstone Capital Management Holdings LLC, a former subadvisor, transitioned to MacKay Shields LLC, a former subadvisor. The past performance in the chart and table prior to that date reflects the Portfolio’s prior subadvisor and principal investment strategies. |
| 2. | Effective May 1, 2021, the Portfolio replaced its subadvisor and modified its principal investment strategies. The past performance in the graph and table prior to that date reflects the Portfolio's prior subadvisor and principal investment strategies. |
| 3. | The gross expense ratios presented reflect the Portfolio’s “Total Annual Portfolio Operating Expenses” from the most recent Prospectus, as supplemented, and may differ from other expense ratios disclosed in this report. |
| Benchmark Performance | Six
Months | One
Year | Five
Years | Since
Inception |
| Russell 2000® Index1 | 17.54% | 62.03% | 16.47% | 16.20% |
| Morningstar Small Blend Category Average2 | 20.14 | 60.17 | 13.54 | 13.14 |
| 1. | The Russell 2000® Index is the Portfolio’s primary benchmark. The Russell 2000® Index measures the performance of the small-cap segment of the U.S. equity universe. It is a subset of the Russell 3000® Index and includes approximately 2,000 of the smallest securities based on a combination of their market cap and current index membership. An investment cannot be made directly in an index. |
| 2. | The Morningstar Small Blend Category Average is representative of funds that favor U.S. firms at the smaller end of the market-capitalization range. Some aim to own an array of value and growth stocks while others employ a discipline that leads to holdings with valuations and growth rates close to the small-cap averages. Stocks in the bottom 10% of the capitalization of the U.S. equity market are defined as small cap. The blend style is assigned to portfolios where neither growth nor value characteristics predominate. Results are based on average total returns of similar funds with all dividends and capital gain distributions reinvested. |
Cost in Dollars of a $1,000 Investment in MainStay VP Wellington Small Cap Portfolio (Unaudited)
The example below is intended to describe the fees and expenses borne by shareholders during the six-month period from January 1, 2021 to June 30, 2021, and the impact of those costs on your investment.
Example
As a shareholder of the Portfolio you incur two types of costs: (1) transaction costs, including exchange fees and sales charges (loads) on purchases (as applicable), and (2) ongoing costs, including management fees, distribution and/or service (12b-1) fees, and other Portfolio expenses (as applicable). This example is intended to help you understand your ongoing costs (in dollars) of investing in the Portfolio and to compare these costs with the ongoing costs of investing in other mutual funds. The example is based on an investment of $1,000 made at the beginning of the six-month period and held for the entire period from January 1, 2021 to June 30, 2021. Shares are only sold in connection with variable life and annuity contracts and the example does not reflect any contract level or transactional fees or expenses. If these costs had been included, your costs would have been higher.
This example illustrates your Portfolio’s ongoing costs in two ways:
Actual Expenses
The second and third data columns in the table below provide information about actual account values and actual expenses. You may use the information in these columns, together with the amount you invested, to estimate the expenses that you paid during the six months ended June
30, 2021. Simply divide your account value by $1,000 (for example, an $8,600 account value divided by $1,000 = 8.6), then multiply the result by the number under the heading entitled “Expenses Paid During Period” to estimate the expenses you paid on your account during this period.
Hypothetical Example for Comparison Purposes
The fourth and fifth data columns in the table below provide information about hypothetical account values and hypothetical expenses based on the Portfolio’s actual expense ratio and an assumed rate of return of 5% per year before expenses, which is not the Portfolio’s actual return. The hypothetical account values and expenses may not be used to estimate the actual ending account balances or expenses you paid for the six-month period shown. You may use this information to compare the ongoing costs of investing in the Portfolio with the ongoing costs of investing in other mutual funds. To do so, compare this 5% hypothetical example with the 5% hypothetical examples that appear in the shareholder reports of the other mutual funds.
Please note that the expenses shown in the table are meant to highlight your ongoing costs only and do not reflect any transactional costs, such as exchange fees or sales charges (loads). Therefore, the fourth and fifth data columns of the table are useful in comparing ongoing costs only and will not help you determine the relative total costs of owning different funds. In addition, if these transactional costs were included, your costs would have been higher.
| Share Class | Beginning
Account
Value
1/1/21 | Ending Account
Value (Based
on Actual
Returns and
Expenses)
6/30/21 | Expenses
Paid
During
Period1 | Ending Account
Value (Based
on Hypothetical
5% Annualized
Return and
Actual Expenses)
6/30/21 | Expenses
Paid
During
Period1 | Net Expense
Ratio
During
Period2 |
| Initial Class Shares | $1,000.00 | $1,168.30 | $3.98 | $1,021.13 | $3.71 | 0.74% |
| Service Class Shares | $1,000.00 | $1,166.80 | $5.32 | $1,019.89 | $4.96 | 0.99% |
| 1. | Expenses are equal to the Portfolio’s annualized expense ratio of each class multiplied by the average account value over the period, divided by 365 and multiplied by 181 (to reflect the six-month period). The table above represents the actual expenses incurred during the six-month period. In addition to the fees and expenses which the Portfolio bears directly, it also indirectly bears a pro rata share of the fees and expenses of the underlying funds in which it invests. Such indirect expenses are not included in the above-reported expense figures. |
| 2. | Expenses are equal to the Portfolio's annualized expense ratio to reflect the six-month period. |
| 6 | MainStay VP Wellington Small Cap Portfolio |
Industry Composition as of June 30, 2021 (Unaudited)
| Banks | 9.0% |
| Software | 8.1 |
| Biotechnology | 5.2 |
| Semiconductors & Semiconductor Equipment | 4.4 |
| Health Care Equipment & Supplies | 4.3 |
| Equity Real Estate Investment Trusts | 3.9 |
| Machinery | 3.5 |
| Commercial Services & Supplies | 3.1 |
| Health Care Providers & Services | 2.6 |
| Thrifts & Mortgage Finance | 2.5 |
| Electronic Equipment, Instruments & Components | 2.4 |
| IT Services | 2.2 |
| Diversified Consumer Services | 2.2 |
| Textiles, Apparel & Luxury Goods | 2.2 |
| Media | 2.2 |
| Consumer Finance | 2.1 |
| Hotels, Restaurants & Leisure | 2.1 |
| Professional Services | 2.0 |
| Exchange–Traded Funds | 1.9 |
| Building Products | 1.8 |
| Health Care Technology | 1.8 |
| Household Durables | 1.6 |
| Electrical Equipment | 1.5 |
| Internet & Direct Marketing Retail | 1.5 |
| Capital Markets | 1.5 |
| Specialty Retail | 1.5 |
| Food Products | 1.5 |
| Metals & Mining | 1.4 |
| Insurance | 1.3 |
| Leisure Products | 1.3% |
| Personal Products | 1.3 |
| Trading Companies & Distributors | 1.2 |
| Chemicals | 1.2 |
| Gas Utilities | 1.1 |
| Auto Components | 1.0 |
| Energy Equipment & Services | 1.0 |
| Life Sciences Tools & Services | 0.9 |
| Construction & Engineering | 0.9 |
| Multiline Retail | 0.7 |
| Diversified Financial Services | 0.6 |
| Paper & Forest Products | 0.6 |
| Communications Equipment | 0.6 |
| Marine | 0.5 |
| Entertainment | 0.5 |
| Air Freight & Logistics | 0.5 |
| Beverages | 0.5 |
| Electric Utilities | 0.5 |
| Real Estate Management & Development | 0.5 |
| Household Products | 0.5 |
| Aerospace & Defense | 0.4 |
| Pharmaceuticals | 0.4 |
| Diversified Telecommunication Services | 0.3 |
| Mortgage Real Estate Investment Trusts | 0.2 |
| Short–Term Investments | 4.7 |
| Other Assets, Less Liabilities | –3.2 |
| | 100.0% |
See Portfolio of Investments beginning on page 10 for specific holdings within these categories. The Portfolio's holdings are subject to change.
Top Ten Holdings as of June 30, 2021 (excluding short-term investments) (Unaudited)
| 1. | Tower Semiconductor Ltd. |
| 2. | iShares Russell 2000 ETF |
| 3. | Cardlytics, Inc. |
| 4. | Hostess Brands, Inc. |
| 5. | Skyline Champion Corp. |
| 6. | EnerSys |
| 7. | PRA Group, Inc. |
| 8. | Federal Agricultural Mortgage Corp., Class C |
| 9. | Rapid7, Inc. |
| 10. | Varonis Systems, Inc. |
Portfolio Management Discussion and Analysis (Unaudited)
Answers to the questions reflect the views of portfolio managers Migene Kim, CFA, and Mona Patni of MacKay Shields LLC (“MacKay Shields”), the Portfolio’s former Subadvisor, and Gregg R. Thomas and Roberto J. Isch of Wellington Management Company LLP (“Wellington”).
How did MainStay VP Wellington Small Cap Portfolio perform relative to its benchmark and peers during the six months ended June 30, 2021?
For the six months ended June 30, 2021, MainStay VP Wellington Small Cap Portfolio returned 16.83% for Initial Class shares and 16.68% for Service Class shares. Over the same period, both share classes underperformed the 17.54% return of the Russell 2000® Index (“the Index”), which is the Portfolio’s benchmark, and the 20.14% return of the Morningstar Small Blend Category Average.1
Were there any changes to the Fund during the reporting period?
At meetings held on January 21, January 25 and February 3, 2021, the Board of Trustees of MainStay VP Funds Trust considered and approved, among other related proposals: (i) appointing Wellington Management Company LLP as the Portfolio’s subadvisor, and the related subadvisory agreement; (ii) changing the Portfolio’s name; and (iii) modifying the Portfolio’s principal investment strategies and investment process. For more information on these and other changes refer to the supplement dated February 5, 2021.
In the process of implementing the new principal investment strategies and investment process, the Portfolio may have experienced a high level of portfolio turnover. Also, during this transition period, the Portfolio may not have been pursuing its investment objective or may not have been managed consistent with its investment strategies as stated in the Prospectus. This may have impacted the Portfolio’s performance.
What factors affected the Portfolio’s relative performance during the reporting period?
MacKay Shields
During the time MacKay Shields managed the Portfolio, the Portfolio outperformed the Index helped by both allocation and strong stock selection. In terms of stock-selection model efficacy, the combination of signals used by the Portfolio’s quantitative stock selection model was rewarded primarily by valuation measures.
Wellington
During the time Wellington managed the Portfolio, the Portfolio underperformed the Index primarily due to security selection. Sector allocation, a result of our bottom-up stock selection
process, also weighed on relative results.
Which sectors were the strongest positive contributors to the Portfolio’s relative performance, and which sectors were particularly weak?
MacKay Shields
During the time MacKay Shields managed the Portfolio, the strongest positive contributors to the Portfolio’s performance relative to the Index were the information technology, financials and industrials sectors. (Contributions take weightings and total returns into account.) During the same period, the most significant detractors from relative performance were the materials, energy and real estate sectors.
Wellington
During the time Wellington managed the Portfolio, security selection in the information technology sector contributed positively to performance relative to the Index, followed by utilities. The sectors that detracted most significantly from relative performance were consumer discretionary, followed by health care and communication services, with consumer discretionary and health care posting negative absolute returns. For all three of these sectors, weak security selection was primarily responsible for the Portfolio’s relative underperformance.
During the reporting period, which individual stocks made the strongest positive contributions to the Portfolio’s absolute performance and which stocks detracted the most?
MacKay Shields
The stocks providing the strongest positive contributions to the Portfolio’s absolute performance during the time MacKay Shields managed the Portfolio included shares in computer game and electronic entertainment retailer GameStop, biotechnology developer Novavax, and electrical components & equipment maker Atkore. During the same period, the most significant detractors from absolute performance were shares in biotechnology firm Amicus Therapeutics, residential solar equipment company Sunrun and biotechnology firm Editas Medicine.
Wellington
The strongest positive contributors to absolute performance during the time Wellington managed the Portfolio were holdings in engineering company Lydall, land drilling contractor Nabors Industries, and enterprise software provider Cloudera. Shares of
| 1. | See page 5 for more information on benchmark and peer group returns. |
| 8 | MainStay VP Wellington Small Cap Portfolio |
Lydall soared as the company received an unexpected buyout offer from competitor Unifax. Shares of Nabors Industries rose in June 2021 after the company distributed warrants to its shareholders to purchase common shares. The share price of Cloudera spiked after the company announced it had arranged a deal to be bought out by two other firms in a private, all-cash offer.
The most significant detractors from the Portfolio’s absolute performance were holdings in digital media and promotions company Quotient Technology, luxury consignment retailer The RealReal, and pharmaceutical company ChemoCentryx. Shares of Quotient Technology declined after the company reported a loss for the first quarter of 2021, missing consensus estimates and reporting a decline in gross margins compared to the prior year. Shares of The RealReal fell after the company reported its financial results for the first quarter. While revenue rose year-over-year and exceeded estimates, the company posted a quarterly loss that missed consensus expectations. Shares of ChemoCentryx fell sharply after the U.S. Food and Drug Administration (FDA) Arthritis Advisory Committee split on its recommendation for the company’s new drug application for avacopan, a candidate for the treatment of anti-neutrophil cytoplasmic autoantibody-associated vasculitis. While the panel narrowly supported a positive recommendation on safety and risk-benefit grounds, panelists were evenly divided on whether the drug’s efficacy data supported approval. The close vote prompted concern about the drug’s prospects before the FDA.
Did the Portfolio make any significant purchases or sales during the reporting period?
MacKay Shields
The Portfolio’s largest initial purchase during the time MacKay Shields managed the Portfolio was in telecommunications services provider Iridium Communications, while the largest increase in position size was in media company TEGNA. The Portfolio's largest full sale was its position in health care management firm HMS Holdings, while its most significantly decreased position size was in Editas Medicine.
Wellington
During the time Wellington managed the Portfolio, we eliminated the Portfolio’s positions in Lydall and Cloudera on strength. Additionally, we eliminated the Portfolio’s position in ChemoCentryx after the FDA advisory panel’s narrow decision on the company’s drug application for avacopan.
How did the Portfolio’s sector weightings change during the reporting period?
MacKay Shields
During the time MacKay Shields managed the Portfolio, the largest increases in sector exposures relative to the Index were in the communication services and information technology sectors. Conversely, the Portfolio's largest decreases in relative sector exposures were in the health care and real estate sectors.
Wellington
During the time Wellington managed the Portfolio, the most notable increases in absolute sector exposures were to financials and, to a lesser extent, information technology. Notable reductions in the Portfolio’s absolute sector exposures included health care and energy.
How was the Portfolio positioned at the end of the reporting period?
MacKay Shields
At the end of the period when MacKay Shields managed the Portfolio, the Portfolio held its largest overweight positions relative to the Index in the information technology and consumer discretionary sectors. As of the same date, the Portfolio’s most significantly underweight sector positions were in real estate and utilities.
Wellington
As of June 30, 2021, the Portfolio held its most overweight positions relative to the Index in the information technology and financials sectors, and its most underweight positions in health care and energy sectors.
The opinions expressed are those of the portfolio managers as of the date of this report and are subject to change. There is no guarantee that any forecasts will come to pass. This material does not constitute investment advice and is not intended as an endorsement of any specific investment.
Not all MainStay VP Portfolios and/or share classes are available under all policies.
Portfolio of Investments June 30, 2021† (Unaudited)
| | Shares | Value |
| Common Stocks 96.6% |
| Aerospace & Defense 0.4% |
| Curtiss-Wright Corp. | 17,931 | $ 2,129,486 |
| Air Freight & Logistics 0.5% |
| Hub Group, Inc., Class A (a) | 40,500 | 2,672,190 |
| Auto Components 1.0% |
| Dana, Inc. | 110,237 | 2,619,231 |
| Gentherm, Inc. (a) | 39,543 | 2,809,530 |
| | | 5,428,761 |
| Banks 9.0% |
| Allegiance Bancshares, Inc. | 42,563 | 1,636,122 |
| Ameris Bancorp | 37,320 | 1,889,512 |
| Bank OZK | 69,100 | 2,913,256 |
| Berkshire Hills Bancorp, Inc. | 110,574 | 3,030,833 |
| Cadence Bancorp | 139,700 | 2,916,936 |
| First Hawaiian, Inc. | 80,500 | 2,281,370 |
| First Interstate BancSystem, Inc., Class A | 62,292 | 2,605,674 |
| First Midwest Bancorp, Inc. | 91,500 | 1,814,445 |
| FNB Corp. | 192,800 | 2,377,224 |
| Great Western Bancorp, Inc. | 83,300 | 2,731,407 |
| Home BancShares, Inc. | 113,500 | 2,801,180 |
| OFG Bancorp | 114,200 | 2,526,104 |
| Pacific Premier Bancorp, Inc. | 68,134 | 2,881,387 |
| Sandy Spring Bancorp, Inc. | 68,241 | 3,011,475 |
| Sterling Bancorp | 101,880 | 2,525,605 |
| Umpqua Holdings Corp. | 144,184 | 2,660,195 |
| United Community Banks, Inc. | 66,000 | 2,112,660 |
| Veritex Holdings, Inc. | 68,000 | 2,407,880 |
| Western Alliance Bancorp | 18,195 | 1,689,406 |
| | | 46,812,671 |
| Beverages 0.5% |
| Boston Beer Co., Inc. (The), Class A (a) | 2,539 | 2,591,811 |
| Biotechnology 5.2% |
| Allakos, Inc. (a) | 7,560 | 645,397 |
| ALX Oncology Holdings, Inc. (a) | 13,700 | 749,116 |
| Amicus Therapeutics, Inc. (a) | 180,300 | 1,738,092 |
| Apellis Pharmaceuticals, Inc. (a) | 56,445 | 3,567,324 |
| Arena Pharmaceuticals, Inc. (a) | 44,200 | 3,014,440 |
| Ascendis Pharma A/S, ADR (a) | 9,023 | 1,186,976 |
| Celldex Therapeutics, Inc. (a) | 67,678 | 2,263,152 |
| Dicerna Pharmaceuticals, Inc. (a) | 63,015 | 2,351,720 |
| Kodiak Sciences, Inc. (a) | 14,990 | 1,394,070 |
| Kura Oncology, Inc. (a) | 51,429 | 1,072,295 |
| | Shares | Value |
| |
| Biotechnology (continued) |
| Myovant Sciences Ltd. (a)(b) | 130,916 | $ 2,980,957 |
| REVOLUTION Medicines, Inc. (a) | 25,933 | 823,113 |
| Rocket Pharmaceuticals, Inc. (a) | 13,000 | 575,770 |
| Sage Therapeutics, Inc. (a) | 31,124 | 1,768,155 |
| TCR2 Therapeutics, Inc. (a) | 67,861 | 1,113,599 |
| Turning Point Therapeutics, Inc. (a) | 14,544 | 1,134,723 |
| Y-mAbs Therapeutics, Inc. (a) | 28,700 | 970,060 |
| | | 27,348,959 |
| Building Products 1.8% |
| Builders FirstSource, Inc. (a) | 47,442 | 2,023,876 |
| Gibraltar Industries, Inc. (a) | 21,200 | 1,617,772 |
| Insteel Industries, Inc. | 94,389 | 3,034,606 |
| PGT Innovations, Inc. (a) | 120,428 | 2,797,543 |
| | | 9,473,797 |
| Capital Markets 1.5% |
| Greenhill & Co., Inc. | 148,761 | 2,314,721 |
| Hamilton Lane, Inc., Class A | 28,200 | 2,569,584 |
| Moelis & Co., Class A | 50,817 | 2,890,979 |
| | | 7,775,284 |
| Chemicals 1.2% |
| Livent Corp. (a) | 172,430 | 3,338,245 |
| Minerals Technologies, Inc. | 35,000 | 2,753,450 |
| | | 6,091,695 |
| Commercial Services & Supplies 3.1% |
| BrightView Holdings, Inc. (a) | 139,536 | 2,249,320 |
| CoreCivic, Inc. (a) | 172,196 | 1,802,892 |
| Deluxe Corp. | 78,365 | 3,743,496 |
| Herman Miller, Inc. | 70,841 | 3,339,445 |
| Interface, Inc. | 181,300 | 2,773,890 |
| Legalzoom.com, Inc. (a) | 2,300 | 87,055 |
| Loomis AB | 67,826 | 2,121,618 |
| US Ecology, Inc. (a) | 5,700 | 213,864 |
| | | 16,331,580 |
| Communications Equipment 0.6% |
| Plantronics, Inc. (a) | 69,634 | 2,905,827 |
| Construction & Engineering 0.9% |
| Badger Infrastructure Solutions Ltd. | 92,111 | 2,795,431 |
| Fluor Corp. (a) | 95,579 | 1,691,748 |
| | | 4,487,179 |
| Consumer Finance 2.1% |
| Enova International, Inc. (a) | 84,629 | 2,895,158 |
| Navient Corp. | 170,573 | 3,297,176 |
The notes to the financial statements are an integral part of, and should be read in conjunction with, the financial statements.
| 10 | MainStay VP Wellington Small Cap Portfolio |
| | Shares | Value |
| Common Stocks (continued) |
| Consumer Finance (continued) |
| PRA Group, Inc. (a) | 125,495 | $ 4,827,793 |
| | | 11,020,127 |
| Diversified Consumer Services 2.2% |
| 2U, Inc. (a) | 58,820 | 2,451,029 |
| Adtalem Global Education, Inc. (a) | 70,182 | 2,501,287 |
| Chegg, Inc. (a) | 44,768 | 3,720,669 |
| H&R Block, Inc. | 122,267 | 2,870,829 |
| | | 11,543,814 |
| Diversified Financial Services 0.6% |
| ECN Capital Corp. | 426,516 | 3,199,902 |
| Diversified Telecommunication Services 0.3% |
| Bandwidth, Inc., Class A (a) | 12,956 | 1,786,892 |
| Electric Utilities 0.5% |
| Portland General Electric Co. | 55,303 | 2,548,362 |
| Electrical Equipment 1.5% |
| EnerSys | 53,073 | 5,186,824 |
| nVent Electric plc | 84,464 | 2,638,656 |
| | | 7,825,480 |
| Electronic Equipment, Instruments & Components 2.4% |
| FARO Technologies, Inc. (a) | 35,088 | 2,728,794 |
| II-VI, Inc. (a) | 45,040 | 3,269,454 |
| Knowles Corp. (a) | 131,632 | 2,598,416 |
| Novanta, Inc. (a) | 9,831 | 1,324,825 |
| PAR Technology Corp. (a)(b) | 39,500 | 2,762,630 |
| | | 12,684,119 |
| Energy Equipment & Services 1.0% |
| DMC Global, Inc. (a) | 33,500 | 1,883,035 |
| Nabors Industries Ltd. (a)(b) | 30,500 | 3,484,320 |
| | | 5,367,355 |
| Entertainment 0.5% |
| IMAX Corp. (a) | 127,100 | 2,732,650 |
| Equity Real Estate Investment Trusts 3.9% |
| Acadia Realty Trust | 151,022 | 3,316,443 |
| Empire State Realty Trust, Inc., Class A | 225,300 | 2,703,600 |
| Essential Properties Realty Trust, Inc. | 84,254 | 2,278,228 |
| Pebblebrook Hotel Trust | 116,100 | 2,734,155 |
| Piedmont Office Realty Trust, Inc., Class A | 143,000 | 2,641,210 |
| Ryman Hospitality Properties, Inc. (a) | 25,489 | 2,012,612 |
| | Shares | Value |
| |
| Equity Real Estate Investment Trusts (continued) |
| Uniti Group, Inc. | 244,900 | $ 2,593,491 |
| Xenia Hotels & Resorts, Inc. (a) | 98,562 | 1,846,066 |
| | | 20,125,805 |
| Food Products 1.5% |
| Calavo Growers, Inc. | 27,900 | 1,769,418 |
| Hostess Brands, Inc. (a) | 356,305 | 5,768,578 |
| | | 7,537,996 |
| Gas Utilities 1.1% |
| New Jersey Resources Corp. | 74,456 | 2,946,224 |
| South Jersey Industries, Inc. | 116,181 | 3,012,573 |
| | | 5,958,797 |
| Health Care Equipment & Supplies 4.3% |
| Avanos Medical, Inc. (a) | 56,400 | 2,051,268 |
| Envista Holdings Corp. (a) | 57,200 | 2,471,612 |
| Globus Medical, Inc., Class A (a) | 25,400 | 1,969,262 |
| Hill-Rom Holdings, Inc. | 16,829 | 1,911,606 |
| Integra LifeSciences Holdings Corp. (a) | 37,440 | 2,554,906 |
| Lantheus Holdings, Inc. (a) | 125,200 | 3,460,528 |
| NuVasive, Inc. (a) | 42,100 | 2,853,538 |
| Orthofix Medical, Inc. (a) | 60,700 | 2,434,677 |
| SI-BONE, Inc. (a) | 88,924 | 2,798,438 |
| | | 22,505,835 |
| Health Care Providers & Services 2.6% |
| Accolade, Inc. (a) | 49,604 | 2,693,993 |
| AMN Healthcare Services, Inc. (a) | 33,200 | 3,219,736 |
| LHC Group, Inc. (a) | 11,565 | 2,316,007 |
| Oak Street Health, Inc. (a) | 44,075 | 2,581,473 |
| Premier, Inc., Class A | 76,638 | 2,666,236 |
| | | 13,477,445 |
| Health Care Technology 1.8% |
| Health Catalyst, Inc. (a) | 43,781 | 2,430,283 |
| Multiplan Corp. (a)(b) | 198,100 | 1,885,912 |
| NextGen Healthcare, Inc. (a) | 158,514 | 2,629,747 |
| Omnicell, Inc. (a) | 15,819 | 2,395,788 |
| | | 9,341,730 |
| Hotels, Restaurants & Leisure 2.1% |
| Boyd Gaming Corp. (a) | 25,432 | 1,563,814 |
| Hilton Grand Vacations, Inc. (a) | 68,500 | 2,835,215 |
| Penn National Gaming, Inc. (a) | 13,600 | 1,040,264 |
| Planet Fitness, Inc., Class A (a) | 49,478 | 3,723,219 |
| Wingstop, Inc. | 11,730 | 1,849,000 |
| | | 11,011,512 |
The notes to the financial statements are an integral part of, and should be read in conjunction with, the financial statements.
11
Portfolio of Investments June 30, 2021† (Unaudited) (continued)
| | Shares | Value |
| Common Stocks (continued) |
| Household Durables 1.6% |
| Cavco Industries, Inc. (a) | 11,559 | $ 2,568,294 |
| Skyline Champion Corp. (a) | 104,210 | 5,554,393 |
| | | 8,122,687 |
| Household Products 0.5% |
| Energizer Holdings, Inc. | 55,188 | 2,371,980 |
| Insurance 1.3% |
| Lancashire Holdings Ltd. | 246,476 | 2,088,320 |
| ProAssurance Corp. | 116,225 | 2,644,119 |
| SiriusPoint Ltd. (a) | 214,891 | 2,163,952 |
| | | 6,896,391 |
| Internet & Direct Marketing Retail 1.5% |
| Porch Group, Inc. (a) | 74,500 | 1,440,830 |
| Quotient Technology, Inc. (a) | 265,548 | 2,870,574 |
| RealReal, Inc. (The) (a) | 75,656 | 1,494,962 |
| Shutterstock, Inc. | 20,200 | 1,983,034 |
| | | 7,789,400 |
| IT Services 2.2% |
| BM Technologies, Inc. (a) | 10,187 | 126,726 |
| CSG Systems International, Inc. | 45,740 | 2,158,013 |
| LiveRamp Holdings, Inc. (a) | 43,117 | 2,020,032 |
| Perficient, Inc. (a) | 42,504 | 3,418,172 |
| Repay Holdings Corp. (a) | 90,957 | 2,186,606 |
| Verra Mobility Corp. (a) | 116,000 | 1,782,920 |
| | | 11,692,469 |
| Leisure Products 1.3% |
| Polaris, Inc. | 11,756 | 1,610,102 |
| Sturm Ruger & Co., Inc. | 30,100 | 2,708,398 |
| YETI Holdings, Inc. (a) | 27,921 | 2,563,706 |
| | | 6,882,206 |
| Life Sciences Tools & Services 0.9% |
| Codexis, Inc. (a) | 137,227 | 3,109,564 |
| NeoGenomics, Inc. (a) | 38,700 | 1,748,079 |
| | | 4,857,643 |
| Machinery 3.5% |
| Altra Industrial Motion Corp. | 48,235 | 3,136,240 |
| Astec Industries, Inc. | 48,563 | 3,056,555 |
| Colfax Corp. (a) | 37,500 | 1,717,875 |
| Hydrofarm Holdings Group, Inc. (a)(b) | 24,318 | 1,437,437 |
| Kennametal, Inc. | 85,990 | 3,088,761 |
| Kornit Digital Ltd. (a) | 7,400 | 920,042 |
| Middleby Corp. (The) (a) | 14,714 | 2,549,347 |
| | Shares | Value |
| |
| Machinery (continued) |
| REV Group, Inc. | 155,572 | $ 2,440,925 |
| | | 18,347,182 |
| Marine 0.5% |
| Kirby Corp. (a) | 45,567 | 2,763,183 |
| Media 2.2% |
| Cardlytics, Inc. (a) | 50,355 | 6,391,560 |
| Criteo SA, Sponsored ADR (a) | 52,343 | 2,367,474 |
| TEGNA, Inc. | 142,964 | 2,682,005 |
| | | 11,441,039 |
| Metals & Mining 1.4% |
| Carpenter Technology Corp. | 61,000 | 2,453,420 |
| Compass Minerals International, Inc. | 38,199 | 2,263,673 |
| MP Materials Corp. (a)(b) | 76,400 | 2,816,104 |
| | | 7,533,197 |
| Mortgage Real Estate Investment Trusts 0.2% |
| Hannon Armstrong Sustainable Infrastructure Capital, Inc. (b) | 20,400 | 1,145,460 |
| Multiline Retail 0.7% |
| Ollie's Bargain Outlet Holdings, Inc. (a) | 43,813 | 3,685,988 |
| Paper & Forest Products 0.6% |
| Schweitzer-Mauduit International, Inc. | 73,017 | 2,948,426 |
| Personal Products 1.3% |
| Edgewell Personal Care Co. | 83,500 | 3,665,650 |
| Medifast, Inc. | 10,970 | 3,104,291 |
| | | 6,769,941 |
| Pharmaceuticals 0.4% |
| Arvinas, Inc. (a) | 25,300 | 1,948,100 |
| Professional Services 2.0% |
| ICF International, Inc. | 31,672 | 2,782,702 |
| Kforce, Inc. | 47,049 | 2,960,793 |
| Science Applications International Corp. | 30,400 | 2,666,992 |
| TriNet Group, Inc. (a) | 27,500 | 1,993,200 |
| | | 10,403,687 |
| Real Estate Management & Development 0.5% |
| Marcus & Millichap, Inc. (a) | 65,000 | 2,526,550 |
The notes to the financial statements are an integral part of, and should be read in conjunction with, the financial statements.
| 12 | MainStay VP Wellington Small Cap Portfolio |
| | Shares | Value |
| Common Stocks (continued) |
| Semiconductors & Semiconductor Equipment 4.4% |
| ACM Research, Inc., Class A (a)(b) | 19,776 | $ 2,021,503 |
| Ichor Holdings Ltd. (a) | 41,137 | 2,213,171 |
| Maxeon Solar Technologies Ltd. (a)(b) | 43,844 | 939,577 |
| Rambus, Inc. (a) | 152,761 | 3,621,963 |
| Silicon Motion Technology Corp., ADR | 44,663 | 2,862,898 |
| Synaptics, Inc. (a) | 12,200 | 1,898,076 |
| Tower Semiconductor Ltd. (a) | 326,473 | 9,608,100 |
| | | 23,165,288 |
| Software 8.1% |
| 8x8, Inc. (a) | 107,600 | 2,986,976 |
| Agilysys, Inc. (a) | 67,861 | 3,859,255 |
| Box, Inc., Class A (a) | 143,861 | 3,675,649 |
| Clear Secure, Inc., Class A (a) | 1,500 | 60,000 |
| Digital Turbine, Inc. (a) | 49,767 | 3,783,785 |
| InterDigital, Inc. | 35,216 | 2,571,824 |
| J2 Global, Inc. (a) | 18,939 | 2,605,059 |
| Jamf Holding Corp. (a) | 61,533 | 2,065,663 |
| Manhattan Associates, Inc. (a) | 16,344 | 2,367,265 |
| PROS Holdings, Inc. (a) | 61,800 | 2,816,226 |
| Rapid7, Inc. (a) | 45,725 | 4,326,957 |
| SentinelOne, Inc., Class A (a) | 1,500 | 63,750 |
| Telos Corp. (a) | 45,320 | 1,541,333 |
| Varonis Systems, Inc. (a) | 70,566 | 4,066,013 |
| Veritone, Inc. (a)(b) | 123,814 | 2,440,374 |
| Xperi Holding Corp. | 138,515 | 3,080,574 |
| | | 42,310,703 |
| Specialty Retail 1.5% |
| Children's Place, Inc. (The) (a) | 25,096 | 2,335,434 |
| Five Below, Inc. (a) | 16,741 | 3,235,533 |
| Floor & Decor Holdings, Inc., Class A (a) | 20,242 | 2,139,579 |
| | | 7,710,546 |
| Textiles, Apparel & Luxury Goods 2.2% |
| Carter's, Inc. | 28,119 | 2,901,037 |
| Kontoor Brands, Inc. (b) | 46,693 | 2,633,952 |
| Movado Group, Inc. | 85,221 | 2,681,905 |
| Steven Madden Ltd. | 74,679 | 3,267,953 |
| | | 11,484,847 |
| Thrifts & Mortgage Finance 2.5% |
| Federal Agricultural Mortgage Corp., Class C | 44,450 | 4,396,105 |
| MGIC Investment Corp. | 191,654 | 2,606,494 |
| NMI Holdings, Inc., Class A (a) | 75,048 | 1,687,079 |
| Radian Group, Inc. | 115,600 | 2,572,100 |
| | Shares | | Value |
| |
| Thrifts & Mortgage Finance (continued) |
| WSFS Financial Corp. | 37,200 | | $ 1,733,148 |
| | | | 12,994,926 |
| Trading Companies & Distributors 1.2% |
| Applied Industrial Technologies, Inc. | 32,624 | | 2,970,741 |
| Boise Cascade Co. | 54,800 | | 3,197,580 |
| | | | 6,168,321 |
Total Common Stocks
(Cost $492,629,241) | | | 504,677,221 |
| Exchange-Traded Funds 1.9% |
| iShares Russell 2000 ETF (b) | 39,311 | | 9,016,764 |
| iShares Russell 2000 Value ETF | 5,157 | | 854,876 |
Total Exchange-Traded Funds
(Cost $9,570,978) | | | 9,871,640 |
| |
| | Number of
Warrants | | |
| Warrant 0.0% ‡ |
| Energy Equipment & Services 0.0% ‡ |
| Nabors Industries Ltd. | | | |
| Expires 6/11/26 (a) | 12,200 | | 122,000 |
Total Warrant
(Cost $0) | | | 122,000 |
| |
| | Shares | | |
| Short-Term Investments 4.7% |
| Affiliated Investment Company 1.3% |
| MainStay U.S. Government Liquidity Fund, 0.01% (c) | 7,160,850 | | 7,160,850 |
| Unaffiliated Investment Company 3.4% |
| Wells Fargo Government Money Market Fund, 0.025% (c)(d) | 17,703,457 | | 17,703,457 |
Total Short-Term Investments
(Cost $24,864,307) | | | 24,864,307 |
Total Investments
(Cost $527,064,526) | 103.2% | | 539,535,168 |
| Other Assets, Less Liabilities | (3.2) | | (16,903,027) |
| Net Assets | 100.0% | | $ 522,632,141 |
The notes to the financial statements are an integral part of, and should be read in conjunction with, the financial statements.
13
Portfolio of Investments June 30, 2021† (Unaudited) (continued)
| † | Percentages indicated are based on Portfolio net assets. |
| ‡ | Less than one-tenth of a percent. |
| (a) | Non-income producing security. |
| (b) | All or a portion of this security was held on loan. As of June 30, 2021, the aggregate market value of securities on loan was $23,778,040; the total market value of collateral held by the Portfolio was $24,269,340. The market value of the collateral held included non-cash collateral in the form of U.S. Treasury securities with a value of $6,565,883. The Portfolio received cash collateral with a value of $17,703,457. (See Note 2(H)) |
| (c) | Current yield as of June 30, 2021. |
| (d) | Represents a security purchased with cash collateral received for securities on loan. |
| Abbreviation(s): |
| ADR—American Depositary Receipt |
| ETF—Exchange-Traded Fund |
The following is a summary of the fair valuations according to the inputs used as of June 30, 2021, for valuing the Portfolio’s assets:
| Description | Quoted
Prices in
Active
Markets for
Identical
Assets
(Level 1) | | Significant
Other
Observable
Inputs
(Level 2) | | Significant
Unobservable
Inputs
(Level 3) | | Total |
| Asset Valuation Inputs | | | | | | | |
| Investments in Securities (a) | | | | | | | |
| Common Stocks | $ 504,677,221 | | $ — | | $ — | | $ 504,677,221 |
| Exchange-Traded Funds | 9,871,640 | | — | | — | | 9,871,640 |
| Warrant | 122,000 | | — | | — | | 122,000 |
| Short-Term Investments | | | | | | | |
| Affiliated Investment Company | 7,160,850 | | — | | — | | 7,160,850 |
| Unaffiliated Investment Company | 17,703,457 | | — | | — | | 17,703,457 |
| Total Short-Term Investments | 24,864,307 | | — | | — | | 24,864,307 |
| Total Investments in Securities | $ 539,535,168 | | $ — | | $ — | | $ 539,535,168 |
| (a) | For a complete listing of investments and their industries, see the Portfolio of Investments. |
The notes to the financial statements are an integral part of, and should be read in conjunction with, the financial statements.
| 14 | MainStay VP Wellington Small Cap Portfolio |
Statement of Assets and Liabilities as of June 30, 2021 (Unaudited)
| Assets |
Investment in unaffiliated securities, at value
(identified cost $519,903,676) including securities on loan of $23,778,040 | $532,374,318 |
Investment in affiliated investment companies, at value
(identified cost $7,160,850) | 7,160,850 |
| Cash | 729 |
| Receivables: | |
| Investment securities sold | 1,928,797 |
| Dividends | 345,535 |
| Securities lending | 6,799 |
| Other assets | 7,468 |
| Total assets | 541,824,496 |
| Liabilities |
| Cash collateral received for securities on loan | 17,703,457 |
| Payables: | |
| Investment securities purchased | 983,123 |
| Manager (See Note 3) | 297,077 |
| NYLIFE Distributors (See Note 3) | 65,382 |
| Portfolio shares redeemed | 63,495 |
| Custodian | 43,223 |
| Professional fees | 36,146 |
| Shareholder communication | 452 |
| Total liabilities | 19,192,355 |
| Net assets | $522,632,141 |
| Composition of Net Assets |
| Shares of beneficial interest outstanding (par value of $.001 per share) unlimited number of shares authorized | $ 38,397 |
| Additional paid-in-capital | 393,691,835 |
| | 393,730,232 |
| Total distributable earnings (loss) | 128,901,909 |
| Net assets | $522,632,141 |
| Initial Class | |
| Net assets applicable to outstanding shares | $204,347,323 |
| Shares of beneficial interest outstanding | 14,914,842 |
| Net asset value per share outstanding | $ 13.70 |
| Service Class | |
| Net assets applicable to outstanding shares | $318,284,818 |
| Shares of beneficial interest outstanding | 23,482,033 |
| Net asset value per share outstanding | $ 13.55 |
The notes to the financial statements are an integral part of, and should be read in conjunction with, the financial statements.
15
Statement of Operations for the six months ended June 30, 2021 (Unaudited)
| Investment Income (Loss) |
| Income | |
| Dividends-unaffiliated (net of foreign tax withholding of $15,189) | $ 2,743,069 |
| Securities lending | 38,718 |
| Dividends-affiliated | 160 |
| Total income | 2,781,947 |
| Expenses | |
| Manager (See Note 3) | 2,099,857 |
| Distribution/Service—Service Class (See Note 3) | 400,848 |
| Professional fees | 63,246 |
| Shareholder communication | 62,025 |
| Custodian | 37,510 |
| Trustees | 5,102 |
| Miscellaneous | 7,390 |
| Total expenses before waiver/reimbursement | 2,675,978 |
| Expense waiver/reimbursement from Manager (See Note 3) | (332,762) |
| Net expenses | 2,343,216 |
| Net investment income (loss) | 438,731 |
| Realized and Unrealized Gain (Loss) |
| Net realized gain (loss) on: | |
| Unaffiliated investment transactions | 157,411,583 |
| Foreign currency transactions | (6,745) |
| Net realized gain (loss) | 157,404,838 |
| Net change in unrealized appreciation (depreciation) on unaffiliated investments | (74,925,073) |
| Net realized and unrealized gain (loss) | 82,479,765 |
| Net increase (decrease) in net assets resulting from operations | $ 82,918,496 |
The notes to the financial statements are an integral part of, and should be read in conjunction with, the financial statements.
| 16 | MainStay VP Wellington Small Cap Portfolio |
Statements of Changes in Net Assets
for the six months ended June 30, 2021 (Unaudited) and the year ended December 31, 2020
| | 2021 | 2020 |
| Increase (Decrease) in Net Assets |
| Operations: | | |
| Net investment income (loss) | $ 438,731 | $ 1,155,825 |
| Net realized gain (loss) | 157,404,838 | (4,645,271) |
| Net change in unrealized appreciation (depreciation) | (74,925,073) | 49,572,838 |
| Net increase (decrease) in net assets resulting from operations | 82,918,496 | 46,083,392 |
| Distributions to shareholders: | | |
| Initial Class | — | (219,144) |
| Capital share transactions: | | |
| Net proceeds from sales of shares | 13,562,526 | 28,506,306 |
| Net asset value of shares issued to shareholder in reinvestment of distributions | — | 219,144 |
| Cost of shares redeemed | (75,914,059) | (88,033,138) |
| Increase (decrease) in net assets derived from capital share transactions | (62,351,533) | (59,307,688) |
| Net increase (decrease) in net assets | 20,566,963 | (13,443,440) |
| Net Assets |
| Beginning of period | 502,065,178 | 515,508,618 |
| End of period | $522,632,141 | $502,065,178 |
The notes to the financial statements are an integral part of, and should be read in conjunction with, the financial statements.
17
Financial Highlights selected per share data and ratios
| | Six months ended
June 30,
2021* | | Year Ended December 31, | | May 2, 2016^ through
December 31,
2016 |
| Initial Class | 2020 | | 2019 | | 2018 | | 2017 | |
| Net asset value at beginning of period | $ 11.73 | | $ 10.65 | | $ 9.82 | | $ 13.16 | | $ 11.73 | | $ 10.00 |
| Net investment income (loss) (a) | 0.02 | | 0.04 | | 0.05 | | 0.04 | | 0.01 | | 0.03 |
| Net realized and unrealized gain (loss) on investments | 1.95 | | 1.05 | | 1.61 | | (1.71) | | 1.63 | | 1.88 |
| Net realized and unrealized gain (loss) on foreign currency transactions | (0.00)‡ | | — | | — | | — | | — | | — |
| Total from investment operations | 1.97 | | 1.09 | | 1.66 | | (1.67) | | 1.64 | | 1.91 |
| Less distributions: | | | | | | | | | | | |
| From net investment income | — | | (0.01) | | (0.02) | | — | | — | | (0.02) |
| From net realized gain on investments | — | | — | | (0.81) | | (1.67) | | (0.21) | | (0.16) |
| Total distributions | — | | (0.01) | | (0.83) | | (1.67) | | (0.21) | | (0.18) |
| Net asset value at end of period | $ 13.70 | | $ 11.73 | | $ 10.65 | | $ 9.82 | | $ 13.16 | | $ 11.73 |
| Total investment return (b) | 16.79%(c) | | 10.22% | | 17.82% | | (15.11)% | | 13.93% | | 19.14% |
| Ratios (to average net assets)/Supplemental Data: | | | | | | | | | | | |
| Net investment income (loss) | 0.32%†† | | 0.42% | | 0.48% | | 0.33% | | 0.10% | | 0.39%†† |
| Net expenses (d) | 0.74%†† | | 0.75% | | 0.82% | | 0.90% | | 0.90% | | 1.00%†† |
| Expenses (before waiver/reimbursement) (d) | 0.87%†† | | 0.86% | | 0.86% | | 0.90% | | 0.90% | | 1.00%†† |
| Portfolio turnover rate | 44% | | 225% | | 257% | | 161% | | 159% | | 180% |
| Net assets at end of period (in 000’s) | $ 204,347 | | $ 197,586 | | $ 198,292 | | $ 123,857 | | $ 180,840 | | $ 164,253 |
| * | Unaudited. |
| ^ | Inception date. |
| ‡ | Less than one cent per share. |
| †† | Annualized. |
| (a) | Per share data based on average shares outstanding during the period. |
| (b) | Total return does not reflect any deduction of sales charges, mortality and expense charges, contract charges or administrative charges. For periods of less than one year, total return is not annualized. |
| (c) | Total investment return may reflect adjustments to conform to generally accepted accounting principles. |
| (d) | In addition to the fees and expenses which the Portfolio bears directly, it also indirectly bears a pro-rata share of the fees and expenses of the underlying funds in which it invests. Such indirect expenses are not included in the above expense ratios. |
The notes to the financial statements are an integral part of, and should be read in conjunction with, the financial statements.
| 18 | MainStay VP Wellington Small Cap Portfolio |
Financial Highlights selected per share data and ratios
| | Six months ended
June 30,
2021* | | Year Ended December 31, | | May 2, 2016^ through
December 31,
2016 |
| Service Class | 2020 | | 2019 | | 2018 | | 2017 | |
| Net asset value at beginning of period | $ 11.61 | | $ 10.56 | | $ 9.76 | | $ 13.11 | | $ 11.72 | | $ 10.00 |
| Net investment income (loss) (a) | 0.00‡ | | 0.02 | | 0.02 | | 0.01 | | (0.02) | | 0.01 |
| Net realized and unrealized gain (loss) on investments | 1.94 | | 1.03 | | 1.59 | | (1.69) | | 1.62 | | 1.88 |
| Net realized and unrealized gain (loss) on foreign currency transactions | (0.00)‡ | | — | | — | | — | | — | | — |
| Total from investment operations | 1.94 | | 1.05 | | 1.61 | | (1.68) | | 1.60 | | 1.89 |
| Less distributions: | | | | | | | | | | | |
| From net investment income | — | | — | | (0.00)‡ | | — | | — | | (0.01) |
| From net realized gain on investments | — | | — | | (0.81) | | (1.67) | | (0.21) | | (0.16) |
| Total distributions | — | | — | | (0.81) | | (1.67) | | (0.21) | | (0.17) |
| Net asset value at end of period | $ 13.55 | | $ 11.61 | | $ 10.56 | | $ 9.76 | | $ 13.11 | | $ 11.72 |
| Total investment return (b) | 16.71%(c) | | 9.94%(c) | | 17.53% | | (15.32)% | | 13.64% | | 18.95% |
| Ratios (to average net assets)/Supplemental Data: | | | | | | | | | | | |
| Net investment income (loss) | 0.07%†† | | 0.17% | | 0.22% | | 0.09% | | (0.15)% | | 0.16%†† |
| Net expenses (d) | 0.99%†† | | 1.00% | | 1.07% | | 1.15% | | 1.15% | | 1.25%†† |
| Expenses (before waiver/reimbursement) (d) | 1.12%†† | | 1.11% | | 1.12% | | 1.15% | | 1.15% | | 1.25%†† |
| Portfolio turnover rate | 44% | | 225% | | 257% | | 161% | | 159% | | 180% |
| Net assets at end of period (in 000’s) | $ 318,285 | | $ 304,479 | | $ 317,216 | | $ 136,965 | | $ 176,295 | | $ 175,015 |
| * | Unaudited. |
| ^ | Inception date. |
| ‡ | Less than one cent per share. |
| †† | Annualized. |
| (a) | Per share data based on average shares outstanding during the period. |
| (b) | Total return does not reflect any deduction of sales charges, mortality and expense charges, contract charges or administrative charges. For periods of less than one year, total return is not annualized. |
| (c) | Total investment return may reflect adjustments to conform to generally accepted accounting principles. |
| (d) | In addition to the fees and expenses which the Portfolio bears directly, it also indirectly bears a pro-rata share of the fees and expenses of the underlying funds in which it invests. Such indirect expenses are not included in the above expense ratios. |
The notes to the financial statements are an integral part of, and should be read in conjunction with, the financial statements.
19
Notes to Financial Statements (Unaudited)
Note 1–Organization and Business
MainStay VP Funds Trust (the “Fund”) was organized as a Delaware statutory trust on February 1, 2011. The Fund is registered under the Investment Company Act of 1940, as amended (the “1940 Act”), as an open-end management investment company. The Fund is comprised of thirty-one separate series (collectively referred to as the “Portfolios”). These financial statements and notes relate to the MainStay VP Wellington Small Cap Portfolio (formerly known as MainStay VP MacKay Small Cap Core Portfolio) (the "Portfolio"), a "diversified” portfolio, as that term is defined in the 1940 Act, as interpreted or modified by regulatory authorities having jurisdiction, from time to time.
Shares of the Portfolio are currently offered to certain separate accounts to fund variable annuity policies and variable universal life insurance policies issued by New York Life Insurance and Annuity Corporation (“NYLIAC”), a wholly-owned subsidiary of New York Life Insurance Company (“New York Life”) and may also be offered to fund variable annuity policies and variable universal life insurance policies issued by other insurance companies. NYLIAC allocates shares of the Portfolios to, among others, certain NYLIAC separate accounts. Shares of the Portfolio are also offered to the MainStay VP Conservative Allocation Portfolio, MainStay VP Moderate Allocation Portfolio, MainStay VP Growth Allocation Portfolio (formerly known as MainStay VP Moderate Growth Allocation Portfolio) and MainStay VP Equity Allocation Portfolio (formerly known as MainStay VP Growth Allocation Portfolio), which operate as “funds-of-funds," and other variable insurance funds.
The following table lists the Portfolio's share classes that have been registered and commenced operations:
| Class | Commenced Operations |
| Initial Class | May 2, 2016 |
| Service Class | May 2, 2016 |
Shares of the Portfolio are offered and are redeemed at a price equal to their respective net asset value (“NAV”) per share. No sales or redemption charge is applicable to the purchase or redemption of the Portfolio's shares. Under the terms of the Fund’s multiple class plan, adopted pursuant to Rule 18f-3 under the 1940 Act, the classes differ in that, among other things, Service Class shares of the Portfolio pay a combined distribution and service fee of 0.25% of average daily net assets attributable to Service Class shares of the Portfolio to the Distributor (as defined in Note 3(B)) pursuant to a plan adopted in accordance with Rule 12b-1 under the 1940 Act. Contract owners of variable annuity contracts purchased after June 2, 2003, are permitted to invest only in the Service Class shares.
The Portfolio's investment objective is to seek long-term growth of capital.
Note 2–Significant Accounting Policies
The Portfolio is an investment company and accordingly follows the investment company accounting and reporting guidance of the Financial Accounting Standards Board (“FASB”) Accounting Standard Codification Topic 946 Financial Services—Investment Companies. The Portfolio prepares its financial statements in accordance with generally accepted accounting principles (“GAAP”) in the United States of America and follows the significant accounting policies described below.
(A) Securities Valuation. Investments are usually valued as of the close of regular trading on the New York Stock Exchange (the "Exchange") (usually 4:00 p.m. Eastern time) on each day the Portfolio is open for business ("valuation date").
The Board of Trustees of the Fund (the "Board") adopted procedures establishing methodologies for the valuation of the Portfolio's securities and other assets and delegated the responsibility for valuation determinations under those procedures to the Valuation Committee of the Fund (the “Valuation Committee”). The procedures state that, subject to the oversight of the Board and unless otherwise noted, the responsibility for the day-to-day valuation of portfolio assets (including fair value measurements for the Portfolio's assets and liabilities) rests with New York Life Investment Management LLC (“New York Life Investments” or the "Manager"), aided to whatever extent necessary by the Subadvisor (as defined in Note 3(A)). To assess the appropriateness of security valuations, the Manager, the Subadvisor or the Portfolio's third-party service provider, who is subject to oversight by the Manager, regularly compares prior day prices, prices on comparable securities and the sale prices to the prior and current day prices and challenges prices with changes exceeding certain tolerance levels with third-party pricing services or broker sources.
The Board authorized the Valuation Committee to appoint a Valuation Subcommittee (the “Subcommittee”) to establish the prices of securities for which market quotations are not readily available or the prices of which are not otherwise readily determinable under the procedures. The Subcommittee meets (in person, via electronic mail or via teleconference) on an as-needed basis. The Valuation Committee meets to ensure that actions taken by the Subcommittee were appropriate.
For those securities valued through either a standardized fair valuation methodology or a fair valuation measurement, the Subcommittee deals with such valuation and the Valuation Committee reviews and affirms, if appropriate, the reasonableness of the valuation based on such methodologies and measurements on a regular basis after considering information that is reasonably available and deemed relevant by the Valuation Committee. Any action taken by the Subcommittee with respect to the valuation of a portfolio security or other asset is submitted for review and ratification (if appropriate) to the Valuation Committee and the Board at the next regularly scheduled meeting.
"Fair value" is defined as the price the Portfolio would reasonably expect to receive upon selling an asset or liability in an orderly transaction to an independent buyer in the principal or most advantageous market for the
| 20 | MainStay VP Wellington Small Cap Portfolio |
asset or liability. Fair value measurements are determined within a framework that establishes a three-tier hierarchy that maximizes the use of observable market data and minimizes the use of unobservable inputs to establish a classification of fair value measurements for disclosure purposes. "Inputs" refer broadly to the assumptions that market participants would use in pricing the asset or liability, including assumptions about risk, such as the risk inherent in a particular valuation technique used to measure fair value using a pricing model and/or the risk inherent in the inputs for the valuation technique. Inputs may be observable or unobservable. Observable inputs reflect the assumptions market participants would use in pricing the asset or liability based on market data obtained from sources independent of the Portfolio. Unobservable inputs reflect the Portfolio’s own assumptions about the assumptions market participants would use in pricing the asset or liability based on the information available. The inputs or methodology used for valuing assets or liabilities may not be an indication of the risks associated with investing in those assets or liabilities. The three-tier hierarchy of inputs is summarized below.
| • | Level 1—quoted prices in active markets for an identical asset or liability |
| • | Level 2—other significant observable inputs (including quoted prices for a similar asset or liability in active markets, interest rates and yield curves, prepayment speeds, credit risk, etc.) |
| • | Level 3—significant unobservable inputs (including the Portfolio's own assumptions about the assumptions that market participants would use in measuring fair value of an asset or liability) |
The level of an asset or liability within the fair value hierarchy is based on the lowest level of an input, both individually and in the aggregate, that is significant to the fair value measurement. The aggregate value by input level of the Portfolio’s assets and liabilities as of June 30, 2021, is included at the end of the Portfolio of Investments.
The Portfolio may use third-party vendor evaluations, whose prices may be derived from one or more of the following standard inputs, among others:
| • Broker/dealer quotes | • Benchmark securities |
| • Two-sided markets | • Reference data (corporate actions or material event notices) |
| • Bids/offers | • Monthly payment information |
| • Industry and economic events | • Reported trades |
An asset or liability for which market values cannot be measured using the methodologies described above is valued by methods deemed reasonable in good faith by the Valuation Committee, following the procedures established by the Board, to represent fair value. Under these procedures, the Portfolio generally uses a market-based approach which may use related or comparable assets or liabilities, recent transactions, market multiples, book values and other relevant information. The Portfolio may also use an income-based valuation approach in which the anticipated future cash flows of the asset or liability are discounted to
calculate fair value. Discounts may also be applied due to the nature and/or duration of any restrictions on the disposition of the asset or liability. Fair value represents a good faith approximation of the value of a security. Fair value determinations involve the consideration of a number of subjective factors, an analysis of applicable facts and circumstances and the exercise of judgment. As a result, it is possible that the fair value for a security determined in good faith in accordance with the Portfolio's valuation procedures may differ from valuations for the same security determined by other funds using their own valuation procedures. Although the Portfolio's valuation procedures are designed to value a security at the price the Portfolio may reasonably expect to receive upon the security's sale in an orderly transaction, there can be no assurance that any fair value determination thereunder would, in fact, approximate the amount that the Portfolio would actually realize upon the sale of the security or the price at which the security would trade if a reliable market price were readily available. During the six-month period ended June 30, 2021, there were no material changes to the fair value methodologies.
Securities which may be valued in this manner include, but are not limited to: (i) a security for which trading has been halted or suspended; (ii) a debt security that has recently gone into default and for which there is not a current market quotation; (iii) a security of an issuer that has entered into a restructuring; (iv) a security that has been delisted from a national exchange; (v) a security for which the market price is not readily available from a third-party pricing source or, if so provided, does not, in the opinion of the Manager or the Subadvisor, reflect the security's market value; (vi) a security subject to trading collars for which no or limited trading takes place; and (vii) a security whose principal market has been temporarily closed at a time when, under normal conditions, it would be open. Securities valued in this manner are generally categorized as Level 3 in the hierarchy. No securities held by the Portfolio as of June 30, 2021 were fair valued in such a manner.
Certain securities held by the Portfolio may principally trade in foreign markets. Events may occur between the time the foreign markets close and the time at which the Portfolio's NAVs are calculated. These events may include, but are not limited to, situations relating to a single issuer in a market sector, significant fluctuations in U.S. or foreign markets, natural disasters, armed conflicts, governmental actions or other developments not tied directly to the securities markets. Should the Manager or the Subadvisor conclude that such events may have affected the accuracy of the last price of such securities reported on the local foreign market, the Subcommittee may, pursuant to procedures adopted by the Board, adjust the value of the local price to reflect the estimated impact on the price of such securities as a result of such events. In this instance, securities are generally categorized as Level 3 in the hierarchy. Additionally, certain foreign equity securities are also fair valued whenever the movement of a particular index exceeds certain thresholds. In such cases, the securities are fair valued by applying factors provided by a third-party vendor in accordance with valuation procedures adopted by the Board and are generally categorized as Level 2 in the hierarchy. No foreign equity securities held by the Portfolio as of June 30, 2021 were fair valued in such a manner.
Notes to Financial Statements (Unaudited) (continued)
Equity securities are valued at the last quoted sales prices as of the close of regular trading on the relevant exchange on each valuation date. Securities that are not traded on the valuation date are valued at the mean of the last quoted bid and ask prices. Prices are normally taken from the principal market in which each security trades. These securities are generally categorized as Level 1 in the hierarchy.
Exchange-traded funds (“ETFs”) are valued at the last quoted sales prices as of the close of regular trading on the relevant exchange on each valuation date. Securities that are not traded on the valuation date are valued at the mean of the last quoted bid and ask prices. Prices are normally taken from the principal market in which each security trades. These securities are generally categorized as Level 1 in the hierarchy.
Investments in mutual funds, including money market funds, are valued at their respective NAVs at the close of business each day on the valuation date. These securities are generally categorized as Level 1 in the hierarchy.
Temporary cash investments acquired in excess of 60 days to maturity at the time of purchase are valued using the latest bid prices or using valuations based on a matrix system (which considers such factors as security prices, yields, maturities and ratings), both as furnished by independent pricing services. Temporary cash investments that mature in 60 days or less at the time of purchase ("Short-Term Investments") are valued using the amortized cost method of valuation, unless the use of such method would be inappropriate. The amortized cost method involves valuing a security at its cost on the date of purchase and thereafter assuming a constant amortization to maturity of the difference between such cost and the value on maturity date. Amortized cost approximates the current fair value of a security. Securities valued using the amortized cost method are not valued using quoted prices in an active market and are generally categorized as Level 2 in the hierarchy.
The information above is not intended to reflect an exhaustive list of the methodologies that may be used to value portfolio investments. The valuation procedures permit the use of a variety of valuation methodologies in connection with valuing portfolio investments. The methodology used for a specific type of investment may vary based on the market data available or other considerations. The methodologies summarized above may not represent the specific means by which portfolio investments are valued on any particular business day.
(B) Income Taxes. The Portfolio's policy is to comply with the requirements of the Internal Revenue Code of 1986, as amended (the “Internal Revenue Code”), applicable to regulated investment companies and to distribute all of its taxable income to the shareholders of the Portfolio within the allowable time limits.
The Manager evaluates the Portfolio’s tax positions to determine if the tax positions taken meet the minimum recognition threshold in connection with accounting for uncertainties in income tax positions taken or expected to be taken for the purposes of measuring and recognizing tax liabilities in the financial statements. Recognition of tax benefits of an uncertain tax position is permitted only to the extent the position is “more
likely than not” to be sustained assuming examination by taxing authorities. The Manager analyzed the Portfolio's tax positions taken on federal, state and local income tax returns for all open tax years (for up to three tax years) and has concluded that no provisions for federal, state and local income tax are required in the Portfolio's financial statements. The Portfolio's federal, state and local income tax and federal excise tax returns for tax years for which the applicable statutes of limitations have not expired are subject to examination by the Internal Revenue Service and state and local departments of revenue.
(C) Foreign Taxes. The Portfolio may be subject to foreign taxes on income and other transaction-based taxes imposed by certain countries in which it invests. A portion of the taxes on gains on investments or currency purchases/repatriation may be reclaimable. The Portfolio will accrue such taxes and reclaims as applicable, based upon its current interpretation of tax rules and regulations that exist in the markets in which it invests.
The Portfolio may be subject to taxation on realized capital gains, repatriation proceeds and other transaction-based taxes imposed by certain countries in which it invests. The Portfolio will accrue such taxes as applicable based upon its current interpretation of tax rules and regulations that exist in the market in which it invests. Capital gains taxes relating to positions still held are reflected as a liability in the Statement of Assets and Liabilities, as well as an adjustment to the Portfolio's net unrealized appreciation (depreciation). Taxes related to capital gains realized, if any, are reflected as part of net realized gain (loss) in the Statement of Operations. Changes in tax liabilities related to capital gains taxes on unrealized investment gains, if any, are reflected as part of the change in net unrealized appreciation (depreciation) on investments in the Statement of Operations. Transaction-based charges are generally assessed as a percentage of the transaction amount.
(D) Dividends and Distributions to Shareholders. Dividends and distributions are recorded on the ex-dividend date. The Portfolio intends to declare and pay dividends from net investment income and distributions from net realized capital and currency gains, if any, at least annually. Unless a shareholder elects otherwise, all dividends and distributions are reinvested at NAV in the same class of shares of the Portfolio. Dividends and distributions to shareholders are determined in accordance with federal income tax regulations and may differ from determinations using GAAP.
(E) Security Transactions and Investment Income. The Portfolio records security transactions on the trade date. Realized gains and losses on security transactions are determined using the identified cost method. Dividend income is recognized on the ex-dividend date, net of any foreign tax withheld at the source, and interest income is accrued as earned using the effective interest rate method. Distributions received from real estate investment trusts may be classified as dividends, capital gains and/or return of capital.
Investment income and realized and unrealized gains and losses on investments of the Portfolio are allocated pro rata to the separate classes
| 22 | MainStay VP Wellington Small Cap Portfolio |
of shares based upon their relative net assets on the date the income is earned or realized and unrealized gains and losses are incurred.
(F) Expenses. Expenses of the Fund are allocated to the individual Portfolios in proportion to the net assets of the respective Portfolios when the expenses are incurred, except where direct allocations of expenses can be made. Expenses (other than fees incurred under the distribution and service plans, further discussed in Note 3(B), which are charged directly to the Service Class shares) are allocated to separate classes of shares pro rata based upon their relative net assets on the date the expenses are incurred. The expenses borne by the Portfolio, including those of related parties to the Portfolio, are shown in the Statement of Operations.
Additionally, the Portfolio may invest in ETFs and mutual funds, which are subject to management fees and other fees that may cause the costs of investing in ETFs and mutual funds to be greater than the costs of owning the underlying securities directly. These indirect expenses of ETFs and mutual funds are not included in the amounts shown as expenses in the Statement of Operations or in the expense ratios included in the Financial Highlights.
(G) Use of Estimates. In preparing financial statements in conformity with GAAP, the Manager makes estimates and assumptions that affect the reported amounts and disclosures in the financial statements. Actual results could differ from those estimates and assumptions.
(H) Securities Lending. In order to realize additional income, the Portfolio may engage in securities lending, subject to the limitations set forth in the 1940 Act and relevant guidance by the staff of the Securities and Exchange Commission (“SEC”). If the Portfolio engages in securities lending, the Portfolio will lend through its custodian, JPMorgan Chase Bank, N.A., ("JPMorgan"), acting as securities lending agent on behalf of the Portfolio. Under the current arrangement, JPMorgan will manage the Portfolio's collateral in accordance with the securities lending agency agreement between the Portfolio and JPMorgan, and indemnify the Portfolio against counterparty risk. The loans will be collateralized by cash (which may be invested in a money market fund) and/or non-cash collateral (which may include U.S. Treasury securities and/or U.S. government agency securities issued or guaranteed by the United States government or its agencies or instrumentalities) at least equal at all times to the market value of the securities loaned. The Portfolio bears the risk of delay in recovery of, or loss of rights in, the securities loaned. The Portfolio may also record a realized gain or loss on securities deemed sold due to a borrower’s inability to return securities on loan. The Portfolio bears the risk of any loss on investment of cash collateral. The Portfolio will receive compensation for lending its securities in the form of fees or it will retain a portion of interest earned on the investment of any cash collateral. The Portfolio will also continue to receive interest and dividends on the securities loaned and any gain or loss in the market price of the securities loaned that may occur during the term of the loan will be for the account of the Portfolio. Income earned from securities lending activities, if any, is reflected in the Statement of Operations. Securities on loan as of June 30, 2021, are shown in the Portfolio of Investments.
Prior to February 22, 2021, these services were provided by State Street Bank and Trust Company (“State Street”).
(I) Rights and Warrants. Rights are certificates that permit the holder to purchase a certain number of shares, or a fractional share, of a new stock from the issuer at a specific price. Warrants are instruments that entitle the holder to buy an equity security at a specific price for a specific period of time. These investments can provide a greater potential for profit or loss than an equivalent investment in the underlying security. Prices of these investments do not necessarily move in tandem with the prices of the underlying securities.
There is risk involved in the purchase of rights and warrants in that these investments are speculative investments. The Portfolio could also lose the entire value of its investment in warrants if such warrants are not exercised by the date of its expiration. The Portfolio is exposed to risk until the sale or exercise of each right or warrant is completed. Rights and Warrants as of June 30, 2021 are shown in the Portfolio of Investments.
(J) Indemnifications. Under the Fund’s organizational documents, its officers and trustees are indemnified against certain liabilities that may arise out of performance of their duties to the Fund. Additionally, in the normal course of business, the Portfolio enters into contracts with third-party service providers that contain a variety of representations and warranties and that may provide general indemnifications. The Portfolio's maximum exposure under these arrangements is unknown, as this would involve future claims that may be made against the Portfolio that have not yet occurred. The Manager believes that the risk of loss in connection with these potential indemnification obligations is remote. However, there can be no assurance that material liabilities related to such obligations will not arise in the future, which could adversely impact the Portfolio.
Note 3–Fees and Related Party Transactions
(A) Manager and Subadvisor. New York Life Investments, a registered investment adviser and an indirect, wholly-owned subsidiary of New York Life, serves as the Portfolio's Manager, pursuant to an Amended and Restated Management Agreement ("Management Agreement"). The Manager provides offices, conducts clerical, recordkeeping and bookkeeping services and keeps most of the financial and accounting records required to be maintained by the Portfolio. Except for the portion of salaries and expenses that are the responsibility of the Portfolio, the Manager pays the salaries and expenses of all personnel affiliated with the Portfolio and certain operational expenses of the Portfolio. The Portfolio reimburses New York Life Investments in an amount equal to the portion of the compensation of the Chief Compliance Officer attributable to the Portfolio. The Portfolio’s subadvisor changed effective May 1, 2021, due to the replacement of MacKay Shields LLC ("MacKay Shields") as the Portfolio’s subadvisor and the appointment of Wellington Management Company LLP (“Wellington” or the “Subadvisor”) as the Portfolio’s subadvisor. Wellington, a registered investment adviser, is responsible for the day-to-day portfolio management of the Portfolio. Pursuant to the terms of a Subadvisory Agreement ("Subadvisory Agreement") between
Notes to Financial Statements (Unaudited) (continued)
New York Life Investments and Wellington, New York Life Investments pays for the services of the Subadvisor.
Pursuant to the Management Agreement, the Fund pays the Manager, on behalf of the Portfolio, a monthly fee for the services performed and the facilities furnished at an annual rate of the Portfolio's average daily net assets as follows: 0.80% up to $1 billion; 0.775% from $1 billion to $2 billion; and 0.75% in excess of $2 billion. During the six-month period ended June 30, 2021, the effective management fee rate was 0.80% (exclusive of any applicable waivers/reimbursements).
New York Life Investments has contractually agreed to waive fees and/or reimburse expenses so that Total Annual Portfolio Operating Expenses (excluding taxes, interest, litigation, extraordinary expenses, brokerage and other transaction expenses relating to the purchase or sale of portfolio investments and acquired (underlying) portfolio/fund fees and expenses) of of Initial Class shares do not exceed 0.74% of the Portfolio's average daily net assets of its average daily net assets. New York Life Investments will apply an equivalent waiver or reimbursement to Service Class shares. This agreement will remain in effect until May 1, 2022, and shall renew automatically for one-year terms unless New York Life Investments provides written notice of termination prior to the start of the next term or upon approval of the Board.
During the six-month period ended June 30, 2021, New York Life Investments earned fees from the Portfolio in the amount of $2,099,857 and waived fees and/or reimbursed expenses in the amount of $332,762 and paid MacKay Shields and Wellington $612,245 and $295,394, respectively.
JPMorgan provides sub-administration and sub-accounting services to the Portfolio pursuant to an agreement with New York Life Investments.
These services include calculating the daily NAVs of the Portfolio, maintaining the general ledger and sub-ledger accounts for the calculation of the Portfolio's NAVs, and assisting New York Life Investments in conducting various aspects of the Portfolio's administrative operations. For providing these services to the Portfolio, JPMorgan is compensated by New York Life Investments.
Prior to February 22, 2021, these services were provided by State Street.
Pursuant to an agreement between the Fund and New York Life Investments, New York Life Investments is responsible for providing or procuring certain regulatory reporting services for the Portfolio. The Portfolio will reimburse New York Life Investments for the actual costs incurred by New York Life Investments in connection with providing or procuring these services for the Portfolio.
(B) Distribution and Service Fees. The Fund, on behalf of the Portfolio, has entered into a distribution agreement with NYLIFE Distributors LLC (the “Distributor”), an affiliate of New York Life Investments. The Portfolio has adopted a distribution plan (the “Plan”) in accordance with the provisions of Rule 12b-1 under the 1940 Act. Under the Plan, the Distributor has agreed to provide, through its affiliates or independent third parties, various distribution-related, shareholder and administrative support services to the Service Class shareholders. For its services, the Distributor is entitled to a combined distribution and service fee accrued daily and paid monthly at an annual rate of 0.25% of the average daily net assets attributable to the Service Class shares of the Portfolio.
(C) Investments in Affiliates (in 000’s). During the six-month period ended June 30, 2021, purchases and sales transactions, income earned from investments and shares held of investment companies managed by New York Life Investments or its affiliates were as follows:
| Affiliated Investment Companies | Value,
Beginning
of Period | Purchases
at Cost | Proceeds
from
Sales | Net
Realized
Gain/(Loss)
on Sales | Change in
Unrealized
Appreciation/
(Depreciation) | Value,
End of
Period | Dividend
Income | Other
Distributions | Shares
End of
Period |
| MainStay U.S. Government Liquidity Fund | $ — | $ 86,708 | $ (79,547) | $ — | $ — | $ 7,161 | $ —(a) | $ — | 7,161 |
| 24 | MainStay VP Wellington Small Cap Portfolio |
Note 4-Federal Income Tax
As of June 30, 2021, the cost and unrealized appreciation (depreciation) of the Portfolio’s investment portfolio, including applicable derivative contracts and other financial instruments, as determined on a federal income tax basis, were as follows:
| | Federal Tax
Cost | Gross
Unrealized
Appreciation | Gross
Unrealized
(Depreciation) | Net
Unrealized
Appreciation/
(Depreciation) |
| Investments in Securities | $539,333,232 | $20,257,003 | $(20,055,067) | $201,936 |
As of December 31, 2020, for federal income tax purposes, capital loss carryforwards of $30,847,126, as shown in the table below, were available to the extent provided by the regulations to offset future realized gains of the Portfolio. Accordingly, no capital gains distributions are expected to be paid to shareholders until net gains have been realized in excess of such amounts.
Capital Loss
Available Through | Short-Term
Capital Loss
Amounts (000’s) | Long-Term
Capital Loss
Amounts (000’s) |
| Unlimited | $29,441 | $1,406 |
During the year ended December 31, 2020, the tax character of distributions paid as reflected in the Statements of Changes in Net Assets was as follows:
| | 2020 |
| Distributions paid from: | |
| Ordinary Income | $219,144 |
Note 5–Custodian
JPMorgan is the custodian of cash and securities held by the Portfolio. Custodial fees are charged to the Portfolio based on the Portfolio's net assets and/or the market value of securities held by the Portfolio and the number of certain transactions incurred by the Portfolio.
Prior to February 22, 2021, these services were provided by State Street. The services provided by State Street were a direct expense of the Portfolio and are included in the Statement of Operations as Custodian fees which totaled $10,362 for the period January 1, 2021 through February 21, 2021.
Note 6–Line of Credit
The Portfolio and certain other funds managed by New York Life Investments maintain a line of credit with a syndicate of banks in order to secure a source of funds for temporary purposes to meet unanticipated or excessive redemption requests.
Effective July 27, 2021, under the credit agreement (the “Credit Agreement”), the aggregate commitment amount is $600,000,000 with an additional uncommitted amount of $100,000,000. The commitment
fee is an annual rate of 0.15% of the average commitment amount payable quarterly, regardless of usage, to JPMorgan, who serves as the agent to the syndicate. The commitment fee is allocated among the Portfolio and certain other funds managed by New York Life Investments based upon their respective net assets and other factors. Interest on any revolving credit loan is charged based upon the Federal Funds Rate or the one-month LIBOR, whichever is higher. The Credit Agreement expires on July 26, 2022, although the Portfolio, certain other funds managed by New York Life Investments and the syndicate of banks may renew the Credit Agreement for an additional year on the same or different terms or enter into a credit agreement with a different syndicate of banks. Prior to July 27, 2021, the aggregate commitment amount and the commitment fee were the same as those under the current Credit Agreement. During the six-month period ended June 30, 2021, there were no borrowings made or outstanding with respect to the Portfolio under the Credit Agreement.
Note 7–Interfund Lending Program
Pursuant to an exemptive order issued by the SEC, the Portfolio, along with certain other funds managed by New York Life Investments, may participate in an interfund lending program. The interfund lending program provides an alternative credit facility that permits the Portfolio and certain other funds managed by New York Life Investments to lend or borrow money for temporary purposes directly to or from one another, subject to the conditions of the exemptive order. During the six-month period ended June 30, 2021, there were no interfund loans made or outstanding with respect to the Portfolio.
Note 8–Purchases and Sales of Securities (in 000’s)
During the six-month period ended June 30, 2021, purchases and sales of securities, other than short-term securities, were $226,983 and $265,149, respectively.
The Portfolio may purchase securities from or sell securities to other portfolios managed by the Subadvisor. These interportfolio transactions are primarily used for cash management purposes and are made pursuant to Rule 17a-7 under the 1940 Act. During the six-month period ended June 30, 2021, such purchases were $1,835.
Note 9–Capital Share Transactions
Transactions in capital shares for the six-month period ended June 30, 2021 and the year ended December 31, 2020, were as follows:
Notes to Financial Statements (Unaudited) (continued)
| Initial Class | Shares | Amount |
| Period ended June 30, 2021: | | |
| Shares sold | 494,106 | $ 6,649,831 |
| Shares redeemed | (2,430,919) | (32,950,064) |
| Net increase (decrease) | (1,936,813) | $(26,300,233) |
| Year ended December 31, 2020: | | |
| Shares sold | 549,601 | $ 4,722,504 |
| Shares issued to shareholders in reinvestment of distributions | 22,016 | 219,144 |
| Shares redeemed | (2,337,460) | (23,020,294) |
| Net increase (decrease) | (1,765,843) | $(18,078,646) |
| |
| Service Class | Shares | Amount |
| Period ended June 30, 2021: | | |
| Shares sold | 532,798 | $ 6,912,695 |
| Shares redeemed | (3,267,326) | (42,963,995) |
| Net increase (decrease) | (2,734,528) | $(36,051,300) |
| Year ended December 31, 2020: | | |
| Shares sold | 3,009,340 | $ 23,783,802 |
| Shares redeemed | (6,822,754) | (65,012,844) |
| Net increase (decrease) | (3,813,414) | $(41,229,042) |
Note 10–Other Matters
An outbreak of COVID-19, first detected in December 2019, has developed into a global pandemic and has resulted in travel restrictions, closure of international borders, certain businesses and securities markets, restrictions on securities trading activities, prolonged quarantines, supply chain disruptions, and lower consumer demand, as well as general concern and uncertainty. The continued impact of COVID-19 and related new variants is uncertain and could further adversely affect the global economy, national economies, individual issuers and capital markets in unforeseeable ways and result in a substantial and extended economic downturn. Developments that disrupt global economies and financial markets, such as COVID-19, may magnify factors that affect the Portfolio's performance.
Note 11–Subsequent Events
In connection with the preparation of the financial statements of the Portfolio as of and for the six-month period ended June 30, 2021, events and transactions subsequent to June 30, 2021, through the date the financial statements were issued have been evaluated by the Manager for possible adjustment and/or disclosure. No subsequent events requiring financial statement adjustment or disclosure have been identified.
| 26 | MainStay VP Wellington Small Cap Portfolio |
Board Consideration and Approval of Subadvisory Agreement with Wellington Management Company LLP (Unaudited)
The Subadvisory Agreement between New York Life Investment Management LLC (“New York Life Investments”) and Wellington Management Company LLP (“Wellington”) with respect to the MainStay VP Wellington Small Cap Portfolio (formerly known as the MainStay VP MacKay Small Cap Core Portfolio) (“Portfolio”) (“New Subadvisory Agreement”), must be approved initially and, following an initial term of up to two years, is subject to annual review and approval by the Board of Trustees of MainStay VP Funds Trust (“Board” of the “Trust”) in accordance with Section 15 of the Investment Company Act of 1940, as amended (“1940 Act”). At its February 3, 2021 meeting, the Board, including the Trustees who are not an “interested person” (as such term is defined in the 1940 Act) of the Trust (“Independent Trustees”) voting separately, unanimously approved the New Subadvisory Agreement for an initial two-year period, subject to shareholder approval (which was obtained at a shareholder meeting held on April 5, 2021).
At meetings held on January 21, January 25 and February 3, 2021, the Board considered and approved New York Life Investments’ recommendations to appoint Wellington as the subadvisor to the Portfolio, to approve the New Subadvisory Agreement and to approve the related changes to the Portfolio’s principal investment strategies, name and investment process (the “Repositioning”), all effective on or about May 1, 2021. The Board noted that the material terms of the New Subadvisory Agreement are substantially identical to the terms of the then-current subadvisory agreement with MacKay Shields LLC (“MacKay”) with respect to the Portfolio, but that the subadvisory fee schedule under the New Subadvisory Agreement with Wellington includes fees that are lower at every level of assets than the subadvisory fees paid to MacKay under the then-current subadvisory agreement.
In reaching the decisions to approve the Repositioning and New Subadvisory Agreement, the Board considered information furnished by New York Life Investments and Wellington in connection with meetings of the Board and its Contracts, Investment and Risk and Compliance Oversight Committees held on January 21, January 25 and February 3, 2021, as well as other information furnished to the Board and its Committees throughout the year, as deemed relevant by the Trustees. In addition, the Board considered information previously provided to the Board in connection with its review of the subadvisory agreements for other funds in the MainStay Group of Funds, as deemed relevant to each Trustee. The Board also considered information furnished by Wellington in response to requests prepared on behalf of the Board, and in consultation with the Independent Trustees, by independent legal counsel to the Independent Trustees, which encompassed a variety of topics, including those summarized below.
The Board took into account information provided in connection with its meetings throughout the year, including, among other items, information regarding the legal standards and fiduciary obligations applicable to its consideration of the New Subadvisory Agreement and investment performance reports on the Portfolio as well as presentations from New York Life Investments and Wellington personnel. The contract review process, including the structure and format for materials provided to the Board, has been developed in consultation with the Board. The
Independent Trustees also met in executive sessions with their independent legal counsel and, for a portion thereof, with senior management of New York Life Investments.
In considering the Repositioning and the New Subadvisory Agreement, the Trustees reviewed and evaluated the information and factors they believed to reasonably be necessary and appropriate in light of legal advice furnished to them by independent legal counsel and through the exercise of their own business judgment. Although individual Trustees may have weighed certain factors or information differently, the factors considered by the Board are described in greater detail below and include, among other factors: (i) the nature, extent and quality of the services to be provided to the Portfolio by Wellington; (ii) the investment performance of the Portfolio, the qualifications of the proposed portfolio managers of the Portfolio and the historical investment performance of products managed by such portfolio managers with investment strategies similar to those of the Portfolio, as repositioned; (iii) the anticipated costs of the services to be provided, and profits expected to be realized, by Wellington from its relationship with the Portfolio; (iv) the extent to which economies of scale may be realized if the Portfolio grows and the extent to which economies of scale may benefit the Portfolio’s shareholders; and (v) the reasonableness of the Portfolio’s proposed subadvisory fee to be paid by New York Life Investments to Wellington and estimated total ordinary operating expenses. Although the Board recognized that comparisons between the Portfolio’s proposed fees and estimated expenses and those of other funds are imprecise given different terms of agreements, variations in fund strategies and other factors, the Board considered the reasonableness of the Portfolio’s proposed fees and estimated total ordinary operating expenses as compared to the peer funds identified by New York Life Investments.
Although individual Trustees may have weighed certain factors or information differently, the Board’s decisions to approve the Repositioning and the New Subadvisory Agreement were based on a consideration of the information provided to the Trustees throughout the year, such as presentations from Wellington personnel, as well as information furnished specifically in connection with the contract review process for the Portfolio, in each case as deemed relevant to each Trustee. The Trustees noted that, throughout the year, the Trustees would be afforded an opportunity to ask questions of, and request additional information or materials from, New York Life Investments and Wellington with respect to the Portfolio. The Board took note of New York Life Investments’ belief that Wellington, with its resources and historical investment performance track record for strategies similar to those of the Portfolio, as repositioned, is well qualified to serve as the Portfolio’s subadvisor. In addition to considering the above-referenced factors, the Board observed that in the marketplace, notably under variable life insurance policies and variable annuity contracts for which the Portfolio serves as an investment option, there are a range of investment options available to the Portfolio’s shareholders and such shareholders, having had the opportunity to consider other investment options, have chosen to invest in the Portfolio.
Board Consideration and Approval of Subadvisory Agreement with Wellington Management Company LLP (Unaudited) (continued)
The factors that figured prominently in the Board’s decisions to approve the Repositioning and the New Subadvisory Agreement are summarized in more detail below, and the Board did not consider any factor or information controlling in reaching such decisions.
Nature, Extent and Quality of Services to be Provided by Wellington
In considering the Repositioning and the New Subadvisory Agreement, the Board considered New York Life Investments’ responsibilities as manager of the Portfolio, noting that New York Life Investments is responsible for supervising the Portfolio’s subadvisor. The Board examined the nature, extent and quality of the investment advisory services that Wellington proposed to provide to the Portfolio. Further, the Board evaluated and/or examined the following with regard to Wellington:
| • | experience in providing investment advisory services; |
| • | experience in serving as advisor or subadvisor to other accounts (noting that none of which are registered investment companies) with similar strategies as those of the Portfolio, as repositioned, and the performance track record of those accounts; |
| • | experience of investment advisory, senior management and administrative personnel; |
| • | overall legal and compliance environment, resources and history and policies and procedures in place with respect to matters that may involve conflicts of interest between the Portfolio’s investments and those of other accounts managed by Wellington; |
| • | New York Life Investments’ and Wellington’s belief that their respective compliance policies, procedures and systems are reasonably designed to prevent violation of the federal securities laws and their commitment to further developing and strengthening compliance programs relating to the MainStay Group of Funds generally and the Portfolio specifically; |
| • | ability to attract and retain qualified investment professionals and willingness to invest in personnel to service and support the Portfolio; |
| • | portfolio construction and risk management processes; |
| • | experience of the Portfolio’s proposed portfolio managers, including with respect to investment strategies similar to those of the Portfolio, as repositioned, the number of accounts managed by the portfolio managers and the method for compensating the portfolio managers; and |
| • | overall reputation, financial condition and assets under management. |
Based on these considerations, the Board concluded that the Portfolio would likely benefit from the nature, extent and quality of the proposed investment advisory services to be provided by Wellington.
Investment Performance
In evaluating the Portfolio’s investment performance, the Board considered investment performance results over various periods in light of the Portfolio’s investment objective, strategies and risks. The Board
considered investment reports on, and analysis of, the Portfolio’s performance provided to the Board throughout the year. These reports include, among other items, information on the Portfolio’s gross and net returns, the Portfolio’s investment performance compared to relevant investment categories and the Portfolio’s benchmark, the Portfolio’s risk-adjusted investment performance and the Portfolio’s investment performance as compared to peer funds, as appropriate, as well as portfolio attribution information and commentary on the effect of market conditions.
The Board also gave weight to its discussions with senior management at New York Life Investments concerning the Portfolio’s investment performance and remediation efforts undertaken by New York Life Investments, and other alternatives to the Repositioning, and the New Subadvisory Agreement considered by New York Life Investments. In addition, the Board considered steps taken to seek to improve the Portfolio’s investment performance and discussions between the Portfolio’s current portfolio management team and the Investment Committee of the Board. The Board further considered that shareholders may benefit from Wellington’s investment process, including its portfolio construction and risk management processes. The Board noted that the Repositioning had not yet been implemented so an investment performance track record for the Portfolio, as repositioned, was not available.
The Board evaluated the Portfolio’s proposed portfolio management team, investment process, strategies and risks. The Board noted that Wellington currently manages one or more portfolios with investment strategies similar to those of the Portfolio, as repositioned. Additionally, the Board considered the historical performance of such portfolio or portfolios and other portfolios managed by the proposed portfolio managers for the Portfolio. The Board observed that the composite performance information of such portfolio or portfolios, gross of fees for the periods ended November 30, 2020, versus the benchmark and the Portfolio, had been favorable over historical time periods (evaluated since March 31, 2018). The Board noted that the composite performance information had outperformed the benchmark index and the Portfolio over the one- and two-year periods ended November 30, 2020, and for 2019. Based on these considerations, the Board concluded that the Portfolio was likely to be managed responsibly and capably by Wellington.
Based on these considerations, the Board concluded that the selection of Wellington as the subadvisor to the Portfolio is likely to benefit the Portfolio’s long-term investment performance.
Costs of the Services to be Provided, and Profits to be Realized, by Wellington
The Board considered the anticipated costs of the services to be provided by Wellington under the New Subadvisory Agreement and the profits expected to be realized by Wellington due to its relationship with the Portfolio. The Board considered that Wellington’s subadvisory fee had been negotiated at arm’s-length by New York Life Investments and that these fees would be paid by New York Life Investments, not the Portfolio.
| 28 | MainStay VP Wellington Small Cap Portfolio |
In evaluating the anticipated costs of the services to be provided by Wellington and profits expected to be realized by Wellington, the Board considered, among other factors, Wellington’s investments in, or willingness to invest in, personnel, systems, equipment and other resources and infrastructure to support and further enhance the services proposed to be provided to the Portfolio, and that New York Life Investments would be responsible for paying the subadvisory fee to Wellington. The Board also considered the financial resources of Wellington and acknowledged that Wellington must be in a position to attract and retain experienced professional personnel and to maintain a strong financial position for Wellington to be able to provide high-quality services to the Portfolio.
In considering anticipated costs and profitability, the Board also considered certain fall-out benefits that may be realized by Wellington due to its relationship with the Portfolio, including reputational and other indirect benefits. The Board recognized, for example, the potential benefits to Wellington from legally permitted “soft-dollar” arrangements by which brokers would provide research and other services to Wellington in exchange for commissions paid by the Portfolio with respect to trades in the Portfolio’s portfolio securities. In addition, the Board also requested and received information from New York Life Investments concerning other material business relationships between Wellington and its affiliates and New York Life Investments and its affiliates, and considered the existence of a strategic partnership between New York Life Investments and Wellington that relates to certain current and future products that represented a conflict of interest associated with New York Life Investments’ recommendation to approve the Repositioning and the New Subadvisory Agreement.
The Board took into account the fact that the Portfolio would undergo changes to its principal investment strategies in connection with the Repositioning. The Board noted estimates from New York Life Investments and Wellington that a significant portion of the holdings of the Portfolio would be sold to align the Portfolio’s holdings with the strategies that would be pursued by Wellington. Additionally, the Board considered New York Life Investments’ representation that New York Life Investments would work closely with Wellington to seek to execute the optimal transition strategy and that New York Life Investments would make every effort to minimize potential direct and indirect costs associated with the Repositioning.
The Board considered that any profits realized by Wellington due to its relationship with the Portfolio would be the result of arm’s-length negotiations between New York Life Investments and Wellington, acknowledging that any such profits would be based on fees paid to Wellington by New York Life Investments, not the Portfolio.
Subadvisory Fee and Estimated Total Ordinary Operating Expenses
The Board evaluated the reasonableness of the fee to be paid under the New Subadvisory Agreement and the Portfolio’s estimated total ordinary operating expenses. The Board primarily considered the reasonableness
of the management fee to be paid by the Portfolio to New York Life Investments because the subadvisory fee to be paid to Wellington would be paid by New York Life Investments, not the Portfolio. The Board also considered the reasonableness of the subadvisory fee to be paid by New York Life Investments and the amount of the management fee expected to be retained by New York Life Investments.
In assessing the reasonableness of the Portfolio’s proposed fees and estimated expenses, the Board considered information provided by New York Life Investments on fees and expenses of peer funds. The Board also considered that in proposing fees for the Portfolio, New York Life Investments considers the competitive marketplace for mutual funds.
Based on the factors outlined above, the Board concluded that the Portfolio’s management fee and total ordinary operating expenses were within a range that is competitive and support a conclusion that these fees and expenses are reasonable.
Economies of Scale
The Board considered information regarding economies of scale, including whether the Portfolio’s proposed expense structure would permit economies of scale to be appropriately shared with the Portfolio’s beneficial shareholders. The Board also considered a report from New York Life Investments, previously prepared at the request of the Board, that addressed economies of scale, including with respect to the mutual fund business generally and the various ways in which the benefits of economies of scale may be shared with the funds in the MainStay Group of Funds. Although the Board recognized the difficulty of determining economies of scale with precision, the Board acknowledged that economies of scale may be shared with the Portfolio in a number of ways, including, for example, through the imposition of fee breakpoints, initially setting management fee rates at scale or making additional investments to enhance services.
Based on this information, the Board concluded that economies of scale are appropriately reflected for the benefit of the Portfolio’s beneficial shareholders through the Portfolio’s proposed expense structure and other methods to share benefits from economies of scale.
Conclusion
On the basis of the information and factors summarized above, among other information and factors deemed relevant by the Trustees, and the evaluation thereof, the Board, including the Independent Trustees voting separately, unanimously voted to approve the Repositioning and the New Subadvisory Agreement.
Discussion of the Operation and Effectiveness of the Portfolio's Liquidity Risk Management Program (Unaudited)
In compliance with Rule 22e-4 under the Investment Company Act of 1940, as amended (the “Liquidity Rule”), the Portfolio has adopted and implemented a liquidity risk management program (the “Program”), which New York Life Investment Management LLC believes is reasonably designed to assess and manage the Portfolio's liquidity risk (the risk that the Portfolio could not meet requests to redeem shares issued by the Portfolio without significant dilution of remaining investors’ interests in the Portfolio). The Board of Trustees of MainStay VP Funds Trust (the "Board") designated New York Life Investment Management LLC as administrator of the Program (the “Administrator”). The Administrator has established a Liquidity Risk Management Committee to assist the Administrator in the implementation and day-to-day administration of the Program and to otherwise support the Administrator in fulfilling its responsibilities under the Program.
At a meeting of the Board held on March 8, 2021, the Administrator provided the Board with a written report addressing the Program’s operation and assessing its adequacy and effectiveness of implementation for the period from January 1, 2020 through December 31, 2020 (the "Review Period"), as required under the Liquidity Rule. The report noted that the Administrator concluded that (i) the Program operated effectively to assess and manage the Portfolio's liquidity risk, (ii) the Program has been adequately and effectively implemented to monitor and, as applicable, respond to the Portfolio's liquidity developments and (iii) the Portfolio's investment strategy continues to be appropriate for an open-end fund. In addition, the report discussed notable events that impacted liquidity risk during the Review Period, including the COVID-19 pandemic and the resulting economic shutdown.
In accordance with the Program, the Portfolio's liquidity risk is assessed no less frequently than annually taking into consideration certain factors, as applicable, such as (i) investment strategy and liquidity of portfolio investments, (ii) short-term and long-term cash flow projections and (iii) holdings of cash and cash equivalents, as well as borrowing arrangements and other funding sources. Certain factors are considered under both normal and reasonably foreseeable stressed conditions.
Each Portfolio portfolio investment is classified into one of four liquidity categories. The classification is based on a determination of the number of days it is reasonably expected to take to convert the investment into cash, or sell or dispose of the investment, in current market conditions without significantly changing the market value of the investment. The Administrator has delegated liquidity classification determinations to the Portfolio’s subadvisor, subject to appropriate oversight by the Administrator, and classification determinations are made by taking into account the Portfolio's reasonably anticipated trade size, various market, trading and investment-specific considerations, as well as market depth, and, in certain cases, third-party vendor data.
The Liquidity Rule requires portfolios that do not primarily hold assets that are highly liquid investments to adopt a minimum amount of net assets that must be invested in highly liquid investments that are assets (an “HLIM”). In addition, the Liquidity Rule limits a portfolio's investments in illiquid investments. Specifically, the Liquidity Rule prohibits acquisition of illiquid investments if doing so would result in a portfolio holding more than 15% of its net assets in illiquid investments that are assets. The Program includes provisions reasonably designed to determine, periodically review and comply with the HLIM requirement, as applicable, and to comply with the 15% limit on illiquid investments.
There can be no assurance that the Program will achieve its objectives under all circumstances in the future. Please refer to the Portfolio's prospectus for more information regarding the Portfolio's exposure to liquidity risk and other risks to which it may be subject.
| 30 | MainStay VP Wellington Small Cap Portfolio |
Proxy Voting Record
The Portfolio is required to file with the SEC its proxy voting records for the 12-month period ending June 30 on Form N-PX. The Portfolio's most recent Form N-PX or proxy voting record is available free of charge upon request (i) by calling 800-598-2019; (ii) by visiting New York Life Investments’ website at https://www.nylinvestments.com/mainstay/
products-and-performance/mainstay-vp-funds-trust; or (iii) by visiting the SEC’s website at www.sec.gov.
Shareholder Reports and Quarterly Portfolio Disclosure
The Portfolio is required to file its complete schedule of portfolio holdings with the SEC 60 days after its first and third fiscal quarter on Form N-PORT. The Portfolio's holdings report is available free of charge upon request by calling 800-598-2019 or by visiting the SEC’s website at www.sec.gov.
This page intentionally left blank
This page intentionally left blank.
This page intentionally left blank.
MainStay VP Portfolios
MainStay VP offers a wide range of Portfolios. The full array of MainStay VP offerings is listed here, with information about the manager, subadvisors, legal counsel, and independent registered public accounting firm.
Equity
MainStay VP Candriam Emerging Markets Equity Portfolio
MainStay VP Epoch U.S. Equity Yield Portfolio
MainStay VP Fidelity Institutional AM® Utilities Portfolio†
MainStay VP MacKay International Equity Portfolio
MainStay VP MacKay S&P 500 Index Portfolio
MainStay VP Natural Resources Portfolio
MainStay VP Small Cap Growth Portfolio
MainStay VP T. Rowe Price Equity Income Portfolio
MainStay VP Wellington Growth Portfolio
MainStay VP Wellington Mid Cap Portfolio
MainStay VP Wellington Small Cap Portfolio
MainStay VP Wellington U.S. Equity Portfolio
MainStay VP Winslow Large Cap Growth Portfolio
Mixed Asset
MainStay VP Balanced Portfolio
MainStay VP Income Builder Portfolio
MainStay VP Janus Henderson Balanced Portfolio
MainStay VP MacKay Convertible Portfolio
Income
MainStay VP Bond Portfolio
MainStay VP Floating Rate Portfolio
MainStay VP Indexed Bond Portfolio
MainStay VP MacKay Government Portfolio
MainStay VP MacKay High Yield Corporate Bond Portfolio
MainStay VP MacKay Strategic Bond Portfolio
MainStay VP PIMCO Real Return Portfolio
Money Market
MainStay VP U.S. Government Money Market Portfolio
Alternative
MainStay VP CBRE Global Infrastructure Portfolio
MainStay VP IQ Hedge Multi-Strategy Portfolio
Asset Allocation
MainStay VP Conservative Allocation Portfolio
MainStay VP Equity Allocation Portfolio
MainStay VP Growth Allocation Portfolio
MainStay VP Moderate Allocation Portfolio
Manager
New York Life Investment Management LLC
New York, New York
Subadvisors
Brown Advisory LLC
Baltimore, Maryland
Candriam Belgium S.A.*
Brussels, Belgium
CBRE Clarion Securities LLC
Radnor, Pennsylvania
Epoch Investment Partners, Inc.
New York, New York
FIAM LLC
Smithfield, Rhode Island
IndexIQ Advisors LLC*
New York, New York
Janus Capital Management LLC
Denver, Colorado
MacKay Shields LLC*
New York, New York
Mellon Investments Corporation
Boston, Massachusetts
NYL Investors LLC*
New York, New York
Pacific Investment Management Company LLC
Newport Beach, California
Segall Bryant & Hamill, LLC
Chicago, Illinois
T. Rowe Price Associates, Inc.
Baltimore, Maryland
Wellington Management Company LLP
Boston, Massachusetts
Winslow Capital Management, LLC
Minneapolis, Minnesota
Legal Counsel
Dechert LLP
Washington, District of Columbia
Independent Registered Public Accounting Firm
PricewaterhouseCoopers LLP
New York, New York
Distributor
NYLIFE Distributors LLC*
Jersey City, New Jersey
Custodian
JPMorgan Chase Bank, N.A.
New York, New York
Some Portfolios may not be available in all products.
† Fidelity Institutional AM is a registered trade mark of FMR LLC. Used with permission.
* An affiliate of New York Life Investment Management LLC
Not part of the Semiannual Report
2021 Semiannual Report
This report is for the general information of New York Life Variable Annuities and NYLIAC Variable Universal Life Insurance Products policyowners. It must be preceded or accompanied by the appropriate product(s) and funds prospectuses if it is given to anyone who is not an owner of a New York Life variable annuity policy or a NYLIAC Variable Universal Life Insurance Product. This report does not offer for sale or solicit orders to purchase securities.
The performance data quoted in this report represents past performance. Past performance is no guarantee of future results. Due to market volatility and other factors, current performance may be lower or higher than the figures shown. The most recent month-end performance summary for your variable annuity or variable life policy is available by calling 800-598-2019 and is updated periodically on newyorklife.com.
The New York Life Variable Annuities and NYLIAC Variable Universal Life Insurance Products are issued by New York Life Insurance and Annuity Corporation (a Delaware Corporation) and distributed by NYLIFE Distributors LLC (Member FINRA/SIPC).
New York Life Insurance Company
New York Life Insurance and Annuity
Corporation (NYLIAC) (A Delaware Corporation)
51 Madison Avenue, Room 551
New York, NY 10010
newyorklife.com
nylinvestments.com
NYLIFE Distributors LLC, 30 Hudson Street, Jersey City, NJ 07302
New York Life Investment Management LLC is the investment manager to the MainStay VP Funds Trust
©2021 by NYLIFE Distributors LLC. All rights reserved.
You may obtain copies of the Prospectus and the Statement of Additional Information free of charge, upon request, by calling toll-free 800-598-2019 or writing to New York Life Insurance and Annuity Corporation, 51 Madison Avenue, New York, NY 10010.
| Not FDIC Insured | No Bank Guarantee | May Lose Value |
(NYLIAC) NI530
MainStay VP Candriam Emerging Markets Equity Portfolio
(formerly known as MainStay VP Emerging Markets Equity Portfolio)
Message from the President and Semiannual Report
Unaudited | June 30, 2021
Sign up for e-delivery of your shareholder reports. For full details on e-delivery, including who can participate and what you can receive via e-delivery,
please log in to newyorklifeinvestments.com/accounts.
| Not FDIC/NCUA Insured | Not a Deposit | May Lose Value | No Bank Guarantee | Not Insured by Any Government Agency |
This page intentionally left blank
Message from the President
The COVID-19 pandemic continued to afflict our personal lives and broad segments of the U.S. and global economy throughout the six-month reporting period ended June 30, 2021. However, with the deployment of multiple vaccines around the world, including three highly effective versions approved for emergency use in the United States, investors began to turn their attention toward the gradual reopening of the economy and the shape the “new normal” would take.
The first half of the reporting period saw increasing inflationary concerns as fiscal stimulus business reopenings drove accelerating economic growth, rising commodity prices and increased consumer spending. However, the U.S. Federal Reserve noted that price increases were likely to prove temporary and made clear their intention to remain accommodative for the foreseeable future. Accordingly, after moving higher in the first quarter of 2021, interest rates declined in the second quarter.
In response to the uncertain inflation outlook, equity market leadership shifted from value in the first quarter of the year to growth in the second quarter. Nevertheless, investor sentiment remained buoyant throughout the reporting period, with all eleven sectors in the S&P 500® Index, a widely regarded benchmark of market performance, producing positive returns. Energy led the market’s rise fueled by rapidly increasing oil and gas prices, followed by financials and real estate, which benefited from rising interest rates and the economic reopening, respectively. Communication services produced the slowest growth, followed by the traditionally defensive utilities and consumer staples
sectors. In the fixed income market, lower-credit-quality issues tended to outperform their higher-grade counterparts, with high-yield corporate bonds generating the strongest performance. Among securitized products, commercial mortgage-backed securities generally produced the strongest returns, followed by mortgage-backed securities and asset-backed securities, while Treasury securities lagged.
Despite the tremendous progress we’ve seen so far this year, the United States and the world continue to face significant pandemic-related challenges. Newer, more contagious variants of COVID-19 threaten the return of restrictions and lockdowns that could stall the economic recovery. At the same time, supply chain shortages have led to rising prices on everything from laptops to autos, stoking fears of uncontrolled inflation despite reassurance from the U.S. Federal Reserve. At New York Life Investments, we recognize that the shape that the “new normal” eventually takes may differ from our expectations. You can depend on us to keep a sharp watch for the unexpected, and to continue to help you find your way through this rapidly evolving investment landscape.
Sincerely,
Kirk C. Lehneis
President
The opinions expressed are as of the date of this report and are subject to change. There is no guarantee that any forecast made will come to pass. This material does not constitute investment advice and is not intended as an endorsement of any specific investment. Past performance is no guarantee of future results.
Not part of the Semiannual Report
Investors should refer to the Portfolio’s Summary Prospectus and/or Prospectus and consider the Portfolio’s investment objectives, strategies, risks, charges and expenses carefully before investing. The Summary Prospectus and/or Prospectus contain this and other information about the Portfolio. You may obtain copies of the Portfolio’s Summary Prospectus and/or the Prospectus and the Statement of Additional Information free of charge, upon request, by calling toll-free 800-598-2019, by writing to New York Life Insurance and Annuity Corporation, 51 Madison Avenue, Room 251, New York, New York 10010 or by sending an email to MainStayShareholdersServices@nylim.com. These documents are also available at nylinvestments.com/vpdocuments. Please read the Portfolio's Summary Prospectus and/or Prospectus carefully before investing. MainStay VP Funds Trust portfolios are separate account options which are purchased through a variable insurance or variable annuity contract.
Investment and Performance Comparison (Unaudited)
Performance data quoted represents past performance. Past performance is no guarantee of future results. Because of market volatility and other factors, current performance may be lower or higher than the figures shown. Investment return and principal value will fluctuate, and as a result, when shares are redeemed, they may be worth more or less than their original cost. The performance table and graph do not reflect any deduction of sales charges, mortality and expense charges, contract charges or administrative charges. Please refer to the Performance Summary appropriate for your policy. For performance information current to the most recent month-end, please call 800-598-2019 or visit www.newyorklife.com.
Performance figures may reflect certain fee waivers and/or expense limitations, without which total returns may have been different. For information on current fee waivers and/or expense limitations (if any), please refer to the Notes to Financial Statements.
| Average Annual Total Returns for the Period-Ended June 30, 2021 |
| Class | Inception
Date1, 2, 3 | Six
Months | One
Year | Five
Years | Since
Inception | Gross
Expense
Ratio4 |
| Initial Class Shares | 2/17/2012 | 10.62% | 48.03% | 14.16% | 3.84% | 1.19% |
| Service Class Shares | 2/17/2012 | 10.49 | 47.66 | 13.87 | 3.58 | 1.44 |
| 1. | Effective January 13, 2015, the Portfolio changed its subadvisors and revised its principal investment strategies. The performance in the bar chart and table prior to that date reflects the Portfolio’s prior subadvisors and principal investment strategies. |
| 2. | Effective January 1, 2018, due to an organizational restructuring whereby all investment personnel of Cornerstone Capital Management Holdings LLC, the former subadvisor, transitioned to MacKay Shields LLC. |
| 3. | Effective May 1, 2021, the Portfolio replaced one of its subadvisors and modified its principal investment strategies. The past performance in the bar chart and table prior to that date reflects the Portfolio's prior subadvisor and principal investment strategies. |
| 4. | The gross expense ratios presented reflect the Portfolio’s “Total Annual Portfolio Operating Expenses” from the most recent Prospectus, as supplemented, and may differ from other expense ratios disclosed in this report. |
| Benchmark Performance | Six
Months | One
Year | Five
Years | Since
Inception |
| MSCI Emerging Markets Index (Net)1 | 7.45% | 40.90% | 13.03% | 5.29% |
| Morningstar Diversified Emerging Markets Category Average2 | 8.81 | 41.51 | 11.77 | 5.05 |
| 1. | The MSCI Emerging Markets Index (Net) is the Portfolio's primary benchmark. The MSCI Emerging Markets Index (Net) is a broad-based benchmark that is a free float-adjusted market capitalization index that is designed to measure equity market performance in the global emerging markets. Results assume reinvestment of all dividends and capital gains. An investment cannot be made directly in an index. |
| 2. | The Morningstar Diversified Emerging Markets Category Average is representative of funds that tend to divide their assets among 20 or more nations, although they tend to focus on the emerging markets of Asia and Latin America rather than on those of the Middle East, Africa, or Europe. These funds invest predominantly in emerging market equities, but some funds also invest in both equities and fixed income investments from emerging markets. Results are based on average total returns of similar funds with all dividends and capital gain distributions reinvested. |
Cost in Dollars of a $1,000 Investment in MainStay VP Candriam Emerging Markets Equity Portfolio (Unaudited)
The example below is intended to describe the fees and expenses borne by shareholders during the six-month period from January 1, 2021 to June 30, 2021, and the impact of those costs on your investment.
Example
As a shareholder of the Portfolio you incur two types of costs: (1) transaction costs, including exchange fees and sales charges (loads) on purchases (as applicable), and (2) ongoing costs, including management fees, distribution and/or service (12b-1) fees, and other Portfolio expenses (as applicable). This example is intended to help you understand your ongoing costs (in dollars) of investing in the Portfolio and to compare these costs with the ongoing costs of investing in other mutual funds. The example is based on an investment of $1,000 made at the beginning of the six-month period and held for the entire period from January 1, 2021 to June 30, 2021. Shares are only sold in connection with variable life and annuity contracts and the example does not reflect any contract level or transactional fees or expenses. If these costs had been included, your costs would have been higher.
This example illustrates your Portfolio’s ongoing costs in two ways:
Actual Expenses
The second and third data columns in the table below provide information about actual account values and actual expenses. You may use the information in these columns, together with the amount you invested, to estimate the expenses that you paid during the six months ended June
30, 2021. Simply divide your account value by $1,000 (for example, an $8,600 account value divided by $1,000 = 8.6), then multiply the result by the number under the heading entitled “Expenses Paid During Period” to estimate the expenses you paid on your account during this period.
Hypothetical Example for Comparison Purposes
The fourth and fifth data columns in the table below provide information about hypothetical account values and hypothetical expenses based on the Portfolio’s actual expense ratio and an assumed rate of return of 5% per year before expenses, which is not the Portfolio’s actual return. The hypothetical account values and expenses may not be used to estimate the actual ending account balances or expenses you paid for the six-month period shown. You may use this information to compare the ongoing costs of investing in the Portfolio with the ongoing costs of investing in other mutual funds. To do so, compare this 5% hypothetical example with the 5% hypothetical examples that appear in the shareholder reports of the other mutual funds.
Please note that the expenses shown in the table are meant to highlight your ongoing costs only and do not reflect any transactional costs, such as exchange fees or sales charges (loads). Therefore, the fourth and fifth data columns of the table are useful in comparing ongoing costs only and will not help you determine the relative total costs of owning different funds. In addition, if these transactional costs were included, your costs would have been higher.
| Share Class | Beginning
Account
Value
1/1/21 | Ending Account
Value (Based
on Actual
Returns and
Expenses)
6/30/21 | Expenses
Paid
During
Period1 | Ending Account
Value (Based
on Hypothetical
5% Annualized
Return and
Actual Expenses)
6/30/21 | Expenses
Paid
During
Period1 | Net Expense
Ratio
During
Period2 |
| Initial Class Shares | $1,000.00 | $1,106.20 | $6.06 | $1,019.04 | $5.81 | 1.16% |
| Service Class Shares | $1,000.00 | $1,104.90 | $7.36 | $1,017.80 | $7.05 | 1.41% |
| 1. | Expenses are equal to the Portfolio’s annualized expense ratio of each class multiplied by the average account value over the period, divided by 365 and multiplied by 181 (to reflect the six-month period). The table above represents the actual expenses incurred during the six-month period. In addition to the fees and expenses which the Portfolio bears directly, it also indirectly bears a pro rata share of the fees and expenses of the underlying funds in which it invests. Such indirect expenses are not included in the above-reported expense figures. |
| 2. | Expenses are equal to the Portfolio's annualized expense ratio to reflect the six-month period. |
| 6 | MainStay VP Candriam Emerging Markets Equity Portfolio |
Country Composition as of June 30, 2021 (Unaudited)
| China | 39.9% |
| Republic of Korea | 12.9 |
| India | 11.9 |
| Taiwan | 11.3 |
| Brazil | 6.9 |
| Russia | 3.4 |
| South Africa | 3.3 |
| Mexico | 2.0 |
| Hong Kong | 1.8 |
| Poland | 1.3 |
| Thailand | 1.1 |
| Indonesia | 0.7% |
| Peru | 0.7 |
| Chile | 0.5 |
| Argentina | 0.4 |
| Hungary | 0.2 |
| Turkey | 0.2 |
| Canada | 0.1 |
| Greece | 0.0‡ |
| Other Assets, Less Liabilities | 1.4 |
| | 100.0% |
| ‡ | Less than one–tenth of a percent. |
See Portfolio of Investments beginning on page 11 for specific holdings within these categories. The Portfolio's holdings are subject to change.
Top Ten Holdings as of June 30, 2021 (excluding short-term investments) (Unaudited)
| 1. | Taiwan Semiconductor Manufacturing Co. Ltd. |
| 2. | Samsung Electronics Co. Ltd. |
| 3. | Tencent Holdings Ltd. |
| 4. | Alibaba Group Holding Ltd. |
| 5. | Meituan |
| 6. | KB Financial Group, Inc. |
| 7. | TCS Group Holding plc (Registered) |
| 8. | China Merchants Bank Co. Ltd., Class H |
| 9. | Naspers Ltd., Class N |
| 10. | China Construction Bank Corp., Class H |
Portfolio Management Discussion and Analysis (Unaudited)
Answers to the questions reflect the views of portfolio managers Ping Wang, PhD, and Rui Tang, CFA, of MacKay Shields LLC (“MacKay Shields”), a Subadvisor of the Portfolio, and portfolio managers Jan Boudewijns,1 Paulo Salazar, Philip Screve and Lamine Saidi of Candriam Belgium S.A. (“Candriam”), a Subadvisor of the Portfolio.
How did MainStay VP Candriam Emerging Markets Equity Portfolio perform relative to its benchmark and peers during the six months ended June 30, 2021?
For the six months ended June 30, 2021, MainStay VP Candriam Emerging Markets Equity Portfolio returned 10.62% for Initial Class shares and 10.49% for Service Class shares. Over the same period, both share classes outperformed the 7.45% return of the MSCI Emerging Markets Index (Net) (“the Index”), which is the Portfolio’s benchmark, and the 8.81% return of the Morningstar Diversified Emerging Markets Category Average.2
Were there any changes to the Portfolio during the reporting period?
At meetings held on January 21, January 25 and February 3, 2021, the Board of Trustees (“Board”) of MainStay VP Funds Trust (“Trust”) considered and approved, among other related proposals: (i) changing the Portfolio’s name and modifying its non-fundamental “names rule” investment policy; (ii) removing MacKay Shields as a Subadvisor to the Portfolio; and (iii) modifying the Portfolio’s principal investment strategies and investment process. For more information on these and other changes refer to the supplement dated February 5, 2021.
What factors affected the Portfolio’s relative performance during the reporting period?
Candriam
During the reporting period, the portion of the Portfolio subadvised by Candriam outperformed the Index almost entirely due to stock selection effect. Our stock selection process focuses on selecting companies expected to see higher earnings growth and profitability improvement compared to their peers. The flexibility and agility of this process enabled us to add exposure on a timely basis to companies we believed likely to see significant improvements in earnings, including those positioned to benefit from the recovery of the economy that was seen in the first half of 2021. Specifically, much of the Portfolio’s relative outperformance was driven by stock selection in the financials, materials and health care sectors among companies generating increased earnings due to the rollout of vaccines and reopening of economies.
MacKay Shields
During the time MacKay Shields co-managed the Portfolio, the portion of the Portfolio subadvised by MacKay Shields outperformed the Index due to strong security selection and positive sector allocation effects. In terms of stock-selection model efficacy, valuation measures provided the most highly rewarded signals used by our quantitative stock selection model.
Which sectors were the strongest positive contributors to the Portfolio’s relative performance, and which sectors were particularly weak?
Candriam
In the portion of the Portfolio subadvised by Candriam, the strongest positive contribution to relative performance during the reporting period came from the financials sector, driven by strong stock selection and a meaningfully overweight position. (Contributions take weightings and total returns into account.) The materials and health care sectors made smaller positive contributions. The most significant detractors from relative performance during the reporting period were the consumer discretionary, consumer staples and energy sectors.
MacKay Shields
In the portion of the Portfolio subadvised by MacKay Shields, the sectors that made the most substantial positive contributions to the Portfolio’s performance relative to the Index included materials, information technology, and financials. During the time MacKay Shields managed the Portfolio, the utilities sector produced a negative contribution to return. In addition, the consumer staples sector was a weak contributor to the Portfolio’s performance.
During the reporting period, which individual stocks made the strongest positive contributions to the Portfolio’s absolute performance and which stocks detracted the most?
Candriam
In the Candriam portion of the Portfolio, the strongest positive contributions to absolute performance came from holdings in Russian fintech company TCS Group, Indian steel manufacturer JSW Steel and global semiconductor manufacturer Taiwan Semiconductor Manufacturing Company (TSMC). TCS delivered strong results driven by improving profitability, a growing client base and new growth venues in retail brokerage and small and medium enterprise (SME) banking. JSW Steel benefited from the recovery in steel demand and steel prices. TSMC stock rose as the company reported strong financial results driven by a supply/demand imbalance in the semiconductor chip manufacturing industry. Other notably strong contributors to the Portfolio’s absolute returns included Brazilian digital financial services company Banco Inter and Chinese sportswear manufacturer Li Ning. Banco Inter shares rose as the company continued to expand its user base and announced new partnerships to expand offerings. Li Ning continued to gain market share on brand elevation while delivering margin expansion via store optimization, improving operational efficiency and an improved pricing mix.
| 1. | Mr. Boudewijns will serve as a portfolio manager for the Portfolio until on or about April 1, 2022. |
| 2. | See page 5 for more information on benchmark and peer group returns. |
| 8 | MainStay VP Candriam Emerging Markets Equity Portfolio |
The most substantial detractors from absolute performance in the Candriam portion of the Portfolio were Chinese e-commerce company Pinduoduo, Chinese insurer Ping An Insurance and Chinese online education provider New Oriental Education & Technology Group. Pinduoduo stock corrected following increasing pressure from Chinese regulators on cybersecurity, data collection and uncertainty around policy guidelines. Ping An Insurance posted disappointing growth figures as the company focused on quality to meet long-term growth targets. New Oriental Education shares lost ground following tighter regulations regarding after-school and private tutoring in China. The Portfolio had already reduced exposure to Pinduoduo and New Oriental Education before the stocks suffered their sharpest declines.
MacKay Shields
During the time MacKay Shields managed the Portfolio, the stocks that made the most substantial positive contributions to the absolute performance of the MacKay Shields portion of the Portfolio included TSMC, Chinese interactive media & value-added Internet services provider Tencent, and semiconductor maker Novatek Microelectronics. Over the same period, the stocks that detracted the most from absolute performance were Pinduoduo, technology hardware storage & peripherals maker Xiaomi, and oil & gas refining & marketing firm Reliance Industries.
Did the Portfolio make any significant purchases or sales during the reporting period?
Candriam
The most significant purchases in the Candriam portion of the Portfolio during the reporting period included Chinese electric vehicle (EV) battery separator company Yunnan Energy New Material, Korean refining & petrochemical company S-Oil, and Chinese specialized semiconductor devices manufacturer Will Semiconductor. Yunnan Energy New Material showed signs of emerging as a key player in the EV battery supply chain. As one of the most efficient refiners and petrochemical players, S-Oil appeared well positioned to benefit from recovery in energy demand. Will Semiconductor was a beneficiary of tight supply and rising demand in the semiconductor industry and was a strategically positioned player in the CMOS image sensor segment, a key part of the digital camera and cellphone supply chain.
During the same period, the most significant sales in the Candriam portion of the Portfolio included positions in Xiaomi, global EV battery producer LG Chem, and Chinese petrochemical company Hengli Petrochemical. The Xiaomi position was sold after the company was placed on the U.S. blacklist earlier in the year. The LG Chem position was sold in response to the stock’s strong performance and subsequently rich valuation. The Hengli
Petrochemical position was sold due to valuation concerns and risks related to the delayed execution of new projects.
MacKay Shields
During the time MacKay Shields managed the Portfolio, the most substantial position initiated in the MacKay Shields portion of the Portfolio was in South Korea-based construction engineering company DL E&C, while the largest increased position size was in Tencent. The most substantial position that the MacKay Shields portion of the Portfolio exited entirely was in South Korean electronics company Samsung Electronics, while the most significantly decreased position size was in China-based multinational e-commerce and Internet services company Alibaba Group Holding.
How did the Portfolio’s sector weightings change during the reporting period?
Candriam
During the reporting period, the Candriam portion of the Portfolio saw its most substantial weighting increase relative to the Index in the strong-performing financials sector, making it the Portfolio’s largest overweight position. Exposure to energy and communi- cation services increased to a lesser degree. During the same period, the Portfolio saw a large decrease in its sector weightings relative to the benchmark in the consumer discretionary sector, which went from an overweight position at the beginning of the reporting period to an underweight position as of June 30, 2021. Smaller reductions in sector exposure occurred in materials and industrials.
MacKay Shields
During the time MacKay Shields managed the Portfolio, in their portion of the Portfolio, the most substantial increases in sector weightings relative to the Index were in financials and energy. Conversely, the Portfolio saw its most substantial decreases in sector weightings relative to the Index in consumer discretionary and health care.
How was the Portfolio positioned at the end of the reporting period?
Candriam
As of June 30, 2021, the sectors that were most substantially overweight relative to the Index in the Candriam portion of the Portfolio were financials, information technology and materials. As of the same date, the sectors that were most substantially underweight relative to the Index were communication services, consumer staples and consumer discretionary.
MacKay Shields
At the end of the period when MacKay Shields managed the portfolio, the sectors in their portion of the Portfolio that were
most substantially overweight relative to the Index were materials and financials. The sectors that were most substantially underweight relative to the Index were information technology and consumer discretionary.
The opinions expressed are those of the portfolio managers as of the date of this report and are subject to change. There is no guarantee that any forecasts will come to pass. This material does not constitute investment advice and is not intended as an endorsement of any specific investment.
Not all MainStay VP Portfolios and/or share classes are available under all policies.
| 10 | MainStay VP Candriam Emerging Markets Equity Portfolio |
Portfolio of Investments June 30, 2021† (Unaudited)
| | Shares | Value |
| Common Stocks 97.5% |
| Argentina 0.4% |
| MercadoLibre, Inc. (Internet & Direct Marketing Retail) (a) | 940 | $ 1,464,323 |
| Brazil 6.3% |
| Banco BTG Pactual SA (Capital Markets) | 121,000 | 2,969,412 |
| Banco Inter SA (Banks) | 201,000 | 3,143,631 |
| Banco Santander Brasil SA (Banks) | 640,000 | 5,211,307 |
| Cosan SA (Oil, Gas & Consumable Fuels) | 1,040,000 | 5,009,932 |
| Localiza Rent a Car SA (Road & Rail) | 122,500 | 1,576,260 |
| Notre Dame Intermedica Participacoes SA (Health Care Providers & Services) | 100,000 | 1,707,547 |
| Pagseguro Digital Ltd., Class A (IT Services) (a) | 20,000 | 1,118,400 |
| WEG SA (Electrical Equipment) | 264,000 | 1,788,202 |
| | | 22,524,691 |
| Canada 0.1% |
| Pan American Silver Corp. (Metals & Mining) | 10,000 | 285,700 |
| China 39.9% |
| Aier Eye Hospital Group Co. Ltd., Class A (Health Care Providers & Services) | 171,057 | 1,879,087 |
| Air China Ltd., Class H (Airlines) | 1,320,000 | 970,751 |
| Airtac International Group (Machinery) | 61,000 | 2,353,522 |
| Alibaba Group Holding Ltd. Sponsored ADR(Internet & Direct Marketing Retail) (a) | 26,000 | 5,896,280 |
| Alibaba Group Holding Ltd. (Internet & Direct Marketing Retail) (a) | 266,000 | 7,537,061 |
| Alibaba Health Information Technology Ltd. (Health Care Technology) (a) | 320,000 | 709,710 |
| Asia Cement China Holdings Corp. (Construction Materials) | 15,500 | 12,138 |
| Baidu, Inc. Sponsored ADR(Interactive Media & Services) (a) | 13,600 | 2,773,040 |
| Bank of Ningbo Co. Ltd., Class A (Banks) | 390,857 | 2,357,319 |
| Bilibili, Inc. Sponsored ADR(Entertainment) (a) | 15,000 | 1,827,600 |
| Brilliance China Automotive Holdings Ltd. (Automobiles) (b)(c)(d) | 1,142,000 | 536,855 |
| BYD Co. Ltd., Class H (Automobiles) | 18,000 | 538,310 |
| CanSino Biologics, Inc., Class H (Pharmaceuticals) (a)(e) | 34,000 | 1,806,782 |
| China Construction Bank Corp., Class H (Banks) | 7,000,000 | 5,508,546 |
| | Shares | Value |
| |
| China (continued) |
| China Feihe Ltd. (Food Products) (e) | 600,000 | $ 1,295,159 |
| China Mengniu Dairy Co. Ltd. (Food Products) | 230,000 | 1,390,789 |
| China Merchants Bank Co. Ltd., Class H (Banks) | 660,000 | 5,631,544 |
| China Molybdenum Co. Ltd., Class H (Metals & Mining) | 2,140,660 | 1,271,002 |
| China Petroleum & Chemical Corp., Class H (Oil, Gas & Consumable Fuels) | 4,400,000 | 2,227,116 |
| China Tourism Group Duty Free Corp. Ltd., Class A (Specialty Retail) | 40,000 | 1,857,787 |
| Chongqing Zhifei Biological Products Co. Ltd., Class A (Biotechnology) | 55,992 | 1,618,118 |
| CIFI Holdings Group Co. Ltd. (Real Estate Management & Development) | 1,960,000 | 1,529,771 |
| Contemporary Amperex Technology Co. Ltd., Class A (Electrical Equipment) | 38,906 | 3,220,164 |
| Country Garden Services Holdings Co. Ltd. (Commercial Services & Supplies) | 239,000 | 2,582,602 |
| East Money Information Co. Ltd., Class A (Capital Markets) | 350,178 | 1,777,053 |
| Ecovacs Robotics Co. Ltd., Class A (Household Durables) | 10,975 | 387,402 |
| ENN Energy Holdings Ltd. (Gas Utilities) | 120,000 | 2,284,301 |
| Focus Media Information Technology Co. Ltd., Class A (Media) | 799,991 | 1,165,050 |
| Ganfeng Lithium Co. Ltd., Class A (Metals & Mining) | 83,994 | 1,574,079 |
| Geely Automobile Holdings Ltd. (Automobiles) | 220,000 | 692,786 |
| JD.com, Inc. ADR (Internet & Direct Marketing Retail) (a) | 34,000 | 2,713,540 |
| Jiumaojiu International Holdings Ltd. (Hotels, Restaurants & Leisure) (e) | 190,000 | 776,953 |
| Lenovo Group Ltd. (Technology Hardware, Storage & Peripherals) | 1,740,000 | 2,001,236 |
| Li Ning Co. Ltd. (Textiles, Apparel & Luxury Goods) | 290,000 | 3,540,821 |
| Longfor Group Holdings Ltd. (Real Estate Management & Development) | 400,000 | 2,241,026 |
| LONGi Green Energy Technology Co. Ltd., Class A (Semiconductors & Semiconductor Equipment) | 131,600 | 1,809,399 |
| Meituan (Internet & Direct Marketing Retail) (a) | 168,000 | 6,932,653 |
| MMG Ltd. (Metals & Mining) (a) | 1,760,000 | 775,241 |
| NIO, Inc. ADR (Automobiles) (a) | 69,000 | 3,670,800 |
The notes to the financial statements are an integral part of, and should be read in conjunction with, the financial statements.
11
Portfolio of Investments June 30, 2021† (Unaudited) (continued)
| | Shares | Value |
| Common Stocks (continued) |
| China (continued) |
| Pinduoduo, Inc. ADR (Internet & Direct Marketing Retail) (a) | 19,000 | $ 2,413,380 |
| Ping An Bank Co. Ltd., Class A (Banks) | 500,997 | 1,753,871 |
| Ping An Insurance Group Co. of China Ltd., Class H (Insurance) | 392,000 | 3,839,573 |
| Sany Heavy Industry Co. Ltd., Class A (Machinery) | 333,906 | 1,502,240 |
| Shandong Linglong Tyre Co. Ltd., Class A (Auto Components) | 244,000 | 1,651,728 |
| Shandong Pharmaceutical Glass Co. Ltd., Class A (Health Care Equipment & Supplies) | 119,956 | 630,277 |
| Shandong Sinocera Functional Material Co. Ltd., Class A (Chemicals) | 160,482 | 1,210,796 |
| Shenzhen Inovance Technology Co. Ltd., Class A (Machinery) | 150,000 | 1,723,916 |
| Shenzhen Mindray Bio-Medical Electronics Co. Ltd., Class A (Health Care Equipment & Supplies) | 18,964 | 1,408,920 |
| Silergy Corp. (Semiconductors & Semiconductor Equipment) | 20,200 | 2,747,708 |
| Sunny Optical Technology Group Co. Ltd. (Electronic Equipment, Instruments & Components) | 75,000 | 2,370,465 |
| Tencent Holdings Ltd. (Interactive Media & Services) | 181,000 | 13,614,106 |
| Vipshop Holdings Ltd. ADR (Internet & Direct Marketing Retail) (a) | 56,000 | 1,124,480 |
| Will Semiconductor Co. Ltd. Shanghai, Class A (Semiconductors & Semiconductor Equipment) | 47,006 | 2,342,498 |
| Wuxi Biologics Cayman, Inc. (Life Sciences Tools & Services) (a)(e) | 252,000 | 4,618,523 |
| Wuxi Lead Intelligent Equipment Co. Ltd., Class A (Electronic Equipment, Instruments & Components) | 175,984 | 1,637,973 |
| Xinyi Solar Holdings Ltd. (Semiconductors & Semiconductor Equipment) | 900,000 | 1,942,738 |
| Yantai Jereh Oilfield Services Group Co. Ltd., Class A (Energy Equipment & Services) | 325,899 | 2,254,554 |
| Yonyou Network Technology Co. Ltd., Class A (Software) | 112,000 | 576,515 |
| Yunnan Energy New Material Co. Ltd. (Containers & Packaging) | 87,916 | 3,185,219 |
| | | 142,222,873 |
| | Shares | Value |
| |
| Greece 0.0% ‡ |
| FF Group (Textiles, Apparel & Luxury Goods) (a)(b)(c)(d) | 19,000 | $ 0 |
| Hong Kong 1.8% |
| AIA Group Ltd. (Insurance) | 124,000 | 1,541,156 |
| China Lumena New Materials Corp. (Chemicals) (a)(b)(c)(d) | 6,500 | 0 |
| China Metal Recycling Holdings Ltd. (Metals & Mining) (a)(b)(c)(d) | 75,000 | 0 |
| Hong Kong Exchanges & Clearing Ltd. (Capital Markets) | 20,000 | 1,192,123 |
| Nine Dragons Paper Holdings Ltd. (Paper & Forest Products) | 980,000 | 1,257,138 |
| Xinyi Glass Holdings Ltd. (Building Products) | 580,000 | 2,364,283 |
| | | 6,354,700 |
| Hungary 0.2% |
| OTP Bank Nyrt. (Banks) (a) | 16,000 | 861,357 |
| India 11.9% |
| Adani Ports & Special Economic Zone Ltd. (Transportation Infrastructure) | 28,000 | 265,083 |
| Asian Paints Ltd. (Chemicals) | 34,000 | 1,368,920 |
| Bajaj Finance Ltd. (Consumer Finance) | 34,000 | 2,751,768 |
| Divi's Laboratories Ltd. (Life Sciences Tools & Services) (a) | 29,671 | 1,759,682 |
| GAIL India Ltd. (Gas Utilities) | 900,000 | 1,811,987 |
| Graphite India Ltd. (Electrical Equipment) | 192,000 | 1,646,323 |
| Grasim Industries Ltd. (Construction Materials) | 110,000 | 2,217,981 |
| HDFC Bank Ltd. (Banks) | 155,078 | 3,125,136 |
| ICICI Bank Ltd. (Banks) | 504,000 | 4,277,864 |
| ICICI Lombard General Insurance Co. Ltd. (Insurance) (e) | 36,000 | 758,940 |
| Info Edge India Ltd. (Interactive Media & Services) | 27,000 | 1,785,621 |
| Infosys Ltd. (IT Services) | 218,000 | 4,636,276 |
| JSW Steel Ltd. (Metals & Mining) | 470,000 | 4,324,405 |
| Jubilant Foodworks Ltd. (Hotels, Restaurants & Leisure) (a) | 29,922 | 1,239,953 |
| Motherson Sumi Systems Ltd. (Auto Components) (a) | 470,978 | 1,534,021 |
| Reliance Industries Ltd. (Oil, Gas & Consumable Fuels) | 134,000 | 3,805,019 |
| State Bank of India (Banks) | 540,000 | 3,045,446 |
The notes to the financial statements are an integral part of, and should be read in conjunction with, the financial statements.
| 12 | MainStay VP Candriam Emerging Markets Equity Portfolio |
| | Shares | Value |
| Common Stocks (continued) |
| India (continued) |
| Tata Consumer Products Ltd. (Food Products) | 190,000 | $ 1,928,373 |
| | | 42,282,798 |
| Indonesia 0.7% |
| Bank Central Asia Tbk. PT (Banks) | 1,220,000 | 2,534,655 |
| Mexico 2.0% |
| Alsea SAB de CV (Hotels, Restaurants & Leisure) (a) | 780,000 | 1,387,910 |
| Grupo Financiero Banorte SAB de CV, Class O (Banks) | 470,000 | 3,035,878 |
| Ternium SA Sponsored ADR(Metals & Mining) | 67,000 | 2,576,820 |
| | | 7,000,608 |
| Peru 0.7% |
| Southern Copper Corp. (Metals & Mining) | 36,400 | 2,341,248 |
| Poland 1.3% |
| Dino Polska SA (Food & Staples Retailing) (a)(e) | 26,000 | 1,908,576 |
| KGHM Polska Miedz SA (Metals & Mining) | 11,000 | 541,345 |
| Powszechny Zaklad Ubezpieczen SA (Insurance) | 228,000 | 2,194,493 |
| | | 4,644,414 |
| Republic of Korea 12.9% |
| Amorepacific Corp. (Personal Products) | 3,200 | 716,068 |
| Kakao Corp. (Interactive Media & Services) | 27,000 | 3,908,005 |
| KB Financial Group, Inc. (Banks) | 124,000 | 6,144,119 |
| Kia Corp. (Automobiles) | 57,000 | 4,535,097 |
| NAVER Corp. (Interactive Media & Services) | 3,500 | 1,297,563 |
| Samsung C&T Corp. (Industrial Conglomerates) | 11,000 | 1,333,304 |
| Samsung Electro-Mechanics Co. Ltd. (Electronic Equipment, Instruments & Components) | 10,800 | 1,697,465 |
| Samsung Electronics Co. Ltd. (Technology Hardware, Storage & Peripherals) | 215,000 | 15,406,917 |
| Samsung Engineering Co. Ltd. (Construction & Engineering) (a) | 56,000 | 1,188,474 |
| Samsung SDI Co. Ltd. (Electronic Equipment, Instruments & Components) | 4,400 | 2,727,168 |
| SK Hynix, Inc. (Semiconductors & Semiconductor Equipment) | 37,600 | 4,256,982 |
| | Shares | Value |
| |
| Republic of Korea (continued) |
| S-Oil Corp. (Oil, Gas & Consumable Fuels) | 32,000 | $ 2,912,578 |
| | | 46,123,740 |
| Russia 3.4% |
| HeadHunter Group plc ADR (Professional Services) | 14,000 | 593,180 |
| Mobile TeleSystems PJSC Sponsored ADR(Wireless Telecommunication Services) | 64,000 | 592,640 |
| Polymetal International plc (Metals & Mining) | 102,000 | 2,193,347 |
| Tatneft PJSC (Oil, Gas & Consumable Fuels) | 68,694 | 499,012 |
| TCS Group Holding plc (Registered) GDR (Banks) | 67,000 | 5,862,500 |
| Yandex NV, Class A (Interactive Media & Services) (a) | 36,000 | 2,547,000 |
| | | 12,287,679 |
| South Africa 3.3% |
| Capitec Bank Holdings Ltd. (Banks) | 16,000 | 1,889,614 |
| Impala Platinum Holdings Ltd. (Metals & Mining) | 148,000 | 2,440,653 |
| Kumba Iron Ore Ltd. (Metals & Mining) | 38,000 | 1,704,651 |
| Naspers Ltd., Class N (Internet & Direct Marketing Retail) | 26,800 | 5,626,855 |
| | | 11,661,773 |
| Taiwan 11.3% |
| Accton Technology Corp. (Communications Equipment) | 170,000 | 2,016,510 |
| Alchip Technologies Ltd. (Semiconductors & Semiconductor Equipment) | 60,000 | 1,315,747 |
| ASPEED Technology, Inc. (Semiconductors & Semiconductor Equipment) | 22,000 | 1,587,079 |
| Chailease Holding Co. Ltd. (Diversified Financial Services) (a) | 640,000 | 4,651,413 |
| Delta Electronics, Inc. (Electronic Equipment, Instruments & Components) | 260,000 | 2,827,456 |
| Globalwafers Co. Ltd. (Semiconductors & Semiconductor Equipment) | 66,000 | 2,176,905 |
| MediaTek, Inc. (Semiconductors & Semiconductor Equipment) | 150,000 | 5,179,004 |
| Realtek Semiconductor Corp. (Semiconductors & Semiconductor Equipment) | 122,000 | 2,211,216 |
| Taiwan Semiconductor Manufacturing Co. Ltd. (Semiconductors & Semiconductor Equipment) | 780,000 | 16,656,797 |
The notes to the financial statements are an integral part of, and should be read in conjunction with, the financial statements.
13
Portfolio of Investments June 30, 2021† (Unaudited) (continued)
| | Shares | | Value |
| Common Stocks (continued) |
| Taiwan (continued) |
| Wiwynn Corp. (Technology Hardware, Storage & Peripherals) | 42,000 | | $ 1,502,880 |
| | | | 40,125,007 |
| Thailand 1.1% |
| Carabao Group PCL NVDR (Beverages) | 200,000 | | 882,995 |
| Energy Absolute PCL NVDR (Independent Power and Renewable Electricity Producers) (f) | 720,800 | �� | 1,371,882 |
| Srisawad Corp. PCL NVDR (Consumer Finance) (f) | 860,000 | | 1,844,774 |
| | | | 4,099,651 |
| Turkey 0.2% |
| Ford Otomotiv Sanayi A/S (Automobiles) | 33,000 | | 645,086 |
Total Common Stocks
(Cost $272,151,805) | | | 347,460,303 |
| Preferred Stocks 1.1% |
| Brazil 0.6% |
| Petroleo Brasileiro SA (Oil, Gas & Consumable Fuels) 2.69% | 380,000 | | 2,248,462 |
| Chile 0.5% |
| Sociedad Quimica y Minera de Chile SA, Sponsored ADR (Chemicals) 0.35% | 34,000 | | 1,609,220 |
Total Preferred Stocks
(Cost $3,685,015) | | | 3,857,682 |
Total Investments
(Cost $275,836,820) | 98.6% | | 351,317,985 |
| Other Assets, Less Liabilities | 1.4 | | 4,900,649 |
| Net Assets | 100.0% | | $ 356,218,634 |
| † | Percentages indicated are based on Portfolio net assets. |
| ‡ | Less than one-tenth of a percent. |
| (a) | Non-income producing security. |
| (b) | Fair valued security—Represents fair value as measured in good faith under procedures approved by the Board of Trustees. As of June 30, 2021, the total market value was $536,855, which represented 0.2% of the Portfolio’s net assets. |
| (c) | Illiquid security—As of June 30, 2021, the total market value deemed illiquid under procedures approved by the Board of Trustees was $536,855, which represented 0.2% of the Portfolio’s net assets. |
| (d) | Security in which significant unobservable inputs (Level 3) were used in determining fair value. |
| (e) | May be sold to institutional investors only under Rule 144A or securities offered pursuant to Section 4(a)(2) of the Securities Act of 1933, as amended. |
| (f) | All or a portion of this security was held on loan. As of June 30, 2021, the aggregate market value of securities on loan was $2,668,396. The market value of the collateral held included non-cash collateral in the form of U.S. Treasury securities with a value of $2,868,202. (See Note 2(J)) |
| Abbreviation(s): |
| ADR—American Depositary Receipt |
| GDR—Global Depositary Receipt |
| NVDR—Non-Voting Depositary Receipt |
| PCL—Provision for Credit Losses |
The notes to the financial statements are an integral part of, and should be read in conjunction with, the financial statements.
| 14 | MainStay VP Candriam Emerging Markets Equity Portfolio |
The following is a summary of the fair valuations according to the inputs used as of June 30, 2021, for valuing the Portfolio’s assets:
| Description | Quoted
Prices in
Active
Markets for
Identical
Assets
(Level 1) | | Significant
Other
Observable
Inputs
(Level 2) | | Significant
Unobservable
Inputs
(Level 3) | | Total |
| Asset Valuation Inputs | | | | | | | |
| Investments in Securities (a) | | | | | | | |
| Common Stocks | $ 346,923,448 | | $ — | | $ 536,855 | | $ 347,460,303 |
| Preferred Stocks | 3,857,682 | | — | | — | | 3,857,682 |
| Total Investments in Securities | $ 350,781,130 | | $ — | | $ 536,855 | | $ 351,317,985 |
| (a) | For a complete listing of investments and their industries, see the Portfolio of Investments. |
The notes to the financial statements are an integral part of, and should be read in conjunction with, the financial statements.
15
Portfolio of Investments June 30, 2021† (Unaudited) (continued)
The table below sets forth the diversification of the Portfolio’s investments by industry.
Industry Diversification
| | Value | Percent |
| Airlines | $ 970,751 | 0.3% |
| Auto Components | 3,185,749 | 0.9 |
| Automobiles | 10,618,934 | 2.9 |
| Banks | 54,382,787 | 15.3 |
| Beverages | 882,995 | 0.2 |
| Biotechnology | 1,618,118 | 0.5 |
| Building Products | 2,364,283 | 0.7 |
| Capital Markets | 5,938,588 | 1.6 |
| Chemicals | 4,188,936 | 1.2 |
| Commercial Services & Supplies | 2,582,602 | 0.7 |
| Communications Equipment | 2,016,510 | 0.6 |
| Construction & Engineering | 1,188,474 | 0.3 |
| Construction Materials | 2,230,119 | 0.6 |
| Consumer Finance | 4,596,542 | 1.3 |
| Containers & Packaging | 3,185,219 | 0.9 |
| Diversified Financial Services | 4,651,413 | 1.3 |
| Electrical Equipment | 6,654,689 | 1.9 |
| Electronic Equipment, Instruments & Components | 11,260,527 | 3.3 |
| Energy Equipment & Services | 2,254,554 | 0.6 |
| Entertainment | 1,827,600 | 0.5 |
| Food & Staples Retailing | 1,908,576 | 0.5 |
| Food Products | 4,614,321 | 1.3 |
| Gas Utilities | 4,096,288 | 1.1 |
| Health Care Equipment & Supplies | 2,039,197 | 0.5 |
| Health Care Providers & Services | 3,586,634 | 1.0 |
| Health Care Technology | 709,710 | 0.2 |
| Hotels, Restaurants & Leisure | 3,404,816 | 0.9 |
| Household Durables | 387,402 | 0.1 |
| Independent Power and Renewable Electricity Producers | 1,371,882 | 0.4 |
| Industrial Conglomerates | 1,333,304 | 0.4 |
| Insurance | 8,334,162 | 2.3 |
| Interactive Media & Services | 25,925,335 | 7.2 |
| Internet & Direct Marketing Retail | 33,708,572 | 9.5 |
| IT Services | 5,754,676 | 1.6 |
| Life Sciences Tools & Services | 6,378,205 | 1.8 |
| Machinery | 5,579,678 | 1.6 |
| Media | 1,165,050 | 0.3 |
| Metals & Mining | 20,028,491 | 5.7 |
| Oil, Gas & Consumable Fuels | 16,702,119 | 4.6 |
| Paper & Forest Products | 1,257,138 | 0.4 |
| Personal Products | 716,068 | 0.2 |
| Pharmaceuticals | 1,806,782 | 0.5 |
| Professional Services | 593,180 | 0.2 |
| | Value | | Percent |
| Real Estate Management & Development | $ 3,770,797 | | 1.0% |
| Road & Rail | 1,576,260 | | 0.4 |
| Semiconductors & Semiconductor Equipment | 42,226,073 | | 11.9 |
| Software | 576,515 | | 0.2 |
| Specialty Retail | 1,857,787 | | 0.6 |
| Technology Hardware, Storage & Peripherals | 18,911,033 | | 5.3 |
| Textiles, Apparel & Luxury Goods | 3,540,821 | | 1.0 |
| Transportation Infrastructure | 265,083 | | 0.1 |
| Wireless Telecommunication Services | 592,640 | | 0.2 |
| | 351,317,985 | | 98.6 |
| Other Assets, Less Liabilities | 4,900,649 | | 1.4 |
| Net Assets | $356,218,634 | | 100.0% |
| † | Percentages indicated are based on Portfolio net assets. |
The notes to the financial statements are an integral part of, and should be read in conjunction with, the financial statements.
| 16 | MainStay VP Candriam Emerging Markets Equity Portfolio |
Statement of Assets and Liabilities as of June 30, 2021 (Unaudited)
| Assets |
Investment in securities, at value
(identified cost $275,836,820) including securities on loan of $2,668,396 | $351,317,985 |
| Cash | 5,176,247 |
Cash denominated in foreign currencies
(identified cost $1,368,079) | 1,364,698 |
| Receivables: | |
| Investment securities sold | 1,839,487 |
| Dividends and interest | 520,726 |
| Securities lending | 2,151 |
| Other assets | 3,070 |
| Total assets | 360,224,364 |
| Liabilities |
| Payables: | |
| Investment securities purchased | 2,280,956 |
| Foreign capital gains tax (See Note 2) | 1,034,402 |
| Manager (See Note 3) | 291,543 |
| Custodian | 225,935 |
| Portfolio shares redeemed | 91,948 |
| Professional fees | 30,172 |
| NYLIFE Distributors (See Note 3) | 24,052 |
| Shareholder communication | 16,524 |
| Dividend payable | 3,664 |
| Trustees | 147 |
| Accrued expenses | 6,387 |
| Total liabilities | 4,005,730 |
| Net assets | $356,218,634 |
| Composition of Net Assets |
| Shares of beneficial interest outstanding (par value of $.001 per share) unlimited number of shares authorized | $ 27,976 |
| Additional paid-in-capital | 249,908,275 |
| | 249,936,251 |
| Total distributable earnings (loss) | 106,282,383 |
| Net assets | $356,218,634 |
| Initial Class | |
| Net assets applicable to outstanding shares | $238,610,603 |
| Shares of beneficial interest outstanding | 18,733,698 |
| Net asset value per share outstanding | $ 12.74 |
| Service Class | |
| Net assets applicable to outstanding shares | $117,608,031 |
| Shares of beneficial interest outstanding | 9,242,402 |
| Net asset value per share outstanding | $ 12.72 |
The notes to the financial statements are an integral part of, and should be read in conjunction with, the financial statements.
17
Statement of Operations for the six months ended June 30, 2021 (Unaudited)
| Investment Income (Loss) |
| Income | |
| Dividends (net of foreign tax withholding of $477,673) | $ 3,458,949 |
| Securities lending | 27,547 |
| Total income | 3,486,496 |
| Expenses | |
| Manager (See Note 3) | 1,810,103 |
| Custodian | 192,512 |
| Distribution/Service—Service Class (See Note 3) | 148,332 |
| Professional fees | 72,671 |
| Shareholder communication | 33,085 |
| Trustees | 3,832 |
| Miscellaneous | 15,376 |
| Total expenses before waiver/reimbursement | 2,275,911 |
| Expense waiver/reimbursement from Manager (See Note 3) | (25,829) |
| Net expenses | 2,250,082 |
| Net investment income (loss) | 1,236,414 |
| Realized and Unrealized Gain (Loss) |
| Net realized gain (loss) on: | |
| Unaffiliated investment transactions(a) | 60,439,666 |
| Foreign currency transactions | (350,928) |
| Net realized gain (loss) | 60,088,738 |
| Net change in unrealized appreciation (depreciation) on: | |
| Unaffiliated investments(b) | (22,442,146) |
| Translation of other assets and liabilities in foreign currencies | (15,797) |
| Net change in unrealized appreciation (depreciation) | (22,457,943) |
| Net realized and unrealized gain (loss) | 37,630,795 |
| Net increase (decrease) in net assets resulting from operations | $ 38,867,209 |
| (a) | Realized gain (loss) on security transactions recorded net of foreign capital gains tax in the amount of $(93,221). |
| (b) | Net change in unrealized appreciation (depreciation) on investments recorded net of foreign capital gains tax in the amount of $(862,130). |
The notes to the financial statements are an integral part of, and should be read in conjunction with, the financial statements.
| 18 | MainStay VP Candriam Emerging Markets Equity Portfolio |
Statements of Changes in Net Assets
for the six months ended June 30, 2021 (Unaudited) and the year ended December 31, 2020
| | 2021 | 2020 |
| Increase (Decrease) in Net Assets |
| Operations: | | |
| Net investment income (loss) | $ 1,236,414 | $ 2,436,450 |
| Net realized gain (loss) | 60,088,738 | 22,540,454 |
| Net change in unrealized appreciation (depreciation) | (22,457,943) | 50,658,697 |
| Net increase (decrease) in net assets resulting from operations | 38,867,209 | 75,635,601 |
| Distributions to shareholders: | | |
| Initial Class | — | (7,555,963) |
| Service Class | — | (3,147,716) |
| Total distributions to shareholders | — | (10,703,679) |
| Capital share transactions: | | |
| Net proceeds from sales of shares | 1,056,102 | 2,857,868 |
| Net asset value of shares issued to shareholder in reinvestment of distributions | — | 10,703,679 |
| Cost of shares redeemed | (62,087,763) | (100,193,578) |
| Increase (decrease) in net assets derived from capital share transactions | (61,031,661) | (86,632,031) |
| Net increase (decrease) in net assets | (22,164,452) | (21,700,109) |
| Net Assets |
| Beginning of period | 378,383,086 | 400,083,195 |
| End of period | $356,218,634 | $ 378,383,086 |
The notes to the financial statements are an integral part of, and should be read in conjunction with, the financial statements.
19
Financial Highlights selected per share data and ratios
| | Six months ended
June 30,
2021* | | Year Ended December 31, |
| Initial Class | 2020 | | 2019 | | 2018 | | 2017 | | 2016 |
| Net asset value at beginning of period | $ 11.51 | | $ 9.46 | | $ 7.99 | | $ 10.22 | | $ 7.22 | | $ 6.83 |
| Net investment income (loss) (a) | 0.05 | | 0.07 | | 0.19 | | 0.12 | | 0.09 | | 0.06 |
| Net realized and unrealized gain (loss) on investments | 1.19 | | 2.32 | | 1.42 | | (2.19) | | 3.03 | | 0.37 |
| Net realized and unrealized gain (loss) on foreign currency transactions | (0.01) | | (0.02) | | (0.01) | | (0.02) | | (0.01) | | (0.01) |
| Total from investment operations | 1.23 | | 2.37 | | 1.60 | | (2.09) | | 3.11 | | 0.42 |
| Less distributions: | | | | | | | | | | | |
| From net investment income | — | | (0.32) | | (0.13) | | (0.14) | | (0.11) | | (0.03) |
| Net asset value at end of period | $ 12.74 | | $ 11.51 | | $ 9.46 | | $ 7.99 | | $ 10.22 | | $ 7.22 |
| Total investment return (b) | 10.69%(c) | | 25.71% | | 20.08% | | (20.55)% | | 43.12% | | 6.23% |
| Ratios (to average net assets)/Supplemental Data: | | | | | | | | | | | |
| Net investment income (loss) | 0.76%†† | | 0.79% | | 2.18% | | 1.27% | | 0.94% | | 0.91%(d) |
| Net expenses (e)(f) | 1.16%†† | | 1.18% | | 1.17% | | 1.16% | | 1.24% | | 1.29%(g) |
| Expenses (before waiver/reimbursement) (e) | 1.18%†† | | 1.18% | | 1.17% | | 1.16% | | 1.24% | | 1.29% |
| Portfolio turnover rate | 26% | | 123% | | 121% | | 135% | | 149% | | 123% |
| Net assets at end of period (in 000’s) | $ 238,611 | | $ 257,933 | | $ 273,042 | | $ 371,834 | | $ 497,861 | | $ 257,593 |
| * | Unaudited. |
| †† | Annualized. |
| (a) | Per share data based on average shares outstanding during the period. |
| (b) | Total return does not reflect any deduction of sales charges, mortality and expense charges, contract charges or administrative charges. For periods of less than one year, total return is not annualized. |
| (c) | Total investment return may reflect adjustments to conform to generally accepted accounting principles. |
| (d) | Without the custody fee reimbursement, net investment income (loss) would have been 0.83%. |
| (e) | In addition to the fees and expenses which the Portfolio bears directly, it also indirectly bears a pro-rata share of the fees and expenses of the underlying funds in which it invests. Such indirect expenses are not included in the above expense ratios. |
| (f) | The expense ratios presented below show the impact of short sales expense: |
| Period Ended | | Net Expenses
(excluding short
sale expenses) | | Short Sales
Expenses |
| June 30, 2021 | | 1.16% | | — |
| December 31, 2020 | | 1.18% | | — |
| December 31, 2019 | | 1.17% | | — |
| December 31, 2018 | | 1.16% | | — |
| December 31, 2017 | | 1.24% | | 0.00%(h) |
| December 31, 2016 | | 1.29% | | 0.00%(h) |
| (g) | Without the custody fee reimbursement, net expenses would have been 1.37%. |
The notes to the financial statements are an integral part of, and should be read in conjunction with, the financial statements.
| 20 | MainStay VP Candriam Emerging Markets Equity Portfolio |
Financial Highlights selected per share data and ratios
| | Six months ended
June 30,
2021* | | Year Ended December 31, |
| Service Class | 2020 | | 2019 | | 2018 | | 2017 | | 2016 |
| Net asset value at beginning of period | $ 11.52 | | $ 9.45 | | $ 7.98 | | $ 10.20 | | $ 7.21 | | $ 6.82 |
| Net investment income (loss) (a) | 0.03 | | 0.05 | | 0.17 | | 0.10 | | 0.07 | | 0.05 |
| Net realized and unrealized gain (loss) on investments | 1.18 | | 2.33 | | 1.41 | | (2.19) | | 3.02 | | 0.36 |
| Net realized and unrealized gain (loss) on foreign currency transactions | (0.01) | | (0.02) | | (0.01) | | (0.02) | | (0.01) | | (0.01) |
| Total from investment operations | 1.20 | | 2.36 | | 1.57 | | (2.11) | | 3.08 | | 0.40 |
| Less distributions: | | | | | | | | | | | |
| From net investment income | — | | (0.29) | | (0.10) | | (0.11) | | (0.09) | | (0.01) |
| Net asset value at end of period | $ 12.72 | | $ 11.52 | | $ 9.45 | | $ 7.98 | | $ 10.20 | | $ 7.21 |
| Total investment return (b) | 10.42%(c) | | 25.40% | | 19.78% | | (20.74)% | | 42.77% | | 5.96% |
| Ratios (to average net assets)/Supplemental Data: | | | | | | | | | | | |
| Net investment income (loss) | 0.52%†† | | 0.57% | | 2.00% | | 1.07% | | 0.73% | | 0.69%(d) |
| Net expenses (e)(f) | 1.41%†† | | 1.43% | | 1.42% | | 1.41% | | 1.49% | | 1.55%(g) |
| Expenses (before waiver/reimbursement) (e) | 1.43%†† | | 1.43% | | 1.42% | | 1.41% | | 1.49% | | 1.55% |
| Portfolio turnover rate | 26% | | 123% | | 121% | | 135% | | 149% | | 123% |
| Net assets at end of period (in 000’s) | $ 117,608 | | $ 120,450 | | $ 127,042 | | $ 131,498 | | $ 208,590 | | $ 155,777 |
| * | Unaudited. |
| †† | Annualized. |
| (a) | Per share data based on average shares outstanding during the period. |
| (b) | Total return does not reflect any deduction of sales charges, mortality and expense charges, contract charges or administrative charges. For periods of less than one year, total return is not annualized. |
| (c) | Total investment return may reflect adjustments to conform to generally accepted accounting principles. |
| (d) | Without the custody fee reimbursement, net investment income (loss) would have been 0.62%. |
| (e) | In addition to the fees and expenses which the Portfolio bears directly, it also indirectly bears a pro-rata share of the fees and expenses of the underlying funds in which it invests. Such indirect expenses are not included in the above expense ratios. |
| (f) | The expense ratios presented below show the impact of short sales expense: |
| Period Ended | | Net Expenses
(excluding short
sale expenses) | | Short Sales
Expenses |
| June 30, 2021 | | 1.41% | | — |
| December 31, 2020 | | 1.43% | | — |
| December 31, 2019 | | 1.42% | | — |
| December 31, 2018 | | 1.41% | | — |
| December 31, 2017 | | 1.49% | | 0.00%(h) |
| December 31, 2016 | | 1.55% | | 0.00%(h) |
| (g) | Without the custody fee reimbursement, net expenses would have been 1.62%. |
The notes to the financial statements are an integral part of, and should be read in conjunction with, the financial statements.
21
Notes to Financial Statements (Unaudited)
Note 1–Organization and Business
MainStay VP Funds Trust (the “Fund”) was organized as a Delaware statutory trust on February 1, 2011. The Fund is registered under the Investment Company Act of 1940, as amended (the “1940 Act”), as an open-end management investment company. The Fund is comprised of thirty-one separate series (collectively referred to as the “Portfolios”). These financial statements and notes relate to the MainStay VP Candriam Emerging Markets Equity Portfolio (formerly known as MainStay VP Emerging Markets Equity Portfolio) (the "Portfolio"), a "diversified” portfolio, as that term is defined in the 1940 Act, as interpreted or modified by regulatory authorities having jurisdiction, from time to time.
Shares of the Portfolio are currently offered to certain separate accounts to fund variable annuity policies and variable universal life insurance policies issued by New York Life Insurance and Annuity Corporation (“NYLIAC”), a wholly-owned subsidiary of New York Life Insurance Company (“New York Life”) and may also be offered to fund variable annuity policies and variable universal life insurance policies issued by other insurance companies. NYLIAC allocates shares of the Portfolios to, among others, certain NYLIAC separate accounts. Shares of the Portfolio are also offered to the MainStay VP Conservative Allocation Portfolio, MainStay VP Moderate Allocation Portfolio, MainStay VP Growth Allocation Portfolio (formerly known as MainStay VP Moderate Growth Allocation Portfolio) and MainStay VP Equity Allocation Portfolio (formerly known as MainStay VP Growth Allocation Portfolio), which operate as “funds-of-funds," and other variable insurance funds.
The following table lists the Portfolio's share classes that have been registered and commenced operations:
| Class | Commenced Operations |
| Initial Class | February 17, 2012 |
| Service Class | February 17, 2012 |
Shares of the Portfolio are offered and are redeemed at a price equal to their respective net asset value (“NAV”) per share. No sales or redemption charge is applicable to the purchase or redemption of the Portfolio's shares. Under the terms of the Fund’s multiple class plan, adopted pursuant to Rule 18f-3 under the 1940 Act, the classes differ in that, among other things, Service Class shares of the Portfolio pay a combined distribution and service fee of 0.25% of average daily net assets attributable to Service Class shares of the Portfolio to the Distributor (as defined in Note 3(B)) pursuant to a plan adopted in accordance with Rule 12b-1 under the 1940 Act. Contract owners of variable annuity contracts purchased after June 2, 2003, are permitted to invest only in the Service Class shares.
The Portfolio's investment objective is to seek long-term capital appreciation.
Note 2–Significant Accounting Policies
The Portfolio is an investment company and accordingly follows the investment company accounting and reporting guidance of the Financial Accounting Standards Board (“FASB”) Accounting Standard Codification Topic 946 Financial Services—Investment Companies. The Portfolio prepares its financial statements in accordance with generally accepted accounting principles (“GAAP”) in the United States of America and follows the significant accounting policies described below.
(A) Securities Valuation. Investments are usually valued as of the close of regular trading on the New York Stock Exchange (the "Exchange") (usually 4:00 p.m. Eastern time) on each day the Portfolio is open for business ("valuation date").
The Board of Trustees of the Fund (the "Board") adopted procedures establishing methodologies for the valuation of the Portfolio's securities and other assets and delegated the responsibility for valuation determinations under those procedures to the Valuation Committee of the Fund (the “Valuation Committee”). The procedures state that, subject to the oversight of the Board and unless otherwise noted, the responsibility for the day-to-day valuation of portfolio assets (including fair value measurements for the Portfolio's assets and liabilities) rests with New York Life Investment Management LLC (“New York Life Investments” or the "Manager"), aided to whatever extent necessary by the Subadvisor (as defined in Note 3(A)). To assess the appropriateness of security valuations, the Manager, the Subadvisor or the Portfolio's third-party service provider, who is subject to oversight by the Manager, regularly compares prior day prices, prices on comparable securities and the sale prices to the prior and current day prices and challenges prices with changes exceeding certain tolerance levels with third-party pricing services or broker sources.
The Board authorized the Valuation Committee to appoint a Valuation Subcommittee (the “Subcommittee”) to establish the prices of securities for which market quotations are not readily available or the prices of which are not otherwise readily determinable under the procedures. The Subcommittee meets (in person, via electronic mail or via teleconference) on an as-needed basis. The Valuation Committee meets to ensure that actions taken by the Subcommittee were appropriate.
For those securities valued through either a standardized fair valuation methodology or a fair valuation measurement, the Subcommittee deals with such valuation and the Valuation Committee reviews and affirms, if appropriate, the reasonableness of the valuation based on such methodologies and measurements on a regular basis after considering information that is reasonably available and deemed relevant by the Valuation Committee. Any action taken by the Subcommittee with respect to the valuation of a portfolio security or other asset is submitted for review and ratification (if appropriate) to the Valuation Committee and the Board at the next regularly scheduled meeting.
"Fair value" is defined as the price the Portfolio would reasonably expect to receive upon selling an asset or liability in an orderly transaction to an independent buyer in the principal or most advantageous market for the
| 22 | MainStay VP Candriam Emerging Markets Equity Portfolio |
asset or liability. Fair value measurements are determined within a framework that establishes a three-tier hierarchy that maximizes the use of observable market data and minimizes the use of unobservable inputs to establish a classification of fair value measurements for disclosure purposes. "Inputs" refer broadly to the assumptions that market participants would use in pricing the asset or liability, including assumptions about risk, such as the risk inherent in a particular valuation technique used to measure fair value using a pricing model and/or the risk inherent in the inputs for the valuation technique. Inputs may be observable or unobservable. Observable inputs reflect the assumptions market participants would use in pricing the asset or liability based on market data obtained from sources independent of the Portfolio. Unobservable inputs reflect the Portfolio’s own assumptions about the assumptions market participants would use in pricing the asset or liability based on the information available. The inputs or methodology used for valuing assets or liabilities may not be an indication of the risks associated with investing in those assets or liabilities. The three-tier hierarchy of inputs is summarized below.
| • | Level 1—quoted prices in active markets for an identical asset or liability |
| • | Level 2—other significant observable inputs (including quoted prices for a similar asset or liability in active markets, interest rates and yield curves, prepayment speeds, credit risk, etc.) |
| • | Level 3—significant unobservable inputs (including the Portfolio's own assumptions about the assumptions that market participants would use in measuring fair value of an asset or liability) |
The level of an asset or liability within the fair value hierarchy is based on the lowest level of an input, both individually and in the aggregate, that is significant to the fair value measurement. The aggregate value by input level of the Portfolio’s assets and liabilities as of June 30, 2021, is included at the end of the Portfolio of Investments.
The Portfolio may use third-party vendor evaluations, whose prices may be derived from one or more of the following standard inputs, among others:
| • Broker/dealer quotes | • Benchmark securities |
| • Two-sided markets | • Reference data (corporate actions or material event notices) |
| • Bids/offers | • Monthly payment information |
| • Industry and economic events | • Reported trades |
An asset or liability for which market values cannot be measured using the methodologies described above is valued by methods deemed reasonable in good faith by the Valuation Committee, following the procedures established by the Board, to represent fair value. Under these procedures, the Portfolio generally uses a market-based approach which may use related or comparable assets or liabilities, recent transactions, market multiples, book values and other relevant information. The Portfolio may also use an income-based valuation approach in which the anticipated future cash flows of the asset or liability are discounted to
calculate fair value. Discounts may also be applied due to the nature and/or duration of any restrictions on the disposition of the asset or liability. Fair value represents a good faith approximation of the value of a security. Fair value determinations involve the consideration of a number of subjective factors, an analysis of applicable facts and circumstances and the exercise of judgment. As a result, it is possible that the fair value for a security determined in good faith in accordance with the Portfolio's valuation procedures may differ from valuations for the same security determined by other funds using their own valuation procedures. Although the Portfolio's valuation procedures are designed to value a security at the price the Portfolio may reasonably expect to receive upon the security's sale in an orderly transaction, there can be no assurance that any fair value determination thereunder would, in fact, approximate the amount that the Portfolio would actually realize upon the sale of the security or the price at which the security would trade if a reliable market price were readily available. During the six-month period ended June 30, 2021, there were no material changes to the fair value methodologies.
Securities which may be valued in this manner include, but are not limited to: (i) a security for which trading has been halted or suspended; (ii) a debt security that has recently gone into default and for which there is not a current market quotation; (iii) a security of an issuer that has entered into a restructuring; (iv) a security that has been delisted from a national exchange; (v) a security for which the market price is not readily available from a third-party pricing source or, if so provided, does not, in the opinion of the Manager or the Subadvisor, reflect the security's market value; (vi) a security subject to trading collars for which no or limited trading takes place; and (vii) a security whose principal market has been temporarily closed at a time when, under normal conditions, it would be open. Securities valued in this manner are generally categorized as Level 3 in the hierarchy. Securities that were fair valued in such a manner as of June 30, 2021, are shown in the Portfolio of Investments.
Certain securities held by the Portfolio may principally trade in foreign markets. Events may occur between the time the foreign markets close and the time at which the Portfolio's NAVs are calculated. These events may include, but are not limited to, situations relating to a single issuer in a market sector, significant fluctuations in U.S. or foreign markets, natural disasters, armed conflicts, governmental actions or other developments not tied directly to the securities markets. Should the Manager or the Subadvisor conclude that such events may have affected the accuracy of the last price of such securities reported on the local foreign market, the Subcommittee may, pursuant to procedures adopted by the Board, adjust the value of the local price to reflect the estimated impact on the price of such securities as a result of such events. In this instance, securities are generally categorized as Level 3 in the hierarchy. Additionally, certain foreign equity securities are also fair valued whenever the movement of a particular index exceeds certain thresholds. In such cases, the securities are fair valued by applying factors provided by a third-party vendor in accordance with valuation procedures adopted by the Board and are generally categorized as Level 2 in the hierarchy. No foreign equity securities held by the Portfolio as of June 30, 2021 were fair valued in such a manner.
Notes to Financial Statements (Unaudited) (continued)
Equity securities are valued at the last quoted sales prices as of the close of regular trading on the relevant exchange on each valuation date. Securities that are not traded on the valuation date are valued at the mean of the last quoted bid and ask prices. Prices are normally taken from the principal market in which each security trades. These securities are generally categorized as Level 1 in the hierarchy.
The information above is not intended to reflect an exhaustive list of the methodologies that may be used to value portfolio investments. The valuation procedures permit the use of a variety of valuation methodologies in connection with valuing portfolio investments. The methodology used for a specific type of investment may vary based on the market data available or other considerations. The methodologies summarized above may not represent the specific means by which portfolio investments are valued on any particular business day.
A portfolio investment may be classified as an illiquid investment under the Portfolio's written liquidity risk management program and related procedures (“Liquidity Program”). Illiquidity of an investment might prevent the sale of such investment at a time when the Manager or the Subadvisor might wish to sell, and these investments could have the effect of decreasing the overall level of the Portfolio's liquidity. Further, the lack of an established secondary market may make it more difficult to value illiquid investments, requiring the Portfolio to rely on judgments that may be somewhat subjective in measuring value, which could vary materially from the amount that the Portfolio could realize upon disposition. Difficulty in selling illiquid investments may result in a loss or may be costly to the Portfolio. An illiquid investment is any investment that the Manager or Subadvisor reasonably expects cannot be sold or disposed of in current market conditions in seven calendar days or less without the sale or disposition significantly changing the market value of the investment. The liquidity classification of each investment will be made using information obtained after reasonable inquiry and taking into account, among other things, relevant market, trading and investment-specific considerations in accordance with the Liquidity Program. Illiquid investments are often valued in accordance with methods deemed by the Board in good faith to be reasonable and appropriate to accurately reflect their fair value. The liquidity of the Portfolio's investments was determined as of June 30, 2021, and can change at any time. Illiquid investments as of June 30, 2021, are shown in the Portfolio of Investments.
(B) Income Taxes. The Portfolio's policy is to comply with the requirements of the Internal Revenue Code of 1986, as amended (the “Internal Revenue Code”), applicable to regulated investment companies and to distribute all of its taxable income to the shareholders of the Portfolio within the allowable time limits.
The Manager evaluates the Portfolio’s tax positions to determine if the tax positions taken meet the minimum recognition threshold in connection with accounting for uncertainties in income tax positions taken or expected to be taken for the purposes of measuring and recognizing tax liabilities in the financial statements. Recognition of tax benefits of an uncertain tax position is permitted only to the extent the position is “more
likely than not” to be sustained assuming examination by taxing authorities. The Manager analyzed the Portfolio's tax positions taken on federal, state and local income tax returns for all open tax years (for up to three tax years) and has concluded that no provisions for federal, state and local income tax are required in the Portfolio's financial statements. The Portfolio's federal, state and local income tax and federal excise tax returns for tax years for which the applicable statutes of limitations have not expired are subject to examination by the Internal Revenue Service and state and local departments of revenue.
(C) Foreign Taxes. The Portfolio may be subject to foreign taxes on income and other transaction-based taxes imposed by certain countries in which it invests. A portion of the taxes on gains on investments or currency purchases/repatriation may be reclaimable. The Portfolio will accrue such taxes and reclaims as applicable, based upon its current interpretation of tax rules and regulations that exist in the markets in which it invests.
The Portfolio may be subject to taxation on realized capital gains, repatriation proceeds and other transaction-based taxes imposed by certain countries in which it invests. The Portfolio will accrue such taxes as applicable based upon its current interpretation of tax rules and regulations that exist in the market in which it invests. Capital gains taxes relating to positions still held are reflected as a liability in the Statement of Assets and Liabilities, as well as an adjustment to the Portfolio's net unrealized appreciation (depreciation). Taxes related to capital gains realized, if any, are reflected as part of net realized gain (loss) in the Statement of Operations. Changes in tax liabilities related to capital gains taxes on unrealized investment gains, if any, are reflected as part of the change in net unrealized appreciation (depreciation) on investments in the Statement of Operations. Transaction-based charges are generally assessed as a percentage of the transaction amount.
(D) Dividends and Distributions to Shareholders. Dividends and distributions are recorded on the ex-dividend date. The Portfolio intends to declare and pay dividends from net investment income and distributions from net realized capital and currency gains, if any, at least annually. Unless a shareholder elects otherwise, all dividends and distributions are reinvested at NAV in the same class of shares of the Portfolio. Dividends and distributions to shareholders are determined in accordance with federal income tax regulations and may differ from determinations using GAAP.
(E) Security Transactions and Investment Income. The Portfolio records security transactions on the trade date. Realized gains and losses on security transactions are determined using the identified cost method. Dividend income is recognized on the ex-dividend date, net of any foreign tax withheld at the source, and interest income is accrued as earned using the effective interest rate method. Distributions received from real estate investment trusts may be classified as dividends, capital gains and/or return of capital.
Investment income and realized and unrealized gains and losses on investments of the Portfolio are allocated pro rata to the separate classes
| 24 | MainStay VP Candriam Emerging Markets Equity Portfolio |
of shares based upon their relative net assets on the date the income is earned or realized and unrealized gains and losses are incurred.
(F) Expenses. Expenses of the Fund are allocated to the individual Portfolios in proportion to the net assets of the respective Portfolios when the expenses are incurred, except where direct allocations of expenses can be made. Expenses (other than fees incurred under the distribution and service plans, further discussed in Note 3(B), which are charged directly to the Service Class shares) are allocated to separate classes of shares pro rata based upon their relative net assets on the date the expenses are incurred. The expenses borne by the Portfolio, including those of related parties to the Portfolio, are shown in the Statement of Operations.
(G) Use of Estimates. In preparing financial statements in conformity with GAAP, the Manager makes estimates and assumptions that affect the reported amounts and disclosures in the financial statements. Actual results could differ from those estimates and assumptions.
(H) Foreign Currency Transactions. The Portfolio's books and records are maintained in U.S. dollars. Prices of securities denominated in foreign currency amounts are translated into U.S. dollars at the mean between the buying and selling rates last quoted by any major U.S. bank at the following dates:
(i) market value of investment securities, other assets and liabilities— at the valuation date; and
(ii) purchases and sales of investment securities, income and expenses—at the date of such transactions.
The assets and liabilities that are denominated in foreign currency amounts are presented at the exchange rates and market values at the close of the period. The realized and unrealized changes in net assets arising from fluctuations in exchange rates and market prices of securities are not separately presented.
Net realized gain (loss) on foreign currency transactions represents net currency gains or losses realized as a result of differences between the amounts of securities sale proceeds or purchase cost, dividends, interest and withholding taxes as recorded on the Portfolio's books, and the U.S. dollar equivalent amount actually received or paid. Net currency gains or losses from valuing such foreign currency denominated assets and liabilities, other than investments at valuation date exchange rates, are reflected in unrealized foreign exchange gains or losses.
(I) Securities Sold Short. The Portfolio may engage in sales of securities it does not own ("short sales") as part of its investment strategies. When the Portfolio enters into a short sale, it must segregate or maintain with a broker the cash proceeds from the security sold short or other securities as collateral for its obligation to deliver the security upon conclusion of the sale. During the period a short position is open, depending on the nature and type of security, a short position is reflected as a liability and is marked to market in accordance with the valuation methodologies previously detailed (See Note 2(A)). Liabilities for securities sold short are closed out by purchasing the applicable securities for
delivery to the counterparty broker. A gain, limited to the price at which the Portfolio sold the security short, or a loss, unlimited as to dollar amount, will be recognized upon termination of a short sale if the market price on the date the short position is closed out is less or greater, respectively, than the proceeds originally received. Any such gain or loss may be offset, completely or in part, by the change in the value of the hedged investments. Interest on short positions held is accrued daily, while dividends declared on short positions existing on the record date are recorded on the ex-dividend date as a dividend expense in the Statement of Operations. Broker fees and other expenses related to securities sold short are disclosed in the Statement of Operations. Short sales involve risk of loss in excess of the related amounts reflected in the Statement of Assets and Liabilities. For the six-month period ended June 30, 2021, the Portfolio did not enter into any securities sold short.
(J) Securities Lending. In order to realize additional income, the Portfolio may engage in securities lending, subject to the limitations set forth in the 1940 Act and relevant guidance by the staff of the Securities and Exchange Commission (“SEC”). If the Portfolio engages in securities lending, the Portfolio will lend through its custodian, JPMorgan Chase Bank, N.A., ("JPMorgan"), acting as securities lending agent on behalf of the Portfolio. Under the current arrangement, JPMorgan will manage the Portfolio's collateral in accordance with the securities lending agency agreement between the Portfolio and JPMorgan, and indemnify the Portfolio against counterparty risk. The loans will be collateralized by cash (which may be invested in a money market fund) and/or non-cash collateral (which may include U.S. Treasury securities and/or U.S. government agency securities issued or guaranteed by the United States government or its agencies or instrumentalities) at least equal at all times to the market value of the securities loaned. The Portfolio bears the risk of delay in recovery of, or loss of rights in, the securities loaned. The Portfolio may also record a realized gain or loss on securities deemed sold due to a borrower’s inability to return securities on loan. The Portfolio bears the risk of any loss on investment of cash collateral. The Portfolio will receive compensation for lending its securities in the form of fees or it will retain a portion of interest earned on the investment of any cash collateral. The Portfolio will also continue to receive interest and dividends on the securities loaned and any gain or loss in the market price of the securities loaned that may occur during the term of the loan will be for the account of the Portfolio. Income earned from securities lending activities, if any, is reflected in the Statement of Operations. Securities on loan as of June 30, 2021, are shown in the Portfolio of Investments.
Prior to February 22, 2021, these services were provided by State Street Bank and Trust Company (“State Street”).
(K) Foreign Securities Risk. The Portfolio may invest in foreign securities, which carry certain risks that are in addition to the usual risks inherent in domestic securities. These risks include those resulting from currency fluctuations, future adverse political or economic developments and possible imposition of currency exchange blockages or other foreign governmental laws or restrictions. These risks are likely to be greater in emerging markets than in developed markets. The ability of issuers of
Notes to Financial Statements (Unaudited) (continued)
debt securities held by the Portfolio to meet their obligations may be affected by, among other things, economic or political developments in a specific country, industry or region. For example, the Portfolio has significant investments in the Asia-Pacific region. The development and stability of the Asia-Pacific region can be adversely affected by, among other regional and global developments, trade barriers, exchange controls and other measures imposed or negotiated by the countries with which they trade. Some Asia-Pacific countries can be characterized as emerging markets or newly industrialized and may experience more volatile economic cycles and less liquid markets than developed countries.
(L) Counterparty Credit Risk. In order to better define its contractual rights and to secure rights that will help the Portfolio mitigate its counterparty risk, the Portfolio may enter into an International Swaps and Derivatives Association, Inc. Master Agreement (“ISDA Master Agreement”) or similar agreement with its counterparties. An ISDA Master Agreement is a bilateral agreement between the Portfolio and a counterparty that governs certain OTC derivatives and typically contains collateral posting terms and netting provisions. Under an ISDA Master Agreement, the Portfolio may, under certain circumstances, offset with the counterparty certain derivative financial instruments’ payables and/ or receivables with collateral held and/or posted and create one single net payment. The provisions of the ISDA Master Agreement typically permit a single net payment in the event of default including the bankruptcy or insolvency of the counterparty. Bankruptcy or insolvency laws of a particular jurisdiction may restrict or prohibit the right of offset in bankruptcy, insolvency or other events. In addition, certain ISDA Master Agreements may contain provisions for early termination of OTC derivative transactions in the event the net assets of the Portfolio decline below specific levels or if the Portfolio fails to meet the terms of its ISDA Master Agreements. The result would cause the Portfolio to accelerate payment of any net liability owed to the counterparty.
For financial reporting purposes, the Portfolio does not offset derivative assets and derivative liabilities that are subject to netting arrangements, if any, in the Statement of Assets and Liabilities.
(M) Indemnifications. Under the Fund’s organizational documents, its officers and trustees are indemnified against certain liabilities that may arise out of performance of their duties to the Fund. Additionally, in the normal course of business, the Portfolio enters into contracts with third-party service providers that contain a variety of representations and warranties and that may provide general indemnifications. The Portfolio's maximum exposure under these arrangements is unknown, as this would involve future claims that may be made against the Portfolio that have not yet occurred. The Manager believes that the risk of loss in connection with these potential indemnification obligations is remote. However, there can be no assurance that material liabilities related to such obligations will not arise in the future, which could adversely impact the Portfolio.
Note 3–Fees and Related Party Transactions
(A) Manager and Subadvisor. New York Life Investments, a registered investment adviser and an indirect, wholly-owned subsidiary of New York Life, serves as the Portfolio’s Manager, pursuant to an Amended and Restated Management Agreement (“Management Agreement”). The Manager provides offices, conducts clerical, recordkeeping and bookkeeping services, and keeps most of the financial and accounting records required to be maintained by the Portfolio. Except for the portion of salaries and expenses that are the responsibility of the Portfolio, the Manager pays the salaries and expenses of all personnel affiliated with the Portfolio and certain operational expenses of the Portfolio. The Portfolio reimburses New York Life Investments in an amount equal to the portion of the compensation of the Chief Compliance Officer attributable to the Portfolio. MacKay Shields LLC (“MacKay Shields” or “Subadvisor”), a registered investment adviser and an indirect, wholly-owned subsidiary of New York Life, served as a Subadvisor to the Portfolio, pursuant to the terms of an Amended and Restated Subadvisory Agreement (“Subadvisory Agreement”) between New York Life Investments and MacKay Shields. Candriam Belgium (“Candriam Belgium” or “Subadvisor,” and, together with MacKay Shields, the “Subadvisors”), a registered investment adviser and a direct, wholly-owned subsidiary of New York Life, serves as a Subadvisor to the Portfolio, pursuant to the terms of an Amended and Restated Subadvisory Agreement between New York Life Investments and Candriam Belgium. Effective May 1, 2021, Candriam Belgium became the Portfolio's sole subadvisor. Candriam Belgium is responsible for the day-to-day portfolio management of the Portfolio. New York Life Investments pays for the services of the Subadvisors.
Pursuant to the Management Agreement, the Fund pays the Manager, on behalf of the Portfolio, a monthly fee for the services performed and the facilities furnished at an annual rate of the Portfolio's average daily net assets as follows: 1.00% up to $1 billion; and 0.975% in excess of $1 billion. During the six-month period ended June 30, 2021, the effective management fee rate was 1.00%.
During the six-month period ended June 30, 2021, New York Life Investments earned fees from the Portfolio in the amount of $1,810,103 and paid MacKay Shields and Candriam Belgium $287,543 and $618,609, respectively.
JPMorgan provides sub-administration and sub-accounting services to the Portfolio pursuant to an agreement with New York Life Investments. These services include calculating the daily NAVs of the Portfolio, maintaining the general ledger and sub-ledger accounts for the calculation of the Portfolio's NAVs, and assisting New York Life Investments in conducting various aspects of the Portfolio's administrative operations. For providing these services to the Portfolio, JPMorgan is compensated by New York Life Investments.
Prior to February 22, 2021, these services were provided by State Street.
Pursuant to an agreement between the Fund and New York Life Investments, New York Life Investments is responsible for providing or procuring certain regulatory reporting services for the Portfolio. The
| 26 | MainStay VP Candriam Emerging Markets Equity Portfolio |
Portfolio will reimburse New York Life Investments for the actual costs incurred by New York Life Investments in connection with providing or procuring these services for the Portfolio.
(B) Distribution and Service Fees. The Fund, on behalf of the Portfolio, has entered into a distribution agreement with NYLIFE Distributors LLC (the “Distributor”), an affiliate of New York Life Investments. The Portfolio has adopted a distribution plan (the “Plan”) in accordance with the provisions of Rule 12b-1 under the 1940 Act. Under
the Plan, the Distributor has agreed to provide, through its affiliates or independent third parties, various distribution-related, shareholder and administrative support services to the Service Class shareholders. For its services, the Distributor is entitled to a combined distribution and service fee accrued daily and paid monthly at an annual rate of 0.25% of the average daily net assets attributable to the Service Class shares of the Portfolio.
(C) Investments in Affiliates (in 000’s). During the six-month period ended June 30, 2021, purchases and sales transactions, income earned from investments and shares held of investment companies managed by New York Life Investments or its affiliates were as follows:
| Affiliated Investment Companies | Value,
Beginning
of Period | Purchases
at Cost | Proceeds
from
Sales | Net
Realized
Gain/(Loss)
on Sales | Change in
Unrealized
Appreciation/
(Depreciation) | Value,
End of
Period | Dividend
Income | Other
Distributions | Shares
End of
Period |
| MainStay U.S. Government Liquidity Fund | $ 2,098 | $ 39,589 | $ (41,687) | $ — | $ — | $ — | $ —(a) | $ — | — |
Note 4-Federal Income Tax
As of June 30, 2021, the cost and unrealized appreciation (depreciation) of the Portfolio’s investment portfolio, including applicable derivative contracts and other financial instruments, as determined on a federal income tax basis, were as follows:
| | Federal Tax
Cost | Gross
Unrealized
Appreciation | Gross
Unrealized
(Depreciation) | Net
Unrealized
Appreciation/
(Depreciation) |
| Investments in Securities | $282,113,141 | $74,557,428 | $(5,352,584) | $69,204,844 |
As of December 31, 2020, for federal income tax purposes, capital loss carryforwards of $26,543,540, as shown in the table below, were available to the extent provided by the regulations to offset future realized gains of the Portfolio. Accordingly, no capital gains distributions are expected to be paid to shareholders until net gains have been realized in excess of such amounts.
Capital Loss
Available Through | Short-Term
Capital Loss
Amounts (000’s) | Long-Term
Capital Loss
Amounts (000’s) |
| Unlimited | $26,544 | $— |
During the year ended December 31, 2020, the tax character of distributions paid as reflected in the Statements of Changes in Net Assets was as follows:
| | 2020 |
| Distributions paid from: | |
| Ordinary Income | $10,703,679 |
Note 5–Custodian
JPMorgan is the custodian of cash and securities held by the Portfolio. Custodial fees are charged to the Portfolio based on the Portfolio's net assets and/or the market value of securities held by the Portfolio and the number of certain transactions incurred by the Portfolio.
Prior to February 22, 2021, these services were provided by State Street. The services provided by State Street were a direct expense of the Portfolio and are included in the Statement of Operations as Custodian fees which totaled $53,180 for the period January 1, 2021 through February 21, 2021.
Note 6–Line of Credit
The Portfolio and certain other funds managed by New York Life Investments maintain a line of credit with a syndicate of banks in order to secure a source of funds for temporary purposes to meet unanticipated or excessive redemption requests.
Effective July 27, 2021, under the credit agreement (the “Credit Agreement”), the aggregate commitment amount is $600,000,000 with an additional uncommitted amount of $100,000,000. The commitment fee is an annual rate of 0.15% of the average commitment amount payable quarterly, regardless of usage, to JPMorgan, who serves as the agent to the syndicate. The commitment fee is allocated among the Portfolio and certain other funds managed by New York Life Investments based upon their respective net assets and other factors. Interest on any revolving credit loan is charged based upon the Federal Funds Rate or the one-month London Interbank Offered Rate ("LIBOR"), whichever is higher. The Credit Agreement expires on July 26, 2022, although the Portfolio, certain other funds managed by New York Life Investments and the syndicate of banks may renew the Credit Agreement for an additional year on the same or different terms or enter into a credit agreement with a different syndicate of banks. Prior to July 27, 2021, the aggregate
Notes to Financial Statements (Unaudited) (continued)
commitment amount and the commitment fee were the same as those under the current Credit Agreement. During the six-month period ended June 30, 2021, there were no borrowings made or outstanding with respect to the Portfolio under the Credit Agreement.
Note 7–Interfund Lending Program
Pursuant to an exemptive order issued by the SEC, the Portfolio, along with certain other funds managed by New York Life Investments, may participate in an interfund lending program. The interfund lending program provides an alternative credit facility that permits the Portfolio and certain other funds managed by New York Life Investments to lend or borrow money for temporary purposes directly to or from one another, subject to the conditions of the exemptive order. During the six-month period ended June 30, 2021, there were no interfund loans made or outstanding with respect to the Portfolio.
Note 8–Purchases and Sales of Securities (in 000’s)
During the six-month period ended June 30, 2021, purchases and sales of securities, other than short-term securities, were $91,600 and $136,112, respectively.
Note 9–Capital Share Transactions
Transactions in capital shares for the six-month period ended June 30, 2021 and the year ended December 31, 2020, were as follows:
| Initial Class | Shares | Amount |
| Period ended June 30, 2021: | | |
| Shares sold | 57,964 | $ 709,040 |
| Shares redeemed | (3,726,405) | (46,729,759) |
| Net increase (decrease) | (3,668,441) | $(46,020,719) |
| Year ended December 31, 2020: | | |
| Shares sold | 162,798 | $ 1,486,705 |
| Shares issued to shareholders in reinvestment of distributions | 768,171 | 7,555,963 |
| Shares redeemed | (7,404,710) | (67,849,037) |
| Net increase (decrease) | (6,473,741) | $(58,806,369) |
| |
| Service Class | Shares | Amount |
| Period ended June 30, 2021: | | |
| Shares sold | 28,415 | $ 347,062 |
| Shares redeemed | (1,244,501) | (15,358,004) |
| Net increase (decrease) | (1,216,086) | $(15,010,942) |
| Year ended December 31, 2020: | | |
| Shares sold | 164,132 | $ 1,371,163 |
| Shares issued to shareholders in reinvestment of distributions | 319,740 | 3,147,716 |
| Shares redeemed | (3,463,232) | (32,344,541) |
| Net increase (decrease) | (2,979,360) | $(27,825,662) |
Note 10–Other Matters
An outbreak of COVID-19, first detected in December 2019, has developed into a global pandemic and has resulted in travel restrictions, closure of international borders, certain businesses and securities markets, restrictions on securities trading activities, prolonged quarantines, supply chain disruptions, and lower consumer demand, as well as general concern and uncertainty. The continued impact of COVID-19 and related new variants is uncertain and could further adversely affect the global economy, national economies, individual issuers and capital markets in unforeseeable ways and result in a substantial and extended economic downturn. Developments that disrupt global economies and financial markets, such as COVID-19, may magnify factors that affect the Portfolio's performance.
Note 11–Subsequent Events
In connection with the preparation of the financial statements of the Portfolio as of and for the six-month period ended June 30, 2021, events and transactions subsequent to June 30, 2021, through the date the financial statements were issued have been evaluated by the Manager for possible adjustment and/or disclosure. No subsequent events requiring financial statement adjustment or disclosure have been identified.
| 28 | MainStay VP Candriam Emerging Markets Equity Portfolio |
Discussion of the Operation and Effectiveness of the Portfolio's Liquidity Risk Management Program (Unaudited)
In compliance with Rule 22e-4 under the Investment Company Act of 1940, as amended (the “Liquidity Rule”), the Portfolio has adopted and implemented a liquidity risk management program (the “Program”), which New York Life Investment Management LLC believes is reasonably designed to assess and manage the Portfolio's liquidity risk (the risk that the Portfolio could not meet requests to redeem shares issued by the Portfolio without significant dilution of remaining investors’ interests in the Portfolio). The Board of Trustees of MainStay VP Funds Trust (the "Board") designated New York Life Investment Management LLC as administrator of the Program (the “Administrator”). The Administrator has established a Liquidity Risk Management Committee to assist the Administrator in the implementation and day-to-day administration of the Program and to otherwise support the Administrator in fulfilling its responsibilities under the Program.
At a meeting of the Board held on March 8, 2021, the Administrator provided the Board with a written report addressing the Program’s operation and assessing its adequacy and effectiveness of implementation for the period from January 1, 2020 through December 31, 2020 (the "Review Period"), as required under the Liquidity Rule. The report noted that the Administrator concluded that (i) the Program operated effectively to assess and manage the Portfolio's liquidity risk, (ii) the Program has been adequately and effectively implemented to monitor and, as applicable, respond to the Portfolio's liquidity developments and (iii) the Portfolio's investment strategy continues to be appropriate for an open-end fund. In addition, the report discussed notable events that impacted liquidity risk during the Review Period, including the COVID-19 pandemic and the resulting economic shutdown.
In accordance with the Program, the Portfolio's liquidity risk is assessed no less frequently than annually taking into consideration certain factors, as applicable, such as (i) investment strategy and liquidity of portfolio investments, (ii) short-term and long-term cash flow projections and (iii) holdings of cash and cash equivalents, as well as borrowing arrangements and other funding sources. Certain factors are considered under both normal and reasonably foreseeable stressed conditions.
Each Portfolio portfolio investment is classified into one of four liquidity categories. The classification is based on a determination of the number of days it is reasonably expected to take to convert the investment into cash, or sell or dispose of the investment, in current market conditions without significantly changing the market value of the investment. The Administrator has delegated liquidity classification determinations to the Portfolio’s subadvisors, subject to appropriate oversight by the Administrator, and classification determinations are made by taking into account the Portfolio's reasonably anticipated trade size, various market, trading and investment-specific considerations, as well as market depth, and, in certain cases, third-party vendor data.
The Liquidity Rule requires portfolios that do not primarily hold assets that are highly liquid investments to adopt a minimum amount of net assets that must be invested in highly liquid investments that are assets (an “HLIM”). In addition, the Liquidity Rule limits a portfolio's investments in illiquid investments. Specifically, the Liquidity Rule prohibits acquisition of illiquid investments if doing so would result in a portfolio holding more than 15% of its net assets in illiquid investments that are assets. The Program includes provisions reasonably designed to determine, periodically review and comply with the HLIM requirement, as applicable, and to comply with the 15% limit on illiquid investments.
There can be no assurance that the Program will achieve its objectives under all circumstances in the future. Please refer to the Portfolio's prospectus for more information regarding the Portfolio's exposure to liquidity risk and other risks to which it may be subject.
Proxy Voting Record
The Portfolio is required to file with the SEC its proxy voting records for the 12-month period ending June 30 on Form N-PX. The Portfolio's most recent Form N-PX or proxy voting record is available free of charge upon request (i) by calling 800-598-2019; (ii) by visiting New York Life Investments’ website at https://www.nylinvestments.com/mainstay/
products-and-performance/mainstay-vp-funds-trust; or (iii) by visiting the SEC’s website at www.sec.gov.
Shareholder Reports and Quarterly Portfolio Disclosure
The Portfolio is required to file its complete schedule of portfolio holdings with the SEC 60 days after its first and third fiscal quarter on Form N-PORT. The Portfolio's holdings report is available free of charge upon request by calling 800-598-2019 or by visiting the SEC’s website at www.sec.gov.
| 30 | MainStay VP Candriam Emerging Markets Equity Portfolio |
This page intentionally left blank
This page intentionally left blank.
This page intentionally left blank.
This page intentionally left blank.
MainStay VP Portfolios
MainStay VP offers a wide range of Portfolios. The full array of MainStay VP offerings is listed here, with information about the manager, subadvisors, legal counsel, and independent registered public accounting firm.
Equity
MainStay VP Candriam Emerging Markets Equity Portfolio
MainStay VP Epoch U.S. Equity Yield Portfolio
MainStay VP Fidelity Institutional AM® Utilities Portfolio†
MainStay VP MacKay International Equity Portfolio
MainStay VP MacKay S&P 500 Index Portfolio
MainStay VP Natural Resources Portfolio
MainStay VP Small Cap Growth Portfolio
MainStay VP T. Rowe Price Equity Income Portfolio
MainStay VP Wellington Growth Portfolio
MainStay VP Wellington Mid Cap Portfolio
MainStay VP Wellington Small Cap Portfolio
MainStay VP Wellington U.S. Equity Portfolio
MainStay VP Winslow Large Cap Growth Portfolio
Mixed Asset
MainStay VP Balanced Portfolio
MainStay VP Income Builder Portfolio
MainStay VP Janus Henderson Balanced Portfolio
MainStay VP MacKay Convertible Portfolio
Income
MainStay VP Bond Portfolio
MainStay VP Floating Rate Portfolio
MainStay VP Indexed Bond Portfolio
MainStay VP MacKay Government Portfolio
MainStay VP MacKay High Yield Corporate Bond Portfolio
MainStay VP MacKay Strategic Bond Portfolio
MainStay VP PIMCO Real Return Portfolio
Money Market
MainStay VP U.S. Government Money Market Portfolio
Alternative
MainStay VP CBRE Global Infrastructure Portfolio
MainStay VP IQ Hedge Multi-Strategy Portfolio
Asset Allocation
MainStay VP Conservative Allocation Portfolio
MainStay VP Equity Allocation Portfolio
MainStay VP Growth Allocation Portfolio
MainStay VP Moderate Allocation Portfolio
Manager
New York Life Investment Management LLC
New York, New York
Subadvisors
Brown Advisory LLC
Baltimore, Maryland
Candriam Belgium S.A.*
Brussels, Belgium
CBRE Clarion Securities LLC
Radnor, Pennsylvania
Epoch Investment Partners, Inc.
New York, New York
FIAM LLC
Smithfield, Rhode Island
IndexIQ Advisors LLC*
New York, New York
Janus Capital Management LLC
Denver, Colorado
MacKay Shields LLC*
New York, New York
Mellon Investments Corporation
Boston, Massachusetts
NYL Investors LLC*
New York, New York
Pacific Investment Management Company LLC
Newport Beach, California
Segall Bryant & Hamill, LLC
Chicago, Illinois
T. Rowe Price Associates, Inc.
Baltimore, Maryland
Wellington Management Company LLP
Boston, Massachusetts
Winslow Capital Management, LLC
Minneapolis, Minnesota
Legal Counsel
Dechert LLP
Washington, District of Columbia
Independent Registered Public Accounting Firm
PricewaterhouseCoopers LLP
New York, New York
Distributor
NYLIFE Distributors LLC*
Jersey City, New Jersey
Custodian
JPMorgan Chase Bank, N.A.
New York, New York
Some Portfolios may not be available in all products.
† Fidelity Institutional AM is a registered trade mark of FMR LLC. Used with permission.
* An affiliate of New York Life Investment Management LLC
Not part of the Semiannual Report
2021 Semiannual Report
This report is for the general information of New York Life Variable Annuities and NYLIAC Variable Universal Life Insurance Products policyowners. It must be preceded or accompanied by the appropriate product(s) and funds prospectuses if it is given to anyone who is not an owner of a New York Life variable annuity policy or a NYLIAC Variable Universal Life Insurance Product. This report does not offer for sale or solicit orders to purchase securities.
The performance data quoted in this report represents past performance. Past performance is no guarantee of future results. Due to market volatility and other factors, current performance may be lower or higher than the figures shown. The most recent month-end performance summary for your variable annuity or variable life policy is available by calling 800-598-2019 and is updated periodically on newyorklife.com.
The New York Life Variable Annuities and NYLIAC Variable Universal Life Insurance Products are issued by New York Life Insurance and Annuity Corporation (a Delaware Corporation) and distributed by NYLIFE Distributors LLC (Member FINRA/SIPC).
New York Life Insurance Company
New York Life Insurance and Annuity
Corporation (NYLIAC) (A Delaware Corporation)
51 Madison Avenue, Room 551
New York, NY 10010
newyorklife.com
nylinvestments.com
NYLIFE Distributors LLC, 30 Hudson Street, Jersey City, NJ 07302
New York Life Investment Management LLC is the investment manager to the MainStay VP Funds Trust
©2021 by NYLIFE Distributors LLC. All rights reserved.
You may obtain copies of the Prospectus and the Statement of Additional Information free of charge, upon request, by calling toll-free 800-598-2019 or writing to New York Life Insurance and Annuity Corporation, 51 Madison Avenue, New York, NY 10010.
| Not FDIC Insured | No Bank Guarantee | May Lose Value |
(NYLIAC) NI516
MainStay VP IQ Hedge Multi-Strategy Portfolio
Message from the President and Semiannual Report
Unaudited | June 30, 2021
Sign up for e-delivery of your shareholder reports. For full details on e-delivery, including who can participate and what you can receive via e-delivery,
please log in to newyorklifeinvestments.com/accounts.
| Not FDIC/NCUA Insured | Not a Deposit | May Lose Value | No Bank Guarantee | Not Insured by Any Government Agency |
This page intentionally left blank
Message from the President
The COVID-19 pandemic continued to afflict our personal lives and broad segments of the U.S. and global economy throughout the six-month reporting period ended June 30, 2021. However, with the deployment of multiple vaccines around the world, including three highly effective versions approved for emergency use in the United States, investors began to turn their attention toward the gradual reopening of the economy and the shape the “new normal” would take.
The first half of the reporting period saw increasing inflationary concerns as fiscal stimulus business reopenings drove accelerating economic growth, rising commodity prices and increased consumer spending. However, the U.S. Federal Reserve noted that price increases were likely to prove temporary and made clear their intention to remain accommodative for the foreseeable future. Accordingly, after moving higher in the first quarter of 2021, interest rates declined in the second quarter.
In response to the uncertain inflation outlook, equity market leadership shifted from value in the first quarter of the year to growth in the second quarter. Nevertheless, investor sentiment remained buoyant throughout the reporting period, with all eleven sectors in the S&P 500® Index, a widely regarded benchmark of market performance, producing positive returns. Energy led the market’s rise fueled by rapidly increasing oil and gas prices, followed by financials and real estate, which benefited from rising interest rates and the economic reopening, respectively. Communication services produced the slowest growth, followed by the traditionally defensive utilities and consumer staples
sectors. In the fixed income market, lower-credit-quality issues tended to outperform their higher-grade counterparts, with high-yield corporate bonds generating the strongest performance. Among securitized products, commercial mortgage-backed securities generally produced the strongest returns, followed by mortgage-backed securities and asset-backed securities, while Treasury securities lagged.
Despite the tremendous progress we’ve seen so far this year, the United States and the world continue to face significant pandemic-related challenges. Newer, more contagious variants of COVID-19 threaten the return of restrictions and lockdowns that could stall the economic recovery. At the same time, supply chain shortages have led to rising prices on everything from laptops to autos, stoking fears of uncontrolled inflation despite reassurance from the U.S. Federal Reserve. At New York Life Investments, we recognize that the shape that the “new normal” eventually takes may differ from our expectations. You can depend on us to keep a sharp watch for the unexpected, and to continue to help you find your way through this rapidly evolving investment landscape.
Sincerely,
Kirk C. Lehneis
President
The opinions expressed are as of the date of this report and are subject to change. There is no guarantee that any forecast made will come to pass. This material does not constitute investment advice and is not intended as an endorsement of any specific investment. Past performance is no guarantee of future results.
Not part of the Semiannual Report
Investors should refer to the Portfolio’s Summary Prospectus and/or Prospectus and consider the Portfolio’s investment objectives, strategies, risks, charges and expenses carefully before investing. The Summary Prospectus and/or Prospectus contain this and other information about the Portfolio. You may obtain copies of the Portfolio’s Summary Prospectus and/or the Prospectus and the Statement of Additional Information free of charge, upon request, by calling toll-free 800-598-2019, by writing to New York Life Insurance and Annuity Corporation, 51 Madison Avenue, Room 251, New York, New York 10010 or by sending an email to MainStayShareholdersServices@nylim.com. These documents are also available at nylinvestments.com/vpdocuments. Please read the Portfolio's Summary Prospectus and/or Prospectus carefully before investing. MainStay VP Funds Trust portfolios are separate account options which are purchased through a variable insurance or variable annuity contract.
Investment and Performance Comparison (Unaudited)
Performance data quoted represents past performance. Past performance is no guarantee of future results. Because of market volatility and other factors, current performance may be lower or higher than the figures shown. Investment return and principal value will fluctuate, and as a result, when shares are redeemed, they may be worth more or less than their original cost. The performance table and graph do not reflect any deduction of sales charges, mortality and expense charges, contract charges or administrative charges. Please refer to the Performance Summary appropriate for your policy. For performance information current to the most recent month-end, please call 800-598-2019 or visit www.newyorklife.com.
Performance figures may reflect certain fee waivers and/or expense limitations, without which total returns may have been different. For information on current fee waivers and/or expense limitations (if any), please refer to the Notes to Financial Statements.
| Average Annual Total Returns for the Period-Ended June 30, 2021 |
| Class | Inception
Date1 | Six
Months | One
Year | Five
Years | Since
Inception | Gross
Expense
Ratio2 |
| Initial Class Shares | 5/1/2013 | 1.19% | 8.36% | 2.08% | -0.35% | 1.26% |
| Service Class Shares | 5/1/2013 | 1.07 | 8.09 | 1.82 | -0.56 | 1.51 |
| 1. | Effective November 30, 2018, the Portfolio’s predecessor fund, MainStay VP Absolute Return Multi-Strategy Portfolio (the “VP ARMS Portfolio”), was reorganized into the Portfolio. The Portfolio assumed the VP ARMS Portfolio’s historical performance and accounting information. Therefore, the performance information prior to November 30, 2018, shown in this report is that of the VP ARMS Portfolio, which had a different investment objective and different principal investment strategies and subadvisors. Past performance may have been different if the Portfolio’s current subadvisor, investment objective or principal investment strategies had been in place during the periods. |
| 2. | The gross expense ratios presented reflect the Portfolio’s “Total Annual Portfolio Operating Expenses” from the most recent Prospectus, as supplemented, and may differ from other expense ratios disclosed in this report. |
| Benchmark Performance | Six
Months | One
Year | Five
Years | Since
Inception |
| S&P Balanced Equity and Bond Conservative Index1 | 1.20% | 5.81% | 6.14% | 5.83% |
| HFRI Fund of Funds Composite Index2 | 4.75 | 18.07 | 6.09 | 4.31 |
| IQ Hedge Multi-Strategy Index3 | 1.61 | 9.26 | 3.99 | 3.62 |
| Morningstar Multistrategy Category Average4 | 5.48 | 12.44 | 3.30 | 2.97 |
| 1. | The Portfolio has selected the S&P Balanced Equity and Bond Conservative Index as its primary benchmark. The S&P Balanced Equity and Bond-Conservative Index consists of a position in the S&P 500 Total Return Index (25%) and a position in the S&P U.S. Treasury Bond 7-10 Year Index (75%). Results assume reinvestment of all dividends and capital gains. An investment cannot be made directly in an index. |
| 2. | The Portfolio has selected the HFRI Fund of Funds Composite Index as its secondary benchmark. The HFRI Fund of Funds Composite Index is an equally weighted hedge fund index including over 650 domestic and off-shore fund of funds. The index is rebalanced monthly with performance updates three times per month. Results assume reinvestment of all dividends and capital gains. An investment cannot be made directly in an index. |
| 3. | The IQ Hedge Multi-Strategy Index seeks to replicate the risk-adjusted return characteristics of the collective hedge funds using various hedge fund investment styles, including long/short equity, global macro, market neutral, event-driven, fixed income arbitrage and emerging markets. |
| 4. | The Morningstar Multistrategy Category Average is representative of funds that have a majority of their assets exposed to alternative strategies. Funds in this category include both funds with static allocations to alternative strategies and funds tactically allocating among alternative strategies and asset classes. Results are based on average total returns of similar funds with all dividends and capital gain distributions reinvested. |
Cost in Dollars of a $1,000 Investment in MainStay VP IQ Hedge Multi-Strategy Portfolio (Unaudited)
The example below is intended to describe the fees and expenses borne by shareholders during the six-month period from January 1, 2021 to June 30, 2021, and the impact of those costs on your investment.
Example
As a shareholder of the Portfolio you incur two types of costs: (1) transaction costs, including exchange fees and sales charges (loads) on purchases (as applicable), and (2) ongoing costs, including management fees, distribution and/or service (12b-1) fees, and other Portfolio expenses (as applicable). This example is intended to help you understand your ongoing costs (in dollars) of investing in the Portfolio and to compare these costs with the ongoing costs of investing in other mutual funds. The example is based on an investment of $1,000 made at the beginning of the six-month period and held for the entire period from January 1, 2021 to June 30, 2021. Shares are only sold in connection with variable life and annuity contracts and the example does not reflect any contract level or transactional fees or expenses. If these costs had been included, your costs would have been higher.
This example illustrates your Portfolio’s ongoing costs in two ways:
Actual Expenses
The second and third data columns in the table below provide information about actual account values and actual expenses. You may use the information in these columns, together with the amount you invested, to estimate the expenses that you paid during the six months ended June
30, 2021. Simply divide your account value by $1,000 (for example, an $8,600 account value divided by $1,000 = 8.6), then multiply the result by the number under the heading entitled “Expenses Paid During Period” to estimate the expenses you paid on your account during this period.
Hypothetical Example for Comparison Purposes
The fourth and fifth data columns in the table below provide information about hypothetical account values and hypothetical expenses based on the Portfolio’s actual expense ratio and an assumed rate of return of 5% per year before expenses, which is not the Portfolio’s actual return. The hypothetical account values and expenses may not be used to estimate the actual ending account balances or expenses you paid for the six-month period shown. You may use this information to compare the ongoing costs of investing in the Portfolio with the ongoing costs of investing in other mutual funds. To do so, compare this 5% hypothetical example with the 5% hypothetical examples that appear in the shareholder reports of the other mutual funds.
Please note that the expenses shown in the table are meant to highlight your ongoing costs only and do not reflect any transactional costs, such as exchange fees or sales charges (loads). Therefore, the fourth and fifth data columns of the table are useful in comparing ongoing costs only and will not help you determine the relative total costs of owning different funds. In addition, if these transactional costs were included, your costs would have been higher.
| Share Class | Beginning
Account
Value
1/1/21 | Ending Account
Value (Based
on Actual
Returns and
Expenses)
6/30/21 | Expenses
Paid
During
Period1 | Ending Account
Value (Based
on Hypothetical
5% Annualized
Return and
Actual Expenses)
6/30/21 | Expenses
Paid
During
Period1 | Net Expense
Ratio
During
Period2 |
| Initial Class Shares | $1,000.00 | $1,011.90 | $3.49 | $1,021.32 | $3.51 | 0.70% |
| Service Class Shares | $1,000.00 | $1,010.70 | $4.74 | $1,020.08 | $4.76 | 0.95% |
| 1. | Expenses are equal to the Portfolio’s annualized expense ratio of each class multiplied by the average account value over the period, divided by 365 and multiplied by 181 (to reflect the six-month period). The table above represents the actual expenses incurred during the six-month period. In addition to the fees and expenses which the Portfolio bears directly, it also indirectly bears a pro rata share of the fees and expenses of the underlying funds in which it invests. Such indirect expenses are not included in the above-reported expense figures. |
| 2. | Expenses are equal to the Portfolio's annualized expense ratio to reflect the six-month period. |
| 6 | MainStay VP IQ Hedge Multi-Strategy Portfolio |
Portfolio Composition as of June 30, 2021 (Unaudited)
| U.S. Ultra Short Term Bond Funds | 19.0% |
| Investment Grade Corporate Bond Funds | 16.2 |
| Convertible Bond Funds | 11.1 |
| Bank Loan Funds | 10.4 |
| Unaffiliated Investment Company | 9.9 |
| Emerging Equity Funds | 4.6 |
| U.S. Medium Term Treasury Bond Funds | 4.1 |
| Europe Equity Funds | 3.5 |
| International Bond Fund | 2.6 |
| BRIC Equity Funds | 2.4 |
| U.S. Small Cap Growth Funds | 2.3 |
| Emerging Bonds—USD Funds | 2.3 |
| Floating Rate—Investment Grade Funds | 2.3 |
| Emerging Small Cap Equity Fund | 2.2 |
| Emerging Bonds—Local Currency Funds | 2.1 |
| U.S. Dollar Fund | 2.1 |
| High Yield Corporate Bond Funds | 1.8 |
| Gold Funds | 1.7 |
| International Small Cap Equity Funds | 1.6% |
| U.S. Large Cap Core Funds | 1.5 |
| U.S. Large Cap Growth Funds | 1.3 |
| Silver Funds | 1.2 |
| U.S. Preferred Funds | 1.0 |
| Affiliated Investment Company | 1.0 |
| International Equity Core Funds | 0.5 |
| International Large Cap Growth Fund | 0.4 |
| Mortgage–Backed Security Funds | 0.3 |
| Volatility | 0.2 |
| Broad Funds | 0.2 |
| U.S. Momentum Fund | 0.1 |
| U.S. Small Cap Value Funds | 0.0‡ |
| Municipal Bond Fund | 0.0‡ |
| Other Assets, Less Liabilities | –9.9 |
| | 100.0% |
‡ Less than one-tenth of percent.
See Portfolio of Investments beginning on page 10 for specific holdings within these categories. The Portfolio's holdings are subject to change.
Top Ten Holdings as of June 30, 2021 (excluding short-term investments) (Unaudited)
| 1. | IQ Ultra Short Duration ETF |
| 2. | Vanguard Short-Term Corporate Bond ETF |
| 3. | SPDR Bloomberg Barclays Convertible Securities ETF |
| 4. | Invesco Senior Loan ETF |
| 5. | SPDR Blackstone Senior Loan ETF |
| 6. | Vanguard FTSE Europe ETF |
| 7. | SPDR Bloomberg Barclays International Treasury Bond ETF |
| 8. | iShares Short Treasury Bond ETF |
| 9. | SPDR Portfolio Short Term Corporate Bond ETF |
| 10. | iShares Convertible Bond ETF |
Portfolio Management Discussion and Analysis (Unaudited)
Answers to the questions reflect the views of portfolio managers Greg Barrato and James Harrison of IndexIQ Advisors LLC, the Portfolio’s Subadvisor.
How did MainStay VP IQ Hedge Multi-Strategy Portfolio perform relative to its benchmarks and peers during the six months ended June 30, 2021?
For the six months ended June 30, 2021, MainStay VP IQ Hedge Multi-Strategy Portfolio returned 1.19% for Initial Class shares and 1.07% for Service Class shares. Over the same period, both share classes underperformed the 1.20% return for the S&P Balanced Equity and Bond Conservative Index, which is the Portfolio’s primary benchmark, and the 4.75% return for the HFRI Fund of Funds Composite Index, which is the Portfolio’s secondary benchmark. For the six months ended June 30, 2021, both share classes also underperformed the 1.61% return of the IQ Hedge Multi-Strategy Index (“Underlying Index”) and the 5.48% return of the Morningstar Multialternative Category Average.1
What factors affected the Portfolio’s relative performance during the reporting period?
The Portfolio’s average asset allocation over the reporting period was 73.8% in fixed-income securities and 21.0% in equities, with the remainder in currencies, commodities, volatility and real estate. In comparison, the S&P Balanced Equity and Bond Conservative Index allocates 75% to U.S. Treasury bonds and 25% to U.S. equities. During the reporting period, the Portfolio’s underweight position relative to the S&P Balanced Equity and Bond Conservative Index detracted from performance.
During the reporting period, how did the Portfolio’s performance correlate with traditional equity and fixed-income indices?
The Portfolio maintained a higher correlation to traditional equity indices and a lower correlation to investment-grade fixed-income indices. The Portfolio’s correlation to the S&P 500® Index2 was approximately 81.9%. The Portfolio’s correlation to the Bloomberg Barclays U.S. Aggregate Bond Index3 was approximately 32.4%.
During the reporting period, how did the Portfolio’s volatility compare to that of traditional fixed-income indices?
During the reporting period, the annualized daily volatility of the Portfolio was 5.17%, which compared to a volatility of 3.00% for the Bloomberg Barclays U.S. Aggregate Bond Index.
During the reporting period, how did the Portfolio use derivatives and how was the Portfolio’s performance materially affected by investments in derivatives?
The Portfolio seeks to track, before fees and expenses, the performance of its Underlying Index, the IQ Hedge Multi-Strategy Index. The Underlying Index includes solely ETFs and attempts to replicate the risk-adjusted return characteristics of multiple hedge fund strategies using a long/short investment style. The Portfolio uses total return swaps to replicate that long/short exposure. Derivatives were not used to gain leverage beyond that of the Underlying Index; rather, they were used exclusively to enable the Portfolio to track its Underlying Index.
How did you allocate the Portfolio’s assets among each of the strategies during the reporting period and why?
The Portfolio’s allocations are driven by the weightings of the component securities in the Underlying Index, which uses quantitative models to determine the weights across the various hedge fund investment styles represented in the Underlying Index, as well as the weights of the assets within these styles. Given the rules-based nature of the process, there is no subjectivity involved in the allocation decision process.
How did the tactical allocation among the hedge fund investment styles affect the Portfolio’s performance during the reporting period?
The Portfolio allocates its assets among six underlying hedge fund investment styles: emerging markets, market neutral, long/short equity, event-driven, fixed-income arbitrage and global macro. During the reporting period, the Portfolio maintained gross exposure ranging from 100% to 120% due to periodic short allocations to long/short, event-driven and global macro strategies for several months.
The aggregate performance of the weighted Underlying Index versus an equal-weighted allocation of the same investment styles indicates that the Portfolio experienced a negative allocation effect attributable to weighting changes during the reporting period.
During the reporting period, how did each investment style either contribute to or detract from the Portfolio’s absolute performance?
During the reporting period, the Portfolio's emerging markets, event-driven and global macro investment styles contributed positively to absolute performance. (Contributions take weightings and total returns into account.) Each of the styles added nearly 55
| 1. | See page 5 for more information on benchmark and peer group returns. |
| 2. | “S&P 500®” is a trademark of The McGraw-Hill Companies, Inc. The S&P 500® Index is widely regarded as the standard index for measuring large-cap U.S. stock market performance. Results assume reinvestment of all dividends and capital gains. An investment cannot be made directly in an index. |
| 3. | The Bloomberg Barclays U.S. Aggregate Bond Index is a broad-based benchmark that measures the investment grade, U.S. dollar-denominated, fixed-rate taxable bond market, including Treasuries, government-related and corporate securities, mortgage-backed securities (agency fixed-rate and hybrid adjustable rate mortgage passthroughs), asset-backed securities and commercial mortgage-backed securities. Results assume reinvestment of all dividends and capital gains. An investment cannot be made directly in an index. |
| 8 | MainStay VP IQ Hedge Multi-Strategy Portfolio |
basis points, respectively. (A basis point is one one-hundredth of a percentage point.) Contributions from long/short equity, market neutral and fixed-income arbitrage were negative. The market neutral investment style detracted most from the Portfolio’s absolute performance, costing −0.41%.
How did the Portfolio’s investment style weightings change during the reporting period?
During the reporting period, the Portfolio’s allocation to its market neutral investment style decreased gradually, ranging from 31.46% to 15.50%. The Portfolio’s allocation to its emerging market investment style ranged from a low of 20.12% in April 2021 to a high of 30.32% in February 2021. The Portfolio’s allocation to its global macro investment style stayed positive, ranging from 7.18% to 27.91% from January 2021 to May 2021. The Portfolio’s allocation to its fixed-income arbitrage investment style decreased from a high of 19.68% in January 2021 to a low of 0.87% in May 2021. The Portfolio’s allocation to its event-driven investment style stood at 5.31% in January 2021 and increased to a high of 33.33% in April 2021. The Portfolio’s allocation to its long/short equity investment style stood at 8.00% in January 2021, decreased to a low of 0.76% in April, then climbed to 4.62% in June 2021.
The opinions expressed are those of the portfolio managers as of the date of this report and are subject to change. There is no guarantee that any forecasts will come to pass. This material does not constitute investment advice and is not intended as an endorsement of any specific investment.
Not all MainStay VP Portfolios and/or share classes are available under all policies.
Portfolio of Investments June 30, 2021† (Unaudited)
| | Shares | Value |
| Exchange-Traded Funds 93.6% |
| Bonds 72.2% |
| Bank Loan Funds 10.4% |
| Invesco Senior Loan ETF | 1,013,251 | $ 22,443,510 |
| SPDR Blackstone Senior Loan ETF | 385,705 | 17,854,284 |
| | | 40,297,794 |
| Convertible Bond Funds 11.1% |
| iShares Convertible Bond ETF | 88,306 | 9,004,563 |
| SPDR Bloomberg Barclays Convertible Securities ETF (a) | 393,054 | 34,089,573 |
| | | 43,094,136 |
| Emerging Bonds—Local Currency Funds 2.1% |
| SPDR Bloomberg Barclays Emerging Markets Local Bond ETF (a) | 84,695 | 2,238,489 |
| VanEck Vectors J.P. Morgan EM Local Currency Bond ETF (a) | 190,860 | 5,989,187 |
| | | 8,227,676 |
| Emerging Bonds—USD Funds 2.3% |
| iShares J.P. Morgan USD Emerging Markets Bond ETF | 68,479 | 7,701,148 |
| Vanguard Emerging Markets Government Bond ETF (a) | 14,138 | 1,128,637 |
| | | 8,829,785 |
| Floating Rate—Investment Grade Funds 2.3% |
| iShares Floating Rate Bond ETF (a) | 127,095 | 6,458,968 |
| SPDR Bloomberg Barclays Investment Grade Floating Rate ETF (a) | 80,238 | 2,459,294 |
| | | 8,918,262 |
| High Yield Corporate Bond Funds 1.8% |
| iShares 0-5 Year High Yield Corporate Bond ETF | 3,942 | 181,569 |
| iShares iBoxx High Yield Corporate Bond ETF (a) | 42,181 | 3,713,615 |
| SPDR Bloomberg Barclays High Yield Bond ETF (a) | 16,465 | 1,810,491 |
| SPDR Bloomberg Barclays Short Term High Yield Bond ETF | 6,178 | 170,389 |
| Xtrackers USD High Yield Corporate Bond ETF (a) | 27,408 | 1,104,817 |
| | | 6,980,881 |
| International Bond Fund 2.6% |
| SPDR Bloomberg Barclays International Treasury Bond ETF | 338,249 | 9,927,608 |
| | Shares | Value |
| |
| Investment Grade Corporate Bond Funds 16.2% |
| iShares Broad USD Investment Grade Corporate Bond ETF (a) | 5,128 | $ 310,706 |
| iShares iBoxx $ Investment Grade Corporate Bond ETF (a) | 16,458 | 2,211,297 |
| SPDR Portfolio Short Term Corporate Bond ETF (a) | 299,624 | 9,378,231 |
| Vanguard Intermediate-Term Corporate Bond ETF | 25,641 | 2,437,690 |
| Vanguard Short-Term Corporate Bond ETF (a) | 584,251 | 48,323,400 |
| | | 62,661,324 |
| Mortgage-Backed Security Funds 0.3% |
| iShares MBS ETF (a) | ��� 5,595 | 605,547 |
| SPDR Portfolio Mortgage-Backed Bond ETF | 3,362 | 86,941 |
| Vanguard Mortgage-Backed Securities ETF | 6,619 | 353,256 |
| | | 1,045,744 |
| Municipal Bond Fund 0.0% ‡ |
| VanEck Vectors High Yield Muni ETF (a) | 3,330 | 211,821 |
| U.S. Medium Term Treasury Bond Funds 4.1% |
| iShares 3-7 Year Treasury Bond ETF (a) | 60,818 | 7,938,574 |
| Schwab Intermediate-Term U.S. Treasury ETF | 42,951 | 2,442,623 |
| Vanguard Intermediate-Term Treasury ETF | 79,616 | 5,398,761 |
| | | 15,779,958 |
| U.S. Ultra Short Term Bond Funds 19.0% |
| Invesco Treasury Collateral ETF | 38,809 | 4,100,947 |
| IQ Ultra Short Duration ETF | 1,200,718 | 59,519,591 |
| iShares Short Treasury Bond ETF (a)(b) | 86,284 | 9,533,519 |
| SPDR Bloomberg Barclays 1-3 Month T-Bill ETF (a) | 2,524 | 230,871 |
| | | 73,384,928 |
Total Bonds
(Cost $273,549,850) | | 279,359,917 |
| Equities 21.4% |
| BRIC Equity Funds 2.4% |
| iShares MSCI China ETF (a) | 90,249 | 7,440,128 |
| SPDR S&P China ETF | 14,717 | 1,952,946 |
| | | 9,393,074 |
The notes to the financial statements are an integral part of, and should be read in conjunction with, the financial statements.
| 10 | MainStay VP IQ Hedge Multi-Strategy Portfolio |
| | Shares | Value |
| Equities (continued) |
| Emerging Equity Funds 4.6% |
| iShares Core MSCI Emerging Markets ETF | 132,093 | $ 8,848,910 |
| Vanguard FTSE Emerging Markets ETF (a) | 164,333 | 8,924,925 |
| | | 17,773,835 |
| Emerging Small Cap Equity Fund 2.2% |
| SPDR S&P Emerging Markets SmallCap ETF | 139,114 | 8,530,471 |
| Europe Equity Funds 3.5% |
| iShares Core MSCI Europe ETF (a) | 46,821 | 2,681,907 |
| Vanguard FTSE Europe ETF (a) | 162,836 | 10,952,349 |
| | | 13,634,256 |
| International Equity Core Funds 0.5% |
| iShares Core MSCI EAFE ETF | 11,283 | 844,645 |
| Vanguard FTSE Developed Markets ETF | 17,328 | 892,739 |
| | | 1,737,384 |
| International Large Cap Growth Fund 0.4% |
| iShares MSCI EAFE Growth ETF (a) | 15,436 | 1,655,974 |
| International Small Cap Equity Funds 1.6% |
| Schwab International Small-Cap Equity ETF (a) | 39,849 | 1,657,718 |
| Vanguard FTSE All World ex-US Small-Cap ETF (a) | 32,546 | 4,440,902 |
| | | 6,098,620 |
| U.S. Large Cap Core Funds 1.5% |
| Energy Select Sector SPDR Fund | 19,833 | 1,068,404 |
| Financial Select Sector SPDR Fund | 56,321 | 2,066,417 |
| Health Care Select Sector SPDR Fund (a) | 1,381 | 173,937 |
| Technology Select Sector SPDR Fund | 7,966 | 1,176,260 |
| Vanguard Energy ETF | 2,979 | 226,076 |
| Vanguard Financials ETF (a) | 5,638 | 509,957 |
| Vanguard Health Care ETF (a) | 1,019 | 251,825 |
| Vanguard Information Technology ETF | 788 | 314,231 |
| | | 5,787,107 |
| U.S. Large Cap Growth Funds 1.3% |
| Schwab U.S. Large-Cap Growth ETF (a) | 4,763 | 695,208 |
| Vanguard Growth ETF (a) | 12,403 | 3,557,304 |
| Vanguard Mega Cap Growth ETF | 2,179 | 504,177 |
| Vanguard Russell 1000 Growth ETF (a) | 4,289 | 299,458 |
| | | 5,056,147 |
| | Shares | Value |
| |
| U.S. Momentum Fund 0.1% |
| iShares MSCI USA Momentum Factor ETF | 1,376 | $ 238,640 |
| U.S. Preferred Funds 1.0% |
| Invesco Preferred ETF (a) | 66,191 | 1,014,046 |
| iShares Preferred & Income Securities ETF (a) | 69,328 | 2,727,017 |
| | | 3,741,063 |
| U.S. Small Cap Growth Funds 2.3% |
| iShares Russell 2000 Growth ETF (a) | 10,278 | 3,203,550 |
| iShares S&P Small-Cap 600 Growth ETF | 12,530 | 1,661,854 |
| Vanguard Small-Cap Growth ETF (a) | 14,354 | 4,159,645 |
| | | 9,025,049 |
| U.S. Small Cap Value Funds 0.0% ‡ |
| iShares Russell 2000 Value ETF | 124 | 20,555 |
| iShares S&P Small-Cap 600 Value ETF | 106 | 11,176 |
| Vanguard Small-Cap Value ETF | 168 | 29,175 |
| | | 60,906 |
Total Equities
(Cost $75,965,353) | | 82,732,526 |
Total Exchange-Traded Funds
(Cost $349,515,203) | | 362,092,443 |
| Exchange-Traded Note 0.2% |
| Volatility 0.2% |
| Volatility 0.2% |
| iPath Series B S&P 500 VIX Short-Term Futures ETN (a)(c) | 21,298 | 627,439 |
Total Volatility
(Cost $862,957) | | 627,439 |
Total Exchange-Traded Note
(Cost $862,957) | | 627,439 |
| Exchange-Traded Vehicles 5.2% |
| Commodities 3.1% |
| Broad Funds 0.2% |
| FlexShares Global Upstream Natural Resources Index Fund (a) | 13,513 | 517,413 |
| SPDR S&P Global Natural Resources ETF | 3,948 | 209,244 |
| | | 726,657 |
| Gold Funds 1.7% |
| Aberdeen Standard Physical Gold Shares ETF (a)(c) | 25,807 | 438,461 |
| Graniteshares Gold Trust (a)(c) | 11,293 | 198,644 |
| iShares Gold Trust (c) | 157,290 | 5,302,246 |
The notes to the financial statements are an integral part of, and should be read in conjunction with, the financial statements.
11
Portfolio of Investments June 30, 2021† (Unaudited) (continued)
| | Shares | Value |
| Commodities (continued) |
| Gold Funds (continued) |
| SPDR Gold MiniShares Trust (c) | 45,339 | $ 798,420 |
| | | 6,737,771 |
| Silver Funds 1.2% |
| Aberdeen Standard Physical Silver Shares ETF (c) | 11,354 | 286,007 |
| iShares Silver Trust (c) | 173,373 | 4,199,094 |
| | | 4,485,101 |
Total Commodities
(Cost $11,906,377) | | 11,949,529 |
| Currency 2.1% |
| U.S. Dollar Fund 2.1% |
| Invesco DB US Dollar Index Bullish Fund (a) | 325,982 | 8,094,133 |
Total Currency
(Cost $8,020,033) | | 8,094,133 |
Total Exchange-Traded Vehicles
(Cost $19,926,410) | | 20,043,662 |
| |
| Short-Term Investments 10.9% |
| Affiliated Investment Company 1.0% |
| MainStay U.S. Government Liquidity Fund, 0.01% (d) | 3,817,819 | 3,817,819 |
| Unaffiliated Investment Company 9.9% |
| BlackRock Liquidity FedFund, 0.03% (d)(e) | 25,000,000 | 25,000,000 |
| | Shares | | Value |
| |
| Unaffiliated Investment Company (continued) |
| Wells Fargo Government Money Market Fund, 0.03% (d)(e) | 13,442,619 | | $ 13,442,619 |
Total Unaffiliated Investment Companies
(Cost $38,442,619) | | | 38,442,619 |
Total Short-Term Investments
(Cost $42,260,438) | | | 42,260,438 |
Total Investments
(Cost $412,565,008) | 109.9% | | 425,023,982 |
| Other Assets, Less Liabilities | (9.9) | | (38,414,487) |
| Net Assets | 100.0% | | $ 386,609,495 |
| † | Percentages indicated are based on Portfolio net assets. |
| ‡ | Less than one-tenth of a percent. |
| (a) | All or a portion of this security was held on loan. As of June 30, 2021, the aggregate market value of securities on loan was $51,664,611; the total market value of collateral held by the Portfolio was $53,003,967. The market value of the collateral held included non-cash collateral in the form of U.S. Treasury securities with a value of $14,561,348. The Portfolio received cash collateral with a value of $38,442,619. (See Note 2(J)) |
| (b) | Represents a security, or portion thereof, which was maintained at the broker as collateral for swaps. |
| (c) | Non-income producing security. |
| (d) | Current yield as of June 30, 2021. |
| (e) | Represents a security purchased with cash collateral received for securities on loan. |
Swap Contracts
Open OTC total return equity swap contracts as of June 30, 2021 were as follows1:
Swap
Counterparty | Reference Obligation | Floating Rate2 | Termination
Date(s) | Payment
Frequency
Paid/
Received | Notional
Amount
Long/
(Short)
(000)3 | Unrealized
Appreciation/
(Depreciation)4 |
| Bank of America Merrill Lynch | Aberdeen Standard Physical Gold Shares ETF | 1 month LIBOR plus 0.50% | 10/4/21 | Monthly | 13 | $ — |
| Morgan Stanley & Co. | Aberdeen Standard Physical Gold Shares ETF | Federal Fund Rate plus 0.50% | 9/14/22 | Monthly | 13 | — |
| Bank of America Merrill Lynch | Aberdeen Standard Physical Silver Shares ETF | 1 month LIBOR plus 0.50% | 10/4/21 | Monthly | 8 | — |
| Morgan Stanley & Co. | Aberdeen Standard Physical Silver Shares ETF | Federal Fund Rate plus 0.50% | 9/14/22 | Monthly | 8 | — |
| Bank of America Merrill Lynch | Consumer Discretionary Select Sector SPDR Fund | 1 month LIBOR | 10/4/21 | Monthly | (348) | — |
The notes to the financial statements are an integral part of, and should be read in conjunction with, the financial statements.
| 12 | MainStay VP IQ Hedge Multi-Strategy Portfolio |
Swap
Counterparty | Reference Obligation | Floating Rate2 | Termination
Date(s) | Payment
Frequency
Paid/
Received | Notional
Amount
Long/
(Short)
(000)3 | Unrealized
Appreciation/
(Depreciation)4 |
| Morgan Stanley & Co. | Consumer Discretionary Select Sector SPDR Fund | Federal Fund Rate minus 0.05% | 9/14/22 | Monthly | (348) | $ — |
| Bank of America Merrill Lynch | Energy Select Sector SPDR Fund | 1 month LIBOR plus 0.50% | 10/4/21 | Monthly | 31 | — |
| Morgan Stanley & Co. | Energy Select Sector SPDR Fund | Federal Fund Rate plus 0.50% | 9/14/22 | Monthly | 31 | — |
| Bank of America Merrill Lynch | Fidelity MSCI Real Estate Index ETF | 1 month LIBOR | 10/4/21 | Monthly | (27) | — |
| Morgan Stanley & Co. | Fidelity MSCI Real Estate Index ETF | Federal Fund Rate minus 21.75% | 9/14/22 | Monthly | (27) | — |
| Bank of America Merrill Lynch | Financial Select Sector SPDR Fund | 1 month LIBOR plus 0.50% | 10/4/21 | Monthly | 60 | — |
| Morgan Stanley & Co. | Financial Select Sector SPDR Fund | Federal Fund Rate plus 0.50% | 9/14/22 | Monthly | 60 | — |
| Bank of America Merrill Lynch | FlexShares Global Upstream Natural Resources Index Fund | 1 month LIBOR plus 0.50% | 10/4/21 | Monthly | 15 | — |
| Morgan Stanley & Co. | FlexShares Global Upstream Natural Resources Index Fund | Federal Fund Rate plus 0.50% | 9/14/22 | Monthly | 15 | — |
| Bank of America Merrill Lynch | Graniteshares Gold Trust | 1 month LIBOR plus 0.50% | 10/4/21 | Monthly | 6 | — |
| Morgan Stanley & Co. | Graniteshares Gold Trust | Federal Fund Rate plus 0.50% | 9/14/22 | Monthly | 6 | — |
| Bank of America Merrill Lynch | Health Care Select Sector SPDR Fund | 1 month LIBOR plus 0.50% | 10/4/21 | Monthly | 5 | — |
| Morgan Stanley & Co. | Health Care Select Sector SPDR Fund | Federal Fund Rate plus 0.50% | 9/14/22 | Monthly | 5 | — |
| Bank of America Merrill Lynch | Invesco DB US Dollar Index Bullish Fund | 1 month LIBOR plus 0.50% | 10/4/21 | Monthly | 235 | — |
| Morgan Stanley & Co. | Invesco DB US Dollar Index Bullish Fund | Federal Fund Rate plus 0.50% | 9/14/22 | Monthly | 235 | — |
| Bank of America Merrill Lynch | Invesco KBW Bank ETF | 1 month LIBOR | 10/4/21 | Monthly | (23) | — |
| Morgan Stanley & Co. | Invesco KBW Bank ETF | Federal Fund Rate minus 2.90% | 9/14/22 | Monthly | (23) | — |
| Bank of America Merrill Lynch | Invesco Preferred ETF | 1 month LIBOR plus 0.50% | 10/4/21 | Monthly | 29 | — |
| Morgan Stanley & Co. | Invesco Preferred ETF | Federal Fund Rate plus 0.50% | 9/14/22 | Monthly | 29 | — |
| Bank of America Merrill Lynch | Invesco Senior Loan ETF | 1 month LIBOR plus 0.50% | 10/4/21 | Monthly | 651 | — |
| Morgan Stanley & Co. | Invesco Senior Loan ETF | Federal Fund Rate plus 0.50% | 9/14/22 | Monthly | 651 | — |
| Bank of America Merrill Lynch | Invesco Treasury Collateral ETF | 1 month LIBOR plus 0.50% | 10/4/21 | Monthly | 119 | — |
| Morgan Stanley & Co. | Invesco Treasury Collateral ETF | Federal Fund Rate plus 0.50% | 9/14/22 | Monthly | 119 | — |
| Bank of America Merrill Lynch | iPath Series B S&P 500 VIX Short-Term Futures ETN | 1 month LIBOR plus 0.50% | 10/4/21 | Monthly | 18 | — |
| Morgan Stanley & Co. | iPath Series B S&P 500 VIX Short-Term Futures ETN | Federal Fund Rate plus 0.50% | 9/14/22 | Monthly | 18 | — |
| Bank of America Merrill Lynch | IQ Ultra Short Duration ETF | 1 month LIBOR plus 0.50% | 10/4/21 | Monthly | 1,725 | — |
| Morgan Stanley & Co. | IQ Ultra Short Duration ETF | Federal Fund Rate plus 0.50% | 9/14/22 | Monthly | 1,725 | — |
| Bank of America Merrill Lynch | iShares 0-5 Year High Yield Corporate Bond ETF | 1 month LIBOR plus 0.50% | 10/4/21 | Monthly | 5 | — |
| Morgan Stanley & Co. | iShares 0-5 Year High Yield Corporate Bond ETF | Federal Fund Rate plus 0.50% | 9/14/22 | Monthly | 5 | — |
| Bank of America Merrill Lynch | iShares 20+ Year Treasury Bond ETF | 1 month LIBOR | 10/4/21 | Monthly | (466) | — |
| Morgan Stanley & Co. | iShares 20+ Year Treasury Bond ETF | Federal Fund Rate minus 1.15% | 9/14/22 | Monthly | (466) | — |
| Bank of America Merrill Lynch | iShares 3-7 Year Treasury Bond ETF | 1 month LIBOR plus 0.50% | 10/4/21 | Monthly | 230 | — |
| Morgan Stanley & Co. | iShares 3-7 Year Treasury Bond ETF | Federal Fund Rate plus 0.50% | 9/14/22 | Monthly | 230 | — |
| Bank of America Merrill Lynch | iShares Broad USD Investment Grade Corporate Bond ETF | 1 month LIBOR plus 0.50% | 10/4/21 | Monthly | 9 | — |
| Morgan Stanley & Co. | iShares Broad USD Investment Grade Corporate Bond ETF | Federal Fund Rate plus 0.50% | 9/14/22 | Monthly | 9 | — |
| Bank of America Merrill Lynch | iShares Convertible Bond ETF | 1 month LIBOR plus 0.50% | 10/4/21 | Monthly | 261 | — |
The notes to the financial statements are an integral part of, and should be read in conjunction with, the financial statements.
13
Portfolio of Investments June 30, 2021† (Unaudited) (continued)
Swap
Counterparty | Reference Obligation | Floating Rate2 | Termination
Date(s) | Payment
Frequency
Paid/
Received | Notional
Amount
Long/
(Short)
(000)3 | Unrealized
Appreciation/
(Depreciation)4 |
| Morgan Stanley & Co. | iShares Convertible Bond ETF | Federal Fund Rate plus 0.50% | 9/14/22 | Monthly | 261 | $ — |
| Bank of America Merrill Lynch | iShares Core MSCI EAFE ETF | 1 month LIBOR plus 0.50% | 10/4/21 | Monthly | 24 | — |
| Morgan Stanley & Co. | iShares Core MSCI EAFE ETF | Federal Fund Rate plus 0.50% | 9/14/22 | Monthly | 24 | — |
| Bank of America Merrill Lynch | iShares Core MSCI Emerging Markets ETF | 1 month LIBOR plus 0.50% | 10/4/21 | Monthly | 257 | — |
| Morgan Stanley & Co. | iShares Core MSCI Emerging Markets ETF | Federal Fund Rate plus 0.50% | 9/14/22 | Monthly | 257 | — |
| Bank of America Merrill Lynch | iShares Core MSCI Europe ETF | 1 month LIBOR plus 0.50% | 10/4/21 | Monthly | 78 | — |
| Morgan Stanley & Co. | iShares Core MSCI Europe ETF | Federal Fund Rate plus 0.50% | 9/14/22 | Monthly | 78 | — |
| Bank of America Merrill Lynch | iShares Core S&P U.S. Value ETF | 1 month LIBOR | 10/4/21 | Monthly | (278) | — |
| Morgan Stanley & Co. | iShares Core S&P U.S. Value ETF | Federal Fund Rate minus 0.60% | 9/14/22 | Monthly | (278) | — |
| Bank of America Merrill Lynch | iShares Core U.S. REIT ETF | 1 month LIBOR | 10/4/21 | Monthly | (36) | — |
| Morgan Stanley & Co. | iShares Core U.S. REIT ETF | Federal Fund Rate minus 3.05% | 9/14/22 | Monthly | (36) | — |
| Bank of America Merrill Lynch | iShares Floating Rate Bond ETF | 1 month LIBOR plus 0.50% | 10/4/21 | Monthly | 187 | — |
| Morgan Stanley & Co. | iShares Floating Rate Bond ETF | Federal Fund Rate plus 0.50% | 9/14/22 | Monthly | 187 | — |
| Bank of America Merrill Lynch | iShares Gold Trust | 1 month LIBOR plus 0.50% | 10/4/21 | Monthly | 154 | — |
| Morgan Stanley & Co. | iShares Gold Trust | Federal Fund Rate plus 0.50% | 9/14/22 | Monthly | 154 | — |
| Bank of America Merrill Lynch | iShares iBoxx $ Investment Grade Corporate Bond ETF | 1 month LIBOR plus 0.50% | 10/4/21 | Monthly | 64 | — |
| Morgan Stanley & Co. | iShares iBoxx $ Investment Grade Corporate Bond ETF | Federal Fund Rate plus 0.50% | 9/14/22 | Monthly | 64 | — |
| Bank of America Merrill Lynch | iShares iBoxx High Yield Corporate Bond ETF | 1 month LIBOR plus 0.50% | 10/4/21 | Monthly | 108 | — |
| Morgan Stanley & Co. | iShares iBoxx High Yield Corporate Bond ETF | Federal Fund Rate plus 0.50% | 9/14/22 | Monthly | 108 | — |
| Bank of America Merrill Lynch | iShares J.P. Morgan USD Emerging Markets Bond ETF | 1 month LIBOR plus 0.50% | 10/4/21 | Monthly | 223 | — |
| Morgan Stanley & Co. | iShares J.P. Morgan USD Emerging Markets Bond ETF | Federal Fund Rate plus 0.50% | 9/14/22 | Monthly | 223 | — |
| Bank of America Merrill Lynch | iShares MBS ETF | 1 month LIBOR plus 0.50% | 10/4/21 | Monthly | 18 | — |
| Morgan Stanley & Co. | iShares MBS ETF | Federal Fund Rate plus 0.50% | 9/14/22 | Monthly | 18 | — |
| Bank of America Merrill Lynch | iShares MSCI China ETF | 1 month LIBOR plus 0.50% | 10/4/21 | Monthly | 216 | — |
| Morgan Stanley & Co. | iShares MSCI China ETF | Federal Fund Rate plus 0.50% | 9/14/22 | Monthly | 216 | — |
| Bank of America Merrill Lynch | iShares MSCI EAFE Growth ETF | 1 month LIBOR plus 0.50% | 10/4/21 | Monthly | 48 | — |
| Morgan Stanley & Co. | iShares MSCI EAFE Growth ETF | Federal Fund Rate plus 0.50% | 9/14/22 | Monthly | 48 | — |
| Bank of America Merrill Lynch | iShares MSCI Emerging Markets Min Vol Factor ETF | 1 month LIBOR | 10/4/21 | Monthly | (2,166) | — |
| Morgan Stanley & Co. | iShares MSCI Emerging Markets Min Vol Factor ETF | Federal Fund Rate minus 0.35% | 9/14/22 | Monthly | (2,166) | — |
| Bank of America Merrill Lynch | iShares MSCI Japan ETF | 1 month LIBOR | 10/4/21 | Monthly | (1,267) | — |
| Morgan Stanley & Co. | iShares MSCI Japan ETF | Federal Fund Rate minus 0.35% | 9/14/22 | Monthly | (1,267) | — |
| Bank of America Merrill Lynch | iShares MSCI USA Momentum Factor ETF | 1 month LIBOR plus 0.50% | 10/4/21 | Monthly | 7 | — |
| Morgan Stanley & Co. | iShares MSCI USA Momentum Factor ETF | Federal Fund Rate plus 0.50% | 9/14/22 | Monthly | 7 | — |
| Bank of America Merrill Lynch | iShares Preferred & Income Securities ETF | 1 month LIBOR plus 0.50% | 10/4/21 | Monthly | 79 | — |
| Morgan Stanley & Co. | iShares Preferred & Income Securities ETF | Federal Fund Rate plus 0.50% | 9/14/22 | Monthly | 79 | — |
| Bank of America Merrill Lynch | iShares Russell 2000 Growth ETF | 1 month LIBOR plus 0.50% | 10/4/21 | Monthly | 93 | — |
The notes to the financial statements are an integral part of, and should be read in conjunction with, the financial statements.
| 14 | MainStay VP IQ Hedge Multi-Strategy Portfolio |
Swap
Counterparty | Reference Obligation | Floating Rate2 | Termination
Date(s) | Payment
Frequency
Paid/
Received | Notional
Amount
Long/
(Short)
(000)3 | Unrealized
Appreciation/
(Depreciation)4 |
| Morgan Stanley & Co. | iShares Russell 2000 Growth ETF | Federal Fund Rate plus 0.50% | 9/14/22 | Monthly | 93 | $ — |
| Bank of America Merrill Lynch | iShares Russell 2000 Value ETF | 1 month LIBOR plus 0.50% | 10/4/21 | Monthly | 1 | — |
| Morgan Stanley & Co. | iShares Russell 2000 Value ETF | Federal Fund Rate plus 0.50% | 9/14/22 | Monthly | 1 | — |
| Bank of America Merrill Lynch | iShares S&P Small-Cap 600 Growth ETF | 1 month LIBOR plus 0.50% | 10/4/21 | Monthly | 48 | — |
| Morgan Stanley & Co. | iShares S&P Small-Cap 600 Growth ETF | Federal Fund Rate plus 0.50% | 9/14/22 | Monthly | 48 | — |
| Bank of America Merrill Lynch | iShares S&P Small-Cap 600 Value ETF | 1 month LIBOR plus 0.50% | 10/4/21 | Monthly | —‡ | — |
| Morgan Stanley & Co. | iShares S&P Small-Cap 600 Value ETF | Federal Fund Rate plus 0.50% | 9/14/22 | Monthly | —‡ | — |
| Bank of America Merrill Lynch | iShares Short Treasury Bond ETF | 1 month LIBOR plus 0.50% | 10/4/21 | Monthly | 276 | — |
| Morgan Stanley & Co. | iShares Short Treasury Bond ETF | Federal Fund Rate plus 0.50% | 9/14/22 | Monthly | 276 | — |
| Bank of America Merrill Lynch | iShares Silver Trust | 1 month LIBOR plus 0.50% | 10/4/21 | Monthly | 122 | — |
| Morgan Stanley & Co. | iShares Silver Trust | Federal Fund Rate plus 0.50% | 9/14/22 | Monthly | 122 | — |
| Bank of America Merrill Lynch | iShares TIPS Bond ETF | 1 month LIBOR | 10/4/21 | Monthly | (92) | — |
| Morgan Stanley & Co. | iShares TIPS Bond ETF | Federal Fund Rate minus 0.35% | 9/14/22 | Monthly | (92) | — |
| Bank of America Merrill Lynch | Schwab Intermediate-Term U.S. Treasury ETF | 1 month LIBOR plus 0.50% | 10/4/21 | Monthly | 71 | — |
| Morgan Stanley & Co. | Schwab Intermediate-Term U.S. Treasury ETF | Federal Fund Rate plus 0.50% | 9/14/22 | Monthly | 71 | — |
| Bank of America Merrill Lynch | Schwab International Small-Cap Equity ETF | 1 month LIBOR plus 0.50% | 10/4/21 | Monthly | 48 | — |
| Morgan Stanley & Co. | Schwab International Small-Cap Equity ETF | Federal Fund Rate plus 0.50% | 9/14/22 | Monthly | 48 | — |
| Bank of America Merrill Lynch | Schwab U.S. Large-Cap Growth ETF | 1 month LIBOR plus 0.50% | 10/4/21 | Monthly | 20 | — |
| Morgan Stanley & Co. | Schwab U.S. Large-Cap Growth ETF | Federal Fund Rate plus 0.50% | 9/14/22 | Monthly | 20 | — |
| Bank of America Merrill Lynch | Schwab U.S. Large-Cap Value ETF | 1 month LIBOR | 10/4/21 | Monthly | (271) | — |
| Morgan Stanley & Co. | Schwab U.S. Large-Cap Value ETF | Federal Fund Rate minus 1.30% | 9/14/22 | Monthly | (271) | — |
| Bank of America Merrill Lynch | Schwab U.S. TIPS ETF | 1 month LIBOR | 10/4/21 | Monthly | (57) | — |
| Morgan Stanley & Co. | Schwab U.S. TIPS ETF | Federal Fund Rate minus 2.20% | 9/14/22 | Monthly | (57) | — |
| Bank of America Merrill Lynch | SPDR Blackstone Senior Loan ETF | 1 month LIBOR plus 0.50% | 10/4/21 | Monthly | 518 | — |
| Morgan Stanley & Co. | SPDR Blackstone Senior Loan ETF | Federal Fund Rate plus 0.50% | 9/14/22 | Monthly | 518 | — |
| Bank of America Merrill Lynch | SPDR Bloomberg Barclays 1-3 Month T-Bill ETF | 1 month LIBOR plus 0.50% | 10/4/21 | Monthly | 7 | — |
| Morgan Stanley & Co. | SPDR Bloomberg Barclays 1-3 Month T-Bill ETF | Federal Fund Rate plus 0.50% | 9/14/22 | Monthly | 7 | — |
| Bank of America Merrill Lynch | SPDR Bloomberg Barclays Convertible Securities ETF | 1 month LIBOR plus 0.50% | 10/4/21 | Monthly | 988 | — |
| Morgan Stanley & Co. | SPDR Bloomberg Barclays Convertible Securities ETF | Federal Fund Rate plus 0.50% | 9/14/22 | Monthly | 988 | — |
| Bank of America Merrill Lynch | SPDR Bloomberg Barclays Emerging Markets Local Bond ETF | 1 month LIBOR plus 0.50% | 10/4/21 | Monthly | 65 | — |
| Morgan Stanley & Co. | SPDR Bloomberg Barclays Emerging Markets Local Bond ETF | Federal Fund Rate plus 0.50% | 9/14/22 | Monthly | 65 | — |
| Bank of America Merrill Lynch | SPDR Bloomberg Barclays High Yield Bond ETF | 1 month LIBOR plus 0.50% | 10/4/21 | Monthly | 52 | — |
| Morgan Stanley & Co. | SPDR Bloomberg Barclays High Yield Bond ETF | Federal Fund Rate plus 0.50% | 9/14/22 | Monthly | 52 | — |
| Bank of America Merrill Lynch | SPDR Bloomberg Barclays International Treasury Bond ETF | 1 month LIBOR plus 0.50% | 10/4/21 | Monthly | 288 | — |
The notes to the financial statements are an integral part of, and should be read in conjunction with, the financial statements.
15
Portfolio of Investments June 30, 2021† (Unaudited) (continued)
Swap
Counterparty | Reference Obligation | Floating Rate2 | Termination
Date(s) | Payment
Frequency
Paid/
Received | Notional
Amount
Long/
(Short)
(000)3 | Unrealized
Appreciation/
(Depreciation)4 |
| Morgan Stanley & Co. | SPDR Bloomberg Barclays International Treasury Bond ETF | Federal Fund Rate plus 0.50% | 9/14/22 | Monthly | 288 | $ — |
| Bank of America Merrill Lynch | SPDR Bloomberg Barclays Investment Grade Floating Rate ETF | 1 month LIBOR plus 0.50% | 10/4/21 | Monthly | 71 | — |
| Morgan Stanley & Co. | SPDR Bloomberg Barclays Investment Grade Floating Rate ETF | Federal Fund Rate plus 0.50% | 9/14/22 | Monthly | 71 | — |
| Bank of America Merrill Lynch | SPDR Bloomberg Barclays Short Term High Yield Bond ETF | 1 month LIBOR plus 0.50% | 10/4/21 | Monthly | 5 | — |
| Morgan Stanley & Co. | SPDR Bloomberg Barclays Short Term High Yield Bond ETF | Federal Fund Rate plus 0.50% | 9/14/22 | Monthly | 5 | — |
| Bank of America Merrill Lynch | SPDR Dow Jones International Real Estate ETF | 1 month LIBOR | 10/4/21 | Monthly | (338) | — |
| Morgan Stanley & Co. | SPDR Dow Jones International Real Estate ETF | Federal Fund Rate minus 0.85% | 9/14/22 | Monthly | (338) | — |
| Bank of America Merrill Lynch | SPDR Gold MiniShares Trust | 1 month LIBOR plus 0.50% | 10/4/21 | Monthly | 23 | — |
| Morgan Stanley & Co. | SPDR Gold MiniShares Trust | Federal Fund Rate plus 0.50% | 9/14/22 | Monthly | 23 | — |
| Bank of America Merrill Lynch | SPDR Portfolio Long Term Treasury ETF | 1 month LIBOR | 10/4/21 | Monthly | (130) | — |
| Morgan Stanley & Co. | SPDR Portfolio Long Term Treasury ETF | Federal Fund Rate minus 0.35% | 9/14/22 | Monthly | (130) | — |
| Bank of America Merrill Lynch | SPDR Portfolio Mortgage-Backed Bond ETF | 1 month LIBOR plus 0.50% | 10/4/21 | Monthly | 3 | — |
| Morgan Stanley & Co. | SPDR Portfolio Mortgage-Backed Bond ETF | Federal Fund Rate plus 0.50% | 9/14/22 | Monthly | 3 | — |
| Bank of America Merrill Lynch | SPDR Portfolio S&P 500 Value ETF | 1 month LIBOR | 10/4/21 | Monthly | (358) | — |
| Morgan Stanley & Co. | SPDR Portfolio S&P 500 Value ETF | Federal Fund Rate minus 0.70% | 9/14/22 | Monthly | (358) | — |
| Bank of America Merrill Lynch | SPDR Portfolio Short Term Corporate Bond ETF | 1 month LIBOR plus 0.50% | 10/4/21 | Monthly | 272 | — |
| Morgan Stanley & Co. | SPDR Portfolio Short Term Corporate Bond ETF | Federal Fund Rate plus 0.50% | 9/14/22 | Monthly | 272 | — |
| Bank of America Merrill Lynch | SPDR S&P Bank ETF | 1 month LIBOR | 10/4/21 | Monthly | (31) | — |
| Morgan Stanley & Co. | SPDR S&P Bank ETF | Federal Fund Rate minus 0.35% | 9/14/22 | Monthly | (31) | — |
| Bank of America Merrill Lynch | SPDR S&P China ETF | 1 month LIBOR plus 0.50% | 10/4/21 | Monthly | 57 | — |
| Morgan Stanley & Co. | SPDR S&P China ETF | Federal Fund Rate plus 0.50% | 9/14/22 | Monthly | 57 | — |
| Bank of America Merrill Lynch | SPDR S&P Emerging Markets SmallCap ETF | 1 month LIBOR plus 0.50% | 10/4/21 | Monthly | 247 | — |
| Morgan Stanley & Co. | SPDR S&P Emerging Markets SmallCap ETF | Federal Fund Rate plus 0.50% | 9/14/22 | Monthly | 247 | — |
| Bank of America Merrill Lynch | SPDR S&P Global Natural Resources ETF | 1 month LIBOR plus 0.50% | 10/4/21 | Monthly | 6 | — |
| Morgan Stanley & Co. | SPDR S&P Global Natural Resources ETF | Federal Fund Rate plus 0.50% | 9/14/22 | Monthly | 6 | — |
| Bank of America Merrill Lynch | Technology Select Sector SPDR Fund | 1 month LIBOR plus 0.50% | 10/4/21 | Monthly | 34 | — |
| Morgan Stanley & Co. | Technology Select Sector SPDR Fund | Federal Fund Rate plus 0.50% | 9/14/22 | Monthly | 34 | — |
| Bank of America Merrill Lynch | VanEck Vectors High Yield Muni ETF | 1 month LIBOR plus 0.50% | 10/4/21 | Monthly | 6 | — |
| Morgan Stanley & Co. | VanEck Vectors High Yield Muni ETF | Federal Fund Rate plus 0.50% | 9/14/22 | Monthly | 6 | — |
| Bank of America Merrill Lynch | VanEck Vectors J.P. Morgan EM Local Currency Bond ETF | 1 month LIBOR plus 0.50% | 10/4/21 | Monthly | 174 | — |
| Morgan Stanley & Co. | VanEck Vectors J.P. Morgan EM Local Currency Bond ETF | Federal Fund Rate plus 0.50% | 9/14/22 | Monthly | 174 | — |
| Bank of America Merrill Lynch | Vanguard Consumer Discretionary ETF | 1 month LIBOR | 10/4/21 | Monthly | (107) | — |
| Morgan Stanley & Co. | Vanguard Consumer Discretionary ETF | Federal Fund Rate minus 2.75% | 9/14/22 | Monthly | (107) | — |
| Bank of America Merrill Lynch | Vanguard Emerging Markets Government Bond ETF | 1 month LIBOR plus 0.50% | 10/4/21 | Monthly | 33 | — |
The notes to the financial statements are an integral part of, and should be read in conjunction with, the financial statements.
| 16 | MainStay VP IQ Hedge Multi-Strategy Portfolio |
Swap
Counterparty | Reference Obligation | Floating Rate2 | Termination
Date(s) | Payment
Frequency
Paid/
Received | Notional
Amount
Long/
(Short)
(000)3 | Unrealized
Appreciation/
(Depreciation)4 |
| Morgan Stanley & Co. | Vanguard Emerging Markets Government Bond ETF | Federal Fund Rate plus 0.50% | 9/14/22 | Monthly | 33 | $ — |
| Bank of America Merrill Lynch | Vanguard Energy ETF | 1 month LIBOR plus 0.50% | 10/4/21 | Monthly | 7 | — |
| Morgan Stanley & Co. | Vanguard Energy ETF | Federal Fund Rate plus 0.50% | 9/14/22 | Monthly | 7 | — |
| Bank of America Merrill Lynch | Vanguard Financials ETF | 1 month LIBOR plus 0.50% | 10/4/21 | Monthly | 15 | — |
| Morgan Stanley & Co. | Vanguard Financials ETF | Federal Fund Rate plus 0.50% | 9/14/22 | Monthly | 15 | — |
| Bank of America Merrill Lynch | Vanguard FTSE All World ex-US Small-Cap ETF | 1 month LIBOR plus 0.50% | 10/4/21 | Monthly | 129 | — |
| Morgan Stanley & Co. | Vanguard FTSE All World ex-US Small-Cap ETF | Federal Fund Rate plus 0.50% | 9/14/22 | Monthly | 129 | — |
| Bank of America Merrill Lynch | Vanguard FTSE Developed Markets ETF | 1 month LIBOR plus 0.50% | 10/4/21 | Monthly | 26 | — |
| Morgan Stanley & Co. | Vanguard FTSE Developed Markets ETF | Federal Fund Rate plus 0.50% | 9/14/22 | Monthly | 26 | — |
| Bank of America Merrill Lynch | Vanguard FTSE Emerging Markets ETF | 1 month LIBOR plus 0.50% | 10/4/21 | Monthly | 259 | — |
| Morgan Stanley & Co. | Vanguard FTSE Emerging Markets ETF | Federal Fund Rate plus 0.50% | 9/14/22 | Monthly | 259 | — |
| Bank of America Merrill Lynch | Vanguard FTSE Europe ETF | 1 month LIBOR plus 0.50% | 10/4/21 | Monthly | 317 | — |
| Morgan Stanley & Co. | Vanguard FTSE Europe ETF | Federal Fund Rate plus 0.50% | 9/14/22 | Monthly | 317 | — |
| Bank of America Merrill Lynch | Vanguard Global ex-U.S. Real Estate ETF | 1 month LIBOR | 10/4/21 | Monthly | (1,829) | — |
| Morgan Stanley & Co. | Vanguard Global ex-U.S. Real Estate ETF | Federal Fund Rate minus 0.35% | 9/14/22 | Monthly | (1,829) | — |
| Bank of America Merrill Lynch | Vanguard Growth ETF | 1 month LIBOR plus 0.50% | 10/4/21 | Monthly | 103 | — |
| Morgan Stanley & Co. | Vanguard Growth ETF | Federal Fund Rate plus 0.50% | 9/14/22 | Monthly | 103 | — |
| Bank of America Merrill Lynch | Vanguard Health Care ETF | 1 month LIBOR plus 0.50% | 10/4/21 | Monthly | 7 | — |
| Morgan Stanley & Co. | Vanguard Health Care ETF | Federal Fund Rate plus 0.50% | 9/14/22 | Monthly | 7 | — |
| Bank of America Merrill Lynch | Vanguard Information Technology ETF | 1 month LIBOR plus 0.50% | 10/4/21 | Monthly | 9 | — |
| Morgan Stanley & Co. | Vanguard Information Technology ETF | Federal Fund Rate plus 0.50% | 9/14/22 | Monthly | 9 | — |
| Bank of America Merrill Lynch | Vanguard Intermediate-Term Corporate Bond ETF | 1 month LIBOR plus 0.50% | 10/4/21 | Monthly | 71 | — |
| Morgan Stanley & Co. | Vanguard Intermediate-Term Corporate Bond ETF | Federal Fund Rate plus 0.50% | 9/14/22 | Monthly | 71 | — |
| Bank of America Merrill Lynch | Vanguard Intermediate-Term Treasury ETF | 1 month LIBOR plus 0.50% | 10/4/21 | Monthly | 157 | — |
| Morgan Stanley & Co. | Vanguard Intermediate-Term Treasury ETF | Federal Fund Rate plus 0.50% | 9/14/22 | Monthly | 157 | — |
| Bank of America Merrill Lynch | Vanguard Long-Term Treasury ETF | 1 month LIBOR | 10/4/21 | Monthly | (79) | — |
| Morgan Stanley & Co. | Vanguard Long-Term Treasury ETF | Federal Fund Rate minus 2.25% | 9/14/22 | Monthly | (79) | — |
| Bank of America Merrill Lynch | Vanguard Mega Cap Growth ETF | 1 month LIBOR plus 0.50% | 10/4/21 | Monthly | 15 | — |
| Morgan Stanley & Co. | Vanguard Mega Cap Growth ETF | Federal Fund Rate plus 0.50% | 9/14/22 | Monthly | 15 | — |
| Bank of America Merrill Lynch | Vanguard Mortgage-Backed Securities ETF | 1 month LIBOR plus 0.50% | 10/4/21 | Monthly | 10 | — |
| Morgan Stanley & Co. | Vanguard Mortgage-Backed Securities ETF | Federal Fund Rate plus 0.50% | 9/14/22 | Monthly | 10 | — |
| Bank of America Merrill Lynch | Vanguard Real Estate ETF | 1 month LIBOR | 10/4/21 | Monthly | (700) | — |
| Morgan Stanley & Co. | Vanguard Real Estate ETF | Federal Fund Rate minus 0.15% | 9/14/22 | Monthly | (700) | — |
| Bank of America Merrill Lynch | Vanguard Russell 1000 Growth ETF | 1 month LIBOR plus 0.50% | 10/4/21 | Monthly | 9 | — |
| Morgan Stanley & Co. | Vanguard Russell 1000 Growth ETF | Federal Fund Rate plus 0.50% | 9/14/22 | Monthly | 9 | — |
| Bank of America Merrill Lynch | Vanguard Russell 1000 Value ETF | 1 month LIBOR | 10/4/21 | Monthly | (134) | — |
| Morgan Stanley & Co. | Vanguard Russell 1000 Value ETF | Federal Fund Rate minus 1.00% | 9/14/22 | Monthly | (134) | — |
The notes to the financial statements are an integral part of, and should be read in conjunction with, the financial statements.
17
Portfolio of Investments June 30, 2021† (Unaudited) (continued)
Swap
Counterparty | Reference Obligation | Floating Rate2 | Termination
Date(s) | Payment
Frequency
Paid/
Received | Notional
Amount
Long/
(Short)
(000)3 | Unrealized
Appreciation/
(Depreciation)4 |
| Bank of America Merrill Lynch | Vanguard Short-Term Corporate Bond ETF | 1 month LIBOR plus 0.50% | 10/4/21 | Monthly | 1,401 | $ — |
| Morgan Stanley & Co. | Vanguard Short-Term Corporate Bond ETF | Federal Fund Rate plus 0.50% | 9/14/22 | Monthly | 1,401 | — |
| Bank of America Merrill Lynch | Vanguard Small-Cap Growth ETF | 1 month LIBOR plus 0.50% | 10/4/21 | Monthly | 121 | — |
| Morgan Stanley & Co. | Vanguard Small-Cap Growth ETF | Federal Fund Rate plus 0.50% | 9/14/22 | Monthly | 121 | — |
| Bank of America Merrill Lynch | Vanguard Small-Cap Value ETF | 1 month LIBOR plus 0.50% | 10/4/21 | Monthly | 1 | — |
| Morgan Stanley & Co. | Vanguard Small-Cap Value ETF | Federal Fund Rate plus 0.50% | 9/14/22 | Monthly | 1 | — |
| Bank of America Merrill Lynch | Vanguard Value ETF | 1 month LIBOR | 10/4/21 | Monthly | (2,243) | — |
| Morgan Stanley & Co. | Vanguard Value ETF | Federal Fund Rate minus 0.35% | 9/14/22 | Monthly | (2,243) | — |
| Bank of America Merrill Lynch | Xtrackers USD High Yield Corporate Bond ETF | 1 month LIBOR plus 0.50% | 10/4/21 | Monthly | 32 | — |
| Morgan Stanley & Co. | Xtrackers USD High Yield Corporate Bond ETF | Federal Fund Rate plus 0.50% | 9/14/22 | Monthly | 32 | — |
| | | | | | | $ — |
‡ Less than one-tenth of percent.
| 1. | As of June 30, 2021, cash in the amount $580,000 was pledged from brokers for OTC swap contracts. |
| 2. | Portfolio pays or receives the floating rate and receives or pays the total return of the referenced entity. |
| 3. | Notional amounts reflected as a positive value indicate a long position held by the Portfolio or Index and a negative value indicates a short position. |
| 4. | Reflects the value at reset date as of June 30, 2021. |
| Abbreviation(s): |
| BRIC—Brazil, Russia, India and China |
| DB—Deutsche Bank |
| EAFE—Europe, Australasia and Far East |
| EM—Emerging Markets |
| ETF—Exchange-Traded Fund |
| ETN—Exchange-Traded Note |
| FTSE—Financial Times Stock Exchange |
| KBW—Keefe, Bruyette & Woods |
| LIBOR—London Interbank Offered Rate |
| MBS—Mortgage-Backed Security |
| MSCI—Morgan Stanley Capital International |
| REIT—Real Estate Investment Trust |
| SPDR—Standard & Poor’s Depositary Receipt |
| TIPS—Treasury Inflation-Protected Security |
| USD—United States Dollar |
| VIX—CBOE Volatility Index |
The notes to the financial statements are an integral part of, and should be read in conjunction with, the financial statements.
| 18 | MainStay VP IQ Hedge Multi-Strategy Portfolio |
The following is a summary of the fair valuations according to the inputs used as of June 30, 2021, for valuing the Portfolio’s assets:
| Description | Quoted
Prices in
Active
Markets for
Identical
Assets
(Level 1) | | Significant
Other
Observable
Inputs
(Level 2) | | Significant
Unobservable
Inputs
(Level 3) | | Total |
| Asset Valuation Inputs | | | | | | | |
| Investments in Securities (a) | | | | | | | |
| Exchange-Traded Funds | $ 362,092,443 | | $ — | | $ — | | $ 362,092,443 |
| Exchange-Traded Note | 627,439 | | — | | — | | 627,439 |
| Exchange-Traded Vehicles | 20,043,662 | | — | | — | | 20,043,662 |
| Short-Term Investments | | | | | | | |
| Affiliated Investment Company | 3,817,819 | | — | | — | | 3,817,819 |
| Unaffiliated Investment Company | 38,442,619 | | — | | — | | 38,442,619 |
| Total Short-Term Investments | 42,260,438 | | — | | — | | 42,260,438 |
| Total Investments in Securities | $ 425,023,982 | | $ — | | $ — | | $ 425,023,982 |
| (a) | For a complete listing of investments and their industries, see the Portfolio of Investments. |
The notes to the financial statements are an integral part of, and should be read in conjunction with, the financial statements.
19
Statement of Assets and Liabilities as of June 30, 2021 (Unaudited)
| Assets |
Investment in unaffiliated securities, at value
(identified cost $408,747,189) including securities on loan of $51,664,611 | $421,206,163 |
Investment in affiliated investment companies, at value
(identified cost $3,817,819) | 3,817,819 |
| Cash | 14,778 |
| Cash collateral on deposit at broker for swap contracts | 580,000 |
| Receivables: | |
| Dividends and interest | 205,796 |
| Securities lending | 44,299 |
| Portfolio shares sold | 220 |
| Other assets | 4,034 |
| Total assets | 425,873,109 |
| Liabilities |
| Cash collateral received for securities on loan | 38,442,619 |
| Payables: | |
| Portfolio shares redeemed | 217,647 |
| Manager (See Note 3) | 213,259 |
| Custodian | 210,249 |
| NYLIFE Distributors (See Note 3) | 76,591 |
| Shareholder communication | 50,015 |
| Professional fees | 39,264 |
| Transfer agent (See Note 3) | 1,151 |
| Trustees | 86 |
| Accrued expenses | 12,733 |
| Total liabilities | 39,263,614 |
| Net assets | $386,609,495 |
| Composition of Net Assets |
| Shares of beneficial interest outstanding (par value of $.001 per share) unlimited number of shares authorized | $ 42,446 |
| Additional paid-in-capital | 430,679,218 |
| | 430,721,664 |
| Total distributable earnings (loss) | (44,112,169) |
| Net assets | $386,609,495 |
| Initial Class | |
| Net assets applicable to outstanding shares | $ 13,087,837 |
| Shares of beneficial interest outstanding | 1,433,838 |
| Net asset value per share outstanding | $ 9.13 |
| Service Class | |
| Net assets applicable to outstanding shares | $373,521,658 |
| Shares of beneficial interest outstanding | 41,012,607 |
| Net asset value per share outstanding | $ 9.11 |
The notes to the financial statements are an integral part of, and should be read in conjunction with, the financial statements.
| 20 | MainStay VP IQ Hedge Multi-Strategy Portfolio |
Statement of Operations for the six months ended June 30, 2021 (Unaudited)
| Investment Income (Loss) |
| Income | |
| Dividends-unaffiliated | $ 2,556,779 |
| Securities lending | 192,493 |
| Dividends-affiliated | 93 |
| Total income | 2,749,365 |
| Expenses | |
| Manager (See Note 3) | 1,427,606 |
| Distribution/Service—Service Class (See Note 3) | 460,379 |
| Custodian | 155,425 |
| Professional fees | 37,197 |
| Shareholder communication | 22,994 |
| Trustees | 3,984 |
| Miscellaneous | 15,716 |
| Total expenses before waiver/reimbursement | 2,123,301 |
| Expense waiver/reimbursement from Manager (See Note 3) | (330,489) |
| Net expenses | 1,792,812 |
| Net investment income (loss) | 956,553 |
| Realized and Unrealized Gain (Loss) |
| Net realized gain (loss) on: | |
| Unaffiliated investment transactions | 15,239,363 |
| Futures transactions | 95 |
| Swap transactions | (3,147,558) |
| Net realized gain (loss) | 12,091,900 |
| Net change in unrealized appreciation (depreciation) on: | |
| Unaffiliated investments | (8,931,720) |
| Translation of other assets and liabilities in foreign currencies | (1,893) |
| Net change in unrealized appreciation (depreciation) | (8,933,613) |
| Net realized and unrealized gain (loss) | 3,158,287 |
| Net increase (decrease) in net assets resulting from operations | $ 4,114,840 |
The notes to the financial statements are an integral part of, and should be read in conjunction with, the financial statements.
21
Statements of Changes in Net Assets
for the six months ended June 30, 2021 (Unaudited) and the year ended December 31, 2020
| | 2021 | 2020 |
| Increase (Decrease) in Net Assets |
| Operations: | | |
| Net investment income (loss) | $ 956,553 | $ 4,838,078 |
| Net realized gain (loss) | 12,091,900 | (230,538) |
| Net change in unrealized appreciation (depreciation) | (8,933,613) | 12,200,672 |
| Net increase (decrease) in net assets resulting from operations | 4,114,840 | 16,808,212 |
| Distributions to shareholders: | | |
| Initial Class | — | (208,654) |
| Service Class | — | (5,714,181) |
| | — | (5,922,835) |
| Distributions to shareholders from return of capital: | | |
| Initial Class | — | (37,559) |
| Service Class | — | (1,028,579) |
| Total distributions to shareholders | — | (6,988,973) |
| Capital share transactions: | | |
| Net proceeds from sales of shares | 8,774,998 | 18,019,863 |
| Net asset value of shares issued to shareholder in reinvestment of distributions | — | 6,988,973 |
| Cost of shares redeemed | (10,157,036) | (50,801,186) |
| Increase (decrease) in net assets derived from capital share transactions | (1,382,038) | (25,792,350) |
| Net increase (decrease) in net assets | 2,732,802 | (15,973,111) |
| Net Assets |
| Beginning of period | 383,876,693 | 399,849,804 |
| End of period | $386,609,495 | $383,876,693 |
The notes to the financial statements are an integral part of, and should be read in conjunction with, the financial statements.
| 22 | MainStay VP IQ Hedge Multi-Strategy Portfolio |
Financial Highlights selected per share data and ratios
| | Six months ended
June 30,
2021* | | Year Ended December 31, |
| Initial Class | 2020 | | 2019 | | 2018 † | | 2017 † | | 2016 † |
| Net asset value at beginning of period | $ 9.02 | | $ 8.74 | | $ 8.22 | | $ 8.92 | | $ 9.04 | | $ 9.03 |
| Net investment income (loss) (a) | 0.03 | | 0.14 | | 0.20 | | (0.05) | | (0.08) | | (0.10) |
| Net realized and unrealized gain (loss) on investments | 0.08 | | 0.33 | | 0.49 | | (0.55) | | 0.16 | | 0.03 |
| Net realized and unrealized gain (loss) on foreign currency transactions | 0.00‡ | | 0.00‡ | | (0.00)‡ | | 0.00‡ | | (0.10) | | 0.08 |
| Total from investment operations | 0.11 | | 0.47 | | 0.69 | | (0.60) | | (0.02) | | 0.01 |
| Less distributions: | | | | | | | | | | | |
| From net investment income | — | | (0.16) | | (0.16) | | (0.10) | | (0.10) | | — |
| Return of capital | — | | (0.03) | | (0.01) | | — | | — | | — |
| Total distributions | — | | (0.19) | | (0.17) | | (0.10) | | (0.10) | | — |
| Net asset value at end of period | $ 9.13 | | $ 9.02 | | $ 8.74 | | $ 8.22 | | $ 8.92 | | $ 9.04 |
| Total investment return (b) | 1.22%(c) | | 5.38% | | 8.47% | | (6.88)% | | (0.25)% | | 0.11%(c) |
| Ratios (to average net assets)/Supplemental Data: | | | | | | | | | | | |
| Net investment income (loss) | 0.75%†† | | 1.56% | | 2.36% | | (0.53)% | | (0.93)% | | (1.11)% |
| Net expenses (d) | 0.70%†† | | 0.70% | | 0.70% | | 1.43% | | 1.43% | | 1.46% |
| Expenses (before waiver/reimbursement) (d)(e) | 0.87%†† | | 1.00% | | 1.20% | | 2.96% | | 2.63% | | 2.63% |
| Portfolio turnover rate | 79% | | 179% | | 151% | | 450% | | 185% | | 267% |
| Net assets at end of period (in 000’s) | $ 13,088 | | $ 12,044 | | $ 10,749 | | $ 9,059 | | $ 149,753 | | $ 201,252 |
| * | Unaudited. |
| † | Consolidated Financial Highlights for the periods January 1, 2018 to November 30, 2018, January 1, 2017 to December 31, 2017 and January 9, 2016 to December 31, 2016. |
| ‡ | Less than one cent per share. |
| †† | Annualized. |
| (a) | Per share data based on average shares outstanding during the period. |
| (b) | Total return does not reflect any deduction of sales charges, mortality and expense charges, contract charges or administrative charges. For periods of less than one year, total return is not annualized. |
| (c) | Total investment return may reflect adjustments to conform to generally accepted accounting principles. |
| (d) | In addition to the fees and expenses which the Portfolio bears directly, it also indirectly bears a pro-rata share of the fees and expenses of the underlying funds in which it invests. Such indirect expenses are not included in the above expense ratios. |
| (e) | The expense ratios presented below show the impact of short sales expense: |
| Period Ended | | Net Expenses
(excluding short
sale expenses) | | Short Sales
Expenses |
| June 30, 2021*†† | | 0.70% | | — |
| December 31, 2020 | | 0.70% | | — |
| December 31, 2019 | | 0.70% | | — |
| December 31, 2018 | | 1.43% | | 1.28% |
| December 31, 2017 | | 1.43% | | 1.05% |
| December 31, 2016 | | 1.46% | | 0.95% |
The notes to the financial statements are an integral part of, and should be read in conjunction with, the financial statements.
23
Financial Highlights selected per share data and ratios
| | Six months ended
June 30,
2021* | | Year Ended December 31, |
| Service Class | 2020 | | 2019 | | 2018 † | | 2017 † | | 2016 † |
| Net asset value at beginning of period | $ 9.01 | | $ 8.73 | | $ 8.18 | | $ 8.87 | | $ 8.99 | | $ 9.00 |
| Net investment income (loss) (a) | 0.02 | | 0.11 | | 0.18 | | (0.00)‡ | | (0.11) | | (0.12) |
| Net realized and unrealized gain (loss) on investments | 0.08 | | 0.34 | | 0.49 | | (0.63) | | 0.18 | | 0.03 |
| Net realized and unrealized gain (loss) on foreign currency transactions | 0.00‡ | | 0.00‡ | | (0.00)‡ | | 0.00‡ | | (0.11) | | 0.08 |
| Total from investment operations | 0.10 | | 0.45 | | 0.67 | | (0.63) | | (0.04) | | (0.01) |
| Less distributions: | | | | | | | | | | | |
| From net investment income | — | | (0.14) | | (0.12) | | (0.06) | | (0.08) | | — |
| Return of capital | — | | (0.03) | | (0.00)‡ | | — | | — | | — |
| Total distributions | — | | (0.17) | | (0.12) | | (0.06) | | (0.08) | | — |
| Net asset value at end of period | $ 9.11 | | $ 9.01 | | $ 8.73 | | $ 8.18 | | $ 8.87 | | $ 8.99 |
| Total investment return (b) | 1.11%(c) | | 5.14% | | 8.23% | | (7.14)% | | (0.51)% | | (0.11)%(c) |
| Ratios (to average net assets)/Supplemental Data: | | | | | | | | | | | |
| Net investment income (loss) | 0.49%†† | | 1.29% | | 2.09% | | 0.03% | | (1.20)% | | (1.36)% |
| Net expenses (d) | 0.95%†† | | 0.95% | | 0.95% | | 1.60% | | 1.68% | | 1.71% |
| Expenses (before waiver/reimbursement) (d)(e) | 1.12%†† | | 1.25% | | 1.45% | | 2.84% | | 2.88% | | 2.80% |
| Portfolio turnover rate | 79% | | 179% | | 151% | | 450% | | 185% | | 267% |
| Net assets at end of period (in 000’s) | $ 373,522 | | $ 371,833 | | $ 389,101 | | $ 391,094 | | $ 423,600 | | $ 366,470 |
| * | Unaudited. |
| † | Consolidated Financial Highlights for the periods January 1, 2018 to November 30, 2018, January 1, 2017 to December 31, 2017 and January 9, 2016 to December 31, 2016. |
| ‡ | Less than one cent per share. |
| †† | Annualized. |
| (a) | Per share data based on average shares outstanding during the period. |
| (b) | Total return does not reflect any deduction of sales charges, mortality and expense charges, contract charges or administrative charges. For periods of less than one year, total return is not annualized. |
| (c) | Total investment return may reflect adjustments to conform to generally accepted accounting principles. |
| (d) | In addition to the fees and expenses which the Portfolio bears directly, it also indirectly bears a pro-rata share of the fees and expenses of the underlying funds in which it invests. Such indirect expenses are not included in the above expense ratios. |
| (e) | The expense ratios presented below show the impact of short sales expense: |
| Period Ended | | Net Expenses
(excluding short
sale expenses) | | Short Sales
Expenses |
| June 30, 2021*†† | | 0.95% | | — |
| December 31, 2020 | | 0.95% | | — |
| December 31, 2019 | | 0.95% | | — |
| December 31, 2018 | | 1.60% | | 0.99% |
| December 31, 2017 | | 1.68% | | 1.05% |
| December 31, 2016 | | 1.71% | | 0.90% |
The notes to the financial statements are an integral part of, and should be read in conjunction with, the financial statements.
| 24 | MainStay VP IQ Hedge Multi-Strategy Portfolio |
Notes to Financial Statements (Unaudited)
Note 1–Organization and Business
MainStay VP Funds Trust (the “Fund”) was organized as a Delaware statutory trust on February 1, 2011. The Fund is registered under the Investment Company Act of 1940, as amended (the “1940 Act”), as an open-end management investment company. The Fund is comprised of thirty-one separate series (collectively referred to as the “Portfolios”). These financial statements and notes relate to the MainStay VP IQ Hedge Multi-Strategy Portfolio (the "Portfolio"), a "diversified” portfolio, as that term is defined in the 1940 Act, as interpreted or modified by regulatory authorities having jurisdiction, from time to time.
Shares of the Portfolio are currently offered to certain separate accounts to fund variable annuity policies and variable universal life insurance policies issued by New York Life Insurance and Annuity Corporation (“NYLIAC”), a wholly-owned subsidiary of New York Life Insurance Company (“New York Life”) and may also be offered to fund variable annuity policies and variable universal life insurance policies issued by other insurance companies. NYLIAC allocates shares of the Portfolios to, among others, certain NYLIAC separate accounts. Shares of the Portfolio are also offered to the MainStay VP Conservative Allocation Portfolio, MainStay VP Moderate Allocation Portfolio, MainStay VP Growth Allocation Portfolio (formerly known as MainStay VP Moderate Growth Allocation Portfolio) and MainStay VP Equity Allocation Portfolio (formerly known as MainStay VP Growth Allocation Portfolio), which operate as “funds-of-funds," and other variable insurance funds.
The following table lists the Portfolio's share classes that have been registered and commenced operations:
| Class | Commenced Operations |
| Initial Class | May 1, 2013 |
| Service Class | May 1, 2013 |
Shares of the Portfolio are offered and are redeemed at a price equal to their respective net asset value (“NAV”) per share. No sales or redemption charge is applicable to the purchase or redemption of the Portfolio's shares. Under the terms of the Fund’s multiple class plan, adopted pursuant to Rule 18f-3 under the 1940 Act, the classes differ in that, among other things, Service Class shares of the Portfolio pay a combined distribution and service fee of 0.25% of average daily net assets attributable to Service Class shares of the Portfolio to the Distributor (as defined in Note 3(B)) pursuant to a plan adopted in accordance with Rule 12b-1 under the 1940 Act. Contract owners of variable annuity contracts purchased after June 2, 2003, are permitted to invest only in the Service Class shares.
The Portfolio's investment objective is to seek investment returns that correspond (before fees and expenses) generally to the price and yield performance of its underlying index, the IQ Hedge Multi-Strategy Index. The IQ Hedge Multi-Strategy Index seeks to achieve performance similar to the overall hedge fund universe by replicating the “beta” portion of the hedge fund return characteristics (i.e., that portion of the returns that are non-idiosyncratic, or unrelated to manager skill) by using the following
hedge fund investment styles: long/short equity; global macro; market neutral; event-driven; fixed-income arbitrage; and emerging markets.
The Portfolio is a “fund of funds” that seeks to achieve its investment objective by investing primarily in exchange-traded funds (“ETFs”), other exchange-traded vehicles issuing equity securities organized in the U.S., such as exchange-traded commodity pools (“ETVs”), and exchange-traded notes (“ETNs”) (such ETFs, ETVs and ETNs are referred to collectively as “exchange-traded products” or “ETPs”), but may also invest in one or more financial instruments, including but not limited to, futures contracts, reverse repurchase agreements, options, and swap agreements (collectively, “Financial Instruments”) in order to seek to achieve exposure to investment strategies and/or asset classes that are similar to those of the IQ Hedge Multi-Strategy Index.
Note 2–Significant Accounting Policies
The Portfolio is an investment company and accordingly follows the investment company accounting and reporting guidance of the Financial Accounting Standards Board (“FASB”) Accounting Standard Codification Topic 946 Financial Services—Investment Companies. The Portfolio prepares its financial statements in accordance with generally accepted accounting principles (“GAAP”) in the United States of America and follows the significant accounting policies described below.
(A) Securities Valuation. Investments are usually valued as of the close of regular trading on the New York Stock Exchange (the "Exchange") (usually 4:00 p.m. Eastern time) on each day the Portfolio is open for business ("valuation date").
The Board of Trustees of the Fund (the "Board") adopted procedures establishing methodologies for the valuation of the Portfolio's securities and other assets and delegated the responsibility for valuation determinations under those procedures to the Valuation Committee of the Fund (the “Valuation Committee”). The procedures state that, subject to the oversight of the Board and unless otherwise noted, the responsibility for the day-to-day valuation of portfolio assets (including fair value measurements for the Portfolio's assets and liabilities) rests with New York Life Investment Management LLC (“New York Life Investments” or the "Manager"), aided to whatever extent necessary by the Subadvisor (as defined in Note 3(A)). To assess the appropriateness of security valuations, the Manager, the Subadvisor or the Portfolio's third-party service provider, who is subject to oversight by the Manager, regularly compares prior day prices, prices on comparable securities and the sale prices to the prior and current day prices and challenges prices with changes exceeding certain tolerance levels with third-party pricing services or broker sources.
The Board authorized the Valuation Committee to appoint a Valuation Subcommittee (the “Subcommittee”) to establish the prices of securities for which market quotations are not readily available or the prices of which are not otherwise readily determinable under the procedures. The Subcommittee meets (in person, via electronic mail or via teleconference)
Notes to Financial Statements (Unaudited) (continued)
on an as-needed basis. The Valuation Committee meets to ensure that actions taken by the Subcommittee were appropriate.
For those securities valued through either a standardized fair valuation methodology or a fair valuation measurement, the Subcommittee deals with such valuation and the Valuation Committee reviews and affirms, if appropriate, the reasonableness of the valuation based on such methodologies and measurements on a regular basis after considering information that is reasonably available and deemed relevant by the Valuation Committee. Any action taken by the Subcommittee with respect to the valuation of a portfolio security or other asset is submitted for review and ratification (if appropriate) to the Valuation Committee and the Board at the next regularly scheduled meeting.
"Fair value" is defined as the price the Portfolio would reasonably expect to receive upon selling an asset or liability in an orderly transaction to an independent buyer in the principal or most advantageous market for the asset or liability. Fair value measurements are determined within a framework that establishes a three-tier hierarchy that maximizes the use of observable market data and minimizes the use of unobservable inputs to establish a classification of fair value measurements for disclosure purposes. "Inputs" refer broadly to the assumptions that market participants would use in pricing the asset or liability, including assumptions about risk, such as the risk inherent in a particular valuation technique used to measure fair value using a pricing model and/or the risk inherent in the inputs for the valuation technique. Inputs may be observable or unobservable. Observable inputs reflect the assumptions market participants would use in pricing the asset or liability based on market data obtained from sources independent of the Portfolio. Unobservable inputs reflect the Portfolio’s own assumptions about the assumptions market participants would use in pricing the asset or liability based on the information available. The inputs or methodology used for valuing assets or liabilities may not be an indication of the risks associated with investing in those assets or liabilities. The three-tier hierarchy of inputs is summarized below.
| • | Level 1—quoted prices in active markets for an identical asset or liability |
| • | Level 2—other significant observable inputs (including quoted prices for a similar asset or liability in active markets, interest rates and yield curves, prepayment speeds, credit risk, etc.) |
| • | Level 3—significant unobservable inputs (including the Portfolio's own assumptions about the assumptions that market participants would use in measuring fair value of an asset or liability) |
The level of an asset or liability within the fair value hierarchy is based on the lowest level of an input, both individually and in the aggregate, that is significant to the fair value measurement. The aggregate value by input level of the Portfolio’s assets and liabilities as of June 30, 2021, is included at the end of the Portfolio of Investments.
The Portfolio may use third-party vendor evaluations, whose prices may be derived from one or more of the following standard inputs, among others:
| • Benchmark yields | • Reported trades |
| • Broker/dealer quotes | • Issuer spreads |
| • Two-sided markets | • Benchmark securities |
| • Bids/offers | • Reference data (corporate actions or material event notices) |
| • Industry and economic events | • Comparable bonds |
| • Monthly payment information | |
An asset or liability for which market values cannot be measured using the methodologies described above is valued by methods deemed reasonable in good faith by the Valuation Committee, following the procedures established by the Board, to represent fair value. Under these procedures, the Portfolio generally uses a market-based approach which may use related or comparable assets or liabilities, recent transactions, market multiples, book values and other relevant information. The Portfolio may also use an income-based valuation approach in which the anticipated future cash flows of the asset or liability are discounted to calculate fair value. Discounts may also be applied due to the nature and/or duration of any restrictions on the disposition of the asset or liability. Fair value represents a good faith approximation of the value of a security. Fair value determinations involve the consideration of a number of subjective factors, an analysis of applicable facts and circumstances and the exercise of judgment. As a result, it is possible that the fair value for a security determined in good faith in accordance with the Portfolio's valuation procedures may differ from valuations for the same security determined by other funds using their own valuation procedures. Although the Portfolio's valuation procedures are designed to value a security at the price the Portfolio may reasonably expect to receive upon the security's sale in an orderly transaction, there can be no assurance that any fair value determination thereunder would, in fact, approximate the amount that the Portfolio would actually realize upon the sale of the security or the price at which the security would trade if a reliable market price were readily available. During the six-month period ended June 30, 2021, there were no material changes to the fair value methodologies.
Securities which may be valued in this manner include, but are not limited to: (i) a security for which trading has been halted or suspended; (ii) a debt security that has recently gone into default and for which there is not a current market quotation; (iii) a security of an issuer that has entered into a restructuring; (iv) a security that has been delisted from a national exchange; (v) a security for which the market price is not readily available from a third-party pricing source or, if so provided, does not, in the opinion of the Manager or the Subadvisor, reflect the security's market value; (vi) a security subject to trading collars for which no or limited trading takes place; and (vii) a security whose principal market has been temporarily closed at a time when, under normal conditions, it would be open. Securities valued in this manner are generally categorized as Level 3 in the hierarchy. No securities held by the Portfolio as of June 30, 2021 were fair valued in such a manner.
| 26 | MainStay VP IQ Hedge Multi-Strategy Portfolio |
ETFs are valued at the last quoted sales prices as of the close of regular trading on the relevant exchange on each valuation date. Securities that are not traded on the valuation date are valued at the mean of the last quoted bid and ask prices. Prices are normally taken from the principal market in which each security trades. These securities are generally categorized as Level 1 in the hierarchy.
Investments in mutual funds, including money market funds, are valued at their respective NAVs at the close of business each day on the valuation date. These securities are generally categorized as Level 1 in the hierarchy.
Swaps are marked to market daily based upon quotations from pricing agents, brokers or market makers. These securities are generally categorized as Level 2 in the hierarchy.
Total return swap contracts, which are arrangements to exchange a market-linked return for a periodic payment, are based on a notional principal amount. To the extent that the total return of the security, index or other financial measure underlying the transaction exceeds or falls short of the offsetting interest rate obligation, the Portfolio will receive a payment from or make a payment to the counterparty. Total return swap contracts are marked to market daily based upon quotations from market makers and these securities are generally categorized as Level 2 in the hierarchy.
Temporary cash investments acquired in excess of 60 days to maturity at the time of purchase are valued using the latest bid prices or using valuations based on a matrix system (which considers such factors as security prices, yields, maturities and ratings), both as furnished by independent pricing services. Temporary cash investments that mature in 60 days or less at the time of purchase ("Short-Term Investments") are valued using the amortized cost method of valuation, unless the use of such method would be inappropriate. The amortized cost method involves valuing a security at its cost on the date of purchase and thereafter assuming a constant amortization to maturity of the difference between such cost and the value on maturity date. Amortized cost approximates the current fair value of a security. Securities valued using the amortized cost method are not valued using quoted prices in an active market and are generally categorized as Level 2 in the hierarchy.
The information above is not intended to reflect an exhaustive list of the methodologies that may be used to value portfolio investments. The valuation procedures permit the use of a variety of valuation methodologies in connection with valuing portfolio investments. The methodology used for a specific type of investment may vary based on the market data available or other considerations. The methodologies summarized above may not represent the specific means by which portfolio investments are valued on any particular business day.
(B) Income Taxes. The Portfolio's policy is to comply with the requirements of the Internal Revenue Code of 1986, as amended (the “Internal Revenue Code”), applicable to regulated investment companies and to distribute all of its taxable income to the shareholders of the Portfolio within the allowable time limits.
The Manager evaluates the Portfolio’s tax positions to determine if the tax positions taken meet the minimum recognition threshold in connection with accounting for uncertainties in income tax positions taken or expected to be taken for the purposes of measuring and recognizing tax liabilities in the financial statements. Recognition of tax benefits of an uncertain tax position is permitted only to the extent the position is “more likely than not” to be sustained assuming examination by taxing authorities. The Manager analyzed the Portfolio's tax positions taken on federal, state and local income tax returns for all open tax years (for up to three tax years) and has concluded that no provisions for federal, state and local income tax are required in the Portfolio's financial statements. The Portfolio's federal, state and local income tax and federal excise tax returns for tax years for which the applicable statutes of limitations have not expired are subject to examination by the Internal Revenue Service and state and local departments of revenue.
(C) Foreign Taxes. The Portfolio may be subject to foreign taxes on income and other transaction-based taxes imposed by certain countries in which it invests. A portion of the taxes on gains on investments or currency purchases/repatriation may be reclaimable. The Portfolio will accrue such taxes and reclaims as applicable, based upon its current interpretation of tax rules and regulations that exist in the markets in which it invests.
The Portfolio may be subject to taxation on realized capital gains, repatriation proceeds and other transaction-based taxes imposed by certain countries in which it invests. The Portfolio will accrue such taxes as applicable based upon its current interpretation of tax rules and regulations that exist in the market in which it invests. Capital gains taxes relating to positions still held are reflected as a liability in the Statement of Assets and Liabilities, as well as an adjustment to the Portfolio's net unrealized appreciation (depreciation). Taxes related to capital gains realized, if any, are reflected as part of net realized gain (loss) in the Statement of Operations. Changes in tax liabilities related to capital gains taxes on unrealized investment gains, if any, are reflected as part of the change in net unrealized appreciation (depreciation) on investments in the Statement of Operations. Transaction-based charges are generally assessed as a percentage of the transaction amount.
(D) Dividends and Distributions to Shareholders. Dividends and distributions are recorded on the ex-dividend date. The Portfolio intends to declare and pay dividends from net investment income and distributions from net realized capital and currency gains, if any, at least annually. Unless a shareholder elects otherwise, all dividends and distributions are reinvested at NAV in the same class of shares of the Portfolio. Dividends and distributions to shareholders are determined in accordance with federal income tax regulations and may differ from determinations using GAAP.
(E) Security Transactions and Investment Income. The Portfolio records security transactions on the trade date. Realized gains and losses on security transactions are determined using the identified cost method. Dividend income is recognized on the ex-dividend date, net of any foreign tax withheld at the source, and interest income is accrued as earned
Notes to Financial Statements (Unaudited) (continued)
using the effective interest rate method. Distributions received from real estate investment trusts may be classified as dividends, capital gains and/or return of capital.
Investment income and realized and unrealized gains and losses on investments of the Portfolio are allocated pro rata to the separate classes of shares based upon their relative net assets on the date the income is earned or realized and unrealized gains and losses are incurred.
(F) Expenses. Expenses of the Fund are allocated to the individual Portfolios in proportion to the net assets of the respective Portfolios when the expenses are incurred, except where direct allocations of expenses can be made. Expenses (other than fees incurred under the distribution and service plans, further discussed in Note 3(B), which are charged directly to the Service Class shares) are allocated to separate classes of shares pro rata based upon their relative net assets on the date the expenses are incurred. The expenses borne by the Portfolio, including those of related parties to the Portfolio, are shown in the Statement of Operations.
Additionally, the Portfolio may invest in ETPs and mutual funds, which are subject to management fees and other fees that may cause the costs of investing in ETPs and mutual funds to be greater than the costs of owning the underlying securities directly. These indirect expenses of ETPs and mutual funds are not included in the amounts shown as expenses in the Statement of Operations or in the expense ratios included in the Financial Highlights.
In addition, the Portfolio bears a pro rata share of the fees and expenses of the ETPs in which it invests. Because the ETPs have varied expense and fee levels and the Portfolio may own different proportions of the ETPs at different times, the amount of fees and expenses incurred indirectly by the Portfolio may vary.
(G) Use of Estimates. In preparing financial statements in conformity with GAAP, the Manager makes estimates and assumptions that affect the reported amounts and disclosures in the financial statements. Actual results could differ from those estimates and assumptions.
(H) Futures Contracts. A futures contract is an agreement to purchase or sell a specified quantity of an underlying instrument at a specified future date and price, or to make or receive a cash payment based on the value of a financial instrument (e.g., foreign currency, interest rate, security or securities index). The Portfolio is subject to risks such as market price risk and/or interest rate risk in the normal course of investing in these contracts. Upon entering into a futures contract, the Portfolio is required to pledge to the broker or futures commission merchant an amount of cash and/or U.S. government securities equal to a certain percentage of the collateral amount, known as the “initial margin.” During the period the futures contract is open, changes in the value of the contract are recognized as unrealized appreciation or depreciation by marking to market such contract on a daily basis to reflect the market value of the contract at the end of each day’s trading. The Portfolio agrees to receive from or pay to the broker or futures commission merchant an amount of cash equal to the daily fluctuation in
the value of the contract. Such receipts or payments are known as “variation margin.” When the futures contract is closed, the Portfolio records a realized gain or loss equal to the difference between the proceeds from (or cost of) the closing transaction and the Portfolio's basis in the contract.
The use of futures contracts involves, to varying degrees, elements of market risk in excess of the amount recognized in the Statement of Assets and Liabilities. The contract or notional amounts and variation margin reflect the extent of the Portfolio's involvement in open futures positions. There are several risks associated with the use of futures contracts as hedging techniques. There can be no assurance that a liquid market will exist at the time when the Portfolio seeks to close out a futures contract. If no liquid market exists, the Portfolio would remain obligated to meet margin requirements until the position is closed. Futures contracts may involve a small initial investment relative to the risk assumed, which could result in losses greater than if the Portfolio did not invest in futures contracts. Futures contracts may be more volatile than direct investments in the instrument underlying the futures and may not correlate to the underlying instrument, causing a given hedge not to achieve its objectives. The Portfolio's activities in futures contracts have minimal counterparty risk as they are conducted through regulated exchanges that guarantee the futures against default by the counterparty. In the event of a bankruptcy or insolvency of a futures commission merchant that holds margin on behalf of the Portfolio, the Portfolio may not be entitled to the return of the entire margin owed to the Portfolio, potentially resulting in a loss. The Portfolio may invest in futures contracts to seek enhanced returns or to reduce the risk of loss by hedging certain of its holdings. The Portfolio's investment in futures contracts and other derivatives may increase the volatility of the Portfolio's NAVs and may result in a loss to the Portfolio. As of June 30, 2021, the Portfolio did not hold any open futures contracts..
(I) Swap Contracts. The Portfolio may enter into credit default, interest rate, equity, index and currency exchange rate swap contracts (“swaps”). In a typical swap transaction, two parties agree to exchange the future returns (or differentials in rates of future returns) earned or realized at periodic intervals on a particular investment or instrument based on a notional principal amount. Generally, the Portfolio will enter into a swap on a net basis, which means that the two payment streams under the swap are netted, with the Portfolio receiving or paying (as the case may be) only the net amount of the two payment streams. Therefore, the Portfolio's current obligation under a swap generally will be equal to the net amount to be paid or received under the swap, based on the relative value of notional positions attributable to each counterparty to the swap. The payments may be adjusted for transaction costs, interest payments, the amount of interest paid on the investment or instrument or other factors. Collateral, in the form of cash or securities, may be required to be held in segregated accounts with the custodian bank or broker in accordance with the terms of the swap. Swap agreements are privately negotiated in the over the counter (“OTC”) market and may be executed in a multilateral or other trade facilities platform, such as a registered commodities exchange (“centrally cleared swaps”).
| 28 | MainStay VP IQ Hedge Multi-Strategy Portfolio |
Certain standardized swaps, including certain credit default and interest rate swaps, are subject to mandatory clearing and exchange-trading, and more types of standardized swaps are expected to be subject to mandatory clearing and exchange-trading in the future. The counterparty risk for exchange-traded and cleared derivatives is expected to be generally lower than for uncleared derivatives, but cleared contracts are not risk-free. In a cleared derivative transaction, the Portfolio typically enters into the transaction with a financial institution counterparty, and performance of the transaction is effectively guaranteed by a central clearinghouse, thereby reducing or eliminating the Portfolio's exposure to the credit risk of its original counterparty. The Portfolio will be required to post specified levels of margin with the clearinghouse or at the instruction of the clearinghouse; the margin required by a clearinghouse may be greater than the margin the Portfolio would be required to post in an uncleared transaction. As of June 30, 2021, all swap positions outstanding are shown in the Portfolio of Investments.
Swaps are marked to market daily based upon quotations from pricing agents, brokers, or market makers and the change in value, if any, is recorded as unrealized appreciation or depreciation. Any payments made or received upon entering into a swap would be amortized or accreted over the life of the swap and recorded as a realized gain or loss. Early termination of a swap is recorded as a realized gain or loss. Daily changes in valuation of centrally cleared swaps, if any, are recorded as a receivable or payable for the change in value as appropriate on the Statement of Assets and Liabilities.
The Portfolio bears the risk of loss of the amount expected to be received under a swap in the event of the default or bankruptcy of the swap counterparty. The Portfolio may be able to eliminate its exposure under a swap either by assignment or other disposition, or by entering into an offsetting swap with the same party or a similar credit-worthy party. Swaps are not actively traded on financial markets. Entering into swaps involves elements of credit, market, and documentation risk in excess of the amounts recognized on the Statement of Assets and Liabilities. Such risks involve the possibilities that there will be no liquid market for these swaps, that the counterparty to the swaps may default on its obligation to perform or disagree as to the meaning of the contractual terms in the swaps and that there may be unfavorable changes in interest rates, the price of the index or the security underlying these transactions.
Equity Swaps (Total Return Swaps). Total return swap contracts are agreements between counterparties to exchange cash flow, one based on a market-linked return of an individual asset or group of assets (such as an index), and the other on a fixed or floating rate. As a total return swap, an equity swap may be structured in different ways. For example, when the Portfolio enters into a “long” equity swap, the counterparty may agree to pay the Portfolio the amount, if any, by which the notional amount of the equity swap would have increased in value had it been invested in a particular referenced security or securities, plus the dividends that would have been received on those securities. In return, the Portfolio will generally agree to pay the counterparty interest on the notional amount of the equity swap plus the amount, if any, by which that notional amount would have decreased in value had it been invested in such referenced
security or securities, plus, in certain instances, commissions or trading spreads on the notional amounts. Therefore, the Portfolio's return on the equity swap generally should equal the gain or loss on the notional amount, plus dividends on the referenced security or securities less the interest paid by the Portfolio on the notional amount. Alternatively, when the Portfolio enters into a “short” equity swap, the counterparty will generally agree to pay the Portfolio the amount, if any, by which the notional amount of the equity swap would have decreased in value had the Portfolio sold a particular referenced security or securities short, less the dividend expense that the Portfolio would have incurred on the referenced security or securities, as adjusted for interest payments or other economic factors. In this situation, the Portfolio will generally be obligated to pay the amount, if any, by which the notional amount of the swap would have increased in value had it been invested directly in the referenced security or securities.
Equity swaps generally do not involve the delivery of securities or other referenced assets. Accordingly, the risk of loss with respect to equity swaps is normally limited to the net amount of payments that the Portfolio is contractually obligated to make. If the other party to an equity swap defaults, the Portfolio's risk of loss consists of the net amount of payments that the Portfolio is contractually entitled to receive, if any. The Portfolio will segregate cash or liquid assets, enter into offsetting transactions or use other measures permitted by applicable law to “cover” the Portfolio's current obligations. The Portfolio and New York Life Investments, however, believe these transactions do not constitute senior securities under the 1940 Act and, accordingly, will not treat them as being subject to the Portfolio's borrowing restrictions.
Equity swaps are derivatives and their value can be very volatile. The Portfolio may engage in total return swaps to gain exposure to emerging markets securities, along with offsetting long total return swap positions to maintain appropriate currency balances and risk exposures across all swap positions. To the extent that the Manager, or the Subadvisor do not accurately analyze and predict future market trends, the values or assets or economic factors, the Portfolio may suffer a loss, which may be substantial.
(J) Securities Lending. In order to realize additional income, the Portfolio may engage in securities lending, subject to the limitations set forth in the 1940 Act and relevant guidance by the staff of the Securities and Exchange Commission (“SEC”). If the Portfolio engages in securities lending, the Portfolio will lend through its custodian, JPMorgan Chase Bank, N.A., ("JPMorgan"), acting as securities lending agent on behalf of the Portfolio. Under the current arrangement, JPMorgan will manage the Portfolio's collateral in accordance with the securities lending agency agreement between the Portfolio and JPMorgan, and indemnify the Portfolio against counterparty risk. The loans will be collateralized by cash (which may be invested in a money market fund) and/or non-cash collateral (which may include U.S. Treasury securities and/or U.S. government agency securities issued or guaranteed by the United States government or its agencies or instrumentalities) at least equal at all times to the market value of the securities loaned. The Portfolio bears the risk of
Notes to Financial Statements (Unaudited) (continued)
delay in recovery of, or loss of rights in, the securities loaned. The Portfolio may also record a realized gain or loss on securities deemed sold due to a borrower’s inability to return securities on loan. The Portfolio bears the risk of any loss on investment of cash collateral. The Portfolio will receive compensation for lending its securities in the form of fees or it will retain a portion of interest earned on the investment of any cash collateral. The Portfolio will also continue to receive interest and dividends on the securities loaned and any gain or loss in the market price of the securities loaned that may occur during the term of the loan will be for the account of the Portfolio. Income earned from securities lending activities, if any, is reflected in the Statement of Operations. Securities on loan as of June 30, 2021, are shown in the Portfolio of Investments.
Prior to February 22, 2021, these services were provided by State Street Bank and Trust Company (“State Street”).
(K) Foreign Securities Risk. The Portfolio may invest in foreign securities, which carry certain risks that are in addition to the usual risks inherent in domestic securities. These risks include those resulting from currency fluctuations, future adverse political or economic developments and possible imposition of currency exchange blockages or other foreign governmental laws or restrictions. These risks are likely to be greater in emerging markets than in developed markets. The ability of issuers of debt securities held by the Portfolio to meet their obligations may be affected by, among other things, economic or political developments in a specific country, industry or region.
(L) Counterparty Credit Risk. In order to better define its contractual rights and to secure rights that will help the Portfolio mitigate its counterparty risk, the Portfolio may enter into an International Swaps and Derivatives Association, Inc. Master Agreement (“ISDA Master Agreement”) or similar agreement with its counterparties. An ISDA Master Agreement is a bilateral agreement between the Portfolio and a counterparty that governs certain OTC derivatives and typically contains collateral posting terms and netting provisions. Under an ISDA Master Agreement, the Portfolio may, under certain circumstances, offset with the counterparty certain derivative financial instruments’ payables and/ or receivables with collateral held and/or posted and create one single net payment. The provisions of the ISDA Master Agreement typically permit a single net payment in the event of default including the bankruptcy or insolvency of the counterparty. Bankruptcy or insolvency laws of a particular jurisdiction may restrict or prohibit the right of offset in bankruptcy, insolvency or other events. In addition, certain ISDA Master Agreements may contain provisions for early termination of OTC derivative transactions in the event the net assets of the Portfolio decline below specific levels or if the Portfolio fails to meet the terms of its ISDA Master Agreements. The result would cause the Portfolio to accelerate payment of any net liability owed to the counterparty.
For financial reporting purposes, the Portfolio does not offset derivative assets and derivative liabilities that are subject to netting arrangements, if any, in the Statement of Assets and Liabilities.
(M) LIBOR Replacement Risk. The Portfolio may invest in certain debt securities, derivatives or other financial instruments that utilize the London Interbank Offered Rate ("LIBOR"), as a “benchmark” or “reference rate” for various interest rate calculations. The United Kingdom Financial Conduct Authority, which regulates LIBOR, announced that after 2021 it will cease its active encouragement of banks to provide the quotations needed to sustain LIBOR. However, it is possible that certain LIBOR tenors may continue beyond 2021 and the most widely used LIBOR tenors may continue until mid-2023. As a result, it is anticipated that LIBOR will be discontinued or will no longer be sufficiently robust to be representative of its underlying market around that time. Although financial regulators and industry working groups have suggested alternative reference rates, such as European Interbank Offer Rate (“EURIBOR”), Sterling Overnight Interbank Average Rate (“SONIA”) and Secured Overnight Financing Rate (“SOFR”), there are challenges to converting certain contracts and transactions to a new benchmark and neither the full effects of the transition process nor its ultimate outcome is known. New York Life Investments is currently working to assess exposure and will modify contracts as necessary.
The elimination of LIBOR or changes to other reference rates or any other changes or reforms to the determination or supervision of reference rates could have an adverse impact on the market for, or value of, any securities or payments linked to those reference rates, which may adversely affect the Portfolio's performance and/or net asset value. Uncertainty and risk also remain regarding the willingness and ability of issuers and lenders to include revised provisions in new and existing contracts or instruments. Consequently, the transition away from LIBOR to other reference rates may lead to increased volatility and illiquidity in markets that are tied to LIBOR, fluctuations in values of LIBOR-related investments or investments in issuers that utilize LIBOR, increased difficulty in borrowing or refinancing and diminished effectiveness of hedging strategies, adversely affecting the Portfolio's performance. Furthermore, the risks associated with the expected discontinuation of LIBOR and transition may be exacerbated if the work necessary to effect an orderly transition to an alternative reference rate is not completed in a timely manner. Because the usefulness of LIBOR as a benchmark could deteriorate during the transition period, these effects could occur prior to the end of 2021 with respect to certain LIBOR tenors or mid-2023 for the remaining LIBOR tenors.
(N) Indemnifications. Under the Fund’s organizational documents, its officers and trustees are indemnified against certain liabilities that may arise out of performance of their duties to the Fund. Additionally, in the normal course of business, the Portfolio enters into contracts with third-party service providers that contain a variety of representations and warranties and that may provide general indemnifications. The Portfolio's maximum exposure under these arrangements is unknown, as this would involve future claims that may be made against the Portfolio that have not yet occurred. The Manager believes that the risk of loss in connection with these potential indemnification obligations is remote. However, there can be no assurance that material liabilities related to such obligations will not arise in the future, which could adversely impact the Portfolio.
| 30 | MainStay VP IQ Hedge Multi-Strategy Portfolio |
(O) Quantitative Disclosure of Derivative Holdings. The following tables show additional disclosures related to the Portfolio's derivative and hedging activities, including how such activities are accounted for and their effect on the Portfolio's financial positions, performance and cash flows.
The Portfolio utilizes a range of derivative instruments for a variety of different purposes. Total return swaps (“TRS”) are one form of derivative that is used. In some cases, TRS contracts are entered into so as to affect long and short exposure to individual securities or indices within a particular strategy. In other cases, TRS are used to gain exposure to the strategy itself, which may also use derivatives. For example, a TRS contract is used to generate the return available from a customized index comprised of a diversified basket of exchange-traded futures. Other examples of derivative positions into which the Portfolio may enter include interest rate swaps, credit default swaps and option contracts. These instruments are frequently used to obtain a desired return at a lower cost to the Portfolio than is available when investing directly in the underlying instrument or to hedge against credit and interest rate risks. The Portfolio may also enter into foreign currency forward contracts to gain exposure to a particular currency or to hedge against the risk of loss due to changing currency exchange rates. These derivatives are not accounted for as hedging instruments.
The effect of derivative instruments on the Statement of Operations for the six-month period ended June 30, 2021:
| Net Realized Gain (Loss) from: | Equity
Contracts
Risk | Total |
| Swap Contracts | $(3,147,558) | $(3,147,558) |
| Total Net Realized Gain (Loss) | $(3,147,558) | $(3,147,558) |
| Average Notional Amount | Total |
| Swap Contracts Long | $ 31,055,901 |
| Swap Contracts Short | $(31,346,119) |
Note 3–Fees and Related Party Transactions
(A) Manager and Subadvisor. New York Life Investments, a registered investment adviser and an indirect, wholly-owned subsidiary of New York Life, serves as the Portfolio’s Manager, pursuant to an Amended and Restated Management Agreement (“Management Agreement”). The Manager provides offices, conducts clerical, recordkeeping and bookkeeping services, and keeps most of the financial and accounting records required to be maintained by the Portfolio. Except for the portion of salaries and expenses that are the responsibility of the Portfolio, the Manager pays the salaries and expenses of all personnel affiliated with the Portfolio and certain operational expenses of the Portfolio. The Portfolio reimburses New York Life Investments in an amount equal to the portion of the compensation of the Chief Compliance Officer attributable to the Portfolio. IndexIQ Advisors LLC (“IndexIQ Advisors” or “Subadvisor”), a registered investment adviser and an affiliate of New York Life
Investments, serves as Subadvisor to the Portfolio and is responsible for the day-to-day portfolio management of the Portfolio. Pursuant to the terms of a Subadvisory Agreement (“Subadvisory Agreement”) between New York Life Investments and IndexIQ Advisors, New York Life Investments pays for the services of the Subadvisor.
Pursuant to the Management Agreement, the Fund pays the Manager, on behalf of the Portfolio, a monthly fee for the services performed and the facilities furnished at an annual rate of 0.75% of the Portfolio's average daily net assets.
New York Life Investments has contractually agreed to waive fees and/or reimburse expenses so that the Total Annual Portfolio Operating Expenses (excluding taxes, interest, litigation, extraordinary expenses, brokerage and other transaction expenses relating to the purchase or sale of portfolio investments and acquired (underlying) portfolio/fund fees and expenses) of Initial Class shares and Service Class shares do not exceed 0.70% and 0.95%, respectively, of the Portfolio's average daily net assets. This agreement will remain in effect until May 1, 2022, and shall renew automatically for one-year terms unless New York Life Investments provides written notice of termination prior to the start of the next term or upon approval of the Board.
During the six-month period ended June 30, 2021, New York Life Investments earned fees from the Portfolio in the amount of $1,427,606 and waived fees and/or reimbursed expenses in the amount of $330,489 and paid the Subadvisor fees in the amount of $548,646.
JPMorgan provides sub-administration and sub-accounting services to the Portfolio pursuant to an agreement with New York Life Investments. These services include calculating the daily NAVs of the Portfolio, maintaining the general ledger and sub-ledger accounts for the calculation of the Portfolio's NAVs, and assisting New York Life Investments in conducting various aspects of the Portfolio's administrative operations. For providing these services to the Portfolio, JPMorgan is compensated by New York Life Investments.
Prior to February 22, 2021, these services were provided by State Street.
Pursuant to an agreement between the Fund and New York Life Investments, New York Life Investments is responsible for providing or procuring certain regulatory reporting services for the Portfolio. The Portfolio will reimburse New York Life Investments for the actual costs incurred by New York Life Investments in connection with providing or procuring these services for the Portfolio.
(B) Distribution and Service Fees. The Fund, on behalf of the Portfolio, has entered into a distribution agreement with NYLIFE Distributors LLC (the “Distributor”), an affiliate of New York Life Investments. The Portfolio has adopted a distribution plan (the “Plan”) in accordance with the provisions of Rule 12b-1 under the 1940 Act. Under the Plan, the Distributor has agreed to provide, through its affiliates or independent third parties, various distribution-related, shareholder and administrative support services to the Service Class shareholders. For its services, the Distributor is entitled to a combined distribution and service
Notes to Financial Statements (Unaudited) (continued)
fee accrued daily and paid monthly at an annual rate of 0.25% of the average daily net assets attributable to the Service Class shares of the Portfolio.
(C) Investments in Affiliates (in 000’s). During the six-month period ended June 30, 2021, purchases and sales transactions, income earned from investments and shares held of investment companies managed by New York Life Investments or its affiliates were as follows:
| Affiliated Investment Companies | Value,
Beginning
of Period | Purchases
at Cost | Proceeds
from
Sales | Net
Realized
Gain/(Loss)
on Sales | Change in
Unrealized
Appreciation/
(Depreciation) | Value,
End of
Period | Dividend
Income | Other
Distributions | Shares
End of
Period |
| MainStay U.S. Government Liquidity Fund | $ 4,176 | $ 14,612 | $ (14,970) | $ — | $ — | $ 3,818 | $ —(a) | $ — | 3,818 |
(D) Capital. As of June 30, 2021, New York Life and its affiliates beneficially held shares of the Portfolio with the values and percentages of net assets as follows:
| Initial Class | $1,646,533 | 12.6% |
| Service Class | 27,722 | 0.0‡ |
| ‡ | Less than one-tenth of a percent. |
Note 4-Federal Income Tax
As of June 30, 2021, the cost and unrealized appreciation (depreciation) of the Portfolio’s investment portfolio, including applicable derivative contracts and other financial instruments, as determined on a federal income tax basis, were as follows:
| | Federal Tax
Cost | Gross
Unrealized
Appreciation | Gross
Unrealized
(Depreciation) | Net
Unrealized
Appreciation/
(Depreciation) |
| Investments in Securities | $414,269,982 | $11,312,776 | $(558,776) | $10,754,000 |
As of December 31, 2020, for federal income tax purposes, capital loss carryforwards of $64,899,091, as shown in the table below, were available to the extent provided by the regulations to offset future realized gains of the Portfolio. Accordingly, no capital gains distributions are expected to be paid to shareholders until net gains have been realized in excess of such amounts.
Capital Loss
Available Through | Short-Term
Capital Loss
Amounts (000’s) | Long-Term
Capital Loss
Amounts (000’s) |
| Unlimited | $61,988 | $2,911 |
During the year ended December 31, 2020, the tax character of distributions paid as reflected in the Statements of Changes in Net Assets was as follows:
| | 2020 |
| Distributions paid from: | |
| Ordinary Income | $5,922,835 |
| Return of Capital | 1,066,138 |
| Total | $6,988,973 |
Note 5–Custodian
JPMorgan is the custodian of cash and securities held by the Portfolio. Custodial fees are charged to the Portfolio based on the Portfolio's net assets and/or the market value of securities held by the Portfolio and the number of certain transactions incurred by the Portfolio.
Prior to February 22, 2021, these services were provided by State Street. The services provided by State Street were a direct expense of the Portfolio and are included in the Statement of Operations as Custodian fees which totaled $112,627 for the period January 1, 2021 through February 21, 2021.
Note 6–Line of Credit
The Portfolio and certain other funds managed by New York Life Investments maintain a line of credit with a syndicate of banks in order to secure a source of funds for temporary purposes to meet unanticipated or excessive redemption requests.
Effective July 27, 2021, under the credit agreement (the “Credit Agreement”), the aggregate commitment amount is $600,000,000 with an additional uncommitted amount of $100,000,000. The commitment fee is an annual rate of 0.15% of the average commitment amount payable quarterly, regardless of usage, to JPMorgan, who serves as the agent to the syndicate. The commitment fee is allocated among the Portfolio and certain other funds managed by New York Life Investments based upon their respective net assets and other factors. Interest on any revolving credit loan is charged based upon the Federal Funds Rate or the one-month LIBOR, whichever is higher. The Credit Agreement expires on
| 32 | MainStay VP IQ Hedge Multi-Strategy Portfolio |
July 26, 2022, although the Portfolio, certain other funds managed by New York Life Investments and the syndicate of banks may renew the Credit Agreement for an additional year on the same or different terms or enter into a credit agreement with a different syndicate of banks. Prior to July 27, 2021, the aggregate commitment amount and the commitment fee were the same as those under the current Credit Agreement. During the six-month period ended June 30, 2021, there were no borrowings made or outstanding with respect to the Portfolio under the Credit Agreement.
Note 7–Interfund Lending Program
Pursuant to an exemptive order issued by the SEC, the Portfolio, along with certain other funds managed by New York Life Investments, may participate in an interfund lending program. The interfund lending program provides an alternative credit facility that permits the Portfolio and certain other funds managed by New York Life Investments to lend or borrow money for temporary purposes directly to or from one another, subject to the conditions of the exemptive order. During the six-month period ended June 30, 2021, there were no interfund loans made or outstanding with respect to the Portfolio.
Note 8–Purchases and Sales of Securities (in 000’s)
During the six-month period ended June 30, 2021, purchases and sales of securities, other than short-term securities, were $300,817 and $304,162, respectively.
Note 9–Capital Share Transactions
Transactions in capital shares for the six-month period ended June 30, 2021 and the year ended December 31, 2020, were as follows:
| Initial Class | Shares | Amount |
| Period ended June 30, 2021: | | |
| Shares sold | 106,244 | $ 964,680 |
| Shares redeemed | (7,570) | (68,330) |
| Net increase (decrease) | 98,674 | $ 896,350 |
| Year ended December 31, 2020: | | |
| Shares sold | 156,471 | $ 1,375,966 |
| Shares issued to shareholders in reinvestment of distributions | 27,268 | 246,213 |
| Shares redeemed | (78,784) | (661,131) |
| Net increase (decrease) | 104,955 | $ 961,048 |
| |
| Service Class | Shares | Amount |
| Period ended June 30, 2021: | | |
| Shares sold | 862,008 | $ 7,810,318 |
| Shares redeemed | (1,111,299) | (10,088,706) |
| Net increase (decrease) | (249,291) | $ (2,278,388) |
| Year ended December 31, 2020: | | |
| Shares sold | 1,899,216 | $ 16,643,897 |
| Shares issued to shareholders in reinvestment of distributions | 747,510 | 6,742,760 |
| Shares redeemed | (5,958,743) | (50,140,055) |
| Net increase (decrease) | (3,312,017) | $(26,753,398) |
Note 10–Other Matters
An outbreak of COVID-19, first detected in December 2019, has developed into a global pandemic and has resulted in travel restrictions, closure of international borders, certain businesses and securities markets, restrictions on securities trading activities, prolonged quarantines, supply chain disruptions, and lower consumer demand, as well as general concern and uncertainty. The continued impact of COVID-19 and related new variants is uncertain and could further adversely affect the global economy, national economies, individual issuers and capital markets in unforeseeable ways and result in a substantial and extended economic downturn. Developments that disrupt global economies and financial markets, such as COVID-19, may magnify factors that affect the Portfolio's performance.
Note 11–Subsequent Events
In connection with the preparation of the financial statements of the Portfolio as of and for the six-month period ended June 30, 2021, events and transactions subsequent to June 30, 2021, through the date the financial statements were issued have been evaluated by the Manager for possible adjustment and/or disclosure. No subsequent events requiring financial statement adjustment or disclosure have been identified.
Discussion of the Operation and Effectiveness of the Portfolio's Liquidity Risk Management Program (Unaudited)
In compliance with Rule 22e-4 under the Investment Company Act of 1940, as amended (the “Liquidity Rule”), the Portfolio has adopted and implemented a liquidity risk management program (the “Program”), which New York Life Investment Management LLC believes is reasonably designed to assess and manage the Portfolio's liquidity risk (the risk that the Portfolio could not meet requests to redeem shares issued by the Portfolio without significant dilution of remaining investors’ interests in the Portfolio). The Board of Trustees of MainStay VP Funds Trust (the "Board") designated New York Life Investment Management LLC as administrator of the Program (the “Administrator”). The Administrator has established a Liquidity Risk Management Committee to assist the Administrator in the implementation and day-to-day administration of the Program and to otherwise support the Administrator in fulfilling its responsibilities under the Program.
At a meeting of the Board held on March 8, 2021, the Administrator provided the Board with a written report addressing the Program’s operation and assessing its adequacy and effectiveness of implementation for the period from January 1, 2020 through December 31, 2020 (the "Review Period"), as required under the Liquidity Rule. The report noted that the Administrator concluded that (i) the Program operated effectively to assess and manage the Portfolio's liquidity risk, (ii) the Program has been adequately and effectively implemented to monitor and, as applicable, respond to the Portfolio's liquidity developments and (iii) the Portfolio's investment strategy continues to be appropriate for an open-end fund. In addition, the report discussed notable events that impacted liquidity risk during the Review Period, including the COVID-19 pandemic and the resulting economic shutdown.
In accordance with the Program, the Portfolio's liquidity risk is assessed no less frequently than annually taking into consideration certain factors, as applicable, such as (i) investment strategy and liquidity of portfolio investments, (ii) short-term and long-term cash flow projections and (iii) holdings of cash and cash equivalents, as well as borrowing arrangements and other funding sources. Certain factors are considered under both normal and reasonably foreseeable stressed conditions.
Each Portfolio portfolio investment is classified into one of four liquidity categories. The classification is based on a determination of the number of days it is reasonably expected to take to convert the investment into cash, or sell or dispose of the investment, in current market conditions without significantly changing the market value of the investment. The Administrator has delegated liquidity classification determinations to the Portfolio’s subadvisor, subject to appropriate oversight by the Administrator, and classification determinations are made by taking into account the Portfolio's reasonably anticipated trade size, various market, trading and investment-specific considerations, as well as market depth, and, in certain cases, third-party vendor data.
The Liquidity Rule requires portfolios that do not primarily hold assets that are highly liquid investments to adopt a minimum amount of net assets that must be invested in highly liquid investments that are assets (an “HLIM”). In addition, the Liquidity Rule limits a portfolio's investments in illiquid investments. Specifically, the Liquidity Rule prohibits acquisition of illiquid investments if doing so would result in a portfolio holding more than 15% of its net assets in illiquid investments that are assets. The Program includes provisions reasonably designed to determine, periodically review and comply with the HLIM requirement, as applicable, and to comply with the 15% limit on illiquid investments.
There can be no assurance that the Program will achieve its objectives under all circumstances in the future. Please refer to the Portfolio's prospectus for more information regarding the Portfolio's exposure to liquidity risk and other risks to which it may be subject.
Proxy Voting Record
The Portfolio is required to file with the SEC its proxy voting records for the 12-month period ending June 30 on Form N-PX. The Portfolio's most recent Form N-PX or proxy voting record is available free of charge upon request (i) by calling 800-598-2019; (ii) by visiting New York Life Investments’ website at https://www.nylinvestments.com/mainstay/
products-and-performance/mainstay-vp-funds-trust; or (iii) by visiting the SEC’s website at www.sec.gov.
Shareholder Reports and Quarterly Portfolio Disclosure
The Portfolio is required to file its complete schedule of portfolio holdings with the SEC 60 days after its first and third fiscal quarter on Form N-PORT. The Portfolio's holdings report is available free of charge upon request by calling 800-598-2019 or by visiting the SEC’s website at www.sec.gov.
This page intentionally left blank
This page intentionally left blank.
This page intentionally left blank.
MainStay VP Portfolios
MainStay VP offers a wide range of Portfolios. The full array of MainStay VP offerings is listed here, with information about the manager, subadvisors, legal counsel, and independent registered public accounting firm.
Equity
MainStay VP Candriam Emerging Markets Equity Portfolio
MainStay VP Epoch U.S. Equity Yield Portfolio
MainStay VP Fidelity Institutional AM® Utilities Portfolio†
MainStay VP MacKay International Equity Portfolio
MainStay VP MacKay S&P 500 Index Portfolio
MainStay VP Natural Resources Portfolio
MainStay VP Small Cap Growth Portfolio
MainStay VP T. Rowe Price Equity Income Portfolio
MainStay VP Wellington Growth Portfolio
MainStay VP Wellington Mid Cap Portfolio
MainStay VP Wellington Small Cap Portfolio
MainStay VP Wellington U.S. Equity Portfolio
MainStay VP Winslow Large Cap Growth Portfolio
Mixed Asset
MainStay VP Balanced Portfolio
MainStay VP Income Builder Portfolio
MainStay VP Janus Henderson Balanced Portfolio
MainStay VP MacKay Convertible Portfolio
Income
MainStay VP Bond Portfolio
MainStay VP Floating Rate Portfolio
MainStay VP Indexed Bond Portfolio
MainStay VP MacKay Government Portfolio
MainStay VP MacKay High Yield Corporate Bond Portfolio
MainStay VP MacKay Strategic Bond Portfolio
MainStay VP PIMCO Real Return Portfolio
Money Market
MainStay VP U.S. Government Money Market Portfolio
Alternative
MainStay VP CBRE Global Infrastructure Portfolio
MainStay VP IQ Hedge Multi-Strategy Portfolio
Asset Allocation
MainStay VP Conservative Allocation Portfolio
MainStay VP Equity Allocation Portfolio
MainStay VP Growth Allocation Portfolio
MainStay VP Moderate Allocation Portfolio
Manager
New York Life Investment Management LLC
New York, New York
Subadvisors
Brown Advisory LLC
Baltimore, Maryland
Candriam Belgium S.A.*
Brussels, Belgium
CBRE Clarion Securities LLC
Radnor, Pennsylvania
Epoch Investment Partners, Inc.
New York, New York
FIAM LLC
Smithfield, Rhode Island
IndexIQ Advisors LLC*
New York, New York
Janus Capital Management LLC
Denver, Colorado
MacKay Shields LLC*
New York, New York
Mellon Investments Corporation
Boston, Massachusetts
NYL Investors LLC*
New York, New York
Pacific Investment Management Company LLC
Newport Beach, California
Segall Bryant & Hamill, LLC
Chicago, Illinois
T. Rowe Price Associates, Inc.
Baltimore, Maryland
Wellington Management Company LLP
Boston, Massachusetts
Winslow Capital Management, LLC
Minneapolis, Minnesota
Legal Counsel
Dechert LLP
Washington, District of Columbia
Independent Registered Public Accounting Firm
PricewaterhouseCoopers LLP
New York, New York
Distributor
NYLIFE Distributors LLC*
Jersey City, New Jersey
Custodian
JPMorgan Chase Bank, N.A.
New York, New York
Some Portfolios may not be available in all products.
† Fidelity Institutional AM is a registered trade mark of FMR LLC. Used with permission.
* An affiliate of New York Life Investment Management LLC
Not part of the Semiannual Report
2021 Semiannual Report
This report is for the general information of New York Life Variable Annuities and NYLIAC Variable Universal Life Insurance Products policyowners. It must be preceded or accompanied by the appropriate product(s) and funds prospectuses if it is given to anyone who is not an owner of a New York Life variable annuity policy or a NYLIAC Variable Universal Life Insurance Product. This report does not offer for sale or solicit orders to purchase securities.
The performance data quoted in this report represents past performance. Past performance is no guarantee of future results. Due to market volatility and other factors, current performance may be lower or higher than the figures shown. The most recent month-end performance summary for your variable annuity or variable life policy is available by calling 800-598-2019 and is updated periodically on newyorklife.com.
The New York Life Variable Annuities and NYLIAC Variable Universal Life Insurance Products are issued by New York Life Insurance and Annuity Corporation (a Delaware Corporation) and distributed by NYLIFE Distributors LLC (Member FINRA/SIPC).
New York Life Insurance Company
New York Life Insurance and Annuity
Corporation (NYLIAC) (A Delaware Corporation)
51 Madison Avenue, Room 551
New York, NY 10010
newyorklife.com
nylinvestments.com
NYLIFE Distributors LLC, 30 Hudson Street, Jersey City, NJ 07302
New York Life Investment Management LLC is the investment manager to the MainStay VP Funds Trust
©2021 by NYLIFE Distributors LLC. All rights reserved.
You may obtain copies of the Prospectus and the Statement of Additional Information free of charge, upon request, by calling toll-free 800-598-2019 or writing to New York Life Insurance and Annuity Corporation, 51 Madison Avenue, New York, NY 10010.
| Not FDIC Insured | No Bank Guarantee | May Lose Value |
(NYLIAC) NI506
MainStay VP Balanced Portfolio
Message from the President and Semiannual Report
Unaudited | June 30, 2021
Sign up for e-delivery of your shareholder reports. For full details on e-delivery, including who can participate and what you can receive via e-delivery,
please log in to newyorklifeinvestments.com/accounts.
| Not FDIC/NCUA Insured | Not a Deposit | May Lose Value | No Bank Guarantee | Not Insured by Any Government Agency |
This page intentionally left blank
Message from the President
The COVID-19 pandemic continued to afflict our personal lives and broad segments of the U.S. and global economy throughout the six-month reporting period ended June 30, 2021. However, with the deployment of multiple vaccines around the world, including three highly effective versions approved for emergency use in the United States, investors began to turn their attention toward the gradual reopening of the economy and the shape the “new normal” would take.
The first half of the reporting period saw increasing inflationary concerns as fiscal stimulus business reopenings drove accelerating economic growth, rising commodity prices and increased consumer spending. However, the U.S. Federal Reserve noted that price increases were likely to prove temporary and made clear their intention to remain accommodative for the foreseeable future. Accordingly, after moving higher in the first quarter of 2021, interest rates declined in the second quarter.
In response to the uncertain inflation outlook, equity market leadership shifted from value in the first quarter of the year to growth in the second quarter. Nevertheless, investor sentiment remained buoyant throughout the reporting period, with all eleven sectors in the S&P 500® Index, a widely regarded benchmark of market performance, producing positive returns. Energy led the market’s rise fueled by rapidly increasing oil and gas prices, followed by financials and real estate, which benefited from rising interest rates and the economic reopening, respectively. Communication services produced the slowest growth, followed by the traditionally defensive utilities and consumer staples
sectors. In the fixed income market, lower-credit-quality issues tended to outperform their higher-grade counterparts, with high-yield corporate bonds generating the strongest performance. Among securitized products, commercial mortgage-backed securities generally produced the strongest returns, followed by mortgage-backed securities and asset-backed securities, while Treasury securities lagged.
Despite the tremendous progress we’ve seen so far this year, the United States and the world continue to face significant pandemic-related challenges. Newer, more contagious variants of COVID-19 threaten the return of restrictions and lockdowns that could stall the economic recovery. At the same time, supply chain shortages have led to rising prices on everything from laptops to autos, stoking fears of uncontrolled inflation despite reassurance from the U.S. Federal Reserve. At New York Life Investments, we recognize that the shape that the “new normal” eventually takes may differ from our expectations. You can depend on us to keep a sharp watch for the unexpected, and to continue to help you find your way through this rapidly evolving investment landscape.
Sincerely,
Kirk C. Lehneis
President
The opinions expressed are as of the date of this report and are subject to change. There is no guarantee that any forecast made will come to pass. This material does not constitute investment advice and is not intended as an endorsement of any specific investment. Past performance is no guarantee of future results.
Not part of the Semiannual Report
Investors should refer to the Portfolio’s Summary Prospectus and/or Prospectus and consider the Portfolio’s investment objectives, strategies, risks, charges and expenses carefully before investing. The Summary Prospectus and/or Prospectus contain this and other information about the Portfolio. You may obtain copies of the Portfolio’s Summary Prospectus and/or the Prospectus and the Statement of Additional Information free of charge, upon request, by calling toll-free 800-598-2019, by writing to New York Life Insurance and Annuity Corporation, 51 Madison Avenue, Room 251, New York, New York 10010 or by sending an email to MainStayShareholdersServices@nylim.com. These documents are also available at nylinvestments.com/vpdocuments. Please read the Portfolio's Summary Prospectus and/or Prospectus carefully before investing. MainStay VP Funds Trust portfolios are separate account options which are purchased through a variable insurance or variable annuity contract.
Investment and Performance Comparison (Unaudited)
Performance data quoted represents past performance. Past performance is no guarantee of future results. Because of market volatility and other factors, current performance may be lower or higher than the figures shown. Investment return and principal value will fluctuate, and as a result, when shares are redeemed, they may be worth more or less than their original cost. The performance table and graph do not reflect any deduction of sales charges, mortality and expense charges, contract charges or administrative charges. Please refer to the Performance Summary appropriate for your policy. For performance information current to the most recent month-end, please call 800-598-2019 or visit www.newyorklife.com.
Performance figures may reflect certain fee waivers and/or expense limitations, without which total returns may have been different. For information on current fee waivers and/or expense limitations (if any), please refer to the Notes to Financial Statements.
| Average Annual Total Returns for the Period-Ended June 30, 2021 |
| Class | Inception
Date1, 2 | Six
Months | One
Year | Five
Years | Ten
Years | Gross
Expense
Ratio3 |
| Initial Class Shares | 5/2/2005 | 11.61% | 27.74% | 8.53% | 8.58% | 0.71% |
| Service Class Shares | 5/2/2005 | 11.47 | 27.42 | 8.26 | 8.31 | 0.96 |
| 1. | The Portfolio’s equity subadvisor changed effective January 1, 2018, due to an organizational restructuring whereby all investment personnel of Cornerstone Capital Management Holdings LLC, the former subadvisor, transitioned to MacKay Shields LLC. |
| 2. | Effective May 1, 2021, the Portfolio replaced the subadvisor to the equity portion of the Portfolio and modified the equity portion of the Portfolio's principal investment strategies. The past performance in the graph and table prior to that date reflects the Portfolio’s prior subadvisor and principal investment strategies for the equity portion of the Portfolio. |
| 3. | The gross expense ratios presented reflect the Portfolio’s “Total Annual Portfolio Operating Expenses” from the most recent Prospectus, as supplemented, and may differ from other expense ratios disclosed in this report. |
| Benchmark Performance | Six
Months | One
Year | Five
Years | Ten
Years |
| Russell 1000® Value Index1 | 17.05% | 43.68% | 11.87% | 11.61% |
| Bloomberg Barclays U.S. Intermediate Government/Credit Bond Index2 | -0.90 | 0.19 | 2.63 | 2.76 |
| Balanced Composite Index3 | 9.65 | 24.83 | 8.45 | 8.28 |
| Russell Midcap® Value Index4 | 19.45 | 53.06 | 11.79 | 11.75 |
| Morningstar Allocation - 50% to 70% Equity Category Average5 | 9.54 | 26.62 | 10.00 | 7.89 |
| 1. | The Portfolio has selected the Russell 1000® Value Index as its primary benchmark. The Russell 1000® Value Index measures the performance of the large-cap value segment of the U.S. equity universe. It includes those Russell 1000® Index companies with lower price-to-book ratios and lower expected growth values. Results assume reinvestment of all dividends and capital gains. An investment cannot be made directly in an index. |
| 2. | The Portfolio has selected the Bloomberg Barclays U.S. Intermediate Government/Credit Bond Index as a secondary benchmark. The Bloomberg Barclays U.S. Intermediate Government/Credit Bond Index measures the performance of U.S. dollar denominated U.S. treasuries, government related and investment grade U.S. corporate securities that have a remaining maturity of greater than one year and less than ten years. Results assume reinvestment of all dividends and capital gains. An investment cannot be made directly in an index. |
| 3. | The Portfolio has selected the Balanced Composite Index as an additional benchmark. The Balanced Composite Index consists of the Russell 1000® Value Index and the Bloomberg Barclays U.S. Intermediate Government/Credit Bond Index weighted 60% and 40%, respectively. Results assume reinvestment of all dividends and capital gains. An investment cannot be made directly in an index. |
| 4. | The Russell Midcap® Value Index, the Fund's prior primary benchmark, measures the performance of the mid-cap value segment of the U.S. equity universe. It includes those Russell Midcap® Index companies with lower price-to-book ratios and lower forecasted growth values. Results assume reinvestment of all dividends and capital gains. An investment cannot be made directly in an index. |
| 5. | The Morningstar Allocation – 50% to 70% Equity Category Average is representative of funds that seek to provide both income and capital appreciation by investing in multiple asset classes, including stocks, bonds, and cash. These funds are dominated by domestic holdings and have equity exposures between 50% and 70%. Results are based on average total returns of similar funds with all dividends and capital gain distributions reinvested. |
The footnotes on the preceding page are an integral part of the table and graph and should be carefully read in conjunction with them.
| 6 | MainStay VP Balanced Portfolio |
Cost in Dollars of a $1,000 Investment in MainStay VP Balanced Portfolio (Unaudited)
The example below is intended to describe the fees and expenses borne by shareholders during the six-month period from January 1, 2021 to June 30, 2021, and the impact of those costs on your investment.
Example
As a shareholder of the Portfolio you incur two types of costs: (1) transaction costs, including exchange fees and sales charges (loads) on purchases (as applicable), and (2) ongoing costs, including management fees, distribution and/or service (12b-1) fees, and other Portfolio expenses (as applicable). This example is intended to help you understand your ongoing costs (in dollars) of investing in the Portfolio and to compare these costs with the ongoing costs of investing in other mutual funds. The example is based on an investment of $1,000 made at the beginning of the six-month period and held for the entire period from January 1, 2021 to June 30, 2021. Shares are only sold in connection with variable life and annuity contracts and the example does not reflect any contract level or transactional fees or expenses. If these costs had been included, your costs would have been higher.
This example illustrates your Portfolio’s ongoing costs in two ways:
Actual Expenses
The second and third data columns in the table below provide information about actual account values and actual expenses. You may use the information in these columns, together with the amount you invested, to estimate the expenses that you paid during the six months ended June
30, 2021. Simply divide your account value by $1,000 (for example, an $8,600 account value divided by $1,000 = 8.6), then multiply the result by the number under the heading entitled “Expenses Paid During Period” to estimate the expenses you paid on your account during this period.
Hypothetical Example for Comparison Purposes
The fourth and fifth data columns in the table below provide information about hypothetical account values and hypothetical expenses based on the Portfolio’s actual expense ratio and an assumed rate of return of 5% per year before expenses, which is not the Portfolio’s actual return. The hypothetical account values and expenses may not be used to estimate the actual ending account balances or expenses you paid for the six-month period shown. You may use this information to compare the ongoing costs of investing in the Portfolio with the ongoing costs of investing in other mutual funds. To do so, compare this 5% hypothetical example with the 5% hypothetical examples that appear in the shareholder reports of the other mutual funds.
Please note that the expenses shown in the table are meant to highlight your ongoing costs only and do not reflect any transactional costs, such as exchange fees or sales charges (loads). Therefore, the fourth and fifth data columns of the table are useful in comparing ongoing costs only and will not help you determine the relative total costs of owning different funds. In addition, if these transactional costs were included, your costs would have been higher.
| Share Class | Beginning
Account
Value
1/1/21 | Ending Account
Value (Based
on Actual
Returns and
Expenses)
6/30/21 | Expenses
Paid
During
Period1 | Ending Account
Value (Based
on Hypothetical
5% Annualized
Return and
Actual Expenses)
6/30/21 | Expenses
Paid
During
Period1 | Net Expense
Ratio
During
Period2 |
| Initial Class Shares | $1,000.00 | $1,116.10 | $3.83 | $1,021.18 | $3.66 | 0.73% |
| Service Class Shares | $1,000.00 | $1,114.70 | $5.14 | $1,019.94 | $4.91 | 0.98% |
| 1. | Expenses are equal to the Portfolio’s annualized expense ratio of each class multiplied by the average account value over the period, divided by 365 and multiplied by 181 (to reflect the six-month period). The table above represents the actual expenses incurred during the six-month period. In addition to the fees and expenses which the Portfolio bears directly, it also indirectly bears a pro rata share of the fees and expenses of the underlying funds in which it invests. Such indirect expenses are not included in the above-reported expense figures. |
| 2. | Expenses are equal to the Portfolio's annualized expense ratio to reflect the six-month period. |
Portfolio Composition as of June 30, 2021 (Unaudited)
See Portfolio of Investments beginning on page 13 for specific holdings within these categories. The Portfolio's holdings are subject to change.
Top Ten Holdings or Issuers Held as of June 30, 2021 (excluding short-term investments) (Unaudited)
| 1. | U.S. Treasury Notes, 0.125%-1.625%, due 6/30/23–5/15/31 |
| 2. | FFCB, 1.14%-2.70%, due 1/21/28–6/21/41 |
| 3. | iShares Russell 1000 Value ETF |
| 4. | iShares Intermediate Government/Credit Bond ETF |
| 5. | JPMorgan Chase & Co. |
| 6. | UnitedHealth Group, Inc. |
| 7. | Bank of America Corp. |
| 8. | Cisco Systems, Inc. |
| 9. | Comcast Corp., Class A |
| 10. | Pfizer, Inc. |
| 8 | MainStay VP Balanced Portfolio |
Portfolio Management Discussion and Analysis (Unaudited)
Answers to the questions reflect the views of portfolio managers Jae S. Yoon, CFA, and Jonathan Swaney of New York Life Investment Management LLC, the Portfolio’s Manager; Kenneth Sommer and AJ Rzad, CFA, of NYL Investors LLC, the Portfolio’s fixed-income Subadvisor; and Migene Kim, CFA, and Mona Patni of MacKay Shields LLC (“MacKay Shields”), the Portfolio’s former equity Subadvisor; and Adam H. Illfelder of Wellington Management Company LLP (“Wellington”), the Portfolio’s current equity Subadvisor.
How did MainStay VP Balanced Portfolio perform relative to its benchmarks and peers during the six months ended June 30, 2021?
For the six months ended June 30, 2021, MainStay VP Balanced Portfolio returned 11.61% for Initial Class shares and 11.47% for Service Class shares. Over the same period, both share classes underperformed the 17.05% return of the Russell 1000® Value Index, which is the Portfolio’s primary benchmark, and outperformed the −0.90% return of the Bloomberg Barclays U.S. Intermediate Government/Credit Bond Index, which is a secondary benchmark of the Portfolio. For the six months ended June 30, 2021, both share classes outperformed the 9.65% return of the Balanced Composite Index and underperformed the 19.45% return of the Russell Midcap® Value Index, which are additional benchmarks of the Portfolio. Over the same period, both share classes outperformed the 9.54% return of the Morningstar Allocation—50% to 70% Equity Category Average.1
Were there any changes to the Fund during the reporting period?
At meetings held on January 21, January 25 and February 3, 2021, the Board of Trustees of MainStay VP Funds Trust considered and approved, among other related proposals: (i) appointing Wellington Management Company LLP as subadvisor to the equity portion of the Portfolio, and the related subadvisory agreement; (ii) modifying the Portfolio’s principal investment strategies and investment process and primary benchmark; and (iii) reducing the Portfolio’s contractual management fee. These changes became effective on May 1, 2021. For more information on these and other changes refer to the supplement dated February 5, 2021.
In the process of implementing the new principal investment strategies and investment process, the Portfolio may have experienced a high level of portfolio turnover. Also during this transition period, the Portfolio may not have been pursuing its investment objective or may not have been managed consistent with its investment strategies as stated in the Prospectus. This may have impacted the Portfolio’s performance.
What factors affected the relative performance of the equity portion of the Portfolio during the reporting period?
MacKay Shields
During the time MacKay Shields managed the equity portion of the Portfolio, the equity portion of the Portfolio outperformed the Russell Midcap® Value Index primarily due to strong stock selection among consumer discretionary and health care stocks. Sector allocation modestly detracted, as the Portfolio held
overweight exposure to the benchmark-lagging health care and consumer staples sectors. In terms of stock-selection model efficacy, the combination of signals used by the quantitative stock selection model was rewarded primarily by valuation measures.
Wellington
During the time Wellington managed the equity portion of the Portfolio, the Portfolio underperformed the Russell 1000® Value Index. Sector attribution, a result of our bottom-up stock selection process, weighed on results.
Which market segments were the strongest positive contributors to relative performance in the equity portion of the Portfolio, and which market segments detracted the most?
MacKay Shields
During the time MacKay Shields managed the equity portion of the Portfolio, the strongest positive contributions to the Portfolio’s performance relative to the Russell Midcap® Value Index came from the consumer discretionary, utilities and financials sectors. (Contributions take weightings and total returns into account.) During the same period, the most significant detractors from relative performance were the communication services and consumer staples sectors.
Wellington
During the time Wellington managed the equity portion of the Portfolio, security selection in the health care, communication services and industrials sectors made the strongest positive contributions to performance relative to the Russell 1000® Value Index, while selection in the financials, consumer discretionary and real estate sectors detracted. From an allocation standpoint, the Portfolio’s overweight position in health care and its underweight position in communication services bolstered relative results. Underweight exposure to energy and overweight exposure to materials were the most significant detractors.
During the reporting period, which individual stocks made the strongest positive contributions to the Portfolio’s absolute performance and which stocks detracted the most?
MacKay Shields
The strongest positive contributions to the absolute performance of the equity portion of the Portfolio during the time it was managed by MacKay Shields included shares in regional banking firm Signature Bank, technology hardware storage & peripherals maker HP, and building products maker Johnson Controls International. During the same period, the most significant detractors from absolute returns were positions in film & TV
| 1. | See page 5 for more information on benchmark and peer group returns. |
content producer ViacomCBS, interactive home entertainment provider Take-Two Interactive Software, and oil & gas equipment & services company NOV.
Wellington
The strongest positive contributors to absolute performance during the time Wellington managed the equity portion of the Portfolio were holdings in pharmaceutical company Eli Lilly, food packaging company Sealed Air, and managed care provider Centene. Shares of Eli Lilly rose after the U.S. Food and Drug Administration (FDA) granted Breakthrough Therapy designation for donanemab, an Alzheimer’s disease treatment. Eli Lilly also gained emergency use authorization in India for the use of baricitinib in severely ill COVID-19 patients. Shares of Sealed Air rose after the company reported first-quarter 2021earnings ahead of expectations and raised fiscal 2021 operating guidance. Shares of Centene advanced as markets responded favorably to the company’s intermediate-term plans to improve margins.
The most significant detractors from absolute performance were LPL Financial, a provider of infrastructure to independent wealth advisors; Global Payments, a provider of payment technology services; and Chubb, a property and casualty insurance provider. Shares of LPL Financial fell despite the company’s strong first-quarter 2021 earnings. Management disclosed that a $2.25 billion Insured Cash Account balance, due in 2024, would be terminated three years earlier than expected. Shares of Global Payments lost ground despite posting first-quarter earnings that exceeded consensus estimates. Rather than reward this positive news, market participants appeared to be more focused on increasing competition in the space, while also reacting skeptically to the company’s two announced acquisitions. Shares of Chubb fell amid rising cyber insurance claims. The company was the biggest writer of packaged cyber insurance based on direct-written premiums.
Did the equity portion of the Portfolio make any significant purchases or sales during the reporting period?
MacKay Shields
The largest initial purchase in the equity portion of the Portfolio during the time it was managed by MacKay Shields was in shares of digital banking and payment services company Discover Financial Services, while the largest increase in position size was in mining firm Freeport-McMoRan. The largest full sale was a position in financial exchange Nasdaq, while the largest decreased position size was in regional banking firm First Republic Bank.
Wellington
During the time Wellington managed the equity portion of the
Portfolio, the largest purchases included shares of alternative asset manager Ares Management and global coatings company Axalta Coating Systems. In our opinion, Ares offers a very attractive combination of growth, business quality and valuation compared to other pure-play alternatives managers. Axalta is an industry leader with significant exposure to the automotive sector. In our view, it offers above-average quality at a steep discount to the market and has the potential to increase capital returns over time.
Notable sales included the Portfolio’s full positions in alternatives asset manager Blackstone Group and railroad company Union Pacific. We used the proceeds from the Portfolio’s sale of Blackstone as a source of funds for initiating a position in Ares, where we saw better risk-adjusted upside. Our decision to eliminate the Portfolio’s position in Union Pacific was valuation driven as we saw less upside in the name than in other potential investments.
How did sector weightings in the equity portion of the Portfolio change during the reporting period?
MacKay Shields
During the time MacKay Shields managed the equity portion of the Portfolio, the largest increases in sector exposures relative to the Russell Midcap® Value Index were in the information technology and utilities sectors. Conversely, the largest decreases in benchmark-relative sector exposures were in the consumer discretionary and financials sectors.
Wellington
During the time Wellington managed the equity portion of the Portfolio, the most notable increases in absolute sector exposures were to health care and, to a lesser extent, materials. Notable reductions in sector exposure included financials, industrials and consumer discretionary.
How was the equity portion of the Portfolio positioned at the end of the reporting period?
MacKay Shields
At the end of the period MacKay Shields managed the equity portion of the Portfolio, the equity portion of the Portfolio held its largest overweight relative to the Russell Midcap® Value Index in the health care and consumer staples sectors. As of the same date, the Portfolio’s most significantly underweight sector positions were in real estate and materials.
Wellington
As of June 30, 2021, the equity portion of the Portfolio held its most overweight positions relative to the Russell 1000® Value Index in the information technology, health care and materials
| 10 | MainStay VP Balanced Portfolio |
sectors, and its most underweight positions in consumer staples, communication services and energy.
What factors affected the relative performance of the fixed-income portion of the Portfolio during the reporting period?
The fixed-income portion of the Portfolio held overweight positions relative to the Bloomberg Barclays U.S. Intermediate Government/Credit Bond Index in U.S. government agencies, corporates, asset-backed securities and commercial mortgage-backed securities throughout the reporting period. To facilitate these overweight positions, the Portfolio maintained an underweight position in the U.S. Treasury sector. Corporate sector holdings provided the strongest boost to the Portfolio’s performance relative to the Index, followed by asset-backed securities and commercial mortgage-backed securities. Relatively overweight exposure to the U.S. government agency sector was slightly accretive to performance, while underweight exposure to the U.S. Treasury sector detracted slightly.
During the reporting period, how was the performance of the fixed-income portion of the Portfolio materially affected by investments in derivatives?
The fixed-income portion of the Portfolio’s use of derivatives was limited to interest rate derivatives used to keep the duration2 of the Portfolio in line with our target. These interest rate derivatives had a negative impact on performance during the reporting period.
What was the duration strategy of the fixed-income portion of the Portfolio during the reporting period?
The fixed-income portion of the Portfolio maintained a
duration relatively close to that of the Bloomberg Barclays U.S. Intermediate Government/Credit Bond Index. On one occasion, toward the end of the reporting period, the duration of the Portfolio was shorter than that of the Index. This strategy had a negative impact on the Portfolio’s performance. As of June 30,
2021, the effective duration of the Portfolio was 4.00 years, compared to a duration of 4.15 years for the Index.
During the reporting period, which market segments made the strongest positive contributions to the performance of the fixed-income portion of the Portfolio and which market segments were particularly weak?
During the reporting period, asset-backed securities made the strongest positive contribution to the fixed-income portion of the Portfolio’s absolute performance. In the asset-backed sector, the Portfolio’s allocation to commercial loan obligations (CLOs) rated AAA and AA were the most accretive to absolute performance.3 The commercial mortgage-backed securities sector, particularly the non-agency subcomponent, made the second strongest contribution to the Portfolio’s absolute performance.
During the same period, U.S. government agencies produced the weakest contribution to the Portfolio’s absolute performance. In the corporate sector, industrials and financials detracted most. In the interest rate complex, the Portfolio’s duration and yield curve4 positioning detracted, while rolldown positioning added to absolute performance.
Among the Portfolio’s corporate bond holdings, those producing the strongest absolute performance during the reporting period were issued by vehicle maker Ford Motor, electric utility FirstEnergy, and bank holding company Antares Holdings. Those with the weakest absolute performance were issued by investment banking firm JPMorgan Chase, cell tower REIT (real estate investment trust) Crown Castle International and diversified bank Credit Suisse Group.
Did the fixed-income portion of the Portfolio make any significant purchases or sales during the reporting period?
The largest purchases made by the fixed-income portion of the Portfolio during the reporting period included bonds issued by Crown Castle International, investment bank NatWest Markets, and aircraft leasing company Air Lease. Other notably large
| 2. | Duration is a measure of the price sensitivity of a fixed-income investment to changes in interest rates. Duration is expressed as a number of years and is considered a more accurate sensitivity gauge than average maturity. |
| 3. | An obligation rated ‘AAA’ has the highest rating assigned by Standard & Poor’s (“S&P”), and in the opinion of S&P, the obligor’s capacity to meet its financial commitment on the obligation is extremely strong. An obligation rated ‘AA’ by S&P is deemed by S&P to differ from the highest-rated obligations only to a small degree. In the opinion of S&P, the obligor's capacity to meet its financial commitment on the obligation is very strong. When applied to Fund holdings, ratings are based solely on the creditworthiness of the bonds in the portfolio and are not meant to represent the security or safety of the Fund. |
| 4. | The yield curve is a line that plots the yields of various securities of similar quality—typically U.S. Treasury issues—across a range of maturities. The U.S. Treasury yield curve serves as a benchmark for other debt and is used in economic forecasting. |
purchases included bonds from insurer Brighthouse Financial Global Funding and dialysis care provider Fresenius Medical Care.
The most significant sales during the same period were bonds issued by energy infrastructure firm Kinder Morgan, health care plan provider Cigna and medical equipment & supplies company Becton Dickinson. Other significant but smaller sales were of securities from Japan-based bank holding company Mizuho Financial and metal products producer Reliance Steel & Aluminum.
During the reporting period, how did sector (or industry) weightings change in the fixed-income portion of the Portfolio?
Given stretched valuations and immense uncertainty regarding prepayments among non-agency residential mortgage-backed securities early in the reporting period, we reduced the Portfolio’s exposure to these assets. Throughout the reporting period, we increased the Portfolio’s allocation to CLOs rated AAA and AA. The CLO asset class was one of our highest-conviction, risk-adjusted, relative-value allocations. With interest rates at or close to multi-year lows, CLOs provided a higher yield and lower duration than most other investment-grade fixed-income assets. Within the corporate credit sector, the Portfolio held overweight allocations to the financials, industrials and utilities sectors. Near the close of the reporting period, we reduced the Portfolio’s overweight position in the corporate credit sector. The unprecedented amount of fiscal and monetary stimulus unleashed into financial markets drove option-adjusted spreads5 (OAS) on investment-grade credit to multi-year tights, reducing the attractiveness of owning certain sectors in the corporate credit universe. As of June 30, 2021, the Portfolio still maintained overweight exposure to corporate credit concentrated in those areas that we believed still offered an attractive relative-value proposition.
How was the fixed-income portion of the Portfolio positioned at the end of the reporting period?
As of June 30, 2021, the fixed-income portion of the Portfolio held overweight exposure relative to the Bloomberg Barclays U.S. Intermediate Government/Credit Bond Index in corporate bonds. Within the corporate sector, the Portfolio held overweight positions in financials, industrials and utilities. The Portfolio also held overweight positions in asset-backed securities, commercial mortgage-backed securities and U.S. government agencies. The
Portfolio’s largest overweight allocation among spread6 assets was to the asset-backed securities sector.
As of the same date, the Portfolio held relatively underweight positions in the sovereign, supranational, foreign agency and foreign local government sectors. The Portfolio also held an underweight position in the U.S. Treasury sector.
| 5. | An option-adjusted spread is the measurement of the spread of a fixed-income security rate and the risk-free rate of return, which is then adjusted to take into account an embedded option. |
| 6. | The terms “spread” and “yield spread” may refer to the difference in yield between a security or type of security and comparable U.S. Treasury issues. The terms may also refer to the difference in yield between two specific securities or types of securities at a given time. |
The opinions expressed are those of the portfolio managers as of the date of this report and are subject to change. There is no guarantee that any forecasts will come to pass. This material does not constitute investment advice and is not intended as an endorsement of any specific investment.
Not all MainStay VP Portfolios and/or share classes are available under all policies.
| 12 | MainStay VP Balanced Portfolio |
Portfolio of Investments June 30, 2021† (Unaudited)
| | Principal
Amount | Value |
| Long-Term Bonds 34.5% |
| Asset-Backed Securities 4.6% |
| Automobile Asset-Backed Security 0.2% |
| Ford Credit Floorplan Master Owner Trust | |
| Series 2018-4, Class A | | |
| 4.06%, due 11/15/30 | $ 600,000 | $ 689,793 |
| Other Asset-Backed Securities 4.4% |
| 522 Funding CLO Ltd. | |
| Series 2021-7A, Class A | | |
| 1.27% (3 Month LIBOR + 1.07%), due 4/23/34 (a)(b) | 400,000 | 400,286 |
| AIG CLO LLC | |
| Series 2020-1A, Class AR | | |
| 1.294% (3 Month LIBOR + 1.16%), due 4/15/34 (a)(b) | 600,000 | 600,107 |
| Apidos CLO XXV | |
| Series 2016-25A, Class A1R | | |
| 1.358% (3 Month LIBOR + 1.17%), due 10/20/31 (a)(b) | 400,000 | 400,153 |
| Apidos CLO XXX | |
| Series XXXA, Class A2 | | |
| 1.79% (3 Month LIBOR + 1.60%), due 10/18/31 (a)(b) | 650,000 | 649,997 |
| Apidos CLO XXXII | |
| Series 2019-32A, Class A1 | | |
| 1.508% (3 Month LIBOR + 1.32%), due 1/20/33 (a)(b) | 500,000 | 500,449 |
| ARES L CLO Ltd. | |
| Series 2018-50A, Class AR | | |
| 1.123% (3 Month LIBOR + 1.05%), due 1/15/32 (a)(b) | 700,000 | 700,133 |
| ARES XXXVIII CLO Ltd. | |
| Series 2015-38A, Class BR | | |
| 1.588% (3 Month LIBOR + 1.40%), due 4/20/30 (a)(b) | 400,000 | 397,857 |
| Battalion CLO Ltd. | |
| Series 2021-21A, Class A | | |
| 1.312% (3 Month LIBOR + 1.18%), due 7/15/34 (a)(b)(c) | 700,000 | 700,073 |
| Benefit Street Partners CLO XVIII Ltd. | |
| Series 2019-18A, Class A | | |
| 1.524% (3 Month LIBOR + 1.34%), due 10/15/32 (a)(b) | 250,000 | 250,483 |
| Benefit Street Partners CLO XXIII Ltd. | |
| Series 2021-23A, Class A1 | | |
| 1.293% (3 Month LIBOR + 1.08%), due 4/25/34 (a)(b) | 600,000 | 600,212 |
| | Principal
Amount | Value |
| |
| Other Asset-Backed Securities (continued) |
| CAL Funding IV Ltd. | |
| Series 2020-1A, Class A | | |
| 2.22%, due 9/25/45 (a) | $ 702,188 | $ 708,513 |
| Carlyle Global Market Strategies | |
| Series 2021-5A, Class B | | |
| 1.735% (3 Month LIBOR + 1.60%), due 7/20/34 (a)(b) | 500,000 | 500,502 |
| Carlyle Global Market Strategies CLO Ltd. | |
| Series 2013-3A, Class A2R | | |
| 1.584% (3 Month LIBOR + 1.40%), due 10/15/30 (a)(b) | 800,000 | 794,917 |
| Cedar Funding XII CLO Ltd. | |
| Series 2020-12A, Class A | | |
| 1.446% (3 Month LIBOR + 1.27%), due 10/25/32 (a)(b) | 500,000 | 500,176 |
| Dryden 76 CLO Ltd. | |
| Series 2019-76A, Class A1 | | |
| 1.518% (3 Month LIBOR + 1.33%), due 10/20/32 (a)(b) | 250,000 | 250,364 |
| HPS Loan Management Ltd. | |
| Series 11A-17, Class AR | | |
| 1.195% (3 Month LIBOR + 1.02%), due 5/6/30 (a)(b) | 850,000 | 847,637 |
| Magnetite XVIII Ltd. | |
| Series 2016-18A, Class AR | | |
| 1.236% (3 Month LIBOR + 1.08%), due 11/15/28 (a)(b) | 400,000 | 400,004 |
| Magnetite XXIII Ltd. | |
| Series 2019-23A, Class A | | |
| 1.476% (3 Month LIBOR + 1.30%), due 10/25/32 (a)(b) | 250,000 | 250,356 |
| Neuberger Berman Loan Advisers CLO 24 Ltd. | |
| Series 2017-24A, Class AR | | |
| 1.21% (3 Month LIBOR + 1.02%), due 4/19/30 (a)(b) | 250,000 | 249,638 |
| Neuberger Berman Loan Advisers CLO 35 Ltd. | |
| Series 2019-35A, Class A1 | | |
| 1.53% (3 Month LIBOR + 1.34%), due 1/19/33 (a)(b) | 600,000 | 600,910 |
| Neuberger Berman Loan Advisers CLO 37 Ltd. | |
| Series 2020-37A, Class BR | | |
| 1.542% (3 Month LIBOR + 1.45%), due 7/20/31 (a)(b) | 500,000 | 500,502 |
| Octagon Investment Partners 29 Ltd. | |
| Series 2016-1A, Class AR | | |
| 1.356% (3 Month LIBOR + 1.18%), due 1/24/33 (a)(b) | 350,000 | 349,331 |
The notes to the financial statements are an integral part of, and should be read in conjunction with, the financial statements.
13
Portfolio of Investments June 30, 2021† (Unaudited) (continued)
| | Principal
Amount | Value |
| Asset-Backed Securities (continued) |
| Other Asset-Backed Securities (continued) |
| OHA Credit Funding 6 Ltd. | |
| Series 2020-6A, Class A1 | | |
| 1.838% (3 Month LIBOR + 1.65%), due 7/20/31 (a)(b) | $ 600,000 | $ 600,000 |
| Palmer Square CLO Ltd. (a)(b) | |
| Series 2014-1A, Class A1R2 | | |
| 1.32% (3 Month LIBOR + 1.13%), due 1/17/31 | 250,000 | 250,072 |
| Series 2015-2A, Class A2R2 | | |
| 1.738% (3 Month LIBOR + 1.55%), due 7/20/30 | 750,000 | 750,026 |
| Palmer Square Loan Funding Ltd. | |
| Series 2021-3A, Class A2 | | |
| 1.571% (3 Month LIBOR + 1.40%), due 7/20/29 (a)(b)(c) | 500,000 | 500,000 |
| Progress Residential | |
| Series 2021-SFR3, Class A | | |
| 1.637%, due 5/17/26 (a) | 499,303 | 502,528 |
| Regatta XIV Funding Ltd. | |
| Series 2018-3A, Class A | | |
| 1.366% (3 Month LIBOR + 1.19%), due 10/25/31 (a)(b) | 600,000 | 600,020 |
| Regatta XV Funding Ltd. | |
| Series 2018-4A, Class A1 | | |
| 1.406% (3 Month LIBOR + 1.23%), due 10/25/31 (a)(b) | 250,000 | 250,103 |
| STORE Master Funding LLC | |
| Series 2021-1A, Class A1 | | |
| 2.12%, due 6/20/51 (a) | 243,750 | 246,341 |
| THL Credit Wind River CLO Ltd. | |
| Series 2017-4A, Class A | | |
| 1.305% (3 Month LIBOR + 1.15%), due 11/20/30 (a)(b) | 250,000 | 250,193 |
| Tiaa CLO III Ltd. | |
| Series 2017-2A, Class A | | |
| 1.334% (3 Month LIBOR + 1.15%), due 1/16/31 (a)(b) | 350,000 | 348,164 |
| TIF Funding II LLC | |
| Series 2021-1A, Class A | | |
| 1.65%, due 2/20/46 (a) | 584,500 | 575,383 |
| Vantage Data Centers LLC | |
| Series 2020-1A, Class A2 | | |
| 1.645%, due 9/15/45 (a) | 725,000 | 726,926 |
| | Principal
Amount | Value |
| |
| Other Asset-Backed Securities (continued) |
| Voya CLO Ltd. | |
| Series 2019-1A, Class AR | | |
| 1.244% (3 Month LIBOR + 1.06%), due 4/15/31 (a)(b) | $ 250,000 | $ 250,030 |
| | | 17,002,386 |
Total Asset-Backed Securities
(Cost $17,693,747) | | 17,692,179 |
| Corporate Bonds 14.2% |
| Aerospace & Defense 0.3% |
| Boeing Co. (The) | | |
| 3.10%, due 5/1/26 | 240,000 | 253,719 |
| 3.25%, due 2/1/28 | 325,000 | 344,529 |
| 3.625%, due 2/1/31 | 375,000 | 403,323 |
| | | 1,001,571 |
| Apparel 0.0% ‡ |
| Ralph Lauren Corp. | | |
| 1.70%, due 6/15/22 | 175,000 | 177,287 |
| Auto Manufacturers 1.1% |
| American Honda Finance Corp. | | |
| 0.55%, due 7/12/24 | 300,000 | 299,028 |
| Daimler Finance North America LLC | | |
| 2.45%, due 3/2/31 (a) | 250,000 | 256,138 |
| Ford Motor Credit Co. LLC | | |
| 3.087%, due 1/9/23 | 425,000 | 433,500 |
| 3.664%, due 9/8/24 | 725,000 | 759,901 |
| General Motors Financial Co., Inc. | | |
| 1.05%, due 3/8/24 | 200,000 | 201,147 |
| 1.50%, due 6/10/26 | 1,275,000 | 1,266,683 |
| Hyundai Capital America (a) | | |
| 1.80%, due 1/10/28 | 225,000 | 222,987 |
| 2.375%, due 10/15/27 | 375,000 | 383,380 |
| Nissan Motor Co. Ltd. | | |
| 4.81%, due 9/17/30 (a) | 275,000 | 310,486 |
| | | 4,133,250 |
| Banks 2.9% |
| Banco Santander SA | | |
| 1.849%, due 3/25/26 | 600,000 | 606,399 |
| Bank of America Corp. | | |
| 2.087%, due 6/14/29 (d) | 2,455,000 | 2,474,865 |
| BNP Paribas SA | | |
| 2.588% (5 Year Treasury Constant Maturity Rate + 2.05%), due 8/12/35 (a)(b) | 435,000 | 424,957 |
The notes to the financial statements are an integral part of, and should be read in conjunction with, the financial statements.
| 14 | MainStay VP Balanced Portfolio |
| | Principal
Amount | Value |
| Corporate Bonds (continued) |
| Banks (continued) |
| Citigroup, Inc. | | |
| 3.20%, due 10/21/26 | $ 930,000 | $ 1,007,432 |
| Goldman Sachs Group, Inc. (The) | | |
| 1.542%, due 9/10/27 (d) | 500,000 | 498,593 |
| JPMorgan Chase & Co. | | |
| 1.578%, due 4/22/27 (d) | 1,705,000 | 1,713,834 |
| Lloyds Banking Group plc | | |
| 0.695% (1 Year Treasury Constant Maturity Rate + 0.55%), due 5/11/24 (b) | 430,000 | 431,156 |
| Morgan Stanley | | |
| 3.625%, due 1/20/27 | 350,000 | 388,087 |
| 4.35%, due 9/8/26 | 820,000 | 928,458 |
| NatWest Markets plc | | |
| 0.80%, due 8/12/24 (a) | 1,425,000 | 1,418,469 |
| Societe Generale SA | | |
| 1.792% (1 Year Treasury Constant Maturity Rate + 1.00%), due 6/9/27 (a)(b) | 350,000 | 349,149 |
| Standard Chartered plc | | |
| 0.991% (1 Year Treasury Constant Maturity Rate + 0.78%), due 1/12/25 (a)(b) | 200,000 | 199,371 |
| Truist Financial Corp. | | |
| 1.267%, due 3/2/27 (d) | 375,000 | 374,579 |
| UBS Group AG | | |
| 1.364% (1 Year Treasury Constant Maturity Rate + 1.08%), due 1/30/27 (a)(b) | 475,000 | 471,675 |
| | | 11,287,024 |
| Beverages 0.3% |
| Anheuser-Busch InBev Worldwide, Inc. | | |
| 4.75%, due 1/23/29 | 760,000 | 905,361 |
| Diageo Capital plc | | |
| 2.125%, due 4/29/32 | 325,000 | 326,375 |
| | | 1,231,736 |
| Building Materials 0.2% |
| Owens Corning | | |
| 3.95%, due 8/15/29 | 700,000 | 790,834 |
| Chemicals 0.3% |
| EI du Pont de Nemours and Co. | | |
| 1.70%, due 7/15/25 | 175,000 | 179,468 |
| International Flavors & Fragrances, Inc. | | |
| 1.832%, due 10/15/27 (a) | 275,000 | 274,219 |
| | Principal
Amount | Value |
| |
| Chemicals (continued) |
| LYB International Finance III LLC | | |
| 1.25%, due 10/1/25 | $ 175,000 | $ 174,562 |
| NewMarket Corp. | | |
| 4.10%, due 12/15/22 | 525,000 | 550,145 |
| | | 1,178,394 |
| Computers 0.2% |
| HP, Inc. | | |
| 2.65%, due 6/17/31 (a) | 675,000 | 673,803 |
| Diversified Financial Services 1.3% |
| Air Lease Corp. | | |
| 0.70%, due 2/15/24 | 1,150,000 | 1,145,902 |
| Aircastle Ltd. | | |
| 2.85%, due 1/26/28 (a) | 500,000 | 502,471 |
| Antares Holdings LP | | |
| 3.95%, due 7/15/26 (a) | 250,000 | 260,156 |
| Aviation Capital Group LLC | | |
| 1.95%, due 1/30/26 (a) | 475,000 | 475,128 |
| BOC Aviation USA Corp. | | |
| 1.625%, due 4/29/24 (a) | 400,000 | 403,147 |
| GE Capital Funding LLC | | |
| 4.05%, due 5/15/27 | 1,440,000 | 1,629,773 |
| LSEGA Financing plc | | |
| 2.00%, due 4/6/28 (a) | 400,000 | 404,503 |
| Thirax 1 LLC | | |
| 0.968%, due 1/14/33 | 220,633 | 218,749 |
| | | 5,039,829 |
| Electric 1.3% |
| Berkshire Hathaway Energy Co. | | |
| 1.65%, due 5/15/31 | 475,000 | 455,897 |
| Commonwealth Edison Co. | | |
| 3.10%, due 11/1/24 | 250,000 | 266,887 |
| DTE Electric Co. | | |
| 2.65%, due 6/15/22 | 500,000 | 508,294 |
| DTE Energy Co. | | |
| Series F | | |
| 1.05%, due 6/1/25 | 250,000 | 249,931 |
| Entergy Arkansas LLC | | |
| 3.70%, due 6/1/24 | 500,000 | 539,964 |
| Entergy Corp. | | |
| 4.00%, due 7/15/22 | 1,000,000 | 1,031,497 |
| FirstEnergy Transmission LLC | | |
| 4.35%, due 1/15/25 (a) | 700,000 | 767,984 |
| Pinnacle West Capital Corp. | | |
| 1.30%, due 6/15/25 | 625,000 | 628,666 |
The notes to the financial statements are an integral part of, and should be read in conjunction with, the financial statements.
15
Portfolio of Investments June 30, 2021† (Unaudited) (continued)
| | Principal
Amount | Value |
| Corporate Bonds (continued) |
| Electric (continued) |
| Southern California Edison Co. | | |
| Series 20C | | |
| 1.20%, due 2/1/26 | $ 400,000 | $ 397,039 |
| Tampa Electric Co. | | |
| 2.40%, due 3/15/31 | 225,000 | 229,864 |
| | | 5,076,023 |
| Electrical Components & Equipment 0.1% |
| Emerson Electric Co. | | |
| 1.80%, due 10/15/27 | 400,000 | 409,847 |
| Electronics 0.1% |
| Flex Ltd. | | |
| 3.75%, due 2/1/26 | 275,000 | 300,749 |
| Food 0.1% |
| Conagra Brands, Inc. | | |
| 4.85%, due 11/1/28 | 450,000 | 535,720 |
| Forest Products & Paper 0.1% |
| Georgia-Pacific LLC | | |
| 0.95%, due 5/15/26 (a) | 225,000 | 221,268 |
| Healthcare-Services 0.3% |
| Fresenius Medical Care U.S. Finance III, Inc. (a) | | |
| 1.875%, due 12/1/26 | 225,000 | 225,007 |
| 2.375%, due 2/16/31 | 1,025,000 | 1,000,005 |
| | | 1,225,012 |
| Insurance 0.4% |
| Brighthouse Financial Global Funding | | |
| 1.00%, due 4/12/24 (a) | 975,000 | 976,878 |
| Guardian Life Global Funding | | |
| 1.25%, due 11/19/27 (a) | 625,000 | 609,221 |
| | | 1,586,099 |
| Investment Companies 0.1% |
| Blackstone Secured Lending Fund | | |
| 2.75%, due 9/16/26 (a) | 250,000 | 253,375 |
| Iron & Steel 0.1% |
| Nucor Corp. | | |
| 2.00%, due 6/1/25 | 275,000 | 284,562 |
| | Principal
Amount | Value |
| |
| Iron & Steel (continued) |
| Steel Dynamics, Inc. | | |
| 2.40%, due 6/15/25 | $ 250,000 | $ 261,425 |
| | | 545,987 |
| Machinery-Diversified 0.1% |
| Deere & Co. | | |
| 3.10%, due 4/15/30 | 450,000 | 496,361 |
| Media 0.1% |
| Discovery Communications LLC | | |
| 3.625%, due 5/15/30 | 150,000 | 163,647 |
| Thomson Reuters Corp. | | |
| 3.85%, due 9/29/24 | 300,000 | 325,262 |
| | | 488,909 |
| Mining 0.3% |
| Anglo American Capital plc (a) | | |
| 2.25%, due 3/17/28 | 525,000 | 530,814 |
| 5.625%, due 4/1/30 | 400,000 | 489,410 |
| | | 1,020,224 |
| Oil & Gas 0.2% |
| Valero Energy Corp. | | |
| 2.85%, due 4/15/25 | 675,000 | 715,719 |
| Oil & Gas Services 0.2% |
| Schlumberger Holdings Corp. | | |
| 3.75%, due 5/1/24 (a) | 925,000 | 995,475 |
| Packaging & Containers 0.3% |
| WRKCo, Inc. | | |
| 3.75%, due 3/15/25 | 925,000 | 1,009,107 |
| Pharmaceuticals 0.6% |
| AbbVie, Inc. | | |
| 2.95%, due 11/21/26 | 950,000 | 1,021,199 |
| Bayer US Finance II LLC | | |
| 4.375%, due 12/15/28 (a) | 600,000 | 687,395 |
| Cigna Corp. | | |
| 2.375%, due 3/15/31 | 250,000 | 253,503 |
| CVS Health Corp. | | |
| 1.875%, due 2/28/31 | 490,000 | 475,279 |
| | | 2,437,376 |
| Pipelines 0.4% |
| Energy Transfer Partners LP | | |
| 5.875%, due 3/1/22 | 1,150,000 | 1,174,602 |
The notes to the financial statements are an integral part of, and should be read in conjunction with, the financial statements.
| 16 | MainStay VP Balanced Portfolio |
| | Principal
Amount | Value |
| Corporate Bonds (continued) |
| Pipelines (continued) |
| Texas Eastern Transmission LP | | |
| 2.80%, due 10/15/22 (a) | $ 225,000 | $ 229,653 |
| | | 1,404,255 |
| Real Estate Investment Trusts 1.8% |
| American Campus Communities Operating Partnership LP | | |
| 3.30%, due 7/15/26 | 900,000 | 965,098 |
| Corporate Office Properties LP | | |
| 2.75%, due 4/15/31 | 230,000 | 231,736 |
| Crown Castle International Corp. | | |
| 1.05%, due 7/15/26 | 1,835,000 | 1,792,147 |
| Federal Realty Investment Trust | | |
| 1.25%, due 2/15/26 | 150,000 | 148,908 |
| Highwoods Realty LP | | |
| 3.875%, due 3/1/27 | 1,350,000 | 1,481,308 |
| Kimco Realty Corp. | | |
| 1.90%, due 3/1/28 | 225,000 | 224,603 |
| 2.80%, due 10/1/26 | 500,000 | 531,442 |
| Simon Property Group LP | | |
| 1.75%, due 2/1/28 | 375,000 | 372,995 |
| Spirit Realty LP | | |
| 2.70%, due 2/15/32 | 175,000 | 173,471 |
| 3.20%, due 2/15/31 | 175,000 | 182,383 |
| VEREIT Operating Partnership LP | | |
| 3.95%, due 8/15/27 | 890,000 | 1,002,495 |
| | | 7,106,586 |
| Retail 0.1% |
| Advance Auto Parts, Inc. | | |
| 1.75%, due 10/1/27 | 150,000 | 148,837 |
| CK Hutchison International 21 Ltd. | | |
| 1.50%, due 4/15/26 (a) | 375,000 | 376,964 |
| | | 525,801 |
| Semiconductors 0.1% |
| Skyworks Solutions, Inc. | | |
| 1.80%, due 6/1/26 | 300,000 | 303,779 |
| Telecommunications 0.8% |
| AT&T, Inc. | | |
| 4.35%, due 3/1/29 | 775,000 | 897,339 |
| T-Mobile US, Inc. | | |
| 2.55%, due 2/15/31 | 825,000 | 834,240 |
| Verizon Communications, Inc. | | |
| 2.10%, due 3/22/28 | 350,000 | 357,320 |
| | Principal
Amount | Value |
| |
| Telecommunications (continued) |
Verizon Communications, Inc.
(continued) | | |
| 3.376%, due 2/15/25 | $ 6,000 | $ 6,518 |
| 4.016%, due 12/3/29 | 912,000 | 1,045,716 |
| | | 3,141,133 |
Total Corporate Bonds
(Cost $53,682,437) | | 55,312,533 |
| Foreign Government Bonds 0.1% |
| Norway 0.1% |
| Equinor ASA | | |
| 1.75%, due 1/22/26 | 225,000 | 231,697 |
| Philippines 0.0% ‡ |
| Philippine Government Bond | | |
| 3.00%, due 2/1/28 | 200,000 | 215,657 |
| Poland 0.0% ‡ |
| Poland Government Bond | | |
| 5.00%, due 3/23/22 | 50,000 | 51,709 |
Total Foreign Government Bonds
(Cost $469,789) | | 499,063 |
| Mortgage-Backed Securities 0.6% |
| Commercial Mortgage Loans (Collateralized Mortgage Obligations) 0.6% |
| BFLD Trust | |
| Series 2021-FPM, Class A | | |
| 1.70% (1 Month LIBOR + 1.60%), due 6/15/38 (a)(b) | 500,000 | 500,449 |
| Citigroup Commercial Mortgage Trust | |
| Series 2020-420K, Class A | | |
| 2.456%, due 11/10/42 (a) | 500,000 | 506,222 |
| Series 2020-GC46, Class A5 | | |
| 2.717%, due 2/15/53 | 500,000 | 528,057 |
| CSMC WEST Trust | |
| Series 2020-WEST, Class A | | |
| 3.04%, due 2/15/35 (a) | 750,000 | 781,720 |
Total Mortgage-Backed Securities
(Cost $2,290,862) | | 2,316,448 |
The notes to the financial statements are an integral part of, and should be read in conjunction with, the financial statements.
17
Portfolio of Investments June 30, 2021† (Unaudited) (continued)
| | Principal
Amount | Value |
| U.S. Government & Federal Agencies 15.0% |
| Federal Home Loan Mortgage Corporation (Mortgage Pass-Through Securities) 4.5% |
| FFCB | | |
| 1.14%, due 8/20/29 | $ 800,000 | $ 783,311 |
| 1.23%, due 9/10/29 | 1,000,000 | 977,545 |
| 1.23%, due 7/29/30 | 725,000 | 703,017 |
| 1.25%, due 6/24/30 | 925,000 | 898,241 |
| 1.62%, due 4/6/28 | 425,000 | 425,124 |
| 1.67%, due 3/3/31 | 650,000 | 649,437 |
| 1.84%, due 6/3/30 | 500,000 | 500,083 |
| 1.98%, due 6/2/31 | 1,200,000 | 1,197,714 |
| 2.00%, due 5/27/31 | 900,000 | 900,067 |
| 2.03%, due 1/21/28 | 850,000 | 891,443 |
| 2.04%, due 4/14/31 | 475,000 | 475,946 |
| 2.09%, due 4/1/31 | 625,000 | 625,005 |
| 2.10%, due 5/6/31 | 1,000,000 | 1,000,105 |
| 2.19%, due 6/1/33 | 700,000 | 698,001 |
| 2.35%, due 4/16/35 | 300,000 | 300,000 |
| 2.45%, due 5/10/34 | 425,000 | 425,321 |
| 2.50%, due 6/2/36 | 550,000 | 550,005 |
| 2.70%, due 6/21/41 | 350,000 | 351,115 |
| FHLB | | |
| 0.375%, due 9/4/25 | 730,000 | 721,107 |
| 1.50%, due 9/11/29 | 600,000 | 595,177 |
| 2.00%, due 5/12/31 | 700,000 | 700,446 |
| 2.00%, due 5/27/31 | 945,000 | 945,157 |
| 3.125%, due 9/12/25 | 800,000 | 874,683 |
| FHLMC | | |
| 0.375%, due 9/23/25 | 175,000 | 172,261 |
| 1.42%, due 12/30/30 | 725,000 | 711,019 |
| FNMA | | |
| 0.50%, due 6/17/25 | 650,000 | 645,930 |
| | | 17,717,260 |
| United States Treasury Notes 10.5% |
| U.S. Treasury Notes | | |
| 0.125%, due 6/30/23 | 5,285,000 | 5,272,407 |
| 0.25%, due 6/15/24 | 14,590,000 | 14,501,092 |
| 0.875%, due 6/30/26 | 11,300,000 | 11,294,703 |
| | Principal
Amount | Value |
| |
| United States Treasury Notes (continued) |
| U.S. Treasury Notes (continued) | | |
| 1.25%, due 6/30/28 | $ 3,823,000 | $ 3,828,974 |
| 1.625%, due 5/15/31 | 5,852,600 | 5,942,218 |
| | | 40,839,394 |
Total U.S. Government & Federal Agencies
(Cost $58,488,674) | | 58,556,654 |
Total Long-Term Bonds
(Cost $132,625,509) | | 134,376,877 |
| |
| | Shares | |
| Common Stocks 56.5% |
| Aerospace & Defense 3.1% |
| General Dynamics Corp. | 14,829 | 2,791,708 |
| L3Harris Technologies, Inc. | 13,859 | 2,995,623 |
| Lockheed Martin Corp. | 6,675 | 2,525,486 |
| Raytheon Technologies Corp. | 43,104 | 3,677,202 |
| | | 11,990,019 |
| Auto Components 0.7% |
| Gentex Corp. | 78,206 | 2,587,837 |
| Banks 6.4% |
| Bank of America Corp. | 157,204 | 6,481,521 |
| JPMorgan Chase & Co. | 55,789 | 8,677,421 |
| M&T Bank Corp. | 18,809 | 2,733,136 |
| PNC Financial Services Group, Inc. (The) | 20,223 | 3,857,739 |
| Truist Financial Corp. | 55,334 | 3,071,037 |
| | | 24,820,854 |
| Beverages 0.8% |
| Keurig Dr Pepper, Inc. | 89,900 | 3,168,076 |
| Building Products 1.4% |
| Fortune Brands Home & Security, Inc. | 23,202 | 2,311,151 |
| Johnson Controls International plc | 45,820 | 3,144,627 |
| | | 5,455,778 |
| Capital Markets 2.2% |
| ARES Management Corp. | 33,570 | 2,134,716 |
| BlackRock, Inc. | 1,179 | 1,031,590 |
| LPL Financial Holdings, Inc. | 19,923 | 2,689,207 |
| Morgan Stanley | 29,963 | 2,747,307 |
| | | 8,602,820 |
The notes to the financial statements are an integral part of, and should be read in conjunction with, the financial statements.
| 18 | MainStay VP Balanced Portfolio |
| | Shares | Value |
| Common Stocks (continued) |
| Chemicals 1.9% |
| Axalta Coating Systems Ltd. (e) | 69,772 | $ 2,127,348 |
| Celanese Corp. | 18,921 | 2,868,423 |
| FMC Corp. | 21,903 | 2,369,905 |
| | | 7,365,676 |
| Communications Equipment 2.3% |
| Cisco Systems, Inc. | 114,167 | 6,050,851 |
| F5 Networks, Inc. (e) | 16,637 | 3,105,462 |
| | | 9,156,313 |
| Containers & Packaging 0.8% |
| Sealed Air Corp. | 53,913 | 3,194,345 |
| Electric Utilities 1.3% |
| Entergy Corp. | 23,408 | 2,333,778 |
| Exelon Corp. | 66,327 | 2,938,949 |
| | | 5,272,727 |
| Electrical Equipment 0.8% |
| nVent Electric plc | 96,355 | 3,010,130 |
| Electronic Equipment, Instruments & Components 0.8% |
| Corning, Inc. | 79,200 | 3,239,280 |
| Equity Real Estate Investment Trusts 2.1% |
| Crown Castle International Corp. | 12,147 | 2,369,879 |
| Gaming and Leisure Properties, Inc. | 73,339 | 3,397,796 |
| Host Hotels & Resorts, Inc. (e) | 133,086 | 2,274,440 |
| | | 8,042,115 |
| Food Products 0.8% |
| Mondelez International, Inc., Class A | 50,656 | 3,162,961 |
| Health Care Equipment & Supplies 2.7% |
| Becton Dickinson and Co. | 13,179 | 3,205,001 |
| Boston Scientific Corp. (e) | 70,142 | 2,999,272 |
| Medtronic plc | 33,772 | 4,192,118 |
| | | 10,396,391 |
| Health Care Providers & Services 3.7% |
| Anthem, Inc. | 12,552 | 4,792,354 |
| Centene Corp. (e) | 37,412 | 2,728,457 |
| UnitedHealth Group, Inc. | 17,266 | 6,913,997 |
| | | 14,434,808 |
| Hotels, Restaurants & Leisure 0.5% |
| Booking Holdings, Inc. (e) | 897 | 1,962,717 |
| | Shares | Value |
| |
| Household Durables 0.7% |
| Lennar Corp., Class A | 28,435 | $ 2,825,017 |
| Insurance 3.6% |
| Assurant, Inc. | 20,129 | 3,143,747 |
| Chubb Ltd. | 23,810 | 3,784,362 |
| MetLife, Inc. | 73,123 | 4,376,412 |
| Progressive Corp. (The) | 26,935 | 2,645,286 |
| | | 13,949,807 |
| Interactive Media & Services 1.2% |
| Alphabet, Inc., Class C (e) | 1,867 | 4,679,300 |
| IT Services 1.5% |
| Amdocs Ltd. | 35,694 | 2,761,288 |
| Global Payments, Inc. | 15,474 | 2,901,994 |
| | | 5,663,282 |
| Machinery 0.7% |
| Middleby Corp. (The) (e) | 15,242 | 2,640,829 |
| Media 1.5% |
| Comcast Corp., Class A | 104,703 | 5,970,165 |
| Metals & Mining 0.7% |
| Rio Tinto plc, Sponsored ADR (f) | 31,013 | 2,601,681 |
| Multi-Utilities 1.4% |
| Dominion Energy, Inc. | 39,990 | 2,942,064 |
| Sempra Energy | 20,191 | 2,674,904 |
| | | 5,616,968 |
| Oil, Gas & Consumable Fuels 1.5% |
| Phillips 66 | 34,256 | 2,939,850 |
| Pioneer Natural Resources Co. | 18,582 | 3,019,947 |
| | | 5,959,797 |
| Pharmaceuticals 5.2% |
| AstraZeneca plc, Sponsored ADR (f) | 51,436 | 3,081,017 |
| Eli Lilly and Co. | 18,871 | 4,331,272 |
| Merck & Co., Inc. | 56,551 | 4,397,971 |
| Pfizer, Inc. | 146,345 | 5,730,870 |
| Roche Holding AG | 7,006 | 2,639,223 |
| | | 20,180,353 |
| Real Estate Management & Development 0.7% |
| CBRE Group, Inc., Class A (e) | 31,204 | 2,675,119 |
The notes to the financial statements are an integral part of, and should be read in conjunction with, the financial statements.
19
Portfolio of Investments June 30, 2021† (Unaudited) (continued)
| | Shares | | Value |
| Common Stocks (continued) |
| Road & Rail 0.7% |
Knight-Swift Transportation
Holdings, Inc. | 63,151 | | $ 2,870,844 |
| Semiconductors & Semiconductor Equipment 2.9% |
| Analog Devices, Inc. | 16,066 | | 2,765,922 |
| KLA Corp. | 6,376 | | 2,067,163 |
| Micron Technology, Inc. (e) | 41,033 | | 3,486,984 |
| Qorvo, Inc. (e) | 15,461 | | 3,024,945 |
| | | | 11,345,014 |
| Software 0.6% |
| VMware, Inc., Class A (e)(f) | 13,947 | | 2,231,102 |
| Specialty Retail 1.3% |
| Home Depot, Inc. (The) | 7,197 | | 2,295,052 |
| TJX Cos., Inc. (The) | 40,134 | | 2,705,834 |
| | | | 5,000,886 |
Total Common Stocks
(Cost $207,298,303) | | | 220,073,011 |
| Exchange-Traded Funds 4.9% |
| iShares Intermediate Government/Credit Bond ETF | 76,929 | | 8,894,531 |
| iShares Russell 1000 Value ETF | 63,914 | | 10,138,039 |
Total Exchange-Traded Funds
(Cost $18,143,387) | | | 19,032,570 |
| Short-Term Investments 2.7% |
| Affiliated Investment Company 1.3% |
| MainStay U.S. Government Liquidity Fund, 0.01% (g) | 5,070,911 | | 5,070,911 |
| Unaffiliated Investment Company 1.4% |
| Wells Fargo Government Money Market Fund, 0.025% (g)(h) | 5,460,256 | | 5,460,256 |
Total Short-Term Investments
(Cost $10,531,167) | | | 10,531,167 |
Total Investments
(Cost $368,598,366) | 98.6% | | 384,013,625 |
| Other Assets, Less Liabilities | 1.4 | | 5,608,027 |
| Net Assets | 100.0% | | $ 389,621,652 |
| † | Percentages indicated are based on Portfolio net assets. |
| ‡ | Less than one-tenth of a percent. |
| (a) | May be sold to institutional investors only under Rule 144A or securities offered pursuant to Section 4(a)(2) of the Securities Act of 1933, as amended. |
| (b) | Floating rate—Rate shown was the rate in effect as of June 30, 2021. |
| (c) | Delayed delivery security. |
| (d) | Fixed to floating rate—Rate shown was the rate in effect as of June 30, 2021. |
| (e) | Non-income producing security. |
| (f) | All or a portion of this security was held on loan. As of June 30, 2021, the aggregate market value of securities on loan was $5,376,126; the total market value of collateral held by the Portfolio was $5,529,129. The market value of the collateral held included non-cash collateral in the form of U.S. Treasury securities with a value of $68,873. The Portfolio received cash collateral with a value of $5,460,256. (See Note 2(J)) |
| (g) | Current yield as of June 30, 2021. |
| (h) | Represents a security purchased with cash collateral received for securities on loan. |
The notes to the financial statements are an integral part of, and should be read in conjunction with, the financial statements.
| 20 | MainStay VP Balanced Portfolio |
Futures Contracts
As of June 30, 2021, the Portfolio held the following futures contracts1:
| Type | Number of
Contracts | Expiration
Date | Value at
Trade Date | Current
Notional
Amount | Unrealized
Appreciation
(Depreciation)2 |
| Long Contracts | | | | | |
| U.S. Treasury 2 Year Notes | 62 | September 2021 | $ 13,671,404 | $ 13,659,859 | $ (11,545) |
| U.S. Treasury 10 Year Notes | 24 | September 2021 | 3,162,246 | 3,180,000 | 17,754 |
| U.S. Treasury Ultra Bonds | 1 | September 2021 | 193,303 | 192,688 | (615) |
| Total Long Contracts | | | | | 5,594 |
| Short Contracts | | | | | |
| U.S. Treasury 5 Year Notes | (7) | September 2021 | (863,559) | (864,008) | (449) |
| U.S. Treasury 10 Year Ultra Bonds | (42) | September 2021 | (6,090,146) | (6,182,531) | (92,385) |
| U.S. Treasury Long Bonds | (4) | September 2021 | (624,680) | (643,000) | (18,320) |
| Total Short Contracts | | | | | (111,154) |
| Net Unrealized Depreciation | | | | | $ (105,560) |
| 1. | As of June 30, 2021, cash in the amount of $80,404 was on deposit with a broker or futures commission merchant for futures transactions. |
| 2. | Represents the difference between the value of the contracts at the time they were opened and the value as of June 30, 2021. |
| Abbreviation(s): |
| ADR—American Depositary Receipt |
| CLO—Collateralized Loan Obligation |
| ETF—Exchange-Traded Fund |
| FFCB—Federal Farm Credit Bank |
| FHLB—Federal Home Loan Bank |
| FHLMC—Federal Home Loan Mortgage Corp. |
| FNMA—Federal National Mortgage Association |
| LIBOR—London Interbank Offered Rate |
The notes to the financial statements are an integral part of, and should be read in conjunction with, the financial statements.
21
Portfolio of Investments June 30, 2021† (Unaudited) (continued)
The following is a summary of the fair valuations according to the inputs used as of June 30, 2021, for valuing the Portfolio’s assets and liabilities:
| Description | Quoted
Prices in
Active
Markets for
Identical
Assets
(Level 1) | | Significant
Other
Observable
Inputs
(Level 2) | | Significant
Unobservable
Inputs
(Level 3) | | Total |
| Asset Valuation Inputs | | | | | | | |
| Investments in Securities (a) | | | | | | | |
| Long-Term Bonds | | | | | | | |
| Asset-Backed Securities | $ — | | $ 17,692,179 | | $ — | | $ 17,692,179 |
| Corporate Bonds | — | | 55,312,533 | | — | | 55,312,533 |
| Foreign Government Bonds | — | | 499,063 | | — | | 499,063 |
| Mortgage-Backed Securities | — | | 2,316,448 | | — | | 2,316,448 |
| U.S. Government & Federal Agencies | — | | 58,556,654 | | — | | 58,556,654 |
| Total Long-Term Bonds | — | | 134,376,877 | | — | | 134,376,877 |
| Common Stocks | 220,073,011 | | — | | — | | 220,073,011 |
| Exchange-Traded Funds | 19,032,570 | | — | | — | | 19,032,570 |
| Short-Term Investments | | | | | | | |
| Affiliated Investment Company | 5,070,911 | | — | | — | | 5,070,911 |
| Unaffiliated Investment Company | 5,460,256 | | — | | — | | 5,460,256 |
| Total Short-Term Investments | 10,531,167 | | — | | — | | 10,531,167 |
| Total Investments in Securities | 249,636,748 | | 134,376,877 | | — | | 384,013,625 |
| Other Financial Instruments | | | | | | | |
| Futures Contracts (b) | 17,754 | | — | | — | | 17,754 |
| Total Investments in Securities and Other Financial Instruments | $ 249,654,502 | | $ 134,376,877 | | $ — | | $ 384,031,379 |
| Liability Valuation Inputs | | | | | | | |
| Other Financial Instruments | | | | | | | |
| Futures Contracts (b) | $ (123,314) | | $ — | | $ — | | $ (123,314) |
| (a) | For a complete listing of investments and their industries, see the Portfolio of Investments. |
| (b) | The value listed for these securities reflects unrealized appreciation (depreciation) as shown on the Portfolio of Investments. |
The notes to the financial statements are an integral part of, and should be read in conjunction with, the financial statements.
| 22 | MainStay VP Balanced Portfolio |
Statement of Assets and Liabilities as of June 30, 2021 (Unaudited)
| Assets |
Investment in unaffiliated securities, at value
(identified cost $363,527,455) including securities on loan of $5,376,126 | $378,942,714 |
Investment in affiliated investment companies, at value
(identified cost $5,070,911) | 5,070,911 |
| Cash | 11,254,984 |
| Cash collateral on deposit at broker for futures contracts | 80,404 |
| Receivables: | |
| Investment securities sold | 3,748,128 |
| Dividends and interest | 621,946 |
| Portfolio shares sold | 338,839 |
| Securities lending | 4,335 |
| Other assets | 3,622 |
| Total assets | 400,065,883 |
| Liabilities |
| Cash collateral received for securities on loan | 5,460,256 |
| Payables: | |
| Investment securities purchased | 4,653,682 |
| Manager (See Note 3) | 208,762 |
| NYLIFE Distributors (See Note 3) | 76,002 |
| Custodian | 28,668 |
| Professional fees | 13,971 |
| Variation margin on futures contracts | 2,890 |
| Total liabilities | 10,444,231 |
| Net assets | $389,621,652 |
| Composition of Net Assets |
| Shares of beneficial interest outstanding (par value of $.001 per share) unlimited number of shares authorized | $ 23,814 |
| Additional paid-in-capital | 289,185,328 |
| | 289,209,142 |
| Total distributable earnings (loss) | 100,412,510 |
| Net assets | $389,621,652 |
| Initial Class | |
| Net assets applicable to outstanding shares | $ 20,829,706 |
| Shares of beneficial interest outstanding | 1,258,777 |
| Net asset value per share outstanding | $ 16.55 |
| Service Class | |
| Net assets applicable to outstanding shares | $368,791,946 |
| Shares of beneficial interest outstanding | 22,555,138 |
| Net asset value per share outstanding | $ 16.35 |
The notes to the financial statements are an integral part of, and should be read in conjunction with, the financial statements.
23
Statement of Operations for the six months ended June 30, 2021 (Unaudited)
| Investment Income (Loss) |
| Income | |
| Dividends-unaffiliated (net of foreign tax withholding of $369) | $ 2,155,850 |
| Interest | 1,035,164 |
| Securities lending | 25,221 |
| Dividends-affiliated | 67 |
| Other | 21 |
| Total income | 3,216,323 |
| Expenses | |
| Manager (See Note 3) | 1,268,978 |
| Distribution/Service—Service Class (See Note 3) | 439,907 |
| Professional fees | 40,068 |
| Custodian | 23,306 |
| Shareholder communication | 17,818 |
| Trustees | 3,674 |
| Miscellaneous | 7,012 |
| Total expenses | 1,800,763 |
| Net investment income (loss) | 1,415,560 |
| Realized and Unrealized Gain (Loss) |
| Net realized gain (loss) on: | |
| Unaffiliated investment transactions | 77,172,760 |
| Futures transactions | (141,392) |
| Foreign currency transactions | (16,525) |
| Net realized gain (loss) | 77,014,843 |
| Net change in unrealized appreciation (depreciation) on: | |
| Unaffiliated investments | (38,207,521) |
| Futures contracts | (138,839) |
| Net change in unrealized appreciation (depreciation) | (38,346,360) |
| Net realized and unrealized gain (loss) | 38,668,483 |
| Net increase (decrease) in net assets resulting from operations | $ 40,084,043 |
The notes to the financial statements are an integral part of, and should be read in conjunction with, the financial statements.
| 24 | MainStay VP Balanced Portfolio |
Statements of Changes in Net Assets
for the six months ended June 30, 2021 (Unaudited) and the year ended December 31, 2020
| | 2021 | 2020 |
| Increase (Decrease) in Net Assets |
| Operations: | | |
| Net investment income (loss) | $ 1,415,560 | $ 4,428,441 |
| Net realized gain (loss) | 77,014,843 | 6,164,007 |
| Net change in unrealized appreciation (depreciation) | (38,346,360) | 9,512,059 |
| Net increase (decrease) in net assets resulting from operations | 40,084,043 | 20,104,507 |
| Distributions to shareholders: | | |
| Initial Class | — | (1,017,200) |
| Service Class | — | (18,038,419) |
| Total distributions to shareholders | — | (19,055,619) |
| Capital share transactions: | | |
| Net proceeds from sales of shares | 13,529,947 | 26,609,990 |
| Net asset value of shares issued to shareholder in reinvestment of distributions | — | 19,055,619 |
| Cost of shares redeemed | (17,557,544) | (86,852,589) |
| Increase (decrease) in net assets derived from capital share transactions | (4,027,597) | (41,186,980) |
| Net increase (decrease) in net assets | 36,056,446 | (40,138,092) |
| Net Assets |
| Beginning of period | 353,565,206 | 393,703,298 |
| End of period | $389,621,652 | $353,565,206 |
The notes to the financial statements are an integral part of, and should be read in conjunction with, the financial statements.
25
Financial Highlights selected per share data and ratios
| | Six months ended
June 30,
2021* | | Year Ended December 31, |
| Initial Class | 2020 | | 2019 | | 2018 | | 2017 | | 2016 |
| Net asset value at beginning of period | $ 14.83 | | $ 14.59 | | $ 13.23 | | $ 15.18 | | $ 14.26 | | $ 13.57 |
| Net investment income (loss) (a) | 0.08 | | 0.21 | | 0.25 | | 0.28 | | 0.23 | | 0.21 |
| Net realized and unrealized gain (loss) on investments | 1.64 | | 0.88 | | 1.93 | | (1.31) | | 1.18 | | 1.15 |
| Net realized and unrealized gain (loss) on foreign currency transactions | (0.00)‡ | | — | | — | | — | | — | | — |
| Total from investment operations | 1.72 | | 1.09 | | 2.18 | | (1.03) | | 1.41 | | 1.36 |
| Less distributions: | | | | | | | | | | | |
| From net investment income | — | | (0.30) | | (0.29) | | (0.25) | | (0.19) | | (0.20) |
| From net realized gain on investments | — | | (0.55) | | (0.53) | | (0.67) | | (0.30) | | (0.47) |
| Total distributions | — | | (0.85) | | (0.82) | | (0.92) | | (0.49) | | (0.67) |
| Net asset value at end of period | $ 16.55 | | $ 14.83 | | $ 14.59 | | $ 13.23 | | $ 15.18 | | $ 14.26 |
| Total investment return (b) | 11.60%(c) | | 7.90% | | 16.75% | | (7.36)% | | 10.02% | | 10.24% |
| Ratios (to average net assets)/Supplemental Data: | | | | | | | | | | | |
| Net investment income (loss) | 1.00%†† | | 1.52% | | 1.75% | | 1.88% | | 1.54% | | 1.47%(d) |
| Net expenses (e) | 0.73%†† | | 0.76% | | 0.76% | | 0.74% | | 0.74% | | 0.74%(f) |
| Expenses (before waiver/reimbursement) (e) | 0.73%†† | | 0.76% | | 0.76% | | 0.74% | | 0.74% | | 0.76% |
| Portfolio turnover rate | 102% | | 218% | | 186% | | 209% | | 174% | | 253% |
| Net assets at end of period (in 000’s) | $ 20,830 | | $ 18,533 | | $ 18,653 | | $ 16,084 | | $ 17,209 | | $ 15,666 |
| * | Unaudited. |
| ‡ | Less than one cent per share. |
| †† | Annualized. |
| (a) | Per share data based on average shares outstanding during the period. |
| (b) | Total return does not reflect any deduction of sales charges, mortality and expense charges, contract charges or administrative charges. For periods of less than one year, total return is not annualized. |
| (c) | Total investment return may reflect adjustments to conform to generally accepted accounting principles. |
| (d) | Without the custody fee reimbursement, net investment income (loss) would have been 1.45%. |
| (e) | In addition to the fees and expenses which the Portfolio bears directly, it also indirectly bears a pro-rata share of the fees and expenses of the underlying funds in which it invests. Such indirect expenses are not included in the above expense ratios. |
| (f) | Without the custody fee reimbursement, net expenses would have been 0.76%. |
The notes to the financial statements are an integral part of, and should be read in conjunction with, the financial statements.
| 26 | MainStay VP Balanced Portfolio |
Financial Highlights selected per share data and ratios
| | Six months ended
June 30,
2021* | | Year Ended December 31, |
| Service Class | 2020 | | 2019 | | 2018 | | 2017 | | 2016 |
| Net asset value at beginning of period | $ 14.67 | | $ 14.43 | | $ 13.09 | | $ 15.03 | | $ 14.13 | | $ 13.45 |
| Net investment income (loss) (a) | 0.06 | | 0.17 | | 0.21 | | 0.24 | | 0.19 | | 0.17 |
| Net realized and unrealized gain (loss) on investments | 1.62 | | 0.88 | | 1.91 | | (1.30) | | 1.17 | | 1.15 |
| Net realized and unrealized gain (loss) on foreign currency transactions | (0.00)‡ | | — | | — | | — | | — | | — |
| Total from investment operations | 1.68 | | 1.05 | | 2.12 | | (1.06) | | 1.36 | | 1.32 |
| Less distributions: | | | | | | | | | | | |
| From net investment income | — | | (0.26) | | (0.25) | | (0.21) | | (0.16) | | (0.17) |
| From net realized gain on investments | — | | (0.55) | | (0.53) | | (0.67) | | (0.30) | | (0.47) |
| Total distributions | — | | (0.81) | | (0.78) | | (0.88) | | (0.46) | | (0.64) |
| Net asset value at end of period | $ 16.35 | | $ 14.67 | | $ 14.43 | | $ 13.09 | | $ 15.03 | | $ 14.13 |
| Total investment return (b) | 11.45%(c) | | 7.63% | | 16.46% | | (7.59)% | | 9.75% | | 9.96% |
| Ratios (to average net assets)/Supplemental Data: | | | | | | | | | | | |
| Net investment income (loss) | 0.75%†† | | 1.27% | | 1.50% | | 1.62% | | 1.28% | | 1.22%(d) |
| Net expenses (e) | 0.98%†† | | 1.01% | | 1.01% | | 0.99% | | 0.99% | | 0.99%(f) |
| Expenses (before waiver/reimbursement) (e) | 0.98%†† | | 1.01% | | 1.01% | | 0.99% | | 0.99% | | 1.01% |
| Portfolio turnover rate | 102% | | 218% | | 186% | | 209% | | 174% | | 253% |
| Net assets at end of period (in 000’s) | $ 368,792 | | $ 335,032 | | $ 375,050 | | $ 352,496 | | $ 426,646 | | $ 395,611 |
| * | Unaudited. |
| ‡ | Less than one cent per share. |
| †† | Annualized. |
| (a) | Per share data based on average shares outstanding during the period. |
| (b) | Total return does not reflect any deduction of sales charges, mortality and expense charges, contract charges or administrative charges. For periods of less than one year, total return is not annualized. |
| (c) | Total investment return may reflect adjustments to conform to generally accepted accounting principles. |
| (d) | Without the custody fee reimbursement, net investment income (loss) would have been 1.20%. |
| (e) | In addition to the fees and expenses which the Portfolio bears directly, it also indirectly bears a pro-rata share of the fees and expenses of the underlying funds in which it invests. Such indirect expenses are not included in the above expense ratios. |
| (f) | Without the custody fee reimbursement, net expenses would have been 1.01%. |
The notes to the financial statements are an integral part of, and should be read in conjunction with, the financial statements.
27
Notes to Financial Statements (Unaudited)
Note 1–Organization and Business
MainStay VP Funds Trust (the “Fund”) was organized as a Delaware statutory trust on February 1, 2011. The Fund is registered under the Investment Company Act of 1940, as amended (the “1940 Act”), as an open-end management investment company. The Fund is comprised of thirty-one separate series (collectively referred to as the “Portfolios”). These financial statements and notes relate to the MainStay VP Balanced Portfolio (the "Portfolio"), a "diversified” portfolio, as that term is defined in the 1940 Act, as interpreted or modified by regulatory authorities having jurisdiction, from time to time.
Shares of the Portfolio are currently offered to certain separate accounts to fund variable annuity policies and variable universal life insurance policies issued by New York Life Insurance and Annuity Corporation (“NYLIAC”), a wholly-owned subsidiary of New York Life Insurance Company (“New York Life”) and may also be offered to fund variable annuity policies and variable universal life insurance policies issued by other insurance companies. NYLIAC allocates shares of the Portfolios to, among others, certain NYLIAC separate accounts. Shares of the Portfolio are also offered to the MainStay VP Conservative Allocation Portfolio, MainStay VP Moderate Allocation Portfolio, MainStay VP Growth Allocation Portfolio (formerly known as MainStay VP Moderate Growth Allocation Portfolio) and MainStay VP Equity Allocation Portfolio (formerly known as MainStay VP Growth Allocation Portfolio), which operate as “funds-of-funds," and other variable insurance funds.
The following table lists the Portfolio's share classes that have been registered and commenced operations:
| Class | Commenced Operations |
| Initial Class | May 2, 2005 |
| Service Class | May 2, 2005 |
Shares of the Portfolio are offered and are redeemed at a price equal to their respective net asset value (“NAV”) per share. No sales or redemption charge is applicable to the purchase or redemption of the Portfolio's shares. Under the terms of the Fund’s multiple class plan, adopted pursuant to Rule 18f-3 under the 1940 Act, the classes differ in that, among other things, Service Class shares of the Portfolio pay a combined distribution and service fee of 0.25% of average daily net assets attributable to Service Class shares of the Portfolio to the Distributor (as defined in Note 3(B)) pursuant to a plan adopted in accordance with Rule 12b-1 under the 1940 Act. Contract owners of variable annuity contracts purchased after June 2, 2003, are permitted to invest only in the Service Class shares.
The Portfolio's investment objective is to seek total return.
Note 2–Significant Accounting Policies
The Portfolio is an investment company and accordingly follows the investment company accounting and reporting guidance of the Financial Accounting Standards Board (“FASB”) Accounting Standard Codification Topic 946 Financial Services—Investment Companies. The Portfolio
prepares its financial statements in accordance with generally accepted accounting principles (“GAAP”) in the United States of America and follows the significant accounting policies described below.
(A) Securities Valuation. Investments are usually valued as of the close of regular trading on the New York Stock Exchange (the "Exchange") (usually 4:00 p.m. Eastern time) on each day the Portfolio is open for business ("valuation date").
The Board of Trustees of the Fund (the "Board") adopted procedures establishing methodologies for the valuation of the Portfolio's securities and other assets and delegated the responsibility for valuation determinations under those procedures to the Valuation Committee of the Fund (the “Valuation Committee”). The procedures state that, subject to the oversight of the Board and unless otherwise noted, the responsibility for the day-to-day valuation of portfolio assets (including fair value measurements for the Portfolio's assets and liabilities) rests with New York Life Investment Management LLC (“New York Life Investments” or the "Manager"), aided to whatever extent necessary by the Subadvisor (as defined in Note 3(A)). To assess the appropriateness of security valuations, the Manager, the Subadvisor or the Portfolio's third-party service provider, who is subject to oversight by the Manager, regularly compares prior day prices, prices on comparable securities and the sale prices to the prior and current day prices and challenges prices with changes exceeding certain tolerance levels with third-party pricing services or broker sources.
The Board authorized the Valuation Committee to appoint a Valuation Subcommittee (the “Subcommittee”) to establish the prices of securities for which market quotations are not readily available or the prices of which are not otherwise readily determinable under the procedures. The Subcommittee meets (in person, via electronic mail or via teleconference) on an as-needed basis. The Valuation Committee meets to ensure that actions taken by the Subcommittee were appropriate.
For those securities valued through either a standardized fair valuation methodology or a fair valuation measurement, the Subcommittee deals with such valuation and the Valuation Committee reviews and affirms, if appropriate, the reasonableness of the valuation based on such methodologies and measurements on a regular basis after considering information that is reasonably available and deemed relevant by the Valuation Committee. Any action taken by the Subcommittee with respect to the valuation of a portfolio security or other asset is submitted for review and ratification (if appropriate) to the Valuation Committee and the Board at the next regularly scheduled meeting.
"Fair value" is defined as the price the Portfolio would reasonably expect to receive upon selling an asset or liability in an orderly transaction to an independent buyer in the principal or most advantageous market for the asset or liability. Fair value measurements are determined within a framework that establishes a three-tier hierarchy that maximizes the use of observable market data and minimizes the use of unobservable inputs to establish a classification of fair value measurements for disclosure purposes. "Inputs" refer broadly to the assumptions that market
| 28 | MainStay VP Balanced Portfolio |
participants would use in pricing the asset or liability, including assumptions about risk, such as the risk inherent in a particular valuation technique used to measure fair value using a pricing model and/or the risk inherent in the inputs for the valuation technique. Inputs may be observable or unobservable. Observable inputs reflect the assumptions market participants would use in pricing the asset or liability based on market data obtained from sources independent of the Portfolio. Unobservable inputs reflect the Portfolio’s own assumptions about the assumptions market participants would use in pricing the asset or liability based on the information available. The inputs or methodology used for valuing assets or liabilities may not be an indication of the risks associated with investing in those assets or liabilities. The three-tier hierarchy of inputs is summarized below.
| • | Level 1—quoted prices in active markets for an identical asset or liability |
| • | Level 2—other significant observable inputs (including quoted prices for a similar asset or liability in active markets, interest rates and yield curves, prepayment speeds, credit risk, etc.) |
| • | Level 3—significant unobservable inputs (including the Portfolio's own assumptions about the assumptions that market participants would use in measuring fair value of an asset or liability) |
The level of an asset or liability within the fair value hierarchy is based on the lowest level of an input, both individually and in the aggregate, that is significant to the fair value measurement. The aggregate value by input level of the Portfolio’s assets and liabilities as of June 30, 2021, is included at the end of the Portfolio of Investments.
The Portfolio may use third-party vendor evaluations, whose prices may be derived from one or more of the following standard inputs, among others:
| • Benchmark yields | • Reported trades |
| • Broker/dealer quotes | • Issuer spreads |
| • Two-sided markets | • Benchmark securities |
| • Bids/offers | • Reference data (corporate actions or material event notices) |
| • Industry and economic events | • Comparable bonds |
| • Monthly payment information | |
An asset or liability for which market values cannot be measured using the methodologies described above is valued by methods deemed reasonable in good faith by the Valuation Committee, following the procedures established by the Board, to represent fair value. Under these procedures, the Portfolio generally uses a market-based approach which may use related or comparable assets or liabilities, recent transactions, market multiples, book values and other relevant information. The Portfolio may also use an income-based valuation approach in which the anticipated future cash flows of the asset or liability are discounted to calculate fair value. Discounts may also be applied due to the nature and/or duration of any restrictions on the disposition of the asset or liability. Fair value represents a good faith approximation of the value of a
security. Fair value determinations involve the consideration of a number of subjective factors, an analysis of applicable facts and circumstances and the exercise of judgment. As a result, it is possible that the fair value for a security determined in good faith in accordance with the Portfolio's valuation procedures may differ from valuations for the same security determined by other funds using their own valuation procedures. Although the Portfolio's valuation procedures are designed to value a security at the price the Portfolio may reasonably expect to receive upon the security's sale in an orderly transaction, there can be no assurance that any fair value determination thereunder would, in fact, approximate the amount that the Portfolio would actually realize upon the sale of the security or the price at which the security would trade if a reliable market price were readily available. During the six-month period ended June 30, 2021, there were no material changes to the fair value methodologies.
Securities which may be valued in this manner include, but are not limited to: (i) a security for which trading has been halted or suspended; (ii) a debt security that has recently gone into default and for which there is not a current market quotation; (iii) a security of an issuer that has entered into a restructuring; (iv) a security that has been delisted from a national exchange; (v) a security for which the market price is not readily available from a third-party pricing source or, if so provided, does not, in the opinion of the Manager or the Subadvisor, reflect the security's market value; (vi) a security subject to trading collars for which no or limited trading takes place; and (vii) a security whose principal market has been temporarily closed at a time when, under normal conditions, it would be open. Securities valued in this manner are generally categorized as Level 3 in the hierarchy. No securities held by the Portfolio as of June 30, 2021 were fair valued in such a manner.
Certain securities held by the Portfolio may principally trade in foreign markets. Events may occur between the time the foreign markets close and the time at which the Portfolio's NAVs are calculated. These events may include, but are not limited to, situations relating to a single issuer in a market sector, significant fluctuations in U.S. or foreign markets, natural disasters, armed conflicts, governmental actions or other developments not tied directly to the securities markets. Should the Manager or the Subadvisor conclude that such events may have affected the accuracy of the last price of such securities reported on the local foreign market, the Subcommittee may, pursuant to procedures adopted by the Board, adjust the value of the local price to reflect the estimated impact on the price of such securities as a result of such events. In this instance, securities are generally categorized as Level 3 in the hierarchy. Additionally, certain foreign equity securities are also fair valued whenever the movement of a particular index exceeds certain thresholds. In such cases, the securities are fair valued by applying factors provided by a third-party vendor in accordance with valuation procedures adopted by the Board and are generally categorized as Level 2 in the hierarchy. No foreign equity securities held by the Portfolio as of June 30, 2021 were fair valued in such a manner.
Equity securities are valued at the last quoted sales prices as of the close of regular trading on the relevant exchange on each valuation date. Securities that are not traded on the valuation date are valued at the
Notes to Financial Statements (Unaudited) (continued)
mean of the last quoted bid and ask prices. Prices are normally taken from the principal market in which each security trades. These securities are generally categorized as Level 1 in the hierarchy.
Exchange-traded funds (“ETFs”) are valued at the last quoted sales prices as of the close of regular trading on the relevant exchange on each valuation date. Securities that are not traded on the valuation date are valued at the mean of the last quoted bid and ask prices. Prices are normally taken from the principal market in which each security trades. These securities are generally categorized as Level 1 in the hierarchy.
Investments in mutual funds, including money market funds, are valued at their respective NAVs at the close of business each day on the valuation date. These securities are generally categorized as Level 1 in the hierarchy.
Futures contracts are valued at the last posted settlement price on the market where such futures are primarily traded. These securities are generally categorized as Level 1 in the hierarchy.
Debt securities (other than convertible and municipal bonds) are valued at the evaluated bid prices (evaluated mean prices in the case of convertible and municipal bonds) supplied by a pricing agent or broker selected by the Manager, in consultation with the Subadvisors. The evaluations are market-based measurements processed through a pricing application and represents the pricing agent’s good faith determination as to what a holder may receive in an orderly transaction under market conditions. The rules-based logic utilizes valuation techniques that reflect participants’ assumptions and vary by asset class and per methodology, maximizing the use of relevant observable data including quoted prices for similar assets, benchmark yield curves and market corroborated inputs. The evaluated bid or mean prices are deemed by the Manager, in consultation with the Subadvisors, to be representative of market values at the regular close of trading of the Exchange on each valuation date. Debt securities purchased on a delayed delivery basis are marked to market daily until settlement at the forward settlement date. Debt securities, including corporate bonds, U.S. government and federal agency bonds, municipal bonds, foreign bonds, convertible bonds, asset-backed securities and mortgage-backed securities are generally categorized as Level 2 in the hierarchy.
Temporary cash investments acquired in excess of 60 days to maturity at the time of purchase are valued using the latest bid prices or using valuations based on a matrix system (which considers such factors as security prices, yields, maturities and ratings), both as furnished by independent pricing services. Temporary cash investments that mature in 60 days or less at the time of purchase ("Short-Term Investments") are valued using the amortized cost method of valuation, unless the use of such method would be inappropriate. The amortized cost method involves valuing a security at its cost on the date of purchase and thereafter assuming a constant amortization to maturity of the difference between such cost and the value on maturity date. Amortized cost approximates the current fair value of a security. Securities valued using the amortized cost method are not valued using quoted prices in an active market and are generally categorized as Level 2 in the hierarchy.
The information above is not intended to reflect an exhaustive list of the methodologies that may be used to value portfolio investments. The valuation procedures permit the use of a variety of valuation methodologies in connection with valuing portfolio investments. The methodology used for a specific type of investment may vary based on the market data available or other considerations. The methodologies summarized above may not represent the specific means by which portfolio investments are valued on any particular business day.
(B) Income Taxes. The Portfolio's policy is to comply with the requirements of the Internal Revenue Code of 1986, as amended (the “Internal Revenue Code”), applicable to regulated investment companies and to distribute all of its taxable income to the shareholders of the Portfolio within the allowable time limits.
The Manager evaluates the Portfolio’s tax positions to determine if the tax positions taken meet the minimum recognition threshold in connection with accounting for uncertainties in income tax positions taken or expected to be taken for the purposes of measuring and recognizing tax liabilities in the financial statements. Recognition of tax benefits of an uncertain tax position is permitted only to the extent the position is “more likely than not” to be sustained assuming examination by taxing authorities. The Manager analyzed the Portfolio's tax positions taken on federal, state and local income tax returns for all open tax years (for up to three tax years) and has concluded that no provisions for federal, state and local income tax are required in the Portfolio's financial statements. The Portfolio's federal, state and local income tax and federal excise tax returns for tax years for which the applicable statutes of limitations have not expired are subject to examination by the Internal Revenue Service and state and local departments of revenue.
(C) Foreign Taxes. The Portfolio may be subject to foreign taxes on income and other transaction-based taxes imposed by certain countries in which it invests. A portion of the taxes on gains on investments or currency purchases/repatriation may be reclaimable. The Portfolio will accrue such taxes and reclaims as applicable, based upon its current interpretation of tax rules and regulations that exist in the markets in which it invests.
The Portfolio may be subject to taxation on realized capital gains, repatriation proceeds and other transaction-based taxes imposed by certain countries in which it invests. The Portfolio will accrue such taxes as applicable based upon its current interpretation of tax rules and regulations that exist in the market in which it invests. Capital gains taxes relating to positions still held are reflected as a liability in the Statement of Assets and Liabilities, as well as an adjustment to the Portfolio's net unrealized appreciation (depreciation). Taxes related to capital gains realized, if any, are reflected as part of net realized gain (loss) in the Statement of Operations. Changes in tax liabilities related to capital gains taxes on unrealized investment gains, if any, are reflected as part of the change in net unrealized appreciation (depreciation) on investments in the Statement of Operations. Transaction-based charges are generally assessed as a percentage of the transaction amount.
| 30 | MainStay VP Balanced Portfolio |
(D) Dividends and Distributions to Shareholders. Dividends and distributions are recorded on the ex-dividend date. The Portfolio intends to declare and pay dividends from net investment income and distributions from net realized capital and currency gains, if any, at least annually. Unless a shareholder elects otherwise, all dividends and distributions are reinvested at NAV in the same class of shares of the Portfolio. Dividends and distributions to shareholders are determined in accordance with federal income tax regulations and may differ from determinations using GAAP.
(E) Security Transactions and Investment Income. The Portfolio records security transactions on the trade date. Realized gains and losses on security transactions are determined using the identified cost method. Dividend income is recognized on the ex-dividend date, net of any foreign tax withheld at the source, and interest income is accrued as earned using the effective interest rate method. Distributions received from real estate investment trusts may be classified as dividends, capital gains and/or return of capital. Discounts and premiums on securities purchased for the Portfolio are accreted and amortized, respectively, on the effective interest rate method.
Investment income and realized and unrealized gains and losses on investments of the Portfolio are allocated pro rata to the separate classes of shares based upon their relative net assets on the date the income is earned or realized and unrealized gains and losses are incurred.
The Portfolio may place a debt security on non-accrual status and reduce related interest income by ceasing current accruals and writing off all or a portion of any interest receivables when the collection of all or a portion of such interest has become doubtful. A debt security is removed from non-accrual status when the issuer resumes interest payments or when collectability of interest is reasonably assured.
(F) Expenses. Expenses of the Fund are allocated to the individual Portfolios in proportion to the net assets of the respective Portfolios when the expenses are incurred, except where direct allocations of expenses can be made. Expenses (other than fees incurred under the distribution and service plans, further discussed in Note 3(B), which are charged directly to the Service Class shares) are allocated to separate classes of shares pro rata based upon their relative net assets on the date the expenses are incurred. The expenses borne by the Portfolio, including those of related parties to the Portfolio, are shown in the Statement of Operations.
Additionally, the Portfolio may invest in ETFs and mutual funds, which are subject to management fees and other fees that may cause the costs of investing in ETFs and mutual funds to be greater than the costs of owning the underlying securities directly. These indirect expenses of ETFs and mutual funds are not included in the amounts shown as expenses in the Statement of Operations or in the expense ratios included in the Financial Highlights.
(G) Use of Estimates. In preparing financial statements in conformity with GAAP, the Manager makes estimates and assumptions that affect the reported amounts and disclosures in the financial statements. Actual results could differ from those estimates and assumptions.
(H) Futures Contracts. A futures contract is an agreement to purchase or sell a specified quantity of an underlying instrument at a specified future date and price, or to make or receive a cash payment based on the value of a financial instrument (e.g., foreign currency, interest rate, security or securities index). The Portfolio is subject to risks such as market price risk and/or interest rate risk in the normal course of investing in these contracts. Upon entering into a futures contract, the Portfolio is required to pledge to the broker or futures commission merchant an amount of cash and/or U.S. government securities equal to a certain percentage of the collateral amount, known as the “initial margin.” During the period the futures contract is open, changes in the value of the contract are recognized as unrealized appreciation or depreciation by marking to market such contract on a daily basis to reflect the market value of the contract at the end of each day’s trading. The Portfolio agrees to receive from or pay to the broker or futures commission merchant an amount of cash equal to the daily fluctuation in the value of the contract. Such receipts or payments are known as “variation margin.” When the futures contract is closed, the Portfolio records a realized gain or loss equal to the difference between the proceeds from (or cost of) the closing transaction and the Portfolio's basis in the contract.
The use of futures contracts involves, to varying degrees, elements of market risk in excess of the amount recognized in the Statement of Assets and Liabilities. The contract or notional amounts and variation margin reflect the extent of the Portfolio's involvement in open futures positions. There are several risks associated with the use of futures contracts as hedging techniques. There can be no assurance that a liquid market will exist at the time when the Portfolio seeks to close out a futures contract. If no liquid market exists, the Portfolio would remain obligated to meet margin requirements until the position is closed. Futures contracts may involve a small initial investment relative to the risk assumed, which could result in losses greater than if the Portfolio did not invest in futures contracts. Futures contracts may be more volatile than direct investments in the instrument underlying the futures and may not correlate to the underlying instrument, causing a given hedge not to achieve its objectives. The Portfolio's activities in futures contracts have minimal counterparty risk as they are conducted through regulated exchanges that guarantee the futures against default by the counterparty. In the event of a bankruptcy or insolvency of a futures commission merchant that holds margin on behalf of the Portfolio, the Portfolio may not be entitled to the return of the entire margin owed to the Portfolio, potentially resulting in a loss. The Portfolio may invest in futures contracts to seek enhanced returns or to reduce the risk of loss by hedging certain of its holdings. The Portfolio's investment in futures contracts and other derivatives may increase the volatility of the Portfolio's NAVs and may result in a loss to the Portfolio. Open futures contracts as of June 30, 2021 are shown in the Portfolio of Investments.
Notes to Financial Statements (Unaudited) (continued)
(I) Foreign Currency Transactions. The Portfolio's books and records are maintained in U.S. dollars. Prices of securities denominated in foreign currency amounts are translated into U.S. dollars at the mean between the buying and selling rates last quoted by any major U.S. bank at the following dates:
(i) market value of investment securities, other assets and liabilities— at the valuation date; and
(ii) purchases and sales of investment securities, income and expenses—at the date of such transactions.
The assets and liabilities that are denominated in foreign currency amounts are presented at the exchange rates and market values at the close of the period. The realized and unrealized changes in net assets arising from fluctuations in exchange rates and market prices of securities are not separately presented.
Net realized gain (loss) on foreign currency transactions represents net currency gains or losses realized as a result of differences between the amounts of securities sale proceeds or purchase cost, dividends, interest and withholding taxes as recorded on the Portfolio's books, and the U.S. dollar equivalent amount actually received or paid. Net currency gains or losses from valuing such foreign currency denominated assets and liabilities, other than investments at valuation date exchange rates, are reflected in unrealized foreign exchange gains or losses.
(J) Securities Lending. In order to realize additional income, the Portfolio may engage in securities lending, subject to the limitations set forth in the 1940 Act and relevant guidance by the staff of the Securities and Exchange Commission (“SEC”). If the Portfolio engages in securities lending, the Portfolio will lend through its custodian, JPMorgan Chase Bank, N.A., ("JPMorgan"), acting as securities lending agent on behalf of the Portfolio. Under the current arrangement, JPMorgan will manage the Portfolio's collateral in accordance with the securities lending agency agreement between the Portfolio and JPMorgan, and indemnify the Portfolio against counterparty risk. The loans will be collateralized by cash (which may be invested in a money market fund) and/or non-cash collateral (which may include U.S. Treasury securities and/or U.S. government agency securities issued or guaranteed by the United States government or its agencies or instrumentalities) at least equal at all times to the market value of the securities loaned. The Portfolio bears the risk of delay in recovery of, or loss of rights in, the securities loaned. The Portfolio may also record a realized gain or loss on securities deemed sold due to a borrower’s inability to return securities on loan. The Portfolio bears the risk of any loss on investment of cash collateral. The Portfolio will receive compensation for lending its securities in the form of fees or it will retain a portion of interest earned on the investment of any cash collateral. The Portfolio will also continue to receive interest and dividends on the securities loaned and any gain or loss in the market price of the securities loaned that may occur during the term of the loan will be for the account of the Portfolio. Income earned from securities lending activities, if any, is reflected in the Statement of Operations. Securities on loan as of June 30, 2021, are shown in the Portfolio of Investments.
Prior to February 22, 2021, these services were provided by State Street Bank and Trust Company (“State Street”).
(K) Delayed Delivery Transactions. The Portfolio may purchase or sell securities on a delayed delivery basis. These transactions involve a commitment by the Portfolio to purchase or sell securities for a predetermined price or yield, with payment and delivery taking place beyond the customary settlement period. When delayed delivery purchases are outstanding, the Portfolio will designate liquid assets in an amount sufficient to meet the purchase price. When purchasing a security on a delayed delivery basis, the Portfolio assumes the rights and risks of ownership of the security, including the risk of price and yield fluctuations, and takes such fluctuations into account when determining its NAV. The Portfolio may dispose of or renegotiate a delayed delivery transaction after it is entered into, and may sell delayed delivery securities before they are delivered, which may result in a realized gain or loss. When the Portfolio has sold a security it owns on a delayed delivery basis, the Portfolio does not participate in future gains and losses with respect to the security. As of June 30, 2021, delayed delivery transactions are shown in the Portfolio of Investments.
(L) Debt Securities Risk. The ability of issuers of debt securities held by the Portfolio to meet their obligations may be affected by, among other things, economic or political developments in a specific country, industry or region. Debt securities are also subject to the risks associated with changes in interest rates.
Investments in the Portfolio are not guaranteed, even though some of the Portfolio’s underlying investments are guaranteed by the U.S. government or its agencies or instrumentalities. The principal risk of mortgage-related and asset-backed securities is that the underlying debt may be prepaid ahead of schedule, if interest rates fall, thereby reducing the value of the Portfolio’s investment. If interest rates rise, less of the debt may be prepaid and the Portfolio may lose money because the Portfolio may be unable to invest in higher yielding assets. The Portfolio is subject to interest-rate risk and can lose principal value when interest rates rise. Bonds are also subject to credit risk, in which the bond issuer may fail to pay interest and principal in a timely manner.
The Portfolio may invest in foreign debt securities, which carry certain risks that are in addition to the usual risks inherent in domestic instruments. These risks include those resulting from currency fluctuations, future adverse political or economic developments and possible imposition of currency exchange blockages or other foreign governmental laws or restrictions. These risks are likely to be greater in emerging markets than in developed markets.
(M) LIBOR Replacement Risk. The Portfolio may invest in certain debt securities, derivatives or other financial instruments that utilize the London Interbank Offered Rate ("LIBOR"), as a “benchmark” or “reference rate” for various interest rate calculations. The United Kingdom Financial Conduct Authority, which regulates LIBOR, announced that after 2021 it will cease its active encouragement of banks to provide the quotations needed to sustain LIBOR. However, it is possible that certain LIBOR tenors
| 32 | MainStay VP Balanced Portfolio |
may continue beyond 2021 and the most widely used LIBOR tenors may continue until mid-2023. As a result, it is anticipated that LIBOR will be discontinued or will no longer be sufficiently robust to be representative of its underlying market around that time. Although financial regulators and industry working groups have suggested alternative reference rates, such as European Interbank Offer Rate (“EURIBOR”), Sterling Overnight Interbank Average Rate (“SONIA”) and Secured Overnight Financing Rate (“SOFR”), there are challenges to converting certain contracts and transactions to a new benchmark and neither the full effects of the transition process nor its ultimate outcome is known. New York Life Investments is currently working to assess exposure and will modify contracts as necessary.
The elimination of LIBOR or changes to other reference rates or any other changes or reforms to the determination or supervision of reference rates could have an adverse impact on the market for, or value of, any securities or payments linked to those reference rates, which may adversely affect the Portfolio's performance and/or net asset value. Uncertainty and risk also remain regarding the willingness and ability of issuers and lenders to include revised provisions in new and existing contracts or instruments. Consequently, the transition away from LIBOR to other reference rates may lead to increased volatility and illiquidity in markets that are tied to LIBOR, fluctuations in values of LIBOR-related investments or investments in issuers that utilize LIBOR, increased difficulty in borrowing or refinancing and diminished effectiveness of hedging strategies, adversely affecting the Portfolio's performance. Furthermore, the risks associated with the expected discontinuation of LIBOR and transition may be exacerbated if the work necessary to effect an orderly transition to an alternative reference rate is not completed in a timely manner. Because the usefulness of LIBOR as a benchmark could deteriorate during the transition period, these effects could occur prior to the end of 2021 with respect to certain LIBOR tenors or mid-2023 for the remaining LIBOR tenors.
(N) Indemnifications. Under the Fund’s organizational documents, its officers and trustees are indemnified against certain liabilities that may arise out of performance of their duties to the Fund. Additionally, in the normal course of business, the Portfolio enters into contracts with third-party service providers that contain a variety of representations and warranties and that may provide general indemnifications. The Portfolio's maximum exposure under these arrangements is unknown, as this would involve future claims that may be made against the Portfolio that have not yet occurred. The Manager believes that the risk of loss in connection with these potential indemnification obligations is remote. However, there can be no assurance that material liabilities related to such obligations will not arise in the future, which could adversely impact the Portfolio.
(O) Quantitative Disclosure of Derivative Holdings. The following tables show additional disclosures related to the Portfolio's derivative and hedging activities, including how such activities are accounted for and their effect on the Portfolio's financial positions, performance and cash flows.
The Portfolio entered into futures contracts in order to help manage the duration and yield curve positioning of the portfolio while minimizing the exposure to wider bid/ask spreads in traditional bonds. These derivatives are not accounted for as hedging instruments.
Fair value of derivative instruments as of June 30, 2021:
| Asset Derivatives | Interest
Rate
Contracts
Risk | Total |
| Futures Contracts - Net Assets—Net unrealized appreciation on futures contracts (a) | $17,754 | $17,754 |
| Total Fair Value | $17,754 | $17,754 |
| (a) | Includes cumulative appreciation (depreciation) of futures contracts as reported in the Portfolio of Investments. Only current day’s variation margin is reported within the Statement of Assets and Liabilities. |
| Liability Derivatives | Interest
Rate
Contracts
Risk | Total |
| Futures Contracts - Net Assets—Net unrealized depreciation on futures contracts (a) | $(123,314) | $(123,314) |
| Total Fair Value | $(123,314) | $(123,314) |
| (a) | Includes cumulative appreciation (depreciation) of futures contracts as reported in the Portfolio of Investments. Only current day’s variation margin is reported within the Statement of Assets and Liabilities. |
The effect of derivative instruments on the Statement of Operations for the six-month period ended June 30, 2021:
| Net Realized Gain (Loss) from: | Interest
Rate
Contracts
Risk | Total |
| Futures Contracts | $(141,392) | $(141,392) |
| Total Net Realized Gain (Loss) | $(141,392) | $(141,392) |
| Net Change in Unrealized Appreciation (Depreciation) | Interest
Rate
Contracts
Risk | Total |
| Futures Contracts | $(138,839) | $(138,839) |
| Total Net Change in Unrealized Appreciation (Depreciation) | $(138,839) | $(138,839) |
| Average Notional Amount | Total |
| Futures Contracts Long | $16,146,397 |
| Futures Contracts Short | $ (4,788,941) |
Note 3–Fees and Related Party Transactions
(A) Manager and Subadvisors. New York Life Investments, a registered investment adviser and an indirect, wholly-owned subsidiary of New York Life, serves as the Portfolio’s Manager, pursuant to an Amended
Notes to Financial Statements (Unaudited) (continued)
and Restated Management Agreement (“Management Agreement”). The Manager provides offices, conducts clerical, recordkeeping and bookkeeping services and keeps most of the financial and accounting records required to be maintained by the Portfolio. Except for the portion of salaries and expenses that are the responsibility of the Portfolio, the Manager pays the salaries and expenses of all personnel affiliated with the Portfolio and certain operational expenses of the Portfolio. The Portfolio reimburses New York Life Investments in an amount equal to the portion of the compensation of the Chief Compliance Officer attributable to the Portfolio. The Portfolio’s subadvisor changed effective May 1, 2021, due to the removal of MacKay Shields LLC ("MacKay Shields") as a subadvisor to the equity portion of the Portfolio and the appointment of Wellington Management Company LLP (“Wellington” or the “Subadvisor”) as a subadvisor to the equity portion of the Portfolio. Wellington, a registered investment adviser, is responsible for the day-to-day portfolio management of the equity portion of the Fund, pursuant to the terms of a Subadvisory Agreement (a “Subadvisory Agreement”) between New York Life Investments and Wellington, and NYL Investors LLC (“NYL Investors” or the “Subadvisor,” and, together with Wellington, the “Subadvisors”), a registered investment adviser and a direct, wholly-owned subsidiary of New York Life, serves as a Subadvisor to the Portfolio and is responsible for the day-to-day portfolio management of the fixed-income portion of the Portfolio, pursuant to the terms of a Subadvisory Agreement between New York Life Investments and NYL Investors. New York Life Investments pays for the services of the Subadvisors.
Effective May 1, 2021, under the Management Agreement, the Fund pays the Manager, on behalf of the Portfolio, a monthly fee for the services performed and the facilities furnished at an annual rate of the Portfolio’s average daily net assets as follows: 0.65% up to $1 billion; 0.625% from $1 billion to $2 billion; and 0.60% in excess of $2 billion.
Prior to May 1, 2021, the Fund paid the Manager, on behalf of the Portfolio, a monthly fee for the services performed and the facilities furnished at an annual rate of the Portfolio's average daily net assets as follows: 0.70% up to $1 billion; 0.65% from $1 billion to $2 billion; and 0.60% in excess of $2 billion. During the six-month period ended June 30, 2021, the effective management fee rate was 0.68%.
During the six-month period ended June 30, 2021, New York Life Investments earned fees from the Portfolio in the amount of $1,268,978 and paid MacKay Shields, Wellington and NYL Investors $253,378, $103,821 and $357,200, respectively.
JPMorgan Chase Bank, N.A. ("JPMorgan") provides sub-administration and sub-accounting services to the Portfolio pursuant to an agreement with New York Life Investments. These services include calculating the daily NAVs of the Portfolio, maintaining the general ledger and sub-ledger accounts for the calculation of the Portfolio's NAVs, and assisting New York Life Investments in conducting various aspects of the Portfolio's administrative operations. For providing these services to the Portfolio, JPMorgan is compensated by New York Life Investments.
Prior to February 22, 2021, these services were provided by State Street.
Pursuant to an agreement between the Fund and New York Life Investments, New York Life Investments is responsible for providing or procuring certain regulatory reporting services for the Portfolio. The Portfolio will reimburse New York Life Investments for the actual costs incurred by New York Life Investments in connection with providing or procuring these services for the Portfolio.
(B) Distribution and Service Fees. The Fund, on behalf of the Portfolio, has entered into a distribution agreement with NYLIFE Distributors LLC (the “Distributor”), an affiliate of New York Life Investments. The Portfolio has adopted a distribution plan (the “Plan”) in accordance with the provisions of Rule 12b-1 under the 1940 Act. Under the Plan, the Distributor has agreed to provide, through its affiliates or independent third parties, various distribution-related, shareholder and administrative support services to the Service Class shareholders. For its services, the Distributor is entitled to a combined distribution and service fee accrued daily and paid monthly at an annual rate of 0.25% of the average daily net assets attributable to the Service Class shares of the Portfolio.
(C) Investments in Affiliates (in 000’s). During the six-month period ended June 30, 2021, purchases and sales transactions, income earned from investments and shares held of investment companies managed by New York Life Investments or its affiliates were as follows:
| Affiliated Investment Companies | Value,
Beginning
of Period | Purchases
at Cost | Proceeds
from
Sales | Net
Realized
Gain/(Loss)
on Sales | Change in
Unrealized
Appreciation/
(Depreciation) | Value,
End of
Period | Dividend
Income | Other
Distributions | Shares
End of
Period |
| MainStay U.S. Government Liquidity Fund | $ — | $ 9,986 | $ (4,915) | $ — | $ — | $ 5,071 | $ —(a) | $ — | 5,071 |
| 34 | MainStay VP Balanced Portfolio |
Note 4-Federal Income Tax
As of June 30, 2021, the cost and unrealized appreciation (depreciation) of the Portfolio’s investment portfolio, including applicable derivative contracts and other financial instruments, as determined on a federal income tax basis, were as follows:
| | Federal Tax
Cost | Gross
Unrealized
Appreciation | Gross
Unrealized
(Depreciation) | Net
Unrealized
Appreciation/
(Depreciation) |
| Investments in Securities | $373,685,880 | $13,598,102 | $(3,270,357) | $10,327,745 |
During the year ended December 31, 2020, the tax character of distributions paid as reflected in the Statements of Changes in Net Assets was as follows:
| | 2020 |
| Distributions paid from: | |
| Ordinary Income | $10,837,122 |
| Long-Term Capital Gains | 8,218,497 |
| Total | $19,055,619 |
Note 5–Custodian
JPMorgan is the custodian of cash and securities held by the Portfolio. Custodial fees are charged to the Portfolio based on the Portfolio's net assets and/or the market value of securities held by the Portfolio and the number of certain transactions incurred by the Portfolio.
Prior to February 22, 2021, these services were provided by State Street. The services provided by State Street were a direct expense of the Portfolio and are included in the Statement of Operations as Custodian fees which totaled $6,438 for the period January 1, 2021 through February 21, 2021.
Note 6–Line of Credit
The Portfolio and certain other funds managed by New York Life Investments maintain a line of credit with a syndicate of banks in order to secure a source of funds for temporary purposes to meet unanticipated or excessive redemption requests.
Effective July 27, 2021, under the credit agreement (the “Credit Agreement”), the aggregate commitment amount is $600,000,000 with an additional uncommitted amount of $100,000,000. The commitment fee is an annual rate of 0.15% of the average commitment amount payable quarterly, regardless of usage, to JPMorgan, who serves as the agent to the syndicate. The commitment fee is allocated among the Portfolio and certain other funds managed by New York Life Investments based upon their respective net assets and other factors. Interest on any revolving credit loan is charged based upon the Federal Funds Rate or the one-month London Interbank Offered Rate ("LIBOR"), whichever is higher. The Credit Agreement expires on July 26, 2022, although the Portfolio, certain other funds managed by New York Life Investments and the
syndicate of banks may renew the Credit Agreement for an additional year on the same or different terms or enter into a credit agreement with a different syndicate of banks. Prior to July 27, 2021, the aggregate commitment amount and the commitment fee were the same as those under the current Credit Agreement. During the six-month period ended June 30, 2021, there were no borrowings made or outstanding with respect to the Portfolio under the Credit Agreement.
Note 7–Interfund Lending Program
Pursuant to an exemptive order issued by the SEC, the Portfolio, along with certain other funds managed by New York Life Investments, may participate in an interfund lending program. The interfund lending program provides an alternative credit facility that permits the Portfolio and certain other funds managed by New York Life Investments to lend or borrow money for temporary purposes directly to or from one another, subject to the conditions of the exemptive order. During the six-month period ended June 30, 2021, there were no interfund loans made or outstanding with respect to the Portfolio.
Note 8–Purchases and Sales of Securities (in 000’s)
During the six-month period ended June 30, 2021, purchases and sales of U.S. government securities were $225,575 and $202,948, respectively. Purchases and sales of securities, other than U.S. government securities and short-term securities, were $142,992 and $172,785 respectively.
Note 9–Capital Share Transactions
Transactions in capital shares for the six-month period ended June 30, 2021 and the year ended December 31, 2020, were as follows:
| Initial Class | Shares | Amount |
| Period ended June 30, 2021: | | |
| Shares sold | 67,637 | $ 1,058,935 |
| Shares redeemed | (58,842) | (938,328) |
| Net increase (decrease) | 8,795 | $ 120,607 |
| Year ended December 31, 2020: | | |
| Shares sold | 86,898 | $ 1,207,655 |
| Shares issued to shareholders in reinvestment of distributions | 73,825 | 1,017,200 |
| Shares redeemed | (189,520) | (2,605,835) |
| Net increase (decrease) | (28,797) | $ (380,980) |
| |
Notes to Financial Statements (Unaudited) (continued)
| Service Class | Shares | Amount |
| Period ended June 30, 2021: | | |
| Shares sold | 790,612 | $ 12,471,012 |
| Shares redeemed | (1,076,212) | (16,619,216) |
| Net increase (decrease) | (285,600) | $ (4,148,204) |
| Year ended December 31, 2020: | | |
| Shares sold | 1,840,287 | $ 25,402,335 |
| Shares issued to shareholders in reinvestment of distributions | 1,322,542 | 18,038,419 |
| Shares redeemed | (6,305,685) | (84,246,754) |
| Net increase (decrease) | (3,142,856) | $(40,806,000) |
Note 10–Other Matters
An outbreak of COVID-19, first detected in December 2019, has developed into a global pandemic and has resulted in travel restrictions, closure of international borders, certain businesses and securities markets, restrictions on securities trading activities, prolonged quarantines, supply chain disruptions, and lower consumer demand, as well as general concern and uncertainty. The continued impact of COVID-19 and related new variants is uncertain and could further adversely affect the global economy, national economies, individual issuers and capital markets in unforeseeable ways and result in a substantial and extended economic downturn. Developments that disrupt global economies and financial markets, such as COVID-19, may magnify factors that affect the Portfolio's performance.
Note 11–Subsequent Events
In connection with the preparation of the financial statements of the Portfolio as of and for the six-month period ended June 30, 2021, events and transactions subsequent to June 30, 2021, through the date the financial statements were issued have been evaluated by the Manager for possible adjustment and/or disclosure. No subsequent events requiring financial statement adjustment or disclosure have been identified.
| 36 | MainStay VP Balanced Portfolio |
Board Consideration and Approval of Subadvisory Agreement with Wellington Management Company LLP (Unaudited)
The Subadvisory Agreement between New York Life Investment Management LLC (“New York Life Investments”) and Wellington Management Company LLP (“Wellington”) with respect to the MainStay VP Balanced Portfolio (“Portfolio”) (“New Subadvisory Agreement”), must be approved initially and, following an initial term of up to two years, is subject to annual review and approval by the Board of Trustees of MainStay VP Funds Trust (“Board” of the “Trust”) in accordance with Section 15 of the Investment Company Act of 1940, as amended (“1940 Act”). At its February 3, 2021 meeting, the Board, including the Trustees who are not an “interested person” (as such term is defined in the 1940 Act) of the Trust (“Independent Trustees”) voting separately, unanimously approved the New Subadvisory Agreement for an initial two-year period.
At meetings held on January 21, January 25 and February 3, 2021, the Board considered and approved New York Life Investments’ recommendations to appoint Wellington as a subadvisor to the Portfolio, to approve the New Subadvisory Agreement, to approve the related changes to the Portfolio’s principal investment strategies and investment process and to approve a reduction of the contractual management fee for the Portfolio (the “Repositioning”), all effective on or about May 1, 2021. The Board noted that the material terms of the New Subadvisory Agreement are substantially identical to the terms of the then-current subadvisory agreement with MacKay Shields LLC (“MacKay”) with respect to the Portfolio, but that the subadvisory fee schedule under the New Subadvisory Agreement with Wellington includes fees that are lower at every level of assets than the subadvisory fees paid to MacKay under the then-current subadvisory agreement.
In reaching the decisions to approve the Repositioning and New Subadvisory Agreement, the Board considered information furnished by New York Life Investments and Wellington in connection with meetings of the Board and its Contracts, Investment and Risk and Compliance Oversight Committees held on January 21, January 25 and February 3, 2021, as well as other information furnished to the Board and its Committees throughout the year, as deemed relevant by the Trustees. The Board also considered information on the fees charged to other investment advisory clients of Wellington that follow investment strategies similar to those proposed for the Portfolio, as repositioned, and, when applicable, the rationale for any differences in the Portfolio’s proposed subadvisory fee and the fees charged to those other investment advisory clients. In addition, the Board considered information previously provided to the Board in connection with its review of the subadvisory agreements for other funds in the MainStay Group of Funds, as deemed relevant to each Trustee. The Board also considered information furnished by Wellington in response to requests prepared on behalf of the Board, and in consultation with the Independent Trustees, by independent legal counsel to the Independent Trustees, which encompassed a variety of topics, including those summarized below.
The Board took into account information provided in connection with its meetings throughout the year, including, among other items, information regarding the legal standards and fiduciary obligations applicable to its consideration of the New Subadvisory Agreement and investment performance reports on the Portfolio as well as presentations from New
York Life Investments and Wellington personnel. The contract review process, including the structure and format for materials provided to the Board, has been developed in consultation with the Board. The Independent Trustees also met in executive sessions with their independent legal counsel and, for a portion thereof, with senior management of New York Life Investments.
In considering the Repositioning and the New Subadvisory Agreement, the Trustees reviewed and evaluated the information and factors they believed to reasonably be necessary and appropriate in light of legal advice furnished to them by independent legal counsel and through the exercise of their own business judgment. Although individual Trustees may have weighed certain factors or information differently, the factors considered by the Board are described in greater detail below and include, among other factors: (i) the nature, extent and quality of the services to be provided to the Portfolio by Wellington; (ii) the investment performance of the Portfolio, the qualifications of the proposed portfolio managers of the Portfolio and the historical investment performance of products managed by such portfolio managers with investment strategies similar to those of the Portfolio, as repositioned; (iii) the anticipated costs of the services to be provided, and profits expected to be realized, by Wellington from its relationship with the Portfolio; (iv) the extent to which economies of scale may be realized if the Portfolio grows and the extent to which economies of scale may benefit the Portfolio’s shareholders; and (v) the reasonableness of the Portfolio’s proposed subadvisory fee to be paid by New York Life Investments to Wellington and estimated total ordinary operating expenses. Although the Board recognized that comparisons between the Portfolio’s proposed fees and estimated expenses and those of other funds are imprecise given different terms of agreements, variations in fund strategies and other factors, the Board considered the reasonableness of the Portfolio’s proposed fees and estimated total ordinary operating expenses as compared to the peer funds identified by New York Life Investments.
Although individual Trustees may have weighed certain factors or information differently, the Board’s decisions to approve the Repositioning and the New Subadvisory Agreement were based on a consideration of the information provided to the Trustees throughout the year, such as presentations from Wellington personnel, as well as information furnished specifically in connection with the contract review process for the Portfolio, in each case as deemed relevant to each Trustee. The Trustees noted that, throughout the year, the Trustees would be afforded an opportunity to ask questions of, and request additional information or materials from, New York Life Investments and Wellington with respect to the Portfolio. The Board took note of New York Life Investments’ belief that Wellington, with its resources and historical investment performance track record for strategies similar to those of the Portfolio, as repositioned, is well qualified to serve as a subadvisor to the Portfolio. In addition to considering the above-referenced factors, the Board observed that in the marketplace, notably under variable life insurance policies and variable annuity contracts for which the Portfolio serves as an investment
Board Consideration and Approval of Subadvisory Agreement with Wellington Management Company LLP (Unaudited) (continued)
option, there are a range of investment options available to the Portfolio’s shareholders and such shareholders, having had the opportunity to consider other investment options, have chosen to invest in the Portfolio.
The factors that figured prominently in the Board’s decisions to approve the Repositioning and the New Subadvisory Agreement are summarized in more detail below, and the Board did not consider any factor or information controlling in reaching such decisions.
Nature, Extent and Quality of Services to be Provided by Wellington
In considering the Repositioning and the New Subadvisory Agreement, the Board considered New York Life Investments’ responsibilities as manager of the Portfolio, noting that New York Life Investments is responsible for supervising the Portfolio’s subadvisors. The Board examined the nature, extent and quality of the investment advisory services that Wellington proposed to provide to the Portfolio. Further, the Board evaluated and/or examined the following with regard to Wellington:
| • | experience in providing investment advisory services; |
| • | experience in serving as advisor or subadvisor to other funds with similar strategies as those of the Portfolio, as repositioned, and the performance track record of those funds; |
| • | experience of investment advisory, senior management and administrative personnel; |
| • | overall legal and compliance environment, resources and history and policies and procedures in place with respect to matters that may involve conflicts of interest between the Portfolio’s investments and those of other accounts managed by Wellington; |
| • | New York Life Investments’ and Wellington’s belief that their respective compliance policies, procedures and systems are reasonably designed to prevent violation of the federal securities laws and their commitment to further developing and strengthening compliance programs relating to the MainStay Group of Funds generally and the Portfolio specifically; |
| • | ability to attract and retain qualified investment professionals and willingness to invest in personnel to service and support the Portfolio; |
| • | portfolio construction and risk management processes; |
| • | experience of the Portfolio’s proposed portfolio managers, including with respect to investment strategies similar to those of the Portfolio, as repositioned, the number of accounts managed by the portfolio managers and the method for compensating the portfolio managers; and |
| • | overall reputation, financial condition and assets under management. |
Based on these considerations, the Board concluded that the Portfolio would likely benefit from the nature, extent and quality of the proposed investment advisory services to be provided by Wellington.
Investment Performance
In evaluating the Portfolio’s investment performance, the Board considered investment performance results over various periods in light of the Portfolio’s investment objective, strategies and risks. The Board considered investment reports on, and analysis of, the Portfolio’s performance provided to the Board throughout the year. These reports include, among other items, information on the Portfolio’s gross and net returns, the Portfolio’s investment performance compared to relevant investment categories and the Portfolio’s benchmarks, the Portfolio’s risk-adjusted investment performance and the Portfolio’s investment performance as compared to peer funds, as appropriate, as well as portfolio attribution information and commentary on the effect of market conditions.
The Board also gave weight to its discussions with senior management at New York Life Investments concerning the Portfolio’s investment performance and remediation efforts undertaken by New York Life Investments, and other alternatives to the Repositioning, and the New Subadvisory Agreement considered by New York Life Investments. In addition, the Board considered steps taken to seek to improve the Portfolio’s investment performance and discussions between the Portfolio’s current portfolio management team and the Investment Committee of the Board. The Board further considered that shareholders may benefit from Wellington’s investment process, including its portfolio construction and risk management processes. The Board noted that the Repositioning had not yet been implemented so an investment performance track record for the Portfolio, as repositioned, was not available.
The Board evaluated the Portfolio’s proposed portfolio management team, investment process, strategies and risks. The Board noted that Wellington currently manages one or more portfolios with investment strategies similar to those of the Portfolio, as repositioned. Additionally, the Board considered the historical performance of such portfolio or portfolios and other portfolios managed by the proposed portfolio managers for the Portfolio. Based on these considerations, the Board concluded that the Portfolio was likely to be managed responsibly and capably by Wellington.
Based on these considerations, the Board concluded that the selection of Wellington as a subadvisor to the Portfolio is likely to benefit the Portfolio’s long-term investment performance.
Costs of the Services to be Provided, and Profits to be Realized, by Wellington
The Board considered the anticipated costs of the services to be provided by Wellington under the New Subadvisory Agreement and the profits expected to be realized by Wellington due to its relationship with the Portfolio. The Board considered that Wellington’s subadvisory fee had been negotiated at arm’s-length by New York Life Investments and that these fees would be paid by New York Life Investments, not the Portfolio.
| 38 | MainStay VP Balanced Portfolio |
In evaluating the anticipated costs of the services to be provided by Wellington and profits expected to be realized by Wellington, the Board considered, among other factors, Wellington’s investments in, or willingness to invest in, personnel, systems, equipment and other resources and infrastructure to support and further enhance the services proposed to be provided to the Portfolio, and that New York Life Investments would be responsible for paying the subadvisory fee to Wellington. The Board also considered the financial resources of Wellington and acknowledged that Wellington must be in a position to attract and retain experienced professional personnel and to maintain a strong financial position for Wellington to be able to provide high-quality services to the Portfolio. The Board also considered that New York Life Investments proposed to reduce the contractual management fee for the Portfolio.
In considering anticipated costs and profitability, the Board also considered certain fall-out benefits that may be realized by Wellington due to its relationship with the Portfolio, including reputational and other indirect benefits. The Board recognized, for example, the potential benefits to Wellington from legally permitted “soft-dollar” arrangements by which brokers would provide research and other services to Wellington in exchange for commissions paid by the Portfolio with respect to trades in the Portfolio’s portfolio securities. In addition, the Board also requested and received information from New York Life Investments concerning other material business relationships between Wellington and its affiliates and New York Life Investments and its affiliates, and considered the existence of a strategic partnership between New York Life Investments and Wellington that relates to certain current and future products that represented a conflict of interest associated with New York Life Investments’ recommendation to approve the Repositioning and the New Subadvisory Agreement.
The Board took into account the fact that the Portfolio would undergo changes to its principal investment strategies in connection with the Repositioning. The Board noted estimates from New York Life Investments and Wellington that a significant portion of the holdings of the Portfolio would be sold to align the Portfolio’s holdings with the strategies that would be pursued by Wellington. Additionally, the Board considered New York Life Investments’ representation that New York Life Investments would work closely with Wellington to seek to execute the optimal transition strategy and that New York Life Investments would make every effort to minimize potential direct and indirect costs associated with the Repositioning.
The Board considered that any profits realized by Wellington due to its relationship with the Portfolio would be the result of arm’s-length negotiations between New York Life Investments and Wellington, acknowledging that any such profits would be based on fees paid to Wellington by New York Life Investments, not the Portfolio.
Subadvisory Fee and Estimated Total Ordinary Operating Expenses
The Board evaluated the reasonableness of the fee to be paid under the New Subadvisory Agreement and the Portfolio’s estimated total ordinary operating expenses. The Board primarily considered the reasonableness of the management fee to be paid by the Portfolio to New York Life Investments because the subadvisory fee to be paid to Wellington would be paid by New York Life Investments, not the Portfolio. The Board also considered the reasonableness of the subadvisory fee to be paid by New York Life Investments and the amount of the management fee expected to be retained by New York Life Investments.
In assessing the reasonableness of the Portfolio’s proposed fees and estimated expenses, the Board considered information provided by New York Life Investments on fees and expenses of peer funds, and the Board considered information provided by Wellington on fees charged to other investment advisory clients, including institutional separate accounts and/or other funds that follow investment strategies similar to those of the Portfolio, as repositioned. The Board considered the similarities and differences in the contractual fee schedules of the Portfolio and these similarly-managed accounts and/or funds, taking into account the rationale for any differences in fee schedules and noted that New York Life Investments proposed to reduce the Portfolio’s contractual management fee. The Board also considered that in proposing fees for the Portfolio, New York Life Investments considers the competitive marketplace for mutual funds.
Based on the factors outlined above, the Board concluded that the Portfolio’s management fee and total ordinary operating expenses were within a range that is competitive and support a conclusion that these fees and expenses are reasonable.
Economies of Scale
The Board considered information regarding economies of scale, including whether the Portfolio’s proposed expense structure would permit economies of scale to be appropriately shared with the Portfolio’s beneficial shareholders. The Board also considered a report from New York Life Investments, previously prepared at the request of the Board, that addressed economies of scale, including with respect to the mutual fund business generally and the various ways in which the benefits of economies of scale may be shared with the funds in the MainStay Group of Funds. Although the Board recognized the difficulty of determining economies of scale with precision, the Board acknowledged that economies of scale may be shared with the Portfolio in a number of ways, including, for example, through the imposition of fee breakpoints, initially setting management fee rates at scale or making additional investments to enhance services.
Based on this information, the Board concluded that economies of scale are appropriately reflected for the benefit of the Portfolio’s beneficial shareholders through the Portfolio’s proposed expense structure and other methods to share benefits from economies of scale.
Board Consideration and Approval of Subadvisory Agreement with Wellington Management Company LLP (Unaudited) (continued)
Conclusion
On the basis of the information and factors summarized above, among other information and factors deemed relevant by the Trustees, and the evaluation thereof, the Board, including the Independent Trustees voting separately, unanimously voted to approve the Repositioning and the New Subadvisory Agreement.
| 40 | MainStay VP Balanced Portfolio |
Discussion of the Operation and Effectiveness of the Portfolio's Liquidity Risk Management Program (Unaudited)
In compliance with Rule 22e-4 under the Investment Company Act of 1940, as amended (the “Liquidity Rule”), the Portfolio has adopted and implemented a liquidity risk management program (the “Program”), which New York Life Investment Management LLC believes is reasonably designed to assess and manage the Portfolio's liquidity risk (the risk that the Portfolio could not meet requests to redeem shares issued by the Portfolio without significant dilution of remaining investors’ interests in the Portfolio). The Board of Trustees of MainStay VP Funds Trust (the "Board") designated New York Life Investment Management LLC as administrator of the Program (the “Administrator”). The Administrator has established a Liquidity Risk Management Committee to assist the Administrator in the implementation and day-to-day administration of the Program and to otherwise support the Administrator in fulfilling its responsibilities under the Program.
At a meeting of the Board held on March 8, 2021, the Administrator provided the Board with a written report addressing the Program’s operation and assessing its adequacy and effectiveness of implementation for the period from January 1, 2020 through December 31, 2020 (the "Review Period"), as required under the Liquidity Rule. The report noted that the Administrator concluded that (i) the Program operated effectively to assess and manage the Portfolio's liquidity risk, (ii) the Program has been adequately and effectively implemented to monitor and, as applicable, respond to the Portfolio's liquidity developments and (iii) the Portfolio's investment strategy continues to be appropriate for an open-end fund. In addition, the report discussed notable events that impacted liquidity risk during the Review Period, including the COVID-19 pandemic and the resulting economic shutdown.
In accordance with the Program, the Portfolio's liquidity risk is assessed no less frequently than annually taking into consideration certain factors, as applicable, such as (i) investment strategy and liquidity of portfolio investments, (ii) short-term and long-term cash flow projections and (iii) holdings of cash and cash equivalents, as well as borrowing arrangements and other funding sources. Certain factors are considered under both normal and reasonably foreseeable stressed conditions.
Each Portfolio portfolio investment is classified into one of four liquidity categories. The classification is based on a determination of the number of days it is reasonably expected to take to convert the investment into cash, or sell or dispose of the investment, in current market conditions without significantly changing the market value of the investment. The Administrator has delegated liquidity classification determinations to the Portfolio’s subadvisors, subject to appropriate oversight by the Administrator, and classification determinations are made by taking into account the Portfolio's reasonably anticipated trade size, various market, trading and investment-specific considerations, as well as market depth, and, in certain cases, third-party vendor data.
The Liquidity Rule requires portfolios that do not primarily hold assets that are highly liquid investments to adopt a minimum amount of net assets that must be invested in highly liquid investments that are assets (an “HLIM”). In addition, the Liquidity Rule limits a portfolio's investments in illiquid investments. Specifically, the Liquidity Rule prohibits acquisition of illiquid investments if doing so would result in a portfolio holding more than 15% of its net assets in illiquid investments that are assets. The Program includes provisions reasonably designed to determine, periodically review and comply with the HLIM requirement, as applicable, and to comply with the 15% limit on illiquid investments.
There can be no assurance that the Program will achieve its objectives under all circumstances in the future. Please refer to the Portfolio's prospectus for more information regarding the Portfolio's exposure to liquidity risk and other risks to which it may be subject.
Proxy Voting Record
The Portfolio is required to file with the SEC its proxy voting records for the 12-month period ending June 30 on Form N-PX. The Portfolio's most recent Form N-PX or proxy voting record is available free of charge upon request (i) by calling 800-598-2019; (ii) by visiting New York Life Investments’ website at https://www.nylinvestments.com/mainstay/
products-and-performance/mainstay-vp-funds-trust; or (iii) by visiting the SEC’s website at www.sec.gov.
Shareholder Reports and Quarterly Portfolio Disclosure
The Portfolio is required to file with the SEC its proxy voting records for the 12-month period ending June 30 on Form N-PX. The Portfolio's most recent Form N-PX or proxy voting record is available free of charge upon request (i) by calling 800-598-2019; (ii) by visiting New York Life Investments’ website at https://www.nylinvestments.com/mainstay/
products-and-performance/mainstay-vp-funds-trust; or (iii) by visiting the SEC’s website at www.sec.gov.
| 42 | MainStay VP Balanced Portfolio |
MainStay VP Portfolios
MainStay VP offers a wide range of Portfolios. The full array of MainStay VP offerings is listed here, with information about the manager, subadvisors, legal counsel, and independent registered public accounting firm.
Equity
MainStay VP Candriam Emerging Markets Equity Portfolio
MainStay VP Epoch U.S. Equity Yield Portfolio
MainStay VP Fidelity Institutional AM® Utilities Portfolio†
MainStay VP MacKay International Equity Portfolio
MainStay VP MacKay S&P 500 Index Portfolio
MainStay VP Natural Resources Portfolio
MainStay VP Small Cap Growth Portfolio
MainStay VP T. Rowe Price Equity Income Portfolio
MainStay VP Wellington Growth Portfolio
MainStay VP Wellington Mid Cap Portfolio
MainStay VP Wellington Small Cap Portfolio
MainStay VP Wellington U.S. Equity Portfolio
MainStay VP Winslow Large Cap Growth Portfolio
Mixed Asset
MainStay VP Balanced Portfolio
MainStay VP Income Builder Portfolio
MainStay VP Janus Henderson Balanced Portfolio
MainStay VP MacKay Convertible Portfolio
Income
MainStay VP Bond Portfolio
MainStay VP Floating Rate Portfolio
MainStay VP Indexed Bond Portfolio
MainStay VP MacKay Government Portfolio
MainStay VP MacKay High Yield Corporate Bond Portfolio
MainStay VP MacKay Strategic Bond Portfolio
MainStay VP PIMCO Real Return Portfolio
Money Market
MainStay VP U.S. Government Money Market Portfolio
Alternative
MainStay VP CBRE Global Infrastructure Portfolio
MainStay VP IQ Hedge Multi-Strategy Portfolio
Asset Allocation
MainStay VP Conservative Allocation Portfolio
MainStay VP Equity Allocation Portfolio
MainStay VP Growth Allocation Portfolio
MainStay VP Moderate Allocation Portfolio
Manager
New York Life Investment Management LLC
New York, New York
Subadvisors
Brown Advisory LLC
Baltimore, Maryland
Candriam Belgium S.A.*
Brussels, Belgium
CBRE Clarion Securities LLC
Radnor, Pennsylvania
Epoch Investment Partners, Inc.
New York, New York
FIAM LLC
Smithfield, Rhode Island
IndexIQ Advisors LLC*
New York, New York
Janus Capital Management LLC
Denver, Colorado
MacKay Shields LLC*
New York, New York
Mellon Investments Corporation
Boston, Massachusetts
NYL Investors LLC*
New York, New York
Pacific Investment Management Company LLC
Newport Beach, California
Segall Bryant & Hamill, LLC
Chicago, Illinois
T. Rowe Price Associates, Inc.
Baltimore, Maryland
Wellington Management Company LLP
Boston, Massachusetts
Winslow Capital Management, LLC
Minneapolis, Minnesota
Legal Counsel
Dechert LLP
Washington, District of Columbia
Independent Registered Public Accounting Firm
PricewaterhouseCoopers LLP
New York, New York
Distributor
NYLIFE Distributors LLC*
Jersey City, New Jersey
Custodian
JPMorgan Chase Bank, N.A.
New York, New York
Some Portfolios may not be available in all products.
† Fidelity Institutional AM is a registered trade mark of FMR LLC. Used with permission.
* An affiliate of New York Life Investment Management LLC
Not part of the Semiannual Report
2021 Semiannual Report
This report is for the general information of New York Life Variable Annuities and NYLIAC Variable Universal Life Insurance Products policyowners. It must be preceded or accompanied by the appropriate product(s) and funds prospectuses if it is given to anyone who is not an owner of a New York Life variable annuity policy or a NYLIAC Variable Universal Life Insurance Product. This report does not offer for sale or solicit orders to purchase securities.
The performance data quoted in this report represents past performance. Past performance is no guarantee of future results. Due to market volatility and other factors, current performance may be lower or higher than the figures shown. The most recent month-end performance summary for your variable annuity or variable life policy is available by calling 800-598-2019 and is updated periodically on newyorklife.com.
The New York Life Variable Annuities and NYLIAC Variable Universal Life Insurance Products are issued by New York Life Insurance and Annuity Corporation (a Delaware Corporation) and distributed by NYLIFE Distributors LLC (Member FINRA/SIPC).
New York Life Insurance Company
New York Life Insurance and Annuity
Corporation (NYLIAC) (A Delaware Corporation)
51 Madison Avenue, Room 551
New York, NY 10010
newyorklife.com
nylinvestments.com
NYLIFE Distributors LLC, 30 Hudson Street, Jersey City, NJ 07302
New York Life Investment Management LLC is the investment manager to the MainStay VP Funds Trust
©2021 by NYLIFE Distributors LLC. All rights reserved.
You may obtain copies of the Prospectus and the Statement of Additional Information free of charge, upon request, by calling toll-free 800-598-2019 or writing to New York Life Insurance and Annuity Corporation, 51 Madison Avenue, New York, NY 10010.
| Not FDIC Insured | No Bank Guarantee | May Lose Value |
(NYLIAC) NI508
MainStay VP Bond Portfolio
Message from the President and Semiannual Report
Unaudited | June 30, 2021
Sign up for e-delivery of your shareholder reports. For full details on e-delivery, including who can participate and what you can receive via e-delivery,
please log in to newyorklifeinvestments.com/accounts.
| Not FDIC/NCUA Insured | Not a Deposit | May Lose Value | No Bank Guarantee | Not Insured by Any Government Agency |
This page intentionally left blank
Message from the President
The COVID-19 pandemic continued to afflict our personal lives and broad segments of the U.S. and global economy throughout the six-month reporting period ended June 30, 2021. However, with the deployment of multiple vaccines around the world, including three highly effective versions approved for emergency use in the United States, investors began to turn their attention toward the gradual reopening of the economy and the shape the “new normal” would take.
The first half of the reporting period saw increasing inflationary concerns as fiscal stimulus business reopenings drove accelerating economic growth, rising commodity prices and increased consumer spending. However, the U.S. Federal Reserve noted that price increases were likely to prove temporary and made clear their intention to remain accommodative for the foreseeable future. Accordingly, after moving higher in the first quarter of 2021, interest rates declined in the second quarter.
In response to the uncertain inflation outlook, equity market leadership shifted from value in the first quarter of the year to growth in the second quarter. Nevertheless, investor sentiment remained buoyant throughout the reporting period, with all eleven sectors in the S&P 500® Index, a widely regarded benchmark of market performance, producing positive returns. Energy led the market’s rise fueled by rapidly increasing oil and gas prices, followed by financials and real estate, which benefited from rising interest rates and the economic reopening, respectively. Communication services produced the slowest growth, followed by the traditionally defensive utilities and consumer staples
sectors. In the fixed income market, lower-credit-quality issues tended to outperform their higher-grade counterparts, with high-yield corporate bonds generating the strongest performance. Among securitized products, commercial mortgage-backed securities generally produced the strongest returns, followed by mortgage-backed securities and asset-backed securities, while Treasury securities lagged.
Despite the tremendous progress we’ve seen so far this year, the United States and the world continue to face significant pandemic-related challenges. Newer, more contagious variants of COVID-19 threaten the return of restrictions and lockdowns that could stall the economic recovery. At the same time, supply chain shortages have led to rising prices on everything from laptops to autos, stoking fears of uncontrolled inflation despite reassurance from the U.S. Federal Reserve. At New York Life Investments, we recognize that the shape that the “new normal” eventually takes may differ from our expectations. You can depend on us to keep a sharp watch for the unexpected, and to continue to help you find your way through this rapidly evolving investment landscape.
Sincerely,
Kirk C. Lehneis
President
The opinions expressed are as of the date of this report and are subject to change. There is no guarantee that any forecast made will come to pass. This material does not constitute investment advice and is not intended as an endorsement of any specific investment. Past performance is no guarantee of future results.
Not part of the Semiannual Report
Investors should refer to the Portfolio’s Summary Prospectus and/or Prospectus and consider the Portfolio’s investment objectives, strategies, risks, charges and expenses carefully before investing. The Summary Prospectus and/or Prospectus contain this and other information about the Portfolio. You may obtain copies of the Portfolio’s Summary Prospectus and/or the Prospectus and the Statement of Additional Information free of charge, upon request, by calling toll-free 800-598-2019, by writing to New York Life Insurance and Annuity Corporation, 51 Madison Avenue, Room 251, New York, New York 10010 or by sending an email to MainStayShareholdersServices@nylim.com. These documents are also available at nylinvestments.com/vpdocuments. Please read the Portfolio's Summary Prospectus and/or Prospectus carefully before investing. MainStay VP Funds Trust portfolios are separate account options which are purchased through a variable insurance or variable annuity contract.
Investment and Performance Comparison (Unaudited)
Performance data quoted represents past performance. Past performance is no guarantee of future results. Because of market volatility and other factors, current performance may be lower or higher than the figures shown. Investment return and principal value will fluctuate, and as a result, when shares are redeemed, they may be worth more or less than their original cost. The performance table and graph do not reflect any deduction of sales charges, mortality and expense charges, contract charges or administrative charges. Please refer to the Performance Summary appropriate for your policy. For performance information current to the most recent month-end, please call 800-598-2019 or visit www.newyorklife.com.
Performance figures may reflect certain fee waivers and/or expense limitations, without which total returns may have been different. For information on current fee waivers and/or expense limitations (if any), please refer to the Notes to Financial Statements.
| Average Annual Total Returns for the Period-Ended June 30, 2021 |
| Class | Inception
Date | Six
Months | One
Year | Five
Years | Ten
Years | Gross
Expense
Ratio1 |
| Initial Class Shares | 1/23/1984 | -1.17% | 1.11% | 3.19% | 3.51% | 0.53% |
| Service Class Shares | 6/4/2003 | -1.30 | 0.86 | 2.93 | 3.25 | 0.78 |
| 1. | The gross expense ratios presented reflect the Portfolio’s “Total Annual Portfolio Operating Expenses” from the most recent Prospectus, as supplemented, and may differ from other expense ratios disclosed in this report. |
| Benchmark Performance | Six
Months | One
Year | Five
Years | Ten
Years |
| Bloomberg Barclays U.S. Aggregate Bond Index1 | -1.60% | -0.33% | 3.03% | 3.39% |
| Morningstar Intermediate Core Bond Category Average2 | -1.25 | 0.61 | 3.15 | 3.37 |
| 1. | The Bloomberg Barclays U.S. Aggregate Bond Index is the Portfolio's primary benchmark. The Bloomberg Barclays U.S. Aggregate Bond Index is a broad-based benchmark that measures performance of the investment-grade, U.S. dollar denominated, fixed-rate taxable bond market, including Treasurys, government-related and corporate securities, mortgage-backed securities (agency fixed-rate and hybrid adjustable-rate mortgage pass-throughs), asset-backed securities and commercial mortgage-backed securities. Results assume reinvestment of all dividends and capital gains. An investment cannot be made directly in an index. |
| 2. | The Morningstar Intermediate Core Bond Category Average is representative of funds that invest primarily in investment-grade U.S. fixed-income issues including government, corporate, and securitized debt, and hold less than 5% in below-investment-grade exposures. Their durations (a measure of interest-rate sensitivity) typically range between 75% and 125% of the three-year average of the effective duration of the Morningstar Core Bond Index. Results are based on average total returns of similar funds with all dividends and capital gain distributions reinvested. |
Cost in Dollars of a $1,000 Investment in MainStay VP Bond Portfolio (Unaudited)
The example below is intended to describe the fees and expenses borne by shareholders during the six-month period from January 1, 2021 to June 30, 2021, and the impact of those costs on your investment.
Example
As a shareholder of the Portfolio you incur two types of costs: (1) transaction costs, including exchange fees and sales charges (loads) on purchases (as applicable), and (2) ongoing costs, including management fees, distribution and/or service (12b-1) fees, and other Portfolio expenses (as applicable). This example is intended to help you understand your ongoing costs (in dollars) of investing in the Portfolio and to compare these costs with the ongoing costs of investing in other mutual funds. The example is based on an investment of $1,000 made at the beginning of the six-month period and held for the entire period from January 1, 2021 to June 30, 2021. Shares are only sold in connection with variable life and annuity contracts and the example does not reflect any contract level or transactional fees or expenses. If these costs had been included, your costs would have been higher.
This example illustrates your Portfolio’s ongoing costs in two ways:
Actual Expenses
The second and third data columns in the table below provide information about actual account values and actual expenses. You may use the information in these columns, together with the amount you invested, to estimate the expenses that you paid during the six months ended June
30, 2021. Simply divide your account value by $1,000 (for example, an $8,600 account value divided by $1,000 = 8.6), then multiply the result by the number under the heading entitled “Expenses Paid During Period” to estimate the expenses you paid on your account during this period.
Hypothetical Example for Comparison Purposes
The fourth and fifth data columns in the table below provide information about hypothetical account values and hypothetical expenses based on the Portfolio’s actual expense ratio and an assumed rate of return of 5% per year before expenses, which is not the Portfolio’s actual return. The hypothetical account values and expenses may not be used to estimate the actual ending account balances or expenses you paid for the six-month period shown. You may use this information to compare the ongoing costs of investing in the Portfolio with the ongoing costs of investing in other mutual funds. To do so, compare this 5% hypothetical example with the 5% hypothetical examples that appear in the shareholder reports of the other mutual funds.
Please note that the expenses shown in the table are meant to highlight your ongoing costs only and do not reflect any transactional costs, such as exchange fees or sales charges (loads). Therefore, the fourth and fifth data columns of the table are useful in comparing ongoing costs only and will not help you determine the relative total costs of owning different funds. In addition, if these transactional costs were included, your costs would have been higher.
| Share Class | Beginning
Account
Value
1/1/21 | Ending Account
Value (Based
on Actual
Returns and
Expenses)
6/30/21 | Expenses
Paid
During
Period1 | Ending Account
Value (Based
on Hypothetical
5% Annualized
Return and
Actual Expenses)
6/30/21 | Expenses
Paid
During
Period1 | Net Expense
Ratio
During
Period2 |
| Initial Class Shares | $1,000.00 | $988.30 | $2.56 | $1,022.22 | $2.61 | 0.52% |
| Service Class Shares | $1,000.00 | $987.00 | $3.79 | $1,020.98 | $3.86 | 0.77% |
| 1. | Expenses are equal to the Portfolio’s annualized expense ratio of each class multiplied by the average account value over the period, divided by 365 and multiplied by 181 (to reflect the six-month period). The table above represents the actual expenses incurred during the six-month period. In addition to the fees and expenses which the Portfolio bears directly, it also indirectly bears a pro rata share of the fees and expenses of the underlying funds in which it invests. Such indirect expenses are not included in the above-reported expense figures. |
| 2. | Expenses are equal to the Portfolio's annualized expense ratio to reflect the six-month period. |
| 6 | MainStay VP Bond Portfolio |
Portfolio Composition as of June 30, 2021 (Unaudited)
See Portfolio of Investments beginning on page 10 for specific holdings within these categories. The Portfolio's holdings are subject to change.
Top Ten Issuers Held as of June 30, 2021 (excluding short-term investments) (Unaudited)
| 1. | FFCB, 1.05%-2.70%, due 1/21/28–6/21/41 |
| 2. | U.S. Treasury Notes, 0.125%-1.625%, due 6/30/23–5/15/31 |
| 3. | UMBS, 30 Year, 2.00%-7.50%, due 7/1/28–6/1/51 |
| 4. | UMBS, Single Family, 30 Year, 2.00%-3.00%, due 7/25/51 |
| 5. | FHLMC, 1.28%-4.00%, due 4/30/30–6/15/48 |
| 6. | U.S. Treasury Bonds, 1.625%-1.875%, due 2/15/41–11/15/50 |
| 7. | FHLMC, Multifamily Structured Pass-Through Certificates, 0.866%-1.81%, due 3/25/30–2/25/54 |
| 8. | FHLB, 2.00%, due 5/12/31–5/27/31 |
| 9. | UMBS, 30 Year, 3.00%-3.50%, due 3/1/50–9/1/50 |
| 10. | Boeing Co. (The), 3.10%-5.15%, due 5/1/26–2/1/31 |
Portfolio Management Discussion and Analysis (Unaudited)
Answers to the questions reflect the views of Kenneth Sommer and AJ Rzad, CFA, of NYL Investors LLC, the Portfolio’s Subadvisor.
How did MainStay VP Bond Portfolio perform relative to its benchmark and peers during the six months ended June 30, 2021?
For the six months ended June 30, 2021, MainStay VP Bond Portfolio returned −1.17% for Initial Class shares and −1.30% for Service Class shares. Over the same period, both share classes outperformed the −1.60% return of the Bloomberg Barclays U.S. Aggregate Bond Index (“the Index”), which is the Portfolio’s primary benchmark. For the six months ended June 30, 2021, Initial Class shares outperformed, and Service Class shares underperformed, the −1.25% return of the Morningstar Intermediate Core Bond Category Average.1
What factors affected the Portfolio’s relative performance during the reporting period?
The Portfolio held overweight positions relative to the Index in U.S. government agencies, corporates, asset-backed securities and commercial mortgage-backed securities throughout the reporting period. To facilitate these overweight positions, the Portfolio maintained an underweight position in the U.S. Treasury sector. The corporate sector was the Portfolio’s best performing sector during the period, followed by asset-backed securities and commercial mortgage-backed securities sectors. The Portfolio’s underweight position in the mortgage-backed securities sector, particularly the agency subcomponent, also added to relative performance.
During the reporting period, how was the Portfolio’s performance materially affected by investments in derivatives?
The Portfolio’s use of derivatives was limited to interest rate derivatives used to keep the duration2 of the Portfolio in line with our target. These interest rate derivatives had a negative impact on the Portfolio's performance during the reporting period.
What was the Portfolio’s duration strategy during the reporting period?
The Portfolio maintained a duration relatively close to that of the Index. On one occasion, toward the end of the reporting period, the duration of the Portfolio was shorter than that of the Index. This strategy had a negative impact on the Portfolio’s performance. As of June 30, 2021, the effective duration of the
Portfolio was 6.50 years, compared to a duration of 6.65 years for the Index.
What specific factors, risks or market forces prompted significant decisions for the Portfolio during the reporting period?
Given our view of stretched valuations and the immense uncertainty regarding prepayments among non-agency residential mortgage-backed securities (RMBS) early in the reporting period, we reduced the Portfolio’s exposure to these assets. Throughout the reporting period, we increased the Portfolio’s allocation to commercial loan obligations (CLOs) rated AAA and AA.3 The CLO asset class was one of our highest-conviction, risk-adjusted, relative-value allocations. With interest rates at or close to multi-year lows, CLOs provided a higher yield and lower duration than most other investment-grade fixed-income assets. Within the corporate credit sector, the Portfolio held overweight allocations to the financials, industrials and utilities sectors. Near the close of the reporting period, we reduced the Portfolio’s overweight position in the corporate credit sector. The unprecedented amount of fiscal and monetary stimulus unleashed into financial markets drove option-adjusted spreads4 (OAS) on investment-grade credit to multi-year tights, reducing the attractiveness of owning certain sectors in the corporate credit universe. As of June 30, 2021, the Portfolio still maintained overweight exposure to corporate credit concentrated in those areas that we believed still offered an attractive relative-value proposition.
During the reporting period, which market segments were the strongest positive contributors to the Portfolio’s absolute performance and which market segments were particularly weak?
During the reporting period, asset-backed securities made the strongest positive contribution to the Portfolio’s absolute performance. (Contributions take weightings and total returns into account.) In the asset-backed sector, the Portfolio’s allocation to CLOs rated AAA and AA were the most accretive to absolute performance. The commercial mortgage-backed securities sector, particularly the non-agency subcomponent, made the second strongest contribution to the Portfolio’s absolute performance.
During the same period, the U.S. Treasury sector produced the weakest contribution to the Portfolio’s absolute performance. In the corporate sector, industrials and financials detracted most,
| 1. | See page 5 for more information on benchmark and peer group returns. |
| 2. | Duration is a measure of the price sensitivity of a fixed-income investment to changes in interest rates. Duration is expressed as a number of years and is considered a more accurate sensitivity gauge than average maturity. |
| 3. | An obligation rated ‘AAA’ has the highest rating assigned by Standard & Poor’s (“S&P”), and in the opinion of S&P, the obligor’s capacity to meet its financial commitment on the obligation is extremely strong. When applied to Fund holdings, ratings are based solely on the creditworthiness of the bonds in the portfolio and are not meant to represent the security or safety of the Fund. An obligation rated ‘AA’ by S&P is deemed by S&P to differ from the highest-rated obligations only to a small degree. In the opinion of S&P, the obligor's capacity to meet its financial commitment on the obligation is very strong. When applied to Fund holdings, ratings are based solely on the creditworthiness of the bonds in the portfolio and are not meant to represent the security or safety of the Fund. |
| 4. | An option-adjusted spread is the measurement of the spread of a fixed-income security rate and the risk-free rate of return, which is then adjusted to take into account an embedded option. |
| 8 | MainStay VP Bond Portfolio |
while positioning among U.S. government agencies and mortgage-backed securities detracted from absolute performance as well. In the interest rate complex, the Portfolio’s duration positioning detracted, while yield curve5 and rolldown positioning added to absolute performance.
Among the Portfolio’s corporate bond holdings, those producing the strongest absolute performance during the reporting period were issued by First Energy, United Health Group and Energy Transfer. Those with the weakest absolute performance were issued by BNP Paribas, Comcast and Apple.
Did the Portfolio make any significant purchases or sales during the reporting period?
The Portfolio’s largest purchases during the reporting period included bonds issued by multinational industrial conglomerate CK Hutchison International and aircraft leasing company Air Lease. Other significant purchases included bonds from financial services provider NTT Finance, kidney dialysis services provider Fresenium Medical Care and aircraft leasing company Aircastle.
The Portfolios most significant sale during the same period were bonds issued by Japan-based bank holding company Mizuho Financial. Other significant but smaller sales were of securities from energy infrastructure firm Kinder Morgan, energy company Exelon, Fifth Third Bank and international financial services provider Barclays.
How did the Portfolio’s sector weightings change during the reporting period?
As described in greater detail above, the Portfolio increased its exposure to RMBS and to highly rated CLOs during the reporting period. Conversely, the Portfolio trimmed its exposure to the corporate credit sector while maintaining overweight exposure in select areas in the corporate credit universe.
How was the Portfolio positioned at the end of the reporting period?
As of June 30, 2021, the Portfolio held overweight exposure relative to the Index in corporate bonds. Within the corporate sector, the Portfolio held overweight positions in financials, industrials and utilities. The Portfolio also held overweight positions in asset-backed securities, commercial mortgage-backed securities and U.S. government agencies. The
Portfolio’s largest overweight allocation among spread6 assets was to the asset-backed securities sector.
As of the same date, the Portfolio held relatively underweight positions in the sovereign, supranational, foreign agency and foreign local government sectors. The Portfolio also held underweight positions in the mortgage-backed securities and U.S. Treasury sectors.
| 5. | The yield curve is a line that plots the yields of various securities of similar quality—typically U.S. Treasury issues—across a range of maturities. The U.S. Treasury yield curve serves as a benchmark for other debt and is used in economic forecasting. |
| 6. | The terms “spread” and “yield spread” may refer to the difference in yield between a security or type of security and comparable U.S. Treasury issues. The terms may also refer to the difference in yield between two specific securities or types of securities at a given time. |
The opinions expressed are those of the portfolio managers as of the date of this report and are subject to change. There is no guarantee that any forecasts will come to pass. This material does not constitute investment advice and is not intended as an endorsement of any specific investment.
Not all MainStay VP Portfolios and/or share classes are available under all policies.
Portfolio of Investments June 30, 2021�� (Unaudited)
| | Principal
Amount | Value |
| Long-Term Bonds 98.2% |
| Asset-Backed Securities 15.3% |
| Automobile Asset-Backed Security 0.6% |
| Ford Credit Floorplan Master Owner Trust | |
| Series 2018-4, Class A | | |
| 4.06%, due 11/15/30 | $ 4,245,000 | $ 4,880,286 |
| Home Equity Asset-Backed Securities 0.1% |
| Chase Funding Trust | |
| Series 2002-2, Class 1A5 | | |
| 6.333%, due 4/25/32 (a) | 51,934 | 52,909 |
| JP Morgan Mortgage Acquisition Trust | |
| Series 2007-CH2, Class AF3 | | |
| 4.541%, due 10/25/30 (a) | 514,891 | 354,089 |
| Morgan Stanley Mortgage Loan Trust | |
| Series 2006-17XS, Class A3A | | |
| 5.651%, due 10/25/46 (a) | 846,003 | 359,044 |
| | | 766,042 |
| Other Asset-Backed Securities 14.6% |
| 522 Funding CLO Ltd. | |
| Series 2019-4A, Class BR | | |
| 1.788% (3 Month LIBOR + 1.60%), due 4/20/30 (b)(c) | 3,000,000 | 2,994,675 |
| AIMCO CLO | |
| Series 2015-AA, Class BR | | |
| 1.484% (3 Month LIBOR + 1.30%), due 1/15/28 (b)(c) | 2,000,000 | 1,999,996 |
| Apidos CLO XXV | |
| Series 2016-25A, Class A1R | | |
| 1.358% (3 Month LIBOR + 1.17%), due 10/20/31 (b)(c) | 1,300,000 | 1,300,497 |
| Apidos CLO XXXII | |
| Series 2019-32A, Class A1 | | |
| 1.508% (3 Month LIBOR + 1.32%), due 1/20/33 (b)(c) | 2,200,000 | 2,201,978 |
| ARES L CLO Ltd. | |
| Series 2018-50A, Class BR | | |
| 1.719% (3 Month LIBOR + 1.60%), due 1/15/32 (b)(c) | 2,000,000 | 2,000,378 |
| ARES XLI CLO Ltd. | |
| Series 2016-41A, Class AR2 | | |
| 1.237% (3 Month LIBOR + 1.07%), due 4/15/34 (b)(c) | 3,000,000 | 3,000,534 |
| ARES XXXIV CLO Ltd. | |
| Series 2015-2A, Class AR2 | | |
| 1.44% (3 Month LIBOR + 1.25%), due 4/17/33 (b)(c) | 2,000,000 | 2,007,476 |
| | Principal
Amount | Value |
| |
| Other Asset-Backed Securities (continued) |
| ARES XXXVIII CLO Ltd. | |
| Series 2015-38A, Class BR | | |
| 1.588% (3 Month LIBOR + 1.40%), due 4/20/30 (b)(c) | $ 2,000,000 | $ 1,989,286 |
| Battalion CLO 17 Ltd. | |
| Series 2021-17A, Class A1 | | |
| 1.45% (3 Month LIBOR + 1.26%), due 3/9/34 (b)(c) | 3,000,000 | 3,003,234 |
| Battalion CLO Ltd. (b)(d) | |
| Series 2021-21A, Class B | | |
| (zero coupon), due 7/15/34 | 2,000,000 | 1,999,792 |
| Series 2021-21A, Class A | | |
| 1.312%, due 7/15/34 | 2,000,000 | 2,000,208 |
| Benefit Street Partners CLO XIX Ltd. | |
| Series 2019-19A, Class A | | |
| 1.534% (3 Month LIBOR + 1.35%), due 1/15/33 (b)(c) | 1,500,000 | 1,501,671 |
| Benefit Street Partners CLO XVIII Ltd. | |
| Series 2019-18A, Class A | | |
| 1.524% (3 Month LIBOR + 1.34%), due 10/15/32 (b)(c) | 1,000,000 | 1,001,933 |
| CAL Funding IV Ltd. | |
| Series 2020-1A, Class A | | |
| 2.22%, due 9/25/45 (b) | 4,915,312 | 4,959,590 |
| Capital Automotive LLC | |
| Series 2017-1A, Class A1 | | |
| 3.87%, due 4/15/47 (b) | 2,012,200 | 2,017,307 |
| Carlyle Global Market Strategies | |
| Series 2021-5A, Class B | | |
| 1.735% (3 Month LIBOR + 1.60%), due 7/20/34 (b)(c) | 3,000,000 | 3,003,012 |
| CARS-DB4 LP | |
| Series 2020-1A, Class A1 | | |
| 2.69%, due 2/15/50 (b) | 919,602 | 950,671 |
| Cedar Funding VIII CLO Ltd. | |
| Series 2017-8A, Class A1 | | |
| 1.44% (3 Month LIBOR + 1.25%), due 10/17/30 (b)(c) | 1,250,000 | 1,250,304 |
| Cedar Funding XII CLO Ltd. | |
| Series 2020-12A, Class A | | |
| 1.446% (3 Month LIBOR + 1.27%), due 10/25/32 (b)(c) | 2,600,000 | 2,600,918 |
| College Avenue Student Loans LLC (b) | |
| Series 2021-A, Class A2 | | |
| 1.60%, due 7/25/51 | 3,052,325 | 3,043,500 |
| Series 2021-B, Class B | | |
| 1.76%, due 6/25/52 | 3,198,073 | 3,193,992 |
The notes to the financial statements are an integral part of, and should be read in conjunction with, the financial statements.
| 10 | MainStay VP Bond Portfolio |
| | Principal
Amount | Value |
| Asset-Backed Securities (continued) |
| Other Asset-Backed Securities (continued) |
| Cook Park CLO Ltd. | |
| Series 2018-1A, Class B | | |
| 1.59% (3 Month LIBOR + 1.40%), due 4/17/30 (b)(c) | $ 3,000,000 | $ 3,000,021 |
| Dryden 76 CLO Ltd. | |
| Series 2019-76A, Class A1 | | |
| 1.518% (3 Month LIBOR + 1.33%), due 10/20/32 (b)(c) | 1,875,000 | 1,877,730 |
| Dryden Senior Loan Fund | |
| Series 2021-87A, Class B | | |
| 1.688% (3 Month LIBOR + 1.55%), due 5/20/34 (b)(c) | 3,000,000 | 3,003,012 |
| Galaxy XXI CLO Ltd. | |
| Series 2015-21A, Class BR | | |
| 1.538% (3 Month LIBOR + 1.35%), due 4/20/31 (b)(c) | 1,500,000 | 1,495,258 |
| Galaxy XXVI CLO Ltd. | |
| Series 2018-26A, Class A | | |
| 1.35% (3 Month LIBOR + 1.20%), due 11/22/31 (b)(c) | 1,500,000 | 1,499,995 |
| Grippen Park CLO Ltd. | |
| Series 2017-1A, Class B | | |
| 1.838% (3 Month LIBOR + 1.65%), due 1/20/30 (b)(c) | 750,000 | 750,064 |
| Kayne CLO 10 Ltd. | |
| Series 2021-10A, Class A | | |
| 1.36% (3 Month LIBOR + 1.17%), due 4/23/34 (b)(c) | 2,000,000 | 2,001,418 |
| Laurel Road Prime Student Loan Trust | |
| Series 2020-A, Class A2FX | | |
| 1.40%, due 11/25/50 (b) | 3,734,000 | 3,726,059 |
| Magnetite CLO Ltd. | |
| Series 2021-31A, Class A1 | | |
| (zero coupon), due 7/15/34 (b)(d) | 2,500,000 | 2,500,000 |
| Magnetite XVIII Ltd. | |
| Series 2016-18A, Class AR | | |
| 1.236% (3 Month LIBOR + 1.08%), due 11/15/28 (b)(c) | 1,900,000 | 1,900,019 |
| Magnetite XXIII Ltd. | |
| Series 2019-23A, Class A | | |
| 1.476% (3 Month LIBOR + 1.30%), due 10/25/32 (b)(c) | 1,000,000 | 1,001,424 |
| Magnetite XXVIII Ltd. | |
| Series 2020-28A, Class B | | |
| 1.826% (3 Month LIBOR + 1.65%), due 10/25/31 (b)(c) | 2,500,000 | 2,503,632 |
| | Principal
Amount | Value |
| |
| Other Asset-Backed Securities (continued) |
| Neuberger Berman CLO XIV Ltd. | |
| Series 2013-14A, Class BR2 | | |
| 1.684% (3 Month LIBOR + 1.50%), due 1/28/30 (b)(c) | $ 1,000,000 | $ 1,000,011 |
| Neuberger Berman Loan Advisers CLO 24 Ltd. | |
| Series 2017-24A, Class BR | | |
| 1.69% (3 Month LIBOR + 1.50%), due 4/19/30 (b)(c) | 1,000,000 | 1,000,071 |
| Neuberger Berman Loan Advisers CLO 35 Ltd. | |
| Series 2019-35A, Class A1 | | |
| 1.53% (3 Month LIBOR + 1.34%), due 1/19/33 (b)(c) | 3,000,000 | 3,004,548 |
| Oaktree CLO Ltd. (b)(c) | |
| Series 2015-1A, Class A2BR | | |
| 1.538% (3 Month LIBOR + 1.35%), due 10/20/27 | 1,000,000 | 1,000,036 |
| Series 2020-1A, Class BR | | |
| 1.995% (3 Month LIBOR + 1.65%), due 7/15/34 | 2,000,000 | 2,002,154 |
| Octagon Investment Partners 29 Ltd. | |
| Series 2016-1A, Class AR | | |
| 1.356% (3 Month LIBOR + 1.18%), due 1/24/33 (b)(c) | 1,200,000 | 1,197,706 |
| OHA Credit Funding 6 Ltd. | |
| Series 2020-6A, Class A1 | | |
| 1.838% (3 Month LIBOR + 1.65%), due 7/20/31 (b)(c) | 2,000,000 | 2,000,000 |
| Palmer Square CLO Ltd. (b)(c) | |
| Series 2015-2A, Class A1R2 | | |
| 1.288% (3 Month LIBOR + 1.10%), due 7/20/30 | 300,000 | 299,677 |
| Series 2014-1A, Class A1R2 | | |
| 1.32% (3 Month LIBOR + 1.13%), due 1/17/31 | 750,000 | 750,215 |
| Series 2015-2A, Class A2R2 | | |
| 1.738% (3 Month LIBOR + 1.55%), due 7/20/30 | 2,000,000 | 2,000,070 |
| Palmer Square Loan Funding Ltd. (b) | |
| Series 2021-3A, Class A2 | | |
| 1.571%, due 7/20/29 (d) | 2,500,000 | 2,500,000 |
| Series 2019-3A, Class A2 | | |
| 1.755% (3 Month LIBOR + 1.60%), due 8/20/27 (c) | 3,000,000 | 3,001,770 |
| Park Avenue Institutional Advisers CLO Ltd. | |
| Series 2021-1A, Class A1A | | |
| 1.595% (3 Month LIBOR + 1.39%), due 1/20/34 (b)(c) | 2,000,000 | 1,998,844 |
The notes to the financial statements are an integral part of, and should be read in conjunction with, the financial statements.
11
Portfolio of Investments June 30, 2021† (Unaudited) (continued)
| | Principal
Amount | Value |
| Asset-Backed Securities (continued) |
| Other Asset-Backed Securities (continued) |
| Regatta XIV Funding Ltd. | |
| Series 2018-3A, Class A | | |
| 1.366% (3 Month LIBOR + 1.19%), due 10/25/31 (b)(c) | $ 2,000,000 | $ 2,000,066 |
| Shackleton CLO Ltd. (b) | |
| Series 2019-14A, Class A1R | | |
| (zero coupon), due 7/20/34 (d) | 1,000,000 | 1,000,000 |
| Series 2019-15A, Class AR | | |
| 1.384% (3 Month LIBOR + 1.20%), due 1/15/32 (c) | 2,000,000 | 1,996,166 |
| Series 2019-14A, Class A1 | | |
| 1.418% (3 Month LIBOR + 1.23%), due 7/20/30 (c) | 2,000,000 | 2,000,000 |
| Slam Ltd. | |
| Series 2021-1A, Class A | | |
| 2.434%, due 6/15/46 (b) | 4,283,000 | 4,280,806 |
| Stack Infrastructure Issuer LLC | |
| Series 2021-1A, Class A2 | | |
| 1.877%, due 3/26/46 (b) | 2,500,000 | 2,510,130 |
| STORE Master Funding LLC | |
| Series 2021-1A, Class A1 | | |
| 2.12%, due 6/20/51 (b) | 1,430,000 | 1,445,201 |
| Textainer Marine Containers VII Ltd. | |
| Series 2021-1A, Class A | | |
| 1.68%, due 2/20/46 (b) | 3,893,333 | 3,850,953 |
| THL Credit Wind River CLO Ltd. | |
| Series 2017-4A, Class A | | |
| 1.305% (3 Month LIBOR + 1.15%), due 11/20/30 (b)(c) | 2,243,000 | 2,244,732 |
| Tiaa CLO III Ltd. | |
| Series 2017-2A, Class A | | |
| 1.334% (3 Month LIBOR + 1.15%), due 1/16/31 (b)(c) | 2,400,000 | 2,387,410 |
| TICP CLO XV Ltd. | |
| Series 2020-15A, Class A | | |
| 1.468% (3 Month LIBOR + 1.28%), due 4/20/33 (b)(c) | 2,000,000 | 2,005,058 |
| TIF Funding II LLC | |
| Series 2021-1A, Class A | | |
| 1.65%, due 2/20/46 (b) | 2,338,000 | 2,301,533 |
| TRP-TRIP Rail Master Funding LLC | |
| Series 2021-2, Class A | | |
| 2.15%, due 6/19/51 (b) | 3,000,000 | 3,005,724 |
| Voya CLO Ltd. (b)(c) | |
| Series 2019-1A, Class AR | | |
| 1.244% (3 Month LIBOR + 1.06%), due 4/15/31 | 1,500,000 | 1,500,178 |
| | Principal
Amount | Value |
| |
| Other Asset-Backed Securities (continued) |
| Voya CLO Ltd. (b)(c) (continued) | |
| Series 2019-1A, Class BR | | |
| 1.734% (3 Month LIBOR + 1.55%), due 4/15/31 | $ 2,000,000 | $ 1,982,486 |
| | | 129,545,129 |
Total Asset-Backed Securities
(Cost $135,526,787) | | 135,191,457 |
| Corporate Bonds 36.6% |
| Aerospace & Defense 1.0% |
| Boeing Co. (The) | | |
| 3.10%, due 5/1/26 | 1,925,000 | 2,035,035 |
| 3.25%, due 2/1/28 | 1,825,000 | 1,934,664 |
| 3.625%, due 2/1/31 | 2,500,000 | 2,688,820 |
| 5.15%, due 5/1/30 | 1,975,000 | 2,338,706 |
| | | 8,997,225 |
| Auto Manufacturers 2.9% |
| American Honda Finance Corp. | | |
| 0.55%, due 7/12/24 | 2,225,000 | 2,217,791 |
| Daimler Finance North America LLC | | |
| 2.45%, due 3/2/31 (b) | 2,000,000 | 2,049,102 |
| Ford Motor Credit Co. LLC | | |
| 3.087%, due 1/9/23 | 825,000 | 841,500 |
| 3.664%, due 9/8/24 | 1,800,000 | 1,886,652 |
| General Motors Co. | | |
| 5.15%, due 4/1/38 | 1,500,000 | 1,829,078 |
| General Motors Financial Co., Inc. | | |
| 1.05%, due 3/8/24 | 3,253,000 | 3,271,656 |
| Hyundai Capital America (b) | | |
| 1.80%, due 1/10/28 | 875,000 | 867,171 |
| 2.375%, due 10/15/27 | 1,525,000 | 1,559,077 |
| Nissan Motor Co. Ltd. | | |
| 4.81%, due 9/17/30 (b) | 5,885,000 | 6,644,402 |
| Volkswagen Group of America Finance LLC | | |
| 3.35%, due 5/13/25 (b) | 4,225,000 | 4,559,229 |
| | | 25,725,658 |
| Banks 5.9% |
| Banco Santander SA | | |
| 1.849%, due 3/25/26 | 4,000,000 | 4,042,661 |
| 4.25%, due 4/11/27 | 1,800,000 | 2,031,118 |
| Bank of America Corp. (e) | | |
| 2.087%, due 6/14/29 | 5,745,000 | 5,791,487 |
| 2.831%, due 10/24/51 | 2,890,000 | 2,818,230 |
The notes to the financial statements are an integral part of, and should be read in conjunction with, the financial statements.
| 12 | MainStay VP Bond Portfolio |
| | Principal
Amount | Value |
| Corporate Bonds (continued) |
| Banks (continued) |
| BNP Paribas SA (b) | | |
| 1.323%, due 1/13/27 (e) | $ 1,650,000 | $ 1,630,011 |
| 2.824%, due 1/26/41 | 3,850,000 | 3,640,852 |
| Citigroup, Inc. | | |
| 3.20%, due 10/21/26 | 1,500,000 | 1,624,891 |
| 4.75%, due 5/18/46 | 1,975,000 | 2,513,627 |
| Goldman Sachs Group, Inc. (The) | | |
| 2.615%, due 4/22/32 (e) | 2,425,000 | 2,477,300 |
| 5.15%, due 5/22/45 | 975,000 | 1,303,711 |
| JPMorgan Chase & Co. | | |
| 1.578%, due 4/22/27 (e) | 6,600,000 | 6,634,195 |
| Morgan Stanley | | |
| 1.593%, due 5/4/27 (e) | 2,300,000 | 2,316,273 |
| 1.928%, due 4/28/32 (e) | 2,650,000 | 2,575,875 |
| 4.35%, due 9/8/26 | 1,556,000 | 1,761,806 |
| Societe Generale SA (b)(c) | | |
| 1.792% (1 Year Treasury Constant Maturity Rate + 1.00%), due 6/9/27 | 2,075,000 | 2,069,956 |
| 3.625%, due 3/1/41 | 2,000,000 | 2,030,475 |
| Standard Chartered plc | | |
| 0.991% (1 Year Treasury Constant Maturity Rate + 0.78%), due 1/12/25 (b)(c) | 2,100,000 | 2,093,393 |
| UBS Group AG (b)(c) | | |
| 1.364% (1 Year Treasury Constant Maturity Rate + 1.08%), due 1/30/27 | 2,825,000 | 2,805,224 |
| 2.095% (1 Year Treasury Constant Maturity Rate + 1.00%), due 2/11/32 | 1,800,000 | 1,763,337 |
| | | 51,924,422 |
| Beverages 1.1% |
| Anheuser-Busch InBev Worldwide, Inc. | | |
| 4.60%, due 4/15/48 | 2,000,000 | 2,441,687 |
| 4.75%, due 1/23/29 | 3,750,000 | 4,467,243 |
| Diageo Capital plc | | |
| 2.125%, due 4/29/32 | 1,150,000 | 1,154,865 |
| Keurig Dr Pepper, Inc. | | |
| 3.35%, due 3/15/51 | 2,000,000 | 2,096,964 |
| | | 10,160,759 |
| Biotechnology 0.2% |
| Amgen, Inc. | | |
| 3.375%, due 2/21/50 | 1,600,000 | 1,689,268 |
| | Principal
Amount | Value |
| |
| Building Materials 1.3% |
| Carrier Global Corp. | | |
| 3.577%, due 4/5/50 | $ 3,575,000 | $ 3,791,167 |
| Masco Corp. | | |
| 4.50%, due 5/15/47 | 3,000,000 | 3,640,134 |
| Owens Corning | | |
| 3.95%, due 8/15/29 | 3,378,000 | 3,816,337 |
| | | 11,247,638 |
| Chemicals 1.1% |
| EI du Pont de Nemours and Co. | | |
| 1.70%, due 7/15/25 | 950,000 | 974,254 |
| International Flavors & Fragrances, Inc. | | |
| 1.832%, due 10/15/27 (b) | 1,600,000 | 1,595,454 |
| LYB International Finance III LLC | | |
| 1.25%, due 10/1/25 | 925,000 | 922,688 |
| NewMarket Corp. | | |
| 4.10%, due 12/15/22 | 5,536,000 | 5,801,145 |
| Nutrien Ltd. | | |
| 3.625%, due 3/15/24 | 825,000 | 880,918 |
| | | 10,174,459 |
| Computers 0.5% |
| HP, Inc. | | |
| 2.65%, due 6/17/31 (b) | 4,300,000 | 4,292,375 |
| Diversified Financial Services 3.1% |
| Air Lease Corp. | | |
| 0.70%, due 2/15/24 | 1,575,000 | 1,569,387 |
| 1.875%, due 8/15/26 | 2,125,000 | 2,126,642 |
| 3.875%, due 7/3/23 | 2,800,000 | 2,970,228 |
| Aircastle Ltd. | | |
| 2.85%, due 1/26/28 (b) | 4,325,000 | 4,346,379 |
| Antares Holdings LP | | |
| 3.95%, due 7/15/26 (b) | 1,600,000 | 1,664,996 |
| Aviation Capital Group LLC | | |
| 1.95%, due 1/30/26 (b) | 3,525,000 | 3,525,952 |
| BOC Aviation USA Corp. | | |
| 1.625%, due 4/29/24 (b) | 2,325,000 | 2,343,293 |
| GE Capital International Funding Co. Unlimited Co. | | |
| 4.418%, due 11/15/35 | 6,160,000 | 7,382,646 |
| Thirax 1 LLC | | |
| 0.968%, due 1/14/33 | 1,765,060 | 1,749,990 |
| | | 27,679,513 |
| Electric 3.2% |
| Appalachian Power Co. | | |
| 6.375%, due 4/1/36 | 1,750,000 | 2,384,732 |
The notes to the financial statements are an integral part of, and should be read in conjunction with, the financial statements.
13
Portfolio of Investments June 30, 2021† (Unaudited) (continued)
| | Principal
Amount | Value |
| Corporate Bonds (continued) |
| Electric (continued) |
| Arizona Public Service Co. | | |
| 5.50%, due 9/1/35 | $ 1,275,000 | $ 1,659,865 |
| Dayton Power & Light Co. (The) | | |
| 3.95%, due 6/15/49 | 1,025,000 | 1,136,289 |
| DTE Energy Co. | | |
| Series F | | |
| 1.05%, due 6/1/25 | 1,300,000 | 1,299,639 |
| Entergy Mississippi LLC | | |
| 3.85%, due 6/1/49 | 2,500,000 | 2,873,706 |
| FirstEnergy Transmission LLC | | |
| 4.35%, due 1/15/25 (b) | 3,455,000 | 3,790,551 |
| Niagara Mohawk Power Corp. | | |
| 3.025%, due 6/27/50 (b) | 1,850,000 | 1,802,091 |
| Ohio Edison Co. | | |
| 6.875%, due 7/15/36 | 2,500,000 | 3,546,159 |
| Pinnacle West Capital Corp. | | |
| 1.30%, due 6/15/25 | 3,100,000 | 3,118,185 |
| Southern California Edison Co. | | |
| 1.10%, due 4/1/24 | 2,275,000 | 2,290,669 |
| Series 20C | | |
| 1.20%, due 2/1/26 | 1,800,000 | 1,786,674 |
| Tennessee Valley Authority | | |
| 5.25%, due 9/15/39 | 2,000,000 | 2,862,500 |
| | | 28,551,060 |
| Electronics 0.4% |
| Flex Ltd. | | |
| 3.75%, due 2/1/26 | 3,400,000 | 3,718,350 |
| Food 0.6% |
| Bimbo Bakeries USA, Inc. | | |
| 4.00%, due 5/17/51 (b) | 1,325,000 | 1,422,788 |
| Conagra Brands, Inc. | | |
| 4.85%, due 11/1/28 | 2,300,000 | 2,738,125 |
| Kroger Co. (The) | | |
| Series B | | |
| 7.70%, due 6/1/29 | 1,000,000 | 1,379,111 |
| | | 5,540,024 |
| Gas 0.2% |
| NiSource, Inc. | | |
| 5.65%, due 2/1/45 | 1,125,000 | 1,550,584 |
| Healthcare-Products 0.1% |
| Stryker Corp. | | |
| 2.90%, due 6/15/50 | 850,000 | 849,705 |
| | Principal
Amount | Value |
| |
| Healthcare-Services 0.9% |
| Fresenius Medical Care U.S. Finance III, Inc. (b) | | |
| 1.875%, due 12/1/26 | $ 1,400,000 | $ 1,400,040 |
| 2.375%, due 2/16/31 | 4,270,000 | 4,165,876 |
| UnitedHealth Group, Inc. | | |
| 3.25%, due 5/15/51 | 2,550,000 | 2,720,257 |
| | | 8,286,173 |
| Insurance 0.7% |
| Brighthouse Financial Global Funding | | |
| 1.00%, due 4/12/24 (b) | 3,975,000 | 3,982,657 |
| Pacific LifeCorp | | |
| 3.35%, due 9/15/50 (b) | 1,700,000 | 1,797,175 |
| | | 5,779,832 |
| Investment Companies 0.2% |
| Blackstone Secured Lending Fund | | |
| 2.75%, due 9/16/26 (b) | 1,925,000 | 1,950,987 |
| Iron & Steel 0.4% |
| Nucor Corp. | | |
| 2.00%, due 6/1/25 | 1,575,000 | 1,629,766 |
| Steel Dynamics, Inc. | | |
| 2.40%, due 6/15/25 | 875,000 | 914,986 |
| 3.25%, due 10/15/50 | 725,000 | 722,427 |
| | | 3,267,179 |
| Media 0.8% |
| Charter Communications Operating LLC | | |
| 4.908%, due 7/23/25 | 1,700,000 | 1,925,949 |
| Comcast Corp. | | |
| 4.60%, due 10/15/38 | 750,000 | 929,552 |
| Discovery Communications LLC | | |
| 3.625%, due 5/15/30 | 800,000 | 872,784 |
| Fox Corp. | | |
| 5.576%, due 1/25/49 | 1,250,000 | 1,687,361 |
| Thomson Reuters Corp. | | |
| 3.85%, due 9/29/24 | 1,575,000 | 1,707,628 |
| | | 7,123,274 |
| Mining 0.6% |
| Anglo American Capital plc (b) | | |
| 2.25%, due 3/17/28 | 2,900,000 | 2,932,117 |
| 5.625%, due 4/1/30 | 1,875,000 | 2,294,109 |
| | | 5,226,226 |
| Oil & Gas 0.5% |
| Valero Energy Corp. | | |
| 2.85%, due 4/15/25 | 4,000,000 | 4,241,296 |
The notes to the financial statements are an integral part of, and should be read in conjunction with, the financial statements.
| 14 | MainStay VP Bond Portfolio |
| | Principal
Amount | Value |
| Corporate Bonds (continued) |
| Oil & Gas Services 0.6% |
| Schlumberger Holdings Corp. | | |
| 3.75%, due 5/1/24 (b) | $ 4,725,000 | $ 5,084,993 |
| Packaging & Containers 0.4% |
| Packaging Corp. of America | | |
| 4.05%, due 12/15/49 | 1,525,000 | 1,791,667 |
| WRKCo, Inc. | | |
| 3.75%, due 3/15/25 | 1,825,000 | 1,990,941 |
| | | 3,782,608 |
| Pharmaceuticals 1.3% |
| AbbVie, Inc. | | |
| 2.95%, due 11/21/26 | 2,575,000 | 2,767,987 |
| Bayer US Finance II LLC | | |
| 4.375%, due 12/15/28 (b) | 2,825,000 | 3,236,484 |
| CVS Health Corp. | | |
| 1.875%, due 2/28/31 | 2,425,000 | 2,352,147 |
| 4.25%, due 4/1/50 | 2,325,000 | 2,755,968 |
| | | 11,112,586 |
| Pipelines 1.7% |
| Energy Transfer Operating LP | | |
| 6.05%, due 6/1/41 | 1,300,000 | 1,648,452 |
| Energy Transfer Partners LP | | |
| 5.875%, due 3/1/22 | 4,800,000 | 4,902,685 |
| Enterprise Products Operating LLC | | |
| 5.10%, due 2/15/45 | 2,600,000 | 3,283,725 |
| Kinder Morgan Energy Partners LP | | |
| 6.375%, due 3/1/41 | 400,000 | 552,898 |
| Tennessee Gas Pipeline Co. LLC | | |
| 2.90%, due 3/1/30 (b) | 2,275,000 | 2,360,246 |
| Texas Eastern Transmission LP | | |
| 2.80%, due 10/15/22 (b) | 2,350,000 | 2,398,602 |
| | | 15,146,608 |
| Real Estate Investment Trusts 3.0% |
| American Campus Communities Operating Partnership LP | | |
| 3.30%, due 7/15/26 | 3,000,000 | 3,216,994 |
| American Homes 4 Rent LP | | |
| 3.375%, due 7/15/51 | 3,225,000 | 3,159,274 |
| Corporate Office Properties LP | | |
| 2.75%, due 4/15/31 | 1,715,000 | 1,727,941 |
| Federal Realty Investment Trust | | |
| 1.25%, due 2/15/26 | 850,000 | 843,812 |
| Highwoods Realty LP | | |
| 3.05%, due 2/15/30 | 1,410,000 | 1,471,874 |
| | Principal
Amount | Value |
| |
| Real Estate Investment Trusts (continued) |
| Highwoods Realty LP (continued) | | |
| 3.875%, due 3/1/27 | $ 3,590,000 | $ 3,939,182 |
| Kimco Realty Corp. | | |
| 2.80%, due 10/1/26 | 1,800,000 | 1,913,190 |
| Simon Property Group LP | | |
| 1.75%, due 2/1/28 | 2,750,000 | 2,735,294 |
| Spirit Realty LP | | |
| 2.70%, due 2/15/32 | 900,000 | 892,134 |
| 3.20%, due 2/15/31 | 900,000 | 937,971 |
| VEREIT Operating Partnership LP | | |
| 3.95%, due 8/15/27 | 4,870,000 | 5,485,565 |
| | | 26,323,231 |
| Retail 0.7% |
| Advance Auto Parts, Inc. | | |
| 1.75%, due 10/1/27 | 1,125,000 | 1,116,282 |
| CK Hutchison International 21 Ltd. | | |
| 1.50%, due 4/15/26 (b) | 3,375,000 | 3,392,674 |
| Lowe's Cos., Inc. | | |
| 3.00%, due 10/15/50 | 1,450,000 | 1,429,595 |
| | | 5,938,551 |
| Semiconductors 0.2% |
| Skyworks Solutions, Inc. | | |
| 1.80%, due 6/1/26 | 1,825,000 | 1,847,991 |
| Software 0.3% |
| Fiserv, Inc. | | |
| 2.25%, due 6/1/27 | 2,960,000 | 3,070,502 |
| Telecommunications 2.4% |
| AT&T, Inc. | | |
| 1.65%, due 2/1/28 | 1,175,000 | 1,166,250 |
| 4.85%, due 3/1/39 | 2,000,000 | 2,429,346 |
| NTT Finance Corp. | | |
| 1.162%, due 4/3/26 (b) | 2,800,000 | 2,793,561 |
| Orange SA | | |
| 5.375%, due 1/13/42 | 895,000 | 1,207,118 |
| Telefonica Emisiones SA | | |
| 5.213%, due 3/8/47 | 750,000 | 936,206 |
| T-Mobile US, Inc. | | |
| 2.55%, due 2/15/31 | 6,540,000 | 6,613,248 |
| Verizon Communications, Inc. | | |
| 2.10%, due 3/22/28 | 2,350,000 | 2,399,151 |
| 4.272%, due 1/15/36 | 3,250,000 | 3,866,931 |
| | | 21,411,811 |
The notes to the financial statements are an integral part of, and should be read in conjunction with, the financial statements.
15
Portfolio of Investments June 30, 2021† (Unaudited) (continued)
| | Principal
Amount | Value |
| Corporate Bonds (continued) |
| Transportation 0.3% |
| Norfolk Southern Corp. | | |
| 5.64%, due 5/17/29 | $ 1,400,000 | $ 1,732,467 |
| Union Pacific Corp. | | |
| 3.25%, due 2/5/50 | 775,000 | 817,336 |
| | | 2,549,803 |
Total Corporate Bonds
(Cost $305,382,047) | | 324,244,691 |
| Foreign Government Bonds 0.7% |
| Chile 0.2% |
| Banco del Estado de Chile | | |
| 2.704%, due 1/9/25 (b) | 1,275,000 | 1,326,013 |
| France 0.5% |
| Electricite de France SA | | |
| 5.00%, due 9/21/48 (b) | 3,420,000 | 4,474,369 |
| Poland 0.0% ‡ |
| Poland Government Bond | | |
| 5.00%, due 3/23/22 | 350,000 | 361,967 |
Total Foreign Government Bonds
(Cost $4,947,964) | | 6,162,349 |
| Mortgage-Backed Securities 15.9% |
| Agency (Collateralized Mortgage Obligations) 9.1% |
| FHLMC | |
| REMIC, Series 4994, Class GV | | |
| 2.00%, due 6/25/46 | 2,000,000 | 2,003,090 |
| REMIC, Series 4623, Class LZ | | |
| 2.50%, due 10/15/46 | 2,247,217 | 2,339,757 |
| REMIC, Series 4199, Class BZ | | |
| 3.50%, due 5/15/43 | 3,183,476 | 3,556,570 |
| REMIC, Series 4684, Class CZ | | |
| 4.00%, due 5/15/47 | 1,647,953 | 1,967,600 |
| REMIC, Series 4748, Class Z | | |
| 4.00%, due 11/15/47 | 1,840,010 | 2,081,918 |
| REMIC, Series 4798, Class GZ | | |
| 4.00%, due 6/15/48 | 2,262,059 | 2,568,419 |
| FNMA, STRIPS | |
| REMIC, Series 396, Class 1 | | |
| (zero coupon), due 6/25/39 | 3,104,563 | 2,864,180 |
| GNMA | |
| REMIC, Series 2013-149, Class LZ | | |
| 2.50%, due 10/20/43 | 3,269,768 | 3,418,349 |
| | Principal
Amount | Value |
| |
| Agency (Collateralized Mortgage Obligations) (continued) |
| GNMA (continued) | |
| REMIC, Series 2014-181, Class L | | |
| 3.00%, due 12/20/44 | $ 2,399,998 | $ 2,604,990 |
| GNMA II, Single Family, 30 Year (f) | |
| 2.00%, due 7/15/51 TBA | 3,000,000 | 3,055,313 |
| 2.50%, due 7/15/51 TBA | 5,650,000 | 5,846,867 |
| UMBS, Single Family, 30 Year (f) | |
| 2.00%, due 7/25/51 TBA | 22,850,000 | 23,071,360 |
| 2.50%, due 7/25/51 TBA | 22,200,000 | 22,961,391 |
| 3.00%, due 7/25/51 TBA | 2,100,000 | 2,188,963 |
| | | 80,528,767 |
| Commercial Mortgage Loans (Collateralized Mortgage Obligations) 4.4% |
| Aventura Mall Trust | |
| Series 2018-AVM, Class A | | |
| 4.249%, due 7/5/40 (b)(g) | 3,250,000 | 3,691,716 |
| BFLD Trust | |
| Series 2021-FPM, Class A | | |
| 1.70% (1 Month LIBOR + 1.60%), due 6/15/38 (b)(c) | 3,000,000 | 3,002,694 |
| Citigroup Commercial Mortgage Trust | |
| Series 2020-420K, Class A | | |
| 2.456%, due 11/10/42 (b) | 3,100,000 | 3,138,577 |
| CSMC WEST Trust | |
| Series 2020-WEST, Class A | | |
| 3.04%, due 2/15/35 (b) | 5,000,000 | 5,211,467 |
| FHLMC, Multifamily Structured Pass-Through Certificates (g) | |
| REMIC, Series K123, Class X1 | | |
| 0.866%, due 2/25/54 | 72,714,032 | 4,615,821 |
| REMIC, Series K122, Class X1 | | |
| 0.974%, due 11/25/30 | 31,980,246 | 2,286,962 |
| REMIC, Series K119, Class X1 | | |
| 1.027%, due 9/25/30 | 54,926,078 | 4,095,959 |
| REMIC, Series K108, Class X1 | | |
| 1.81%, due 3/25/30 | 19,198,317 | 2,495,818 |
| GS Mortgage Securities Trust | |
| Series 2015-GC32, Class AS | | |
| 4.018%, due 7/10/48 (h) | 3,000,000 | 3,281,107 |
| Houston Galleria Mall Trust | |
| Series 2015-HGLR, Class A1A1 | | |
| 3.087%, due 3/5/37 (b) | 3,250,000 | 3,390,333 |
| Morgan Stanley Bank of America Merrill Lynch Trust | |
| Series 2015-C21, Class AS | | |
| 3.652%, due 3/15/48 | 1,000,000 | 1,070,734 |
| WFLD Mortgage Trust | |
| Series 2014-MONT, Class A | | |
| 3.88%, due 8/10/31 (b)(g) | 2,800,000 | 2,951,469 |
| | | 39,232,657 |
The notes to the financial statements are an integral part of, and should be read in conjunction with, the financial statements.
| 16 | MainStay VP Bond Portfolio |
| | Principal
Amount | Value |
| Mortgage-Backed Securities (continued) |
| Whole Loan (Collateralized Mortgage Obligations) 2.4% |
| J.P. Morgan Mortgage Trust | |
| Series 2014-2, Class 1A1 | | |
| 3.00%, due 6/25/29 (b)(h) | $ 972,295 | $ 994,180 |
| Seasoned Credit Risk Transfer Trust | |
| Series 2020-3, Class MT | | |
| 2.00%, due 5/25/60 | 2,898,946 | 2,932,633 |
| Series 2020-2, Class M55G | | |
| 3.00%, due 11/25/59 | 3,474,951 | 3,682,568 |
| Series 2019-2, Class M55D | | |
| 4.00%, due 8/25/58 | 1,756,788 | 1,928,716 |
| Series 2019-4, Class M55D | | |
| 4.00%, due 2/25/59 | 1,655,645 | 1,819,431 |
| Series 2017-4, Class M45T | | |
| 4.50%, due 6/25/57 | 808,338 | 898,291 |
| Seasoned Loans Structured Transaction | |
| Series 2019-1, Class A1 | | |
| 3.50%, due 5/25/29 | 3,044,354 | 3,245,057 |
| Sequoia Mortgage Trust (b)(h) | |
| Series 2021-1, Class A1 | | |
| 2.50%, due 3/25/51 | 1,565,016 | 1,588,919 |
| Series 2021-3, Class A1 | | |
| 2.50%, due 5/25/51 | 4,443,887 | 4,503,404 |
| | | 21,593,199 |
Total Mortgage-Backed Securities
(Cost $140,567,492) | | 141,354,623 |
| Municipal Bonds 0.6% |
| Texas 0.6% |
San Antonio Water System
Revenue Bonds | | |
| 5.502%, due 5/15/29 | 2,000,000 | 2,443,387 |
Texas Transportation Commission State Highway Fund
Revenue Bonds, First Tier | | |
| 5.178%, due 4/1/30 | 2,150,000 | 2,655,087 |
| | | 5,098,474 |
Total Municipal Bonds
(Cost $4,596,178) | | 5,098,474 |
| U.S. Government & Federal Agencies 29.1% |
| Federal Home Loan Mortgage Corporation (Mortgage Pass-Through Securities) 13.4% |
| FFCB | | |
| 1.05%, due 6/22/28 | 3,300,000 | 3,258,210 |
| | Principal
Amount | Value |
| |
| Federal Home Loan Mortgage Corporation (Mortgage Pass-Through Securities) (continued) |
| FFCB (continued) | | |
| 1.125%, due 6/1/29 | $ 6,950,000 | $ 6,828,805 |
| 1.14%, due 8/20/29 | 5,000,000 | 4,895,696 |
| 1.23%, due 9/10/29 | 7,000,000 | 6,842,813 |
| 1.23%, due 7/29/30 | 4,300,000 | 4,169,616 |
| 1.24%, due 12/23/30 | 1,025,000 | 991,446 |
| 1.25%, due 6/24/30 | 5,475,000 | 5,316,615 |
| 1.33%, due 7/1/30 | 5,000,000 | 4,895,916 |
| 1.67%, due 3/3/31 | 5,000,000 | 4,995,668 |
| 1.84%, due 6/3/30 | 2,000,000 | 2,000,333 |
| 1.98%, due 6/2/31 | 8,050,000 | 8,034,663 |
| 2.00%, due 5/27/31 | 5,900,000 | 5,900,441 |
| 2.02%, due 4/1/31 | 3,500,000 | 3,507,024 |
| 2.03%, due 1/21/28 | 3,800,000 | 3,985,273 |
| 2.04%, due 4/14/31 | 3,300,000 | 3,306,576 |
| 2.09%, due 4/1/31 | 3,500,000 | 3,500,031 |
| 2.19%, due 6/1/33 | 4,400,000 | 4,387,438 |
| 2.35%, due 4/16/35 | 1,835,000 | 1,835,001 |
| 2.45%, due 5/10/34 | 2,500,000 | 2,501,888 |
| 2.50%, due 6/2/36 | 3,600,000 | 3,600,031 |
| 2.70%, due 6/21/41 | 2,200,000 | 2,207,006 |
| FHLB | | |
| 2.00%, due 5/12/31 | 4,400,000 | 4,402,801 |
| 2.00%, due 5/27/31 | 6,125,000 | 6,126,020 |
| FHLMC | | |
| 1.28%, due 4/30/30 | 3,000,000 | 2,919,778 |
| 1.42%, due 12/30/30 | 4,600,000 | 4,511,293 |
| FHLMC Gold Pools, 15 Year | | |
| 4.50%, due 4/1/22 | 634 | 664 |
| 4.50%, due 4/1/23 | 1,524 | 1,598 |
| 5.00%, due 3/1/25 | 28,942 | 30,187 |
| 5.50%, due 9/1/21 | 465 | 466 |
| 6.00%, due 7/1/21 | 780 | 779 |
| FHLMC Gold Pools, 30 Year | | |
| 6.50%, due 11/1/35 | 3,469 | 3,885 |
| 6.50%, due 8/1/37 | 21,287 | 24,610 |
| FNMA | | |
| 6.25%, due 5/15/29 | 3,000,000 | 4,085,142 |
| UMBS, 30 Year | | |
| 3.00%, due 5/1/50 | 2,000,272 | 2,146,695 |
| 3.00%, due 8/1/50 | 2,204,230 | 2,349,984 |
| 3.00%, due 9/1/50 | 3,150,780 | 3,354,307 |
| 3.50%, due 3/1/50 | 2,033,719 | 2,213,760 |
| | | 119,132,459 |
The notes to the financial statements are an integral part of, and should be read in conjunction with, the financial statements.
17
Portfolio of Investments June 30, 2021† (Unaudited) (continued)
| | Principal
Amount | Value |
| U.S. Government & Federal Agencies (continued) |
| Federal National Mortgage Association (Mortgage Pass-Through Securities) 6.8% |
| UMBS, 15 Year | | |
| 4.50%, due 5/1/24 | $ 100,154 | $ 105,245 |
| 5.00%, due 12/1/23 | 26,944 | 28,072 |
| 5.00%, due 12/1/23 | 9,849 | 10,269 |
| 5.50%, due 12/1/21 | 443 | 445 |
| 5.50%, due 1/1/22 | 1,477 | 1,482 |
| 5.50%, due 2/1/22 | 82 | 83 |
| UMBS, 30 Year | | |
| 2.00%, due 10/1/50 | 5,656,599 | 5,723,945 |
| 2.00%, due 3/1/51 | 3,472,830 | 3,512,314 |
| 2.00%, due 4/1/51 | 2,847,219 | 2,881,381 |
| 2.50%, due 5/1/43 | 337,611 | 350,163 |
| 3.00%, due 5/1/48 | 2,669,006 | 2,823,123 |
| 3.00%, due 10/1/49 | 1,824,797 | 1,927,277 |
| 3.00%, due 9/1/50 | 2,733,501 | 2,915,504 |
| 3.00%, due 10/1/50 | 2,445,623 | 2,592,727 |
| 3.00%, due 2/1/51 | 2,249,651 | 2,398,445 |
| 3.00%, due 4/1/51 | 1,564,381 | 1,665,927 |
| 3.00%, due 6/1/51 | 2,096,870 | 2,206,619 |
| 3.50%, due 8/1/49 | 4,019,385 | 4,366,900 |
| 3.50%, due 3/1/50 | 6,007,170 | 6,538,987 |
| 3.50%, due 9/1/50 | 6,314,780 | 6,876,274 |
| 3.50%, due 4/1/51 | 1,379,750 | 1,490,235 |
| 4.00%, due 2/1/45 | 831,800 | 913,626 |
| 4.00%, due 6/1/46 | 1,252,928 | 1,370,161 |
| 4.00%, due 11/1/46 | 4,042,493 | 4,383,389 |
| 4.00%, due 4/1/47 | 3,810,825 | 4,182,406 |
| 4.00%, due 1/1/48 | 621,788 | 679,425 |
| 6.50%, due 10/1/36 | 16,593 | 19,550 |
| 6.50%, due 10/1/36 | 12,060 | 13,528 |
| 6.50%, due 8/1/37 | 3,324 | 3,808 |
| 7.00%, due 9/1/37 | 34,183 | 40,255 |
| 7.00%, due 10/1/37 | 459 | 543 |
| 7.00%, due 11/1/37 | 5,252 | 6,198 |
| 7.50%, due 7/1/28 | 7,602 | 8,360 |
| | | 60,036,666 |
| Government National Mortgage Association (Mortgage Pass-Through Securities) 0.1% |
| GNMA I, 30 Year | | |
| 4.00%, due 3/15/44 | 24,995 | 27,589 |
| 4.00%, due 7/15/44 | 244,651 | 271,555 |
| 4.00%, due 7/15/45 | 106,643 | 116,807 |
| 4.50%, due 6/15/39 | 542,583 | 612,406 |
| 4.50%, due 6/15/40 | 186,841 | 211,022 |
| | | 1,239,379 |
| | Principal
Amount | | Value |
| |
| United States Treasury Bonds 1.7% |
| U.S. Treasury Bonds | | | |
| 1.625%, due 11/15/50 | $ 12,500,000 | | $ 11,226,562 |
| 1.875%, due 2/15/41 | 3,770,000 | | 3,690,477 |
| | | | 14,917,039 |
| United States Treasury Notes 7.1% |
| U.S. Treasury Notes | | | |
| 0.125%, due 6/30/23 | 3,500,000 | | 3,491,660 |
| 0.25%, due 6/15/24 | 10,125,000 | | 10,063,301 |
| 0.875%, due 6/30/26 | 26,920,000 | | 26,907,382 |
| 1.625%, due 5/15/31 | 22,300,000 | | 22,641,469 |
| | | | 63,103,812 |
Total U.S. Government & Federal Agencies
(Cost $257,906,470) | | | 258,429,355 |
Total Long-Term Bonds
(Cost $848,926,938) | | | 870,480,949 |
| |
| | Shares | | |
| Short-Term Investment 6.4% |
| Unaffiliated Investment Company 6.4% |
| J.P. Morgan U.S. Government Money Market Fund, 0.026% (i) | 56,911,254 | | 56,911,254 |
Total Short-Term Investment
(Cost $56,911,254) | | | 56,911,254 |
Total Investments
(Cost $905,838,192) | 104.6% | | 927,392,203 |
| Other Assets, Less Liabilities | (4.6) | | (40,682,182) |
| Net Assets | 100.0% | | $ 886,710,021 |
| † | Percentages indicated are based on Portfolio net assets. |
| ‡ | Less than one-tenth of a percent. |
| (a) | Step coupon—Rate shown was the rate in effect as of June 30, 2021. |
| (b) | May be sold to institutional investors only under Rule 144A or securities offered pursuant to Section 4(a)(2) of the Securities Act of 1933, as amended. |
| (c) | Floating rate—Rate shown was the rate in effect as of June 30, 2021. |
| (d) | Delayed delivery security. |
| (e) | Fixed to floating rate—Rate shown was the rate in effect as of June 30, 2021. |
The notes to the financial statements are an integral part of, and should be read in conjunction with, the financial statements.
| 18 | MainStay VP Bond Portfolio |
| (f) | TBA—Security purchased on a forward commitment basis with an approximate principal amount and maturity date. The actual principal amount and maturity date will be determined upon settlement. As of June 30, 2021, the total net market value was $57,123,894, which represented 6.4% of the Portfolio’s net assets. All or a portion of this security is a part of a mortgage dollar roll agreement. |
| (g) | Collateral strip rate—A bond whose interest was based on the weighted net interest rate of the collateral. The coupon rate adjusts periodically based on a predetermined schedule. Rate shown was the rate in effect as of June 30, 2021. |
| (h) | Coupon rate may change based on changes of the underlying collateral or prepayments of principal. Rate shown was the rate in effect as of June 30, 2021. |
| (i) | Current yield as of June 30, 2021. |
Futures Contracts
As of June 30, 2021, the Portfolio held the following futures contracts1:
| Type | Number of
Contracts | Expiration
Date | Value at
Trade Date | Current
Notional
Amount | Unrealized
Appreciation
(Depreciation)2 |
| Long Contracts | | | | | |
| U.S. Treasury 2 Year Notes | 160 | September 2021 | $ 35,250,256 | $ 35,251,250 | $ 994 |
| U.S. Treasury 5 Year Notes | 115 | September 2021 | 14,245,942 | 14,194,414 | (51,528) |
| U.S. Treasury Ultra Bonds | 285 | September 2021 | 53,579,989 | 54,915,938 | 1,335,949 |
| Total Long Contracts | | | | | 1,285,415 |
| Short Contracts | | | | | |
| U.S. Treasury 10 Year Notes | (96) | September 2021 | (12,665,955) | (12,720,000) | (54,045) |
| U.S. Treasury 10 Year Ultra Bonds | (335) | September 2021 | (48,556,498) | (49,313,047) | (756,549) |
| Total Short Contracts | | | | | (810,594) |
| Net Unrealized Appreciation | | | | | $ 474,821 |
| 1. | As of June 30, 2021, cash in the amount of $1,342,838 was on deposit with a broker or futures commission merchant for futures transactions. |
| 2. | Represents the difference between the value of the contracts at the time they were opened and the value as of June 30, 2021. |
| Abbreviation(s): |
| CLO—Collateralized Loan Obligation |
| FFCB—Federal Farm Credit Bank |
| FHLB—Federal Home Loan Bank |
| FHLMC—Federal Home Loan Mortgage Corp. |
| FNMA—Federal National Mortgage Association |
| GNMA—Government National Mortgage Association |
| LIBOR—London Interbank Offered Rate |
| REMIC—Real Estate Mortgage Investment Conduit |
| TBA—To Be Announced |
| UMBS—Uniform Mortgage Backed Securities |
The notes to the financial statements are an integral part of, and should be read in conjunction with, the financial statements.
19
Portfolio of Investments June 30, 2021† (Unaudited) (continued)
The following is a summary of the fair valuations according to the inputs used as of June 30, 2021, for valuing the Portfolio’s assets and liabilities:
| Description | Quoted
Prices in
Active
Markets for
Identical
Assets
(Level 1) | | Significant
Other
Observable
Inputs
(Level 2) | | Significant
Unobservable
Inputs
(Level 3) | | Total |
| Asset Valuation Inputs | | | | | | | |
| Investments in Securities (a) | | | | | | | |
| Long-Term Bonds | | | | | | | |
| Asset-Backed Securities | $ — | | $ 135,191,457 | | $ — | | $ 135,191,457 |
| Corporate Bonds | — | | 324,244,691 | | — | | 324,244,691 |
| Foreign Government Bonds | — | | 6,162,349 | | — | | 6,162,349 |
| Mortgage-Backed Securities | — | | 141,354,623 | | — | | 141,354,623 |
| Municipal Bonds | — | | 5,098,474 | | — | | 5,098,474 |
| U.S. Government & Federal Agencies | — | | 258,429,355 | | — | | 258,429,355 |
| Total Long-Term Bonds | — | | 870,480,949 | | — | | 870,480,949 |
| Short-Term Investment | | | | | | | |
| Unaffiliated Investment Company | 56,911,254 | | — | | — | | 56,911,254 |
| Total Investments in Securities | 56,911,254 | | 870,480,949 | | — | | 927,392,203 |
| Other Financial Instruments | | | | | | | |
| Futures Contracts (b) | 1,336,943 | | — | | — | | 1,336,943 |
| Total Investments in Securities and Other Financial Instruments | $ 58,248,197 | | $ 870,480,949 | | $ — | | $ 928,729,146 |
| Liability Valuation Inputs | | | | | | | |
| Other Financial Instruments | | | | | | | |
| Futures Contracts (b) | $ (862,122) | | $ — | | $ — | | $ (862,122) |
| (a) | For a complete listing of investments and their industries, see the Portfolio of Investments. |
| (b) | The value listed for these securities reflects unrealized appreciation (depreciation) as shown on the Portfolio of Investments. |
The notes to the financial statements are an integral part of, and should be read in conjunction with, the financial statements.
| 20 | MainStay VP Bond Portfolio |
Statement of Assets and Liabilities as of June 30, 2021 (Unaudited)
| Assets |
Investment in securities, at value
(identified cost $905,838,192) | $927,392,203 |
| Cash | 28,629,466 |
| Cash collateral on deposit at broker for futures contracts | 1,342,838 |
| Receivables: | |
| Investment securities sold | 12,342,483 |
| Interest | 3,859,819 |
| Portfolio shares sold | 1,075,000 |
| Variation margin on futures contracts | 69,887 |
| Other assets | 14,008 |
| Total assets | 974,725,704 |
| Liabilities |
| Cash collateral due to broker for TBA | 637,836 |
| Payables: | |
| Investment securities purchased | 85,814,945 |
| Portfolio shares redeemed | 928,930 |
| Manager (See Note 3) | 354,487 |
| NYLIFE Distributors (See Note 3) | 109,092 |
| Shareholder communication | 79,231 |
| Professional fees | 60,500 |
| Custodian | 30,413 |
| Trustees | 249 |
| Total liabilities | 88,015,683 |
| Net assets | $886,710,021 |
| Composition of Net Assets |
| Shares of beneficial interest outstanding (par value of $.001 per share) unlimited number of shares authorized | $ 58,841 |
| Additional paid-in-capital | 819,092,072 |
| | 819,150,913 |
| Total distributable earnings (loss) | 67,559,108 |
| Net assets | $886,710,021 |
| Initial Class | |
| Net assets applicable to outstanding shares | $353,783,040 |
| Shares of beneficial interest outstanding | 23,293,791 |
| Net asset value per share outstanding | $ 15.19 |
| Service Class | |
| Net assets applicable to outstanding shares | $532,926,981 |
| Shares of beneficial interest outstanding | 35,547,374 |
| Net asset value per share outstanding | $ 14.99 |
The notes to the financial statements are an integral part of, and should be read in conjunction with, the financial statements.
21
Statement of Operations for the six months ended June 30, 2021 (Unaudited)
| Investment Income (Loss) |
| Income | |
| Interest | $ 9,309,372 |
| Dividends | 121,539 |
| Other | 5,254 |
| Total income | 9,436,165 |
| Expenses | |
| Manager (See Note 3) | 2,223,031 |
| Distribution/Service—Service Class (See Note 3) | 653,696 |
| Professional fees | 66,391 |
| Shareholder communication | 44,184 |
| Custodian | 24,962 |
| Trustees | 9,758 |
| Miscellaneous | 12,408 |
| Total expenses | 3,034,430 |
| Net investment income (loss) | 6,401,735 |
| Realized and Unrealized Gain (Loss) |
| Net realized gain (loss) on: | |
| Unaffiliated investment transactions | (1,023,055) |
| Futures transactions | (1,233,416) |
| Net realized gain (loss) | (2,256,471) |
| Net change in unrealized appreciation (depreciation) on: | |
| Unaffiliated investments | (16,490,652) |
| Futures contracts | 492,693 |
| Net change in unrealized appreciation (depreciation) | (15,997,959) |
| Net realized and unrealized gain (loss) | (18,254,430) |
| Net increase (decrease) in net assets resulting from operations | $(11,852,695) |
The notes to the financial statements are an integral part of, and should be read in conjunction with, the financial statements.
| 22 | MainStay VP Bond Portfolio |
Statements of Changes in Net Assets
for the six months ended June 30, 2021 (Unaudited) and the year ended December 31, 2020
| | 2021 | 2020 |
| Increase (Decrease) in Net Assets |
| Operations: | | |
| Net investment income (loss) | $ 6,401,735 | $ 14,248,343 |
| Net realized gain (loss) | (2,256,471) | 26,821,653 |
| Net change in unrealized appreciation (depreciation) | (15,997,959) | 19,568,324 |
| Net increase (decrease) in net assets resulting from operations | (11,852,695) | 60,638,320 |
| Distributions to shareholders: | | |
| Initial Class | — | (8,712,379) |
| Service Class | — | (10,771,134) |
| Total distributions to shareholders | — | (19,483,513) |
| Capital share transactions: | | |
| Net proceeds from sales of shares | 113,277,902 | 274,423,509 |
| Net asset value of shares issued to shareholder in reinvestment of distributions | — | 19,483,513 |
| Cost of shares redeemed | (157,105,928) | (161,417,551) |
| Increase (decrease) in net assets derived from capital share transactions | (43,828,026) | 132,489,471 |
| Net increase (decrease) in net assets | (55,680,721) | 173,644,278 |
| Net Assets |
| Beginning of period | 942,390,742 | 768,746,464 |
| End of period | $ 886,710,021 | $ 942,390,742 |
The notes to the financial statements are an integral part of, and should be read in conjunction with, the financial statements.
23
Financial Highlights selected per share data and ratios
| | Six months ended
June 30,
2021* | | Year Ended December 31, |
| Initial Class | 2020 | | 2019 | | 2018 | | 2017 | | 2016 |
| Net asset value at beginning of period | $ 15.37 | | $ 14.57 | | $ 13.72 | | $ 14.31 | | $ 14.26 | | $ 14.19 |
| Net investment income (loss) (a) | 0.12 | | 0.28 | | 0.37 | | 0.38 | | 0.32 | | 0.32 |
| Net realized and unrealized gain (loss) on investments | (0.30) | | 0.87 | | 0.88 | | (0.53) | | 0.23 | | 0.20 |
| Total from investment operations | (0.18) | | 1.15 | | 1.25 | | (0.15) | | 0.55 | | 0.52 |
| Less distributions: | | | | | | | | | | | |
| From net investment income | — | | (0.31) | | (0.40) | | (0.40) | | (0.37) | | (0.39) |
| From net realized gain on investments | — | | (0.04) | | — | | (0.04) | | (0.13) | | (0.06) |
| Total distributions | — | | (0.35) | | (0.40) | | (0.44) | | (0.50) | | (0.45) |
| Net asset value at end of period | $ 15.19 | | $ 15.37 | | $ 14.57 | | $ 13.72 | | $ 14.31 | | $ 14.26 |
| Total investment return (b) | (1.17)% | | 7.94% | | 9.12% | | (1.00)% | | 3.85% | | 3.53% |
| Ratios (to average net assets)/Supplemental Data: | | | | | | | | | | | |
| Net investment income (loss) | 1.55%†† | | 1.83% | | 2.60% | | 2.76% | | 2.23% | | 2.16%(c) |
| Net expenses (d) | 0.52%†† | | 0.53% | | 0.54% | | 0.53% | | 0.52% | | 0.51%(e) |
| Expenses (before waiver/reimbursement) (d) | 0.52%†† | | 0.53% | | 0.54% | | 0.53% | | 0.52% | | 0.53% |
| Portfolio turnover rate (f) | 145% | | 255% | | 204% | | 148% | | 209% | | 258% |
| Net assets at end of period (in 000’s) | $ 353,783 | | $ 412,053 | | $ 341,408 | | $ 307,682 | | $ 517,067 | | $ 538,979 |
| * | Unaudited. |
| †† | Annualized. |
| (a) | Per share data based on average shares outstanding during the period. |
| (b) | Total return does not reflect any deduction of sales charges, mortality and expense charges, contract charges or administrative charges. For periods of less than one year, total return is not annualized. |
| (c) | Without the custody fee reimbursement, net investment income (loss) would have been 2.14%. |
| (d) | In addition to the fees and expenses which the Portfolio bears directly, it also indirectly bears a pro-rata share of the fees and expenses of the underlying funds in which it invests. Such indirect expenses are not included in the above expense ratios. |
| (e) | Without the custody fee reimbursement, net expenses would have been 0.53%. |
| (f) | The portfolio turnover rates not including mortgage dollar rolls were 99%, 241%, 197%, 133%, 190% and 223% for the six months ended June 30, 2021 and for the years ended December 31, 2020, 2019, 2018, 2017 and 2016, respectively. |
The notes to the financial statements are an integral part of, and should be read in conjunction with, the financial statements.
| 24 | MainStay VP Bond Portfolio |
Financial Highlights selected per share data and ratios
| | Six months ended
June 30,
2021* | | Year Ended December 31, |
| Service Class | 2020 | | 2019 | | 2018 | | 2017 | | 2016 |
| Net asset value at beginning of period | $ 15.19 | | $ 14.41 | | $ 13.58 | | $ 14.16 | | $ 14.12 | | $ 14.06 |
| Net investment income (loss) (a) | 0.10 | | 0.24 | | 0.33 | | 0.35 | | 0.28 | | 0.28 |
| Net realized and unrealized gain (loss) on investments | (0.30) | | 0.86 | | 0.87 | | (0.53) | | 0.22 | | 0.19 |
| Total from investment operations | (0.20) | | 1.10 | | 1.20 | | (0.18) | | 0.50 | | 0.47 |
| Less distributions: | | | | | | | | | | | |
| From net investment income | — | | (0.28) | | (0.37) | | (0.36) | | (0.33) | | (0.35) |
| From net realized gain on investments | — | | (0.04) | | — | | (0.04) | | (0.13) | | (0.06) |
| Total distributions | — | | (0.32) | | (0.37) | | (0.40) | | (0.46) | | (0.41) |
| Net asset value at end of period | $ 14.99 | | $ 15.19 | | $ 14.41 | | $ 13.58 | | $ 14.16 | | $ 14.12 |
| Total investment return (b) | (1.32)%(c) | | 7.67% | | 8.85% | | (1.25)% | | 3.59% | | 3.27% |
| Ratios (to average net assets)/Supplemental Data: | | | | | | | | | | | |
| Net investment income (loss) | 1.30%†† | | 1.57% | | 2.34% | | 2.53% | | 1.98% | | 1.90%(d) |
| Net expenses (e) | 0.77%†† | | 0.78% | | 0.79% | | 0.78% | | 0.77% | | 0.76%(f) |
| Expenses (before waiver/reimbursement) (e) | 0.77%†† | | 0.78% | | 0.79% | | 0.78% | | 0.77% | | 0.78% |
| Portfolio turnover rate (g) | 145% | | 255% | | 204% | | 148% | | 209% | | 258% |
| Net assets at end of period (in 000’s) | $ 532,927 | | $ 530,338 | | $ 427,338 | | $ 323,100 | | $ 333,530 | | $ 351,848 |
| * | Unaudited. |
| †† | Annualized. |
| (a) | Per share data based on average shares outstanding during the period. |
| (b) | Total return does not reflect any deduction of sales charges, mortality and expense charges, contract charges or administrative charges. For periods of less than one year, total return is not annualized. |
| (c) | Total investment return may reflect adjustments to conform to generally accepted accounting principles. |
| (d) | Without the custody fee reimbursement, net investment income (loss) would have been 1.88%. |
| (e) | In addition to the fees and expenses which the Portfolio bears directly, it also indirectly bears a pro-rata share of the fees and expenses of the underlying funds in which it invests. Such indirect expenses are not included in the above expense ratios. |
| (f) | Without the custody fee reimbursement, net expenses would have been 0.78%. |
| (g) | The portfolio turnover rates not including mortgage dollar rolls were 99%, 241%, 197%, 133%, 190% and 223% for the six months ended June 30, 2021 and for the years ended December 31, 2020, 2019, 2018, 2017 and 2016, respectively. |
The notes to the financial statements are an integral part of, and should be read in conjunction with, the financial statements.
25
Notes to Financial Statements (Unaudited)
Note 1–Organization and Business
MainStay VP Funds Trust (the “Fund”) was organized as a Delaware statutory trust on February 1, 2011. The Fund is registered under the Investment Company Act of 1940, as amended (the “1940 Act”), as an open-end management investment company. The Fund is comprised of thirty-one separate series (collectively referred to as the “Portfolios”). These financial statements and notes relate to the MainStay VP Bond Portfolio (the "Portfolio"), a "diversified” portfolio, as that term is defined in the 1940 Act, as interpreted or modified by regulatory authorities having jurisdiction, from time to time.
Shares of the Portfolio are currently offered to certain separate accounts to fund variable annuity policies and variable universal life insurance policies issued by New York Life Insurance and Annuity Corporation (“NYLIAC”), a wholly-owned subsidiary of New York Life Insurance Company (“New York Life”) and may also be offered to fund variable annuity policies and variable universal life insurance policies issued by other insurance companies. NYLIAC allocates shares of the Portfolios to, among others, certain NYLIAC separate accounts. Shares of the Portfolio are also offered to the MainStay VP Conservative Allocation Portfolio, MainStay VP Moderate Allocation Portfolio, MainStay VP Growth Allocation Portfolio (formerly known as MainStay VP Moderate Growth Allocation Portfolio) and MainStay VP Equity Allocation Portfolio (formerly known as MainStay VP Growth Allocation Portfolio), which operate as “funds-of-funds," and other variable insurance funds.
The following table lists the Portfolio's share classes that have been registered and commenced operations:
| Class | Commenced Operations |
| Initial Class | January 23, 1984 |
| Service Class | June 4, 2003 |
Shares of the Portfolio are offered and are redeemed at a price equal to their respective net asset value (“NAV”) per share. No sales or redemption charge is applicable to the purchase or redemption of the Portfolio's shares. Under the terms of the Fund’s multiple class plan, adopted pursuant to Rule 18f-3 under the 1940 Act, the classes differ in that, among other things, Service Class shares of the Portfolio pay a combined distribution and service fee of 0.25% of average daily net assets attributable to Service Class shares of the Portfolio to the Distributor (as defined in Note 3(B)) pursuant to a plan adopted in accordance with Rule 12b-1 under the 1940 Act. Contract owners of variable annuity contracts purchased after June 2, 2003, are permitted to invest only in the Service Class shares.
The Portfolio's investment objective is to seek total return.
Note 2–Significant Accounting Policies
The Portfolio is an investment company and accordingly follows the investment company accounting and reporting guidance of the Financial Accounting Standards Board (“FASB”) Accounting Standard Codification Topic 946 Financial Services—Investment Companies. The Portfolio
prepares its financial statements in accordance with generally accepted accounting principles (“GAAP”) in the United States of America and follows the significant accounting policies described below.
(A) Securities Valuation. Investments are usually valued as of the close of regular trading on the New York Stock Exchange (the "Exchange") (usually 4:00 p.m. Eastern time) on each day the Portfolio is open for business ("valuation date").
The Board of Trustees of the Fund (the "Board") adopted procedures establishing methodologies for the valuation of the Portfolio's securities and other assets and delegated the responsibility for valuation determinations under those procedures to the Valuation Committee of the Fund (the “Valuation Committee”). The procedures state that, subject to the oversight of the Board and unless otherwise noted, the responsibility for the day-to-day valuation of portfolio assets (including fair value measurements for the Portfolio's assets and liabilities) rests with New York Life Investment Management LLC (“New York Life Investments” or the "Manager"), aided to whatever extent necessary by the Subadvisor (as defined in Note 3(A)). To assess the appropriateness of security valuations, the Manager, the Subadvisor or the Portfolio's third-party service provider, who is subject to oversight by the Manager, regularly compares prior day prices, prices on comparable securities and the sale prices to the prior and current day prices and challenges prices with changes exceeding certain tolerance levels with third-party pricing services or broker sources.
The Board authorized the Valuation Committee to appoint a Valuation Subcommittee (the “Subcommittee”) to establish the prices of securities for which market quotations are not readily available or the prices of which are not otherwise readily determinable under the procedures. The Subcommittee meets (in person, via electronic mail or via teleconference) on an as-needed basis. The Valuation Committee meets to ensure that actions taken by the Subcommittee were appropriate.
For those securities valued through either a standardized fair valuation methodology or a fair valuation measurement, the Subcommittee deals with such valuation and the Valuation Committee reviews and affirms, if appropriate, the reasonableness of the valuation based on such methodologies and measurements on a regular basis after considering information that is reasonably available and deemed relevant by the Valuation Committee. Any action taken by the Subcommittee with respect to the valuation of a portfolio security or other asset is submitted for review and ratification (if appropriate) to the Valuation Committee and the Board at the next regularly scheduled meeting.
"Fair value" is defined as the price the Portfolio would reasonably expect to receive upon selling an asset or liability in an orderly transaction to an independent buyer in the principal or most advantageous market for the asset or liability. Fair value measurements are determined within a framework that establishes a three-tier hierarchy that maximizes the use of observable market data and minimizes the use of unobservable inputs to establish a classification of fair value measurements for disclosure purposes. "Inputs" refer broadly to the assumptions that market
| 26 | MainStay VP Bond Portfolio |
participants would use in pricing the asset or liability, including assumptions about risk, such as the risk inherent in a particular valuation technique used to measure fair value using a pricing model and/or the risk inherent in the inputs for the valuation technique. Inputs may be observable or unobservable. Observable inputs reflect the assumptions market participants would use in pricing the asset or liability based on market data obtained from sources independent of the Portfolio. Unobservable inputs reflect the Portfolio’s own assumptions about the assumptions market participants would use in pricing the asset or liability based on the information available. The inputs or methodology used for valuing assets or liabilities may not be an indication of the risks associated with investing in those assets or liabilities. The three-tier hierarchy of inputs is summarized below.
| • | Level 1—quoted prices in active markets for an identical asset or liability |
| • | Level 2—other significant observable inputs (including quoted prices for a similar asset or liability in active markets, interest rates and yield curves, prepayment speeds, credit risk, etc.) |
| • | Level 3—significant unobservable inputs (including the Portfolio's own assumptions about the assumptions that market participants would use in measuring fair value of an asset or liability) |
The level of an asset or liability within the fair value hierarchy is based on the lowest level of an input, both individually and in the aggregate, that is significant to the fair value measurement. The aggregate value by input level of the Portfolio’s assets and liabilities as of June 30, 2021, is included at the end of the Portfolio of Investments.
The Portfolio may use third-party vendor evaluations, whose prices may be derived from one or more of the following standard inputs, among others:
| • Benchmark yields | • Reported trades |
| • Broker/dealer quotes | • Issuer spreads |
| • Two-sided markets | • Benchmark securities |
| • Bids/offers | • Reference data (corporate actions or material event notices) |
| • Industry and economic events | • Comparable bonds |
| • Monthly payment information | |
An asset or liability for which market values cannot be measured using the methodologies described above is valued by methods deemed reasonable in good faith by the Valuation Committee, following the procedures established by the Board, to represent fair value. Under these procedures, the Portfolio generally uses a market-based approach which may use related or comparable assets or liabilities, recent transactions, market multiples, book values and other relevant information. The Portfolio may also use an income-based valuation approach in which the anticipated future cash flows of the asset or liability are discounted to calculate fair value. Discounts may also be applied due to the nature and/or duration of any restrictions on the disposition of the asset or liability. Fair value represents a good faith approximation of the value of a
security. Fair value determinations involve the consideration of a number of subjective factors, an analysis of applicable facts and circumstances and the exercise of judgment. As a result, it is possible that the fair value for a security determined in good faith in accordance with the Portfolio's valuation procedures may differ from valuations for the same security determined by other funds using their own valuation procedures. Although the Portfolio's valuation procedures are designed to value a security at the price the Portfolio may reasonably expect to receive upon the security's sale in an orderly transaction, there can be no assurance that any fair value determination thereunder would, in fact, approximate the amount that the Portfolio would actually realize upon the sale of the security or the price at which the security would trade if a reliable market price were readily available. During the six-month period ended June 30, 2021, there were no material changes to the fair value methodologies.
Securities which may be valued in this manner include, but are not limited to: (i) a security for which trading has been halted or suspended; (ii) a debt security that has recently gone into default and for which there is not a current market quotation; (iii) a security of an issuer that has entered into a restructuring; (iv) a security that has been delisted from a national exchange; (v) a security for which the market price is not readily available from a third-party pricing source or, if so provided, does not, in the opinion of the Manager or the Subadvisor, reflect the security's market value; (vi) a security subject to trading collars for which no or limited trading takes place; and (vii) a security whose principal market has been temporarily closed at a time when, under normal conditions, it would be open. Securities valued in this manner are generally categorized as Level 3 in the hierarchy. No securities held by the Portfolio as of June 30, 2021 were fair valued in such a manner.
Investments in mutual funds, including money market funds, are valued at their respective NAVs at the close of business each day on the valuation date. These securities are generally categorized as Level 1 in the hierarchy.
Futures contracts are valued at the last posted settlement price on the market where such futures are primarily traded. These securities are generally categorized as Level 1 in the hierarchy.
Debt securities (other than convertible and municipal bonds) are valued at the evaluated bid prices (evaluated mean prices in the case of convertible and municipal bonds) supplied by a pricing agent or broker selected by the Manager, in consultation with the Subadvisor. The evaluations are market-based measurements processed through a pricing application and represents the pricing agent’s good faith determination as to what a holder may receive in an orderly transaction under market conditions. The rules-based logic utilizes valuation techniques that reflect participants’ assumptions and vary by asset class and per methodology, maximizing the use of relevant observable data including quoted prices for similar assets, benchmark yield curves and market corroborated inputs. The evaluated bid or mean prices are deemed by the Manager, in consultation with the Subadvisor, to be representative of market values at the regular close of trading of the Exchange on each valuation date. Debt securities purchased on a delayed delivery basis are marked to market daily until
Notes to Financial Statements (Unaudited) (continued)
settlement at the forward settlement date. Debt securities, including corporate bonds, U.S. government and federal agency bonds, municipal bonds, foreign bonds, convertible bonds, asset-backed securities and mortgage-backed securities are generally categorized as Level 2 in the hierarchy.
Temporary cash investments acquired in excess of 60 days to maturity at the time of purchase are valued using the latest bid prices or using valuations based on a matrix system (which considers such factors as security prices, yields, maturities and ratings), both as furnished by independent pricing services. Temporary cash investments that mature in 60 days or less at the time of purchase ("Short-Term Investments") are valued using the amortized cost method of valuation, unless the use of such method would be inappropriate. The amortized cost method involves valuing a security at its cost on the date of purchase and thereafter assuming a constant amortization to maturity of the difference between such cost and the value on maturity date. Amortized cost approximates the current fair value of a security. Securities valued using the amortized cost method are not valued using quoted prices in an active market and are generally categorized as Level 2 in the hierarchy.
The information above is not intended to reflect an exhaustive list of the methodologies that may be used to value portfolio investments. The valuation procedures permit the use of a variety of valuation methodologies in connection with valuing portfolio investments. The methodology used for a specific type of investment may vary based on the market data available or other considerations. The methodologies summarized above may not represent the specific means by which portfolio investments are valued on any particular business day.
(B) Income Taxes. The Portfolio's policy is to comply with the requirements of the Internal Revenue Code of 1986, as amended (the “Internal Revenue Code”), applicable to regulated investment companies and to distribute all of its taxable income to the shareholders of the Portfolio within the allowable time limits.
The Manager evaluates the Portfolio’s tax positions to determine if the tax positions taken meet the minimum recognition threshold in connection with accounting for uncertainties in income tax positions taken or expected to be taken for the purposes of measuring and recognizing tax liabilities in the financial statements. Recognition of tax benefits of an uncertain tax position is permitted only to the extent the position is “more likely than not” to be sustained assuming examination by taxing authorities. The Manager analyzed the Portfolio's tax positions taken on federal, state and local income tax returns for all open tax years (for up to three tax years) and has concluded that no provisions for federal, state and local income tax are required in the Portfolio's financial statements. The Portfolio's federal, state and local income tax and federal excise tax returns for tax years for which the applicable statutes of limitations have not expired are subject to examination by the Internal Revenue Service and state and local departments of revenue.
(C) Foreign Taxes. The Portfolio may be subject to foreign taxes on income and other transaction-based taxes imposed by certain countries in which it invests. A portion of the taxes on gains on investments or currency purchases/repatriation may be reclaimable. The Portfolio will accrue such taxes and reclaims as applicable, based upon its current interpretation of tax rules and regulations that exist in the markets in which it invests.
The Portfolio may be subject to taxation on realized capital gains, repatriation proceeds and other transaction-based taxes imposed by certain countries in which it invests. The Portfolio will accrue such taxes as applicable based upon its current interpretation of tax rules and regulations that exist in the market in which it invests. Capital gains taxes relating to positions still held are reflected as a liability in the Statement of Assets and Liabilities, as well as an adjustment to the Portfolio's net unrealized appreciation (depreciation). Taxes related to capital gains realized, if any, are reflected as part of net realized gain (loss) in the Statement of Operations. Changes in tax liabilities related to capital gains taxes on unrealized investment gains, if any, are reflected as part of the change in net unrealized appreciation (depreciation) on investments in the Statement of Operations. Transaction-based charges are generally assessed as a percentage of the transaction amount.
(D) Dividends and Distributions to Shareholders. Dividends and distributions are recorded on the ex-dividend date. The Portfolio intends to declare and pay dividends from net investment income and distributions from net realized capital and currency gains, if any, at least annually. Unless a shareholder elects otherwise, all dividends and distributions are reinvested at NAV in the same class of shares of the Portfolio. Dividends and distributions to shareholders are determined in accordance with federal income tax regulations and may differ from determinations using GAAP.
(E) Security Transactions and Investment Income. The Portfolio records security transactions on the trade date. Realized gains and losses on security transactions are determined using the identified cost method. Dividend income is recognized on the ex-dividend date, net of any foreign tax withheld at the source, and interest income is accrued as earned using the effective interest rate method and includes any realized gains and losses from repayments of principal on mortgage-backed securities. Discounts and premiums on securities purchased for the Portfolio are accreted and amortized, respectively, on the effective interest rate method.
Investment income and realized and unrealized gains and losses on investments of the Portfolio are allocated pro rata to the separate classes of shares based upon their relative net assets on the date the income is earned or realized and unrealized gains and losses are incurred.
The Portfolio may place a debt security on non-accrual status and reduce related interest income by ceasing current accruals and writing off all or a portion of any interest receivables when the collection of all or a portion of such interest has become doubtful. A debt security is removed from
| 28 | MainStay VP Bond Portfolio |
non-accrual status when the issuer resumes interest payments or when collectability of interest is reasonably assured.
(F) Expenses. Expenses of the Fund are allocated to the individual Portfolios in proportion to the net assets of the respective Portfolios when the expenses are incurred, except where direct allocations of expenses can be made. Expenses (other than fees incurred under the distribution and service plans, further discussed in Note 3(B), which are charged directly to the Service Class shares) are allocated to separate classes of shares pro rata based upon their relative net assets on the date the expenses are incurred. The expenses borne by the Portfolio, including those of related parties to the Portfolio, are shown in the Statement of Operations.
Additionally, the Portfolio may invest in mutual funds, which are subject to management fees and other fees that may cause the costs of investing in mutual funds to be greater than the costs of owning the underlying securities directly. These indirect expenses of mutual funds are not included in the amounts shown as expenses in the Statement of Operations or in the expense ratios included in the Financial Highlights.
(G) Use of Estimates. In preparing financial statements in conformity with GAAP, the Manager makes estimates and assumptions that affect the reported amounts and disclosures in the financial statements. Actual results could differ from those estimates and assumptions.
(H) Futures Contracts. A futures contract is an agreement to purchase or sell a specified quantity of an underlying instrument at a specified future date and price, or to make or receive a cash payment based on the value of a financial instrument (e.g., foreign currency, interest rate, security or securities index). The Portfolio is subject to risks such as market price risk and/or interest rate risk in the normal course of investing in these contracts. Upon entering into a futures contract, the Portfolio is required to pledge to the broker or futures commission merchant an amount of cash and/or U.S. government securities equal to a certain percentage of the collateral amount, known as the “initial margin.” During the period the futures contract is open, changes in the value of the contract are recognized as unrealized appreciation or depreciation by marking to market such contract on a daily basis to reflect the market value of the contract at the end of each day’s trading. The Portfolio agrees to receive from or pay to the broker or futures commission merchant an amount of cash equal to the daily fluctuation in the value of the contract. Such receipts or payments are known as “variation margin.” When the futures contract is closed, the Portfolio records a realized gain or loss equal to the difference between the proceeds from (or cost of) the closing transaction and the Portfolio's basis in the contract.
The use of futures contracts involves, to varying degrees, elements of market risk in excess of the amount recognized in the Statement of Assets and Liabilities. The contract or notional amounts and variation margin reflect the extent of the Portfolio's involvement in open futures positions. There are several risks associated with the use of futures contracts as hedging techniques. There can be no assurance that a liquid
market will exist at the time when the Portfolio seeks to close out a futures contract. If no liquid market exists, the Portfolio would remain obligated to meet margin requirements until the position is closed. Futures contracts may involve a small initial investment relative to the risk assumed, which could result in losses greater than if the Portfolio did not invest in futures contracts. Futures contracts may be more volatile than direct investments in the instrument underlying the futures and may not correlate to the underlying instrument, causing a given hedge not to achieve its objectives. The Portfolio's activities in futures contracts have minimal counterparty risk as they are conducted through regulated exchanges that guarantee the futures against default by the counterparty. In the event of a bankruptcy or insolvency of a futures commission merchant that holds margin on behalf of the Portfolio, the Portfolio may not be entitled to the return of the entire margin owed to the Portfolio, potentially resulting in a loss. The Portfolio may invest in futures contracts to seek enhanced returns or to reduce the risk of loss by hedging certain of its holdings. The Portfolio's investment in futures contracts and other derivatives may increase the volatility of the Portfolio's NAVs and may result in a loss to the Portfolio. Open futures contracts as of June 30, 2021 are shown in the Portfolio of Investments.
(I) Dollar Rolls. The Portfolio may enter into dollar roll transactions in which it sells mortgage-backed securities ("MBS") from its portfolio to a counterparty from whom it simultaneously agrees to buy a similar security on a delayed delivery basis. The Portfolio generally transfers MBS where the MBS are "to be announced," therefore, the Portfolio accounts for these transactions as purchases and sales.
When accounted for as purchase and sales, the securities sold in connection with the dollar rolls are removed from the portfolio and a realized gain or loss is recognized. The securities the Portfolio has agreed to acquire are included at market value in the Portfolio of Investments and liabilities for such purchase commitments are included as payables for investments purchased. During the roll period, the Portfolio foregoes principal and interest paid on the securities. The Portfolio is compensated by the difference between the current sales price and the forward price for the future as well as by the earnings on the cash proceeds of the initial sale. Dollar rolls may be renewed without physical delivery of the securities subject to the contract. The Portfolio maintains liquid assets from its portfolio having a value not less than the repurchase price, including accrued interest. Dollar roll transactions involve certain risks, including the risk that the securities returned to the Portfolio at the end of the roll period, while substantially similar, could be inferior to what was initially sold to the counterparty.
(J) Delayed Delivery Transactions. The Portfolio may purchase or sell securities on a delayed delivery basis. These transactions involve a commitment by the Portfolio to purchase or sell securities for a predetermined price or yield, with payment and delivery taking place beyond the customary settlement period. When delayed delivery purchases are outstanding, the Portfolio will designate liquid assets in an amount sufficient to meet the purchase price. When purchasing a security on a delayed delivery basis, the Portfolio assumes the rights and risks of
Notes to Financial Statements (Unaudited) (continued)
ownership of the security, including the risk of price and yield fluctuations, and takes such fluctuations into account when determining its NAV. The Portfolio may dispose of or renegotiate a delayed delivery transaction after it is entered into, and may sell delayed delivery securities before they are delivered, which may result in a realized gain or loss. When the Portfolio has sold a security it owns on a delayed delivery basis, the Portfolio does not participate in future gains and losses with respect to the security. As of June 30, 2021, delayed delivery transactions are shown in the Portfolio of Investments.
(K) Debt Securities Risk. The ability of issuers of debt securities held by the Portfolio to meet their obligations may be affected by, among other things, economic or political developments in a specific country, industry or region. Debt securities are also subject to the risks associated with changes in interest rates.
Investments in the Portfolio are not guaranteed, even though some of the Portfolio’s underlying investments are guaranteed by the U.S. government or its agencies or instrumentalities. The principal risk of mortgage-related and asset-backed securities is that the underlying debt may be prepaid ahead of schedule, if interest rates fall, thereby reducing the value of the Portfolio’s investment. If interest rates rise, less of the debt may be prepaid and the Portfolio may lose money because the Portfolio may be unable to invest in higher yielding assets. The Portfolio is subject to interest-rate risk and can lose principal value when interest rates rise. Bonds are also subject to credit risk, in which the bond issuer may fail to pay interest and principal in a timely manner.
The Portfolio may invest in foreign debt securities, which carry certain risks that are in addition to the usual risks inherent in domestic instruments. These risks include those resulting from currency fluctuations, future adverse political or economic developments and possible imposition of currency exchange blockages or other foreign governmental laws or restrictions. These risks are likely to be greater in emerging markets than in developed markets.
(L) LIBOR Replacement Risk. The Portfolio may invest in certain debt securities, derivatives or other financial instruments that utilize the London Interbank Offered Rate ("LIBOR"), as a “benchmark” or “reference rate” for various interest rate calculations. The United Kingdom Financial Conduct Authority, which regulates LIBOR, announced that after 2021 it will cease its active encouragement of banks to provide the quotations needed to sustain LIBOR. However, it is possible that certain LIBOR tenors may continue beyond 2021 and the most widely used LIBOR tenors may continue until mid-2023. As a result, it is anticipated that LIBOR will be discontinued or will no longer be sufficiently robust to be representative of its underlying market around that time. Although financial regulators and industry working groups have suggested alternative reference rates, such as European Interbank Offer Rate (“EURIBOR”), Sterling Overnight Interbank Average Rate (“SONIA”) and Secured Overnight Financing Rate (“SOFR”), there are challenges to converting certain contracts and transactions to a new benchmark and neither the full effects of the transition process nor its ultimate outcome is known. New York Life
Investments is currently working to assess exposure and will modify contracts as necessary.
The elimination of LIBOR or changes to other reference rates or any other changes or reforms to the determination or supervision of reference rates could have an adverse impact on the market for, or value of, any securities or payments linked to those reference rates, which may adversely affect the Portfolio's performance and/or net asset value. Uncertainty and risk also remain regarding the willingness and ability of issuers and lenders to include revised provisions in new and existing contracts or instruments. Consequently, the transition away from LIBOR to other reference rates may lead to increased volatility and illiquidity in markets that are tied to LIBOR, fluctuations in values of LIBOR-related investments or investments in issuers that utilize LIBOR, increased difficulty in borrowing or refinancing and diminished effectiveness of hedging strategies, adversely affecting the Portfolio's performance. Furthermore, the risks associated with the expected discontinuation of LIBOR and transition may be exacerbated if the work necessary to effect an orderly transition to an alternative reference rate is not completed in a timely manner. Because the usefulness of LIBOR as a benchmark could deteriorate during the transition period, these effects could occur prior to the end of 2021 with respect to certain LIBOR tenors or mid-2023 for the remaining LIBOR tenors.
(M) Indemnifications. Under the Fund’s organizational documents, its officers and trustees are indemnified against certain liabilities that may arise out of performance of their duties to the Fund. Additionally, in the normal course of business, the Portfolio enters into contracts with third-party service providers that contain a variety of representations and warranties and that may provide general indemnifications. The Portfolio's maximum exposure under these arrangements is unknown, as this would involve future claims that may be made against the Portfolio that have not yet occurred. The Manager believes that the risk of loss in connection with these potential indemnification obligations is remote. However, there can be no assurance that material liabilities related to such obligations will not arise in the future, which could adversely impact the Portfolio.
(N) Quantitative Disclosure of Derivative Holdings. The following tables show additional disclosures related to the Portfolio's derivative and hedging activities, including how such activities are accounted for and their effect on the Portfolio's financial positions, performance and cash flows.
The Portfolio entered into futures contracts in order to hedge against anticipated changes in interest rates that might otherwise have an adverse effect upon the value of the Portfolio's securities as well as help manage the duration and yield curve positioning of the portfolio. These derivatives are not accounted for as hedging instruments.
| 30 | MainStay VP Bond Portfolio |
Fair value of derivative instruments as of June 30, 2021:
| Asset Derivatives | Interest
Rate
Contracts
Risk | Total |
| Futures Contracts - Net Assets—Net unrealized appreciation on futures contracts (a) | $1,336,943 | $1,336,943 |
| Total Fair Value | $1,336,943 | $1,336,943 |
| (a) | Includes cumulative appreciation (depreciation) of futures contracts as reported in the Portfolio of Investments. Only current day’s variation margin is reported within the Statement of Assets and Liabilities. |
| Liability Derivatives | Interest
Rate
Contracts
Risk | Total |
| Futures Contracts - Net Assets—Net unrealized depreciation on futures contracts (a) | $(862,122) | $(862,122) |
| Total Fair Value | $(862,122) | $(862,122) |
| (a) | Includes cumulative appreciation (depreciation) of futures contracts as reported in the Portfolio of Investments. Only current day’s variation margin is reported within the Statement of Assets and Liabilities. |
The effect of derivative instruments on the Statement of Operations for the six-month period ended June 30, 2021:
| Net Realized Gain (Loss) from: | Interest
Rate
Contracts
Risk | Total |
| Futures Contracts | $(1,233,416) | $(1,233,416) |
| Total Net Realized Gain (Loss) | $(1,233,416) | $(1,233,416) |
| Net Change in Unrealized Appreciation (Depreciation) | Interest
Rate
Contracts
Risk | Total |
| Futures Contracts | $492,693 | $492,693 |
| Total Net Change in Unrealized Appreciation (Depreciation) | $492,693 | $492,693 |
| Average Notional Amount | Total |
| Futures Contracts Long | $106,362,600 |
| Futures Contracts Short | $ (61,107,099) |
Note 3–Fees and Related Party Transactions
(A) Manager and Subadvisor. New York Life Investments, a registered investment adviser and an indirect, wholly-owned subsidiary of New York Life, serves as the Portfolio's Manager pursuant to an Amended and Restated Management Agreement ("Management Agreement"). The Manager provides offices, conducts clerical, recordkeeping and bookkeeping services and keeps most of the financial and accounting records required to be maintained by the Portfolio. Except for the portion of salaries and expenses that are the responsibility of the Portfolio, the
Manager pays the salaries and expenses of all personnel affiliated with the Portfolio and certain operational expenses of the Portfolio. The Portfolio reimburses New York Life Investments in an amount equal to the portion of the compensation of the Chief Compliance Officer attributable to the Portfolio. NYL Investors LLC ("NYL Investors" or ''Subadvisor''), a registered investment adviser and a direct, wholly-owned subsidiary of New York Life, serves as Subadvisor to the Portfolio and is responsible for the day-to-day portfolio management of the Portfolio. Pursuant to the terms of a Subadvisory Agreement ("Subadvisory Agreement") between New York Life Investments and NYL Investors, New York Life Investments pays for the services of the Subadvisor.
Pursuant to the Management Agreement, the Fund pays the Manager, on behalf of the Portfolio, a monthly fee for the services performed and the facilities furnished at an annual rate of the Portfolio's average daily net assets as follows: 0.50% up to $500 million; 0.475% from $500 million to $1 billion; 0.45% from $1 billion to $3 billion; and 0.44% in excess of $3 billion. During the six-month period ended June 30, 2021, the effective management fee rate was 0.49%.
During the six-month period ended June 30, 2021, New York Life Investments earned fees from the Portfolio in the amount of $2,223,031 and paid the Subadvisor fees in the amount of $1,111,454.
JPMorgan provides sub-administration and sub-accounting services to the Portfolio pursuant to an agreement with New York Life Investments. These services include calculating the daily NAVs of the Portfolio, maintaining the general ledger and sub-ledger accounts for the calculation of the Portfolio's NAVs, and assisting New York Life Investments in conducting various aspects of the Portfolio's administrative operations. For providing these services to the Portfolio, JPMorgan is compensated by New York Life Investments.
Prior to February 22, 2021, these services were provided by State Street Bank and Trust Company ("State Street").
Pursuant to an agreement between the Fund and New York Life Investments, New York Life Investments is responsible for providing or procuring certain regulatory reporting services for the Portfolio. The Portfolio will reimburse New York Life Investments for the actual costs incurred by New York Life Investments in connection with providing or procuring these services for the Portfolio.
(B) Distribution and Service Fees. The Fund, on behalf of the Portfolio, has entered into a distribution agreement with NYLIFE Distributors LLC (the “Distributor”), an affiliate of New York Life Investments. The Portfolio has adopted a distribution plan (the “Plan”) in accordance with the provisions of Rule 12b-1 under the 1940 Act. Under the Plan, the Distributor has agreed to provide, through its affiliates or independent third parties, various distribution-related, shareholder and administrative support services to the Service Class shareholders. For its services, the Distributor is entitled to a combined distribution and service fee accrued daily and paid monthly at an annual rate of 0.25% of the average daily net assets attributable to the Service Class shares of the Portfolio.
Notes to Financial Statements (Unaudited) (continued)
Note 4-Federal Income Tax
As of June 30, 2021, the cost and unrealized appreciation (depreciation) of the Portfolio’s investment portfolio, including applicable derivative contracts and other financial instruments, as determined on a federal income tax basis, were as follows:
| | Federal Tax
Cost | Gross
Unrealized
Appreciation | Gross
Unrealized
(Depreciation) | Net
Unrealized
Appreciation/
(Depreciation) |
| Investments in Securities | $905,856,104 | $24,941,962 | $(3,405,863) | $21,536,099 |
During the year ended December 31, 2020, the tax character of distributions paid as reflected in the Statements of Changes in Net Assets was as follows:
| | 2020 |
| Distributions paid from: | |
| Ordinary Income | $19,483,513 |
Note 5–Custodian
JPMorgan is the custodian of cash and securities held by the Portfolio. Custodial fees are charged to the Portfolio based on the Portfolio's net assets and/or the market value of securities held by the Portfolio and the number of certain transactions incurred by the Portfolio.
Prior to February 22, 2021, these services were provided by State Street. The services provided by State Street were a direct expense of the Portfolio and are included in the Statement of Operations as Custodian fees which totaled $6,896 for the period January 1, 2021 through February 21, 2021.
Note 6–Line of Credit
The Portfolio and certain other funds managed by New York Life Investments maintain a line of credit with a syndicate of banks in order to secure a source of funds for temporary purposes to meet unanticipated or excessive redemption requests.
Effective July 27, 2021, under the credit agreement (the “Credit Agreement”), the aggregate commitment amount is $600,000,000 with an additional uncommitted amount of $100,000,000. The commitment fee is an annual rate of 0.15% of the average commitment amount payable quarterly, regardless of usage, to JPMorgan, who serves as the agent to the syndicate. The commitment fee is allocated among the Portfolio and certain other funds managed by New York Life Investments based upon their respective net assets and other factors. Interest on any revolving credit loan is charged based upon the Federal Funds Rate or the one-month LIBOR, whichever is higher. The Credit Agreement expires on July 26, 2022, although the Portfolio, certain other funds managed by New York Life Investments and the syndicate of banks may renew the Credit Agreement for an additional year on the same or different terms or enter into a credit agreement with a different syndicate of banks. Prior to
July 27, 2021, the aggregate commitment amount and the commitment fee were the same as those under the current Credit Agreement. During the six-month period ended June 30, 2021, there were no borrowings made or outstanding with respect to the Portfolio under the Credit Agreement.
Note 7–Interfund Lending Program
Pursuant to an exemptive order issued by the SEC, the Portfolio, along with certain other funds managed by New York Life Investments, may participate in an interfund lending program. The interfund lending program provides an alternative credit facility that permits the Portfolio and certain other funds managed by New York Life Investments to lend or borrow money for temporary purposes directly to or from one another, subject to the conditions of the exemptive order. During the six-month period ended June 30, 2021, there were no interfund loans made or outstanding with respect to the Portfolio.
Note 8–Purchases and Sales of Securities (in 000’s)
During the six-month period ended June 30, 2021, purchases and sales of U.S. government securities were $578,501 and $561,203, respectively. Purchases and sales of securities, other than U.S. government securities and short-term securities, were $739,344 and $798,594 respectively.
Note 9–Capital Share Transactions
Transactions in capital shares for the six-month period ended June 30, 2021 and the year ended December 31, 2020, were as follows:
| Initial Class | Shares | Amount |
| Period ended June 30, 2021: | | |
| Shares sold | 5,493,072 | $ 82,874,998 |
| Shares redeemed | (9,010,096) | (136,154,316) |
| Net increase (decrease) | (3,517,024) | $ (53,279,318) |
| Year ended December 31, 2020: | | |
| Shares sold | 8,066,603 | $ 123,217,088 |
| Shares issued to shareholders in reinvestment of distributions | 574,551 | 8,712,379 |
| Shares redeemed | (5,265,667) | (79,188,768) |
| Net increase (decrease) | 3,375,487 | $ 52,740,699 |
| |
| 32 | MainStay VP Bond Portfolio |
| Service Class | Shares | Amount |
| Period ended June 30, 2021: | | |
| Shares sold | 2,033,355 | $ 30,402,904 |
| Shares redeemed | (1,400,733) | (20,951,612) |
| Net increase (decrease) | 632,622 | $ 9,451,292 |
| Year ended December 31, 2020: | | |
| Shares sold | 10,093,014 | $ 151,206,421 |
| Shares issued to shareholders in reinvestment of distributions | 718,296 | 10,771,134 |
| Shares redeemed | (5,549,124) | (47,384,751) |
| Net increase (decrease) | 5,262,186 | $ 79,748,772 |
Note 10–Other Matters
An outbreak of COVID-19, first detected in December 2019, has developed into a global pandemic and has resulted in travel restrictions, closure of international borders, certain businesses and securities markets, restrictions on securities trading activities, prolonged quarantines, supply chain disruptions, and lower consumer demand, as well as general concern and uncertainty. The continued impact of COVID-19 and related new variants is uncertain and could further adversely affect the global economy, national economies, individual issuers and capital markets in unforeseeable ways and result in a substantial and extended economic downturn. Developments that disrupt global economies and financial markets, such as COVID-19, may magnify factors that affect the Portfolio's performance.
Note 11–Subsequent Events
In connection with the preparation of the financial statements of the Portfolio as of and for the six-month period ended June 30, 2021, events and transactions subsequent to June 30, 2021, through the date the financial statements were issued have been evaluated by the Manager for possible adjustment and/or disclosure. No subsequent events requiring financial statement adjustment or disclosure have been identified.
Discussion of the Operation and Effectiveness of the Portfolio's Liquidity Risk Management Program (Unaudited)
In compliance with Rule 22e-4 under the Investment Company Act of 1940, as amended (the “Liquidity Rule”), the Portfolio has adopted and implemented a liquidity risk management program (the “Program”), which New York Life Investment Management LLC believes is reasonably designed to assess and manage the Portfolio's liquidity risk (the risk that the Portfolio could not meet requests to redeem shares issued by the Portfolio without significant dilution of remaining investors’ interests in the Portfolio). The Board of Trustees of MainStay VP Funds Trust (the "Board") designated New York Life Investment Management LLC as administrator of the Program (the “Administrator”). The Administrator has established a Liquidity Risk Management Committee to assist the Administrator in the implementation and day-to-day administration of the Program and to otherwise support the Administrator in fulfilling its responsibilities under the Program.
At a meeting of the Board held on March 8, 2021, the Administrator provided the Board with a written report addressing the Program’s operation and assessing its adequacy and effectiveness of implementation for the period from January 1, 2020 through December 31, 2020 (the "Review Period"), as required under the Liquidity Rule. The report noted that the Administrator concluded that (i) the Program operated effectively to assess and manage the Portfolio's liquidity risk, (ii) the Program has been adequately and effectively implemented to monitor and, as applicable, respond to the Portfolio's liquidity developments and (iii) the Portfolio's investment strategy continues to be appropriate for an open-end fund. In addition, the report discussed notable events that impacted liquidity risk during the Review Period, including the COVID-19 pandemic and the resulting economic shutdown.
In accordance with the Program, the Portfolio's liquidity risk is assessed no less frequently than annually taking into consideration certain factors, as applicable, such as (i) investment strategy and liquidity of portfolio investments, (ii) short-term and long-term cash flow projections and (iii) holdings of cash and cash equivalents, as well as borrowing arrangements and other funding sources. Certain factors are considered under both normal and reasonably foreseeable stressed conditions.
Each Portfolio portfolio investment is classified into one of four liquidity categories. The classification is based on a determination of the number of days it is reasonably expected to take to convert the investment into cash, or sell or dispose of the investment, in current market conditions without significantly changing the market value of the investment. The Administrator has delegated liquidity classification determinations to the Portfolio’s subadvisor, subject to appropriate oversight by the Administrator, and classification determinations are made by taking into account the Portfolio's reasonably anticipated trade size, various market, trading and investment-specific considerations, as well as market depth, and, in certain cases, third-party vendor data.
The Liquidity Rule requires portfolios that do not primarily hold assets that are highly liquid investments to adopt a minimum amount of net assets that must be invested in highly liquid investments that are assets (an “HLIM”). In addition, the Liquidity Rule limits a portfolio's investments in illiquid investments. Specifically, the Liquidity Rule prohibits acquisition of illiquid investments if doing so would result in a portfolio holding more than 15% of its net assets in illiquid investments that are assets. The Program includes provisions reasonably designed to determine, periodically review and comply with the HLIM requirement, as applicable, and to comply with the 15% limit on illiquid investments.
There can be no assurance that the Program will achieve its objectives under all circumstances in the future. Please refer to the Portfolio's prospectus for more information regarding the Portfolio's exposure to liquidity risk and other risks to which it may be subject.
| 34 | MainStay VP Bond Portfolio |
Proxy Voting Record
The Portfolio is required to file with the SEC its proxy voting records for the 12-month period ending June 30 on Form N-PX. The Portfolio's most recent Form N-PX or proxy voting record is available free of charge upon request (i) by calling 800-598-2019; (ii) by visiting New York Life Investments’ website at https://www.nylinvestments.com/mainstay/
products-and-performance/mainstay-vp-funds-trust; or (iii) by visiting the SEC’s website at www.sec.gov.
Shareholder Reports and Quarterly Portfolio Disclosure
The Portfolio is required to file with the SEC its proxy voting records for the 12-month period ending June 30 on Form N-PX. The Portfolio's most recent Form N-PX or proxy voting record is available free of charge upon request (i) by calling 800-598-2019; (ii) by visiting New York Life Investments’ website at https://www.nylinvestments.com/mainstay/
products-and-performance/mainstay-vp-funds-trust; or (iii) by visiting the SEC’s website at www.sec.gov.
This page intentionally left blank
This page intentionally left blank.
This page intentionally left blank.
MainStay VP Portfolios
MainStay VP offers a wide range of Portfolios. The full array of MainStay VP offerings is listed here, with information about the manager, subadvisors, legal counsel, and independent registered public accounting firm.
Equity
MainStay VP Candriam Emerging Markets Equity Portfolio
MainStay VP Epoch U.S. Equity Yield Portfolio
MainStay VP Fidelity Institutional AM® Utilities Portfolio†
MainStay VP MacKay International Equity Portfolio
MainStay VP MacKay S&P 500 Index Portfolio
MainStay VP Natural Resources Portfolio
MainStay VP Small Cap Growth Portfolio
MainStay VP T. Rowe Price Equity Income Portfolio
MainStay VP Wellington Growth Portfolio
MainStay VP Wellington Mid Cap Portfolio
MainStay VP Wellington Small Cap Portfolio
MainStay VP Wellington U.S. Equity Portfolio
MainStay VP Winslow Large Cap Growth Portfolio
Mixed Asset
MainStay VP Balanced Portfolio
MainStay VP Income Builder Portfolio
MainStay VP Janus Henderson Balanced Portfolio
MainStay VP MacKay Convertible Portfolio
Income
MainStay VP Bond Portfolio
MainStay VP Floating Rate Portfolio
MainStay VP Indexed Bond Portfolio
MainStay VP MacKay Government Portfolio
MainStay VP MacKay High Yield Corporate Bond Portfolio
MainStay VP MacKay Strategic Bond Portfolio
MainStay VP PIMCO Real Return Portfolio
Money Market
MainStay VP U.S. Government Money Market Portfolio
Alternative
MainStay VP CBRE Global Infrastructure Portfolio
MainStay VP IQ Hedge Multi-Strategy Portfolio
Asset Allocation
MainStay VP Conservative Allocation Portfolio
MainStay VP Equity Allocation Portfolio
MainStay VP Growth Allocation Portfolio
MainStay VP Moderate Allocation Portfolio
Manager
New York Life Investment Management LLC
New York, New York
Subadvisors
Brown Advisory LLC
Baltimore, Maryland
Candriam Belgium S.A.*
Brussels, Belgium
CBRE Clarion Securities LLC
Radnor, Pennsylvania
Epoch Investment Partners, Inc.
New York, New York
FIAM LLC
Smithfield, Rhode Island
IndexIQ Advisors LLC*
New York, New York
Janus Capital Management LLC
Denver, Colorado
MacKay Shields LLC*
New York, New York
Mellon Investments Corporation
Boston, Massachusetts
NYL Investors LLC*
New York, New York
Pacific Investment Management Company LLC
Newport Beach, California
Segall Bryant & Hamill, LLC
Chicago, Illinois
T. Rowe Price Associates, Inc.
Baltimore, Maryland
Wellington Management Company LLP
Boston, Massachusetts
Winslow Capital Management, LLC
Minneapolis, Minnesota
Legal Counsel
Dechert LLP
Washington, District of Columbia
Independent Registered Public Accounting Firm
PricewaterhouseCoopers LLP
New York, New York
Distributor
NYLIFE Distributors LLC*
Jersey City, New Jersey
Custodian
JPMorgan Chase Bank, N.A.
New York, New York
Some Portfolios may not be available in all products.
† Fidelity Institutional AM is a registered trade mark of FMR LLC. Used with permission.
* An affiliate of New York Life Investment Management LLC
Not part of the Semiannual Report
2021 Semiannual Report
This report is for the general information of New York Life Variable Annuities and NYLIAC Variable Universal Life Insurance Products policyowners. It must be preceded or accompanied by the appropriate product(s) and funds prospectuses if it is given to anyone who is not an owner of a New York Life variable annuity policy or a NYLIAC Variable Universal Life Insurance Product. This report does not offer for sale or solicit orders to purchase securities.
The performance data quoted in this report represents past performance. Past performance is no guarantee of future results. Due to market volatility and other factors, current performance may be lower or higher than the figures shown. The most recent month-end performance summary for your variable annuity or variable life policy is available by calling 800-598-2019 and is updated periodically on newyorklife.com.
The New York Life Variable Annuities and NYLIAC Variable Universal Life Insurance Products are issued by New York Life Insurance and Annuity Corporation (a Delaware Corporation) and distributed by NYLIFE Distributors LLC (Member FINRA/SIPC).
New York Life Insurance Company
New York Life Insurance and Annuity
Corporation (NYLIAC) (A Delaware Corporation)
51 Madison Avenue, Room 551
New York, NY 10010
newyorklife.com
nylinvestments.com
NYLIFE Distributors LLC, 30 Hudson Street, Jersey City, NJ 07302
New York Life Investment Management LLC is the investment manager to the MainStay VP Funds Trust
©2021 by NYLIFE Distributors LLC. All rights reserved.
You may obtain copies of the Prospectus and the Statement of Additional Information free of charge, upon request, by calling toll-free 800-598-2019 or writing to New York Life Insurance and Annuity Corporation, 51 Madison Avenue, New York, NY 10010.
| Not FDIC Insured | No Bank Guarantee | May Lose Value |
(NYLIAC) NI509
MainStay VP MacKay Government Portfolio
Message from the President and Semiannual Report
Unaudited | June 30, 2021
Sign up for e-delivery of your shareholder reports. For full details on e-delivery, including who can participate and what you can receive via e-delivery,
please log in to newyorklifeinvestments.com/accounts.
| Not FDIC/NCUA Insured | Not a Deposit | May Lose Value | No Bank Guarantee | Not Insured by Any Government Agency |
This page intentionally left blank
Message from the President
The COVID-19 pandemic continued to afflict our personal lives and broad segments of the U.S. and global economy throughout the six-month reporting period ended June 30, 2021. However, with the deployment of multiple vaccines around the world, including three highly effective versions approved for emergency use in the United States, investors began to turn their attention toward the gradual reopening of the economy and the shape the “new normal” would take.
The first half of the reporting period saw increasing inflationary concerns as fiscal stimulus business reopenings drove accelerating economic growth, rising commodity prices and increased consumer spending. However, the U.S. Federal Reserve noted that price increases were likely to prove temporary and made clear their intention to remain accommodative for the foreseeable future. Accordingly, after moving higher in the first quarter of 2021, interest rates declined in the second quarter.
In response to the uncertain inflation outlook, equity market leadership shifted from value in the first quarter of the year to growth in the second quarter. Nevertheless, investor sentiment remained buoyant throughout the reporting period, with all eleven sectors in the S&P 500® Index, a widely regarded benchmark of market performance, producing positive returns. Energy led the market’s rise fueled by rapidly increasing oil and gas prices, followed by financials and real estate, which benefited from rising interest rates and the economic reopening, respectively. Communication services produced the slowest growth, followed by the traditionally defensive utilities and consumer staples
sectors. In the fixed income market, lower-credit-quality issues tended to outperform their higher-grade counterparts, with high-yield corporate bonds generating the strongest performance. Among securitized products, commercial mortgage-backed securities generally produced the strongest returns, followed by mortgage-backed securities and asset-backed securities, while Treasury securities lagged.
Despite the tremendous progress we’ve seen so far this year, the United States and the world continue to face significant pandemic-related challenges. Newer, more contagious variants of COVID-19 threaten the return of restrictions and lockdowns that could stall the economic recovery. At the same time, supply chain shortages have led to rising prices on everything from laptops to autos, stoking fears of uncontrolled inflation despite reassurance from the U.S. Federal Reserve. At New York Life Investments, we recognize that the shape that the “new normal” eventually takes may differ from our expectations. You can depend on us to keep a sharp watch for the unexpected, and to continue to help you find your way through this rapidly evolving investment landscape.
Sincerely,
Kirk C. Lehneis
President
The opinions expressed are as of the date of this report and are subject to change. There is no guarantee that any forecast made will come to pass. This material does not constitute investment advice and is not intended as an endorsement of any specific investment. Past performance is no guarantee of future results.
Not part of the Semiannual Report
Investors should refer to the Portfolio’s Summary Prospectus and/or Prospectus and consider the Portfolio’s investment objectives, strategies, risks, charges and expenses carefully before investing. The Summary Prospectus and/or Prospectus contain this and other information about the Portfolio. You may obtain copies of the Portfolio’s Summary Prospectus and/or the Prospectus and the Statement of Additional Information free of charge, upon request, by calling toll-free 800-598-2019, by writing to New York Life Insurance and Annuity Corporation, 51 Madison Avenue, Room 251, New York, New York 10010 or by sending an email to MainStayShareholdersServices@nylim.com. These documents are also available at nylinvestments.com/vpdocuments. Please read the Portfolio's Summary Prospectus and/or Prospectus carefully before investing. MainStay VP Funds Trust portfolios are separate account options which are purchased through a variable insurance or variable annuity contract.
Investment and Performance Comparison (Unaudited)
Performance data quoted represents past performance. Past performance is no guarantee of future results. Because of market volatility and other factors, current performance may be lower or higher than the figures shown. Investment return and principal value will fluctuate, and as a result, when shares are redeemed, they may be worth more or less than their original cost. The performance table and graph do not reflect any deduction of sales charges, mortality and expense charges, contract charges or administrative charges. Please refer to the Performance Summary appropriate for your policy. For performance information current to the most recent month-end, please call 800-598-2019 or visit www.newyorklife.com.
Performance figures may reflect certain fee waivers and/or expense limitations, without which total returns may have been different. For information on current fee waivers and/or expense limitations (if any), please refer to the Notes to Financial Statements.
| Average Annual Total Returns for the Period-Ended June 30, 2021 |
| Class | Inception
Date | Six
Months | One
Year | Five
Years | Ten
Years | Gross
Expense
Ratio1 |
| Initial Class Shares | 1/29/1993 | -1.03% | -0.37% | 1.80% | 2.25% | 0.56% |
| Service Class Shares | 6/4/2003 | -1.15 | -0.61 | 1.55 | 1.99 | 0.81 |
| 1. | The gross expense ratios presented reflect the Portfolio’s “Total Annual Portfolio Operating Expenses” from the most recent Prospectus, as supplemented, and may differ from other expense ratios disclosed in this report. |
| Benchmark Performance | Six
Months | One
Year | Five
Years | Ten
Years |
| Bloomberg Barclays U.S. Government Bond Index1 | -2.51% | -3.10% | 2.19% | 2.78% |
| Morningstar Intermediate Government Category Average2 | -1.41 | -1.15 | 1.86 | 2.19 |
| 1. | The Bloomberg Barclays U.S. Government Bond Index is the Portfolio’s primary benchmark. The Bloomberg Barclays U.S. Government Bond Index is a broad-based benchmark that consists of publicly issued debt of the U.S. Treasury and government agencies. Results assume the reinvestment of all income and capital gains. An investment cannot be made directly in an index. |
| 2. | The Morningstar Intermediate Government Category Average is representative of funds that have at least 90% of their bond holdings in bonds backed by U.S. government or by U.S. government-linked agencies. These funds have durations between 3.5 and 6 years and/or average effective maturities between 4 and 10 years. Results are based on average total returns of similar funds with all dividends and capital gain distributions reinvested. |
Cost in Dollars of a $1,000 Investment in MainStay VP MacKay Government Portfolio (Unaudited)
The example below is intended to describe the fees and expenses borne by shareholders during the six-month period from January 1, 2021 to June 30, 2021, and the impact of those costs on your investment.
Example
As a shareholder of the Portfolio you incur two types of costs: (1) transaction costs, including exchange fees and sales charges (loads) on purchases (as applicable), and (2) ongoing costs, including management fees, distribution and/or service (12b-1) fees, and other Portfolio expenses (as applicable). This example is intended to help you understand your ongoing costs (in dollars) of investing in the Portfolio and to compare these costs with the ongoing costs of investing in other mutual funds. The example is based on an investment of $1,000 made at the beginning of the six-month period and held for the entire period from January 1, 2021 to June 30, 2021. Shares are only sold in connection with variable life and annuity contracts and the example does not reflect any contract level or transactional fees or expenses. If these costs had been included, your costs would have been higher.
This example illustrates your Portfolio’s ongoing costs in two ways:
Actual Expenses
The second and third data columns in the table below provide information about actual account values and actual expenses. You may use the information in these columns, together with the amount you invested, to estimate the expenses that you paid during the six months ended June
30, 2021. Simply divide your account value by $1,000 (for example, an $8,600 account value divided by $1,000 = 8.6), then multiply the result by the number under the heading entitled “Expenses Paid During Period” to estimate the expenses you paid on your account during this period.
Hypothetical Example for Comparison Purposes
The fourth and fifth data columns in the table below provide information about hypothetical account values and hypothetical expenses based on the Portfolio’s actual expense ratio and an assumed rate of return of 5% per year before expenses, which is not the Portfolio’s actual return. The hypothetical account values and expenses may not be used to estimate the actual ending account balances or expenses you paid for the six-month period shown. You may use this information to compare the ongoing costs of investing in the Portfolio with the ongoing costs of investing in other mutual funds. To do so, compare this 5% hypothetical example with the 5% hypothetical examples that appear in the shareholder reports of the other mutual funds.
Please note that the expenses shown in the table are meant to highlight your ongoing costs only and do not reflect any transactional costs, such as exchange fees or sales charges (loads). Therefore, the fourth and fifth data columns of the table are useful in comparing ongoing costs only and will not help you determine the relative total costs of owning different funds. In addition, if these transactional costs were included, your costs would have been higher.
| Share Class | Beginning
Account
Value
1/1/21 | Ending Account
Value (Based
on Actual
Returns and
Expenses)
6/30/21 | Expenses
Paid
During
Period1 | Ending Account
Value (Based
on Hypothetical
5% Annualized
Return and
Actual Expenses)
6/30/21 | Expenses
Paid
During
Period1 | Net Expense
Ratio
During
Period2 |
| Initial Class Shares | $1,000.00 | $989.70 | $2.71 | $1,022.07 | $2.76 | 0.55% |
| Service Class Shares | $1,000.00 | $988.50 | $3.94 | $1,020.83 | $4.01 | 0.80% |
| 1. | Expenses are equal to the Portfolio’s annualized expense ratio of each class multiplied by the average account value over the period, divided by 365 and multiplied by 181 (to reflect the six-month period). The table above represents the actual expenses incurred during the six-month period. In addition to the fees and expenses which the Portfolio bears directly, it also indirectly bears a pro rata share of the fees and expenses of the underlying funds in which it invests. Such indirect expenses are not included in the above-reported expense figures. |
| 2. | Expenses are equal to the Portfolio's annualized expense ratio to reflect the six-month period. |
| 6 | MainStay VP MacKay Government Portfolio |
Portfolio Composition as of June 30, 2021 (Unaudited)
See Portfolio of Investments beginning on page 10 for specific holdings within these categories. The Portfolio's holdings are subject to change.
Top Ten Issuers Held as of June 30, 2021 (excluding short-term investment) (Unaudited)
| 1. | UMBS, 30 Year, 2.00%-6.50%, due 7/1/39–4/1/51 |
| 2. | U.S. Treasury Notes, 0.375%-3.00%, due 7/31/23–2/15/30 |
| 3. | UMBS, 30 Year, 2.00%-3.50%, due 6/1/46–1/1/51 |
| 4. | U.S. Treasury Inflation Linked Notes, 0.125%-0.875%, due 1/15/29–7/15/30 |
| 5. | FNMA, 1.25%-3.50%, due 3/25/33–3/25/60 |
| 6. | FHLMC Gold Pools, 30 Year, 2.50%-6.50%, due 4/1/37–3/1/49 |
| 7. | GNMA, 1.00%-3.25%, due 8/16/41–6/20/51 |
| 8. | U.S. Treasury Bonds, 3.00%-4.375%, due 11/15/39–2/15/48 |
| 9. | Small Business Administration Participation Certificates, 1.93%-3.31%, due 12/1/32–4/1/38 |
| 10. | FNMA, Other, 2.50%-6.50%, due 4/1/25–6/1/57 |
Portfolio Management Discussion and Analysis (Unaudited)
Answers to the questions reflect the views of portfolio managers, Steven H. Rich, Stephen R. Cianci, CFA, and Neil Moriarty III, of MacKay Shields LLC, the Portfolio’s Subadvisor.
How did MainStay VP MacKay Government Portfolio perform relative to its benchmark and peers during the six months ended June 30, 2021?
For the six months ended June 30, 2021, MainStay VP MacKay Government Portfolio returned −1.03% for Initial Class shares and −1.15% for Service Class shares. Over the same period, both share classes outperformed the −2.51% return of the Bloomberg Barclays U.S. Government Bond Index (“the Index”), which is the Portfolio’s primary benchmark, and outperformed the –1.41% return of the Morningstar Intermediate Government Category Average.1
What factors affected the Portfolio’s relative performance during the reporting period?
Duration,2 yield-curve3 posture, sector weighting and issue selection were the four factors primarily affecting the Portfolio’s performance relative to the Index.
Duration and yield-curve posture: As the financial markets anticipated the salutary impact of a COVID-19 vaccine, Treasury yields rose and the yield curve steepened. The steepening slowed toward the end of the reporting period as U.S. Federal Reserve commentary signaled the agency might become less accommodative of inflationary pressures. The Portfolio benefited from the backdrop of higher yields and a steeper curve. The Portfolio’s shorter duration made it less sensitive than the Index and longer-duration peers to changes in Treasury yields. On yield-curve posture, the steepening of the yield curve advantaged the Portfolio relative to the Index and peers with assets more concentrated in the long end of the yield curve.
Sector weighting: Agency residential mortgage-backed securities were the largest class of securities held in the Portfolio. Our commitment to the mortgage sector imparted a yield advantage over lower-yielding Treasury securities and agency debentures. However, the interest-rate volatility that prevailed during most of the reporting period chipped away at the Portfolio’s yield advantage.
Issue Selection: The Portfolio’s mortgage exposure emphasized seasoned loans (i.e., loans originated in prior years) and low-balance loans. Mortgage passthroughs backed by loans with these characteristics often have more stable cash-flow profiles. As lower mortgage rates prompted borrowers to refinance, the negative-return impact of accelerating prepayments was more extreme than in recent prior reporting periods. This dynamic led the market to recalibrate the value of cash-flow stability, which boosted price performance for seasoning and loan balance.
Similarly, the Portfolio benefited from the stability of its collateralized mortgage obligations, which are structured to dampen cash-flow variability.
During the reporting period, how was the Portfolio’s performance materially affected by investments in derivatives?
The Portfolio used Treasury futures to manage duration. This position had minimal impact on performance.
What was the Portfolio’s duration strategy during the reporting period?
As Treasury yields and mortgage rates rose, the Portfolio’s duration extended from 3.0 to 3.8 years, while the Index’s duration shortened from 7.1 years to 6.9 years. The Portfolio’s duration typically lengthens as Treasury yields rise because of its exposure to single-family residential mortgage-backed securities. Mortgage rates move directionally with Treasury rates. Higher mortgage rates crimp refinancing opportunities and, in turn, slow prepayments. Higher yields have the opposite effect on the Index’s duration due to its positive convexity.4
A duration near 4.0 years was our preferred spot for the Portfolio during the reporting period. Extending duration to pick up yield did not appear to be a compelling trade off. Moving out the curve presented the risk of negative price return should Treasury yields rise, and this effect could have readily eroded the yield advantage of longer maturities.
During the reporting period, which market segments were the strongest positive contributors to the Portfolio’s absolute performance and which market segments were particularly weak?
The Portfolio’s commitment to agency multifamily mortgage-backed securities made a positive contribution to absolute performance during the reporting period. (Contributions take weightings and total returns into account.) Agency multifamily mortgage-backed securities are backed by FNMA- or FHMLC-guaranteed mortgages on larger multifamily developments and apartment buildings. (FNMA stands for Federal National Mortgage Association, also known as Fannie Mae. FHMLC stands for Federal Home Loan Mortgage Corporation, also known as Freddie Mac.) Multifamily mortgages are typically not freely prepayable like single-family mortgages and, consequently, they amortize more slowly. Investors crossed over to multifamily from single family, attracted to the more stable cash-flow profiles offered by securities backed by mortgages on multifamily
| 1. | See page 5 for more information on benchmark and peer group returns. |
| 2. | Duration is a measure of the price sensitivity of a fixed-income investment to changes in interest rates. Duration is expressed as a number of years and is considered a more accurate sensitivity gauge than average maturity. |
| 3. | The yield curve is a line that plots the yields of various securities of similar quality—typically U.S. Treasury issues—across a range of maturities. The U.S. Treasury yield curve serves as a benchmark for other debt and is used in economic forecasting. |
| 4. | Convexity is a mathematical measure of the sensitivity of an interest-bearing bond to changes in interest rates. |
| 8 | MainStay VP MacKay Government Portfolio |
properties. In turn, the multifamily sector’s average spread5 to duration-matched Treasury bonds narrowed.
The Portfolio maintained a preference for residential mortgage passthroughs guaranteed by FNMA and FHLMC over those guaranteed by GNMA (the Government National Mortgage Association, also known as Ginnie Mae). This posture was additive to the Portfolio’s absolute performance and advantaged the Portfolio relative to peers with higher GNMA exposure. GNMA mortgage-backed passthroughs often underperformed FNMA/FHLMC passthroughs during the reporting period, reflecting investor concern about the potential for higher default and forbearance levels for GNMA mortgages, and the potential for new government policies to influence refinancing patterns of mortgage loans sponsored by the Federal Housing Administration.
During the reporting period, the weakest contributors to the Fund's absolute return were the longer-duration Treasuries whose prices fell as Treasury yields rose and the yield curve steepened.
Holdings of Treasury inflation-protected securities (TIPS) also contributed positively to the Portfolio’s absolute performance, as well as boosting its performance relative to the Index.
Did the Portfolio make any significant purchases or sales during the reporting period?
The Portfolio initiated a position in taxable municipals during the reporting period to diversify holdings. These are bonds issued by state and local municipalities to fund projects that do not qualify for tax exemption. The sector trades with narrower sponsorship than other government-related spaces because it is less well understood. The narrower sponsorship generates a yield premium, which improves the sector’s relative value to Treasury securities. As of June 30, 2021, the Portfolio’s taxable municipals exposure was approximately 2% of net assets.
How was the Portfolio positioned at the end of the reporting period?
As of June 30, 2021, relative to the Index, the Portfolio held underweight exposure to Treasury securities, market-weight exposure to agency debentures and overweight exposure to agency residential mortgage-backed securities, both single-family and multifamily. The Portfolio also held overweight exposure to taxable municipal bonds. Modest additional overweight positions included asset-backed securities, non-agency mortgage-backed securities and corporate bonds; collectively, this non-government exposure represented approximately 4% of the Portfolio’s net
assets. As of the same date, the Portfolio held approximately 3% in cash and cash equivalents.
| 5. | The terms “spread” and “yield spread” may refer to the difference in yield between a security or type of security and comparable U.S. Treasury issues. The terms may also refer to the difference in yield between two specific securities or types of securities at a given time. |
The opinions expressed are those of the portfolio as of the date of this report and are subject to change. There is no guarantee that any forecasts will come to pass. This material does not constitute investment advice and is not intended as an endorsement of any specific investment.
Not all MainStay VP Portfolios and/or share classes are available under all policies.
Portfolio of Investments June 30, 2021† (Unaudited)
| | Principal
Amount | Value |
| Long-Term Bonds 97.9% |
| Asset-Backed Securities 2.5% |
| Other Asset-Backed Securities 2.5% |
| Atlantic City Electric Transition Funding LLC | |
| Series 2002-1, Class A4 | | |
| 5.55%, due 10/20/23 | $ 146,292 | $ 147,775 |
| FirstEnergy Ohio PIRB Special Purpose Trust | |
| Series 2013-1, Class A3 | | |
| 3.45%, due 1/15/36 | 497,301 | 541,142 |
| PSNH Funding LLC 3 | |
| Series 2018-1, Class A1 | | |
| 3.094%, due 2/1/26 | 251,703 | 260,229 |
| Small Business Administration Participation Certificates | |
| Series 2012-20L, Class 1 | | |
| 1.93%, due 12/1/32 | 353,197 | 364,539 |
| Series 2014-20H, Class 1 | | |
| 2.88%, due 8/1/34 | 428,235 | 454,898 |
| Series 2015-20G, Class 1 | | |
| 2.88%, due 7/1/35 | 1,104,506 | 1,173,479 |
| Series 2014-20I, Class 1 | | |
| 2.92%, due 9/1/34 | 469,311 | 498,967 |
| Series 2014-20C, Class 1 | | |
| 3.21%, due 3/1/34 | 751,620 | 803,864 |
| Series 2018-20B, Class 1 | | |
| 3.22%, due 2/1/38 | 1,701,739 | 1,857,753 |
| Series 2018-20D, Class 1 | | |
| 3.31%, due 4/1/38 | 1,961,898 | 2,151,192 |
Total Asset-Backed Securities
(Cost $7,877,761) | | 8,253,838 |
| Corporate Bonds 1.7% |
| Electric 1.3% |
| Duke Energy Florida Project Finance LLC | | |
| Series 2026 | | |
| 2.538%, due 9/1/29 | 1,900,000 | 2,002,850 |
| Monongahela Power Co. | | |
| 4.10%, due 4/15/24 (a) | 2,000,000 | 2,152,623 |
| | | 4,155,473 |
| Real Estate Investment Trusts 0.4% |
| Host Hotels & Resorts LP | | |
| Series D | | |
| 3.75%, due 10/15/23 | 1,350,000 | 1,423,272 |
Total Corporate Bonds
(Cost $5,339,596) | | 5,578,745 |
| | Principal
Amount | Value |
| Mortgage-Backed Securities 18.5% |
| Agency (Collateralized Mortgage Obligations) 10.7% |
| FHLMC | |
| REMIC, Series 5073, Class DG | | |
| 1.50%, due 8/25/38 | $ 365,000 | $ 369,188 |
| REMIC, Series 5051, Class KI | | |
| 2.50%, due 12/25/50 | 2,668,116 | 412,384 |
| REMIC, Series 4913, Class UA | | |
| 3.00%, due 3/15/49 | 468,434 | 492,540 |
| REMIC, Series 4908, Class BD | | |
| 3.00%, due 4/25/49 | 1,532,902 | 1,584,108 |
| REMIC, Series 4888, Class BA | | |
| 3.50%, due 9/15/48 | 300,506 | 313,105 |
| REMIC, Series 4877, Class AT | | |
| 3.50%, due 11/15/48 | 325,719 | 344,752 |
| REMIC, Series 4877, Class BE | | |
| 3.50%, due 11/15/48 | 458,185 | 482,884 |
| REMIC, Series 4958, Class DL | | |
| 4.00%, due 1/25/50 | 360,742 | 389,364 |
| FHLMC, Multifamily Structured Pass-Through Certificates | |
| REMIC, Series K042, Class A2 | | |
| 2.67%, due 12/25/24 | 1,500,000 | 1,592,993 |
| REMIC, Series K729, Class A2 | | |
| 3.136%, due 10/25/24 | 2,745,000 | 2,937,118 |
| FNMA | |
| REMIC, Series 2020-63, Class B | | |
| 1.25%, due 9/25/50 | 675,235 | 681,333 |
| REMIC, Series 2013-24, Class PA | | |
| 1.75%, due 3/25/33 | 1,632,709 | 1,683,073 |
| REMIC, Series 2012-124, Class PG | | |
| 2.00%, due 7/25/42 | 1,178,142 | 1,209,925 |
| REMIC, Series 2021-2, Class AI | | |
| 2.00%, due 2/25/51 | 6,152,473 | 679,704 |
| REMIC, Series 2019-13, Class PE | | |
| 3.00%, due 3/25/49 | 363,010 | 384,826 |
| REMIC, Series 2019-58, Class LP | | |
| 3.00%, due 10/25/49 | 881,311 | 919,074 |
| REMIC, Series 2021-13, Class BI | | |
| 3.00%, due 2/25/50 | 1,625,000 | 200,991 |
| REMIC, Series 2020-10, Class LP | | |
| 3.50%, due 3/25/50 | 2,419,487 | 2,574,309 |
| REMIC, Series 2021-6, Class ML | | |
| 3.50%, due 6/25/50 | 1,198,283 | 1,268,177 |
| REMIC, Series 2021-6, Class MC | | |
| 3.50%, due 6/25/50 | 2,288,571 | 2,491,832 |
| REMIC, Series 2021-12, Class GC | | |
| 3.50%, due 7/25/50 | 1,186,993 | 1,282,298 |
| REMIC, Series 2020-10, Class DA | | |
| 3.50%, due 3/25/60 | 2,195,303 | 2,373,838 |
The notes to the financial statements are an integral part of, and should be read in conjunction with, the financial statements.
| 10 | MainStay VP MacKay Government Portfolio |
| | Principal
Amount | Value |
| Mortgage-Backed Securities (continued) |
| Agency (Collateralized Mortgage Obligations) (continued) |
| FNMA, STRIPS (b) | |
| REMIC, Series 360, Class 2 | | |
| 5.00%, due 8/25/35 | $ 57,265 | $ 9,328 |
| REMIC, Series 361, Class 2 | | |
| 6.00%, due 10/25/35 | 13,218 | 2,726 |
| GNMA | |
| REMIC, Series 2021-77, Class BA | | |
| 1.00%, due 7/20/50 | 987,414 | 963,391 |
| REMIC, Series 2021-78, Class LA | | |
| 1.00%, due 5/20/51 | 991,915 | 971,134 |
| REMIC, Series 2021-91, Class MF | | |
| 1.00%, due 5/20/51 | 493,997 | 489,332 |
| REMIC, Series 2021-105, Class DB | | |
| 1.00%, due 6/20/51 | 1,000,000 | 973,603 |
| REMIC, Series 2021-57, Class IN | | |
| 2.00%, due 2/20/51 | 497,008 | 61,409 |
| REMIC, Series 2021-57, Class AI | | |
| 2.00%, due 2/20/51 | 2,597,719 | 308,594 |
| REMIC, Series 2014-63, Class PG | | |
| 2.50%, due 7/20/43 | 1,006,421 | 1,038,862 |
| REMIC, Series 2021-25, Class LI | | |
| 2.50%, due 2/20/51 | 2,955,002 | 350,454 |
| REMIC, Series 2019-3, Class A | | |
| 3.00%, due 4/20/48 | 564,463 | 580,616 |
| REMIC, Series 2019-59, Class KA | | |
| 3.00%, due 12/20/48 | 649,521 | 676,820 |
| REMIC, Series 2021-74, Class HI | | |
| 3.00%, due 4/20/51 | 1,482,624 | 209,832 |
| REMIC, Series 2013-149, Class BA | | |
| 3.25%, due 8/16/41 | 1,249,044 | 1,316,043 |
| UMBS, Single Family, 30 Year (c) | |
| 3.00%, due 7/25/51 TBA | 1,100,000 | 1,146,600 |
| 3.50%, due 7/25/51 TBA | 1,600,000 | 1,684,156 |
| | | 35,450,716 |
| Commercial Mortgage Loans (Collateralized Mortgage Obligations) 7.4% |
| BX Trust | |
| Series 2019-OC11, Class A | | |
| 3.202%, due 12/9/41 (a) | 485,000 | 522,473 |
| BXP Trust | |
| Series 2017-GM, Class A | | |
| 3.379%, due 6/13/39 (a) | 1,750,000 | 1,912,754 |
| FREMF Mortgage Trust (a)(d) | |
| REMIC, Series 2013-K33, Class B | | |
| 3.612%, due 8/25/46 | 933,000 | 983,591 |
| REMIC, Series 2013-K27, Class B | | |
| 3.615%, due 1/25/46 | 1,300,000 | 1,355,683 |
| | Principal
Amount | Value |
| |
| Commercial Mortgage Loans (Collateralized Mortgage Obligations) (continued) |
| FREMF Mortgage Trust (a)(d) (continued) | |
| REMIC, Series 2013-K24, Class B | | |
| 3.627%, due 11/25/45 | $ 2,000,000 | $ 2,067,916 |
| REMIC, Series 2015-K721, Class B | | |
| 3.673%, due 11/25/47 | 3,140,000 | 3,239,676 |
| REMIC, Series 2012-K23, Class B | | |
| 3.782%, due 10/25/45 | 1,222,000 | 1,262,647 |
| REMIC, Series 2012-K22, Class B | | |
| 3.811%, due 8/25/45 | 800,000 | 826,063 |
| REMIC, Series 2016-K58, Class B | | |
| 3.866%, due 9/25/49 | 500,000 | 548,993 |
| REMIC, Series 2014-K41, Class B | | |
| 3.964%, due 11/25/47 | 2,700,000 | 2,935,480 |
| REMIC, Series 2013-K35, Class B | | |
| 4.069%, due 12/25/46 | 1,925,000 | 2,054,126 |
| REMIC, Series 2016-K54, Class B | | |
| 4.189%, due 4/25/48 | 695,000 | 769,394 |
| REMIC, Series 2014-K40, Class B | | |
| 4.208%, due 11/25/47 | 1,645,000 | 1,798,220 |
| REMIC, Series 2014-K38, Class B | | |
| 4.376%, due 6/25/47 | 2,000,000 | 2,167,619 |
| One Bryant Park Trust | |
| Series 2019-OBP, Class A | | |
| 2.516%, due 9/15/54 (a) | 1,265,000 | 1,309,858 |
| Wells Fargo Commercial Mortgage Trust | |
| Series 2018-1745, Class A | | |
| 3.874%, due 6/15/36 (a)(d) | 695,000 | 773,183 |
| | | 24,527,676 |
| Whole Loan (Collateralized Mortgage Obligations) 0.4% |
| Citigroup Mortgage Loan Trust | |
| Series 2006-AR6, Class 1A1 | | |
| 3.206%, due 8/25/36 (d) | 77,083 | 73,571 |
| Flagstar Mortgage Trust | |
| Series 2021-2, Class A2 | | |
| 2.50%, due 4/25/51 (a)(e) | 982,748 | 996,889 |
| Seasoned Loans Structured Transaction | |
| Series 2019-1, Class A1 | | |
| 3.50%, due 5/25/29 | 353,000 | 376,272 |
| | | 1,446,732 |
Total Mortgage-Backed Securities
(Cost $60,752,993) | | 61,425,124 |
The notes to the financial statements are an integral part of, and should be read in conjunction with, the financial statements.
11
Portfolio of Investments June 30, 2021† (Unaudited) (continued)
| | Principal
Amount | Value |
| Municipal Bonds 2.1% |
| New Jersey 0.8% |
New Jersey Turnpike Authority
Revenue Bonds | | |
| 1.483%, due 1/1/28 | $ 1,000,000 | $ 994,914 |
| 7.102%, due 1/1/41 | 1,000,000 | 1,601,879 |
| | | 2,596,793 |
| New York 1.3% |
New York State Thruway Authority
Revenue Bonds | | |
| Series M | | |
| 2.90%, due 1/1/35 | 4,000,000 | 4,289,322 |
Total Municipal Bonds
(Cost $6,851,415) | | 6,886,115 |
| U.S. Government & Federal Agencies 73.1% |
| Federal Home Loan Mortgage Corporation (Mortgage Pass-Through Securities) 14.3% |
| FHLMC Gold Pools, 30 Year | | |
| 2.50%, due 8/1/46 | 837,800 | 870,139 |
| 3.00%, due 2/1/46 | 1,470,684 | 1,549,219 |
| 3.00%, due 4/1/47 | 1,594,237 | 1,676,958 |
| 3.50%, due 1/1/44 | 375,674 | 404,669 |
| 3.50%, due 1/1/48 | 1,540,478 | 1,645,514 |
| 4.00%, due 7/1/44 | 832,047 | 908,435 |
| 4.00%, due 12/1/46 | 635,736 | 690,332 |
| 4.00%, due 10/1/48 | 666,385 | 727,803 |
| 4.00%, due 3/1/49 | 325,142 | 346,577 |
| 4.50%, due 12/1/44 | 1,109,466 | 1,237,253 |
| 5.00%, due 11/1/41 | 840,621 | 962,091 |
| 6.50%, due 4/1/37 | 24,134 | 28,571 |
| FHLMC Gold Pools, Other | | |
| 4.50%, due 3/1/41 | 185,348 | 202,795 |
| Freddie Mac Pool, 30 Year | | |
| 2.50%, due 5/1/51 | 1,396,973 | 1,446,765 |
| Tennessee Valley Authority | | |
| 4.65%, due 6/15/35 | 4,395,000 | 5,781,567 |
| UMBS, 15 Year | | |
| 2.00%, due 6/1/35 | 968,691 | 1,002,351 |
| 2.50%, due 9/1/34 | 394,024 | 411,529 |
| UMBS, 30 Year | | |
| 2.00%, due 7/1/50 | 3,515,631 | 3,552,044 |
| 2.00%, due 7/1/50 | 1,571,726 | 1,588,005 |
| 2.00%, due 8/1/50 | 1,499,759 | 1,515,292 |
| 2.00%, due 8/1/50 | 3,092,795 | 3,146,976 |
| 2.00%, due 8/1/50 | 2,304,788 | 2,328,659 |
| 2.00%, due 9/1/50 | 1,041,439 | 1,052,224 |
| | Principal
Amount | Value |
| |
| Federal Home Loan Mortgage Corporation (Mortgage Pass-Through Securities) (continued) |
| UMBS, 30 Year (continued) | | |
| 2.00%, due 11/1/50 | $ 2,123,799 | $ 2,145,795 |
| 2.50%, due 3/1/50 | 1,385,442 | 1,434,304 |
| 2.50%, due 7/1/50 | 2,196,433 | 2,273,896 |
| 2.50%, due 10/1/50 | 189,888 | 196,870 |
| 2.50%, due 11/1/50 | 2,035,210 | 2,106,987 |
| 2.50%, due 1/1/51 | 519,750 | 538,961 |
| 3.00%, due 6/1/46 | 800,721 | 843,646 |
| 3.00%, due 8/1/49 | 1,583,301 | 1,653,400 |
| 3.00%, due 9/1/49 | 264,114 | 275,795 |
| 3.00%, due 11/1/49 | 907,244 | 953,363 |
| 3.50%, due 1/1/50 | 1,429,149 | 1,504,097 |
| United States International Development Finance Corp. | | |
| 5.142%, due 12/15/23 | 346,256 | 368,622 |
| | | 47,371,504 |
| Federal National Mortgage Association (Mortgage Pass-Through Securities) 36.2% |
| FNMA, Other | | |
| 2.50%, due 1/1/57 | 732,506 | 770,545 |
| 2.68%, due 5/1/25 | 2,000,000 | 2,133,468 |
| 2.73%, due 4/1/25 | 1,025,000 | 1,095,132 |
| 3.00%, due 9/1/46 | 689,620 | 707,816 |
| 3.00%, due 10/1/46 | 671,619 | 689,408 |
| 3.00%, due 10/1/48 | 16,389 | 16,614 |
| 3.00%, due 2/1/57 | 621,268 | 672,316 |
| 3.00%, due 6/1/57 | 726,045 | 785,367 |
| 6.00%, due 4/1/37 | 7,701 | 8,651 |
| 6.50%, due 8/1/47 | 14,498 | 15,686 |
| UMBS, 15 Year | | |
| 2.00%, due 6/1/35 | 1,775,166 | 1,836,898 |
| UMBS, 20 Year | | |
| 2.00%, due 5/1/41 | 2,480,279 | 2,522,722 |
| 2.50%, due 6/1/41 | 2,090,634 | 2,174,460 |
| 3.00%, due 10/1/32 | 415,728 | 441,056 |
| UMBS, 30 Year | | |
| 2.00%, due 6/1/50 | 1,811,073 | 1,829,802 |
| 2.00%, due 8/1/50 | 3,426,741 | 3,462,182 |
| 2.00%, due 10/1/50 | 2,860,435 | 2,903,358 |
| 2.00%, due 10/1/50 | 2,249,059 | 2,274,095 |
| 2.00%, due 12/1/50 | 1,967,949 | 1,988,331 |
| 2.00%, due 3/1/51 | 2,485,259 | 2,512,562 |
| 2.50%, due 1/1/47 | 2,022,132 | 2,100,827 |
| 2.50%, due 9/1/49 | 1,788,204 | 1,851,270 |
| 2.50%, due 3/1/50 | 684,630 | 712,252 |
| 2.50%, due 3/1/50 | 1,672,549 | 1,731,536 |
The notes to the financial statements are an integral part of, and should be read in conjunction with, the financial statements.
| 12 | MainStay VP MacKay Government Portfolio |
| | Principal
Amount | Value |
| U.S. Government & Federal Agencies (continued) |
| Federal National Mortgage Association (Mortgage Pass-Through Securities) (continued) |
| UMBS, 30 Year (continued) | | |
| 2.50%, due 3/1/50 | $ 1,781,162 | $ 1,843,980 |
| 2.50%, due 4/1/50 | 2,568,720 | 2,683,311 |
| 2.50%, due 5/1/50 | 3,807,607 | 3,941,893 |
| 2.50%, due 7/1/50 | 2,201,749 | 2,279,400 |
| 2.50%, due 8/1/50 | 2,517,336 | 2,610,735 |
| 2.50%, due 8/1/50 | 3,343,518 | 3,475,568 |
| 2.50%, due 9/1/50 | 2,870,484 | 3,002,429 |
| 2.50%, due 10/1/50 | 2,932,698 | 3,037,021 |
| 2.50%, due 11/1/50 | 2,880,722 | 3,021,821 |
| 2.50%, due 12/1/50 | 2,730,228 | 2,826,517 |
| 2.50%, due 1/1/51 | 2,564,503 | 2,673,938 |
| 2.50%, due 1/1/51 | 2,338,907 | 2,423,156 |
| 2.50%, due 4/1/51 | 1,877,896 | 1,952,109 |
| 3.00%, due 10/1/44 | 1,295,414 | 1,382,341 |
| 3.00%, due 3/1/47 | 750,219 | 792,457 |
| 3.00%, due 12/1/47 | 974,403 | 1,024,365 |
| 3.00%, due 10/1/49 | 1,033,989 | 1,079,748 |
| 3.00%, due 3/1/50 | 1,397,625 | 1,476,908 |
| 3.00%, due 3/1/50 | 2,188,101 | 2,312,582 |
| 3.00%, due 3/1/50 | 1,816,025 | 1,896,113 |
| 3.00%, due 5/1/50 | 1,677,944 | 1,752,295 |
| 3.00%, due 7/1/50 | 2,424,333 | 2,546,186 |
| 3.50%, due 5/1/43 | 1,633,460 | 1,770,656 |
| 3.50%, due 11/1/44 | 572,046 | 617,698 |
| 3.50%, due 3/1/45 | 605,261 | 654,985 |
| 3.50%, due 11/1/45 | 1,707,618 | 1,836,654 |
| 3.50%, due 8/1/46 | 431,238 | 464,407 |
| 3.50%, due 10/1/47 | 339,851 | 359,977 |
| 3.50%, due 2/1/48 | 190,782 | 201,147 |
| 3.50%, due 8/1/49 | 1,050,935 | 1,104,082 |
| 3.50%, due 9/1/50 | 2,506,582 | 2,678,625 |
| 4.00%, due 1/1/46 | 580,871 | 634,716 |
| 4.00%, due 9/1/47 | 283,428 | 303,644 |
| 4.00%, due 7/1/48 | 743,044 | 791,942 |
| 4.00%, due 8/1/48 | 3,762,185 | 4,013,854 |
| 4.00%, due 9/1/48 | 720,487 | 768,162 |
| 4.00%, due 4/1/49 | 200,594 | 213,575 |
| 4.00%, due 3/1/50 | 1,787,930 | 1,923,671 |
| 4.50%, due 2/1/41 | 1,878,570 | 2,094,741 |
| 4.50%, due 4/1/41 | 4,724,694 | 5,308,373 |
| 4.50%, due 8/1/42 | 790,547 | 881,217 |
| 4.50%, due 8/1/44 | 895,930 | 998,599 |
| 5.00%, due 9/1/41 | 1,619,413 | 1,852,743 |
| 5.00%, due 10/1/41 | 1,375,835 | 1,572,205 |
| 5.50%, due 7/1/41 | 2,523,319 | 2,918,959 |
| | Principal
Amount | Value |
| |
| Federal National Mortgage Association (Mortgage Pass-Through Securities) (continued) |
| UMBS, 30 Year (continued) | | |
| 6.00%, due 7/1/39 | $ 587,210 | $ 695,621 |
| 6.50%, due 10/1/39 | 107,300 | 123,514 |
| | | 120,054,994 |
| Government National Mortgage Association (Mortgage Pass-Through Securities) 0.5% |
| GNMA II, 30 Year | | |
| 4.00%, due 11/20/49 | 828,603 | 877,120 |
| 4.50%, due 7/20/49 | 676,323 | 720,855 |
| | | 1,597,975 |
| United States Treasury Bonds 2.2% |
| U.S. Treasury Bonds | | |
| 3.00%, due 5/15/45 | 2,790,000 | 3,290,238 |
| 3.00%, due 2/15/48 | 2,000,000 | 2,384,063 |
| 4.375%, due 11/15/39 | 1,200,000 | 1,669,359 |
| | | 7,343,660 |
| United States Treasury Inflation - Indexed Notes 7.4% |
| U.S. Treasury Inflation Linked Notes (f) | | |
| 0.125%, due 1/15/30 | 9,780,000 | 11,142,557 |
| 0.125%, due 7/15/30 | 7,500,000 | 8,617,123 |
| 0.875%, due 1/15/29 | 3,950,000 | 4,833,549 |
| | | 24,593,229 |
| United States Treasury Notes 12.5% |
| U.S. Treasury Notes | | |
| 0.375%, due 4/30/25 | 5,000,000 | 4,946,289 |
| 1.50%, due 2/15/30 | 2,615,000 | 2,640,844 |
| 2.25%, due 4/30/24 | 19,045,000 | 20,021,056 |
| 2.375%, due 8/15/24 | 1,695,000 | 1,794,515 |
| 2.625%, due 1/31/26 | 1,700,000 | 1,838,922 |
| 2.75%, due 7/31/23 | 345,000 | 362,816 |
| 2.75%, due 8/31/23 | 1,325,000 | 1,395,546 |
| 3.00%, due 10/31/25 | 7,805,000 | 8,550,743 |
| | | 41,550,731 |
Total U.S. Government & Federal Agencies
(Cost $237,157,742) | | 242,512,093 |
Total Long-Term Bonds
(Cost $317,979,507) | | 324,655,915 |
| |
The notes to the financial statements are an integral part of, and should be read in conjunction with, the financial statements.
13
Portfolio of Investments June 30, 2021† (Unaudited) (continued)
| | Shares | | Value |
| Short-Term Investment 3.2% |
| Affiliated Investment Company 3.2% |
| MainStay U.S. Government Liquidity Fund, 0.01% (g) | 10,608,409 | | $ 10,608,409 |
Total Short-Term Investment
(Cost $10,608,409) | | | 10,608,409 |
Total Investments
(Cost $328,587,916) | 101.1% | | 335,264,324 |
| Other Assets, Less Liabilities | (1.1) | | (3,810,207) |
| Net Assets | 100.0% | | $ 331,454,117 |
| † | Percentages indicated are based on Portfolio net assets. |
| (a) | May be sold to institutional investors only under Rule 144A or securities offered pursuant to Section 4(a)(2) of the Securities Act of 1933, as amended. |
| (b) | Collateralized Mortgage Obligation Interest Only Strip—Pays a fixed or variable rate of interest based on mortgage loans or mortgage pass-through securities. The principal amount of the underlying pool represents the notional amount on which the current interest was calculated. The value of these stripped securities may be particularly sensitive to changes in prevailing interest rates and are typically more sensitive to changes in prepayment rates than traditional mortgage-backed securities. |
| (c) | TBA—Security purchased on a forward commitment basis with an approximate principal amount and maturity date. The actual principal amount and maturity date will be determined upon settlement. As of June 30, 2021, the total net market value was $2,830,756, which represented 0.9% of the Portfolio’s net assets. All or a portion of this security is a part of a mortgage dollar roll agreement. |
| (d) | Collateral strip rate—A bond whose interest was based on the weighted net interest rate of the collateral. The coupon rate adjusts periodically based on a predetermined schedule. Rate shown was the rate in effect as of June 30, 2021. |
| (e) | Coupon rate may change based on changes of the underlying collateral or prepayments of principal. Rate shown was the rate in effect as of June 30, 2021. |
| (f) | Treasury Inflation Protected Security—Pays a fixed rate of interest on a principal amount that is continuously adjusted for inflation based on the Consumer Price Index-Urban Consumers. |
| (g) | Current yield as of June 30, 2021. |
The notes to the financial statements are an integral part of, and should be read in conjunction with, the financial statements.
| 14 | MainStay VP MacKay Government Portfolio |
Futures Contracts
As of June 30, 2021, the Portfolio held the following futures contracts1:
| Type | Number of
Contracts | Expiration
Date | Value at
Trade Date | Current
Notional
Amount | Unrealized
Appreciation
(Depreciation)2 |
| Short Contracts | | | | | |
| U.S. Treasury 10 Year Ultra Bonds | (12) | September 2021 | $ (1,739,973) | $ (1,766,438) | $ (26,464) |
| U.S. Treasury Long Bonds | (9) | September 2021 | (1,412,065) | (1,446,750) | (34,685) |
| U.S. Treasury Ultra Bonds | (24) | September 2021 | (4,454,005) | (4,624,500) | (170,495) |
| Net Unrealized Depreciation | | | | | $ (231,644) |
| 1. | As of June 30, 2021, cash in the amount of $216,900 was on deposit with a broker or futures commission merchant for futures transactions. |
| 2. | Represents the difference between the value of the contracts at the time they were opened and the value as of June 30, 2021. |
| Abbreviation(s): |
| FHLMC—Federal Home Loan Mortgage Corp. |
| FNMA—Federal National Mortgage Association |
| FREMF—Freddie Mac Multifamily |
| GNMA—Government National Mortgage Association |
| REMIC—Real Estate Mortgage Investment Conduit |
| TBA—To Be Announced |
| UMBS—Uniform Mortgage Backed Securities |
The following is a summary of the fair valuations according to the inputs used as of June 30, 2021, for valuing the Portfolio’s assets and liabilities:
| Description | Quoted
Prices in
Active
Markets for
Identical
Assets
(Level 1) | | Significant
Other
Observable
Inputs
(Level 2) | | Significant
Unobservable
Inputs
(Level 3) | | Total |
| Asset Valuation Inputs | | | | | | | |
| Investments in Securities (a) | | | | | | | |
| Long-Term Bonds | | | | | | | |
| Asset-Backed Securities | $ — | | $ 8,253,838 | | $ — | | $ 8,253,838 |
| Corporate Bonds | — | | 5,578,745 | | — | | �� 5,578,745 |
| Mortgage-Backed Securities | — | | 61,425,124 | | — | | 61,425,124 |
| Municipal Bonds | — | | 6,886,115 | | — | | 6,886,115 |
| U.S. Government & Federal Agencies | — | | 242,512,093 | | — | | 242,512,093 |
| Total Long-Term Bonds | — | | 324,655,915 | | — | | 324,655,915 |
| Short-Term Investment | | | | | | | |
| Affiliated Investment Company | 10,608,409 | | — | | — | | 10,608,409 |
| Total Investments in Securities | $ 10,608,409 | | $ 324,655,915 | | $ — | | $ 335,264,324 |
| Liability Valuation Inputs | | | | | | | |
| Other Financial Instruments | | | | | | | |
| Futures Contracts (b) | $ (231,644) | | $ — | | $ — | | $ (231,644) |
| (a) | For a complete listing of investments and their industries, see the Portfolio of Investments. |
| (b) | The value listed for these securities reflects unrealized appreciation (depreciation) as shown on the Portfolio of Investments. |
The notes to the financial statements are an integral part of, and should be read in conjunction with, the financial statements.
15
Statement of Assets and Liabilities as of June 30, 2021 (Unaudited)
| Assets |
Investment in unaffiliated securities, at value
(identified cost $317,979,507) | $324,655,915 |
Investment in affiliated investment companies, at value
(identified cost $10,608,409) | 10,608,409 |
| Cash | 203,056 |
| Cash collateral on deposit at broker for futures contracts | 216,900 |
| Receivables: | |
| Investment securities sold | 1,583,906 |
| Interest | 1,037,092 |
| Portfolio shares sold | 120,000 |
| Other assets | 5,582 |
| Total assets | 338,430,860 |
| Liabilities |
| Cash collateral due to broker for TBA | 201,575 |
| Due to broker | 78,491 |
| Payables: | |
| Investment securities purchased | 5,870,583 |
| Portfolio shares redeemed | 506,087 |
| Manager (See Note 3) | 136,041 |
| NYLIFE Distributors (See Note 3) | 52,843 |
| Variation margin on futures contracts | 42,000 |
| Professional fees | 40,192 |
| Shareholder communication | 29,857 |
| Custodian | 19,067 |
| Trustees | 7 |
| Total liabilities | 6,976,743 |
| Net assets | $331,454,117 |
| Composition of Net Assets |
| Shares of beneficial interest outstanding (par value of $.001 per share) unlimited number of shares authorized | $ 30,125 |
| Additional paid-in-capital | 321,570,091 |
| | 321,600,216 |
| Total distributable earnings (loss) | 9,853,901 |
| Net assets | $331,454,117 |
| Initial Class | |
| Net assets applicable to outstanding shares | $ 74,853,616 |
| Shares of beneficial interest outstanding | 6,745,477 |
| Net asset value per share outstanding | $ 11.10 |
| Service Class | |
| Net assets applicable to outstanding shares | $256,600,501 |
| Shares of beneficial interest outstanding | 23,379,872 |
| Net asset value per share outstanding | $ 10.98 |
The notes to the financial statements are an integral part of, and should be read in conjunction with, the financial statements.
| 16 | MainStay VP MacKay Government Portfolio |
Statement of Operations for the six months ended June 30, 2021 (Unaudited)
| Investment Income (Loss) |
| Income | |
| Interest | $ 4,000,759 |
| Dividends-affiliated | 492 |
| Total income | 4,001,251 |
| Expenses | |
| Manager (See Note 3) | 933,044 |
| Distribution/Service—Service Class (See Note 3) | 333,395 |
| Professional fees | 41,080 |
| Shareholder communication | 17,649 |
| Custodian | 16,344 |
| Trustees | 4,015 |
| Miscellaneous | 5,924 |
| Total expenses | 1,351,451 |
| Net investment income (loss) | 2,649,800 |
| Realized and Unrealized Gain (Loss) |
| Net realized gain (loss) on: | |
| Unaffiliated investment transactions | 175,673 |
| Futures transactions | (94,934) |
| Net realized gain (loss) | 80,739 |
| Net change in unrealized appreciation (depreciation) on: | |
| Unaffiliated investments | (6,747,948) |
| Futures contracts | (231,644) |
| Net change in unrealized appreciation (depreciation) | (6,979,592) |
| Net realized and unrealized gain (loss) | (6,898,853) |
| Net increase (decrease) in net assets resulting from operations | $(4,249,053) |
The notes to the financial statements are an integral part of, and should be read in conjunction with, the financial statements.
17
Statements of Changes in Net Assets
for the six months ended June 30, 2021 (Unaudited) and the year ended December 31, 2020
| | 2021 | 2020 |
| Increase (Decrease) in Net Assets |
| Operations: | | |
| Net investment income (loss) | $ 2,649,800 | $ 4,416,874 |
| Net realized gain (loss) | 80,739 | 1,424,439 |
| Net change in unrealized appreciation (depreciation) | (6,979,592) | 7,617,671 |
| Net increase (decrease) in net assets resulting from operations | (4,249,053) | 13,458,984 |
| Distributions to shareholders: | | |
| Initial Class | — | (1,180,531) |
| Service Class | — | (3,747,304) |
| Total distributions to shareholders | — | (4,927,835) |
| Capital share transactions: | | |
| Net proceeds from sales of shares | 53,565,029 | 237,953,765 |
| Net asset value of shares issued to shareholder in reinvestment of distributions | — | 4,927,835 |
| Cost of shares redeemed | (106,869,650) | (114,972,175) |
| Increase (decrease) in net assets derived from capital share transactions | (53,304,621) | 127,909,425 |
| Net increase (decrease) in net assets | (57,553,674) | 136,440,574 |
| Net Assets |
| Beginning of period | 389,007,791 | 252,567,217 |
| End of period | $ 331,454,117 | $ 389,007,791 |
The notes to the financial statements are an integral part of, and should be read in conjunction with, the financial statements.
| 18 | MainStay VP MacKay Government Portfolio |
Financial Highlights selected per share data and ratios
| | Six months ended
June 30,
2021* | | Year Ended December 31, |
| Initial Class | 2020 | | 2019 | | 2018 | | 2017 | | 2016 |
| Net asset value at beginning of period | $ 11.21 | | $ 10.84 | | $ 10.49 | | $ 10.78 | | $ 10.85 | | $ 10.99 |
| Net investment income (loss) (a) | 0.09 | | 0.17 | | 0.25 | | 0.26 | | 0.25 | | 0.24 |
| Net realized and unrealized gain (loss) on investments | (0.20) | | 0.36 | | 0.32 | | (0.27) | | (0.02) | | (0.11) |
| Total from investment operations | (0.11) | | 0.53 | | 0.57 | | (0.01) | | 0.23 | | 0.13 |
| Less distributions: | | | | | | | | | | | |
| From net investment income | — | | (0.16) | | (0.22) | | (0.28) | | (0.30) | | (0.27) |
| Net asset value at end of period | $ 11.10 | | $ 11.21 | | $ 10.84 | | $ 10.49 | | $ 10.78 | | $ 10.85 |
| Total investment return (b) | (0.98)%(c) | | 4.97% | | 5.42% | | (0.06)% | | 2.11% | | 1.07% |
| Ratios (to average net assets)/Supplemental Data: | | | | | | | | | | | |
| Net investment income (loss) | 1.57%†† | | 1.50% | | 2.35% | | 2.44% | | 2.29% | | 2.14%(d) |
| Net expenses (e) | 0.55%†† | | 0.56% | | 0.57% | | 0.57% | | 0.56% | | 0.55%(f) |
| Expenses (before waiver/reimbursement) (e) | 0.55%†† | | 0.56% | | 0.57% | | 0.57% | | 0.56% | | 0.56% |
| Portfolio turnover rate (g) | 44% | | 77% | | 30% | | 92% | | 17% | | 64% |
| Net assets at end of period (in 000’s) | $ 74,854 | | $ 107,954 | | $ 51,698 | | $ 52,552 | | $ 56,561 | | $ 64,930 |
| * | Unaudited. |
| †† | Annualized. |
| (a) | Per share data based on average shares outstanding during the period. |
| (b) | Total return does not reflect any deduction of sales charges, mortality and expense charges, contract charges or administrative charges. For periods of less than one year, total return is not annualized. |
| (c) | Total investment return may reflect adjustments to conform to generally accepted accounting principles. |
| (d) | Without the custody fee reimbursement, net investment income (loss) would have been 2.13%. |
| (e) | In addition to the fees and expenses which the Portfolio bears directly, it also indirectly bears a pro-rata share of the fees and expenses of the underlying funds in which it invests. Such indirect expenses are not included in the above expense ratios. |
| (f) | Without the custody fee reimbursement, net expenses would have been 0.56%. |
| (g) | The portfolio turnover rates not including mortgage dollar rolls were 19%, 53%, 80%, 5% and 19% for the six months ended June 30, 2021 and for years ended December 31, 2020, 2018, 2017 and 2016, respectively. |
The notes to the financial statements are an integral part of, and should be read in conjunction with, the financial statements.
19
Financial Highlights selected per share data and ratios
| | Six months ended
June 30,
2021* | | Year Ended December 31, |
| Service Class | 2020 | | 2019 | | 2018 | | 2017 | | 2016 |
| Net asset value at beginning of period | $ 11.10 | | $ 10.74 | | $ 10.41 | | $ 10.69 | | $ 10.76 | | $ 10.90 |
| Net investment income (loss) (a) | 0.07 | | 0.14 | | 0.22 | | 0.23 | | 0.22 | | 0.21 |
| Net realized and unrealized gain (loss) on investments | (0.19) | | 0.37 | | 0.31 | | (0.26) | | (0.03) | | (0.11) |
| Total from investment operations | (0.12) | | 0.51 | | 0.53 | | (0.03) | | 0.19 | | 0.10 |
| Less distributions: | | | | | | | | | | | |
| From net investment income | — | | (0.15) | | (0.20) | | (0.25) | | (0.26) | | (0.24) |
| Net asset value at end of period | $ 10.98 | | $ 11.10 | | $ 10.74 | | $ 10.41 | | $ 10.69 | | $ 10.76 |
| Total investment return (b) | (1.08)%(c) | | 4.70% | | 5.15% | | (0.31)% | | 1.86% | | 0.82% |
| Ratios (to average net assets)/Supplemental Data: | | | | | | | | | | | |
| Net investment income (loss) | 1.36%†† | | 1.29% | | 2.09% | | 2.19% | | 2.04% | | 1.89%(d) |
| Net expenses (e) | 0.80%†† | | 0.80% | | 0.82% | | 0.82% | | 0.81% | | 0.80%(f) |
| Expenses (before waiver/reimbursement) (e) | 0.80%†† | | 0.80% | | 0.82% | | 0.82% | | 0.81% | | 0.81% |
| Portfolio turnover rate (g) | 44% | | 77% | | 30% | | 92% | | 17% | | 64% |
| Net assets at end of period (in 000’s) | $ 256,601 | | $ 281,054 | | $ 200,869 | | $ 159,575 | | $ 155,477 | | $ 186,207 |
| * | Unaudited. |
| †† | Annualized. |
| (a) | Per share data based on average shares outstanding during the period. |
| (b) | Total return does not reflect any deduction of sales charges, mortality and expense charges, contract charges or administrative charges. For periods of less than one year, total return is not annualized. |
| (c) | Total investment return may reflect adjustments to conform to generally accepted accounting principles. |
| (d) | Without the custody fee reimbursement, net investment income (loss) would have been 1.88%. |
| (e) | In addition to the fees and expenses which the Portfolio bears directly, it also indirectly bears a pro-rata share of the fees and expenses of the underlying funds in which it invests. Such indirect expenses are not included in the above expense ratios. |
| (f) | Without the custody fee reimbursement, net expenses would have been 0.81%. |
| (g) | The portfolio turnover rates not including mortgage dollar rolls were 19%, 53%, 80%, 5% and 19% for the six months ended June 30, 2021 and for years ended December 31, 2020, 2018, 2017 and 2016, respectively. |
The notes to the financial statements are an integral part of, and should be read in conjunction with, the financial statements.
| 20 | MainStay VP MacKay Government Portfolio |
Notes to Financial Statements (Unaudited)
Note 1–Organization and Business
MainStay VP Funds Trust (the “Fund”) was organized as a Delaware statutory trust on February 1, 2011. The Fund is registered under the Investment Company Act of 1940, as amended (the “1940 Act”), as an open-end management investment company. The Fund is comprised of thirty-one separate series (collectively referred to as the “Portfolios”). These financial statements and notes relate to the MainStay VP MacKay Government Portfolio (the "Portfolio"), a "diversified” portfolio, as that term is defined in the 1940 Act, as interpreted or modified by regulatory authorities having jurisdiction, from time to time.
Shares of the Portfolio are currently offered to certain separate accounts to fund variable annuity policies and variable universal life insurance policies issued by New York Life Insurance and Annuity Corporation (“NYLIAC”), a wholly-owned subsidiary of New York Life Insurance Company (“New York Life”) and may also be offered to fund variable annuity policies and variable universal life insurance policies issued by other insurance companies. NYLIAC allocates shares of the Portfolios to, among others, certain NYLIAC separate accounts. Shares of the Portfolio are also offered to the MainStay VP Conservative Allocation Portfolio, MainStay VP Moderate Allocation Portfolio, MainStay VP Growth Allocation Portfolio (formerly known as MainStay VP Moderate Growth Allocation Portfolio) and MainStay VP Equity Allocation Portfolio (formerly known as MainStay VP Growth Allocation Portfolio), which operate as “funds-of-funds," and other variable insurance funds.
The following table lists the Portfolio's share classes that have been registered and commenced operations:
| Class | Commenced Operations |
| Initial Class | January 29, 1993 |
| Service Class | June 4, 2003 |
Shares of the Portfolio are offered and are redeemed at a price equal to their respective net asset value (“NAV”) per share. No sales or redemption charge is applicable to the purchase or redemption of the Portfolio's shares. Under the terms of the Fund’s multiple class plan, adopted pursuant to Rule 18f-3 under the 1940 Act, the classes differ in that, among other things, Service Class shares of the Portfolio pay a combined distribution and service fee of 0.25% of average daily net assets attributable to Service Class shares of the Portfolio to the Distributor (as defined in Note 3(B)) pursuant to a plan adopted in accordance with Rule 12b-1 under the 1940 Act. Contract owners of variable annuity contracts purchased after June 2, 2003, are permitted to invest only in the Service Class shares.
The Portfolio's investment objective is to seek current income.
Note 2–Significant Accounting Policies
The Portfolio is an investment company and accordingly follows the investment company accounting and reporting guidance of the Financial Accounting Standards Board (“FASB”) Accounting Standard Codification Topic 946 Financial Services—Investment Companies. The Portfolio
prepares its financial statements in accordance with generally accepted accounting principles (“GAAP”) in the United States of America and follows the significant accounting policies described below.
(A) Securities Valuation. Investments are usually valued as of the close of regular trading on the New York Stock Exchange (the "Exchange") (usually 4:00 p.m. Eastern time) on each day the Portfolio is open for business ("valuation date").
The Board of Trustees of the Fund (the "Board") adopted procedures establishing methodologies for the valuation of the Portfolio's securities and other assets and delegated the responsibility for valuation determinations under those procedures to the Valuation Committee of the Fund (the “Valuation Committee”). The procedures state that, subject to the oversight of the Board and unless otherwise noted, the responsibility for the day-to-day valuation of portfolio assets (including fair value measurements for the Portfolio's assets and liabilities) rests with New York Life Investment Management LLC (“New York Life Investments” or the "Manager"), aided to whatever extent necessary by the Subadvisor (as defined in Note 3(A)). To assess the appropriateness of security valuations, the Manager, the Subadvisor or the Portfolio's third-party service provider, who is subject to oversight by the Manager, regularly compares prior day prices, prices on comparable securities and the sale prices to the prior and current day prices and challenges prices with changes exceeding certain tolerance levels with third-party pricing services or broker sources.
The Board authorized the Valuation Committee to appoint a Valuation Subcommittee (the “Subcommittee”) to establish the prices of securities for which market quotations are not readily available or the prices of which are not otherwise readily determinable under the procedures. The Subcommittee meets (in person, via electronic mail or via teleconference) on an as-needed basis. The Valuation Committee meets to ensure that actions taken by the Subcommittee were appropriate.
For those securities valued through either a standardized fair valuation methodology or a fair valuation measurement, the Subcommittee deals with such valuation and the Valuation Committee reviews and affirms, if appropriate, the reasonableness of the valuation based on such methodologies and measurements on a regular basis after considering information that is reasonably available and deemed relevant by the Valuation Committee. Any action taken by the Subcommittee with respect to the valuation of a portfolio security or other asset is submitted for review and ratification (if appropriate) to the Valuation Committee and the Board at the next regularly scheduled meeting.
"Fair value" is defined as the price the Portfolio would reasonably expect to receive upon selling an asset or liability in an orderly transaction to an independent buyer in the principal or most advantageous market for the asset or liability. Fair value measurements are determined within a framework that establishes a three-tier hierarchy that maximizes the use of observable market data and minimizes the use of unobservable inputs to establish a classification of fair value measurements for disclosure purposes. "Inputs" refer broadly to the assumptions that market
Notes to Financial Statements (Unaudited) (continued)
participants would use in pricing the asset or liability, including assumptions about risk, such as the risk inherent in a particular valuation technique used to measure fair value using a pricing model and/or the risk inherent in the inputs for the valuation technique. Inputs may be observable or unobservable. Observable inputs reflect the assumptions market participants would use in pricing the asset or liability based on market data obtained from sources independent of the Portfolio. Unobservable inputs reflect the Portfolio’s own assumptions about the assumptions market participants would use in pricing the asset or liability based on the information available. The inputs or methodology used for valuing assets or liabilities may not be an indication of the risks associated with investing in those assets or liabilities. The three-tier hierarchy of inputs is summarized below.
| • | Level 1—quoted prices in active markets for an identical asset or liability |
| • | Level 2—other significant observable inputs (including quoted prices for a similar asset or liability in active markets, interest rates and yield curves, prepayment speeds, credit risk, etc.) |
| • | Level 3—significant unobservable inputs (including the Portfolio's own assumptions about the assumptions that market participants would use in measuring fair value of an asset or liability) |
The level of an asset or liability within the fair value hierarchy is based on the lowest level of an input, both individually and in the aggregate, that is significant to the fair value measurement. The aggregate value by input level of the Portfolio’s assets and liabilities as of June 30, 2021, is included at the end of the Portfolio of Investments.
The Portfolio may use third-party vendor evaluations, whose prices may be derived from one or more of the following standard inputs, among others:
| • Benchmark yields | • Reported trades |
| • Broker/dealer quotes | • Issuer spreads |
| • Two-sided markets | • Benchmark securities |
| • Bids/offers | • Reference data (corporate actions or material event notices) |
| • Industry and economic events | • Comparable bonds |
| • Monthly payment information | |
An asset or liability for which market values cannot be measured using the methodologies described above is valued by methods deemed reasonable in good faith by the Valuation Committee, following the procedures established by the Board, to represent fair value. Under these procedures, the Portfolio generally uses a market-based approach which may use related or comparable assets or liabilities, recent transactions, market multiples, book values and other relevant information. The Portfolio may also use an income-based valuation approach in which the anticipated future cash flows of the asset or liability are discounted to calculate fair value. Discounts may also be applied due to the nature and/or duration of any restrictions on the disposition of the asset or liability. Fair value represents a good faith approximation of the value of a
security. Fair value determinations involve the consideration of a number of subjective factors, an analysis of applicable facts and circumstances and the exercise of judgment. As a result, it is possible that the fair value for a security determined in good faith in accordance with the Portfolio's valuation procedures may differ from valuations for the same security determined by other funds using their own valuation procedures. Although the Portfolio's valuation procedures are designed to value a security at the price the Portfolio may reasonably expect to receive upon the security's sale in an orderly transaction, there can be no assurance that any fair value determination thereunder would, in fact, approximate the amount that the Portfolio would actually realize upon the sale of the security or the price at which the security would trade if a reliable market price were readily available. During the six-month period ended June 30, 2021, there were no material changes to the fair value methodologies.
Securities which may be valued in this manner include, but are not limited to: (i) a security for which trading has been halted or suspended; (ii) a debt security that has recently gone into default and for which there is not a current market quotation; (iii) a security of an issuer that has entered into a restructuring; (iv) a security that has been delisted from a national exchange; (v) a security for which the market price is not readily available from a third-party pricing source or, if so provided, does not, in the opinion of the Manager or the Subadvisor, reflect the security's market value; (vi) a security subject to trading collars for which no or limited trading takes place; and (vii) a security whose principal market has been temporarily closed at a time when, under normal conditions, it would be open. Securities valued in this manner are generally categorized as Level 3 in the hierarchy. No securities held by the Portfolio as of June 30, 2021 were fair valued in such a manner.
Investments in mutual funds, including money market funds, are valued at their respective NAVs at the close of business each day on the valuation date. These securities are generally categorized as Level 1 in the hierarchy.
Futures contracts are valued at the last posted settlement price on the market where such futures are primarily traded. These securities are generally categorized as Level 1 in the hierarchy.
Debt securities (other than convertible and municipal bonds) are valued at the evaluated bid prices (evaluated mean prices in the case of convertible and municipal bonds) supplied by a pricing agent or broker selected by the Manager, in consultation with the Subadvisor. The evaluations are market-based measurements processed through a pricing application and represents the pricing agent’s good faith determination as to what a holder may receive in an orderly transaction under market conditions. The rules-based logic utilizes valuation techniques that reflect participants’ assumptions and vary by asset class and per methodology, maximizing the use of relevant observable data including quoted prices for similar assets, benchmark yield curves and market corroborated inputs. The evaluated bid or mean prices are deemed by the Manager, in consultation with the Subadvisor, to be representative of market values at the regular close of trading of the Exchange on each valuation date. Debt securities purchased on a delayed delivery basis are marked to market daily until
| 22 | MainStay VP MacKay Government Portfolio |
settlement at the forward settlement date. Debt securities, including corporate bonds, U.S. government and federal agency bonds, municipal bonds, foreign bonds, convertible bonds, asset-backed securities and mortgage-backed securities are generally categorized as Level 2 in the hierarchy.
Temporary cash investments acquired in excess of 60 days to maturity at the time of purchase are valued using the latest bid prices or using valuations based on a matrix system (which considers such factors as security prices, yields, maturities and ratings), both as furnished by independent pricing services. Temporary cash investments that mature in 60 days or less at the time of purchase ("Short-Term Investments") are valued using the amortized cost method of valuation, unless the use of such method would be inappropriate. The amortized cost method involves valuing a security at its cost on the date of purchase and thereafter assuming a constant amortization to maturity of the difference between such cost and the value on maturity date. Amortized cost approximates the current fair value of a security. Securities valued using the amortized cost method are not valued using quoted prices in an active market and are generally categorized as Level 2 in the hierarchy.
The information above is not intended to reflect an exhaustive list of the methodologies that may be used to value portfolio investments. The valuation procedures permit the use of a variety of valuation methodologies in connection with valuing portfolio investments. The methodology used for a specific type of investment may vary based on the market data available or other considerations. The methodologies summarized above may not represent the specific means by which portfolio investments are valued on any particular business day.
(B) Income Taxes. The Portfolio's policy is to comply with the requirements of the Internal Revenue Code of 1986, as amended (the “Internal Revenue Code”), applicable to regulated investment companies and to distribute all of its taxable income to the shareholders of the Portfolio within the allowable time limits.
The Manager evaluates the Portfolio’s tax positions to determine if the tax positions taken meet the minimum recognition threshold in connection with accounting for uncertainties in income tax positions taken or expected to be taken for the purposes of measuring and recognizing tax liabilities in the financial statements. Recognition of tax benefits of an uncertain tax position is permitted only to the extent the position is “more likely than not” to be sustained assuming examination by taxing authorities. The Manager analyzed the Portfolio's tax positions taken on federal, state and local income tax returns for all open tax years (for up to three tax years) and has concluded that no provisions for federal, state and local income tax are required in the Portfolio's financial statements. The Portfolio's federal, state and local income tax and federal excise tax returns for tax years for which the applicable statutes of limitations have not expired are subject to examination by the Internal Revenue Service and state and local departments of revenue.
(C) Dividends and Distributions to Shareholders. Dividends and distributions are recorded on the ex-dividend date. The Portfolio intends to declare and pay dividends from net investment income and distributions from net realized capital and currency gains, if any, at least annually. Unless a shareholder elects otherwise, all dividends and distributions are reinvested at NAV in the same class of shares of the Portfolio. Dividends and distributions to shareholders are determined in accordance with federal income tax regulations and may differ from determinations using GAAP.
(D) Security Transactions and Investment Income. The Portfolio records security transactions on the trade date. Realized gains and losses on security transactions are determined using the identified cost method. Interest income is accrued as earned using the effective interest rate method and includes any realized gains and losses from repayments of principal on mortgage-backed securities. Discounts and premiums on securities purchased, other than temporary cash investments that mature in 60 days or less at the time of purchase, for the Portfolio are accreted and amortized, respectively, on the effective interest rate method.
Investment income and realized and unrealized gains and losses on investments of the Portfolio are allocated pro rata to the separate classes of shares based upon their relative net assets on the date the income is earned or realized and unrealized gains and losses are incurred.
The Portfolio may place a debt security on non-accrual status and reduce related interest income by ceasing current accruals and writing off all or a portion of any interest receivables when the collection of all or a portion of such interest has become doubtful. A debt security is removed from non-accrual status when the issuer resumes interest payments or when collectability of interest is reasonably assured.
(E) Expenses. Expenses of the Fund are allocated to the individual Portfolios in proportion to the net assets of the respective Portfolios when the expenses are incurred, except where direct allocations of expenses can be made. Expenses (other than fees incurred under the distribution and service plans, further discussed in Note 3(B), which are charged directly to the Service Class shares) are allocated to separate classes of shares pro rata based upon their relative net assets on the date the expenses are incurred. The expenses borne by the Portfolio, including those of related parties to the Portfolio, are shown in the Statement of Operations.
Additionally, the Portfolio may invest in mutual funds, which are subject to management fees and other fees that may cause the costs of investing in mutual funds to be greater than the costs of owning the underlying securities directly. These indirect expenses of mutual funds are not included in the amounts shown as expenses in the Statement of Operations or in the expense ratios included in the Financial Highlights.
(F) Use of Estimates. In preparing financial statements in conformity with GAAP, the Manager makes estimates and assumptions that affect the reported amounts and disclosures in the financial statements. Actual results could differ from those estimates and assumptions.
Notes to Financial Statements (Unaudited) (continued)
(G) Futures Contracts. A futures contract is an agreement to purchase or sell a specified quantity of an underlying instrument at a specified future date and price, or to make or receive a cash payment based on the value of a financial instrument (e.g., foreign currency, interest rate, security or securities index). The Portfolio is subject to risks such as market price risk and/or interest rate risk in the normal course of investing in these contracts. Upon entering into a futures contract, the Portfolio is required to pledge to the broker or futures commission merchant an amount of cash and/or U.S. government securities equal to a certain percentage of the collateral amount, known as the “initial margin.” During the period the futures contract is open, changes in the value of the contract are recognized as unrealized appreciation or depreciation by marking to market such contract on a daily basis to reflect the market value of the contract at the end of each day’s trading. The Portfolio agrees to receive from or pay to the broker or futures commission merchant an amount of cash equal to the daily fluctuation in the value of the contract. Such receipts or payments are known as “variation margin.” When the futures contract is closed, the Portfolio records a realized gain or loss equal to the difference between the proceeds from (or cost of) the closing transaction and the Portfolio's basis in the contract.
The use of futures contracts involves, to varying degrees, elements of market risk in excess of the amount recognized in the Statement of Assets and Liabilities. The contract or notional amounts and variation margin reflect the extent of the Portfolio's involvement in open futures positions. There are several risks associated with the use of futures contracts as hedging techniques. There can be no assurance that a liquid market will exist at the time when the Portfolio seeks to close out a futures contract. If no liquid market exists, the Portfolio would remain obligated to meet margin requirements until the position is closed. Futures contracts may involve a small initial investment relative to the risk assumed, which could result in losses greater than if the Portfolio did not invest in futures contracts. Futures contracts may be more volatile than direct investments in the instrument underlying the futures and may not correlate to the underlying instrument, causing a given hedge not to achieve its objectives. The Portfolio's activities in futures contracts have minimal counterparty risk as they are conducted through regulated exchanges that guarantee the futures against default by the counterparty. In the event of a bankruptcy or insolvency of a futures commission merchant that holds margin on behalf of the Portfolio, the Portfolio may not be entitled to the return of the entire margin owed to the Portfolio, potentially resulting in a loss. The Portfolio may invest in futures contracts to seek enhanced returns or to reduce the risk of loss by hedging certain of its holdings. The Portfolio's investment in futures contracts and other derivatives may increase the volatility of the Portfolio's NAVs and may result in a loss to the Portfolio. Open futures contracts as of June 30, 2021 are shown in the Portfolio of Investments.
(H) Dollar Rolls. The Portfolio may enter into dollar roll transactions in which it sells mortgage-backed securities ("MBS") from its portfolio to a counterparty from whom it simultaneously agrees to buy a similar security on a delayed delivery basis. The Portfolio generally transfers MBS where
the MBS are "to be announced," therefore, the Portfolio accounts for these transactions as purchases and sales.
When accounted for as purchase and sales, the securities sold in connection with the dollar rolls are removed from the portfolio and a realized gain or loss is recognized. The securities the Portfolio has agreed to acquire are included at market value in the Portfolio of Investments and liabilities for such purchase commitments are included as payables for investments purchased. During the roll period, the Portfolio foregoes principal and interest paid on the securities. The Portfolio is compensated by the difference between the current sales price and the forward price for the future as well as by the earnings on the cash proceeds of the initial sale. Dollar rolls may be renewed without physical delivery of the securities subject to the contract. The Portfolio maintains liquid assets from its portfolio having a value not less than the repurchase price, including accrued interest. Dollar roll transactions involve certain risks, including the risk that the securities returned to the Portfolio at the end of the roll period, while substantially similar, could be inferior to what was initially sold to the counterparty.
(I) Debt Securities Risk. The ability of issuers of debt securities held by the Portfolio to meet their obligations may be affected by, among other things, economic or political developments in a specific country, industry or region. Debt securities are also subject to the risks associated with changes in interest rates.
Investments in the Portfolio are not guaranteed, even though some of the Portfolio’s underlying investments are guaranteed by the U.S. government or its agencies or instrumentalities. The principal risk of mortgage-related and asset-backed securities is that the underlying debt may be prepaid ahead of schedule, if interest rates fall, thereby reducing the value of the Portfolio’s investment. If interest rates rise, less of the debt may be prepaid and the Portfolio may lose money because the Portfolio may be unable to invest in higher yielding assets. The Portfolio is subject to interest-rate risk and can lose principal value when interest rates rise. Bonds are also subject to credit risk, in which the bond issuer may fail to pay interest and principal in a timely manner.
(J) LIBOR Replacement Risk. The Portfolio may invest in certain debt securities, derivatives or other financial instruments that utilize the London Interbank Offered Rate ("LIBOR"), as a “benchmark” or “reference rate” for various interest rate calculations. The United Kingdom Financial Conduct Authority, which regulates LIBOR, announced that after 2021 it will cease its active encouragement of banks to provide the quotations needed to sustain LIBOR. However, it is possible that certain LIBOR tenors may continue beyond 2021 and the most widely used LIBOR tenors may continue until mid-2023. As a result, it is anticipated that LIBOR will be discontinued or will no longer be sufficiently robust to be representative of its underlying market around that time. Although financial regulators and industry working groups have suggested alternative reference rates, such as European Interbank Offer Rate (“EURIBOR”), Sterling Overnight Interbank Average Rate (“SONIA”) and Secured Overnight Financing Rate (“SOFR”), there are challenges to converting certain contracts and transactions to a new benchmark and neither the full effects of the
| 24 | MainStay VP MacKay Government Portfolio |
transition process nor its ultimate outcome is known. New York Life Investments is currently working to assess exposure and will modify contracts as necessary.
The elimination of LIBOR or changes to other reference rates or any other changes or reforms to the determination or supervision of reference rates could have an adverse impact on the market for, or value of, any securities or payments linked to those reference rates, which may adversely affect the Portfolio's performance and/or net asset value. Uncertainty and risk also remain regarding the willingness and ability of issuers and lenders to include revised provisions in new and existing contracts or instruments. Consequently, the transition away from LIBOR to other reference rates may lead to increased volatility and illiquidity in markets that are tied to LIBOR, fluctuations in values of LIBOR-related investments or investments in issuers that utilize LIBOR, increased difficulty in borrowing or refinancing and diminished effectiveness of hedging strategies, adversely affecting the Portfolio's performance. Furthermore, the risks associated with the expected discontinuation of LIBOR and transition may be exacerbated if the work necessary to effect an orderly transition to an alternative reference rate is not completed in a timely manner. Because the usefulness of LIBOR as a benchmark could deteriorate during the transition period, these effects could occur prior to the end of 2021 with respect to certain LIBOR tenors or mid-2023 for the remaining LIBOR tenors.
(K) Indemnifications. Under the Fund’s organizational documents, its officers and trustees are indemnified against certain liabilities that may arise out of performance of their duties to the Fund. Additionally, in the normal course of business, the Portfolio enters into contracts with third-party service providers that contain a variety of representations and warranties and that may provide general indemnifications. The Portfolio's maximum exposure under these arrangements is unknown, as this would involve future claims that may be made against the Portfolio that have not yet occurred. The Manager believes that the risk of loss in connection with these potential indemnification obligations is remote. However, there can be no assurance that material liabilities related to such obligations will not arise in the future, which could adversely impact the Portfolio.
(L) Quantitative Disclosure of Derivative Holdings. The following tables show additional disclosures related to the Portfolio's derivative and hedging activities, including how such activities are accounted for and their effect on the Portfolio's financial positions, performance and cash flows.
The Portfolio entered into futures contracts to help manage the duration and yield curve positioning of the portfolio while minimizing the exposure to wider bid/ask spreads in traditional bonds. These derivatives are not accounted for as hedging instruments.
Fair value of derivative instruments as of June 30, 2021:
| Liability Derivatives | Interest
Rate
Contracts
Risk | Total |
| Futures Contracts - Net Assets—Net unrealized depreciation on futures contracts (a) | $(231,644) | $(231,644) |
| Total Fair Value | $(231,644) | $(231,644) |
| (a) | Includes cumulative appreciation (depreciation) of futures contracts as reported in the Portfolio of Investments. Only current day’s variation margin is reported within the Statement of Assets and Liabilities. |
The effect of derivative instruments on the Statement of Operations for the six-month period ended June 30, 2021:
| Net Realized Gain (Loss) from: | Interest
Rate
Contracts
Risk | Total |
| Futures Contracts | $(94,934) | $(94,934) |
| Total Net Realized Gain (Loss) | $(94,934) | $(94,934) |
| Net Change in Unrealized Appreciation (Depreciation) | Interest
Rate
Contracts
Risk | Total |
| Futures Contracts | $(231,644) | $(231,644) |
| Total Net Change in Unrealized Appreciation (Depreciation) | $(231,644) | $(231,644) |
| Average Notional Amount | Total |
| Futures Contracts Short | $(7,715,953) |
Note 3–Fees and Related Party Transactions
(A) Manager and Subadvisor. New York Life Investments, a registered investment adviser and an indirect, wholly-owned subsidiary of New York Life, serves as the Portfolio's Manager, pursuant to an Amended and Restated Management Agreement ("Management Agreement"). The Manager provides offices, conducts clerical, recordkeeping and bookkeeping services and keeps most of the financial and accounting records required to be maintained by the Portfolio. Except for the portion of salaries and expenses that are the responsibility of the Portfolio, the Manager pays the salaries and expenses of all personnel affiliated with the Portfolio and certain operational expenses of the Portfolio. The Portfolio reimburses New York Life Investments in an amount equal to the portion of the compensation of the Chief Compliance Officer attributable to the Portfolio. MacKay Shields LLC ("MacKay Shields" or the "Subadvisor"), a registered investment adviser and an indirect, wholly-owned subsidiary of New York Life, serves as Subadvisor to the Portfolio and is responsible for the day-to-day portfolio management of the Portfolio. Pursuant to the terms of an Amended and Restated Subadvisory Agreement ("Subadvisory Agreement") between New York
Notes to Financial Statements (Unaudited) (continued)
Life Investments and MacKay Shields, New York Life Investments pays for the services of the Subadvisor.
Pursuant to the Management Agreement, the Fund pays the Manager, on behalf of the Portfolio, a monthly fee for the services performed and the facilities furnished at an annual rate of the Portfolio's average daily net assets as follows: 0.50% up to $500 million; 0.475% from $500 million to $1 billion; and 0.45% in excess of $1 billion. During the six-month period ended June 30, 2021, the effective management fee rate was 0.50%.
During the six-month period ended June 30, 2021, New York Life Investments earned fees from the Portfolio in the amount of $933,044 and paid the Subadvisor in the amount of $466,503.
JPMorgan provides sub-administration and sub-accounting services to the Portfolio pursuant to an agreement with New York Life Investments. These services include calculating the daily NAVs of the Portfolio, maintaining the general ledger and sub-ledger accounts for the calculation of the Portfolio's NAVs, and assisting New York Life Investments in conducting various aspects of the Portfolio's administrative operations. For providing these services to the Portfolio, JPMorgan is compensated by New York Life Investments.
Prior to February 22, 2021, these services were provided by State Street.
Pursuant to an agreement between the Fund and New York Life Investments, New York Life Investments is responsible for providing or procuring certain regulatory reporting services for the Portfolio. The Portfolio will reimburse New York Life Investments for the actual costs incurred by New York Life Investments in connection with providing or procuring these services for the Portfolio.
(B) Distribution and Service Fees. The Fund, on behalf of the Portfolio, has entered into a distribution agreement with NYLIFE Distributors LLC (the “Distributor”), an affiliate of New York Life Investments. The Portfolio has adopted a distribution plan (the “Plan”) in accordance with the provisions of Rule 12b-1 under the 1940 Act. Under the Plan, the Distributor has agreed to provide, through its affiliates or independent third parties, various distribution-related, shareholder and administrative support services to the Service Class shareholders. For its services, the Distributor is entitled to a combined distribution and service fee accrued daily and paid monthly at an annual rate of 0.25% of the average daily net assets attributable to the Service Class shares of the Portfolio.
(C) Investments in Affiliates (in 000’s). During the six-month period ended June 30, 2021, purchases and sales transactions, income earned from investments and shares held of investment companies managed by New York Life Investments or its affiliates were as follows:
| Affiliated Investment Companies | Value,
Beginning
of Period | Purchases
at Cost | Proceeds
from
Sales | Net
Realized
Gain/(Loss)
on Sales | Change in
Unrealized
Appreciation/
(Depreciation) | Value,
End of
Period | Dividend
Income | Other
Distributions | Shares
End of
Period |
| MainStay U.S. Government Liquidity Fund | $ 12,052 | $ 175,746 | $ (177,190) | $ — | $ — | $ 10,608 | $ —(a) | $ — | 10,608 |
Note 4-Federal Income Tax
As of June 30, 2021, the cost and unrealized appreciation (depreciation) of the Portfolio’s investment portfolio, including applicable derivative contracts and other financial instruments, as determined on a federal income tax basis, were as follows:
| | Federal Tax
Cost | Gross
Unrealized
Appreciation | Gross
Unrealized
(Depreciation) | Net
Unrealized
Appreciation/
(Depreciation) |
| Investments in Securities | $328,601,368 | $8,220,230 | $(1,557,274) | $6,662,956 |
As of December 31, 2020, for federal income tax purposes, capital loss carryforwards of $3,839,017, as shown in the table below, were available to the extent provided by the regulations to offset future realized gains of the Portfolio. Accordingly, no capital gains distributions are expected to be
paid to shareholders until net gains have been realized in excess of such amounts.
Capital Loss
Available Through | Short-Term
Capital Loss
Amounts (000’s) | Long-Term
Capital Loss
Amounts (000’s) |
| Unlimited | $— | $3,839 |
During the year ended December 31, 2020, the tax character of distributions paid as reflected in the Statements of Changes in Net Assets was as follows:
| | 2020 |
| Distributions paid from: | |
| Ordinary Income | $4,927,835 |
Note 5–Custodian
JPMorgan is the custodian of cash and securities held by the Portfolio. Custodial fees are charged to the Portfolio based on the Portfolio's net assets and/or the market value of securities held by the Portfolio and the number of certain transactions incurred by the Portfolio.
| 26 | MainStay VP MacKay Government Portfolio |
Prior to February 22, 2021, these services were provided by State Street. The services provided by State Street were a direct expense of the Portfolio and are included in the Statement of Operations as Custodian fees which totaled $4,515 for the period January 1, 2021 through February 21, 2021.
Note 6–Line of Credit
The Portfolio and certain other funds managed by New York Life Investments maintain a line of credit with a syndicate of banks in order to secure a source of funds for temporary purposes to meet unanticipated or excessive redemption requests.
Effective July 27, 2021, under the credit agreement (the “Credit Agreement”), the aggregate commitment amount is $600,000,000 with an additional uncommitted amount of $100,000,000. The commitment fee is an annual rate of 0.15% of the average commitment amount payable quarterly, regardless of usage, to JPMorgan, who serves as the agent to the syndicate. The commitment fee is allocated among the Portfolio and certain other funds managed by New York Life Investments based upon their respective net assets and other factors. Interest on any revolving credit loan is charged based upon the Federal Funds Rate or the one-month London Interbank Offered Rate ("LIBOR"), whichever is higher. The Credit Agreement expires on July 26, 2022, although the Portfolio, certain other funds managed by New York Life Investments and the syndicate of banks may renew the Credit Agreement for an additional year on the same or different terms or enter into a credit agreement with a different syndicate of banks. Prior to July 27, 2021, the aggregate commitment amount and the commitment fee were the same as those under the current Credit Agreement. During the six-month period ended June 30, 2021, there were no borrowings made or outstanding with respect to the Portfolio under the Credit Agreement.
Note 7–Interfund Lending Program
Pursuant to an exemptive order issued by the SEC, the Portfolio, along with certain other funds managed by New York Life Investments, may participate in an interfund lending program. The interfund lending program provides an alternative credit facility that permits the Portfolio and certain other funds managed by New York Life Investments to lend or borrow money for temporary purposes directly to or from one another, subject to the conditions of the exemptive order. During the six-month period ended June 30, 2021, there were no interfund loans made or outstanding with respect to the Portfolio.
Note 8–Purchases and Sales of Securities (in 000’s)
During the six-month period ended June 30, 2021, purchases and sales of U.S. government securities were $63,578 and $72,106, respectively. Purchases and sales of securities, other than U.S. government securities and short-term securities, were $98,140 and $134,149 respectively.
Note 9–Capital Share Transactions
Transactions in capital shares for the six-month period ended June 30, 2021 and the year ended December 31, 2020, were as follows:
| Initial Class | Shares | Amount |
| Period ended June 30, 2021: | | |
| Shares sold | 3,552,127 | $ 39,510,424 |
| Shares redeemed | (6,434,827) | (71,578,878) |
| Net increase (decrease) | (2,882,700) | $ (32,068,454) |
| Year ended December 31, 2020: | | |
| Shares sold | 5,754,098 | $ 64,738,684 |
| Shares issued to shareholders in reinvestment of distributions | 105,587 | 1,180,531 |
| Shares redeemed | (1,001,790) | (11,226,218) |
| Net increase (decrease) | 4,857,895 | $ 54,692,997 |
| |
| Service Class | Shares | Amount |
| Period ended June 30, 2021: | | |
| Shares sold | 1,272,415 | $ 14,054,605 |
| Shares redeemed | (3,206,090) | (35,290,772) |
| Net increase (decrease) | (1,933,675) | $ (21,236,167) |
| Year ended December 31, 2020: | | |
| Shares sold | 15,621,490 | $ 173,215,081 |
| Shares issued to shareholders in reinvestment of distributions | 338,268 | 3,747,304 |
| Shares redeemed | (9,342,684) | (103,745,957) |
| Net increase (decrease) | 6,617,074 | $ 73,216,428 |
Note 10–Other Matters
An outbreak of COVID-19, first detected in December 2019, has developed into a global pandemic and has resulted in travel restrictions, closure of international borders, certain businesses and securities markets, restrictions on securities trading activities, prolonged quarantines, supply chain disruptions, and lower consumer demand, as well as general concern and uncertainty. The continued impact of COVID-19 and related new variants is uncertain and could further adversely affect the global economy, national economies, individual issuers and capital markets in unforeseeable ways and result in a substantial and extended economic downturn. Developments that disrupt global economies and financial markets, such as COVID-19, may magnify factors that affect the Portfolio's performance.
Note 11–Subsequent Events
In connection with the preparation of the financial statements of the Portfolio as of and for the six-month period ended June 30, 2021, events and transactions subsequent to June 30, 2021, through the date the financial statements were issued have been evaluated by the Manager for possible adjustment and/or disclosure. No subsequent events requiring financial statement adjustment or disclosure have been identified.
Discussion of the Operation and Effectiveness of the Portfolio's Liquidity Risk Management Program (Unaudited)
In compliance with Rule 22e-4 under the Investment Company Act of 1940, as amended (the “Liquidity Rule”), the Portfolio has adopted and implemented a liquidity risk management program (the “Program”), which New York Life Investment Management LLC believes is reasonably designed to assess and manage the Portfolio's liquidity risk (the risk that the Portfolio could not meet requests to redeem shares issued by the Portfolio without significant dilution of remaining investors’ interests in the Portfolio). The Board of Trustees of MainStay VP Funds Trust (the "Board") designated New York Life Investment Management LLC as administrator of the Program (the “Administrator”). The Administrator has established a Liquidity Risk Management Committee to assist the Administrator in the implementation and day-to-day administration of the Program and to otherwise support the Administrator in fulfilling its responsibilities under the Program.
At a meeting of the Board held on March 8, 2021, the Administrator provided the Board with a written report addressing the Program’s operation and assessing its adequacy and effectiveness of implementation for the period from January 1, 2020 through December 31, 2020 (the "Review Period"), as required under the Liquidity Rule. The report noted that the Administrator concluded that (i) the Program operated effectively to assess and manage the Portfolio's liquidity risk, (ii) the Program has been adequately and effectively implemented to monitor and, as applicable, respond to the Portfolio's liquidity developments and (iii) the Portfolio's investment strategy continues to be appropriate for an open-end fund. In addition, the report discussed notable events that impacted liquidity risk during the Review Period, including the COVID-19 pandemic and the resulting economic shutdown.
In accordance with the Program, the Portfolio's liquidity risk is assessed no less frequently than annually taking into consideration certain factors, as applicable, such as (i) investment strategy and liquidity of portfolio investments, (ii) short-term and long-term cash flow projections and (iii) holdings of cash and cash equivalents, as well as borrowing arrangements and other funding sources. Certain factors are considered under both normal and reasonably foreseeable stressed conditions.
Each Portfolio portfolio investment is classified into one of four liquidity categories. The classification is based on a determination of the number of days it is reasonably expected to take to convert the investment into cash, or sell or dispose of the investment, in current market conditions without significantly changing the market value of the investment. The Administrator has delegated liquidity classification determinations to the Portfolio’s subadvisor, subject to appropriate oversight by the Administrator, and classification determinations are made by taking into account the Portfolio's reasonably anticipated trade size, various market, trading and investment-specific considerations, as well as market depth, and, in certain cases, third-party vendor data.
The Liquidity Rule requires portfolios that do not primarily hold assets that are highly liquid investments to adopt a minimum amount of net assets that must be invested in highly liquid investments that are assets (an “HLIM”). In addition, the Liquidity Rule limits a portfolio's investments in illiquid investments. Specifically, the Liquidity Rule prohibits acquisition of illiquid investments if doing so would result in a portfolio holding more than 15% of its net assets in illiquid investments that are assets. The Program includes provisions reasonably designed to determine, periodically review and comply with the HLIM requirement, as applicable, and to comply with the 15% limit on illiquid investments.
There can be no assurance that the Program will achieve its objectives under all circumstances in the future. Please refer to the Portfolio's prospectus for more information regarding the Portfolio's exposure to liquidity risk and other risks to which it may be subject.
| 28 | MainStay VP MacKay Government Portfolio |
Proxy Voting Record
The Portfolio is required to file with the SEC its proxy voting records for the 12-month period ending June 30 on Form N-PX. The Portfolio's most recent Form N-PX or proxy voting record is available free of charge upon request (i) by calling 800-598-2019; (ii) by visiting New York Life Investments’ website at https://www.nylinvestments.com/mainstay/
products-and-performance/mainstay-vp-funds-trust; or (iii) by visiting the SEC’s website at www.sec.gov.
Shareholder Reports and Quarterly Portfolio Disclosure
The Portfolio is required to file its complete schedule of portfolio holdings with the SEC 60 days after its first and third fiscal quarter on Form N-PORT. The Portfolio's holdings report is available free of charge upon request by calling 800-598-2019 or by visiting the SEC’s website at www.sec.gov.
This page intentionally left blank
MainStay VP Portfolios
MainStay VP offers a wide range of Portfolios. The full array of MainStay VP offerings is listed here, with information about the manager, subadvisors, legal counsel, and independent registered public accounting firm.
Equity
MainStay VP Candriam Emerging Markets Equity Portfolio
MainStay VP Epoch U.S. Equity Yield Portfolio
MainStay VP Fidelity Institutional AM® Utilities Portfolio†
MainStay VP MacKay International Equity Portfolio
MainStay VP MacKay S&P 500 Index Portfolio
MainStay VP Natural Resources Portfolio
MainStay VP Small Cap Growth Portfolio
MainStay VP T. Rowe Price Equity Income Portfolio
MainStay VP Wellington Growth Portfolio
MainStay VP Wellington Mid Cap Portfolio
MainStay VP Wellington Small Cap Portfolio
MainStay VP Wellington U.S. Equity Portfolio
MainStay VP Winslow Large Cap Growth Portfolio
Mixed Asset
MainStay VP Balanced Portfolio
MainStay VP Income Builder Portfolio
MainStay VP Janus Henderson Balanced Portfolio
MainStay VP MacKay Convertible Portfolio
Income
MainStay VP Bond Portfolio
MainStay VP Floating Rate Portfolio
MainStay VP Indexed Bond Portfolio
MainStay VP MacKay Government Portfolio
MainStay VP MacKay High Yield Corporate Bond Portfolio
MainStay VP MacKay Strategic Bond Portfolio
MainStay VP PIMCO Real Return Portfolio
Money Market
MainStay VP U.S. Government Money Market Portfolio
Alternative
MainStay VP CBRE Global Infrastructure Portfolio
MainStay VP IQ Hedge Multi-Strategy Portfolio
Asset Allocation
MainStay VP Conservative Allocation Portfolio
MainStay VP Equity Allocation Portfolio
MainStay VP Growth Allocation Portfolio
MainStay VP Moderate Allocation Portfolio
Manager
New York Life Investment Management LLC
New York, New York
Subadvisors
Brown Advisory LLC
Baltimore, Maryland
Candriam Belgium S.A.*
Brussels, Belgium
CBRE Clarion Securities LLC
Radnor, Pennsylvania
Epoch Investment Partners, Inc.
New York, New York
FIAM LLC
Smithfield, Rhode Island
IndexIQ Advisors LLC*
New York, New York
Janus Capital Management LLC
Denver, Colorado
MacKay Shields LLC*
New York, New York
Mellon Investments Corporation
Boston, Massachusetts
NYL Investors LLC*
New York, New York
Pacific Investment Management Company LLC
Newport Beach, California
Segall Bryant & Hamill, LLC
Chicago, Illinois
T. Rowe Price Associates, Inc.
Baltimore, Maryland
Wellington Management Company LLP
Boston, Massachusetts
Winslow Capital Management, LLC
Minneapolis, Minnesota
Legal Counsel
Dechert LLP
Washington, District of Columbia
Independent Registered Public Accounting Firm
PricewaterhouseCoopers LLP
New York, New York
Distributor
NYLIFE Distributors LLC*
Jersey City, New Jersey
Custodian
JPMorgan Chase Bank, N.A.
New York, New York
Some Portfolios may not be available in all products.
† Fidelity Institutional AM is a registered trade mark of FMR LLC. Used with permission.
* An affiliate of New York Life Investment Management LLC
Not part of the Semiannual Report
2021 Semiannual Report
This report is for the general information of New York Life Variable Annuities and NYLIAC Variable Universal Life Insurance Products policyowners. It must be preceded or accompanied by the appropriate product(s) and funds prospectuses if it is given to anyone who is not an owner of a New York Life variable annuity policy or a NYLIAC Variable Universal Life Insurance Product. This report does not offer for sale or solicit orders to purchase securities.
The performance data quoted in this report represents past performance. Past performance is no guarantee of future results. Due to market volatility and other factors, current performance may be lower or higher than the figures shown. The most recent month-end performance summary for your variable annuity or variable life policy is available by calling 800-598-2019 and is updated periodically on newyorklife.com.
The New York Life Variable Annuities and NYLIAC Variable Universal Life Insurance Products are issued by New York Life Insurance and Annuity Corporation (a Delaware Corporation) and distributed by NYLIFE Distributors LLC (Member FINRA/SIPC).
New York Life Insurance Company
New York Life Insurance and Annuity
Corporation (NYLIAC) (A Delaware Corporation)
51 Madison Avenue, Room 551
New York, NY 10010
newyorklife.com
nylinvestments.com
NYLIFE Distributors LLC, 30 Hudson Street, Jersey City, NJ 07302
New York Life Investment Management LLC is the investment manager to the MainStay VP Funds Trust
©2021 by NYLIFE Distributors LLC. All rights reserved.
You may obtain copies of the Prospectus and the Statement of Additional Information free of charge, upon request, by calling toll-free 800-598-2019 or writing to New York Life Insurance and Annuity Corporation, 51 Madison Avenue, New York, NY 10010.
| Not FDIC Insured | No Bank Guarantee | May Lose Value |
(NYLIAC) NI519
MainStay VP Indexed Bond Portfolio
Message from the President and Semiannual Report
Unaudited | June 30, 2021
Sign up for e-delivery of your shareholder reports. For full details on e-delivery, including who can participate and what you can receive via e-delivery,
please log in to newyorklifeinvestments.com/accounts.
| Not FDIC/NCUA Insured | Not a Deposit | May Lose Value | No Bank Guarantee | Not Insured by Any Government Agency |
This page intentionally left blank
Message from the President
The COVID-19 pandemic continued to afflict our personal lives and broad segments of the U.S. and global economy throughout the six-month reporting period ended June 30, 2021. However, with the deployment of multiple vaccines around the world, including three highly effective versions approved for emergency use in the United States, investors began to turn their attention toward the gradual reopening of the economy and the shape the “new normal” would take.
The first half of the reporting period saw increasing inflationary concerns as fiscal stimulus business reopenings drove accelerating economic growth, rising commodity prices and increased consumer spending. However, the U.S. Federal Reserve noted that price increases were likely to prove temporary and made clear their intention to remain accommodative for the foreseeable future. Accordingly, after moving higher in the first quarter of 2021, interest rates declined in the second quarter.
In response to the uncertain inflation outlook, equity market leadership shifted from value in the first quarter of the year to growth in the second quarter. Nevertheless, investor sentiment remained buoyant throughout the reporting period, with all eleven sectors in the S&P 500® Index, a widely regarded benchmark of market performance, producing positive returns. Energy led the market’s rise fueled by rapidly increasing oil and gas prices, followed by financials and real estate, which benefited from rising interest rates and the economic reopening, respectively. Communication services produced the slowest growth, followed by the traditionally defensive utilities and consumer staples
sectors. In the fixed income market, lower-credit-quality issues tended to outperform their higher-grade counterparts, with high-yield corporate bonds generating the strongest performance. Among securitized products, commercial mortgage-backed securities generally produced the strongest returns, followed by mortgage-backed securities and asset-backed securities, while Treasury securities lagged.
Despite the tremendous progress we’ve seen so far this year, the United States and the world continue to face significant pandemic-related challenges. Newer, more contagious variants of COVID-19 threaten the return of restrictions and lockdowns that could stall the economic recovery. At the same time, supply chain shortages have led to rising prices on everything from laptops to autos, stoking fears of uncontrolled inflation despite reassurance from the U.S. Federal Reserve. At New York Life Investments, we recognize that the shape that the “new normal” eventually takes may differ from our expectations. You can depend on us to keep a sharp watch for the unexpected, and to continue to help you find your way through this rapidly evolving investment landscape.
Sincerely,
Kirk C. Lehneis
President
The opinions expressed are as of the date of this report and are subject to change. There is no guarantee that any forecast made will come to pass. This material does not constitute investment advice and is not intended as an endorsement of any specific investment. Past performance is no guarantee of future results.
Not part of the Semiannual Report
Investors should refer to the Portfolio’s Summary Prospectus and/or Prospectus and consider the Portfolio’s investment objectives, strategies, risks, charges and expenses carefully before investing. The Summary Prospectus and/or Prospectus contain this and other information about the Portfolio. You may obtain copies of the Portfolio’s Summary Prospectus and/or the Prospectus and the Statement of Additional Information free of charge, upon request, by calling toll-free 800-598-2019, by writing to New York Life Insurance and Annuity Corporation, 51 Madison Avenue, Room 251, New York, New York 10010 or by sending an email to MainStayShareholdersServices@nylim.com. These documents are also available at nylinvestments.com/vpdocuments. Please read the Portfolio's Summary Prospectus and/or Prospectus carefully before investing. MainStay VP Funds Trust portfolios are separate account options which are purchased through a variable insurance or variable annuity contract.
Investment and Performance Comparison (Unaudited)
Performance data quoted represents past performance. Past performance is no guarantee of future results. Because of market volatility and other factors, current performance may be lower or higher than the figures shown. Investment return and principal value will fluctuate, and as a result, when shares are redeemed, they may be worth more or less than their original cost. The performance table and graph do not reflect any deduction of sales charges, mortality and expense charges, contract charges or administrative charges. Please refer to the Performance Summary appropriate for your policy. For performance information current to the most recent month-end, please call 800-598-2019 or visit www.newyorklife.com.
Performance figures may reflect certain fee waivers and/or expense limitations, without which total returns may have been different. For information on current fee waivers and/or expense limitations (if any), please refer to the Notes to Financial Statements.
| Average Annual Total Returns for the Period-Ended June 30, 2021 |
| Class | Inception
Date | Six
Months | One
Year | Since
Inception | Gross
Expense
Ratio1 |
| Initial Class Shares | 5/1/2017 | -1.80% | -0.95% | 3.42% | 0.29% |
| 1. | The gross expense ratios presented reflect the Portfolio’s “Total Annual Portfolio Operating Expenses” from the most recent Prospectus, as supplemented, and may differ from other expense ratios disclosed in this report. |
| Benchmark Performance | Six
Months | One
Year | Since
Inception |
| Bloomberg Barclays U.S. Aggregate Bond Index1 | -1.60% | -0.33% | 3.89% |
| Morningstar Intermediate Core Bond Category Average2 | -1.25 | 0.61 | 3.75 |
| 1. | The Bloomberg Barclays U.S. Aggregate Bond Index is the Portfolio's primary benchmark. The Bloomberg Barclays U.S. Aggregate Bond Index is a broad-based benchmark that measures performance of the investment-grade, U.S. dollar denominated, fixed-rate taxable bond market, including Treasurys, government-related and corporate securities, mortgage-backed securities (agency fixed-rate and hybrid adjustable-rate mortgage pass-throughs), asset-backed securities and commercial mortgage-backed securities. Results assume reinvestment of all dividends and capital gains. An investment cannot be made directly in an index. |
| 2. | The Morningstar Intermediate Core Bond Category Average is representative of funds that invest primarily in investment-grade U.S. fixed-income issues including government, corporate, and securitized debt, and hold less than 5% in below-investment-grade exposures. Their durations (a measure of interest-rate sensitivity) typically range between 75% and 125% of the three-year average of the effective duration of the Morningstar Core Bond Index. Results are based on average total returns of similar funds with all dividends and capital gain distributions reinvested. |
Cost in Dollars of a $1,000 Investment in MainStay VP Indexed Bond Portfolio (Unaudited)
The example below is intended to describe the fees and expenses borne by shareholders during the six-month period from January 1, 2021 to June 30, 2021, and the impact of those costs on your investment.
Example
As a shareholder of the Portfolio you incur two types of costs: (1) transaction costs, including exchange fees and sales charges (loads) on purchases (as applicable), and (2) ongoing costs, including management fees, distribution and/or service (12b-1) fees, and other Portfolio expenses (as applicable). This example is intended to help you understand your ongoing costs (in dollars) of investing in the Portfolio and to compare these costs with the ongoing costs of investing in other mutual funds. The example is based on an investment of $1,000 made at the beginning of the six-month period and held for the entire period from January 1, 2021 to June 30, 2021. Shares are only sold in connection with variable life and annuity contracts and the example does not reflect any contract level or transactional fees or expenses. If these costs had been included, your costs would have been higher.
This example illustrates your Portfolio’s ongoing costs in two ways:
Actual Expenses
The second and third data columns in the table below provide information about actual account values and actual expenses. You may use the information in these columns, together with the amount you invested, to estimate the expenses that you paid during the six months ended June
30, 2021. Simply divide your account value by $1,000 (for example, an $8,600 account value divided by $1,000 = 8.6), then multiply the result by the number under the heading entitled “Expenses Paid During Period” to estimate the expenses you paid on your account during this period.
Hypothetical Example for Comparison Purposes
The fourth and fifth data columns in the table below provide information about hypothetical account values and hypothetical expenses based on the Portfolio’s actual expense ratio and an assumed rate of return of 5% per year before expenses, which is not the Portfolio’s actual return. The hypothetical account values and expenses may not be used to estimate the actual ending account balances or expenses you paid for the six-month period shown. You may use this information to compare the ongoing costs of investing in the Portfolio with the ongoing costs of investing in other mutual funds. To do so, compare this 5% hypothetical example with the 5% hypothetical examples that appear in the shareholder reports of the other mutual funds.
Please note that the expenses shown in the table are meant to highlight your ongoing costs only and do not reflect any transactional costs, such as exchange fees or sales charges (loads). Therefore, the fourth and fifth data columns of the table are useful in comparing ongoing costs only and will not help you determine the relative total costs of owning different funds. In addition, if these transactional costs were included, your costs would have been higher.
| Share Class | Beginning
Account
Value
1/1/21 | Ending Account
Value (Based
on Actual
Returns and
Expenses)
6/30/21 | Expenses
Paid
During
Period1 | Ending Account
Value (Based
on Hypothetical
5% Annualized
Return and
Actual Expenses)
6/30/21 | Expenses
Paid
During
Period1 | Net Expense
Ratio
During
Period2 |
| Initial Class Shares | $1,000.00 | $982.00 | $1.47 | $1,023.31 | $1.51 | 0.30% |
| 1. | Expenses are equal to the Portfolio’s annualized expense ratio of each class multiplied by the average account value over the period, divided by 365 and multiplied by 181 (to reflect the six-month period). The table above represents the actual expenses incurred during the six-month period. In addition to the fees and expenses which the Portfolio bears directly, it also indirectly bears a pro rata share of the fees and expenses of the underlying funds in which it invests. Such indirect expenses are not included in the above-reported expense figures. |
| 2. | Expenses are equal to the Portfolio's annualized expense ratio to reflect the six-month period. |
| 6 | MainStay VP Indexed Bond Portfolio |
Portfolio Composition as of June 30, 2021 (Unaudited)
See Portfolio of Investments beginning on page 9 for specific holdings within these categories. The Portfolio's holdings are subject to change.
Top Ten Issuers Held as of June 30, 2021 (excluding short-term investments) (Unaudited)
| 1. | U.S. Treasury Notes, 0.125%-2.875%, due 12/31/22–5/15/31 |
| 2. | UMBS, Single Family, 30 Year, 2.00%-2.50%, due 7/25/51 |
| 3. | UMBS, 30 Year, 2.00%-5.50%, due 6/1/36–10/1/50 |
| 4. | U.S. Treasury Bonds, 1.25%-4.625%, due 2/15/36–11/15/50 |
| 5. | GNMA II, 30 Year, 2.50%-5.00%, due 11/20/42–2/20/50 |
| 6. | GNMA II, Single Family, 30 Year, 2.00%-2.50%, due 7/15/51 |
| 7. | FHLMC Gold Pools, 30 Year, 3.00%-5.50%, due 7/1/38–1/1/49 |
| 8. | UMBS, Single Family, 15 Year, 1.50%-2.00%, due 7/25/36 |
| 9. | UMBS, 30 Year, 2.50%-4.50%, due 12/1/47–5/1/50 |
| 10. | FNMA, 0.65%-1.875%, due 4/5/22–9/24/26 |
Portfolio Management Discussion and Analysis (Unaudited)
Answers to the questions reflect the views of portfolio managers Kenneth Sommer and AJ Rzad, CFA, of NYL Investors LLC, the Portfolio’s Subadvisor.
How did MainStay VP Indexed Bond Portfolio perform relative to its benchmark and peers during the six months ended June 30, 2021?
For the six months ended June 30, 2021, MainStay VP Indexed Bond Portfolio returned −1.80% for Initial Class shares. Over the same period, Initial Class shares underperformed the −1.60% return of the Bloomberg Barclays U.S. Aggregate Bond Index (“the Index”), which is the Portfolio’s benchmark. Although the Portfolio seeks investment results that correspond to the total return performance of fixed-income securities in the aggregate, as represented by the Portfolio’s benchmark, the Portfolio’s performance will typically lag that of the Index because the Portfolio incurs fees and expenses that the Index does not. For the six months ended June 30, 2021, Initial Class shares underperformed the −1.25% return of the Morningstar Intermediate Core Bond Category Average.1
During the reporting period, how was the Portfolio’s performance materially affected by investments in derivatives?
U.S. Treasury futures were used to maintain a duration2 equal to that of the Index and did not materially affect the performance of the Portfolio. Treasury futures were also used to reduce variations between the Portfolio and the Index. These trades reduced tracking error for the Portfolio and the Index.
During the reporting period, which credit-rating categories were strong performers and which credit rating categories were weak?
BBB-rated credit generated the highest excess return followed by the AA-rated category.3 All investment-grade credit categories produced positive excess returns during the reporting period, outperforming matched-duration Treasury securities.
What was the Portfolio’s duration strategy during the reporting period?
The Portfolio employs a passive strategy that attempts to replicate the duration of the Index. The Portfolio’s duration strategy had a neutral impact on performance during the reporting period. As of June 30, 2021, the Portfolio’s duration was approximately 6.65 years, as compared to a duration of 6.66 years for the Index.
Which market segments made the strongest contributions to the Portfolio’s performance, and which market segments detracted the most?
During the reporting period, all broad sectors in the Index, outside of asset-backed securities (ABS), produced negative total returns. Driven by the relatively short duration on ABS, the sector’s total return during the reporting period was slightly positive. The Treasury sector detracted the most from performance as interest rates rose and the longer duration nature of the Treasury sector negatively impacted performance. The corporate sector produced the second-weakest performance, with the industrials and utility subsectors detracting most. In the non-corporate sector, the sovereign subsector was the worst performer. Among securitized products, ABS outperformed both commercial mortgage-backed securities and mortgage-backed securities.
Were there any significant changes to the Portfolio’s benchmark during the reporting period?
There were no changes to the Index material enough to lead us to change the Portfolio’s investment strategy.
| 1. | See page 5 for more information on benchmark and peer group returns. |
| 2. | Duration is a measure of the price sensitivity of a fixed-income investment to changes in interest rates. Duration is expressed as a number of years and is considered a more accurate sensitivity gauge than average maturity. |
| 3. | An obligation rated ‘BBB’ by Standard & Poor’s (S&P) is deemed by S&P to exhibit adequate protection parameters. In the opinion of S&P, however, adverse economic conditions or changing circumstances are more likely to lead to a weakened capacity of the obligor to meet its financial commitment on the obligation. An obligation rated ‘AA’ by S&P is deemed by S&P to differ from the highest-rated obligations only to a small degree. In the opinion of S&P, the obligor's capacity to meet its financial commitment on the obligation is very strong. When applied to Fund holdings, ratings are based solely on the creditworthiness of the bonds in the portfolio and are not meant to represent the security or safety of the Fund. |
The opinions expressed are those of the portfolio managers as of the date of this report and are subject to change. There is no guarantee that any forecasts will come to pass. This material does not constitute investment advice and is not intended as an endorsement of any specific investment.
Not all MainStay VP Portfolios and/or share classes are available under all policies.
| 8 | MainStay VP Indexed Bond Portfolio |
Portfolio of Investments June 30, 2021† (Unaudited)
| | Principal
Amount | Value |
| Long-Term Bonds 98.2% |
| Asset-Backed Securities 0.1% |
| Automobile Asset-Backed Securities 0.1% |
| Ally Auto Receivables Trust | |
| Series 2018-3, Class A3 | | |
| 3.00%, due 1/17/23 | $ 11,733 | $ 11,773 |
| GM Financial Consumer Automobile Receivables Trust | |
| Series 2018-3, Class A3 | | |
| 3.02%, due 5/16/23 | 197,283 | 198,887 |
| Honda Auto Receivables Owner Trust | |
| Series 2018-3, Class A3 | | |
| 2.95%, due 8/22/22 | 132,828 | 133,517 |
Total Asset-Backed Securities
(Cost $341,820) | | 344,177 |
| Corporate Bonds 29.2% |
| Aerospace & Defense 0.7% |
| Boeing Co. (The) | | |
| 3.25%, due 3/1/28 | 560,000 | 587,569 |
| 5.15%, due 5/1/30 | 650,000 | 769,701 |
| Lockheed Martin Corp. | | |
| 4.07%, due 12/15/42 | 305,000 | 370,318 |
| Northrop Grumman Systems Corp. | | |
| 7.75%, due 2/15/31 | 260,000 | 377,622 |
| Raytheon Technologies Corp. | | |
| 3.125%, due 7/1/50 | 450,000 | 462,006 |
| 3.15%, due 12/15/24 | 305,000 | 327,308 |
| 3.50%, due 3/15/27 | 260,000 | 286,780 |
| 3.65%, due 8/16/23 | 2,000 | 2,122 |
| | | 3,183,426 |
| Apparel 0.0% ‡ |
| NIKE, Inc. | | |
| 3.625%, due 5/1/43 | 90,000 | 104,168 |
| Auto Manufacturers 0.4% |
| General Motors Financial Co., Inc. | | |
| 4.35%, due 1/17/27 | 1,425,000 | 1,602,115 |
| Toyota Motor Credit Corp. | | |
| 2.25%, due 10/18/23 | 340,000 | 354,161 |
| | | 1,956,276 |
| Banks 5.6% |
| Bank of America Corp. | | |
| 0.523%, due 6/14/24 (a) | 900,000 | 899,811 |
| 2.831%, due 10/24/51 (a) | 695,000 | 677,740 |
| 3.248%, due 10/21/27 | 480,000 | 520,675 |
| 3.419%, due 12/20/28 (a) | 1,685,000 | 1,835,149 |
| | Principal
Amount | Value |
| |
| Banks (continued) |
| Bank of New York Mellon Corp. (The) | | |
| Series G | | |
| 3.00%, due 2/24/25 | $ 485,000 | $ 521,724 |
| Barclays plc | | |
| 5.25%, due 8/17/45 | 270,000 | 359,171 |
| BNP Paribas SA | | |
| 3.25%, due 3/3/23 | 495,000 | 518,637 |
| Citigroup, Inc. | | |
| 0.981%, due 5/1/25 (a) | 1,750,000 | 1,754,165 |
| 2.561%, due 5/1/32 (a) | 250,000 | 254,488 |
| 4.45%, due 9/29/27 | 1,435,000 | 1,639,482 |
| 4.65%, due 7/30/45 | 170,000 | 218,863 |
| Cooperatieve Rabobank UA | | |
| 5.25%, due 5/24/41 | 480,000 | 661,850 |
| Credit Suisse Group AG | | |
| 3.80%, due 6/9/23 | 335,000 | 355,025 |
| Goldman Sachs Group, Inc. (The) | | |
| 1.542%, due 9/10/27 (a) | 2,350,000 | 2,343,385 |
| 4.80%, due 7/8/44 | 400,000 | 522,303 |
| HSBC Holdings plc | | |
| 3.90%, due 5/25/26 | 1,375,000 | 1,529,178 |
| JPMorgan Chase & Co. | | |
| 4.25%, due 10/1/27 | 2,340,000 | 2,666,354 |
| 4.26%, due 2/22/48 (a) | 575,000 | 697,897 |
| Lloyds Banking Group plc | | |
| 3.75%, due 1/11/27 | 1,265,000 | 1,397,172 |
| Mitsubishi UFJ Financial Group, Inc. | | |
| 3.455%, due 3/2/23 | 560,000 | 588,177 |
| Morgan Stanley | | |
| 0.79%, due 5/30/25 (a) | 630,000 | 627,777 |
| 1.928%, due 4/28/32 (a) | 650,000 | 631,818 |
| 3.625%, due 1/20/27 | 1,700,000 | 1,884,994 |
| Natwest Group plc | | |
| 3.875%, due 9/12/23 | 270,000 | 288,426 |
| Wells Fargo & Co. | | |
| 3.00%, due 4/22/26 | 2,425,000 | 2,607,499 |
| 3.50%, due 3/8/22 | 97,000 | 99,156 |
| 4.75%, due 12/7/46 | 575,000 | 727,630 |
| | | 26,828,546 |
| Beverages 0.9% |
| Anheuser-Busch InBev Worldwide, Inc. | | |
| 4.60%, due 4/15/48 | 1,465,000 | 1,788,536 |
| Coca-Cola Co. (The) | | |
| 2.60%, due 6/1/50 | 450,000 | 433,576 |
| Constellation Brands, Inc. | | |
| 3.60%, due 2/15/28 | 125,000 | 138,480 |
The notes to the financial statements are an integral part of, and should be read in conjunction with, the financial statements.
9
Portfolio of Investments June 30, 2021† (Unaudited) (continued)
| | Principal
Amount | Value |
| Corporate Bonds (continued) |
| Beverages (continued) |
| Diageo Capital plc | | |
| 5.875%, due 9/30/36 | $ 268,000 | $ 382,625 |
| Keurig Dr Pepper, Inc. | | |
| 4.985%, due 5/25/38 | 90,000 | 114,713 |
| Molson Coors Beverage Co. | | |
| 4.20%, due 7/15/46 | 90,000 | 100,264 |
| PepsiCo, Inc. | | |
| 2.75%, due 3/1/23 | 380,000 | 395,371 |
| 2.85%, due 2/24/26 | 260,000 | 280,693 |
| 4.45%, due 4/14/46 | 550,000 | 708,242 |
| | | 4,342,500 |
| Biotechnology 0.3% |
| Amgen, Inc. | | |
| 3.125%, due 5/1/25 | 305,000 | 328,446 |
| 3.375%, due 2/21/50 | 405,000 | 427,596 |
| Baxalta, Inc. | | |
| 3.60%, due 6/23/22 | 39,000 | 40,020 |
| Gilead Sciences, Inc. | | |
| 3.65%, due 3/1/26 | 490,000 | 540,190 |
| 4.60%, due 9/1/35 | 205,000 | 250,831 |
| | | 1,587,083 |
| Building Materials 0.0% ‡ |
| Johnson Controls International plc | | |
| 6.00%, due 1/15/36 | 75,000 | 104,999 |
| Chemicals 0.4% |
| DuPont de Nemours, Inc. | | |
| 4.493%, due 11/15/25 | 450,000 | 511,720 |
| Ecolab, Inc. | | |
| 2.70%, due 11/1/26 | 260,000 | 278,533 |
| Mosaic Co. (The) | | |
| 4.05%, due 11/15/27 | 480,000 | 538,162 |
| Nutrien Ltd. | | |
| 5.875%, due 12/1/36 | 260,000 | 353,484 |
| Sherwin-Williams Co. (The) | | |
| 3.95%, due 1/15/26 | 305,000 | 340,318 |
| | | 2,022,217 |
| Computers 1.0% |
| Apple, Inc. | | |
| 2.90%, due 9/12/27 | 300,000 | 326,760 |
| 3.35%, due 2/9/27 | 16,000 | 17,767 |
| 4.25%, due 2/9/47 | 205,000 | 258,393 |
| 4.50%, due 2/23/36 | 845,000 | 1,065,506 |
| | Principal
Amount | Value |
| |
| Computers (continued) |
| Dell International LLC | | |
| 5.45%, due 6/15/23 | $ 545,000 | $ 591,251 |
| 6.02%, due 6/15/26 | 375,000 | 450,197 |
| Hewlett Packard Enterprise Co. | | |
| 4.40%, due 10/15/22 (b) | 205,000 | 213,912 |
| International Business Machines Corp. | | |
| 1.875%, due 8/1/22 | 300,000 | 305,088 |
| 3.45%, due 2/19/26 | 275,000 | 303,826 |
| 3.50%, due 5/15/29 | 1,215,000 | 1,359,705 |
| | | 4,892,405 |
| Cosmetics & Personal Care 0.1% |
| Procter & Gamble Co. (The) | | |
| 2.70%, due 2/2/26 | 260,000 | 280,587 |
| Unilever Capital Corp. | | |
| 3.10%, due 7/30/25 | 100,000 | 108,777 |
| | | 389,364 |
| Diversified Financial Services 0.8% |
| American Express Co. | | |
| 2.50%, due 7/30/24 | 765,000 | 806,037 |
| GE Capital Funding LLC | | |
| 4.05%, due 5/15/27 | 1,625,000 | 1,839,153 |
| Mastercard, Inc. | | |
| 3.85%, due 3/26/50 | 450,000 | 543,437 |
| Visa, Inc. | | |
| 2.80%, due 12/14/22 | 480,000 | 495,943 |
| 4.30%, due 12/14/45 | 200,000 | 256,679 |
| | | 3,941,249 |
| Electric 1.9% |
| CenterPoint Energy Houston Electric LLC | | |
| Series AC | | |
| 4.25%, due 2/1/49 | 300,000 | 375,003 |
| Commonwealth Edison Co. | | |
| 3.65%, due 6/15/46 | 465,000 | 528,734 |
| Consolidated Edison Co. of New York, Inc. | | |
| Series 06-A | | |
| 5.85%, due 3/15/36 | 640,000 | 855,729 |
| DTE Electric Co. | | |
| 3.375%, due 3/1/25 | 205,000 | 221,237 |
| Duke Energy Carolinas LLC | | |
| 3.875%, due 3/15/46 | 790,000 | 911,171 |
| 4.00%, due 9/30/42 | 260,000 | 306,326 |
| Edison International | | |
| 2.95%, due 3/15/23 | 205,000 | 211,622 |
The notes to the financial statements are an integral part of, and should be read in conjunction with, the financial statements.
| 10 | MainStay VP Indexed Bond Portfolio |
| | Principal
Amount | Value |
| Corporate Bonds (continued) |
| Electric (continued) |
| Entergy Louisiana LLC | | |
| 4.20%, due 4/1/50 | $ 350,000 | $ 428,232 |
| Florida Power & Light Co. | | |
| 2.75%, due 6/1/23 | 120,000 | 124,193 |
| 3.80%, due 12/15/42 | 575,000 | 678,122 |
| MidAmerican Energy Co. | | |
| 3.95%, due 8/1/47 | 380,000 | 449,671 |
| National Rural Utilities Cooperative Finance Corp. | | |
| 2.70%, due 2/15/23 | 115,000 | 118,814 |
| Ohio Power Co. | | |
| Series G | | |
| 6.60%, due 2/15/33 | 190,000 | 260,840 |
| PPL Electric Utilities Corp. | | |
| 3.95%, due 6/1/47 | 125,000 | 147,740 |
| Public Service Electric and Gas Co. | | |
| 2.70%, due 5/1/50 | 450,000 | 445,286 |
| San Diego Gas & Electric Co. | | |
| 4.15%, due 5/15/48 | 260,000 | 315,053 |
| Sempra Energy | | |
| 3.80%, due 2/1/38 | 260,000 | 288,660 |
| Southern California Edison Co. | | |
| Series C | | |
| 4.125%, due 3/1/48 | 260,000 | 277,078 |
| Southern Co. (The) | | |
| 2.95%, due 7/1/23 | 205,000 | 213,873 |
| 4.40%, due 7/1/46 | 525,000 | 616,544 |
| Virginia Electric and Power Co. | | |
| 4.00%, due 1/15/43 | 390,000 | 457,823 |
| Xcel Energy, Inc. | | |
| 3.30%, due 6/1/25 | 830,000 | 894,604 |
| | | 9,126,355 |
| Environmental Control 0.1% |
| Republic Services, Inc. | | |
| 3.20%, due 3/15/25 | 305,000 | 327,479 |
| Waste Management, Inc. | | |
| 3.15%, due 11/15/27 | 305,000 | 333,585 |
| | | 661,064 |
| Food 0.3% |
| General Mills, Inc. | | |
| 3.15%, due 12/15/21 | 5,000 | 5,030 |
| 4.20%, due 4/17/28 | 90,000 | 103,751 |
| Kroger Co. (The) | | |
| 2.20%, due 5/1/30 | 650,000 | 653,720 |
| | Principal
Amount | Value |
| |
| Food (continued) |
| Sysco Corp. | | |
| 3.25%, due 7/15/27 | $ 305,000 | $ 330,216 |
| Tyson Foods, Inc. | | |
| 5.10%, due 9/28/48 | 300,000 | 394,863 |
| | | 1,487,580 |
| Forest Products & Paper 0.2% |
| Fibria Overseas Finance Ltd. | | |
| 5.50%, due 1/17/27 | 480,000 | 556,805 |
| International Paper Co. | | |
| 3.80%, due 1/15/26 | 235,000 | 260,939 |
| | | 817,744 |
| Gas 0.1% |
| NiSource, Inc. | | |
| 3.49%, due 5/15/27 | 260,000 | 285,974 |
| Healthcare-Products 0.5% |
| Abbott Laboratories | | |
| 3.75%, due 11/30/26 | 175,000 | 197,632 |
| 4.90%, due 11/30/46 | 275,000 | 376,356 |
| Boston Scientific Corp. | | |
| 4.70%, due 3/1/49 | 225,000 | 287,753 |
| Medtronic, Inc. | | |
| 4.625%, due 3/15/45 | 449,000 | 589,001 |
| Stryker Corp. | | |
| 3.65%, due 3/7/28 | 260,000 | 292,468 |
| Thermo Fisher Scientific, Inc. | | |
| 2.95%, due 9/19/26 | 340,000 | 366,642 |
| | | 2,109,852 |
| Healthcare-Services 0.8% |
| Aetna, Inc. | | |
| 6.625%, due 6/15/36 | 260,000 | 378,808 |
| Anthem, Inc. | | |
| 4.375%, due 12/1/47 | 305,000 | 371,995 |
| Laboratory Corp. of America Holdings | | |
| 3.60%, due 2/1/25 | 305,000 | 329,926 |
| UnitedHealth Group, Inc. | | |
| 3.10%, due 3/15/26 | 575,000 | 627,118 |
| 3.75%, due 7/15/25 | 1,700,000 | 1,886,284 |
| 4.25%, due 4/15/47 | 300,000 | 368,603 |
| | | 3,962,734 |
| Household Products & Wares 0.1% |
| Clorox Co. (The) | | |
| 3.90%, due 5/15/28 | 260,000 | 295,847 |
The notes to the financial statements are an integral part of, and should be read in conjunction with, the financial statements.
11
Portfolio of Investments June 30, 2021† (Unaudited) (continued)
| | Principal
Amount | Value |
| Corporate Bonds (continued) |
| Household Products & Wares (continued) |
| Kimberly-Clark Corp. | | |
| 2.75%, due 2/15/26 | $ 260,000 | $ 282,192 |
| | | 578,039 |
| Housewares 0.0% ‡ |
| Newell Brands, Inc. | | |
| 4.35%, due 4/1/23 (b) | 175,000 | 183,312 |
| Insurance 0.7% |
| Allstate Corp. (The) | | |
| 5.35%, due 6/1/33 | 260,000 | 338,268 |
| American International Group, Inc. | | |
| 6.25%, due 5/1/36 | 350,000 | 485,244 |
| Berkshire Hathaway Finance Corp. | | |
| 4.30%, due 5/15/43 | 405,000 | 504,663 |
| Chubb INA Holdings, Inc. | | |
| 3.35%, due 5/3/26 | 205,000 | 225,072 |
| MetLife, Inc. | | |
| 3.60%, due 11/13/25 | 1,590,000 | 1,757,294 |
| Prudential Financial, Inc. | | |
| 3.935%, due 12/7/49 | 150,000 | 175,290 |
| | | 3,485,831 |
| Internet 0.3% |
| Alphabet, Inc. | | |
| 3.375%, due 2/25/24 | 350,000 | 376,257 |
| Amazon.com, Inc. | | |
| 3.875%, due 8/22/37 | 935,000 | 1,114,941 |
| | | 1,491,198 |
| Machinery—Construction & Mining 0.1% |
| Caterpillar, Inc. | | |
| 5.30%, due 9/15/35 | 310,000 | 413,590 |
| Machinery-Diversified 0.1% |
| Deere & Co. | | |
| 3.90%, due 6/9/42 | 170,000 | 208,787 |
| Media 1.7% |
| Charter Communications Operating LLC | | |
| 4.908%, due 7/23/25 | 850,000 | 962,974 |
| 5.75%, due 4/1/48 | 800,000 | 1,018,193 |
| Comcast Corp. | | |
| 3.30%, due 4/1/27 | 725,000 | 799,037 |
| 3.40%, due 7/15/46 | 1,415,000 | 1,509,430 |
| | Principal
Amount | Value |
| |
| Media (continued) |
| Discovery Communications LLC | | |
| 3.95%, due 3/20/28 | $ 400,000 | $ 444,885 |
| TWDC Enterprises 18 Corp. | | |
| 2.35%, due 12/1/22 | 560,000 | 575,583 |
| ViacomCBS, Inc. | | |
| 4.95%, due 1/15/31 | 650,000 | 783,457 |
| Walt Disney Co. (The) | | |
| 3.00%, due 9/15/22 | 715,000 | 738,093 |
| 3.80%, due 3/22/30 | 650,000 | 742,276 |
| 6.40%, due 12/15/35 | 485,000 | 709,906 |
| | | 8,283,834 |
| Mining 0.3% |
| Barrick North America Finance LLC | | |
| 5.70%, due 5/30/41 | 125,000 | 171,649 |
| BHP Billiton Finance USA Ltd. | | |
| 3.85%, due 9/30/23 | 480,000 | 515,483 |
| Rio Tinto Finance USA Ltd. | | |
| 3.75%, due 6/15/25 | 480,000 | 532,255 |
| | | 1,219,387 |
| Miscellaneous—Manufacturing 0.3% |
| 3M Co. | | |
| 4.00%, due 9/14/48 | 300,000 | 365,488 |
| Eaton Corp. | | |
| 4.00%, due 11/2/32 | 260,000 | 302,807 |
| General Electric Co. | | |
| 4.125%, due 10/9/42 | 94,000 | 108,278 |
| Parker-Hannifin Corp. | | |
| 3.50%, due 9/15/22 | 290,000 | 300,783 |
| 4.20%, due 11/21/34 | 90,000 | 105,811 |
| | | 1,183,167 |
| Multi-National 0.2% |
| International Bank for Reconstruction & Development | | |
| 3.00%, due 9/27/23 | 900,000 | 952,457 |
| Oil & Gas 1.2% |
| BP Capital Markets America, Inc. | | |
| 1.749%, due 8/10/30 | 875,000 | 853,763 |
| 3.588%, due 4/14/27 | 300,000 | 332,147 |
| Canadian Natural Resources Ltd. | | |
| 6.25%, due 3/15/38 | 125,000 | 167,095 |
| Chevron Corp. | | |
| 3.191%, due 6/24/23 | 485,000 | 509,209 |
| ConocoPhillips Co. | | |
| 5.95%, due 3/15/46 | 340,000 | 503,864 |
The notes to the financial statements are an integral part of, and should be read in conjunction with, the financial statements.
| 12 | MainStay VP Indexed Bond Portfolio |
| | Principal
Amount | Value |
| Corporate Bonds (continued) |
| Oil & Gas (continued) |
| Devon Energy Corp. | | |
| 4.75%, due 5/15/42 | $ 260,000 | $ 293,373 |
| EOG Resources, Inc. | | |
| 3.90%, due 4/1/35 | 205,000 | 236,668 |
| Exxon Mobil Corp. | | |
| 4.114%, due 3/1/46 | 465,000 | 548,542 |
| Hess Corp. | | |
| 7.125%, due 3/15/33 | 125,000 | 169,446 |
| Shell International Finance BV | | |
| 2.375%, due 8/21/22 | 340,000 | 348,096 |
| 3.75%, due 9/12/46 | 560,000 | 632,989 |
| TotalEnergies Capital International SA | | |
| 2.829%, due 1/10/30 | 875,000 | 939,769 |
| | | 5,534,961 |
| Oil & Gas Services 0.0% ‡ |
| Halliburton Co. | | |
| 3.80%, due 11/15/25 | 28,000 | 30,948 |
| Pharmaceuticals 2.5% |
| AbbVie, Inc. | | |
| 3.20%, due 11/6/22 | 490,000 | 506,184 |
| 3.75%, due 11/14/23 | 95,000 | 101,900 |
| 3.80%, due 3/15/25 | 175,000 | 191,423 |
| 4.70%, due 5/14/45 | 1,055,000 | 1,313,734 |
| 4.75%, due 3/15/45 | 100,000 | 125,375 |
| Allergan Funding SCS | | |
| 3.80%, due 3/15/25 | 50,000 | 53,671 |
| 4.75%, due 3/15/45 | 25,000 | 25,614 |
| AstraZeneca plc | | |
| 6.45%, due 9/15/37 | 490,000 | 732,478 |
| Bristol-Myers Squibb Co. | | |
| 2.75%, due 2/15/23 | 25,000 | 25,933 |
| 3.40%, due 7/26/29 | 1,480,000 | 1,658,619 |
| 3.55%, due 8/15/22 | 180,000 | 186,435 |
| 3.625%, due 5/15/24 | 560,000 | 604,306 |
| Cigna Corp. | | |
| 4.90%, due 12/15/48 | 175,000 | 225,372 |
| CVS Health Corp. | | |
| 1.875%, due 2/28/31 | 1,160,000 | 1,125,151 |
| 2.75%, due 12/1/22 | 380,000 | 390,473 |
| 4.25%, due 4/1/50 | 325,000 | 385,243 |
| Eli Lilly and Co. | | |
| 3.95%, due 3/15/49 | 300,000 | 363,640 |
| GlaxoSmithKline Capital, Inc. | | |
| 3.875%, due 5/15/28 | 305,000 | 349,766 |
| | Principal
Amount | Value |
| |
| Pharmaceuticals (continued) |
| Johnson & Johnson | | |
| 3.55%, due 3/1/36 | $ 350,000 | $ 407,355 |
| 4.95%, due 5/15/33 | 300,000 | 394,835 |
| Merck & Co., Inc. | | |
| 3.70%, due 2/10/45 | 260,000 | 299,433 |
| Mylan, Inc. | | |
| 4.20%, due 11/29/23 | 75,000 | 80,439 |
| 5.20%, due 4/15/48 | 90,000 | 110,750 |
| Novartis Capital Corp. | | |
| 4.00%, due 11/20/45 | 310,000 | 378,331 |
| Pfizer, Inc. | | |
| 3.00%, due 6/15/23 | 180,000 | 189,163 |
| 3.20%, due 9/15/23 | 25,000 | 26,420 |
| 4.00%, due 12/15/36 | 1,165,000 | 1,409,117 |
| 4.10%, due 9/15/38 | 95,000 | 115,731 |
| | | 11,776,891 |
| Pipelines 1.8% |
| Enbridge, Inc. | | |
| 4.50%, due 6/10/44 | 260,000 | 306,765 |
| Energy Transfer Operating LP | | |
| 4.05%, due 3/15/25 | 2,655,000 | 2,878,755 |
| Enterprise Products Operating LLC | | |
| 3.70%, due 2/15/26 | 475,000 | 525,457 |
| 4.80%, due 2/1/49 | 400,000 | 492,278 |
| Kinder Morgan Energy Partners LP | | |
| 5.80%, due 3/15/35 | 305,000 | 391,776 |
| Kinder Morgan, Inc. | | |
| 4.30%, due 6/1/25 | 565,000 | 629,069 |
| MPLX LP | | |
| 4.125%, due 3/1/27 | 855,000 | 955,374 |
| ONEOK, Inc. | | |
| 3.10%, due 3/15/30 | 650,000 | 679,577 |
| Phillips 66 Partners LP | | |
| 4.68%, due 2/15/45 | 487,000 | 556,424 |
| TransCanada PipeLines Ltd. | | |
| 4.875%, due 1/15/26 | 310,000 | 356,012 |
| 4.875%, due 5/15/48 | 575,000 | 726,735 |
| | | 8,498,222 |
| Real Estate Investment Trusts 0.3% |
| American Tower Corp. | | |
| 5.00%, due 2/15/24 | 170,000 | 188,538 |
| AvalonBay Communities, Inc. | | |
| 2.90%, due 10/15/26 | 205,000 | 219,887 |
| Crown Castle International Corp. | | |
| 1.05%, due 7/15/26 | 150,000 | 146,497 |
| ERP Operating LP | | |
| 3.25%, due 8/1/27 | 260,000 | 282,363 |
The notes to the financial statements are an integral part of, and should be read in conjunction with, the financial statements.
13
Portfolio of Investments June 30, 2021† (Unaudited) (continued)
| | Principal
Amount | Value |
| Corporate Bonds (continued) |
| Real Estate Investment Trusts (continued) |
| Realty Income Corp. | | |
| 4.65%, due 3/15/47 | $ 150,000 | $ 193,140 |
| Simon Property Group LP | | |
| 4.25%, due 11/30/46 | 443,000 | 510,388 |
| | | 1,540,813 |
| Retail 1.1% |
| Home Depot, Inc. (The) | | |
| 2.375%, due 3/15/51 | 850,000 | 786,179 |
| Lowe's Cos., Inc. | | |
| 4.05%, due 5/3/47 | 385,000 | 443,301 |
| McDonald's Corp. | | |
| 3.375%, due 5/26/25 | 1,485,000 | 1,612,709 |
| Starbucks Corp. | | |
| 2.55%, due 11/15/30 | 875,000 | 906,632 |
| Target Corp. | | |
| 2.35%, due 2/15/30 | 175,000 | 182,785 |
| 3.50%, due 7/1/24 | 300,000 | 325,397 |
| Walmart, Inc. | | |
| 2.85%, due 7/8/24 | 250,000 | 266,798 |
| 3.30%, due 4/22/24 | 90,000 | 96,522 |
| 4.30%, due 4/22/44 | 625,000 | 794,859 |
| | | 5,415,182 |
| Semiconductors 0.7% |
| Applied Materials, Inc. | | |
| 5.10%, due 10/1/35 | 260,000 | 342,259 |
| Broadcom, Inc. | | |
| 4.15%, due 11/15/30 | 650,000 | 728,920 |
| Intel Corp. | | |
| 3.70%, due 7/29/25 | 1,460,000 | 1,613,890 |
| QUALCOMM, Inc. | | |
| 4.65%, due 5/20/35 | 260,000 | 330,588 |
| Texas Instruments, Inc. | | |
| 2.625%, due 5/15/24 | 350,000 | 368,996 |
| | | 3,384,653 |
| Software 0.9% |
| Fiserv, Inc. | | |
| 4.20%, due 10/1/28 | 625,000 | 718,460 |
| Microsoft Corp. | | |
| 2.40%, due 2/6/22 | 10,000 | 10,118 |
| 2.921%, due 3/17/52 | 455,000 | 482,913 |
| 3.30%, due 2/6/27 | 390,000 | 433,886 |
| Oracle Corp. | | |
| 2.95%, due 5/15/25 | 1,955,000 | 2,089,558 |
| | Principal
Amount | Value |
| |
| Software (continued) |
| Oracle Corp. (continued) | | |
| 4.00%, due 7/15/46 | $ 205,000 | $ 222,297 |
| 5.375%, due 7/15/40 | 350,000 | 453,781 |
| | | 4,411,013 |
| Telecommunications 1.8% |
| AT&T, Inc. | | |
| 2.55%, due 12/1/33 (c) | 1,551,000 | 1,536,485 |
| 3.55%, due 9/15/55 (c) | 1,131,000 | 1,134,792 |
| 3.60%, due 7/15/25 | 310,000 | 339,920 |
| Cisco Systems, Inc. | | |
| 2.95%, due 2/28/26 | 485,000 | 526,828 |
| Deutsche Telekom International Finance BV | | |
| 8.75%, due 6/15/30 (b) | 260,000 | 389,594 |
| Telefonica Emisiones SA | | |
| 7.045%, due 6/20/36 | 350,000 | 503,918 |
| T-Mobile US, Inc. | | |
| 3.875%, due 4/15/30 | 650,000 | 726,583 |
| Verizon Communications, Inc. | | |
| 4.016%, due 12/3/29 | 565,000 | 647,839 |
| 5.50%, due 3/16/47 | 975,000 | 1,363,961 |
| Vodafone Group plc | | |
| 4.375%, due 5/30/28 | 1,330,000 | 1,547,149 |
| | | 8,717,069 |
| Transportation 1.0% |
| Burlington Northern Santa Fe LLC | | |
| 3.25%, due 6/15/27 | 956,000 | 1,054,193 |
| Canadian National Railway Co. | | |
| 6.25%, due 8/1/34 | 260,000 | 367,093 |
| CSX Corp. | | |
| 3.35%, due 9/15/49 | 575,000 | 609,713 |
| Norfolk Southern Corp. | | |
| 3.942%, due 11/1/47 | 341,000 | 392,280 |
| Union Pacific Corp. | | |
| 2.75%, due 3/1/26 | 1,680,000 | 1,792,456 |
| United Parcel Service, Inc. | | |
| 3.40%, due 11/15/46 | 480,000 | 537,655 |
| | | 4,753,390 |
Total Corporate Bonds
(Cost $135,149,504) | | 139,866,280 |
| Foreign Government Bonds 2.9% |
| Canada 0.4% |
| Province of Ontario Canada | | |
| 2.50%, due 4/27/26 | 1,120,000 | 1,196,702 |
The notes to the financial statements are an integral part of, and should be read in conjunction with, the financial statements.
| 14 | MainStay VP Indexed Bond Portfolio |
| | Principal
Amount | Value |
| Foreign Government Bonds (continued) |
| Canada (continued) |
| Province of Quebec Canada | | |
| 2.50%, due 4/20/26 | $ 775,000 | $ 829,986 |
| | | 2,026,688 |
| Japan 0.1% |
| Japan Bank for International Cooperation | | |
| 2.875%, due 6/1/27 | 576,000 | 628,004 |
| Luxembourg 0.4% |
| European Investment Bank | | |
| 2.25%, due 8/15/22 | 1,375,000 | 1,407,010 |
| 2.375%, due 5/24/27 | 520,000 | 557,626 |
| | | 1,964,636 |
| Mexico 0.9% |
| Mexico Government Bond | | |
| 4.125%, due 1/21/26 | 3,830,000 | 4,321,695 |
| Norway 0.1% |
| Equinor ASA | | |
| 5.10%, due 8/17/40 | 385,000 | 512,294 |
| Panama 0.2% |
| Panama Government Bond | | |
| 3.75%, due 3/16/25 | 750,000 | 814,418 |
| Peru 0.3% |
| Peruvian Government Bond | | |
| 7.35%, due 7/21/25 | 1,045,000 | 1,281,755 |
| Philippines 0.4% |
| Asian Development Bank | | |
| 2.75%, due 3/17/23 | 900,000 | 938,307 |
| Philippine Government Bond | | |
| 5.00%, due 1/13/37 | 600,000 | 753,981 |
| | | 1,692,288 |
| Republic of Korea 0.1% |
| Korea Development Bank (The) | | |
| 3.25%, due 2/19/24 | 650,000 | 695,117 |
Total Foreign Government Bonds
(Cost $13,387,623) | | 13,936,895 |
| | Principal
Amount | Value |
| Mortgage-Backed Securities 12.3% |
| Agency (Collateralized Mortgage Obligations) 10.8% |
| Freddie Mac Multifamily Structured Pass Through Certificates | |
| REMIC, Series K094, Class A2 | | |
| 2.903%, due 6/25/29 | $ 4,000,000 | $ 4,412,045 |
| GNMA II, Single Family, 30 Year (d) | |
| 2.00%, due 7/15/51 TBA | 4,250,000 | 4,328,359 |
| 2.50%, due 7/15/51 TBA | 5,300,000 | 5,484,672 |
| UMBS, Single Family, 15 Year (d) | |
| 1.50%, due 7/25/36 TBA | 3,500,000 | 3,542,178 |
| 2.00%, due 7/25/36 TBA | 2,950,000 | 3,042,706 |
| UMBS, Single Family, 30 Year (d) | |
| 2.00%, due 7/25/51 TBA | 20,050,000 | 20,244,234 |
| 2.50%, due 7/25/51 TBA | 10,350,000 | 10,704,973 |
| | | 51,759,167 |
| Commercial Mortgage Loans (Collateralized Mortgage Obligations) 1.5% |
| BANK | |
| Series 2018-BN14, Class A3 | | |
| 3.966%, due 9/15/60 | 800,000 | 900,795 |
| Benchmark Mortgage Trust | |
| Series 2018-B1, Class A2 | | |
| 3.571%, due 1/15/51 | 100,000 | 103,228 |
| Series 2018-B1, Class A5 | | |
| 3.666%, due 1/15/51 (e) | 800,000 | 891,676 |
| Series 2018-B6, Class A3 | | |
| 3.995%, due 10/10/51 | 900,000 | 1,021,020 |
| CFCRE Commercial Mortgage Trust | |
| Series 2016-C6, Class A3 | | |
| 3.217%, due 11/10/49 (e) | 300,000 | 322,798 |
| Series 2017-C8, Class A3 | | |
| 3.305%, due 6/15/50 | 200,000 | 216,758 |
| Citigroup Commercial Mortgage Trust | |
| Series 2017-P8, Class A4 | | |
| 3.465%, due 9/15/50 | 300,000 | 331,338 |
| Series 2015-GC35, Class A4 | | |
| 3.818%, due 11/10/48 | 300,000 | 330,878 |
| CSAIL Commercial Mortgage Trust | |
| Series 2017-CX9, Class A5 | | |
| 3.446%, due 9/15/50 | 300,000 | 327,362 |
| GS Mortgage Securities Trust | |
| Series 2016-GS3, Class A4 | | |
| 2.85%, due 10/10/49 | 300,000 | 319,922 |
| Series 2014-GC22, Class A5 | | |
| 3.862%, due 6/10/47 | 300,000 | 323,395 |
| Series 2018-GS9, Class A4 | | |
| 3.992%, due 3/10/51 (e) | 800,000 | 911,028 |
The notes to the financial statements are an integral part of, and should be read in conjunction with, the financial statements.
15
Portfolio of Investments June 30, 2021† (Unaudited) (continued)
| | Principal
Amount | Value |
| Mortgage-Backed Securities (continued) |
| Commercial Mortgage Loans (Collateralized Mortgage Obligations) (continued) |
| Morgan Stanley Bank of America Merrill Lynch Trust | |
| Series 2013-C7, Class A4 | | |
| 2.918%, due 2/15/46 | $ 300,000 | $ 308,675 |
| Morgan Stanley Capital I Trust | |
| Series 2018-H3, Class A4 | | |
| 3.914%, due 7/15/51 | 500,000 | 559,992 |
| Wells Fargo Commercial Mortgage Trust | |
| Series 2015-SG1, Class A4 | | |
| 3.789%, due 9/15/48 | 298,975 | 323,141 |
| WFRBS Commercial Mortgage Trust | |
| Series 2012-C8, Class A3 | | |
| 3.001%, due 8/15/45 | 200,000 | 203,701 |
| | | 7,395,707 |
Total Mortgage-Backed Securities
(Cost $58,533,844) | | 59,154,874 |
| U.S. Government & Federal Agencies 53.7% |
| Federal Home Loan Mortgage Corporation (Mortgage Pass-Through Securities) 6.4% |
| FFCB | | |
| 0.68%, due 1/13/27 | 1,125,000 | 1,099,651 |
| 1.98%, due 6/2/31 | 825,000 | 823,428 |
| FHLB | | |
| 3.25%, due 11/16/28 | 2,200,000 | 2,498,672 |
| FHLMC | | |
| 0.375%, due 7/21/25 | 1,800,000 | 1,774,657 |
| 2.375%, due 1/13/22 | 500,000 | 506,120 |
| FHLMC Gold Pools, 15 Year | | |
| 2.50%, due 10/1/31 | 52,498 | 55,426 |
| 2.50%, due 2/1/32 | 227,283 | 238,088 |
| 2.50%, due 2/1/33 | 230,161 | 240,937 |
| 2.50%, due 4/1/33 | 301,277 | 314,772 |
| 2.50%, due 6/1/33 | 43,737 | 45,689 |
| 2.50%, due 7/1/33 | 103,410 | 108,196 |
| 3.00%, due 9/1/27 | 123,628 | 130,736 |
| 3.00%, due 4/1/32 | 142,756 | 150,944 |
| 3.00%, due 6/1/32 | 37,085 | 39,181 |
| 3.00%, due 9/1/32 | 18,283 | 19,331 |
| 3.00%, due 10/1/32 | 81,436 | 86,042 |
| 3.00%, due 5/1/33 | 108,053 | 113,929 |
| 3.00%, due 9/1/33 | 91,160 | 95,987 |
| 3.50%, due 12/1/25 | 25,774 | 27,546 |
| 3.50%, due 5/1/33 | 92,500 | 99,153 |
| 3.50%, due 9/1/33 | 26,874 | 28,765 |
| | Principal
Amount | Value |
| |
| Federal Home Loan Mortgage Corporation (Mortgage Pass-Through Securities) (continued) |
| FHLMC Gold Pools, 20 Year | | |
| 3.00%, due 9/1/36 | $ 110,850 | $ 118,172 |
| 3.00%, due 11/1/37 | 66,767 | 69,818 |
| 3.00%, due 12/1/37 | 114,641 | 119,538 |
| 3.50%, due 2/1/37 | 109,752 | 117,680 |
| 3.50%, due 1/1/38 | 115,780 | 122,443 |
| 4.50%, due 5/1/38 | 69,735 | 75,672 |
| 5.50%, due 1/1/29 | 36,797 | 40,951 |
| FHLMC Gold Pools, 30 Year | | |
| 3.00%, due 9/1/46 | 532,950 | 561,234 |
| 3.00%, due 12/1/46 | 37,457 | 39,366 |
| 3.00%, due 2/1/47 | 44,227 | 46,856 |
| 3.00%, due 3/1/47 | 194,908 | 204,884 |
| 3.00%, due 4/1/47 | 58,221 | 61,101 |
| 3.00%, due 1/1/48 | 382,408 | 399,522 |
| 3.00%, due 2/1/48 | 232,930 | 243,538 |
| 3.00%, due 3/1/48 | 207,974 | 217,147 |
| 3.00%, due 4/1/48 | 494,880 | 525,632 |
| 3.00%, due 6/1/48 | 350,341 | 366,036 |
| 3.50%, due 6/1/43 | 146,816 | 159,176 |
| 3.50%, due 9/1/44 | 122,027 | 132,302 |
| 3.50%, due 8/1/45 | 202,663 | 216,839 |
| 3.50%, due 8/1/46 | 287,264 | 307,905 |
| 3.50%, due 8/1/47 | 27,326 | 28,920 |
| 3.50%, due 9/1/47 | 65,839 | 69,458 |
| 3.50%, due 11/1/47 | 141,042 | 149,345 |
| 3.50%, due 12/1/47 | 301,260 | 318,627 |
| 3.50%, due 1/1/48 | 30,175 | 31,917 |
| 3.50%, due 3/1/48 | 397,301 | 420,481 |
| 3.50%, due 5/1/48 | 131,974 | 139,533 |
| 3.50%, due 6/1/48 | 205,104 | 216,363 |
| 3.50%, due 8/1/48 | 226,369 | 238,412 |
| 3.50%, due 9/1/48 | 183,639 | 193,760 |
| 3.50%, due 11/1/48 | 64,359 | 67,789 |
| 3.50%, due 12/1/48 | 171,945 | 181,499 |
| 4.00%, due 4/1/46 | 249,070 | 269,629 |
| 4.00%, due 5/1/46 | 80,008 | 86,437 |
| 4.00%, due 4/1/47 | 59,798 | 64,255 |
| 4.00%, due 6/1/47 | 151,258 | 162,369 |
| 4.00%, due 8/1/47 | 310,148 | 333,242 |
| 4.00%, due 10/1/47 | 71,404 | 76,560 |
| 4.00%, due 12/1/47 | 191,171 | 204,687 |
| 4.00%, due 1/1/48 | 61,302 | 65,764 |
| 4.00%, due 5/1/48 | 85,733 | 91,754 |
| 4.00%, due 9/1/48 | 323,349 | 344,166 |
| 4.00%, due 12/1/48 | 178,178 | 189,734 |
| 4.50%, due 9/1/46 | 16,221 | 17,678 |
The notes to the financial statements are an integral part of, and should be read in conjunction with, the financial statements.
| 16 | MainStay VP Indexed Bond Portfolio |
| | Principal
Amount | Value |
| U.S. Government & Federal Agencies (continued) |
| Federal Home Loan Mortgage Corporation (Mortgage Pass-Through Securities) (continued) |
| FHLMC Gold Pools, 30 Year (continued) | | |
| 4.50%, due 9/1/46 | $ 40,992 | $ 44,933 |
| 4.50%, due 10/1/46 | 127,430 | 138,921 |
| 4.50%, due 2/1/47 | 27,935 | 30,431 |
| 4.50%, due 11/1/47 | 33,891 | 36,763 |
| 4.50%, due 2/1/48 | 64,375 | 69,702 |
| 4.50%, due 4/1/48 | 80,469 | 86,990 |
| 4.50%, due 6/1/48 | 47,167 | 50,921 |
| 4.50%, due 7/1/48 | 174,411 | 188,004 |
| 4.50%, due 8/1/48 | 172,749 | 186,125 |
| 5.00%, due 9/1/38 | 48,960 | 56,059 |
| 5.00%, due 11/1/41 | 77,456 | 88,260 |
| 5.00%, due 3/1/47 | 136,506 | 151,553 |
| 5.00%, due 9/1/48 | 285,033 | 314,328 |
| 5.00%, due 1/1/49 | 96,092 | 105,635 |
| 5.50%, due 7/1/38 | 76,370 | 88,842 |
| FNMA | | |
| 0.65%, due 12/10/25 | 2,000,000 | 1,982,624 |
| 1.375%, due 9/6/22 | 725,000 | 735,680 |
| 1.875%, due 4/5/22 | 300,000 | 304,100 |
| 1.875%, due 9/24/26 | 1,650,000 | 1,729,883 |
| UMBS, 15 Year | | |
| 2.50%, due 9/1/34 | 583,120 | 609,026 |
| 2.50%, due 10/1/34 | 590,252 | 616,522 |
| 2.50%, due 3/1/35 | 1,173,939 | 1,226,264 |
| UMBS, 30 Year | | |
| 2.50%, due 5/1/50 | 2,663,771 | 2,774,544 |
| 3.50%, due 12/1/47 | 2,344,176 | 2,478,622 |
| 4.50%, due 1/1/49 | 231,168 | 248,375 |
| | | 30,948,548 |
| Federal National Mortgage Association (Mortgage Pass-Through Securities) 7.6% |
| UMBS, 10 Year | | |
| 3.00%, due 4/1/25 | 35,891 | 37,685 |
| 3.50%, due 7/1/21 | 48 | 48 |
| 3.50%, due 3/1/22 | 7,574 | 8,080 |
| UMBS, 15 Year | | |
| 2.50%, due 10/1/27 | 137,576 | 144,080 |
| 2.50%, due 4/1/30 | 118,810 | 124,362 |
| 2.50%, due 10/1/31 | 190,637 | 199,546 |
| 2.50%, due 2/1/32 | 181,396 | 190,066 |
| 2.50%, due 2/1/32 | 190,280 | 199,360 |
| 2.50%, due 8/1/32 | 407,216 | 429,727 |
| 2.50%, due 3/1/33 | 234,952 | 248,500 |
| 2.50%, due 6/1/33 | 175,020 | 183,123 |
| | Principal
Amount | Value |
| |
| Federal National Mortgage Association (Mortgage Pass-Through Securities) (continued) |
| UMBS, 15 Year (continued) | | |
| 3.00%, due 11/1/31 | $ 130,868 | $ 138,355 |
| 3.00%, due 1/1/32 | 148,849 | 157,211 |
| 3.00%, due 6/1/32 | 101,657 | 107,427 |
| 3.00%, due 1/1/33 | 144,438 | 152,420 |
| 3.00%, due 2/1/33 | 185,059 | 197,401 |
| 3.00%, due 4/1/33 | 199,013 | 209,886 |
| 3.00%, due 5/1/33 | 257,936 | 272,631 |
| 3.00%, due 9/1/33 | 30,536 | 32,142 |
| 3.00%, due 9/1/34 | 854,430 | 899,939 |
| 3.50%, due 5/1/26 | 28,806 | 30,776 |
| 3.50%, due 11/1/31 | 35,275 | 37,688 |
| 3.50%, due 5/1/33 | 84,268 | 90,273 |
| 3.50%, due 6/1/33 | 113,672 | 121,759 |
| 3.50%, due 7/1/33 | 54,786 | 58,672 |
| 3.50%, due 9/1/33 | 55,608 | 59,470 |
| 4.00%, due 5/1/24 | 41,740 | 44,326 |
| 4.00%, due 11/1/29 | 111,879 | 118,908 |
| UMBS, 20 Year | | |
| 3.00%, due 2/1/37 | 159,721 | 169,915 |
| 3.00%, due 1/1/38 | 345,591 | 361,358 |
| 4.00%, due 2/1/37 | 32,553 | 35,416 |
| 4.00%, due 8/1/38 | 218,578 | 233,901 |
| 5.00%, due 8/1/31 | 99,606 | 109,435 |
| 5.50%, due 8/1/27 | 48,009 | 53,537 |
| UMBS, 30 Year | | |
| 2.00%, due 8/1/50 | 1,998,403 | 2,019,071 |
| 2.00%, due 9/1/50 | 2,682,300 | 2,710,063 |
| 2.50%, due 4/1/46 | 36,149 | 37,524 |
| 2.50%, due 10/1/46 | 139,565 | 145,012 |
| 3.00%, due 9/1/42 | 696,681 | 737,407 |
| 3.00%, due 3/1/43 | 1,960,667 | 2,076,512 |
| 3.00%, due 12/1/43 | 723,606 | 768,345 |
| 3.00%, due 10/1/44 | 506,356 | 538,073 |
| 3.00%, due 10/1/46 | 97,157 | 102,220 |
| 3.00%, due 12/1/46 | 875,954 | 925,290 |
| 3.00%, due 2/1/47 | 139,554 | 146,808 |
| 3.00%, due 8/1/47 | 681,451 | 724,908 |
| 3.00%, due 10/1/47 | 580,496 | 618,129 |
| 3.00%, due 11/1/47 | 95,538 | 100,055 |
| 3.00%, due 6/1/48 | 81,763 | 85,501 |
| 3.00%, due 9/1/49 | 979,551 | 1,021,139 |
| 3.00%, due 10/1/50 | 3,339,405 | 3,540,271 |
| 3.50%, due 5/1/45 | 596,811 | 650,578 |
| 3.50%, due 9/1/45 | 54,657 | 58,290 |
| 3.50%, due 12/1/45 | 139,781 | 149,056 |
| 3.50%, due 12/1/45 | 295,410 | 319,073 |
The notes to the financial statements are an integral part of, and should be read in conjunction with, the financial statements.
17
Portfolio of Investments June 30, 2021† (Unaudited) (continued)
| | Principal
Amount | Value |
| U.S. Government & Federal Agencies (continued) |
| Federal National Mortgage Association (Mortgage Pass-Through Securities) (continued) |
| UMBS, 30 Year (continued) | | |
| 3.50%, due 1/1/46 | $ 211,155 | $ 230,209 |
| 3.50%, due 1/1/46 | 179,352 | 193,015 |
| 3.50%, due 4/1/46 | 74,429 | 79,754 |
| 3.50%, due 9/1/46 | 373,495 | 405,428 |
| 3.50%, due 10/1/46 | 165,985 | 176,349 |
| 3.50%, due 10/1/46 | 71,099 | 75,269 |
| 3.50%, due 1/1/47 | 142,149 | 151,476 |
| 3.50%, due 7/1/47 | 30,669 | 32,465 |
| 3.50%, due 7/1/47 | 163,528 | 176,112 |
| 3.50%, due 10/1/47 | 112,810 | 119,345 |
| 3.50%, due 11/1/47 | 347,823 | 367,917 |
| 3.50%, due 11/1/47 | 160,290 | 169,830 |
| 3.50%, due 11/1/47 | 428,563 | 453,352 |
| 3.50%, due 12/1/47 | 30,324 | 32,074 |
| 3.50%, due 8/1/48 | 209,066 | 220,235 |
| 3.50%, due 9/1/48 | 261,255 | 275,594 |
| 3.50%, due 2/1/49 | 506,642 | 533,021 |
| 3.50%, due 6/1/49 | 1,030,030 | 1,084,155 |
| 4.00%, due 8/1/44 | 178,273 | 195,013 |
| 4.00%, due 2/1/45 | 162,497 | 176,696 |
| 4.00%, due 9/1/45 | 30,499 | 33,079 |
| 4.00%, due 5/1/46 | 122,931 | 132,639 |
| 4.00%, due 9/1/46 | 54,620 | 59,170 |
| 4.00%, due 9/1/46 | 64,302 | 69,178 |
| 4.00%, due 2/1/47 | 24,741 | 26,736 |
| 4.00%, due 4/1/47 | 12,586 | 13,525 |
| 4.00%, due 5/1/47 | 93,236 | 100,271 |
| 4.00%, due 5/1/47 | 73,469 | 78,864 |
| 4.00%, due 6/1/47 | 279,466 | 299,156 |
| 4.00%, due 10/1/47 | 30,633 | 32,863 |
| 4.00%, due 11/1/47 | 30,871 | 33,093 |
| 4.00%, due 12/1/47 | 84,875 | 90,637 |
| 4.00%, due 1/1/48 | 171,004 | 182,904 |
| 4.00%, due 1/1/48 | 32,736 | 35,171 |
| 4.00%, due 1/1/48 | 194,329 | 207,422 |
| 4.00%, due 2/1/48 | 93,138 | 99,501 |
| 4.00%, due 6/1/48 | 341,005 | 363,659 |
| 4.00%, due 7/1/48 | 228,298 | 243,317 |
| 4.00%, due 7/1/48 | 95,690 | 101,938 |
| 4.00%, due 7/1/48 | 365,383 | 389,289 |
| 4.00%, due 8/1/48 | 60,950 | 65,022 |
| 4.00%, due 9/1/48 | 234,659 | 249,923 |
| 4.00%, due 9/1/48 | 58,778 | 62,616 |
| 4.00%, due 10/1/48 | 42,077 | 44,818 |
| 4.00%, due 11/1/48 | 110,788 | 118,008 |
| | Principal
Amount | Value |
| |
| Federal National Mortgage Association (Mortgage Pass-Through Securities) (continued) |
| UMBS, 30 Year (continued) | | |
| 4.00%, due 1/1/49 | $ 83,449 | $ 88,894 |
| 4.00%, due 9/1/49 | 1,552,170 | 1,652,759 |
| 4.50%, due 7/1/46 | 32,926 | 35,878 |
| 4.50%, due 12/1/46 | 38,257 | 41,686 |
| 4.50%, due 4/1/47 | 370,892 | 405,388 |
| 4.50%, due 5/1/47 | 14,944 | 16,296 |
| 4.50%, due 7/1/47 | 204,819 | 220,763 |
| 4.50%, due 7/1/47 | 55,669 | 60,470 |
| 4.50%, due 8/1/47 | 7,118 | 7,708 |
| 4.50%, due 2/1/48 | 212,513 | 229,373 |
| 4.50%, due 4/1/48 | 48,800 | 52,741 |
| 4.50%, due 4/1/48 | 18,109 | 19,575 |
| 4.50%, due 4/1/48 | 55,294 | 59,732 |
| 4.50%, due 5/1/48 | 134,206 | 144,821 |
| 4.50%, due 6/1/48 | 78,603 | 84,602 |
| 4.50%, due 8/1/48 | 147,953 | 159,152 |
| 4.50%, due 10/1/48 | 52,795 | 56,889 |
| 4.50%, due 9/1/49 | 748,602 | 806,525 |
| 5.00%, due 6/1/39 | 117,144 | 133,908 |
| 5.00%, due 6/1/40 | 26,169 | 29,980 |
| 5.00%, due 7/1/47 | 78,433 | 86,686 |
| 5.00%, due 1/1/48 | 157,907 | 174,363 |
| 5.00%, due 4/1/48 | 28,078 | 30,886 |
| 5.00%, due 5/1/48 | 87,177 | 95,469 |
| 5.00%, due 9/1/48 | 86,113 | 94,962 |
| 5.50%, due 6/1/36 | 61,224 | 69,790 |
| 5.50%, due 5/1/44 | 78,184 | 90,445 |
| 5.50%, due 9/1/48 | 217,275 | 242,259 |
| | | 36,402,856 |
| Government National Mortgage Association (Mortgage Pass-Through Securities) 3.7% |
| GNMA I, 30 Year | | |
| 3.00%, due 6/15/45 | 23,461 | 24,563 |
| 3.00%, due 10/15/45 | 9,302 | 9,680 |
| 3.00%, due 5/15/48 | 121,456 | 126,572 |
| 3.50%, due 3/15/45 | 12,533 | 13,364 |
| 3.50%, due 4/15/45 | 29,660 | 31,575 |
| 3.50%, due 5/15/48 | 46,049 | 48,391 |
| 4.00%, due 8/15/46 | 57,869 | 63,671 |
| 4.00%, due 11/15/47 | 57,507 | 61,762 |
| 4.00%, due 7/15/49 | 136,184 | 146,403 |
| 4.50%, due 8/15/46 | 51,368 | 57,160 |
| 4.50%, due 2/15/47 | 10,815 | 12,171 |
| 4.50%, due 4/15/47 | 42,761 | 47,389 |
| 4.50%, due 8/15/47 | 243,420 | 274,854 |
The notes to the financial statements are an integral part of, and should be read in conjunction with, the financial statements.
| 18 | MainStay VP Indexed Bond Portfolio |
| | Principal
Amount | Value |
| U.S. Government & Federal Agencies (continued) |
| Government National Mortgage Association (Mortgage Pass-Through Securities) (continued) |
| GNMA I, 30 Year (continued) | | |
| 4.50%, due 8/15/47 | $ 227,550 | $ 252,181 |
| 5.00%, due 4/15/47 | 34,961 | 39,732 |
| 5.00%, due 12/15/47 | 37,553 | 42,338 |
| GNMA II, 30 Year | | |
| 2.50%, due 4/20/47 | 53,163 | 55,471 |
| 3.00%, due 11/20/45 | 426,808 | 451,927 |
| 3.00%, due 8/20/46 | 152,133 | 160,450 |
| 3.00%, due 9/20/46 | 82,494 | 87,009 |
| 3.00%, due 10/20/46 | 513,432 | 539,573 |
| 3.00%, due 1/20/47 | 581,514 | 613,064 |
| 3.00%, due 5/20/47 | 100,045 | 106,133 |
| 3.00%, due 12/20/47 | 310,787 | 327,922 |
| 3.00%, due 2/20/48 | 350,421 | 366,351 |
| 3.00%, due 3/20/48 | 418,137 | 437,149 |
| 3.00%, due 2/20/50 | 3,136,680 | 3,278,735 |
| 3.50%, due 11/20/42 | 178,967 | 190,243 |
| 3.50%, due 9/20/44 | 238,420 | 254,772 |
| 3.50%, due 7/20/45 | 610,110 | 652,657 |
| 3.50%, due 11/20/45 | 275,864 | 294,514 |
| 3.50%, due 7/20/46 | 30,448 | 32,404 |
| 3.50%, due 10/20/46 | 32,202 | 34,343 |
| 3.50%, due 11/20/46 | 393,431 | 418,116 |
| 3.50%, due 1/20/47 | 440,045 | 468,936 |
| 3.50%, due 5/20/47 | 324,915 | 344,768 |
| 3.50%, due 9/20/47 | 340,673 | 360,491 |
| 3.50%, due 10/20/47 | 610,464 | 649,264 |
| 3.50%, due 12/20/47 | 304,850 | 322,402 |
| 3.50%, due 7/20/48 | 166,399 | 175,783 |
| 3.50%, due 9/20/48 | 175,536 | 185,270 |
| 3.50%, due 10/20/48 | 177,099 | 186,853 |
| 3.50%, due 4/20/49 | 960,731 | 1,009,289 |
| 3.50%, due 7/20/49 | 1,115,888 | 1,172,128 |
| 4.00%, due 12/20/46 | 26,612 | 28,713 |
| 4.00%, due 1/20/47 | 210,921 | 227,081 |
| 4.00%, due 2/20/47 | 51,547 | 55,318 |
| 4.00%, due 3/20/47 | 38,422 | 41,218 |
| 4.00%, due 4/20/47 | 85,042 | 90,959 |
| 4.00%, due 5/20/47 | 69,714 | 74,616 |
| 4.00%, due 7/20/47 | 28,762 | 30,689 |
| 4.00%, due 11/20/47 | 349,877 | 373,706 |
| 4.00%, due 12/20/47 | 76,999 | 82,191 |
| 4.00%, due 4/20/48 | 281,674 | 299,749 |
| 4.00%, due 5/20/48 | 123,570 | 131,392 |
| 4.00%, due 6/20/48 | 51,310 | 54,614 |
| 4.00%, due 8/20/48 | 345,104 | 367,008 |
| | Principal
Amount | Value |
| |
| Government National Mortgage Association (Mortgage Pass-Through Securities) (continued) |
| GNMA II, 30 Year (continued) | | |
| 4.00%, due 9/20/48 | $ 181,606 | $ 193,529 |
| 4.00%, due 3/20/49 | 48,409 | 51,296 |
| 4.50%, due 8/20/46 | 85,401 | 94,245 |
| 4.50%, due 4/20/47 | 79,433 | 86,041 |
| 4.50%, due 11/20/47 | 75,041 | 81,118 |
| 4.50%, due 1/20/48 | 179,280 | 193,700 |
| 4.50%, due 3/20/48 | 75,355 | 81,009 |
| 4.50%, due 5/20/48 | 65,887 | 70,238 |
| 4.50%, due 6/20/48 | 111,562 | 119,869 |
| 4.50%, due 8/20/48 | 210,139 | 226,103 |
| 5.00%, due 8/20/45 | 100,122 | 112,568 |
| 5.00%, due 11/20/46 | 61,801 | 69,982 |
| 5.00%, due 11/20/47 | 70,310 | 76,957 |
| 5.00%, due 3/20/48 | 46,377 | 50,655 |
| 5.00%, due 6/20/48 | 101,706 | 109,731 |
| | | 17,902,118 |
| United States Treasury Bonds 4.7% |
| U.S. Treasury Bonds | | |
| 1.25%, due 5/15/50 | 175,000 | 142,892 |
| 1.375%, due 8/15/50 | 500,000 | 421,504 |
| 1.625%, due 11/15/50 | 3,500,000 | 3,143,437 |
| 2.25%, due 8/15/49 | 475,000 | 492,070 |
| 2.375%, due 11/15/49 | 785,000 | 835,902 |
| 2.75%, due 8/15/47 | 235,000 | 267,313 |
| 2.75%, due 11/15/47 | 300,000 | 341,508 |
| 2.875%, due 11/15/46 | 140,000 | 162,488 |
| 2.875%, due 5/15/49 | 1,600,000 | 1,873,562 |
| 3.00%, due 2/15/47 | 815,000 | 968,195 |
| 3.00%, due 5/15/47 | 575,000 | 683,733 |
| 3.00%, due 2/15/48 | 1,950,000 | 2,324,461 |
| 3.00%, due 8/15/48 | 1,290,000 | 1,540,240 |
| 3.00%, due 2/15/49 | 845,000 | 1,011,656 |
| 3.125%, due 5/15/48 | 2,900,000 | 3,536,754 |
| 3.375%, due 11/15/48 | 550,000 | 702,238 |
| 3.625%, due 2/15/44 | 150,000 | 193,881 |
| 4.50%, due 2/15/36 | 1,900,000 | 2,608,344 |
| 4.625%, due 2/15/40 | 750,000 | 1,076,602 |
| | | 22,326,780 |
| United States Treasury Notes 31.3% |
| U.S. Treasury Notes | | |
| 0.125%, due 12/31/22 | 9,500,000 | 9,491,836 |
| 0.125%, due 1/31/23 | 1,000,000 | 999,023 |
| 0.125%, due 2/28/23 | 1,000,000 | 998,750 |
| 0.125%, due 4/30/23 | 2,000,000 | 1,996,250 |
| 0.125%, due 5/15/23 | 9,500,000 | 9,482,187 |
The notes to the financial statements are an integral part of, and should be read in conjunction with, the financial statements.
19
Portfolio of Investments June 30, 2021† (Unaudited) (continued)
| | Principal
Amount | Value |
| U.S. Government & Federal Agencies (continued) |
| United States Treasury Notes (continued) |
| U.S. Treasury Notes (continued) | | |
| 0.125%, due 5/31/23 | $ 1,500,000 | $ 1,496,777 |
| 0.125%, due 6/30/23 | 1,500,000 | 1,496,426 |
| 0.125%, due 7/15/23 | 6,300,000 | 6,283,512 |
| 0.125%, due 8/15/23 | 14,000,000 | 13,956,797 |
| 0.125%, due 9/15/23 | 2,250,000 | 2,241,738 |
| 0.125%, due 10/15/23 | 3,000,000 | 2,987,109 |
| 0.125%, due 12/15/23 | 1,500,000 | 1,492,090 |
| 0.125%, due 1/15/24 | 700,000 | 695,762 |
| 0.125%, due 2/15/24 | 400,000 | 397,422 |
| 0.25%, due 4/15/23 | 850,000 | 850,465 |
| 0.25%, due 6/15/23 | 5,450,000 | 5,450,426 |
| 0.25%, due 11/15/23 | 3,000,000 | 2,994,961 |
| 0.25%, due 3/15/24 | 1,400,000 | 1,394,422 |
| 0.25%, due 5/15/24 | 1,300,000 | 1,292,891 |
| 0.25%, due 6/15/24 | 700,000 | 695,734 |
| 0.25%, due 5/31/25 | 1,850,000 | 1,818,926 |
| 0.25%, due 6/30/25 | 700,000 | 687,586 |
| 0.25%, due 8/31/25 | 950,000 | 930,926 |
| 0.375%, due 4/15/24 | 1,000,000 | 998,828 |
| 0.375%, due 4/30/25 | 2,025,000 | 2,003,247 |
| 0.375%, due 12/31/25 | 200,000 | 196,211 |
| 0.375%, due 7/31/27 | 975,000 | 934,477 |
| 0.50%, due 4/30/27 | 500,000 | 484,941 |
| 0.50%, due 5/31/27 | 1,050,000 | 1,016,531 |
| 0.50%, due 6/30/27 | 1,150,000 | 1,112,266 |
| 0.50%, due 8/31/27 | 2,500,000 | 2,410,742 |
| 0.625%, due 12/31/27 | 450,000 | 435,041 |
| 0.625%, due 5/15/30 | 175,000 | 163,577 |
| 0.625%, due 8/15/30 | 250,000 | 232,910 |
| 0.75%, due 5/31/26 | 1,500,000 | 1,491,445 |
| 0.875%, due 6/30/26 | 1,500,000 | 1,499,297 |
| 0.875%, due 11/15/30 | 200,000 | 190,188 |
| 1.125%, due 2/29/28 | 400,000 | 398,813 |
| 1.125%, due 2/15/31 | 250,000 | 242,695 |
| 1.25%, due 3/31/28 | 200,000 | 200,789 |
| 1.25%, due 4/30/28 | 475,000 | 476,484 |
| 1.25%, due 5/31/28 | 3,900,000 | 3,909,750 |
| 1.25%, due 6/30/28 | 3,450,000 | 3,455,391 |
| 1.50%, due 10/31/24 | 3,100,000 | 3,198,812 |
| 1.50%, due 1/31/27 | 2,400,000 | 2,467,219 |
| 1.625%, due 8/15/29 | 1,050,000 | 1,073,912 |
| 1.625%, due 5/15/31 | 3,950,000 | 4,010,484 |
| 1.75%, due 6/30/24 | 2,875,000 | 2,985,732 |
| 1.75%, due 7/31/24 | 6,650,000 | 6,910,545 |
| 1.875%, due 8/31/24 | 650,000 | 678,082 |
| 2.00%, due 4/30/24 | 4,035,000 | 4,214,053 |
| | Principal
Amount | | Value |
| |
| United States Treasury Notes (continued) |
| U.S. Treasury Notes (continued) | | | |
| 2.00%, due 5/31/24 | $ 1,400,000 | | $ 1,463,055 |
| 2.125%, due 7/31/24 | 150,000 | | 157,547 |
| 2.375%, due 5/15/29 | 825,000 | | 890,259 |
| 2.50%, due 3/31/23 | 100,000 | | 103,988 |
| 2.625%, due 6/30/23 | 1,900,000 | | 1,989,656 |
| 2.625%, due 12/31/23 | 150,000 | | 158,490 |
| 2.75%, due 4/30/23 | 5,425,000 | | 5,673,999 |
| 2.75%, due 5/31/23 | 1,700,000 | | 1,781,547 |
| 2.75%, due 7/31/23 | 4,675,000 | | 4,916,420 |
| 2.75%, due 8/31/23 | 8,300,000 | | 8,741,910 |
| 2.75%, due 6/30/25 | 275,000 | | 297,419 |
| 2.875%, due 9/30/23 | 2,875,000 | | 3,041,099 |
| 2.875%, due 10/31/23 | 2,300,000 | | 2,436,563 |
| 2.875%, due 11/30/23 | 600,000 | | 636,703 |
| 2.875%, due 5/31/25 | 300,000 | | 325,688 |
| | | | 150,138,821 |
Total U.S. Government & Federal Agencies
(Cost $250,858,588) | | | 257,719,123 |
Total Long-Term Bonds
(Cost $458,271,379) | | | 471,021,349 |
| |
| | Shares | | |
| Short-Term Investment 6.0% |
| Unaffiliated Investment Company 6.0% |
| J.P. Morgan U.S. Government Money Market Fund, 0.026% (f) | 28,829,465 | | 28,829,465 |
Total Short-Term Investment
(Cost $28,829,465) | | | 28,829,465 |
Total Investments
(Cost $487,100,844) | 104.2% | | 499,850,814 |
| Other Assets, Less Liabilities | (4.2) | | (20,200,461) |
| Net Assets | 100.0% | | $ 479,650,353 |
| † | Percentages indicated are based on Portfolio net assets. |
| ‡ | Less than one-tenth of a percent. |
| (a) | Fixed to floating rate—Rate shown was the rate in effect as of June 30, 2021. |
| (b) | Step coupon—Rate shown was the rate in effect as of June 30, 2021. |
| (c) | May be sold to institutional investors only under Rule 144A or securities offered pursuant to Section 4(a)(2) of the Securities Act of 1933, as amended. |
The notes to the financial statements are an integral part of, and should be read in conjunction with, the financial statements.
| 20 | MainStay VP Indexed Bond Portfolio |
| (d) | TBA—Security purchased on a forward commitment basis with an approximate principal amount and maturity date. The actual principal amount and maturity date will be determined upon settlement. As of June 30, 2021, the total net market value was $47,347,122, which represented 9.9% of the Portfolio’s net assets. All or a portion of this security is a part of a mortgage dollar roll agreement. |
| (e) | Coupon rate may change based on changes of the underlying collateral or prepayments of principal. Rate shown was the rate in effect as of June 30, 2021. |
| (f) | Current yield as of June 30, 2021. |
Futures Contracts
As of June 30, 2021, the Portfolio held the following futures contracts1:
| Type | Number of
Contracts | Expiration
Date | Value at
Trade Date | Current
Notional
Amount | Unrealized
Appreciation
(Depreciation)2 |
| Long Contracts | | | | | |
| U.S. Treasury 5 Year Notes | 30 | September 2021 | $ 3,718,566 | $ 3,702,891 | $ (15,675) |
| U.S. Treasury 10 Year Notes | 34 | September 2021 | 4,479,294 | 4,505,000 | 25,706 |
| U.S. Treasury 10 Year Ultra Bonds | 54 | September 2021 | 7,810,690 | 7,948,969 | 138,279 |
| U.S. Treasury Long Bonds | 131 | September 2021 | 20,455,738 | 21,058,250 | 602,512 |
| U.S. Treasury Ultra Bonds | 27 | September 2021 | 4,978,743 | 5,202,562 | 223,819 |
| Total Long Contracts | | | | | 974,641 |
| Short Contracts | | | | | |
| U.S. Treasury 2 Year Notes | (161) | September 2021 | (35,526,286) | (35,471,570) | 54,716 |
| Net Unrealized Appreciation | | | | | $ 1,029,357 |
| 1. | As of June 30, 2021, cash in the amount of $809,513 was on deposit with a broker or futures commission merchant for futures transactions. |
| 2. | Represents the difference between the value of the contracts at the time they were opened and the value as of June 30, 2021. |
| Abbreviation(s): |
| FFCB—Federal Farm Credit Bank |
| FHLB—Federal Home Loan Bank |
| FHLMC—Federal Home Loan Mortgage Corp. |
| FNMA—Federal National Mortgage Association |
| GNMA—Government National Mortgage Association |
| REMIC—Real Estate Mortgage Investment Conduit |
| TBA—To Be Announced |
| UMBS—Uniform Mortgage Backed Securities |
The notes to the financial statements are an integral part of, and should be read in conjunction with, the financial statements.
21
Portfolio of Investments June 30, 2021† (Unaudited) (continued)
The following is a summary of the fair valuations according to the inputs used as of June 30, 2021, for valuing the Portfolio’s assets and liabilities:
| Description | Quoted
Prices in
Active
Markets for
Identical
Assets
(Level 1) | | Significant
Other
Observable
Inputs
(Level 2) | | Significant
Unobservable
Inputs
(Level 3) | | Total |
| Asset Valuation Inputs | | | | | | | |
| Investments in Securities (a) | | | | | | | |
| Long-Term Bonds | | | | | | | |
| Asset-Backed Securities | $ — | | $ 344,177 | | $ — | | $ 344,177 |
| Corporate Bonds | — | | 139,866,280 | | — | | 139,866,280 |
| Foreign Government Bonds | — | | 13,936,895 | | — | | 13,936,895 |
| Mortgage-Backed Securities | — | | 59,154,874 | | — | | 59,154,874 |
| U.S. Government & Federal Agencies | — | | 257,719,123 | | — | | 257,719,123 |
| Total Long-Term Bonds | — | | 471,021,349 | | — | | 471,021,349 |
| Short-Term Investment | | | | | | | |
| Unaffiliated Investment Company | 28,829,465 | | — | | — | | 28,829,465 |
| Total Investments in Securities | 28,829,465 | | 471,021,349 | | — | | 499,850,814 |
| Other Financial Instruments | | | | | | | |
| Futures Contracts (b) | 1,045,032 | | — | | — | | 1,045,032 |
| Total Investments in Securities and Other Financial Instruments | $ 29,874,497 | | $ 471,021,349 | | $ — | | $ 500,895,846 |
| Liability Valuation Inputs | | | | | | | |
| Other Financial Instruments | | | | | | | |
| Futures Contracts (b) | $ (15,675) | | $ — | | $ — | | $ (15,675) |
| (a) | For a complete listing of investments and their industries, see the Portfolio of Investments. |
| (b) | The value listed for these securities reflects unrealized appreciation (depreciation) as shown on the Portfolio of Investments. |
The notes to the financial statements are an integral part of, and should be read in conjunction with, the financial statements.
| 22 | MainStay VP Indexed Bond Portfolio |
Statement of Assets and Liabilities as of June 30, 2021 (Unaudited)
| Assets |
Investment in securities, at value
(identified cost $487,100,844) | $499,850,814 |
| Cash | 17,580,064 |
| Cash collateral on deposit at broker for futures contracts | 809,513 |
| Receivables: | |
| Investment securities sold | 15,003,952 |
| Interest | 2,083,671 |
| Variation margin on futures contracts | 160,316 |
| Other assets | 10,740 |
| Total assets | 535,499,070 |
| Liabilities |
| Cash collateral due to broker for TBA | 580,064 |
| Payables: | |
| Investment securities purchased | 55,017,002 |
| Manager (See Note 3) | 108,372 |
| Shareholder communication | 55,112 |
| Professional fees | 54,667 |
| Custodian | 32,042 |
| Trustees | 1,458 |
| Total liabilities | 55,848,717 |
| Net assets | $479,650,353 |
| Composition of Net Assets |
| Shares of beneficial interest outstanding (par value of $.001 per share) unlimited number of shares authorized | $ 43,428 |
| Additional paid-in-capital | 432,632,675 |
| | 432,676,103 |
| Total distributable earnings (loss) | 46,974,250 |
| Net assets | $479,650,353 |
| Initial Class | |
| Net assets applicable to outstanding shares | $479,650,353 |
| Shares of beneficial interest outstanding | 43,427,636 |
| Net asset value per share outstanding | $ 11.04 |
The notes to the financial statements are an integral part of, and should be read in conjunction with, the financial statements.
23
Statement of Operations for the six months ended June 30, 2021 (Unaudited)
| Investment Income (Loss) |
| Income | |
| Interest | $ 5,101,690 |
| Dividends | 42,533 |
| Total income | 5,144,223 |
| Expenses | |
| Manager (See Note 3) | 758,640 |
| Professional fees | 56,135 |
| Shareholder communication | 33,623 |
| Custodian | 27,570 |
| Trustees | 8,167 |
| Miscellaneous | 11,589 |
| Total expenses | 895,724 |
| Net investment income (loss) | 4,248,499 |
| Realized and Unrealized Gain (Loss) |
| Net realized gain (loss) on: | |
| Unaffiliated investment transactions | 5,847,953 |
| Futures transactions | (4,917,781) |
| Net realized gain (loss) | 930,172 |
| Net change in unrealized appreciation (depreciation) on: | |
| Unaffiliated investments | (20,120,718) |
| Futures contracts | 1,324,070 |
| Net change in unrealized appreciation (depreciation) | (18,796,648) |
| Net realized and unrealized gain (loss) | (17,866,476) |
| Net increase (decrease) in net assets resulting from operations | $(13,617,977) |
The notes to the financial statements are an integral part of, and should be read in conjunction with, the financial statements.
| 24 | MainStay VP Indexed Bond Portfolio |
Statements of Changes in Net Assets
for the six months ended June 30, 2021 (Unaudited) and the year ended December 31, 2020
| | 2021 | 2020 |
| Increase (Decrease) in Net Assets |
| Operations: | | |
| Net investment income (loss) | $ 4,248,499 | $ 11,825,564 |
| Net realized gain (loss) | 930,172 | 17,704,592 |
| Net change in unrealized appreciation (depreciation) | (18,796,648) | 15,176,885 |
| Net increase (decrease) in net assets resulting from operations | (13,617,977) | 44,707,041 |
| Distributions to shareholders: | | |
| Initial Class | — | (10,704,315) |
| Service Class (a) | — | (2,561,185) |
| Total distributions to shareholders | — | (13,265,500) |
| Capital share transactions: | | |
| Net proceeds from sales of shares | 8,297,914 | 583,487,098 |
| Net asset value of shares issued to shareholder in reinvestment of distributions | — | 13,265,500 |
| Cost of shares redeemed | (272,661,483) | (409,275,329) |
| Increase (decrease) in net assets derived from capital share transactions | (264,363,569) | 187,477,269 |
| Net increase (decrease) in net assets | (277,981,546) | 218,918,810 |
| Net Assets |
| Beginning of period | 757,631,899 | 538,713,089 |
| End of period | $ 479,650,353 | $ 757,631,899 |
| (a) | Service Class liquidated on November 22, 2020 |
The notes to the financial statements are an integral part of, and should be read in conjunction with, the financial statements.
25
Financial Highlights selected per share data and ratios
| | Six months ended
June 30,
2021* | | Year Ended December 31, | | May 1, 2017^ through
December 31,
2017 |
| Initial Class | 2020 | | 2019 | | 2018 | |
| Net asset value at beginning of period | $ 11.25 | | $ 10.62 | | $ 9.80 | | $ 10.04 | | $ 10.00 |
| Net investment income (loss) (a) | 0.08 | | 0.18 | | 0.27 | | 0.26 | | 0.13 |
| Net realized and unrealized gain (loss) on investments | (0.29) | | 0.60 | | 0.55 | | (0.33) | | 0.01 |
| Total from investment operations | (0.21) | | 0.78 | | 0.82 | | (0.07) | | 0.14 |
| Less distributions: | | | | | | | | | |
| From net investment income | — | | (0.13) | | — | | (0.17) | | (0.10) |
| From net realized gain on investments | — | | (0.02) | | — | | — | | (0.00)‡ |
| Total distributions | — | | (0.15) | | — | | (0.17) | | (0.10) |
| Net asset value at end of period | $ 11.04 | | $ 11.25 | | $ 10.62 | | $ 9.80 | | $ 10.04 |
| Total investment return (b) | (1.87)%(c) | | 7.40% | | 8.37%(c) | | (0.67)% | | 1.42% |
| Ratios (to average net assets)/Supplemental Data: | | | | | | | | | |
| Net investment income (loss) | 1.40%†† | | 1.59% | | 2.66% | | 2.67% | | 1.92%†† |
| Net expenses (d) | 0.30%†† | | 0.29% | | 0.30% | | 0.31% | | 0.37%†† |
| Portfolio turnover rate (e) | 115% | | 191% | | 65% | | 143% | | 104%(f) |
| Net assets at end of period (in 000’s) | $ 479,650 | | $ 757,632 | | $ 422,163 | | $ 362,545 | | $ 140,759 |
| * | Unaudited. |
| ^ | Inception date. |
| ‡ | Less than one cent per share. |
| †† | Annualized. |
| (a) | Per share data based on average shares outstanding during the period. |
| (b) | Total return does not reflect any deduction of sales charges, mortality and expense charges, contract charges or administrative charges. For periods of less than one year, total return is not annualized. |
| (c) | Total investment return may reflect adjustments to conform to generally accepted accounting principles. |
| (d) | In addition to the fees and expenses which the Portfolio bears directly, it also indirectly bears a pro-rata share of the fees and expenses of the underlying funds in which it invests. Such indirect expenses are not included in the above expense ratios. |
| (e) | The portfolio turnover rate not including mortgage dollar rolls were 26%, 138%, 57%, 104% and 59% for the six months ended June 30, 2021 and for the years ended December 31, 2020, 2019, 2018 and for the period ended December 31, 2017, respectively. |
| (f) | Portfolio turnover rate is not annualized. |
The notes to the financial statements are an integral part of, and should be read in conjunction with, the financial statements.
| 26 | MainStay VP Indexed Bond Portfolio |
Notes to Financial Statements (Unaudited)
Note 1–Organization and Business
MainStay VP Funds Trust (the “Fund”) was organized as a Delaware statutory trust on February 1, 2011. The Fund is registered under the Investment Company Act of 1940, as amended (the “1940 Act”), as an open-end management investment company. The Fund is comprised of thirty-one separate series (collectively referred to as the “Portfolios”). These financial statements and notes relate to the MainStay VP Indexed Bond Portfolio (the "Portfolio"), a "diversified” portfolio, as that term is defined in the 1940 Act, as interpreted or modified by regulatory authorities having jurisdiction, from time to time.
Shares of the Portfolio are currently offered to certain separate accounts to fund variable annuity policies and variable universal life insurance policies issued by New York Life Insurance and Annuity Corporation (“NYLIAC”), a wholly-owned subsidiary of New York Life Insurance Company (“New York Life”) and may also be offered to fund variable annuity policies and variable universal life insurance policies issued by other insurance companies. NYLIAC allocates shares of the Portfolios to, among others, certain NYLIAC separate accounts. Shares of the Portfolio are also offered to the MainStay VP Conservative Allocation Portfolio, MainStay VP Moderate Allocation Portfolio, MainStay VP Growth Allocation Portfolio (formerly known as MainStay VP Moderate Growth Allocation Portfolio) and MainStay VP Equity Allocation Portfolio (formerly known as MainStay VP Growth Allocation Portfolio), which operate as “funds-of-funds," and other variable insurance funds.
The following table lists the Portfolio's share classes that have been registered and commenced operations:
| Class | Commenced Operations |
| Initial Class | May 1, 2017 |
| Service Class | N/A* |
* Service Class shares were previously available for sale, As of November 22, 2020, Service Class shares were no longer available for sale.
Shares of the Portfolio are offered and are redeemed at a price equal to their respective net asset value (“NAV”) per share. No sales or redemption charge is applicable to the purchase or redemption of the Portfolio's shares. Under the terms of the Fund’s multiple class plan, adopted pursuant to Rule 18f-3 under the 1940 Act, the classes differ in that, among other things, Service Class shares of the Portfolio pay a combined distribution and service fee of 0.25% of average daily net assets attributable to Service Class shares of the Portfolio to the Distributor (as defined in Note 3(B)) pursuant to a plan adopted in accordance with Rule 12b-1 under the 1940 Act.
The Portfolio's investment objective is to seek investment results that correspond to the total return performance of fixed-income securities in the aggregate, as represented by the Portfolio's primary benchmark index.
Note 2–Significant Accounting Policies
The Portfolio is an investment company and accordingly follows the investment company accounting and reporting guidance of the Financial Accounting Standards Board (“FASB”) Accounting Standard Codification Topic 946 Financial Services—Investment Companies. The Portfolio prepares its financial statements in accordance with generally accepted accounting principles (“GAAP”) in the United States of America and follows the significant accounting policies described below.
(A) Securities Valuation. Investments are usually valued as of the close of regular trading on the New York Stock Exchange (the "Exchange") (usually 4:00 p.m. Eastern time) on each day the Portfolio is open for business ("valuation date").
The Board of Trustees of the Fund (the "Board") adopted procedures establishing methodologies for the valuation of the Portfolio's securities and other assets and delegated the responsibility for valuation determinations under those procedures to the Valuation Committee of the Fund (the “Valuation Committee”). The procedures state that, subject to the oversight of the Board and unless otherwise noted, the responsibility for the day-to-day valuation of portfolio assets (including fair value measurements for the Portfolio's assets and liabilities) rests with New York Life Investment Management LLC (“New York Life Investments” or the "Manager"), aided to whatever extent necessary by the Subadvisor (as defined in Note 3(A)). To assess the appropriateness of security valuations, the Manager, the Subadvisor or the Portfolio's third-party service provider, who is subject to oversight by the Manager, regularly compares prior day prices, prices on comparable securities and the sale prices to the prior and current day prices and challenges prices with changes exceeding certain tolerance levels with third-party pricing services or broker sources.
The Board authorized the Valuation Committee to appoint a Valuation Subcommittee (the “Subcommittee”) to establish the prices of securities for which market quotations are not readily available or the prices of which are not otherwise readily determinable under the procedures. The Subcommittee meets (in person, via electronic mail or via teleconference) on an as-needed basis. The Valuation Committee meets to ensure that actions taken by the Subcommittee were appropriate.
For those securities valued through either a standardized fair valuation methodology or a fair valuation measurement, the Subcommittee deals with such valuation and the Valuation Committee reviews and affirms, if appropriate, the reasonableness of the valuation based on such methodologies and measurements on a regular basis after considering information that is reasonably available and deemed relevant by the Valuation Committee. Any action taken by the Subcommittee with respect to the valuation of a portfolio security or other asset is submitted for review and ratification (if appropriate) to the Valuation Committee and the Board at the next regularly scheduled meeting.
"Fair value" is defined as the price the Portfolio would reasonably expect to receive upon selling an asset or liability in an orderly transaction to an independent buyer in the principal or most advantageous market for the
Notes to Financial Statements (Unaudited) (continued)
asset or liability. Fair value measurements are determined within a framework that establishes a three-tier hierarchy that maximizes the use of observable market data and minimizes the use of unobservable inputs to establish a classification of fair value measurements for disclosure purposes. "Inputs" refer broadly to the assumptions that market participants would use in pricing the asset or liability, including assumptions about risk, such as the risk inherent in a particular valuation technique used to measure fair value using a pricing model and/or the risk inherent in the inputs for the valuation technique. Inputs may be observable or unobservable. Observable inputs reflect the assumptions market participants would use in pricing the asset or liability based on market data obtained from sources independent of the Portfolio. Unobservable inputs reflect the Portfolio’s own assumptions about the assumptions market participants would use in pricing the asset or liability based on the information available. The inputs or methodology used for valuing assets or liabilities may not be an indication of the risks associated with investing in those assets or liabilities. The three-tier hierarchy of inputs is summarized below.
| • | Level 1—quoted prices in active markets for an identical asset or liability |
| • | Level 2—other significant observable inputs (including quoted prices for a similar asset or liability in active markets, interest rates and yield curves, prepayment speeds, credit risk, etc.) |
| • | Level 3—significant unobservable inputs (including the Portfolio's own assumptions about the assumptions that market participants would use in measuring fair value of an asset or liability) |
The level of an asset or liability within the fair value hierarchy is based on the lowest level of an input, both individually and in the aggregate, that is significant to the fair value measurement. The aggregate value by input level of the Portfolio’s assets and liabilities as of June 30, 2021, is included at the end of the Portfolio of Investments.
The Portfolio may use third-party vendor evaluations, whose prices may be derived from one or more of the following standard inputs, among others:
| • Benchmark yields | • Reported trades |
| • Broker/dealer quotes | • Issuer spreads |
| • Two-sided markets | • Benchmark securities |
| • Bids/offers | • Reference data (corporate actions or material event notices) |
| • Industry and economic events | • Comparable bonds |
| • Monthly payment information | |
An asset or liability for which market values cannot be measured using the methodologies described above is valued by methods deemed reasonable in good faith by the Valuation Committee, following the procedures established by the Board, to represent fair value. Under these procedures, the Portfolio generally uses a market-based approach which may use related or comparable assets or liabilities, recent transactions, market multiples, book values and other relevant information. The
Portfolio may also use an income-based valuation approach in which the anticipated future cash flows of the asset or liability are discounted to calculate fair value. Discounts may also be applied due to the nature and/or duration of any restrictions on the disposition of the asset or liability. Fair value represents a good faith approximation of the value of a security. Fair value determinations involve the consideration of a number of subjective factors, an analysis of applicable facts and circumstances and the exercise of judgment. As a result, it is possible that the fair value for a security determined in good faith in accordance with the Portfolio's valuation procedures may differ from valuations for the same security determined by other funds using their own valuation procedures. Although the Portfolio's valuation procedures are designed to value a security at the price the Portfolio may reasonably expect to receive upon the security's sale in an orderly transaction, there can be no assurance that any fair value determination thereunder would, in fact, approximate the amount that the Portfolio would actually realize upon the sale of the security or the price at which the security would trade if a reliable market price were readily available. During the six-month period ended June 30, 2021, there were no material changes to the fair value methodologies.
Securities which may be valued in this manner include, but are not limited to: (i) a security for which trading has been halted or suspended; (ii) a debt security that has recently gone into default and for which there is not a current market quotation; (iii) a security of an issuer that has entered into a restructuring; (iv) a security that has been delisted from a national exchange; (v) a security for which the market price is not readily available from a third-party pricing source or, if so provided, does not, in the opinion of the Manager or the Subadvisor, reflect the security's market value; (vi) a security subject to trading collars for which no or limited trading takes place; and (vii) a security whose principal market has been temporarily closed at a time when, under normal conditions, it would be open. Securities valued in this manner are generally categorized as Level 3 in the hierarchy. No securities held by the Portfolio as of June 30, 2021 were fair valued in such a manner.
Investments in mutual funds, including money market funds, are valued at their respective NAVs at the close of business each day on the valuation date. These securities are generally categorized as Level 1 in the hierarchy.
Futures contracts are valued at the last posted settlement price on the market where such futures are primarily traded. These securities are generally categorized as Level 1 in the hierarchy.
Debt securities (other than convertible and municipal bonds) are valued at the evaluated bid prices (evaluated mean prices in the case of convertible and municipal bonds) supplied by a pricing agent or broker selected by the Manager, in consultation with the Subadvisor. The evaluations are market-based measurements processed through a pricing application and represents the pricing agent’s good faith determination as to what a holder may receive in an orderly transaction under market conditions. The rules-based logic utilizes valuation techniques that reflect participants’ assumptions and vary by asset class and per methodology, maximizing the use of relevant observable data including quoted prices for similar
| 28 | MainStay VP Indexed Bond Portfolio |
assets, benchmark yield curves and market corroborated inputs. The evaluated bid or mean prices are deemed by the Manager, in consultation with the Subadvisor, to be representative of market values at the regular close of trading of the Exchange on each valuation date. Debt securities purchased on a delayed delivery basis are marked to market daily until settlement at the forward settlement date. Debt securities, including corporate bonds, U.S. government and federal agency bonds, municipal bonds, foreign bonds, convertible bonds, asset-backed securities and mortgage-backed securities are generally categorized as Level 2 in the hierarchy.
Temporary cash investments acquired in excess of 60 days to maturity at the time of purchase are valued using the latest bid prices or using valuations based on a matrix system (which considers such factors as security prices, yields, maturities and ratings), both as furnished by independent pricing services. Temporary cash investments that mature in 60 days or less at the time of purchase ("Short-Term Investments") are valued using the amortized cost method of valuation, unless the use of such method would be inappropriate. The amortized cost method involves valuing a security at its cost on the date of purchase and thereafter assuming a constant amortization to maturity of the difference between such cost and the value on maturity date. Amortized cost approximates the current fair value of a security. Securities valued using the amortized cost method are not valued using quoted prices in an active market and are generally categorized as Level 2 in the hierarchy.
The information above is not intended to reflect an exhaustive list of the methodologies that may be used to value portfolio investments. The valuation procedures permit the use of a variety of valuation methodologies in connection with valuing portfolio investments. The methodology used for a specific type of investment may vary based on the market data available or other considerations. The methodologies summarized above may not represent the specific means by which portfolio investments are valued on any particular business day.
(B) Income Taxes. The Portfolio's policy is to comply with the requirements of the Internal Revenue Code of 1986, as amended (the “Internal Revenue Code”), applicable to regulated investment companies and to distribute all of its taxable income to the shareholders of the Portfolio within the allowable time limits.
The Manager evaluates the Portfolio’s tax positions to determine if the tax positions taken meet the minimum recognition threshold in connection with accounting for uncertainties in income tax positions taken or expected to be taken for the purposes of measuring and recognizing tax liabilities in the financial statements. Recognition of tax benefits of an uncertain tax position is permitted only to the extent the position is “more likely than not” to be sustained assuming examination by taxing authorities. The Manager analyzed the Portfolio's tax positions taken on federal, state and local income tax returns for all open tax years (for up to three tax years) and has concluded that no provisions for federal, state and local income tax are required in the Portfolio's financial statements. The Portfolio's federal, state and local income tax and federal excise tax returns for tax years for which the applicable statutes of limitations have
not expired are subject to examination by the Internal Revenue Service and state and local departments of revenue.
(C) Foreign Taxes. The Portfolio may be subject to foreign taxes on income and other transaction-based taxes imposed by certain countries in which it invests. A portion of the taxes on gains on investments or currency purchases/repatriation may be reclaimable. The Portfolio will accrue such taxes and reclaims as applicable, based upon its current interpretation of tax rules and regulations that exist in the markets in which it invests.
The Portfolio may be subject to taxation on realized capital gains, repatriation proceeds and other transaction-based taxes imposed by certain countries in which it invests. The Portfolio will accrue such taxes as applicable based upon its current interpretation of tax rules and regulations that exist in the market in which it invests. Capital gains taxes relating to positions still held are reflected as a liability in the Statement of Assets and Liabilities, as well as an adjustment to the Portfolio's net unrealized appreciation (depreciation). Taxes related to capital gains realized, if any, are reflected as part of net realized gain (loss) in the Statement of Operations. Changes in tax liabilities related to capital gains taxes on unrealized investment gains, if any, are reflected as part of the change in net unrealized appreciation (depreciation) on investments in the Statement of Operations. Transaction-based charges are generally assessed as a percentage of the transaction amount.
(D) Dividends and Distributions to Shareholders. Dividends and distributions are recorded on the ex-dividend date. The Portfolio intends to declare and pay dividends from net investment income and distributions from net realized capital and currency gains, if any, at least annually. Unless a shareholder elects otherwise, all dividends and distributions are reinvested at NAV in the same class of shares of the Portfolio. Dividends and distributions to shareholders are determined in accordance with federal income tax regulations and may differ from determinations using GAAP.
(E) Security Transactions and Investment Income. The Portfolio records security transactions on the trade date. Realized gains and losses on security transactions are determined using the identified cost method. Dividend income is recognized on the ex-dividend date, net of any foreign tax withheld at the source, and interest income is accrued as earned using the effective interest rate method. Discounts and premiums on securities purchased, other than temporary cash investments that mature in 60 days or less at the time of purchase, for the Portfolio are accreted and amortized, respectively, on the effective interest rate method.
Investment income and realized and unrealized gains and losses on investments of the Portfolio are allocated pro rata to the separate classes of shares based upon their relative net assets on the date the income is earned or realized and unrealized gains and losses are incurred.
The Portfolio may place a debt security on non-accrual status and reduce related interest income by ceasing current accruals and writing off all or a portion of any interest receivables when the collection of all or a portion of such interest has become doubtful. A debt security is removed from
Notes to Financial Statements (Unaudited) (continued)
non-accrual status when the issuer resumes interest payments or when collectability of interest is reasonably assured.
(F) Expenses. Expenses of the Fund are allocated to the individual Portfolios in proportion to the net assets of the respective Portfolios when the expenses are incurred, except where direct allocations of expenses can be made. Expenses (other than fees incurred under the distribution and service plans, further discussed in Note 3(B), which are charged directly to the Service Class shares) are allocated to separate classes of shares pro rata based upon their relative net assets on the date the expenses are incurred. The expenses borne by the Portfolio, including those of related parties to the Portfolio, are shown in the Statement of Operations.
Additionally, the Portfolio may invest in mutual funds, which are subject to management fees and other fees that may cause the costs of investing in mutual funds to be greater than the costs of owning the underlying securities directly. These indirect expenses of mutual funds are not included in the amounts shown as expenses in the Statement of Operations or in the expense ratios included in the Financial Highlights.
(G) Use of Estimates. In preparing financial statements in conformity with GAAP, the Manager makes estimates and assumptions that affect the reported amounts and disclosures in the financial statements. Actual results could differ from those estimates and assumptions.
(H) Futures Contracts. A futures contract is an agreement to purchase or sell a specified quantity of an underlying instrument at a specified future date and price, or to make or receive a cash payment based on the value of a financial instrument (e.g., foreign currency, interest rate, security or securities index). The Portfolio is subject to risks such as market price risk and/or interest rate risk in the normal course of investing in these contracts. Upon entering into a futures contract, the Portfolio is required to pledge to the broker or futures commission merchant an amount of cash and/or U.S. government securities equal to a certain percentage of the collateral amount, known as the “initial margin.” During the period the futures contract is open, changes in the value of the contract are recognized as unrealized appreciation or depreciation by marking to market such contract on a daily basis to reflect the market value of the contract at the end of each day’s trading. The Portfolio agrees to receive from or pay to the broker or futures commission merchant an amount of cash equal to the daily fluctuation in the value of the contract. Such receipts or payments are known as “variation margin.” When the futures contract is closed, the Portfolio records a realized gain or loss equal to the difference between the proceeds from (or cost of) the closing transaction and the Portfolio's basis in the contract.
The use of futures contracts involves, to varying degrees, elements of market risk in excess of the amount recognized in the Statement of Assets and Liabilities. The contract or notional amounts and variation margin reflect the extent of the Portfolio's involvement in open futures positions. There are several risks associated with the use of futures contracts as hedging techniques. There can be no assurance that a liquid
market will exist at the time when the Portfolio seeks to close out a futures contract. If no liquid market exists, the Portfolio would remain obligated to meet margin requirements until the position is closed. Futures contracts may involve a small initial investment relative to the risk assumed, which could result in losses greater than if the Portfolio did not invest in futures contracts. Futures contracts may be more volatile than direct investments in the instrument underlying the futures and may not correlate to the underlying instrument, causing a given hedge not to achieve its objectives. The Portfolio's activities in futures contracts have minimal counterparty risk as they are conducted through regulated exchanges that guarantee the futures against default by the counterparty. In the event of a bankruptcy or insolvency of a futures commission merchant that holds margin on behalf of the Portfolio, the Portfolio may not be entitled to the return of the entire margin owed to the Portfolio, potentially resulting in a loss. The Portfolio may invest in futures contracts to seek enhanced returns or to reduce the risk of loss by hedging certain of its holdings. The Portfolio's investment in futures contracts and other derivatives may increase the volatility of the Portfolio's NAVs and may result in a loss to the Portfolio. Open futures contracts as of June 30, 2021 are shown in the Portfolio of Investments.
(I) Securities Lending. In order to realize additional income, the Portfolio may engage in securities lending, subject to the limitations set forth in the 1940 Act and relevant guidance by the staff of the Securities and Exchange Commission (“SEC”). If the Portfolio engages in securities lending, the Portfolio will lend through its custodian, JPMorgan Chase Bank, N.A., ("JPMorgan"), acting as securities lending agent on behalf of the Portfolio. Under the current arrangement, JPMorgan will manage the Portfolio's collateral in accordance with the securities lending agency agreement between the Portfolio and JPMorgan, and indemnify the Portfolio against counterparty risk. The loans will be collateralized by cash (which may be invested in a money market fund) and/or non-cash collateral (which may include U.S. Treasury securities and/or U.S. government agency securities issued or guaranteed by the United States government or its agencies or instrumentalities) at least equal at all times to the market value of the securities loaned. The Portfolio bears the risk of delay in recovery of, or loss of rights in, the securities loaned. The Portfolio may also record a realized gain or loss on securities deemed sold due to a borrower’s inability to return securities on loan. The Portfolio bears the risk of any loss on investment of cash collateral. The Portfolio will receive compensation for lending its securities in the form of fees or it will retain a portion of interest earned on the investment of any cash collateral. The Portfolio will also continue to receive interest and dividends on the securities loaned and any gain or loss in the market price of the securities loaned that may occur during the term of the loan will be for the account of the Portfolio. Income earned from securities lending activities, if any, is reflected in the Statement of Operations. As of June 30, 2021, the Portfolio did not have any portfolio securities on loan.
Prior to February 22, 2021, these services were provided by State Street Bank and Trust Company (“State Street”).
| 30 | MainStay VP Indexed Bond Portfolio |
(J) Dollar Rolls. The Portfolio may enter into dollar roll transactions in which it sells mortgage-backed securities ("MBS") from its portfolio to a counterparty from whom it simultaneously agrees to buy a similar security on a delayed delivery basis. The Portfolio generally transfers MBS where the MBS are "to be announced," therefore, the Portfolio accounts for these transactions as purchases and sales.
When accounted for as purchase and sales, the securities sold in connection with the dollar rolls are removed from the portfolio and a realized gain or loss is recognized. The securities the Portfolio has agreed to acquire are included at market value in the Portfolio of Investments and liabilities for such purchase commitments are included as payables for investments purchased. During the roll period, the Portfolio foregoes principal and interest paid on the securities. The Portfolio is compensated by the difference between the current sales price and the forward price for the future as well as by the earnings on the cash proceeds of the initial sale. Dollar rolls may be renewed without physical delivery of the securities subject to the contract. The Portfolio maintains liquid assets from its portfolio having a value not less than the repurchase price, including accrued interest. Dollar roll transactions involve certain risks, including the risk that the securities returned to the Portfolio at the end of the roll period, while substantially similar, could be inferior to what was initially sold to the counterparty.
(K) Debt Securities Risk. The ability of issuers of debt securities held by the Portfolio to meet their obligations may be affected by, among other things, economic or political developments in a specific country, industry or region. Debt securities are also subject to the risks associated with changes in interest rates.
Investments in the Portfolio are not guaranteed, even though some of the Portfolio’s underlying investments are guaranteed by the U.S. government or its agencies or instrumentalities. The principal risk of mortgage-related and asset-backed securities is that the underlying debt may be prepaid ahead of schedule, if interest rates fall, thereby reducing the value of the Portfolio’s investment. If interest rates rise, less of the debt may be prepaid and the Portfolio may lose money because the Portfolio may be unable to invest in higher yielding assets. The Portfolio is subject to interest-rate risk and can lose principal value when interest rates rise. Bonds are also subject to credit risk, in which the bond issuer may fail to pay interest and principal in a timely manner.
The Portfolio may invest in foreign debt securities, which carry certain risks that are in addition to the usual risks inherent in domestic instruments. These risks include those resulting from currency fluctuations, future adverse political or economic developments and possible imposition of currency exchange blockages or other foreign governmental laws or restrictions. These risks are likely to be greater in emerging markets than in developed markets.
(L) LIBOR Replacement Risk. The Portfolio may invest in certain debt securities, derivatives or other financial instruments that utilize the London Interbank Offered Rate ("LIBOR"), as a “benchmark” or “reference rate” for various interest rate calculations. The United Kingdom Financial
Conduct Authority, which regulates LIBOR, announced that after 2021 it will cease its active encouragement of banks to provide the quotations needed to sustain LIBOR. However, it is possible that certain LIBOR tenors may continue beyond 2021 and the most widely used LIBOR tenors may continue until mid-2023. As a result, it is anticipated that LIBOR will be discontinued or will no longer be sufficiently robust to be representative of its underlying market around that time. Although financial regulators and industry working groups have suggested alternative reference rates, such as European Interbank Offer Rate (“EURIBOR”), Sterling Overnight Interbank Average Rate (“SONIA”) and Secured Overnight Financing Rate (“SOFR”), there are challenges to converting certain contracts and transactions to a new benchmark and neither the full effects of the transition process nor its ultimate outcome is known. New York Life Investments is currently working to assess exposure and will modify contracts as necessary.
The elimination of LIBOR or changes to other reference rates or any other changes or reforms to the determination or supervision of reference rates could have an adverse impact on the market for, or value of, any securities or payments linked to those reference rates, which may adversely affect the Portfolio's performance and/or net asset value. Uncertainty and risk also remain regarding the willingness and ability of issuers and lenders to include revised provisions in new and existing contracts or instruments. Consequently, the transition away from LIBOR to other reference rates may lead to increased volatility and illiquidity in markets that are tied to LIBOR, fluctuations in values of LIBOR-related investments or investments in issuers that utilize LIBOR, increased difficulty in borrowing or refinancing and diminished effectiveness of hedging strategies, adversely affecting the Portfolio's performance. Furthermore, the risks associated with the expected discontinuation of LIBOR and transition may be exacerbated if the work necessary to effect an orderly transition to an alternative reference rate is not completed in a timely manner. Because the usefulness of LIBOR as a benchmark could deteriorate during the transition period, these effects could occur prior to the end of 2021 with respect to certain LIBOR tenors or mid-2023 for the remaining LIBOR tenors.
(M) Indemnifications. Under the Fund’s organizational documents, its officers and trustees are indemnified against certain liabilities that may arise out of performance of their duties to the Fund. Additionally, in the normal course of business, the Portfolio enters into contracts with third-party service providers that contain a variety of representations and warranties and that may provide general indemnifications. The Portfolio's maximum exposure under these arrangements is unknown, as this would involve future claims that may be made against the Portfolio that have not yet occurred. The Manager believes that the risk of loss in connection with these potential indemnification obligations is remote. However, there can be no assurance that material liabilities related to such obligations will not arise in the future, which could adversely impact the Portfolio.
Notes to Financial Statements (Unaudited) (continued)
(N) Quantitative Disclosure of Derivative Holdings. The following tables show additional disclosures related to the Portfolio's derivative and hedging activities, including how such activities are accounted for and their effect on the Portfolio's financial positions, performance and cash flows.
The Portfolio entered into futures contracts in order to hedge against anticipated changes in interest rates that might otherwise have an adverse effect upon the value of the Portfolio’s securities as well as help manage the duration and yield curve of the portfolio. These derivatives are not accounted for as hedging instruments.
Fair value of derivative instruments as of June 30, 2021:
| Asset Derivatives | Interest
Rate
Contracts
Risk | Total |
| Futures Contracts - Net Assets—Net unrealized appreciation on futures contracts (a) | $1,045,032 | $1,045,032 |
| Total Fair Value | $1,045,032 | $1,045,032 |
| (a) | Includes cumulative appreciation (depreciation) of futures contracts as reported in the Portfolio of Investments. Only current day’s variation margin is reported within the Statement of Assets and Liabilities. |
| Liability Derivatives | Interest
Rate
Contracts
Risk | Total |
| Futures Contracts - Net Assets—Net unrealized depreciation on futures contracts (a) | $(15,675) | $(15,675) |
| Total Fair Value | $(15,675) | $(15,675) |
| (a) | Includes cumulative appreciation (depreciation) of futures contracts as reported in the Portfolio of Investments. Only current day’s variation margin is reported within the Statement of Assets and Liabilities. |
The effect of derivative instruments on the Statement of Operations for the six-month period ended June 30, 2021:
| Net Realized Gain (Loss) from: | Interest
Rate
Contracts
Risk | Total |
| Futures Contracts | $(4,917,781) | $(4,917,781) |
| Total Net Realized Gain (Loss) | $(4,917,781) | $(4,917,781) |
| Net Change in Unrealized Appreciation (Depreciation) | Interest
Rate
Contracts
Risk | Total |
| Futures Contracts | $1,324,070 | $1,324,070 |
| Total Net Change in Unrealized Appreciation (Depreciation) | $1,324,070 | $1,324,070 |
| Average Notional Amount | Total |
| Futures Contracts Long | $ 59,696,461 |
| Futures Contracts Short | $(41,938,525) |
Note 3–Fees and Related Party Transactions
(A) Manager and Subadvisor. New York Life Investments, a registered investment adviser and an indirect, wholly-owned subsidiary of New York Life, serves as the Portfolio's Manager pursuant to an Amended and Restated Management Agreement ("Management Agreement"). The Manager provides offices, conducts clerical, recordkeeping and bookkeeping services and keeps most of the financial and accounting records required to be maintained by the Portfolio. Except for the portion of salaries and expenses that are the responsibility of the Portfolio, the Manager pays the salaries and expenses of all personnel affiliated with the Portfolio and certain operational expenses of the Portfolio. The Portfolio reimburses New York Life Investments in an amount equal to the portion of the compensation of the Chief Compliance Officer attributable to the Portfolio. NYL Investors LLC ("NYL Investors" or ''Subadvisor''), a registered investment adviser and a direct, wholly-owned subsidiary of New York Life, serves as Subadvisor to the Portfolio and is responsible for the day-to-day portfolio management of the Portfolio. Pursuant to the terms of a Subadvisory Agreement ("Subadvisory Agreement") between New York Life Investments and NYL Investors, New York Life Investments pays for the services of the Subadvisor.
Pursuant to the Management Agreement, the Fund pays the Manager, on behalf of the Portfolio, a monthly fee for the services performed and the facilities furnished at an annual rate of the Portfolio's average daily net assets as follows: 0.25% up to $1 billion; and 0.20% in excess of $1 billion. During the six-month period ended June 30, 2021, the effective management fee rate was 0.25% (exclusive of any applicable waivers/reimbursements).
New York Life Investments has contractually agreed to waive fees and/or reimburse expenses so that the Total Annual Portfolio Operating Expenses (excluding taxes, interest, litigation, extraordinary expenses, brokerage and other transaction expenses relating to the purchase or sale of portfolio investments and acquired (underlying) portfolio/fund fees and expenses) of Initial Class shares do not exceed 0.375% of the Portfolio's average daily net assets. This agreement will remain in effect until May 1, 2022, and shall renew automatically for one-year terms unless New York Life Investments provides written notice of termination prior to the start of the next term or upon approval of the Board.
During the six-month period ended June 30, 2021, New York Life Investments earned fees from the Portfolio in the amount of $758,640 and paid the Subadvisor fees in the amount of $379,299.
JPMorgan provides sub-administration and sub-accounting services to the Portfolio pursuant to an agreement with New York Life Investments. These services include calculating the daily NAVs of the Portfolio, maintaining the general ledger and sub-ledger accounts for the calculation of the Portfolio's NAVs, and assisting New York Life
| 32 | MainStay VP Indexed Bond Portfolio |
Investments in conducting various aspects of the Portfolio's administrative operations. For providing these services to the Portfolio, JPMorgan is compensated by New York Life Investments.
Prior to February 22, 2021, these services were provided by State Street Bank and Trust Company ("State Street").
Pursuant to an agreement between the Fund and New York Life Investments, New York Life Investments is responsible for providing or procuring certain regulatory reporting services for the Portfolio. The Portfolio will reimburse New York Life Investments for the actual costs incurred by New York Life Investments in connection with providing or procuring these services for the Portfolio.
Note 4-Federal Income Tax
As of June 30, 2021, the cost and unrealized appreciation (depreciation) of the Portfolio’s investment portfolio, including applicable derivative contracts and other financial instruments, as determined on a federal income tax basis, were as follows:
| | Federal Tax
Cost | Gross
Unrealized
Appreciation | Gross
Unrealized
(Depreciation) | Net
Unrealized
Appreciation/
(Depreciation) |
| Investments in Securities | $487,426,238 | $13,787,146 | $(1,362,570) | $12,424,576 |
During the year ended December 31, 2020, the tax character of distributions paid as reflected in the Statements of Changes in Net Assets was as follows:
| | 2020 |
| Distributions paid from: | |
| Ordinary Income | $13,265,500 |
Note 5–Custodian
JPMorgan is the custodian of cash and securities held by the Portfolio. Custodial fees are charged to the Portfolio based on the Portfolio's net assets and/or the market value of securities held by the Portfolio and the number of certain transactions incurred by the Portfolio.
Prior to February 22, 2021, these services were provided by State Street. The services provided by State Street were a direct expense of the Portfolio and are included in the Statement of Operations as Custodian fees which totaled $7,616 for the period January 1, 2021 through February 21, 2021.
Note 6–Line of Credit
The Portfolio and certain other funds managed by New York Life Investments maintain a line of credit with a syndicate of banks in order to secure a source of funds for temporary purposes to meet unanticipated or excessive redemption requests.
Effective July 27, 2021, under the credit agreement (the “Credit Agreement”), the aggregate commitment amount is $600,000,000 with an additional uncommitted amount of $100,000,000. The commitment fee is an annual rate of 0.15% of the average commitment amount payable quarterly, regardless of usage, to JPMorgan, who serves as the agent to the syndicate. The commitment fee is allocated among the Portfolio and certain other funds managed by New York Life Investments based upon their respective net assets and other factors. Interest on any revolving credit loan is charged based upon the Federal Funds Rate or the one-month London Interbank Offered Rate ("LIBOR"), whichever is higher. The Credit Agreement expires on July 26, 2022, although the Portfolio, certain other funds managed by New York Life Investments and the syndicate of banks may renew the Credit Agreement for an additional year on the same or different terms or enter into a credit agreement with a different syndicate of banks. Prior to July 27, 2021, the aggregate commitment amount and the commitment fee were the same as those under the current Credit Agreement. During the six-month period ended June 30, 2021, there were no borrowings made or outstanding with respect to the Portfolio under the Credit Agreement.
Note 7–Interfund Lending Program
Pursuant to an exemptive order issued by the SEC, the Portfolio, along with certain other funds managed by New York Life Investments, may participate in an interfund lending program. The interfund lending program provides an alternative credit facility that permits the Portfolio and certain other funds managed by New York Life Investments to lend or borrow money for temporary purposes directly to or from one another, subject to the conditions of the exemptive order. During the six-month period ended June 30, 2021, there were no interfund loans made or outstanding with respect to the Portfolio.
Note 8–Purchases and Sales of Securities (in 000’s)
During the six-month period ended June 30, 2021, purchases and sales of U.S. government securities were $315,673 and $448,713, respectively. Purchases and sales of securities, other than U.S. government securities and short-term securities, were $367,771 and $483,961 respectively.
Note 9–Capital Share Transactions
Transactions in capital shares for the six-month period ended June 30, 2021 and the year ended December 31, 2020, were as follows:
Notes to Financial Statements (Unaudited) (continued)
| Initial Class | Shares | Amount |
| Period ended June 30, 2021: | | |
| Shares sold | 761,489 | $ 8,297,914 |
| Shares redeemed | (24,695,160) | (272,661,483) |
| Net increase (decrease) | (23,933,671) | $(264,363,569) |
| Year ended December 31, 2020: | | |
| Shares sold | 41,854,751 | $ 468,357,354 |
| Shares issued to shareholders in reinvestment of distributions | 958,902 | 10,704,315 |
| Shares redeemed | (15,217,602) | (167,763,236) |
| Net increase (decrease) | 27,596,051 | $ 311,298,433 |
| |
| Service Class | Shares | Amount |
| Year ended December 31, 2020:(a) | | |
| Shares sold | 10,398,358 | $ 115,129,744 |
| Shares issued to shareholders in reinvestment of distributions | 230,808 | 2,561,185 |
| Shares redeemed | (21,661,578) | (241,512,093) |
| Net increase (decrease) | (11,032,412) | $(123,821,164) |
| (a) | Service Class liquidated on November 22, 2020 |
Note 10–Other Matters
An outbreak of COVID-19, first detected in December 2019, has developed into a global pandemic and has resulted in travel restrictions, closure of international borders, certain businesses and securities markets, restrictions on securities trading activities, prolonged quarantines, supply chain disruptions, and lower consumer demand, as well as general concern and uncertainty. The continued impact of COVID-19 and related new variants is uncertain and could further adversely affect the global economy, national economies, individual issuers and capital markets in unforeseeable ways and result in a substantial and extended economic downturn. Developments that disrupt global economies and financial markets, such as COVID-19, may magnify factors that affect the Portfolio's performance.
Note 11–Subsequent Events
In connection with the preparation of the financial statements of the Portfolio as of and for the six-month period ended June 30, 2021, events and transactions subsequent to June 30, 2021, through the date the financial statements were issued have been evaluated by the Manager for possible adjustment and/or disclosure. No subsequent events requiring financial statement adjustment or disclosure have been identified.
| 34 | MainStay VP Indexed Bond Portfolio |
Discussion of the Operation and Effectiveness of the Portfolio's Liquidity Risk Management Program (Unaudited)
In compliance with Rule 22e-4 under the Investment Company Act of 1940, as amended (the “Liquidity Rule”), the Portfolio has adopted and implemented a liquidity risk management program (the “Program”), which New York Life Investment Management LLC believes is reasonably designed to assess and manage the Portfolio's liquidity risk (the risk that the Portfolio could not meet requests to redeem shares issued by the Portfolio without significant dilution of remaining investors’ interests in the Portfolio). The Board of Trustees of MainStay VP Funds Trust (the "Board") designated New York Life Investment Management LLC as administrator of the Program (the “Administrator”). The Administrator has established a Liquidity Risk Management Committee to assist the Administrator in the implementation and day-to-day administration of the Program and to otherwise support the Administrator in fulfilling its responsibilities under the Program.
At a meeting of the Board held on March 8, 2021, the Administrator provided the Board with a written report addressing the Program’s operation and assessing its adequacy and effectiveness of implementation for the period from January 1, 2020 through December 31, 2020 (the "Review Period"), as required under the Liquidity Rule. The report noted that the Administrator concluded that (i) the Program operated effectively to assess and manage the Portfolio's liquidity risk, (ii) the Program has been adequately and effectively implemented to monitor and, as applicable, respond to the Portfolio's liquidity developments and (iii) the Portfolio's investment strategy continues to be appropriate for an open-end fund. In addition, the report discussed notable events that impacted liquidity risk during the Review Period, including the COVID-19 pandemic and the resulting economic shutdown.
In accordance with the Program, the Portfolio's liquidity risk is assessed no less frequently than annually taking into consideration certain factors, as applicable, such as (i) investment strategy and liquidity of portfolio investments, (ii) short-term and long-term cash flow projections and (iii) holdings of cash and cash equivalents, as well as borrowing arrangements and other funding sources. Certain factors are considered under both normal and reasonably foreseeable stressed conditions.
Each Portfolio portfolio investment is classified into one of four liquidity categories. The classification is based on a determination of the number of days it is reasonably expected to take to convert the investment into cash, or sell or dispose of the investment, in current market conditions without significantly changing the market value of the investment. The Administrator has delegated liquidity classification determinations to the Portfolio’s subadvisor, subject to appropriate oversight by the Administrator, and classification determinations are made by taking into account the Portfolio's reasonably anticipated trade size, various market, trading and investment-specific considerations, as well as market depth, and, in certain cases, third-party vendor data.
The Liquidity Rule requires portfolios that do not primarily hold assets that are highly liquid investments to adopt a minimum amount of net assets that must be invested in highly liquid investments that are assets (an “HLIM”). In addition, the Liquidity Rule limits a portfolio's investments in illiquid investments. Specifically, the Liquidity Rule prohibits acquisition of illiquid investments if doing so would result in a portfolio holding more than 15% of its net assets in illiquid investments that are assets. The Program includes provisions reasonably designed to determine, periodically review and comply with the HLIM requirement, as applicable, and to comply with the 15% limit on illiquid investments.
There can be no assurance that the Program will achieve its objectives under all circumstances in the future. Please refer to the Portfolio's prospectus for more information regarding the Portfolio's exposure to liquidity risk and other risks to which it may be subject.
Proxy Voting Record
The Portfolio is required to file with the SEC its proxy voting records for the 12-month period ending June 30 on Form N-PX. The Portfolio's most recent Form N-PX or proxy voting record is available free of charge upon request (i) by calling 800-598-2019; (ii) by visiting New York Life Investments’ website at https://www.nylinvestments.com/mainstay/
products-and-performance/mainstay-vp-funds-trust; or (iii) by visiting the SEC’s website at www.sec.gov.
Shareholder Reports and Quarterly Portfolio Disclosure
The Portfolio is required to file its complete schedule of portfolio holdings with the SEC 60 days after its first and third fiscal quarter on Form N-PORT. The Portfolio's holdings report is available free of charge upon request by calling 800-598-2019 or by visiting the SEC’s website at www.sec.gov.
This page intentionally left blank
This page intentionally left blank.
MainStay VP Portfolios
MainStay VP offers a wide range of Portfolios. The full array of MainStay VP offerings is listed here, with information about the manager, subadvisors, legal counsel, and independent registered public accounting firm.
Equity
MainStay VP Candriam Emerging Markets Equity Portfolio
MainStay VP Epoch U.S. Equity Yield Portfolio
MainStay VP Fidelity Institutional AM® Utilities Portfolio†
MainStay VP MacKay International Equity Portfolio
MainStay VP MacKay S&P 500 Index Portfolio
MainStay VP Natural Resources Portfolio
MainStay VP Small Cap Growth Portfolio
MainStay VP T. Rowe Price Equity Income Portfolio
MainStay VP Wellington Growth Portfolio
MainStay VP Wellington Mid Cap Portfolio
MainStay VP Wellington Small Cap Portfolio
MainStay VP Wellington U.S. Equity Portfolio
MainStay VP Winslow Large Cap Growth Portfolio
Mixed Asset
MainStay VP Balanced Portfolio
MainStay VP Income Builder Portfolio
MainStay VP Janus Henderson Balanced Portfolio
MainStay VP MacKay Convertible Portfolio
Income
MainStay VP Bond Portfolio
MainStay VP Floating Rate Portfolio
MainStay VP Indexed Bond Portfolio
MainStay VP MacKay Government Portfolio
MainStay VP MacKay High Yield Corporate Bond Portfolio
MainStay VP MacKay Strategic Bond Portfolio
MainStay VP PIMCO Real Return Portfolio
Money Market
MainStay VP U.S. Government Money Market Portfolio
Alternative
MainStay VP CBRE Global Infrastructure Portfolio
MainStay VP IQ Hedge Multi-Strategy Portfolio
Asset Allocation
MainStay VP Conservative Allocation Portfolio
MainStay VP Equity Allocation Portfolio
MainStay VP Growth Allocation Portfolio
MainStay VP Moderate Allocation Portfolio
Manager
New York Life Investment Management LLC
New York, New York
Subadvisors
Brown Advisory LLC
Baltimore, Maryland
Candriam Belgium S.A.*
Brussels, Belgium
CBRE Clarion Securities LLC
Radnor, Pennsylvania
Epoch Investment Partners, Inc.
New York, New York
FIAM LLC
Smithfield, Rhode Island
IndexIQ Advisors LLC*
New York, New York
Janus Capital Management LLC
Denver, Colorado
MacKay Shields LLC*
New York, New York
Mellon Investments Corporation
Boston, Massachusetts
NYL Investors LLC*
New York, New York
Pacific Investment Management Company LLC
Newport Beach, California
Segall Bryant & Hamill, LLC
Chicago, Illinois
T. Rowe Price Associates, Inc.
Baltimore, Maryland
Wellington Management Company LLP
Boston, Massachusetts
Winslow Capital Management, LLC
Minneapolis, Minnesota
Legal Counsel
Dechert LLP
Washington, District of Columbia
Independent Registered Public Accounting Firm
PricewaterhouseCoopers LLP
New York, New York
Distributor
NYLIFE Distributors LLC*
Jersey City, New Jersey
Custodian
JPMorgan Chase Bank, N.A.
New York, New York
Some Portfolios may not be available in all products.
† Fidelity Institutional AM is a registered trade mark of FMR LLC. Used with permission.
* An affiliate of New York Life Investment Management LLC
Not part of the Semiannual Report
2021 Semiannual Report
This report is for the general information of New York Life Variable Annuities and NYLIAC Variable Universal Life Insurance Products policyowners. It must be preceded or accompanied by the appropriate product(s) and funds prospectuses if it is given to anyone who is not an owner of a New York Life variable annuity policy or a NYLIAC Variable Universal Life Insurance Product. This report does not offer for sale or solicit orders to purchase securities.
The performance data quoted in this report represents past performance. Past performance is no guarantee of future results. Due to market volatility and other factors, current performance may be lower or higher than the figures shown. The most recent month-end performance summary for your variable annuity or variable life policy is available by calling 800-598-2019 and is updated periodically on newyorklife.com.
The New York Life Variable Annuities and NYLIAC Variable Universal Life Insurance Products are issued by New York Life Insurance and Annuity Corporation (a Delaware Corporation) and distributed by NYLIFE Distributors LLC (Member FINRA/SIPC).
New York Life Insurance Company
New York Life Insurance and Annuity
Corporation (NYLIAC) (A Delaware Corporation)
51 Madison Avenue, Room 551
New York, NY 10010
newyorklife.com
nylinvestments.com
NYLIFE Distributors LLC, 30 Hudson Street, Jersey City, NJ 07302
New York Life Investment Management LLC is the investment manager to the MainStay VP Funds Trust
©2021 by NYLIFE Distributors LLC. All rights reserved.
You may obtain copies of the Prospectus and the Statement of Additional Information free of charge, upon request, by calling toll-free 800-598-2019 or writing to New York Life Insurance and Annuity Corporation, 51 Madison Avenue, New York, NY 10010.
| Not FDIC Insured | No Bank Guarantee | May Lose Value |
(NYLIAC) NI555
MainStay VP Janus Henderson Balanced Portfolio
Message from the President and Semiannual Report
Unaudited | June 30, 2021
Sign up for e-delivery of your shareholder reports. For full details on e-delivery, including who can participate and what you can receive via e-delivery,
please log in to newyorklifeinvestments.com/accounts.
| Not FDIC/NCUA Insured | Not a Deposit | May Lose Value | No Bank Guarantee | Not Insured by Any Government Agency |
This page intentionally left blank
Message from the President
The COVID-19 pandemic continued to afflict our personal lives and broad segments of the U.S. and global economy throughout the six-month reporting period ended June 30, 2021. However, with the deployment of multiple vaccines around the world, including three highly effective versions approved for emergency use in the United States, investors began to turn their attention toward the gradual reopening of the economy and the shape the “new normal” would take.
The first half of the reporting period saw increasing inflationary concerns as fiscal stimulus business reopenings drove accelerating economic growth, rising commodity prices and increased consumer spending. However, the U.S. Federal Reserve noted that price increases were likely to prove temporary and made clear their intention to remain accommodative for the foreseeable future. Accordingly, after moving higher in the first quarter of 2021, interest rates declined in the second quarter.
In response to the uncertain inflation outlook, equity market leadership shifted from value in the first quarter of the year to growth in the second quarter. Nevertheless, investor sentiment remained buoyant throughout the reporting period, with all eleven sectors in the S&P 500® Index, a widely regarded benchmark of market performance, producing positive returns. Energy led the market’s rise fueled by rapidly increasing oil and gas prices, followed by financials and real estate, which benefited from rising interest rates and the economic reopening, respectively. Communication services produced the slowest growth, followed by the traditionally defensive utilities and consumer staples
sectors. In the fixed income market, lower-credit-quality issues tended to outperform their higher-grade counterparts, with high-yield corporate bonds generating the strongest performance. Among securitized products, commercial mortgage-backed securities generally produced the strongest returns, followed by mortgage-backed securities and asset-backed securities, while Treasury securities lagged.
Despite the tremendous progress we’ve seen so far this year, the United States and the world continue to face significant pandemic-related challenges. Newer, more contagious variants of COVID-19 threaten the return of restrictions and lockdowns that could stall the economic recovery. At the same time, supply chain shortages have led to rising prices on everything from laptops to autos, stoking fears of uncontrolled inflation despite reassurance from the U.S. Federal Reserve. At New York Life Investments, we recognize that the shape that the “new normal” eventually takes may differ from our expectations. You can depend on us to keep a sharp watch for the unexpected, and to continue to help you find your way through this rapidly evolving investment landscape.
Sincerely,
Kirk C. Lehneis
President
The opinions expressed are as of the date of this report and are subject to change. There is no guarantee that any forecast made will come to pass. This material does not constitute investment advice and is not intended as an endorsement of any specific investment. Past performance is no guarantee of future results.
Not part of the Semiannual Report
Investors should refer to the Portfolio’s Summary Prospectus and/or Prospectus and consider the Portfolio’s investment objectives, strategies, risks, charges and expenses carefully before investing. The Summary Prospectus and/or Prospectus contain this and other information about the Portfolio. You may obtain copies of the Portfolio’s Summary Prospectus and/or the Prospectus and the Statement of Additional Information free of charge, upon request, by calling toll-free 800-598-2019, by writing to New York Life Insurance and Annuity Corporation, 51 Madison Avenue, Room 251, New York, New York 10010 or by sending an email to MainStayShareholdersServices@nylim.com. These documents are also available at nylinvestments.com/vpdocuments. Please read the Portfolio's Summary Prospectus and/or Prospectus carefully before investing. MainStay VP Funds Trust portfolios are separate account options which are purchased through a variable insurance or variable annuity contract.
Investment and Performance Comparison (Unaudited)
Performance data quoted represents past performance. Past performance is no guarantee of future results. Because of market volatility and other factors, current performance may be lower or higher than the figures shown. Investment return and principal value will fluctuate, and as a result, when shares are redeemed, they may be worth more or less than their original cost. The performance table and graph do not reflect any deduction of sales charges, mortality and expense charges, contract charges or administrative charges. Please refer to the Performance Summary appropriate for your policy. For performance information current to the most recent month-end, please call 800-598-2019 or visit www.newyorklife.com.
Performance figures may reflect certain fee waivers and/or expense limitations, without which total returns may have been different. For information on current fee waivers and/or expense limitations (if any), please refer to the Notes to Financial Statements.
| Average Annual Total Returns for the Period-Ended June 30, 2021 |
| Class | Inception
Date | Six
Months | One
Year | Five
Years | Since
Inception | Gross
Expense
Ratio1 |
| Initial Class Shares | 2/17/2012 | 8.67% | 24.53% | 13.78% | 10.90% | 0.58% |
| Service Class Shares | 2/17/2012 | 8.53 | 24.21 | 13.50 | 10.62 | 0.83 |
| 1. | The gross expense ratios presented reflect the Portfolio’s “Total Annual Portfolio Operating Expenses” from the most recent Prospectus, as supplemented, and may differ from other expense ratios disclosed in this report. |
| Benchmark Performance | Six
Months | One
Year | Five
Years | Since
Inception |
| S&P 500® Index1 | 15.25% | 40.79% | 17.65% | 15.37% |
| Bloomberg Barclays U.S. Aggregate Bond Index2 | -1.60 | -0.33 | 3.03 | 3.04 |
| Janus Balanced Composite Index3 | 7.43 | 20.92 | 11.16 | 9.91 |
| Morningstar Allocation—50% to 70% Equity Category Average4 | 9.54 | 26.62 | 10.00 | 8.29 |
| 1. | The S&P 500® Index is the Portfolio’s primary benchmark. "S&P 500®" is a trademark of The McGraw-Hill Companies, Inc. The S&P 500® Index is widely regarded as the standard index for measuring large-cap U.S. stock market performance. Results assume reinvestment of all dividends and capital gains. An investment cannot be made directly in an index. |
| 2. | The Portfolio has selected the Bloomberg Barclays U.S. Aggregate Bond Index as a secondary benchmark. The Bloomberg Barclays U.S. Aggregate Bond Index is a broad-based benchmark that measures performance of the investment-grade, U.S. dollar denominated, fixed-rate taxable bond market, including Treasurys, government-related and corporate securities, mortgage-backed securities (agency fixed-rate and hybrid adjustable-rate mortgage pass-throughs), asset-backed securities and commercial mortgage-backed securities. Results assume reinvestment of all dividends and capital gains. An investment cannot be made directly in an index. |
| 3. | The Portfolio has selected the Janus Balanced Composite Index as an additional benchmark. The Janus Balanced Composite Index consists of the S&P 500® Index and the Bloomberg Barclays U.S. Aggregate Bond Index weighted 55% / 45%, respectively. Results assume reinvestment of all dividends and capital gains. An investment cannot be made directly in an index. |
| 4. | The Morningstar Allocation – 50% to 70% Equity Category Average is representative of funds that seek to provide both income and capital appreciation by investing in multiple asset classes, including stocks, bonds, and cash. These funds are dominated by domestic holdings and have equity exposures between 50% and 70%. Results are based on average total returns of similar funds with all dividends and capital gain distributions reinvested. |
Cost in Dollars of a $1,000 Investment in MainStay VP Janus Henderson Balanced Portfolio (Unaudited)
The example below is intended to describe the fees and expenses borne by shareholders during the six-month period from January 1, 2021 to June 30, 2021, and the impact of those costs on your investment.
Example
As a shareholder of the Portfolio you incur two types of costs: (1) transaction costs, including exchange fees and sales charges (loads) on purchases (as applicable), and (2) ongoing costs, including management fees, distribution and/or service (12b-1) fees, and other Portfolio expenses (as applicable). This example is intended to help you understand your ongoing costs (in dollars) of investing in the Portfolio and to compare these costs with the ongoing costs of investing in other mutual funds. The example is based on an investment of $1,000 made at the beginning of the six-month period and held for the entire period from January 1, 2021 to June 30, 2021. Shares are only sold in connection with variable life and annuity contracts and the example does not reflect any contract level or transactional fees or expenses. If these costs had been included, your costs would have been higher.
This example illustrates your Portfolio’s ongoing costs in two ways:
Actual Expenses
The second and third data columns in the table below provide information about actual account values and actual expenses. You may use the information in these columns, together with the amount you invested, to estimate the expenses that you paid during the six months ended June
30, 2021. Simply divide your account value by $1,000 (for example, an $8,600 account value divided by $1,000 = 8.6), then multiply the result by the number under the heading entitled “Expenses Paid During Period” to estimate the expenses you paid on your account during this period.
Hypothetical Example for Comparison Purposes
The fourth and fifth data columns in the table below provide information about hypothetical account values and hypothetical expenses based on the Portfolio’s actual expense ratio and an assumed rate of return of 5% per year before expenses, which is not the Portfolio’s actual return. The hypothetical account values and expenses may not be used to estimate the actual ending account balances or expenses you paid for the six-month period shown. You may use this information to compare the ongoing costs of investing in the Portfolio with the ongoing costs of investing in other mutual funds. To do so, compare this 5% hypothetical example with the 5% hypothetical examples that appear in the shareholder reports of the other mutual funds.
Please note that the expenses shown in the table are meant to highlight your ongoing costs only and do not reflect any transactional costs, such as exchange fees or sales charges (loads). Therefore, the fourth and fifth data columns of the table are useful in comparing ongoing costs only and will not help you determine the relative total costs of owning different funds. In addition, if these transactional costs were included, your costs would have been higher.
| Share Class | Beginning
Account
Value
1/1/21 | Ending Account
Value (Based
on Actual
Returns and
Expenses)
6/30/21 | Expenses
Paid
During
Period1 | Ending Account
Value (Based
on Hypothetical
5% Annualized
Return and
Actual Expenses)
6/30/21 | Expenses
Paid
During
Period1 | Net Expense
Ratio
During
Period2 |
| Initial Class Shares | $1,000.00 | $1,086.70 | $2.95 | $1,021.97 | $2.86 | 0.57% |
| Service Class Shares | $1,000.00 | $1,085.30 | $4.24 | $1,020.73 | $4.11 | 0.82% |
| 1. | Expenses are equal to the Portfolio’s annualized expense ratio of each class multiplied by the average account value over the period, divided by 365 and multiplied by 181 (to reflect the six-month period). The table above represents the actual expenses incurred during the six-month period. In addition to the fees and expenses which the Portfolio bears directly, it also indirectly bears a pro rata share of the fees and expenses of the underlying funds in which it invests. Such indirect expenses are not included in the above-reported expense figures. |
| 2. | Expenses are equal to the Portfolio's annualized expense ratio to reflect the six-month period. |
| 6 | MainStay VP Janus Henderson Balanced Portfolio |
Portfolio Composition as of June 30, 2021 (Unaudited)
See Portfolio of Investments beginning on page 11 for specific holdings within these categories. The Portfolio's holdings are subject to change.
Top Ten Holdings or Issuers Held as of June 30, 2021 (excluding short-term investments) (Unaudited)
| 1. | U.S. Treasury Notes, 0.125%-1.625%, due 2/28/23–5/15/31 |
| 2. | Microsoft Corp. |
| 3. | Alphabet, Inc., Class C |
| 4. | Apple, Inc. |
| 5. | Amazon.com, Inc. |
| 6. | U.S. Treasury Bonds, 1.125%-2.75%, due 5/15/40–2/15/51 |
| 7. | Mastercard, Inc., Class A |
| 8. | UnitedHealth Group, Inc. |
| 9. | Adobe, Inc. |
| 10. | Bank of America Corp. |
Portfolio Management Discussion and Analysis (Unaudited)
Answers to the questions reflect the views of portfolio managers Jeremiah Buckley, CFA, E. Marc Pinto, CFA,1 Greg Wilensky and Michael Keough of Janus Capital Management LLC (“Janus Capital”), the Portfolio’s Subadvisor.
How did MainStay VP Janus Henderson Balanced Portfolio perform relative to its benchmarks and peers during the six months ended June 30, 2021?
For the six months ended June 30, 2021, MainStay VP Janus Henderson Balanced Portfolio returned 8.67% for Initial Class shares and 8.53% for Service Class shares. Over the same period, both share classes underperformed the 15.25% return of the S&P 500® Index, which is the Portfolio’s primary benchmark, and outperformed the −1.60% return of the Bloomberg Barclays U.S. Aggregate Bond Index, which is a secondary benchmark of the Portfolio. For the six months ended June 30, 2021, both share classes outperformed the 7.43% return of the Janus Balanced Composite Index, which is an additional benchmark of the Portfolio, and underperformed the 9.54% return of the Morningstar Allocation—50% to 70% Equity Category Average.2
What factors affected the Portfolio’s performance relative to its primary prospectus benchmark during the reporting period?
Performance relative to the S&P 500® Index suffered given the Portfolio’s allocation to bonds during a period in which equities generated robust returns. The equity portion of the Portfolio also underperformed the Index. The Portfolio’s zero weight in the benchmark-leading energy sector was among the largest detractors from relative results as oil prices continued to improve.
Relative to the Janus Balanced Composite Index, a blended benchmark of the S&P 500® Index (55%) and the Bloomberg Barclays U.S. Aggregate Bond Index (45%), the Portfolio’s outperformance was driven by the Portfolio’s ability to dynamically adjust its allocations with changing market conditions. Specifically, we increased the Portfolio’s allocation to equities to its mandated 65% limit early in the reporting period. On average, 65% of the Portfolio was invested in stocks throughout the reporting period (based on month-end data). This positioning reflected our belief that equities offered greater risk-adjusted opportunities than fixed-income securities as the U.S. economy reopened.
The fixed-income portion of the Portfolio outperformed the Bloomberg Barclays U.S. Aggregate Bond Index largely due to allocation decisions, including an out-of-index allocation to high-yield corporate credit and underweight exposure to mortgage-backed securities (MBS). Security selection in asset-backed securities (ABS) also aided relative results.
During the reporting period, which sectors were the strongest positive contributors to relative performance in the equity portion of the Portfolio and which sectors were particularly weak?
Among sectors held in the equity portion of the Portfolio, the strongest positive contribution to performance relative to the S&P
500® Index came from information technology, where stock selection bolstered returns. (Contributions take weightings and total returns into account.) Stock selection also made industrials the second-strongest contributing sector held in the Portfolio, while health care was the third strongest. Relative performance also benefited significantly from the Portfolio’s complete lack of exposure to the lagging utilities sector throughout the reporting period.
Conversely, lack of exposure to the benchmark-leading energy sector was the single most significant detractor from the Portfolio’s relative performance. Although oil prices improved, disappointing returns on invested capital and a lack of control over supply generally led us to avoid the industry. We also expected widespread focus on reducing carbon usage to challenge the sector. Stock selection and an underweight allocation led to the financials sector being the weakest contributing sector held in the Portfolio, followed by consumer staples.
During the reporting period, which individual stocks made the strongest positive contributions to the absolute performance of the equity portion of the Portfolio and which individual stocks detracted the most?
Holdings in Alphabet, the parent company of Internet search and advertising company Google, was the strongest positive contributor to the absolute performance of the equity portion of the Portfolio. The company reported continued strength in its cloud, digital advertising and YouTube segments. Alphabet’s solid balance sheet and free cash flows also enabled it to continue buying back its shares during the reporting period.
Shares in software company Microsoft made the second-strongest positive contribution to absolute performance. The COVID-19 pandemic accelerated the digital transformation affecting virtually every aspect of business, and companies offering services and products relevant to this shift in technology and capital spending were rewarded by the market. Microsoft reported strong user growth in its Azure cloud platform and subscription-based Office 365 suite.
Holdings in graphics and networking-related semiconductor maker NVIDIA made the third-strongest positive contribution to absolute performance. Continued strength in the gaming and data-center end markets drove robust demand for NVIDIA’s graphics processing units (GPUs), and the market continued to recognize the company’s industry-leading innovation in processors and related software.
The weakest contribution to the Portfolio’s absolute performance came from holdings in wireless technology company Qualcomm, which generated negative returns. We sold the position due to concerns over the maturity of the 5G chipset market, as well as
| 1. | As of April 2, 2021, Mr. Pinto no longer served as portfolio manager for the Portfolio. |
| 2. | See page 5 for more information on benchmark and peer group returns. |
| 8 | MainStay VP Janus Henderson Balanced Portfolio |
the trend for some of the company’s customers to insource phone components previously supplied by Qualcomm.
Shares in telecommunications company T-Mobile produced the second-weakest contribution to absolute performance, generating negative returns. We sold the Portfolio’s position due to concerns over the company’s return on invested capital and our desire to reallocate the assets into other, higher-conviction ideas.
A position in media and entertainment company The Walt Disney Company was the third-weakest contributor to absolute performance, also generating negative returns. Subscriber growth for the company’s Disney+ streaming platform fell short of analysts’ expectations, which negatively impacted the stock.
Did the equity portion of the Portfolio make any significant purchases or sales during the reporting period?
The equity portion of the Portfolio initiated a position in Aptiv, a global technology company serving the automotive sector. We believe the company is well positioned to supply parts, software and systems integration techniques to electric vehicle manufacturers. The Portfolio also initiated a position in computer software company Cadence Design Systems amid the first quarter 2021 sell-off in higher-growth names. We believe that—as the leader in electronic design automation, which enables semiconductors to get smaller in chip size—Cadence is well positioned as the digital transformation of the economy continues.
The equity portion of the Portfolio sold its position in pharmaceutical company Bristol-Myers Squibb during the reporting period. We became less confident in the company’s drug pipeline compared to other pharmaceutical companies and decided to rotate from Bristol Myers into what we deemed a more robust investment opportunity in AstraZeneca. The Portfolio also sold its position in Qualcomm for the reasons described above.
How did sector weightings change in the equity portion of the Portfolio during the reporting period?
During the reporting period, the equity portion of the Portfolio increased its exposure to industrials, communication services and
financials, while decreasing its exposure to health care, real estate and consumer staples.
How was the equity portion of the Portfolio positioned at the end of the reporting period?
As of June 30, 2021, the largest overweight sector position in the equity portion of the Portfolio was in information technology, followed by consumer discretionary. As of the same date, the most significantly underweight position in the equity portion of the Portfolio was in real estate, followed by materials. As of June 30, 2021, the Portfolio did not hold stocks in the energy or utilities sectors.
What was the duration3 strategy of the fixed-income portion of the Portfolio during the reporting period?
As of June 30, 2021, the duration of the fixed-income portion of the Portfolio was 5.73 years, or approximately 88% of the duration of the Bloomberg Barclays U.S. Aggregate Bond Index. We began reducing the Portfolio’s duration after the Democratic Party gained control of the U.S. Senate in early January 2021, expecting additional fiscal stimulus could lead to rising interest rates. We reduced duration further as both pandemic-related news and the economic outlook improved, while benchmark duration crept higher. Overall, the duration of the fixed-income portion of the Portfolio fell by approximately one year relative to the Index, a significant reduction in interest rate exposure.
Treasury yields rose quickly through the first half of the reporting period as faster-than-expected vaccine delivery heightened expectations regarding the pace of the economic recovery. The Biden administration’s $1.9 trillion stimulus plan also contributed to the sell-off in rates. Longer-dated yields then fell toward the end of the period as inflation concerns moderated. Ultimately, positioning relative to the U.S. Treasury yield curve4 detracted from the Portfolio’s relative results particularly when the curve steepened, with long Treasury holdings being most impacted. However, underweight exposure to Treasury securities and out-of-index exposure to TIPS (Treasury Inflation-Protected Securities) helped offset some of those losses.
| 3. | Duration is a measure of the price sensitivity of a fixed-income investment to changes in interest rates. Duration is expressed as a number of years and is considered a more accurate sensitivity gauge than average maturity. |
| 4. | The yield curve is a line that plots the yields of various securities of similar quality—typically U.S. Treasury issues—across a range of maturities. The U.S. Treasury yield curve serves as a benchmark for other debt and is used in economic forecasting. |
During the reporting period, which market segments made the strongest positive contributions to the performance of the fixed-income portion of the Portfolio and which market segments were particularly weak?
The fixed-income portion of the Portfolio’s out-of-index allocation to high-yield corporate bonds performed well as the economic outlook continued to improve and investors’ demand for yield remained intact. Out-of-index exposure to TIPS also provided strongly positive contributions to performance as we adjusted positioning with the ebb and flow of inflation expectations. Underweight exposure to MBS further bolstered relative performance, particularly as spreads5 widened in the latter half of the reporting period.
The lack of exposure to government-related securities was a modest detractor. A small cash balance also held back returns.
Did the fixed-income portion of the Portfolio make any significant purchases or sales during the reporting period?
The largest asset allocation changes to the fixed-income portion of the Portfolio involved trimming corporate credit exposure, particularly holdings in the lowest tier of the investment-grade market. Instead, we sought opportunities for credit diversification across the securitized markets, in bank loans and in TIPS.
During the reporting period, how did sector (or industry) weightings change in the fixed-income portion of the Portfolio?
On a corporate industry basis, the fixed-income portion of the Portfolio decreased its exposure to banking and technology while increasing exposure to finance companies. The Portfolio also increased its allocation to CMBS.
How was the fixed-income portion of the Portfolio positioned at the end of the reporting period?
As of June 30, 2021, relative to the Bloomberg Barclays U.S. Aggregate Bond Index, the fixed-income portion of the Portfolio held underweight exposure to U.S. Treasury securities and MBS. It also had no exposure to government-related securities. As of the same date, the Portfolio held overweight exposure to corporate credit, CMBS and ABS, and held out-of-benchmark positions in high-yield corporate credit, collateralized mortgage obligations, bank loans, TIPS and cash.
| 5. | The terms “spread” and “yield spread” may refer to the difference in yield between a security or type of security and comparable U.S. Treasury issues. The terms may also refer to the difference in yield between two specific securities or types of securities at a given time. |
The opinions expressed are those of the portfolio managers as of the date of this report and are subject to change. There is no guarantee that any forecasts will come to pass. This material does not constitute investment advice and is not intended as an endorsement of any specific investment.
Not all MainStay VP Portfolios and/or share classes are available under all policies.
| 10 | MainStay VP Janus Henderson Balanced Portfolio |
Portfolio of Investments June 30, 2021† (Unaudited)
| | Principal
Amount | Value |
| Long-Term Bonds 34.4% |
| Asset-Backed Securities 2.1% |
| Automobile Asset-Backed Securities 0.5% |
| CarMax Auto Owner Trust | |
| Series 2017-3, Class C | | |
| 2.72%, due 5/15/23 | $ 642,000 | $ 644,970 |
| Chase Auto Credit Linked Notes | |
| Series 2021-1, Class B | | |
| 0.875%, due 9/25/28 (a) | 519,000 | 519,380 |
| Credit Acceptance Auto Loan Trust | |
| Series 2018-2A, Class B | | |
| 3.94%, due 7/15/27 (a) | 85,425 | 85,575 |
| Drive Auto Receivables Trust | |
| Series 2017-3, Class D | | |
| 3.53%, due 12/15/23 (a) | 53,222 | 53,705 |
| Series 2018-4, Class C | | |
| 3.66%, due 11/15/24 | 7,297 | 7,307 |
| Series 2017-1, Class E | | |
| 5.17%, due 9/16/24 | 1,590,000 | 1,610,575 |
| Series 2017-2, Class E | | |
| 5.27%, due 11/15/24 | 1,400,000 | 1,427,477 |
| Exeter Automobile Receivables Trust | |
| Series 2021-1A, Class C | | |
| 0.74%, due 1/15/26 | 211,000 | 210,871 |
| Series 2021-1A, Class D | | |
| 1.08%, due 11/16/26 | 674,000 | 670,170 |
| OneMain Direct Auto Receivables Trust (a) | |
| Series 2018-1A, Class C | | |
| 3.85%, due 10/14/25 | 181,000 | 183,210 |
| Series 2018-1A, Class D | | |
| 4.40%, due 1/14/28 | 180,000 | 182,418 |
| Santander Drive Auto Receivables Trust | |
| Series 2020-3, Class D | | |
| 1.64%, due 11/16/26 | 1,630,000 | 1,650,838 |
| Westlake Automobile Receivables Trust | |
| Series 2020-1A, Class D | | |
| 2.80%, due 6/16/25 (a) | 741,000 | 765,279 |
| | | 8,011,775 |
| Credit Card Asset-Backed Securities 0.1% |
| Mercury Financial Credit Card Master Trust | |
| Series 2021-1A, Class A | | |
| 1.54%, due 3/20/26 (a) | 842,000 | 844,543 |
| Newday Funding Master Issuer plc | |
| Series 2021-1A, Class A2 | | |
| 1.11% (SOFR + 1.10%), due 3/15/29 (a)(b) | 792,000 | 796,191 |
| | | 1,640,734 |
| | Principal
Amount | Value |
| |
| Other Asset-Backed Securities 1.5% |
| Arbys Funding LLC | |
| Series 2020-1A, Class A2 | | |
| 3.237%, due 7/30/50 (a) | $ 1,397,440 | $ 1,460,115 |
| CF Hippolyta LLC (a) | |
| Series 2021-1A, Class A1 | | |
| 1.53%, due 3/15/61 | 1,010,000 | 1,016,746 |
| Series 2021-1A, Class B1 | | |
| 1.98%, due 3/15/61 | 382,000 | 385,243 |
| DB Master Finance LLC (a) | |
| Series 2019-1A, Class A2I | | |
| 3.787%, due 5/20/49 | 459,810 | 465,774 |
| Series 2019-1A, Class A2II | | |
| 4.021%, due 5/20/49 | 253,485 | 267,510 |
| Series 2019-1A, Class A23 | | |
| 4.352%, due 5/20/49 | 367,455 | 405,861 |
| Diamond Infrastructure Funding LLC | |
| Series 2021-1A, Class A | | |
| 1.76%, due 4/15/49 (a) | 1,031,000 | 1,025,898 |
| Domino's Pizza Master Issuer LLC (a) | |
| Series 2019-1A, Class A2 | | |
| 3.668%, due 10/25/49 | 1,628,387 | 1,761,329 |
| Series 2018-1A, Class A2I | | |
| 4.116%, due 7/25/48 | 902,850 | 941,528 |
| Series 2017-1A, Class A23 | | |
| 4.118%, due 7/25/47 | 208,013 | 224,454 |
| Series 2018-1A, Class A2II | | |
| 4.328%, due 7/25/48 | 494,325 | 537,672 |
| Jack in the Box Funding LLC (a) | |
| Series 2019-1A, Class A2I | | |
| 3.982%, due 8/25/49 | 983,567 | 1,006,386 |
| Series 2019-1A, Class A2II | | |
| 4.476%, due 8/25/49 | 983,567 | 1,037,211 |
| Series 2019-1A, Class A23 | | |
| 4.97%, due 8/25/49 | 983,567 | 1,083,478 |
| Lakeview CDO LLC | |
| 1.827%, due 11/10/32 (c)(d) | 829,317 | 829,317 |
| Lakeview LLC | |
| Series 2020-CRT1 | | |
| 1.827%, due 7/10/32 (c)(d) | 27,065 | 27,065 |
| NRZ Excess Spread-Collateralized Notes | |
| Series 2020-PLS1, Class A | | |
| 3.844%, due 12/25/25 (a) | 393,254 | 396,958 |
| Oak Street Investment Grade Net Lease Fund | |
| Series 2020-1A, Class A1 | | |
| 1.85%, due 11/20/50 (a) | 829,475 | 841,496 |
| Planet Fitness Master Issuer LLC (a) | |
| Series 2019-1A, Class A2 | | |
| 3.858%, due 12/5/49 | 859,905 | 869,347 |
The notes to the financial statements are an integral part of, and should be read in conjunction with, the financial statements.
11
Portfolio of Investments June 30, 2021† (Unaudited) (continued)
| | Principal
Amount | Value |
| Asset-Backed Securities (continued) |
| Other Asset-Backed Securities (continued) |
| Planet Fitness Master Issuer LLC (a) (continued) | |
| Series 2018-1A, Class A2I | | |
| 4.262%, due 9/5/48 | $ 614,620 | $ 616,894 |
| PRPM LLC (a)(e) | |
| Series 2020-4, Class A1 | | |
| 2.951%, due 10/25/25 | 775,670 | 778,950 |
| Series 2020-1A, Class A1 | | |
| 2.981%, due 2/25/25 | 215,368 | 216,328 |
| Taco Bell Funding LLC (a) | |
| Series 2018-1A, Class A2I | | |
| 4.318%, due 11/25/48 | 655,200 | 656,602 |
| Series 2018-1A, Class A2II | | |
| 4.94%, due 11/25/48 | 507,975 | 573,351 |
| Series 2016-1A, Class A23 | | |
| 4.97%, due 5/25/46 | 489,600 | 528,680 |
| Vantage Data Centers LLC (a) | |
| Series 2020-1A, Class A2 | | |
| 1.645%, due 9/15/45 | 1,615,000 | 1,619,290 |
| Series 2020-2A, Class A2 | | |
| 1.992%, due 9/15/45 | 705,000 | 700,924 |
| VCAT LLC (a)(e) | |
| Series 2021-NPL1, Class A1 | | |
| 2.289%, due 12/26/50 | 378,326 | 379,319 |
| Series 2020-NPL1, Class A1 | | |
| 3.671%, due 8/25/50 | 376,685 | 378,509 |
| Wendy's Funding LLC (a) | |
| Series 2021-1A, Class A2I | | |
| 2.37%, due 6/15/51 | 434,000 | 437,772 |
| Series 2021-1A, Class A2II | | |
| 2.775%, due 6/15/51 | 505,000 | 509,626 |
| Series 2019-1A, Class A2I | | |
| 3.783%, due 6/15/49 | 490,455 | 523,320 |
| Series 2018-1A, Class A2II | | |
| 3.884%, due 3/15/48 | 87,815 | 93,387 |
| Wingstop Funding LLC | |
| Series 2020-1A, Class A2 | | |
| 2.841%, due 12/5/50 (a) | 813,960 | 844,166 |
| Zaxby's Funding LLC | |
| Series 2021-1A, Class A2 | | |
| 3.238%, due 7/30/51 (a) | 642,000 | 650,012 |
| | | 24,090,518 |
Total Asset-Backed Securities
(Cost $33,163,888) | | 33,743,027 |
| | Principal
Amount | Value |
| Corporate Bonds 13.5% |
| Aerospace & Defense 0.5% |
| Boeing Co. (The) | | |
| 2.196%, due 2/4/26 | $ 442,000 | $ 446,225 |
| 3.25%, due 2/1/28 | 472,000 | 500,362 |
| 3.625%, due 2/1/31 | 991,000 | 1,065,848 |
| 3.95%, due 8/1/59 | 599,000 | 626,694 |
| 4.508%, due 5/1/23 | 1,427,000 | 1,521,317 |
| 4.875%, due 5/1/25 | 460,000 | 515,416 |
| General Dynamics Corp. | | |
| 3.50%, due 4/1/27 | 456,000 | 505,936 |
| TransDigm, Inc. | | |
| 4.625%, due 1/15/29 (a) | 2,069,000 | 2,069,724 |
| | | 7,251,522 |
| Banks 2.9% |
| Bank of America Corp. (f) | | |
| 2.087%, due 6/14/29 | 1,528,000 | 1,540,364 |
| 2.592%, due 4/29/31 | 3,117,000 | 3,213,431 |
| 3.705%, due 4/24/28 | 1,598,000 | 1,767,039 |
| 3.97%, due 3/5/29 | 670,000 | 755,256 |
| Series U | | |
| 5.20%, due 6/1/23 (g)(h) | 443,000 | 460,831 |
| Series X | | |
| 6.25%, due 9/5/24 (g) | 1,172,000 | 1,296,525 |
| Bank of New York Mellon Corp. (The) | | |
| Series G | | |
| 4.70% (5 Year Treasury Constant Maturity Rate + 4.358%), due 9/20/25 (b)(g) | 2,024,000 | 2,208,690 |
| BNP Paribas SA (a) | | |
| 2.588% (5 Year Treasury Constant Maturity Rate + 2.05%), due 8/12/35 (b) | 1,692,000 | 1,652,937 |
| 2.819%, due 11/19/25 (f) | 227,000 | 238,836 |
| Citigroup, Inc. (f) | | |
| 3.887%, due 1/10/28 | 2,060,000 | 2,292,668 |
| 4.412%, due 3/31/31 | 1,635,000 | 1,909,136 |
| Series U | | |
| 5.00%, due 9/12/24 (g) | 559,000 | 585,049 |
| Series D | | |
| 5.35%, due 5/15/23 (g) | 537,000 | 557,146 |
| 5.95%, due 1/30/23 (g) | 890,000 | 935,706 |
| Series P | | |
| 5.95%, due 5/15/25 (g) | 584,000 | 639,159 |
| Series M | | |
| 6.30%, due 5/15/24 (g) | 123,000 | 132,311 |
| Credit Agricole SA | | |
| 1.907%, due 6/16/26 (a)(f) | 426,000 | 434,324 |
The notes to the financial statements are an integral part of, and should be read in conjunction with, the financial statements.
| 12 | MainStay VP Janus Henderson Balanced Portfolio |
| | Principal
Amount | Value |
| Corporate Bonds (continued) |
| Banks (continued) |
| First Republic Bank | | |
| 4.625%, due 2/13/47 | $ 391,000 | $ 495,926 |
| Goldman Sachs Group, Inc. (The) | | |
| 3.50%, due 4/1/25 | 2,399,000 | 2,602,669 |
| Series R | | |
| 4.95% (5 Year Treasury Constant Maturity Rate + 3.224%), due 2/10/25 (b)(g) | 368,000 | 393,341 |
| HSBC Holdings plc (f) | | |
| 1.589%, due 5/24/27 | 1,629,000 | 1,632,140 |
| 1.645%, due 4/18/26 | 700,000 | 709,385 |
| JPMorgan Chase & Co. (f) | | |
| 1.578%, due 4/22/27 | 1,421,000 | 1,428,362 |
| 2.083%, due 4/22/26 | 570,000 | 589,405 |
| 2.956%, due 5/13/31 | 3,100,000 | 3,256,571 |
| 3.96%, due 1/29/27 | 1,446,000 | 1,610,273 |
| Series HH | | |
| 4.60%, due 2/1/25 (g) | 466,000 | 482,916 |
| Series FF | | |
| 5.00%, due 8/1/24 (g) | 441,000 | 466,115 |
| Morgan Stanley | | |
| 1.593%, due 5/4/27 (f) | 685,000 | 689,847 |
| 1.794%, due 2/13/32 (f) | 1,226,000 | 1,177,956 |
| 2.188%, due 4/28/26 (f) | 1,521,000 | 1,579,257 |
| 3.95%, due 4/23/27 | 1,401,000 | 1,565,433 |
| 4.35%, due 9/8/26 | 898,000 | 1,016,775 |
| National Australia Bank Ltd. | | |
| 2.99%, due 5/21/31 (a) | 1,708,000 | 1,734,122 |
| Natwest Group plc | | |
| 3.032% (5 Year Treasury Constant Maturity Rate + 2.35%), due 11/28/35 (b) | 1,260,000 | 1,262,016 |
| SVB Financial Group | | |
| 1.80%, due 2/2/31 | 625,000 | 597,825 |
| 4.10% (10 Year Treasury Constant Maturity Rate + 3.064%), due 2/15/31 (b)(g) | 1,382,000 | 1,401,859 |
| Westpac Banking Corp. | | |
| 2.668% (5 Year Treasury Constant Maturity Rate + 1.75%), due 11/15/35 (b) | 1,218,000 | 1,198,049 |
| | | 46,509,650 |
| Beverages 0.2% |
| Anheuser-Busch Cos. LLC | | |
| 4.90%, due 2/1/46 | 919,000 | 1,163,224 |
| | Principal
Amount | Value |
| |
| Beverages (continued) |
| Coca-Cola Femsa SAB de CV | | |
| 2.75%, due 1/22/30 | $ 651,000 | $ 677,743 |
| Diageo Capital plc | | |
| 1.375%, due 9/29/25 | 757,000 | 769,410 |
| 2.00%, due 4/29/30 | 713,000 | 713,500 |
| 2.125%, due 4/29/32 | 572,000 | 574,420 |
| | | 3,898,297 |
| Biotechnology 0.1% |
| Royalty Pharma plc | | |
| 3.55%, due 9/2/50 (a) | 899,000 | 894,186 |
| Chemicals 0.2% |
| Axalta Coating Systems LLC | | |
| 3.375%, due 2/15/29 (a) | 1,696,000 | 1,657,840 |
| Element Solutions, Inc. | | |
| 3.875%, due 9/1/28 (a) | 1,338,000 | 1,365,161 |
| | | 3,023,001 |
| Commercial Services 0.4% |
| CoStar Group, Inc. | | |
| 2.80%, due 7/15/30 (a) | 1,339,000 | 1,360,238 |
| Experian Finance plc | | |
| 2.75%, due 3/8/30 (a) | 1,281,000 | 1,323,893 |
| Global Payments, Inc. | | |
| 4.80%, due 4/1/26 | 629,000 | 719,142 |
| IHS Markit Ltd. (a) | | |
| 4.75%, due 2/15/25 | 687,000 | 769,097 |
| 5.00%, due 11/1/22 | 119,000 | 124,657 |
| Service Corp. International | | |
| 3.375%, due 8/15/30 | 489,000 | 479,122 |
| 4.00%, due 5/15/31 | 1,156,000 | 1,179,900 |
| | | 5,956,049 |
| Computers 0.1% |
| Booz Allen Hamilton, Inc. | | |
| 3.875%, due 9/1/28 (a) | 1,244,000 | 1,268,880 |
| Seagate HDD Cayman | | |
| 3.125%, due 7/15/29 (a) | 206,000 | 199,596 |
| 4.091%, due 6/1/29 (a) | 350,000 | 358,330 |
| 4.125%, due 1/15/31 (a) | 361,000 | 368,220 |
| 4.875%, due 6/1/27 | 44,000 | 48,510 |
| | | 2,243,536 |
| Diversified Financial Services 0.8% |
| AerCap Ireland Capital DAC | | |
| 4.625%, due 10/15/27 | 1,147,000 | 1,284,564 |
| Air Lease Corp. | | |
| 1.875%, due 8/15/26 | 1,020,000 | 1,020,788 |
The notes to the financial statements are an integral part of, and should be read in conjunction with, the financial statements.
13
Portfolio of Investments June 30, 2021† (Unaudited) (continued)
| | Principal
Amount | Value |
| Corporate Bonds (continued) |
| Diversified Financial Services (continued) |
| Air Lease Corp. (continued) | | |
| 3.00%, due 2/1/30 | $ 515,000 | $ 522,377 |
| Ally Financial, Inc. | | |
| Series B | | |
| 4.70% (5 Year Treasury Constant Maturity Rate + 3.868%), due 5/15/26 (b)(g) | 1,176,000 | 1,217,983 |
| Charles Schwab Corp. (The) (b)(g) | | |
| Series H | | |
| 4.00% (10 Year Treasury Constant Maturity Rate + 3.079%), due 12/1/30 | 809,000 | 827,607 |
| Series G | | |
| 5.375% (5 Year Treasury Constant Maturity Rate + 4.971%), due 6/1/25 | 3,408,000 | 3,766,862 |
| GE Capital International Funding Co. Unlimited Co. | | |
| 4.418%, due 11/15/35 | 1,835,000 | 2,199,214 |
| Quicken Loans LLC (a) | | |
| 3.625%, due 3/1/29 | 1,013,000 | 1,000,338 |
| 3.875%, due 3/1/31 | 1,481,000 | 1,492,093 |
| | | 13,331,826 |
| Electric 0.5% |
| Dominion Energy, Inc. | | |
| Series C | | |
| 3.375%, due 4/1/30 | 1,199,000 | 1,305,604 |
| Duquesne Light Holdings, Inc. | | |
| 2.775%, due 1/7/32 (a) | 1,005,000 | 1,012,735 |
| NextEra Energy Capital Holdings, Inc. | | |
| 2.75%, due 5/1/25 | 629,000 | 668,039 |
| NRG Energy, Inc. | | |
| 3.375%, due 2/15/29 (a) | 1,057,000 | 1,034,560 |
| 3.625%, due 2/15/31 (a) | 1,195,000 | 1,174,326 |
| 6.625%, due 1/15/27 | 1,094,000 | 1,132,531 |
| 7.25%, due 5/15/26 | 1,111,000 | 1,151,668 |
| Pacific Gas and Electric Co. | | |
| 3.00%, due 6/15/28 | 1,185,000 | 1,190,330 |
| | | 8,669,793 |
| Electronics 0.2% |
| Sensata Technologies, Inc. | | |
| 3.75%, due 2/15/31 (a) | 469,000 | 463,761 |
| | Principal
Amount | Value |
| |
| Electronics (continued) |
| Trimble, Inc. | | |
| 4.75%, due 12/1/24 | $ 1,238,000 | $ 1,375,333 |
| 4.90%, due 6/15/28 | 672,000 | 788,141 |
| | | 2,627,235 |
| Engineering & Construction 0.1% |
| Cellnex Finance Co. SA | | |
| 3.875%, due 7/7/41 (a) | 1,182,000 | 1,178,407 |
| Food 0.5% |
| JBS Finance Luxembourg SARL | | |
| 3.625%, due 1/15/32 (a) | 784,000 | 783,757 |
| JBS USA LUX SA (a) | | |
| 3.75%, due 12/1/31 | 742,000 | 759,252 |
| 5.50%, due 1/15/30 | 1,208,000 | 1,351,003 |
| 6.50%, due 4/15/29 | 1,551,000 | 1,742,952 |
| 6.75%, due 2/15/28 | 612,000 | 672,435 |
| Kraft Heinz Foods Co. | | |
| 3.875%, due 5/15/27 | 991,000 | 1,088,884 |
| 4.375%, due 6/1/46 | 182,000 | 206,242 |
| 4.875%, due 10/1/49 | 424,000 | 514,715 |
| 5.00%, due 6/4/42 | 630,000 | 769,292 |
| Mondelez International, Inc. | | |
| 2.75%, due 4/13/30 | 173,000 | 182,228 |
| Sysco Corp. | | |
| 6.60%, due 4/1/50 | 314,000 | 487,756 |
| | | 8,558,516 |
| Food Service 0.1% |
| Aramark Services, Inc. | | |
| 6.375%, due 5/1/25 (a) | 1,470,000 | 1,561,875 |
| Gas 0.0% ‡ |
| East Ohio Gas Co. (The) | | |
| 2.00%, due 6/15/30 (a) | 152,000 | 150,269 |
| Healthcare-Services 1.1% |
| Centene Corp. | | |
| 2.45%, due 7/15/28 | 1,381,000 | 1,399,643 |
| 2.50%, due 3/1/31 | 337,000 | 332,366 |
| 3.00%, due 10/15/30 | 588,000 | 604,041 |
| 4.25%, due 12/15/27 | 1,112,000 | 1,171,770 |
| 5.375%, due 6/1/26 (a) | 1,510,000 | 1,577,950 |
| DaVita, Inc. (a) | | |
| 3.75%, due 2/15/31 | 1,295,000 | 1,243,200 |
| 4.625%, due 6/1/30 | 1,054,000 | 1,083,744 |
| HCA, Inc. | | |
| 3.50%, due 9/1/30 | 2,329,000 | 2,481,247 |
The notes to the financial statements are an integral part of, and should be read in conjunction with, the financial statements.
| 14 | MainStay VP Janus Henderson Balanced Portfolio |
| | Principal
Amount | Value |
| Corporate Bonds (continued) |
| Healthcare-Services (continued) |
| HCA, Inc. (continued) | | |
| 3.50%, due 7/15/51 (h) | $ 1,106,000 | $ 1,105,496 |
| 5.25%, due 6/15/49 | 339,000 | 432,121 |
| 5.375%, due 2/1/25 | 545,000 | 614,760 |
| 5.375%, due 9/1/26 | 220,000 | 253,165 |
| 5.50%, due 6/15/47 | 226,000 | 294,347 |
| 5.625%, due 9/1/28 | 310,000 | 367,350 |
| 5.875%, due 2/15/26 | 286,000 | 330,516 |
| 5.875%, due 2/1/29 | 459,000 | 554,242 |
| Molina Healthcare, Inc. | | |
| 4.375%, due 6/15/28 (a) | 2,834,000 | 2,954,445 |
| | | 16,800,403 |
| Home Builders 0.0% ‡ |
| MDC Holdings, Inc. | | |
| 5.50%, due 1/15/24 | 465,000 | 509,477 |
| Insurance 0.2% |
| Brown & Brown, Inc. | | |
| 2.375%, due 3/15/31 | 216,000 | 215,815 |
| 4.50%, due 3/15/29 | 451,000 | 518,764 |
| Prudential Financial, Inc. | | |
| 3.70% (5 Year Treasury Constant Maturity Rate + 3.035%), due 10/1/50 (b) | 1,777,000 | 1,852,523 |
| | | 2,587,102 |
| Internet 0.1% |
| Go Daddy Operating Co. LLC | | |
| 3.50%, due 3/1/29 (a) | 1,659,000 | 1,648,217 |
| Iron & Steel 0.1% |
| Allegheny Technologies, Inc. | | |
| 5.875%, due 12/1/27 (h) | 1,047,000 | 1,096,733 |
| Reliance Steel & Aluminum Co. | | |
| 4.50%, due 4/15/23 | 469,000 | 496,532 |
| | | 1,593,265 |
| Lodging 0.1% |
| Choice Hotels International, Inc. | | |
| 3.70%, due 12/1/29 | 817,000 | 884,411 |
| 3.70%, due 1/15/31 | 294,000 | 318,149 |
| MGM Resorts International | | |
| 7.75%, due 3/15/22 | 182,000 | 190,226 |
| | | 1,392,786 |
| | Principal
Amount | Value |
| |
| Machinery-Diversified 0.1% |
| Westinghouse Air Brake Technologies Corp. | | |
| 3.20%, due 6/15/25 | $ 584,000 | $ 621,084 |
| 4.40%, due 3/15/24 (e) | 662,000 | 717,269 |
| 4.95%, due 9/15/28 (e) | 659,000 | 764,431 |
| | | 2,102,784 |
| Media 0.9% |
| CCO Holdings LLC | | |
| 4.25%, due 2/1/31 (a) | 1,527,000 | 1,555,631 |
| 4.50%, due 5/1/32 | 2,216,000 | 2,296,330 |
| Charter Communications Operating LLC | | |
| 2.80%, due 4/1/31 | 811,000 | 829,095 |
| 4.80%, due 3/1/50 | 562,000 | 645,484 |
| 5.375%, due 5/1/47 | 205,000 | 251,209 |
| 6.484%, due 10/23/45 | 256,000 | 352,559 |
| Comcast Corp. | | |
| 3.75%, due 4/1/40 | 365,000 | 411,457 |
| CSC Holdings LLC (a) | | |
| 3.375%, due 2/15/31 | 926,000 | 874,987 |
| 4.125%, due 12/1/30 | 1,351,000 | 1,342,556 |
| 4.625%, due 12/1/30 | 1,204,000 | 1,181,256 |
| 5.00%, due 11/15/31 | 586,000 | 588,813 |
| Fox Corp. | | |
| 4.03%, due 1/25/24 | 429,000 | 464,741 |
| GCI LLC | | |
| 4.75%, due 10/15/28 (a) | 2,154,000 | 2,204,619 |
| Sirius XM Radio, Inc. | | |
| 4.125%, due 7/1/30 (a) | 1,625,000 | 1,639,430 |
| | | 14,638,167 |
| Miscellaneous—Manufacturing 0.1% |
| General Electric Co. | | |
| Series D | | |
| 3.449% (3 Month LIBOR + 3.33%), due 9/15/21 (b)(g) | 1,414,000 | 1,385,720 |
| Oil & Gas 0.1% |
| Continental Resources, Inc. | | |
| 5.75%, due 1/15/31 (a) | 1,214,000 | 1,453,765 |
| Pharmaceuticals 0.2% |
| CVS Health Corp. | | |
| 5.05%, due 3/25/48 | 617,000 | 801,406 |
| Elanco Animal Health, Inc. | | |
| 5.272%, due 8/28/23 (e) | 1,242,000 | 1,335,883 |
The notes to the financial statements are an integral part of, and should be read in conjunction with, the financial statements.
15
Portfolio of Investments June 30, 2021† (Unaudited) (continued)
| | Principal
Amount | Value |
| Corporate Bonds (continued) |
| Pharmaceuticals (continued) |
| Organon & Co. | | |
| 4.125%, due 4/30/28 (a) | $ 1,692,000 | $ 1,725,502 |
| | | 3,862,791 |
| Pipelines 0.5% |
| Cheniere Corpus Christi Holdings LLC | | |
| 3.70%, due 11/15/29 | 1,121,000 | 1,224,448 |
| Cheniere Energy Partners LP | | |
| 4.00%, due 3/1/31 (a) | 783,000 | 818,235 |
| Cheniere Energy, Inc. | | |
| 4.625%, due 10/15/28 (a) | 1,333,000 | 1,406,315 |
| Energy Transfer Operating LP | | |
| 4.95%, due 6/15/28 | 116,000 | 134,024 |
| 5.50%, due 6/1/27 | 159,000 | 186,473 |
| 5.875%, due 1/15/24 | 301,000 | 333,539 |
| Hess Midstream Operations LP | | |
| 5.125%, due 6/15/28 (a) | 1,336,000 | 1,401,130 |
| NGPL PipeCo LLC | | |
| 3.25%, due 7/15/31 (a) | 472,000 | 486,457 |
| ONEOK, Inc. | | |
| 6.35%, due 1/15/31 | 808,000 | 1,044,875 |
| 7.15%, due 1/15/51 | 211,000 | 310,187 |
| | | 7,345,683 |
| Real Estate 0.0% ‡ |
| Jones Lang LaSalle, Inc. | | |
| 4.40%, due 11/15/22 | 651,000 | 677,087 |
| Real Estate Investment Trusts 0.5% |
| Agree LP | | |
| 2.00%, due 6/15/28 | 684,000 | 678,373 |
| 2.60%, due 6/15/33 | 513,000 | 511,107 |
| 2.90%, due 10/1/30 | 473,000 | 493,520 |
| Crown Castle International Corp. | | |
| 3.10%, due 11/15/29 | 710,000 | 753,281 |
| 3.65%, due 9/1/27 | 548,000 | 604,221 |
| Equinix, Inc. | | |
| 2.15%, due 7/15/30 | 623,000 | 619,023 |
| GLP Capital LP | | |
| 4.00%, due 1/15/30 | 1,005,000 | 1,078,677 |
| 5.25%, due 6/1/25 | 361,000 | 406,360 |
| 5.30%, due 1/15/29 | 86,000 | 100,190 |
| 5.375%, due 4/15/26 | 381,000 | 438,535 |
| MPT Operating Partnership LP | | |
| 3.50%, due 3/15/31 | 1,099,000 | 1,109,979 |
| | Principal
Amount | Value |
| |
| Real Estate Investment Trusts (continued) |
| Sun Communities Operating LP | | |
| 2.70%, due 7/15/31 | $ 1,283,000 | $ 1,282,870 |
| | | 8,076,136 |
| Retail 0.5% |
| 1011778 BC ULC | | |
| 4.00%, due 10/15/30 (a) | 2,348,000 | 2,271,690 |
| Dollar General Corp. | | |
| 4.125%, due 4/3/50 | 762,000 | 892,658 |
| Lithia Motors, Inc. | | |
| 3.875%, due 6/1/29 (a) | 1,847,000 | 1,914,508 |
| Nordstrom, Inc. | | |
| 4.375%, due 4/1/30 | 846,000 | 881,533 |
| Yum! Brands, Inc. | | |
| 4.625%, due 1/31/32 | 1,198,000 | 1,257,900 |
| | | 7,218,289 |
| Semiconductors 1.2% |
| Analog Devices, Inc. | | |
| 2.95%, due 4/1/25 | 676,000 | 723,281 |
| Broadcom, Inc. | | |
| 3.419%, due 4/15/33 (a) | 1,071,000 | 1,124,726 |
| 3.469%, due 4/15/34 (a) | 1,686,000 | 1,783,374 |
| 4.15%, due 11/15/30 | 1,233,000 | 1,382,705 |
| 4.30%, due 11/15/32 | 986,000 | 1,122,783 |
| Marvell Technology, Inc. (a) | | |
| 1.65%, due 4/15/26 | 793,000 | 792,542 |
| 2.95%, due 4/15/31 | 1,256,000 | 1,301,682 |
| 4.20%, due 6/22/23 | 142,000 | 150,961 |
| 4.875%, due 6/22/28 | 883,000 | 1,020,749 |
| Microchip Technology, Inc. | | |
| 2.67%, due 9/1/23 | 1,514,000 | 1,576,861 |
| 4.25%, due 9/1/25 | 1,186,000 | 1,245,141 |
| Qorvo, Inc. | | |
| 3.375%, due 4/1/31 (a) | 1,333,000 | 1,389,279 |
| SK Hynix, Inc. (a) | | |
| 1.50%, due 1/19/26 | 1,067,000 | 1,052,510 |
| 2.375%, due 1/19/31 | 773,000 | 752,694 |
| Skyworks Solutions, Inc. | | |
| 0.90%, due 6/1/23 | 238,000 | 238,708 |
| 1.80%, due 6/1/26 | 371,000 | 375,674 |
| 3.00%, due 6/1/31 | 333,000 | 340,363 |
| TSMC Global Ltd. (a) | | |
| 1.25%, due 4/23/26 | 1,347,000 | 1,335,312 |
| 1.75%, due 4/23/28 | 1,360,000 | 1,359,619 |
| | | 19,068,964 |
The notes to the financial statements are an integral part of, and should be read in conjunction with, the financial statements.
| 16 | MainStay VP Janus Henderson Balanced Portfolio |
| | Principal
Amount | Value |
| Corporate Bonds (continued) |
| Software 0.3% |
| Broadridge Financial Solutions, Inc. | | |
| 2.60%, due 5/1/31 | $ 1,084,000 | $ 1,103,775 |
| MSCI, Inc. (a) | | |
| 3.625%, due 9/1/30 | 1,643,000 | 1,680,230 |
| 3.875%, due 2/15/31 | 1,122,000 | 1,164,367 |
| 4.00%, due 11/15/29 | 104,000 | 109,720 |
| Twilio, Inc. | | |
| 3.625%, due 3/15/29 | 471,000 | 480,420 |
| 3.875%, due 3/15/31 | 471,000 | 483,364 |
| | | 5,021,876 |
| Telecommunications 0.6% |
| AT&T, Inc. (a) | | |
| 3.65%, due 9/15/59 | 105,000 | 106,480 |
| 3.80%, due 12/1/57 | 642,000 | 668,889 |
| Level 3 Financing, Inc. | | |
| 3.875%, due 11/15/29 (a) | 956,000 | 1,023,905 |
| Lumen Technologies, Inc. | | |
| Series T | | |
| 5.80%, due 3/15/22 | 419,000 | 431,189 |
| Switch Ltd. | | |
| 4.125%, due 6/15/29 (a) | 866,000 | 888,732 |
| T-Mobile US, Inc. | | |
| 2.25%, due 2/15/26 | 647,000 | 651,852 |
| 2.625%, due 2/15/29 | 1,626,000 | 1,605,675 |
| 3.00%, due 2/15/41 | 686,000 | 677,542 |
| 3.50%, due 4/15/25 | 718,000 | 778,201 |
| 3.75%, due 4/15/27 | 990,000 | 1,093,950 |
| Verizon Communications, Inc. | | |
| 2.10%, due 3/22/28 | 389,000 | 397,136 |
| 3.00%, due 3/22/27 | 535,000 | 575,729 |
| 3.55%, due 3/22/51 | 658,000 | 702,985 |
| | | 9,602,265 |
| Toys, Games & Hobbies 0.2% |
| Hasbro, Inc. | | |
| 3.90%, due 11/19/29 | 1,867,000 | 2,075,881 |
| 5.10%, due 5/15/44 | 449,000 | 548,847 |
| 6.35%, due 3/15/40 | 420,000 | 585,549 |
| | | 3,210,277 |
| | Principal
Amount | Value |
| |
| Transportation 0.1% |
| GXO Logistics, Inc. (a) | | |
| 1.65%, due 7/15/26 | $ 885,000 | $ 880,540 |
| 2.65%, due 7/15/31 | 585,000 | 580,302 |
| | | 1,460,842 |
Total Corporate Bonds
(Cost $207,355,423) | | 215,510,058 |
| Loan Assignments 0.4% |
| Chemicals, Plastics & Rubber 0.1% |
| Alpha 3 B.V. | |
| Initial Dollar Term Loan | |
| 3.00% (3 Month LIBOR + 2.50%), due 3/18/28 (b) | 941,000 | 935,560 |
| Healthcare, Education & Childcare 0.1% |
| Elanco Animal Health, Inc. | |
| Term Loan | |
| 1.842% (1 Month LIBOR + 1.75%), due 8/1/27 (b) | 2,233,949 | 2,200,839 |
| Manufacturing 0.1% |
| Madison IAQ LLC | |
| Term Loan | |
| 3.75% (3 Month LIBOR + 3.25%), due 6/21/28 (b) | 1,526,204 | 1,526,586 |
| Services: Business 0.1% |
| ICON Luxembourg SARL | |
| Term Loan B | |
| TBD, due 7/1/28 | 1,962,000 | 1,965,679 |
| Term Loan B | |
| TBD, due 7/1/28 | 488,833 | 489,749 |
| | | 2,455,428 |
Total Loan Assignments
(Cost $7,135,528) | | 7,118,413 |
| Mortgage-Backed Securities 6.2% |
| Agency (Collateralized Mortgage Obligations) 2.6% |
| FNMA | |
| REMIC, Series 2018-27, Class EA | | |
| 3.00%, due 5/25/48 | 820,147 | 862,908 |
| REMIC, Series 2019-71, Class P | | |
| 3.00%, due 11/25/49 | 1,263,104 | 1,327,696 |
The notes to the financial statements are an integral part of, and should be read in conjunction with, the financial statements.
17
Portfolio of Investments June 30, 2021† (Unaudited) (continued)
| | Principal
Amount | Value |
| Mortgage-Backed Securities (continued) |
| Agency (Collateralized Mortgage Obligations) (continued) |
| GNMA II, Single Family, 30 Year (i) | |
| 2.00%, due 7/15/51 TBA | $ 8,805,569 | $ 8,967,922 |
| 2.50%, due 7/15/51 TBA | 4,969,800 | 5,142,967 |
| UMBS, Single Family, 15 Year (i) | |
| 1.50%, due 7/25/36 TBA | 404,515 | 409,390 |
| 2.00%, due 7/25/36 TBA | 2,603,869 | 2,685,698 |
| UMBS, Single Family, 30 Year (i) | |
| 2.00%, due 7/25/51 TBA | 6,776,402 | 6,842,048 |
| 2.50%, due 7/25/51 TBA | 10,495,769 | 10,855,741 |
| 3.50%, due 7/25/51 TBA | 4,190,000 | 4,410,384 |
| | | 41,504,754 |
| Commercial Mortgage Loans (Collateralized Mortgage Obligations) 2.3% |
| 280 Park Avenue Mortgage Trust | |
| Series 2017-280P, Class A | | |
| 0.953% (1 Month LIBOR + 0.88%), due 9/15/34 (a)(b) | 699,152 | 699,152 |
| BANK | |
| Series 2019-BN23, Class A3 | | |
| 2.92%, due 12/15/52 | 888,598 | 952,935 |
| Series 2019-BN24, Class A3 | | |
| 2.96%, due 11/15/62 | 218,800 | 235,521 |
| Series 2019-BN20, Class A3 | | |
| 3.011%, due 9/15/62 | 493,957 | 533,547 |
| Series 2019-BN18, Class A4 | | |
| 3.584%, due 5/15/62 | 1,026,801 | 1,148,472 |
| Series 2019-BN17, Class A4 | | |
| 3.714%, due 4/15/52 | 603,641 | 679,659 |
| Series 2018-BN12, Class A4 | | |
| 4.255%, due 5/15/61 (c) | 271,673 | 313,546 |
| BBCMS Mortgage Trust | |
| Series 2017-DELC, Class A | | |
| 0.923% (1 Month LIBOR + 0.85%), due 8/15/36 (a)(b) | 495,000 | 495,458 |
| BBCMS Trust | |
| Series 2015-SRCH, Class A2 | | |
| 4.197%, due 8/10/35 (a) | 875,000 | 991,963 |
| Benchmark Mortgage Trust | |
| Series 2020-B16, Class A5 | | |
| 2.732%, due 2/15/53 | 550,000 | 581,939 |
| BX Commercial Mortgage Trust (a)(b) | |
| Series 2018-IND, Class A | | |
| 0.823% (1 Month LIBOR + 0.75%), due 11/15/35 | 501,252 | 501,416 |
| Series 2019-XL, Class A | | |
| 0.993% (1 Month LIBOR + 0.92%), due 10/15/36 | 1,069,119 | 1,070,515 |
| | Principal
Amount | Value |
| |
| Commercial Mortgage Loans (Collateralized Mortgage Obligations) (continued) |
| BX Commercial Mortgage Trust (a)(b) (continued) | |
| Series 2020-FOX, Class A | | |
| 1.073% (1 Month LIBOR + 1.00%), due 11/15/32 | $ 1,518,808 | $ 1,523,566 |
| Series 2019-XL, Class B | | |
| 1.153% (1 Month LIBOR + 1.08%), due 10/15/36 | 172,906 | 173,187 |
| Series 2020-FOX, Class B | | |
| 1.423% (1 Month LIBOR + 1.35%), due 11/15/32 | 277,040 | 277,734 |
| Series 2020-FOX, Class C | | |
| 1.623% (1 Month LIBOR + 1.55%), due 11/15/32 | 277,040 | 277,908 |
| BX Trust (a) | |
| Series 2021-LBA, Class AV | | |
| 0.873% (1 Month LIBOR + 0.80%), due 2/15/36 (b) | 1,122,000 | 1,123,792 |
| Series 2021-LBA, Class AJV | | |
| 0.873% (1 Month LIBOR + 0.80%), due 2/15/36 (b) | 987,000 | 988,576 |
| Series 2019-OC11, Class A | | |
| 3.202%, due 12/9/41 | 565,000 | 608,654 |
| Series 2019-OC11, Class B | | |
| 3.605%, due 12/9/41 | 284,000 | 310,860 |
| Series 2019-OC11, Class C | | |
| 3.856%, due 12/9/41 | 564,000 | 612,937 |
| Series 2019-OC11, Class D | | |
| 4.075%, due 12/9/41 (j) | 847,000 | 906,222 |
| BXP Trust | |
| Series 2017-GM, Class A | | |
| 3.379%, due 6/13/39 (a) | 396,000 | 432,829 |
| CHT Mortgage Trust | |
| Series 2017-CSMO, Class A | | |
| 1.003% (1 Month LIBOR + 0.93%), due 11/15/36 (a)(b) | 617,327 | 617,901 |
| Cold Storage Trust (a)(b) | |
| Series 2020-ICE5, Class A | | |
| 0.973% (1 Month LIBOR + 0.90%), due 11/15/37 | 1,480,384 | 1,488,033 |
| Series 2020-ICE5, Class B | | |
| 1.373% (1 Month LIBOR + 1.30%), due 11/15/37 | 657,620 | 659,476 |
| Series 2020-ICE5, Class C | | |
| 1.723% (1 Month LIBOR + 1.65%), due 11/15/37 | 660,569 | 662,640 |
The notes to the financial statements are an integral part of, and should be read in conjunction with, the financial statements.
| 18 | MainStay VP Janus Henderson Balanced Portfolio |
| | Principal
Amount | Value |
| Mortgage-Backed Securities (continued) |
| Commercial Mortgage Loans (Collateralized Mortgage Obligations) (continued) |
| Credit Suisse Mortgage Capital Certificates (a)(b) | |
| Series 2019-ICE4, Class A | | |
| 1.053% (1 Month LIBOR + 0.98%), due 5/15/36 | $ 1,783,000 | $ 1,787,766 |
| Series 2019-ICE4, Class C | | |
| 1.503% (1 Month LIBOR + 1.43%), due 5/15/36 | 333,000 | 334,135 |
| Extended Stay America Trust (a)(b) | |
| Series 2021-ESH, Class A | | |
| (zero coupon) (1 Month LIBOR + 1.08%), due 7/15/38 | 1,277,000 | 1,280,589 |
| Series 2021-ESH, Class B | | |
| (zero coupon) (1 Month LIBOR + 1.38%), due 7/15/38 | 348,000 | 349,196 |
| Great Wolf Trust (a)(b) | |
| Series 2019-WOLF, Class A | | |
| 1.107% (1 Month LIBOR + 1.034%), due 12/15/36 | 270,000 | 270,167 |
| Series 2019-WOLF, Class B | | |
| 1.407% (1 Month LIBOR + 1.334%), due 12/15/36 | 303,000 | 303,093 |
| Series 2019-WOLF, Class C | | |
| 1.706% (1 Month LIBOR + 1.633%), due 12/15/36 | 337,000 | 336,998 |
| GS Mortgage Securities Trust | |
| Series 2020-GC47, Class A5 | | |
| 2.377%, due 5/12/53 | 736,000 | 759,459 |
| Series 2020-GC45, Class A5 | | |
| 2.911%, due 2/13/53 | 547,000 | 586,392 |
| Series 2018-GS9, Class A4 | | |
| 3.992%, due 3/10/51 (c) | 645,957 | 735,606 |
| Series 2018-GS10, Class A5 | | |
| 4.155%, due 7/10/51 (c) | 388,105 | 444,777 |
| Life Mortgage Trust (a)(b) | |
| Series 2021-BMR, Class A | | |
| 0.773% (1 Month LIBOR + 0.70%), due 3/15/38 | 1,864,000 | 1,866,242 |
| Series 2021-BMR, Class C | | |
| 1.173% (1 Month LIBOR + 1.10%), due 3/15/38 | 924,000 | 925,762 |
| MHC Commercial Mortgage Trust (a)(b) | |
| Series 2021-MHC, Class A | | |
| 0.874% (1 Month LIBOR + 0.80%), due 4/15/38 | 1,947,744 | 1,948,964 |
| | Principal
Amount | Value |
| |
| Commercial Mortgage Loans (Collateralized Mortgage Obligations) (continued) |
| MHC Commercial Mortgage Trust (a)(b) (continued) | |
| Series 2021-MHC, Class C | | |
| 1.424% (1 Month LIBOR + 1.35%), due 4/15/38 | $ 938,912 | $ 939,796 |
| Morgan Stanley Capital I Trust | |
| Series 2016-UB11, Class A4 | | |
| 2.782%, due 8/15/49 | 656,000 | 698,357 |
| Series 2019-H6, Class A4 | | |
| 3.417%, due 6/15/52 | 343,549 | 379,026 |
| Series 2015-UBS8, Class A4 | | |
| 3.809%, due 12/15/48 | 517,000 | 567,672 |
| Series 2018-H3, Class A5 | | |
| 4.177%, due 7/15/51 | 561,262 | 648,328 |
| Series 2018-H4, Class A4 | | |
| 4.31%, due 12/15/51 | 840,223 | 967,851 |
| VASA Trust | |
| Series 2021-VASA, Class A | | |
| 0.973% (1 Month LIBOR + 0.90%), due 7/15/39 (a)(b) | 525,000 | 525,157 |
| Wells Fargo Commercial Mortgage Trust | |
| Series 2021-SAVE, Class A | | |
| 1.223% (1 Month LIBOR + 1.15%), due 2/15/40 (a)(b) | 497,235 | 499,285 |
| | | 36,023,056 |
| Whole Loan (Collateralized Mortgage Obligations) 1.3% |
| Angel Oak Mortgage Trust (a) | |
| Series 2020-3, Class A2 | | |
| 2.41%, due 4/25/65 (c) | 533,887 | 540,327 |
| Series 2019-5, Class A1 | | |
| 2.593%, due 10/25/49 (j) | 351,110 | 352,535 |
| Series 2019-6, Class A1 | | |
| 2.62%, due 11/25/59 (c) | 326,866 | 328,755 |
| Series 2018-2, Class A1 | | |
| 3.674%, due 7/27/48 (c) | 49,720 | 50,076 |
| Bayview Financing Trust | |
| Series 2021-1F | | |
| 1.56%, due 7/10/33 (c) | 239,108 | 239,124 |
| Series 2021-2F, Class M1 | | |
| 1.56% (SOFR 30A + 1.55%), due 12/31/49 (a)(b)(d) | 744,043 | 744,043 |
| CIM Trust | |
| Series 2021-NR1, Class A1 | | |
| 2.569%, due 7/25/55 (a)(e) | 910,114 | 910,049 |
| COLT Mortgage Loan Trust (a)(c) | |
| Series 2020-3, Class A1 | | |
| 1.506%, due 4/27/65 | 275,642 | 276,708 |
The notes to the financial statements are an integral part of, and should be read in conjunction with, the financial statements.
19
Portfolio of Investments June 30, 2021† (Unaudited) (continued)
| | Principal
Amount | Value |
| Mortgage-Backed Securities (continued) |
| Whole Loan (Collateralized Mortgage Obligations) (continued) |
| COLT Mortgage Loan Trust (a)(c) (continued) | |
| Series 2020-2, Class A1 | | |
| 1.853%, due 3/25/65 | $ 259,163 | $ 260,544 |
| Connecticut Avenue Securities Trust (a)(b) | |
| Series 2019-R05, Class 1M2 | | |
| 2.091% (1 Month LIBOR + 2.00%), due 7/25/39 | 372,288 | 373,784 |
| Series 2020-R02, Class 2M2 | | |
| 2.091% (1 Month LIBOR + 2.00%), due 1/25/40 | 922,805 | 926,873 |
| Series 2019-R04, Class 2M2 | | |
| 2.192% (1 Month LIBOR + 2.10%), due 6/25/39 | 412,442 | 414,098 |
| Series 2019-R07, Class 1M2 | | |
| 2.192% (1 Month LIBOR + 2.1%), due 10/25/39 | 163,156 | 163,830 |
| Series 2019-R03, Class 1M2 | | |
| 2.242% (1 Month LIBOR + 2.15%), due 9/25/31 | 434,366 | 437,461 |
| Series 2019-R02, Class 1M2 | | |
| 2.392% (1 Month LIBOR + 2.30%), due 8/25/31 | 185,190 | 186,467 |
| Series 2018-R07, Class 1M2 | | |
| 2.491% (1 Month LIBOR + 2.40%), due 4/25/31 | 480,421 | 483,058 |
| CSMC Trust | |
| 3.795%, due 12/15/23 | 509,000 | 510,436 |
| 4.07%, due 4/15/26 (c) | 912,505 | 912,463 |
| FHLMC STACR REMIC Trust (a)(b) | |
| Series 2020-DNA6, Class M2 | | |
| 2.018% (SOFR 30A + 2.00%), due 12/25/50 | 1,021,000 | 1,031,863 |
| Series 2021-HQA1, Class M2 | | |
| 2.268% (SOFR 30A + 2.25%), due 8/25/33 | 573,000 | 580,531 |
| Series 2020-HQA4, Class M2 | | |
| 3.242% (1 Month LIBOR + 3.15%), due 9/25/50 | 460,316 | 465,535 |
| FHLMC STACR Trust | |
| Series 2019-DNA4, Class M2 | | |
| 2.041% (1 Month LIBOR + 1.95%), due 10/25/49 (a)(b) | 151,327 | 152,127 |
| FHLMC Structured Agency Credit Risk Debt Notes (b) | |
| Series 2021-DNA2, Class M2 | | |
| 2.318% (SOFR 30A + 2.30%), due 8/25/33 (a) | 372,000 | 381,663 |
| | Principal
Amount | Value |
| |
| Whole Loan (Collateralized Mortgage Obligations) (continued) |
FHLMC Structured Agency Credit Risk Debt Notes (b)
(continued) | |
| Series 2020-HQA5, Class M2 | | |
| 2.618% (SOFR 30A + 2.60%), due 11/25/50 (a) | $ 1,664,000 | $ 1,690,306 |
| Series 2016-DNA1, Class M3 | | |
| 5.641% (1 Month LIBOR + 5.55%), due 7/25/28 | 411,036 | 430,622 |
| FNMA (b) | |
| Series 2017-C06, Class 1M2 | | |
| 2.742% (1 Month LIBOR + 2.65%), due 2/25/30 | 356,844 | 362,534 |
| Series 2017-C01, Class 1M2 | | |
| 3.642% (1 Month LIBOR + 3.55%), due 7/25/29 | 519,859 | 539,699 |
| Series 2016-C04, Class 1M2 | | |
| 4.341% (1 Month LIBOR + 4.25%), due 1/25/29 | 376,887 | 393,388 |
| Series 2016-C06, Class 1M2 | | |
| 4.341% (1 Month LIBOR + 4.25%), due 4/25/29 | 440,477 | 457,879 |
| Series 2014-C04, Class 1M2 | | |
| 4.992% (1 Month LIBOR + 4.90%), due 11/25/24 | 74,298 | 76,818 |
| Series 2015-C03, Class 1M2 | | |
| 5.092% (1 Month LIBOR + 5.00%), due 7/25/25 | 422,848 | 434,829 |
| Series 2015-C04, Class 1M2 | | |
| 5.792% (1 Month LIBOR + 5.70%), due 4/25/28 | 321,422 | 340,510 |
| Series 2016-C03, Class 2M2 | | |
| 5.992% (1 Month LIBOR + 5.90%), due 10/25/28 | 152,071 | 160,644 |
| Lakeview LLC | |
| Series 2021-CRT1 | | |
| 2.327%, due 1/10/33 (c)(d) | 751,000 | 752,408 |
| MRA Issuance Trust | |
| Series 2021-NA1, Class A1X | | |
| 1.595% (1 Month LIBOR + 1.50%), due 3/8/22 (a)(b)(d) | 1,505,000 | 1,505,000 |
| New Residential Mortgage Loan Trust | |
| Series 2018-2A, Class A1 | | |
| 4.50%, due 2/25/58 (a)(c) | 238,846 | 254,606 |
| PRPM LLC (a)(e) | |
| Series 2020-3, Class A1 | | |
| 2.857%, due 9/25/25 | 1,183,082 | 1,189,364 |
| Series 2020-5, Class A1 | | |
| 3.104%, due 11/25/25 | 396,268 | 398,895 |
The notes to the financial statements are an integral part of, and should be read in conjunction with, the financial statements.
| 20 | MainStay VP Janus Henderson Balanced Portfolio |
| | Principal
Amount | Value |
| Mortgage-Backed Securities (continued) |
| Whole Loan (Collateralized Mortgage Obligations) (continued) |
| Sequoia Mortgage Trust (a) | |
| Series 2013-5, Class A1 | | |
| 2.50%, due 5/25/43 (j) | $ 270,579 | $ 272,616 |
| Series 2020-2, Class A19 | | |
| 3.50%, due 3/25/50 (c) | 117,291 | 119,788 |
| Spruce Hill Mortgage Loan Trust (a)(c) | |
| Series 2020-SH1, Class A1 | | |
| 2.521%, due 1/28/50 | 105,644 | 107,186 |
| Series 2020-SH1, Class A2 | | |
| 2.624%, due 1/28/50 | 264,353 | 267,843 |
| Series 2020-SH2, Class A1 | | |
| 3.407%, due 6/25/55 | 552,639 | 557,924 |
| | | 21,035,209 |
Total Mortgage-Backed Securities
(Cost $97,554,335) | | 98,563,019 |
| U.S. Government & Federal Agencies 12.2% |
| Federal Home Loan Mortgage Corporation (Mortgage Pass-Through Securities) 1.1% |
| FHLMC Gold Pools, Other | | |
| 3.00%, due 6/1/43 | 25,609 | 26,366 |
| 3.50%, due 7/1/42 | 31,681 | 34,188 |
| 3.50%, due 8/1/42 | 41,996 | 45,320 |
| 3.50%, due 8/1/42 | 33,829 | 36,374 |
| 3.50%, due 2/1/43 | 221,280 | 238,792 |
| 3.50%, due 2/1/44 | 268,820 | 290,095 |
| 3.50%, due 1/1/47 | 82,540 | 89,074 |
| 4.50%, due 5/1/44 | 536,323 | 595,297 |
| UMBS, 15 Year | | |
| 2.50%, due 12/1/33 | 1,300,491 | 1,361,326 |
| 2.50%, due 11/1/34 | 245,579 | 259,348 |
| 2.50%, due 11/1/34 | 277,648 | 293,310 |
| 3.00%, due 5/1/31 | 1,089,319 | 1,148,511 |
| 3.00%, due 9/1/32 | 240,936 | 254,990 |
| 3.00%, due 10/1/32 | 88,048 | 93,075 |
| 3.00%, due 1/1/33 | 138,463 | 147,208 |
| 3.00%, due 10/1/34 | 120,499 | 128,014 |
| 3.00%, due 10/1/34 | 289,346 | 308,206 |
| UMBS, 20 Year | | |
| 2.00%, due 5/1/41 | 5,175,008 | 5,280,999 |
| UMBS, 30 Year | | |
| 2.50%, due 1/1/50 | 52,599 | 54,763 |
| 3.00%, due 1/1/45 | 155,604 | 163,895 |
| 3.00%, due 8/1/46 | 11,745 | 12,322 |
| 3.00%, due 10/1/46 | 800,051 | 847,221 |
| 3.00%, due 4/1/47 | 17,858 | 18,758 |
| | Principal
Amount | Value |
| |
| Federal Home Loan Mortgage Corporation (Mortgage Pass-Through Securities) (continued) |
| UMBS, 30 Year (continued) | | |
| 3.00%, due 8/1/49 | $ 179,492 | $ 189,172 |
| 3.00%, due 8/1/49 | 69,867 | 74,743 |
| 3.00%, due 10/1/49 | 124,864 | 130,483 |
| 3.00%, due 11/1/49 | 127,860 | 133,492 |
| 3.00%, due 11/1/49 | 387,556 | 405,062 |
| 3.00%, due 12/1/49 | 117,005 | 122,173 |
| 3.00%, due 12/1/49 | 222,092 | 232,167 |
| 3.00%, due 12/1/49 | 202,954 | 212,301 |
| 3.00%, due 3/1/50 | 77,603 | 81,120 |
| 3.50%, due 12/1/44 | 536,491 | 579,314 |
| 3.50%, due 7/1/46 | 164,850 | 176,565 |
| 3.50%, due 9/1/47 | 336,649 | 356,450 |
| 3.50%, due 12/1/47 | 1,037,946 | 1,126,389 |
| 3.50%, due 2/1/48 | 261,853 | 281,038 |
| 3.50%, due 3/1/50 | 6,232 | 6,579 |
| 4.00%, due 3/1/47 | 42,559 | 46,411 |
| 4.00%, due 3/1/48 | 201,233 | 218,575 |
| 4.00%, due 4/1/48 | 4,511 | 4,810 |
| 4.00%, due 4/1/48 | 267,554 | 288,756 |
| 4.00%, due 5/1/48 | 594,928 | 634,917 |
| 4.50%, due 3/1/48 | 212,234 | 228,885 |
| 4.50%, due 12/1/48 | 266,967 | 295,047 |
| 5.00%, due 9/1/48 | 36,872 | 40,498 |
| 6.00%, due 4/1/40 | 520,884 | 616,597 |
| | | 18,208,996 |
| Federal National Mortgage Association (Mortgage Pass-Through Securities) 1.6% |
| FNMA, Other | | |
| 3.00%, due 2/1/43 | 21,167 | 22,534 |
| 3.00%, due 5/1/43 | 89,285 | 95,267 |
| 3.00%, due 2/1/57 | 1,064,421 | 1,151,883 |
| 3.00%, due 6/1/57 | 17,540 | 18,973 |
| 3.50%, due 8/1/56 | 1,330,985 | 1,446,635 |
| 4.50%, due 6/1/45 | 193,397 | 214,666 |
| 5.00%, due 7/1/44 | 332,028 | 371,260 |
| UMBS, 15 Year | | |
| 2.50%, due 11/1/34 | 318,100 | 335,033 |
| 3.00%, due 10/1/34 | 141,244 | 149,550 |
| 3.00%, due 11/1/34 | 30,728 | 32,714 |
| 3.00%, due 12/1/34 | 32,028 | 34,185 |
| UMBS, 30 Year | | |
| 2.50%, due 1/1/50 | 128,235 | 133,528 |
| 2.50%, due 10/1/50 | 147,766 | 153,730 |
| 2.50%, due 1/1/51 | 362,359 | 376,080 |
| 3.00%, due 1/1/43 | 59,470 | 63,240 |
The notes to the financial statements are an integral part of, and should be read in conjunction with, the financial statements.
21
Portfolio of Investments June 30, 2021† (Unaudited) (continued)
| | Principal
Amount | Value |
| U.S. Government & Federal Agencies (continued) |
| Federal National Mortgage Association (Mortgage Pass-Through Securities) (continued) |
| UMBS, 30 Year (continued) | | |
| 3.00%, due 5/1/43 | $ 586,550 | $ 620,779 |
| 3.00%, due 1/1/46 | 2,469 | 2,596 |
| 3.00%, due 9/1/46 | 987,459 | 1,049,236 |
| 3.00%, due 2/1/47 | 8,195,351 | 8,708,347 |
| 3.00%, due 3/1/47 | 619,778 | 658,343 |
| 3.00%, due 11/1/48 | 88,622 | 93,644 |
| 3.00%, due 8/1/49 | 233,334 | 249,615 |
| 3.00%, due 9/1/49 | 47,800 | 50,202 |
| 3.50%, due 12/1/45 | 131,923 | 141,272 |
| 3.50%, due 7/1/46 | 365,797 | 397,085 |
| 3.50%, due 3/1/47 | 113,742 | 121,385 |
| 3.50%, due 7/1/47 | 97,493 | 104,077 |
| 3.50%, due 8/1/47 | 129,825 | 137,439 |
| 3.50%, due 8/1/47 | 100,814 | 110,735 |
| 3.50%, due 12/1/47 | 28,907 | 31,752 |
| 3.50%, due 12/1/47 | 49,071 | 53,777 |
| 3.50%, due 1/1/48 | 300,049 | 321,846 |
| 3.50%, due 3/1/48 | 45,042 | 49,340 |
| 3.50%, due 7/1/48 | 2,730,634 | 2,904,553 |
| 4.00%, due 1/1/48 | 648,351 | 712,218 |
| 4.00%, due 1/1/48 | 1,155,169 | 1,241,246 |
| 4.00%, due 3/1/48 | 228,395 | 248,789 |
| 4.00%, due 2/1/49 | 192,582 | 205,200 |
| 4.50%, due 11/1/42 | 81,452 | 90,799 |
| 4.50%, due 10/1/44 | 262,050 | 292,253 |
| 4.50%, due 3/1/45 | 382,821 | 426,943 |
| 4.50%, due 2/1/46 | 429,666 | 477,708 |
| 4.50%, due 3/1/48 | 230,465 | 249,028 |
| 4.50%, due 8/1/48 | 135,406 | 145,921 |
| 5.00%, due 5/1/48 | 198,637 | 218,544 |
| 6.00%, due 2/1/37 | 30,829 | 36,571 |
| | | 24,750,521 |
| Government National Mortgage Association (Mortgage Pass-Through Securities) 0.2% |
| GNMA I, 30 Year | | |
| 4.00%, due 1/15/45 | 600,385 | 664,406 |
| 4.00%, due 7/15/47 | 561,302 | 605,121 |
| 4.00%, due 8/15/47 | 101,124 | 110,892 |
| 4.00%, due 11/15/47 | 94,316 | 103,623 |
| 4.00%, due 12/15/47 | 116,787 | 126,808 |
| 4.50%, due 8/15/46 | 650,061 | 738,824 |
| GNMA II, 30 Year | | |
| 4.00%, due 8/20/47 | 30,493 | 32,897 |
| 4.00%, due 8/20/47 | 72,931 | 78,124 |
| | Principal
Amount | Value |
| |
| Government National Mortgage Association (Mortgage Pass-Through Securities) (continued) |
| GNMA II, 30 Year (continued) | | |
| 4.00%, due 8/20/47 | $ 23,070 | $ 24,700 |
| 4.00%, due 6/20/48 | 396,299 | 421,824 |
| 4.50%, due 2/20/48 | 86,783 | 92,517 |
| 4.50%, due 5/20/48 | 44,492 | 47,761 |
| 4.50%, due 5/20/48 | 223,475 | 240,331 |
| 5.00%, due 8/20/48 | 533,716 | 576,577 |
| | | 3,864,405 |
| United States Treasury Bonds 2.6% |
| U.S. Treasury Bonds | | |
| 1.125%, due 5/15/40 | 869,000 | 750,191 |
| 1.375%, due 11/15/40 | 2,707,000 | 2,431,647 |
| 1.375%, due 8/15/50 | 8,806,800 | 7,424,201 |
| 1.625%, due 11/15/50 | 14,468,900 | 12,994,881 |
| 1.875%, due 2/15/41 | 4,962,000 | 4,857,333 |
| 1.875%, due 2/15/51 | 2,663,600 | 2,542,073 |
| 2.25%, due 5/15/41 | 2,111,000 | 2,196,430 |
| 2.75%, due 8/15/42 | 6,590,900 | 7,426,863 |
| | | 40,623,619 |
| United States Treasury Inflation - Indexed Notes 1.4% |
| U.S. Treasury Inflation Linked Notes (k) | | |
| 0.125%, due 4/15/26 | 9,865,000 | 10,927,344 |
| 0.125%, due 1/15/31 | 3,906,000 | 4,409,414 |
| 0.625%, due 4/15/23 | 5,968,000 | 6,787,197 |
| | | 22,123,955 |
| United States Treasury Notes 5.3% |
| U.S. Treasury Notes | | |
| 0.125%, due 2/28/23 | 22,237,000 | 22,209,204 |
| 0.125%, due 4/30/23 | 19,097,000 | 19,061,193 |
| 0.25%, due 5/15/24 | 2,141,000 | 2,129,291 |
| 0.375%, due 1/31/26 | 4,346,900 | 4,259,792 |
| 0.50%, due 2/28/26 | 18,186,000 | 17,910,368 |
| 0.75%, due 4/30/26 | 10,323,000 | 10,270,579 |
| 0.875%, due 11/15/30 | 6,191,600 | 5,887,825 |
| 1.125%, due 2/15/31 | 770,300 | 747,793 |
The notes to the financial statements are an integral part of, and should be read in conjunction with, the financial statements.
| 22 | MainStay VP Janus Henderson Balanced Portfolio |
| | Principal
Amount | Value |
| U.S. Government & Federal Agencies (continued) |
| United States Treasury Notes (continued) |
| U.S. Treasury Notes (continued) | | |
| 1.25%, due 4/30/28 | $ 580,000 | $ 581,813 |
| 1.625%, due 5/15/31 | 876,800 | 890,226 |
| | | 83,948,084 |
Total U.S. Government & Federal Agencies
(Cost $192,797,136) | | 193,519,580 |
Total Long-Term Bonds
(Cost $538,006,310) | | 548,454,097 |
| |
| | Shares | |
| Common Stocks 64.6% |
| Aerospace & Defense 1.1% |
| General Dynamics Corp. | 54,529 | 10,265,630 |
| L3Harris Technologies, Inc. | 31,862 | 6,886,971 |
| | | 17,152,601 |
| Air Freight & Logistics 1.3% |
| United Parcel Service, Inc., Class B | 97,779 | 20,335,099 |
| Airlines 0.4% |
| Southwest Airlines Co. (l) | 118,101 | 6,269,982 |
| Auto Components 0.4% |
| Aptiv plc (l) | 40,225 | 6,328,599 |
| Banks 1.5% |
| Bank of America Corp. | 565,609 | 23,320,059 |
| Beverages 0.8% |
| Constellation Brands, Inc., Class A | 11,806 | 2,761,305 |
| Monster Beverage Corp. (l) | 117,813 | 10,762,218 |
| | | 13,523,523 |
| Biotechnology 0.9% |
| AbbVie, Inc. | 123,590 | 13,921,179 |
| Building Products 0.2% |
| Trane Technologies plc | 17,390 | 3,202,195 |
| Capital Markets 2.8% |
| Charles Schwab Corp. (The) | 38,573 | 2,808,500 |
| CME Group, Inc. | 66,019 | 14,040,921 |
| | Shares | Value |
| |
| Capital Markets (continued) |
| Morgan Stanley | 248,891 | $ 22,820,816 |
| S&P Global, Inc. | 10,945 | 4,492,375 |
| | | 44,162,612 |
| Chemicals 0.4% |
| Sherwin-Williams Co. (The) | 26,424 | 7,199,219 |
| Communications Equipment 0.5% |
| Motorola Solutions, Inc. | 35,019 | 7,593,870 |
| Consumer Finance 1.1% |
| American Express Co. | 109,237 | 18,049,230 |
| Electrical Equipment 0.4% |
| Rockwell Automation, Inc. | 21,197 | 6,062,766 |
| Electronic Equipment, Instruments & Components 0.3% |
| Corning, Inc. | 139,198 | 5,693,198 |
| Entertainment 1.7% |
| Activision Blizzard, Inc. | 98,554 | 9,405,994 |
| Netflix, Inc. (l) | 9,453 | 4,993,169 |
| Walt Disney Co. (The) (l) | 74,731 | 13,135,468 |
| | | 27,534,631 |
| Food & Staples Retailing 1.6% |
| Costco Wholesale Corp. | 48,417 | 19,157,154 |
| Sysco Corp. | 75,830 | 5,895,783 |
| | | 25,052,937 |
| Food Products 0.5% |
| Hershey Co. (The) | 44,687 | 7,783,582 |
| Health Care Equipment & Supplies 2.7% |
| Abbott Laboratories | 123,136 | 14,275,157 |
| Edwards Lifesciences Corp. (l) | 70,993 | 7,352,745 |
| Intuitive Surgical, Inc. (l) | 6,357 | 5,846,151 |
| Medtronic plc | 72,945 | 9,054,663 |
| Stryker Corp. | 23,689 | 6,152,744 |
| | | 42,681,460 |
| Health Care Providers & Services 2.1% |
| UnitedHealth Group, Inc. | 83,219 | 33,324,216 |
| Hotels, Restaurants & Leisure 3.2% |
| Booking Holdings, Inc. (l) | 4,715 | 10,316,844 |
| Hilton Worldwide Holdings, Inc. (l) | 80,656 | 9,728,727 |
The notes to the financial statements are an integral part of, and should be read in conjunction with, the financial statements.
23
Portfolio of Investments June 30, 2021† (Unaudited) (continued)
| | Shares | Value |
| Common Stocks (continued) |
| Hotels, Restaurants & Leisure (continued) |
| McDonald's Corp. | 88,841 | $ 20,521,382 |
| Starbucks Corp. | 93,296 | 10,431,426 |
| | | 50,998,379 |
| Household Products 0.9% |
| Procter & Gamble Co. (The) | 104,509 | 14,101,399 |
| Industrial Conglomerates 1.1% |
| Honeywell International, Inc. | 78,807 | 17,286,315 |
| Insurance 1.1% |
| Progressive Corp. (The) | 179,265 | 17,605,616 |
| Interactive Media & Services 3.7% |
| Alphabet, Inc., Class C (l) | 23,318 | 58,442,370 |
| Internet & Direct Marketing Retail 3.0% |
| Amazon.com, Inc. (l) | 14,059 | 48,365,209 |
| IT Services 3.4% |
| Accenture plc, Class A | 36,731 | 10,827,932 |
| Fidelity National Information Services, Inc. | 44,420 | 6,292,981 |
| Mastercard, Inc., Class A | 101,825 | 37,175,289 |
| | | 54,296,202 |
| Leisure Products 0.5% |
| Hasbro, Inc. | 78,700 | 7,438,724 |
| Life Sciences Tools & Services 1.2% |
| Illumina, Inc. (l) | 13,700 | 6,482,977 |
| Thermo Fisher Scientific, Inc. | 25,815 | 13,022,893 |
| | | 19,505,870 |
| Machinery 1.2% |
| Deere & Co. | 46,858 | 16,527,285 |
| Parker-Hannifin Corp. | 6,725 | 2,065,315 |
| | | 18,592,600 |
| Media 1.4% |
| Comcast Corp., Class A | 396,766 | 22,623,597 |
| Multiline Retail 1.0% |
| Dollar General Corp. | 72,121 | 15,606,263 |
| | Shares | Value |
| |
| Personal Products 0.3% |
| Estee Lauder Cos., Inc. (The), Class A | 13,412 | $ 4,266,089 |
| Pharmaceuticals 2.5% |
| AstraZeneca plc, Sponsored ADR (h) | 82,745 | 4,956,426 |
| Eli Lilly and Co. | 95,306 | 21,874,633 |
| Merck & Co., Inc. | 164,779 | 12,814,863 |
| | | 39,645,922 |
| Real Estate Management & Development 0.3% |
| CBRE Group, Inc., Class A (l) | 61,462 | 5,269,137 |
| Road & Rail 0.1% |
| CSX Corp. | 59,689 | 1,914,823 |
| Semiconductors & Semiconductor Equipment 4.7% |
| Advanced Micro Devices, Inc. (l) | 79,262 | 7,445,080 |
| Lam Research Corp. | 42,782 | 27,838,247 |
| NVIDIA Corp. | 30,287 | 24,232,629 |
| Texas Instruments, Inc. | 78,552 | 15,105,549 |
| | | 74,621,505 |
| Software 8.5% |
| Adobe, Inc. (l) | 56,564 | 33,126,141 |
| Autodesk, Inc. (l) | 12,668 | 3,697,789 |
| Cadence Design Systems, Inc. (l) | 44,546 | 6,094,784 |
| Microsoft Corp. | 300,624 | 81,439,042 |
| salesforce.com, Inc. (l) | 47,571 | 11,620,168 |
| | | 135,977,924 |
| Specialty Retail 1.6% |
| Home Depot, Inc. (The) | 78,028 | 24,882,349 |
| Technology Hardware, Storage & Peripherals 3.3% |
| Apple, Inc. | 386,592 | 52,947,640 |
| Textiles, Apparel & Luxury Goods 0.9% |
| NIKE, Inc., Class B | 93,404 | 14,429,984 |
Total Common Stocks
(Cost $593,972,029) | | 1,028,008,875 |
| Preferred Stocks 0.2% |
| Banks 0.2% |
| First Republic Bank, 4.12% (g)(h)(l) | 55,450 | 1,422,293 |
| Truist Financial Corp., 4.75% (g)(l) | 61,225 | 1,629,809 |
Total Preferred Stocks
(Cost $2,916,875) | | 3,052,102 |
The notes to the financial statements are an integral part of, and should be read in conjunction with, the financial statements.
| 24 | MainStay VP Janus Henderson Balanced Portfolio |
| | Shares | | Value |
| Short-Term Investments 4.0% |
| Affiliated Investment Company 3.6% |
| MainStay U.S. Government Liquidity Fund, 0.01% (m) | 57,559,601 | | $ 57,559,601 |
| Unaffiliated Investment Company 0.4% |
| Wells Fargo Government Money Market Fund, 0.025% (m)(n) | 6,628,836 | | 6,628,836 |
Total Short-Term Investments
(Cost $64,188,437) | | | 64,188,437 |
Total Investments
(Cost $1,199,083,651) | 103.2% | | 1,643,703,511 |
| Other Assets, Less Liabilities | (3.2) | | (51,318,031) |
| Net Assets | 100.0% | | $ 1,592,385,480 |
| † | Percentages indicated are based on Portfolio net assets. |
| ‡ | Less than one-tenth of a percent. |
| (a) | May be sold to institutional investors only under Rule 144A or securities offered pursuant to Section 4(a)(2) of the Securities Act of 1933, as amended. |
| (b) | Floating rate—Rate shown was the rate in effect as of June 30, 2021. |
| (c) | Coupon rate may change based on changes of the underlying collateral or prepayments of principal. Rate shown was the rate in effect as of June 30, 2021. |
| (d) | Fair valued security—Represents fair value as measured in good faith under procedures approved by the Board of Trustees. As of June 30, 2021, the total market value was $3,857,833, which represented 0.2% of the Portfolio’s net assets. |
| (e) | Step coupon—Rate shown was the rate in effect as of June 30, 2021. |
| (f) | Fixed to floating rate—Rate shown was the rate in effect as of June 30, 2021. |
| (g) | Security is perpetual and, thus, does not have a predetermined maturity date. The date shown, if applicable, reflects the next call date. |
| (h) | All or a portion of this security was held on loan. As of June 30, 2021, the aggregate market value of securities on loan was $6,839,824; the total market value of collateral held by the Portfolio was $7,018,293. The market value of the collateral held included non-cash collateral in the form of U.S. Treasury securities with a value of $389,457. The Portfolio received cash collateral with a value of $6,628,836. (See Note 2(H)) |
| (i) | TBA—Security purchased on a forward commitment basis with an approximate principal amount and maturity date. The actual principal amount and maturity date will be determined upon settlement. As of June 30, 2021, the total net market value was $39,314,150, which represented 2.5% of the Portfolio’s net assets. All or a portion of this security is a part of a mortgage dollar roll agreement. |
| (j) | Collateral strip rate—A bond whose interest was based on the weighted net interest rate of the collateral. The coupon rate adjusts periodically based on a predetermined schedule. Rate shown was the rate in effect as of June 30, 2021. |
| (k) | Treasury Inflation Protected Security—Pays a fixed rate of interest on a principal amount that is continuously adjusted for inflation based on the Consumer Price Index-Urban Consumers. |
| (l) | Non-income producing security. |
| (m) | Current yield as of June 30, 2021. |
| (n) | Represents a security purchased with cash collateral received for securities on loan. |
| Abbreviation(s): |
| ADR—American Depositary Receipt |
| FHLMC—Federal Home Loan Mortgage Corp. |
| FNMA—Federal National Mortgage Association |
| GNMA—Government National Mortgage Association |
| LIBOR—London Interbank Offered Rate |
| REMIC—Real Estate Mortgage Investment Conduit |
| SOFR—Secured Overnight Financing Rate |
| TBA—To Be Announced |
| TBD—To Be Determined |
| UMBS—Uniform Mortgage Backed Securities |
The notes to the financial statements are an integral part of, and should be read in conjunction with, the financial statements.
25
Portfolio of Investments June 30, 2021† (Unaudited) (continued)
The following is a summary of the fair valuations according to the inputs used as of June 30, 2021, for valuing the Portfolio’s assets:
| Description | Quoted
Prices in
Active
Markets for
Identical
Assets
(Level 1) | | Significant
Other
Observable
Inputs
(Level 2) | | Significant
Unobservable
Inputs
(Level 3) | | Total |
| Asset Valuation Inputs | | | | | | | |
| Investments in Securities (a) | | | | | | | |
| Long-Term Bonds | | | | | | | |
| Asset-Backed Securities | $ — | | $ 33,743,027 | | $ — | | $ 33,743,027 |
| Corporate Bonds | — | | 215,510,058 | | — | | 215,510,058 |
| Loan Assignments | — | | 7,118,413 | | — | | 7,118,413 |
| Mortgage-Backed Securities | — | | 98,563,019 | | — | | 98,563,019 |
| U.S. Government & Federal Agencies | — | | 193,519,580 | | — | | 193,519,580 |
| Total Long-Term Bonds | — | | 548,454,097 | | — | | 548,454,097 |
| Common Stocks | 1,028,008,875 | | — | | — | | 1,028,008,875 |
| Preferred Stocks | 3,052,102 | | — | | — | | 3,052,102 |
| Short-Term Investments | | | | | | | |
| Affiliated Investment Company | 57,559,601 | | — | | — | | 57,559,601 |
| Unaffiliated Investment Company | 6,628,836 | | — | | — | | 6,628,836 |
| Total Short-Term Investments | 64,188,437 | | — | | — | | 64,188,437 |
| Total Investments in Securities | $ 1,095,249,414 | | $ 548,454,097 | | $ — | | $ 1,643,703,511 |
| (a) | For a complete listing of investments and their industries, see the Portfolio of Investments. |
The notes to the financial statements are an integral part of, and should be read in conjunction with, the financial statements.
| 26 | MainStay VP Janus Henderson Balanced Portfolio |
Statement of Assets and Liabilities as of June 30, 2021 (Unaudited)
| Assets |
Investment in unaffiliated securities, at value
(identified cost $1,141,524,050) including securities on loan of $6,839,824 | $1,586,143,910 |
Investment in affiliated investment companies, at value
(identified cost $57,559,601) | 57,559,601 |
| Cash | 135,983 |
| Due from custodian | 82,818 |
| Receivables: | |
| Investment securities sold | 5,442,754 |
| Dividends and interest | 2,780,273 |
| Portfolio shares sold | 1,051,947 |
| Securities lending | 2,125 |
| Other assets | 20,038 |
| Total assets | 1,653,219,449 |
| Liabilities |
| Cash collateral received for securities on loan | 6,628,836 |
| Payables: | |
| Investment securities purchased | 53,044,979 |
| Manager (See Note 3) | 697,080 |
| NYLIFE Distributors (See Note 3) | 233,676 |
| Shareholder communication | 120,632 |
| Professional fees | 72,980 |
| Custodian | 35,786 |
| Total liabilities | 60,833,969 |
| Net assets | $1,592,385,480 |
| Composition of Net Assets |
| Shares of beneficial interest outstanding (par value of $.001 per share) unlimited number of shares authorized | $ 96,940 |
| Additional paid-in-capital | 1,008,698,137 |
| | 1,008,795,077 |
| Total distributable earnings (loss) | 583,590,403 |
| Net assets | $1,592,385,480 |
| Initial Class | |
| Net assets applicable to outstanding shares | $ 437,004,547 |
| Shares of beneficial interest outstanding | 26,440,357 |
| Net asset value per share outstanding | $ 16.53 |
| Service Class | |
| Net assets applicable to outstanding shares | $1,155,380,933 |
| Shares of beneficial interest outstanding | 70,500,034 |
| Net asset value per share outstanding | $ 16.39 |
The notes to the financial statements are an integral part of, and should be read in conjunction with, the financial statements.
27
Statement of Operations for the six months ended June 30, 2021 (Unaudited)
| Investment Income (Loss) |
| Income | |
| Interest | $ 6,945,908 |
| Dividends-unaffiliated | 6,351,257 |
| Securities lending | 14,833 |
| Dividends-affiliated | 1,906 |
| Total income | 13,313,904 |
| Expenses | |
| Manager (See Note 3) | 4,062,237 |
| Distribution/Service—Service Class (See Note 3) | 1,352,920 |
| Professional fees | 84,920 |
| Shareholder communication | 66,270 |
| Custodian | 30,375 |
| Trustees | 15,047 |
| Miscellaneous | 18,375 |
| Total expenses | 5,630,144 |
| Net investment income (loss) | 7,683,760 |
| Realized and Unrealized Gain (Loss) |
| Net realized gain (loss) on unaffiliated investments | 62,124,582 |
| Net change in unrealized appreciation (depreciation) on unaffiliated investments | 56,144,994 |
| Net realized and unrealized gain (loss) | 118,269,576 |
| Net increase (decrease) in net assets resulting from operations | $125,953,336 |
The notes to the financial statements are an integral part of, and should be read in conjunction with, the financial statements.
| 28 | MainStay VP Janus Henderson Balanced Portfolio |
Statements of Changes in Net Assets
for the six months ended June 30, 2021 (Unaudited) and the year ended December 31, 2020
| | 2021 | 2020 |
| Increase (Decrease) in Net Assets |
| Operations: | | |
| Net investment income (loss) | $ 7,683,760 | $ 18,335,563 |
| Net realized gain (loss) | 62,124,582 | 53,224,727 |
| Net change in unrealized appreciation (depreciation) | 56,144,994 | 106,458,260 |
| Net increase (decrease) in net assets resulting from operations | 125,953,336 | 178,018,550 |
| Distributions to shareholders: | | |
| Initial Class | — | (20,833,044) |
| Service Class | — | (49,436,862) |
| Total distributions to shareholders | — | (70,269,906) |
| Capital share transactions: | | |
| Net proceeds from sales of shares | 63,325,141 | 174,035,243 |
| Net asset value of shares issued to shareholder in reinvestment of distributions | — | 70,269,906 |
| Cost of shares redeemed | (55,818,584) | (217,020,749) |
| Increase (decrease) in net assets derived from capital share transactions | 7,506,557 | 27,284,400 |
| Net increase (decrease) in net assets | 133,459,893 | 135,033,044 |
| Net Assets |
| Beginning of period | 1,458,925,587 | 1,323,892,543 |
| End of period | $1,592,385,480 | $1,458,925,587 |
The notes to the financial statements are an integral part of, and should be read in conjunction with, the financial statements.
29
Financial Highlights selected per share data and ratios
| | Six months ended
June 30,
2021* | | Year Ended December 31, |
| Initial Class | 2020 | | 2019 | | 2018 | | 2017 | | 2016 |
| Net asset value at beginning of period | $ 15.21 | | $ 14.04 | | $ 12.31 | | $ 13.18 | | $ 11.82 | | $ 12.11 |
| Net investment income (loss) (a) | 0.09 | | 0.22 | | 0.27 | | 0.26 | | 0.25 | | 0.22 |
| Net realized and unrealized gain (loss) on investments | 1.23 | | 1.74 | | 2.48 | | (0.14) | | 1.89 | | 0.32 |
| Net realized and unrealized gain (loss) on foreign currency transactions | — | | (0.00)‡ | | 0.00‡ | | (0.00)‡ | | 0.00‡ | | 0.00‡ |
| Total from investment operations | 1.32 | | 1.96 | | 2.75 | | 0.12 | | 2.14 | | 0.54 |
| Less distributions: | | | | | | | | | | | |
| From net investment income | — | | (0.27) | | (0.25) | | (0.25) | | (0.23) | | (0.23) |
| From net realized gain on investments | — | | (0.52) | | (0.77) | | (0.74) | | (0.55) | | (0.60) |
| Total distributions | — | | (0.79) | | (1.02) | | (0.99) | | (0.78) | | (0.83) |
| Net asset value at end of period | $ 16.53 | | $ 15.21 | | $ 14.04 | | $ 12.31 | | $ 13.18 | | $ 11.82 |
| Total investment return (b) | 8.68%(c) | | 14.32% | | 22.93% | | 0.42% | | 18.35% | | 4.70% |
| Ratios (to average net assets)/Supplemental Data: | | | | | | | | | | | |
| Net investment income (loss) | 1.21%†† | | 1.57% | | 2.01% | | 1.93% | | 1.95% | | 1.87% |
| Net expenses (d) | 0.57%†† | | 0.58% | | 0.58% | | 0.58% | | 0.58% | | 0.59% |
| Expenses (before waiver/reimbursement) (d) | 0.57%†† | | 0.58% | | 0.58% | | 0.58%(e) | | 0.58%(e) | | 0.59% |
| Portfolio turnover rate | 54%(f) | | 106%(f) | | 98%(f) | | 132%(f) | | 73%(f) | | 74% |
| Net assets at end of period (in 000’s) | $ 437,005 | | $ 416,712 | | $ 404,231 | | $ 371,106 | | $ 417,996 | | $ 401,219 |
| * | Unaudited. |
| ‡ | Less than one cent per share. |
| †† | Annualized. |
| (a) | Per share data based on average shares outstanding during the period. |
| (b) | Total return does not reflect any deduction of sales charges, mortality and expense charges, contract charges or administrative charges. For periods of less than one year, total return is not annualized. |
| (c) | Total investment return may reflect adjustments to conform to generally accepted accounting principles. |
| (d) | In addition to the fees and expenses which the Portfolio bears directly, it also indirectly bears a pro-rata share of the fees and expenses of the underlying funds in which it invests. Such indirect expenses are not included in the above expense ratios. |
| (e) | Expense waiver/reimbursement less than 0.01%. |
| (f) | The portfolio turnover rate not including mortgage dollar rolls were 36%, 95%, 93%, 103% and 66% for the six months ended June 30, 2021 and for the years ended December 31, 2020, 2019, 2018 and 2017, respectively. |
The notes to the financial statements are an integral part of, and should be read in conjunction with, the financial statements.
| 30 | MainStay VP Janus Henderson Balanced Portfolio |
Financial Highlights selected per share data and ratios
| | Six months ended
June 30,
2021* | | Year Ended December 31, |
| Service Class | 2020 | | 2019 | | 2018 | | 2017 | | 2016 |
| Net asset value at beginning of period | $ 15.10 | | $ 13.94 | | $ 12.24 | | $ 13.11 | | $ 11.77 | | $ 12.06 |
| Net investment income (loss) (a) | 0.07 | | 0.18 | | 0.24 | | 0.22 | | 0.22 | | 0.19 |
| Net realized and unrealized gain (loss) on investments | 1.22 | | 1.74 | | 2.45 | | (0.13) | | 1.88 | | 0.32 |
| Net realized and unrealized gain (loss) on foreign currency transactions | — | | (0.00)‡ | | 0.00‡ | | (0.00)‡ | | 0.00‡ | | 0.00‡ |
| Total from investment operations | 1.29 | | 1.92 | | 2.69 | | 0.09 | | 2.10 | | 0.51 |
| Less distributions: | | | | | | | | | | | |
| From net investment income | — | | (0.24) | | (0.22) | | (0.22) | | (0.21) | | (0.20) |
| From net realized gain on investments | — | | (0.52) | | (0.77) | | (0.74) | | (0.55) | | (0.60) |
| Total distributions | — | | (0.76) | | (0.99) | | (0.96) | | (0.76) | | (0.80) |
| Net asset value at end of period | $ 16.39 | | $ 15.10 | | $ 13.94 | | $ 12.24 | | $ 13.11 | | $ 11.77 |
| Total investment return (b) | 8.54%(c) | | 14.03% | | 22.62% | | 0.17% | | 18.05% | | 4.44% |
| Ratios (to average net assets)/Supplemental Data: | | | | | | | | | | | |
| Net investment income (loss) | 0.95%†† | | 1.31% | | 1.76% | | 1.69% | | 1.70% | | 1.62% |
| Net expenses (d) | 0.82%†† | | 0.83% | | 0.83% | | 0.83% | | 0.83% | | 0.84% |
| Expenses (before waiver/reimbursement) (d) | 0.82%†† | | 0.83% | | 0.83% | | 0.83%(e) | | 0.83%(e) | | 0.84% |
| Portfolio turnover rate | 54%(f) | | 106%(f) | | 98%(f) | | 132%(f) | | 73%(f) | | 74% |
| Net assets at end of period (in 000’s) | $ 1,155,381 | | $ 1,042,214 | | $ 919,661 | | $ 748,653 | | $ 730,439 | | $ 619,849 |
| * | Unaudited. |
| ‡ | Less than one cent per share. |
| †† | Annualized. |
| (a) | Per share data based on average shares outstanding during the period. |
| (b) | Total return does not reflect any deduction of sales charges, mortality and expense charges, contract charges or administrative charges. For periods of less than one year, total return is not annualized. |
| (c) | Total investment return may reflect adjustments to conform to generally accepted accounting principles. |
| (d) | In addition to the fees and expenses which the Portfolio bears directly, it also indirectly bears a pro-rata share of the fees and expenses of the underlying funds in which it invests. Such indirect expenses are not included in the above expense ratios. |
| (e) | Expense waiver/reimbursement less than 0.01%. |
| (f) | The portfolio turnover rate not including mortgage dollar rolls were 36%, 95%, 93%, 103% and 66% for the six months ended June 30, 2021 and for the years ended December 31, 2020, 2019, 2018 and 2017, respectively. |
The notes to the financial statements are an integral part of, and should be read in conjunction with, the financial statements.
31
Notes to Financial Statements (Unaudited)
Note 1–Organization and Business
MainStay VP Funds Trust (the “Fund”) was organized as a Delaware statutory trust on February 1, 2011. The Fund is registered under the Investment Company Act of 1940, as amended (the “1940 Act”), as an open-end management investment company. The Fund is comprised of thirty-one separate series (collectively referred to as the “Portfolios”). These financial statements and notes relate to the MainStay VP Janus Henderson Balanced Portfolio (the "Portfolio"), a "diversified” portfolio, as that term is defined in the 1940 Act, as interpreted or modified by regulatory authorities having jurisdiction, from time to time.
Shares of the Portfolio are currently offered to certain separate accounts to fund variable annuity policies and variable universal life insurance policies issued by New York Life Insurance and Annuity Corporation (“NYLIAC”), a wholly-owned subsidiary of New York Life Insurance Company (“New York Life”) and may also be offered to fund variable annuity policies and variable universal life insurance policies issued by other insurance companies. NYLIAC allocates shares of the Portfolios to, among others, certain NYLIAC separate accounts. Shares of the Portfolio are also offered to the MainStay VP Conservative Allocation Portfolio, MainStay VP Moderate Allocation Portfolio, MainStay VP Growth Allocation Portfolio (formerly known as MainStay VP Moderate Growth Allocation Portfolio) and MainStay VP Equity Allocation Portfolio (formerly known as MainStay VP Growth Allocation Portfolio), which operate as “funds-of-funds," and other variable insurance funds.
The following table lists the Portfolio's share classes that have been registered and commenced operations:
| Class | Commenced Operations |
| Initial Class | February 17, 2012 |
| Service Class | February 17, 2012 |
Shares of the Portfolio are offered and are redeemed at a price equal to their respective net asset value (“NAV”) per share. No sales or redemption charge is applicable to the purchase or redemption of the Portfolio's shares. Under the terms of the Fund’s multiple class plan, adopted pursuant to Rule 18f-3 under the 1940 Act, the classes differ in that, among other things, Service Class shares of the Portfolio pay a combined distribution and service fee of 0.25% of average daily net assets attributable to Service Class shares of the Portfolio to the Distributor (as defined in Note 3(B)) pursuant to a plan adopted in accordance with Rule 12b-1 under the 1940 Act. Contract owners of variable annuity contracts purchased after June 2, 2003, are permitted to invest only in the Service Class shares.
The Portfolio's investment objective is to seek long-term capital growth, consistent with preservation of capital and balanced by current income.
Note 2–Significant Accounting Policies
The Portfolio is an investment company and accordingly follows the investment company accounting and reporting guidance of the Financial Accounting Standards Board (“FASB”) Accounting Standard Codification
Topic 946 Financial Services—Investment Companies. The Portfolio prepares its financial statements in accordance with generally accepted accounting principles (“GAAP”) in the United States of America and follows the significant accounting policies described below.
(A) Securities Valuation. Investments are usually valued as of the close of regular trading on the New York Stock Exchange (the "Exchange") (usually 4:00 p.m. Eastern time) on each day the Portfolio is open for business ("valuation date").
The Board of Trustees of the Fund (the "Board") adopted procedures establishing methodologies for the valuation of the Portfolio's securities and other assets and delegated the responsibility for valuation determinations under those procedures to the Valuation Committee of the Fund (the “Valuation Committee”). The procedures state that, subject to the oversight of the Board and unless otherwise noted, the responsibility for the day-to-day valuation of portfolio assets (including fair value measurements for the Portfolio's assets and liabilities) rests with New York Life Investment Management LLC (“New York Life Investments” or the "Manager"), aided to whatever extent necessary by the Subadvisor (as defined in Note 3(A)). To assess the appropriateness of security valuations, the Manager, the Subadvisor or the Portfolio's third-party service provider, who is subject to oversight by the Manager, regularly compares prior day prices, prices on comparable securities and the sale prices to the prior and current day prices and challenges prices with changes exceeding certain tolerance levels with third-party pricing services or broker sources.
The Board authorized the Valuation Committee to appoint a Valuation Subcommittee (the “Subcommittee”) to establish the prices of securities for which market quotations are not readily available or the prices of which are not otherwise readily determinable under the procedures. The Subcommittee meets (in person, via electronic mail or via teleconference) on an as-needed basis. The Valuation Committee meets to ensure that actions taken by the Subcommittee were appropriate.
For those securities valued through either a standardized fair valuation methodology or a fair valuation measurement, the Subcommittee deals with such valuation and the Valuation Committee reviews and affirms, if appropriate, the reasonableness of the valuation based on such methodologies and measurements on a regular basis after considering information that is reasonably available and deemed relevant by the Valuation Committee. Any action taken by the Subcommittee with respect to the valuation of a portfolio security or other asset is submitted for review and ratification (if appropriate) to the Valuation Committee and the Board at the next regularly scheduled meeting.
"Fair value" is defined as the price the Portfolio would reasonably expect to receive upon selling an asset or liability in an orderly transaction to an independent buyer in the principal or most advantageous market for the asset or liability. Fair value measurements are determined within a framework that establishes a three-tier hierarchy that maximizes the use of observable market data and minimizes the use of unobservable inputs to establish a classification of fair value measurements for disclosure
| 32 | MainStay VP Janus Henderson Balanced Portfolio |
purposes. "Inputs" refer broadly to the assumptions that market participants would use in pricing the asset or liability, including assumptions about risk, such as the risk inherent in a particular valuation technique used to measure fair value using a pricing model and/or the risk inherent in the inputs for the valuation technique. Inputs may be observable or unobservable. Observable inputs reflect the assumptions market participants would use in pricing the asset or liability based on market data obtained from sources independent of the Portfolio. Unobservable inputs reflect the Portfolio’s own assumptions about the assumptions market participants would use in pricing the asset or liability based on the information available. The inputs or methodology used for valuing assets or liabilities may not be an indication of the risks associated with investing in those assets or liabilities. The three-tier hierarchy of inputs is summarized below.
| • | Level 1—quoted prices in active markets for an identical asset or liability |
| • | Level 2—other significant observable inputs (including quoted prices for a similar asset or liability in active markets, interest rates and yield curves, prepayment speeds, credit risk, etc.) |
| • | Level 3—significant unobservable inputs (including the Portfolio's own assumptions about the assumptions that market participants would use in measuring fair value of an asset or liability) |
The level of an asset or liability within the fair value hierarchy is based on the lowest level of an input, both individually and in the aggregate, that is significant to the fair value measurement. The aggregate value by input level of the Portfolio’s assets and liabilities as of June 30, 2021, is included at the end of the Portfolio of Investments.
The Portfolio may use third-party vendor evaluations, whose prices may be derived from one or more of the following standard inputs, among others:
| • Benchmark yields | • Reported trades |
| • Broker/dealer quotes | • Issuer spreads |
| • Two-sided markets | • Benchmark securities |
| • Bids/offers | • Reference data (corporate actions or material event notices) |
| • Industry and economic events | • Comparable bonds |
| • Monthly payment information | |
An asset or liability for which market values cannot be measured using the methodologies described above is valued by methods deemed reasonable in good faith by the Valuation Committee, following the procedures established by the Board, to represent fair value. Under these procedures, the Portfolio generally uses a market-based approach which may use related or comparable assets or liabilities, recent transactions, market multiples, book values and other relevant information. The Portfolio may also use an income-based valuation approach in which the anticipated future cash flows of the asset or liability are discounted to calculate fair value. Discounts may also be applied due to the nature and/or duration of any restrictions on the disposition of the asset or
liability. Fair value represents a good faith approximation of the value of a security. Fair value determinations involve the consideration of a number of subjective factors, an analysis of applicable facts and circumstances and the exercise of judgment. As a result, it is possible that the fair value for a security determined in good faith in accordance with the Portfolio's valuation procedures may differ from valuations for the same security determined by other funds using their own valuation procedures. Although the Portfolio's valuation procedures are designed to value a security at the price the Portfolio may reasonably expect to receive upon the security's sale in an orderly transaction, there can be no assurance that any fair value determination thereunder would, in fact, approximate the amount that the Portfolio would actually realize upon the sale of the security or the price at which the security would trade if a reliable market price were readily available. During the six-month period ended June 30, 2021, there were no material changes to the fair value methodologies.
Securities which may be valued in this manner include, but are not limited to: (i) a security for which trading has been halted or suspended; (ii) a debt security that has recently gone into default and for which there is not a current market quotation; (iii) a security of an issuer that has entered into a restructuring; (iv) a security that has been delisted from a national exchange; (v) a security for which the market price is not readily available from a third-party pricing source or, if so provided, does not, in the opinion of the Manager or the Subadvisor, reflect the security's market value; (vi) a security subject to trading collars for which no or limited trading takes place; and (vii) a security whose principal market has been temporarily closed at a time when, under normal conditions, it would be open. Securities valued in this manner are generally categorized as Level 3 in the hierarchy. No securities held by the Portfolio as of June 30, 2021 were fair valued in such a manner.
Equity securities are valued at the last quoted sales prices as of the close of regular trading on the relevant exchange on each valuation date. Securities that are not traded on the valuation date are valued at the mean of the last quoted bid and ask prices. Prices are normally taken from the principal market in which each security trades. These securities are generally categorized as Level 1 in the hierarchy.
Investments in mutual funds, including money market funds, are valued at their respective NAVs at the close of business each day on the valuation date. These securities are generally categorized as Level 1 in the hierarchy.
Debt securities (other than convertible and municipal bonds) are valued at the evaluated bid prices (evaluated mean prices in the case of convertible and municipal bonds) supplied by a pricing agent or broker selected by the Manager, in consultation with the Subadvisor. The evaluations are market-based measurements processed through a pricing application and represents the pricing agent’s good faith determination as to what a holder may receive in an orderly transaction under market conditions. The rules-based logic utilizes valuation techniques that reflect participants’ assumptions and vary by asset class and per methodology, maximizing the use of relevant observable data including quoted prices for similar assets, benchmark yield curves and market corroborated inputs. The
Notes to Financial Statements (Unaudited) (continued)
evaluated bid or mean prices are deemed by the Manager, in consultation with the Subadvisor, to be representative of market values at the regular close of trading of the Exchange on each valuation date. Debt securities purchased on a delayed delivery basis are marked to market daily until settlement at the forward settlement date. Debt securities, including corporate bonds, U.S. government and federal agency bonds, municipal bonds, foreign bonds, convertible bonds, asset-backed securities and mortgage-backed securities are generally categorized as Level 2 in the hierarchy.
Loan assignments, participations and commitments are valued at the average of bid quotations obtained from the engaged independent pricing service and are generally categorized as Level 2 in the hierarchy. Certain loan assignments, participations and commitments may be valued by utilizing significant unobservable inputs obtained from the pricing service and are generally categorized as Level 3 in the hierarchy. No securities held by the Portfolio as of June 30, 2021 were fair valued in such a manner.
Temporary cash investments acquired in excess of 60 days to maturity at the time of purchase are valued using the latest bid prices or using valuations based on a matrix system (which considers such factors as security prices, yields, maturities and ratings), both as furnished by independent pricing services. Temporary cash investments that mature in 60 days or less at the time of purchase ("Short-Term Investments") are valued using the amortized cost method of valuation, unless the use of such method would be inappropriate. The amortized cost method involves valuing a security at its cost on the date of purchase and thereafter assuming a constant amortization to maturity of the difference between such cost and the value on maturity date. Amortized cost approximates the current fair value of a security. Securities valued using the amortized cost method are not valued using quoted prices in an active market and are generally categorized as Level 2 in the hierarchy.
The information above is not intended to reflect an exhaustive list of the methodologies that may be used to value portfolio investments. The valuation procedures permit the use of a variety of valuation methodologies in connection with valuing portfolio investments. The methodology used for a specific type of investment may vary based on the market data available or other considerations. The methodologies summarized above may not represent the specific means by which portfolio investments are valued on any particular business day.
(B) Income Taxes. The Portfolio's policy is to comply with the requirements of the Internal Revenue Code of 1986, as amended (the “Internal Revenue Code”), applicable to regulated investment companies and to distribute all of its taxable income to the shareholders of the Portfolio within the allowable time limits.
The Manager evaluates the Portfolio’s tax positions to determine if the tax positions taken meet the minimum recognition threshold in connection with accounting for uncertainties in income tax positions taken or expected to be taken for the purposes of measuring and recognizing tax liabilities in the financial statements. Recognition of tax benefits of an
uncertain tax position is permitted only to the extent the position is “more likely than not” to be sustained assuming examination by taxing authorities. The Manager analyzed the Portfolio's tax positions taken on federal, state and local income tax returns for all open tax years (for up to three tax years) and has concluded that no provisions for federal, state and local income tax are required in the Portfolio's financial statements. The Portfolio's federal, state and local income tax and federal excise tax returns for tax years for which the applicable statutes of limitations have not expired are subject to examination by the Internal Revenue Service and state and local departments of revenue.
(C) Dividends and Distributions to Shareholders. Dividends and distributions are recorded on the ex-dividend date. The Portfolio intends to declare and pay dividends from net investment income and distributions from net realized capital and currency gains, if any, at least annually. Unless a shareholder elects otherwise, all dividends and distributions are reinvested at NAV in the same class of shares of the Portfolio. Dividends and distributions to shareholders are determined in accordance with federal income tax regulations and may differ from determinations using GAAP.
(D) Security Transactions and Investment Income. The Portfolio records security transactions on the trade date. Realized gains and losses on security transactions are determined using the identified cost method. Dividend income is recognized on the ex-dividend date, net of any foreign tax withheld at the source, and interest income is accrued as earned using the effective interest rate method and includes any realized gains and losses from repayments of principal on mortgage-backed securities. Distributions received from real estate investment trusts may be classified as dividends, capital gains and/or return of capital. Discounts and premiums on securities purchased for the Portfolio are accreted and amortized, respectively, on the effective interest rate method.
Investment income and realized and unrealized gains and losses on investments of the Portfolio are allocated pro rata to the separate classes of shares based upon their relative net assets on the date the income is earned or realized and unrealized gains and losses are incurred.
The Portfolio may place a debt security on non-accrual status and reduce related interest income by ceasing current accruals and writing off all or a portion of any interest receivables when the collection of all or a portion of such interest has become doubtful. A debt security is removed from non-accrual status when the issuer resumes interest payments or when collectability of interest is reasonably assured.
(E) Expenses. Expenses of the Fund are allocated to the individual Portfolios in proportion to the net assets of the respective Portfolios when the expenses are incurred, except where direct allocations of expenses can be made. Expenses (other than fees incurred under the distribution and service plans, further discussed in Note 3(B), which are charged directly to the Service Class shares) are allocated to separate classes of shares pro rata based upon their relative net assets on the date the
| 34 | MainStay VP Janus Henderson Balanced Portfolio |
expenses are incurred. The expenses borne by the Portfolio, including those of related parties to the Portfolio, are shown in the Statement of Operations.
Additionally, the Portfolio may invest in mutual funds, which are subject to management fees and other fees that may cause the costs of investing in mutual funds to be greater than the costs of owning the underlying securities directly. These indirect expenses of mutual funds are not included in the amounts shown as expenses in the Statement of Operations or in the expense ratios included in the Financial Highlights.
(F) Use of Estimates. In preparing financial statements in conformity with GAAP, the Manager makes estimates and assumptions that affect the reported amounts and disclosures in the financial statements. Actual results could differ from those estimates and assumptions.
(G) Loan Assignments, Participations and Commitments. The Portfolio may invest in loan assignments and participations ("loans"). Commitments are agreements to make money available to a borrower in a specified amount, at a specified rate and within a specified time. The Portfolio records an investment when the borrower withdraws money on a commitment or when a funded loan is purchased (trade date) and records interest as earned. These loans pay interest at rates that are periodically reset by reference to a base lending rate plus a spread. These base lending rates are generally the prime rate offered by a designated U.S. bank or the London Interbank Offered Rate ("LIBOR").
The loans in which the Portfolio may invest are generally readily marketable, but may be subject to some restrictions on resale. For example, the Portfolio may be contractually obligated to receive approval from the agent bank and/or borrower prior to the sale of these investments. If the Portfolio purchases an assignment from a lender, the Portfolio will generally have direct contractual rights against the borrower in favor of the lender. If the Portfolio purchases a participation interest either from a lender or a participant, the Portfolio typically will have established a direct contractual relationship with the seller of the participation interest, but not with the borrower. Consequently, the Portfolio is subject to the credit risk of the lender or participant who sold the participation interest to the Portfolio, in addition to the usual credit risk of the borrower. In the event that the borrower, selling participant or intermediate participants become insolvent or enter into bankruptcy, the Portfolio may incur certain costs and delays in realizing payment, or may suffer a loss of principal and/or interest.
Unfunded commitments represent the remaining obligation of the Portfolio to the borrower. At any point in time, up to the maturity date of the issue, the borrower may demand the unfunded portion. Unfunded amounts, if any, are marked to market and any unrealized gains or losses are recorded in the Statement of Assets and Liabilities. As of June 30, 2021, the Portfolio did not hold any unfunded commitments.
(H) Securities Lending. In order to realize additional income, the Portfolio may engage in securities lending, subject to the limitations set forth in the 1940 Act and relevant guidance by the staff of the Securities and Exchange Commission (“SEC”). If the Portfolio engages in securities
lending, the Portfolio will lend through its custodian, JPMorgan Chase Bank, N.A., ("JPMorgan"), acting as securities lending agent on behalf of the Portfolio. Under the current arrangement, JPMorgan will manage the Portfolio's collateral in accordance with the securities lending agency agreement between the Portfolio and JPMorgan, and indemnify the Portfolio against counterparty risk. The loans will be collateralized by cash (which may be invested in a money market fund) and/or non-cash collateral (which may include U.S. Treasury securities and/or U.S. government agency securities issued or guaranteed by the United States government or its agencies or instrumentalities) at least equal at all times to the market value of the securities loaned. The Portfolio bears the risk of delay in recovery of, or loss of rights in, the securities loaned. The Portfolio may also record a realized gain or loss on securities deemed sold due to a borrower’s inability to return securities on loan. The Portfolio bears the risk of any loss on investment of cash collateral. The Portfolio will receive compensation for lending its securities in the form of fees or it will retain a portion of interest earned on the investment of any cash collateral. The Portfolio will also continue to receive interest and dividends on the securities loaned and any gain or loss in the market price of the securities loaned that may occur during the term of the loan will be for the account of the Portfolio. Income earned from securities lending activities, if any, is reflected in the Statement of Operations. Securities on loan as of June 30, 2021, are shown in the Portfolio of Investments.
Prior to February 22, 2021, these services were provided by State Street Bank and Trust Company (“State Street”).
(I) Dollar Rolls. The Portfolio may enter into dollar roll transactions in which it sells mortgage-backed securities ("MBS") from its portfolio to a counterparty from whom it simultaneously agrees to buy a similar security on a delayed delivery basis. The Portfolio generally transfers MBS where the MBS are "to be announced," therefore, the Portfolio accounts for these transactions as purchases and sales.
When accounted for as purchase and sales, the securities sold in connection with the dollar rolls are removed from the portfolio and a realized gain or loss is recognized. The securities the Portfolio has agreed to acquire are included at market value in the Portfolio of Investments and liabilities for such purchase commitments are included as payables for investments purchased. During the roll period, the Portfolio foregoes principal and interest paid on the securities. The Portfolio is compensated by the difference between the current sales price and the forward price for the future as well as by the earnings on the cash proceeds of the initial sale. Dollar rolls may be renewed without physical delivery of the securities subject to the contract. The Portfolio maintains liquid assets from its portfolio having a value not less than the repurchase price, including accrued interest. Dollar roll transactions involve certain risks, including the risk that the securities returned to the Portfolio at the end of the roll period, while substantially similar, could be inferior to what was initially sold to the counterparty.
(J) Securities Risk. The ability of issuers of debt securities held by the Portfolio to meet their obligations may be affected by, among other things, economic or political developments in a specific country, industry
Notes to Financial Statements (Unaudited) (continued)
or region. Debt securities are also subject to the risks associated with changes in interest rates.
The Portfolio may invest in high-yield debt securities (sometimes called “junk bonds”), which are generally considered speculative because they present a greater risk of loss, including default, than higher rated debt securities. These securities pay investors a premium—a higher interest rate or yield than investment grade debt securities—because of the increased risk of loss. These securities can also be subject to greater price volatility. In times of unusual or adverse market, economic or political conditions, these securities may experience higher than normal default rates.
Investments in the Portfolio are not guaranteed, even though some of the Portfolio’s underlying investments are guaranteed by the U.S. government or its agencies or instrumentalities. The principal risk of mortgage-related and asset-backed securities is that the underlying debt may be prepaid ahead of schedule, if interest rates fall, thereby reducing the value of the Portfolio’s investment. If interest rates rise, less of the debt may be prepaid and the Portfolio may lose money because the Portfolio may be unable to invest in higher yielding assets. The Portfolio is subject to interest-rate risk and can lose principal value when interest rates rise. Bonds are also subject to credit risk, in which the bond issuer may fail to pay interest and principal in a timely manner.
The Portfolio’s investments may include loans which are usually rated below investment grade and are generally considered speculative because they present a greater risk of loss, including default, than higher rated debt securities. These investments pay investors a higher interest rate than investment grade debt securities because of the increased risk of loss. Although certain loans are collateralized, there is no guarantee that the value of the collateral will be sufficient to repay the loan. In a recession or serious credit event, the value of these investments could decline significantly. As a result, the Portfolio’s NAVs could go down and you could lose money.
In addition, loans generally are subject to extended settlement periods that may be longer than seven days. As a result, the Portfolio may be adversely affected by selling other investments at an unfavorable time and/or under unfavorable conditions or engaging in borrowing transactions, such as borrowing against its credit facility, to raise cash to meet redemption obligations or pursue other investment opportunities.
In certain circumstances, loans may not be deemed to be securities. As a result, the Portfolio may not have the protection of anti-fraud provisions of the federal securities laws. In such cases, the Portfolio generally must rely on the contractual provisions in the loan agreement and common-law fraud protections under applicable state law.
The Portfolio may invest in foreign securities, both debt and equity securities, which carry certain risks that are in addition to the usual risks inherent in domestic securities. These risks include those resulting from currency fluctuations, future adverse political or economic developments and possible imposition of currency exchange blockages or other foreign governmental laws or restrictions. These risks are likely to be greater in
emerging markets than in developed markets. The ability of issuers of securities held by the Portfolio to meet their obligations may be affected by, among other things, economic or political developments in a specific country, industry or region.
(K) LIBOR Replacement Risk. The Portfolio may invest in certain debt securities, derivatives or other financial instruments that utilize the LIBOR, as a “benchmark” or “reference rate” for various interest rate calculations. The United Kingdom Financial Conduct Authority, which regulates LIBOR, announced that after 2021 it will cease its active encouragement of banks to provide the quotations needed to sustain LIBOR. However, it is possible that certain LIBOR tenors may continue beyond 2021 and the most widely used LIBOR tenors may continue until mid-2023. As a result, it is anticipated that LIBOR will be discontinued or will no longer be sufficiently robust to be representative of its underlying market around that time. Although financial regulators and industry working groups have suggested alternative reference rates, such as European Interbank Offer Rate (“EURIBOR”), Sterling Overnight Interbank Average Rate (“SONIA”) and Secured Overnight Financing Rate (“SOFR”), there are challenges to converting certain contracts and transactions to a new benchmark and neither the full effects of the transition process nor its ultimate outcome is known. New York Life Investments is currently working to assess exposure and will modify contracts as necessary.
The elimination of LIBOR or changes to other reference rates or any other changes or reforms to the determination or supervision of reference rates could have an adverse impact on the market for, or value of, any securities or payments linked to those reference rates, which may adversely affect the Portfolio's performance and/or net asset value. Uncertainty and risk also remain regarding the willingness and ability of issuers and lenders to include revised provisions in new and existing contracts or instruments. Consequently, the transition away from LIBOR to other reference rates may lead to increased volatility and illiquidity in markets that are tied to LIBOR, fluctuations in values of LIBOR-related investments or investments in issuers that utilize LIBOR, increased difficulty in borrowing or refinancing and diminished effectiveness of hedging strategies, adversely affecting the Portfolio's performance. Furthermore, the risks associated with the expected discontinuation of LIBOR and transition may be exacerbated if the work necessary to effect an orderly transition to an alternative reference rate is not completed in a timely manner. Because the usefulness of LIBOR as a benchmark could deteriorate during the transition period, these effects could occur prior to the end of 2021 with respect to certain LIBOR tenors or mid-2023 for the remaining LIBOR tenors.
(L) Indemnifications. Under the Fund’s organizational documents, its officers and trustees are indemnified against certain liabilities that may arise out of performance of their duties to the Fund. Additionally, in the normal course of business, the Portfolio enters into contracts with third-party service providers that contain a variety of representations and warranties and that may provide general indemnifications. The Portfolio's maximum exposure under these arrangements is unknown, as this would involve future claims that may be made against the Portfolio that have not
| 36 | MainStay VP Janus Henderson Balanced Portfolio |
yet occurred. The Manager believes that the risk of loss in connection with these potential indemnification obligations is remote. However, there can be no assurance that material liabilities related to such obligations will not arise in the future, which could adversely impact the Portfolio.
Note 3–Fees and Related Party Transactions
(A) Manager and Subadvisor. New York Life Investments, a registered investment adviser and an indirect, wholly-owned subsidiary of New York Life, serves as the Portfolio’s Manager pursuant to an Amended and Restated Management Agreement (“Management Agreement”). The Manager provides offices, conducts clerical, recordkeeping and bookkeeping services, and keeps most of the financial and accounting records required to be maintained by the Portfolio. Except for the portion of salaries and expenses that are the responsibility of the Portfolio, the Manager pays the salaries and expenses of all personnel affiliated with the Portfolio and certain operational expenses of the Portfolio. The Portfolio reimburses New York Life Investments in an amount equal to the portion of the compensation of the Chief Compliance Officer attributable to the Portfolio. Janus Capital Management LLC (“Janus” or the “Subadvisor”), a registered investment adviser and wholly-owned subsidiary of Janus Henderson Group PLC, doing business as Janus Henderson Investors, serves as Subadvisor to the Portfolio and is responsible for the day-to-day portfolio management of the Portfolio. Pursuant to the terms of a Subadvisory Agreement (“Subadvisory Agreement”) between New York Life Investments and Janus, New York Life Investments pays for the services of the Subadvisor.
Pursuant to the Management Agreement, the Fund pays the Manager, on behalf of the Portfolio, a monthly fee for the services performed and the facilities furnished at an annual rate of the Portfolio's average daily net assets as follows: 0.55% up to $1 billion; 0.525% from $1 billion to $2 billion; and 0.515% in excess of $2 billion. During the six-month period ended June 30, 2021, the effective management fee rate was 0.54%.
During the six-month period ended June 30, 2021, New York Life Investments earned fees from the Portfolio in the amount of $4,062,237 and paid the Subadvisor fees in the amount of $1,901,090.
JPMorgan provides sub-administration and sub-accounting services to the Portfolio pursuant to an agreement with New York Life Investments. These services include calculating the daily NAVs of the Portfolio, maintaining the general ledger and sub-ledger accounts for the calculation of the Portfolio's NAVs, and assisting New York Life Investments in conducting various aspects of the Portfolio's administrative operations. For providing these services to the Portfolio, JPMorgan is compensated by New York Life Investments.
Prior to February 22, 2021, these services were provided by State Street.
Pursuant to an agreement between the Fund and New York Life Investments, New York Life Investments is responsible for providing or procuring certain regulatory reporting services for the Portfolio. The Portfolio will reimburse New York Life Investments for the actual costs incurred by New York Life Investments in connection with providing or procuring these services for the Portfolio.
(B) Distribution and Service Fees. The Fund, on behalf of the Portfolio, has entered into a distribution agreement with NYLIFE Distributors LLC (the “Distributor”), an affiliate of New York Life Investments. The Portfolio has adopted a distribution plan (the “Plan”) in accordance with the provisions of Rule 12b-1 under the 1940 Act. Under the Plan, the Distributor has agreed to provide, through its affiliates or independent third parties, various distribution-related, shareholder and administrative support services to the Service Class shareholders. For its services, the Distributor is entitled to a combined distribution and service fee accrued daily and paid monthly at an annual rate of 0.25% of the average daily net assets attributable to the Service Class shares of the Portfolio.
(C) Investments in Affiliates (in 000’s). During the six-month period ended June 30, 2021, purchases and sales transactions, income earned from investments and shares held of investment companies managed by New York Life Investments or its affiliates were as follows:
| Affiliated Investment Companies | Value,
Beginning
of Period | Purchases
at Cost | Proceeds
from
Sales | Net
Realized
Gain/(Loss)
on Sales | Change in
Unrealized
Appreciation/
(Depreciation) | Value,
End of
Period | Dividend
Income | Other
Distributions | Shares
End of
Period |
| MainStay U.S. Government Liquidity Fund | $ 33,485 | $ 193,595 | $ (169,520) | $ — | $ — | $ 57,560 | $ 2 | $ — | 57,560 |
Notes to Financial Statements (Unaudited) (continued)
Note 4-Federal Income Tax
As of June 30, 2021, the cost and unrealized appreciation (depreciation) of the Portfolio’s investment portfolio, including applicable derivative contracts and other financial instruments, as determined on a federal income tax basis, were as follows:
| | Federal Tax
Cost | Gross
Unrealized
Appreciation | Gross
Unrealized
(Depreciation) | Net
Unrealized
Appreciation/
(Depreciation) |
| Investments in Securities | $1,200,900,124 | $445,060,003 | $(2,256,616) | $442,803,387 |
During the year ended December 31, 2020, the tax character of distributions paid as reflected in the Statements of Changes in Net Assets was as follows:
| | 2020 |
| Distributions paid from: | |
| Ordinary Income | $33,150,432 |
| Long-Term Capital Gains | 37,119,474 |
| Total | $70,269,906 |
Note 5–Custodian
JPMorgan is the custodian of cash and securities held by the Portfolio. Custodial fees are charged to the Portfolio based on the Portfolio's net assets and/or the market value of securities held by the Portfolio and the number of certain transactions incurred by the Portfolio.
Prior to February 22, 2021, these services were provided by State Street. The services provided by State Street were a direct expense of the Portfolio and are included in the Statement of Operations as Custodian fees which totaled $8,391 for the period January 1, 2021 through February 21, 2021.
Note 6–Line of Credit
The Portfolio and certain other funds managed by New York Life Investments maintain a line of credit with a syndicate of banks in order to secure a source of funds for temporary purposes to meet unanticipated or excessive redemption requests.
Effective July 27, 2021, under the credit agreement (the “Credit Agreement”), the aggregate commitment amount is $600,000,000 with an additional uncommitted amount of $100,000,000. The commitment fee is an annual rate of 0.15% of the average commitment amount payable quarterly, regardless of usage, to JPMorgan, who serves as the agent to the syndicate. The commitment fee is allocated among the Portfolio and certain other funds managed by New York Life Investments based upon their respective net assets and other factors. Interest on any revolving credit loan is charged based upon the Federal Funds Rate or the one-month LIBOR, whichever is higher. The Credit Agreement expires on July 26, 2022, although the Portfolio, certain other funds managed by New York Life Investments and the syndicate of banks may renew the
Credit Agreement for an additional year on the same or different terms or enter into a credit agreement with a different syndicate of banks. Prior to July 27, 2021, the aggregate commitment amount and the commitment fee were the same as those under the current Credit Agreement. During the six-month period ended June 30, 2021, there were no borrowings made or outstanding with respect to the Portfolio under the Credit Agreement.
Note 7–Interfund Lending Program
Pursuant to an exemptive order issued by the SEC, the Portfolio, along with certain other funds managed by New York Life Investments, may participate in an interfund lending program. The interfund lending program provides an alternative credit facility that permits the Portfolio and certain other funds managed by New York Life Investments to lend or borrow money for temporary purposes directly to or from one another, subject to the conditions of the exemptive order. During the six-month period ended June 30, 2021, there were no interfund loans made or outstanding with respect to the Portfolio.
Note 8–Purchases and Sales of Securities (in 000’s)
During the six-month period ended June 30, 2021, purchases and sales of U.S. government securities were $312,525 and $247,048, respectively. Purchases and sales of securities, other than U.S. government securities and short-term securities, were $506,071 and $558,531 respectively.
Note 9–Capital Share Transactions
Transactions in capital shares for the six-month period ended June 30, 2021 and the year ended December 31, 2020, were as follows:
| Initial Class | Shares | Amount |
| Period ended June 30, 2021: | | |
| Shares sold | 207,608 | $ 3,251,403 |
| Shares redeemed | (1,165,158) | (18,247,797) |
| Net increase (decrease) | (957,550) | $ (14,996,394) |
| Year ended December 31, 2020: | | |
| Shares sold | 758,889 | $ 10,891,846 |
| Shares issued to shareholders in reinvestment of distributions | 1,448,943 | 20,833,044 |
| Shares redeemed | (3,611,218) | (50,728,001) |
| Net increase (decrease) | (1,403,386) | $ (19,003,111) |
| |
| 38 | MainStay VP Janus Henderson Balanced Portfolio |
| Service Class | Shares | Amount |
| Period ended June 30, 2021: | | |
| Shares sold | 3,917,295 | $ 60,073,738 |
| Shares redeemed | (2,438,547) | (37,570,787) |
| Net increase (decrease) | 1,478,748 | $ 22,502,951 |
| Year ended December 31, 2020: | | |
| Shares sold | 11,648,966 | $ 163,143,397 |
| Shares issued to shareholders in reinvestment of distributions | 3,461,335 | 49,436,862 |
| Shares redeemed | (12,044,352) | (166,292,748) |
| Net increase (decrease) | 3,065,949 | $ 46,287,511 |
Note 10–Other Matters
An outbreak of COVID-19, first detected in December 2019, has developed into a global pandemic and has resulted in travel restrictions, closure of international borders, certain businesses and securities markets, restrictions on securities trading activities, prolonged quarantines, supply chain disruptions, and lower consumer demand, as well as general concern and uncertainty. The continued impact of COVID-19 and related new variants is uncertain and could further adversely affect the global economy, national economies, individual issuers and capital markets in unforeseeable ways and result in a substantial and extended economic downturn. Developments that disrupt global economies and financial markets, such as COVID-19, may magnify factors that affect the Portfolio's performance.
Note 11–Subsequent Events
In connection with the preparation of the financial statements of the Portfolio as of and for the six-month period ended June 30, 2021, events and transactions subsequent to June 30, 2021, through the date the financial statements were issued have been evaluated by the Manager for possible adjustment and/or disclosure. No subsequent events requiring financial statement adjustment or disclosure have been identified.
Discussion of the Operation and Effectiveness of the Portfolio's Liquidity Risk Management Program (Unaudited)
In compliance with Rule 22e-4 under the Investment Company Act of 1940, as amended (the “Liquidity Rule”), the Portfolio has adopted and implemented a liquidity risk management program (the “Program”), which New York Life Investment Management LLC believes is reasonably designed to assess and manage the Portfolio's liquidity risk (the risk that the Portfolio could not meet requests to redeem shares issued by the Portfolio without significant dilution of remaining investors’ interests in the Portfolio). The Board of Trustees of MainStay VP Funds Trust (the "Board") designated New York Life Investment Management LLC as administrator of the Program (the “Administrator”). The Administrator has established a Liquidity Risk Management Committee to assist the Administrator in the implementation and day-to-day administration of the Program and to otherwise support the Administrator in fulfilling its responsibilities under the Program.
At a meeting of the Board held on March 8, 2021, the Administrator provided the Board with a written report addressing the Program’s operation and assessing its adequacy and effectiveness of implementation for the period from January 1, 2020 through December 31, 2020 (the "Review Period"), as required under the Liquidity Rule. The report noted that the Administrator concluded that (i) the Program operated effectively to assess and manage the Portfolio's liquidity risk, (ii) the Program has been adequately and effectively implemented to monitor and, as applicable, respond to the Portfolio's liquidity developments and (iii) the Portfolio's investment strategy continues to be appropriate for an open-end fund. In addition, the report discussed notable events that impacted liquidity risk during the Review Period, including the COVID-19 pandemic and the resulting economic shutdown.
In accordance with the Program, the Portfolio's liquidity risk is assessed no less frequently than annually taking into consideration certain factors, as applicable, such as (i) investment strategy and liquidity of portfolio investments, (ii) short-term and long-term cash flow projections and (iii) holdings of cash and cash equivalents, as well as borrowing arrangements and other funding sources. Certain factors are considered under both normal and reasonably foreseeable stressed conditions.
Each Portfolio portfolio investment is classified into one of four liquidity categories. The classification is based on a determination of the number of days it is reasonably expected to take to convert the investment into cash, or sell or dispose of the investment, in current market conditions without significantly changing the market value of the investment. The Administrator has delegated liquidity classification determinations to the Portfolio’s subadvisor, subject to appropriate oversight by the Administrator, and classification determinations are made by taking into account the Portfolio's reasonably anticipated trade size, various market, trading and investment-specific considerations, as well as market depth, and, in certain cases, third-party vendor data.
The Liquidity Rule requires portfolios that do not primarily hold assets that are highly liquid investments to adopt a minimum amount of net assets that must be invested in highly liquid investments that are assets (an “HLIM”). In addition, the Liquidity Rule limits a portfolio's investments in illiquid investments. Specifically, the Liquidity Rule prohibits acquisition of illiquid investments if doing so would result in a portfolio holding more than 15% of its net assets in illiquid investments that are assets. The Program includes provisions reasonably designed to determine, periodically review and comply with the HLIM requirement, as applicable, and to comply with the 15% limit on illiquid investments.
There can be no assurance that the Program will achieve its objectives under all circumstances in the future. Please refer to the Portfolio's prospectus for more information regarding the Portfolio's exposure to liquidity risk and other risks to which it may be subject.
| 40 | MainStay VP Janus Henderson Balanced Portfolio |
Proxy Voting Record
The Portfolio is required to file with the SEC its proxy voting records for the 12-month period ending June 30 on Form N-PX. The Portfolio's most recent Form N-PX or proxy voting record is available free of charge upon request (i) by calling 800-598-2019; (ii) by visiting New York Life Investments’ website at https://www.nylinvestments.com/mainstay/
products-and-performance/mainstay-vp-funds-trust; or (iii) by visiting the SEC’s website at www.sec.gov.
Shareholder Reports and Quarterly Portfolio Disclosure
The Portfolio is required to file its complete schedule of portfolio holdings with the SEC 60 days after its first and third fiscal quarter on Form N-PORT. The Portfolio's holdings report is available free of charge upon request by calling 800-598-2019 or by visiting the SEC’s website at www.sec.gov.
This page intentionally left blank
MainStay VP Portfolios
MainStay VP offers a wide range of Portfolios. The full array of MainStay VP offerings is listed here, with information about the manager, subadvisors, legal counsel, and independent registered public accounting firm.
Equity
MainStay VP Candriam Emerging Markets Equity Portfolio
MainStay VP Epoch U.S. Equity Yield Portfolio
MainStay VP Fidelity Institutional AM® Utilities Portfolio†
MainStay VP MacKay International Equity Portfolio
MainStay VP MacKay S&P 500 Index Portfolio
MainStay VP Natural Resources Portfolio
MainStay VP Small Cap Growth Portfolio
MainStay VP T. Rowe Price Equity Income Portfolio
MainStay VP Wellington Growth Portfolio
MainStay VP Wellington Mid Cap Portfolio
MainStay VP Wellington Small Cap Portfolio
MainStay VP Wellington U.S. Equity Portfolio
MainStay VP Winslow Large Cap Growth Portfolio
Mixed Asset
MainStay VP Balanced Portfolio
MainStay VP Income Builder Portfolio
MainStay VP Janus Henderson Balanced Portfolio
MainStay VP MacKay Convertible Portfolio
Income
MainStay VP Bond Portfolio
MainStay VP Floating Rate Portfolio
MainStay VP Indexed Bond Portfolio
MainStay VP MacKay Government Portfolio
MainStay VP MacKay High Yield Corporate Bond Portfolio
MainStay VP MacKay Strategic Bond Portfolio
MainStay VP PIMCO Real Return Portfolio
Money Market
MainStay VP U.S. Government Money Market Portfolio
Alternative
MainStay VP CBRE Global Infrastructure Portfolio
MainStay VP IQ Hedge Multi-Strategy Portfolio
Asset Allocation
MainStay VP Conservative Allocation Portfolio
MainStay VP Equity Allocation Portfolio
MainStay VP Growth Allocation Portfolio
MainStay VP Moderate Allocation Portfolio
Manager
New York Life Investment Management LLC
New York, New York
Subadvisors
Brown Advisory LLC
Baltimore, Maryland
Candriam Belgium S.A.*
Brussels, Belgium
CBRE Clarion Securities LLC
Radnor, Pennsylvania
Epoch Investment Partners, Inc.
New York, New York
FIAM LLC
Smithfield, Rhode Island
IndexIQ Advisors LLC*
New York, New York
Janus Capital Management LLC
Denver, Colorado
MacKay Shields LLC*
New York, New York
Mellon Investments Corporation
Boston, Massachusetts
NYL Investors LLC*
New York, New York
Pacific Investment Management Company LLC
Newport Beach, California
Segall Bryant & Hamill, LLC
Chicago, Illinois
T. Rowe Price Associates, Inc.
Baltimore, Maryland
Wellington Management Company LLP
Boston, Massachusetts
Winslow Capital Management, LLC
Minneapolis, Minnesota
Legal Counsel
Dechert LLP
Washington, District of Columbia
Independent Registered Public Accounting Firm
PricewaterhouseCoopers LLP
New York, New York
Distributor
NYLIFE Distributors LLC*
Jersey City, New Jersey
Custodian
JPMorgan Chase Bank, N.A.
New York, New York
Some Portfolios may not be available in all products.
† Fidelity Institutional AM is a registered trade mark of FMR LLC. Used with permission.
* An affiliate of New York Life Investment Management LLC
Not part of the Semiannual Report
2021 Semiannual Report
This report is for the general information of New York Life Variable Annuities and NYLIAC Variable Universal Life Insurance Products policyowners. It must be preceded or accompanied by the appropriate product(s) and funds prospectuses if it is given to anyone who is not an owner of a New York Life variable annuity policy or a NYLIAC Variable Universal Life Insurance Product. This report does not offer for sale or solicit orders to purchase securities.
The performance data quoted in this report represents past performance. Past performance is no guarantee of future results. Due to market volatility and other factors, current performance may be lower or higher than the figures shown. The most recent month-end performance summary for your variable annuity or variable life policy is available by calling 800-598-2019 and is updated periodically on newyorklife.com.
The New York Life Variable Annuities and NYLIAC Variable Universal Life Insurance Products are issued by New York Life Insurance and Annuity Corporation (a Delaware Corporation) and distributed by NYLIFE Distributors LLC (Member FINRA/SIPC).
New York Life Insurance Company
New York Life Insurance and Annuity
Corporation (NYLIAC) (A Delaware Corporation)
51 Madison Avenue, Room 551
New York, NY 10010
newyorklife.com
nylinvestments.com
NYLIFE Distributors LLC, 30 Hudson Street, Jersey City, NJ 07302
New York Life Investment Management LLC is the investment manager to the MainStay VP Funds Trust
©2021 by NYLIFE Distributors LLC. All rights reserved.
You may obtain copies of the Prospectus and the Statement of Additional Information free of charge, upon request, by calling toll-free 800-598-2019 or writing to New York Life Insurance and Annuity Corporation, 51 Madison Avenue, New York, NY 10010.
| Not FDIC Insured | No Bank Guarantee | May Lose Value |
(NYLIAC) NI524
MainStay VP Floating Rate Portfolio
Message from the President and Semiannual Report
Unaudited | June 30, 2021
Sign up for e-delivery of your shareholder reports. For full details on e-delivery, including who can participate and what you can receive via e-delivery,
please log in to newyorklifeinvestments.com/accounts.
| Not FDIC/NCUA Insured | Not a Deposit | May Lose Value | No Bank Guarantee | Not Insured by Any Government Agency |
This page intentionally left blank
Message from the President
The COVID-19 pandemic continued to afflict our personal lives and broad segments of the U.S. and global economy throughout the six-month reporting period ended June 30, 2021. However, with the deployment of multiple vaccines around the world, including three highly effective versions approved for emergency use in the United States, investors began to turn their attention toward the gradual reopening of the economy and the shape the “new normal” would take.
The first half of the reporting period saw increasing inflationary concerns as fiscal stimulus business reopenings drove accelerating economic growth, rising commodity prices and increased consumer spending. However, the U.S. Federal Reserve noted that price increases were likely to prove temporary and made clear their intention to remain accommodative for the foreseeable future. Accordingly, after moving higher in the first quarter of 2021, interest rates declined in the second quarter.
In response to the uncertain inflation outlook, equity market leadership shifted from value in the first quarter of the year to growth in the second quarter. Nevertheless, investor sentiment remained buoyant throughout the reporting period, with all eleven sectors in the S&P 500® Index, a widely regarded benchmark of market performance, producing positive returns. Energy led the market’s rise fueled by rapidly increasing oil and gas prices, followed by financials and real estate, which benefited from rising interest rates and the economic reopening, respectively. Communication services produced the slowest growth, followed by the traditionally defensive utilities and consumer staples
sectors. In the fixed income market, lower-credit-quality issues tended to outperform their higher-grade counterparts, with high-yield corporate bonds generating the strongest performance. Among securitized products, commercial mortgage-backed securities generally produced the strongest returns, followed by mortgage-backed securities and asset-backed securities, while Treasury securities lagged.
Despite the tremendous progress we’ve seen so far this year, the United States and the world continue to face significant pandemic-related challenges. Newer, more contagious variants of COVID-19 threaten the return of restrictions and lockdowns that could stall the economic recovery. At the same time, supply chain shortages have led to rising prices on everything from laptops to autos, stoking fears of uncontrolled inflation despite reassurance from the U.S. Federal Reserve. At New York Life Investments, we recognize that the shape that the “new normal” eventually takes may differ from our expectations. You can depend on us to keep a sharp watch for the unexpected, and to continue to help you find your way through this rapidly evolving investment landscape.
Sincerely,
Kirk C. Lehneis
President
The opinions expressed are as of the date of this report and are subject to change. There is no guarantee that any forecast made will come to pass. This material does not constitute investment advice and is not intended as an endorsement of any specific investment. Past performance is no guarantee of future results.
Not part of the Semiannual Report
Investors should refer to the Portfolio’s Summary Prospectus and/or Prospectus and consider the Portfolio’s investment objectives, strategies, risks, charges and expenses carefully before investing. The Summary Prospectus and/or Prospectus contain this and other information about the Portfolio. You may obtain copies of the Portfolio’s Summary Prospectus and/or the Prospectus and the Statement of Additional Information free of charge, upon request, by calling toll-free 800-598-2019, by writing to New York Life Insurance and Annuity Corporation, 51 Madison Avenue, Room 251, New York, New York 10010 or by sending an email to MainStayShareholdersServices@nylim.com. These documents are also available at nylinvestments.com/vpdocuments. Please read the Portfolio's Summary Prospectus and/or Prospectus carefully before investing. MainStay VP Funds Trust portfolios are separate account options which are purchased through a variable insurance or variable annuity contract.
Investment and Performance Comparison (Unaudited)
Performance data quoted represents past performance. Past performance is no guarantee of future results. Because of market volatility and other factors, current performance may be lower or higher than the figures shown. Investment return and principal value will fluctuate, and as a result, when shares are redeemed, they may be worth more or less than their original cost. The performance table and graph do not reflect any deduction of sales charges, mortality and expense charges, contract charges or administrative charges. Please refer to the Performance Summary appropriate for your policy. For performance information current to the most recent month-end, please call 800-598-2019 or visit www.newyorklife.com.
Performance figures may reflect certain fee waivers and/or expense limitations, without which total returns may have been different. For information on current fee waivers and/or expense limitations (if any), please refer to the Notes to Financial Statements.
| Average Annual Total Returns for the Period-Ended June 30, 2021 |
| Class | Inception
Date | Six
Months | One
Year | Five
Years | Ten
Years | Gross
Expense
Ratio1 |
| Initial Class Shares | 5/2/2005 | 2.39% | 9.72% | 4.29% | 3.83% | 0.65% |
| Service Class Shares | 5/2/2005 | 2.26 | 9.44 | 4.02 | 3.56 | 0.90 |
| 1. | The gross expense ratios presented reflect the Portfolio’s “Total Annual Portfolio Operating Expenses” from the most recent Prospectus, as supplemented, and may differ from other expense ratios disclosed in this report. |
| Benchmark Performance | Six
Months | One
Year | Five
Years | Ten
Years |
| S&P/LSTA Leveraged Loan Index1 | 3.28% | 11.65% | 4.99% | 4.39% |
| Morningstar Bank Loan Category Average2 | 2.83 | 9.97 | 3.89 | 3.66 |
| 1. | The S&P/LSTA Leveraged Loan Index is the Portfolio's primary benchmark. The S&P/LSTA Leveraged Loan Index is a broad-based index designed to reflect the performance of U.S. dollar facilities in the leveraged loan market. Results assume reinvestment of all dividends and capital gains. An investment cannot be made directly in an index. |
| 2. | The Morningstar Bank Loan Category Average is representative of funds that invest in floating-rate bank loans instead of bonds. In exchange for their credit risk, these loans offer high interest payments that typically float above a common short-term benchmark. Results are based on average total returns of similar funds with all dividends and capital gain distributions reinvested. |
Cost in Dollars of a $1,000 Investment in MainStay VP Floating Rate Portfolio (Unaudited)
The example below is intended to describe the fees and expenses borne by shareholders during the six-month period from January 1, 2021 to June 30, 2021, and the impact of those costs on your investment.
Example
As a shareholder of the Portfolio you incur two types of costs: (1) transaction costs, including exchange fees and sales charges (loads) on purchases (as applicable), and (2) ongoing costs, including management fees, distribution and/or service (12b-1) fees, and other Portfolio expenses (as applicable). This example is intended to help you understand your ongoing costs (in dollars) of investing in the Portfolio and to compare these costs with the ongoing costs of investing in other mutual funds. The example is based on an investment of $1,000 made at the beginning of the six-month period and held for the entire period from January 1, 2021 to June 30, 2021. Shares are only sold in connection with variable life and annuity contracts and the example does not reflect any contract level or transactional fees or expenses. If these costs had been included, your costs would have been higher.
This example illustrates your Portfolio’s ongoing costs in two ways:
Actual Expenses
The second and third data columns in the table below provide information about actual account values and actual expenses. You may use the information in these columns, together with the amount you invested, to estimate the expenses that you paid during the six months ended June
30, 2021. Simply divide your account value by $1,000 (for example, an $8,600 account value divided by $1,000 = 8.6), then multiply the result by the number under the heading entitled “Expenses Paid During Period” to estimate the expenses you paid on your account during this period.
Hypothetical Example for Comparison Purposes
The fourth and fifth data columns in the table below provide information about hypothetical account values and hypothetical expenses based on the Portfolio’s actual expense ratio and an assumed rate of return of 5% per year before expenses, which is not the Portfolio’s actual return. The hypothetical account values and expenses may not be used to estimate the actual ending account balances or expenses you paid for the six-month period shown. You may use this information to compare the ongoing costs of investing in the Portfolio with the ongoing costs of investing in other mutual funds. To do so, compare this 5% hypothetical example with the 5% hypothetical examples that appear in the shareholder reports of the other mutual funds.
Please note that the expenses shown in the table are meant to highlight your ongoing costs only and do not reflect any transactional costs, such as exchange fees or sales charges (loads). Therefore, the fourth and fifth data columns of the table are useful in comparing ongoing costs only and will not help you determine the relative total costs of owning different funds. In addition, if these transactional costs were included, your costs would have been higher.
| Share Class | Beginning
Account
Value
1/1/21 | Ending Account
Value (Based
on Actual
Returns and
Expenses)
6/30/21 | Expenses
Paid
During
Period1 | Ending Account
Value (Based
on Hypothetical
5% Annualized
Return and
Actual Expenses)
6/30/21 | Expenses
Paid
During
Period1 | Net Expense
Ratio
During
Period2 |
| Initial Class Shares | $1,000.00 | $1,023.90 | $3.26 | $1,021.57 | $3.26 | 0.65% |
| Service Class Shares | $1,000.00 | $1,022.60 | $4.51 | $1,020.33 | $4.51 | 0.90% |
| 1. | Expenses are equal to the Portfolio’s annualized expense ratio of each class multiplied by the average account value over the period, divided by 365 and multiplied by 181 (to reflect the six-month period). The table above represents the actual expenses incurred during the six-month period. In addition to the fees and expenses which the Portfolio bears directly, it also indirectly bears a pro rata share of the fees and expenses of the underlying funds in which it invests. Such indirect expenses are not included in the above-reported expense figures. |
| 2. | Expenses are equal to the Portfolio's annualized expense ratio to reflect the six-month period. |
| 6 | MainStay VP Floating Rate Portfolio |
Industry Composition as of June 30, 2021 (Unaudited)
| Electronics | 11.9% |
| Healthcare, Education & Childcare | 9.7 |
| Finance | 8.4 |
| Hotels, Motels, Inns & Gaming | 4.8 |
| Telecommunications | 4.7 |
| Chemicals, Plastics & Rubber | 4.6 |
| Broadcasting & Entertainment | 4.2 |
| Diversified/Conglomerate Manufacturing | 3.9 |
| Containers, Packaging & Glass | 3.6 |
| Insurance | 3.2 |
| Utilities | 3.1 |
| Aerospace & Defense | 2.9 |
| Buildings & Real Estate | 2.8 |
| Diversified/Conglomerate Service | 2.5 |
| Personal, Food & Miscellaneous Services | 2.4 |
| Beverage, Food & Tobacco | 2.2 |
| Retail Store | 2.0 |
| Leisure, Amusement, Motion Pictures & Entertainment | 2.0 |
| Personal & Nondurable Consumer Products | 1.9 |
| Commercial Services | 1.9 |
| Automobile | 1.6 |
| Banking | 1.6 |
| Oil & Gas | 1.5 |
| Services: Business | 1.4 |
| Machinery (Non–Agriculture, Non–Construct & Non–Electronic) | 1.3 |
| Manufacturing | 1.1 |
| Mining, Steel, Iron & Non–Precious Metals | 1.0 |
| Printing & Publishing | 1.0 |
| Entertainment | 0.9 |
| Personal & Nondurable Consumer Products (Manufacturing Only) | 0.5 |
| Retail | 0.5 |
| Personal Transportation | 0.4 |
| Electric | 0.4% |
| Affiliated Investment Company | 0.3 |
| Cargo Transport | 0.3 |
| Ecological | 0.3 |
| Environmental Control | 0.3 |
| Home and Office Furnishings, Housewares & Durable Consumer Products | 0.2 |
| Media | 0.2 |
| Lodging | 0.2 |
| Real Estate | 0.2 |
| Packaging & Containers | 0.2 |
| Radio and TV Broadcasting | 0.1 |
| Pharmaceuticals | 0.1 |
| Auto Manufacturers | 0.1 |
| Food | 0.1 |
| Iron & Steel | 0.1 |
| Distribution & Wholesale | 0.1 |
| Real Estate Investment Trusts | 0.1 |
| Building Materials | 0.1 |
| Chemicals | 0.1 |
| Oil & Gas Services | 0.1 |
| Airlines | 0.1 |
| Software | 0.1 |
| Healthcare–Services | 0.0‡ |
| Machinery–Diversified | 0.0‡ |
| Health Care Equipment & Supplies | 0.0‡ |
| Health Care Providers & Services | 0.0‡ |
| Metals & Mining | 0.0‡ |
| Communications Equipment | 0.0‡ |
| Independent Power and Renewable Electricity Producers | 0.0‡ |
| Short–Term Investments | 8.5 |
| Other Assets, Less Liabilities | –7.8 |
| | 100.0% |
‡ Less than one-tenth of a percent.
See Portfolio of Investments beginning on page 10 for specific holdings within these categories. The Portfolio's holdings are subject to change.
Top Ten Issuers Held as of June 30, 2021 (excluding short-term investments) (Unaudited)
| 1. | Sunshine Luxembourg VII SARL, 4.50%, due 10/1/26 |
| 2. | Peraton Corp., 4.50%, due 2/1/28 |
| 3. | Organon & Co., 3.50%-5.125%, due 6/2/28–4/30/31 |
| 4. | SS&C Technologies Holdings, Inc., 1.854%, due 4/16/25 |
| 5. | Asurion LLC, 3.104%-5.354%, due 11/3/23–1/31/28 |
| 6. | Triton Water Holdings, Inc., 4.00%, due 3/31/28 |
| 7. | Scientific Games International, Inc., 2.854%-7.00%, due 8/14/24–5/15/28 |
| 8. | Prime Security Services Borrower LLC, 3.50%-6.25%, due 9/23/26–1/15/28 |
| 9. | IRB Holding Corp., 3.75%-7.00%, due 2/5/25–12/15/27 |
| 10. | TransDigm, Inc., 2.354%, due 5/30/25–12/9/25 |
Portfolio Management Discussion and Analysis (Unaudited)
Answers to the questions reflect the views of portfolio managers Robert H. Dial, Mark A. Campellone and Arthur S. Torrey of NYL Investors LLC, the Portfolio’s Subadvisor.
How did MainStay VP Floating Rate Portfolio perform relative to its benchmark and peers during the six months ended June 30, 2021?
For the six months ended June 30, 2021, MainStay VP Floating Rate Portfolio returned 2.39% for Initial Class shares and 2.26% for Service Class shares. Over the same period, both share classes underperformed the 3.28% return of the S&P/LSTA Leveraged Loan Index (“the Index”), which is the Portfolio’s benchmark. As of June 30, 2021, both share classes underperformed the 2.83% return of the Morningstar Bank Loan Category Average.1
What factors affected the Portfolio’s relative performance during the reporting period?
Market conditions were generally favorable during the reporting period, with the floating-rate market realizing positive performance consistent with other risk assets, including equities and high yield. These risk assets generally continue to recover from the pandemic-related market sell-off that occurred in February and March of 2020, the most severe sell-off since the Global Financial Crisis that began in 2008. Those segments of the loan market that underperformed the most during 2020, including lower credit quality and more COVID-sensitive sectors, tended to outperform in the current reporting period. The Portfolio has historically been positioned with higher credit quality and less exposure to COVID-impacted sectors, and underperformed as a result.
What was the Portfolio’s duration2 strategy during the reporting period?
Floating-rate loans are, by their nature, a low-duration asset. Loans earn a stated spread3 over a floating reference rate, which is the London InterBank Offered Rate (“LIBOR”)4. Issuers can generally borrow under a 30- to 90-day range with LIBOR. The weighted-average time to LIBOR reset on the Portfolio averaged less than 40 days during the reporting period.
What specific factors, risks or market forces prompted significant decisions for the Portfolio during the reporting period?
As noted above, as financial markets and the economy continued to recover during the reporting period, we selectively and modestly added to the Portfolio’s high-yield bond allocation in addition to more COVID-sensitive floating-rate loans that continued to rally. The Portfolio also saw a modest decrease in its overweight position relative to the Index in credit rated BB.5
During the reporting period, which market segments were the strongest positive contributors to the Portfolio’s absolute performance and which market segments were particularly weak?
During the reporting period the Portfolio realized its largest contributions to absolute performance from its market-weight position in home furnishings, its out-of-benchmark bond positions and its underweight exposure to containers & packaging. (Contributions take weightings and total returns into account.) The most significant detractors from the Portfolio’s absolute performance came from its underweight positions in oil & gas, electronics and leisure.
Did the Portfolio make any significant purchases or sales during the reporting period?
The Portfolio’s largest loan purchases during the reporting period included issues from financial services provider CoreLogic and bottled water manufacturer Triton Water Holdings, reflecting our favorable view toward the relative value, business prospects and management of these issuers. The largest sales during the reporting period were holdings in lighting and ceiling fan manufacturer VC GB Holdings, department store chain Belk, and business process outsourcing services provider Tempo Acquisition. The Portfolio’s sale of loans from VC GB and Belk reflected concerns about future company performance, while the partial sale of holdings from Tempo was a reduction closer to a market weight position given our view of relative value.
| 1. | See page 5 for more information on benchmark and peer group returns. |
| 2. | Duration is a measure of the price sensitivity of a fixed-income investment to changes in interest rates. Duration is expressed as a number of years and is considered a more accurate sensitivity gauge than average maturity. |
| 3. | The terms “spread” and “yield spread” may refer to the difference in yield between a security or type of security and comparable U.S. Treasury issues. The terms may also refer to the difference in yield between two specific securities or types of securities at a given time. |
| 4. | LIBOR is a composite of interest rates at which banks borrow from one another in the London market, and it is a widely used benchmark for short-term interest rates. |
| 5. | An obligation rated ‘BB’ by Standard & Poor’s (“S&P”) is deemed by S&P to be less vulnerable to nonpayment than other speculative issues. In the opinion of S&P, however, the obligor faces major ongoing uncertainties or exposure to adverse business, financial or economic conditions which could lead to the obligor’s inadequate capacity to meet its financial commitment on the obligation. When applied to Fund holdings, ratings are based solely on the creditworthiness of the bonds in the portfolio and are not meant to represent the security or safety of the Fund. |
| 8 | MainStay VP Floating Rate Portfolio |
How did the Portfolio’s sector weightings change during the reporting period?
As the economy and markets continued to recover from the onset of COVID-19, we increased the Portfolio’s exposure to out-of-benchmark positions in high-yield bonds and health care. Conversely, the Portfolio’s benchmark-relative exposure fell in electronics and utilities.
How was the Portfolio positioned at the end of the reporting period?
As of June 30, 2021, we remained cautiously optimistic about floating-rate market performance. We maintained the Portfolio’s overweight positions relative to the Index in packaging, gaming and building materials, and expected to continue to do so in the prevailing environment. The Portfolio continued to hold underweight exposure to electronics, business services and health care while looking for opportunities to add exposure in these underweight sectors subject to our underwriting criteria.
From a ratings perspective, the Portfolio was moving closer to a market-weight position in credit rated BB and better, while moving toward an overweight position in credit rated B,6 reflecting our view on improving credit fundamentals for the loan market and better relative performance. We were also looking to maintain lower cash balances with additional fund purchases subject to market conditions and flows into or out of the Portfolio.
| 6. | An obligation rated ‘B’ by S&P is deemed by S&P to be more vulnerable to nonpayment than obligations rated ‘BB’, but in the opinion of S&P, the obligor currently has the capacity to meet its financial commitment on the obligation. It is the opinion of S&P that adverse business, financial, or economic conditions will likely impair the obligor's capacity or willingness to meet its financial commitment on the obligation. When applied to Fund holdings, ratings are based solely on the creditworthiness of the bonds in the portfolio and are not meant to represent the security or safety of the Fund. |
The opinions expressed are those of the portfolio managers as of the date of this report and are subject to change. There is no guarantee that any forecasts will come to pass. This material does not constitute investment advice and is not intended as an endorsement of any specific investment.
Not all MainStay VP Portfolios and/or share classes are available under all policies.
Portfolio of Investments June 30, 2021† (Unaudited)
| | Principal
Amount | Value |
| Long-Term Bonds 99.0% |
| Corporate Bonds 4.2% |
| Aerospace & Defense 0.2% |
| Howmet Aerospace, Inc. | | |
| 6.875%, due 5/1/25 | $ 200,000 | $ 232,796 |
| Spirit AeroSystems, Inc. | | |
| 7.50%, due 4/15/25 (a) | 900,000 | 960,750 |
| | | 1,193,546 |
| Airlines 0.1% |
| United Airlines, Inc. (a) | | |
| 4.375%, due 4/15/26 | 200,000 | 207,036 |
| 4.625%, due 4/15/29 | 600,000 | 621,000 |
| | | 828,036 |
| Auto Manufacturers 0.1% |
| Ford Motor Co. | | |
| 8.50%, due 4/21/23 | 300,000 | 334,785 |
| 9.00%, due 4/22/25 | 600,000 | 739,722 |
| | | 1,074,507 |
| Building Materials 0.1% |
| Koppers, Inc. | | |
| 6.00%, due 2/15/25 (a) | 500,000 | 516,000 |
| U.S. Concrete, Inc. | | |
| 5.125%, due 3/1/29 (a) | 200,000 | 218,500 |
| | | 734,500 |
| Chemicals 0.1% |
| Kraton Polymers LLC | | |
| 4.25%, due 12/15/25 (a) | 400,000 | 408,000 |
| Nouryon Holding BV | | |
| 8.00%, due 10/1/26 (a) | 500,000 | 530,000 |
| | | 938,000 |
| Commercial Services 0.6% |
| Bidfair Holdings, Inc. | | |
| 5.875%, due 6/1/29 (a) | 900,000 | 913,500 |
| Herc Holdings, Inc. | | |
| 5.50%, due 7/15/27 (a) | 850,000 | 896,087 |
| Jaguar Holding Co. II | | |
| 4.625%, due 6/15/25 (a) | 1,200,000 | 1,260,000 |
| Prime Security Services Borrower LLC | | |
| 6.25%, due 1/15/28 (a) | 1,000,000 | 1,063,750 |
| Team Health Holdings, Inc. | | |
| 6.375%, due 2/1/25 (a) | 500,000 | 475,530 |
| | | 4,608,867 |
| | Principal
Amount | Value |
| |
| Distribution & Wholesale 0.1% |
| IAA, Inc. | | |
| 5.50%, due 6/15/27 (a) | $ 500,000 | $ 524,860 |
| KAR Auction Services, Inc. | | |
| 5.125%, due 6/1/25 (a) | 350,000 | 359,170 |
| | | 884,030 |
| Electric 0.4% |
| NRG Energy, Inc. | | |
| 7.25%, due 5/15/26 | 1,300,000 | 1,347,586 |
| Vistra Operations Co. LLC | | |
| 5.00%, due 7/31/27 (a) | 1,500,000 | 1,539,945 |
| | | 2,887,531 |
| Entertainment 0.1% |
| Scientific Games International, Inc. | | |
| 7.00%, due 5/15/28 (a) | 900,000 | 982,980 |
| Environmental Control 0.3% |
| GFL Environmental, Inc. (a) | | |
| 3.75%, due 8/1/25 | 1,000,000 | 1,027,500 |
| 4.25%, due 6/1/25 | 500,000 | 520,770 |
| 4.75%, due 6/15/29 | 1,000,000 | 1,038,300 |
| | | 2,586,570 |
| Food 0.1% |
| Post Holdings, Inc. | | |
| 5.50%, due 12/15/29 (a) | 240,000 | 257,100 |
| U.S. Foods, Inc. | | |
| 6.25%, due 4/15/25 (a) | 500,000 | 530,000 |
| | | 787,100 |
| Healthcare-Services 0.0% ‡ |
| Acadia Healthcare Co., Inc. | | |
| 5.00%, due 4/15/29 (a) | 120,000 | 125,150 |
| Iron & Steel 0.1% |
| Carpenter Technology Corp. | | |
| 6.375%, due 7/15/28 | 310,000 | 340,334 |
| Lodging 0.2% |
| Boyd Gaming Corp. | | |
| 4.75%, due 12/1/27 | 400,000 | 414,000 |
| 8.625%, due 6/1/25 (a) | 1,000,000 | 1,102,370 |
| | | 1,516,370 |
| Machinery-Diversified 0.0% ‡ |
| GrafTech Finance, Inc. | | |
| 4.625%, due 12/15/28 (a) | 220,000 | 225,775 |
The notes to the financial statements are an integral part of, and should be read in conjunction with, the financial statements.
| 10 | MainStay VP Floating Rate Portfolio |
| | Principal
Amount | Value |
| Corporate Bonds (continued) |
| Media 0.1% |
| Radiate Holdco LLC | | |
| 4.50%, due 9/15/26 (a) | $ 370,000 | $ 382,950 |
| Univision Communications, Inc. | | |
| 6.625%, due 6/1/27 (a) | 600,000 | 650,130 |
| | | 1,033,080 |
| Oil & Gas Services 0.1% |
| USA Compression Partners LP | | |
| 6.875%, due 4/1/26 | 360,000 | 377,100 |
| Packaging & Containers 0.2% |
| Ardagh Metal Packaging Finance USA LLC | | |
| 4.00%, due 9/1/29 (a) | 400,000 | 396,630 |
| Ardagh Packaging Finance plc | | |
| 5.25%, due 4/30/25 (a) | 1,000,000 | 1,051,250 |
| Plastipak Holdings, Inc. | | |
| 6.25%, due 10/15/25 (a) | 220,000 | 224,950 |
| | | 1,672,830 |
| Pharmaceuticals 0.1% |
| Bausch Health Cos., Inc. | | |
| 5.50%, due 11/1/25 (a) | 300,000 | 307,800 |
| Organon & Co. | | |
| 5.125%, due 4/30/31 (a) | 600,000 | 618,120 |
| | | 925,920 |
| Real Estate 0.2% |
| Realogy Group LLC (a) | | |
| 5.75%, due 1/15/29 | 1,330,000 | 1,390,369 |
| 7.625%, due 6/15/25 | 240,000 | 260,328 |
| | | 1,650,697 |
| Real Estate Investment Trusts 0.1% |
| Iron Mountain, Inc. | | |
| 5.00%, due 7/15/28 (a) | 350,000 | 363,283 |
| RHP Hotel Properties LP | | |
| 4.75%, due 10/15/27 | 300,000 | 308,115 |
| | | 671,398 |
| Retail 0.5% |
| 1011778 BC ULC | | |
| 4.00%, due 10/15/30 (a) | 1,040,000 | 1,006,200 |
| IRB Holding Corp. | | |
| 7.00%, due 6/15/25 (a) | 580,000 | 626,412 |
| LBM Acquisition LLC | | |
| 6.25%, due 1/15/29 (a) | 1,000,000 | 1,007,700 |
| | Principal
Amount | Value |
| |
| Retail (continued) |
| Magic Mergeco, Inc. (a) | | |
| 5.25%, due 5/1/28 | $ 450,000 | $ 461,668 |
| 7.875%, due 5/1/29 | 600,000 | 618,750 |
| | | 3,720,730 |
| Software 0.1% |
| Clarivate Science Holdings Corp. (a) | | |
| 3.875%, due 6/30/28 | 300,000 | 302,733 |
| 4.875%, due 6/30/29 | 300,000 | 307,875 |
| | | 610,608 |
| Telecommunications 0.3% |
| Frontier Communications Holdings LLC | | |
| 5.875%, due 10/15/27 (a) | 280,000 | 299,950 |
| LogMeIn, Inc. | | |
| 5.50%, due 9/1/27 (a) | 1,100,000 | 1,138,555 |
| Lumen Technologies, Inc. | | |
| 4.50%, due 1/15/29 (a) | 670,000 | 653,887 |
| Telesat Canada | | |
| 4.875%, due 6/1/27 (a) | 600,000 | 579,000 |
| | | 2,671,392 |
Total Corporate Bonds
(Cost $31,666,531) | | 33,047,051 |
| Loan Assignments 94.8% |
| Aerospace & Defense 2.7% |
| AI Convoy (Luxembourg) SARL | |
| Facility Term Loan B | |
| 4.50% (2 Month LIBOR + 3.50%, 6 Month LIBOR + 3.50%), due 1/18/27 (b) | 861,740 | 860,394 |
| Asplundh Tree Expert LLC | |
| Amendment No. 1 Term Loan | |
| 1.854% (1 Month LIBOR + 1.75%), due 9/7/27 (b) | 2,651,219 | 2,642,014 |
| Dynasty Acquisition Co., Inc. (b) | |
| 2020 Term Loan B1 | |
| 3.647% (3 Month LIBOR + 3.50%), due 4/6/26 | 1,528,827 | 1,486,784 |
| 2020 Term Loan B2 | |
| 3.647% (3 Month LIBOR + 3.50%), due 4/6/26 | 821,950 | 799,346 |
| Kestrel Bidco, Inc. | |
| Term Loan | |
| 4.00% (3 Month LIBOR + 3.00%), due 12/11/26 (b) | 1,234,375 | 1,208,762 |
The notes to the financial statements are an integral part of, and should be read in conjunction with, the financial statements.
11
Portfolio of Investments June 30, 2021† (Unaudited) (continued)
| | Principal
Amount | Value |
| Loan Assignments (continued) |
| Aerospace & Defense (continued) |
| Russell Investments U.S. Institutional Holdco, Inc. | |
| 2025 Term Loan | |
| 4.50% (3 Month LIBOR + 3.50%), due 5/30/25 (b) | $ 4,367,733 | $ 4,340,435 |
| Science Applications International Corp. | |
| Tranche Term Loan B | |
| 1.979% (1 Month LIBOR + 1.875%), due 10/31/25 (b) | 877,500 | 875,306 |
| SkyMiles IP Ltd. | |
| Initial Term Loan | |
| 4.75% (3 Month LIBOR + 3.75%), due 10/20/27 (b) | 1,185,714 | 1,251,670 |
| TransDigm, Inc. (b) | |
| Tranche Refinancing Term Loan E | |
| 2.354% (1 Month LIBOR + 2.25%), due 5/30/25 | 967,763 | 952,641 |
| Tranche Refinancing Term Loan F | |
| 2.354% (1 Month LIBOR + 2.25%), due 12/9/25 | 4,091,292 | 4,027,648 |
| United AirLines, Inc. | |
| Term Loan B | |
| 4.50% (3 Month LIBOR + 3.75%), due 4/21/28 (b) | 2,793,000 | 2,826,916 |
| | | 21,271,916 |
| Automobile 1.6% |
| American Axle & Manufacturing, Inc. | |
| Tranche Term Loan B | |
| 3.00% (1 Month LIBOR + 2.25%), due 4/6/24 (b) | 1,304,652 | 1,299,578 |
| Autokiniton U.S. Holdings, Inc. | |
| Closing Date Term B | |
| 5.00% (3 Month LIBOR + 4.50%), due 4/6/28 (b) | 1,456,350 | 1,465,452 |
| Belron Finance U.S. LLC (b) | |
| First Incremental Loan | |
| 2.438% (3 Month LIBOR + 2.25%), due 11/13/25 | 975,000 | 969,313 |
| 2019 Dollar Second Incremental Loan | |
| 2.438% (3 Month LIBOR + 2.25%), due 10/30/26 | 1,231,250 | 1,221,631 |
| Belron Group SA | |
| Dollar Third Incremental Loan | |
| 3.25% (3 Month LIBOR + 2.75%), due 4/13/28 (b) | 965,081 | 961,060 |
| | Principal
Amount | Value |
| |
| Automobile (continued) |
| Chassix, Inc. | |
| Initial Term Loan | |
| 6.50% (3 Month LIBOR + 4.50%, 3 Month LIBOR + 5.50%), due 11/15/23 (b) | $ 1,947,500 | $ 1,930,459 |
| Clarios Global LP | |
| First Lien Amendment No. 1 Dollar Term Loan | |
| 3.354% (1 Month LIBOR + 3.25%), due 4/30/26 (b) | 1,370,942 | 1,357,233 |
| KAR Auction Services, Inc. | |
| Tranche Term Loan B6 | |
| 2.375% (1 Month LIBOR + 2.25%), due 9/19/26 (b) | 734,413 | 724,621 |
| Wand Newco 3, Inc. | |
| First Lien Tranche Term Loan B1 | |
| 3.104% (1 Month LIBOR + 3.00%), due 2/5/26 (b) | 2,653,640 | 2,618,575 |
| | | 12,547,922 |
| Banking 1.6% |
| Apollo Commercial Real Estate Finance, Inc. (b) | |
| Initial Term Loan | |
| 2.841% (1 Month LIBOR + 2.75%), due 5/15/26 | 1,473,750 | 1,451,644 |
| Term Loan B1 | |
| 4.00% (1 Month LIBOR + 3.50%), due 3/11/28 | 750,000 | 748,125 |
| Broadstreet Partners, Inc. | |
| 2020 Initial Term Loan | |
| 3.354% (1 Month LIBOR + 3.25%), due 1/27/27 (b) | 2,528,350 | 2,504,330 |
| Brookfield Property REIT, Inc. | |
| Initial Term Loan B | |
| 2.604% (1 Month LIBOR + 2.50%), due 8/27/25 (b) | 1,411,782 | 1,376,488 |
| Edelman Financial Engines Center LLC (The) | |
| 2021 First Lien Initial Term Loan | |
| 4.50% (1 Month LIBOR + 3.75%), due 4/7/28 (b) | 1,661,750 | 1,662,212 |
| Greenhill & Co., Inc. | |
| New Term Loan | |
| 3.354% (1 Month LIBOR + 3.25%), due 4/12/24 (b)(c)(d) | 628,603 | 626,245 |
| Jane Street Group LLC | |
| Dollar Term Loan | |
| 2.854% (1 Month LIBOR + 2.75%), due 1/26/28 (b) | 3,816,223 | 3,797,142 |
| | | 12,166,186 |
The notes to the financial statements are an integral part of, and should be read in conjunction with, the financial statements.
| 12 | MainStay VP Floating Rate Portfolio |
| | Principal
Amount | Value |
| Loan Assignments (continued) |
| Beverage, Food & Tobacco 2.2% |
| 8th Avenue Food & Provisions, Inc. | |
| First Lien Term Loan | |
| 3.591% (1 Month LIBOR + 3.50%), due 10/1/25 (b) | $ 2,554,898 | $ 2,544,786 |
| American Seafoods Group LLC | |
| First Lien Tranche Term Loan B | |
| 3.75% (1 Month LIBOR + 2.75%, 3 Month LIBOR + 2.75%), due 8/21/23 (b) | 589,361 | 589,361 |
| Arctic Glacier Group Holdings, Inc. | |
| Specified Refinancing Term Loan | |
| 4.50% (3 Month LIBOR + 3.50%), due 3/20/24 (b)(c) | 619,218 | 590,966 |
| CHG PPC Parent LLC | |
| First Lien Initial Term Loan | |
| 2.854% (1 Month LIBOR + 2.75%), due 3/31/25 (b) | 1,697,500 | 1,676,281 |
| City Brewing Co. LLC | |
| First Lien Closing Date Term Loan | |
| 4.25% (3 Month LIBOR + 3.50%), due 4/5/28 (b) | 1,700,000 | 1,704,250 |
| Froneri International Ltd. | |
| First Lien Facility Term Loan B2 | |
| 2.354% (1 Month LIBOR + 2.25%), due 1/29/27 (b) | 1,470,150 | 1,447,179 |
| H Food Holdings LLC | |
| Initial Term Loan | |
| 3.792% (1 Month LIBOR + 3.6875%), due 5/23/25 (b) | 1,259,784 | 1,250,729 |
| JBS USA Lux SA | |
| New Term Loan | |
| 2.093% (1 Month LIBOR + 2.00%), due 5/1/26 (b) | 3,334,380 | 3,324,257 |
| Sunshine Investments BV | |
| Facility Term Loan B3 | |
| 3.156% (3 Month LIBOR + 3.00%), due 3/28/25 (b) | 2,960,000 | 2,937,800 |
| United Natural Foods, Inc. | |
| Initial Term Loan | |
| 3.604% (1 Month LIBOR + 3.50%), due 10/22/25 (b) | 1,346,306 | 1,346,306 |
| | | 17,411,915 |
| | Principal
Amount | Value |
| |
| Broadcasting & Entertainment 4.2% |
| Altice France SA | |
| USD Incremental Term Loan B13 | |
| 4.155% (3 Month LIBOR + 4.00%), due 8/14/26 (b) | $ 1,218,750 | $ 1,214,433 |
| Charter Communications Operating LLC | |
| Term Loan B1 | |
| 1.86% (1 Month LIBOR + 1.75%), due 4/30/25 (b) | 4,825,000 | 4,814,583 |
| Clear Channel Outdoor Holdings, Inc. | |
| Term Loan B | |
| 3.686% (3 Month LIBOR + 3.50%), due 8/21/26 (b) | 1,719,375 | 1,677,465 |
| Diamond Sports Group LLC | |
| Term Loan | |
| 3.36% (1 Month LIBOR + 3.25%), due 8/24/26 (b) | 2,942,563 | 1,793,913 |
| Gray Television, Inc. | |
| Term Loan C | |
| 2.592% (1 Month LIBOR + 2.50%), due 1/2/26 (b) | 2,506,446 | 2,492,869 |
| Nexstar Broadcasting, Inc. | |
| Term Loan B4 | |
| 2.592% (1 Month LIBOR + 2.50%), due 9/18/26 (b) | 2,911,767 | 2,901,887 |
| Numericable U.S. LLC (b) | |
| Term Loan B11 | |
| 2.936% (3 Month LIBOR + 2.75%), due 7/31/25 | 1,890,573 | 1,859,062 |
| USD Term Loan B12 | |
| 3.871% (3 Month LIBOR + 3.6875%), due 1/31/26 | 964,976 | 955,671 |
| Radiate Holdco LLC | |
| Term Loan B | |
| 4.25% (1 Month LIBOR + 3.50%), due 9/25/26 (b) | 4,120,353 | 4,118,808 |
| Terrier Media Buyer, Inc. | |
| First Lien 2021 Term Loan B | |
| 3.604% (1 Month LIBOR + 3.50%), due 12/17/26 (b) | 3,300,912 | 3,283,949 |
| Univision Communications Inc. | |
| Term Loan B | |
| TBD, due 5/5/28 | 2,080,000 | 2,074,280 |
| Univision Communications, Inc. | |
| First Lien 2017 Replacement Repriced Term Loan | |
| 3.75% (1 Month LIBOR + 2.75%), due 3/15/24 (b) | 3,576,393 | 3,569,369 |
The notes to the financial statements are an integral part of, and should be read in conjunction with, the financial statements.
13
Portfolio of Investments June 30, 2021† (Unaudited) (continued)
| | Principal
Amount | Value |
| Loan Assignments (continued) |
| Broadcasting & Entertainment (continued) |
| WideOpenWest Finance LLC | |
| Eighth Amendment Term Loan B | |
| 4.25% (1 Month LIBOR + 3.25%), due 8/18/23 (b) | $ 2,406,906 | $ 2,398,884 |
| | | 33,155,173 |
| Buildings & Real Estate 2.8% |
| Beacon Roofing Supply, Inc. | |
| 2028 Term Loan | |
| 2.604% (1 Month LIBOR + 2.50%), due 5/19/28 (b) | 1,500,000 | 1,491,562 |
| Core & Main LP | |
| Initial Term Loan | |
| 3.75% (1 Month LIBOR + 2.75%, 3 Month LIBOR + 2.75%), due 8/1/24 (b) | 2,537,886 | 2,533,656 |
| Cornerstone Building Brands, Inc. | |
| Tranche Term Loan B | |
| 3.75% (1 Month LIBOR + 3.25%), due 4/12/28 (b) | 4,518,638 | 4,511,860 |
| Cushman & Wakefield U.S. Borrower LLC | |
| Replacement Term Loan | |
| 2.843% (1 Month LIBOR + 2.75%), due 8/21/25 (b) | 2,927,969 | 2,898,689 |
| Hamilton Holdco LLC | |
| Term Loan | |
| 2.15% (3 Month LIBOR + 2.00%), due 1/2/27 (b) | 304,597 | 302,313 |
| Jeld-Wen, Inc. | |
| Term Loan B4 | |
| 2.104% (1 Month LIBOR + 2.00%), due 12/14/24 (b) | 753,906 | 752,493 |
| Realogy Group LLC | |
| Extended 2025 Term Loan | |
| 3.00% (1 Month LIBOR + 2.25%), due 2/8/25 (b) | 413,088 | 411,435 |
| SIWF Holdings, Inc. (b) | |
| First Lien Initial Term Loan | |
| 4.354% (1 Month LIBOR + 4.25%), due 6/15/25 | 1,753,399 | 1,753,837 |
| Second Lien Initial Term Loan | |
| 8.604% (1 Month LIBOR + 8.50%), due 6/15/26 | 120,000 | 120,150 |
| SRS Distribution Inc. | |
| 2021 Refinancing Term Loan | |
| 4.25% (1 Month LIBOR + 3.75%), due 6/2/28 (b) | 2,080,000 | 2,077,075 |
| | Principal
Amount | Value |
| |
| Buildings & Real Estate (continued) |
| Wilsonart LLC | |
| Tranche Term Loan E | |
| 4.50% (3 Month LIBOR + 3.50%), due 12/31/26 (b) | $ 2,938,807 | $ 2,935,951 |
| Zebra Buyer LLC | |
| Term Loan | |
| TBD, due 4/21/28 | 1,800,000 | 1,804,500 |
| | | 21,593,521 |
| Cargo Transport 0.3% |
| Genesee & Wyoming, Inc. | |
| Initial Term Loan | |
| 2.147% (3 Month LIBOR + 2.00%), due 12/30/26 (b) | 2,478,725 | 2,461,684 |
| Chemicals, Plastics & Rubber 4.6% |
| Allnex (Luxembourg) & Cy S.C.A. (b)(c) | |
| Tranche Term Loan B2 | |
| 4.00% (1 Month LIBOR + 3.25%), due 9/13/23 | 936,444 | 934,395 |
| Tranche Term Loan B3 | |
| 4.00% (1 Month LIBOR + 3.25%), due 9/13/23 | 705,543 | 703,999 |
| Alpha 3 B.V. | |
| Initial Dollar Term Loan | |
| 3.00% (3 Month LIBOR + 2.50%), due 3/18/28 (b) | 1,024,000 | 1,018,080 |
| Aruba Investments Holdings LLC | |
| First Lien Initial Dollar Term Loan | |
| 4.75% (3 Month LIBOR + 4.00%), due 11/24/27 (b) | 531,994 | 533,324 |
| Cabot Microelectronics Corp. | |
| Term Loan B1 | |
| 2.125% (1 Month LIBOR + 2.00%), due 11/17/25 (b) | 784,543 | 782,337 |
| Diamond (BC) BV | |
| Initial USD Term Loan 3.147%-3.185% | |
| (2 Month LIBOR + 3.00%, 3 Month LIBOR + 3.00%), due 9/6/24 (b) | 1,608,333 | 1,598,030 |
| Emerald Performance Materials LLC | |
| Cov-Lite Term Loan | |
| 5.00% (1 Month LIBOR + 4.00%), due 8/12/25 (b) | 1,197,145 | 1,198,641 |
| Flex Acquisition Co., Inc. | |
| 2021 Specified Refinancing Term Loan | |
| 4.00% (3 Month LIBOR + 3.50%), due 3/2/28 (b) | 832,862 | 829,219 |
The notes to the financial statements are an integral part of, and should be read in conjunction with, the financial statements.
| 14 | MainStay VP Floating Rate Portfolio |
| | Principal
Amount | Value |
| Loan Assignments (continued) |
| Chemicals, Plastics & Rubber (continued) |
| INEOS Styrolution Group GmbH | |
| 2026 Tranche Dollar Term Loan B | |
| 3.25% (1 Month LIBOR + 2.75%), due 1/29/26 (b) | $ 1,940,000 | $ 1,933,938 |
| Ineos U.S. Finance LLC | |
| 2024 New Dollar Term Loan | |
| 2.104% (1 Month LIBOR + 2.00%), due 4/1/24 (b) | 1,441,392 | 1,427,879 |
| Innophos Holdings, Inc. | |
| Initial Term Loan | |
| 3.604% (1 Month LIBOR + 3.50%), due 2/5/27 (b) | 1,481,250 | 1,477,547 |
| Jazz Pharmaceuticals plc | |
| Initial Dollar Term Loan | |
| 4.00% (1 Month LIBOR + 3.50%), due 5/5/28 (b) | 3,000,000 | 3,010,713 |
| Lonza Group AG | |
| Term Loan B | |
| TBD, due 6/29/28 | 1,500,000 | 1,499,625 |
| Minerals Technologies, Inc. | |
| New Term Loan B1 | |
| 3.00% (1 Month LIBOR + 2.25%), due 2/14/24 (b)(c) | 618,032 | 618,419 |
| Nouryon Finance BV | |
| Initial Dollar Term Loan 2.843%-5.00% | |
| (1 Month LIBOR + 2.75%, 3 Month LIBOR + 1.75%), due 10/1/25 (b) | 3,039,694 | 3,014,617 |
| Oxea Holding Vier GMBH | |
| Tranche Term Loan B2 | |
| 3.625% (1 Month LIBOR + 3.50%), due 10/14/24 (b) | 2,237,500 | 2,223,516 |
| Pactiv Evergreen, Inc. | |
| Tranche U.S. Term Loan B1 | |
| 2.854% (1 Month LIBOR + 2.75%), due 2/5/23 (b) | 583,190 | 581,813 |
| Parexel International Corp. | |
| Initial Term Loan | |
| 2.854% (1 Month LIBOR + 2.75%), due 9/27/24 (b) | 1,215,632 | 1,207,844 |
| PPD, Inc. | |
| Initial Term Loan | |
| 2.75% (1 Month LIBOR + 2.25%), due 1/13/28 (b) | 2,681,757 | 2,676,393 |
| PQ Corp. | |
| Third Amendment Tranche Term Loan B1 | |
| 2.436% (3 Month LIBOR + 2.25%), due 2/7/27 (b) | 401,024 | 399,879 |
| | Principal
Amount | Value |
| |
| Chemicals, Plastics & Rubber (continued) |
| SCIH Salt Holdings, Inc. | |
| First Lien Term Loan B1 | |
| 4.75% (3 Month LIBOR + 4.00%), due 3/16/27 (b) | $ 3,325,000 | $ 3,329,156 |
| Sparta U.S. HoldCo LLC | |
| Term Loan | |
| TBD, due 4/28/28 | 900,000 | 900,844 |
| Tricorbraun Holdings, Inc. (b) | |
| First Lien Closing Date Initial Term Loan | |
| 3.75% (3 Month LIBOR + 3.25%), due 3/3/28 | 1,148,025 | 1,138,518 |
| First Lien Delayed Draw Term Loan | |
| 3.75% (3 Month LIBOR + 3.25%), due 3/3/28 (c) | 8,608 | 8,536 |
| Tronox Finance LLC | |
| First Lien Refinancing Term Loan | |
| % (1 Month LIBOR + 2.50%, 3 Month LIBOR + 2.50%), due 3/10/28 (b) | 1,331,466 | 1,322,729 |
| Venator Finance SARL | |
| Initial Term Loan | |
| 3.104% (1 Month LIBOR + 3.00%), due 8/8/24 (b) | 1,430,141 | 1,415,840 |
| | | 35,785,831 |
| Commercial Services 1.3% |
| ADMI Corp. | |
| Amendment No. 4 Refinancing Term Loan | |
| 3.875% (1 Month LIBOR + 2.75%), due 12/23/27 (b) | 1,496,250 | 1,480,871 |
| MHI Holdings LLC | |
| Initial Term Loan | |
| 5.095% (1 Month LIBOR + 5.00%), due 9/21/26 (b) | 1,888,143 | 1,892,864 |
| Prime Security Services Borrower LLC | |
| First Lien 2021 Refinancing Term Loan B1 | |
| 3.50% (1 Month LIBOR + 2.75%, 3 Month LIBOR + 2.75%), due 9/23/26 (b) | 4,163,823 | 4,158,618 |
| Sotheby's | |
| 2021 Refinancing Term Loan | |
| 5.50% (3 Month LIBOR + 4.75%), due 1/15/27 (b) | 2,296,915 | 2,307,442 |
| | | 9,839,795 |
The notes to the financial statements are an integral part of, and should be read in conjunction with, the financial statements.
15
Portfolio of Investments June 30, 2021† (Unaudited) (continued)
| | Principal
Amount | Value |
| Loan Assignments (continued) |
| Containers, Packaging & Glass 3.6% |
| Alliance Laundry Systems LLC | |
| Initial Term Loan B | |
| 4.25% (3 Month LIBOR + 3.50%), due 10/8/27 (b) | $ 1,771,714 | $ 1,772,822 |
| Altium Packaging LLC | |
| First Lien 2021 Term Loan | |
| 3.25% (1 Month LIBOR + 2.75%), due 2/3/28 (b) | 3,106,383 | 3,086,968 |
| Anchor Glass Container Corp. | |
| First Lien July 2017 Additional Term Loan | |
| 3.75% (3 Month LIBOR + 2.75%), due 12/7/23 (b) | 2,094,222 | 1,937,155 |
| Berlin Packaging LLC | |
| Tranche Term Loan B4 | |
| 3.75% (3 Month LIBOR + 3.25%), due 3/11/28 (b) | 2,000,000 | 1,991,250 |
| Berry Global, Inc. | |
| Term Loan Z | |
| 1.827% (1 Month LIBOR + 1.75%), due 7/1/26 (b) | 1,964,896 | 1,949,750 |
| Charter Next Generation, Inc. | |
| First Lien Initial Term Loan | |
| 4.50% (1 Month LIBOR + 4.25%), due 12/1/27 (b) | 851,755 | 852,886 |
| Clearwater Paper Corp. | |
| Initial Term Loan | |
| 3.125% (1 Month LIBOR + 3.00%), due 7/26/26 (b) | 1,077,083 | 1,077,083 |
| Fort Dearborn Holding Co., Inc. (b) | |
| First Lien Initial Term Loan | |
| 5.00% (1 Month LIBOR + 4.00%, 3 Month LIBOR + 4.00%), due 10/19/23 | 1,405,496 | 1,406,375 |
| Second Lien Initial Term Loan | |
| 9.50% (3 Month LIBOR + 8.50%), due 10/21/24 (c) | 1,000,000 | 997,500 |
| Graham Packaging Co., Inc. | |
| 2021 Initial Term Loan | |
| 3.75% (1 Month LIBOR + 3.00%), due 8/4/27 (b) | 3,289,806 | 3,285,694 |
| Mauser Packaging Solutions Holding Co. | |
| Initial Term Loan | |
| 3.354% (1 Month LIBOR + 3.25%), due 4/3/24 (b) | 2,857,903 | 2,787,476 |
| | Principal
Amount | Value |
| |
| Containers, Packaging & Glass (continued) |
| Pretium PKG Holdings, Inc. | |
| First Lien Initial Term Loan | |
| 4.75% (3 Month LIBOR + 4.00%), due 11/5/27 (b) | $ 1,142,177 | $ 1,143,248 |
| Pro Mach Group, Inc. | |
| First Lien Initial Term Loan | |
| 2.843% (1 Month LIBOR + 2.75%), due 3/7/25 (b)(c) | 997,423 | 983,085 |
| Reynolds Consumer Products LLC | |
| Initial Term Loan | |
| 1.854% (1 Month LIBOR + 1.75%), due 2/4/27 (b) | 1,299,432 | 1,288,467 |
| Tank Holding Corp. (b) | |
| First Lien 2020 Refinancing Term Loan 3.604%-5.75% | |
| (1 Month LIBOR + 3.50%, 3 Month LIBOR + 2.50%), due 3/26/26 | 2,213,088 | 2,195,799 |
| First Lien 2020 Incremental Term Loan 5.75%-7.25% | |
| (1 Month LIBOR + 5.00%, 3 Month LIBOR + 4.00%, 3 Month LIBOR + 5.00%), due 3/26/26 (c) | 1,094,500 | 1,097,236 |
| Trident TPI Holdings, Inc. | |
| Tranche Term Loan B1 | |
| 4.00% (3 Month LIBOR + 3.00%), due 10/17/24 (b) | 720,533 | 717,831 |
| | | 28,570,625 |
| Diversified/Conglomerate Manufacturing 3.9% |
| AI Ladder (Luxembourg) Subco SARL | |
| Facility B | |
| 4.584% (52 Week LIBOR + 4.50%), due 7/9/25 (b)(c) | 786,364 | 785,872 |
| Allied Universal Holdco LLC | |
| Initial U.S. Dollar Term Loan | |
| 4.25% (3 Month LIBOR + 3.75%), due 5/12/28 (b) | 4,315,796 | 4,326,585 |
| Bright Bidco BV | |
| 2018 Refinancing Term Loan B | |
| 4.50% (3 Month LIBOR + 3.50%), due 6/30/24 (b) | 1,920,087 | 1,605,329 |
| EWT Holdings III Corp. | |
| Initial Term Loan | |
| 2.625% (1 Month LIBOR + 2.50%), due 4/1/28 (b) | 1,750,000 | 1,737,421 |
| Filtration Group Corp. | |
| Initial Dollar Term Loan | |
| 3.104% (1 Month LIBOR + 3.00%), due 3/31/25 (b) | 1,767,565 | 1,752,099 |
The notes to the financial statements are an integral part of, and should be read in conjunction with, the financial statements.
| 16 | MainStay VP Floating Rate Portfolio |
| | Principal
Amount | Value |
| Loan Assignments (continued) |
| Diversified/Conglomerate Manufacturing (continued) |
| Gardner Denver, Inc. | |
| 2020 GDI Tranche Dollar Term Loan B2 | |
| 1.854% (1 Month LIBOR + 1.75%), due 3/1/27 (b) | $ 1,988,575 | $ 1,965,138 |
| GYP Holdings III Corp. | |
| 2021 First Lien Incremental Term Loan | |
| 2.604% (1 Month LIBOR + 2.50%), due 6/1/25 (b) | 1,394,997 | 1,390,637 |
| Ingersoll-Rand Services Co. | |
| 2020 Spinco Tranche Dollar Term Loan B1 | |
| 1.854% (1 Month LIBOR + 1.75%), due 3/1/27 (b) | 862,156 | 851,995 |
| Iron Mountain Information Management LLC | |
| Incremental Term Loan B | |
| 1.854% (1 Month LIBOR + 1.75%), due 1/2/26 (b) | 1,814,063 | 1,777,781 |
| LTI Holdings, Inc. | |
| First Lien Initial Term Loan | |
| 3.604% (1 Month LIBOR + 3.50%), due 9/6/25 (b) | 1,068,482 | 1,052,677 |
| Pre-Paid Legal Services, Inc. | |
| First Lien Initial Term Loan | |
| 3.354% (1 Month LIBOR + 3.25%), due 5/1/25 (b) | 2,962,838 | 2,939,876 |
| Quikrete Holdings, Inc. | |
| First Lien Fourth Amendment Term Loan B1 | |
| TBD, due 5/12/28 | 1,500,000 | 1,487,250 |
| First Lien Initial Term Loan | |
| 2.593% (1 Month LIBOR + 2.50%), due 2/1/27 (b) | 2,301,741 | 2,279,011 |
| Red Ventures LLC (b) | |
| First Lien Term Loan B2 | |
| 2.604% (1 Month LIBOR + 2.50%), due 11/8/24 | 2,992,770 | 2,950,552 |
| First Lien Term Loan B3 | |
| 4.25% (1 Month LIBOR + 3.50%), due 11/8/24 | 1,990,000 | 1,983,781 |
| TRC Companies, Inc. | |
| Initial Term Loan | |
| 4.50% (1 Month LIBOR + 3.50%), due 6/21/24 (b)(c) | 863,681 | 861,162 |
| WP CPP Holdings LLC | |
| First Lien Initial Term Loan | |
| 4.75% (3 Month LIBOR + 3.75%), due 4/30/25 (b) | 995,111 | 973,550 |
| | | 30,720,716 |
| | Principal
Amount | Value |
| |
| Diversified/Conglomerate Service 2.5% |
| Applied Systems, Inc. (b) | |
| First Lien Closing Date Term Loan 3.75%-5.50% | |
| (3 Month LIBOR + 2.25%, 3 Month LIBOR + 3.25%), due 9/19/24 | $ 2,536,196 | $ 2,529,402 |
| 2021 Second Lien Term Loan | |
| 6.25% (3 Month LIBOR + 5.50%), due 9/19/25 | 445,140 | 450,259 |
| Blackhawk Network Holdings, Inc. | |
| First Lien Term Loan | |
| 3.104% (1 Month LIBOR + 3.00%), due 6/15/25 (b) | 1,967,429 | 1,944,066 |
| Brightview Landscapes LLC | |
| First Lien 2018 Initial Term Loan | |
| 2.625% (1 Month LIBOR + 2.50%), due 8/15/25 (b) | 1,091,892 | 1,084,612 |
| CCC Information Services, Inc. | |
| First Lien Initial Term Loan | |
| 4.00% (1 Month LIBOR + 3.00%), due 4/29/24 (b) | 921,021 | 920,199 |
| Change Healthcare Holdings, Inc. | |
| Closing Date Term Loan | |
| 3.50% (1 Month LIBOR + 2.50%), due 3/1/24 (b) | 1,467,752 | 1,465,917 |
| Greeneden U.S. Holdings I LLC | |
| 2020 Initial Dollar Term Loan | |
| 4.75% (1 Month LIBOR + 4.00%), due 12/1/27 (b) | 1,433,293 | 1,435,853 |
| IRI Holdings, Inc. | |
| First Lien Initial Term Loan | |
| 4.354% (1 Month LIBOR + 4.25%), due 12/1/25 (b) | 3,176,306 | 3,172,336 |
| Mitchell International, Inc. | |
| First Lien Initial Term Loan 3.342%-3.354% | |
| (1 Month LIBOR + 3.25%), due 11/29/24 (b) | 958,884 | 948,845 |
| MKS Instruments, Inc. | |
| Tranche Term Loan B6 | |
| 1.843% (1 Month LIBOR + 1.75%), due 2/2/26 (b) | 692,912 | 690,190 |
| Monitronics International, Inc. | |
| Term Loan | |
| 7.75% (1 Month LIBOR + 6.50%), due 3/29/24 (b)(c) | 946,498 | 918,103 |
| TruGreen LP | |
| First Lien Second Refinancing Term Loan | |
| 4.75% (1 Month LIBOR + 4.00%), due 11/2/27 (b) | 2,719,663 | 2,733,261 |
The notes to the financial statements are an integral part of, and should be read in conjunction with, the financial statements.
17
Portfolio of Investments June 30, 2021† (Unaudited) (continued)
| | Principal
Amount | Value |
| Loan Assignments (continued) |
| Diversified/Conglomerate Service (continued) |
| Verint Systems, Inc. | |
| Refinancing Term Loan | |
| 2.086% (1 Month LIBOR + 2.00%), due 6/28/24 (b) | $ 588,235 | $ 583,824 |
| Verscend Holding Corp. | |
| Term Loan B1 | |
| 4.104% (1 Month LIBOR + 4.00%), due 8/27/25 (b) | 1,054,996 | 1,056,973 |
| | | 19,933,840 |
| Ecological 0.3% |
| GFL Environmental, Inc. | |
| 2020 Refinancing Term Loan | |
| 3.50% (1 Month LIBOR + 3.00%), due 5/30/25 (b) | 2,041,901 | 2,042,666 |
| Sophia LP | |
| Closing Date Term Loan | |
| 4.50% (3 Month LIBOR + 3.75%), due 10/7/27 (b) | 683,379 | 683,522 |
| | | 2,726,188 |
| Electronics 11.9% |
| AqGen Ascensus, Inc. | |
| Term Loan | |
| TBD, due 5/19/28 | 2,400,000 | 2,394,000 |
| Avast Software BV | |
| Initial Dollar Term Loan | |
| 2.147% (3 Month LIBOR + 2.00%), due 3/22/28 (b) | 197,500 | 196,595 |
| Barracuda Networks, Inc. | |
| First Lien 2020 Term Loan | |
| 4.50% (3 Month LIBOR + 3.75%), due 2/12/25 (b) | 1,944,003 | 1,948,052 |
| Camelot U.S. Acquisition 1 Co. (b) | |
| Initial Term Loan | |
| 3.104% (1 Month LIBOR + 3.00%), due 10/30/26 | 1,863,724 | 1,855,337 |
| Amendment No. 2 Incremental Term Loan | |
| 4.00% (1 Month LIBOR + 3.00%), due 10/30/26 | 1,243,750 | 1,243,439 |
| Castle U.S. Holding Corp. (b) | |
| Initial Dollar Term Loan | |
| 3.897% (3 Month LIBOR + 3.75%), due 1/29/27 | 1,429,001 | 1,410,424 |
| Dollar Term Loan B2 | |
| 4.75% (3 Month LIBOR + 4.00%), due 1/29/27 | 2,494,792 | 2,462,359 |
| | Principal
Amount | Value |
| |
| Electronics (continued) |
| CommScope, Inc. | |
| Initial Term Loan | |
| 3.354% (1 Month LIBOR + 3.25%), due 4/6/26 (b) | $ 4,235,800 | $ 4,211,597 |
| CoreLogic, Inc. | |
| First Lien Initial Term Loan | |
| 4.00% (1 Month LIBOR + 3.50%), due 6/2/28 (b) | 4,000,000 | 3,985,000 |
| DCert Buyer, Inc. | |
| First Lien Initial Term Loan | |
| 4.104% (1 Month LIBOR + 4.00%), due 10/16/26 (b) | 2,472,481 | 2,474,026 |
| Dell International LLC | |
| Refinancing Term Loan B2 | |
| 2.00% (1 Month LIBOR + 1.75%), due 9/19/25 (b) | 2,152,954 | 2,152,057 |
| Diebold Nixdorf, Inc. | |
| New Dollar Term Loan B | |
| 2.875% (1 Month LIBOR + 2.75%), due 11/6/23 (b) | 638,986 | 628,203 |
| ECi Macola/MAX Holding LLC | |
| First Lien Initial Term Loan | |
| 4.50% (3 Month LIBOR + 3.75%), due 11/9/27 (b) | 1,990,000 | 1,993,108 |
| Epicor Software Corp. | |
| Term Loan C | |
| 4.00% (1 Month LIBOR + 3.25%), due 7/30/27 (b) | 3,078,935 | 3,073,337 |
| Flexera Software LLC | |
| First Lien Term Loan B1 | |
| 4.50% (3 Month LIBOR + 3.75%), due 3/3/28 (b) | 2,401,195 | 2,405,054 |
| Go Daddy Operating Co. LLC | |
| Tranche Term Loan B2 | |
| 1.854% (1 Month LIBOR + 1.75%), due 2/15/24 (b) | 2,193,347 | 2,174,903 |
| Helios Software Holdings, Inc. | |
| 2021 Initial Dollar Term Loan | |
| 3.917% (3 Month LIBOR + 3.75%), due 3/11/28 (b) | 497,143 | 496,832 |
| Hyland Software, Inc. (b) | |
| First Lien 2018 Refinancing Term Loan | |
| 4.25% (1 Month LIBOR + 3.50%), due 7/1/24 | 3,572,918 | 3,578,024 |
| 2021 Second Lien Refinancing Term Loan | |
| 7.00% (1 Month LIBOR + 6.25%), due 7/7/25 | 535,333 | 536,337 |
The notes to the financial statements are an integral part of, and should be read in conjunction with, the financial statements.
| 18 | MainStay VP Floating Rate Portfolio |
| | Principal
Amount | Value |
| Loan Assignments (continued) |
| Electronics (continued) |
| Informatica LLC | |
| 2020 Dollar Term Loan | |
| 3.354% (1 Month LIBOR + 3.25%), due 2/25/27 (b) | $ 2,982,449 | $ 2,963,395 |
| ION Trading Finance Ltd. | |
| 2021 Initial Dollar Term Loan | |
| 4.917% (3 Month LIBOR + 4.75%), due 4/1/28 (b) | 1,000,000 | 1,002,857 |
| MA FinanceCo. LLC (b) | |
| Tranche Term Loan B3 | |
| 2.854% (1 Month LIBOR + 2.75%), due 6/21/24 | 344,067 | 339,551 |
| Tranche Term Loan B4 | |
| 5.25% (3 Month LIBOR + 4.25%), due 6/5/25 (c) | 500,000 | 505,833 |
| McAfee LLC | |
| USD Term Loan B | |
| 3.846% (1 Month LIBOR + 3.75%), due 9/30/24 (b) | 4,088,526 | 4,087,389 |
| MH Sub I LLC (b) | |
| First Lien Amendment No. 2 Initial Term Loan | |
| 3.604% (1 Month LIBOR + 3.50%), due 9/13/24 | 3,024,443 | 3,009,862 |
| First Lien 2020 June New Term Loan Term Loan | |
| 4.75% (1 Month LIBOR + 3.75%), due 9/13/24 | 587,940 | 588,822 |
| Milano Acquisition Corp. | |
| First Lien Term Loan B | |
| 4.75% (3 Month LIBOR + 4.00%), due 10/1/27 (b) | 523,684 | 524,666 |
| Misys Ltd. (b) | |
| First Lien Dollar Term Loan | |
| 4.50% (3 Month LIBOR + 3.50%), due 6/13/24 | 2,672,982 | 2,628,712 |
| Second Lien Dollar Term Loan | |
| 8.25% (3 Month LIBOR + 7.25%), due 6/13/25 | 900,000 | 908,679 |
| Project Alpha Intermediate Holding, Inc. | |
| 2021 Refinancing Term Loan | |
| 4.11% (1 Month LIBOR + 4.00%), due 4/26/24 (b) | 2,015,998 | 2,017,258 |
| Project Leopard Holdings, Inc. (b) | |
| 2018 Repricing Term Loan | |
| 5.75% (3 Month LIBOR + 4.75%), due 7/5/24 | 1,083,504 | 1,085,401 |
| | Principal
Amount | Value |
| |
| Electronics (continued) |
| Project Leopard Holdings, Inc. (b) (continued) | |
| 2019 Incremental Term Loan | |
| 5.75% (3 Month LIBOR + 4.75%), due 7/5/24 (c) | $ 978,784 | $ 980,497 |
| Proofpoint, Inc. | |
| Term Loan | |
| TBD, due 6/9/28 | 2,500,000 | 2,484,765 |
| Rocket Software, Inc. | |
| Term Loan | |
| TBD, due 11/28/25 | 1,500,000 | 1,471,875 |
| First Lien Initial Term Loan | |
| 4.354% (1 Month LIBOR + 4.25%), due 11/28/25 (b) | 879,750 | 862,155 |
| Seattle SpinCo, Inc. | |
| Initial Term Loan | |
| 2.854% (1 Month LIBOR + 2.75%), due 6/21/24 (b) | 2,323,570 | 2,293,073 |
| SS&C Technologies Holdings, Inc. (b) | |
| Term Loan B3 | |
| 1.854% (1 Month LIBOR + 1.75%), due 4/16/25 | 1,978,881 | 1,955,176 |
| Term Loan B4 | |
| 1.854% (1 Month LIBOR + 1.75%), due 4/16/25 | 1,503,480 | 1,485,470 |
| Term Loan B5 | |
| 1.854% (1 Month LIBOR + 1.75%), due 4/16/25 | 1,943,778 | 1,921,359 |
| Surf Holdings LLC SARL | |
| First Lien Dollar Tranche Term Loan | |
| 3.628% (3 Month LIBOR + 3.50%), due 3/5/27 (b) | 2,030,999 | 2,015,766 |
| Tempo Acquisition LLC | |
| Extended Term Loan | |
| 3.75% (1 Month LIBOR + 3.25%), due 11/2/26 (b) | 1,954,940 | 1,956,406 |
| ThoughtWorks, Inc. | |
| Incremental Term Loan | |
| 3.75% (1 Month LIBOR + 3.25%), due 3/24/28 (b) | 598,500 | 598,201 |
| Tibco Software, Inc. (b) | |
| Term Loan B3 | |
| 3.86% (1 Month LIBOR + 3.75%), due 6/30/26 | 2,984,962 | 2,969,416 |
| Second Lien Term Loan | |
| 7.36% (1 Month LIBOR + 7.25%), due 3/3/28 | 400,000 | 405,333 |
The notes to the financial statements are an integral part of, and should be read in conjunction with, the financial statements.
19
Portfolio of Investments June 30, 2021† (Unaudited) (continued)
| | Principal
Amount | Value |
| Loan Assignments (continued) |
| Electronics (continued) |
| Trader Corp. | |
| First Lien 2017 Refinancing Term Loan | |
| 4.00% (1 Month LIBOR + 3.00%), due 9/28/23 (b) | $ 2,283,127 | $ 2,271,711 |
| UKG, Inc. (b) | |
| First Lien Initial Term Loan | |
| 3.854% (1 Month LIBOR + 3.75%), due 5/4/26 | 1,719,375 | 1,719,375 |
| First Lien 2021 Incremental Term Loan | |
| 4.00% (3 Month LIBOR + 3.25%), due 5/4/26 | 2,207,109 | 2,207,453 |
| Vertiv Group Corp. | |
| Term Loan B | |
| 2.836% (1 Month LIBOR + 2.75%), due 3/2/27 (b) | 1,975,075 | 1,962,731 |
| Vision Solutions, Inc. | |
| First Lien Initial Term Loan | |
| 5.00% (3 Month LIBOR + 4.25%), due 4/24/28 (b) | 1,666,667 | 1,660,417 |
| VS Buyer LLC | |
| Initial Term Loan | |
| 3.104% (1 Month LIBOR + 3.00%), due 2/28/27 (b) | 987,500 | 980,711 |
| Western Digital Corp. | |
| U.S. Term Loan B4 | |
| 1.843% (1 Month LIBOR + 1.75%), due 4/29/23 (b) | 801,810 | 800,808 |
| WEX, Inc. | |
| Term Loan B | |
| 2.354% (1 Month LIBOR + 2.25%), due 3/31/28 (b) | 997,500 | 990,019 |
| | | 92,873,826 |
| Entertainment 0.8% |
| Formula One Management Ltd. | |
| USD Facility B3 | |
| 3.50% (1 Month LIBOR + 2.50%), due 2/1/24 (b) | 2,568,089 | 2,553,243 |
| J&J Ventures Gaming LLC | |
| Initial Term Loan | |
| 4.75% (1 Month LIBOR + 4.00%), due 4/26/28 (b) | 4,000,000 | 4,010,000 |
| | | 6,563,243 |
| | Principal
Amount | Value |
| |
| Finance 8.4% |
| AAdvantage Loyality IP Ltd. | |
| Initial Term Loan | |
| 5.50% (3 Month LIBOR + 4.75%), due 4/20/28 (b) | $ 1,400,000 | $ 1,458,843 |
| Acuity Specialty Products, Inc. | |
| First Lien Initial Term Loan | |
| 5.00% (3 Month LIBOR + 4.00%), due 8/12/24 (b)(c) | 1,098,123 | 1,080,507 |
| Acuris Finance U.S., Inc. | |
| Initial Dollar Term Loan | |
| 4.50% (3 Month LIBOR + 4.00%), due 2/16/28 (b) | 1,269,531 | 1,272,705 |
| ADMI Corp. | |
| Term Loan B3 | |
| TBD, due 12/23/27 | 750,000 | 748,594 |
| AlixPartners, LLP | |
| Initial Dollar Term Loan | |
| 3.25% (1 Month LIBOR + 2.75%), due 2/4/28 (b) | 1,496,250 | 1,489,185 |
| Amentum Government Services Holdings LLC (b) | |
| First Lien Tranche Term Loan 1 | |
| 3.604% (1 Month LIBOR + 3.50%), due 1/29/27 | 1,117,491 | 1,111,437 |
| First Lien Tranche Term Loan 2 | |
| 5.50% (3 Month LIBOR + 4.75%), due 1/29/27 | 997,500 | 1,004,981 |
| Blue Tree Holdings, Inc. | |
| Term Loan | |
| 2.65% (3 Month LIBOR + 2.50%), due 3/4/28 (b) | 498,750 | 495,633 |
| Boxer Parent Co., Inc. | |
| 2021 Replacement Dollar Term Loan | |
| 3.854% (1 Month LIBOR + 3.75%), due 10/2/25 (b) | 2,129,227 | 2,115,476 |
| Brand Energy & Infrastructure Services, Inc. | |
| Initial Term Loan | |
| 5.25% (3 Month LIBOR + 4.25%), due 6/21/24 (b) | 1,657,186 | 1,628,415 |
| Colouroz Investment 1 LLC GMBH | |
| First Lien Initial Term Loan C | |
| 5.25% (0.75% PIK), (3 Month LIBOR + 4.25%), due 9/21/23 (b)(c) | 288,043 | 286,424 |
| Colouroz Investment 2 LLC GMBH | |
| First Lien Initial Term Loan B2 | |
| 5.25% (0.75% PIK), (3 Month LIBOR + 4.25%), due 9/21/23 (b)(c) | 1,742,425 | 1,732,633 |
The notes to the financial statements are an integral part of, and should be read in conjunction with, the financial statements.
| 20 | MainStay VP Floating Rate Portfolio |
| | Principal
Amount | Value |
| Loan Assignments (continued) |
| Finance (continued) |
| Covia Holdings LLC | |
| Initial Term Loan | |
| 5.00% (3 Month LIBOR + 4.00%), due 7/31/26 (b) | $ 709,736 | $ 697,759 |
| CPC Acquisition Corp. | |
| First Lien Initial Term Loan | |
| 4.50% (3 Month LIBOR + 3.75%), due 12/29/27 (b) | 1,995,000 | 1,991,259 |
| Cyxtera DC Holdings, Inc. | |
| Second Lien Initial Term Loan | |
| 8.25% (3 Month LIBOR + 7.25%), due 5/1/25 (b)(c) | 800,000 | 791,400 |
| Deerfield Dakota Holding LLC | |
| First Lien Initial Dollar Term Loan | |
| 4.75% (1 Month LIBOR + 3.75%), due 4/9/27 (b) | 990,000 | 993,671 |
| Endurance International Group Holdings, Inc. | |
| Initial Term Loan | |
| 4.25% (3 Month LIBOR + 3.50%), due 2/10/28 (b) | 3,904,555 | 3,881,780 |
| Flexential Intermediate Corp. | |
| First Lien Initial Term Loan | |
| 3.647% (3 Month LIBOR + 3.50%), due 8/1/24 (b) | 1,155,000 | 1,055,381 |
| Greenrock Finance, Inc. | |
| First Lien Initial USD Term Loan B | |
| 4.50% (3 Month LIBOR + 3.50%), due 6/28/24 (b)(c) | 967,454 | 951,733 |
| ICON Luxembourg SARL | |
| Term Loan B | |
| TBD, due 7/1/28 | 2,001,360 | 2,005,112 |
| Indy US Bidco LLC | |
| Tranche Term Loan B1 | |
| 4.08% (1 Month LIBOR + 4.00%), due 3/6/28 (b) | 1,496,250 | 1,497,853 |
| Intelsat Jackson Holdings SA | |
| DIP Facility Term Loan | |
| 6.50% (3 Month LIBOR + 5.50%), due 7/13/22 (b) | 241,525 | 243,458 |
| IPS Acquisition LLC | |
| First Lien Term Loan B2 | |
| 4.25% (1 Month LIBOR + 3.25%), due 11/7/24 (b) | 452,020 | 451,079 |
| iStar, Inc. | |
| Loan 2.822%-2.835% | |
| (1 Month LIBOR + 2.75%), due 6/28/23 (b) | 630,585 | 629,009 |
| | Principal
Amount | Value |
| |
| Finance (continued) |
| LBM Acquisition LLC | |
| First Lien Initial Term Loan | |
| 4.50% (3 Month LIBOR + 3.75%), due 12/17/27 (b) | $ 700,000 | $ 694,968 |
| LSF11 Skyscraper Holdco SARL | |
| USD Term Loan B | |
| 4.25% (3 Month LIBOR + 3.50%), due 9/29/27 (b) | 798,000 | 799,995 |
| Minimax Viking GmbH Facility | |
| Term Loan B1C | |
| 3.50% (1 Month LIBOR + 2.75%), due 7/31/25 (b) | 2,183,962 | 2,183,962 |
| ON Semiconductor Corp. | |
| 2019 New Replacement Term Loan B4 | |
| 2.104% (1 Month LIBOR + 2.00%), due 9/19/26 (b) | 486,325 | 484,501 |
| Onex TSG Intermediate Corp. | |
| Initial Term Loan | |
| 5.50% (3 Month LIBOR + 4.75%), due 2/28/28 (b) | 1,000,000 | 1,002,083 |
| Pactiv Evergreen, Inc. | |
| Tranche U.S. Term Loan B2 | |
| 3.354% (1 Month LIBOR + 3.25%), due 2/5/26 (b) | 1,120,622 | 1,112,685 |
| Park River Holdings, Inc. | |
| First Lien Initial Term Loan | |
| 4.00% (3 Month LIBOR + 3.25%), due 12/28/27 (b) | 1,333,333 | 1,324,444 |
| Peraton Corp. | |
| First Lien Term Loan B | |
| 4.50% (1 Month LIBOR + 3.75%), due 2/1/28 (b) | 5,586,000 | 5,599,094 |
| PODS, LLC | |
| Initial Term Loan | |
| 3.75% (1 Month LIBOR + 3.00%), due 3/31/28 (b) | 2,992,500 | 2,986,267 |
| Potters Industries LLC | |
| Initial Term Loan | |
| 4.75% (3 Month LIBOR + 4.00%), due 12/14/27 (b) | 798,000 | 798,499 |
| Realpage, Inc. | |
| First Lien Initial Term Loan | |
| 3.75% (1 Month LIBOR + 3.25%), due 4/24/28 (b) | 633,846 | 631,707 |
| Spa Holdings 3 Oy | |
| USD Term Loan B | |
| 4.75% (3 Month LIBOR + 4.00%), due 2/4/28 (b) | 798,000 | 799,995 |
The notes to the financial statements are an integral part of, and should be read in conjunction with, the financial statements.
21
Portfolio of Investments June 30, 2021† (Unaudited) (continued)
| | Principal
Amount | Value |
| Loan Assignments (continued) |
| Finance (continued) |
| Transplace Holdings, Inc. | |
| First Lien Closing Date Term Loan | |
| 4.75% (3 Month LIBOR + 3.75%), due 10/7/24 (b)(c) | $ 1,158,098 | $ 1,158,387 |
| Triton Water Holdings, Inc. | |
| First Lien Initial Term Loan | |
| 4.00% (3 Month LIBOR + 3.50%), due 3/31/28 (b) | 5,240,000 | 5,234,388 |
| Truck Hero, Inc. | |
| Initial Term Loan | |
| 4.50% (1 Month LIBOR + 3.75%), due 1/31/28 (b) | 1,077,300 | 1,076,701 |
| USS Ultimate Holdings, Inc. | |
| First Lien Initial Term Loan | |
| 4.75% (1 Month LIBOR + 3.75%), due 8/25/24 (b) | 2,029,822 | 2,034,896 |
| WCG Purchaser Corp. | |
| First Lien Initial Term Loan | |
| 5.00% (3 Month LIBOR + 4.00%), due 1/8/27 (b) | 2,272,500 | 2,278,181 |
| WildBrain Ltd. | |
| Initial Term Loan | |
| 5.00% (1 Month LIBOR + 4.25%), due 3/24/28 (b) | 3,635,888 | 3,617,708 |
| WIN Waste Innovations Holdings, Inc. | |
| Initial Term Term Loan | |
| 3.25% (3 Month LIBOR + 2.75%), due 3/24/28 (b) | 2,240,000 | 2,231,600 |
| | | 65,664,388 |
| Healthcare, Education & Childcare 9.7% |
| Agiliti Health, Inc. | |
| Initial Term Loan | |
| 2.875% (1 Month LIBOR + 2.75%), due 1/4/26 (b) | 879,750 | 874,252 |
| AHP Health Partners, Inc. | |
| Term Loan B1 | |
| 4.75% (1 Month LIBOR + 3.75%), due 6/30/25 (b) | 2,288,746 | 2,291,607 |
| Akorn Operating Co. LLC | |
| Term Loan | |
| 8.50% (3 Month LIBOR + 7.50%), due 10/1/25 (b) | 75,632 | 77,807 |
| Alliance Healthcare Services, Inc. | |
| First Lien Initial Term Loan | |
| 5.50% (1 Month LIBOR + 4.50%), due 10/24/23 (b)(c) | 781,165 | 773,353 |
| | Principal
Amount | Value |
| |
| Healthcare, Education & Childcare (continued) |
| Alvogen Pharma U.S., Inc. | |
| January 2020 Loan | |
| 6.25% (3 Month LIBOR + 5.25%), due 12/31/23 (b) | $ 1,283,715 | $ 1,261,250 |
| Amneal Pharmaceuticals LLC | |
| Initial Term Loan | |
| 3.625% (1 Month LIBOR + 3.50%), due 5/4/25 (b) | 3,159,864 | 3,103,777 |
| athenahealth, Inc. | |
| First Lien Term Loan B1 | |
| 4.41% (3 Month LIBOR + 4.25%), due 2/11/26 (b) | 2,821,593 | 2,833,937 |
| Auris Luxembourg III SARL | |
| Facility Term Loan B2 | |
| 3.854% (1 Month LIBOR + 3.75%), due 2/27/26 (b) | 1,155,848 | 1,144,290 |
| Avantor Funding, Inc. | |
| Initial Dollar Term Loan B3 | |
| 3.00% (1 Month LIBOR + 2.00%), due 11/21/24 (b) | 393,307 | 393,110 |
| Bausch Health Cos., Inc. | |
| Initial Term Loan | |
| 3.093% (1 Month LIBOR + 3.00%), due 6/2/25 (b) | 4,663,400 | 4,642,998 |
| Carestream Dental Equipment, Inc. | |
| First Lien Initial Term Loan | |
| 4.25% (3 Month LIBOR + 3.25%), due 9/1/24 (b) | 962,500 | 958,891 |
| Carestream Health, Inc. (b) | |
| First Lien 2023 Extended Term Loan | |
| 7.75% (3 Month LIBOR + 6.75%), due 5/8/23 | 1,877,955 | 1,877,955 |
| Second Lien 2023 Extended Loan | |
| 13.50% (3 Month LIBOR + 4.50%), due 8/8/23 | 1,482,409 | 1,443,496 |
| DaVita, Inc. | |
| Tranche Term Loan B1 | |
| 1.854% (1 Month LIBOR + 1.75%), due 8/12/26 (b) | 1,709,535 | 1,699,384 |
| Ecovyst Catalyst Technologies LLC | |
| Initial Term Loan | |
| 3.25% (2 Month LIBOR + 2.75%), due 6/9/28 (b) | 1,800,000 | 1,796,999 |
| Elanco Animal Health, Inc. | |
| Term Loan | |
| 1.842% (1 Month LIBOR + 1.75%), due 8/1/27 (b) | 1,549,438 | 1,526,474 |
The notes to the financial statements are an integral part of, and should be read in conjunction with, the financial statements.
| 22 | MainStay VP Floating Rate Portfolio |
| | Principal
Amount | Value |
| Loan Assignments (continued) |
| Healthcare, Education & Childcare (continued) |
| Endo Luxembourg Finance Co. SARL | |
| 2021 Term Loan | |
| 5.75% (3 Month LIBOR + 5.00%), due 3/27/28 (b) | $ 2,294,250 | $ 2,226,856 |
| Envision Healthcare Corp. | |
| Initial Term Loan | |
| 3.843% (1 Month LIBOR + 3.75%), due 10/10/25 (b) | 1,826,357 | 1,559,252 |
| eResearchTechnology, Inc. | |
| First Lien Initial Term Loan | |
| 5.50% (1 Month LIBOR + 4.50%), due 2/4/27 (b) | 1,985,985 | 1,994,052 |
| ExamWorks Group, Inc. | |
| Term Loan B1 | |
| 4.25% (1 Month LIBOR + 3.25%), due 7/27/23 (b) | 2,876,613 | 2,877,511 |
| FC Compassus LLC | |
| Term Loan B1 | |
| 5.00% (3 Month LIBOR + 4.25%), due 12/31/26 (b)(c) | 2,061,516 | 2,071,823 |
| Gentiva Health Services, Inc. | |
| First Lien Term Loan B1 | |
| 2.875% (1 Month LIBOR + 2.75%), due 7/2/25 (b) | 1,872,487 | 1,867,221 |
| Grifols Worldwide Operations Ltd. | |
| Tranche Term Loan B | |
| 2.088% (52 Week LIBOR + 2.00%), due 11/15/27 (b) | 985,000 | 974,814 |
| HCA Inc. | |
| Term Loan | |
| TBD, due 6/30/28 | 600,000 | 602,250 |
| Horizon Therapeutics USA, Inc. | |
| Incremental Term Loan B2 | |
| 2.50% (1 Month LIBOR + 2.00%), due 3/15/28 (b) | 665,000 | 661,200 |
| Insulet Corp. | |
| Term Loan B | |
| 3.75% (1 Month LIBOR + 3.25%), due 5/4/28 (b) | 1,400,000 | 1,400,875 |
| Journey Personal Care Corp. | |
| Initial Term Loan | |
| 5.00% (3 Month LIBOR + 4.25%), due 3/1/28 (b) | 1,000,000 | 1,001,875 |
| LifePoint Health, Inc. | |
| First Lien Term Loan B | |
| 3.854% (1 Month LIBOR + 3.75%), due 11/16/25 (b) | 3,376,733 | 3,368,292 |
| | Principal
Amount | Value |
| |
| Healthcare, Education & Childcare (continued) |
| Mallinckrodt International Finance SA | |
| 2017 Term Loan B | |
| 6.00% (3 Month LIBOR + 5.25%), due 9/24/24 (b)(e)(f) | $ 969,714 | $ 936,582 |
| National Mentor Holdings, Inc. (b) | |
| First Lien Initial Term Loan | |
| 4.50% (1 Month LIBOR + 3.75%, 3 Month LIBOR + 3.75%), due 3/2/28 | 1,573,665 | 1,575,877 |
| First Lien Initial Term Loan C | |
| 4.50% (3 Month LIBOR + 3.75%), due 3/2/28 (c) | 49,563 | 49,632 |
| Organon & Co. | |
| Dollar Term Loan | |
| 3.50% (6 Month LIBOR + 3.00%), due 6/2/28 (b) | 4,750,000 | 4,751,696 |
| Ortho-Clinical Diagnostics, Inc. | |
| Second Amendment New Term Loan | |
| 3.089% (1 Month LIBOR + 3.00%), due 6/30/25 (b) | 2,610,690 | 2,607,426 |
| Petco Health and Wellness Co., Inc. | |
| First Lien Initial Term Loan | |
| 4.00% (3 Month LIBOR + 3.25%), due 3/3/28 (b) | 1,995,000 | 1,990,725 |
| Raptor Acquisition Corp. | |
| Term Loan | |
| TBD, due 11/1/26 | 1,250,000 | 1,251,173 |
| Select Medical Corp. | |
| Tranche Term Loan B | |
| 2.36% (1 Month LIBOR + 2.25%), due 3/6/25 (b) | 3,048,392 | 3,020,767 |
| Sound Inpatient Physicians, Inc. | |
| First Lien Initial Term Loan | |
| 2.854% (1 Month LIBOR + 2.75%), due 6/27/25 (b)(c) | 485,000 | 482,777 |
| Sunshine Luxembourg VII SARL | |
| Facility Term Loan B3 | |
| 4.50% (3 Month LIBOR + 3.75%), due 10/1/26 (b) | 6,495,393 | 6,512,684 |
| Team Health Holdings, Inc. | |
| Team Health Holdings, Inc. Initial Term Loan | |
| 3.75% (1 Month LIBOR + 2.75%), due 2/6/24 (b) | 2,843,225 | 2,750,820 |
| U.S. Anesthesia Partners, Inc. | |
| First Lien Initial Term Loan | |
| 4.00% (3 Month LIBOR + 3.00%), due 6/23/24 (b) | 2,292,187 | 2,275,472 |
The notes to the financial statements are an integral part of, and should be read in conjunction with, the financial statements.
23
Portfolio of Investments June 30, 2021† (Unaudited) (continued)
| | Principal
Amount | Value |
| Loan Assignments (continued) |
| Healthcare, Education & Childcare (continued) |
| Visual Comfort and Co. | |
| Term Loan | |
| TBD, due 6/1/28 | $ 500,000 | $ 497,500 |
| | | 76,008,732 |
| Home and Office Furnishings, Housewares & Durable Consumer Products 0.2% |
| Serta Simmons Bedding LLC | |
| First Lien Initial Term Loan | |
| 4.50% (3 Month LIBOR + 3.50%), due 11/8/23 (b) | 2,506,599 | 1,709,709 |
| Hotels, Motels, Inns & Gaming 4.8% |
| Aimbridge Acquisition Co., Inc. | |
| First Lien 2019 Initial Term Loan | |
| 3.854% (1 Month LIBOR + 3.75%), due 2/2/26 (b) | 2,708,093 | 2,640,391 |
| AP Gaming I LLC | |
| First Lien Incremental Term Loan B | |
| 4.50% (3 Month LIBOR + 3.50%), due 2/15/24 (b) | 1,825,373 | 1,806,207 |
| Caesars Resort Collection LLC | |
| Term Loan B | |
| 2.854% (1 Month LIBOR + 2.75%), due 12/23/24 (b) | 2,388,035 | 2,366,395 |
| Churchill Downs, Inc. | |
| Facility Term Loan B | |
| 2.11% (1 Month LIBOR + 2.00%), due 12/27/24 (b) | 1,937,292 | 1,921,552 |
| CityCenter Holdings LLC | |
| Term Loan B | |
| 3.00% (1 Month LIBOR + 2.25%), due 4/18/24 (b) | 2,784,000 | 2,760,634 |
| Everi Payments, Inc. | |
| Term Loan B | |
| 3.50% (1 Month LIBOR + 2.75%), due 5/9/24 (b) | 2,955,113 | 2,947,111 |
| Flutter Entertainment plc | |
| USD Term Loan | |
| 3.647% (3 Month LIBOR + 3.50%), due 7/10/25 (b) | 378,430 | 379,106 |
| Four Seasons Holdings, Inc. | |
| First Lien Term Loan | |
| 2.104% (1 Month LIBOR + 2.00%), due 11/30/23 (b) | 1,439,515 | 1,434,717 |
| | Principal
Amount | Value |
| |
| Hotels, Motels, Inns & Gaming (continued) |
| Golden Entertainment, Inc. | |
| First Lien Facility Term Loan B | |
| 3.75% (1 Month LIBOR + 3.00%), due 10/20/24 (b) | $ 1,502,591 | $ 1,490,382 |
| GVC Holdings plc | |
| USD Facility Term Loan B3 | |
| 3.00% (6 Month LIBOR + 2.00%), due 3/29/24 (b) | 1,456,112 | 1,447,465 |
| Hilton Worldwide Finance LLC | |
| Refinancing Term Loan B2 | |
| 1.842% (1 Month LIBOR + 1.75%), due 6/22/26 (b) | 235,804 | 233,741 |
| PCI Gaming Authority Facility | |
| Term Loan B | |
| 2.604% (1 Month LIBOR + 2.50%), due 5/29/26 (b) | 2,588,843 | 2,575,495 |
| Penn National Gaming, Inc. | |
| Facility Term Loan B1 | |
| 3.00% (1 Month LIBOR + 2.25%), due 10/15/25 (b) | 1,036,769 | 1,033,116 |
| Scientific Games International, Inc. | |
| Initial Term Loan B5 | |
| 2.854% (1 Month LIBOR + 2.75%), due 8/14/24 (b) | 4,277,109 | 4,245,030 |
| Station Casinos LLC | |
| Facility Term Loan B1 | |
| 2.50% (1 Month LIBOR + 2.25%), due 2/8/27 (b) | 1,639,899 | 1,620,016 |
| UFC Holdings, LLC | |
| First Lien Term Loan B3 | |
| 3.50% (3 Month LIBOR + 3.00%), due 4/29/26 (b) | 4,168,538 | 4,160,722 |
| Wyndham Destinations, Inc. | |
| Term Loan B | |
| 2.354% (1 Month LIBOR + 2.25%), due 5/30/25 (b) | 1,952,349 | 1,926,859 |
| Wyndham Hotels & Resorts, Inc. | |
| Term Loan B | |
| 1.854% (1 Month LIBOR + 1.75%), due 5/30/25 (b) | 2,438,599 | 2,416,922 |
| | | 37,405,861 |
| Insurance 3.2% |
| Acrisure LLC | |
| 2020 First Lien Term Loan | |
| 3.604% (1 Month LIBOR + 3.50%), due 2/15/27 (b) | 3,022,166 | 2,985,900 |
The notes to the financial statements are an integral part of, and should be read in conjunction with, the financial statements.
| 24 | MainStay VP Floating Rate Portfolio |
| | Principal
Amount | Value |
| Loan Assignments (continued) |
| Insurance (continued) |
| AmWINS Group, Inc. | |
| Term Loan | |
| 3.00% (1 Month LIBOR + 2.25%), due 2/19/28 (b) | $ 1,990,000 | $ 1,976,657 |
| AssuredPartners, Inc. | |
| 2020 February Refinancing Term Loan | |
| 3.604% (1 Month LIBOR + 3.50%), due 2/12/27 (b) | 3,173,192 | 3,153,927 |
| Asurion LLC (b) | |
| Replacement Term Loan B6 | |
| 3.104% (1 Month LIBOR + 3.00%), due 11/3/23 | 1,095,062 | 1,088,731 |
| New Term Loan B7 | |
| 3.104% (1 Month LIBOR + 3.00%), due 11/3/24 | 2,449,546 | 2,423,138 |
| New Term Loan B8 | |
| 3.354% (1 Month LIBOR + 3.25%), due 12/23/26 | 995,000 | 983,029 |
| New Term Loan B9 | |
| 3.354% (1 Month LIBOR + 3.25%), due 7/31/27 | 498,750 | 492,931 |
| Second Lien Term Loan B3 | |
| 5.354% (1 Month LIBOR + 5.25%), due 1/31/28 | 300,000 | 302,175 |
| Hub International Ltd. (b) | |
| Initial Term Loan 2.90%-2.925% | |
| (2 Month LIBOR + 2.75%, 3 Month LIBOR + 2.75%), due 4/25/25 | 1,411,699 | 1,395,082 |
| Incremental Term Loan B3 | |
| 4.00% (3 Month LIBOR + 3.25%), due 4/25/25 | 997,494 | 996,959 |
| NFP Corp. | |
| Closing Date Term Loan | |
| 3.354% (1 Month LIBOR + 3.25%), due 2/15/27 (b) | 1,939,107 | 1,910,323 |
| Ryan Specialty Group LLC | |
| Initial Term Loan | |
| 3.75% (1 Month LIBOR + 3.00%), due 9/1/27 (b) | 992,500 | 991,259 |
| Sedgwick Claims Management Services, Inc. (b) | |
| Initial Term Loan | |
| 3.354% (1 Month LIBOR + 3.25%), due 12/31/25 | 2,940,074 | 2,906,999 |
| 2019 Term Loan | |
| 3.854% (1 Month LIBOR + 3.75%), due 9/3/26 | 980,000 | 978,095 |
| | Principal
Amount | Value |
| |
| Insurance (continued) |
| USI, Inc. | |
| 2017 New Term Loan | |
| 3.147% (3 Month LIBOR + 3.00%), due 5/16/24 (b) | $ 2,887,500 | $ 2,859,656 |
| | | 25,444,861 |
| Leisure, Amusement, Motion Pictures & Entertainment 2.0% |
| Alterra Mountain Co. | |
| Initial Bluebird Term Loan | |
| 2.854% (1 Month LIBOR + 2.75%), due 7/31/24 (b) | 3,406,706 | 3,362,906 |
| Bombardier Recreational Products, Inc. | |
| 2020 Replacement Term Loan | |
| 2.104% (1 Month LIBOR + 2.00%), due 5/24/27 (b) | 3,298,713 | 3,257,479 |
| Boyd Gaming Corp. | |
| Refinacing Term Loan B | |
| 2.338% (52 Week LIBOR + 2.25%), due 9/15/23 (b) | 1,390,333 | 1,388,121 |
| Creative Artists Agency LLC | |
| Closing Date Term Loan | |
| 3.854% (1 Month LIBOR + 3.75%), due 11/27/26 (b) | 1,477,500 | 1,471,343 |
| Fitness International LLC (b) | |
| Term Loan A | |
| 4.25% (3 Month LIBOR + 3.25%), due 1/8/25 | 1,179,375 | 1,122,372 |
| Term Loan B | |
| 4.25% (1 Month LIBOR + 3.25%), due 4/18/25 | 270,764 | 258,072 |
| Lions Gate Capital Holdings LLC | |
| Term Loan B | |
| 2.354% (1 Month LIBOR + 2.25%), due 3/24/25 (b) | 1,025,784 | 1,016,808 |
| Marriott Ownership Resorts, Inc. | |
| 2019 Refinancing Term Loan | |
| 1.854% (1 Month LIBOR + 1.75%), due 8/29/25 (b) | 1,313,765 | 1,292,964 |
| William Morris Endeavor Entertainment LLC | |
| First Lien Term Loan B1 | |
| 2.86% (1 Month LIBOR + 2.75%), due 5/18/25 (b) | 2,632,102 | 2,581,653 |
| | | 15,751,718 |
| Machinery (Non-Agriculture, Non-Construct & Non-Electronic) 1.3% |
| Advanced Drainage Systems, Inc. | |
| Initial Term Loan | |
| 2.375% (1 Month LIBOR + 2.25%), due 7/31/26 (b) | 470,893 | 472,305 |
The notes to the financial statements are an integral part of, and should be read in conjunction with, the financial statements.
25
Portfolio of Investments June 30, 2021† (Unaudited) (continued)
| | Principal
Amount | Value |
| Loan Assignments (continued) |
| Machinery (Non-Agriculture, Non-Construct & Non-Electronic) (continued) |
| Altra Industrial Motion Corp. | |
| Term Loan | |
| 2.104% (1 Month LIBOR + 2.00%), due 10/1/25 (b) | $ 1,798,930 | $ 1,788,587 |
| Brown Group Holdings LLC | |
| Initial Term Loan | |
| 3.25% (3 Month LIBOR + 2.75%), due 6/7/28 (b) | 1,250,000 | 1,243,750 |
| Columbus McKinnon Corp. | |
| Initial Term Loan | |
| 3.25% (3 Month LIBOR + 2.75%), due 5/14/28 (b) | 1,500,000 | 1,496,250 |
| CPM Holdings, Inc. (b) | |
| First Lien Initial Term Loan | |
| 3.592% (1 Month LIBOR + 3.50%), due 11/17/25 | 1,462,498 | 1,450,067 |
| Second Lien Initial Term Loan | |
| 8.342% (1 Month LIBOR + 8.25%), due 11/16/26 (c) | 797,980 | 786,010 |
| Titan Acquisition Ltd. | |
| Initial Term Loan | |
| 3.167% (3 Month LIBOR + 3.00%), due 3/28/25 (b) | 1,814,058 | 1,780,951 |
| Welbilt, Inc. | |
| 2018 Term Loan B | |
| 2.604% (1 Month LIBOR + 2.50%), due 10/23/25 (b) | 1,284,178 | 1,271,337 |
| | | 10,289,257 |
| Manufacturing 1.1% |
| CP Atlas Buyer, Inc. | |
| Term Loan B | |
| 4.25% (1 Month LIBOR + 3.75%), due 11/23/27 (b) | 1,995,000 | 1,988,516 |
| Fairbanks Morse Defense | |
| Term Loan | |
| 5.50% (3 Month LIBOR + 5.50%), due 6/23/28 (b) | 2,500,000 | 2,496,875 |
| Fluid Flow Products, Inc. | |
| First Lien Intial Term Loan | |
| 4.25% (3 Month LIBOR + 3.75%), due 3/31/28 (b) | 840,000 | 840,525 |
| Idemia Group SAS | |
| Term Loan B3 | |
| 5.25% (2 Month LIBOR + 4.50%), due 1/10/26 (b) | 1,081,160 | 1,076,430 |
| | Principal
Amount | Value |
| |
| Manufacturing (continued) |
| Madison IAQ LLC | |
| Term Loan | |
| 3.75% (3 Month LIBOR + 3.25%), due 6/21/28 (b) | $ 1,840,000 | $ 1,840,460 |
| Weber-Stephen Products LLC | |
| Initial Term Loan B | |
| 4.00% (1 Month LIBOR + 3.25%), due 10/30/27 (b) | 358,200 | 358,584 |
| | | 8,601,390 |
| Media 0.1% |
| Mission Broadcasting, Inc. | |
| Term Loan B4 | |
| 2.604% (1 Month LIBOR + 2.50%), due 6/2/28 (b) | 600,000 | 598,050 |
| Mining, Steel, Iron & Non-Precious Metals 1.0% |
| American Rock Salt Co. LLC | |
| First Lien Initial Term Loan | |
| 4.75% (1 Month LIBOR + 4.00%), due 6/9/28 (b) | 1,257,143 | 1,258,714 |
| Gates Global LLC | |
| Initial Dollar Term Loan B3 | |
| 3.50% (1 Month LIBOR + 2.75%), due 3/31/27 (b) | 2,943,738 | 2,936,043 |
| Graftech International Ltd. | |
| Initial Term Loan | |
| 3.50% (1 Month LIBOR + 3.00%), due 2/12/25 (b) | 1,037,579 | 1,038,876 |
| MRC Global (U.S.), Inc. | |
| 2018 Refinancing Term Loan | |
| 3.104% (1 Month LIBOR + 3.00%), due 9/20/24 (b) | 1,054,451 | 1,046,543 |
| U.S. Silica Co. | |
| Term Loan | |
| 5.00% (1 Month LIBOR + 4.00%), due 5/1/25 (b) | 1,451,011 | 1,384,679 |
| | | 7,664,855 |
| Oil & Gas 1.5% |
| Buckeye Partners LP | |
| 2021 Tranche Term Loan B1 | |
| 2.354% (1 Month LIBOR + 2.25%), due 11/1/26 (b) | 1,357,864 | 1,347,303 |
| ChampionX Corp. | |
| Initial Term Loan | |
| 2.625% (1 Month LIBOR + 2.50%), due 5/9/25 (b)(c) | 202,410 | 200,891 |
The notes to the financial statements are an integral part of, and should be read in conjunction with, the financial statements.
| 26 | MainStay VP Floating Rate Portfolio |
| | Principal
Amount | Value |
| Loan Assignments (continued) |
| Oil & Gas (continued) |
| DT Midstream, Inc. | |
| Initial Term Loan | |
| TBD, due 6/26/28 | $ 800,000 | $ 800,625 |
| Fleet Midco I Ltd. | |
| Facility Loan B | |
| 3.104% (1 Month LIBOR + 3.00%), due 10/7/26 (b) | 1,228,125 | 1,209,703 |
| GIP III Stetson I, LP | |
| Initial Term Loan | |
| 4.354% (1 Month LIBOR + 4.25%), due 7/18/25 (b)(c) | 1,513,789 | 1,458,283 |
| Keane Group Holdings LLC | |
| Initial Term Loan | |
| 5.50% (1 Month LIBOR + 4.50%), due 5/25/25 (b) | 970,000 | 955,450 |
| Lucid Energy Group II Borrower LLC | |
| Initial Term Loan | |
| 4.00% (1 Month LIBOR + 3.00%), due 2/17/25 (b) | 1,354,500 | 1,340,278 |
| Medallion Midland Acquisition LLC | |
| Initial Term Loan | |
| 4.25% (1 Month LIBOR + 3.25%), due 10/30/24 (b) | 579,000 | 574,078 |
| Murphy Oil USA, Inc. | |
| Tranche Term Loan B | |
| 2.25% (3 Month LIBOR + 1.75%), due 1/31/28 (b) | 448,875 | 449,436 |
| NorthRiver Midstream Finance LP | |
| Initial Term Loan B | |
| 3.452% (3 Month LIBOR + 3.25%), due 10/1/25 (b) | 1,167,000 | 1,156,372 |
| PES Holdings LLC | |
| Tranche Term Loan C | |
| (3.00% PIK), (1 Month LIBOR + 4.50%), due 12/31/22 (b)(c)(e)(f) | 1,113,958 | 11,140 |
| Prairie ECI Acquiror LP | |
| Initial Term Loan | |
| 4.854% (1 Month LIBOR + 4.75%), due 3/11/26 (b) | 1,185,525 | 1,152,711 |
| Traverse Midstream Partners LLC | |
| Advance | |
| 6.50% (1 Month LIBOR + 5.50%), due 9/27/24 (b) | 1,221,054 | 1,225,252 |
| | | 11,881,522 |
| | Principal
Amount | Value |
| |
| Personal & Nondurable Consumer Products 1.9% |
| Caesars Resort Collection LLC | |
| Term Loan B1 | |
| 4.604% (1 Month LIBOR + 4.50%), due 7/21/25 (b) | $ 1,042,125 | $ 1,044,730 |
| Foundation Building Materials, Inc. | |
| First Lien Initial Term Loan | |
| 3.75% (3 Month LIBOR + 3.25%), due 1/31/28 (b) | 750,000 | 744,509 |
| Great Outdoors Group LLC | |
| Term Loan B1 | |
| 5.00% (3 Month LIBOR + 4.25%), due 3/6/28 (b) | 2,397,950 | 2,409,940 |
| Leslie's Poolmart, Inc. | |
| Initial Term Loan | |
| 3.25% (3 Month LIBOR + 2.75%), due 3/9/28 (b) | 1,995,000 | 1,986,410 |
| Michaels Cos., Inc. (The) | |
| Term Loan B | |
| 5.00% (3 Month LIBOR + 4.25%), due 4/15/28 (b) | 3,200,000 | 3,211,334 |
| Perrigo Co. plc | |
| Term Loan B | |
| TBD, due 1/1/28 | 1,200,000 | 1,188,000 |
| Prestige Brands, Inc. | |
| Term Loan B | |
| TBD, due 6/9/28 | 900,000 | 900,450 |
| Term Loan B4 | |
| 4.25% (3 Month LIBOR + 1.00%), due 1/26/24 (b) | 349,414 | 349,352 |
| Spectrum Brands, Inc. | |
| 2021 Term Loan | |
| 2.50% (3 Month LIBOR + 2.00%), due 3/3/28 (b) | 99,750 | 99,293 |
| SRAM LLC | |
| Initial Term Loan | |
| 3.25% (1 Month LIBOR + 2.75%, 3 Month LIBOR + 2.75%), due 5/18/28 (b) | 2,972,728 | 2,969,011 |
| | | 14,903,029 |
| Personal & Nondurable Consumer Products (Manufacturing Only) 0.5% |
| American Builders & Contractors Supply Co., Inc. | |
| Restatement Effective Date Term Loan | |
| 2.104% (1 Month LIBOR + 2.00%), due 1/15/27 (b) | 1,709,451 | 1,695,659 |
The notes to the financial statements are an integral part of, and should be read in conjunction with, the financial statements.
27
Portfolio of Investments June 30, 2021† (Unaudited) (continued)
| | Principal
Amount | Value |
| Loan Assignments (continued) |
| Personal & Nondurable Consumer Products (Manufacturing Only) (continued) |
| Hercules Achievement, Inc. | |
| First Lien Initial Term Loan | |
| 4.50% (1 Month LIBOR + 3.50%), due 12/16/24 (b) | $ 1,930,059 | $ 1,882,612 |
| | | 3,578,271 |
| Personal Transportation 0.4% |
| Uber Technologies, Inc. (b) | |
| 2021 Incremental Term Loan | |
| 3.593% (1 Month LIBOR + 3.50%), due 4/4/25 | 1,736,573 | 1,734,402 |
| 2021 Refinancing Term Loan | |
| 3.593% (1 Month LIBOR + 3.50%), due 2/25/27 | 997,382 | 996,848 |
| | | 2,731,250 |
| Personal, Food & Miscellaneous Services 2.4% |
| 1011778 B.C. Unlimited Liability Co. | |
| Term Loan B4 | |
| 1.854% (1 Month LIBOR + 1.75%), due 11/19/26 (b) | 2,153,920 | 2,121,275 |
| Aramark Intermediate Holdco Corp. (b) | |
| U.S. Term Loan B3 | |
| 1.854% (1 Month LIBOR + 1.75%), due 3/11/25 | 2,182,663 | 2,156,743 |
| Term Loan B5 | |
| 2.604% (1 Month LIBOR + 2.50%), due 4/6/28 | 1,596,000 | 1,586,025 |
| Hayward Industries, Inc. | |
| First Lien Refinancing Term Loan | |
| 3.25% (1 Month LIBOR + 2.75%), due 5/30/28 (b) | 2,800,000 | 2,792,418 |
| Hillman Group, Inc. | |
| The Term Loan B1 | |
| TBD, due 7/14/28 | 540,225 | 538,762 |
| IRB Holding Corp. (b) | |
| 2020 Replacement Term Loan B | |
| 3.75% (3 Month LIBOR + 2.75%), due 2/5/25 | 2,429,773 | 2,421,802 |
| Fourth Amendment Incremental Term Loan | |
| 4.25% (1 Month LIBOR + 3.25%, 3 Month LIBOR + 3.25%), due 12/15/27 | 2,161,244 | 2,158,542 |
| | Principal
Amount | Value |
| |
| Personal, Food & Miscellaneous Services (continued) |
| KFC Holding Co. | |
| 2021 Term Loan B | |
| 1.833% (1 Month LIBOR + 1.75%), due 3/15/28 (b) | $ 1,471,368 | $ 1,471,368 |
| WW International, Inc. | |
| Initial Term Loan | |
| 4.00% (1 Month LIBOR + 3.50%), due 4/13/28 (b) | 3,600,000 | 3,606,750 |
| | | 18,853,685 |
| Printing & Publishing 1.0% |
| Getty Images, Inc. | |
| Initial Dollar Term Loan | |
| 4.625% (1 Month LIBOR + 4.50%), due 2/19/26 (b) | 1,466,916 | 1,463,983 |
| McGraw Hill LLC | |
| First Lien Term Loan B | |
| 5.75% (1 Month LIBOR + 4.75%), due 11/1/24 (b) | 972,199 | 973,111 |
| Severin Acquisition LLC | |
| First Lien Initial Term Loan | |
| 3.332% (1 Month LIBOR + 3.25%), due 8/1/25 (b) | 1,965,127 | 1,953,664 |
| Springer Nature Deutschland GmbH | |
| Initial Term Loan B18 | |
| 3.75% (1 Month LIBOR + 3.00%), due 8/14/26 (b) | 3,062,584 | 3,060,192 |
| | | 7,450,950 |
| Radio and TV Broadcasting 0.1% |
| Nielsen Finance LLC | |
| Term Loan B4 | |
| 2.081% (1 Month LIBOR + 2.00%), due 10/4/23 (b) | 855,929 | 854,859 |
| Retail Store 2.0% |
| Alphabet Holding Co., Inc. | |
| First Lien Initial Term Loan | |
| 3.604% (1 Month LIBOR + 3.50%), due 9/26/24 (b) | 2,021,250 | 2,018,022 |
| BJ's Wholesale Club, Inc. | |
| First Lien Tranche Term Loan B | |
| 2.073% (1 Month LIBOR + 2.00%), due 2/3/24 (b) | 1,549,996 | 1,549,644 |
| EG Group Ltd. (b) | |
| Facility Term Loan B | |
| 4.147% (3 Month LIBOR + 4.00%), due 2/7/25 | 670,361 | 664,663 |
The notes to the financial statements are an integral part of, and should be read in conjunction with, the financial statements.
| 28 | MainStay VP Floating Rate Portfolio |
| | Principal
Amount | Value |
| Loan Assignments (continued) |
| Retail Store (continued) |
| EG Group Ltd. (b) (continued) | |
| USD Additional Facility Loan | |
| 4.147% (3 Month LIBOR + 4.00%), due 2/7/25 | $ 1,451,274 | $ 1,438,938 |
| Harbor Freight Tools USA, Inc. | |
| 2020 Initial Loan | |
| 3.75% (1 Month LIBOR + 3.00%), due 10/19/27 (b) | 3,862,855 | 3,860,221 |
| LBM Acquisition LLC | |
| First Lien Initial Delayed Draw Term Loan | |
| 4.50% (2 Month LIBOR + 3.75%), due 12/17/27 (b) | 103,704 | 102,958 |
| PetSmart LLC | |
| Initial Term Loan | |
| 4.50% (3 Month LIBOR + 3.75%), due 2/11/28 (b) | 1,400,000 | 1,400,437 |
| Rising Tide Holdings, Inc. | |
| First Lien Initial Term Loan | |
| 5.50% (1 Month LIBOR + 4.75%), due 6/1/28 (b) | 2,440,000 | 2,440,000 |
| White Cap Buyer LLC | |
| Initial Closing Date Term Loan | |
| 4.50% (3 Month LIBOR + 4.00%), due 10/19/27 (b) | 1,992,500 | 1,994,369 |
| | | 15,469,252 |
| Services: Business 1.4% |
| AI Aqua Merger Sub, Inc. | |
| Term Loan B | |
| TBD, due 6/16/28 | 2,133,333 | 2,137,333 |
| Dun & Bradstreet Corp.(The) | |
| Initial Term Borrowing | |
| 3.345% (1 Month LIBOR + 3.25%), due 2/6/26 (b) | 2,937,744 | 2,921,677 |
| ICON Luxembourg SARL | |
| Term Loan B | |
| TBD, due 7/1/28 | 498,640 | 499,575 |
| Intrado Corp. | |
| Initial Term Loan B | |
| 5.00% (3 Month LIBOR + 4.00%), due 10/10/24 (b) | 1,517,146 | 1,483,010 |
| Polaris Newco LLC | |
| First Lien Dollar Term Loan | |
| 4.50% (3 Month LIBOR + 4.00%), due 6/2/28 (b) | 3,000,000 | 3,006,819 |
| | Principal
Amount | Value |
| |
| Services: Business (continued) |
| Project Boost Purchaser, LLC | |
| Term Loan | |
| TBD, due 5/30/26 | $ 750,000 | $ 749,063 |
| | | 10,797,477 |
| Telecommunications 4.4% |
| Avaya, Inc. | |
| Tranche Term Loan B2 | |
| 4.073% (1 Month LIBOR + 4.00%), due 12/15/27 (b) | 1,168,269 | 1,171,372 |
| Azalea TopCo, Inc. | |
| First Lien Initial Term Loan | |
| 3.686% (3 Month LIBOR + 3.50%), due 7/24/26 (b) | 2,456,250 | 2,441,409 |
| Cablevision Lightpath LLC | |
| Initial Term Loan | |
| 3.75% (1 Month LIBOR + 3.25%), due 11/30/27 (b) | 1,500,000 | 1,499,063 |
| Conduent, Inc. | |
| Term Loan B | |
| 2.604% (1 Month LIBOR + 2.50%), due 12/7/23 (b) | 1,434,826 | 1,410,912 |
| Connect Finco SARL | |
| Amendment No. 1 Refinancing Term Loan | |
| 4.50% (1 Month LIBOR + 3.50%), due 12/11/26 (b) | 3,969,949 | 3,971,605 |
| CSC Holdings LLC | |
| September 2019 Initial Term Loan | |
| 2.573% (1 Month LIBOR + 2.50%), due 4/15/27 (b) | 3,654,367 | 3,614,016 |
| Cyxtera DC Holdings, Inc. | |
| First Lien Initial Term Loan | |
| 4.00% (3 Month LIBOR + 3.00%), due 5/1/24 (b)(c) | 960,000 | 934,400 |
| Frontier Communications Holdings LLC | |
| Term Loan B1 | |
| 4.50% (1 Month LIBOR + 3.75%), due 5/1/28 (b) | 2,144,625 | 2,144,625 |
| Gogo, Inc. | |
| Term Loan B | |
| 4.50% (1 Month LIBOR + 3.75%), due 4/30/28 (b) | 2,000,000 | 1,992,500 |
| Intelsat Jackson Holdings SA | |
| Tranche Term Loan B3 | |
| 8.00% (1 Month LIBOR + 4.75%), due 11/27/23 (b) | 1,639,180 | 1,658,986 |
The notes to the financial statements are an integral part of, and should be read in conjunction with, the financial statements.
29
Portfolio of Investments June 30, 2021† (Unaudited) (continued)
| | Principal
Amount | Value |
| Loan Assignments (continued) |
| Telecommunications (continued) |
| Level 3 Financing, Inc. | |
| Tranche 2027 Term Loan B | |
| 1.854% (1 Month LIBOR + 1.75%), due 3/1/27 (b) | $ 1,500,000 | $ 1,477,500 |
| Lumen Technologies Inc. | |
| Term Loan B | |
| 2.354% (1 Month LIBOR + 2.25%), due 3/15/27 (b) | 2,701,307 | 2,663,742 |
| Redstone HoldCo 2 LP | |
| First Lien Initial Term Loan | |
| 5.50% (3 Month LIBOR + 4.75%), due 4/27/28 (b) | 2,515,484 | 2,509,195 |
| SBA Senior Finance II LLC | |
| Initial Term Loan | |
| 1.86% (1 Month LIBOR + 1.75%), due 4/11/25 (b) | 1,780,587 | 1,765,007 |
| Telesat Canada | |
| Term Loan B5 | |
| 2.86% (1 Month LIBOR + 2.75%), due 12/7/26 (b) | 1,220,447 | 1,137,456 |
| Zayo Group Holdings, Inc. | |
| Initial Dollar Term Loan | |
| 3.104% (1 Month LIBOR + 3.00%), due 3/9/27 (b) | 4,348,136 | 4,298,011 |
| | | 34,689,799 |
| Utilities 3.1% |
| Astoria Energy LLC | |
| 2020 Term B Advance | |
| 4.50% (3 Month LIBOR + 3.50%), due 12/10/27 (b) | 670,956 | 669,931 |
| Brookfield WEC Holdings, Inc. | |
| First Lien 2021 Initial Term Loan | |
| 3.25% (1 Month LIBOR + 2.75%), due 8/1/25 (b) | 2,927,750 | 2,898,473 |
| Calpine Corp. | |
| 2019 Term Loan | |
| 2.11% (1 Month LIBOR + 2.00%), due 4/5/26 (b) | 3,087,000 | 3,045,742 |
| Compass Power Generation LLC | |
| Tranche Term Loan B1 | |
| 4.50% (1 Month LIBOR + 3.50%), due 12/20/24 (b) | 1,617,947 | 1,599,745 |
| Edgewater Generation LLC | |
| Term Loan | |
| 3.854% (1 Month LIBOR + 3.75%), due 12/13/25 (b) | 3,834,351 | 3,650,850 |
| | Principal
Amount | Value |
| |
| Utilities (continued) |
| ExGen Renewables IV LLC | |
| Term Loan | |
| 3.50% (3 Month LIBOR + 2.50%), due 12/15/27 (b) | $ 1,475,042 | $ 1,475,349 |
| Granite Generation LLC | |
| Term Loan | |
| 4.75% (1 Month LIBOR + 3.75%, 3 Month LIBOR + 3.75%), due 11/9/26 (b) | 3,225,499 | 3,146,877 |
| Hamilton Projects Acquiror LLC | |
| Term Loan | |
| 5.75% (3 Month LIBOR + 4.75%), due 6/17/27 (b) | 2,475,000 | 2,447,156 |
| Helix Gen Funding LLC | |
| Term Loan | |
| 4.75% (1 Month LIBOR + 3.75%), due 6/3/24 (b) | 413,243 | 400,845 |
| PG&E Corp. | |
| Term Loan | |
| 3.50% (3 Month LIBOR + 3.00%), due 6/23/25 (b) | 1,732,500 | 1,707,956 |
| Southeast PowerGen LLC | |
| Advance Term Loan B | |
| 4.50% (1 Month LIBOR + 3.50%), due 12/2/21 (b) | 403,024 | 398,994 |
| Vistra Operations Co. LLC | |
| First Lien 2018 Incremental Term Loan 1.831%-1.854% | |
| (1 Month LIBOR + 1.75%), due 12/31/25 (b) | 3,134,511 | 3,111,304 |
| | | 24,553,222 |
Total Loan Assignments
(Cost $748,483,056) | | 742,524,518 |
Total Long-Term Bonds
(Cost $780,149,587) | | 775,571,569 |
| |
| | Shares | |
| Affiliated Investment Company 0.3% |
| Fixed Income Fund 0.3% | | |
| MainStay MacKay High Yield Corporate Bond Fund Class I | 436,571 | 2,484,742 |
Total Affiliated Investment Company
(Cost $2,479,721) | | 2,484,742 |
The notes to the financial statements are an integral part of, and should be read in conjunction with, the financial statements.
| 30 | MainStay VP Floating Rate Portfolio |
| | Shares | Value |
| Common Stocks 0.0% ‡ |
| Communications Equipment 0.0% ‡ |
| Energy Future Holdings Corp. (c)(d)(g)(h) | 94,456 | $ — |
| Millennium Corporate Trust (c)(d)(g)(h) | 1,243 | — |
| Millennium Lender Trust (c)(d)(g)(h) | 1,324 | — |
| | | — |
| Metals & Mining 0.0% ‡ |
| Ameriforge Group, Inc. (c)(d)(g)(h) | 45,694 | 271,422 |
Total Common Stocks
(Cost $1,573,379) | | 271,422 |
| |
| | Number of
Rights | |
| Rights 0.0% ‡ |
| Independent Power and Renewable Electricity Producers 0.0% ‡ |
| Vistra Energy Corp. | | |
| Expires 12/31/46 (c)(d)(g)(h) | 57,684 | 60,568 |
Total Rights
(Cost $47,301) | | 60,568 |
| |
| | Number of
Warrants | |
| Warrants 0.0% ‡ |
| Health Care Equipment & Supplies 0.0% ‡ |
| Carestream Health, Inc. | | |
| Expires 12/31/21 (c)(d)(g)(h) | 29 | — |
| Health Care Providers & Services 0.0% ‡ |
| THAIHOT Investment Co. Ltd. | | |
| Expires 10/13/27 (c)(d)(g)(h) | 22 | — |
Total Warrants
(Cost $0) | | — |
| |
| | Principal
Amount | |
| Short-Term Investments 8.5% |
| U.S. Treasury Debt 8.5% |
| U.S. Treasury Bills (i) | | |
| 0.009%, due 7/15/21 | $ 9,759,000 | 9,758,829 |
| | Principal
Amount | | Value |
| |
| U.S. Treasury Debt (continued) |
| U.S. Treasury Bills (i) (continued) | | | |
| 0.011%, due 7/13/21 | $ 591,000 | | $ 590,992 |
| 0.012%, due 7/20/21 | 52,432,000 | | 52,430,616 |
| 0.069%, due 7/27/21 | 3,601,000 | | 3,600,880 |
Total Short-Term Investments
(Cost $66,382,553) | | | 66,381,317 |
Total Investments
(Cost $850,632,541) | 107.8% | | 844,769,618 |
| Other Assets, Less Liabilities | (7.8) | | (61,403,125) |
| Net Assets | 100.0% | | $ 783,366,493 |
| † | Percentages indicated are based on Portfolio net assets. |
| ‡ | Less than one-tenth of a percent. |
| (a) | May be sold to institutional investors only under Rule 144A or securities offered pursuant to Section 4(a)(2) of the Securities Act of 1933, as amended. |
| (b) | Floating rate—Rate shown was the rate in effect as of June 30, 2021. |
| (c) | Illiquid security—As of June 30, 2021, the total market value deemed illiquid under procedures approved by the Board of Trustees was $23,713,231, which represented 3.0% of the Portfolio’s net assets. |
| (d) | Security in which significant unobservable inputs (Level 3) were used in determining fair value. |
| (e) | Issue in default. |
| (f) | Issue in non-accrual status. |
| (g) | Fair valued security—Represents fair value as measured in good faith under procedures approved by the Board of Trustees. As of June 30, 2021, the total market value was $331,990, which represented less than one-tenth of a percent of the Portfolio’s net assets. |
| (h) | Non-income producing security. |
| (i) | Interest rate shown represents yield to maturity. |
| Abbreviation(s): |
| LIBOR—London Interbank Offered Rate |
| REIT—Real Estate Investment Trust |
| TBD—To Be Determined |
| USD—United States Dollar |
The notes to the financial statements are an integral part of, and should be read in conjunction with, the financial statements.
31
Portfolio of Investments June 30, 2021† (Unaudited) (continued)
The following is a summary of the fair valuations according to the inputs used as of June 30, 2021, for valuing the Portfolio’s assets:
| Description | Quoted
Prices in
Active
Markets for
Identical
Assets
(Level 1) | | Significant
Other
Observable
Inputs
(Level 2) | | Significant
Unobservable
Inputs
(Level 3) | | Total |
| Asset Valuation Inputs | | | | | | | |
| Investments in Securities (a) | | | | | | | |
| Long-Term Bonds | | | | | | | |
| Corporate Bonds | $ — | | $ 33,047,051 | | $ — | | $ 33,047,051 |
| Loan Assignments | — | | 741,898,273 | | 626,245 | | 742,524,518 |
| Total Long-Term Bonds | — | | 774,945,324 | | 626,245 | | 775,571,569 |
| Affiliated Investment Company | | | | | | | |
| Fixed Income Fund | 2,484,742 | | — | | — | | 2,484,742 |
| Common Stocks | — | | — | | 271,422 | | 271,422 |
| Rights | — | | — | | 60,568 | | 60,568 |
| Warrants | — | | — | | — | | — |
| Short-Term Investments | | | | | | | |
| U.S. Treasury Debt | — | | 66,381,317 | | — | | 66,381,317 |
| Total Investments in Securities | $ 2,484,742 | | $ 841,326,641 | | $ 958,235 | | $ 844,769,618 |
| (a) | For a complete listing of investments and their industries, see the Portfolio of Investments. |
The following is a reconciliation of investments in which significant unobservable inputs (Level 3) were used in determining value:
Investments in
Securities | Balance
as of
December 31,
2020 | | Accrued
Discounts
(Premiums) | | Realized
Gain
(Loss) | | Change in
Unrealized
Appreciation
(Depreciation) | | Purchases | | Sales | | Transfers
in to
Level 3 | | Transfers
out of
Level 3 | | Balance
as of
June 30,
2021 | | Change in
Unrealized
Appreciation
(Depreciation)
from
Investments
Still Held as
of June 30,
2021 |
| Long-Term Bonds | | | | | | | | | | | | | | | | | | | |
| Loan Assignments | $6,817,156 | | $2,298 | | $ 9,646 | | $ 45,868 | | $— | | $(4,172,332) | | $667,587 | | $(2,743,978) | | $626,245 | | $ (739) |
| Common Stocks | 1,336,649 | | — | | (662,769) | | 444,395 | | — | | (846,853) | | — | | — | | 271,422 | | (1,301,956) |
| Rights | 62,876 | | — | | — | | (2,308) | | — | | — | | — | | — | | 60,568 | | 13,267 |
| Warrants | 577 | | — | | (6,398) | | 5,821 | | — | | — | | — | | — | | — | | — |
| Total | $8,217,258 | | $2,298 | | $(659,521) | | $493,776 | | $— | | $(5,019,185) | | $667,587 | | $(2,743,978) | | $958,235 | | $(1,289,428) |
As of June 30, 2021, a Loan Assignment with a market value of $667,587 transferred from Level 2 to Level 3 as the the fair value for this Loan Assignment utilized significant unobservable inputs. As of December 31, 2020, the fair value obtained for this Loan Assignment utilized significant other observable inputs.
As of June 30, 2021, Loan Assignments with a market value of $2,743,978 transferred from Level 3 to Level 2 as the fair value obtained by an independent pricing service, utilized significant other observable inputs. As of December 31, 2020, the fair value obtained for these Loan Assignments, as determined by an independent pricing service, utilized significant unobservable inputs.
The notes to the financial statements are an integral part of, and should be read in conjunction with, the financial statements.
| 32 | MainStay VP Floating Rate Portfolio |
Statement of Assets and Liabilities as of June 30, 2021 (Unaudited)
| Assets |
Investment in unaffiliated securities, at value
(identified cost $848,152,820) | $842,284,876 |
Investment in affiliated investment companies, at value
(identified cost $2,479,721) | 2,484,742 |
| Cash | 5,348,814 |
| Receivables: | |
| Interest | 2,505,340 |
| Investment securities sold | 2,045,496 |
| Portfolio shares sold | 43,670 |
| Other assets | 5,375 |
| Total assets | 854,718,313 |
| Liabilities |
| Unrealized depreciation on unfunded commitments (See Note 5) | 8,031 |
| Payables: | |
| Investment securities purchased | 70,444,216 |
| Manager (See Note 3) | 380,829 |
| Portfolio shares redeemed | 250,978 |
| NYLIFE Distributors (See Note 3) | 106,161 |
| Professional fees | 64,507 |
| Shareholder communication | 62,280 |
| Custodian | 27,607 |
| Accrued expenses | 7,211 |
| Total liabilities | 71,351,820 |
| Net assets | $783,366,493 |
| Composition of Net Assets |
| Shares of beneficial interest outstanding (par value of $.001 per share) unlimited number of shares authorized | $ 88,137 |
| Additional paid-in-capital | 831,840,655 |
| | 831,928,792 |
| Total distributable earnings (loss) | (48,562,299) |
| Net assets | $783,366,493 |
| Initial Class | |
| Net assets applicable to outstanding shares | $265,217,143 |
| Shares of beneficial interest outstanding | 29,854,673 |
| Net asset value per share outstanding | $ 8.88 |
| Service Class | |
| Net assets applicable to outstanding shares | $518,149,350 |
| Shares of beneficial interest outstanding | 58,281,986 |
| Net asset value per share outstanding | $ 8.89 |
The notes to the financial statements are an integral part of, and should be read in conjunction with, the financial statements.
33
Statement of Operations for the six months ended June 30, 2021 (Unaudited)
| Investment Income (Loss) |
| Income | |
| Interest | $13,022,649 |
| Dividends-affiliated | 64,438 |
| Dividends-unaffiliated | 51 |
| Total income | 13,087,138 |
| Expenses | |
| Manager (See Note 3) | 2,055,378 |
| Distribution/Service—Service Class (See Note 3) | 630,037 |
| Professional fees | 69,828 |
| Shareholder communication | 35,507 |
| Custodian | 23,125 |
| Trustees | 6,710 |
| Miscellaneous | 25,523 |
| Total expenses | 2,846,108 |
| Net investment income (loss) | 10,241,030 |
| Realized and Unrealized Gain (Loss) |
| Net realized gain (loss) on unaffiliated investments | (1,009,843) |
| Net change in unrealized appreciation (depreciation) on: | |
| Unaffiliated investments | 6,152,883 |
| Affiliated investments | 17,758 |
| Unfunded commitments | (8,031) |
| Net change in unrealized appreciation (depreciation) | 6,162,610 |
| Net realized and unrealized gain (loss) | 5,152,767 |
| Net increase (decrease) in net assets resulting from operations | $15,393,797 |
The notes to the financial statements are an integral part of, and should be read in conjunction with, the financial statements.
| 34 | MainStay VP Floating Rate Portfolio |
Statements of Changes in Net Assets
for the six months ended June 30, 2021 (Unaudited) and the year ended December 31, 2020
| | 2021 | 2020 |
| Increase (Decrease) in Net Assets |
| Operations: | | |
| Net investment income (loss) | $ 10,241,030 | $ 24,045,879 |
| Net realized gain (loss) | (1,009,843) | (17,282,060) |
| Net change in unrealized appreciation (depreciation) | 6,162,610 | (1,860,669) |
| Net increase (decrease) in net assets resulting from operations | 15,393,797 | 4,903,150 |
| Distributions to shareholders: | | |
| Initial Class | (2,850,503) | (6,228,271) |
| Service Class | (7,321,525) | (17,934,955) |
| Total distributions to shareholders | (10,172,028) | (24,163,226) |
| Capital share transactions: | | |
| Net proceeds from sales of shares | 164,890,111 | 67,930,271 |
| Net asset value of shares issued to shareholder in reinvestment of distributions | 10,172,015 | 24,163,559 |
| Cost of shares redeemed | (35,965,958) | (218,800,676) |
| Increase (decrease) in net assets derived from capital share transactions | 139,096,168 | (126,706,846) |
| Net increase (decrease) in net assets | 144,317,937 | (145,966,922) |
| Net Assets |
| Beginning of period | 639,048,556 | 785,015,478 |
| End of period | $783,366,493 | $ 639,048,556 |
The notes to the financial statements are an integral part of, and should be read in conjunction with, the financial statements.
35
Financial Highlights selected per share data and ratios
| | Six months ended
June 30,
2021* | | Year Ended December 31, |
| Initial Class | 2020 | | 2019 | | 2018 | | 2017 | | 2016 |
| Net asset value at beginning of period | $ 8.81 | | $ 8.93 | | $ 8.66 | | $ 9.08 | | $ 9.11 | | $ 8.74 |
| Net investment income (loss) (a) | 0.14 | | 0.32 | | 0.44 | | 0.43 | | 0.39 | | 0.35 |
| Net realized and unrealized gain (loss) on investments | 0.07 | | (0.12) | | 0.27 | | (0.42) | | (0.03) | | 0.37 |
| Total from investment operations | 0.21 | | 0.20 | | 0.71 | | 0.01 | | 0.36 | | 0.72 |
| Less distributions: | | | | | | | | | | | |
| From net investment income | (0.14) | | (0.32) | | (0.44) | | (0.43) | | (0.39) | | (0.35) |
| Net asset value at end of period | $ 8.88 | | $ 8.81 | | $ 8.93 | | $ 8.66 | | $ 9.08 | | $ 9.11 |
| Total investment return (b) | 2.39% | | 2.45% | | 8.48% | | (0.00)%‡(c) | | 3.98% | | 8.45% |
| Ratios (to average net assets)/Supplemental Data: | | | | | | | | | | | |
| Net investment income (loss) | 3.17%†† | | 3.81% | | 4.98% | | 4.75% | | 4.21% | | 3.94%(d) |
| Net expenses (e) | 0.65%†† | | 0.65% | | 0.65% | | 0.65% | | 0.64% | | 0.64%(f) |
| Portfolio turnover rate | 16% | | 19% | | 35% | | 29% | | 52% | | 36% |
| Net assets at end of period (in 000’s) | $ 265,217 | | $ 142,403 | | $ 205,596 | | $ 187,285 | | $ 259,054 | | $ 287,373 |
| * | Unaudited. |
| ‡ | Less than one-tenth of a percent. |
| †† | Annualized. |
| (a) | Per share data based on average shares outstanding during the period. |
| (b) | Total return does not reflect any deduction of sales charges, mortality and expense charges, contract charges or administrative charges. For periods of less than one year, total return is not annualized. |
| (c) | Total investment return may reflect adjustments to conform to generally accepted accounting principles. |
| (d) | Without the custody fee reimbursement, net investment income (loss) would have been 3.93%. |
| (e) | In addition to the fees and expenses which the Portfolio bears directly, it also indirectly bears a pro-rata share of the fees and expenses of the underlying funds in which it invests. Such indirect expenses are not included in the above expense ratios. |
| (f) | Without the custody fee reimbursement, net expenses would have been 0.65%. |
| | Six months ended
June 30,
2021* | | Year Ended December 31, |
| Service Class | 2020 | | 2019 | | 2018 | | 2017 | | 2016 |
| Net asset value at beginning of period | $ 8.82 | | $ 8.94 | | $ 8.67 | | $ 9.09 | | $ 9.12 | | $ 8.75 |
| Net investment income (loss) (a) | 0.13 | | 0.30 | | 0.42 | | 0.41 | | 0.36 | | 0.33 |
| Net realized and unrealized gain (loss) on investments | 0.07 | | (0.12) | | 0.27 | | (0.42) | | (0.03) | | 0.37 |
| Total from investment operations | 0.20 | | 0.18 | | 0.69 | | (0.01) | | 0.33 | | 0.70 |
| Less distributions: | | | | | | | | | | | |
| From net investment income | (0.13) | | (0.30) | | (0.42) | | (0.41) | | (0.36) | | (0.33) |
| Net asset value at end of period | $ 8.89 | | $ 8.82 | | $ 8.94 | | $ 8.67 | | $ 9.09 | | $ 9.12 |
| Total investment return (b) | 2.26% | | 2.20% | | 8.19% | | (0.25)%(c) | | 3.71% | | 8.18% |
| Ratios (to average net assets)/Supplemental Data: | | | | | | | | | | | |
| Net investment income (loss) | 2.92%†† | | 3.50% | | 4.73% | | 4.52% | | 3.96% | | 3.68%(d) |
| Net expenses (e) | 0.90%†† | | 0.90% | | 0.90% | | 0.90% | | 0.89% | | 0.89%(f) |
| Portfolio turnover rate | 16% | | 19% | | 35% | | 29% | | 52% | | 36% |
| Net assets at end of period (in 000’s) | $ 518,149 | | $ 496,645 | | $ 579,419 | | $ 611,492 | | $ 581,596 | | $ 582,341 |
| * | Unaudited. |
| †† | Annualized. |
| (a) | Per share data based on average shares outstanding during the period. |
| (b) | Total return does not reflect any deduction of sales charges, mortality and expense charges, contract charges or administrative charges. For periods of less than one year, total return is not annualized. |
| (c) | Total investment return may reflect adjustments to conform to generally accepted accounting principles. |
| (d) | Without the custody fee reimbursement, net investment income (loss) would have been 3.67%. |
| (e) | In addition to the fees and expenses which the Portfolio bears directly, it also indirectly bears a pro-rata share of the fees and expenses of the underlying funds in which it invests. Such indirect expenses are not included in the above expense ratios. |
| (f) | Without the custody fee reimbursement, net expenses would have been 0.90%. |
The notes to the financial statements are an integral part of, and should be read in conjunction with, the financial statements.
| 36 | MainStay VP Floating Rate Portfolio |
Notes to Financial Statements (Unaudited)
Note 1–Organization and Business
MainStay VP Funds Trust (the “Fund”) was organized as a Delaware statutory trust on February 1, 2011. The Fund is registered under the Investment Company Act of 1940, as amended (the “1940 Act”), as an open-end management investment company. The Fund is comprised of thirty-one separate series (collectively referred to as the “Portfolios”). These financial statements and notes relate to the MainStay VP Floating Rate Portfolio (the "Portfolio"), a "non-diversified” portfolio, as that term is defined in the 1940 Act, as interpreted or modified by regulatory authorities having jurisdiction, from time to time. However, due to its principal investment strategies and investment processes, the Portfolio has historically operated as a "diversified" portfolio. Therefore, the Portfolio will not operate as "non-diversified" portfolio without first obtaining shareholder approval.
Shares of the Portfolio are currently offered to certain separate accounts to fund variable annuity policies and variable universal life insurance policies issued by New York Life Insurance and Annuity Corporation (“NYLIAC”), a wholly-owned subsidiary of New York Life Insurance Company (“New York Life”) and may also be offered to fund variable annuity policies and variable universal life insurance policies issued by other insurance companies. NYLIAC allocates shares of the Portfolios to, among others, certain NYLIAC separate accounts. Shares of the Portfolio are also offered to the MainStay VP Conservative Allocation Portfolio, MainStay VP Moderate Allocation Portfolio, MainStay VP Growth Allocation Portfolio (formerly known as MainStay VP Moderate Growth Allocation Portfolio) and MainStay VP Equity Allocation Portfolio (formerly known as MainStay VP Growth Allocation Portfolio), which operate as “funds-of-funds," and other variable insurance funds.
The following table lists the Portfolio's share classes that have been registered and commenced operations:
| Class | Commenced Operations |
| Initial Class | May 2, 2005 |
| Service Class | May 2, 2005 |
Shares of the Portfolio are offered and are redeemed at a price equal to their respective net asset value (“NAV”) per share. No sales or redemption charge is applicable to the purchase or redemption of the Portfolio's shares. Under the terms of the Fund’s multiple class plan, adopted pursuant to Rule 18f-3 under the 1940 Act, the classes differ in that, among other things, Service Class shares of the Portfolio pay a combined distribution and service fee of 0.25% of average daily net assets attributable to Service Class shares of the Portfolio to the Distributor (as defined in Note 3(B)) pursuant to a plan adopted in accordance with Rule 12b-1 under the 1940 Act. Contract owners of variable annuity contracts purchased after June 2, 2003, are permitted to invest only in the Service Class shares.
The Portfolio's investment objective is to seek high current income.
Note 2–Significant Accounting Policies
The Portfolio is an investment company and accordingly follows the investment company accounting and reporting guidance of the Financial Accounting Standards Board (“FASB”) Accounting Standard Codification Topic 946 Financial Services—Investment Companies. The Portfolio prepares its financial statements in accordance with generally accepted accounting principles (“GAAP”) in the United States of America and follows the significant accounting policies described below.
(A) Securities Valuation. Investments are usually valued as of the close of regular trading on the New York Stock Exchange (the "Exchange") (usually 4:00 p.m. Eastern time) on each day the Portfolio is open for business ("valuation date").
The Board of Trustees of the Fund (the "Board") adopted procedures establishing methodologies for the valuation of the Portfolio's securities and other assets and delegated the responsibility for valuation determinations under those procedures to the Valuation Committee of the Fund (the “Valuation Committee”). The procedures state that, subject to the oversight of the Board and unless otherwise noted, the responsibility for the day-to-day valuation of portfolio assets (including fair value measurements for the Portfolio's assets and liabilities) rests with New York Life Investment Management LLC (“New York Life Investments” or the "Manager"), aided to whatever extent necessary by the Subadvisor (as defined in Note 3(A)). To assess the appropriateness of security valuations, the Manager, the Subadvisor or the Portfolio's third-party service provider, who is subject to oversight by the Manager, regularly compares prior day prices, prices on comparable securities and the sale prices to the prior and current day prices and challenges prices with changes exceeding certain tolerance levels with third-party pricing services or broker sources.
The Board authorized the Valuation Committee to appoint a Valuation Subcommittee (the “Subcommittee”) to establish the prices of securities for which market quotations are not readily available or the prices of which are not otherwise readily determinable under the procedures. The Subcommittee meets (in person, via electronic mail or via teleconference) on an as-needed basis. The Valuation Committee meets to ensure that actions taken by the Subcommittee were appropriate.
For those securities valued through either a standardized fair valuation methodology or a fair valuation measurement, the Subcommittee deals with such valuation and the Valuation Committee reviews and affirms, if appropriate, the reasonableness of the valuation based on such methodologies and measurements on a regular basis after considering information that is reasonably available and deemed relevant by the Valuation Committee. Any action taken by the Subcommittee with respect to the valuation of a portfolio security or other asset is submitted for review and ratification (if appropriate) to the Valuation Committee and the Board at the next regularly scheduled meeting.
"Fair value" is defined as the price the Portfolio would reasonably expect to receive upon selling an asset or liability in an orderly transaction to an independent buyer in the principal or most advantageous market for the
Notes to Financial Statements (Unaudited) (continued)
asset or liability. Fair value measurements are determined within a framework that establishes a three-tier hierarchy that maximizes the use of observable market data and minimizes the use of unobservable inputs to establish a classification of fair value measurements for disclosure purposes. "Inputs" refer broadly to the assumptions that market participants would use in pricing the asset or liability, including assumptions about risk, such as the risk inherent in a particular valuation technique used to measure fair value using a pricing model and/or the risk inherent in the inputs for the valuation technique. Inputs may be observable or unobservable. Observable inputs reflect the assumptions market participants would use in pricing the asset or liability based on market data obtained from sources independent of the Portfolio. Unobservable inputs reflect the Portfolio’s own assumptions about the assumptions market participants would use in pricing the asset or liability based on the information available. The inputs or methodology used for valuing assets or liabilities may not be an indication of the risks associated with investing in those assets or liabilities. The three-tier hierarchy of inputs is summarized below.
| • | Level 1—quoted prices in active markets for an identical asset or liability |
| • | Level 2—other significant observable inputs (including quoted prices for a similar asset or liability in active markets, interest rates and yield curves, prepayment speeds, credit risk, etc.) |
| • | Level 3—significant unobservable inputs (including the Portfolio's own assumptions about the assumptions that market participants would use in measuring fair value of an asset or liability) |
The level of an asset or liability within the fair value hierarchy is based on the lowest level of an input, both individually and in the aggregate, that is significant to the fair value measurement. The aggregate value by input level of the Portfolio’s assets and liabilities as of June 30, 2021, is included at the end of the Portfolio of Investments.
The Portfolio may use third-party vendor evaluations, whose prices may be derived from one or more of the following standard inputs, among others:
| • Benchmark yields | • Reported trades |
| • Broker/dealer quotes | • Issuer spreads |
| • Two-sided markets | • Benchmark securities |
| • Bids/offers | • Reference data (corporate actions or material event notices) |
| • Industry and economic events | • Comparable bonds |
| • Monthly payment information | |
An asset or liability for which market values cannot be measured using the methodologies described above is valued by methods deemed reasonable in good faith by the Valuation Committee, following the procedures established by the Board, to represent fair value. Under these procedures, the Portfolio generally uses a market-based approach which may use related or comparable assets or liabilities, recent transactions, market multiples, book values and other relevant information. The
Portfolio may also use an income-based valuation approach in which the anticipated future cash flows of the asset or liability are discounted to calculate fair value. Discounts may also be applied due to the nature and/or duration of any restrictions on the disposition of the asset or liability. Fair value represents a good faith approximation of the value of a security. Fair value determinations involve the consideration of a number of subjective factors, an analysis of applicable facts and circumstances and the exercise of judgment. As a result, it is possible that the fair value for a security determined in good faith in accordance with the Portfolio's valuation procedures may differ from valuations for the same security determined by other funds using their own valuation procedures. Although the Portfolio's valuation procedures are designed to value a security at the price the Portfolio may reasonably expect to receive upon the security's sale in an orderly transaction, there can be no assurance that any fair value determination thereunder would, in fact, approximate the amount that the Portfolio would actually realize upon the sale of the security or the price at which the security would trade if a reliable market price were readily available. During the six-month period ended June 30, 2021, there were no material changes to the fair value methodologies.
Securities which may be valued in this manner include, but are not limited to: (i) a security for which trading has been halted or suspended; (ii) a debt security that has recently gone into default and for which there is not a current market quotation; (iii) a security of an issuer that has entered into a restructuring; (iv) a security that has been delisted from a national exchange; (v) a security for which the market price is not readily available from a third-party pricing source or, if so provided, does not, in the opinion of the Manager or the Subadvisor, reflect the security's market value; (vi) a security subject to trading collars for which no or limited trading takes place; and (vii) a security whose principal market has been temporarily closed at a time when, under normal conditions, it would be open. Securities valued in this manner are generally categorized as Level 3 in the hierarchy. Securities that were fair valued in such a manner as of June 30, 2021, are shown in the Portfolio of Investments.
Certain securities held by the Portfolio may principally trade in foreign markets. Events may occur between the time the foreign markets close and the time at which the Portfolio's NAVs are calculated. These events may include, but are not limited to, situations relating to a single issuer in a market sector, significant fluctuations in U.S. or foreign markets, natural disasters, armed conflicts, governmental actions or other developments not tied directly to the securities markets. Should the Manager or the Subadvisor conclude that such events may have affected the accuracy of the last price of such securities reported on the local foreign market, the Subcommittee may, pursuant to procedures adopted by the Board, adjust the value of the local price to reflect the estimated impact on the price of such securities as a result of such events. In this instance, securities are generally categorized as Level 3 in the hierarchy. Additionally, certain foreign equity securities are also fair valued whenever the movement of a particular index exceeds certain thresholds. In such cases, the securities are fair valued by applying factors provided by a third-party vendor in accordance with valuation procedures adopted by the Board and are generally categorized as Level 2 in the hierarchy. No foreign equity
| 38 | MainStay VP Floating Rate Portfolio |
securities held by the Portfolio as of June 30, 2021 were fair valued in such a manner.
Equity securities are valued at the last quoted sales prices as of the close of regular trading on the relevant exchange on each valuation date. Securities that are not traded on the valuation date are valued at the mean of the last quoted bid and ask prices. Prices are normally taken from the principal market in which each security trades. These securities are generally categorized as Level 1 in the hierarchy.
Investments in mutual funds, including money market funds, are valued at their respective NAVs at the close of business each day on the valuation date. These securities are generally categorized as Level 1 in the hierarchy.
Debt securities (other than convertible and municipal bonds) are valued at the evaluated bid prices (evaluated mean prices in the case of convertible and municipal bonds) supplied by a pricing agent or broker selected by the Manager, in consultation with the Subadvisor. The evaluations are market-based measurements processed through a pricing application and represents the pricing agent’s good faith determination as to what a holder may receive in an orderly transaction under market conditions. The rules-based logic utilizes valuation techniques that reflect participants’ assumptions and vary by asset class and per methodology, maximizing the use of relevant observable data including quoted prices for similar assets, benchmark yield curves and market corroborated inputs. The evaluated bid or mean prices are deemed by the Manager, in consultation with the Subadvisor, to be representative of market values at the regular close of trading of the Exchange on each valuation date. Debt securities purchased on a delayed delivery basis are marked to market daily until settlement at the forward settlement date. Debt securities, including corporate bonds, U.S. government and federal agency bonds, municipal bonds, foreign bonds, convertible bonds, asset-backed securities and mortgage-backed securities are generally categorized as Level 2 in the hierarchy.
Loan assignments, participations and commitments are valued at the average of bid quotations obtained from the engaged independent pricing service and are generally categorized as Level 2 in the hierarchy. Certain loan assignments, participations and commitments may be valued by utilizing significant unobservable inputs obtained from the pricing service and are generally categorized as Level 3 in the hierarchy.
Temporary cash investments acquired in excess of 60 days to maturity at the time of purchase are valued using the latest bid prices or using valuations based on a matrix system (which considers such factors as security prices, yields, maturities and ratings), both as furnished by independent pricing services. Temporary cash investments that mature in 60 days or less at the time of purchase ("Short-Term Investments") are valued using the amortized cost method of valuation, unless the use of such method would be inappropriate. The amortized cost method involves valuing a security at its cost on the date of purchase and thereafter assuming a constant amortization to maturity of the difference between such cost and the value on maturity date. Amortized cost approximates the current fair value of a security. Securities valued using the amortized
cost method are not valued using quoted prices in an active market and are generally categorized as Level 2 in the hierarchy.
The information above is not intended to reflect an exhaustive list of the methodologies that may be used to value portfolio investments. The valuation procedures permit the use of a variety of valuation methodologies in connection with valuing portfolio investments. The methodology used for a specific type of investment may vary based on the market data available or other considerations. The methodologies summarized above may not represent the specific means by which portfolio investments are valued on any particular business day.
A portfolio investment may be classified as an illiquid investment under the Portfolio's written liquidity risk management program and related procedures (“Liquidity Program”). Illiquidity of an investment might prevent the sale of such investment at a time when the Manager or the Subadvisor might wish to sell, and these investments could have the effect of decreasing the overall level of the Portfolio's liquidity. Further, the lack of an established secondary market may make it more difficult to value illiquid investments, requiring the Portfolio to rely on judgments that may be somewhat subjective in measuring value, which could vary materially from the amount that the Portfolio could realize upon disposition. Difficulty in selling illiquid investments may result in a loss or may be costly to the Portfolio. An illiquid investment is any investment that the Manager or Subadvisor reasonably expects cannot be sold or disposed of in current market conditions in seven calendar days or less without the sale or disposition significantly changing the market value of the investment. The liquidity classification of each investment will be made using information obtained after reasonable inquiry and taking into account, among other things, relevant market, trading and investment-specific considerations in accordance with the Liquidity Program. Illiquid investments are often valued in accordance with methods deemed by the Board in good faith to be reasonable and appropriate to accurately reflect their fair value. The liquidity of the Portfolio's investments was determined as of June 30, 2021, and can change at any time. Illiquid investments as of June 30, 2021, are shown in the Portfolio of Investments.
(B) Income Taxes. The Portfolio's policy is to comply with the requirements of the Internal Revenue Code of 1986, as amended (the “Internal Revenue Code”), applicable to regulated investment companies and to distribute all of its taxable income to the shareholders of the Portfolio within the allowable time limits.
The Manager evaluates the Portfolio’s tax positions to determine if the tax positions taken meet the minimum recognition threshold in connection with accounting for uncertainties in income tax positions taken or expected to be taken for the purposes of measuring and recognizing tax liabilities in the financial statements. Recognition of tax benefits of an uncertain tax position is permitted only to the extent the position is “more likely than not” to be sustained assuming examination by taxing authorities. The Manager analyzed the Portfolio's tax positions taken on federal, state and local income tax returns for all open tax years (for up to three tax years) and has concluded that no provisions for federal, state
Notes to Financial Statements (Unaudited) (continued)
and local income tax are required in the Portfolio's financial statements. The Portfolio's federal, state and local income tax and federal excise tax returns for tax years for which the applicable statutes of limitations have not expired are subject to examination by the Internal Revenue Service and state and local departments of revenue.
(C) Foreign Taxes. The Portfolio may be subject to foreign taxes on income and other transaction-based taxes imposed by certain countries in which it invests. A portion of the taxes on gains on investments or currency purchases/repatriation may be reclaimable. The Portfolio will accrue such taxes and reclaims as applicable, based upon its current interpretation of tax rules and regulations that exist in the markets in which it invests.
The Portfolio may be subject to taxation on realized capital gains, repatriation proceeds and other transaction-based taxes imposed by certain countries in which it invests. The Portfolio will accrue such taxes as applicable based upon its current interpretation of tax rules and regulations that exist in the market in which it invests. Capital gains taxes relating to positions still held are reflected as a liability in the Statement of Assets and Liabilities, as well as an adjustment to the Portfolio's net unrealized appreciation (depreciation). Taxes related to capital gains realized, if any, are reflected as part of net realized gain (loss) in the Statement of Operations. Changes in tax liabilities related to capital gains taxes on unrealized investment gains, if any, are reflected as part of the change in net unrealized appreciation (depreciation) on investments in the Statement of Operations. Transaction-based charges are generally assessed as a percentage of the transaction amount.
(D) Dividends and Distributions to Shareholders. Dividends and distributions are recorded on the ex-dividend date. The Portfolio intends to declare dividends from net investment income, if any, daily and intends to pay them at least monthly and distributions from net realized capital and currency gains, if any, at least annually. Unless a shareholder elects otherwise, all dividends and distributions are reinvested at NAV in the same class of shares of the Portfolio. Dividends and distributions to shareholders are determined in accordance with federal income tax regulations and may differ from determinations using GAAP.
(E) Security Transactions and Investment Income. The Portfolio records security transactions on the trade date. Realized gains and losses on security transactions are determined using the identified cost method. Dividend income is recognized on the ex-dividend date, net of any foreign tax withheld at the source, and interest income is accrued as earned using the effective interest rate method. Distributions received from real estate investment trusts may be classified as dividends, capital gains and/or return of capital. Discounts and premiums on securities purchased for the Portfolio are accreted and amortized, respectively, on the effective interest rate method.
Investment income and realized and unrealized gains and losses on investments of the Portfolio are allocated pro rata to the separate classes of shares based upon their relative net assets on the date the income is earned or realized and unrealized gains and losses are incurred.
The Portfolio may place a debt security on non-accrual status and reduce related interest income by ceasing current accruals and writing off all or a portion of any interest receivables when the collection of all or a portion of such interest has become doubtful. A debt security is removed from non-accrual status when the issuer resumes interest payments or when collectability of interest is reasonably assured.
(F) Expenses. Expenses of the Fund are allocated to the individual Portfolios in proportion to the net assets of the respective Portfolios when the expenses are incurred, except where direct allocations of expenses can be made. Expenses (other than fees incurred under the distribution and service plans, further discussed in Note 3(B), which are charged directly to the Service Class shares) are allocated to separate classes of shares pro rata based upon their relative net assets on the date the expenses are incurred. The expenses borne by the Portfolio, including those of related parties to the Portfolio, are shown in the Statement of Operations.
Additionally, the Portfolio may invest in mutual funds, which are subject to management fees and other fees that may cause the costs of investing in mutual funds to be greater than the costs of owning the underlying securities directly. These indirect expenses of mutual funds are not included in the amounts shown as expenses in the Statement of Operations or in the expense ratios included in the Financial Highlights.
(G) Use of Estimates. In preparing financial statements in conformity with GAAP, the Manager makes estimates and assumptions that affect the reported amounts and disclosures in the financial statements. Actual results could differ from those estimates and assumptions.
(H) Loan Assignments, Participations and Commitments. The Portfolio may invest in loan assignments and participations ("loans"). Commitments are agreements to make money available to a borrower in a specified amount, at a specified rate and within a specified time. The Portfolio records an investment when the borrower withdraws money on a commitment or when a funded loan is purchased (trade date) and records interest as earned. These loans pay interest at rates that are periodically reset by reference to a base lending rate plus a spread. These base lending rates are generally the prime rate offered by a designated U.S. bank or the London Interbank Offered Rate ("LIBOR").
The loans in which the Portfolio may invest are generally readily marketable, but may be subject to some restrictions on resale. For example, the Portfolio may be contractually obligated to receive approval from the agent bank and/or borrower prior to the sale of these investments. If the Portfolio purchases an assignment from a lender, the Portfolio will generally have direct contractual rights against the borrower in favor of the lender. If the Portfolio purchases a participation interest either from a lender or a participant, the Portfolio typically will have established a direct contractual relationship with the seller of the participation interest, but not with the borrower. Consequently, the Portfolio is subject to the credit risk of the lender or participant who sold the participation interest to the Portfolio, in addition to the usual credit risk of the borrower. In the event that the borrower, selling participant or
| 40 | MainStay VP Floating Rate Portfolio |
intermediate participants become insolvent or enter into bankruptcy, the Portfolio may incur certain costs and delays in realizing payment, or may suffer a loss of principal and/or interest.
Unfunded commitments represent the remaining obligation of the Portfolio to the borrower. At any point in time, up to the maturity date of the issue, the borrower may demand the unfunded portion. Unfunded amounts, if any, are marked to market and any unrealized gains or losses are recorded in the Statement of Assets and Liabilities. As of June 30, 2021, the Portfolio held unfunded commitments. (See Note 5).
(I) Rights and Warrants. Rights are certificates that permit the holder to purchase a certain number of shares, or a fractional share, of a new stock from the issuer at a specific price. Warrants are instruments that entitle the holder to buy an equity security at a specific price for a specific period of time. These investments can provide a greater potential for profit or loss than an equivalent investment in the underlying security. Prices of these investments do not necessarily move in tandem with the prices of the underlying securities.
There is risk involved in the purchase of rights and warrants in that these investments are speculative investments. The Portfolio could also lose the entire value of its investment in warrants if such warrants are not exercised by the date of its expiration. The Portfolio is exposed to risk until the sale or exercise of each right or warrant is completed. Rights and Warrants as of June 30, 2021 are shown in the Portfolio of Investments.
(J) Debt Securities Risk. The ability of issuers of debt securities held by the Portfolio to meet their obligations may be affected by, among other things, economic or political developments in a specific country, industry or region. Debt securities are also subject to the risks associated with changes in interest rates.
The Portfolio’s principal investments include floating rate loans, which are usually rated below investment grade and are generally considered speculative because they present a greater risk of loss, including default, than higher rated debt securities. These investments pay investors a higher interest rate than investment grade debt securities because of the increased risk of loss. Although certain floating rate loans are collateralized, there is no guarantee that the value of the collateral will be sufficient to repay the loan. In a recession or serious credit event, the value of these investments could decline significantly. As a result, the Portfolio’s NAVs could decrease and you could lose money.
In addition, floating rate loans generally are subject to extended settlement periods that may be longer than seven days. As a result, the Portfolio may be adversely affected by selling other investments at an unfavorable time and/or under unfavorable conditions or engaging in borrowing transactions, such as borrowing against its credit facility, to raise cash to meet redemption obligations or pursue other investment opportunities.
In certain circumstances, floating rate loans may not be deemed to be securities. As a result, the Portfolio may not have the protection of the anti-fraud provisions of the federal securities laws. In such cases, the
Portfolio generally must rely on the contractual provisions in the loan agreement and common-law fraud protections under applicable state law.
The Portfolio may invest in foreign debt securities, which carry certain risks that are in addition to the usual risks inherent in domestic debt securities. These risks include those resulting from currency fluctuations, future adverse political or economic developments and possible imposition of currency exchange blockages or other foreign governmental laws or restrictions. These risks are likely to be greater in emerging markets than in developed markets.
(K) LIBOR Replacement Risk. The Portfolio may invest in certain debt securities, derivatives or other financial instruments that utilize the London Interbank Offered Rate ("LIBOR"), as a “benchmark” or “reference rate” for various interest rate calculations. The United Kingdom Financial Conduct Authority, which regulates LIBOR, announced that after 2021 it will cease its active encouragement of banks to provide the quotations needed to sustain LIBOR. However, it is possible that certain LIBOR tenors may continue beyond 2021 and the most widely used LIBOR tenors may continue until mid-2023. As a result, it is anticipated that LIBOR will be discontinued or will no longer be sufficiently robust to be representative of its underlying market around that time. Although financial regulators and industry working groups have suggested alternative reference rates, such as European Interbank Offer Rate (“EURIBOR”), Sterling Overnight Interbank Average Rate (“SONIA”) and Secured Overnight Financing Rate (“SOFR”), there are challenges to converting certain contracts and transactions to a new benchmark and neither the full effects of the transition process nor its ultimate outcome is known. New York Life Investments is currently working to assess exposure and will modify contracts as necessary.
The elimination of LIBOR or changes to other reference rates or any other changes or reforms to the determination or supervision of reference rates could have an adverse impact on the market for, or value of, any securities or payments linked to those reference rates, which may adversely affect the Portfolio's performance and/or net asset value. Uncertainty and risk also remain regarding the willingness and ability of issuers and lenders to include revised provisions in new and existing contracts or instruments. Consequently, the transition away from LIBOR to other reference rates may lead to increased volatility and illiquidity in markets that are tied to LIBOR, fluctuations in values of LIBOR-related investments or investments in issuers that utilize LIBOR, increased difficulty in borrowing or refinancing and diminished effectiveness of hedging strategies, adversely affecting the Portfolio's performance. Furthermore, the risks associated with the expected discontinuation of LIBOR and transition may be exacerbated if the work necessary to effect an orderly transition to an alternative reference rate is not completed in a timely manner. Because the usefulness of LIBOR as a benchmark could deteriorate during the transition period, these effects could occur prior to the end of 2021 with respect to certain LIBOR tenors or mid-2023 for the remaining LIBOR tenors.
Notes to Financial Statements (Unaudited) (continued)
(L) Indemnifications. Under the Fund’s organizational documents, its officers and trustees are indemnified against certain liabilities that may arise out of performance of their duties to the Fund. Additionally, in the normal course of business, the Portfolio enters into contracts with third-party service providers that contain a variety of representations and warranties and that may provide general indemnifications. The Portfolio's maximum exposure under these arrangements is unknown, as this would involve future claims that may be made against the Portfolio that have not yet occurred. The Manager believes that the risk of loss in connection with these potential indemnification obligations is remote. However, there can be no assurance that material liabilities related to such obligations will not arise in the future, which could adversely impact the Portfolio.
Note 3–Fees and Related Party Transactions
(A) Manager and Subadvisor. New York Life Investments, a registered investment adviser and an indirect, wholly-owned subsidiary of New York Life, serves as the Portfolio's Manager pursuant to an Amended and Restated Management Agreement ("Management Agreement"). The Manager provides offices, conducts clerical, recordkeeping and bookkeeping services and keeps most of the financial and accounting records required to be maintained by the Portfolio. Except for the portion of salaries and expenses that are the responsibility of the Portfolio, the Manager pays the salaries and expenses of all personnel affiliated with the Portfolio and certain operational expenses of the Portfolio. The Portfolio reimburses New York Life Investments in an amount equal to the portion of the compensation of the Chief Compliance Officer attributable to the Portfolio. NYL Investors LLC ("NYL Investors" or ''Subadvisor''), a registered investment adviser and a direct, wholly-owned subsidiary of New York Life, serves as Subadvisor to the Portfolio and is responsible for the day-to-day portfolio management of the Portfolio. Pursuant to the terms of a Subadvisory Agreement ("Subadvisory Agreement") between New York Life Investments and NYL Investors, New York Life Investments pays for the services of the Subadvisor.
Pursuant to the Management Agreement, the Fund pays the Manager, on behalf of the Portfolio, a monthly fee for the services performed and the facilities furnished at an annual rate of the Portfolio's average daily net assets as follows: 0.60% up to $1 billion; 0.575% from $1 billion to
$3 billion; and 0.565% in excess of $3 billion. During the six-month period ended June 30, 2021, the effective management fee rate was 0.60%.
During the six-month period ended June 30, 2021, New York Life Investments earned fees from the Portfolio in the amount of $2,055,378 and paid the Subadvisor fees in the amount of $1,027,676.
JPMorgan Chase Bank, N.A. ("JPMorgan") provides sub-administration and sub-accounting services to the Portfolio pursuant to an agreement with New York Life Investments. These services include calculating the daily NAVs of the Portfolio, maintaining the general ledger and sub-ledger accounts for the calculation of the Portfolio's NAVs, and assisting New York Life Investments in conducting various aspects of the Portfolio's administrative operations. For providing these services to the Portfolio, JPMorgan is compensated by New York Life Investments.
Prior to February 22, 2021, these services were provided by State Street Bank and Trust Company ("State Street").
Pursuant to an agreement between the Fund and New York Life Investments, New York Life Investments is responsible for providing or procuring certain regulatory reporting services for the Portfolio. The Portfolio will reimburse New York Life Investments for the actual costs incurred by New York Life Investments in connection with providing or procuring these services for the Portfolio.
(B) Distribution and Service Fees. The Fund, on behalf of the Portfolio, has entered into a distribution agreement with NYLIFE Distributors LLC (the “Distributor”), an affiliate of New York Life Investments. The Portfolio has adopted a distribution plan (the “Plan”) in accordance with the provisions of Rule 12b-1 under the 1940 Act. Under the Plan, the Distributor has agreed to provide, through its affiliates or independent third parties, various distribution-related, shareholder and administrative support services to the Service Class shareholders. For its services, the Distributor is entitled to a combined distribution and service fee accrued daily and paid monthly at an annual rate of 0.25% of the average daily net assets attributable to the Service Class shares of the Portfolio.
(C) Investments in Affiliates (in 000’s). During the six-month period ended June 30, 2021, purchases and sales transactions, income earned from investments and shares held of investment companies managed by New York Life Investments or its affiliates were as follows:
| Affiliated Investment Companies | Value,
Beginning
of Period | Purchases
at Cost | Proceeds
from
Sales | Net
Realized
Gain/(Loss)
on Sales | Change in
Unrealized
Appreciation/
(Depreciation) | Value,
End of
Period | Dividend
Income | Other
Distributions | Shares
End of
Period |
| MainStay MacKay High Yield Corporate Bond Fund Class I | $ 2,454 | $ — | $ — | $ — | $ 31 | $ 2,485 | $ 64 | $ — | 437 |
| 42 | MainStay VP Floating Rate Portfolio |
Note 4-Federal Income Tax
As of June 30, 2021, the cost and unrealized appreciation (depreciation) of the Portfolio’s investment portfolio, including applicable derivative contracts and other financial instruments, as determined on a federal income tax basis, were as follows:
| | Federal Tax
Cost | Gross
Unrealized
Appreciation | Gross
Unrealized
(Depreciation) | Net
Unrealized
Appreciation/
(Depreciation) |
| Investments in Securities | $850,644,736 | $3,091,200 | $(8,966,318) | $(5,875,118) |
As of December 31, 2020, for federal income tax purposes, capital loss carryforwards of $42,496,402, as shown in the table below, were available to the extent provided by the regulations to offset future realized gains of the Portfolio. Accordingly, no capital gains distributions are expected to be paid to shareholders until net gains have been realized in excess of such amounts.
Capital Loss
Available Through | Short-Term
Capital Loss
Amounts (000’s) | Long-Term
Capital Loss
Amounts (000’s) |
| Unlimited | $4,592 | $37,905 |
During the year ended December 31, 2020, the tax character of distributions paid as reflected in the Statements of Changes in Net Assets was as follows:
| | 2020 |
| Distributions paid from: | |
| Ordinary Income | $24,163,226 |
Note 5–Commitments and Contingencies
As of June 30, 2021, the Portfolio had unfunded commitments pursuant to the following loan agreements:
| Borrower | Unfunded
Commitments | Unrealized
Appreciation/
(Depreciation) |
AI Aqua Merger Sub, Inc.,
Delayed Draw Term Loan
TBD, due 6/16/28 | $ 267,167 | $ 1,833 |
FCG Acquisitions, Inc.,
First Lien Delayed Draw Term Loan
1.875%,
(1 Month LIBOR + 1.875%), due 3/31/28 | 85,685 | (395) |
Hillman Group, Inc.,
Delayed Term Loan
TBD, due 2/24/28 | 10,324 | (28) |
LBM Acquisition LLC,
First Lien Initial Delayed Draw Term Loan
4.50%, due 12/17/27 | 51,479 | 146 |
National Mentor Holdings, Inc.,
First Lien Delayed Draw Term Loan
3.75%,
(3 Month LIBOR + 3.75), due 3/2/28 | 73,158 | (59) |
Pluto Acquisition I, Inc.,
2021 Term Loan
TBD, due 6/20/26 | 2,100,000 | (5,000) |
Redstone HoldCo 2 LP,
First Lien Delayed Draw Term Loan
TBD, due 4/27/28 | 982,055 | (2,461) |
Tricorbraun Holdings, Inc.,
First Lien Delayed Draw Term Loan
TBD,
(3 Month LIBOR + 3.25%), due 3/3/28 | 247,550 | (2,067) |
| Total | $3,817,418 | $(8,031) |
Commitments are available until maturity date.
Note 6–Custodian
JPMorgan is the custodian of cash and securities held by the Portfolio. Custodial fees are charged to the Portfolio based on the Portfolio's net assets and/or the market value of securities held by the Portfolio and the number of certain transactions incurred by the Portfolio.
Prior to February 22, 2021, these services were provided by State Street. The services provided by State Street were a direct expense of the Portfolio and are included in the Statement of Operations as Custodian fees which totaled $6,644 for the period January 1, 2021 through February 21, 2021.
Notes to Financial Statements (Unaudited) (continued)
Note 7–Line of Credit
The Portfolio and certain other funds managed by New York Life Investments maintain a line of credit with a syndicate of banks in order to secure a source of funds for temporary purposes to meet unanticipated or excessive redemption requests.
Effective July 27, 2021, under the credit agreement (the “Credit Agreement”), the aggregate commitment amount is $600,000,000 with an additional uncommitted amount of $100,000,000. The commitment fee is an annual rate of 0.15% of the average commitment amount payable quarterly, regardless of usage, to JPMorgan, who serves as the agent to the syndicate. The commitment fee is allocated among the Portfolio and certain other funds managed by New York Life Investments based upon their respective net assets and other factors. Interest on any revolving credit loan is charged based upon the Federal Funds Rate or the one-month LIBOR, whichever is higher. The Credit Agreement expires on July 26, 2022, although the Portfolio, certain other funds managed by New York Life Investments and the syndicate of banks may renew the Credit Agreement for an additional year on the same or different terms or enter into a credit agreement with a different syndicate of banks. Prior to July 27, 2021, the aggregate commitment amount and the commitment fee were the same as those under the current Credit Agreement. During the six-month period ended June 30, 2021, there were no borrowings made or outstanding with respect to the Portfolio under the Credit Agreement.
Note 8–Interfund Lending Program
Pursuant to an exemptive order issued by the SEC, the Portfolio, along with certain other funds managed by New York Life Investments, may participate in an interfund lending program. The interfund lending program provides an alternative credit facility that permits the Portfolio and certain other funds managed by New York Life Investments to lend or borrow money for temporary purposes directly to or from one another, subject to the conditions of the exemptive order. During the six-month period ended June 30, 2021, there were no interfund loans made or outstanding with respect to the Portfolio.
Note 9–Purchases and Sales of Securities (in 000’s)
During the six-month period ended June 30, 2021, purchases and sales of securities, other than short-term securities, were $277,923 and $108,093, respectively.
Note 10–Capital Share Transactions
Transactions in capital shares for the six-month period ended June 30, 2021 and the year ended December 31, 2020, were as follows:
| Initial Class | Shares | Amount |
| Period ended June 30, 2021: | | |
| Shares sold | 15,190,335 | $ 134,916,177 |
| Shares issued to shareholders in reinvestment of distributions | 321,170 | 2,850,175 |
| Shares redeemed | (1,816,522) | (16,126,119) |
| Net increase (decrease) | 13,694,983 | $ 121,640,233 |
| Year ended December 31, 2020: | | |
| Shares sold | 902,443 | $ 7,694,804 |
| Shares issued to shareholders in reinvestment of distributions | 735,186 | 6,228,563 |
| Shares redeemed | (8,502,000) | (70,651,192) |
| Net increase (decrease) | (6,864,371) | $ (56,727,825) |
| |
| Service Class | Shares | Amount |
| Period ended June 30, 2021: | | |
| Shares sold | 3,376,838 | $ 29,973,934 |
| Shares issued to shareholders in reinvestment of distributions | 824,545 | 7,321,840 |
| Shares redeemed | (2,233,736) | (19,839,839) |
| Net increase (decrease) | 1,967,647 | $ 17,455,935 |
| Year ended December 31, 2020: | | |
| Shares sold | 7,072,308 | $ 60,235,467 |
| Shares issued to shareholders in reinvestment of distributions | 2,112,090 | 17,934,996 |
| Shares redeemed | (17,706,501) | (148,149,484) |
| Net increase (decrease) | (8,522,103) | $ (69,979,021) |
Note 11–Other Matters
An outbreak of COVID-19, first detected in December 2019, has developed into a global pandemic and has resulted in travel restrictions, closure of international borders, certain businesses and securities markets, restrictions on securities trading activities, prolonged quarantines, supply chain disruptions, and lower consumer demand, as well as general concern and uncertainty. The continued impact of COVID-19 and related new variants is uncertain and could further adversely affect the global economy, national economies, individual issuers and capital markets in unforeseeable ways and result in a substantial and extended economic downturn. Developments that disrupt global economies and financial markets, such as COVID-19, may magnify factors that affect the Portfolio's performance.
Note 12–Subsequent Events
In connection with the preparation of the financial statements of the Portfolio as of and for the six-month period ended June 30, 2021, events and transactions subsequent to June 30, 2021, through the date the financial statements were issued have been evaluated by the Manager for possible adjustment and/or disclosure. No subsequent events requiring financial statement adjustment or disclosure have been identified.
| 44 | MainStay VP Floating Rate Portfolio |
Discussion of the Operation and Effectiveness of the Portfolio's Liquidity Risk Management Program (Unaudited)
In compliance with Rule 22e-4 under the Investment Company Act of 1940, as amended (the “Liquidity Rule”), the Portfolio has adopted and implemented a liquidity risk management program (the “Program”), which New York Life Investment Management LLC believes is reasonably designed to assess and manage the Portfolio's liquidity risk (the risk that the Portfolio could not meet requests to redeem shares issued by the Portfolio without significant dilution of remaining investors’ interests in the Portfolio). The Board of Trustees of MainStay VP Funds Trust (the "Board") designated New York Life Investment Management LLC as administrator of the Program (the “Administrator”). The Administrator has established a Liquidity Risk Management Committee to assist the Administrator in the implementation and day-to-day administration of the Program and to otherwise support the Administrator in fulfilling its responsibilities under the Program.
At a meeting of the Board held on March 8, 2021, the Administrator provided the Board with a written report addressing the Program’s operation and assessing its adequacy and effectiveness of implementation for the period from January 1, 2020 through December 31, 2020 (the "Review Period"), as required under the Liquidity Rule. The report noted that the Administrator concluded that (i) the Program operated effectively to assess and manage the Portfolio's liquidity risk, (ii) the Program has been adequately and effectively implemented to monitor and, as applicable, respond to the Portfolio's liquidity developments and (iii) the Portfolio's investment strategy continues to be appropriate for an open-end fund. In addition, the report discussed notable events that impacted liquidity risk during the Review Period, including the COVID-19 pandemic and the resulting economic shutdown.
In accordance with the Program, the Portfolio's liquidity risk is assessed no less frequently than annually taking into consideration certain factors, as applicable, such as (i) investment strategy and liquidity of portfolio investments, (ii) short-term and long-term cash flow projections and (iii) holdings of cash and cash equivalents, as well as borrowing arrangements and other funding sources. Certain factors are considered under both normal and reasonably foreseeable stressed conditions.
Each Portfolio portfolio investment is classified into one of four liquidity categories. The classification is based on a determination of the number of days it is reasonably expected to take to convert the investment into cash, or sell or dispose of the investment, in current market conditions without significantly changing the market value of the investment. The Administrator has delegated liquidity classification determinations to the Portfolio’s subadvisor, subject to appropriate oversight by the Administrator, and classification determinations are made by taking into account the Portfolio's reasonably anticipated trade size, various market, trading and investment-specific considerations, as well as market depth, and, in certain cases, third-party vendor data.
The Liquidity Rule requires portfolios that do not primarily hold assets that are highly liquid investments to adopt a minimum amount of net assets that must be invested in highly liquid investments that are assets (an “HLIM”). In addition, the Liquidity Rule limits a portfolio's investments in illiquid investments. Specifically, the Liquidity Rule prohibits acquisition of illiquid investments if doing so would result in a portfolio holding more than 15% of its net assets in illiquid investments that are assets. The Program includes provisions reasonably designed to determine, periodically review and comply with the HLIM requirement, as applicable, and to comply with the 15% limit on illiquid investments.
There can be no assurance that the Program will achieve its objectives under all circumstances in the future. Please refer to the Portfolio's prospectus for more information regarding the Portfolio's exposure to liquidity risk and other risks to which it may be subject.
Proxy Voting Record
The Portfolio is required to file with the SEC its proxy voting records for the 12-month period ending June 30 on Form N-PX. The Portfolio's most recent Form N-PX or proxy voting record is available free of charge upon request (i) by calling 800-598-2019; (ii) by visiting New York Life Investments’ website at https://www.nylinvestments.com/mainstay/
products-and-performance/mainstay-vp-funds-trust; or (iii) by visiting the SEC’s website at www.sec.gov.
Shareholder Reports and Quarterly Portfolio Disclosure
The Portfolio is required to file its complete schedule of portfolio holdings with the SEC 60 days after its first and third fiscal quarter on Form N-PORT. The Portfolio's holdings report is available free of charge upon request by calling 800-598-2019 or by visiting the SEC’s website at www.sec.gov.
| 46 | MainStay VP Floating Rate Portfolio |
MainStay VP Portfolios
MainStay VP offers a wide range of Portfolios. The full array of MainStay VP offerings is listed here, with information about the manager, subadvisors, legal counsel, and independent registered public accounting firm.
Equity
MainStay VP Candriam Emerging Markets Equity Portfolio
MainStay VP Epoch U.S. Equity Yield Portfolio
MainStay VP Fidelity Institutional AM® Utilities Portfolio†
MainStay VP MacKay International Equity Portfolio
MainStay VP MacKay S&P 500 Index Portfolio
MainStay VP Natural Resources Portfolio
MainStay VP Small Cap Growth Portfolio
MainStay VP T. Rowe Price Equity Income Portfolio
MainStay VP Wellington Growth Portfolio
MainStay VP Wellington Mid Cap Portfolio
MainStay VP Wellington Small Cap Portfolio
MainStay VP Wellington U.S. Equity Portfolio
MainStay VP Winslow Large Cap Growth Portfolio
Mixed Asset
MainStay VP Balanced Portfolio
MainStay VP Income Builder Portfolio
MainStay VP Janus Henderson Balanced Portfolio
MainStay VP MacKay Convertible Portfolio
Income
MainStay VP Bond Portfolio
MainStay VP Floating Rate Portfolio
MainStay VP Indexed Bond Portfolio
MainStay VP MacKay Government Portfolio
MainStay VP MacKay High Yield Corporate Bond Portfolio
MainStay VP MacKay Strategic Bond Portfolio
MainStay VP PIMCO Real Return Portfolio
Money Market
MainStay VP U.S. Government Money Market Portfolio
Alternative
MainStay VP CBRE Global Infrastructure Portfolio
MainStay VP IQ Hedge Multi-Strategy Portfolio
Asset Allocation
MainStay VP Conservative Allocation Portfolio
MainStay VP Equity Allocation Portfolio
MainStay VP Growth Allocation Portfolio
MainStay VP Moderate Allocation Portfolio
Manager
New York Life Investment Management LLC
New York, New York
Subadvisors
Brown Advisory LLC
Baltimore, Maryland
Candriam Belgium S.A.*
Brussels, Belgium
CBRE Clarion Securities LLC
Radnor, Pennsylvania
Epoch Investment Partners, Inc.
New York, New York
FIAM LLC
Smithfield, Rhode Island
IndexIQ Advisors LLC*
New York, New York
Janus Capital Management LLC
Denver, Colorado
MacKay Shields LLC*
New York, New York
Mellon Investments Corporation
Boston, Massachusetts
NYL Investors LLC*
New York, New York
Pacific Investment Management Company LLC
Newport Beach, California
Segall Bryant & Hamill, LLC
Chicago, Illinois
T. Rowe Price Associates, Inc.
Baltimore, Maryland
Wellington Management Company LLP
Boston, Massachusetts
Winslow Capital Management, LLC
Minneapolis, Minnesota
Legal Counsel
Dechert LLP
Washington, District of Columbia
Independent Registered Public Accounting Firm
PricewaterhouseCoopers LLP
New York, New York
Distributor
NYLIFE Distributors LLC*
Jersey City, New Jersey
Custodian
JPMorgan Chase Bank, N.A.
New York, New York
Some Portfolios may not be available in all products.
† Fidelity Institutional AM is a registered trade mark of FMR LLC. Used with permission.
* An affiliate of New York Life Investment Management LLC
Not part of the Semiannual Report
2021 Semiannual Report
This report is for the general information of New York Life Variable Annuities and NYLIAC Variable Universal Life Insurance Products policyowners. It must be preceded or accompanied by the appropriate product(s) and funds prospectuses if it is given to anyone who is not an owner of a New York Life variable annuity policy or a NYLIAC Variable Universal Life Insurance Product. This report does not offer for sale or solicit orders to purchase securities.
The performance data quoted in this report represents past performance. Past performance is no guarantee of future results. Due to market volatility and other factors, current performance may be lower or higher than the figures shown. The most recent month-end performance summary for your variable annuity or variable life policy is available by calling 800-598-2019 and is updated periodically on newyorklife.com.
The New York Life Variable Annuities and NYLIAC Variable Universal Life Insurance Products are issued by New York Life Insurance and Annuity Corporation (a Delaware Corporation) and distributed by NYLIFE Distributors LLC (Member FINRA/SIPC).
New York Life Insurance Company
New York Life Insurance and Annuity
Corporation (NYLIAC) (A Delaware Corporation)
51 Madison Avenue, Room 551
New York, NY 10010
newyorklife.com
nylinvestments.com
NYLIFE Distributors LLC, 30 Hudson Street, Jersey City, NJ 07302
New York Life Investment Management LLC is the investment manager to the MainStay VP Funds Trust
©2021 by NYLIFE Distributors LLC. All rights reserved.
You may obtain copies of the Prospectus and the Statement of Additional Information free of charge, upon request, by calling toll-free 800-598-2019 or writing to New York Life Insurance and Annuity Corporation, 51 Madison Avenue, New York, NY 10010.
| Not FDIC Insured | No Bank Guarantee | May Lose Value |
(NYLIAC) NI518
MainStay VP MacKay High Yield Corporate Bond Portfolio
Message from the President and Semiannual Report
Unaudited | June 30, 2021
Sign up for e-delivery of your shareholder reports. For full details on e-delivery, including who can participate and what you can receive via e-delivery,
please log in to newyorklifeinvestments.com/accounts.
| Not FDIC/NCUA Insured | Not a Deposit | May Lose Value | No Bank Guarantee | Not Insured by Any Government Agency |
This page intentionally left blank
Message from the President
The COVID-19 pandemic continued to afflict our personal lives and broad segments of the U.S. and global economy throughout the six-month reporting period ended June 30, 2021. However, with the deployment of multiple vaccines around the world, including three highly effective versions approved for emergency use in the United States, investors began to turn their attention toward the gradual reopening of the economy and the shape the “new normal” would take.
The first half of the reporting period saw increasing inflationary concerns as fiscal stimulus business reopenings drove accelerating economic growth, rising commodity prices and increased consumer spending. However, the U.S. Federal Reserve noted that price increases were likely to prove temporary and made clear their intention to remain accommodative for the foreseeable future. Accordingly, after moving higher in the first quarter of 2021, interest rates declined in the second quarter.
In response to the uncertain inflation outlook, equity market leadership shifted from value in the first quarter of the year to growth in the second quarter. Nevertheless, investor sentiment remained buoyant throughout the reporting period, with all eleven sectors in the S&P 500® Index, a widely regarded benchmark of market performance, producing positive returns. Energy led the market’s rise fueled by rapidly increasing oil and gas prices, followed by financials and real estate, which benefited from rising interest rates and the economic reopening, respectively. Communication services produced the slowest growth, followed by the traditionally defensive utilities and consumer staples
sectors. In the fixed income market, lower-credit-quality issues tended to outperform their higher-grade counterparts, with high-yield corporate bonds generating the strongest performance. Among securitized products, commercial mortgage-backed securities generally produced the strongest returns, followed by mortgage-backed securities and asset-backed securities, while Treasury securities lagged.
Despite the tremendous progress we’ve seen so far this year, the United States and the world continue to face significant pandemic-related challenges. Newer, more contagious variants of COVID-19 threaten the return of restrictions and lockdowns that could stall the economic recovery. At the same time, supply chain shortages have led to rising prices on everything from laptops to autos, stoking fears of uncontrolled inflation despite reassurance from the U.S. Federal Reserve. At New York Life Investments, we recognize that the shape that the “new normal” eventually takes may differ from our expectations. You can depend on us to keep a sharp watch for the unexpected, and to continue to help you find your way through this rapidly evolving investment landscape.
Sincerely,
Kirk C. Lehneis
President
The opinions expressed are as of the date of this report and are subject to change. There is no guarantee that any forecast made will come to pass. This material does not constitute investment advice and is not intended as an endorsement of any specific investment. Past performance is no guarantee of future results.
Not part of the Semiannual Report
Investors should refer to the Portfolio’s Summary Prospectus and/or Prospectus and consider the Portfolio’s investment objectives, strategies, risks, charges and expenses carefully before investing. The Summary Prospectus and/or Prospectus contain this and other information about the Portfolio. You may obtain copies of the Portfolio’s Summary Prospectus and/or the Prospectus and the Statement of Additional Information free of charge, upon request, by calling toll-free 800-598-2019, by writing to New York Life Insurance and Annuity Corporation, 51 Madison Avenue, Room 251, New York, New York 10010 or by sending an email to MainStayShareholdersServices@nylim.com. These documents are also available at nylinvestments.com/vpdocuments. Please read the Portfolio's Summary Prospectus and/or Prospectus carefully before investing. MainStay VP Funds Trust portfolios are separate account options which are purchased through a variable insurance or variable annuity contract.
Investment and Performance Comparison (Unaudited)
Performance data quoted represents past performance. Past performance is no guarantee of future results. Because of market volatility and other factors, current performance may be lower or higher than the figures shown. Investment return and principal value will fluctuate, and as a result, when shares are redeemed, they may be worth more or less than their original cost. The performance table and graph do not reflect any deduction of sales charges, mortality and expense charges, contract charges or administrative charges. Please refer to the Performance Summary appropriate for your policy. For performance information current to the most recent month-end, please call 800-598-2019 or visit www.newyorklife.com.
Performance figures may reflect certain fee waivers and/or expense limitations, without which total returns may have been different. For information on current fee waivers and/or expense limitations (if any), please refer to the Notes to Financial Statements.
| Average Annual Total Returns for the Period-Ended June 30, 2021 |
| Class | Inception
Date | Six
Months | One
Year | Five
Years | Ten
Years | Gross
Expense
Ratio1 |
| Initial Class Shares | 5/1/1995 | 4.12% | 14.43% | 6.99% | 6.48% | 0.59% |
| Service Class Shares | 6/4/2003 | 3.99 | 14.15 | 6.72 | 6.22 | 0.84 |
| 1. | The gross expense ratios presented reflect the Portfolio’s “Total Annual Portfolio Operating Expenses” from the most recent Prospectus, as supplemented, and may differ from other expense ratios disclosed in this report. |
| Benchmark Performance | Six
Months | One
Year | Five
Years | Ten
Years |
| ICE BofA U.S. High Yield Constrained Index1 | 3.70% | 15.60% | 7.28% | 6.49% |
| Morningstar High Yield Bond Category Average2 | 3.61 | 14.48 | 6.07 | 5.29 |
| 1. | The ICE BofA U.S. High Yield Constrained Index is the Portfolio's primary benchmark. The ICE BofA U.S. High Yield Constrained Index is a market value-weighted index of all domestic and Yankee high-yield bonds, including deferred interest bonds and payment-in-kind securities. Issuers included in the Index have maturities of one year or more and have a credit rating lower than BBB-/Baa3, but are not in default. No single issuer may issuer may constitute greater than 2% of the Index. Results assume reinvestment of all dividends and capital gains. An investment cannot be made directly in an index. |
| 2. | The Morningstar High Yield Bond Category Average is representative of funds that concentrate on lower-quality bonds, which are riskier than those of higher-quality companies. These portfolios primarily invest in U.S. high-income debt securities where at least 65% or more of bond assets are not rated or are rated by a major agency such as Standard & Poor’s or Moody’s at the level of BB and below. Results are based on average total returns of similar funds with all dividends and capital gain distributions reinvested. |
Cost in Dollars of a $1,000 Investment in MainStay VP MacKay High Yield Corporate Bond Portfolio (Unaudited)
The example below is intended to describe the fees and expenses borne by shareholders during the six-month period from January 1, 2021 to June 30, 2021, and the impact of those costs on your investment.
Example
As a shareholder of the Portfolio you incur two types of costs: (1) transaction costs, including exchange fees and sales charges (loads) on purchases (as applicable), and (2) ongoing costs, including management fees, distribution and/or service (12b-1) fees, and other Portfolio expenses (as applicable). This example is intended to help you understand your ongoing costs (in dollars) of investing in the Portfolio and to compare these costs with the ongoing costs of investing in other mutual funds. The example is based on an investment of $1,000 made at the beginning of the six-month period and held for the entire period from January 1, 2021 to June 30, 2021. Shares are only sold in connection with variable life and annuity contracts and the example does not reflect any contract level or transactional fees or expenses. If these costs had been included, your costs would have been higher.
This example illustrates your Portfolio’s ongoing costs in two ways:
Actual Expenses
The second and third data columns in the table below provide information about actual account values and actual expenses. You may use the information in these columns, together with the amount you invested, to estimate the expenses that you paid during the six months ended June
30, 2021. Simply divide your account value by $1,000 (for example, an $8,600 account value divided by $1,000 = 8.6), then multiply the result by the number under the heading entitled “Expenses Paid During Period” to estimate the expenses you paid on your account during this period.
Hypothetical Example for Comparison Purposes
The fourth and fifth data columns in the table below provide information about hypothetical account values and hypothetical expenses based on the Portfolio’s actual expense ratio and an assumed rate of return of 5% per year before expenses, which is not the Portfolio’s actual return. The hypothetical account values and expenses may not be used to estimate the actual ending account balances or expenses you paid for the six-month period shown. You may use this information to compare the ongoing costs of investing in the Portfolio with the ongoing costs of investing in other mutual funds. To do so, compare this 5% hypothetical example with the 5% hypothetical examples that appear in the shareholder reports of the other mutual funds.
Please note that the expenses shown in the table are meant to highlight your ongoing costs only and do not reflect any transactional costs, such as exchange fees or sales charges (loads). Therefore, the fourth and fifth data columns of the table are useful in comparing ongoing costs only and will not help you determine the relative total costs of owning different funds. In addition, if these transactional costs were included, your costs would have been higher.
| Share Class | Beginning
Account
Value
1/1/21 | Ending Account
Value (Based
on Actual
Returns and
Expenses)
6/30/21 | Expenses
Paid
During
Period1 | Ending Account
Value (Based
on Hypothetical
5% Annualized
Return and
Actual Expenses)
6/30/21 | Expenses
Paid
During
Period1 | Net Expense
Ratio
During
Period2 |
| Initial Class Shares | $1,000.00 | $1,041.20 | $2.94 | $1,021.92 | $2.91 | 0.58% |
| Service Class Shares | $1,000.00 | $1,039.90 | $4.20 | $1,020.68 | $4.16 | 0.83% |
| 1. | Expenses are equal to the Portfolio’s annualized expense ratio of each class multiplied by the average account value over the period, divided by 365 and multiplied by 181 (to reflect the six-month period). The table above represents the actual expenses incurred during the six-month period. In addition to the fees and expenses which the Portfolio bears directly, it also indirectly bears a pro rata share of the fees and expenses of the underlying funds in which it invests. Such indirect expenses are not included in the above-reported expense figures. |
| 2. | Expenses are equal to the Portfolio's annualized expense ratio to reflect the six-month period. |
Portfolio Composition as of June 30, 2021 (Unaudited)
‡ Less than one-tenth of percent.
See Portfolio of Investments beginning on page 9 for specific holdings within these categories. The Portfolio's holdings are subject to change.
Top Ten Holdings or Issuers Held as of June 30, 2021 (excluding short-term investments) (Unaudited)
| 1. | CCO Holdings LLC, 4.25%-5.75%, due 2/15/26–6/1/33 |
| 2. | HCA, Inc., 3.50%-8.36%, due 5/1/23–11/6/33 |
| 3. | MSCI, Inc., 3.625%-5.375%, due 5/15/27–11/1/31 |
| 4. | TransDigm, Inc., 2.354%-8.00%, due 12/9/25–5/1/29 |
| 5. | Netflix, Inc., 4.875%-5.875%, due 2/15/22–6/15/30 |
| 6. | Carnival Corp., 5.75%-11.50%, due 4/1/23–8/1/27 |
| 7. | T-Mobile US, Inc., 2.625%-5.375%, due 2/1/26–4/15/31 |
| 8. | Sprint Capital Corp., 6.875%, due 11/15/28 |
| 9. | MGM Growth Properties Operating Partnership LP, 3.875%-5.75%, due 5/1/24–2/15/29 |
| 10. | Gulfport Energy Operating Corp. |
Portfolio Management Discussion and Analysis (Unaudited)
Answers to the questions reflect the views of portfolio manager Andrew Susser of MacKay Shields LLC, the Portfolio’s Subadvisor.
How did MainStay VP MacKay High Yield Corporate Bond Portfolio perform relative to its benchmark and peers during the six months ended June 30, 2021?
For the six months ended June 30, 2021, MainStay VP MacKay High Yield Corporate Bond Portfolio returned 4.12% for Initial Class shares and 3.99% for Service Class shares. Over the same period, both share classes outperformed the 3.70% return of the ICE BofA U.S. High Yield Constrained Index (“Index”), which is the Portfolio’s benchmark, and the 3.61% return of the Morningstar High Yield Bond Category Average.1
What factors affected the Portfolio’s relative performance during the reporting period?
During the reporting period, the Portfolio’s outperformance relative to the Index was driven primarily by strong security selection. In the energy sector, good selection and overweight exposure to exploration & production companies made positive contributions to returns. (Contributions take weightings and total returns into account.) Though underweight exposure to CCC-rated2 bonds detracted from returns relative to the Index as that segment of the market outperformed, security selection among CCC-rated credits offset the negative effect of the Portfolio’s underweight position.
What was the Portfolio’s duration3 strategy during the reporting period?
The Portfolio’s duration is the result of our bottom-up fundamental analysis and is residual of the investment process. However, the Portfolio did have a lower duration relative to the Index throughout the reporting period.
What specific factors, risks or market forces prompted significant decisions for the Portfolio during the reporting period?
There were no material shifts to the Portfolio during the reporting period, but the sharp recovery in the “fallen angels” (credits downgraded from investment grade to high yield) component of the Portfolio did give us the opportunity to trim positions at premiums that were purchased at steep discounts. Fallen angels were significant positive contributors to the Portfolio’s returns during the reporting period.
During the reporting period, which market segments were the strongest positive contributors to the Portfolio’s absolute performance and which market segments were particularly weak?
Security selection in the energy sector made the strongest positive contribution to the Portfolio’s absolute returns during the reporting period. Security selection in basic industry and media were also positive contributors to returns. Security selection in the utility sector posted a negative contribution to return during the reporting period. In addition, the banking sector was a weak contributor to absolute performance.
Did the Portfolio make any significant purchases or sales during the reporting period?
During the reporting period, we selectively trimmed the Portfolio’s positions in fallen angels that were purchased at the height of the pandemic and then recovered nicely. The Portfolio purchased new issues in toy manufacturer Mattel and energy producer New Fortress Energy.
How did the Portfolio’s sector weightings change during the reporting period?
During the reporting period, there were no material changes to the sector weightings in the Portfolio. On the margin, we did add to the Portfolio’s health care and services exposure while moderately trimming exposure to consumer goods and telecommunications.
How was the Portfolio positioned at the end of the reporting period?
As of June 30, 2021, the Portfolio held underweight positions relative to the Index in CCC-rated bonds and held overweight exposure to higher-quality issuers. Across industries, the Portfolio held overweight exposure to energy and basic industry. Conversely, the Portfolio held underweight exposure to consumer goods and telecommunications.
| 1. | See page 5 for more information on benchmark and peer group returns. |
| 2. | An obligation rated ‘CCC’ by Standard & Poor’s (S&P) is deemed by S&P to be currently vulnerable to nonpayment and is dependent upon favorable business, financial and economic conditions for the obligor to meet its financial commitment on the obligation. It is the opinion of S&P that in the event of adverse business, financial or economic conditions, the obligor is not likely to have the capacity to meet its financial commitment on the obligation. When applied to Fund holdings, ratings are based solely on the creditworthiness of the bonds in the portfolio and are not meant to represent the security or safety of the Fund. |
| 3. | Duration is a measure of the price sensitivity of a fixed-income investment to changes in interest rates. Duration is expressed as a number of years and is considered a more accurate sensitivity gauge than average maturity. |
The opinions expressed are those of the portfolio manager as of the date of this report and are subject to change. There is no guarantee that any forecasts will come to pass. This material does not constitute investment advice and is not intended as an endorsement of any specific investment.
Not all MainStay VP Portfolios and/or share classes are available under all policies.
Portfolio of Investments June 30, 2021† (Unaudited)
| | Principal
Amount | Value |
| Long-Term Bonds 92.7% |
| Convertible Bonds 0.7% |
| Investment Companies 0.2% |
| Ares Capital Corp. | | |
| 4.625%, due 3/1/24 | $ 4,365,000 | $ 4,771,382 |
| Media 0.2% |
| DISH Network Corp. | | |
| 2.375%, due 3/15/24 | 3,050,000 | 2,968,031 |
| 3.375%, due 8/15/26 | 4,520,000 | 4,623,960 |
| | | 7,591,991 |
| Oil & Gas Services 0.3% |
| Forum Energy Technologies, Inc. | | |
| 9.00% (6.25% Cash and 2.75% PIK), due 8/4/25 (a) | 9,247,866 | 9,280,464 |
Total Convertible Bonds
(Cost $20,123,824) | | 21,643,837 |
| Corporate Bonds 89.3% |
| Advertising 1.0% |
| Lamar Media Corp. | | |
| 3.625%, due 1/15/31 (b) | 9,000,000 | 8,797,500 |
| 3.75%, due 2/15/28 | 6,320,000 | 6,430,600 |
| 4.00%, due 2/15/30 | 6,400,000 | 6,477,504 |
| 4.875%, due 1/15/29 | 2,195,000 | 2,315,725 |
| Outfront Media Capital LLC (b) | | |
| 4.25%, due 1/15/29 | 2,000,000 | 2,012,500 |
| 5.00%, due 8/15/27 | 6,910,000 | 7,154,545 |
| | | 33,188,374 |
| Aerospace & Defense 1.8% |
| F-Brasile SpA | | |
| Series XR | | |
| 7.375%, due 8/15/26 (b) | 5,587,000 | 5,754,610 |
| Rolls-Royce plc | | |
| 5.75%, due 10/15/27 (b) | 3,210,000 | 3,535,783 |
| TransDigm UK Holdings plc | | |
| 6.875%, due 5/15/26 | 7,637,000 | 8,057,035 |
| TransDigm, Inc. | | |
| 4.625%, due 1/15/29 (b) | 7,485,000 | 7,487,620 |
| 4.875%, due 5/1/29 (b) | 5,630,000 | 5,683,485 |
| 6.25%, due 3/15/26 (b) | 22,850,000 | 24,106,750 |
| 7.50%, due 3/15/27 | 2,500,000 | 2,659,375 |
| 8.00%, due 12/15/25 (b) | 2,000,000 | 2,161,000 |
| | | 59,445,658 |
| | Principal
Amount | Value |
| |
| Airlines 1.0% |
| American Airlines, Inc. (b) | | |
| 5.50%, due 4/20/26 | $ 4,560,000 | $ 4,827,900 |
| 5.75%, due 4/20/29 | 3,750,000 | 4,054,687 |
| Delta Air Lines, Inc. | | |
| 4.50%, due 10/20/25 (b) | 4,095,000 | 4,400,572 |
| 4.75%, due 10/20/28 (b) | 5,450,000 | 6,059,079 |
| 7.00%, due 5/1/25 (b) | 1,220,000 | 1,423,726 |
| 7.375%, due 1/15/26 | 2,160,000 | 2,534,402 |
| Mileage Plus Holdings LLC | | |
| 6.50%, due 6/20/27 (b) | 6,405,000 | 7,051,905 |
| Spirit Loyalty Cayman Ltd. | | |
| 8.00%, due 9/20/25 (b) | 1,495,984 | 1,691,958 |
| | | 32,044,229 |
| Auto Manufacturers 2.0% |
| Ford Holdings LLC | | |
| 9.30%, due 3/1/30 | 8,454,000 | 11,434,880 |
| Ford Motor Co. | | |
| 7.45%, due 7/16/31 | 5,200,000 | 6,838,000 |
| 9.625%, due 4/22/30 | 1,500,000 | 2,152,500 |
| Ford Motor Credit Co. LLC | | |
| 3.339%, due 3/28/22 | 2,561,000 | 2,598,647 |
| 3.375%, due 11/13/25 | 4,000,000 | 4,147,800 |
| 4.00%, due 11/13/30 | 5,000,000 | 5,237,500 |
| 4.125%, due 8/17/27 | 1,000,000 | 1,060,777 |
| 4.271%, due 1/9/27 | 1,647,000 | 1,764,596 |
| 4.389%, due 1/8/26 | 750,000 | 810,000 |
| 5.125%, due 6/16/25 | 3,500,000 | 3,854,375 |
| General Motors Co. | | |
| 6.80%, due 10/1/27 | 3,000,000 | 3,778,705 |
| JB Poindexter & Co., Inc. | | |
| 7.125%, due 4/15/26 (b) | 11,255,000 | 11,888,094 |
| Mclaren Finance plc | | |
| 5.75%, due 8/1/22 (b) | 2,711,000 | 2,701,701 |
| PM General Purchaser LLC | | |
| 9.50%, due 10/1/28 (b) | 3,775,000 | 3,976,660 |
| Wabash National Corp. | | |
| 5.50%, due 10/1/25 (b) | 2,377,000 | 2,424,540 |
| | | 64,668,775 |
| Auto Parts & Equipment 2.2% |
| Adient Global Holdings Ltd. | | |
| 4.875%, due 8/15/26 (b) | 6,300,000 | 6,484,149 |
| Adient US LLC | | |
| 9.00%, due 4/15/25 (b) | 1,320,000 | 1,453,650 |
| American Axle & Manufacturing, Inc. | | |
| 6.25%, due 4/1/25 | 4,000,000 | 4,131,840 |
| Dealer Tire LLC | | |
| 8.00%, due 2/1/28 (b) | 2,400,000 | 2,586,000 |
The notes to the financial statements are an integral part of, and should be read in conjunction with, the financial statements.
9
Portfolio of Investments June 30, 2021† (Unaudited) (continued)
| | Principal
Amount | Value |
| Corporate Bonds (continued) |
| Auto Parts & Equipment (continued) |
| Exide Global Holding Netherlands CV | | |
| 10.75%, due 10/26/24 (c)(d)(e) | $ 3,380,000 | $ 3,312,400 |
| Goodyear Tire & Rubber Co. (The) (b) | | |
| 5.00%, due 7/15/29 | 4,070,000 | 4,261,290 |
| 5.25%, due 7/15/31 | 2,135,000 | 2,231,075 |
| IHO Verwaltungs GmbH (a)(b) | | |
| 4.75% (4.75% Cash or 5.50% PIK), due 9/15/26 | 7,173,000 | 7,332,886 |
| 6.00% (6.00% Cash or 6.75% PIK), due 5/15/27 | 9,581,000 | 10,036,097 |
| 6.375% (6.38% Cash or 7.13% PIK), due 5/15/29 | 10,105,000 | 11,014,450 |
| Meritor, Inc. | | |
| 6.25%, due 6/1/25 (b) | 1,000,000 | 1,065,170 |
| Real Hero Merger Sub 2, Inc. | | |
| 6.25%, due 2/1/29 (b) | 9,805,000 | 10,169,746 |
| Tenneco, Inc. | | |
| 5.00%, due 7/15/26 | 1,500,000 | 1,492,050 |
| 7.875%, due 1/15/29 (b) | 2,770,000 | 3,128,383 |
| Wheel Pros, Inc. | | |
| 6.50%, due 5/15/29 (b) | 3,000,000 | 3,033,750 |
| | | 71,732,936 |
| Beverages 0.1% |
| Primo Water Holdings, Inc. | | |
| 4.375%, due 4/30/29 (b) | 3,725,000 | 3,725,000 |
| Biotechnology 0.1% |
| Emergent BioSolutions, Inc. | | |
| 3.875%, due 8/15/28 (b) | 2,980,000 | 2,918,970 |
| Building Materials 1.1% |
| James Hardie International Finance DAC | | |
| 5.00%, due 1/15/28 (b) | 8,011,000 | 8,484,330 |
| Koppers, Inc. | | |
| 6.00%, due 2/15/25 (b) | 6,270,000 | 6,470,640 |
| Patrick Industries, Inc. (b) | | |
| 4.75%, due 5/1/29 | 2,295,000 | 2,280,656 |
| 7.50%, due 10/15/27 | 5,615,000 | 6,071,050 |
| Summit Materials LLC (b) | | |
| 5.125%, due 6/1/25 | 3,270,000 | 3,296,242 |
| 5.25%, due 1/15/29 | 3,930,000 | 4,175,350 |
| 6.50%, due 3/15/27 | 5,135,000 | 5,435,295 |
| | | 36,213,563 |
| | Principal
Amount | Value |
| |
| Chemicals 1.4% |
| CVR Partners LP | | |
| 6.125%, due 6/15/28 (b) | $ 1,700,000 | $ 1,742,500 |
| GPD Cos., Inc. | | |
| 10.125%, due 4/1/26 (b) | 6,400,000 | 6,976,000 |
| Innophos Holdings, Inc. | | |
| 9.375%, due 2/15/28 (b) | 5,900,000 | 6,372,000 |
| Iris Holdings, Inc. | | |
| 8.75% (8.75% Cash or 9.50% PIK), due 2/15/26 (a)(b) | 5,015,000 | 5,115,300 |
| NOVA Chemicals Corp. (b) | | |
| 4.875%, due 6/1/24 | 2,635,000 | 2,779,925 |
| 5.25%, due 6/1/27 | 1,000,000 | 1,077,800 |
| SCIH Salt Holdings, Inc. (b) | | |
| 4.875%, due 5/1/28 | 6,000,000 | 5,999,280 |
| 6.625%, due 5/1/29 | 7,280,000 | 7,298,200 |
| TPC Group, Inc. Escrow Claim Shares | | |
| (zero coupon)%, due 12/31/49 (c)(d)(e)(f) | 53,500 | — |
| 10.50%, due 8/1/24 (b) | 3,583,000 | 3,368,020 |
| 10.875%, due 8/1/24 (b) | 5,350,000 | 5,724,500 |
| | | 46,453,525 |
| Coal 0.2% |
| Coronado Finance Pty. Ltd. | | |
| 10.75%, due 5/15/26 (b) | 2,600,000 | 2,769,000 |
| Natural Resource Partners LP | | |
| 9.125%, due 6/30/25 (b) | 3,095,000 | 3,033,100 |
| | | 5,802,100 |
| Commercial Services 4.0% |
| Allied Universal Holdco LLC (b) | | |
| 6.625%, due 7/15/26 | 3,000,000 | 3,180,690 |
| 9.75%, due 7/15/27 | 4,115,000 | 4,531,644 |
| AMN Healthcare, Inc. (b) | | |
| 4.00%, due 4/15/29 | 2,350,000 | 2,366,603 |
| 4.625%, due 10/1/27 | 2,100,000 | 2,182,320 |
| Ashtead Capital, Inc. (b) | | |
| 4.00%, due 5/1/28 | 4,130,000 | 4,341,662 |
| 4.25%, due 11/1/29 | 5,300,000 | 5,724,000 |
| 4.375%, due 8/15/27 | 2,008,000 | 2,103,380 |
| 5.25%, due 8/1/26 | 3,500,000 | 3,648,890 |
| Carriage Services, Inc. | | |
| 4.25%, due 5/15/29 (b) | 2,500,000 | 2,496,200 |
| Cimpress plc | | |
| 7.00%, due 6/15/26 (b) | 7,892,000 | 8,319,510 |
| Gartner, Inc. | | |
| 3.75%, due 10/1/30 (b) | 4,200,000 | 4,297,062 |
| Graham Holdings Co. | | |
| 5.75%, due 6/1/26 (b) | 11,107,000 | 11,551,280 |
The notes to the financial statements are an integral part of, and should be read in conjunction with, the financial statements.
| | Principal
Amount | Value |
| Corporate Bonds (continued) |
| Commercial Services (continued) |
| IHS Markit Ltd. (b) | | |
| 4.75%, due 2/15/25 | $ 3,950,000 | $ 4,422,025 |
| 5.00%, due 11/1/22 | 18,089,000 | 18,948,931 |
| Jaguar Holding Co. II | | |
| 5.00%, due 6/15/28 (b) | 1,030,000 | 1,116,437 |
| Korn Ferry | | |
| 4.625%, due 12/15/27 (b) | 4,000,000 | 4,155,000 |
| MPH Acquisition Holdings LLC | | |
| 5.75%, due 11/1/28 (b) | 3,295,000 | 3,311,178 |
| NESCO Holdings II, Inc. | | |
| 5.50%, due 4/15/29 (b) | 3,200,000 | 3,340,000 |
| Nielsen Finance LLC (b) | | |
| 4.50%, due 7/15/29 | 1,900,000 | 1,905,320 |
| 4.75%, due 7/15/31 | 3,000,000 | 3,007,500 |
| Rent-A-Center, Inc. | | |
| 6.375%, due 2/15/29 (b) | 1,000,000 | 1,073,750 |
| Ritchie Bros Auctioneers, Inc. | | |
| 5.375%, due 1/15/25 (b) | 3,800,000 | 3,911,625 |
| Service Corp. International | | |
| 3.375%, due 8/15/30 | 4,480,000 | 4,389,504 |
| 4.00%, due 5/15/31 | 7,000,000 | 7,144,725 |
| Square, Inc. | | |
| 3.50%, due 6/1/31 (b) | 2,165,000 | 2,183,944 |
| United Rentals North America, Inc. | | |
| 3.875%, due 11/15/27 | 4,495,000 | 4,723,031 |
| 3.875%, due 2/15/31 | 3,500,000 | 3,561,250 |
| 4.875%, due 1/15/28 | 1,000,000 | 1,060,500 |
| 5.50%, due 5/15/27 | 1,000,000 | 1,060,000 |
| WW International, Inc. | | |
| 4.50%, due 4/15/29 (b) | 5,510,000 | 5,551,325 |
| | | 129,609,286 |
| Computers 0.2% |
| Booz Allen Hamilton, Inc. | | |
| 4.00%, due 7/1/29 (b) | 1,750,000 | 1,789,375 |
| Unisys Corp. | | |
| 6.875%, due 11/1/27 (b) | 5,365,000 | 5,863,087 |
| | | 7,652,462 |
| Cosmetics & Personal Care 0.3% |
| Edgewell Personal Care Co. (b) | | |
| 4.125%, due 4/1/29 | 6,780,000 | 6,847,800 |
| 5.50%, due 6/1/28 | 4,000,000 | 4,240,000 |
| | | 11,087,800 |
| Distribution & Wholesale 0.7% |
| Avient Corp. | | |
| 5.25%, due 3/15/23 | 8,636,000 | 9,240,520 |
| | Principal
Amount | Value |
| |
| Distribution & Wholesale (continued) |
| Avient Corp. (continued) | | |
| 5.75%, due 5/15/25 (b) | $ 2,000,000 | $ 2,111,510 |
| G-III Apparel Group Ltd. | | |
| 7.875%, due 8/15/25 (b) | 5,000,000 | 5,412,750 |
| H&E Equipment Services, Inc. | | |
| 3.875%, due 12/15/28 (b) | 4,450,000 | 4,378,800 |
| Resideo Funding, Inc. | | |
| 6.125%, due 11/1/26 (b) | 1,927,000 | 2,023,350 |
| | | 23,166,930 |
| Diversified Financial Services 1.5% |
| Credit Acceptance Corp. | | |
| 5.125%, due 12/31/24 (b) | 2,605,000 | 2,699,431 |
| 6.625%, due 3/15/26 | 9,465,000 | 9,961,912 |
| Enact Holdings, Inc. | | |
| 6.50%, due 8/15/25 (b) | 4,485,000 | 4,943,367 |
| Jefferies Finance LLC | | |
| 6.25%, due 6/3/26 (b) | 5,000,000 | 5,225,000 |
| LPL Holdings, Inc. (b) | | |
| 4.00%, due 3/15/29 | 6,970,000 | 7,001,156 |
| 4.375%, due 5/15/31 | 3,280,000 | 3,316,900 |
| 4.625%, due 11/15/27 | 1,535,000 | 1,590,644 |
| Oxford Finance LLC | | |
| 6.375%, due 12/15/22 (b) | 5,480,000 | 5,521,100 |
| PennyMac Financial Services, Inc. | | |
| 4.25%, due 2/15/29 (b) | 3,650,000 | 3,516,446 |
| PRA Group, Inc. | | |
| 7.375%, due 9/1/25 (b) | 3,700,000 | 3,991,375 |
| StoneX Group, Inc. | | |
| 8.625%, due 6/15/25 (b) | 1,298,000 | 1,387,238 |
| | | 49,154,569 |
| Electric 1.5% |
| Clearway Energy Operating LLC | | |
| 4.75%, due 3/15/28 (b) | 4,050,000 | 4,247,438 |
| DPL, Inc. | | |
| 4.125%, due 7/1/25 | 5,815,000 | 6,236,587 |
| Keystone Power Pass-Through Holders LLC | | |
| 13.00% (13.00% PIK), due 6/1/24 (a)(b)(d) | 3,416,654 | 2,801,656 |
| Leeward Renewable Energy Operations LLC | | |
| 4.25%, due 7/1/29 (b) | 4,400,000 | 4,455,000 |
| NextEra Energy Operating Partners LP | | |
| 3.875%, due 10/15/26 (b) | 4,500,000 | 4,753,125 |
| NRG Energy, Inc. | | |
| 6.625%, due 1/15/27 | 7,000,000 | 7,246,540 |
The notes to the financial statements are an integral part of, and should be read in conjunction with, the financial statements.
11
Portfolio of Investments June 30, 2021† (Unaudited) (continued)
| | Principal
Amount | Value |
| Corporate Bonds (continued) |
| Electric (continued) |
| Pattern Energy Operations LP | | |
| 4.50%, due 8/15/28 (b) | $ 4,205,000 | $ 4,353,016 |
| PG&E Corp. | | |
| 5.00%, due 7/1/28 | 5,960,000 | 6,026,275 |
| 5.25%, due 7/1/30 | 3,840,000 | 3,876,480 |
| Vistra Operations Co. LLC (b) | | |
| 4.375%, due 5/1/29 | 2,850,000 | 2,864,250 |
| 5.00%, due 7/31/27 | 3,300,000 | 3,387,879 |
| | | 50,248,246 |
| Electrical Components & Equipment 0.2% |
| WESCO Distribution, Inc. (b) | | |
| 7.125%, due 6/15/25 | 4,535,000 | 4,900,975 |
| 7.25%, due 6/15/28 | 2,500,000 | 2,784,625 |
| | | 7,685,600 |
| Energy-Alternate Sources 0.2% |
| Renewable Energy Group, Inc. | | |
| 5.875%, due 6/1/28 (b) | 3,700,000 | 3,880,375 |
| TerraForm Power Operating LLC | | |
| 4.75%, due 1/15/30 (b) | 3,000,000 | 3,072,510 |
| | | 6,952,885 |
| Engineering & Construction 0.5% |
| Arcosa, Inc. | | |
| 4.375%, due 4/15/29 (b) | 1,340,000 | 1,363,450 |
| Great Lakes Dredge & Dock Corp. | | |
| 5.25%, due 6/1/29 (b) | 4,000,000 | 4,120,400 |
| PowerTeam Services LLC | | |
| 9.033%, due 12/4/25 (b) | 3,465,000 | 3,811,500 |
| Weekley Homes LLC | | |
| 4.875%, due 9/15/28 (b) | 5,800,000 | 6,003,000 |
| | | 15,298,350 |
| Entertainment 2.6% |
| Affinity Gaming | | |
| 6.875%, due 12/15/27 (b) | 3,340,000 | 3,544,575 |
| Allen Media LLC | | |
| 10.50%, due 2/15/28 (b) | 4,700,000 | 4,993,750 |
| Bally's Corp. | | |
| 6.75%, due 6/1/27 (b) | 6,595,000 | 7,027,830 |
| Boyne USA, Inc. | | |
| 4.75%, due 5/15/29 (b) | 2,900,000 | 2,992,017 |
| CCM Merger, Inc. | | |
| 6.375%, due 5/1/26 (b) | 2,170,000 | 2,278,500 |
| Churchill Downs, Inc. (b) | | |
| 4.75%, due 1/15/28 | 11,527,000 | 11,927,102 |
| 5.50%, due 4/1/27 | 8,051,000 | 8,389,597 |
| | Principal
Amount | Value |
| |
| Entertainment (continued) |
| Everi Holdings, Inc. | | |
| 5.00%, due 7/15/29 (b) | $ 440,000 | $ 440,000 |
| International Game Technology plc | | |
| 6.25%, due 1/15/27 (b) | 6,725,000 | 7,666,500 |
| Jacobs Entertainment, Inc. | | |
| 7.875%, due 2/1/24 (b) | 2,193,000 | 2,291,685 |
| Live Nation Entertainment, Inc. (b) | | |
| 3.75%, due 1/15/28 | 1,300,000 | 1,305,746 |
| 6.50%, due 5/15/27 | 6,435,000 | 7,141,563 |
| Merlin Entertainments Ltd. | | |
| 5.75%, due 6/15/26 (b) | 10,940,000 | 11,446,631 |
| Midwest Gaming Borrower LLC | | |
| 4.875%, due 5/1/29 (b) | 1,650,000 | 1,652,063 |
| Motion Bondco DAC | | |
| 6.625%, due 11/15/27 (b) | 4,200,000 | 4,252,500 |
| Powdr Corp. | | |
| 6.00%, due 8/1/25 (b) | 3,335,000 | 3,501,750 |
| Vail Resorts, Inc. | | |
| 6.25%, due 5/15/25 (b) | 2,800,000 | 2,997,064 |
| | | 83,848,873 |
| Environmental Control 0.2% |
| Madison IAQ LLC (b) | | |
| 4.125%, due 6/30/28 | 2,300,000 | 2,323,000 |
| 5.875%, due 6/30/29 | 3,200,000 | 3,256,000 |
| | | 5,579,000 |
| Food 2.0% |
| B&G Foods, Inc. | | |
| 5.25%, due 4/1/25 | 4,142,000 | 4,254,248 |
| Kraft Heinz Foods Co. | | |
| 3.875%, due 5/15/27 | 4,625,000 | 5,081,827 |
| 4.25%, due 3/1/31 | 3,500,000 | 3,975,961 |
| 6.50%, due 2/9/40 | 7,715,000 | 10,714,402 |
| 6.875%, due 1/26/39 | 7,588,000 | 10,899,476 |
| Lamb Weston Holdings, Inc. | | |
| 4.875%, due 5/15/28 (b) | 3,300,000 | 3,650,625 |
| Land O' Lakes, Inc. | | |
| 6.00%, due 11/15/22 (b) | 7,880,000 | 8,311,298 |
| Land O'Lakes Capital Trust I | | |
| 7.45%, due 3/15/28 (b) | 5,130,000 | 5,901,706 |
| Simmons Foods, Inc. | | |
| 4.625%, due 3/1/29 (b) | 4,950,000 | 4,993,015 |
| TreeHouse Foods, Inc. | | |
| 4.00%, due 9/1/28 | 3,000,000 | 2,977,500 |
| United Natural Foods, Inc. | | |
| 6.75%, due 10/15/28 (b) | 5,000,000 | 5,380,800 |
| | | 66,140,858 |
The notes to the financial statements are an integral part of, and should be read in conjunction with, the financial statements.
| | Principal
Amount | Value |
| Corporate Bonds (continued) |
| Food Service 0.2% |
| Aramark Services, Inc. | | |
| 6.375%, due 5/1/25 (b) | $ 6,500,000 | $ 6,906,250 |
| Forest Products & Paper 1.0% |
| Mercer International, Inc. | | |
| 5.125%, due 2/1/29 (b) | 8,860,000 | 9,116,940 |
| 5.50%, due 1/15/26 | 1,000,000 | 1,027,490 |
| Schweitzer-Mauduit International, Inc. | | |
| 6.875%, due 10/1/26 (b) | 3,000,000 | 3,176,250 |
| Smurfit Kappa Treasury Funding DAC | | |
| 7.50%, due 11/20/25 | 15,843,000 | 19,684,927 |
| | | 33,005,607 |
| Gas 0.6% |
| AmeriGas Partners LP | | |
| 5.625%, due 5/20/24 | 4,425,000 | 4,834,313 |
| 5.75%, due 5/20/27 | 2,485,000 | 2,770,775 |
| 5.875%, due 8/20/26 | 6,885,000 | 7,708,790 |
| Rockpoint Gas Storage Canada Ltd. | | |
| 7.00%, due 3/31/23 (b) | 5,100,000 | 5,214,750 |
| | | 20,528,628 |
| Hand & Machine Tools 0.1% |
| Werner FinCo. LP | | |
| 8.75%, due 7/15/25 (b) | 4,250,000 | 4,430,625 |
| Healthcare-Products 0.9% |
| Hologic, Inc. (b) | | |
| 3.25%, due 2/15/29 | 7,325,000 | 7,260,906 |
| 4.625%, due 2/1/28 | 3,000,000 | 3,150,000 |
| Teleflex, Inc. | | |
| 4.25%, due 6/1/28 (b) | 7,755,000 | 8,084,588 |
| 4.625%, due 11/15/27 | 3,500,000 | 3,728,165 |
| Varex Imaging Corp. | | |
| 7.875%, due 10/15/27 (b) | 5,050,000 | 5,656,000 |
| | | 27,879,659 |
| Healthcare-Services 5.1% |
| Acadia Healthcare Co., Inc. (b) | | |
| 5.00%, due 4/15/29 | 1,750,000 | 1,825,110 |
| 5.50%, due 7/1/28 | 1,500,000 | 1,601,250 |
| AHP Health Partners, Inc. | | |
| 9.75%, due 7/15/26 (b) | 5,890,000 | 6,336,462 |
| Catalent Pharma Solutions, Inc. (b) | | |
| 3.125%, due 2/15/29 | 5,195,000 | 5,030,734 |
| 5.00%, due 7/15/27 | 5,180,000 | 5,412,893 |
| | Principal
Amount | Value |
| |
| Healthcare-Services (continued) |
| Centene Corp. | | |
| 3.00%, due 10/15/30 | $ 4,000,000 | $ 4,109,120 |
| 4.25%, due 12/15/27 | 1,810,000 | 1,907,287 |
| 4.625%, due 12/15/29 | 4,870,000 | 5,355,880 |
| 5.375%, due 6/1/26 (b) | 3,245,000 | 3,391,025 |
| 5.375%, due 8/15/26 (b) | 2,380,000 | 2,487,100 |
| Charles River Laboratories International, Inc. | | |
| 3.75%, due 3/15/29 (b) | 1,620,000 | 1,642,275 |
| DaVita, Inc. (b) | | |
| 3.75%, due 2/15/31 | 2,900,000 | 2,784,000 |
| 4.625%, due 6/1/30 | 2,700,000 | 2,776,194 |
| Encompass Health Corp. | | |
| 4.50%, due 2/1/28 | 5,000,000 | 5,187,350 |
| 4.625%, due 4/1/31 | 1,875,000 | 2,008,969 |
| 4.75%, due 2/1/30 | 7,100,000 | 7,543,750 |
| HCA, Inc. | | |
| 3.50%, due 9/1/30 | 7,300,000 | 7,777,201 |
| 5.375%, due 2/1/25 | 7,255,000 | 8,183,640 |
| 5.625%, due 9/1/28 | 2,090,000 | 2,476,650 |
| 5.875%, due 5/1/23 | 4,800,000 | 5,216,160 |
| 5.875%, due 2/15/26 | 9,015,000 | 10,418,185 |
| 7.50%, due 11/6/33 | 12,100,000 | 16,698,000 |
| 7.58%, due 9/15/25 | 3,507,000 | 4,225,935 |
| 7.69%, due 6/15/25 | 9,195,000 | 11,171,465 |
| 8.36%, due 4/15/24 | 4,450,000 | 5,245,437 |
| IQVIA, Inc. | | |
| 5.00%, due 10/15/26 (b) | 9,792,000 | 10,134,720 |
| LifePoint Health, Inc. | | |
| 5.375%, due 1/15/29 (b) | 3,985,000 | 3,885,375 |
| ModivCare, Inc. | | |
| 5.875%, due 11/15/25 (b) | 3,500,000 | 3,745,000 |
| Molina Healthcare, Inc. | | |
| 3.875%, due 11/15/30 (b) | 4,180,000 | 4,352,425 |
| RegionalCare Hospital Partners Holdings, Inc. | | |
| 9.75%, due 12/1/26 (b) | 10,055,000 | 10,821,694 |
| Select Medical Corp. | | |
| 6.25%, due 8/15/26 (b) | 2,000,000 | 2,130,040 |
| | | 165,881,326 |
| Holding Companies-Diversified 0.3% |
| Stena International SA | | |
| 6.125%, due 2/1/25 (b) | 9,525,000 | 9,906,000 |
| Home Builders 2.2% |
| Adams Homes, Inc. | | |
| 7.50%, due 2/15/25 (b) | 5,250,000 | 5,486,250 |
The notes to the financial statements are an integral part of, and should be read in conjunction with, the financial statements.
13
Portfolio of Investments June 30, 2021† (Unaudited) (continued)
| | Principal
Amount | Value |
| Corporate Bonds (continued) |
| Home Builders (continued) |
| Ashton Woods USA LLC (b) | | |
| 6.625%, due 1/15/28 | $ 2,000,000 | $ 2,130,000 |
| 6.75%, due 8/1/25 | 2,237,000 | 2,318,091 |
| 9.875%, due 4/1/27 | 3,230,000 | 3,609,525 |
| Brookfield Residential Properties, Inc. | | |
| 6.25%, due 9/15/27 (b) | 4,855,000 | 5,128,094 |
| Century Communities, Inc. | | |
| 5.875%, due 7/15/25 | 3,100,000 | 3,206,082 |
| 6.75%, due 6/1/27 | 6,775,000 | 7,189,969 |
| Installed Building Products, Inc. | | |
| 5.75%, due 2/1/28 (b) | 4,655,000 | 4,899,387 |
| M/I Homes, Inc. | | |
| 4.95%, due 2/1/28 | 3,000,000 | 3,129,750 |
| 5.625%, due 8/1/25 | 515,000 | 530,450 |
| Meritage Homes Corp. | | |
| 3.875%, due 4/15/29 (b) | 5,565,000 | 5,759,775 |
| Picasso Finance Sub, Inc. | | |
| 6.125%, due 6/15/25 (b) | 3,935,000 | 4,160,279 |
| PulteGroup, Inc. | | |
| 7.875%, due 6/15/32 | 3,595,000 | 5,160,622 |
| Shea Homes LP (b) | | |
| 4.75%, due 2/15/28 | 7,300,000 | 7,470,601 |
| 4.75%, due 4/1/29 | 1,000,000 | 1,026,880 |
| STL Holding Co. LLC | | |
| 7.50%, due 2/15/26 (b) | 2,700,000 | 2,841,750 |
| Williams Scotsman International, Inc. | | |
| 4.625%, due 8/15/28 (b) | 3,020,000 | 3,118,754 |
| Winnebago Industries, Inc. | | |
| 6.25%, due 7/15/28 (b) | 3,300,000 | 3,555,750 |
| | | 70,722,009 |
| Household Products & Wares 0.3% |
| Central Garden & Pet Co. | | |
| 4.125%, due 10/15/30 | 2,020,000 | 2,062,925 |
| 4.125%, due 4/30/31 (b) | 2,300,000 | 2,325,875 |
| Spectrum Brands, Inc. | | |
| 3.875%, due 3/15/31 (b) | 1,500,000 | 1,473,945 |
| 5.75%, due 7/15/25 | 3,840,000 | 3,935,040 |
| | | 9,797,785 |
| Housewares 0.2% |
| Scotts Miracle-Gro Co. (The) | | |
| 4.00%, due 4/1/31 (b) | 4,860,000 | 4,844,837 |
| | Principal
Amount | Value |
| |
| Insurance 1.0% |
| American Equity Investment Life Holding Co. | | |
| 5.00%, due 6/15/27 | $ 3,420,000 | $ 3,869,279 |
| BroadStreet Partners, Inc. | | |
| 5.875%, due 4/15/29 (b) | 4,500,000 | 4,590,000 |
| Fairfax Financial Holdings Ltd. | | |
| 8.30%, due 4/15/26 | 4,273,000 | 5,387,125 |
| Fidelity & Guaranty Life Holdings, Inc. | | |
| 5.50%, due 5/1/25 (b) | 2,500,000 | 2,878,501 |
| MGIC Investment Corp. | | |
| 5.25%, due 8/15/28 | 6,140,000 | 6,508,400 |
| NMI Holdings, Inc. | | |
| 7.375%, due 6/1/25 (b) | 3,245,000 | 3,718,640 |
| USI, Inc. | | |
| 6.875%, due 5/1/25 (b) | 5,890,000 | 5,963,802 |
| | | 32,915,747 |
| Internet 2.2% |
| Cars.com, Inc. | | |
| 6.375%, due 11/1/28 (b) | 4,150,000 | 4,426,141 |
| Netflix, Inc. | | |
| 4.875%, due 4/15/28 | 1,692,000 | 1,966,950 |
| 4.875%, due 6/15/30 (b) | 3,000,000 | 3,567,900 |
| 5.375%, due 11/15/29 (b) | 2,500,000 | 3,036,491 |
| 5.50%, due 2/15/22 | 7,455,000 | 7,641,375 |
| 5.75%, due 3/1/24 | 10,899,000 | 12,234,127 |
| 5.875%, due 2/15/25 | 3,320,000 | 3,836,526 |
| 5.875%, due 11/15/28 | 8,800,000 | 10,801,384 |
| Uber Technologies, Inc. (b) | | |
| 7.50%, due 5/15/25 | 2,400,000 | 2,590,080 |
| 7.50%, due 9/15/27 | 6,065,000 | 6,665,314 |
| VeriSign, Inc. | | |
| 4.75%, due 7/15/27 | 6,000,000 | 6,367,500 |
| 5.25%, due 4/1/25 | 9,025,000 | 10,249,602 |
| | | 73,383,390 |
| Investment Companies 1.2% |
| Compass Group Diversified Holdings LLC | | |
| 5.25%, due 4/15/29 (b) | 8,500,000 | 8,840,000 |
| FS Energy and Power Fund | | |
| 7.50%, due 8/15/23 (b) | 21,035,000 | 21,718,637 |
| Icahn Enterprises LP | | |
| 5.25%, due 5/15/27 | 4,000,000 | 4,129,980 |
| 5.25%, due 5/15/27 (b) | 425,000 | 438,813 |
| 6.25%, due 5/15/26 | 4,000,000 | 4,244,000 |
| | | 39,371,430 |
The notes to the financial statements are an integral part of, and should be read in conjunction with, the financial statements.
| | Principal
Amount | Value |
| Corporate Bonds (continued) |
| Iron & Steel 0.9% |
| Allegheny Ludlum LLC | | |
| 6.95%, due 12/15/25 | $ 7,400,000 | $ 8,103,000 |
| Allegheny Technologies, Inc. | | |
| 7.875%, due 8/15/23 (g) | 1,423,000 | 1,559,964 |
| Big River Steel LLC | | |
| 6.625%, due 1/31/29 (b) | 8,500,000 | 9,360,625 |
| Mineral Resources Ltd. | | |
| 8.125%, due 5/1/27 (b) | 10,345,000 | 11,366,569 |
| | | 30,390,158 |
| Leisure Time 2.3% |
| Carlson Travel, Inc. (b) | | |
| 6.75%, due 12/15/25 (f)(h) | 14,283,000 | 13,131,505 |
| 10.50%, due 3/31/25 (g) | 9,199,150 | 9,659,107 |
| 11.50% (9.50% Cash and 2.00% PIK), due 12/15/26 (a)(f)(h)(i) | 8,460,000 | 4,230,000 |
| Carnival Corp. (b) | | |
| 5.75%, due 3/1/27 | 16,080,000 | 16,843,800 |
| 7.625%, due 3/1/26 | 2,785,000 | 3,025,206 |
| 9.875%, due 8/1/27 | 7,000,000 | 8,172,500 |
| 10.50%, due 2/1/26 | 6,090,000 | 7,090,283 |
| 11.50%, due 4/1/23 | 5,880,000 | 6,617,352 |
| Royal Caribbean Cruises Ltd. | | |
| 5.50%, due 4/1/28 (b) | 4,870,000 | 5,100,351 |
| | | 73,870,104 |
| Lodging 1.7% |
| Boyd Gaming Corp. | | |
| 4.75%, due 12/1/27 | 8,195,000 | 8,481,825 |
| 4.75%, due 6/15/31 (b) | 5,825,000 | 6,043,438 |
| Genting New York LLC | | |
| 3.30%, due 2/15/26 (b) | 6,185,000 | 6,243,499 |
| Hilton Domestic Operating Co., Inc. | | |
| 4.00%, due 5/1/31 (b) | 6,845,000 | 6,905,715 |
| 4.875%, due 1/15/30 | 7,000,000 | 7,472,500 |
| 5.75%, due 5/1/28 (b) | 1,725,000 | 1,866,571 |
| Hyatt Hotels Corp. | | |
| 5.75%, due 4/23/30 | 2,315,000 | 2,810,133 |
| Marriott International, Inc. | | |
| Series GG | | |
| 3.50%, due 10/15/32 | 4,000,000 | 4,249,208 |
| Series FF | | |
| 4.625%, due 6/15/30 | 2,000,000 | 2,303,404 |
| Series EE | | |
| 5.75%, due 5/1/25 | 7,050,000 | 8,137,810 |
| | Principal
Amount | Value |
| |
| Lodging (continued) |
| Marriott Ownership Resorts, Inc. | | |
| 6.50%, due 9/15/26 | $ 2,001,000 | $ 2,078,539 |
| | | 56,592,642 |
| Machinery—Construction & Mining 0.1% |
| Terex Corp. | | |
| 5.00%, due 5/15/29 (b) | 2,150,000 | 2,241,375 |
| Machinery-Diversified 0.5% |
| Briggs & Stratton Corp. Escrow Claim Shares | | |
| 6.875%, due 12/15/20 (d)(f)(h)(j) | 5,030,000 | 414,975 |
| Colfax Corp. | | |
| 6.375%, due 2/15/26 (b) | 3,053,000 | 3,223,968 |
| Stevens Holding Co., Inc. | | |
| 6.125%, due 10/1/26 (b) | 4,144,000 | 4,444,440 |
| TK Elevator US Newco, Inc. | | |
| 5.25%, due 7/15/27 (b) | 5,380,000 | 5,669,175 |
| Vertical Holdco GmbH | | |
| 7.625%, due 7/15/28 (b) | 1,570,000 | 1,703,748 |
| | | 15,456,306 |
| Media 6.7% |
| Block Communications, Inc. | | |
| 4.875%, due 3/1/28 (b) | 3,775,000 | 3,850,500 |
| Cable One, Inc. | | |
| 4.00%, due 11/15/30 (b) | 9,475,000 | 9,510,531 |
| CCO Holdings LLC | | |
| 4.25%, due 2/1/31 (b) | 6,000,000 | 6,112,500 |
| 4.50%, due 8/15/30 (b) | 13,555,000 | 14,113,654 |
| 4.50%, due 5/1/32 | 10,680,000 | 11,067,150 |
| 4.50%, due 6/1/33 (b) | 4,300,000 | 4,400,018 |
| 4.75%, due 3/1/30 (b) | 7,715,000 | 8,158,613 |
| 5.00%, due 2/1/28 (b) | 8,550,000 | 8,966,813 |
| 5.125%, due 5/1/27 (b) | 12,000,000 | 12,586,800 |
| 5.375%, due 6/1/29 (b) | 4,780,000 | 5,225,018 |
| 5.75%, due 2/15/26 (b) | 2,532,000 | 2,616,974 |
| CSC Holdings LLC (b) | | |
| 5.75%, due 1/15/30 | 6,705,000 | 6,964,819 |
| 6.50%, due 2/1/29 | 2,660,000 | 2,946,216 |
| Diamond Sports Group LLC (b) | | |
| 5.375%, due 8/15/26 | 800,000 | 518,960 |
| 6.625%, due 8/15/27 | 3,335,000 | 1,637,935 |
| DISH DBS Corp. | | |
| 5.125%, due 6/1/29 (b) | 3,300,000 | 3,258,519 |
| 5.875%, due 7/15/22 | 6,655,000 | 6,942,496 |
| 7.75%, due 7/1/26 | 9,055,000 | 10,254,787 |
The notes to the financial statements are an integral part of, and should be read in conjunction with, the financial statements.
15
Portfolio of Investments June 30, 2021† (Unaudited) (continued)
| | Principal
Amount | Value |
| Corporate Bonds (continued) |
| Media (continued) |
| LCPR Senior Secured Financing DAC (b) | | |
| 5.125%, due 7/15/29 | $ 1,700,000 | $ 1,757,375 |
| 6.75%, due 10/15/27 | 15,106,000 | 16,279,736 |
| Meredith Corp. | | |
| 6.875%, due 2/1/26 | 16,403,000 | 17,059,120 |
| News Corp. | | |
| 3.875%, due 5/15/29 (b) | 10,470,000 | 10,574,700 |
| Quebecor Media, Inc. | | |
| 5.75%, due 1/15/23 | 12,147,000 | 12,999,294 |
| Scripps Escrow II, Inc. | | |
| 3.875%, due 1/15/29 (b) | 4,805,000 | 4,766,704 |
| Sirius XM Radio, Inc. | | |
| 4.00%, due 7/15/28 (b) | 2,750,000 | 2,832,500 |
| Sterling Entertainment Enterprises LLC | | |
| 10.25%, due 1/15/25 (c)(d)(e)(j) | 7,000,000 | 7,245,000 |
| Townsquare Media, Inc. | | |
| 6.875%, due 2/1/26 (b) | 1,015,000 | 1,086,050 |
| Videotron Ltd. | | |
| 5.00%, due 7/15/22 | 2,625,000 | 2,730,263 |
| 5.125%, due 4/15/27 (b) | 5,890,000 | 6,155,050 |
| 5.375%, due 6/15/24 (b) | 11,450,000 | 12,537,750 |
| Virgin Media Finance plc | | |
| 5.00%, due 7/15/30 (b) | 3,490,000 | 3,525,912 |
| | | 218,681,757 |
| Metal Fabricate & Hardware 0.9% |
| Advanced Drainage Systems, Inc. | | |
| 5.00%, due 9/30/27 (b) | 3,895,000 | 4,043,088 |
| Grinding Media, Inc. | | |
| 7.375%, due 12/15/23 (b) | 20,535,000 | 20,997,859 |
| Park-Ohio Industries, Inc. | | |
| 6.625%, due 4/15/27 | 4,875,000 | 4,961,775 |
| | | 30,002,722 |
| Mining 2.3% |
| Alcoa Nederland Holding BV | | |
| 7.00%, due 9/30/26 (b) | 5,745,000 | 6,003,525 |
| Arconic Corp. | | |
| 6.00%, due 5/15/25 (b) | 2,200,000 | 2,344,694 |
| Century Aluminum Co. | | |
| 7.50%, due 4/1/28 (b) | 5,650,000 | 5,995,836 |
| Compass Minerals International, Inc. (b) | | |
| 4.875%, due 7/15/24 | 2,250,000 | 2,323,125 |
| 6.75%, due 12/1/27 | 7,990,000 | 8,589,250 |
| | Principal
Amount | Value |
| |
| Mining (continued) |
| First Quantum Minerals Ltd. (b) | | |
| 6.875%, due 10/15/27 | $ 1,800,000 | $ 1,961,460 |
| 7.25%, due 4/1/23 | 7,480,000 | 7,624,962 |
| Hudbay Minerals, Inc. | | |
| 4.50%, due 4/1/26 (b) | 2,750,000 | 2,760,313 |
| IAMGOLD Corp. | | |
| 5.75%, due 10/15/28 (b) | 7,000,000 | 7,282,450 |
| Joseph T Ryerson & Son, Inc. | | |
| 8.50%, due 8/1/28 (b) | 2,880,000 | 3,196,800 |
| Novelis Corp. (b) | | |
| 4.75%, due 1/30/30 | 5,700,000 | 5,985,000 |
| 5.875%, due 9/30/26 | 20,805,000 | 21,642,497 |
| | | 75,709,912 |
| Miscellaneous—Manufacturing 0.8% |
| Amsted Industries, Inc. (b) | | |
| 4.625%, due 5/15/30 | 2,615,000 | 2,680,375 |
| 5.625%, due 7/1/27 | 7,240,000 | 7,629,150 |
| EnPro Industries, Inc. | | |
| 5.75%, due 10/15/26 | 4,240,000 | 4,471,504 |
| FXI Holdings, Inc. (b) | | |
| 7.875%, due 11/1/24 | 1,720,000 | 1,773,750 |
| 12.25%, due 11/15/26 | 4,206,000 | 4,842,158 |
| Hillenbrand, Inc. | | |
| 3.75%, due 3/1/31 | 2,240,000 | 2,229,315 |
| 5.75%, due 6/15/25 | 2,000,000 | 2,146,800 |
| | | 25,773,052 |
| Office Furnishings 0.1% |
| Interface, Inc. | | |
| 5.50%, due 12/1/28 (b) | 4,000,000 | 4,184,000 |
| Oil & Gas 7.3% |
| Apache Corp. | | |
| 4.625%, due 11/15/25 | 1,170,000 | 1,263,600 |
| 4.875%, due 11/15/27 | 3,130,000 | 3,389,759 |
| Ascent Resources Utica Holdings LLC (b) | | |
| 7.00%, due 11/1/26 | 3,400,000 | 3,557,114 |
| 9.00%, due 11/1/27 | 2,684,000 | 3,709,664 |
| California Resources Corp. | | |
| 7.125%, due 2/1/26 (b) | 3,500,000 | 3,683,120 |
| Callon Petroleum Co. | | |
| 6.125%, due 10/1/24 | 4,560,000 | 4,495,202 |
| 9.00%, due 4/1/25 (b) | 5,600,000 | 6,104,000 |
| Centennial Resource Production LLC (b) | | |
| 5.375%, due 1/15/26 | 4,300,000 | 4,214,000 |
The notes to the financial statements are an integral part of, and should be read in conjunction with, the financial statements.
| | Principal
Amount | Value |
| Corporate Bonds (continued) |
| Oil & Gas (continued) |
| Centennial Resource Production LLC (b) (continued) | | |
| 6.875%, due 4/1/27 | $ 5,158,000 | $ 5,274,622 |
| Chevron USA, Inc. | | |
| 4.95%, due 8/15/47 | 4,330,000 | 5,836,627 |
| 5.05%, due 11/15/44 | 2,366,000 | 3,172,705 |
| 5.25%, due 11/15/43 | 1,800,000 | 2,446,794 |
| Colgate Energy Partners III LLC | | |
| 7.75%, due 2/15/26 (b) | 5,040,000 | 5,525,100 |
| Comstock Resources, Inc. | | |
| 6.75%, due 3/1/29 (b) | 3,700,000 | 3,941,351 |
| Continental Resources, Inc. | | |
| 4.50%, due 4/15/23 | 651,000 | 677,418 |
| Encino Acquisition Partners Holdings LLC | | |
| 8.50%, due 5/1/28 (b) | 10,460,000 | 10,669,200 |
| Endeavor Energy Resources LP | | |
| 6.625%, due 7/15/25 (b) | 1,805,000 | 1,931,350 |
| EQT Corp. | | |
| 3.125%, due 5/15/26 (b) | 4,000,000 | 4,098,840 |
| 7.625%, due 2/1/25 (g) | 4,850,000 | 5,657,476 |
| Gulfport Energy Operating Corp. | | |
| 8.00%, due 5/17/26 (b) | 8,284,024 | 8,824,142 |
| Gulfport Energy Operating Corp. Escrow Claim Shares (f) | | |
| 6.00%, due 10/15/24 | 15,745,000 | 590,438 |
| 6.375%, due 5/15/25 | 8,000,000 | 300,000 |
| 6.375%, due 1/15/26 | 4,441,000 | 166,538 |
| Hilcorp Energy I LP (b) | | |
| 5.75%, due 2/1/29 | 1,610,000 | 1,678,425 |
| 6.00%, due 2/1/31 | 1,075,000 | 1,139,500 |
| Marathon Oil Corp. | | |
| 4.40%, due 7/15/27 | 5,300,000 | 6,002,854 |
| 6.80%, due 3/15/32 | 2,665,000 | 3,500,825 |
| Matador Resources Co. | | |
| 5.875%, due 9/15/26 | 2,800,000 | 2,884,000 |
| Moss Creek Resources Holdings, Inc. | | |
| 7.50%, due 1/15/26 (b) | 4,065,000 | 3,780,450 |
| Murphy Oil Corp. | | |
| 6.875%, due 8/15/24 | 3,315,000 | 3,389,587 |
| Occidental Petroleum Corp. | | |
| 2.70%, due 2/15/23 | 1,523,000 | 1,556,811 |
| 2.90%, due 8/15/24 | 3,150,000 | 3,220,875 |
| 5.55%, due 3/15/26 | 9,840,000 | 10,873,200 |
| 5.875%, due 9/1/25 | 1,500,000 | 1,668,750 |
| 6.125%, due 1/1/31 | 2,500,000 | 2,941,325 |
| 6.375%, due 9/1/28 | 1,500,000 | 1,751,250 |
| | Principal
Amount | Value |
| |
| Oil & Gas (continued) |
Occidental Petroleum Corp.
(continued) | | |
| 6.45%, due 9/15/36 | $ 3,100,000 | $ 3,706,360 |
| 6.625%, due 9/1/30 | 3,345,000 | 4,014,000 |
| 7.50%, due 5/1/31 | 1,200,000 | 1,512,000 |
| 8.00%, due 7/15/25 | 1,750,000 | 2,095,625 |
| Parkland Corp. (b) | | |
| 4.50%, due 10/1/29 (k) | 3,470,000 | 3,526,179 |
| 5.875%, due 7/15/27 | 3,130,000 | 3,336,173 |
| PBF Holding Co. LLC | | |
| 6.00%, due 2/15/28 | 8,790,000 | 6,021,150 |
| 7.25%, due 6/15/25 | 3,920,000 | 2,979,200 |
| 9.25%, due 5/15/25 (b) | 6,300,000 | 6,346,557 |
| PDC Energy, Inc. | | |
| 6.125%, due 9/15/24 | 5,783,000 | 5,914,274 |
| Range Resources Corp. | | |
| 8.25%, due 1/15/29 (b) | 1,615,000 | 1,820,913 |
| 9.25%, due 2/1/26 | 9,038,000 | 9,964,395 |
| Southwestern Energy Co. | | |
| 6.45%, due 1/23/25 (g) | 7,455,000 | 8,252,685 |
| 7.50%, due 4/1/26 | 8,000,000 | 8,470,000 |
| 8.375%, due 9/15/28 | 1,600,000 | 1,808,000 |
| Sunoco LP | | |
| 4.50%, due 5/15/29 (b) | 1,690,000 | 1,719,575 |
| 6.00%, due 4/15/27 | 2,000,000 | 2,091,500 |
| Talos Production, Inc. | | |
| 12.00%, due 1/15/26 | 19,985,000 | 21,284,025 |
| Transocean Pontus Ltd. | | |
| 6.125%, due 8/1/25 (b) | 1,924,875 | 1,947,425 |
| Transocean Poseidon Ltd. | | |
| 6.875%, due 2/1/27 (b) | 2,550,000 | 2,562,750 |
| Transocean Sentry Ltd. | | |
| 5.375%, due 5/15/23 (b) | 3,308,300 | 3,233,863 |
| Viper Energy Partners LP | | |
| 5.375%, due 11/1/27 (b) | 3,470,000 | 3,614,734 |
| | | 240,138,295 |
| Oil & Gas Services 0.5% |
| Bristow Group, Inc. | | |
| 6.875%, due 3/1/28 (b) | 5,355,000 | 5,462,100 |
| Nine Energy Service, Inc. | | |
| 8.75%, due 11/1/23 (b) | 6,897,000 | 3,517,470 |
| TechnipFMC plc | | |
| 6.50%, due 2/1/26 (b) | 6,945,000 | 7,498,971 |
| | | 16,478,541 |
The notes to the financial statements are an integral part of, and should be read in conjunction with, the financial statements.
17
Portfolio of Investments June 30, 2021† (Unaudited) (continued)
| | Principal
Amount | Value |
| Corporate Bonds (continued) |
| Packaging & Containers 0.4% |
| ARD Finance SA | | |
| 6.50% (6.50% Cash or 7.25% PIK), due 6/30/27 (a)(b) | $ 3,000,000 | $ 3,150,000 |
| Cascades USA, Inc. (b) | | |
| 5.125%, due 1/15/26 | 2,810,000 | 2,992,650 |
| 5.375%, due 1/15/28 | 5,200,000 | 5,466,500 |
| Graphic Packaging International LLC | | |
| 3.50%, due 3/1/29 (b) | 1,000,000 | 990,700 |
| | | 12,599,850 |
| Pharmaceuticals 2.3% |
| Bausch Health Americas, Inc. (b) | | |
| 8.50%, due 1/31/27 | 1,600,000 | 1,739,040 |
| 9.25%, due 4/1/26 | 1,435,000 | 1,560,850 |
| Bausch Health Cos., Inc. (b) | | |
| 5.00%, due 1/30/28 | 3,430,000 | 3,254,212 |
| 5.00%, due 2/15/29 | 1,430,000 | 1,333,475 |
| 5.25%, due 2/15/31 | 2,500,000 | 2,333,625 |
| 6.125%, due 4/15/25 | 3,392,000 | 3,476,800 |
| 6.25%, due 2/15/29 | 6,400,000 | 6,329,920 |
| 7.00%, due 1/15/28 | 1,750,000 | 1,802,500 |
| Cheplapharm Arzneimittel GmbH | | |
| 5.50%, due 1/15/28 (b) | 1,850,000 | 1,896,250 |
| Endo DAC (b) | | |
| 6.00%, due 6/30/28 | 4,575,000 | 3,085,174 |
| 9.50%, due 7/31/27 | 2,000,000 | 2,040,000 |
| Jazz Securities DAC | | |
| 4.375%, due 1/15/29 (b) | 6,000,000 | 6,220,800 |
| Organon & Co. (b) | | |
| 4.125%, due 4/30/28 | 8,200,000 | 8,362,360 |
| 5.125%, due 4/30/31 | 6,500,000 | 6,696,300 |
| Owens & Minor, Inc. | | |
| 4.50%, due 3/31/29 (b) | 3,140,000 | 3,226,350 |
| Par Pharmaceutical, Inc. | | |
| 7.50%, due 4/1/27 (b) | 6,411,000 | 6,554,158 |
| Prestige Brands, Inc. (b) | | |
| 3.75%, due 4/1/31 | 6,415,000 | 6,184,862 |
| 5.125%, due 1/15/28 | 4,245,000 | 4,468,966 |
| Vizient, Inc. | | |
| 6.25%, due 5/15/27 (b) | 3,615,000 | 3,822,862 |
| | | 74,388,504 |
| Pipelines 5.3% |
| ANR Pipeline Co. | | |
| 7.375%, due 2/15/24 | 395,000 | 457,969 |
| 9.625%, due 11/1/21 | 5,950,000 | 6,129,562 |
| | Principal
Amount | Value |
| |
| Pipelines (continued) |
| Antero Midstream Partners LP (b) | | |
| 5.375%, due 6/15/29 | $ 2,000,000 | $ 2,085,000 |
| 5.75%, due 1/15/28 | 1,565,000 | 1,646,803 |
| Cheniere Energy Partners LP | | |
| 4.00%, due 3/1/31 (b) | 6,400,000 | 6,688,000 |
| 5.625%, due 10/1/26 | 1,800,000 | 1,867,500 |
| CNX Midstream Partners LP | | |
| 6.50%, due 3/15/26 (b) | 6,022,000 | 6,317,078 |
| DT Midstream, Inc. (b) | | |
| 4.125%, due 6/15/29 | 1,355,000 | 1,375,772 |
| 4.375%, due 6/15/31 | 2,975,000 | 3,039,825 |
| Enable Midstream Partners LP | | |
| 4.15%, due 9/15/29 | 2,260,000 | 2,474,522 |
| 4.40%, due 3/15/27 | 5,702,000 | 6,286,317 |
| 4.95%, due 5/15/28 | 2,925,000 | 3,349,017 |
| EQM Midstream Partners LP | | |
| 4.50%, due 1/15/29 (b) | 1,880,000 | 1,912,670 |
| 4.75%, due 1/15/31 (b) | 2,700,000 | 2,782,188 |
| 5.50%, due 7/15/28 | 720,000 | 778,018 |
| 6.00%, due 7/1/25 (b) | 2,975,000 | 3,235,312 |
| 6.50%, due 7/1/27 (b) | 1,405,000 | 1,566,575 |
| Genesis Energy LP | | |
| 6.25%, due 5/15/26 | 2,716,000 | 2,722,790 |
| 6.50%, due 10/1/25 | 1,600,000 | 1,616,000 |
| 7.75%, due 2/1/28 | 470,000 | 485,717 |
| 8.00%, due 1/15/27 | 5,375,000 | 5,647,109 |
| Harvest Midstream I LP | | |
| 7.50%, due 9/1/28 (b) | 5,530,000 | 6,005,580 |
| Hess Midstream Operations LP | | |
| 5.625%, due 2/15/26 (b) | 3,300,000 | 3,441,900 |
| Holly Energy Partners LP | | |
| 5.00%, due 2/1/28 (b) | 2,845,000 | 2,909,012 |
| ITT Holdings LLC | | |
| 6.50%, due 8/1/29 (b) | 2,250,000 | 2,292,187 |
| MPLX LP | | |
| 4.875%, due 12/1/24 | 5,000,000 | 5,595,267 |
| 4.875%, due 6/1/25 | 6,708,000 | 7,572,199 |
| New Fortress Energy, Inc. | | |
| 6.50%, due 9/30/26 (b)(k) | 5,060,000 | 5,170,308 |
| NGL Energy Operating LLC | | |
| 7.50%, due 2/1/26 (b) | 3,015,000 | 3,165,750 |
| NGPL PipeCo LLC | | |
| 4.875%, due 8/15/27 (b) | 5,280,000 | 6,047,390 |
| Northwest Pipeline LLC | | |
| 7.125%, due 12/1/25 | 2,195,000 | 2,664,571 |
| Oasis Midstream Partners LP | | |
| 8.00%, due 4/1/29 (b) | 2,150,000 | 2,285,558 |
The notes to the financial statements are an integral part of, and should be read in conjunction with, the financial statements.
| | Principal
Amount | Value |
| Corporate Bonds (continued) |
| Pipelines (continued) |
| PBF Logistics LP | | |
| 6.875%, due 5/15/23 | $ 1,200,000 | $ 1,179,000 |
| Plains All American Pipeline LP | | |
| Series B | | |
| 6.125%, due 11/15/22 (l)(m) | 14,265,000 | 12,598,848 |
| Rockies Express Pipeline LLC (b) | | |
| 3.60%, due 5/15/25 | 2,000,000 | 2,034,400 |
| 4.80%, due 5/15/30 | 5,000,000 | 4,989,350 |
| Ruby Pipeline LLC | | |
| 8.00%, due 4/1/22 (b)(g) | 13,334,545 | 12,142,379 |
| Tallgrass Energy Partners LP (b) | | |
| 5.50%, due 9/15/24 | 6,327,000 | 6,413,174 |
| 6.00%, due 3/1/27 | 1,500,000 | 1,545,000 |
| Targa Resources Partners LP | | |
| 5.875%, due 4/15/26 | 4,915,000 | 5,162,274 |
| TransMontaigne Partners LP | | |
| 6.125%, due 2/15/26 | 8,055,000 | 8,236,237 |
| Western Midstream Operating LP | | |
| 4.35%, due 2/1/25 (g) | 1,600,000 | 1,690,544 |
| 4.65%, due 7/1/26 | 2,000,000 | 2,134,360 |
| 5.50%, due 8/15/48 | 6,360,000 | 6,922,160 |
| | | 174,661,192 |
| Real Estate 0.7% |
| Howard Hughes Corp. (The) (b) | | |
| 4.125%, due 2/1/29 | 3,300,000 | 3,300,066 |
| 4.375%, due 2/1/31 | 2,000,000 | 1,992,760 |
| Newmark Group, Inc. | | |
| 6.125%, due 11/15/23 | 9,839,000 | 10,823,519 |
| Realogy Group LLC | | |
| 5.75%, due 1/15/29 (b) | 5,750,000 | 6,010,993 |
| | | 22,127,338 |
| Real Estate Investment Trusts 3.0% |
| CTR Partnership LP | | |
| 3.875%, due 6/30/28 (b) | 3,345,000 | 3,415,646 |
| GLP Capital LP | | |
| 5.30%, due 1/15/29 | 5,700,000 | 6,640,500 |
| 5.375%, due 11/1/23 | 1,500,000 | 1,629,960 |
| 5.375%, due 4/15/26 | 1,506,000 | 1,733,421 |
| 5.75%, due 6/1/28 | 2,000,000 | 2,379,717 |
| Host Hotels & Resorts LP | | |
| Series I | | |
| 3.50%, due 9/15/30 | 2,100,000 | 2,203,677 |
| MGM Growth Properties Operating Partnership LP | | |
| 3.875%, due 2/15/29 (b) | 8,495,000 | 8,627,267 |
| | Principal
Amount | Value |
| |
| Real Estate Investment Trusts (continued) |
| MGM Growth Properties Operating Partnership LP (continued) | | |
| 4.625%, due 6/15/25 (b) | $ 3,100,000 | $ 3,311,947 |
| 5.625%, due 5/1/24 | 19,120,000 | 20,706,050 |
| 5.75%, due 2/1/27 | 6,315,000 | 7,026,195 |
| MPT Operating Partnership LP | | |
| 3.50%, due 3/15/31 | 4,000,000 | 4,039,960 |
| 4.625%, due 8/1/29 | 3,000,000 | 3,211,380 |
| 5.00%, due 10/15/27 | 7,726,000 | 8,190,255 |
| Park Intermediate Holdings LLC | | |
| 4.875%, due 5/15/29 (b) | 4,550,000 | 4,706,748 |
| RHP Hotel Properties LP | | |
| 4.50%, due 2/15/29 (b) | 3,650,000 | 3,652,993 |
| 4.75%, due 10/15/27 | 6,175,000 | 6,342,034 |
| SBA Communications Corp. | | |
| 3.125%, due 2/1/29 (b) | 4,500,000 | 4,338,298 |
| 3.875%, due 2/15/27 | 3,000,000 | 3,080,715 |
| VICI Properties LP | | |
| 4.125%, due 8/15/30 (b) | 1,000,000 | 1,026,820 |
| XHR LP | | |
| 4.875%, due 6/1/29 (b) | 1,655,000 | 1,708,788 |
| | | 97,972,371 |
| Retail 3.8% |
| 1011778 BC ULC (b) | | |
| 3.50%, due 2/15/29 | 3,920,000 | 3,871,000 |
| 3.875%, due 1/15/28 | 3,340,000 | 3,381,750 |
| 4.00%, due 10/15/30 | 10,155,000 | 9,824,962 |
| Asbury Automotive Group, Inc. | | |
| 4.50%, due 3/1/28 | 4,631,000 | 4,758,352 |
| 4.75%, due 3/1/30 | 4,182,000 | 4,370,190 |
| CEC Entertainment LLC | | |
| 6.75%, due 5/1/26 (b) | 3,435,000 | 3,525,169 |
| Dave & Buster's, Inc. | | |
| 7.625%, due 11/1/25 (b) | 3,350,000 | 3,605,438 |
| Group 1 Automotive, Inc. | | |
| 4.00%, due 8/15/28 (b) | 2,250,000 | 2,289,375 |
| Ken Garff Automotive LLC | | |
| 4.875%, due 9/15/28 (b) | 5,885,000 | 6,002,700 |
| KFC Holding Co. | | |
| 4.75%, due 6/1/27 (b) | 5,275,000 | 5,518,969 |
| LCM Investments Holdings II LLC | | |
| 4.875%, due 5/1/29 (b) | 7,850,000 | 8,046,250 |
| Lithia Motors, Inc. (b) | | |
| 3.875%, due 6/1/29 | 2,000,000 | 2,073,100 |
| 4.375%, due 1/15/31 | 2,000,000 | 2,142,220 |
| 4.625%, due 12/15/27 | 700,000 | 740,320 |
The notes to the financial statements are an integral part of, and should be read in conjunction with, the financial statements.
19
Portfolio of Investments June 30, 2021† (Unaudited) (continued)
| | Principal
Amount | Value |
| Corporate Bonds (continued) |
| Retail (continued) |
| Murphy Oil USA, Inc. | | |
| 4.75%, due 9/15/29 | $ 3,000,000 | $ 3,156,600 |
| 5.625%, due 5/1/27 | 2,994,000 | 3,158,670 |
| NMG Holding Co., Inc. | | |
| 7.125%, due 4/1/26 (b) | 16,000,000 | 17,080,000 |
| Penske Automotive Group, Inc. | | |
| 3.50%, due 9/1/25 | 3,945,000 | 4,086,231 |
| PetSmart, Inc. | | |
| 7.75%, due 2/15/29 (b) | 4,005,000 | 4,415,513 |
| TPro Acquisition Corp. | | |
| 11.00%, due 10/15/24 (b) | 1,500,000 | 1,650,000 |
| Ultra Resources, Inc. Escrow Claim Shares | | |
| 6.875%, due 4/15/22 (c)(d)(e)(f) | 9,675,000 | — |
| Yum! Brands, Inc. | | |
| 3.625%, due 3/15/31 | 9,150,000 | 9,104,250 |
| 4.625%, due 1/31/32 | 9,750,000 | 10,237,500 |
| 4.75%, due 1/15/30 (b) | 8,767,000 | 9,490,365 |
| | | 122,528,924 |
| Software 3.9% |
| ACI Worldwide, Inc. | | |
| 5.75%, due 8/15/26 (b) | 4,405,000 | 4,619,744 |
| Ascend Learning LLC | | |
| 6.875%, due 8/1/25 (b) | 7,485,000 | 7,589,341 |
| BY Crown Parent LLC (b) | | |
| 4.25%, due 1/31/26 | 4,355,000 | 4,561,863 |
| 7.375%, due 10/15/24 | 7,110,000 | 7,237,980 |
| Camelot Finance SA | | |
| 4.50%, due 11/1/26 (b) | 4,480,000 | 4,687,200 |
| CDK Global, Inc. | | |
| 5.25%, due 5/15/29 (b) | 2,000,000 | 2,182,820 |
| Change Healthcare Holdings LLC | | |
| 5.75%, due 3/1/25 (b) | 2,300,000 | 2,337,375 |
| Clarivate Science Holdings Corp. (b) | | |
| 3.875%, due 6/30/28 | 5,060,000 | 5,106,097 |
| 4.875%, due 6/30/29 | 7,425,000 | 7,619,906 |
| Fair Isaac Corp. | | |
| 5.25%, due 5/15/26 (b) | 3,590,000 | 4,038,750 |
| MSCI, Inc. (b) | | |
| 3.625%, due 9/1/30 | 8,215,000 | 8,401,152 |
| 3.625%, due 11/1/31 | 8,300,000 | 8,513,310 |
| 3.875%, due 2/15/31 | 10,620,000 | 11,021,011 |
| 4.00%, due 11/15/29 | 9,500,000 | 10,022,500 |
| 5.375%, due 5/15/27 | 6,230,000 | 6,634,950 |
| Open Text Corp. (b) | | |
| 3.875%, due 2/15/28 | 4,560,000 | 4,622,928 |
| | Principal
Amount | Value |
| |
| Software (continued) |
| Open Text Corp. (b) (continued) | | |
| 5.875%, due 6/1/26 | $ 5,675,000 | $ 5,874,930 |
| Open Text Holdings, Inc. | | |
| 4.125%, due 2/15/30 (b) | 5,969,000 | 6,087,186 |
| PTC, Inc. (b) | | |
| 3.625%, due 2/15/25 | 3,400,000 | 3,502,000 |
| 4.00%, due 2/15/28 | 6,250,000 | 6,456,250 |
| SS&C Technologies, Inc. | | |
| 5.50%, due 9/30/27 (b) | 5,000,000 | 5,298,500 |
| Veritas US, Inc. | | |
| 7.50%, due 9/1/25 (b) | 2,000,000 | 2,082,500 |
| | | 128,498,293 |
| Telecommunications 5.0% |
| Altice France SA | | |
| 7.375%, due 5/1/26 (b) | 3,108,000 | 3,232,102 |
| CommScope Technologies LLC | | |
| 6.00%, due 6/15/25 (b) | 1,300,000 | 1,327,625 |
| CommScope, Inc. | | |
| 8.25%, due 3/1/27 (b) | 8,924,000 | 9,537,971 |
| Connect Finco SARL | | |
| 6.75%, due 10/1/26 (b) | 12,365,000 | 13,075,988 |
| Hughes Satellite Systems Corp. | | |
| 5.25%, due 8/1/26 | 7,035,000 | 7,880,466 |
| 6.625%, due 8/1/26 | 6,460,000 | 7,243,275 |
| Level 3 Financing, Inc. | | |
| 3.75%, due 7/15/29 (b) | 3,000,000 | 2,917,500 |
| 5.375%, due 5/1/25 | 6,300,000 | 6,433,875 |
| Lumen Technologies, Inc. | | |
| Series T | | |
| 5.80%, due 3/15/22 | 9,390,000 | 9,663,155 |
| QualityTech LP | | |
| 3.875%, due 10/1/28 (b) | 4,500,000 | 4,812,300 |
| Sprint Capital Corp. | | |
| 6.875%, due 11/15/28 | 31,465,000 | 40,353,862 |
| Sprint Corp. | | |
| 7.875%, due 9/15/23 | 14,030,000 | 15,939,146 |
| T-Mobile US, Inc. | | |
| 2.625%, due 2/15/29 | 4,000,000 | 3,950,000 |
| 2.875%, due 2/15/31 | 8,160,000 | 8,098,800 |
| 3.375%, due 4/15/29 (b) | 3,630,000 | 3,746,137 |
| 3.50%, due 4/15/31 (b) | 2,500,000 | 2,586,375 |
| 4.50%, due 2/1/26 | 3,345,000 | 3,408,956 |
| 4.75%, due 2/1/28 | 9,585,000 | 10,267,931 |
| 5.375%, due 4/15/27 | 8,875,000 | 9,449,124 |
| | | 163,924,588 |
The notes to the financial statements are an integral part of, and should be read in conjunction with, the financial statements.
| | Principal
Amount | Value |
| Corporate Bonds (continued) |
| Toys, Games & Hobbies 0.3% |
| Mattel, Inc. (b) | | |
| 3.375%, due 4/1/26 | $ 3,200,000 | $ 3,320,000 |
| 3.75%, due 4/1/29 | 3,000,000 | 3,120,000 |
| 6.75%, due 12/31/25 | 3,453,000 | 3,628,067 |
| | | 10,068,067 |
| Transportation 0.4% |
| Teekay Corp. | | |
| 9.25%, due 11/15/22 (b) | 1,500,000 | 1,549,688 |
| Watco Cos. LLC | | |
| 6.50%, due 6/15/27 (b) | 10,340,000 | 11,063,800 |
| | | 12,613,488 |
Total Corporate Bonds
(Cost $2,764,175,432) | | 2,921,092,761 |
| Loan Assignments 2.7% |
| Aerospace & Defense 0.1% |
| TransDigm, Inc. | |
| Tranche Refinancing Term Loan F | |
| 2.354% (1 Month LIBOR + 2.25%), due 12/9/25 (n) | 1,623,758 | 1,598,498 |
| Automobile 0.2% |
| Dealer Tire LLC | |
| Term Loan B1 | |
| 4.354% (1 Month LIBOR + 4.25%), due 1/1/38 (n) | 5,910,000 | 5,907,045 |
| Wheel Pros, Inc. | |
| First Lien Initial Term Loan | |
| 5.25% (1 Month LIBOR + 4.50%), due 5/11/28 (n) | 2,000,000 | 2,003,612 |
| | | 7,910,657 |
| Beverage, Food & Tobacco 0.2% |
| United Natural Foods, Inc. | |
| Initial Term Loan | |
| 3.604% (1 Month LIBOR + 3.50%), due 10/22/25 (n) | 5,336,358 | 5,336,358 |
| Chemicals, Plastics & Rubber 0.3% |
| Innophos Holdings, Inc. | |
| Initial Term Loan | |
| 3.604% (1 Month LIBOR + 3.50%), due 2/5/27 (n) | 1,876,250 | 1,871,560 |
| | Principal
Amount | Value |
| |
| Chemicals, Plastics & Rubber (continued) |
| Jazz Pharmaceuticals plc | |
| Initial Dollar Term Loan | |
| 4.00% (1 Month LIBOR + 3.50%), due 5/5/28 (n) | $ 6,300,000 | $ 6,322,497 |
| | | 8,194,057 |
| Finance 0.4% |
| AAdvantage Loyality IP Ltd. | |
| Initial Term Loan | |
| 5.50% (3 Month LIBOR + 4.75%), due 4/20/28 (n) | 2,000,000 | 2,084,062 |
| American Trailer World Corp. | |
| First Lien Initial Term Loan | |
| 4.50% (1 Month LIBOR + 3.75%), due 3/3/28 (n) | 3,600,000 | 3,592,501 |
| BY Crown Parent LLC | |
| Initial Term Loan B1 | |
| 4.00% (1 Month LIBOR + 3.00%), due 2/2/26 (n) | 1,188,039 | 1,186,554 |
| Schweitzer-Mauduit International, Inc. | |
| Term Loan B | |
| 4.50% (1 Month LIBOR + 3.75%), due 2/9/28 | 5,250,000 | 5,171,250 |
| | | 12,034,367 |
| Healthcare, Education & Childcare 0.1% |
| LifePoint Health, Inc. | |
| First Lien Term Loan B | |
| 3.854% (1 Month LIBOR + 3.75%), due 11/16/25 (n) | 3,000,000 | 2,992,500 |
| Manufacturing 0.2% |
| Adient US LLC | |
| Term Loan B1 | |
| 3.604% (1 Month LIBOR + 3.5%), due 4/10/28 (n) | 3,800,000 | 3,802,375 |
| Madison IAQ LLC | |
| Term Loan | |
| 3.75% (3 Month LIBOR + 3.25%), due 6/21/28 (n) | 3,000,000 | 3,000,750 |
| | | 6,803,125 |
| Oil & Gas 0.2% |
| Ascent Resources Utica Holdings LLC | |
| Second Lien Term Loan | |
| 10.00% (3 Month LIBOR + 9.00%), due 11/1/25 (n) | 2,842,000 | 3,134,490 |
The notes to the financial statements are an integral part of, and should be read in conjunction with, the financial statements.
21
Portfolio of Investments June 30, 2021† (Unaudited) (continued)
| | Principal
Amount | Value |
| Loan Assignments (continued) |
| Oil & Gas (continued) |
| PetroQuest Energy LLC (c)(d)(e) | |
| Term Loan | |
| 8.50% (8.50% PIK), (1 Month LIBOR + 7.50%), due 11/8/23 (n) | $ 5,501,561 | $ 4,401,249 |
| 2020 Term Loan | |
| 8.50% (8.50% PIK),, due 9/19/26 | 529,542 | 529,542 |
| | | 8,065,281 |
| Personal & Nondurable Consumer Products 0.6% |
| Great Outdoors Group LLC | |
| Term Loan B1 | |
| 5.00% (3 Month LIBOR + 4.25%), due 3/6/28 (n) | 20,198,500 | 20,299,493 |
| Utilities 0.4% |
| PG&E Corp. | |
| Term Loan | |
| 3.50% (3 Month LIBOR + 3.00%), due 6/23/25 (n) | 13,365,000 | 13,175,658 |
Total Loan Assignments
(Cost $86,327,331) | | 86,409,994 |
Total Long-Term Bonds
(Cost $2,870,626,587) | | 3,029,146,592 |
| |
| | Shares | |
| Common Stocks 1.9% |
| Commercial Services & Supplies 0.1% |
| ATD New Holdings, Inc. (c)(d)(o) | 44,740 | 2,538,995 |
| Electric Utilities 0.0% ‡ |
| Keycon Power Holdings LLC (c)(d)(e)(o) | 11,280 | 113 |
| Electrical Equipment 0.3% |
| Energy Technologies, Inc. (c)(d)(e)(o) | 4,822 | 9,523,450 |
| Hotels, Restaurants & Leisure 0.0% ‡ |
| Carlson Travel, Inc. (c)(e)(j)(o) | 6,281 | — |
| Independent Power and Renewable Electricity Producers 0.4% |
| GenOn Energy, Inc. (c)(j) | 115,826 | 12,451,295 |
| | Shares | | Value |
| |
| Metals & Mining 0.0% ‡ |
| Neenah Enterprises, Inc. (c)(d)(e)(j)(o) | 230,859 | | $ 2,428,637 |
| Oil, Gas & Consumable Fuels 1.1% |
| California Resources Corp. (o) | 55,317 | | 1,667,254 |
| Gulfport Energy Operating Corp. (o) | 311,067 | | 20,126,035 |
| PetroQuest Energy, Inc. (c)(d)(e)(o) | 8,224,665 | | — |
| Talos Energy, Inc. (o) | 637,880 | | 9,976,443 |
| Titan Energy LLC (c)(d)(e)(o) | 25,911 | | — |
| Whiting Petroleum Corp. (o) | 80,669 | | 4,400,494 |
| | | | 36,170,226 |
| Software 0.0% ‡ |
| ASG warrant corp. (c)(d)(e)(o) | 3,368 | | — |
Total Common Stocks
(Cost $84,957,573) | | | 63,112,716 |
| Preferred Stocks 0.4% |
| Electrical Equipment 0.3% |
| Energy Technologies Ltd., 0.000 (c)(d)(e)(o) | 10,741 | | 8,646,505 |
| Oil, Gas & Consumable Fuels 0.1% |
| Gulfport Energy Operating Corp., 10.00% (o) | 1,037 | | 4,744,275 |
Total Preferred Stocks
(Cost $15,122,430) | | | 13,390,780 |
| |
| | Number of
Warrants | | |
| Warrant 0.0% ‡ |
| Oil, Gas & Consumable Fuels 0.0% ‡ |
| California Resources Corp. | | | |
| Expires 10/27/24 (o) | 9,742 | | 74,819 |
Total Warrant
(Cost $3,897) | | | 74,819 |
Total Investments
(Cost $2,970,710,487) | 95.0% | | 3,105,724,907 |
| Other Assets, Less Liabilities | 5.0 | | 164,053,582 |
| Net Assets | 100.0% | | $ 3,269,778,489 |
| † | Percentages indicated are based on Portfolio net assets. |
| ‡ | Less than one-tenth of a percent. |
| (a) | PIK ("Payment-in-Kind")—issuer may pay interest or dividends with additional securities and/or in cash. |
The notes to the financial statements are an integral part of, and should be read in conjunction with, the financial statements.
| (b) | May be sold to institutional investors only under Rule 144A or securities offered pursuant to Section 4(a)(2) of the Securities Act of 1933, as amended. |
| (c) | Fair valued security—Represents fair value as measured in good faith under procedures approved by the Board of Trustees. As of June 30, 2021, the total market value was $51,077,186, which represented 1.6% of the Portfolio’s net assets. |
| (d) | Illiquid security—As of June 30, 2021, the total market value deemed illiquid under procedures approved by the Board of Trustees was $41,842,522, which represented 1.3% of the Portfolio’s net assets. |
| (e) | Security in which significant unobservable inputs (Level 3) were used in determining fair value. |
| (f) | Issue in non-accrual status. |
| (g) | Step coupon—Rate shown was the rate in effect as of June 30, 2021. |
| (h) | Issue in default. |
| (i) | Coupon rate may change based on changes of the underlying collateral or prepayments of principal. Rate shown was the rate in effect as of June 30, 2021. |
| (j) | Restricted security. (See Note 6) |
| (k) | Delayed delivery security. |
| (l) | Fixed to floating rate—Rate shown was the rate in effect as of June 30, 2021. |
| (m) | Security is perpetual and, thus, does not have a predetermined maturity date. The date shown, if applicable, reflects the next call date. |
| (n) | Floating rate—Rate shown was the rate in effect as of June 30, 2021. |
| (o) | Non-income producing security. |
| Abbreviation(s): |
| LIBOR—London Interbank Offered Rate |
The following is a summary of the fair valuations according to the inputs used as of June 30, 2021, for valuing the Portfolio’s assets:
| Description | Quoted
Prices in
Active
Markets for
Identical
Assets
(Level 1) | | Significant
Other
Observable
Inputs
(Level 2) | | Significant
Unobservable
Inputs
(Level 3) | | Total |
| Asset Valuation Inputs | | | | | | | |
| Investments in Securities (a) | | | | | | | |
| Long-Term Bonds | | | | | | | |
| Convertible Bonds | $ — | | $ 21,643,837 | | $ — | | $ 21,643,837 |
| Corporate Bonds | — | | 2,910,535,361 | | 10,557,400 | | 2,921,092,761 |
| Loan Assignments | — | | 81,479,203 | | 4,930,791 | | 86,409,994 |
| Total Long-Term Bonds | — | | 3,013,658,401 | | 15,488,191 | | 3,029,146,592 |
| Common Stocks | 36,170,226 | | 14,990,290 | | 11,952,200 | | 63,112,716 |
| Preferred Stocks | — | | 4,744,275 | | 8,646,505 | | 13,390,780 |
| Warrant | 74,819 | | — | | — | | 74,819 |
| Total Investments in Securities | $ 36,245,045 | | $ 3,033,392,966 | | $ 36,086,896 | | $ 3,105,724,907 |
| (a) | For a complete listing of investments and their industries, see the Portfolio of Investments. |
The notes to the financial statements are an integral part of, and should be read in conjunction with, the financial statements.
23
Portfolio of Investments June 30, 2021† (Unaudited) (continued)
The following is a reconciliation of investments in which significant unobservable inputs (Level 3) were used in determining value:
Investments in
Securities | Balance
as of
December 31,
2020 | | Accrued
Discounts
(Premiums) | | Realized
Gain
(Loss) | | Change in
Unrealized
Appreciation
(Depreciation) | | Purchases | | Sales | | Transfers
in to
Level 3 | | Transfers
out of
Level 3 | | Balance
as of
June 30,
2021 | | Change in
Unrealized
Appreciation
(Depreciation)
from
Investments
Still Held as
of June 30,
2021 |
| Long-Term Bonds | | | | | | | | | | | | | | | | | | | |
| Corporate Bonds | $10,874,686 | | $3,045,269 | | $ — | | $ 10,199,107 | | $ — | | $(13,561,662) | | $ — | | $— | | $10,557,400 | | $ (387,869) |
| Loan Assignments | 4,290,785 | | — | | — | | (158,433) | | 287,619 | | — | | 510,820 | | — | | 4,930,791 | | (158,433) |
| Common Stocks | 10,866,455 | | — | | 667,348 | | (12,510,231) | | 13,594,162 | | (667,348) | | 1,814 | | — | | 11,952,200 | | (11,936,031) |
| Preferred Stock | 8,109,455 | | — | | — | | 537,050 | | — | | — | | — | | — | | 8,646,505 | | 537,050 |
| Total | $34,141,381 | | $3,045,269 | | $667,348 | | $ (1,932,507) | | $13,881,781 | | $(14,229,010) | | $512,634 | | $— | | $36,086,896 | | $(11,945,283) |
As of June 30, 2021, a Loan Assignment with a market value of $510,820 transferred from Level 2 to Level 3 as the the fair value for this Loan Assignment utilized significant unobservable inputs. As of December 31, 2020, the fair value obtained for this Loan Assignment utilized significant other observable inputs.
As of June 30, 2021, Common Stocks with a market value of $1,814 transferred from Level 1 to Level 3 as the the fair value for these Common Stocks utilized significant unobservable inputs. As of December 31, 2020, the fair value obtained for these Common Stocks utilized significant other observable inputs.
The notes to the financial statements are an integral part of, and should be read in conjunction with, the financial statements.
Statement of Assets and Liabilities as of June 30, 2021 (Unaudited)
| Assets |
Investment in securities, at value
(identified cost $2,970,710,487) | $3,105,724,907 |
| Cash | 150,589,172 |
| Due from custodian | 1,295,511 |
| Receivables: | |
| Interest | 43,742,586 |
| Investment securities sold | 3,218,012 |
| Other assets | 53,847 |
| Total assets | 3,304,624,035 |
| Liabilities |
| Payables: | |
| Investment securities purchased | 31,217,199 |
| Manager (See Note 3) | 1,481,698 |
| Portfolio shares redeemed | 1,150,504 |
| NYLIFE Distributors (See Note 3) | 560,334 |
| Shareholder communication | 279,751 |
| Professional fees | 130,268 |
| Custodian | 25,637 |
| Trustees | 155 |
| Total liabilities | 34,845,546 |
| Net assets | $3,269,778,489 |
| Composition of Net Assets |
| Shares of beneficial interest outstanding (par value of $.001 per share) unlimited number of shares authorized | $ 322,152 |
| Additional paid-in-capital | 3,034,148,758 |
| | 3,034,470,910 |
| Total distributable earnings (loss) | 235,307,579 |
| Net assets | $3,269,778,489 |
| Initial Class | |
| Net assets applicable to outstanding shares | $ 527,381,138 |
| Shares of beneficial interest outstanding | 51,206,296 |
| Net asset value per share outstanding | $ 10.30 |
| Service Class | |
| Net assets applicable to outstanding shares | $2,742,397,351 |
| Shares of beneficial interest outstanding | 270,945,867 |
| Net asset value per share outstanding | $ 10.12 |
The notes to the financial statements are an integral part of, and should be read in conjunction with, the financial statements.
25
Statement of Operations for the six months ended June 30, 2021 (Unaudited)
| Investment Income (Loss) |
| Income | |
| Interest | $ 84,296,017 |
| Dividends | 1,355,149 |
| Securities lending | 353 |
| Other | 47,190 |
| Total income | 85,698,709 |
| Expenses | |
| Manager (See Note 3) | 8,683,459 |
| Distribution/Service—Service Class (See Note 3) | 3,314,628 |
| Professional fees | 159,229 |
| Shareholder communication | 149,935 |
| Trustees | 31,923 |
| Custodian | 22,594 |
| Miscellaneous | 39,183 |
| Total expenses | 12,400,951 |
| Net investment income (loss) | 73,297,758 |
| Realized and Unrealized Gain (Loss) |
| Net realized gain (loss) on investments | 32,587,249 |
| Net change in unrealized appreciation (depreciation) on investments | 17,255,865 |
| Net realized and unrealized gain (loss) | 49,843,114 |
| Net increase (decrease) in net assets resulting from operations | $123,140,872 |
The notes to the financial statements are an integral part of, and should be read in conjunction with, the financial statements.
Statements of Changes in Net Assets
for the six months ended June 30, 2021 (Unaudited) and the year ended December 31, 2020
| | 2021 | 2020 |
| Increase (Decrease) in Net Assets |
| Operations: | | |
| Net investment income (loss) | $ 73,297,758 | $ 155,731,043 |
| Net realized gain (loss) | 32,587,249 | (85,686,820) |
| Net change in unrealized appreciation (depreciation) | 17,255,865 | 71,065,568 |
| Net increase (decrease) in net assets resulting from operations | 123,140,872 | 141,109,791 |
| Distributions to shareholders: | | |
| Initial Class | — | (25,417,401) |
| Service Class | — | (140,197,619) |
| Total distributions to shareholders | — | (165,615,020) |
| Capital share transactions: | | |
| Net proceeds from sales of shares | 165,372,196 | 362,905,712 |
| Net asset value of shares issued to shareholder in reinvestment of distributions | — | 165,615,020 |
| Cost of shares redeemed | (94,543,394) | (457,051,427) |
| Increase (decrease) in net assets derived from capital share transactions | 70,828,802 | 71,469,305 |
| Net increase (decrease) in net assets | 193,969,674 | 46,964,076 |
| Net Assets |
| Beginning of period | 3,075,808,815 | 3,028,844,739 |
| End of period | $3,269,778,489 | $3,075,808,815 |
The notes to the financial statements are an integral part of, and should be read in conjunction with, the financial statements.
27
Financial Highlights selected per share data and ratios
| | Six months ended
June 30,
2021* | | Year Ended December 31, |
| Initial Class | 2020 | | 2019 | | 2018 | | 2017 | | 2016 |
| Net asset value at beginning of period | $ 9.89 | | $ 9.96 | | $ 9.32 | | $ 10.05 | | $ 9.99 | | $ 9.10 |
| Net investment income (loss) (a) | 0.25 | | 0.54 | | 0.58 | | 0.55 | | 0.58 | | 0.62 |
| Net realized and unrealized gain (loss) on investments | 0.16 | | (0.04) | | 0.64 | | (0.68) | | 0.10 | | 0.85 |
| Total from investment operations | 0.41 | | 0.50 | | 1.22 | | (0.13) | | 0.68 | | 1.47 |
| Less distributions: | | | | | | | | | | | |
| From net investment income | — | | (0.57) | | (0.58) | | (0.60) | | (0.62) | | (0.58) |
| Net asset value at end of period | $ 10.30 | | $ 9.89 | | $ 9.96 | | $ 9.32 | | $ 10.05 | | $ 9.99 |
| Total investment return (b) | 4.15%(c) | | 5.40% | | 13.22% | | (1.46)% | | 6.86% | | 16.23% |
| Ratios (to average net assets)/Supplemental Data: | | | | | | | | | | | |
| Net investment income (loss) | 4.90%†† | | 5.56% | | 5.84% | | 5.58% | | 5.69% | | 6.41% |
| Net expenses | 0.58%†† | | 0.59%(d) | | 0.59%(d) | | 0.58%(d) | | 0.58%(d) | | 0.59%(d) |
| Portfolio turnover rate | 22% | | 39% | | 28% | | 28% | | 40% | | 39% |
| Net assets at end of period (in 000’s) | $ 527,381 | | $ 461,075 | | $ 471,775 | | $ 458,129 | | $ 574,162 | | $ 665,881 |
| * | Unaudited. |
| †† | Annualized. |
| (a) | Per share data based on average shares outstanding during the period. |
| (b) | Total return does not reflect any deduction of sales charges, mortality and expense charges, contract charges or administrative charges. For periods of less than one year, total return is not annualized. |
| (c) | Total investment return may reflect adjustments to conform to generally accepted accounting principles. |
| (d) | In addition to the fees and expenses which the Portfolio bears directly, it also indirectly bears a pro-rata share of the fees and expenses of the underlying funds in which it invests. Such indirect expenses are not included in the above expense ratios. |
| | Six months ended
June 30,
2021* | | Year Ended December 31, |
| Service Class | 2020 | | 2019 | | 2018 | | 2017 | | 2016 |
| Net asset value at beginning of period | $ 9.74 | | $ 9.81 | | $ 9.19 | | $ 9.91 | | $ 9.86 | | $ 8.99 |
| Net investment income (loss) (a) | 0.23 | | 0.50 | | 0.55 | | 0.52 | | 0.55 | | 0.59 |
| Net realized and unrealized gain (loss) on investments | 0.15 | | (0.02) | | 0.62 | | (0.66) | | 0.10 | | 0.83 |
| Total from investment operations | 0.38 | | 0.48 | | 1.17 | | (0.14) | | 0.65 | | 1.42 |
| Less distributions: | | | | | | | | | | | |
| From net investment income | — | | (0.55) | | (0.55) | | (0.58) | | (0.60) | | (0.55) |
| Net asset value at end of period | $ 10.12 | | $ 9.74 | | $ 9.81 | | $ 9.19 | | $ 9.91 | | $ 9.86 |
| Total investment return (b) | 4.00%(c) | | 5.14% | | 12.94% | | (1.71)% | | 6.59% | | 15.94% |
| Ratios (to average net assets)/Supplemental Data: | | | | | | | | | | | |
| Net investment income (loss) | 4.66%†† | | 5.31% | | 5.60% | | 5.33% | | 5.43% | | 6.15% |
| Net expenses | 0.83%†† | | 0.84%(d) | | 0.84%(d) | | 0.83%(d) | | 0.83%(d) | | 0.84%(d) |
| Portfolio turnover rate | 22% | | 39% | | 28% | | 28% | | 40% | | 39% |
| Net assets at end of period (in 000’s) | $ 2,742,397 | | $ 2,614,734 | | $ 2,557,069 | | $ 2,298,144 | | $ 2,528,783 | | $ 2,315,441 |
| * | Unaudited. |
| †† | Annualized. |
| (a) | Per share data based on average shares outstanding during the period. |
| (b) | Total return does not reflect any deduction of sales charges, mortality and expense charges, contract charges or administrative charges. For periods of less than one year, total return is not annualized. |
| (c) | Total investment return may reflect adjustments to conform to generally accepted accounting principles. |
| (d) | In addition to the fees and expenses which the Portfolio bears directly, it also indirectly bears a pro-rata share of the fees and expenses of the underlying funds in which it invests. Such indirect expenses are not included in the above expense ratios. |
The notes to the financial statements are an integral part of, and should be read in conjunction with, the financial statements.
Notes to Financial Statements (Unaudited)
Note 1–Organization and Business
MainStay VP Funds Trust (the “Fund”) was organized as a Delaware statutory trust on February 1, 2011. The Fund is registered under the Investment Company Act of 1940, as amended (the “1940 Act”), as an open-end management investment company. The Fund is comprised of thirty-one separate series (collectively referred to as the “Portfolios”). These financial statements and notes relate to the MainStay VP MacKay High Yield Corporate Bond Portfolio (the "Portfolio"), a "diversified” portfolio, as that term is defined in the 1940 Act, as interpreted or modified by regulatory authorities having jurisdiction, from time to time.
Shares of the Portfolio are currently offered to certain separate accounts to fund variable annuity policies and variable universal life insurance policies issued by New York Life Insurance and Annuity Corporation (“NYLIAC”), a wholly-owned subsidiary of New York Life Insurance Company (“New York Life”) and may also be offered to fund variable annuity policies and variable universal life insurance policies issued by other insurance companies. NYLIAC allocates shares of the Portfolios to, among others, certain NYLIAC separate accounts. Shares of the Portfolio are also offered to the MainStay VP Conservative Allocation Portfolio, MainStay VP Moderate Allocation Portfolio, MainStay VP Growth Allocation Portfolio (formerly known as MainStay VP Moderate Growth Allocation Portfolio) and MainStay VP Equity Allocation Portfolio (formerly known as MainStay VP Growth Allocation Portfolio), which operate as “funds-of-funds," and other variable insurance funds.
The following table lists the Portfolio's share classes that have been registered and commenced operations:
| Class | Commenced Operations |
| Initial Class | May 1, 1995 |
| Service Class | June 4, 2003 |
Shares of the Portfolio are offered and are redeemed at a price equal to their respective net asset value (“NAV”) per share. No sales or redemption charge is applicable to the purchase or redemption of the Portfolio's shares. Under the terms of the Fund’s multiple class plan, adopted pursuant to Rule 18f-3 under the 1940 Act, the classes differ in that, among other things, Service Class shares of the Portfolio pay a combined distribution and service fee of 0.25% of average daily net assets attributable to Service Class shares of the Portfolio to the Distributor (as defined in Note 3(B)) pursuant to a plan adopted in accordance with Rule 12b-1 under the 1940 Act. Contract owners of variable annuity contracts purchased after June 2, 2003, are permitted to invest only in the Service Class shares.
The Portfolio's investment objective is to seek maximum current income through investment in a diversified portfolio of high-yield debt securities. Capital appreciation is a secondary objective.
Note 2–Significant Accounting Policies
The Portfolio is an investment company and accordingly follows the investment company accounting and reporting guidance of the Financial Accounting Standards Board (“FASB”) Accounting Standard Codification Topic 946 Financial Services—Investment Companies. The Portfolio prepares its financial statements in accordance with generally accepted accounting principles (“GAAP”) in the United States of America and follows the significant accounting policies described below.
(A) Securities Valuation. Investments are usually valued as of the close of regular trading on the New York Stock Exchange (the "Exchange") (usually 4:00 p.m. Eastern time) on each day the Portfolio is open for business ("valuation date").
The Board of Trustees of the Fund (the "Board") adopted procedures establishing methodologies for the valuation of the Portfolio's securities and other assets and delegated the responsibility for valuation determinations under those procedures to the Valuation Committee of the Fund (the “Valuation Committee”). The procedures state that, subject to the oversight of the Board and unless otherwise noted, the responsibility for the day-to-day valuation of portfolio assets (including fair value measurements for the Portfolio's assets and liabilities) rests with New York Life Investment Management LLC (“New York Life Investments” or the "Manager"), aided to whatever extent necessary by the Subadvisor (as defined in Note 3(A)). To assess the appropriateness of security valuations, the Manager, the Subadvisor or the Portfolio's third-party service provider, who is subject to oversight by the Manager, regularly compares prior day prices, prices on comparable securities and the sale prices to the prior and current day prices and challenges prices with changes exceeding certain tolerance levels with third-party pricing services or broker sources.
The Board authorized the Valuation Committee to appoint a Valuation Subcommittee (the “Subcommittee”) to establish the prices of securities for which market quotations are not readily available or the prices of which are not otherwise readily determinable under the procedures. The Subcommittee meets (in person, via electronic mail or via teleconference) on an as-needed basis. The Valuation Committee meets to ensure that actions taken by the Subcommittee were appropriate.
For those securities valued through either a standardized fair valuation methodology or a fair valuation measurement, the Subcommittee deals with such valuation and the Valuation Committee reviews and affirms, if appropriate, the reasonableness of the valuation based on such methodologies and measurements on a regular basis after considering information that is reasonably available and deemed relevant by the Valuation Committee. Any action taken by the Subcommittee with respect to the valuation of a portfolio security or other asset is submitted for review and ratification (if appropriate) to the Valuation Committee and the Board at the next regularly scheduled meeting.
"Fair value" is defined as the price the Portfolio would reasonably expect to receive upon selling an asset or liability in an orderly transaction to an independent buyer in the principal or most advantageous market for the
Notes to Financial Statements (Unaudited) (continued)
asset or liability. Fair value measurements are determined within a framework that establishes a three-tier hierarchy that maximizes the use of observable market data and minimizes the use of unobservable inputs to establish a classification of fair value measurements for disclosure purposes. "Inputs" refer broadly to the assumptions that market participants would use in pricing the asset or liability, including assumptions about risk, such as the risk inherent in a particular valuation technique used to measure fair value using a pricing model and/or the risk inherent in the inputs for the valuation technique. Inputs may be observable or unobservable. Observable inputs reflect the assumptions market participants would use in pricing the asset or liability based on market data obtained from sources independent of the Portfolio. Unobservable inputs reflect the Portfolio’s own assumptions about the assumptions market participants would use in pricing the asset or liability based on the information available. The inputs or methodology used for valuing assets or liabilities may not be an indication of the risks associated with investing in those assets or liabilities. The three-tier hierarchy of inputs is summarized below.
| • | Level 1—quoted prices in active markets for an identical asset or liability |
| • | Level 2—other significant observable inputs (including quoted prices for a similar asset or liability in active markets, interest rates and yield curves, prepayment speeds, credit risk, etc.) |
| • | Level 3—significant unobservable inputs (including the Portfolio's own assumptions about the assumptions that market participants would use in measuring fair value of an asset or liability) |
The level of an asset or liability within the fair value hierarchy is based on the lowest level of an input, both individually and in the aggregate, that is significant to the fair value measurement. The aggregate value by input level of the Portfolio’s assets and liabilities as of June 30, 2021, is included at the end of the Portfolio of Investments.
The Portfolio may use third-party vendor evaluations, whose prices may be derived from one or more of the following standard inputs, among others:
| • Benchmark yields | • Reported trades |
| • Broker/dealer quotes | • Issuer spreads |
| • Two-sided markets | • Benchmark securities |
| • Bids/offers | • Reference data (corporate actions or material event notices) |
| • Industry and economic events | • Comparable bonds |
| • Monthly payment information | |
An asset or liability for which market values cannot be measured using the methodologies described above is valued by methods deemed reasonable in good faith by the Valuation Committee, following the procedures established by the Board, to represent fair value. Under these procedures, the Portfolio generally uses a market-based approach which may use related or comparable assets or liabilities, recent transactions, market multiples, book values and other relevant information. The
Portfolio may also use an income-based valuation approach in which the anticipated future cash flows of the asset or liability are discounted to calculate fair value. Discounts may also be applied due to the nature and/or duration of any restrictions on the disposition of the asset or liability. Fair value represents a good faith approximation of the value of a security. Fair value determinations involve the consideration of a number of subjective factors, an analysis of applicable facts and circumstances and the exercise of judgment. As a result, it is possible that the fair value for a security determined in good faith in accordance with the Portfolio's valuation procedures may differ from valuations for the same security determined by other funds using their own valuation procedures. Although the Portfolio's valuation procedures are designed to value a security at the price the Portfolio may reasonably expect to receive upon the security's sale in an orderly transaction, there can be no assurance that any fair value determination thereunder would, in fact, approximate the amount that the Portfolio would actually realize upon the sale of the security or the price at which the security would trade if a reliable market price were readily available. During the six-month period ended June 30, 2021, there were no material changes to the fair value methodologies.
Securities which may be valued in this manner include, but are not limited to: (i) a security for which trading has been halted or suspended; (ii) a debt security that has recently gone into default and for which there is not a current market quotation; (iii) a security of an issuer that has entered into a restructuring; (iv) a security that has been delisted from a national exchange; (v) a security for which the market price is not readily available from a third-party pricing source or, if so provided, does not, in the opinion of the Manager or the Subadvisor, reflect the security's market value; (vi) a security subject to trading collars for which no or limited trading takes place; and (vii) a security whose principal market has been temporarily closed at a time when, under normal conditions, it would be open. Securities valued in this manner are generally categorized as Level 3 in the hierarchy. Securities that were fair valued in such a manner as of June 30, 2021, are shown in the Portfolio of Investments.
Equity securities are valued at the last quoted sales prices as of the close of regular trading on the relevant exchange on each valuation date. Securities that are not traded on the valuation date are valued at the mean of the last quoted bid and ask prices. Prices are normally taken from the principal market in which each security trades. These securities are generally categorized as Level 1 in the hierarchy.
Debt securities (other than convertible and municipal bonds) are valued at the evaluated bid prices (evaluated mean prices in the case of convertible and municipal bonds) supplied by a pricing agent or broker selected by the Manager, in consultation with the Subadvisor. The evaluations are market-based measurements processed through a pricing application and represents the pricing agent’s good faith determination as to what a holder may receive in an orderly transaction under market conditions. The rules-based logic utilizes valuation techniques that reflect participants’ assumptions and vary by asset class and per methodology, maximizing the use of relevant observable data including quoted prices for similar assets, benchmark yield curves and market corroborated inputs. The evaluated bid or mean prices are deemed by the Manager, in consultation
| 30 | MainStay VP MacKay High Yield Corporate Bond Portfolio |
with the Subadvisor, to be representative of market values at the regular close of trading of the Exchange on each valuation date. Debt securities purchased on a delayed delivery basis are marked to market daily until settlement at the forward settlement date. Debt securities, including corporate bonds, U.S. government and federal agency bonds, municipal bonds, foreign bonds, convertible bonds, asset-backed securities and mortgage-backed securities are generally categorized as Level 2 in the hierarchy.
Loan assignments, participations and commitments are valued at the average of bid quotations obtained from the engaged independent pricing service and are generally categorized as Level 2 in the hierarchy. Certain loan assignments, participations and commitments may be valued by utilizing significant unobservable inputs obtained from the pricing service and are generally categorized as Level 3 in the hierarchy. No securities held by the Portfolio as of June 30, 2021 were fair valued in such a manner.
The information above is not intended to reflect an exhaustive list of the methodologies that may be used to value portfolio investments. The valuation procedures permit the use of a variety of valuation methodologies in connection with valuing portfolio investments. The methodology used for a specific type of investment may vary based on the market data available or other considerations. The methodologies summarized above may not represent the specific means by which portfolio investments are valued on any particular business day.
The valuation techniques and significant amounts of unobservable inputs used in the fair valuation of each Portfolio's Level 3 securities are outlined in the table below. A significant increase or decrease in any of those inputs in isolation would result in a significantly higher or lower fair value measurement.
| Asset Class | Fair Value at 6/30/21* | Valuation Technique | Unobservable Inputs | Inputs/Range |
| Corporate Bonds | 3,312,400 | Income Approach | Spread Adjustment | 0.72% |
| Loan Assignments | 4,930,791 | Market Approach | Implied natural gas price | $2.70 |
| | | | Discount Rate | 10.00% |
| Common Stocks | 113 | Market Approach | Ownership % of equity interest | 16.56%-39.70% |
| | 9,523,450 | Income Approach | Rate of Return | 14.00% |
| | | Market Approach | EBITDA Multiple | 6.50x-9.00x |
| | 2,428,637 | Market Approach | EBITDA Multiple | 5.75x |
| | 0 | Market Approach | Implied natural gas price | $2.70 |
| | | | Discount Rate | 10.00% |
| Preferred Stock | 8,646,505 | Income Approach | Spread Adjustment | 4.21% |
| | $28,841,896 | | | |
| * The table above does not include a level 3 investment that was valued by a broker. As of June 30, 2021, the value of this investment was $7,245,000. The inputs for this investment were not readily available or cannot be reasonably estimated. |
A portfolio investment may be classified as an illiquid investment under the Portfolio's written liquidity risk management program and related procedures (“Liquidity Program”). Illiquidity of an investment might prevent the sale of such investment at a time when the Manager or the Subadvisor might wish to sell, and these investments could have the effect of decreasing the overall level of the Portfolio's liquidity. Further, the lack of an established secondary market may make it more difficult to value illiquid investments, requiring the Portfolio to rely on judgments that may be somewhat subjective in measuring value, which could vary materially from the amount that the Portfolio could realize upon disposition. Difficulty in selling illiquid investments may result in a loss or may be costly to the Portfolio. An illiquid investment is any investment that the Manager or Subadvisor reasonably expects cannot be sold or disposed of in current market conditions in seven calendar days or less without the sale or disposition significantly changing the market value of the investment. The liquidity classification of each investment will be made using information obtained after reasonable inquiry and taking into account, among other things, relevant market, trading and investment-specific considerations in accordance with the Liquidity Program. Illiquid investments are often valued in accordance with methods deemed by the Board in good faith to be reasonable and
appropriate to accurately reflect their fair value. The liquidity of the Portfolio's investments was determined as of June 30, 2021, and can change at any time. Illiquid investments as of June 30, 2021, are shown in the Portfolio of Investments.
(B) Income Taxes. The Portfolio's policy is to comply with the requirements of the Internal Revenue Code of 1986, as amended (the “Internal Revenue Code”), applicable to regulated investment companies and to distribute all of its taxable income to the shareholders of the Portfolio within the allowable time limits.
The Manager evaluates the Portfolio’s tax positions to determine if the tax positions taken meet the minimum recognition threshold in connection with accounting for uncertainties in income tax positions taken or expected to be taken for the purposes of measuring and recognizing tax liabilities in the financial statements. Recognition of tax benefits of an uncertain tax position is permitted only to the extent the position is “more likely than not” to be sustained assuming examination by taxing authorities. The Manager analyzed the Portfolio's tax positions taken on federal, state and local income tax returns for all open tax years (for up to three tax years) and has concluded that no provisions for federal, state and local income tax are required in the Portfolio's financial statements.
Notes to Financial Statements (Unaudited) (continued)
The Portfolio's federal, state and local income tax and federal excise tax returns for tax years for which the applicable statutes of limitations have not expired are subject to examination by the Internal Revenue Service and state and local departments of revenue.
(C) Foreign Taxes. The Portfolio may be subject to foreign taxes on income and other transaction-based taxes imposed by certain countries in which it invests. A portion of the taxes on gains on investments or currency purchases/repatriation may be reclaimable. The Portfolio will accrue such taxes and reclaims as applicable, based upon its current interpretation of tax rules and regulations that exist in the markets in which it invests.
The Portfolio may be subject to taxation on realized capital gains, repatriation proceeds and other transaction-based taxes imposed by certain countries in which it invests. The Portfolio will accrue such taxes as applicable based upon its current interpretation of tax rules and regulations that exist in the market in which it invests. Capital gains taxes relating to positions still held are reflected as a liability in the Statement of Assets and Liabilities, as well as an adjustment to the Portfolio's net unrealized appreciation (depreciation). Taxes related to capital gains realized, if any, are reflected as part of net realized gain (loss) in the Statement of Operations. Changes in tax liabilities related to capital gains taxes on unrealized investment gains, if any, are reflected as part of the change in net unrealized appreciation (depreciation) on investments in the Statement of Operations. Transaction-based charges are generally assessed as a percentage of the transaction amount.
(D) Dividends and Distributions to Shareholders. Dividends and distributions are recorded on the ex-dividend date. The Portfolio intends to declare and pay dividends from net investment income and distributions from net realized capital and currency gains, if any, at least annually. Unless a shareholder elects otherwise, all dividends and distributions are reinvested at NAV in the same class of shares of the Portfolio. Dividends and distributions to shareholders are determined in accordance with federal income tax regulations and may differ from determinations using GAAP.
(E) Security Transactions and Investment Income. The Portfolio records security transactions on the trade date. Realized gains and losses on security transactions are determined using the identified cost method. Dividend income is recognized on the ex-dividend date; and interest income is accrued as earned using the effective interest rate method. Discounts and premiums on securities purchased for the Portfolio are accreted and amortized, respectively, on the effective interest rate method. Income from payment-in-kind securities is accreted daily based on the effective interest method. Investment income and realized and unrealized gains and losses on investments of the Portfolio are allocated pro rata to the separate classes of shares based upon their relative net assets on the date the income is earned or realized and unrealized gains and losses are incurred.
Investment income and realized and unrealized gains and losses on investments of the Portfolio are allocated pro rata to the separate classes
of shares based upon their relative net assets on the date the income is earned or realized and unrealized gains and losses are incurred.
The Portfolio may place a debt security on non-accrual status and reduce related interest income by ceasing current accruals and writing off all or a portion of any interest receivables when the collection of all or a portion of such interest has become doubtful. A debt security is removed from non-accrual status when the issuer resumes interest payments or when collectability of interest is reasonably assured.
(F) Expenses. Expenses of the Fund are allocated to the individual Portfolios in proportion to the net assets of the respective Portfolios when the expenses are incurred, except where direct allocations of expenses can be made. Expenses (other than fees incurred under the distribution and service plans, further discussed in Note 3(B), which are charged directly to the Service Class shares) are allocated to separate classes of shares pro rata based upon their relative net assets on the date the expenses are incurred. The expenses borne by the Portfolio, including those of related parties to the Portfolio, are shown in the Statement of Operations.
(G) Use of Estimates. In preparing financial statements in conformity with GAAP, the Manager makes estimates and assumptions that affect the reported amounts and disclosures in the financial statements. Actual results could differ from those estimates and assumptions.
(H) Loan Assignments, Participations and Commitments. The Portfolio may invest in loan assignments and participations ("loans"). Commitments are agreements to make money available to a borrower in a specified amount, at a specified rate and within a specified time. The Portfolio records an investment when the borrower withdraws money on a commitment or when a funded loan is purchased (trade date) and records interest as earned. These loans pay interest at rates that are periodically reset by reference to a base lending rate plus a spread. These base lending rates are generally the prime rate offered by a designated U.S. bank or the London Interbank Offered Rate ("LIBOR").
The loans in which the Portfolio may invest are generally readily marketable, but may be subject to some restrictions on resale. For example, the Portfolio may be contractually obligated to receive approval from the agent bank and/or borrower prior to the sale of these investments. If the Portfolio purchases an assignment from a lender, the Portfolio will generally have direct contractual rights against the borrower in favor of the lender. If the Portfolio purchases a participation interest either from a lender or a participant, the Portfolio typically will have established a direct contractual relationship with the seller of the participation interest, but not with the borrower. Consequently, the Portfolio is subject to the credit risk of the lender or participant who sold the participation interest to the Portfolio, in addition to the usual credit risk of the borrower. In the event that the borrower, selling participant or intermediate participants become insolvent or enter into bankruptcy, the Portfolio may incur certain costs and delays in realizing payment, or may suffer a loss of principal and/or interest.
| 32 | MainStay VP MacKay High Yield Corporate Bond Portfolio |
Unfunded commitments represent the remaining obligation of the Portfolio to the borrower. At any point in time, up to the maturity date of the issue, the borrower may demand the unfunded portion. Unfunded amounts, if any, are marked to market and any unrealized gains or losses are recorded in the Statement of Assets and Liabilities. As of June 30, 2021, the Portfolio held unfunded commitments. (See Note 5).
(I) Securities Lending. In order to realize additional income, the Portfolio may engage in securities lending, subject to the limitations set forth in the 1940 Act and relevant guidance by the staff of the Securities and Exchange Commission (“SEC”). If the Portfolio engages in securities lending, the Portfolio will lend through its custodian, JPMorgan Chase Bank, N.A., ("JPMorgan"), acting as securities lending agent on behalf of the Portfolio. Under the current arrangement, JPMorgan will manage the Portfolio's collateral in accordance with the securities lending agency agreement between the Portfolio and JPMorgan, and indemnify the Portfolio against counterparty risk. The loans will be collateralized by cash (which may be invested in a money market fund) and/or non-cash collateral (which may include U.S. Treasury securities and/or U.S. government agency securities issued or guaranteed by the United States government or its agencies or instrumentalities) at least equal at all times to the market value of the securities loaned. The Portfolio bears the risk of delay in recovery of, or loss of rights in, the securities loaned. The Portfolio may also record a realized gain or loss on securities deemed sold due to a borrower’s inability to return securities on loan. The Portfolio bears the risk of any loss on investment of cash collateral. The Portfolio will receive compensation for lending its securities in the form of fees or it will retain a portion of interest earned on the investment of any cash collateral. The Portfolio will also continue to receive interest and dividends on the securities loaned and any gain or loss in the market price of the securities loaned that may occur during the term of the loan will be for the account of the Portfolio. Income earned from securities lending activities, if any, is reflected in the Statement of Operations. As of June 30, 2021, the Portfolio did not have any portfolio securities on loan.
Prior to February 22, 2021, these services were provided by State Street Bank and Trust Company (“State Street”).
(J) Rights and Warrants. Rights are certificates that permit the holder to purchase a certain number of shares, or a fractional share, of a new stock from the issuer at a specific price. Warrants are instruments that entitle the holder to buy an equity security at a specific price for a specific period of time. These investments can provide a greater potential for profit or loss than an equivalent investment in the underlying security. Prices of these investments do not necessarily move in tandem with the prices of the underlying securities.
There is risk involved in the purchase of rights and warrants in that these investments are speculative investments. The Portfolio could also lose the entire value of its investment in warrants if such warrants are not exercised by the date of its expiration. The Portfolio is exposed to risk until the sale or exercise of each right or warrant is completed. Warrants as of June 30, 2021 are shown in the Portfolio of Investments.
(K) Delayed Delivery Transactions. The Portfolio may purchase or sell securities on a delayed delivery basis. These transactions involve a commitment by the Portfolio to purchase or sell securities for a predetermined price or yield, with payment and delivery taking place beyond the customary settlement period. When delayed delivery purchases are outstanding, the Portfolio will designate liquid assets in an amount sufficient to meet the purchase price. When purchasing a security on a delayed delivery basis, the Portfolio assumes the rights and risks of ownership of the security, including the risk of price and yield fluctuations, and takes such fluctuations into account when determining its NAV. The Portfolio may dispose of or renegotiate a delayed delivery transaction after it is entered into, and may sell delayed delivery securities before they are delivered, which may result in a realized gain or loss. When the Portfolio has sold a security it owns on a delayed delivery basis, the Portfolio does not participate in future gains and losses with respect to the security. As of June 30, 2021, delayed delivery transactions are shown in the Portfolio of Investments.
(L) Debt Securities Risk. The ability of issuers of debt securities held by the Portfolio to meet their obligations may be affected by, among other things, economic or political developments in a specific country, industry or region. Debt securities are also subject to the risks associated with changes in interest rates. The Portfolio primarily invests in high-yield debt securities (commonly referred to as “junk bonds”), which are considered speculative because they present a greater risk of loss, including default, than higher rated debt securities. These securities pay investors a premium—a higher interest rate or yield than investment grade debt securities—because of the increased risk of loss. These securities can also be subject to greater price volatility. In times of unusual or adverse market, economic or political conditions, these securities may experience higher than normal default rates.
The loans in which the Portfolio invests are usually rated below investment grade, or if unrated, determined by the Subadvisor to be of comparable quality (commonly referred to as “junk bonds”) and are generally considered speculative because they present a greater risk of loss, including default, than higher quality debt securities. Moreover, such securities may, under certain circumstances, be particularly susceptible to liquidity and valuation risks.
Although certain loans are collateralized, there is no guarantee that the value of the collateral will be sufficient to repay the loan. In a recession or serious credit event, the value of these investments could decline significantly. As a result, the Portfolio’s NAVs could go down and you could lose money.
In addition, loans generally are subject to extended settlement periods that may be longer than seven days. As a result, the Portfolio may be adversely affected by selling other investments at an unfavorable time and/or under unfavorable conditions or engaging in borrowing transactions, such as borrowing against its credit facility, to raise cash to meet redemption obligations or pursue other investment opportunities.
Notes to Financial Statements (Unaudited) (continued)
In certain circumstances, loans may not be deemed to be securities. As a result, the Portfolio may not have the protection of the anti-fraud provisions of the federal securities laws. In such cases, the Portfolio generally must rely on the contractual provisions in the loan agreement and common-law fraud protections under applicable state law.
(M) LIBOR Replacement Risk. The Portfolio may invest in certain debt securities, derivatives or other financial instruments that utilize the London Interbank Offered Rate ("LIBOR"), as a “benchmark” or “reference rate” for various interest rate calculations. The United Kingdom Financial Conduct Authority, which regulates LIBOR, announced that after 2021 it will cease its active encouragement of banks to provide the quotations needed to sustain LIBOR. However, it is possible that certain LIBOR tenors may continue beyond 2021 and the most widely used LIBOR tenors may continue until mid-2023. As a result, it is anticipated that LIBOR will be discontinued or will no longer be sufficiently robust to be representative of its underlying market around that time. Although financial regulators and industry working groups have suggested alternative reference rates, such as European Interbank Offer Rate (“EURIBOR”), Sterling Overnight Interbank Average Rate (“SONIA”) and Secured Overnight Financing Rate (“SOFR”), there are challenges to converting certain contracts and transactions to a new benchmark and neither the full effects of the transition process nor its ultimate outcome is known. New York Life Investments is currently working to assess exposure and will modify contracts as necessary.
The elimination of LIBOR or changes to other reference rates or any other changes or reforms to the determination or supervision of reference rates could have an adverse impact on the market for, or value of, any securities or payments linked to those reference rates, which may adversely affect the Portfolio's performance and/or net asset value. Uncertainty and risk also remain regarding the willingness and ability of issuers and lenders to include revised provisions in new and existing contracts or instruments. Consequently, the transition away from LIBOR to other reference rates may lead to increased volatility and illiquidity in markets that are tied to LIBOR, fluctuations in values of LIBOR-related investments or investments in issuers that utilize LIBOR, increased difficulty in borrowing or refinancing and diminished effectiveness of hedging strategies, adversely affecting the Portfolio's performance. Furthermore, the risks associated with the expected discontinuation of LIBOR and transition may be exacerbated if the work necessary to effect an orderly transition to an alternative reference rate is not completed in a timely manner. Because the usefulness of LIBOR as a benchmark could deteriorate during the transition period, these effects could occur prior to the end of 2021 with respect to certain LIBOR tenors or mid-2023 for the remaining LIBOR tenors.
(N) Indemnifications. Under the Fund’s organizational documents, its officers and trustees are indemnified against certain liabilities that may arise out of performance of their duties to the Fund. Additionally, in the normal course of business, the Portfolio enters into contracts with third-party service providers that contain a variety of representations and warranties and that may provide general indemnifications. The Portfolio's
maximum exposure under these arrangements is unknown, as this would involve future claims that may be made against the Portfolio that have not yet occurred. The Manager believes that the risk of loss in connection with these potential indemnification obligations is remote. However, there can be no assurance that material liabilities related to such obligations will not arise in the future, which could adversely impact the Portfolio.
Note 3–Fees and Related Party Transactions
(A) Manager and Subadvisor. New York Life Investments, a registered investment adviser and an indirect, wholly-owned subsidiary of New York Life, serves as the Portfolio's Manager, pursuant to an Amended and Restated Management Agreement ("Management Agreement"). The Manager provides offices, conducts clerical, recordkeeping and bookkeeping services and keeps most of the financial and accounting records required to be maintained by the Portfolio. Except for the portion of salaries and expenses that are the responsibility of the Portfolio, the Manager pays the salaries and expenses of all personnel affiliated with the Portfolio and certain operational expenses of the Portfolio. The Portfolio reimburses New York Life Investments in an amount equal to the portion of the compensation of the Chief Compliance Officer attributable to the Portfolio. MacKay Shields LLC ("MacKay Shields" or the "Subadvisor"), a registered investment adviser and an indirect, wholly-owned subsidiary of New York Life, serves as Subadvisor to the Portfolio and is responsible for the day-to-day portfolio management of the Portfolio. Pursuant to the terms of an Amended and Restated Subadvisory Agreement ("Subadvisory Agreement") between New York Life Investments and MacKay Shields, New York Life Investments pays for the services of the Subadvisor.
Pursuant to the Management Agreement, the Fund pays the Manager, on behalf of the Portfolio, a monthly fee for the services performed and the facilities furnished at an annual rate of the Portfolio's average daily net assets as follows: 0.57% up to $1 billion; 0.55% from $1 billion to $5 billion; and 0.525% in excess of $5 billion. During the six-month period ended June 30, 2021, the effective management fee rate was 0.56%.
During the six-month period ended June 30, 2021, New York Life Investments earned fees from the Portfolio in the amount of $8,683,459 and paid the Subadvisor fees in the amount of $4,341,718.
JPMorgan provides sub-administration and sub-accounting services to the Portfolio pursuant to an agreement with New York Life Investments. These services include calculating the daily NAVs of the Portfolio, maintaining the general ledger and sub-ledger accounts for the calculation of the Portfolio's NAVs, and assisting New York Life Investments in conducting various aspects of the Portfolio's administrative operations. For providing these services to the Portfolio, JPMorgan is compensated by New York Life Investments.
Prior to February 22, 2021, these services were provided by State Street.
Pursuant to an agreement between the Fund and New York Life Investments, New York Life Investments is responsible for providing or
| 34 | MainStay VP MacKay High Yield Corporate Bond Portfolio |
procuring certain regulatory reporting services for the Portfolio. The Portfolio will reimburse New York Life Investments for the actual costs incurred by New York Life Investments in connection with providing or procuring these services for the Portfolio.
(B) Distribution and Service Fees. The Fund, on behalf of the Portfolio, has entered into a distribution agreement with NYLIFE Distributors LLC (the “Distributor”), an affiliate of New York Life Investments. The Portfolio has adopted a distribution plan (the “Plan”) in accordance with the provisions of Rule 12b-1 under the 1940 Act. Under the Plan, the Distributor has agreed to provide, through its affiliates or independent third parties, various distribution-related, shareholder and administrative support services to the Service Class shareholders. For its services, the Distributor is entitled to a combined distribution and service fee accrued daily and paid monthly at an annual rate of 0.25% of the average daily net assets attributable to the Service Class shares of the Portfolio.
Note 4-Federal Income Tax
As of June 30, 2021, the cost and unrealized appreciation (depreciation) of the Portfolio’s investment portfolio, including applicable derivative contracts and other financial instruments, as determined on a federal income tax basis, were as follows:
| | Federal Tax
Cost | Gross
Unrealized
Appreciation | Gross
Unrealized
(Depreciation) | Net
Unrealized
Appreciation/
(Depreciation) |
| Investments in Securities | $2,967,529,267 | $194,254,939 | $(56,059,300) | $138,195,639 |
As of December 31, 2020, for federal income tax purposes, capital loss carryforwards of $159,783,684, as shown in the table below, were available to the extent provided by the regulations to offset future realized gains of the Portfolio. Accordingly, no capital gains distributions are expected to be paid to shareholders until net gains have been realized in excess of such amounts.
Capital Loss
Available Through | Short-Term
Capital Loss
Amounts (000’s) | Long-Term
Capital Loss
Amounts (000’s) |
| Unlimited | $14,221 | $145,563 |
During the year ended December 31, 2020, the tax character of distributions paid as reflected in the Statements of Changes in Net Assets was as follows:
| | 2020 |
| Distributions paid from: | |
| Ordinary Income | $165,615,020 |
Note 5–Commitments and Contingencies
As of June 30, 2021, the Portfolio had unfunded commitments pursuant to the following loan agreements:
| Borrower | Unfunded
Commitments | Unrealized
Appreciation/
(Depreciation) |
Neenah Foundry,
2020 PIK Loan
TBD, due 4/1/23 | $320,000 | $— |
Commitments are available until maturity date.
Note 6–Restricted Securities
Restricted securities are subject to legal or contractual restrictions on resale. Private placement securities are generally considered to be restricted except for those securities traded between qualified institutional investors under the provisions of Rule 144A of the Securities Act of 1933, as amended. Disposal of restricted securities may involve time consuming negotiations and expenses, and prompt sale at an acceptable price may be difficult to achieve.
Notes to Financial Statements (Unaudited) (continued)
As of June 30, 2021, restricted securities held by the Portfolio were as follows:
| Security | Date(s) of
Acquisition | Principal
Amount/
Shares | Cost | 6/30/21
Value | Percent of
Net Assets |
| Briggs & Stratton Corp. Escrow Claim Shares |
Corporate Bond
6.875%, due 12/15/20 | 2/26/21 | $ 5,030,000 | $ 5,170,425 | $ 414,975 | 0.0% ‡ |
| Carlson Travel, Inc. |
| Common Stock | 9/4/20-2/4/21 | 6,281 | — | — | 0.0‡ |
| GenOn Energy, Inc. |
| Common Stock | 12/14/18 | 115,826 | 12,970,154 | 12,451,295 | 0.4 |
| Neenah Enterprises, Inc. |
| Common Stock | 4/12/20 | 230,859 | 1,955,376 | 2,428,637 | 0.0‡ |
| Sterling Entertainment Enterprises LLC |
Corporate Bond
10.25%, due 1/15/25 | 12/28/17-7/3/21 | $ 7,000,000 | 6,937,878 | 7,245,000 | 0.3% |
| Total | | | $ 27,033,833 | $ 22,539,907 | 0.7% |
| ‡ | Less than one-tenth of a percent. |
Note 7–Custodian
JPMorgan is the custodian of cash and securities held by the Portfolio. Custodial fees are charged to the Portfolio based on the Portfolio's net assets and/or the market value of securities held by the Portfolio and the number of certain transactions incurred by the Portfolio.
Prior to February 22, 2021, these services were provided by State Street. The services provided by State Street were a direct expense of the Portfolio and are included in the Statement of Operations as Custodian fees which totaled $6,242 for the period January 1, 2021 through February 21, 2021.
Note 8–Line of Credit
The Portfolio and certain other funds managed by New York Life Investments maintain a line of credit with a syndicate of banks in order to secure a source of funds for temporary purposes to meet unanticipated or excessive redemption requests.
Effective July 27, 2021, under the credit agreement (the “Credit Agreement”), the aggregate commitment amount is $600,000,000 with an additional uncommitted amount of $100,000,000. The commitment fee is an annual rate of 0.15% of the average commitment amount payable quarterly, regardless of usage, to JPMorgan, who serves as the agent to the syndicate. The commitment fee is allocated among the Portfolio and certain other funds managed by New York Life Investments based upon their respective net assets and other factors. Interest on any revolving credit loan is charged based upon the Federal Funds Rate or the one-month London Interbank Offered Rate ("LIBOR"), whichever is higher. The Credit Agreement expires on July 26, 2022, although the Portfolio, certain other funds managed by New York Life Investments and the syndicate of banks may renew the Credit Agreement for an additional year on the same or different terms or enter into a credit agreement with
a different syndicate of banks. Prior to July 27, 2021, the aggregate commitment amount and the commitment fee were the same as those under the current Credit Agreement. During the six-month period ended June 30, 2021, there were no borrowings made or outstanding with respect to the Portfolio under the Credit Agreement.
Note 9–Interfund Lending Program
Pursuant to an exemptive order issued by the SEC, the Portfolio, along with certain other funds managed by New York Life Investments, may participate in an interfund lending program. The interfund lending program provides an alternative credit facility that permits the Portfolio and certain other funds managed by New York Life Investments to lend or borrow money for temporary purposes directly to or from one another, subject to the conditions of the exemptive order. During the six-month period ended June 30, 2021, there were no interfund loans made or outstanding with respect to the Portfolio.
Note 10–Purchases and Sales of Securities (in 000’s)
During the six-month period ended June 30, 2021, purchases and sales of securities, other than short-term securities, were $769,356 and $676,219, respectively.
Note 11–Capital Share Transactions
Transactions in capital shares for the six-month period ended June 30, 2021 and the year ended December 31, 2020, were as follows:
| 36 | MainStay VP MacKay High Yield Corporate Bond Portfolio |
| Initial Class | Shares | Amount |
| Period ended June 30, 2021: | | |
| Shares sold | 8,530,740 | $ 86,749,083 |
| Shares redeemed | (3,923,489) | (39,557,889) |
| Net increase (decrease) | 4,607,251 | $ 47,191,194 |
| Year ended December 31, 2020: | | |
| Shares sold | 4,741,138 | $ 45,519,125 |
| Shares issued to shareholders in reinvestment of distributions | 2,675,798 | 25,417,401 |
| Shares redeemed | (8,207,626) | (78,748,285) |
| Net increase (decrease) | (790,690) | $ (7,811,759) |
| |
| Service Class | Shares | Amount |
| Period ended June 30, 2021: | | |
| Shares sold | 7,962,634 | $ 78,623,113 |
| Shares redeemed | (5,578,275) | (54,985,505) |
| Net increase (decrease) | 2,384,359 | $ 23,637,608 |
| Year ended December 31, 2020: | | |
| Shares sold | 33,371,463 | $ 317,386,587 |
| Shares issued to shareholders in reinvestment of distributions | 14,990,710 | 140,197,619 |
| Shares redeemed | (40,584,222) | (378,303,142) |
| Net increase (decrease) | 7,777,951 | $ 79,281,064 |
Note 12–Other Matters
An outbreak of COVID-19, first detected in December 2019, has developed into a global pandemic and has resulted in travel restrictions, closure of international borders, certain businesses and securities markets, restrictions on securities trading activities, prolonged quarantines, supply chain disruptions, and lower consumer demand, as well as general concern and uncertainty. The continued impact of COVID-19 and related new variants is uncertain and could further adversely affect the global economy, national economies, individual issuers and capital markets in unforeseeable ways and result in a substantial and extended economic downturn. Developments that disrupt global economies and financial markets, such as COVID-19, may magnify factors that affect the Portfolio's performance.
Note 13–Subsequent Events
In connection with the preparation of the financial statements of the Portfolio as of and for the six-month period ended June 30, 2021, events and transactions subsequent to June 30, 2021, through the date the financial statements were issued have been evaluated by the Manager for possible adjustment and/or disclosure. No subsequent events requiring financial statement adjustment or disclosure have been identified.
Discussion of the Operation and Effectiveness of the Portfolio's Liquidity Risk Management Program (Unaudited)
In compliance with Rule 22e-4 under the Investment Company Act of 1940, as amended (the “Liquidity Rule”), the Portfolio has adopted and implemented a liquidity risk management program (the “Program”), which New York Life Investment Management LLC believes is reasonably designed to assess and manage the Portfolio's liquidity risk (the risk that the Portfolio could not meet requests to redeem shares issued by the Portfolio without significant dilution of remaining investors’ interests in the Portfolio). The Board of Trustees of MainStay VP Funds Trust (the "Board") designated New York Life Investment Management LLC as administrator of the Program (the “Administrator”). The Administrator has established a Liquidity Risk Management Committee to assist the Administrator in the implementation and day-to-day administration of the Program and to otherwise support the Administrator in fulfilling its responsibilities under the Program.
At a meeting of the Board held on March 8, 2021, the Administrator provided the Board with a written report addressing the Program’s operation and assessing its adequacy and effectiveness of implementation for the period from January 1, 2020 through December 31, 2020 (the "Review Period"), as required under the Liquidity Rule. The report noted that the Administrator concluded that (i) the Program operated effectively to assess and manage the Portfolio's liquidity risk, (ii) the Program has been adequately and effectively implemented to monitor and, as applicable, respond to the Portfolio's liquidity developments and (iii) the Portfolio's investment strategy continues to be appropriate for an open-end fund. In addition, the report discussed notable events that impacted liquidity risk during the Review Period, including the COVID-19 pandemic and the resulting economic shutdown.
In accordance with the Program, the Portfolio's liquidity risk is assessed no less frequently than annually taking into consideration certain factors, as applicable, such as (i) investment strategy and liquidity of portfolio investments, (ii) short-term and long-term cash flow projections and (iii) holdings of cash and cash equivalents, as well as borrowing arrangements and other funding sources. Certain factors are considered under both normal and reasonably foreseeable stressed conditions.
Each Portfolio portfolio investment is classified into one of four liquidity categories. The classification is based on a determination of the number of days it is reasonably expected to take to convert the investment into cash, or sell or dispose of the investment, in current market conditions without significantly changing the market value of the investment. The Administrator has delegated liquidity classification determinations to the Portfolio’s subadvisor, subject to appropriate oversight by the Administrator, and classification determinations are made by taking into account the Portfolio's reasonably anticipated trade size, various market, trading and investment-specific considerations, as well as market depth, and, in certain cases, third-party vendor data.
The Liquidity Rule requires portfolios that do not primarily hold assets that are highly liquid investments to adopt a minimum amount of net assets that must be invested in highly liquid investments that are assets (an “HLIM”). In addition, the Liquidity Rule limits a portfolio's investments in illiquid investments. Specifically, the Liquidity Rule prohibits acquisition of illiquid investments if doing so would result in a portfolio holding more than 15% of its net assets in illiquid investments that are assets. The Program includes provisions reasonably designed to determine, periodically review and comply with the HLIM requirement, as applicable, and to comply with the 15% limit on illiquid investments.
There can be no assurance that the Program will achieve its objectives under all circumstances in the future. Please refer to the Portfolio's prospectus for more information regarding the Portfolio's exposure to liquidity risk and other risks to which it may be subject.
| 38 | MainStay VP MacKay High Yield Corporate Bond Portfolio |
Proxy Voting Record
The Portfolio is required to file with the SEC its proxy voting records for the 12-month period ending June 30 on Form N-PX. The Portfolio's most recent Form N-PX or proxy voting record is available free of charge upon request (i) by calling 800-598-2019; (ii) by visiting New York Life Investments’ website at https://www.nylinvestments.com/mainstay/
products-and-performance/mainstay-vp-funds-trust; or (iii) by visiting the SEC’s website at www.sec.gov.
Shareholder Reports and Quarterly Portfolio Disclosure
The Portfolio is required to file its complete schedule of portfolio holdings with the SEC 60 days after its first and third fiscal quarter on Form N-PORT. The Portfolio's holdings report is available free of charge upon request by calling 800-598-2019 or by visiting the SEC’s website at www.sec.gov.
This page intentionally left blank
This page intentionally left blank.
This page intentionally left blank.
MainStay VP Portfolios
MainStay VP offers a wide range of Portfolios. The full array of MainStay VP offerings is listed here, with information about the manager, subadvisors, legal counsel, and independent registered public accounting firm.
Equity
MainStay VP Candriam Emerging Markets Equity Portfolio
MainStay VP Epoch U.S. Equity Yield Portfolio
MainStay VP Fidelity Institutional AM® Utilities Portfolio†
MainStay VP MacKay International Equity Portfolio
MainStay VP MacKay S&P 500 Index Portfolio
MainStay VP Natural Resources Portfolio
MainStay VP Small Cap Growth Portfolio
MainStay VP T. Rowe Price Equity Income Portfolio
MainStay VP Wellington Growth Portfolio
MainStay VP Wellington Mid Cap Portfolio
MainStay VP Wellington Small Cap Portfolio
MainStay VP Wellington U.S. Equity Portfolio
MainStay VP Winslow Large Cap Growth Portfolio
Mixed Asset
MainStay VP Balanced Portfolio
MainStay VP Income Builder Portfolio
MainStay VP Janus Henderson Balanced Portfolio
MainStay VP MacKay Convertible Portfolio
Income
MainStay VP Bond Portfolio
MainStay VP Floating Rate Portfolio
MainStay VP Indexed Bond Portfolio
MainStay VP MacKay Government Portfolio
MainStay VP MacKay High Yield Corporate Bond Portfolio
MainStay VP MacKay Strategic Bond Portfolio
MainStay VP PIMCO Real Return Portfolio
Money Market
MainStay VP U.S. Government Money Market Portfolio
Alternative
MainStay VP CBRE Global Infrastructure Portfolio
MainStay VP IQ Hedge Multi-Strategy Portfolio
Asset Allocation
MainStay VP Conservative Allocation Portfolio
MainStay VP Equity Allocation Portfolio
MainStay VP Growth Allocation Portfolio
MainStay VP Moderate Allocation Portfolio
Manager
New York Life Investment Management LLC
New York, New York
Subadvisors
Brown Advisory LLC
Baltimore, Maryland
Candriam Belgium S.A.*
Brussels, Belgium
CBRE Clarion Securities LLC
Radnor, Pennsylvania
Epoch Investment Partners, Inc.
New York, New York
FIAM LLC
Smithfield, Rhode Island
IndexIQ Advisors LLC*
New York, New York
Janus Capital Management LLC
Denver, Colorado
MacKay Shields LLC*
New York, New York
Mellon Investments Corporation
Boston, Massachusetts
NYL Investors LLC*
New York, New York
Pacific Investment Management Company LLC
Newport Beach, California
Segall Bryant & Hamill, LLC
Chicago, Illinois
T. Rowe Price Associates, Inc.
Baltimore, Maryland
Wellington Management Company LLP
Boston, Massachusetts
Winslow Capital Management, LLC
Minneapolis, Minnesota
Legal Counsel
Dechert LLP
Washington, District of Columbia
Independent Registered Public Accounting Firm
PricewaterhouseCoopers LLP
New York, New York
Distributor
NYLIFE Distributors LLC*
Jersey City, New Jersey
Custodian
JPMorgan Chase Bank, N.A.
New York, New York
Some Portfolios may not be available in all products.
† Fidelity Institutional AM is a registered trade mark of FMR LLC. Used with permission.
* An affiliate of New York Life Investment Management LLC
Not part of the Semiannual Report
2021 Semiannual Report
This report is for the general information of New York Life Variable Annuities and NYLIAC Variable Universal Life Insurance Products policyowners. It must be preceded or accompanied by the appropriate product(s) and funds prospectuses if it is given to anyone who is not an owner of a New York Life variable annuity policy or a NYLIAC Variable Universal Life Insurance Product. This report does not offer for sale or solicit orders to purchase securities.
The performance data quoted in this report represents past performance. Past performance is no guarantee of future results. Due to market volatility and other factors, current performance may be lower or higher than the figures shown. The most recent month-end performance summary for your variable annuity or variable life policy is available by calling 800-598-2019 and is updated periodically on newyorklife.com.
The New York Life Variable Annuities and NYLIAC Variable Universal Life Insurance Products are issued by New York Life Insurance and Annuity Corporation (a Delaware Corporation) and distributed by NYLIFE Distributors LLC (Member FINRA/SIPC).
New York Life Insurance Company
New York Life Insurance and Annuity
Corporation (NYLIAC) (A Delaware Corporation)
51 Madison Avenue, Room 551
New York, NY 10010
newyorklife.com
nylinvestments.com
NYLIFE Distributors LLC, 30 Hudson Street, Jersey City, NJ 07302
New York Life Investment Management LLC is the investment manager to the MainStay VP Funds Trust
©2021 by NYLIFE Distributors LLC. All rights reserved.
You may obtain copies of the Prospectus and the Statement of Additional Information free of charge, upon request, by calling toll-free 800-598-2019 or writing to New York Life Insurance and Annuity Corporation, 51 Madison Avenue, New York, NY 10010.
| Not FDIC Insured | No Bank Guarantee | May Lose Value |
(NYLIAC) NI520
MainStay VP Income Builder Portfolio
Message from the President and Semiannual Report
Unaudited | June 30, 2021
Sign up for e-delivery of your shareholder reports. For full details on e-delivery, including who can participate and what you can receive via e-delivery,
please log in to newyorklifeinvestments.com/accounts.
| Not FDIC/NCUA Insured | Not a Deposit | May Lose Value | No Bank Guarantee | Not Insured by Any Government Agency |
This page intentionally left blank
Message from the President
The COVID-19 pandemic continued to afflict our personal lives and broad segments of the U.S. and global economy throughout the six-month reporting period ended June 30, 2021. However, with the deployment of multiple vaccines around the world, including three highly effective versions approved for emergency use in the United States, investors began to turn their attention toward the gradual reopening of the economy and the shape the “new normal” would take.
The first half of the reporting period saw increasing inflationary concerns as fiscal stimulus business reopenings drove accelerating economic growth, rising commodity prices and increased consumer spending. However, the U.S. Federal Reserve noted that price increases were likely to prove temporary and made clear their intention to remain accommodative for the foreseeable future. Accordingly, after moving higher in the first quarter of 2021, interest rates declined in the second quarter.
In response to the uncertain inflation outlook, equity market leadership shifted from value in the first quarter of the year to growth in the second quarter. Nevertheless, investor sentiment remained buoyant throughout the reporting period, with all eleven sectors in the S&P 500® Index, a widely regarded benchmark of market performance, producing positive returns. Energy led the market’s rise fueled by rapidly increasing oil and gas prices, followed by financials and real estate, which benefited from rising interest rates and the economic reopening, respectively. Communication services produced the slowest growth, followed by the traditionally defensive utilities and consumer staples
sectors. In the fixed income market, lower-credit-quality issues tended to outperform their higher-grade counterparts, with high-yield corporate bonds generating the strongest performance. Among securitized products, commercial mortgage-backed securities generally produced the strongest returns, followed by mortgage-backed securities and asset-backed securities, while Treasury securities lagged.
Despite the tremendous progress we’ve seen so far this year, the United States and the world continue to face significant pandemic-related challenges. Newer, more contagious variants of COVID-19 threaten the return of restrictions and lockdowns that could stall the economic recovery. At the same time, supply chain shortages have led to rising prices on everything from laptops to autos, stoking fears of uncontrolled inflation despite reassurance from the U.S. Federal Reserve. At New York Life Investments, we recognize that the shape that the “new normal” eventually takes may differ from our expectations. You can depend on us to keep a sharp watch for the unexpected, and to continue to help you find your way through this rapidly evolving investment landscape.
Sincerely,
Kirk C. Lehneis
President
The opinions expressed are as of the date of this report and are subject to change. There is no guarantee that any forecast made will come to pass. This material does not constitute investment advice and is not intended as an endorsement of any specific investment. Past performance is no guarantee of future results.
Not part of the Semiannual Report
Investors should refer to the Portfolio’s Summary Prospectus and/or Prospectus and consider the Portfolio’s investment objectives, strategies, risks, charges and expenses carefully before investing. The Summary Prospectus and/or Prospectus contain this and other information about the Portfolio. You may obtain copies of the Portfolio’s Summary Prospectus and/or the Prospectus and the Statement of Additional Information free of charge, upon request, by calling toll-free 800-598-2019, by writing to New York Life Insurance and Annuity Corporation, 51 Madison Avenue, Room 251, New York, New York 10010 or by sending an email to MainStayShareholdersServices@nylim.com. These documents are also available at nylinvestments.com/vpdocuments. Please read the Portfolio's Summary Prospectus and/or Prospectus carefully before investing. MainStay VP Funds Trust portfolios are separate account options which are purchased through a variable insurance or variable annuity contract.
Investment and Performance Comparison (Unaudited)
Performance data quoted represents past performance. Past performance is no guarantee of future results. Because of market volatility and other factors, current performance may be lower or higher than the figures shown. Investment return and principal value will fluctuate, and as a result, when shares are redeemed, they may be worth more or less than their original cost. The performance table and graph do not reflect any deduction of sales charges, mortality and expense charges, contract charges or administrative charges. Please refer to the Performance Summary appropriate for your policy. For performance information current to the most recent month-end, please call 800-598-2019 or visit www.newyorklife.com.
Performance figures may reflect certain fee waivers and/or expense limitations, without which total returns may have been different. For information on current fee waivers and/or expense limitations (if any), please refer to the Notes to Financial Statements.
| Average Annual Total Returns for the Period-Ended June 30, 2021 |
| Class | Inception
Date | Six
Months | One
Year | Five
Years | Ten
Years | Gross
Expense
Ratio1 |
| Initial Class Shares | 1/29/1993 | 7.19% | 21.09% | 8.37% | 8.35% | 0.63% |
| Service Class Shares | 6/4/2003 | 7.06 | 20.79 | 8.10 | 8.08 | 0.88 |
| 1. | The gross expense ratios presented reflect the Portfolio’s “Total Annual Portfolio Operating Expenses” from the most recent Prospectus, as supplemented, and may differ from other expense ratios disclosed in this report. |
| Benchmark Performance | Six
Months | One
Year | Five
Years | Ten
Years |
| MSCI World Index (Net)1 | 13.05% | 39.04% | 14.83% | 10.65% |
| Bloomberg Barclays U.S. Aggregate Bond Index2 | -1.60 | -0.33 | 3.03 | 3.39 |
| Blended Benchmark Index3 | 7.01 | 22.10 | 10.26 | 7.96 |
| Morningstar World Allocation Category Average4 | 8.65 | 24.56 | 7.38 | 4.79 |
| 1. | The MSCI World Index (Net) is the Portfolio's primary benchmark. The MSCI World Index (Net) is a broad-based benchmark that is a free float-adjusted market capitalization weighted index that is designed to measure the equity market performance of developed markets. Results assume reinvestment of all dividends and capital gains. An investment cannot be made directly in an index. |
| 2. | The Portfolio has selected the Bloomberg Barclays U.S. Aggregate Bond Index as a secondary benchmark. The Bloomberg Barclays U.S. Aggregate Bond Index is a broad-based benchmark that measures performance of the investment grade, U.S. dollar-denominated, fixed-rate taxable bond market, including Treasurys, government-related and corporate securities, mortgage-backed securities (agency fixed-rate and hybrid adjustable rate mortgage pass-throughs), asset-backed securities, and commercial mortgage-backed securities. Results assume reinvestment of all dividends and capital gains. An investment cannot be made directly in an index. |
| 3. | The Portfolio has selected the Blended Benchmark Index as an additional benchmark. The Blended Benchmark Index consists of the MSCI World Index (Net) and the Bloomberg Barclays U.S. Aggregate Bond Index, weighted 60% and 40%, respectively. Results assume reinvestment of all dividends and capital gains. An investment cannot be made directly in an index. |
| 4. | The Morningstar World Allocation Category Average is representative of funds that seek to provide both capital appreciation and income by investing in three major areas: stocks, bonds, and cash. While these funds do explore the whole world, most of them focus on the U.S., Canada, Japan, and the larger markets in Europe. It is rare for such funds to invest more than 10% of their assets in emerging markets. These funds typically have at least 10% of assets in bonds, less than 70% of assets in stocks, and at least 40% of assets in non-U.S. stocks or bonds. Results are based on average total returns of similar funds with all dividends and capital gain distributions reinvested. |
Cost in Dollars of a $1,000 Investment in MainStay VP Income Builder Portfolio (Unaudited)
The example below is intended to describe the fees and expenses borne by shareholders during the six-month period from January 1, 2021 to June 30, 2021, and the impact of those costs on your investment.
Example
As a shareholder of the Portfolio you incur two types of costs: (1) transaction costs, including exchange fees and sales charges (loads) on purchases (as applicable), and (2) ongoing costs, including management fees, distribution and/or service (12b-1) fees, and other Portfolio expenses (as applicable). This example is intended to help you understand your ongoing costs (in dollars) of investing in the Portfolio and to compare these costs with the ongoing costs of investing in other mutual funds. The example is based on an investment of $1,000 made at the beginning of the six-month period and held for the entire period from January 1, 2021 to June 30, 2021. Shares are only sold in connection with variable life and annuity contracts and the example does not reflect any contract level or transactional fees or expenses. If these costs had been included, your costs would have been higher.
This example illustrates your Portfolio’s ongoing costs in two ways:
Actual Expenses
The second and third data columns in the table below provide information about actual account values and actual expenses. You may use the information in these columns, together with the amount you invested, to estimate the expenses that you paid during the six months ended June
30, 2021. Simply divide your account value by $1,000 (for example, an $8,600 account value divided by $1,000 = 8.6), then multiply the result by the number under the heading entitled “Expenses Paid During Period” to estimate the expenses you paid on your account during this period.
Hypothetical Example for Comparison Purposes
The fourth and fifth data columns in the table below provide information about hypothetical account values and hypothetical expenses based on the Portfolio’s actual expense ratio and an assumed rate of return of 5% per year before expenses, which is not the Portfolio’s actual return. The hypothetical account values and expenses may not be used to estimate the actual ending account balances or expenses you paid for the six-month period shown. You may use this information to compare the ongoing costs of investing in the Portfolio with the ongoing costs of investing in other mutual funds. To do so, compare this 5% hypothetical example with the 5% hypothetical examples that appear in the shareholder reports of the other mutual funds.
Please note that the expenses shown in the table are meant to highlight your ongoing costs only and do not reflect any transactional costs, such as exchange fees or sales charges (loads). Therefore, the fourth and fifth data columns of the table are useful in comparing ongoing costs only and will not help you determine the relative total costs of owning different funds. In addition, if these transactional costs were included, your costs would have been higher.
| Share Class | Beginning
Account
Value
1/1/21 | Ending Account
Value (Based
on Actual
Returns and
Expenses)
6/30/21 | Expenses
Paid
During
Period1 | Ending Account
Value (Based
on Hypothetical
5% Annualized
Return and
Actual Expenses)
6/30/21 | Expenses
Paid
During
Period1 | Net Expense
Ratio
During
Period2 |
| Initial Class Shares | $1,000.00 | $1,071.90 | $3.19 | $1,021.72 | $3.11 | 0.62% |
| Service Class Shares | $1,000.00 | $1,070.60 | $4.47 | $1,020.48 | $4.36 | 0.87% |
| 1. | Expenses are equal to the Portfolio’s annualized expense ratio of each class multiplied by the average account value over the period, divided by 365 and multiplied by 181 (to reflect the six-month period). The table above represents the actual expenses incurred during the six-month period. In addition to the fees and expenses which the Portfolio bears directly, it also indirectly bears a pro rata share of the fees and expenses of the underlying funds in which it invests. Such indirect expenses are not included in the above-reported expense figures. |
| 2. | Expenses are equal to the Portfolio's annualized expense ratio to reflect the six-month period. |
| 6 | MainStay VP Income Builder Portfolio |
Portfolio Composition as of June 30, 2021 (Unaudited)
See Portfolio of Investments beginning on page 11 for specific holdings within these categories. The Portfolio's holdings are subject to change.
Top Ten Holdings or Issuers Held as of June 30, 2021 (excluding short-term investments) (Unaudited)
| 1. | U.S. Treasury Notes, 0.125%-1.625%, due 4/30/23–5/15/31 |
| 2. | JPMorgan Chase & Co. |
| 3. | GNMA, 1.00%-3.25%, due 8/16/41–6/20/51 |
| 4. | U.S. Treasury Bonds, 1.875%-4.375%, due 11/15/39–5/15/51 |
| 5. | Bank of America Corp., 2.087%-6.30%, due 12/20/23–4/23/40 |
| 6. | U.S. Treasury Inflation Linked Notes, 0.125%-0.875%, due 1/15/29–7/15/30 |
| 7. | Apple, Inc. |
| 8. | AbbVie, Inc. |
| 9. | Microsoft Corp. |
| 10. | FNMA, 2.50%-3.742%, due 7/25/29–3/25/60 |
Portfolio Management Discussion and Analysis (Unaudited)
Questions answered by portfolio managers Jae S. Yoon, CFA, and Jonathan Swaney of New York Life Investment Management LLC, the Portfolio’s Manager; Stephen R. Cianci, CFA, and Neil Moriarty III, of MacKay Shields LLC (“MacKay Shields”), the Subadvisor for the fixed-income portion of the Portfolio; and William W. Priest, CFA, Michael A. Welhoelter, CFA, John Tobin, PhD, CFA, and Kera Van Valen, CFA, of Epoch Investment Partners, Inc. (“Epoch”), the Subadvisor for the equity portion of the Portfolio.
How did MainStay VP Income Builder Portfolio perform relative to its benchmarks and peers during the six months ended June 30, 2021?
For the six months ended June 30, 2021, MainStay VP Income Builder Portfolio returned 7.19% for Initial Class shares and 7.06% for Service Class shares. Over the same period, both share classes underperformed the 13.05% return of the MSCI World Index (Net), which is the Portfolio’s primary benchmark; outperformed the −1.60% return of the Bloomberg Barclays U.S. Aggregate Bond Index, which is the Portfolio’s secondary benchmark; and outperformed the 7.01% return of the Blended Benchmark Index, which is an additional benchmark of the Portfolio. For the six months ended June 30, 2021, both share classes underperformed the 8.65% return of the Morningstar World Allocation Category Average.1
What factors affected the relative performance of the equity portion of the Portfolio during the reporting period?
In the equity portion of the Portfolio performance relative to the MSCI World Index (Net) was helped by stock selection across several sectors, including industrials, real estate, information technology, consumer discretionary, consumer staples and utilities. An overweight position in the energy sector also supported relative performance. Detractors from relative performance included stock selection in the energy, financials, communication services and health care sectors. A relatively overweight position in the utilities sector was also a negative factor.
During the reporting period, were there any market events that materially impacted the equity portion of the Portfolio’s performance or liquidity?
Stocks advanced as the vaccination rollout accelerated across most developed markets, businesses reopened and a rapid economic recovery supported a rebound in earnings. The first quarter of 2021 was marked by a spike in bond yields, concerns about inflation and market leadership by cyclical stocks. The second quarter saw bond yields ease in the United States and Japan, and begin to ease mid-quarter in Europe. The second quarter also witnessed the "reopen/reflation trade" lose steam, with cyclical stocks lagging and a handful of large technology,
communication services and e-commerce stocks reasserting their market dominance.
Which market segments were the strongest positive contributors to relative performance in the equity portion of the Portfolio, and which market segments detracted the most?
During the reporting period, the strongest positive contributions to the performance of the equity portion of the Portfolio relative to the MSCI World Index (Net) came from favorable stock selection in the industrials, real estate and consumer discretionary sectors. (Contributions take weightings and total returns into account.) The weakest contributing sector was communication services due to stock selection, as the sector’s gains were dominated by a handful of Internet-related companies that did not pay dividends and were therefore outside of the Portfolio’s investable universe. The next-weakest sectors in terms of relative returns were financials and health care due to stock selection.
During the reporting period, which individual stocks made the strongest positive contributions to absolute performance in the equity portion of the Portfolio and which stocks detracted the most?
The strongest positive contributors to the absolute performance of the equity portion of the Portfolio included positions in data and records management company Iron Mountain, software and cloud services provider Microsoft, and insurer MetLife. Iron Mountain shares rose in response to a favorable earnings report that included modest upward revisions to full-year guidance for revenues, EBITDA (earnings before interest, taxes, depreciation, and amortization) and funds from operations. Microsoft stock outperformed on sustained demand for the company’s cloud offerings as its customers increasingly chose and expanded their use of Azure. The rest of Microsoft’s businesses continued to benefit from growth in subscription services and digitization. MetLife shares traded higher on strong financial results. The company executed well and delivered along multiple fronts with top-line growth across business lines and geographies, limited COVID-19 impacts and good expense control. It also approved a $3 billion share buyback program and stated its intention to complete the program in 2021.
| 1. | See page 5 for more information on benchmark and peer group returns. |
| 8 | MainStay VP Income Builder Portfolio |
The weakest contributors to the absolute performance of the equity portion of the Portfolio included positions in drug company Takeda Pharmaceutical, insurer and asset manager Tokio Marine, and gaming company Las Vegas Sands. Takeda shares underperformed after the company announced plans to significantly increase near-term R&D investment to support its promising pipeline. Tokio Marine shares traded lower after the company’s May 2021 earnings release showed results modestly below expectations. Las Vegas Sands underperformed as visitation trends, though sequentially improving, remained well below normal levels due to ongoing travel restrictions and testing requirements related to the COVID-19 pandemic.
Did the equity portion of the Portfolio make any significant purchases or sales during the reporting period?
The Portfolio initiated positions in utility company NextEra Energy and industrial gas company Linde during the reporting period. NextEra Energy not only operates regulated electric utilities in Florida but is also the world's largest generator of renewable energy from solar and wind. The company generates strong cash flows both from the regulated operations that are under constructive regulations and through attractive long-term contracts for its renewable generation assets. Cash flow growth is driven by continued investment in the regulated generation, transmission and distribution rate bases, and from completing a strong backlog of projects in developing, constructing and operating contracted renewable assets. NextEra has a strong balance sheet and has historically rewarded its shareholders with an attractive and growing dividend. Linde generates strong cash flow by distributing its products through various profitable methods, such as on-site, merchant and packaged gases. Cash flow growth comes from exposure to fast-growing markets such as health care and electronics, and expansions in geographies with strong industrial growth. It has a strong project backlog and is well-positioned to offer clean energy solutions with its expertise in carbon dioxide and hydrogen. Linde has historically rewarded its shareholders with an attractive and growing dividend and regular share buybacks.
During the same period, the Portfolio’s full positions in automotive logistics company Hyundai Glovis and industrial tool maker Atlas Copco were sold to fund other shareholder yield opportunities.
How did sector weightings in the equity portion of the Portfolio change during the reporting period?
During the reporting period, the most substantial weighting increase in the equity portion of the Portfolio was in consumer discretionary, lessening the degree to which the Portfolio held underweight exposure to that sector. Conversely, the Portfolio reduced its exposure to communication services, increasing the degree of its underweight exposure to that sector.
How was the equity portion of the Portfolio positioned at the end of the reporting period?
Relative to the MSCI World Index (Net), as of June 30, 2021, the most substantially overweight sector positions in the equity portion of the Portfolio were in utilities, consumer staples and energy. As of the same date, the most substantially underweight sector positions relative to the benchmark were in information technology, consumer discretionary and communication services. These relative weightings were the result of individual stock selections rather than a top-down macroeconomic view.
What factors affected the relative performance of the fixed-income portion of the Portfolio during the reporting period?
Overall risk continued to rally throughout the reporting period assisted by the acceleration of actual vaccinations in the first quarter of 2021 globally. Additionally, the fiscal packages that were passed by the U.S. Congress helped to propel risk assets higher. Lastly, the U.S. Federal Reserve’s monetary policy remained accommodative. All these factors were catalysts that led to risk assets outperforming.
The fixed-income portion of the Portfolio outperformed the Bloomberg Barclays U.S. Aggregate Bond Index during the reporting period due to relatively overweight exposure to corporate bonds, both investment grade and high yield.
What was the duration2 strategy of the fixed-income portion of the Portfolio during the reporting period?
We extended the duration of the fixed-income portion of the Portfolio during the reporting period to be longer than that of the Bloomberg Barclays U.S. Aggregate Bond Index, detracting from performance relative to the benchmark. The Portfolio’s overall duration shifted as the reporting period progressed, but always maintained longer than that of the benchmark. As of June 30,
| 2. | Duration is a measure of the price sensitivity of a fixed-income investment to changes in interest rates. Duration is expressed as a number of years and is considered a more accurate sensitivity gauge than average maturity. |
2021, the Portfolio’s duration stood at 6.46 years, 0.06 years longer than the benchmark duration.
During the reporting period, which market segments were the strongest positive contributors to the absolute performance of the fixed-income portion of the Portfolio and which market segments were particularly weak?
The Portfolio’s overweight exposure to securitized3 products, equity-linked and high-yield debt, contributed positively to absolute performance during the reporting period. Conversely, interest rates rose, detracting modestly from the Portfolio’s total returns.
Did the fixed-income portion of the Portfolio make any significant purchases or sales during the reporting period?
A robust primary calendar for corporate credit offered several opportunities to introduce new names into the Portfolio among midstream, financials and consumer non-cyclical industries. Meanwhile, we trimmed higher-quality credits with limited total return potential as spreads narrowed, reducing the Portfolio’s overall exposure to the sector.
How did sector weightings change in the fixed-income portion of the Portfolio during the reporting period?
During the reporting period, we reduced the Portfolio’s exposure to the investment-grade sector as spreads continued to tighten.
How was the fixed-income portion of the Portfolio positioned at the end of the reporting period?
As of June 30, 2021, relative to the Bloomberg Barclays U.S. Aggregate Bond Index, the fixed-income portion of the Portfolio held overweight exposure to high-yield and investment-grade corporate bonds, along with securitized assets. As of the same date, the fixed-income portion of the Portfolio held underweight exposure to U.S. Treasury securities and agency mortgages.
| 3. | A securitization is a financial instrument created by an issuer by combining a pool of financial assets (such as mortgages). The financial instrument is then marketed to investors, sometimes in tiers. |
The opinions expressed are those of the portfolio managers as of the date of this report and are subject to change. There is no guarantee that any forecasts will come to pass. This material does not constitute investment advice and is not intended as an endorsement of any specific investment.
Not all MainStay VP Portfolios and/or share classes are available under all policies.
| 10 | MainStay VP Income Builder Portfolio |
Portfolio of Investments June 30, 2021† (Unaudited)
| | Principal
Amount | Value |
| Long-Term Bonds 50.3% |
| Asset-Backed Securities 4.1% |
| Automobile Asset-Backed Securities 1.2% |
| Avis Budget Rental Car Funding AESOP LLC | | |
| Series 2021-1A, Class A | | |
| 1.38%, due 8/20/27 (a) | $ 1,000,000 | $ 998,421 |
| Series 2020-2A, Class A | | |
| 2.02%, due 2/20/27 (a) | 360,000 | 370,699 |
| Series 2020-1A, Class A | | |
| 2.33%, due 8/20/26 (a) | 515,000 | 536,701 |
| Chase Auto Credit Linked Notes | | |
| Series 2020-1, Class B | | |
| 0.991%, due 1/25/28 (a) | 516,719 | 518,218 |
| Ford Credit Auto Owner Trust | | |
| Series 2020-2, Class A | | |
| 1.06%, due 4/15/33 (a) | 645,000 | 644,282 |
| Series 2020-1, Class A | | |
| 2.04%, due 8/15/31 (a) | 680,000 | 705,778 |
| Ford Credit Floorplan Master Owner Trust | | |
| Series 2019-4, Class A | | |
| 2.44%, due 9/15/26 | 850,000 | 894,572 |
| Series 2017-3, Class A | | |
| 2.48%, due 9/15/24 | 895,000 | 918,970 |
| Series 2018-4, Class A | | |
| 4.06%, due 11/15/30 | 530,000 | 609,317 |
| Hertz Vehicle Financing III LP | | |
| Series 2021-2A, Class A | | |
| 1.68%, due 12/27/27 (a) | 805,000 | 803,926 |
| Series 2021-2A, Class B | | |
| 2.12%, due 12/27/27 (a) | 175,000 | 174,713 |
| Hertz Vehicle Financing LLC | | |
| Series 2021-1A, Class B | | |
| 1.56%, due 12/26/25 (a) | 520,000 | 519,755 |
| Santander Revolving Auto Loan Trust | | |
| Series 2019-A, Class A | | |
| 2.51%, due 1/26/32 (a) | 330,000 | 347,722 |
| | | 8,043,074 |
| Credit Card Asset-Backed Security 0.1% |
| Capital One Multi-Asset Execution Trust | | |
| Series 2019-A3, Class A3 | | |
| 2.06%, due 8/15/28 | 700,000 | 734,047 |
| | Principal
Amount | Value |
| |
| Home Equity Asset-Backed Securities 0.2% |
| Carrington Mortgage Loan Trust | | |
| Series 2007-HE1, Class A3 | | |
| 0.281% (1 Month LIBOR + 0.19%), due 6/25/37 (b) | $ 1,269,066 | $ 1,251,671 |
| JP Morgan Mortgage Acquisition Trust | | |
| Series 2007-HE1, Class AF1 | | |
| 0.191% (1 Month LIBOR + 0.10%), due 3/25/47 (b) | 139,791 | 89,608 |
| MASTR Asset-Backed Securities Trust | | |
| Series 2006-HE4, Class A1 | | |
| 0.191% (1 Month LIBOR + 0.10%), due 11/25/36 (b) | 209,157 | 93,499 |
| | | 1,434,778 |
| Other Asset-Backed Securities 2.6% |
| American Airlines Pass-Through Trust | | |
| Series 2016-2, Class A | | |
| 3.65%, due 6/15/28 | 594,185 | 574,672 |
| Series 2019-1, Class B | | |
| 3.85%, due 2/15/28 | 506,669 | 483,060 |
| Series 2013-2, Class A | | |
| 4.95%, due 1/15/23 | 1,602,382 | 1,625,878 |
| American Tower Trust #1 | | |
| 3.07%, due 3/15/23 (a) | 175,000 | 175,851 |
| CF Hippolyta LLC | | |
| Series 2021-1A, Class A1 | | |
| 1.53%, due 3/15/61 (a) | 550,000 | 553,673 |
| Series 2020-1, Class A1 | | |
| 1.69%, due 7/15/60 (a) | 906,660 | 921,291 |
| Series 2020-1, Class A2 | | |
| 1.99%, due 7/15/60 (a) | 520,096 | 527,931 |
| Crown Castle Towers LLC | | |
| 4.241%, due 7/15/28 (a) | 990,000 | 1,117,416 |
| CVS Pass-Through Trust | | |
| 5.789%, due 1/10/26 (a) | 22,942 | 25,159 |
| FirstKey Homes 2020-SFR1 Trust | | |
| Series 2021-SFR1, Class A | | |
| 1.538%, due 8/17/28 (a)(c) | 1,165,000 | 1,165,308 |
| MMAF Equipment Finance LLC | | |
| Series 2020-BA, Class A4 | | |
| 0.66%, due 11/15/27 (a) | 1,500,000 | 1,489,515 |
| MVW LLC | | |
| Series 2019-2A, Class A | | |
| 2.22%, due 10/20/38 (a) | 605,103 | 615,923 |
| Navient Private Education Refi Loan Trust | | |
| Series 2020-DA, Class A | | |
| 1.69%, due 5/15/69 (a) | 285,839 | 288,707 |
The notes to the financial statements are an integral part of, and should be read in conjunction with, the financial statements.
11
Portfolio of Investments June 30, 2021† (Unaudited) (continued)
| | Principal
Amount | Value |
| Asset-Backed Securities (continued) |
| Other Asset-Backed Securities (continued) |
| Navient Private Education Refi Loan Trust (continued) | | |
| Series 2020-EA, Class A | | |
| 1.69%, due 5/15/69 (a) | $ 450,994 | $ 458,121 |
| PFS Financing Corp. | | |
| Series 2020-B, Class B | | |
| 1.71%, due 6/15/24 (a) | 355,000 | 358,521 |
| Series 2020-A, Class B | | |
| 1.77%, due 6/15/25 (a) | 765,000 | 776,589 |
| Progress Residential | | |
| Series 2021-SFR1, Class A | | |
| 1.052%, due 4/17/38 (a) | 765,000 | 750,564 |
| Series 2021-SFR3, Class A | | |
| 1.637%, due 5/17/26 (a) | 389,457 | 391,972 |
| Series 2021-SFR4, Class B | | |
| 1.808%, due 5/17/38 (a) | 670,000 | 670,268 |
| Progress Residential Trust | | |
| Series 2021-SFR2, Class A | | |
| 1.546%, due 4/19/38 (a) | 350,000 | 350,987 |
| Series 2021-SFR2, Class B | | |
| 1.796%, due 4/19/38 (a) | 1,050,000 | 1,048,109 |
| Sierra Timeshare Receivables Funding LLC | | |
| Series 2020-2A, Class A | | |
| 1.33%, due 7/20/37 (a) | 393,790 | 395,836 |
| Series 2020-2A, Class C | | |
| 3.51%, due 7/20/37 (a) | 856,493 | 884,393 |
| U.S. Airways Pass-Through Trust | | |
| Series 2012-1, Class A | | |
| 5.90%, due 10/1/24 | 525,475 | 549,061 |
| Series 2010-1, Class A | | |
| 6.25%, due 4/22/23 | 265,806 | 270,279 |
| United Airlines Pass-Through Trust | | |
| Series 2014-2, Class B | | |
| 4.625%, due 9/3/22 | 244,946 | 250,452 |
| Series 2020-1, Class A | | |
| 5.875%, due 10/15/27 | 808,902 | 897,544 |
| Series 2007-1 | | |
| 6.636%, due 7/2/22 | 322,035 | 333,306 |
| | | 17,950,386 |
Total Asset-Backed Securities
(Cost $27,359,355) | | 28,162,285 |
| | Principal
Amount | Value |
| Corporate Bonds 28.8% |
| Aerospace & Defense 0.2% |
| BAE Systems plc | | |
| 3.00%, due 9/15/50 (United Kingdom) (a) | $ 550,000 | $ 538,072 |
| L3Harris Technologies, Inc. | | |
| 4.40%, due 6/15/28 | 810,000 | 940,292 |
| | | 1,478,364 |
| Agriculture 0.1% |
| BAT Capital Corp. | | |
| 3.734%, due 9/25/40 (United Kingdom) | 905,000 | 884,287 |
| Airlines 0.6% |
| American Airlines, Inc. | | |
| 5.50%, due 4/20/26 (a) | 600,000 | 635,250 |
| 5.75%, due 4/20/29 (a) | 360,000 | 389,250 |
| Delta Air Lines, Inc. | | |
| 4.50%, due 10/20/25 (a) | 465,000 | 499,699 |
| 4.75%, due 10/20/28 (a) | 325,000 | 361,321 |
| 7.00%, due 5/1/25 (a) | 985,000 | 1,149,483 |
| Mileage Plus Holdings LLC | | |
| 6.50%, due 6/20/27 (a) | 795,000 | 875,295 |
| | | 3,910,298 |
| Auto Manufacturers 1.0% |
| Ford Motor Co. | | |
| 8.50%, due 4/21/23 | 890,000 | 993,195 |
| 9.00%, due 4/22/25 | 890,000 | 1,097,254 |
| Ford Motor Credit Co. LLC | | |
| 4.063%, due 11/1/24 | 780,000 | 829,647 |
| 4.25%, due 9/20/22 | 305,000 | 314,934 |
| General Motors Co. | | |
| 6.125%, due 10/1/25 | 285,000 | 337,384 |
| General Motors Financial Co., Inc. | | |
| 2.35%, due 1/8/31 | 344,000 | 339,425 |
| 2.70%, due 6/10/31 | 850,000 | 853,056 |
| 3.15%, due 6/30/22 | 320,000 | 327,667 |
| 3.45%, due 4/10/22 | 1,500,000 | 1,527,618 |
| | | 6,620,180 |
| Banks 7.4% |
| Bank of America Corp. | | |
| 2.087%, due 6/14/29 (d) | 715,000 | 720,786 |
| 2.496%, due 2/13/31 (d) | 650,000 | 663,646 |
| 3.004%, due 12/20/23 (d) | 734,000 | 760,680 |
| 3.458%, due 3/15/25 (d) | 1,425,000 | 1,523,018 |
| 3.705%, due 4/24/28 (d) | 555,000 | 613,709 |
The notes to the financial statements are an integral part of, and should be read in conjunction with, the financial statements.
| 12 | MainStay VP Income Builder Portfolio |
| | Principal
Amount | Value |
| Corporate Bonds (continued) |
| Banks (continued) |
| Bank of America Corp. (continued) | | |
| 4.078%, due 4/23/40 (d) | $ 785,000 | $ 915,800 |
| 4.20%, due 8/26/24 | 325,000 | 356,276 |
| Series MM | | |
| 4.30%, due 1/28/25 (d)(e) | 1,461,000 | 1,510,674 |
| Series DD | | |
| 6.30%, due 3/10/26 (d)(e) | 735,000 | 848,124 |
| BNP Paribas SA (France) | | |
| 3.052%, due 1/13/31 (a)(d) | 1,415,000 | 1,491,849 |
| 4.625% (5 Year Treasury Constant Maturity Rate + 3.34%), due 2/25/31 (a)(b)(e) | 620,000 | 645,432 |
| Citigroup, Inc. | | |
| 2.976%, due 11/5/30 (d) | 845,000 | 895,009 |
| 3.352%, due 4/24/25 (d) | 780,000 | 831,131 |
| 3.668%, due 7/24/28 (d) | 430,000 | 474,239 |
| 3.70%, due 1/12/26 | 545,000 | 602,696 |
| 3.98%, due 3/20/30 (d) | 565,000 | 639,945 |
| 4.05%, due 7/30/22 | 105,000 | 109,090 |
| 5.30%, due 5/6/44 | 436,000 | 587,101 |
| 6.625%, due 6/15/32 | 190,000 | 258,739 |
| Citizens Financial Group, Inc. | | |
| 2.638%, due 9/30/32 | 1,190,000 | 1,190,023 |
| Credit Suisse Group AG (Switzerland) | | |
| 2.593%, due 9/11/25 (a)(d) | 1,265,000 | 1,316,074 |
| 3.091%, due 5/14/32 (a)(d) | 785,000 | 808,748 |
| Deutsche Bank AG | | |
| 3.035%, due 5/28/32 (Germany) (d) | 425,000 | 432,160 |
| First Horizon Bank | | |
| 5.75%, due 5/1/30 | 815,000 | 1,004,866 |
| First Horizon Corp. | | |
| 4.00%, due 5/26/25 | 775,000 | 853,802 |
| Freedom Mortgage Corp. | | |
| 7.625%, due 5/1/26 (a) | 685,000 | 713,085 |
| Goldman Sachs Group, Inc. (The) | | |
| 1.326% (3 Month LIBOR + 1.17%), due 5/15/26 (b) | 815,000 | 836,532 |
| 1.431%, due 3/9/27 (d) | 535,000 | 533,492 |
| 1.992%, due 1/27/32 (d) | 590,000 | 573,005 |
| 2.615%, due 4/22/32 (d) | 425,000 | 434,166 |
| 2.905%, due 7/24/23 (d) | 310,000 | 317,779 |
| 2.908%, due 6/5/23 (d) | 285,000 | 291,326 |
| 3.625%, due 1/22/23 | 1,330,000 | 1,396,245 |
| 5.25%, due 7/27/21 | 1,295,000 | 1,299,506 |
| 6.75%, due 10/1/37 | 159,000 | 231,531 |
| | Principal
Amount | Value |
| |
| Banks (continued) |
| HSBC Holdings plc | | |
| 3.973%, due 5/22/30 (United Kingdom) (d) | $ 970,000 | $ 1,085,698 |
| JPMorgan Chase & Co. | | |
| 2.182%, due 6/1/28 (d) | 835,000 | 855,024 |
| 2.956%, due 5/13/31 (d) | 475,000 | 498,991 |
| 3.207%, due 4/1/23 (d) | 1,540,000 | 1,573,426 |
| 3.54%, due 5/1/28 (d) | 850,000 | 934,545 |
| Series HH | | |
| 4.60%, due 2/1/25 (d)(e) | 1,249,000 | 1,294,339 |
| Lloyds Banking Group plc (United Kingdom) | | |
| 4.582%, due 12/10/25 | 508,000 | 570,807 |
| 4.65%, due 3/24/26 | 1,075,000 | 1,216,969 |
| Morgan Stanley | | |
| 3.125%, due 1/23/23 | 1,560,000 | 1,626,478 |
| Series H | | |
| 3.794% (3 Month LIBOR + 3.61%), due 7/15/21 (b)(e) | 645,000 | 647,419 |
| 5.00%, due 11/24/25 | 1,150,000 | 1,325,807 |
| 6.25%, due 8/9/26 | 881,000 | 1,088,716 |
| 7.25%, due 4/1/32 | 100,000 | 145,378 |
| Natwest Group plc | | |
| 3.073% (1 Year Treasury Constant Maturity Rate + 2.55%), due 5/22/28 (United Kingdom) (b) | 1,580,000 | 1,667,314 |
| PNC Bank NA | | |
| 2.55%, due 12/9/21 | 815,000 | 821,898 |
| PNC Financial Services Group, Inc. (The) | | |
| 2.55%, due 1/22/30 | 810,000 | 852,043 |
| Societe Generale SA (France) | | |
| 4.75% (5 Year Treasury Constant Maturity Rate + 3.931%), due 5/26/26 (a)(b)(e) | 395,000 | 409,319 |
| 5.375% (5 Year Treasury Constant Maturity Rate + 4.514%), due 11/18/30 (a)(b)(e) | 1,415,000 | 1,498,131 |
| Standard Chartered plc (United Kingdom) | | |
| 2.678% (1 Year Treasury Constant Maturity Rate + 1.20%), due 6/29/32 (a)(b) | 655,000 | 657,169 |
| 4.75% (5 Year Treasury Constant Maturity Rate + 3.805%), due 1/14/31 (a)(b)(e) | 525,000 | 540,209 |
The notes to the financial statements are an integral part of, and should be read in conjunction with, the financial statements.
13
Portfolio of Investments June 30, 2021† (Unaudited) (continued)
| | Principal
Amount | Value |
| Corporate Bonds (continued) |
| Banks (continued) |
| SVB Financial Group | | |
| Series C | | |
| 4.00% (5 Year Treasury Constant Maturity Rate + 3.202%), due 5/15/26 (b)(e) | $ 770,000 | $ 783,706 |
| Truist Bank | | |
| 2.636% (5 Year Treasury Constant Maturity Rate + 1.15%), due 9/17/29 (b) | 760,000 | 795,788 |
| UBS Group AG | | |
| 4.375% (5 Year Treasury Constant Maturity Rate + 3.313%), due 2/10/31 (Switzerland) (a)(b)(e) | 1,005,000 | 1,026,808 |
| Wachovia Corp. | | |
| 5.50%, due 8/1/35 | 700,000 | 904,319 |
| Wells Fargo & Co. | | |
| 2.406%, due 10/30/25 (d) | 525,000 | 549,292 |
| Wells Fargo Bank NA | | |
| 3.55%, due 8/14/23 | 1,015,000 | 1,080,574 |
| | | 51,130,451 |
| Beverages 0.3% |
| Anheuser-Busch Cos. LLC | | |
| 4.70%, due 2/1/36 (Belgium) | 475,000 | 582,988 |
| Anheuser-Busch InBev Worldwide, Inc. | | |
| 4.75%, due 1/23/29 (Belgium) | 1,270,000 | 1,512,906 |
| | | 2,095,894 |
| Biotechnology 0.2% |
| Biogen, Inc. | | |
| 3.625%, due 9/15/22 | 1,240,000 | 1,288,281 |
| Building Materials 0.6% |
| Builders FirstSource, Inc. | | |
| 5.00%, due 3/1/30 (a) | 820,000 | 862,189 |
| 6.75%, due 6/1/27 (a) | 438,000 | 469,208 |
| Carrier Global Corp. | | |
| 2.722%, due 2/15/30 | 940,000 | 974,513 |
| Cemex SAB de CV | | |
| 3.125%, due 3/19/26 (Mexico) (a) | EUR 1,515,000 | 1,846,136 |
| | | 4,152,046 |
| Chemicals 0.6% |
| Air Liquide Finance SA | | |
| 1.75%, due 9/27/21 (France) (a) | $ 610,000 | 611,494 |
| Braskem Netherlands Finance BV | | |
| 4.50%, due 1/10/28 (Brazil) (a) | 745,000 | 785,007 |
| | Principal
Amount | Value |
| |
| Chemicals (continued) |
| Huntsman International LLC | | |
| 4.50%, due 5/1/29 | $ 731,000 | $ 831,108 |
| International Flavors & Fragrances, Inc. | | |
| 1.832%, due 10/15/27 (a) | 990,000 | 987,187 |
| Orbia Advance Corp. SAB de CV | | |
| 4.00%, due 10/4/27 (Mexico) (a) | 625,000 | 685,156 |
| | | 3,899,952 |
| Commercial Services 0.6% |
| Allied Universal Holdco LLC | | |
| 6.625%, due 7/15/26 (a) | 650,000 | 689,149 |
| Ashtead Capital, Inc. | | |
| 4.00%, due 5/1/28 (United Kingdom) (a) | 380,000 | 399,475 |
| California Institute of Technology | | |
| 3.65%, due 9/1/19 | 605,000 | 674,271 |
| Cintas Corp. No. 2 | | |
| 3.70%, due 4/1/27 | 1,065,000 | 1,193,297 |
| Sodexo, Inc. | | |
| 2.718%, due 4/16/31 (France) (a) | 1,010,000 | 1,030,490 |
| | | 3,986,682 |
| Computers 0.6% |
| Apple, Inc. | | |
| 2.75%, due 1/13/25 | 715,000 | 764,373 |
| Dell International LLC | | |
| 4.90%, due 10/1/26 | 680,000 | 784,777 |
| 5.30%, due 10/1/29 | 318,000 | 383,709 |
| 8.10%, due 7/15/36 | 975,000 | 1,486,023 |
| NCR Corp. | | |
| 5.00%, due 10/1/28 (a) | 991,000 | 1,024,763 |
| | | 4,443,645 |
| Distribution & Wholesale 0.2% |
| Performance Food Group, Inc. | | |
| 5.50%, due 10/15/27 (a) | 1,113,000 | 1,169,707 |
| Diversified Financial Services 1.9% |
| AerCap Ireland Capital DAC (Ireland) | | |
| 3.30%, due 1/23/23 | 730,000 | 757,122 |
| 4.45%, due 12/16/21 | 285,000 | 289,327 |
| 4.625%, due 7/1/22 | 415,000 | 431,533 |
| Air Lease Corp. | | |
| 2.30%, due 2/1/25 | 1,215,000 | 1,256,045 |
| 2.75%, due 1/15/23 | 500,000 | 515,862 |
| 3.50%, due 1/15/22 | 340,000 | 345,622 |
| 4.25%, due 9/15/24 | 420,000 | 457,829 |
The notes to the financial statements are an integral part of, and should be read in conjunction with, the financial statements.
| 14 | MainStay VP Income Builder Portfolio |
| | Principal
Amount | Value |
| Corporate Bonds (continued) |
| Diversified Financial Services (continued) |
| Aircastle Ltd. | | |
| 5.25% (5 Year Treasury Constant Maturity Rate + 4.41%), due 6/15/26 (a)(b)(e) | $ 485,000 | $ 489,850 |
| Ally Financial, Inc. | | |
| 3.875%, due 5/21/24 | 310,000 | 334,038 |
| 8.00%, due 11/1/31 | 1,560,000 | 2,241,795 |
| Aviation Capital Group LLC | | |
| 1.95%, due 1/30/26 (a) | 520,000 | 520,140 |
| Avolon Holdings Funding Ltd. (Ireland) | | |
| 2.125%, due 2/21/26 (a) | 645,000 | 642,329 |
| 2.875%, due 2/15/25 (a) | 1,040,000 | 1,070,786 |
| Banco BTG Pactual SA | | |
| 2.75%, due 1/11/26 (Brazil) (a) | 1,130,000 | 1,101,185 |
| Capital One Financial Corp. | | |
| 4.20%, due 10/29/25 | 165,000 | 184,253 |
| Home Point Capital, Inc. | | |
| 5.00%, due 2/1/26 (a) | 465,000 | 433,613 |
| Intercontinental Exchange, Inc. | | |
| 3.00%, due 9/15/60 | 845,000 | 814,684 |
| OneMain Finance Corp. | | |
| 3.50%, due 1/15/27 | 375,000 | 377,813 |
| PennyMac Financial Services, Inc. | | |
| 4.25%, due 2/15/29 (a) | 545,000 | 525,058 |
| 5.375%, due 10/15/25 (a) | 150,000 | 157,875 |
| | | 12,946,759 |
| Electric 1.0% |
| Connecticut Light and Power Co. (The) | | |
| 4.00%, due 4/1/48 | 450,000 | 544,383 |
| Duke Energy Ohio, Inc. | | |
| 4.30%, due 2/1/49 | 565,000 | 697,835 |
| Duquesne Light Holdings, Inc. | | |
| 3.616%, due 8/1/27 (a) | 865,000 | 938,198 |
| Entergy Louisiana LLC | | |
| 4.00%, due 3/15/33 | 790,000 | 925,623 |
| Evergy, Inc. | | |
| 5.292%, due 6/15/22 (f) | 500,000 | 516,557 |
| Jersey Central Power & Light Co. | | |
| 2.75%, due 3/1/32 (a) | 700,000 | 710,564 |
| Public Service Electric and Gas Co. | | |
| 3.00%, due 5/15/27 | 800,000 | 864,563 |
| Puget Energy, Inc. | | |
| 5.625%, due 7/15/22 | 350,000 | 364,022 |
| Southern California Edison Co. | | |
| Series E | | |
| 3.70%, due 8/1/25 | 330,000 | 359,435 |
| | Principal
Amount | Value |
| |
| Electric (continued) |
Southern California Edison Co.
(continued) | | |
| 4.00%, due 4/1/47 | $ 520,000 | $ 546,989 |
| WEC Energy Group, Inc. | | |
| 2.268% (3 Month LIBOR + 2.112%), due 5/15/67 (b) | 480,000 | 440,741 |
| | | 6,908,910 |
| Environmental Control 0.2% |
| Republic Services, Inc. | | |
| 4.75%, due 5/15/23 | 316,000 | 338,067 |
| Stericycle, Inc. | | |
| 3.875%, due 1/15/29 (a) | 120,000 | 119,764 |
| Waste Management, Inc. | | |
| 2.40%, due 5/15/23 | 810,000 | 837,724 |
| | | 1,295,555 |
| Food 1.4% |
| JBS USA Food Co. | | |
| 7.00%, due 1/15/26 (a) | 230,000 | 243,800 |
| Kraft Heinz Foods Co. | | |
| 4.25%, due 3/1/31 | 1,267,000 | 1,439,298 |
| 5.00%, due 7/15/35 | 501,000 | 614,537 |
| Mondelez International Holdings Netherlands BV | | |
| 2.00%, due 10/28/21 (a) | 1,110,000 | 1,114,686 |
| Nestle Holdings, Inc. | | |
| 1.00%, due 9/15/27 (a) | 1,750,000 | 1,707,343 |
| 3.10%, due 9/24/21 (a) | 1,615,000 | 1,621,876 |
| Smithfield Foods, Inc. | | |
| 3.35%, due 2/1/22 (a) | 565,000 | 572,942 |
| 4.25%, due 2/1/27 (a) | 500,000 | 546,549 |
| Sysco Corp. | | |
| 3.30%, due 2/15/50 | 465,000 | 467,362 |
| 5.95%, due 4/1/30 | 352,000 | 451,461 |
| Tyson Foods, Inc. | | |
| 3.95%, due 8/15/24 | 965,000 | 1,051,713 |
| | | 9,831,567 |
| Gas 0.1% |
| National Fuel Gas Co. | | |
| 2.95%, due 3/1/31 | 355,000 | 357,060 |
| Southern California Gas Co. | | |
| Series VV | | |
| 4.30%, due 1/15/49 | 325,000 | 405,548 |
| | | 762,608 |
The notes to the financial statements are an integral part of, and should be read in conjunction with, the financial statements.
15
Portfolio of Investments June 30, 2021† (Unaudited) (continued)
| | Principal
Amount | Value |
| Corporate Bonds (continued) |
| Healthcare-Products 0.1% |
| Abbott Laboratories | | |
| 3.40%, due 11/30/23 | $ 535,000 | $ 570,953 |
| Healthcare-Services 0.3% |
| Health Care Service Corp. A Mutual Legal Reserve Co. | | |
| 2.20%, due 6/1/30 (a) | 1,685,000 | 1,690,114 |
| NYU Langone Hospitals | | |
| Series 2020 | | |
| 3.38%, due 7/1/55 | 605,000 | 640,836 |
| | | 2,330,950 |
| Insurance 1.5% |
| Athene Global Funding | | |
| 2.50%, due 3/24/28 (a) | 1,030,000 | 1,055,712 |
| Equitable Holdings, Inc. | | |
| 5.00%, due 4/20/48 | 830,000 | 1,059,439 |
| Liberty Mutual Group, Inc. | | |
| 4.25%, due 6/15/23 (a) | 295,000 | 315,080 |
| MassMutual Global Funding II | | |
| 2.50%, due 10/17/22 (a) | 1,270,000 | 1,305,804 |
| 2.95%, due 1/11/25 (a) | 365,000 | 390,755 |
| Peachtree Corners Funding Trust | | |
| 3.976%, due 2/15/25 (a) | 425,000 | 465,220 |
| Principal Life Global Funding II | | |
| 2.375%, due 11/21/21 (a) | 1,470,000 | 1,482,244 |
| Protective Life Corp. | | |
| 8.45%, due 10/15/39 | 725,000 | 1,164,122 |
| Reliance Standard Life Global Funding II | | |
| 2.50%, due 10/30/24 (a) | 950,000 | 990,700 |
| Voya Financial, Inc. | | |
| 3.65%, due 6/15/26 | 310,000 | 343,190 |
| Willis North America, Inc. | | |
| 2.95%, due 9/15/29 | 1,395,000 | 1,464,771 |
| 3.875%, due 9/15/49 | 185,000 | 207,820 |
| | | 10,244,857 |
| Internet 0.4% |
| Cablevision Lightpath LLC | | |
| 3.875%, due 9/15/27 (a) | 875,000 | 864,797 |
| Expedia Group, Inc. | | |
| 3.25%, due 2/15/30 | 1,305,000 | 1,363,134 |
| 3.60%, due 12/15/23 | 480,000 | 510,127 |
| 3.80%, due 2/15/28 | 157,000 | 170,752 |
| 5.00%, due 2/15/26 | 22,000 | 25,097 |
| 6.25%, due 5/1/25 (a) | 88,000 | 102,366 |
| | | 3,036,273 |
| | Principal
Amount | Value |
| |
| Iron & Steel 0.2% |
| Vale Overseas Ltd. (Brazil) | | |
| 6.25%, due 8/10/26 | $ 1,070,000 | $ 1,287,210 |
| 6.875%, due 11/21/36 | 305,000 | 418,067 |
| | | 1,705,277 |
| Lodging 0.6% |
| Hilton Domestic Operating Co., Inc. | | |
| 4.875%, due 1/15/30 | 695,000 | 741,912 |
| 5.75%, due 5/1/28 (a) | 315,000 | 340,852 |
| Las Vegas Sands Corp. | | |
| 3.20%, due 8/8/24 | 555,000 | 582,489 |
| Marriott International, Inc. | | |
| 2.30%, due 1/15/22 | 890,000 | 896,333 |
| 3.60%, due 4/15/24 | 920,000 | 981,072 |
| Sands China Ltd. (Macao) | | |
| 4.60%, due 8/8/23 | 355,000 | 377,045 |
| 5.125%, due 8/8/25 | 460,000 | 513,972 |
| | | 4,433,675 |
| Machinery-Diversified 0.1% |
| CNH Industrial Capital LLC | | |
| 4.20%, due 1/15/24 | 545,000 | 589,735 |
| Media 0.5% |
| Comcast Corp. | | |
| 3.25%, due 11/1/39 | 675,000 | 717,955 |
| 4.70%, due 10/15/48 | 555,000 | 715,497 |
| Grupo Televisa SAB | | |
| 5.25%, due 5/24/49 (Mexico) | 480,000 | 606,973 |
| Sirius XM Radio, Inc. | | |
| 4.125%, due 7/1/30 (a) | 955,000 | 963,481 |
| Sky Ltd. | | |
| 3.75%, due 9/16/24 (United Kingdom) (a) | 340,000 | 371,608 |
| Time Warner Entertainment Co. LP | | |
| 8.375%, due 3/15/23 | 355,000 | 401,148 |
| | | 3,776,662 |
| Metal Fabricate & Hardware 0.2% |
| Precision Castparts Corp. | | |
| 3.25%, due 6/15/25 | 1,455,000 | 1,578,721 |
| Mining 0.2% |
| Glencore Funding LLC | | |
| 1.625%, due 9/1/25 (Australia) (a) | 1,205,000 | 1,218,700 |
The notes to the financial statements are an integral part of, and should be read in conjunction with, the financial statements.
| 16 | MainStay VP Income Builder Portfolio |
| | Principal
Amount | Value |
| Corporate Bonds (continued) |
| Miscellaneous—Manufacturing 0.3% |
| Siemens Financieringsmaatschappij NV | | |
| 2.70%, due 3/16/22 (Germany) (a)(g) | $ 760,000 | $ 773,621 |
| Textron Financial Corp. | | |
| 1.891% (3 Month LIBOR + 1.735%), due 2/15/42 (a)(b) | 1,295,000 | 1,100,750 |
| | | 1,874,371 |
| Oil & Gas 0.8% |
| BP Capital Markets plc | | |
| 4.875% (5 Year Treasury Constant Maturity Rate + 4.398%), due 3/22/30 (United Kingdom) (b)(e) | 205,000 | 225,090 |
| Gazprom PJSC Via Gaz Capital SA | | |
| 7.288%, due 8/16/37 (Russia) (a) | 640,000 | 891,142 |
| Marathon Petroleum Corp. | | |
| 4.50%, due 5/1/23 | 620,000 | 661,201 |
| 4.70%, due 5/1/25 | 675,000 | 761,252 |
| 5.125%, due 12/15/26 | 450,000 | 529,123 |
| Petrobras Global Finance BV | | |
| 5.50%, due 6/10/51 (Brazil) | 555,000 | 555,194 |
| Valero Energy Corp. | | |
| 3.65%, due 3/15/25 | 1,000,000 | 1,090,084 |
| 6.625%, due 6/15/37 | 415,000 | 568,917 |
| | | 5,282,003 |
| Packaging & Containers 0.2% |
| Berry Global, Inc. | | |
| 4.875%, due 7/15/26 (a) | 84,000 | 88,885 |
| Owens-Brockway Glass Container, Inc. | | |
| 6.625%, due 5/13/27 (a) | 1,135,000 | 1,234,313 |
| | | 1,323,198 |
| Pharmaceuticals 0.9% |
| AbbVie, Inc. | | |
| 3.45%, due 3/15/22 | 1,005,000 | 1,021,947 |
| 4.05%, due 11/21/39 | 1,125,000 | 1,306,604 |
| Becton Dickinson and Co. | | |
| 4.669%, due 6/6/47 | 635,000 | 791,085 |
| CVS Health Corp. | | |
| 2.70%, due 8/21/40 | 1,255,000 | 1,216,493 |
| 4.78%, due 3/25/38 | 400,000 | 492,098 |
| Teva Pharmaceutical Finance Netherlands III BV | | |
| 3.15%, due 10/1/26 (Israel) | 1,285,000 | 1,222,356 |
| | | 6,050,583 |
| | Principal
Amount | Value |
| |
| Pipelines 0.8% |
| Enterprise Products Operating LLC | | |
| 3.125%, due 7/31/29 | $ 630,000 | $ 679,731 |
| 3.95%, due 1/31/60 | 595,000 | 663,238 |
| 4.20%, due 1/31/50 | 160,000 | 184,545 |
| Flex Intermediate Holdco LLC | | |
| 3.363%, due 6/30/31 (a) | 865,000 | 875,617 |
| MPLX LP | | |
| 2.65%, due 8/15/30 | 730,000 | 736,784 |
| Spectra Energy Partners LP | | |
| 4.75%, due 3/15/24 | 795,000 | 872,531 |
| Transcontinental Gas Pipe Line Co. LLC | | |
| 4.60%, due 3/15/48 | 840,000 | 1,023,506 |
| Western Midstream Operating LP | | |
| 6.50%, due 2/1/50 (f) | 350,000 | 405,242 |
| | | 5,441,194 |
| Real Estate 0.1% |
| Realogy Group LLC | | |
| 5.75%, due 1/15/29 (a) | 560,000 | 585,418 |
| Real Estate Investment Trusts 1.0% |
| Alexandria Real Estate Equities, Inc. | | |
| 3.375%, due 8/15/31 | 825,000 | 906,745 |
| American Tower Corp. | | |
| 3.375%, due 10/15/26 | 705,000 | 767,984 |
| 3.60%, due 1/15/28 | 375,000 | 412,459 |
| Digital Realty Trust LP | | |
| 3.70%, due 8/15/27 | 1,295,000 | 1,449,482 |
| Equinix, Inc. | | |
| 1.25%, due 7/15/25 | 710,000 | 711,703 |
| 2.625%, due 11/18/24 | 740,000 | 778,614 |
| GLP Capital LP | | |
| 3.35%, due 9/1/24 | 505,000 | 534,955 |
| Iron Mountain, Inc. | | |
| 5.25%, due 7/15/30 (a) | 720,000 | 762,178 |
| Kilroy Realty LP | | |
| 3.45%, due 12/15/24 | 720,000 | 767,953 |
| | | 7,092,073 |
| Retail 1.4% |
| 7-Eleven, Inc. | | |
| 2.50%, due 2/10/41 (a) | 130,000 | 121,035 |
| 2.80%, due 2/10/51 (a) | 430,000 | 401,138 |
| AutoNation, Inc. | | |
| 4.75%, due 6/1/30 | 1,040,000 | 1,230,012 |
| Macy's Retail Holdings LLC | | |
| 5.875%, due 4/1/29 (a)(g) | 645,000 | 693,652 |
The notes to the financial statements are an integral part of, and should be read in conjunction with, the financial statements.
17
Portfolio of Investments June 30, 2021† (Unaudited) (continued)
| | Principal
Amount | Value |
| Corporate Bonds (continued) |
| Retail (continued) |
| Macy's, Inc. | | |
| 8.375%, due 6/15/25 (a) | $ 1,370,000 | $ 1,508,644 |
| McDonald's Corp. | | |
| 3.35%, due 4/1/23 | 1,085,000 | 1,138,276 |
| Nordstrom, Inc. | | |
| 4.00%, due 3/15/27 (g) | 640,000 | 664,090 |
| 4.25%, due 8/1/31 (a) | 530,000 | 551,994 |
| O'Reilly Automotive, Inc. | | |
| 3.55%, due 3/15/26 | 1,000,000 | 1,102,236 |
| QVC, Inc. | | |
| 4.375%, due 9/1/28 | 940,000 | 958,800 |
| Starbucks Corp. | | |
| 3.35%, due 3/12/50 | 375,000 | 392,263 |
| 4.45%, due 8/15/49 | 475,000 | 589,173 |
| | | 9,351,313 |
| Semiconductors 0.1% |
| Broadcom, Inc. | | |
| 3.50%, due 2/15/41 (a) | 325,000 | 332,484 |
| NXP BV | | |
| 3.40%, due 5/1/30 (China) (a) | 555,000 | 606,009 |
| | | 938,493 |
| Software 0.3% |
| Fiserv, Inc. | | |
| 3.20%, due 7/1/26 | 205,000 | 221,847 |
| Oracle Corp. | | |
| 3.65%, due 3/25/41 | 245,000 | 259,787 |
| salesforce.com, Inc. | | |
| 3.25%, due 4/11/23 | 510,000 | 535,037 |
| 3.70%, due 4/11/28 | 690,000 | 786,025 |
| | | 1,802,696 |
| Telecommunications 1.7% |
| Altice France SA | | |
| 5.125%, due 7/15/29 (France) (a) | 865,000 | 869,239 |
| AT&T, Inc. | | |
| 3.50%, due 9/15/53 (a) | 795,000 | 798,713 |
| 4.35%, due 3/1/29 | 320,000 | 370,514 |
| CommScope Technologies LLC | | |
| 6.00%, due 6/15/25 (a) | 411,000 | 419,734 |
| CommScope, Inc. | | |
| 7.125%, due 7/1/28 (a) | 1,080,000 | 1,170,450 |
| Level 3 Financing, Inc. | | |
| 3.40%, due 3/1/27 (a) | 1,050,000 | 1,113,157 |
| Sprint Spectrum Co. LLC | | |
| 4.738%, due 3/20/25 (a) | 1,448,437 | 1,553,971 |
| | Principal
Amount | Value |
| |
| Telecommunications (continued) |
| T-Mobile US, Inc. | | |
| 2.625%, due 2/15/29 | $ 885,000 | $ 873,937 |
| VEON Holdings BV | | |
| 4.95%, due 6/16/24 (Netherlands) (a) | 1,045,000 | 1,125,987 |
| Verizon Communications, Inc. | | |
| 1.256% (3 Month LIBOR + 1.10%), due 5/15/25 (b) | 985,000 | 1,015,860 |
| 3.40%, due 3/22/41 | 330,000 | 349,088 |
| 3.55%, due 3/22/51 | 365,000 | 389,954 |
| Vodafone Group plc | | |
| 4.25%, due 9/17/50 (United Kingdom) | 1,180,000 | 1,378,247 |
| | | 11,428,851 |
| Toys, Games & Hobbies 0.1% |
| Hasbro, Inc. | | |
| 2.60%, due 11/19/22 | 500,000 | 514,412 |
Total Corporate Bonds
(Cost $186,740,620) | | 197,975,594 |
| Foreign Government Bonds 1.0% |
| Brazil 0.4% |
| Brazil Government Bond | | |
| 3.75%, due 9/12/31 | 965,000 | 951,972 |
| Federative Republic of Brazil | | |
| 4.625%, due 1/13/28 | 1,526,000 | 1,648,431 |
| | | 2,600,403 |
| Chile 0.2% |
| Corp. Nacional del Cobre de Chile | | |
| 3.00%, due 9/30/29 (a) | 1,170,000 | 1,215,220 |
| Colombia 0.1% |
| Colombia Government International Bond | | |
| 3.25%, due 4/22/32 | 725,000 | 710,109 |
| Mexico 0.3% |
| Mexico Government Bond | | |
| 2.659%, due 5/24/31 | 1,612,000 | 1,574,747 |
| 3.75%, due 4/19/71 | 800,000 | 731,520 |
| | | 2,306,267 |
Total Foreign Government Bonds
(Cost $6,914,656) | | 6,831,999 |
The notes to the financial statements are an integral part of, and should be read in conjunction with, the financial statements.
| 18 | MainStay VP Income Builder Portfolio |
| | Principal
Amount | Value |
| Loan Assignments 0.6% |
| Containers, Packaging & Glass 0.2% |
| Mauser Packaging Solutions Holding Co. | | |
| Initial Term Loan | | |
| 3.354% (1 Month LIBOR + 3.25%), due 4/3/24 (b) | $ 1,257,084 | $ 1,226,106 |
| Diversified/Conglomerate Service 0.1% |
| TruGreen LP | | |
| First Lien Second Refinancing Term Loan | | |
| 4.75% (1 Month LIBOR + 4.00%), due 11/2/27 (b) | 577,100 | 579,985 |
| Second Lien Initial Term Loan | | |
| 9.25% (3 Month LIBOR + 8.50%), due 11/2/28 (b) | 250,000 | 255,000 |
| | | 834,985 |
| Finance 0.2% |
| Alliant Holdings Intermediate LLC | | |
| 2018 Initial Term Loan | | |
| 3.354% (1 Month LIBOR + 3.25%), due 5/9/25 (b) | 1,252,405 | 1,238,743 |
| Personal & Nondurable Consumer Products 0.0% ‡ |
| Prestige Brands, Inc. | | |
| Term Loan B4 | | |
| 4.25% (3 Month LIBOR + 1.00%), due 1/26/24 (b) | 354,056 | 353,992 |
| Telecommunications 0.1% |
| Level 3 Financing, Inc. | | |
| Tranche 2027 Term Loan B | | |
| 1.854% (1 Month LIBOR + 1.75%), due 3/1/27 (b) | 718,508 | 707,731 |
Total Loan Assignments
(Cost $4,365,310) | | 4,361,557 |
| Mortgage-Backed Securities 8.0% |
| Agency (Collateralized Mortgage Obligations) 2.8% |
| FHLMC | | |
| REMIC, Series 5073, Class DG | | |
| 1.50%, due 8/25/38 | 875,000 | 885,040 |
| REMIC, Series 4993, Class D | | |
| 2.00%, due 9/25/47 | 925,000 | 964,979 |
| | Principal
Amount | Value |
| |
| Agency (Collateralized Mortgage Obligations) (continued) |
| FHLMC (continued) | | |
| REMIC, Series 5049, Class UI | | |
| 3.00%, due 12/25/50 (h) | $ 2,263,414 | $ 401,398 |
| REMIC, Series 4888, Class BA | | |
| 3.50%, due 9/15/48 | 283,383 | 295,264 |
| REMIC, Series 4877, Class AT | | |
| 3.50%, due 11/15/48 | 485,721 | 514,104 |
| REMIC, Series 4877, Class BE | | |
| 3.50%, due 11/15/48 | 681,465 | 718,201 |
| REMIC, Series 4958, Class DL | | |
| 4.00%, due 1/25/50 | 1,280,635 | 1,382,243 |
| FNMA | | |
| REMIC, Series 2021-33, Class AI | | |
| 2.50%, due 5/25/47 (h) | 2,775,591 | 361,969 |
| REMIC, Series 2021-34, Class MI | | |
| 2.50%, due 3/25/51 (h) | 1,817,473 | 255,844 |
| REMIC, Series 2013-77, Class CY | | |
| 3.00%, due 7/25/43 | 746,000 | 768,215 |
| REMIC, Series 2019-13, Class PE | | |
| 3.00%, due 3/25/49 | 539,944 | 572,392 |
| REMIC, Series 2019-13, Class CA | | |
| 3.50%, due 4/25/49 | 869,620 | 948,360 |
| REMIC, Series 2021-12, Class GC | | |
| 3.50%, due 7/25/50 | 1,102,070 | 1,190,556 |
| REMIC, Series 2020-10, Class DA | | |
| 3.50%, due 3/25/60 | 953,959 | 1,031,540 |
| GNMA | | |
| REMIC, Series 2021-78, Class LA | | |
| 1.00%, due 5/20/51 | 892,724 | 874,020 |
| REMIC, Series 2021-87, Class EG | | |
| 1.00%, due 5/20/51 | 890,247 | 882,488 |
| REMIC, Series 2021-87, Class EK | | |
| 1.00%, due 5/20/51 | 2,581,716 | 2,559,216 |
| REMIC, Series 2021-91, Class MF | | |
| 1.00%, due 5/20/51 | 889,194 | 880,798 |
| REMIC, Series 2021-105, Class DB | | |
| 1.00%, due 6/20/51 | 940,000 | 915,187 |
| REMIC, Series 2021-15, Class AI | | |
| 2.00%, due 1/20/51 (h) | 2,325,028 | 255,162 |
| REMIC, Series 2021-25, Class LI | | |
| 2.50%, due 2/20/51 (h) | 2,861,427 | 339,356 |
| REMIC, Series 2021-74, Class HI | | |
| 3.00%, due 4/20/51 (h) | 2,884,691 | 408,263 |
| REMIC, Series 2013-149, Class BA | | |
| 3.25%, due 8/16/41 | 1,778,942 | 1,874,364 |
| | | 19,278,959 |
The notes to the financial statements are an integral part of, and should be read in conjunction with, the financial statements.
19
Portfolio of Investments June 30, 2021† (Unaudited) (continued)
| | Principal
Amount | Value |
| Mortgage-Backed Securities (continued) |
| Commercial Mortgage Loans (Collateralized Mortgage Obligations) 2.4% |
| Arbor Multifamily Mortgage Securities Trust | | |
| Series 2021-MF2, Class AS | | |
| 2.70%, due 6/15/54 (a)(i) | $ 750,000 | $ 774,752 |
| Bayview Commercial Asset Trust | | |
| Series 2006-4A, Class A1 | | |
| 0.437% (1 Month LIBOR + 0.23%), due 12/25/36 (a)(b) | 34,200 | 32,879 |
| Benchmark Mortgage Trust | | |
| Series 2020-B19, Class A2 | | |
| 1.691%, due 9/15/53 | 935,000 | 949,314 |
| BX Commercial Mortgage Trust | | |
| Series 2020-VIV2, Class C | | |
| 3.66%, due 3/9/44 (a)(j) | 785,000 | 830,463 |
| Series 2020-VIV3, Class B | | |
| 3.662%, due 3/9/44 (a)(j) | 675,059 | 733,066 |
| BX Trust | | |
| Series 2021-LBA, Class AV | | |
| 0.873% (1 Month LIBOR + 0.80%), due 2/15/36 (a)(b) | 820,000 | 821,310 |
| Series 2019-OC11, Class A | | |
| 3.202%, due 12/9/41 (a) | 580,000 | 624,813 |
| Series 2019-OC11, Class B | | |
| 3.605%, due 12/9/41 (a) | 170,000 | 186,078 |
| Series 2019-OC11, Class C | | |
| 3.856%, due 12/9/41 (a) | 205,000 | 222,787 |
| CSAIL Commercial Mortgage Trust | | |
| Series 2015-C3, Class A4 | | |
| 3.718%, due 8/15/48 | 845,000 | 922,210 |
| Extended Stay America Trust | | |
| Series 2021-ESH, Class C | | |
| (zero coupon) (1 Month LIBOR + 1.70%), due 7/15/38 (a)(b) | 975,000 | 978,959 |
| FREMF Mortgage Trust | | |
| REMIC, Series 2015-K720, Class B | | |
| 3.511%, due 7/25/22 (a)(j) | 460,000 | 472,001 |
| REMIC, Series 2014-K41, Class B | | |
| 3.964%, due 11/25/47 (a)(j) | 330,000 | 358,781 |
| GB Trust | | |
| Series 2020-FLIX, Class C | | |
| 1.673% (1 Month LIBOR + 1.60%), due 8/15/37 (a)(b) | 500,000 | 501,401 |
| Series 2020-FLIX, Class D | | |
| 2.423% (1 Month LIBOR + 2.35%), due 8/15/37 (a)(b) | 765,000 | 766,682 |
| | Principal
Amount | Value |
| |
| Commercial Mortgage Loans (Collateralized Mortgage Obligations) (continued) |
| Hudson Yards Mortgage Trust | | |
| Series 2019-30HY, Class A | | |
| 3.228%, due 7/10/39 (a) | $ 665,000 | $ 723,893 |
| Manhattan West Mortgage Trust | | |
| Series 2020-1MW, Class A | | |
| 2.13%, due 9/10/39 (a) | 1,120,000 | 1,145,522 |
| Morgan Stanley Bank of America Merrill Lynch Trust | | |
| Series 2015-C23, Class A3 | | |
| 3.451%, due 7/15/50 | 471,777 | 508,550 |
| Morgan Stanley Capital I Trust | | |
| Series 2015-UBS8, Class A4 | | |
| 3.809%, due 12/15/48 | 780,000 | 856,449 |
| One Bryant Park Trust | | |
| Series 2019-OBP, Class A | | |
| 2.516%, due 9/15/54 (a) | 1,315,000 | 1,361,631 |
| Wells Fargo Commercial Mortgage Trust | | |
| Series 2018-1745, Class A | | |
| 3.874%, due 6/15/36 (a)(j) | 940,000 | 1,045,744 |
| Series 2018-AUS, Class A | | |
| 4.194%, due 8/17/36 (a)(j) | 1,200,000 | 1,356,804 |
| | | 16,174,089 |
| Whole Loan (Collateralized Mortgage Obligations) 2.8% |
| Chase Home Lending Mortgage Trust | | |
| Series 2019-ATR2, Class A3 | | |
| 3.50%, due 7/25/49 (a)(i) | 72,198 | 74,262 |
| FHLMC STACR REMIC Trust | | |
| Series 2020-DNA6, Class M2 | | |
| 2.018% (SOFR 30A + 2.00%), due 12/25/50 (a)(b) | 1,220,000 | 1,232,981 |
| FHLMC STACR Trust | | |
| Series 2018-DNA2, Class M2 | | |
| 2.242% (1 Month LIBOR + 2.15%), due 12/25/30 (a)(b) | 920,000 | 930,263 |
| FHLMC Structured Agency Credit Risk Debt Notes | | |
| Series 2017-DNA1, Class M2 | | |
| 3.341% (1 Month LIBOR + 3.25%), due 7/25/29 (b) | 1,440,977 | 1,492,808 |
| Series 2017-HQA1, Class M2 | | |
| 3.642% (1 Month LIBOR + 3.55%), due 8/25/29 (b) | 1,388,514 | 1,436,461 |
| Series 2015-DNA3, Class M3 | | |
| 4.791% (1 Month LIBOR + 4.70%), due 4/25/28 (b) | 1,174,647 | 1,215,536 |
The notes to the financial statements are an integral part of, and should be read in conjunction with, the financial statements.
| 20 | MainStay VP Income Builder Portfolio |
| | Principal
Amount | Value |
| Mortgage-Backed Securities (continued) |
| Whole Loan (Collateralized Mortgage Obligations) (continued) |
| FHLMC Structured Agency Credit Risk Debt Notes (continued) | | |
| Series 2016-DNA1, Class M3 | | |
| 5.641% (1 Month LIBOR + 5.55%), due 7/25/28 (b) | $ 634,250 | $ 664,472 |
| Flagstar Mortgage Trust | | |
| Series 2021-2, Class A2 | | |
| 2.50%, due 4/25/51 (a)(i) | 800,940 | 812,464 |
| FNMA | | |
| Series 2017-C01, Class 1M2 | | |
| 3.642% (1 Month LIBOR + 3.55%), due 7/25/29 (b) | 1,061,635 | 1,102,153 |
| Series 2017-C02, Class 2M2 | | |
| 3.742% (1 Month LIBOR + 3.65%), due 9/25/29 (b) | 479,283 | 496,687 |
| GS Mortgage-Backed Securities Corp. Trust | | |
| Series 2021-PJ5, Class A8 | | |
| 2.50%, due 10/25/51 (a)(i) | 571,447 | 584,483 |
| J.P. Morgan Mortgage Trust | | |
| Series 2021-6, Class A4 | | |
| 2.50%, due 10/25/51 (a)(i) | 818,908 | 838,572 |
| Series 2021-7, Class A3 | | |
| 2.50%, due 11/25/51 (a)(i) | 368,442 | 374,769 |
| Series 2021-7, Class A4 | | |
| 2.50%, due 11/25/51 (a)(i) | 899,920 | 921,574 |
| Series 2019-3, Class A3 | | |
| 4.00%, due 9/25/49 (a)(i) | 75,617 | 76,906 |
| Mello Mortgage Capital Acceptance | | |
| Series 2021-MTG2, Class A1 | | |
| 2.50%, due 6/25/51 (a)(i) | 1,005,604 | 1,020,177 |
| New Residential Mortgage Loan Trust | | |
| Series 2019-5A, Class B7 | | |
| 4.459%, due 8/25/59 (a)(j) | 1,343,243 | 1,097,229 |
| Series 2019-2A, Class B6 | | |
| 4.963%, due 12/25/57 (a)(i) | 475,895 | 348,019 |
| NewRez Warehouse Securitization Trust | | |
| Series 2021-1, Class A | | |
| 0.842% (1 Month LIBOR + 0.75%), due 5/25/55 (a)(b) | 1,075,000 | 1,076,609 |
| OBX Trust | | |
| Series 2021-J1, Class A1 | | |
| 2.50%, due 5/25/51 (a)(i) | 394,990 | 400,283 |
| Seasoned Loans Structured Transaction | | |
| Series 2019-1, Class A1 | | |
| 3.50%, due 5/25/29 | 509,567 | 543,161 |
| | Principal
Amount | Value |
| |
| Whole Loan (Collateralized Mortgage Obligations) (continued) |
| Sequoia Mortgage Trust | | |
| Series 2021-4, Class A1 | | |
| 2.50%, due 6/25/51 (a)(i) | $ 2,562,970 | $ 2,597,309 |
| | | 19,337,178 |
Total Mortgage-Backed Securities
(Cost $53,981,543) | | 54,790,226 |
| Municipal Bond 0.2% |
| California 0.2% |
| Regents of the University of California Medical Center, Pooled, Revenue Bonds | | |
| Series N | | |
| 3.006%, due 5/15/50 | 1,115,000 | 1,149,682 |
Total Municipal Bond
(Cost $1,115,000) | | 1,149,682 |
| U.S. Government & Federal Agencies 7.6% |
| Federal Home Loan Mortgage Corporation (Mortgage Pass-Through Securities) 0.6% |
| FHLMC Gold Pools, 30 Year | | |
| 3.50%, due 1/1/48 | 878,072 | 937,943 |
| UMBS, 30 Year | | |
| 2.00%, due 8/1/50 | 1,080,518 | 1,091,709 |
| 2.00%, due 8/1/50 | 858,464 | 867,355 |
| 2.00%, due 11/1/50 | 272,650 | 275,473 |
| 3.50%, due 7/1/50 | 672,387 | 708,299 |
| | | 3,880,779 |
| Federal National Mortgage Association (Mortgage Pass-Through Securities) 1.1% |
| FNMA, Other | | |
| 3.50%, due 2/1/42 | 1,040,570 | 1,120,998 |
| 6.00%, due 4/1/37 | 6,907 | 7,758 |
| UMBS, 20 Year | | |
| 2.50%, due 5/1/41 | 496,075 | 516,258 |
| UMBS, 30 Year | | |
| 2.00%, due 10/1/50 | 171,626 | 174,202 |
| 2.00%, due 12/1/50 | 265,287 | 268,035 |
| 2.50%, due 8/1/50 | 87,256 | 90,493 |
| 2.50%, due 10/1/50 | 687,351 | 711,802 |
| 2.50%, due 11/1/50 | 508,927 | 533,855 |
| 2.50%, due 1/1/51 | 301,135 | 313,985 |
| 2.50%, due 1/1/51 | 501,870 | 519,949 |
| 3.00%, due 3/1/50 | 962,764 | 1,017,536 |
| 3.00%, due 6/1/51 | 425,000 | 444,435 |
The notes to the financial statements are an integral part of, and should be read in conjunction with, the financial statements.
21
Portfolio of Investments June 30, 2021† (Unaudited) (continued)
| | Principal
Amount | Value |
| U.S. Government & Federal Agencies (continued) |
| Federal National Mortgage Association (Mortgage Pass-Through Securities) (continued) |
| UMBS, 30 Year (continued) | | |
| 4.00%, due 8/1/48 | $ 1,295,124 | $ 1,381,760 |
| 4.00%, due 2/1/49 | 213,808 | 229,703 |
| | | 7,330,769 |
| United States Treasury Bonds 1.2% |
| U.S. Treasury Bonds | | |
| 1.875%, due 2/15/51 | 65,000 | 62,034 |
| 2.25%, due 5/15/41 | 385,000 | 400,581 |
| 2.375%, due 5/15/51 | 2,490,000 | 2,658,464 |
| 4.375%, due 11/15/39 | 2,382,000 | 3,313,678 |
| 4.375%, due 5/15/40 | 1,605,000 | 2,242,925 |
| | | 8,677,682 |
| United States Treasury Inflation - Indexed Notes 1.1% |
| U.S. Treasury Inflation Linked Notes | | |
| 0.125%, due 1/15/30 (k) | 2,550,000 | 2,905,268 |
| 0.125%, due 7/15/30 (k) | 2,530,000 | 2,906,843 |
| 0.875%, due 1/15/29 (k) | 1,435,000 | 1,755,985 |
| | | 7,568,096 |
| United States Treasury Notes 3.6% |
| U.S. Treasury Notes | | |
| 0.125%, due 4/30/23 | 10,442,000 | 10,422,421 |
| 0.375%, due 4/15/24 | 4,040,000 | 4,035,266 |
| 0.75%, due 4/30/26 | 7,510,000 | 7,471,863 |
| 1.25%, due 4/30/28 | 1,004,000 | 1,007,138 |
| 1.625%, due 5/15/31 | 1,865,000 | 1,893,558 |
| | | 24,830,246 |
Total U.S. Government & Federal Agencies
(Cost $51,467,530) | | 52,287,572 |
Total Long-Term Bonds
(Cost $331,944,014) | | 345,558,915 |
| |
| | Shares | |
| Common Stocks 44.4% |
| Aerospace & Defense 1.1% |
| BAE Systems plc (United Kingdom) | 384,563 | 2,776,863 |
| Lockheed Martin Corp. | 6,687 | 2,530,026 |
| Raytheon Technologies Corp. | 30,210 | 2,577,215 |
| | | 7,884,104 |
| | Shares | Value |
| |
| Air Freight & Logistics 1.0% |
| Deutsche Post AG (Registered) (Germany) | 53,245 | $ 3,621,438 |
| United Parcel Service, Inc., Class B | 15,399 | 3,202,530 |
| | | 6,823,968 |
| Automobiles 0.3% |
| Toyota Motor Corp. (Japan) | 20,800 | 1,817,976 |
| Banks 1.9% |
| JPMorgan Chase & Co. | 25,646 | 3,988,979 |
| PNC Financial Services Group, Inc. (The) | 11,889 | 2,267,946 |
| Royal Bank of Canada (Canada) | 35,978 | 3,645,109 |
| Truist Financial Corp. | 51,205 | 2,841,877 |
| | | 12,743,911 |
| Beverages 0.8% |
| Coca-Cola Co. (The) | 42,410 | 2,294,805 |
| Coca-Cola Europacific Partners plc (United Kingdom) | 28,257 | 1,676,205 |
| PepsiCo, Inc. | 12,520 | 1,855,089 |
| | | 5,826,099 |
| Biotechnology 1.0% |
| AbbVie, Inc. | 42,086 | 4,740,567 |
| Amgen, Inc. | 9,006 | 2,195,212 |
| | | 6,935,779 |
| Capital Markets 1.6% |
| BlackRock, Inc. | 5,412 | 4,735,337 |
| Lazard Ltd., Class A | 61,156 | 2,767,309 |
| Singapore Exchange Ltd. (Singapore) | 188,900 | 1,570,538 |
| T. Rowe Price Group, Inc. | 9,338 | 1,848,644 |
| | | 10,921,828 |
| Chemicals 2.2% |
| BASF SE (Germany) | 33,766 | 2,660,127 |
| Dow, Inc. | 41,273 | 2,611,755 |
| Linde plc (United Kingdom) | 9,417 | 2,722,455 |
| LyondellBasell Industries NV, Class A | 23,995 | 2,468,366 |
| Nutrien Ltd. (Canada) | 77,944 | 4,724,186 |
| | | 15,186,889 |
| Commercial Services & Supplies 0.0% ‡ |
| Quad/Graphics, Inc. (l) | 6 | 25 |
| Communications Equipment 0.7% |
| Cisco Systems, Inc. | 88,061 | 4,667,233 |
The notes to the financial statements are an integral part of, and should be read in conjunction with, the financial statements.
| 22 | MainStay VP Income Builder Portfolio |
| | Shares | Value |
| Common Stocks (continued) |
| Diversified Telecommunication Services 2.5% |
| AT&T, Inc. | 60,118 | $ 1,730,196 |
| BCE, Inc. (Canada) | 31,779 | 1,567,159 |
| Deutsche Telekom AG (Registered) (Germany) | 234,915 | 4,961,541 |
| Orange SA (France) | 165,794 | 1,890,215 |
| Telenor ASA (Norway) | 136,118 | 2,293,888 |
| TELUS Corp. (Canada) | 98,284 | 2,204,175 |
| Verizon Communications, Inc. | 48,084 | 2,694,147 |
| | | 17,341,321 |
| Electric Utilities 2.0% |
| American Electric Power Co., Inc. | 21,133 | 1,787,641 |
| Duke Energy Corp. | 15,195 | 1,500,050 |
| Entergy Corp. | 19,789 | 1,972,963 |
| Evergy, Inc. | 34,022 | 2,055,949 |
| Fortis, Inc. (Canada) | 33,877 | 1,499,541 |
| NextEra Energy, Inc. | 41,236 | 3,021,774 |
| Terna Rete Elettrica Nazionale SpA (Italy) | 250,061 | 1,863,268 |
| | | 13,701,186 |
| Electrical Equipment 1.3% |
| Eaton Corp. plc | 21,572 | 3,196,539 |
| Emerson Electric Co. | 58,145 | 5,595,875 |
| | | 8,792,414 |
| Equity Real Estate Investment Trusts 1.3% |
| American Tower Corp. | 6,435 | 1,738,351 |
| Iron Mountain, Inc. | 92,154 | 3,899,957 |
| Welltower, Inc. | 21,092 | 1,752,745 |
| WP Carey, Inc. | 23,078 | 1,722,081 |
| | | 9,113,134 |
| Food Products 0.7% |
| Danone SA (France) | 21,721 | 1,529,114 |
| Nestle SA (Registered) (Switzerland) | 16,159 | 2,012,256 |
| Orkla ASA (Norway) | 143,076 | 1,457,323 |
| | | 4,998,693 |
| Gas Utilities 0.4% |
| Snam SpA (Italy) | 462,060 | 2,670,952 |
| Health Care Equipment & Supplies 0.8% |
| Medtronic plc | 44,880 | 5,570,954 |
| Hotels, Restaurants & Leisure 1.7% |
| Las Vegas Sands Corp. (l) | 61,520 | 3,241,489 |
| McDonald's Corp. | 8,369 | 1,933,155 |
| | Shares | Value |
| |
| Hotels, Restaurants & Leisure (continued) |
| Restaurant Brands International, Inc. (Canada) | 66,680 | $ 4,296,859 |
| Vail Resorts, Inc. | 7,630 | 2,415,048 |
| | | 11,886,551 |
| Household Durables 0.3% |
| Leggett & Platt, Inc. | 43,351 | 2,246,015 |
| Household Products 0.5% |
| Kimberly-Clark Corp. | 15,577 | 2,083,891 |
| Procter & Gamble Co. (The) | 12,141 | 1,638,185 |
| | | 3,722,076 |
| Industrial Conglomerates 0.3% |
| Siemens AG (Registered) (Germany) | 14,698 | 2,328,750 |
| Insurance 2.8% |
| Allianz SE (Registered) (Germany) | 16,153 | 4,027,964 |
| Assicurazioni Generali SpA (Italy) | 100,322 | 2,010,965 |
| AXA SA (France) | 96,041 | 2,435,337 |
| Great-West Lifeco, Inc. (Canada) | 50,913 | 1,512,275 |
| MetLife, Inc. | 74,875 | 4,481,269 |
| Muenchener Rueckversicherungs-Gesellschaft AG (Registered) (Germany) | 12,836 | 3,515,125 |
| Tokio Marine Holdings, Inc. (Japan) | 33,000 | 1,517,296 |
| | | 19,500,231 |
| IT Services 0.5% |
| International Business Machines Corp. | 23,652 | 3,467,147 |
| Leisure Products 0.4% |
| Hasbro, Inc. | 30,154 | 2,850,156 |
| Media 0.3% |
| Omnicom Group, Inc. | 22,103 | 1,768,019 |
| Multiline Retail 0.4% |
| Target Corp. | 10,555 | 2,551,566 |
| Multi-Utilities 1.0% |
| Ameren Corp. | 18,666 | 1,494,027 |
| Dominion Energy, Inc. | 27,659 | 2,034,872 |
| National Grid plc (United Kingdom) | 123,447 | 1,572,397 |
| WEC Energy Group, Inc. | 16,907 | 1,503,878 |
| | | 6,605,174 |
The notes to the financial statements are an integral part of, and should be read in conjunction with, the financial statements.
23
Portfolio of Investments June 30, 2021† (Unaudited) (continued)
| | Shares | Value |
| Common Stocks (continued) |
| Oil, Gas & Consumable Fuels 2.1% |
| Chevron Corp. | 25,569 | $ 2,678,097 |
| Enterprise Products Partners LP | 144,273 | 3,481,307 |
| Magellan Midstream Partners LP | 53,152 | 2,599,664 |
| Phillips 66 | 20,008 | 1,717,087 |
| TotalEnergies SE (France) (g) | 83,800 | 3,791,304 |
| | | 14,267,459 |
| Personal Products 0.5% |
| Unilever plc (United Kingdom) | 56,395 | 3,300,264 |
| Pharmaceuticals 3.8% |
| AstraZeneca plc Sponsored ADR (United Kingdom) (g) | 83,767 | 5,017,643 |
| Bayer AG (Registered) (Germany) | 23,015 | 1,397,523 |
| GlaxoSmithKline plc (United Kingdom) | 80,079 | 1,572,316 |
| Johnson & Johnson | 14,253 | 2,348,039 |
| Merck & Co., Inc. | 39,035 | 3,035,752 |
| Novartis AG (Registered) (Switzerland) | 24,099 | 2,196,193 |
| Pfizer, Inc. | 60,546 | 2,370,981 |
| Roche Holding AG (Switzerland) | 4,126 | 1,554,301 |
| Sanofi (France) | 29,281 | 3,067,855 |
| Takeda Pharmaceutical Co. Ltd. (Japan) | 96,100 | 3,217,030 |
| | | 25,777,633 |
| Semiconductors & Semiconductor Equipment 4.0% |
| Analog Devices, Inc. | 35,256 | 6,069,673 |
| Broadcom, Inc. | 12,719 | 6,064,928 |
| Intel Corp. | 77,933 | 4,375,159 |
| KLA Corp. | 11,616 | 3,766,023 |
| Taiwan Semiconductor Manufacturing Co. Ltd. Sponsored ADR (Taiwan) | 31,311 | 3,762,330 |
| Texas Instruments, Inc. | 19,073 | 3,667,738 |
| | | 27,705,851 |
| Software 1.0% |
| Microsoft Corp. | 26,033 | 7,052,340 |
| Specialty Retail 0.7% |
| Home Depot, Inc. (The) | 10,056 | 3,206,758 |
| Industria de Diseno Textil SA (Spain) | 42,297 | 1,490,065 |
| | | 4,696,823 |
| Technology Hardware, Storage & Peripherals 1.5% |
| Apple, Inc. | 47,806 | 6,547,510 |
| | Shares | | Value |
| |
| Technology Hardware, Storage & Peripherals (continued) |
| Samsung Electronics Co. Ltd. (Registered) GDR (Republic of Korea) (a) | 2,263 | | $ 4,036,060 |
| | | | 10,583,570 |
| Textiles, Apparel & Luxury Goods 0.3% |
| Hanesbrands, Inc. | 101,798 | | 1,900,569 |
| Tobacco 1.8% |
| Altria Group, Inc. | 64,489 | | 3,074,835 |
| British American Tobacco plc (United Kingdom) | 80,812 | | 3,130,043 |
| British American Tobacco plc Sponsored ADR (United Kingdom) | 26,429 | | 1,038,924 |
| Philip Morris International, Inc. | 48,198 | | 4,776,904 |
| | | | 12,020,706 |
| Trading Companies & Distributors 0.7% |
| MSC Industrial Direct Co., Inc., Class A | 30,588 | | 2,744,661 |
| Watsco, Inc. | 5,974 | | 1,712,388 |
| | | | 4,457,049 |
| Wireless Telecommunication Services 0.2% |
| Rogers Communications, Inc., Class B (Canada) | 29,969 | | 1,593,221 |
Total Common Stocks
(Cost $258,072,253) | | | 305,277,636 |
| Short-Term Investments 4.1% |
| Affiliated Investment Company 3.6% |
| MainStay U.S. Government Liquidity Fund, 0.01% (m) | 24,981,996 | | 24,981,996 |
| Unaffiliated Investment Company 0.5% |
| Wells Fargo Government Money Market Fund, 0.025% (m)(n) | 3,555,166 | | 3,555,166 |
Total Short-Term Investments
(Cost $28,537,162) | | | 28,537,162 |
Total Investments
(Cost $618,553,429) | 98.8% | | 679,373,713 |
| Other Assets, Less Liabilities | 1.2 | | 8,304,868 |
| Net Assets | 100.0% | | $ 687,678,581 |
The notes to the financial statements are an integral part of, and should be read in conjunction with, the financial statements.
| 24 | MainStay VP Income Builder Portfolio |
| † | Percentages indicated are based on Portfolio net assets. |
| ‡ | Less than one-tenth of a percent. |
| (a) | May be sold to institutional investors only under Rule 144A or securities offered pursuant to Section 4(a)(2) of the Securities Act of 1933, as amended. |
| (b) | Floating rate—Rate shown was the rate in effect as of June 30, 2021. |
| (c) | Delayed delivery security. |
| (d) | Fixed to floating rate—Rate shown was the rate in effect as of June 30, 2021. |
| (e) | Security is perpetual and, thus, does not have a predetermined maturity date. The date shown, if applicable, reflects the next call date. |
| (f) | Step coupon—Rate shown was the rate in effect as of June 30, 2021. |
| (g) | All or a portion of this security was held on loan. As of June 30, 2021, the aggregate market value of securities on loan was $5,555,667; the total market value of collateral held by the Portfolio was $5,804,060. The market value of the collateral held included non-cash collateral in the form of U.S. Treasury securities with a value of $2,248,894. The Portfolio received cash collateral with a value of $3,555,166. (See Note 2(L)) |
| (h) | Collateralized Mortgage Obligation Interest Only Strip—Pays a fixed or variable rate of interest based on mortgage loans or mortgage pass-through securities. The principal amount of the underlying pool represents the notional amount on which the current interest was calculated. The value of these stripped securities may be particularly sensitive to changes in prevailing interest rates and are typically more sensitive to changes in prepayment rates than traditional mortgage-backed securities. |
| (i) | Coupon rate may change based on changes of the underlying collateral or prepayments of principal. Rate shown was the rate in effect as of June 30, 2021. |
| (j) | Collateral strip rate—A bond whose interest was based on the weighted net interest rate of the collateral. The coupon rate adjusts periodically based on a predetermined schedule. Rate shown was the rate in effect as of June 30, 2021. |
| (k) | Treasury Inflation Protected Security—Pays a fixed rate of interest on a principal amount that is continuously adjusted for inflation based on the Consumer Price Index-Urban Consumers. |
| (l) | Non-income producing security. |
| (m) | Current yield as of June 30, 2021. |
| (n) | Represents a security purchased with cash collateral received for securities on loan. |
The notes to the financial statements are an integral part of, and should be read in conjunction with, the financial statements.
25
Portfolio of Investments June 30, 2021† (Unaudited) (continued)
Foreign Currency Forward Contracts
As of June 30, 2021, the Portfolio held the following foreign currency forward contracts1:
| Currency Purchased | Currency Sold | Counterparty | Settlement
Date | Unrealized
Appreciation
(Depreciation) |
| AUD | 9,875,000 | USD | 7,678,000 | JPMorgan Chase Bank N.A. | 8/3/21 | $ (271,006) |
| EUR | 18,712,000 | USD | 22,642,268 | JPMorgan Chase Bank N.A. | 8/2/21 | (439,844) |
| EUR | 500,000 | USD | 610,757 | JPMorgan Chase Bank N.A. | 8/2/21 | (17,490) |
| GBP | 13,801,000 | USD | 19,207,404 | JPMorgan Chase Bank N.A. | 8/2/21 | (114,659) |
| JPY | 2,168,758,000 | USD | 19,999,797 | JPMorgan Chase Bank N.A. | 8/2/21 | (473,005) |
| Total Unrealized Depreciation | $ (1,316,004) |
| 1. | Foreign Currency Forward Contracts are subject to limitations such that they cannot be “sold or repurchased,” although the Portfolio would be able to exit the transaction through other means, such as through the execution of an offsetting transaction. |
Futures Contracts
As of June 30, 2021, the Portfolio held the following futures contracts1:
| Type | Number of
Contracts | Expiration
Date | Value at
Trade Date | Current
Notional
Amount | Unrealized
Appreciation
(Depreciation)2 |
| Long Contracts | | | | | |
| E-mini S&P500-Industrial Sector Index | 195 | September 2021 | $ 20,239,064 | $ 20,085,000 | $ (154,064) |
| Euro STOXX 50 Index | 472 | September 2021 | 23,059,902 | 22,697,579 | (362,323) |
| FTSE 100 Index | 73 | September 2021 | 7,156,566 | 7,048,972 | (107,594) |
| S&P 500 E-Mini Index | 213 | September 2021 | 45,119,732 | 45,673,590 | 553,857 |
| U.S. Treasury 2 Year Notes | 166 | September 2021 | 36,634,485 | 36,573,172 | (61,313) |
| U.S. Treasury 5 Year Notes | 52 | September 2021 | 6,441,066 | 6,418,344 | (22,722) |
| U.S. Treasury 10 Year Notes | 124 | September 2021 | 16,362,904 | 16,430,000 | 67,096 |
| U.S. Treasury Long Bonds | 60 | September 2021 | 9,414,514 | 9,645,000 | 230,486 |
| U.S. Treasury Ultra Bonds | 146 | September 2021 | 27,143,065 | 28,132,375 | 989,310 |
| XAF Financial Index | 119 | September 2021 | 13,686,862 | 13,426,175 | (260,687) |
| Yen Denominated Nikkei 225 Index | 192 | September 2021 | 25,131,960 | 24,856,565 | (275,395) |
| Total Long Contracts | | | | | 596,651 |
| Short Contracts | | | | | |
| U.S. Treasury 10 Year Ultra Bonds | (157) | September 2021 | (22,801,485) | (23,110,891) | (309,406) |
| Net Unrealized Appreciation | | | | | $ 287,245 |
| 1. | As of June 30, 2021, cash in the amount of $8,934,930 was on deposit with a broker or futures commission merchant for futures transactions. |
| 2. | Represents the difference between the value of the contracts at the time they were opened and the value as of June 30, 2021. |
| Abbreviation(s): |
| ADR—American Depositary Receipt |
| AUD—Australia Dollar |
| EUR—Euro |
| FHLMC—Federal Home Loan Mortgage Corp. |
| FNMA—Federal National Mortgage Association |
| FREMF—Freddie Mac Multifamily |
| FTSE—Financial Times Stock Exchange |
| GBP—British Pound Sterling |
| GDR—Global Depositary Receipt |
| GNMA—Government National Mortgage Association |
The notes to the financial statements are an integral part of, and should be read in conjunction with, the financial statements.
| 26 | MainStay VP Income Builder Portfolio |
| JPY—Japanese Yen |
| LIBOR—London Interbank Offered Rate |
| REMIC—Real Estate Mortgage Investment Conduit |
| SOFR—Secured Overnight Financing Rate |
| UMBS—Uniform Mortgage Backed Securities |
| USD—United States Dollar |
The following is a summary of the fair valuations according to the inputs used as of June 30, 2021, for valuing the Portfolio’s assets and liabilities:
| Description | Quoted
Prices in
Active
Markets for
Identical
Assets
(Level 1) | | Significant
Other
Observable
Inputs
(Level 2) | | Significant
Unobservable
Inputs
(Level 3) | | Total |
| Asset Valuation Inputs | | | | | | | |
| Investments in Securities (a) | | | | | | | |
| Long-Term Bonds | | | | | | | |
| Asset-Backed Securities | $ — | | $ 28,162,285 | | $ — | | $ 28,162,285 |
| Corporate Bonds | — | | 197,975,594 | | — | | 197,975,594 |
| Foreign Government Bonds | — | | 6,831,999 | | — | | 6,831,999 |
| Loan Assignments | — | | 4,361,557 | | — | | 4,361,557 |
| Mortgage-Backed Securities | — | | 54,790,226 | | — | | 54,790,226 |
| Municipal Bond | — | | 1,149,682 | | — | | 1,149,682 |
| U.S. Government & Federal Agencies | — | | 52,287,572 | | — | | 52,287,572 |
| Total Long-Term Bonds | — | | 345,558,915 | | — | | 345,558,915 |
| Common Stocks | 305,277,636 | | — | | — | | 305,277,636 |
| Short-Term Investments | | | | | | | |
| Affiliated Investment Company | 24,981,996 | | — | | — | | 24,981,996 |
| Unaffiliated Investment Company | 3,555,166 | | — | | — | | 3,555,166 |
| Total Short-Term Investments | 28,537,162 | | — | | — | | 28,537,162 |
| Total Investments in Securities | 333,814,798 | | 345,558,915 | | — | | 679,373,713 |
| Other Financial Instruments | | | | | | | |
| Futures Contracts (b) | 1,840,749 | | — | | — | | 1,840,749 |
| Total Investments in Securities and Other Financial Instruments | $ 335,655,547 | | $ 345,558,915 | | $ — | | $ 681,214,462 |
| Liability Valuation Inputs | | | | | | | |
| Other Financial Instruments | | | | | | | |
| Foreign Currency Forward Contracts (b) | $ — | | $ (1,316,004) | | $ — | | $ (1,316,004) |
| Futures Contracts (b) | (1,553,504) | | — | | — | | (1,553,504) |
| Total Other Financial Instruments | $ (1,553,504) | | $ (1,316,004) | | $ — | | $ (2,869,508) |
| (a) | For a complete listing of investments and their industries, see the Portfolio of Investments. |
| (b) | The value listed for these securities reflects unrealized appreciation (depreciation) as shown on the Portfolio of Investments. |
The notes to the financial statements are an integral part of, and should be read in conjunction with, the financial statements.
27
Statement of Assets and Liabilities as of June 30, 2021 (Unaudited)
| Assets |
Investment in unaffiliated securities, at value
(identified cost $593,571,433) including securities on loan of $5,555,667 | $654,391,717 |
Investment in affiliated investment companies, at value
(identified cost $24,981,996) | 24,981,996 |
Cash denominated in foreign currencies
(identified cost $3,609,597) | 3,526,923 |
| Cash collateral on deposit at broker for futures contracts | 8,934,930 |
| Receivables: | |
| Investment securities sold | 13,978,698 |
| Dividends and interest | 3,455,360 |
| Variation margin on futures contracts | 128,845 |
| Portfolio shares sold | 21,782 |
| Securities lending | 13,208 |
| Other assets | 31,315 |
| Total assets | 709,464,774 |
| Liabilities |
| Cash collateral received for securities on loan | 3,555,166 |
| Due to custodian | 1,269,067 |
| Payables: | |
| Investment securities purchased | 15,063,180 |
| Manager (See Note 3) | 323,683 |
| NYLIFE Distributors (See Note 3) | 101,024 |
| Shareholder communication | 57,420 |
| Professional fees | 55,655 |
| Custodian | 39,021 |
| Trustees | 82 |
| Accrued expenses | 5,891 |
| Unrealized depreciation on foreign currency forward contracts | 1,316,004 |
| Total liabilities | 21,786,193 |
| Net assets | $687,678,581 |
| Composition of Net Assets |
| Shares of beneficial interest outstanding (par value of $.001 per share) unlimited number of shares authorized | $ 37,863 |
| Additional paid-in-capital | 580,236,348 |
| | 580,274,211 |
| Total distributable earnings (loss) | 107,404,370 |
| Net assets | $687,678,581 |
| Initial Class | |
| Net assets applicable to outstanding shares | $198,276,252 |
| Shares of beneficial interest outstanding | 10,847,414 |
| Net asset value per share outstanding | $ 18.28 |
| Service Class | |
| Net assets applicable to outstanding shares | $489,402,329 |
| Shares of beneficial interest outstanding | 27,015,511 |
| Net asset value per share outstanding | $ 18.12 |
The notes to the financial statements are an integral part of, and should be read in conjunction with, the financial statements.
| 28 | MainStay VP Income Builder Portfolio |
Statement of Operations for the six months ended June 30, 2021 (Unaudited)
| Investment Income (Loss) |
| Income | |
| Dividends-unaffiliated (net of foreign tax withholding of $455,719) | $ 6,068,961 |
| Interest (net of foreign tax withholding of $2,070) | 5,347,885 |
| Securities lending | 41,178 |
| Dividends-affiliated | 922 |
| Total income | 11,458,946 |
| Expenses | |
| Manager (See Note 3) | 1,911,626 |
| Distribution/Service—Service Class (See Note 3) | 596,339 |
| Professional fees | 63,471 |
| Custodian | 34,509 |
| Shareholder communication | 32,522 |
| Trustees | 6,918 |
| Miscellaneous | 18,933 |
| Total expenses | 2,664,318 |
| Net investment income (loss) | 8,794,628 |
| Realized and Unrealized Gain (Loss) |
| Net realized gain (loss) on: | |
| Unaffiliated investment transactions | 22,633,698 |
| Futures transactions | 15,854,771 |
| Foreign currency transactions | (47,392) |
| Foreign currency forward transactions | (64,540) |
| Net realized gain (loss) | 38,376,537 |
| Net change in unrealized appreciation (depreciation) on: | |
| Unaffiliated investments | 4,151,235 |
| Futures contracts | (2,202,275) |
| Foreign currency forward contracts | (2,197,655) |
| Translation of other assets and liabilities in foreign currencies | (569,103) |
| Net change in unrealized appreciation (depreciation) | (817,798) |
| Net realized and unrealized gain (loss) | 37,558,739 |
| Net increase (decrease) in net assets resulting from operations | $46,353,367 |
The notes to the financial statements are an integral part of, and should be read in conjunction with, the financial statements.
29
Statements of Changes in Net Assets
for the six months ended June 30, 2021 (Unaudited) and the year ended December 31, 2020
| | 2021 | 2020 |
| Increase (Decrease) in Net Assets |
| Operations: | | |
| Net investment income (loss) | $ 8,794,628 | $ 14,317,119 |
| Net realized gain (loss) | 38,376,537 | 13,600,217 |
| Net change in unrealized appreciation (depreciation) | (817,798) | 19,536,923 |
| Net increase (decrease) in net assets resulting from operations | 46,353,367 | 47,454,259 |
| Distributions to shareholders: | | |
| Initial Class | (3,568,860) | (11,330,042) |
| Service Class | (8,275,164) | (26,508,706) |
| Total distributions to shareholders | (11,844,024) | (37,838,748) |
| Capital share transactions: | | |
| Net proceeds from sales of shares | 16,255,225 | 88,346,012 |
| Net asset value of shares issued to shareholder in reinvestment of distributions | 11,844,024 | 37,838,748 |
| Cost of shares redeemed | (40,070,217) | (97,426,876) |
| Increase (decrease) in net assets derived from capital share transactions | (11,970,968) | 28,757,884 |
| Net increase (decrease) in net assets | 22,538,375 | 38,373,395 |
| Net Assets |
| Beginning of period | 665,140,206 | 626,766,811 |
| End of period | $687,678,581 | $665,140,206 |
The notes to the financial statements are an integral part of, and should be read in conjunction with, the financial statements.
| 30 | MainStay VP Income Builder Portfolio |
Financial Highlights selected per share data and ratios
| | Six months ended
June 30,
2021* | | Year Ended December 31, |
| Initial Class | 2020 | | 2019 | | 2018 | | 2017 | | 2016 |
| Net asset value at beginning of period | $ 17.37 | | $ 17.14 | | $ 15.23 | | $ 17.29 | | $ 15.94 | | $ 15.31 |
| Net investment income (loss) (a) | 0.25 | | 0.41 | | 0.49 | | 0.53 | | 0.49 | | 0.54 |
| Net realized and unrealized gain (loss) on investments | 0.99 | | 0.79 | | 2.22 | | (1.49) | | 1.62 | | 0.72 |
| Net realized and unrealized gain (loss) on foreign currency transactions | (0.00)‡ | | 0.08 | | 0.00‡ | | 0.11 | | (0.14) | | 0.14 |
| Total from investment operations | 1.24 | | 1.28 | | 2.71 | | (0.85) | | 1.97 | | 1.40 |
| Less distributions: | | | | | | | | | | | |
| From net investment income | (0.33) | | (0.42) | | (0.68) | | (0.46) | | (0.54) | | (0.68) |
| From net realized gain on investments | — | | (0.63) | | (0.12) | | (0.75) | | (0.08) | | (0.09) |
| Total distributions | (0.33) | | (1.05) | | (0.80) | | (1.21) | | (0.62) | | (0.77) |
| Net asset value at end of period | $ 18.28 | | $ 17.37 | | $ 17.14 | | $ 15.23 | | $ 17.29 | | $ 15.94 |
| Total investment return (b) | 7.19% | | 7.98% | | 18.07% | | (5.21)% | | 12.53% | | 9.30% |
| Ratios (to average net assets)/Supplemental Data: | | | | | | | | | | | |
| Net investment income (loss) | 2.80%†† | | 2.50% | | 3.00% | | 3.18% | | 2.91% | | 3.47% |
| Net expenses (c) | 0.62%†† | | 0.62% | | 0.63% | | 0.62% | | 0.62% | | 0.63% |
| Interest expense and fees | —% | | —% | | —% | | 0.00%(d) | | 0.01% | | —% |
| Portfolio turnover rate | 34%(e) | | 68%(e) | | 59%(e) | | 50%(e) | | 26% | | 28% |
| Net assets at end of period (in 000’s) | $ 198,276 | | $ 192,022 | | $ 193,252 | | $ 178,608 | | $ 207,056 | | $ 202,450 |
| * | Unaudited. |
| ‡ | Less than one cent per share. |
| †† | Annualized. |
| (a) | Per share data based on average shares outstanding during the period. |
| (b) | Total return does not reflect any deduction of sales charges, mortality and expense charges, contract charges or administrative charges. For periods of less than one year, total return is not annualized. |
| (c) | In addition to the fees and expenses which the Portfolio bears directly, it also indirectly bears a pro-rata share of the fees and expenses of the underlying funds in which it invests. Such indirect expenses are not included in the above expense ratios. |
| (d) | Less than 0.01%. |
| (e) | The portfolio turnover rates not including mortgage dollar rolls were 34%, 67%, 52% and 39% for the six months ended June 30, 2021 and for the years ended December 31, 2020, 2019 and 2018, respectively. |
The notes to the financial statements are an integral part of, and should be read in conjunction with, the financial statements.
31
Financial Highlights selected per share data and ratios
| | Six months ended
June 30,
2021* | | Year Ended December 31, |
| Service Class | 2020 | | 2019 | | 2018 | | 2017 | | 2016 |
| Net asset value at beginning of period | $ 17.22 | | $ 16.99 | | $ 15.11 | | $ 17.17 | | $ 15.83 | | $ 15.21 |
| Net investment income (loss) (a) | 0.22 | | 0.37 | | 0.45 | | 0.48 | | 0.44 | | 0.50 |
| Net realized and unrealized gain (loss) on investments | 0.99 | | 0.78 | | 2.19 | | (1.48) | | 1.62 | | 0.72 |
| Net realized and unrealized gain (loss) on foreign currency transactions | (0.00)‡ | | 0.08 | | 0.00‡ | | 0.11 | | (0.14) | | 0.14 |
| Total from investment operations | 1.21 | | 1.23 | | 2.64 | | (0.89) | | 1.92 | | 1.36 |
| Less distributions: | | | | | | | | | | | |
| From net investment income | (0.31) | | (0.37) | | (0.64) | | (0.42) | | (0.50) | | (0.65) |
| From net realized gain on investments | — | | (0.63) | | (0.12) | | (0.75) | | (0.08) | | (0.09) |
| Total distributions | (0.31) | | (1.00) | | (0.76) | | (1.17) | | (0.58) | | (0.74) |
| Net asset value at end of period | $ 18.12 | | $ 17.22 | | $ 16.99 | | $ 15.11 | | $ 17.17 | | $ 15.83 |
| Total investment return (b) | 7.06% | | 7.71% | | 17.78% | | (5.45)% | | 12.25% | | 9.03% |
| Ratios (to average net assets)/Supplemental Data: | | | | | | | | | | | |
| Net investment income (loss) | 2.55%†† | | 2.25% | | 2.74% | | 2.93% | | 2.65% | | 3.20% |
| Net expenses (c) | 0.87%†† | | 0.87% | | 0.88% | | 0.87% | | 0.87% | | 0.88% |
| Interest expense and fees | —% | | —% | | —% | | 0.00%(d) | | 0.01% | | —% |
| Portfolio turnover rate | 34%(e) | | 68%(e) | | 59%(e) | | 50%(e) | | 26% | | 28% |
| Net assets at end of period (in 000’s) | $ 489,402 | | $ 473,118 | | $ 433,515 | | $ 360,874 | | $ 425,340 | | $ 361,357 |
| * | Unaudited. |
| ‡ | Less than one cent per share. |
| †† | Annualized. |
| (a) | Per share data based on average shares outstanding during the period. |
| (b) | Total return does not reflect any deduction of sales charges, mortality and expense charges, contract charges or administrative charges. For periods of less than one year, total return is not annualized. |
| (c) | In addition to the fees and expenses which the Portfolio bears directly, it also indirectly bears a pro-rata share of the fees and expenses of the underlying funds in which it invests. Such indirect expenses are not included in the above expense ratios. |
| (d) | Less than 0.01%. |
| (e) | The portfolio turnover rates not including mortgage dollar rolls were 34%, 67%, 52% and 39% for the six months ended June 30, 2021 and for the years ended December 31, 2020, 2019 and 2018, respectively. |
The notes to the financial statements are an integral part of, and should be read in conjunction with, the financial statements.
| 32 | MainStay VP Income Builder Portfolio |
Notes to Financial Statements (Unaudited)
Note 1–Organization and Business
MainStay VP Funds Trust (the “Fund”) was organized as a Delaware statutory trust on February 1, 2011. The Fund is registered under the Investment Company Act of 1940, as amended (the “1940 Act”), as an open-end management investment company. The Fund is comprised of thirty-one separate series (collectively referred to as the “Portfolios”). These financial statements and notes relate to the MainStay VP Income Builder Portfolio (the "Portfolio"), a "diversified” portfolio, as that term is defined in the 1940 Act, as interpreted or modified by regulatory authorities having jurisdiction, from time to time.
Shares of the Portfolio are currently offered to certain separate accounts to fund variable annuity policies and variable universal life insurance policies issued by New York Life Insurance and Annuity Corporation (“NYLIAC”), a wholly-owned subsidiary of New York Life Insurance Company (“New York Life”) and may also be offered to fund variable annuity policies and variable universal life insurance policies issued by other insurance companies. NYLIAC allocates shares of the Portfolios to, among others, certain NYLIAC separate accounts. Shares of the Portfolio are also offered to the MainStay VP Conservative Allocation Portfolio, MainStay VP Moderate Allocation Portfolio, MainStay VP Growth Allocation Portfolio (formerly known as MainStay VP Moderate Growth Allocation Portfolio) and MainStay VP Equity Allocation Portfolio (formerly known as MainStay VP Growth Allocation Portfolio), which operate as “funds-of-funds," and other variable insurance funds.
The following table lists the Portfolio's share classes that have been registered and commenced operations:
| Class | Commenced Operations |
| Initial Class | January 29, 1993 |
| Service Class | June 4, 2003 |
Shares of the Portfolio are offered and are redeemed at a price equal to their respective net asset value (“NAV”) per share. No sales or redemption charge is applicable to the purchase or redemption of the Portfolio's shares. Under the terms of the Fund’s multiple class plan, adopted pursuant to Rule 18f-3 under the 1940 Act, the classes differ in that, among other things, Service Class shares of the Portfolio pay a combined distribution and service fee of 0.25% of average daily net assets attributable to Service Class shares of the Portfolio to the Distributor (as defined in Note 3(B)) pursuant to a plan adopted in accordance with Rule 12b-1 under the 1940 Act. Contract owners of variable annuity contracts purchased after June 2, 2003, are permitted to invest only in the Service Class shares.
The Portfolio's investment objective is to seek current income consistent with reasonable opportunity for future growth of capital and income.
Note 2–Significant Accounting Policies
The Portfolio is an investment company and accordingly follows the investment company accounting and reporting guidance of the Financial Accounting Standards Board (“FASB”) Accounting Standard Codification
Topic 946 Financial Services—Investment Companies. The Portfolio prepares its financial statements in accordance with generally accepted accounting principles (“GAAP”) in the United States of America and follows the significant accounting policies described below.
(A) Securities Valuation. Investments are usually valued as of the close of regular trading on the New York Stock Exchange (the "Exchange") (usually 4:00 p.m. Eastern time) on each day the Portfolio is open for business ("valuation date").
The Board of Trustees of the Fund (the "Board") adopted procedures establishing methodologies for the valuation of the Portfolio's securities and other assets and delegated the responsibility for valuation determinations under those procedures to the Valuation Committee of the Fund (the “Valuation Committee”). The procedures state that, subject to the oversight of the Board and unless otherwise noted, the responsibility for the day-to-day valuation of portfolio assets (including fair value measurements for the Portfolio's assets and liabilities) rests with New York Life Investment Management LLC (“New York Life Investments” or the "Manager"), aided to whatever extent necessary by the Subadvisors (as defined in Note 3(A)). To assess the appropriateness of security valuations, the Manager, the Subadvisors or the Portfolio's third-party service provider, who is subject to oversight by the Manager, regularly compares prior day prices, prices on comparable securities and the sale prices to the prior and current day prices and challenges prices with changes exceeding certain tolerance levels with third-party pricing services or broker sources.
The Board authorized the Valuation Committee to appoint a Valuation Subcommittee (the “Subcommittee”) to establish the prices of securities for which market quotations are not readily available or the prices of which are not otherwise readily determinable under the procedures. The Subcommittee meets (in person, via electronic mail or via teleconference) on an as-needed basis. The Valuation Committee meets to ensure that actions taken by the Subcommittee were appropriate.
For those securities valued through either a standardized fair valuation methodology or a fair valuation measurement, the Subcommittee deals with such valuation and the Valuation Committee reviews and affirms, if appropriate, the reasonableness of the valuation based on such methodologies and measurements on a regular basis after considering information that is reasonably available and deemed relevant by the Valuation Committee. Any action taken by the Subcommittee with respect to the valuation of a portfolio security or other asset is submitted for review and ratification (if appropriate) to the Valuation Committee and the Board at the next regularly scheduled meeting.
"Fair value" is defined as the price the Portfolio would reasonably expect to receive upon selling an asset or liability in an orderly transaction to an independent buyer in the principal or most advantageous market for the asset or liability. Fair value measurements are determined within a framework that establishes a three-tier hierarchy that maximizes the use of observable market data and minimizes the use of unobservable inputs to establish a classification of fair value measurements for disclosure
Notes to Financial Statements (Unaudited) (continued)
purposes. "Inputs" refer broadly to the assumptions that market participants would use in pricing the asset or liability, including assumptions about risk, such as the risk inherent in a particular valuation technique used to measure fair value using a pricing model and/or the risk inherent in the inputs for the valuation technique. Inputs may be observable or unobservable. Observable inputs reflect the assumptions market participants would use in pricing the asset or liability based on market data obtained from sources independent of the Portfolio. Unobservable inputs reflect the Portfolio’s own assumptions about the assumptions market participants would use in pricing the asset or liability based on the information available. The inputs or methodology used for valuing assets or liabilities may not be an indication of the risks associated with investing in those assets or liabilities. The three-tier hierarchy of inputs is summarized below.
| • | Level 1—quoted prices in active markets for an identical asset or liability |
| • | Level 2—other significant observable inputs (including quoted prices for a similar asset or liability in active markets, interest rates and yield curves, prepayment speeds, credit risk, etc.) |
| • | Level 3—significant unobservable inputs (including the Portfolio's own assumptions about the assumptions that market participants would use in measuring fair value of an asset or liability) |
The level of an asset or liability within the fair value hierarchy is based on the lowest level of an input, both individually and in the aggregate, that is significant to the fair value measurement. The aggregate value by input level of the Portfolio’s assets and liabilities as of June 30, 2021, is included at the end of the Portfolio of Investments.
The Portfolio may use third-party vendor evaluations, whose prices may be derived from one or more of the following standard inputs, among others:
| • Benchmark yields | • Reported trades |
| • Broker/dealer quotes | • Issuer spreads |
| • Two-sided markets | • Benchmark securities |
| • Bids/offers | • Reference data (corporate actions or material event notices) |
| • Industry and economic events | • Comparable bonds |
| • Monthly payment information | |
An asset or liability for which market values cannot be measured using the methodologies described above is valued by methods deemed reasonable in good faith by the Valuation Committee, following the procedures established by the Board, to represent fair value. Under these procedures, the Portfolio generally uses a market-based approach which may use related or comparable assets or liabilities, recent transactions, market multiples, book values and other relevant information. The Portfolio may also use an income-based valuation approach in which the anticipated future cash flows of the asset or liability are discounted to calculate fair value. Discounts may also be applied due to the nature and/or duration of any restrictions on the disposition of the asset or
liability. Fair value represents a good faith approximation of the value of a security. Fair value determinations involve the consideration of a number of subjective factors, an analysis of applicable facts and circumstances and the exercise of judgment. As a result, it is possible that the fair value for a security determined in good faith in accordance with the Portfolio's valuation procedures may differ from valuations for the same security determined by other funds using their own valuation procedures. Although the Portfolio's valuation procedures are designed to value a security at the price the Portfolio may reasonably expect to receive upon the security's sale in an orderly transaction, there can be no assurance that any fair value determination thereunder would, in fact, approximate the amount that the Portfolio would actually realize upon the sale of the security or the price at which the security would trade if a reliable market price were readily available. During the six-month period ended June 30, 2021, there were no material changes to the fair value methodologies.
Securities which may be valued in this manner include, but are not limited to: (i) a security for which trading has been halted or suspended; (ii) a debt security that has recently gone into default and for which there is not a current market quotation; (iii) a security of an issuer that has entered into a restructuring; (iv) a security that has been delisted from a national exchange; (v) a security for which the market price is not readily available from a third-party pricing source or, if so provided, does not, in the opinion of the Manager or the Subadvisors, reflect the security's market value; (vi) a security subject to trading collars for which no or limited trading takes place; and (vii) a security whose principal market has been temporarily closed at a time when, under normal conditions, it would be open. Securities valued in this manner are generally categorized as Level 3 in the hierarchy. No securities held by the Portfolio as of June 30, 2021 were fair valued in such a manner.
Certain securities held by the Portfolio may principally trade in foreign markets. Events may occur between the time the foreign markets close and the time at which the Portfolio's NAVs are calculated. These events may include, but are not limited to, situations relating to a single issuer in a market sector, significant fluctuations in U.S. or foreign markets, natural disasters, armed conflicts, governmental actions or other developments not tied directly to the securities markets. Should the Manager or the Subadvisors conclude that such events may have affected the accuracy of the last price of such securities reported on the local foreign market, the Subcommittee may, pursuant to procedures adopted by the Board, adjust the value of the local price to reflect the estimated impact on the price of such securities as a result of such events. In this instance, securities are generally categorized as Level 3 in the hierarchy. Additionally, certain foreign equity securities are also fair valued whenever the movement of a particular index exceeds certain thresholds. In such cases, the securities are fair valued by applying factors provided by a third-party vendor in accordance with valuation procedures adopted by the Board and are generally categorized as Level 2 in the hierarchy. No foreign equity securities held by the Portfolio as of June 30, 2021 were fair valued in such a manner.
Equity securities are valued at the last quoted sales prices as of the close of regular trading on the relevant exchange on each valuation date.
| 34 | MainStay VP Income Builder Portfolio |
Securities that are not traded on the valuation date are valued at the mean of the last quoted bid and ask prices. Prices are normally taken from the principal market in which each security trades. These securities are generally categorized as Level 1 in the hierarchy.
Investments in mutual funds, including money market funds, are valued at their respective NAVs at the close of business each day on the valuation date. These securities are generally categorized as Level 1 in the hierarchy.
Futures contracts are valued at the last posted settlement price on the market where such futures are primarily traded. These securities are generally categorized as Level 1 in the hierarchy.
Debt securities (other than convertible and municipal bonds) are valued at the evaluated bid prices (evaluated mean prices in the case of convertible and municipal bonds) supplied by a pricing agent or broker selected by the Manager, in consultation with the Subadvisors. The evaluations are market-based measurements processed through a pricing application and represents the pricing agent’s good faith determination as to what a holder may receive in an orderly transaction under market conditions. The rules-based logic utilizes valuation techniques that reflect participants’ assumptions and vary by asset class and per methodology, maximizing the use of relevant observable data including quoted prices for similar assets, benchmark yield curves and market corroborated inputs. The evaluated bid or mean prices are deemed by the Manager, in consultation with the Subadvisors, to be representative of market values at the regular close of trading of the Exchange on each valuation date. Debt securities purchased on a delayed delivery basis are marked to market daily until settlement at the forward settlement date. Debt securities, including corporate bonds, U.S. government and federal agency bonds, municipal bonds, foreign bonds, convertible bonds, asset-backed securities and mortgage-backed securities are generally categorized as Level 2 in the hierarchy.
Foreign currency forward contracts are valued at their fair market values measured on the basis of the mean between the last current bid and ask prices based on dealer or exchange quotations and are generally categorized as Level 2 in the hierarchy.
Loan assignments, participations and commitments are valued at the average of bid quotations obtained from the engaged independent pricing service and are generally categorized as Level 2 in the hierarchy. Certain loan assignments, participations and commitments may be valued by utilizing significant unobservable inputs obtained from the pricing service and are generally categorized as Level 3 in the hierarchy.
Temporary cash investments acquired in excess of 60 days to maturity at the time of purchase are valued using the latest bid prices or using valuations based on a matrix system (which considers such factors as security prices, yields, maturities and ratings), both as furnished by independent pricing services. Temporary cash investments that mature in 60 days or less at the time of purchase ("Short-Term Investments") are valued using the amortized cost method of valuation, unless the use of such method would be inappropriate. The amortized cost method involves
valuing a security at its cost on the date of purchase and thereafter assuming a constant amortization to maturity of the difference between such cost and the value on maturity date. Amortized cost approximates the current fair value of a security. Securities valued using the amortized cost method are not valued using quoted prices in an active market and are generally categorized as Level 2 in the hierarchy.
The information above is not intended to reflect an exhaustive list of the methodologies that may be used to value portfolio investments. The valuation procedures permit the use of a variety of valuation methodologies in connection with valuing portfolio investments. The methodology used for a specific type of investment may vary based on the market data available or other considerations. The methodologies summarized above may not represent the specific means by which portfolio investments are valued on any particular business day.
(B) Income Taxes. The Portfolio's policy is to comply with the requirements of the Internal Revenue Code of 1986, as amended (the “Internal Revenue Code”), applicable to regulated investment companies and to distribute all of its taxable income to the shareholders of the Portfolio within the allowable time limits.
The Manager evaluates the Portfolio’s tax positions to determine if the tax positions taken meet the minimum recognition threshold in connection with accounting for uncertainties in income tax positions taken or expected to be taken for the purposes of measuring and recognizing tax liabilities in the financial statements. Recognition of tax benefits of an uncertain tax position is permitted only to the extent the position is “more likely than not” to be sustained assuming examination by taxing authorities. The Manager analyzed the Portfolio's tax positions taken on federal, state and local income tax returns for all open tax years (for up to three tax years) and has concluded that no provisions for federal, state and local income tax are required in the Portfolio's financial statements. The Portfolio's federal, state and local income tax and federal excise tax returns for tax years for which the applicable statutes of limitations have not expired are subject to examination by the Internal Revenue Service and state and local departments of revenue.
(C) Foreign Taxes. The Portfolio may be subject to foreign taxes on income and other transaction-based taxes imposed by certain countries in which it invests. A portion of the taxes on gains on investments or currency purchases/repatriation may be reclaimable. The Portfolio will accrue such taxes and reclaims as applicable, based upon its current interpretation of tax rules and regulations that exist in the markets in which it invests.
The Portfolio may be subject to taxation on realized capital gains, repatriation proceeds and other transaction-based taxes imposed by certain countries in which it invests. The Portfolio will accrue such taxes as applicable based upon its current interpretation of tax rules and regulations that exist in the market in which it invests. Capital gains taxes relating to positions still held are reflected as a liability in the Statement of Assets and Liabilities, as well as an adjustment to the Portfolio's net unrealized appreciation (depreciation). Taxes related to capital gains
Notes to Financial Statements (Unaudited) (continued)
realized, if any, are reflected as part of net realized gain (loss) in the Statement of Operations. Changes in tax liabilities related to capital gains taxes on unrealized investment gains, if any, are reflected as part of the change in net unrealized appreciation (depreciation) on investments in the Statement of Operations. Transaction-based charges are generally assessed as a percentage of the transaction amount.
(D) Dividends and Distributions to Shareholders. Dividends and distributions are recorded on the ex-dividend date. The Portfolio intends to declare and pay dividends from net investment income, if any, at least quarterly and distributions from net realized capital and currency gains, if any, at least annually. Unless a shareholder elects otherwise, all dividends and distributions are reinvested at NAV in the same class of shares of the Portfolio. Dividends and distributions to shareholders are determined in accordance with federal income tax regulations and may differ from determinations using GAAP.
(E) Security Transactions and Investment Income. The Portfolio records security transactions on the trade date. Realized gains and losses on security transactions are determined using the identified cost method. Dividend income is recognized on the ex-dividend date, net of any foreign tax withheld at the source, and interest income is accrued as earned using the effective interest rate method and includes any realized gains and losses from repayments of principal on mortgage-backed securities. Distributions received from real estate investment trusts may be classified as dividends, capital gains and/or return of capital. Discounts and premiums on securities purchased for the Portfolio are accreted and amortized, respectively, on the effective interest rate method.
Investment income and realized and unrealized gains and losses on investments of the Portfolio are allocated pro rata to the separate classes of shares based upon their relative net assets on the date the income is earned or realized and unrealized gains and losses are incurred.
The Portfolio may place a debt security on non-accrual status and reduce related interest income by ceasing current accruals and writing off all or a portion of any interest receivables when the collection of all or a portion of such interest has become doubtful. A debt security is removed from non-accrual status when the issuer resumes interest payments or when collectability of interest is reasonably assured.
(F) Expenses. Expenses of the Fund are allocated to the individual Portfolios in proportion to the net assets of the respective Portfolios when the expenses are incurred, except where direct allocations of expenses can be made. Expenses (other than fees incurred under the distribution and service plans, further discussed in Note 3(B), which are charged directly to the Service Class shares) are allocated to separate classes of shares pro rata based upon their relative net assets on the date the expenses are incurred. The expenses borne by the Portfolio, including those of related parties to the Portfolio, are shown in the Statement of Operations.
Additionally, the Portfolio may invest in mutual funds, which are subject to management fees and other fees that may cause the costs of investing in mutual funds to be greater than the costs of owning the underlying
securities directly. These indirect expenses of mutual funds are not included in the amounts shown as expenses in the Statement of Operations or in the expense ratios included in the Financial Highlights.
(G) Use of Estimates. In preparing financial statements in conformity with GAAP, the Manager makes estimates and assumptions that affect the reported amounts and disclosures in the financial statements. Actual results could differ from those estimates and assumptions.
(H) Futures Contracts. A futures contract is an agreement to purchase or sell a specified quantity of an underlying instrument at a specified future date and price, or to make or receive a cash payment based on the value of a financial instrument (e.g., foreign currency, interest rate, security or securities index). The Portfolio is subject to risks such as market price risk and/or interest rate risk in the normal course of investing in these contracts. Upon entering into a futures contract, the Portfolio is required to pledge to the broker or futures commission merchant an amount of cash and/or U.S. government securities equal to a certain percentage of the collateral amount, known as the “initial margin.” During the period the futures contract is open, changes in the value of the contract are recognized as unrealized appreciation or depreciation by marking to market such contract on a daily basis to reflect the market value of the contract at the end of each day’s trading. The Portfolio agrees to receive from or pay to the broker or futures commission merchant an amount of cash equal to the daily fluctuation in the value of the contract. Such receipts or payments are known as “variation margin.” When the futures contract is closed, the Portfolio records a realized gain or loss equal to the difference between the proceeds from (or cost of) the closing transaction and the Portfolio's basis in the contract.
The use of futures contracts involves, to varying degrees, elements of market risk in excess of the amount recognized in the Statement of Assets and Liabilities. The contract or notional amounts and variation margin reflect the extent of the Portfolio's involvement in open futures positions. There are several risks associated with the use of futures contracts as hedging techniques. There can be no assurance that a liquid market will exist at the time when the Portfolio seeks to close out a futures contract. If no liquid market exists, the Portfolio would remain obligated to meet margin requirements until the position is closed. Futures contracts may involve a small initial investment relative to the risk assumed, which could result in losses greater than if the Portfolio did not invest in futures contracts. Futures contracts may be more volatile than direct investments in the instrument underlying the futures and may not correlate to the underlying instrument, causing a given hedge not to achieve its objectives. The Portfolio's activities in futures contracts have minimal counterparty risk as they are conducted through regulated exchanges that guarantee the futures against default by the counterparty. In the event of a bankruptcy or insolvency of a futures commission merchant that holds margin on behalf of the Portfolio, the Portfolio may not be entitled to the return of the entire margin owed to the Portfolio, potentially resulting in a loss. The Portfolio may invest in futures contracts to seek enhanced returns or to reduce the risk of loss by hedging certain
| 36 | MainStay VP Income Builder Portfolio |
of its holdings. The Portfolio's investment in futures contracts and other derivatives may increase the volatility of the Portfolio's NAVs and may result in a loss to the Portfolio. Open futures contracts as of June 30, 2021 are shown in the Portfolio of Investments.
(I) Loan Assignments, Participations and Commitments. The Portfolio may invest in loan assignments and participations ("loans"). Commitments are agreements to make money available to a borrower in a specified amount, at a specified rate and within a specified time. The Portfolio records an investment when the borrower withdraws money on a commitment or when a funded loan is purchased (trade date) and records interest as earned. These loans pay interest at rates that are periodically reset by reference to a base lending rate plus a spread. These base lending rates are generally the prime rate offered by a designated U.S. bank or the London Interbank Offered Rate ("LIBOR").
The loans in which the Portfolio may invest are generally readily marketable, but may be subject to some restrictions on resale. For example, the Portfolio may be contractually obligated to receive approval from the agent bank and/or borrower prior to the sale of these investments. If the Portfolio purchases an assignment from a lender, the Portfolio will generally have direct contractual rights against the borrower in favor of the lender. If the Portfolio purchases a participation interest either from a lender or a participant, the Portfolio typically will have established a direct contractual relationship with the seller of the participation interest, but not with the borrower. Consequently, the Portfolio is subject to the credit risk of the lender or participant who sold the participation interest to the Portfolio, in addition to the usual credit risk of the borrower. In the event that the borrower, selling participant or intermediate participants become insolvent or enter into bankruptcy, the Portfolio may incur certain costs and delays in realizing payment, or may suffer a loss of principal and/or interest.
Unfunded commitments represent the remaining obligation of the Portfolio to the borrower. At any point in time, up to the maturity date of the issue, the borrower may demand the unfunded portion. Unfunded amounts, if any, are marked to market and any unrealized gains or losses are recorded in the Statement of Assets and Liabilities. As of June 30, 2021, the Portfolio did not hold any unfunded commitments.
(J) Foreign Currency Forward Contracts. The Portfolio may enter into foreign currency forward contracts, which are agreements to buy or sell foreign currencies on a specified future date at a specified rate. The Portfolio is subject to foreign currency exchange rate risk in the normal course of investing in these transactions. During the period the forward contract is open, changes in the value of the contract are recognized as unrealized appreciation or depreciation by marking to market such contract on a daily basis to reflect the market value of the contract at the end of each day’s trading. Cash movement occurs on the settlement date. When the forward contract is closed, the Portfolio records a realized gain or loss equal to the difference between the proceeds from (or cost of) the closing transaction and the Portfolio's basis in the contract. The Portfolio may purchase and sell foreign currency forward contracts for purposes of seeking to enhance portfolio returns and manage portfolio risk more
efficiently. Foreign currency forward contracts may also be used to gain exposure to a particular currency or to hedge against the risk of loss due to changing currency exchange rates. Foreign currency forward contracts to purchase or sell a foreign currency may also be used in anticipation of future purchases or sales of securities denominated in foreign currency, even if the specific investments have not yet been selected.
The use of foreign currency forward contracts involves, to varying degrees, elements of risk in excess of the amount recognized in the Statement of Assets and Liabilities, including counterparty risk, market risk and illiquidity risk. Counterparty risk is heightened for these instruments because foreign currency forward contracts are not exchange-traded and therefore no clearinghouse or exchange stands ready to meet the obligations under such contracts. Thus, the Portfolio faces the risk that its counterparties under such contracts may not perform their obligations. Market risk is the risk that the value of a foreign currency forward contract will depreciate due to unfavorable changes in exchange rates. Illiquidity risk arises because the secondary market for foreign currency forward contracts may have less liquidity relative to markets for other securities and financial instruments. Risks also arise from the possible movements in the foreign exchange rates underlying these instruments. While the Portfolio may enter into forward contracts to reduce currency exchange risks, changes in currency exchange rates may result in poorer overall performance for the Portfolio than if it had not engaged in such transactions. Exchange rate movements can be large, depending on the currency, and can last for extended periods of time, affecting the value of the Portfolio's assets. Moreover, there may be an imperfect correlation between the Portfolio's holdings of securities denominated in a particular currency and forward contracts entered into by the Portfolio. Such imperfect correlation may prevent the Portfolio from achieving the intended hedge or expose the Portfolio to the risk of currency exchange loss. The unrealized appreciation (depreciation) on forward contracts also reflects the Portfolio's exposure at the valuation date to credit loss in the event of a counterparty’s failure to perform its obligations. Open foreign currency forward contracts as of June 30, 2021, are shown in the Portfolio of Investments.
(K) Foreign Currency Transactions. The Portfolio's books and records are maintained in U.S. dollars. Prices of securities denominated in foreign currency amounts are translated into U.S. dollars at the mean between the buying and selling rates last quoted by any major U.S. bank at the following dates:
(i) market value of investment securities, other assets and liabilities— at the valuation date; and
(ii) purchases and sales of investment securities, income and expenses—at the date of such transactions.
The assets and liabilities that are denominated in foreign currency amounts are presented at the exchange rates and market values at the close of the period. The realized and unrealized changes in net assets arising from fluctuations in exchange rates and market prices of securities are not separately presented.
Notes to Financial Statements (Unaudited) (continued)
Net realized gain (loss) on foreign currency transactions represents net currency gains or losses realized as a result of differences between the amounts of securities sale proceeds or purchase cost, dividends, interest and withholding taxes as recorded on the Portfolio's books, and the U.S. dollar equivalent amount actually received or paid. Net currency gains or losses from valuing such foreign currency denominated assets and liabilities, other than investments at valuation date exchange rates, are reflected in unrealized foreign exchange gains or losses.
(L) Securities Lending. In order to realize additional income, the Portfolio may engage in securities lending, subject to the limitations set forth in the 1940 Act and relevant guidance by the staff of the Securities and Exchange Commission (“SEC”). If the Portfolio engages in securities lending, the Portfolio will lend through its custodian, JPMorgan Chase Bank, N.A., ("JPMorgan"), acting as securities lending agent on behalf of the Portfolio. Under the current arrangement, JPMorgan will manage the Portfolio's collateral in accordance with the securities lending agency agreement between the Portfolio and JPMorgan, and indemnify the Portfolio against counterparty risk. The loans will be collateralized by cash (which may be invested in a money market fund) and/or non-cash collateral (which may include U.S. Treasury securities and/or U.S. government agency securities issued or guaranteed by the United States government or its agencies or instrumentalities) at least equal at all times to the market value of the securities loaned. The Portfolio bears the risk of delay in recovery of, or loss of rights in, the securities loaned. The Portfolio may also record a realized gain or loss on securities deemed sold due to a borrower’s inability to return securities on loan. The Portfolio bears the risk of any loss on investment of cash collateral. The Portfolio will receive compensation for lending its securities in the form of fees or it will retain a portion of interest earned on the investment of any cash collateral. The Portfolio will also continue to receive interest and dividends on the securities loaned and any gain or loss in the market price of the securities loaned that may occur during the term of the loan will be for the account of the Portfolio. Income earned from securities lending activities, if any, is reflected in the Statement of Operations. Securities on loan as of June 30, 2021, are shown in the Portfolio of Investments.
Prior to February 22, 2021, these services were provided by State Street Bank and Trust Company (“State Street”).
(M) Dollar Rolls. The Portfolio may enter into dollar roll transactions in which it sells mortgage-backed securities ("MBS") from its portfolio to a counterparty from whom it simultaneously agrees to buy a similar security on a delayed delivery basis. The Portfolio generally transfers MBS where the MBS are "to be announced," therefore, the Portfolio accounts for these transactions as purchases and sales.
When accounted for as purchase and sales, the securities sold in connection with the dollar rolls are removed from the portfolio and a realized gain or loss is recognized. The securities the Portfolio has agreed to acquire are included at market value in the Portfolio of Investments and liabilities for such purchase commitments are included as payables for investments purchased. During the roll period, the Portfolio foregoes principal and interest paid on the securities. The Portfolio is compensated
by the difference between the current sales price and the forward price for the future as well as by the earnings on the cash proceeds of the initial sale. Dollar rolls may be renewed without physical delivery of the securities subject to the contract. The Portfolio maintains liquid assets from its portfolio having a value not less than the repurchase price, including accrued interest. Dollar roll transactions involve certain risks, including the risk that the securities returned to the Portfolio at the end of the roll period, while substantially similar, could be inferior to what was initially sold to the counterparty.
(N) Delayed Delivery Transactions. The Portfolio may purchase or sell securities on a delayed delivery basis. These transactions involve a commitment by the Portfolio to purchase or sell securities for a predetermined price or yield, with payment and delivery taking place beyond the customary settlement period. When delayed delivery purchases are outstanding, the Portfolio will designate liquid assets in an amount sufficient to meet the purchase price. When purchasing a security on a delayed delivery basis, the Portfolio assumes the rights and risks of ownership of the security, including the risk of price and yield fluctuations, and takes such fluctuations into account when determining its NAV. The Portfolio may dispose of or renegotiate a delayed delivery transaction after it is entered into, and may sell delayed delivery securities before they are delivered, which may result in a realized gain or loss. When the Portfolio has sold a security it owns on a delayed delivery basis, the Portfolio does not participate in future gains and losses with respect to the security. As of June 30, 2021, delayed delivery transactions are shown in the Portfolio of Investments.
(O) Securities Risk. The ability of issuers of debt securities held by the Portfolio to meet their obligations may be affected by, among other things, economic or political developments in a specific country, industry or region. Debt securities are also subject to the risks associated with changes in interest rates.
The Portfolio may invest in high-yield debt securities (sometimes called “junk bonds”), which are generally considered speculative because they present a greater risk of loss, including default, than higher quality debt securities. These securities pay investors a premium—a higher interest rate or yield than investment grade debt securities—because of the increased risk of loss. These securities can also be subject to greater price volatility. In times of unusual or adverse market, economic or political conditions, these securities may experience higher than normal default rates.
The Portfolio may invest in foreign securities, which carry certain risks that are in addition to the usual risks inherent in domestic securities. These risks include those resulting from currency fluctuations, future adverse political or economic developments and possible imposition of currency exchange blockages or other foreign governmental laws or restrictions. These risks are likely to be greater in emerging markets than in developed markets. The ability of issuers of securities held by the Portfolio to meet their obligations may be affected by, among other things, economic or political developments in a specific country, industry or region.
| 38 | MainStay VP Income Builder Portfolio |
The Portfolio may invest in loans which are usually rated below investment grade and are generally considered speculative because they present a greater risk of loss, including default, than higher rated debt securities. These investments pay investors a higher interest rate than investment grade debt securities because of the increased risk of loss. Although certain loans are collateralized, there is no guarantee that the value of the collateral will be sufficient to repay the loan. In a recession or serious credit event, the value of these investments could decline significantly. As a result, the Portfolio’s NAVs could go down and you could lose money.
In addition, loans generally are subject to extended settlement periods that may be longer than seven days. As a result, the Portfolio may be adversely affected by selling other investments at an unfavorable time and/or under unfavorable conditions or engaging in borrowing transactions, such as borrowing against its credit facility, to raise cash to meet redemption obligations or pursue other investment opportunities.
In certain circumstances, loans may not be deemed to be securities. As a result, the Portfolio may not have the protection of anti-fraud provisions of the federal securities laws. In such cases, the Portfolio generally must rely on the contractual provisions in the loan agreement and common-law fraud protections under applicable state law.
(P) Counterparty Credit Risk. In order to better define its contractual rights and to secure rights that will help the Portfolio mitigate its counterparty risk, the Portfolio may enter into an International Swaps and Derivatives Association, Inc. Master Agreement (“ISDA Master Agreement”) or similar agreement with its counterparties. An ISDA Master Agreement is a bilateral agreement between the Portfolio and a counterparty that governs certain OTC derivatives and typically contains collateral posting terms and netting provisions. Under an ISDA Master Agreement, the Portfolio may, under certain circumstances, offset with the counterparty certain derivative financial instruments’ payables and/ or receivables with collateral held and/or posted and create one single net payment. The provisions of the ISDA Master Agreement typically permit a single net payment in the event of default including the bankruptcy or insolvency of the counterparty. Bankruptcy or insolvency laws of a particular jurisdiction may restrict or prohibit the right of offset in bankruptcy, insolvency or other events. In addition, certain ISDA Master Agreements may contain provisions for early termination of OTC derivative transactions in the event the net assets of the Portfolio decline below specific levels or if the Portfolio fails to meet the terms of its ISDA Master Agreements. The result would cause the Portfolio to accelerate payment of any net liability owed to the counterparty.
For financial reporting purposes, the Portfolio does not offset derivative assets and derivative liabilities that are subject to netting arrangements, if any, in the Statement of Assets and Liabilities.
(Q) LIBOR Replacement Risk. The Portfolio may invest in certain debt securities, derivatives or other financial instruments that utilize the LIBOR, as a “benchmark” or “reference rate” for various interest rate calculations. The United Kingdom Financial Conduct Authority, which
regulates LIBOR, announced that after 2021 it will cease its active encouragement of banks to provide the quotations needed to sustain LIBOR. However, it is possible that certain LIBOR tenors may continue beyond 2021 and the most widely used LIBOR tenors may continue until mid-2023. As a result, it is anticipated that LIBOR will be discontinued or will no longer be sufficiently robust to be representative of its underlying market around that time. Although financial regulators and industry working groups have suggested alternative reference rates, such as European Interbank Offer Rate (“EURIBOR”), Sterling Overnight Interbank Average Rate (“SONIA”) and Secured Overnight Financing Rate (“SOFR”), there are challenges to converting certain contracts and transactions to a new benchmark and neither the full effects of the transition process nor its ultimate outcome is known. New York Life Investments is currently working to assess exposure and will modify contracts as necessary.
The elimination of LIBOR or changes to other reference rates or any other changes or reforms to the determination or supervision of reference rates could have an adverse impact on the market for, or value of, any securities or payments linked to those reference rates, which may adversely affect the Portfolio's performance and/or net asset value. Uncertainty and risk also remain regarding the willingness and ability of issuers and lenders to include revised provisions in new and existing contracts or instruments. Consequently, the transition away from LIBOR to other reference rates may lead to increased volatility and illiquidity in markets that are tied to LIBOR, fluctuations in values of LIBOR-related investments or investments in issuers that utilize LIBOR, increased difficulty in borrowing or refinancing and diminished effectiveness of hedging strategies, adversely affecting the Portfolio's performance. Furthermore, the risks associated with the expected discontinuation of LIBOR and transition may be exacerbated if the work necessary to effect an orderly transition to an alternative reference rate is not completed in a timely manner. Because the usefulness of LIBOR as a benchmark could deteriorate during the transition period, these effects could occur prior to the end of 2021 with respect to certain LIBOR tenors or mid-2023 for the remaining LIBOR tenors.
(R) Indemnifications. Under the Fund’s organizational documents, its officers and trustees are indemnified against certain liabilities that may arise out of performance of their duties to the Fund. Additionally, in the normal course of business, the Portfolio enters into contracts with third-party service providers that contain a variety of representations and warranties and that may provide general indemnifications. The Portfolio's maximum exposure under these arrangements is unknown, as this would involve future claims that may be made against the Portfolio that have not yet occurred. The Manager believes that the risk of loss in connection with these potential indemnification obligations is remote. However, there can be no assurance that material liabilities related to such obligations will not arise in the future, which could adversely impact the Portfolio.
Notes to Financial Statements (Unaudited) (continued)
(S) Quantitative Disclosure of Derivative Holdings. The following tables show additional disclosures related to the Portfolio's derivative and hedging activities, including how such activities are accounted for and their effect on the Portfolio's financial positions, performance and cash flows.
The Portfolio entered into Treasury futures contracts in order to hedge against anticipated changes in interest rates that might otherwise have an
adverse effect upon the value of the Portfolio’s securities. The Portfolio also entered into domestic and foreign equity index futures contracts to increase the equity sensitivity to the Portfolio.
The Portfolio entered into foreign currency forward contracts to gain exposure to a particular currency or to hedge against the risk of loss due to changing currency exchange rates. These derivatives are not accounted for as hedging instruments.
Fair value of derivative instruments as of June 30, 2021:
| Asset Derivatives | Equity
Contracts
Risk | Interest
Rate
Contracts
Risk | Total |
| Futures Contracts - Net Assets—Net unrealized appreciation on futures contracts (a) | $553,857 | $1,286,892 | $1,840,749 |
| Total Fair Value | $553,857 | $1,286,892 | $1,840,749 |
| (a) | Includes cumulative appreciation (depreciation) of futures contracts as reported in the Portfolio of Investments. Only current day’s variation margin is reported within the Statement of Assets and Liabilities. |
| Liability Derivatives | Foreign
Exchange
Contracts
Risk | Equity
Contracts
Risk | Interest
Rate
Contracts
Risk | Total |
| Futures Contracts - Net Assets—Net unrealized depreciation on futures contracts (a) | $ — | $(1,160,063) | $(393,441) | $(1,553,504) |
| Forward Contracts - Unrealized depreciation on foreign currency forward contracts | (1,316,004) | — | — | (1,316,004) |
| Total Fair Value | $(1,316,004) | $(1,160,063) | $(393,441) | $(2,869,508) |
| (a) | Includes cumulative appreciation (depreciation) of futures contracts as reported in the Portfolio of Investments. Only current day’s variation margin is reported within the Statement of Assets and Liabilities. |
The effect of derivative instruments on the Statement of Operations for the six-month period ended June 30, 2021:
| Net Realized Gain (Loss) from: | Foreign
Exchange
Contracts
Risk | Equity
Contracts
Risk | Interest
Rate
Contracts
Risk | Total |
| Futures Contracts | $ — | $19,452,950 | $(3,598,179) | $15,854,771 |
| Forward Contracts | (64,540) | — | — | (64,540) |
| Total Net Realized Gain (Loss) | $(64,540) | $19,452,950 | $(3,598,179) | $15,790,231 |
| Net Change in Unrealized Appreciation (Depreciation) | Foreign
Exchange
Contracts
Risk | Equity
Contracts
Risk | Interest
Rate
Contracts
Risk | Total |
| Futures Contracts | $ — | $(3,364,521) | $1,162,246 | $(2,202,275) |
| Forward Contracts | (2,197,655) | — | — | (2,197,655) |
| Total Net Change in Unrealized Appreciation (Depreciation) | $(2,197,655) | $(3,364,521) | $1,162,246 | $(4,399,930) |
| Average Notional Amount | Total |
| Futures Contracts Long | $223,574,129 |
| Futures Contracts Short | $ (18,052,880) |
| Forward Contracts Long | $ 71,760,816 |
| Forward Contracts Short (a) | $ (57,509,144) |
| (a) | Positions were open two months during the reporting period. |
| 40 | MainStay VP Income Builder Portfolio |
Note 3–Fees and Related Party Transactions
(A) Manager and Subadvisors. New York Life Investments, a registered investment adviser and an indirect, wholly-owned subsidiary of New York Life, serves as the Portfolio's Manager, pursuant to an Amended and Restated Management Agreement ("Management Agreement"). The Manager provides offices, conducts clerical, recordkeeping and bookkeeping services and keeps most of the financial and accounting records required to be maintained by the Portfolio. Except for the portion of salaries and expenses that are the responsibility of the Portfolio, the Manager pays the salaries and expenses of all personnel affiliated with the Portfolio and certain operational expenses of the Portfolio. The Portfolio reimburses New York Life Investments in an amount equal to the portion of the compensation of the Chief Compliance Officer attributable to the Portfolio. Pursuant to the terms of an Amended and Restated Subadvisory Agreement with New York Life Investments, MacKay Shields LLC ("MacKay Shields" or "Subadvisor"), a registered investment adviser and an indirect, wholly-owned subsidiary of New York Life, serves as a Subadvisor to the Portfolio and is responsible for the day-to-day portfolio management of the fixed-income portion of the Portfolio. Pursuant to the terms of an Amended and Restated Subadvisory Agreement with New York Life Investments, Epoch Investment Partners, Inc. (“Epoch” or “Subadvisor” and, together with MacKay Shields, the “Subadvisors”), a registered investment adviser, also serves as a Subadvisor to the Portfolio and is responsible for the day-to-day portfolio management of the equity portion of the Portfolio. Asset allocation decisions for the Portfolio are made by a committee chaired by New York Life Investments in collaboration with MacKay. New York Life Investments pays for the services of the Subadvisors.
Pursuant to the Management Agreement, the Fund pays the Manager, on behalf of the Portfolio, a monthly fee for the services performed and the facilities furnished at an annual rate of the Portfolio's average daily net assets as follows: 0.57% up to $1 billion; and 0.55% in excess of $1 billion. During the six-month period ended June 30, 2021, the effective management fee rate was 0.57%.
During the six-month period ended June 30, 2021, New York Life Investments earned fees from the Portfolio in the amount of $1,911,626 and paid MacKay Shields and Epoch $533,784 and $422,592, respectively.
JPMorgan provides sub-administration and sub-accounting services to the Portfolio pursuant to an agreement with New York Life Investments. These services include calculating the daily NAVs of the Portfolio, maintaining the general ledger and sub-ledger accounts for the calculation of the Portfolio's NAVs, and assisting New York Life Investments in conducting various aspects of the Portfolio's administrative operations. For providing these services to the Portfolio, JPMorgan is compensated by New York Life Investments.
Prior to February 22, 2021, these services were provided by State Street.
Pursuant to an agreement between the Fund and New York Life Investments, New York Life Investments is responsible for providing or procuring certain regulatory reporting services for the Portfolio. The Portfolio will reimburse New York Life Investments for the actual costs incurred by New York Life Investments in connection with providing or procuring these services for the Portfolio.
(B) Distribution and Service Fees. The Fund, on behalf of the Portfolio, has entered into a distribution agreement with NYLIFE Distributors LLC (the “Distributor”), an affiliate of New York Life Investments. The Portfolio has adopted a distribution plan (the “Plan”) in accordance with the provisions of Rule 12b-1 under the 1940 Act. Under the Plan, the Distributor has agreed to provide, through its affiliates or independent third parties, various distribution-related, shareholder and administrative support services to the Service Class shareholders. For its services, the Distributor is entitled to a combined distribution and service fee accrued daily and paid monthly at an annual rate of 0.25% of the average daily net assets attributable to the Service Class shares of the Portfolio.
(C) Investments in Affiliates (in 000’s). During the six-month period ended June 30, 2021, purchases and sales transactions, income earned from investments and shares held of investment companies managed by New York Life Investments or its affiliates were as follows:
| Affiliated Investment Companies | Value,
Beginning
of Period | Purchases
at Cost | Proceeds
from
Sales | Net
Realized
Gain/(Loss)
on Sales | Change in
Unrealized
Appreciation/
(Depreciation) | Value,
End of
Period | Dividend
Income | Other
Distributions | Shares
End of
Period |
| MainStay U.S. Government Liquidity Fund | $ 25,926 | $ 119,507 | $ (120,451) | $ — | $ — | $ 24,982 | $ 1 | $ — | 24,982 |
Notes to Financial Statements (Unaudited) (continued)
Note 4-Federal Income Tax
As of June 30, 2021, the cost and unrealized appreciation (depreciation) of the Portfolio’s investment portfolio, including applicable derivative contracts and other financial instruments, as determined on a federal income tax basis, were as follows:
| | Federal Tax
Cost | Gross
Unrealized
Appreciation | Gross
Unrealized
(Depreciation) | Net
Unrealized
Appreciation/
(Depreciation) |
| Investments in Securities | $620,503,287 | $64,473,794 | $(5,603,368) | $58,870,426 |
During the year ended December 31, 2020, the tax character of distributions paid as reflected in the Statements of Changes in Net Assets was as follows:
| | 2020 |
| Distributions paid from: | |
| Ordinary Income | $19,117,766 |
| Long-Term Capital Gains | 18,720,982 |
| Total | $37,838,748 |
Note 5–Custodian
JPMorgan is the custodian of cash and securities held by the Portfolio. Custodial fees are charged to the Portfolio based on the Portfolio's net assets and/or the market value of securities held by the Portfolio and the number of certain transactions incurred by the Portfolio.
Prior to February 22, 2021, these services were provided by State Street. The services provided by State Street were a direct expense of the Portfolio and are included in the Statement of Operations as Custodian fees which totaled $9,533 for the period January 1, 2021 through February 21, 2021.
Note 6–Line of Credit
The Portfolio and certain other funds managed by New York Life Investments maintain a line of credit with a syndicate of banks in order to secure a source of funds for temporary purposes to meet unanticipated or excessive redemption requests.
Effective July 27, 2021, under the credit agreement (the “Credit Agreement”), the aggregate commitment amount is $600,000,000 with an additional uncommitted amount of $100,000,000. The commitment fee is an annual rate of 0.15% of the average commitment amount payable quarterly, regardless of usage, to JPMorgan, who serves as the agent to the syndicate. The commitment fee is allocated among the Portfolio and certain other funds managed by New York Life Investments based upon their respective net assets and other factors. Interest on any revolving credit loan is charged based upon the Federal Funds Rate or the one-month LIBOR, whichever is higher. The Credit Agreement expires on July 26, 2022, although the Portfolio, certain other funds managed by New York Life Investments and the syndicate of banks may renew the
Credit Agreement for an additional year on the same or different terms or enter into a credit agreement with a different syndicate of banks. Prior to July 27, 2021, the aggregate commitment amount and the commitment fee were the same as those under the current Credit Agreement. During the six-month period ended June 30, 2021, there were no borrowings made or outstanding with respect to the Portfolio under the Credit Agreement.
Note 7–Interfund Lending Program
Pursuant to an exemptive order issued by the SEC, the Portfolio, along with certain other funds managed by New York Life Investments, may participate in an interfund lending program. The interfund lending program provides an alternative credit facility that permits the Portfolio and certain other funds managed by New York Life Investments to lend or borrow money for temporary purposes directly to or from one another, subject to the conditions of the exemptive order. During the six-month period ended June 30, 2021, there were no interfund loans made or outstanding with respect to the Portfolio.
Note 8–Purchases and Sales of Securities (in 000’s)
During the six-month period ended June 30, 2021, purchases and sales of U.S. government securities were $71,008 and $55,806, respectively. Purchases and sales of securities, other than U.S. government securities and short-term securities, were $149,867 and $167,293 respectively.
Note 9–Capital Share Transactions
Transactions in capital shares for the six-month period ended June 30, 2021 and the year ended December 31, 2020, were as follows:
| Initial Class | Shares | Amount |
| Period ended June 30, 2021: | | |
| Shares sold | 92,002 | $ 1,640,554 |
| Shares issued to shareholders in reinvestment of distributions | 199,939 | 3,568,860 |
| Shares redeemed | (499,605) | (8,932,479) |
| Net increase (decrease) | (207,664) | $ (3,723,065) |
| Year ended December 31, 2020: | | |
| Shares sold | 471,005 | $ 7,739,984 |
| Shares issued to shareholders in reinvestment of distributions | 698,843 | 11,330,042 |
| Shares redeemed | (1,392,697) | (22,876,387) |
| Net increase (decrease) | (222,849) | $ (3,806,361) |
| |
| 42 | MainStay VP Income Builder Portfolio |
| Service Class | Shares | Amount |
| Period ended June 30, 2021: | | |
| Shares sold | 835,453 | $ 14,614,671 |
| Shares issued to shareholders in reinvestment of distributions | 467,894 | 8,275,164 |
| Shares redeemed | (1,766,653) | (31,137,738) |
| Net increase (decrease) | (463,306) | $ (8,247,903) |
| Year ended December 31, 2020: | | |
| Shares sold | 4,941,562 | $ 80,606,028 |
| Shares issued to shareholders in reinvestment of distributions | 1,648,141 | 26,508,706 |
| Shares redeemed | (4,620,404) | (74,550,489) |
| Net increase (decrease) | 1,969,299 | $ 32,564,245 |
Note 10–Other Matters
An outbreak of COVID-19, first detected in December 2019, has developed into a global pandemic and has resulted in travel restrictions, closure of international borders, certain businesses and securities markets, restrictions on securities trading activities, prolonged quarantines, supply chain disruptions, and lower consumer demand, as well as general concern and uncertainty. The continued impact of COVID-19 and related new variants is uncertain and could further adversely affect the global economy, national economies, individual issuers and capital markets in unforeseeable ways and result in a substantial and extended economic downturn. Developments that disrupt global economies and financial markets, such as COVID-19, may magnify factors that affect the Portfolio's performance.
Note 11–Subsequent Events
In connection with the preparation of the financial statements of the Portfolio as of and for the six-month period ended June 30, 2021, events and transactions subsequent to June 30, 2021, through the date the financial statements were issued have been evaluated by the Manager for possible adjustment and/or disclosure. No subsequent events requiring financial statement adjustment or disclosure have been identified.
Discussion of the Operation and Effectiveness of the Portfolio's Liquidity Risk Management Program (Unaudited)
In compliance with Rule 22e-4 under the Investment Company Act of 1940, as amended (the “Liquidity Rule”), the Portfolio has adopted and implemented a liquidity risk management program (the “Program”), which New York Life Investment Management LLC believes is reasonably designed to assess and manage the Portfolio's liquidity risk (the risk that the Portfolio could not meet requests to redeem shares issued by the Portfolio without significant dilution of remaining investors’ interests in the Portfolio). The Board of Trustees of MainStay VP Funds Trust (the "Board") designated New York Life Investment Management LLC as administrator of the Program (the “Administrator”). The Administrator has established a Liquidity Risk Management Committee to assist the Administrator in the implementation and day-to-day administration of the Program and to otherwise support the Administrator in fulfilling its responsibilities under the Program.
At a meeting of the Board held on March 8, 2021, the Administrator provided the Board with a written report addressing the Program’s operation and assessing its adequacy and effectiveness of implementation for the period from January 1, 2020 through December 31, 2020 (the "Review Period"), as required under the Liquidity Rule. The report noted that the Administrator concluded that (i) the Program operated effectively to assess and manage the Portfolio's liquidity risk, (ii) the Program has been adequately and effectively implemented to monitor and, as applicable, respond to the Portfolio's liquidity developments and (iii) the Portfolio's investment strategy continues to be appropriate for an open-end fund. In addition, the report discussed notable events that impacted liquidity risk during the Review Period, including the COVID-19 pandemic and the resulting economic shutdown.
In accordance with the Program, the Portfolio's liquidity risk is assessed no less frequently than annually taking into consideration certain factors, as applicable, such as (i) investment strategy and liquidity of portfolio investments, (ii) short-term and long-term cash flow projections and (iii) holdings of cash and cash equivalents, as well as borrowing arrangements and other funding sources. Certain factors are considered under both normal and reasonably foreseeable stressed conditions.
Each Portfolio portfolio investment is classified into one of four liquidity categories. The classification is based on a determination of the number of days it is reasonably expected to take to convert the investment into cash, or sell or dispose of the investment, in current market conditions without significantly changing the market value of the investment. The Administrator has delegated liquidity classification determinations to the Portfolio’s subadvisors, subject to appropriate oversight by the Administrator, and classification determinations are made by taking into account the Portfolio's reasonably anticipated trade size, various market, trading and investment-specific considerations, as well as market depth, and, in certain cases, third-party vendor data.
The Liquidity Rule requires portfolios that do not primarily hold assets that are highly liquid investments to adopt a minimum amount of net assets that must be invested in highly liquid investments that are assets (an “HLIM”). In addition, the Liquidity Rule limits a portfolio's investments in illiquid investments. Specifically, the Liquidity Rule prohibits acquisition of illiquid investments if doing so would result in a portfolio holding more than 15% of its net assets in illiquid investments that are assets. The Program includes provisions reasonably designed to determine, periodically review and comply with the HLIM requirement, as applicable, and to comply with the 15% limit on illiquid investments.
There can be no assurance that the Program will achieve its objectives under all circumstances in the future. Please refer to the Portfolio's prospectus for more information regarding the Portfolio's exposure to liquidity risk and other risks to which it may be subject.
| 44 | MainStay VP Income Builder Portfolio |
Proxy Voting Record
The Portfolio is required to file with the SEC its proxy voting records for the 12-month period ending June 30 on Form N-PX. The Portfolio's most recent Form N-PX or proxy voting record is available free of charge upon request (i) by calling 800-598-2019; (ii) by visiting New York Life Investments’ website at https://www.nylinvestments.com/mainstay/
products-and-performance/mainstay-vp-funds-trust; or (iii) by visiting the SEC’s website at www.sec.gov.
Shareholder Reports and Quarterly Portfolio Disclosure
The Portfolio is required to file its complete schedule of portfolio holdings with the SEC 60 days after its first and third fiscal quarter on Form N-PORT. The Portfolio's holdings report is available free of charge upon request by calling 800-598-2019 or by visiting the SEC’s website at www.sec.gov.
This page intentionally left blank
MainStay VP Portfolios
MainStay VP offers a wide range of Portfolios. The full array of MainStay VP offerings is listed here, with information about the manager, subadvisors, legal counsel, and independent registered public accounting firm.
Equity
MainStay VP Candriam Emerging Markets Equity Portfolio
MainStay VP Epoch U.S. Equity Yield Portfolio
MainStay VP Fidelity Institutional AM® Utilities Portfolio†
MainStay VP MacKay International Equity Portfolio
MainStay VP MacKay S&P 500 Index Portfolio
MainStay VP Natural Resources Portfolio
MainStay VP Small Cap Growth Portfolio
MainStay VP T. Rowe Price Equity Income Portfolio
MainStay VP Wellington Growth Portfolio
MainStay VP Wellington Mid Cap Portfolio
MainStay VP Wellington Small Cap Portfolio
MainStay VP Wellington U.S. Equity Portfolio
MainStay VP Winslow Large Cap Growth Portfolio
Mixed Asset
MainStay VP Balanced Portfolio
MainStay VP Income Builder Portfolio
MainStay VP Janus Henderson Balanced Portfolio
MainStay VP MacKay Convertible Portfolio
Income
MainStay VP Bond Portfolio
MainStay VP Floating Rate Portfolio
MainStay VP Indexed Bond Portfolio
MainStay VP MacKay Government Portfolio
MainStay VP MacKay High Yield Corporate Bond Portfolio
MainStay VP MacKay Strategic Bond Portfolio
MainStay VP PIMCO Real Return Portfolio
Money Market
MainStay VP U.S. Government Money Market Portfolio
Alternative
MainStay VP CBRE Global Infrastructure Portfolio
MainStay VP IQ Hedge Multi-Strategy Portfolio
Asset Allocation
MainStay VP Conservative Allocation Portfolio
MainStay VP Equity Allocation Portfolio
MainStay VP Growth Allocation Portfolio
MainStay VP Moderate Allocation Portfolio
Manager
New York Life Investment Management LLC
New York, New York
Subadvisors
Brown Advisory LLC
Baltimore, Maryland
Candriam Belgium S.A.*
Brussels, Belgium
CBRE Clarion Securities LLC
Radnor, Pennsylvania
Epoch Investment Partners, Inc.
New York, New York
FIAM LLC
Smithfield, Rhode Island
IndexIQ Advisors LLC*
New York, New York
Janus Capital Management LLC
Denver, Colorado
MacKay Shields LLC*
New York, New York
Mellon Investments Corporation
Boston, Massachusetts
NYL Investors LLC*
New York, New York
Pacific Investment Management Company LLC
Newport Beach, California
Segall Bryant & Hamill, LLC
Chicago, Illinois
T. Rowe Price Associates, Inc.
Baltimore, Maryland
Wellington Management Company LLP
Boston, Massachusetts
Winslow Capital Management, LLC
Minneapolis, Minnesota
Legal Counsel
Dechert LLP
Washington, District of Columbia
Independent Registered Public Accounting Firm
PricewaterhouseCoopers LLP
New York, New York
Distributor
NYLIFE Distributors LLC*
Jersey City, New Jersey
Custodian
JPMorgan Chase Bank, N.A.
New York, New York
Some Portfolios may not be available in all products.
† Fidelity Institutional AM is a registered trade mark of FMR LLC. Used with permission.
* An affiliate of New York Life Investment Management LLC
Not part of the Semiannual Report
2021 Semiannual Report
This report is for the general information of New York Life Variable Annuities and NYLIAC Variable Universal Life Insurance Products policyowners. It must be preceded or accompanied by the appropriate product(s) and funds prospectuses if it is given to anyone who is not an owner of a New York Life variable annuity policy or a NYLIAC Variable Universal Life Insurance Product. This report does not offer for sale or solicit orders to purchase securities.
The performance data quoted in this report represents past performance. Past performance is no guarantee of future results. Due to market volatility and other factors, current performance may be lower or higher than the figures shown. The most recent month-end performance summary for your variable annuity or variable life policy is available by calling 800-598-2019 and is updated periodically on newyorklife.com.
The New York Life Variable Annuities and NYLIAC Variable Universal Life Insurance Products are issued by New York Life Insurance and Annuity Corporation (a Delaware Corporation) and distributed by NYLIFE Distributors LLC (Member FINRA/SIPC).
New York Life Insurance Company
New York Life Insurance and Annuity
Corporation (NYLIAC) (A Delaware Corporation)
51 Madison Avenue, Room 551
New York, NY 10010
newyorklife.com
nylinvestments.com
NYLIFE Distributors LLC, 30 Hudson Street, Jersey City, NJ 07302
New York Life Investment Management LLC is the investment manager to the MainStay VP Funds Trust
©2021 by NYLIFE Distributors LLC. All rights reserved.
You may obtain copies of the Prospectus and the Statement of Additional Information free of charge, upon request, by calling toll-free 800-598-2019 or writing to New York Life Insurance and Annuity Corporation, 51 Madison Avenue, New York, NY 10010.
| Not FDIC Insured | No Bank Guarantee | May Lose Value |
(NYLIAC) NI522
MainStay VP MacKay Strategic Bond Portfolio
(formerly known as MainStay VP MacKay Unconstrained Bond Portfolio)
Message from the President and Semiannual Report
Unaudited | June 30, 2021
Sign up for e-delivery of your shareholder reports. For full details on e-delivery, including who can participate and what you can receive via e-delivery,
please log in to newyorklifeinvestments.com/accounts.
| Not FDIC/NCUA Insured | Not a Deposit | May Lose Value | No Bank Guarantee | Not Insured by Any Government Agency |
This page intentionally left blank
Message from the President
The COVID-19 pandemic continued to afflict our personal lives and broad segments of the U.S. and global economy throughout the six-month reporting period ended June 30, 2021. However, with the deployment of multiple vaccines around the world, including three highly effective versions approved for emergency use in the United States, investors began to turn their attention toward the gradual reopening of the economy and the shape the “new normal” would take.
The first half of the reporting period saw increasing inflationary concerns as fiscal stimulus business reopenings drove accelerating economic growth, rising commodity prices and increased consumer spending. However, the U.S. Federal Reserve noted that price increases were likely to prove temporary and made clear their intention to remain accommodative for the foreseeable future. Accordingly, after moving higher in the first quarter of 2021, interest rates declined in the second quarter.
In response to the uncertain inflation outlook, equity market leadership shifted from value in the first quarter of the year to growth in the second quarter. Nevertheless, investor sentiment remained buoyant throughout the reporting period, with all eleven sectors in the S&P 500® Index, a widely regarded benchmark of market performance, producing positive returns. Energy led the market’s rise fueled by rapidly increasing oil and gas prices, followed by financials and real estate, which benefited from rising interest rates and the economic reopening, respectively. Communication services produced the slowest growth, followed by the traditionally defensive utilities and consumer staples
sectors. In the fixed income market, lower-credit-quality issues tended to outperform their higher-grade counterparts, with high-yield corporate bonds generating the strongest performance. Among securitized products, commercial mortgage-backed securities generally produced the strongest returns, followed by mortgage-backed securities and asset-backed securities, while Treasury securities lagged.
Despite the tremendous progress we’ve seen so far this year, the United States and the world continue to face significant pandemic-related challenges. Newer, more contagious variants of COVID-19 threaten the return of restrictions and lockdowns that could stall the economic recovery. At the same time, supply chain shortages have led to rising prices on everything from laptops to autos, stoking fears of uncontrolled inflation despite reassurance from the U.S. Federal Reserve. At New York Life Investments, we recognize that the shape that the “new normal” eventually takes may differ from our expectations. You can depend on us to keep a sharp watch for the unexpected, and to continue to help you find your way through this rapidly evolving investment landscape.
Sincerely,
Kirk C. Lehneis
President
The opinions expressed are as of the date of this report and are subject to change. There is no guarantee that any forecast made will come to pass. This material does not constitute investment advice and is not intended as an endorsement of any specific investment. Past performance is no guarantee of future results.
Not part of the Semiannual Report
Investors should refer to the Portfolio’s Summary Prospectus and/or Prospectus and consider the Portfolio’s investment objectives, strategies, risks, charges and expenses carefully before investing. The Summary Prospectus and/or Prospectus contain this and other information about the Portfolio. You may obtain copies of the Portfolio’s Summary Prospectus and/or the Prospectus and the Statement of Additional Information free of charge, upon request, by calling toll-free 800-598-2019, by writing to New York Life Insurance and Annuity Corporation, 51 Madison Avenue, Room 251, New York, New York 10010 or by sending an email to MainStayShareholdersServices@nylim.com. These documents are also available at nylinvestments.com/vpdocuments. Please read the Portfolio's Summary Prospectus and/or Prospectus carefully before investing. MainStay VP Funds Trust portfolios are separate account options which are purchased through a variable insurance or variable annuity contract.
Investment and Performance Comparison (Unaudited)
Performance data quoted represents past performance. Past performance is no guarantee of future results. Because of market volatility and other factors, current performance may be lower or higher than the figures shown. Investment return and principal value will fluctuate, and as a result, when shares are redeemed, they may be worth more or less than their original cost. The performance table and graph do not reflect any deduction of sales charges, mortality and expense charges, contract charges or administrative charges. Please refer to the Performance Summary appropriate for your policy. For performance information current to the most recent month-end, please call 800-598-2019 or visit www.newyorklife.com.
Performance figures may reflect certain fee waivers and/or expense limitations, without which total returns may have been different. For information on current fee waivers and/or expense limitations (if any), please refer to the Notes to Financial Statements.
| Average Annual Total Returns for the Period-Ended June 30, 2021 |
| Class | Inception
Date | Six
Months | One
Year | Five
Years | Ten
Years | Gross
Expense
Ratio1 |
| Initial Class Shares | 4/29/2011 | 1.64% | 8.09% | 4.49% | 4.20% | 0.68% |
| Service Class Shares | 4/29/2011 | 1.52 | 7.82 | 4.23 | 3.94 | 0.93 |
| 1. | The gross expense ratios presented reflect the Portfolio’s “Total Annual Portfolio Operating Expenses” from the most recent Prospectus, as supplemented, and may differ from other expense ratios disclosed in this report. |
| Benchmark Performance | Six
Months | One
Year | Five
Years | Ten
Years |
| Bloomberg Barclays U.S. Aggregate Bond Index1 | -1.60% | -0.33% | 3.03% | 3.39% |
| ICE BofA U.S. Dollar 3-Month Deposit Offered Rate Constant Maturity Index2 | 0.11 | 0.25 | 1.46 | 0.90 |
| Morningstar Nontraditional Bond Category Average3 | 1.81 | 7.94 | 3.53 | 2.43 |
| 1. | The Bloomberg Barclays U.S. Aggregate Bond Index is the Portfolio's primary benchmark. The Bloomberg Barclays U.S. Aggregate Bond Index is a broad-based benchmark that measures performance of the investment-grade, U.S. dollar denominated, fixed-rate taxable bond market, including Treasurys, government-related and corporate securities, mortgage-backed securities (agency fixed-rate and hybrid adjustable-rate mortgage pass-throughs), asset-backed securities and commercial mortgage-backed securities. Results assume reinvestment of all dividends and capital gains. An investment cannot be made directly in an index. |
| 2. | The Portfolio has selected the ICE BofA U.S. Dollar 3-Month Deposit Offered Rate Constant Maturity Index as a secondary benchmark. The ICE BofA U.S. Dollar 3-Month Deposit Offered Rate Constant Maturity Index is unmanaged and tracks the performance of a synthetic asset paying London Interbank Offered Rate to a stated maturity. The index is based on the assumed purchase at par of a synthetic instrument having exactly its stated maturity and with a coupon equal to that day’s fixing rate. That issue is assumed to be sold the following business day (priced at a yield equal to the current day fixing rate) and rolled into a new instrument. Results assume reinvestment of all dividends and capital gains. An investment cannot be made directly in an index. |
| 3. | The Portfolio has selected the Morningstar Nontraditional Bond Category Average as an additional benchmark. The Morningstar Nontraditional Bond Category Average contains funds that pursue strategies divergent in one or more ways from conventional practice in the broader bond-fund universe. Morningstar category averages are equal-weighted returns based on constituents of the category at the end of the period. Results assume reinvestment of all dividends and capital gains. An investment cannot be made directly in an index. |
Cost in Dollars of a $1,000 Investment in MainStay VP MacKay Strategic Bond Portfolio (Unaudited)
The example below is intended to describe the fees and expenses borne by shareholders during the six-month period from January 1, 2021 to June 30, 2021, and the impact of those costs on your investment.
Example
As a shareholder of the Portfolio you incur two types of costs: (1) transaction costs, including exchange fees and sales charges (loads) on purchases (as applicable), and (2) ongoing costs, including management fees, distribution and/or service (12b-1) fees, and other Portfolio expenses (as applicable). This example is intended to help you understand your ongoing costs (in dollars) of investing in the Portfolio and to compare these costs with the ongoing costs of investing in other mutual funds. The example is based on an investment of $1,000 made at the beginning of the six-month period and held for the entire period from January 1, 2021 to June 30, 2021. Shares are only sold in connection with variable life and annuity contracts and the example does not reflect any contract level or transactional fees or expenses. If these costs had been included, your costs would have been higher.
This example illustrates your Portfolio’s ongoing costs in two ways:
Actual Expenses
The second and third data columns in the table below provide information about actual account values and actual expenses. You may use the information in these columns, together with the amount you invested, to estimate the expenses that you paid during the six months ended June
30, 2021. Simply divide your account value by $1,000 (for example, an $8,600 account value divided by $1,000 = 8.6), then multiply the result by the number under the heading entitled “Expenses Paid During Period” to estimate the expenses you paid on your account during this period.
Hypothetical Example for Comparison Purposes
The fourth and fifth data columns in the table below provide information about hypothetical account values and hypothetical expenses based on the Portfolio’s actual expense ratio and an assumed rate of return of 5% per year before expenses, which is not the Portfolio’s actual return. The hypothetical account values and expenses may not be used to estimate the actual ending account balances or expenses you paid for the six-month period shown. You may use this information to compare the ongoing costs of investing in the Portfolio with the ongoing costs of investing in other mutual funds. To do so, compare this 5% hypothetical example with the 5% hypothetical examples that appear in the shareholder reports of the other mutual funds.
Please note that the expenses shown in the table are meant to highlight your ongoing costs only and do not reflect any transactional costs, such as exchange fees or sales charges (loads). Therefore, the fourth and fifth data columns of the table are useful in comparing ongoing costs only and will not help you determine the relative total costs of owning different funds. In addition, if these transactional costs were included, your costs would have been higher.
| Share Class | Beginning
Account
Value
1/1/21 | Ending Account
Value (Based
on Actual
Returns and
Expenses)
6/30/21 | Expenses
Paid
During
Period1 | Ending Account
Value (Based
on Hypothetical
5% Annualized
Return and
Actual Expenses)
6/30/21 | Expenses
Paid
During
Period1 | Net Expense
Ratio
During
Period2, 3 |
| Initial Class Shares | $1,000.00 | $1,016.40 | $3.15 | $1,021.67 | $3.16 | 0.63% |
| Service Class Shares | $1,000.00 | $1,015.20 | $4.40 | $1,020.43 | $4.41 | 0.88% |
| 1. | Expenses are equal to the Portfolio’s annualized expense ratio of each class multiplied by the average account value over the period, divided by 365 and multiplied by 181 (to reflect the six-month period). The table above represents the actual expenses incurred during the six-month period. In addition to the fees and expenses which the Portfolio bears directly, it also indirectly bears a pro rata share of the fees and expenses of the underlying funds in which it invests. Such indirect expenses are not included in the above-reported expense figures. |
| 2. | Expenses are equal to the Portfolio's annualized expense ratio to reflect the six-month period. |
| 3. | Expenses are inclusive of dividends and interest on investments sold short. |
| 6 | MainStay VP MacKay Strategic Bond Portfolio |
Portfolio Composition as of June 30, 2021 (Unaudited)
See Portfolio of Investments beginning on page 10 for specific holdings within these categories. The Portfolio's holdings are subject to change.
Top Ten Issuers Held as of June 30, 2021 (excluding short-term investments) (Unaudited)
| 1. | U.S. Treasury Inflation Linked Notes, 0.125%-0.875%, due 7/15/28–1/15/30 |
| 2. | FNMA, (zero coupon)-4.442%, due 4/25/29–3/25/60 |
| 3. | Bank of America Corp., 2.087%-8.57%, due 12/20/23–6/14/29 |
| 4. | FHLMC Structured Agency Credit Risk Debt Notes, 2.591%-3.992%, due 3/25/29–3/25/30 |
| 5. | GNMA, 1.00%-2.50%, due 7/20/50–6/20/51 |
| 6. | Morgan Stanley, 3.794%-5.00%, due 7/15/21–11/24/25 |
| 7. | JPMorgan Chase & Co., 2.956%-4.60%, due 2/1/25–5/13/31 |
| 8. | Marathon Petroleum Corp., 4.50%-5.125%, due 5/1/23–12/15/26 |
| 9. | CF Hippolyta LLC, 1.69%-1.99%, due 7/15/60–3/15/61 |
| 10. | Federative Republic of Brazil, 4.625%, due 1/13/28 |
Portfolio Management Discussion and Analysis (Unaudited)
Answers to the questions reflect the views of portfolio managers Joseph Cantwell1, Shu-Yang Tan, CFA, Matt Jacob, Stephen R. Cianci, CFA, and Neil Moriarty III, of MacKay Shields LLC, the Portfolio’s Subadvisor.
How did MainStay VP MacKay Strategic Bond Portfolio perform relative to its benchmarks and peers during the six months ended June 30, 2021?
For the six months ended June 30, 2021, MainStay VP MacKay Strategic Bond Portfolio returned 1.64% for Initial Class shares and 1.52% for Service Class shares. Over the same period, both share classes outperformed the −1.60% return of the Bloomberg Barclays U.S. Aggregate Bond Index, which is the Portfolio’s primary benchmark, and the 0.11% return of the ICE BofA U.S. Dollar 3-Month Deposit Offered Rate Constant Maturity Index, which is the Portfolio’s secondary benchmark. For the six months ended June 30, 2021, both share classes underperformed the 1.81% return of the Morningstar Nontraditional Bond Category Average.2
Were there any changes to the Fund during the reporting period?
At a meeting held on December 9-10, 2020, the Board of Trustees of MainStay VP Funds Trust considered and approved, changing the Portfolio's name, among other related proposals. For more information on this change refer to the supplement dated December 11, 2020.
What factors affected the Portfolio’s relative performance during the reporting period?
During the reporting period, the Portfolio outperformed the Bloomberg Barclays U.S. Aggregate Bond Index largely due to its overweight exposure to corporate bonds, both investment grade and high yield. The Portfolio’s overall short duration3 position relative to the benchmark also made a positive contribution to performance. (Contributions take weightings and total returns into account.)
During the reporting period, how was the Portfolio’s performance materially affected by investments in derivatives?
During the reporting period, the Portfolio used Treasury futures to hedge its duration. This position had a positive impact on returns as interest rates rose.
What was the Portfolio’s duration strategy during the reporting period?
Though we extended the Portfolio’s duration during the reporting period, it remained below that of the Bloomberg Barclays U.S. Aggregate Bond Index, contributing to benchmark-relative performance.
During the reporting period, which market segments were the strongest positive contributors to the Portfolio’s absolute performance and which market segments were particularly weak?
The Portfolio’s overweight exposure to corporate bonds, both investment grade and high yield, made a positive contribution to absolute performance during the reporting period, aided by select and timely purchases as a robust corporate new issue calendar during the second quarter provided opportunities to add exposure at healthy concessions across the ratings spectrum.
Did the Portfolio make any significant purchases or sales during the reporting period?
A robust primary calendar for corporate credit offered several opportunities to introduce new names into the Portfolio in the midstream, financials and consumer non-cyclical industries. Meanwhile, we trimmed the Portfolio’s holdings of higher quality credits with limited total return potential as spreads narrowed.
Within emerging markets, we continued to reduce the Portfolio’s exposure to Chinese technology companies, as well as an oil major rumored to be delisted from U.S. stock exchanges. Through the primary market, we added a new issue from a Mexican petrochemical company at favorable terms, as well as a new Brazilian credit in the consumer non-cyclical sector from a company with a strong global presence and solid fundamentals.
Within commercial mortgage-backed securities (CMBS), the Portfolio took advantage of rich valuations by selling AAA-rated4 conduit bonds at levels tighter than pre-pandemic. We also continued to add more opportunistic single-asset deals, such as securitizations5 backed by Las Vegas properties. The Portfolio was active in the CMBS primary market, purchasing issues backed by
| 1. | Effective July 20, 2021, Joseph Cantwell is no longer a portfolio manager. |
| 2. | See page 5 for more information on benchmark and peer group returns. |
| 3. | Duration is a measure of the price sensitivity of a fixed-income investment to changes in interest rates. Duration is expressed as a number of years and is considered a more accurate sensitivity gauge than average maturity. |
| 4. | An obligation rated ‘AAA’ has the highest rating assigned by Standard & Poor’s (“S&P”), and in the opinion of S&P, the obligor’s capacity to meet its financial commitment on the obligation is extremely strong. When applied to Fund holdings, ratings are based solely on the creditworthiness of the bonds in the portfolio and are not meant to represent the security or safety of the Fund. |
| 5. | A securitization is a financial instrument created by an issuer by combining a pool of financial assets (such as mortgages). The financial instrument is then marketed to investors, sometimes in tiers. |
| 8 | MainStay VP MacKay Strategic Bond Portfolio |
multifamily housing, an office building in Seattle and industrial properties spread throughout the country. In the secondary market, the Portfolio purchased seasoned subordinate bonds at attractive yields with sufficient credit enhancement to withstand stresses in the market.
Among non-agency residential mortgage-back securities (RMBS), given strong underlying housing fundamentals, the Portfolio participated in a credit-risk transfer deal brought by the Federal Home Loan Mortgage Corporation (known as Freddie Mac) with underlying collateral characteristics generally considered the strongest ever for the program given the high FICO scores of the borrowers.
How did the Portfolio’s sector weightings change during the reporting period?
During the reporting period, the Portfolio maintained its risk-positive positioning, keeping broader exposures fairly consistent. Changes included modestly increased exposure to CMBS and agency commercial mortgage obligations while trimming a small amount in investment-grade credit and bank loans. The most significant activity during the reporting period involved taking advantage of opportunities within sectors in the new-issue markets and rotating out of rich secondary positions in favor of more attractively valued new issues.
How was the Portfolio positioned at the end of the reporting period?
As of June 30, 2021, the Portfolio held overweight positions relative to the Bloomberg Barclays U.S. Aggregate Bond Index in high-yield and investment-grade corporate bonds, as well as securitized assets. As of the same date, the Portfolio held relatively underweight exposure to Treasury securities and agency mortgages.
The opinions expressed are those of the portfolio managers as of the date of this report and are subject to change. There is no guarantee that any forecasts will come to pass. This material does not constitute investment advice and is not intended as an endorsement of any specific investment.
Not all MainStay VP Portfolios and/or share classes are available under all policies.
Portfolio of Investments June 30, 2021† (Unaudited)
| | Principal
Amount | Value |
| Long-Term Bonds 90.0% |
| Asset-Backed Securities 9.1% |
| Automobile Asset-Backed Securities 2.3% |
| American Credit Acceptance Receivables Trust | |
| Series 2020-2, Class C | | |
| 3.88%, due 4/13/26 (a) | $ 3,615,000 | $ 3,791,011 |
| Avis Budget Rental Car Funding AESOP LLC (a) | |
| Series 2021-1A, Class A | | |
| 1.38%, due 8/20/27 | 2,550,000 | 2,545,975 |
| Series 2020-2A, Class A | | |
| 2.02%, due 2/20/27 | 2,280,000 | 2,347,759 |
| Drive Auto Receivables Trust | |
| Series 2021-1, Class D | | |
| 1.45%, due 1/16/29 | 3,075,000 | 3,093,121 |
| Flagship Credit Auto Trust | |
| Series 2019-2, Class E | | |
| 4.52%, due 12/15/26 (a) | 1,258,000 | 1,327,098 |
| Ford Credit Floorplan Master Owner Trust | |
| Series 2019-4, Class A | | |
| 2.44%, due 9/15/26 | 1,770,000 | 1,862,815 |
| Series 2018-4, Class A | | |
| 4.06%, due 11/15/30 | 2,295,000 | 2,638,458 |
| GLS Auto Receivables Trust | |
| Series 2021-2A, Class D | | |
| 1.42%, due 4/15/27 (a) | 1,350,000 | 1,344,812 |
| Hertz Vehicle Financing III LP (a) | |
| Series 2021-2A, Class B | | |
| 2.12%, due 12/27/27 | 1,570,000 | 1,567,429 |
| Series 2021-2A, Class C | | |
| 2.52%, due 12/27/27 | 1,255,000 | 1,253,207 |
| Hertz Vehicle Financing LLC | |
| Series 2021-1A, Class C | | |
| 2.05%, due 12/26/25 (a) | 1,180,000 | 1,179,215 |
| | | 22,950,900 |
| Home Equity Asset-Backed Securities 0.5% |
| Bayview Financial Acquisition Trust | |
| Series 2006-D, Class 2A4 | | |
| 0.515% (1 Month LIBOR + 0.42%), due 12/28/36 (b) | 167,922 | 167,782 |
| Carrington Mortgage Loan Trust | |
| Series 2007-HE1, Class A3 | | |
| 0.281% (1 Month LIBOR + 0.19%), due 6/25/37 (b) | 3,446,847 | 3,399,600 |
| First NLC Trust | |
| Series 2007-1, Class A1 | | |
| 0.161% (1 Month LIBOR + 0.07%), due 8/25/37 (a)(b) | 62,808 | 40,154 |
| | Principal
Amount | Value |
| |
| Home Equity Asset-Backed Securities (continued) |
| JP Morgan Mortgage Acquisition Trust | |
| Series 2007-HE1, Class AF1 | | |
| 0.191% (1 Month LIBOR + 0.10%), due 3/25/47 (b) | $ 22,006 | $ 14,106 |
| MASTR Asset-Backed Securities Trust | |
| Series 2006-HE4, Class A1 | | |
| 0.191% (1 Month LIBOR + 0.10%), due 11/25/36 (b) | 17,070 | 7,631 |
| Morgan Stanley ABS Capital I, Inc. Trust (b) | |
| Series 2007-HE4, Class A2A | | |
| 0.201% (1 Month LIBOR + 0.11%), due 2/25/37 | 17,868 | 7,732 |
| Series 2007-HE7, Class M1 | | |
| 2.091% (1 Month LIBOR + 2.00%), due 7/25/37 | 930,000 | 961,438 |
| | | 4,598,443 |
| Other Asset-Backed Securities 6.3% |
| American Airlines Pass-Through Trust | |
| Series 2016-2, Class A | | |
| 3.65%, due 6/15/28 | 1,576,361 | 1,524,592 |
| Series 2019-1, Class B | | |
| 3.85%, due 2/15/28 | 1,491,003 | 1,421,526 |
| Series 2015-2, Class A | | |
| 4.00%, due 9/22/27 | 381,586 | 375,001 |
| Series 2013-2, Class A | | |
| 4.95%, due 1/15/23 | 4,123,127 | 4,183,583 |
| CF Hippolyta LLC (a) | |
| Series 2020-1, Class A1 | | |
| 1.69%, due 7/15/60 | 2,285,737 | 2,322,622 |
| Series 2021-1A, Class B1 | | |
| 1.98%, due 3/15/61 | 5,685,000 | 5,733,264 |
| Series 2020-1, Class A2 | | |
| 1.99%, due 7/15/60 | 1,309,697 | 1,329,426 |
| Continental Airlines Pass-Through Trust | |
| Series 2007-1, Class A | | |
| 5.983%, due 4/19/22 | 299,669 | 306,436 |
| Crown Castle Towers LLC (a) | |
| 3.72%, due 7/15/23 | 1,550,000 | 1,600,834 |
| 4.241%, due 7/15/28 | 3,755,000 | 4,238,280 |
| DB Master Finance LLC | |
| Series 2019-1A, Class A23 | | |
| 4.352%, due 5/20/49 (a) | 1,915,875 | 2,116,122 |
| Domino's Pizza Master Issuer LLC | |
| Series 2015-1A, Class A2II | | |
| 4.474%, due 10/25/45 (a) | 3,127,625 | 3,279,503 |
The notes to the financial statements are an integral part of, and should be read in conjunction with, the financial statements.
| 10 | MainStay VP MacKay Strategic Bond Portfolio |
| | Principal
Amount | Value |
| Asset-Backed Securities (continued) |
| Other Asset-Backed Securities (continued) |
| FirstKey Homes 2020-SFR1 Trust (a)(c) | |
| Series 2021-SFR1, Class B | | |
| 1.788%, due 8/17/28 | $ 2,285,000 | $ 2,285,526 |
| Series 2021-SFR1, Class C | | |
| 1.888%, due 8/17/28 | 3,800,000 | 3,800,836 |
| Hilton Grand Vacations Trust (a) | |
| Series 2019-AA, Class A | | |
| 2.34%, due 7/25/33 | 1,526,844 | 1,570,002 |
| Series 2020-AA, Class A | | |
| 2.74%, due 2/25/39 | 1,364,142 | 1,415,306 |
| Series 2020-AA, Class B | | |
| 4.22%, due 2/25/39 | 1,425,169 | 1,514,480 |
| MVW LLC | |
| Series 2019-2A, Class A | | |
| 2.22%, due 10/20/38 (a) | 1,861,632 | 1,894,921 |
| Navient Private Education Refi Loan Trust (a) | |
| Series 2020-GA, Class B | | |
| 2.50%, due 9/16/69 | 1,590,000 | 1,604,266 |
| Series 2020-HA, Class B | | |
| 2.78%, due 1/15/69 | 1,100,000 | 1,133,113 |
| PFS Financing Corp. (a) | |
| Series 2020-B, Class B | | |
| 1.71%, due 6/15/24 | 910,000 | 919,026 |
| Series 2020-A, Class B | | |
| 1.77%, due 6/15/25 | 2,150,000 | 2,182,572 |
| Progress Residential | |
| Series 2021-SFR4, Class B | | |
| 1.808%, due 5/17/38 (a) | 2,085,000 | 2,085,834 |
| Progress Residential Trust | |
| Series 2021-SFR2, Class B | | |
| 1.796%, due 4/19/38 (a) | 3,000,000 | 2,994,598 |
| Sierra Timeshare Receivables Funding LLC (a) | |
| Series 2021-1A, Class C | | |
| 1.79%, due 11/20/37 | 822,043 | 824,854 |
| Series 2020-2A, Class C | | |
| 3.51%, due 7/20/37 | 2,047,707 | 2,114,410 |
| U.S. Airways Pass-Through Trust | |
| Series 2012-1, Class A | | |
| 5.90%, due 10/1/24 | 914,230 | 955,264 |
| Series 2010-1, Class A | | |
| 6.25%, due 4/22/23 | 584,773 | 594,614 |
| United Airlines Pass-Through Trust | |
| Series 2014-2, Class B | | |
| 4.625%, due 9/3/22 | 857,312 | 876,581 |
| Series 2020-1, Class A | | |
| 5.875%, due 10/15/27 | 2,122,180 | 2,354,732 |
| | Principal
Amount | Value |
| |
| Other Asset-Backed Securities (continued) |
| United Airlines Pass-Through Trust (continued) | |
| Series 2007-1 | | |
| 6.636%, due 7/2/22 | $ 1,288,140 | $ 1,333,224 |
| Wendy's Funding LLC | |
| Series 2019-1A, Class A2I | | |
| 3.783%, due 6/15/49 (a) | 1,932,525 | 2,062,024 |
| | | 62,947,372 |
Total Asset-Backed Securities
(Cost $87,758,848) | | 90,496,715 |
| Corporate Bonds 51.1% |
| Advertising 0.1% |
| Clear Channel International BV | | |
| 6.625%, due 8/1/25 (a) | 1,389,000 | 1,459,603 |
| Aerospace & Defense 0.5% |
| BAE Systems plc | | |
| 3.00%, due 9/15/50 (a) | 775,000 | 758,193 |
| L3Harris Technologies, Inc. | | |
| 4.40%, due 6/15/28 | 3,270,000 | 3,795,994 |
| | | 4,554,187 |
| Agriculture 0.2% |
| BAT Capital Corp. | | |
| 3.734%, due 9/25/40 | 1,900,000 | 1,856,513 |
| Airlines 1.0% |
| American Airlines, Inc. (a) | | |
| 5.50%, due 4/20/26 | 1,640,000 | 1,736,350 |
| 5.75%, due 4/20/29 | 1,000,000 | 1,081,250 |
| Delta Air Lines, Inc. (a) | | |
| 4.50%, due 10/20/25 | 1,185,000 | 1,273,425 |
| 4.75%, due 10/20/28 | 955,000 | 1,061,729 |
| 7.00%, due 5/1/25 | 2,555,000 | 2,981,655 |
| Mileage Plus Holdings LLC | | |
| 6.50%, due 6/20/27 (a) | 2,050,000 | 2,257,050 |
| | | 10,391,459 |
| Auto Manufacturers 1.9% |
| Ford Motor Co. | | |
| 8.50%, due 4/21/23 | 2,335,000 | 2,605,743 |
| 9.00%, due 4/22/25 | 2,400,000 | 2,958,888 |
| Ford Motor Credit Co. LLC | | |
| 1.391% (3 Month LIBOR + 1.235%), due 2/15/23 (b) | 1,230,000 | 1,225,387 |
| 4.063%, due 11/1/24 | 2,485,000 | 2,643,170 |
| 4.25%, due 9/20/22 | 900,000 | 929,313 |
The notes to the financial statements are an integral part of, and should be read in conjunction with, the financial statements.
11
Portfolio of Investments June 30, 2021† (Unaudited) (continued)
| | Principal
Amount | Value |
| Corporate Bonds (continued) |
| Auto Manufacturers (continued) |
| General Motors Co. | | |
| 6.125%, due 10/1/25 | $ 745,000 | $ 881,933 |
| General Motors Financial Co., Inc. | | |
| 2.35%, due 1/8/31 | 908,000 | 895,924 |
| 2.70%, due 6/10/31 | 2,255,000 | 2,263,106 |
| 3.45%, due 4/10/22 | 4,000,000 | 4,073,649 |
| | | 18,477,113 |
| Banks 12.5% |
| Bank of America Corp. | | |
| 2.087%, due 6/14/29 (d) | 1,895,000 | 1,910,334 |
| 3.004%, due 12/20/23 (d) | 6,566,000 | 6,804,662 |
| 3.705%, due 4/24/28 (d) | 1,695,000 | 1,874,300 |
| Series MM | | |
| 4.30%, due 1/28/25 (d)(e) | 4,056,000 | 4,193,904 |
| Series DD | | |
| 6.30%, due 3/10/26 (d)(e) | 1,810,000 | 2,088,577 |
| 8.57%, due 11/15/24 | 455,000 | 565,846 |
| Barclays plc | | |
| 2.852%, due 5/7/26 (d) | 3,010,000 | 3,179,983 |
| 5.20%, due 5/12/26 | 1,725,000 | 1,970,192 |
| BNP Paribas SA (a) | | |
| 3.052%, due 1/13/31 (d) | 2,900,000 | 3,057,500 |
| 4.625% (5 Year Treasury Constant Maturity Rate + 3.34%), due 2/25/31 (b)(e) | 1,650,000 | 1,717,683 |
| Citigroup, Inc. | | |
| 5.50%, due 9/13/25 | 2,710,000 | 3,156,581 |
| Series M | | |
| 6.30%, due 5/15/24 (d)(e) | 3,975,000 | 4,275,907 |
| Citizens Financial Group, Inc. | | |
| 2.638%, due 9/30/32 | 2,550,000 | 2,550,050 |
| Series G | | |
| 4.00% (5 Year Treasury Constant Maturity Rate + 3.215%), due 10/6/26 (b)(e) | 1,620,000 | 1,632,150 |
| Credit Suisse Group AG | | |
| 3.091%, due 5/14/32 (a)(d) | 2,195,000 | 2,261,402 |
| Deutsche Bank AG | | |
| 3.035%, due 5/28/32 (d) | 1,125,000 | 1,143,954 |
| Freedom Mortgage Corp. | | |
| 7.625%, due 5/1/26 (a) | 2,920,000 | 3,039,720 |
| Goldman Sachs Group, Inc. (The) | | |
| 1.326% (3 Month LIBOR + 1.17%), due 5/15/26 (b) | 3,075,000 | 3,156,241 |
| 3.21%, due 4/22/42 (d) | 1,990,000 | 2,081,989 |
| 6.75%, due 10/1/37 | 1,828,000 | 2,661,883 |
| | Principal
Amount | Value |
| |
| Banks (continued) |
| Huntington National Bank (The) | | |
| 3.55%, due 10/6/23 | $ 1,445,000 | $ 1,540,927 |
| Intesa Sanpaolo SpA | | |
| 4.198%, due 6/1/32 (a) | 3,460,000 | 3,545,670 |
| JPMorgan Chase & Co. (d) | | |
| 2.956%, due 5/13/31 | 1,245,000 | 1,307,881 |
| 3.54%, due 5/1/28 | 4,175,000 | 4,590,265 |
| Series HH | | |
| 4.60%, due 2/1/25 (e) | 5,182,000 | 5,370,107 |
| Lloyds Banking Group plc | | |
| 2.907%, due 11/7/23 (d) | 1,160,000 | 1,196,089 |
| 4.582%, due 12/10/25 | 2,500,000 | 2,809,090 |
| Morgan Stanley | | |
| Series H | | |
| 3.794% (3 Month LIBOR + 3.61%), due 7/15/21 (b)(e) | 2,125,000 | 2,132,969 |
| Series F | | |
| 3.875%, due 4/29/24 | 6,015,000 | 6,542,055 |
| 5.00%, due 11/24/25 | 3,840,000 | 4,427,044 |
| Natwest Group plc (b) | | |
| 3.073% (1 Year Treasury Constant Maturity Rate + 2.55%), due 5/22/28 | 2,685,000 | 2,833,379 |
| 4.60% (5 Year Treasury Constant Maturity Rate + 3.10%), due 6/28/31 (e) | 2,740,000 | 2,752,878 |
| Popular, Inc. | | |
| 6.125%, due 9/14/23 | 1,953,000 | 2,107,287 |
| Santander Holdings USA, Inc. | | |
| 3.40%, due 1/18/23 | 5,055,000 | 5,262,919 |
| Societe Generale SA (a)(b)(e) | | |
| 4.75% (5 Year Treasury Constant Maturity Rate + 3.931%), due 5/26/26 | 1,070,000 | 1,108,788 |
| 5.375% (5 Year Treasury Constant Maturity Rate + 4.514%), due 11/18/30 | 3,850,000 | 4,076,187 |
| Standard Chartered plc (a)(b) | | |
| 2.678% (1 Year Treasury Constant Maturity Rate + 1.20%), due 6/29/32 | 2,435,000 | 2,443,062 |
| 4.75% (5 Year Treasury Constant Maturity Rate + 3.805%), due 1/14/31 (e) | 1,390,000 | 1,430,268 |
The notes to the financial statements are an integral part of, and should be read in conjunction with, the financial statements.
| 12 | MainStay VP MacKay Strategic Bond Portfolio |
| | Principal
Amount | Value |
| Corporate Bonds (continued) |
| Banks (continued) |
| SVB Financial Group | | |
| Series C | | |
| 4.00% (5 Year Treasury Constant Maturity Rate + 3.202%), due 5/15/26 (b)(e) | $ 2,070,000 | $ 2,106,846 |
| Texas Capital Bancshares, Inc. | | |
| 4.00% (5 Year Treasury Constant Maturity Rate + 3.15%), due 5/6/31 (b) | 1,615,000 | 1,677,904 |
| Truist Bank | | |
| 2.636% (5 Year Treasury Constant Maturity Rate + 1.15%), due 9/17/29 (b) | 2,700,000 | 2,827,143 |
| UBS Group AG | | |
| 4.375% (5 Year Treasury Constant Maturity Rate + 3.313%), due 2/10/31 (a)(b)(e) | 2,715,000 | 2,773,916 |
| Wells Fargo & Co. | | |
| 3.00%, due 10/23/26 | 1,640,000 | 1,768,585 |
| Series U | | |
| 5.875%, due 6/15/25 (d)(e) | 595,000 | 666,346 |
| Series S | | |
| 5.90%, due 6/15/24 (d)(e) | 3,270,000 | 3,523,425 |
| | | 124,143,888 |
| Beverages 0.5% |
| Anheuser-Busch InBev Worldwide, Inc. | | |
| 4.75%, due 1/23/29 | 1,833,000 | 2,183,588 |
| Constellation Brands, Inc. | | |
| 4.25%, due 5/1/23 | 2,985,000 | 3,184,045 |
| | | 5,367,633 |
| Biotechnology 0.5% |
| Biogen, Inc. | | |
| 3.15%, due 5/1/50 | 1,125,000 | 1,104,854 |
| 3.625%, due 9/15/22 | 3,560,000 | 3,698,612 |
| | | 4,803,466 |
| Building Materials 0.3% |
| Builders FirstSource, Inc. (a) | | |
| 5.00%, due 3/1/30 | 2,200,000 | 2,313,190 |
| 6.75%, due 6/1/27 | 755,000 | 808,794 |
| | | 3,121,984 |
| Chemicals 0.7% |
| Alpek SAB de CV | | |
| 3.25%, due 2/25/31 (a) | 1,250,000 | 1,265,013 |
| | Principal
Amount | Value |
| |
| Chemicals (continued) |
| Braskem Netherlands Finance BV | | |
| 4.50%, due 1/10/28 (a) | $ 1,015,000 | $ 1,069,506 |
| International Flavors & Fragrances, Inc. | | |
| 2.30%, due 11/1/30 (a) | 2,035,000 | 2,023,514 |
| Orbia Advance Corp. SAB de CV | | |
| 4.00%, due 10/4/27 (a) | 2,200,000 | 2,411,750 |
| | | 6,769,783 |
| Commercial Services 1.7% |
| Allied Universal Holdco LLC | | |
| 6.625%, due 7/15/26 (a) | 1,320,000 | 1,399,504 |
| Ashtead Capital, Inc. | | |
| 4.25%, due 11/1/29 (a) | 2,250,000 | 2,430,000 |
| California Institute of Technology | | |
| 3.65%, due 9/1/19 | 1,614,000 | 1,798,798 |
| IHS Markit Ltd. | | |
| 4.125%, due 8/1/23 | 2,175,000 | 2,321,595 |
| 4.75%, due 2/15/25 (a) | 3,105,000 | 3,476,047 |
| Sodexo, Inc. | | |
| 2.718%, due 4/16/31 (a) | 2,705,000 | 2,759,878 |
| Trustees of the University of Pennsylvania (The) | | |
| 3.61%, due 2/15/19 | 2,515,000 | 2,843,442 |
| | | 17,029,264 |
| Computers 1.2% |
| Dell International LLC | | |
| 4.90%, due 10/1/26 | 3,695,000 | 4,264,340 |
| 6.02%, due 6/15/26 | 625,000 | 750,329 |
| 8.10%, due 7/15/36 | 1,240,000 | 1,889,916 |
| NCR Corp. (a) | | |
| 5.00%, due 10/1/28 | 2,230,000 | 2,305,976 |
| 6.125%, due 9/1/29 | 893,000 | 973,370 |
| 8.125%, due 4/15/25 | 1,484,000 | 1,622,754 |
| | | 11,806,685 |
| Distribution & Wholesale 0.3% |
| Performance Food Group, Inc. | | |
| 5.50%, due 10/15/27 (a) | 2,955,000 | 3,105,557 |
| Diversified Financial Services 3.7% |
| AerCap Ireland Capital DAC | | |
| 3.30%, due 1/23/23 | 1,400,000 | 1,452,015 |
| 4.45%, due 12/16/21 | 2,200,000 | 2,233,405 |
| Air Lease Corp. | | |
| 2.30%, due 2/1/25 | 3,640,000 | 3,762,966 |
| 2.625%, due 7/1/22 | 2,155,000 | 2,195,812 |
| 2.75%, due 1/15/23 | 1,040,000 | 1,072,992 |
The notes to the financial statements are an integral part of, and should be read in conjunction with, the financial statements.
13
Portfolio of Investments June 30, 2021† (Unaudited) (continued)
| | Principal
Amount | Value |
| Corporate Bonds (continued) |
| Diversified Financial Services (continued) |
| Aircastle Ltd. | | |
| 5.25% (5 Year Treasury Constant Maturity Rate + 4.41%), due 6/15/26 (a)(b)(e) | $ 1,305,000 | $ 1,318,050 |
| Ally Financial, Inc. | | |
| 5.75%, due 11/20/25 | 3,570,000 | 4,098,923 |
| 8.00%, due 11/1/31 | 3,450,000 | 4,957,817 |
| Avolon Holdings Funding Ltd. | | |
| 3.25%, due 2/15/27 (a) | 2,340,000 | 2,412,569 |
| Banco BTG Pactual SA | | |
| 2.75%, due 1/11/26 (a) | 3,885,000 | 3,785,932 |
| Capital One Financial Corp. | | |
| Series E | | |
| 3.935% (3 Month LIBOR + 3.80%), due 9/1/21 (b)(e) | 2,365,000 | 2,373,467 |
| Discover Financial Services | | |
| 3.85%, due 11/21/22 | 300,000 | 314,356 |
| Home Point Capital, Inc. | | |
| 5.00%, due 2/1/26 (a) | 1,034,000 | 964,205 |
| Intercontinental Exchange, Inc. | | |
| 3.00%, due 9/15/60 | 2,130,000 | 2,053,582 |
| OneMain Finance Corp. | | |
| 3.50%, due 1/15/27 | 2,715,000 | 2,735,363 |
| 6.125%, due 3/15/24 | 880,000 | 947,100 |
| | | 36,678,554 |
| Electric 1.4% |
| AEP Transmission Co. LLC | | |
| 3.10%, due 12/1/26 | 3,360,000 | 3,647,871 |
| Appalachian Power Co. | | |
| Series X | | |
| 3.30%, due 6/1/27 | 1,400,000 | 1,516,338 |
| Duke Energy Corp. | | |
| 4.875% (5 Year Treasury Constant Maturity Rate + 3.388%), due 9/16/24 (b)(e) | 2,625,000 | 2,789,062 |
| FirstEnergy Transmission LLC | | |
| 4.35%, due 1/15/25 (a) | 1,675,000 | 1,837,677 |
| Pacific Gas and Electric Co. | | |
| 3.50%, due 8/1/50 | 1,605,000 | 1,430,474 |
| Puget Energy, Inc. | | |
| 5.625%, due 7/15/22 | 585,000 | 608,437 |
| WEC Energy Group, Inc. | | |
| 2.268% (3 Month LIBOR + 2.112%), due 5/15/67 (b) | 1,860,340 | 1,708,182 |
| | | 13,538,041 |
| | Principal
Amount | Value |
| |
| Electronics 0.1% |
| FLIR Systems, Inc. | | |
| 2.50%, due 8/1/30 | $ 1,335,000 | $ 1,345,099 |
| Environmental Control 0.3% |
| Republic Services, Inc. | | |
| 4.75%, due 5/15/23 | 1,999,000 | 2,138,597 |
| Stericycle, Inc. | | |
| 3.875%, due 1/15/29 (a) | 310,000 | 309,389 |
| Waste Management, Inc. | | |
| 2.40%, due 5/15/23 | 505,000 | 522,285 |
| | | 2,970,271 |
| Food 1.1% |
| JBS USA Food Co. | | |
| 7.00%, due 1/15/26 (a) | 885,000 | 938,100 |
| Kraft Heinz Foods Co. | | |
| 4.25%, due 3/1/31 | 2,364,000 | 2,685,477 |
| 5.00%, due 7/15/35 | 997,000 | 1,222,940 |
| Smithfield Foods, Inc. (a) | | |
| 3.00%, due 10/15/30 | 2,005,000 | 2,021,494 |
| 3.35%, due 2/1/22 | 1,805,000 | 1,830,372 |
| Sysco Corp. | | |
| 3.30%, due 7/15/26 | 1,735,000 | 1,885,707 |
| | | 10,584,090 |
| Gas 0.1% |
| National Fuel Gas Co. | | |
| 2.95%, due 3/1/31 | 960,000 | 965,569 |
| Healthcare-Products 0.7% |
| Baxter International, Inc. | | |
| 2.60%, due 8/15/26 | 6,085,000 | 6,476,724 |
| Healthcare-Services 0.4% |
| Health Care Service Corp. A Mutual Legal Reserve Co. | | |
| 3.20%, due 6/1/50 (a) | 1,845,000 | 1,900,124 |
| NYU Langone Hospitals | | |
| Series 2020 | | |
| 3.38%, due 7/1/55 | 1,805,000 | 1,911,916 |
| | | 3,812,040 |
| Home Builders 0.7% |
| DR Horton, Inc. | | |
| 4.375%, due 9/15/22 | 3,350,000 | 3,472,188 |
| Lennar Corp. | | |
| 4.75%, due 11/29/27 | 868,000 | 1,003,293 |
The notes to the financial statements are an integral part of, and should be read in conjunction with, the financial statements.
| 14 | MainStay VP MacKay Strategic Bond Portfolio |
| | Principal
Amount | Value |
| Corporate Bonds (continued) |
| Home Builders (continued) |
| Toll Brothers Finance Corp. | | |
| 3.80%, due 11/1/29 (f) | $ 1,251,000 | $ 1,341,698 |
| 4.35%, due 2/15/28 | 764,000 | 838,490 |
| | | 6,655,669 |
| Home Furnishings 0.4% |
| Panasonic Corp. | | |
| 2.536%, due 7/19/22 (a) | 3,500,000 | 3,569,203 |
| Household Products & Wares 0.2% |
| Kronos Acquisition Holdings, Inc. | | |
| 5.00%, due 12/31/26 (a) | 2,465,000 | 2,501,975 |
| Housewares 0.2% |
| Scotts Miracle-Gro Co. (The) | | |
| 5.25%, due 12/15/26 | 1,960,000 | 2,038,400 |
| Insurance 2.2% |
| Athene Global Funding | | |
| 2.50%, due 3/24/28 (a) | 2,985,000 | 3,059,514 |
| Empower Finance 2020 LP | | |
| 3.075%, due 9/17/51 (a) | 2,270,000 | 2,297,115 |
| Lincoln National Corp. | | |
| 2.513% (3 Month LIBOR + 2.357%), due 5/17/66 (b) | 6,418,000 | 5,663,885 |
| MassMutual Global Funding II | | |
| 2.95%, due 1/11/25 (a) | 2,995,000 | 3,206,328 |
| NMI Holdings, Inc. | | |
| 7.375%, due 6/1/25 (a) | 870,000 | 996,985 |
| Protective Life Corp. | | |
| 8.45%, due 10/15/39 | 1,564,000 | 2,511,293 |
| Reliance Standard Life Global Funding II | | |
| 2.50%, due 10/30/24 (a) | 3,100,000 | 3,232,812 |
| Willis North America, Inc. | | |
| 3.875%, due 9/15/49 | 840,000 | 943,613 |
| | | 21,911,545 |
| Internet 1.1% |
| Cablevision Lightpath LLC | | |
| 3.875%, due 9/15/27 (a) | 2,140,000 | 2,115,047 |
| Expedia Group, Inc. | | |
| 3.25%, due 2/15/30 | 2,315,000 | 2,418,126 |
| 3.60%, due 12/15/23 | 1,215,000 | 1,291,258 |
| 3.80%, due 2/15/28 | 2,245,000 | 2,441,642 |
| 5.00%, due 2/15/26 | 315,000 | 359,344 |
| | Principal
Amount | Value |
| |
| Internet (continued) |
| Expedia Group, Inc. (continued) | | |
| 6.25%, due 5/1/25 (a) | $ 231,000 | $ 268,712 |
| Match Group Holdings II LLC (a) | | |
| 4.125%, due 8/1/30 | 148,000 | 150,590 |
| 5.00%, due 12/15/27 | 1,775,000 | 1,865,969 |
| | | 10,910,688 |
| Iron & Steel 0.3% |
| Vale Overseas Ltd. | | |
| 6.25%, due 8/10/26 | 2,780,000 | 3,344,340 |
| Lodging 0.8% |
| Hilton Domestic Operating Co., Inc. | | |
| 4.875%, due 1/15/30 | 2,120,000 | 2,263,100 |
| 5.375%, due 5/1/25 (a) | 1,135,000 | 1,194,588 |
| Marriott International, Inc. | | |
| 3.75%, due 10/1/25 | 1,860,000 | 2,003,833 |
| MGM Resorts International | | |
| 6.00%, due 3/15/23 | 2,300,000 | 2,460,310 |
| | | 7,921,831 |
| Machinery-Diversified 0.2% |
| Clark Equipment Co. | | |
| 5.875%, due 6/1/25 (a) | 1,535,000 | 1,623,263 |
| Media 1.0% |
| Charter Communications Operating LLC | | |
| 4.464%, due 7/23/22 | 2,770,000 | 2,867,750 |
| Grupo Televisa SAB | | |
| 5.25%, due 5/24/49 | 1,735,000 | 2,193,955 |
| Sirius XM Radio, Inc. | | |
| 5.375%, due 7/15/26 (a) | 3,000,000 | 3,097,500 |
| Sky Ltd. | | |
| 3.75%, due 9/16/24 (a) | 1,105,000 | 1,207,727 |
| Time Warner Entertainment Co. LP | | |
| 8.375%, due 3/15/23 | 740,000 | 836,195 |
| | | 10,203,127 |
| Mining 0.6% |
| Glencore Funding LLC | | |
| 1.625%, due 9/1/25 (a) | 3,165,000 | 3,200,984 |
| Industrias Penoles SAB de CV | | |
| 4.75%, due 8/6/50 (a) | 2,672,000 | 2,875,740 |
| | | 6,076,724 |
The notes to the financial statements are an integral part of, and should be read in conjunction with, the financial statements.
15
Portfolio of Investments June 30, 2021† (Unaudited) (continued)
| | Principal
Amount | Value |
| Corporate Bonds (continued) |
| Miscellaneous—Manufacturing 0.3% |
| Textron Financial Corp. | | |
| 1.891% (3 Month LIBOR + 1.735%), due 2/15/42 (a)(b) | $ 3,720,000 | $ 3,162,000 |
| Oil & Gas 2.0% |
| BP Capital Markets plc | | |
| 4.875% (5 Year Treasury Constant Maturity Rate + 4.398%), due 3/22/30 (b)(e) | 525,000 | 576,450 |
| Gazprom PJSC Via Gaz Capital SA | | |
| 7.288%, due 8/16/37 (a) | 2,500,000 | 3,481,025 |
| Marathon Petroleum Corp. | | |
| 4.50%, due 5/1/23 | 1,615,000 | 1,722,324 |
| 4.70%, due 5/1/25 | 1,755,000 | 1,979,254 |
| 5.125%, due 12/15/26 | 5,755,000 | 6,766,895 |
| Petrobras Global Finance BV | | |
| 5.50%, due 6/10/51 | 1,215,000 | 1,215,425 |
| 5.60%, due 1/3/31 | 1,370,000 | 1,534,400 |
| Valero Energy Corp. | | |
| 4.00%, due 4/1/29 | 2,250,000 | 2,512,583 |
| | | 19,788,356 |
| Packaging & Containers 1.3% |
| Ball Corp. | | |
| 5.00%, due 3/15/22 | 4,240,000 | 4,346,000 |
| Berry Global, Inc. | | |
| 4.875%, due 7/15/26 (a) | 166,000 | 175,655 |
| Graham Packaging Co., Inc. | | |
| 7.125%, due 8/15/28 (a) | 1,000,000 | 1,077,500 |
| Owens-Brockway Glass Container, Inc. | | |
| 6.625%, due 5/13/27 (a) | 2,950,000 | 3,208,125 |
| Sealed Air Corp. | | |
| 4.875%, due 12/1/22 (a) | 1,875,000 | 1,950,000 |
| WestRock RKT LLC | | |
| 4.00%, due 3/1/23 | 2,230,000 | 2,338,058 |
| | | 13,095,338 |
| Pharmaceuticals 1.3% |
| AbbVie, Inc. | | |
| 3.45%, due 3/15/22 | 4,165,000 | 4,235,233 |
| 4.25%, due 11/21/49 | 3,065,000 | 3,673,446 |
| Becton Dickinson and Co. | | |
| 3.363%, due 6/6/24 | 2,245,000 | 2,405,270 |
| Teva Pharmaceutical Finance Netherlands III BV | | |
| 3.15%, due 10/1/26 | 2,575,000 | 2,449,469 |
| | | 12,763,418 |
| | Principal
Amount | Value |
| |
| Pipelines 1.8% |
| Enterprise Products Operating LLC | | |
| 3.95%, due 1/31/60 | $ 1,760,000 | $ 1,961,845 |
| 4.20%, due 1/31/50 | 545,000 | 628,604 |
| Flex Intermediate Holdco LLC | | |
| 3.363%, due 6/30/31 (a) | 2,310,000 | 2,338,354 |
| Hess Midstream Operations LP | | |
| 5.625%, due 2/15/26 (a) | 389,000 | 405,727 |
| MPLX LP | | |
| 4.00%, due 3/15/28 | 2,500,000 | 2,792,892 |
| 4.125%, due 3/1/27 | 1,780,000 | 1,988,966 |
| Plains All American Pipeline LP | | |
| 3.80%, due 9/15/30 | 1,330,000 | 1,423,177 |
| Sabine Pass Liquefaction LLC | | |
| 5.75%, due 5/15/24 | 2,710,000 | 3,041,122 |
| Spectra Energy Partners LP | | |
| 4.75%, due 3/15/24 | 818,000 | 897,774 |
| Western Midstream Operating LP | | |
| 6.50%, due 2/1/50 (g) | 1,975,000 | 2,286,724 |
| | | 17,765,185 |
| Real Estate Investment Trusts 1.3% |
| Boston Properties LP | | |
| 3.20%, due 1/15/25 | 4,800,000 | 5,142,292 |
| CyrusOne LP | | |
| 3.45%, due 11/15/29 | 2,030,000 | 2,156,093 |
| Host Hotels & Resorts LP | | |
| Series D | | |
| 3.75%, due 10/15/23 | 329,000 | 346,857 |
| Iron Mountain, Inc. | | |
| 4.875%, due 9/15/29 (a) | 2,599,000 | 2,682,688 |
| Office Properties Income Trust | | |
| 2.65%, due 6/15/26 | 2,310,000 | 2,343,762 |
| | | 12,671,692 |
| Retail 2.7% |
| 7-Eleven, Inc. (a) | | |
| 2.50%, due 2/10/41 | 395,000 | 367,759 |
| 2.80%, due 2/10/51 | 1,240,000 | 1,156,770 |
| AutoNation, Inc. | | |
| 4.75%, due 6/1/30 | 2,880,000 | 3,406,186 |
| Darden Restaurants, Inc. | | |
| 3.85%, due 5/1/27 | 2,025,000 | 2,249,749 |
| Dollar General Corp. | | |
| 3.25%, due 4/15/23 | 2,794,000 | 2,915,605 |
| Macy's Retail Holdings LLC | | |
| 5.875%, due 4/1/29 (a)(f) | 1,750,000 | 1,882,003 |
| Macy's, Inc. | | |
| 8.375%, due 6/15/25 (a) | 2,605,000 | 2,868,626 |
The notes to the financial statements are an integral part of, and should be read in conjunction with, the financial statements.
| 16 | MainStay VP MacKay Strategic Bond Portfolio |
| | Principal
Amount | Value |
| Corporate Bonds (continued) |
| Retail (continued) |
| Nordstrom, Inc. | | |
| 4.00%, due 3/15/27 | $ 840,000 | $ 871,618 |
| 4.25%, due 8/1/31 (a) | 3,200,000 | 3,332,796 |
| QVC, Inc. | | |
| 4.375%, due 9/1/28 | 2,430,000 | 2,478,600 |
| Starbucks Corp. | | |
| 4.45%, due 8/15/49 | 2,065,000 | 2,561,352 |
| Victoria's Secret & Co. | | |
| 4.625%, due 7/15/29 (a) | 2,445,000 | 2,445,000 |
| | | 26,536,064 |
| Semiconductors 0.6% |
| Broadcom, Inc. (a) | | |
| 3.469%, due 4/15/34 | 2,470,000 | 2,612,654 |
| 3.75%, due 2/15/51 | 910,000 | 949,957 |
| NXP BV (a) | | |
| 3.40%, due 5/1/30 | 1,380,000 | 1,506,833 |
| 4.625%, due 6/1/23 | 1,065,000 | 1,144,601 |
| | | 6,214,045 |
| Software 0.1% |
| Oracle Corp. | | |
| 3.65%, due 3/25/41 | 685,000 | 726,344 |
| Telecommunications 2.8% |
| Altice France SA | | |
| 5.125%, due 7/15/29 (a) | 2,410,000 | 2,421,809 |
| AT&T, Inc. | | |
| 3.65%, due 6/1/51 | 1,860,000 | 1,930,962 |
| CommScope Technologies LLC | | |
| 5.00%, due 3/15/27 (a) | 3,909,000 | 4,001,839 |
| CommScope, Inc. | | |
| 7.125%, due 7/1/28 (a) | 930,000 | 1,007,888 |
| Sprint Spectrum Co. LLC | | |
| 4.738%, due 3/20/25 (a) | 4,453,125 | 4,777,580 |
| Telefonica Emisiones SA | | |
| 4.57%, due 4/27/23 | 1,781,000 | 1,907,685 |
| T-Mobile US, Inc. | | |
| 2.625%, due 2/15/29 | 2,355,000 | 2,325,562 |
| 4.50%, due 2/1/26 | 2,245,000 | 2,287,924 |
| Verizon Communications, Inc. | | |
| 1.256% (3 Month LIBOR + 1.10%), due 5/15/25 (b) | 2,455,000 | 2,531,915 |
| 3.40%, due 3/22/41 | 900,000 | 952,058 |
| 3.55%, due 3/22/51 | 1,000,000 | 1,068,367 |
| | Principal
Amount | Value |
| |
| Telecommunications (continued) |
| Vodafone Group plc | | |
| 4.25%, due 9/17/50 | $ 2,020,000 | $ 2,359,371 |
| | | 27,572,960 |
Total Corporate Bonds
(Cost $476,158,093) | | 506,309,690 |
| Foreign Government Bonds 3.0% |
| Brazil 1.1% |
| Brazil Government Bond | | |
| 3.75%, due 9/12/31 | 2,565,000 | 2,530,373 |
| Federative Republic of Brazil | | |
| 4.625%, due 1/13/28 | 7,789,000 | 8,413,911 |
| | | 10,944,284 |
| Chile 0.4% |
| Corp. Nacional del Cobre de Chile (a) | | |
| 3.00%, due 9/30/29 | 2,055,000 | 2,134,426 |
| 3.75%, due 1/15/31 | 1,635,000 | 1,780,204 |
| | | 3,914,630 |
| Colombia 0.2% |
| Colombia Government International Bond | | |
| 3.25%, due 4/22/32 | 2,065,000 | 2,022,585 |
| Mexico 1.3% |
| Comision Federal de Electricidad | | |
| 4.677%, due 2/9/51 (a) | 2,765,000 | 2,668,252 |
| Mexico Government Bond | | |
| 2.659%, due 5/24/31 | 3,402,000 | 3,323,380 |
| 3.75%, due 4/19/71 | 2,230,000 | 2,039,112 |
| Petroleos Mexicanos | | |
| 6.75%, due 9/21/47 | 4,990,000 | 4,416,150 |
| | | 12,446,894 |
Total Foreign Government Bonds
(Cost $29,957,676) | | 29,328,393 |
| Loan Assignments 3.7% |
| Containers, Packaging & Glass 0.5% |
| Mauser Packaging Solutions Holding Co. | |
| Initial Term Loan | |
| 3.354% (1 Month LIBOR + 3.25%), due 4/3/24 (b) | 5,018,517 | 4,894,845 |
The notes to the financial statements are an integral part of, and should be read in conjunction with, the financial statements.
17
Portfolio of Investments June 30, 2021† (Unaudited) (continued)
| | Principal
Amount | Value |
| Loan Assignments (continued) |
| Diversified/Conglomerate Service 0.6% |
| Change Healthcare Holdings, Inc. | |
| Closing Date Term Loan | |
| 3.50% (1 Month LIBOR + 2.50%), due 3/1/24 (b) | $ 4,192,236 | $ 4,186,996 |
| TruGreen LP (b) | |
| First Lien Second Refinancing Term Loan | |
| 4.75% (1 Month LIBOR + 4.00%), due 11/2/27 | 1,487,525 | 1,494,963 |
| Second Lien Initial Term Loan | |
| 9.25% (3 Month LIBOR + 8.50%), due 11/2/28 | 645,000 | 657,900 |
| | | 6,339,859 |
| Ecological 0.2% |
| GFL Environmental, Inc. | |
| 2020 Refinancing Term Loan | |
| 3.50% (1 Month LIBOR + 3.00%), due 5/30/25 (b) | 1,970,434 | 1,971,173 |
| Finance 1.2% |
| Alliant Holdings Intermediate LLC | |
| 2018 Initial Term Loan | |
| 3.354% (1 Month LIBOR + 3.25%), due 5/9/25 (b) | 3,968,405 | 3,925,114 |
| Iqvia, Inc. | |
| Dollar Term Loan B3 | |
| 1.897% (3 Month LIBOR + 1.75%), due 6/11/25 (b) | 3,734,500 | 3,709,994 |
| Match Group, Inc. | |
| 2020 Refinancing Term Loan | |
| 1.906% (3 Month LIBOR + 1.75%), due 2/13/27 (b) | 1,859,000 | 1,832,663 |
| ON Semiconductor Corp. | |
| 2019 New Replacement Term Loan B4 | |
| 2.104% (1 Month LIBOR + 2.00%), due 9/19/26 (b) | 1,853,140 | 1,846,191 |
| | | 11,313,962 |
| Personal & Nondurable Consumer Products 0.2% |
| Prestige Brands, Inc. | |
| Term Loan B4 | |
| 4.25% (3 Month LIBOR + 1.00%), due 1/26/24 (b) | 1,535,575 | 1,535,300 |
| | Principal
Amount | Value |
| |
| Radio and TV Broadcasting 0.2% |
| Nielsen Finance LLC | |
| Term Loan B4 | |
| 2.081% (1 Month LIBOR + 2.00%), due 10/4/23 (b) | $ 2,067,297 | $ 2,064,713 |
| Telecommunications 0.8% |
| Level 3 Financing, Inc. | |
| Tranche 2027 Term Loan B | |
| 1.854% (1 Month LIBOR + 1.75%), due 3/1/27 (b) | 3,963,602 | 3,904,148 |
| SBA Senior Finance II LLC | |
| Initial Term Loan | |
| 1.86% (1 Month LIBOR + 1.75%), due 4/11/25 (b) | 4,148,728 | 4,112,427 |
| | | 8,016,575 |
Total Loan Assignments
(Cost $36,326,411) | | 36,136,427 |
| Mortgage-Backed Securities 18.9% |
| Agency (Collateralized Mortgage Obligations) 3.1% |
| FHLMC | |
| REMIC, Series 5070, Class IG | | |
| 1.50%, due 1/25/44 | 9,997,555 | 607,178 |
| REMIC, Series 5048, Class IC | | |
| 2.00%, due 12/25/50 | 10,460,641 | 1,000,896 |
| REMIC, Series 5051, Class KI | | |
| 2.50%, due 12/25/50 | 6,707,476 | 1,036,708 |
| REMIC, Series 5036, Class IO | | |
| 3.50%, due 11/25/50 | 5,880,932 | 922,260 |
| REMIC, Series 4924, Class NS | | |
| 5.959% (1 Month LIBOR + 6.05%), due 10/25/49 (b) | 4,269,854 | 626,557 |
| REMIC, Series 4957, Class SB | | |
| 5.959% (1 Month LIBOR + 6.05%), due 11/25/49 (b) | 3,045,715 | 530,378 |
| FNMA | |
| REMIC, Series 2013-110, Class CO | | |
| (zero coupon), due 12/25/39 | 2,587,675 | 2,452,000 |
| REMIC, Series 2013-105, Class QO | | |
| (zero coupon), due 5/25/40 | 973,202 | 913,984 |
| REMIC, Series 2013-105, Class KO | | |
| (zero coupon), due 10/25/43 | 685,279 | 653,747 |
| REMIC, Series 2013-110, Class DO | | |
| (zero coupon), due 11/25/43 | 1,004,617 | 939,933 |
| REMIC, Series 2020-78, Class TI | | |
| 2.00%, due 11/25/50 | 6,256,813 | 713,263 |
The notes to the financial statements are an integral part of, and should be read in conjunction with, the financial statements.
| 18 | MainStay VP MacKay Strategic Bond Portfolio |
| | Principal
Amount | Value |
| Mortgage-Backed Securities (continued) |
| Agency (Collateralized Mortgage Obligations) (continued) |
| FNMA (continued) | |
| REMIC, Series 2020-91, Class MI | | |
| 2.00%, due 12/25/50 | $ 7,716,995 | $ 828,203 |
| REMIC, Series 2021-2, Class AI | | |
| 2.00%, due 2/25/51 | 15,466,027 | 1,708,632 |
| REMIC, Series 2020-91, Class AI | | |
| 2.50%, due 12/25/50 | 6,333,423 | 986,239 |
| REMIC, Series 2021-7, Class EI | | |
| 2.50%, due 2/25/51 | 4,747,997 | 566,376 |
| REMIC, Series 2021-13, Class BI | | |
| 3.00%, due 2/25/50 | 4,050,000 | 500,930 |
| REMIC, Series 2020-10, Class DA | | |
| 3.50%, due 3/25/60 | 2,235,217 | 2,416,998 |
| GNMA | |
| REMIC, Series 2021-77, Class BA | | |
| 1.00%, due 7/20/50 | 2,320,424 | 2,263,969 |
| REMIC, Series 2021-78, Class LA | | |
| 1.00%, due 5/20/51 | 1,304,369 | 1,277,041 |
| REMIC, Series 2021-87, Class EG | | |
| 1.00%, due 5/20/51 | 1,038,621 | 1,029,570 |
| REMIC, Series 2021-87, Class EK | | |
| 1.00%, due 5/20/51 | 994,109 | 985,445 |
| REMIC, Series 2021-91, Class MF | | |
| 1.00%, due 5/20/51 | 1,136,192 | 1,125,464 |
| REMIC, Series 2021-105, Class DA | | |
| 1.00%, due 6/20/51 | 3,350,000 | 3,263,992 |
| REMIC, Series 2021-15, Class AI | | |
| 2.00%, due 1/20/51 | 12,015,900 | 1,318,693 |
| REMIC, Series 2021-57, Class AI | | |
| 2.00%, due 2/20/51 | 7,803,034 | 926,955 |
| REMIC, Series 2021-57, Class IB | | |
| 2.50%, due 2/20/51 | 4,959,754 | 631,340 |
| REMIC, Series 2021-25, Class LI | | |
| 2.50%, due 2/20/51 | 4,555,628 | 540,283 |
| | | 30,767,034 |
| Commercial Mortgage Loans (Collateralized Mortgage Obligations) 7.5% |
| Bayview Commercial Asset Trust | |
| Series 2005-3A, Class A1 | | |
| 0.572% (1 Month LIBOR + 0.48%), due 11/25/35 (a)(b) | 1,151,570 | 1,090,979 |
| BX Commercial Mortgage Trust (a)(h) | |
| Series 2020-VIV2, Class C | | |
| 3.66%, due 3/9/44 | 2,450,000 | 2,591,891 |
| Series 2020-VIV3, Class B | | |
| 3.662%, due 3/9/44 | 1,680,000 | 1,824,360 |
| | Principal
Amount | Value |
| |
| Commercial Mortgage Loans (Collateralized Mortgage Obligations) (continued) |
| BX Commercial Mortgage Trust (a)(h) (continued) | |
| Series 2020-VIVA, Class D | | |
| 3.667%, due 3/11/44 | $ 950,000 | $ 979,772 |
| BX Trust (a) | |
| Series 2021-MFM1, Class C | | |
| 1.273% (1 Month LIBOR + 1.20%), due 1/15/34 (b) | 2,325,000 | 2,324,999 |
| Series 2021-MFM1, Class D | | |
| 1.573% (1 Month LIBOR + 1.50%), due 1/15/34 (b) | 1,050,000 | 1,050,000 |
| Series 2021-LBA, Class DV | | |
| 1.673% (1 Month LIBOR + 1.60%), due 2/15/36 (b) | 2,000,000 | 2,001,798 |
| Series 2019-OC11, Class A | | |
| 3.202%, due 12/9/41 | 1,395,000 | 1,502,782 |
| Series 2019-OC11, Class B | | |
| 3.605%, due 12/9/41 | 340,000 | 372,156 |
| Series 2019-OC11, Class C | | |
| 3.856%, due 12/9/41 | 895,000 | 972,657 |
| Series 2019-OC11, Class E | | |
| 4.075%, due 12/9/41 (h) | 2,525,000 | 2,640,752 |
| COMM Mortgage Trust | |
| Series 2012-CR4, Class AM | | |
| 3.251%, due 10/15/45 | 1,855,000 | 1,871,251 |
| Series 2013-CR9, Class B | | |
| 4.413%, due 7/10/45 (a)(h) | 1,500,000 | 1,514,161 |
| CSAIL Commercial Mortgage Trust | |
| Series 2015-C3, Class A4 | | |
| 3.718%, due 8/15/48 | 2,715,503 | 2,963,627 |
| CSMC WEST Trust | |
| Series 2020-WEST, Class A | | |
| 3.04%, due 2/15/35 (a) | 3,107,500 | 3,238,927 |
| DROP Mortgage Trust | |
| Series 2021-FILE, Class A | | |
| 1.22% (1 Month LIBOR + 1.15%), due 4/15/26 (a)(b) | 1,535,000 | 1,540,851 |
| Extended Stay America Trust | |
| Series 2021-ESH, Class D | | |
| 2.344%, due 7/15/38 (a) | 2,400,000 | 2,417,243 |
| GB Trust (a)(b) | |
| Series 2020-FLIX, Class C | | |
| 1.673% (1 Month LIBOR + 1.60%), due 8/15/37 | 1,300,000 | 1,303,643 |
| Series 2020-FLIX, Class D | | |
| 2.423% (1 Month LIBOR + 2.35%), due 8/15/37 | 1,920,000 | 1,924,220 |
The notes to the financial statements are an integral part of, and should be read in conjunction with, the financial statements.
19
Portfolio of Investments June 30, 2021† (Unaudited) (continued)
| | Principal
Amount | Value |
| Mortgage-Backed Securities (continued) |
| Commercial Mortgage Loans (Collateralized Mortgage Obligations) (continued) |
| GS Mortgage Securities Corp. Trust | |
| Series 2019-BOCA, Class A | | |
| 1.273% (1 Month LIBOR + 1.20%), due 6/15/38 (a)(b) | $ 4,480,000 | $ 4,488,326 |
| GS Mortgage Securities Trust | |
| Series 2017-GS7, Class A4 | | |
| 3.43%, due 8/10/50 | 2,990,000 | 3,289,637 |
| Hudson Yards Mortgage Trust | |
| Series 2019-30HY, Class A | | |
| 3.228%, due 7/10/39 (a) | 1,580,000 | 1,719,926 |
| J.P. Morgan Chase Commercial Mortgage Securities Corp. | |
| Series 2018-AON, Class B | | |
| 4.379%, due 7/5/31 (a)(h) | 1,960,000 | 2,067,926 |
| JPMBB Commercial Mortgage Securities Trust | |
| Series 2014-C26, Class A3 | | |
| 3.231%, due 1/15/48 | 2,044,974 | 2,167,006 |
| Manhattan West Mortgage Trust | |
| Series 2020-1MW, Class A | | |
| 2.13%, due 9/10/39 (a) | 1,725,000 | 1,764,309 |
| Morgan Stanley Bank of America Merrill Lynch Trust | |
| Series 2015-C23, Class A3 | | |
| 3.451%, due 7/15/50 | 1,391,014 | 1,499,437 |
| One Bryant Park Trust | |
| Series 2019-OBP, Class A | | |
| 2.516%, due 9/15/54 (a) | 4,585,000 | 4,747,589 |
| SLG Office Trust | |
| Series 2021-OVA, Class D | | |
| 2.851%, due 7/15/41 (a) | 1,600,000 | 1,614,119 |
| UBS-Barclays Commercial Mortgage Trust | |
| Series 2013-C6, Class B | | |
| 3.875%, due 4/10/46 (a)(i) | 1,485,000 | 1,500,954 |
| Wells Fargo Commercial Mortgage Trust | |
| Series 2019-C53, Class A3 | | |
| 2.787%, due 10/15/52 | 1,005,000 | 1,054,147 |
| Series 2019-C53, Class A4 | | |
| 3.04%, due 10/15/52 | 3,566,000 | 3,852,787 |
| Series 2018-1745, Class A | | |
| 3.874%, due 6/15/36 (a)(h) | 2,900,000 | 3,226,230 |
| Series 2018-AUS, Class A | | |
| 4.194%, due 8/17/36 (a)(h) | 4,325,000 | 4,890,149 |
| WFRBS Commercial Mortgage Trust | |
| Series 2012-C7, Class AS | | |
| 4.09%, due 6/15/45 (i) | 2,290,000 | 2,318,582 |
| | | 74,327,193 |
| | Principal
Amount | Value |
| |
| Whole Loan (Collateralized Mortgage Obligations) 8.3% |
| Alternative Loan Trust | |
| Series 2005-31, Class 1A1 | | |
| 0.651% (1 Month LIBOR + 0.56%), due 8/25/35 (b) | $ 3,152,141 | $ 2,997,340 |
| Chase Home Lending Mortgage Trust | |
| Series 2019-ATR2, Class A3 | | |
| 3.50%, due 7/25/49 (a)(i) | 336,000 | 345,602 |
| Connecticut Avenue Securities Trust | |
| Series 2020-R02, Class 2M2 | | |
| 2.091% (1 Month LIBOR + 2.00%), due 1/25/40 (a)(b) | 4,127,462 | 4,145,654 |
| FHLMC STACR REMIC Trust | |
| Series 2020-DNA6, Class M2 | | |
| 2.018% (SOFR 30A + 2.00%), due 12/25/50 (a)(b) | 4,235,000 | 4,280,060 |
| FHLMC STACR Trust (a)(b) | |
| Series 2018-DNA2, Class M2 | | |
| 2.242% (1 Month LIBOR + 2.15%), due 12/25/30 | 2,500,000 | 2,527,890 |
| Series 2019-DNA3, Class B1 | | |
| 3.341% (1 Month LIBOR + 3.25%), due 7/25/49 | 2,240,000 | 2,260,103 |
| Series 2018-DNA2, Class B1 | | |
| 3.791% (1 Month LIBOR + 3.70%), due 12/25/30 | 3,095,000 | 3,213,933 |
| Series 2019-DNA2, Class B1 | | |
| 4.442% (1 Month LIBOR + 4.35%), due 3/25/49 | 1,100,000 | 1,142,183 |
| FHLMC Structured Agency Credit Risk Debt Notes (b) | |
| Series 2017-DNA3, Class M2 | | |
| 2.591% (1 Month LIBOR + 2.50%), due 3/25/30 | 1,240,000 | 1,267,606 |
| Series 2017-HQA1, Class M2 | | |
| 3.642% (1 Month LIBOR + 3.55%), due 8/25/29 | 3,220,349 | 3,331,551 |
| Series 2016-DNA4, Class M3 | | |
| 3.891% (1 Month LIBOR + 3.80%), due 3/25/29 | 2,121,500 | 2,196,905 |
| Series 2016-HQA3, Class M3 | | |
| 3.941% (1 Month LIBOR + 3.85%), due 3/25/29 | 5,458,561 | 5,655,040 |
| Series 2016-HQA4, Class M3 | | |
| 3.992% (1 Month LIBOR + 3.90%), due 4/25/29 | 2,137,585 | 2,226,753 |
| FNMA (b) | |
| Series 2017-C05, Class 1M2 | | |
| 2.292% (1 Month LIBOR + 2.20%), due 1/25/30 | 1,325,210 | 1,346,335 |
The notes to the financial statements are an integral part of, and should be read in conjunction with, the financial statements.
| 20 | MainStay VP MacKay Strategic Bond Portfolio |
| | Principal
Amount | Value |
| Mortgage-Backed Securities (continued) |
| Whole Loan (Collateralized Mortgage Obligations) (continued) |
| FNMA (b) (continued) | |
| Series 2017-C07, Class 2M2 | | |
| 2.591% (1 Month LIBOR + 2.50%), due 5/25/30 | $ 1,805,243 | $ 1,827,087 |
| Series 2018-C04, Class 2M2 | | |
| 2.642% (1 Month LIBOR + 2.55%), due 12/25/30 | 2,631,415 | 2,678,357 |
| Series 2017-C03, Class 1M2 | | |
| 3.092% (1 Month LIBOR + 3.00%), due 10/25/29 | 1,288,011 | 1,328,047 |
| Series 2017-C02, Class 2M2 | | |
| 3.742% (1 Month LIBOR + 3.65%), due 9/25/29 | 2,405,810 | 2,493,170 |
| Series 2016-C06, Class 1M2 | | |
| 4.341% (1 Month LIBOR + 4.25%), due 4/25/29 | 2,963,347 | 3,080,423 |
| Series 2016-C07, Class 2M2 | | |
| 4.442% (1 Month LIBOR + 4.35%), due 5/25/29 | 3,171,385 | 3,324,297 |
| Galton Funding Mortgage Trust | |
| Series 2018-2, Class A51 | | |
| 4.50%, due 10/25/58 (a)(i) | 1,750,000 | 1,802,220 |
| GreenPoint Mortgage Funding Trust | |
| Series 2007-AR3, Class A1 | | |
| 0.312% (1 Month LIBOR + 0.22%), due 6/25/37 (b) | 671,968 | 668,638 |
| Mello Warehouse Securitization Trust | |
| Series 2021-1, Class B | | |
| 0.992% (1 Month LIBOR + 0.90%), due 2/25/55 (a)(b) | 1,600,000 | 1,604,212 |
| New Residential Mortgage Loan Trust (a) | |
| Series 2019-5A, Class B7 | | |
| 4.459%, due 8/25/59 (h) | 3,664,951 | 2,993,718 |
| Series 2019-4A, Class B6 | | |
| 4.77%, due 12/25/58 (i) | 3,198,085 | 2,563,631 |
| Series 2019-2A, Class B6 | | |
| 4.963%, due 12/25/57 (i) | 1,294,982 | 947,014 |
| NewRez Warehouse Securitization Trust | |
| Series 2021-1, Class B | | |
| 0.992% (1 Month LIBOR + 0.90%), due 5/25/55 (a)(b) | 4,615,000 | 4,619,419 |
| OBX Trust | |
| Series 2021-J1, Class A1 | | |
| 2.50%, due 5/25/51 (a)(i) | 2,567,438 | 2,601,836 |
| Sequoia Mortgage Trust (a)(i) | |
| Series 2021-4, Class A1 | | |
| 2.50%, due 6/25/51 | 2,109,215 | 2,137,474 |
| | Principal
Amount | Value |
| |
| Whole Loan (Collateralized Mortgage Obligations) (continued) |
| Sequoia Mortgage Trust (a)(i) (continued) | |
| Series 2017-1, Class A4 | | |
| 3.50%, due 2/25/47 | $ 130,740 | $ 130,946 |
| Series 2018-7, Class B3 | | |
| 4.217%, due 9/25/48 | 1,605,968 | 1,654,803 |
| STACR Trust (a)(b) | |
| Series 2018-DNA3, Class M2 | | |
| 2.192% (1 Month LIBOR + 2.10%), due 9/25/48 | 2,025,000 | 2,051,625 |
| Series 2018-HRP2, Class M3 | | |
| 2.491% (1 Month LIBOR + 2.40%), due 2/25/47 | 5,750,000 | 5,856,074 |
| WaMu Mortgage Pass-Through Certificates Trust | |
| Series 2006-AR9, Class 2A | | |
| 1.843% (11th District Cost of Funds Index + 1.50%), due 8/25/46 (b) | 945,022 | 924,966 |
| | | 82,224,912 |
Total Mortgage-Backed Securities
(Cost $181,929,571) | | 187,319,139 |
| Municipal Bond 0.3% |
| California 0.3% |
Regents of the University of California Medical Center, Pooled
Revenue Bonds | | |
| Series N | | |
| 3.006%, due 5/15/50 | 3,170,000 | 3,268,603 |
Total Municipal Bond
(Cost $3,170,000) | | 3,268,603 |
| U.S. Government & Federal Agencies 3.9% |
| Federal National Mortgage Association (Mortgage Pass-Through Security) 0.2% |
| UMBS, 30 Year | | |
| 2.00%, due 10/1/50 | 2,376,054 | 2,402,503 |
| United States Treasury Bond 0.0% ‡ |
| U.S. Treasury Bonds | | |
| 2.375%, due 5/15/51 | 200,000 | 213,531 |
| United States Treasury Inflation - Indexed Notes 3.7% |
| U.S. Treasury Inflation Linked Notes (j) | | |
| 0.125%, due 1/15/30 | 5,246,938 | 5,759,266 |
The notes to the financial statements are an integral part of, and should be read in conjunction with, the financial statements.
21
Portfolio of Investments June 30, 2021† (Unaudited) (continued)
| | Principal
Amount | | Value |
| U.S. Government & Federal Agencies (continued) |
| United States Treasury Inflation - Indexed Notes (continued) |
U.S. Treasury Inflation Linked Notes (j)
(continued) | | | |
| 0.75%, due 7/15/28 | $ 10,197,386 | | $ 11,699,908 |
| 0.875%, due 1/15/29 | 16,139,434 | | 18,673,409 |
| | | | 36,132,583 |
Total U.S. Government & Federal Agencies
(Cost $35,547,375) | | | 38,748,617 |
Total Long-Term Bonds
(Cost $850,847,974) | | | 891,607,584 |
| |
| | Shares | | |
| Short-Term Investments 10.5% |
| Affiliated Investment Company 10.3% |
| MainStay U.S. Government Liquidity Fund, 0.01% (k) | 101,945,025 | | 101,945,025 |
| Unaffiliated Investment Company 0.2% |
| Wells Fargo Government Money Market Fund, 0.025% (k)(l) | 2,060,506 | | 2,060,506 |
Total Short-Term Investments
(Cost $104,005,531) | | | 104,005,531 |
Total Investments
(Cost $954,853,505) | 100.5% | | 995,613,115 |
| Other Assets, Less Liabilities | (0.5) | | (4,942,829) |
| Net Assets | 100.0% | | $ 990,670,286 |
| † | Percentages indicated are based on Portfolio net assets. |
| ‡ | Less than one-tenth of a percent. |
| (a) | May be sold to institutional investors only under Rule 144A or securities offered pursuant to Section 4(a)(2) of the Securities Act of 1933, as amended. |
| (b) | Floating rate—Rate shown was the rate in effect as of June 30, 2021. |
| (c) | Delayed delivery security. |
| (d) | Fixed to floating rate—Rate shown was the rate in effect as of June 30, 2021. |
| (e) | Security is perpetual and, thus, does not have a predetermined maturity date. The date shown, if applicable, reflects the next call date. |
| (f) | All or a portion of this security was held on loan. As of June 30, 2021, the aggregate market value of securities on loan was $1,989,253. The Portfolio received cash collateral with a value of $2,060,506. (See Note 2(N)) |
| (g) | Step coupon—Rate shown was the rate in effect as of June 30, 2021. |
| (h) | Collateral strip rate—A bond whose interest was based on the weighted net interest rate of the collateral. The coupon rate adjusts periodically based on a predetermined schedule. Rate shown was the rate in effect as of June 30, 2021. |
| (i) | Coupon rate may change based on changes of the underlying collateral or prepayments of principal. Rate shown was the rate in effect as of June 30, 2021. |
| (j) | Treasury Inflation Protected Security—Pays a fixed rate of interest on a principal amount that is continuously adjusted for inflation based on the Consumer Price Index-Urban Consumers. |
| (k) | Current yield as of June 30, 2021. |
| (l) | Represents a security purchased with cash collateral received for securities on loan. |
Foreign Currency Forward Contracts
As of June 30, 2021, the Portfolio held the following foreign currency forward contracts1:
| Currency Purchased | Currency Sold | Counterparty | Settlement
Date | Unrealized
Appreciation
(Depreciation) |
| USD | 2,767,361 | EUR | 2,287,000 | JPMorgan Chase Bank N.A. | 8/2/21 | $ 53,758 |
| USD | 615,149 | GBP | 442,000 | JPMorgan Chase Bank N.A. | 8/2/21 | 3,672 |
| Total Unrealized Appreciation | 57,430 |
| EUR | 1,230,000 | USD | 1,501,803 | JPMorgan Chase Bank N.A. | 8/2/21 | (42,366) |
| Total Unrealized Depreciation | (42,366) |
| Net Unrealized Appreciation | $ 15,064 |
| 1. | Foreign Currency Forward Contracts are subject to limitations such that they cannot be “sold or repurchased,” although the Portfolio would be able to exit the transaction through other means, such as through the execution of an offsetting transaction. |
The notes to the financial statements are an integral part of, and should be read in conjunction with, the financial statements.
| 22 | MainStay VP MacKay Strategic Bond Portfolio |
Futures Contracts
As of June 30, 2021, the Portfolio held the following futures contracts1:
| Type | Number of
Contracts | Expiration
Date | Value at
Trade Date | Current
Notional
Amount | Unrealized
Appreciation
(Depreciation)2 |
| Long Contracts | | | | | |
| U.S. Treasury 2 Year Notes | 357 | September 2021 | $ 78,784,571 | $ 78,654,351 | $ (130,220) |
| U.S. Treasury Long Bonds | 196 | September 2021 | 31,198,018 | 31,507,000 | 308,982 |
| Total Long Contracts | | | | | 178,762 |
| Short Contracts | | | | | |
| U.S. Treasury 5 Year Notes | (839) | September 2021 | (103,490,234) | (103,557,508) | (67,274) |
| U.S. Treasury 10 Year Notes | (873) | September 2021 | (115,442,534) | (115,672,500) | (229,966) |
| U.S. Treasury 10 Year Ultra Bonds | (183) | September 2021 | (26,773,913) | (26,938,172) | (164,259) |
| U.S. Treasury Ultra Bonds | (88) | September 2021 | (16,326,307) | (16,956,500) | (630,193) |
| Total Short Contracts | | | | | (1,091,692) |
| Net Unrealized Depreciation | | | | | $ (912,930) |
| 1. | As of June 30, 2021, cash in the amount of $2,410,274 was on deposit with a broker or futures commission merchant for futures transactions. |
| 2. | Represents the difference between the value of the contracts at the time they were opened and the value as of June 30, 2021. |
Swap Contracts
As of June 30, 2021, the Portfolio held the following centrally cleared interest rate swap agreements1:
Notional
Amount | Currency | Expiration
Date | Payments
made by Portfolio | Payments
Received by Portfolio | Payment
Frequency
Paid/
Received | Upfront
Premiums
Paid/
(Received) | | Value | | Unrealized
Appreciation/
(Depreciation) |
| $ 50,000,000 | USD | 3/16/23 | Fixed 2.793% | 3 month USD LIBOR | Quarterly | $ — | | $ (2,162,481) | | $ (2,162,481) |
| 50,000,000 | USD | 3/29/23 | Fixed 2.762% | 3 month USD LIBOR | Quarterly | — | | (2,171,499) | | (2,171,499) |
| | | | | | | $ — | | $ (4,333,980) | | $ (4,333,980) |
| 1. | As of June 30, 2021, cash in the amount of $901,765 was on deposit with a broker for centrally cleared swap agreements. |
| Abbreviation(s): |
| EUR—Euro |
| FHLMC—Federal Home Loan Mortgage Corp. |
| FNMA—Federal National Mortgage Association |
| GBP—British Pound Sterling |
| GNMA—Government National Mortgage Association |
| LIBOR—London Interbank Offered Rate |
| REMIC—Real Estate Mortgage Investment Conduit |
| SOFR—Secured Overnight Financing Rate |
| UMBS—Uniform Mortgage Backed Securities |
| USD—United States Dollar |
The notes to the financial statements are an integral part of, and should be read in conjunction with, the financial statements.
23
Portfolio of Investments June 30, 2021† (Unaudited) (continued)
The following is a summary of the fair valuations according to the inputs used as of June 30, 2021, for valuing the Portfolio’s assets and liabilities:
| Description | Quoted
Prices in
Active
Markets for
Identical
Assets
(Level 1) | | Significant
Other
Observable
Inputs
(Level 2) | | Significant
Unobservable
Inputs
(Level 3) | | Total |
| Asset Valuation Inputs | | | | | | | |
| Investments in Securities (a) | | | | | | | |
| Long-Term Bonds | | | | | | | |
| Asset-Backed Securities | $ — | | $ 90,496,715 | | $ — | | $ 90,496,715 |
| Corporate Bonds | — | | 506,309,690 | | — | | 506,309,690 |
| Foreign Government Bonds | — | | 29,328,393 | | — | | 29,328,393 |
| Loan Assignments | — | | 36,136,427 | | — | | 36,136,427 |
| Mortgage-Backed Securities | — | | 187,319,139 | | — | | 187,319,139 |
| Municipal Bond | — | | 3,268,603 | | — | | 3,268,603 |
| U.S. Government & Federal Agencies | — | | 38,748,617 | | — | | 38,748,617 |
| Total Long-Term Bonds | — | | 891,607,584 | | — | | 891,607,584 |
| Short-Term Investments | | | | | | | |
| Affiliated Investment Company | 101,945,025 | | — | | — | | 101,945,025 |
| Unaffiliated Investment Company | 2,060,506 | | — | | — | | 2,060,506 |
| Total Short-Term Investments | 104,005,531 | | — | | — | | 104,005,531 |
| Total Investments in Securities | 104,005,531 | | 891,607,584 | | — | | 995,613,115 |
| Other Financial Instruments | | | | | | | |
| Foreign Currency Forward Contracts (b) | — | | 57,430 | | — | | 57,430 |
| Futures Contracts (b) | 308,982 | | — | | — | | 308,982 |
| Total Other Financial Instruments | 308,982 | | 57,430 | | — | | 366,412 |
| Total Investments in Securities and Other Financial Instruments | $ 104,314,513 | | $ 891,665,014 | | $ — | | $ 995,979,527 |
| Liability Valuation Inputs | | | | | | | |
| Other Financial Instruments | | | | | | | |
| Foreign Currency Forward Contracts (b) | $ — | | $ (42,366) | | $ — | | $ (42,366) |
| Futures Contracts (b) | (1,221,912) | | — | | — | | (1,221,912) |
| Interest Rate Swaps (b) | — | | (4,333,980) | | — | | (4,333,980) |
| Total Other Financial Instruments | $ (1,221,912) | | $ (4,376,346) | | $ — | | $ (5,598,258) |
| (a) | For a complete listing of investments and their industries, see the Portfolio of Investments. |
| (b) | The value listed for these securities reflects unrealized appreciation (depreciation) as shown on the Portfolio of Investments. |
The notes to the financial statements are an integral part of, and should be read in conjunction with, the financial statements.
| 24 | MainStay VP MacKay Strategic Bond Portfolio |
Statement of Assets and Liabilities as of June 30, 2021 (Unaudited)
| Assets |
Investment in unaffiliated securities, at value
(identified cost $852,908,480) including securities on loan of $1,989,253 | $ 893,668,090 |
Investment in affiliated investment companies, at value
(identified cost $101,945,025) | 101,945,025 |
| Cash | 5,525,612 |
Cash denominated in foreign currencies
(identified cost $1,915,586) | 1,872,092 |
| Cash collateral on deposit at broker for futures contracts | 2,410,274 |
| Cash collateral on deposit at broker for swap contracts | 901,765 |
| Receivables: | |
| Investment securities sold | 6,987,040 |
| Interest | 6,208,083 |
| Securities lending | 1,158 |
| Portfolio shares sold | 300 |
| Unrealized appreciation on foreign currency forward contracts | 57,430 |
| Other assets | 14,243 |
| Total assets | 1,019,591,112 |
| Liabilities |
| Cash collateral received for securities on loan | 2,060,506 |
| Payables: | |
| Investment securities purchased | 19,777,513 |
| Variation margin on centrally cleared swap contracts | 5,589,601 |
| Portfolio shares redeemed | 493,641 |
| Manager (See Note 3) | 468,543 |
| NYLIFE Distributors (See Note 3) | 198,747 |
| Shareholder communication | 93,041 |
| Professional fees | 61,980 |
| Variation margin on futures contracts | 58,634 |
| Broker fees and charges on short sales | 51,986 |
| Custodian | 23,908 |
| Trustees | 161 |
| Accrued expenses | 199 |
| Unrealized depreciation on foreign currency forward contracts | 42,366 |
| Total liabilities | 28,920,826 |
| Net assets | $ 990,670,286 |
| Composition of Net Assets |
| Shares of beneficial interest outstanding (par value of $.001 per share) unlimited number of shares authorized | $ 96,624 |
| Additional paid-in-capital | 990,501,531 |
| | 990,598,155 |
| Total distributable earnings (loss) | 72,131 |
| Net assets | $ 990,670,286 |
| Initial Class | |
| Net assets applicable to outstanding shares | $ 24,026,610 |
| Shares of beneficial interest outstanding | 2,335,504 |
| Net asset value per share outstanding | $ 10.29 |
| Service Class | |
| Net assets applicable to outstanding shares | $966,643,676 |
| Shares of beneficial interest outstanding | 94,288,893 |
| Net asset value per share outstanding | $ 10.25 |
The notes to the financial statements are an integral part of, and should be read in conjunction with, the financial statements.
25
Statement of Operations for the six months ended June 30, 2021 (Unaudited)
| Investment Income (Loss) |
| Income | |
| Interest | $ 16,758,087 |
| Securities lending | 5,332 |
| Dividends-affiliated | 3,339 |
| Other | 115,007 |
| Total income | 16,881,765 |
| Expenses | |
| Manager (See Note 3) | 2,838,009 |
| Distribution/Service—Service Class (See Note 3) | 1,204,959 |
| Professional fees | 69,122 |
| Shareholder communication | 51,596 |
| Broker fees and charges on short sales | 51,570 |
| Interest on investments sold short | 30,201 |
| Custodian | 21,919 |
| Trustees | 10,359 |
| Miscellaneous | 16,742 |
| Total expenses | 4,294,477 |
| Net investment income (loss) | 12,587,288 |
| Realized and Unrealized Gain (Loss) |
| Net realized gain (loss) on: | |
| Unaffiliated investment transactions | 20,228,205 |
| Futures transactions | 7,849,411 |
| Investments sold short | (323,725) |
| Swap transactions | (1,303,362) |
| Foreign currency transactions | 177,845 |
| Foreign currency forward transactions | (96,029) |
| Net realized gain (loss) | 26,532,345 |
| Net change in unrealized appreciation (depreciation) on: | |
| Unaffiliated investments | (24,767,051) |
| Futures contracts | (1,191,205) |
| Investments sold short | 206,075 |
| Swap contracts | 1,412,191 |
| Foreign currency forward contracts | 240,842 |
| Translation of other assets and liabilities in foreign currencies | (54,351) |
| Net change in unrealized appreciation (depreciation) | (24,153,499) |
| Net realized and unrealized gain (loss) | 2,378,846 |
| Net increase (decrease) in net assets resulting from operations | $ 14,966,134 |
The notes to the financial statements are an integral part of, and should be read in conjunction with, the financial statements.
| 26 | MainStay VP MacKay Strategic Bond Portfolio |
Statements of Changes in Net Assets
for the six months ended June 30, 2021 (Unaudited) and the year ended December 31, 2020
| | 2021 | 2020 |
| Increase (Decrease) in Net Assets |
| Operations: | | |
| Net investment income (loss) | $ 12,587,288 | $ 25,072,270 |
| Net realized gain (loss) | 26,532,345 | (12,109,969) |
| Net change in unrealized appreciation (depreciation) | (24,153,499) | 36,714,085 |
| Net increase (decrease) in net assets resulting from operations | 14,966,134 | 49,676,386 |
| Distributions to shareholders: | | |
| Initial Class | (296,669) | (692,907) |
| Service Class | (11,035,016) | (22,210,493) |
| | (11,331,685) | (22,903,400) |
| Distributions to shareholders from return of capital: | | |
| Initial Class | — | (16,255) |
| Service Class | — | (521,050) |
| | — | (537,305) |
| Total distributions to shareholders | (11,331,685) | (23,440,705) |
| Capital share transactions: | | |
| Net proceeds from sales of shares | 22,661,941 | 75,789,465 |
| Net asset value of shares issued to shareholder in reinvestment of distributions | 11,331,685 | 23,440,705 |
| Cost of shares redeemed | (38,817,128) | (173,638,542) |
| Increase (decrease) in net assets derived from capital share transactions | (4,823,502) | (74,408,372) |
| Net increase (decrease) in net assets | (1,189,053) | (48,172,691) |
| Net Assets |
| Beginning of period | 991,859,339 | 1,040,032,030 |
| End of period | $990,670,286 | $ 991,859,339 |
The notes to the financial statements are an integral part of, and should be read in conjunction with, the financial statements.
27
Financial Highlights selected per share data and ratios
| | Six months ended
June 30,
2021* | | Year Ended December 31, |
| Initial Class | 2020 | | 2019 | | 2018 | | 2017 | | 2016 |
| Net asset value at beginning of period | $ 10.25 | | $ 9.92 | | $ 9.60 | | $ 10.06 | | $ 9.90 | | $ 9.54 |
| Net investment income (loss) (a) | 0.15 | | 0.28 | | 0.29 | | 0.30 | | 0.29 | | 0.37 |
| Net realized and unrealized gain (loss) on investments | 0.02 | | 0.33 | | 0.38 | | (0.43) | | 0.18 | | 0.33 |
| Net realized and unrealized gain (loss) on foreign currency transactions | 0.00‡ | | (0.01) | | 0.00‡ | | 0.00‡ | | 0.00‡ | | 0.01 |
| Total from investment operations | 0.17 | | 0.60 | | 0.67 | | (0.13) | | 0.47 | | 0.71 |
| Less distributions: | | | | | | | | | | | |
| From net investment income | (0.13) | | (0.26) | | (0.35) | | (0.33) | | (0.31) | | (0.35) |
| Return of capital | — | | (0.01) | | — | | — | | — | | — |
| Total distributions | (0.13) | | (0.27) | | (0.35) | | (0.33) | | (0.31) | | (0.35) |
| Net asset value at end of period | $ 10.29 | | $ 10.25 | | $ 9.92 | | $ 9.60 | | $ 10.06 | | $ 9.90 |
| Total investment return (b) | 1.64% | | 6.12% | | 7.06% | | (1.21)% | | 4.81% | | 7.50% |
| Ratios (to average net assets)/Supplemental Data: | | | | | | | | | | | |
| Net investment income (loss) | 2.85%†† | | 2.84% | | 2.96% | | 3.04% | | 2.89% | | 3.80% |
| Net expenses (c)(d) | 0.63%†† | | 0.70% | | 0.76% | | 0.75% | | 0.67% | | 0.72% |
| Portfolio turnover rate | 31% | | 52%(e) | | 51%(e) | | 33% | | 32% | | 34% |
| Net assets at end of period (in 000’s) | $ 24,027 | | $ 22,538 | | $ 49,296 | | $ 116,901 | | $ 137,454 | | $ 122,586 |
| * | Unaudited. |
| ‡ | Less than one cent per share. |
| †† | Annualized. |
| (a) | Per share data based on average shares outstanding during the period. |
| (b) | Total return does not reflect any deduction of sales charges, mortality and expense charges, contract charges or administrative charges. For periods of less than one year, total return is not annualized. |
| (c) | In addition to the fees and expenses which the Portfolio bears directly, it also indirectly bears a pro-rata share of the fees and expenses of the underlying funds in which it invests. Such indirect expenses are not included in the above expense ratios. |
| (d) | The expense ratios presented below show the impact of short sales expense: |
| Period Ended | | Net Expenses
(excluding short
sale expenses) | | Short Sales
Expenses |
| June 30, 2021*†† | | 0.61% | | 0.02% |
| December 31, 2020 | | 0.62% | | 0.08% |
| December 31, 2019 | | 0.61% | | 0.15% |
| December 31, 2018 | | 0.60% | | 0.15% |
| December 31, 2017 | | 0.60% | | 0.07% |
| December 31, 2016 | | 0.62% | | 0.10% |
| (e) | The portfolio turnover rate not including mortgage dollar rolls was 51% and 45% for the years ended December 31, 2020 and 2019, respectively. |
The notes to the financial statements are an integral part of, and should be read in conjunction with, the financial statements.
| 28 | MainStay VP MacKay Strategic Bond Portfolio |
Financial Highlights selected per share data and ratios
| | Six months ended
June 30,
2021* | | Year Ended December 31, |
| Service Class | 2020 | | 2019 | | 2018 | | 2017 | | 2016 |
| Net asset value at beginning of period | $ 10.21 | | $ 9.89 | | $ 9.57 | | $ 10.03 | | $ 9.87 | | $ 9.51 |
| Net investment income (loss) (a) | 0.13 | | 0.26 | | 0.26 | | 0.28 | | 0.26 | | 0.34 |
| Net realized and unrealized gain (loss) on investments | 0.03 | | 0.31 | | 0.39 | | (0.43) | | 0.19 | | 0.33 |
| Net realized and unrealized gain (loss) on foreign currency transactions | 0.00‡ | | (0.01) | | 0.00‡ | | 0.00‡ | | 0.00‡ | | 0.01 |
| Total from investment operations | 0.16 | | 0.56 | | 0.65 | | (0.15) | | 0.45 | | 0.68 |
| Less distributions: | | | | | | | | | | | |
| From net investment income | (0.12) | | (0.23) | | (0.33) | | (0.31) | | (0.29) | | (0.32) |
| Return of capital | — | | (0.01) | | — | | — | | — | | — |
| Total distributions | (0.12) | | (0.24) | | (0.33) | | (0.31) | | (0.29) | | (0.32) |
| Net asset value at end of period | $ 10.25 | | $ 10.21 | | $ 9.89 | | $ 9.57 | | $ 10.03 | | $ 9.87 |
| Total investment return (b) | 1.52% | | 5.86% | | 6.80% | | (1.46)% | | 4.55% | | 7.23% |
| Ratios (to average net assets)/Supplemental Data: | | | | | | | | | | | |
| Net investment income (loss) | 2.54%†† | | 2.59% | | 2.66% | | 2.79% | | 2.64% | | 3.54% |
| Net expenses (c)(d) | 0.88%†† | | 0.93% | | 1.01% | | 1.00% | | 0.92% | | 0.97% |
| Portfolio turnover rate | 31% | | 52%(e) | | 51%(e) | | 33% | | 32% | | 34% |
| Net assets at end of period (in 000’s) | $ 966,644 | | $ 969,321 | | $ 990,736 | | $ 999,100 | | $ 1,064,435 | | $ 882,928 |
| * | Unaudited. |
| ‡ | Less than one cent per share. |
| †† | Annualized. |
| (a) | Per share data based on average shares outstanding during the period. |
| (b) | Total return does not reflect any deduction of sales charges, mortality and expense charges, contract charges or administrative charges. For periods of less than one year, total return is not annualized. |
| (c) | In addition to the fees and expenses which the Portfolio bears directly, it also indirectly bears a pro-rata share of the fees and expenses of the underlying funds in which it invests. Such indirect expenses are not included in the above expense ratios. |
| (d) | The expense ratios presented below show the impact of short sales expense: |
| Period Ended | | Net Expenses
(excluding short
sale expenses) | | Short Sales
Expenses |
| June 30, 2021*†† | | 0.86% | | 0.02% |
| December 31, 2020 | | 0.86% | | 0.07% |
| December 31, 2019 | | 0.86% | | 0.15% |
| December 31, 2018 | | 0.85% | | 0.15% |
| December 31, 2017 | | 0.85% | | 0.07% |
| December 31, 2016 | | 0.87% | | 0.10% |
| (e) | The portfolio turnover rate not including mortgage dollar rolls was 51% and 45% for the years ended December 31, 2020 and 2019, respectively. |
The notes to the financial statements are an integral part of, and should be read in conjunction with, the financial statements.
29
Notes to Financial Statements (Unaudited)
Note 1–Organization and Business
MainStay VP Funds Trust (the “Fund”) was organized as a Delaware statutory trust on February 1, 2011. The Fund is registered under the Investment Company Act of 1940, as amended (the “1940 Act”), as an open-end management investment company. The Fund is comprised of thirty-one separate series (collectively referred to as the “Portfolios”). These financial statements and notes relate to the MainStay VP MacKay Strategic Bond Portfolio (formerly known as MainStay VP MacKay Unconstrained Bond Portfolio) (the "Portfolio"), a "diversified” portfolio, as that term is defined in the 1940 Act, as interpreted or modified by regulatory authorities having jurisdiction, from time to time.
Shares of the Portfolio are currently offered to certain separate accounts to fund variable annuity policies and variable universal life insurance policies issued by New York Life Insurance and Annuity Corporation (“NYLIAC”), a wholly-owned subsidiary of New York Life Insurance Company (“New York Life”) and may also be offered to fund variable annuity policies and variable universal life insurance policies issued by other insurance companies. NYLIAC allocates shares of the Portfolios to, among others, certain NYLIAC separate accounts. Shares of the Portfolio are also offered to the MainStay VP Conservative Allocation Portfolio, MainStay VP Moderate Allocation Portfolio, MainStay VP Growth Allocation Portfolio (formerly known as MainStay VP Moderate Growth Allocation Portfolio) and MainStay VP Equity Allocation Portfolio (formerly known as MainStay VP Growth Allocation Portfolio), which operate as “funds-of-funds," and other variable insurance funds.
The following table lists the Portfolio's share classes that have been registered and commenced operations:
| Class | Commenced Operations |
| Initial Class | April 29, 2011 |
| Service Class | April 29, 2011 |
Shares of the Portfolio are offered and are redeemed at a price equal to their respective net asset value (“NAV”) per share. No sales or redemption charge is applicable to the purchase or redemption of the Portfolio's shares. Under the terms of the Fund’s multiple class plan, adopted pursuant to Rule 18f-3 under the 1940 Act, the classes differ in that, among other things, Service Class shares of the Portfolio pay a combined distribution and service fee of 0.25% of average daily net assets attributable to Service Class shares of the Portfolio to the Distributor (as defined in Note 3(B)) pursuant to a plan adopted in accordance with Rule 12b-1 under the 1940 Act. Contract owners of variable annuity contracts purchased after June 2, 2003, are permitted to invest only in the Service Class shares.
The Portfolio's investment objective is to seek total return by investing primarily in domestic and foreign debt securities.
Note 2–Significant Accounting Policies
The Portfolio is an investment company and accordingly follows the investment company accounting and reporting guidance of the Financial Accounting Standards Board (“FASB”) Accounting Standard Codification Topic 946 Financial Services—Investment Companies. The Portfolio prepares its financial statements in accordance with generally accepted accounting principles (“GAAP”) in the United States of America and follows the significant accounting policies described below.
(A) Securities Valuation. Investments are usually valued as of the close of regular trading on the New York Stock Exchange (the "Exchange") (usually 4:00 p.m. Eastern time) on each day the Portfolio is open for business ("valuation date").
The Board of Trustees of the Fund (the "Board") adopted procedures establishing methodologies for the valuation of the Portfolio's securities and other assets and delegated the responsibility for valuation determinations under those procedures to the Valuation Committee of the Fund (the “Valuation Committee”). The procedures state that, subject to the oversight of the Board and unless otherwise noted, the responsibility for the day-to-day valuation of portfolio assets (including fair value measurements for the Portfolio's assets and liabilities) rests with New York Life Investment Management LLC (“New York Life Investments” or the "Manager"), aided to whatever extent necessary by the Subadvisor (as defined in Note 3(A)). To assess the appropriateness of security valuations, the Manager, the Subadvisor or the Portfolio's third-party service provider, who is subject to oversight by the Manager, regularly compares prior day prices, prices on comparable securities and the sale prices to the prior and current day prices and challenges prices with changes exceeding certain tolerance levels with third-party pricing services or broker sources.
The Board authorized the Valuation Committee to appoint a Valuation Subcommittee (the “Subcommittee”) to establish the prices of securities for which market quotations are not readily available or the prices of which are not otherwise readily determinable under the procedures. The Subcommittee meets (in person, via electronic mail or via teleconference) on an as-needed basis. The Valuation Committee meets to ensure that actions taken by the Subcommittee were appropriate.
For those securities valued through either a standardized fair valuation methodology or a fair valuation measurement, the Subcommittee deals with such valuation and the Valuation Committee reviews and affirms, if appropriate, the reasonableness of the valuation based on such methodologies and measurements on a regular basis after considering information that is reasonably available and deemed relevant by the Valuation Committee. Any action taken by the Subcommittee with respect to the valuation of a portfolio security or other asset is submitted for review and ratification (if appropriate) to the Valuation Committee and the Board at the next regularly scheduled meeting.
"Fair value" is defined as the price the Portfolio would reasonably expect to receive upon selling an asset or liability in an orderly transaction to an independent buyer in the principal or most advantageous market for the
| 30 | MainStay VP MacKay Strategic Bond Portfolio |
asset or liability. Fair value measurements are determined within a framework that establishes a three-tier hierarchy that maximizes the use of observable market data and minimizes the use of unobservable inputs to establish a classification of fair value measurements for disclosure purposes. "Inputs" refer broadly to the assumptions that market participants would use in pricing the asset or liability, including assumptions about risk, such as the risk inherent in a particular valuation technique used to measure fair value using a pricing model and/or the risk inherent in the inputs for the valuation technique. Inputs may be observable or unobservable. Observable inputs reflect the assumptions market participants would use in pricing the asset or liability based on market data obtained from sources independent of the Portfolio. Unobservable inputs reflect the Portfolio’s own assumptions about the assumptions market participants would use in pricing the asset or liability based on the information available. The inputs or methodology used for valuing assets or liabilities may not be an indication of the risks associated with investing in those assets or liabilities. The three-tier hierarchy of inputs is summarized below.
| • | Level 1—quoted prices in active markets for an identical asset or liability |
| • | Level 2—other significant observable inputs (including quoted prices for a similar asset or liability in active markets, interest rates and yield curves, prepayment speeds, credit risk, etc.) |
| • | Level 3—significant unobservable inputs (including the Portfolio's own assumptions about the assumptions that market participants would use in measuring fair value of an asset or liability) |
The level of an asset or liability within the fair value hierarchy is based on the lowest level of an input, both individually and in the aggregate, that is significant to the fair value measurement. The aggregate value by input level of the Portfolio’s assets and liabilities as of June 30, 2021, is included at the end of the Portfolio of Investments.
The Portfolio may use third-party vendor evaluations, whose prices may be derived from one or more of the following standard inputs, among others:
| • Benchmark yields | • Reported trades |
| • Broker/dealer quotes | • Issuer spreads |
| • Two-sided markets | • Benchmark securities |
| • Bids/offers | • Reference data (corporate actions or material event notices) |
| • Industry and economic events | • Comparable bonds |
| • Monthly payment information | |
An asset or liability for which market values cannot be measured using the methodologies described above is valued by methods deemed reasonable in good faith by the Valuation Committee, following the procedures established by the Board, to represent fair value. Under these procedures, the Portfolio generally uses a market-based approach which may use related or comparable assets or liabilities, recent transactions, market multiples, book values and other relevant information. The
Portfolio may also use an income-based valuation approach in which the anticipated future cash flows of the asset or liability are discounted to calculate fair value. Discounts may also be applied due to the nature and/or duration of any restrictions on the disposition of the asset or liability. Fair value represents a good faith approximation of the value of a security. Fair value determinations involve the consideration of a number of subjective factors, an analysis of applicable facts and circumstances and the exercise of judgment. As a result, it is possible that the fair value for a security determined in good faith in accordance with the Portfolio's valuation procedures may differ from valuations for the same security determined by other funds using their own valuation procedures. Although the Portfolio's valuation procedures are designed to value a security at the price the Portfolio may reasonably expect to receive upon the security's sale in an orderly transaction, there can be no assurance that any fair value determination thereunder would, in fact, approximate the amount that the Portfolio would actually realize upon the sale of the security or the price at which the security would trade if a reliable market price were readily available. During the six-month period ended June 30, 2021, there were no material changes to the fair value methodologies.
Securities which may be valued in this manner include, but are not limited to: (i) a security for which trading has been halted or suspended; (ii) a debt security that has recently gone into default and for which there is not a current market quotation; (iii) a security of an issuer that has entered into a restructuring; (iv) a security that has been delisted from a national exchange; (v) a security for which the market price is not readily available from a third-party pricing source or, if so provided, does not, in the opinion of the Manager or the Subadvisor, reflect the security's market value; (vi) a security subject to trading collars for which no or limited trading takes place; and (vii) a security whose principal market has been temporarily closed at a time when, under normal conditions, it would be open. Securities valued in this manner are generally categorized as Level 3 in the hierarchy. No securities held by the Portfolio as of June 30, 2021 were fair valued in such a manner.
Investments in mutual funds, including money market funds, are valued at their respective NAVs at the close of business each day on the valuation date. These securities are generally categorized as Level 1 in the hierarchy.
Futures contracts are valued at the last posted settlement price on the market where such futures are primarily traded. These securities are generally categorized as Level 1 in the hierarchy.
Swaps are marked to market daily based upon quotations from pricing agents, brokers or market makers. These securities are generally categorized as Level 2 in the hierarchy.
Debt securities (other than convertible and municipal bonds) are valued at the evaluated bid prices (evaluated mean prices in the case of convertible and municipal bonds) supplied by a pricing agent or broker selected by the Manager, in consultation with the Subadvisor. The evaluations are market-based measurements processed through a pricing application and represents the pricing agent’s good faith determination as to what a holder may receive in an orderly transaction under market conditions. The
Notes to Financial Statements (Unaudited) (continued)
rules-based logic utilizes valuation techniques that reflect participants’ assumptions and vary by asset class and per methodology, maximizing the use of relevant observable data including quoted prices for similar assets, benchmark yield curves and market corroborated inputs. The evaluated bid or mean prices are deemed by the Manager, in consultation with the Subadvisor, to be representative of market values at the regular close of trading of the Exchange on each valuation date. Debt securities purchased on a delayed delivery basis are marked to market daily until settlement at the forward settlement date. Debt securities, including corporate bonds, U.S. government and federal agency bonds, municipal bonds, foreign bonds, convertible bonds, asset-backed securities and mortgage-backed securities are generally categorized as Level 2 in the hierarchy.
Foreign currency forward contracts are valued at their fair market values measured on the basis of the mean between the last current bid and ask prices based on dealer or exchange quotations and are generally categorized as Level 2 in the hierarchy.
Loan assignments, participations and commitments are valued at the average of bid quotations obtained from the engaged independent pricing service and are generally categorized as Level 2 in the hierarchy. Certain loan assignments, participations and commitments may be valued by utilizing significant unobservable inputs obtained from the pricing service and are generally categorized as Level 3 in the hierarchy.
Temporary cash investments acquired in excess of 60 days to maturity at the time of purchase are valued using the latest bid prices or using valuations based on a matrix system (which considers such factors as security prices, yields, maturities and ratings), both as furnished by independent pricing services. Temporary cash investments that mature in 60 days or less at the time of purchase ("Short-Term Investments") are valued using the amortized cost method of valuation, unless the use of such method would be inappropriate. The amortized cost method involves valuing a security at its cost on the date of purchase and thereafter assuming a constant amortization to maturity of the difference between such cost and the value on maturity date. Amortized cost approximates the current fair value of a security. Securities valued using the amortized cost method are not valued using quoted prices in an active market and are generally categorized as Level 2 in the hierarchy.
The information above is not intended to reflect an exhaustive list of the methodologies that may be used to value portfolio investments. The valuation procedures permit the use of a variety of valuation methodologies in connection with valuing portfolio investments. The methodology used for a specific type of investment may vary based on the market data available or other considerations. The methodologies summarized above may not represent the specific means by which portfolio investments are valued on any particular business day.
(B) Income Taxes. The Portfolio's policy is to comply with the requirements of the Internal Revenue Code of 1986, as amended (the “Internal Revenue Code”), applicable to regulated investment companies
and to distribute all of its taxable income to the shareholders of the Portfolio within the allowable time limits.
The Manager evaluates the Portfolio’s tax positions to determine if the tax positions taken meet the minimum recognition threshold in connection with accounting for uncertainties in income tax positions taken or expected to be taken for the purposes of measuring and recognizing tax liabilities in the financial statements. Recognition of tax benefits of an uncertain tax position is permitted only to the extent the position is “more likely than not” to be sustained assuming examination by taxing authorities. The Manager analyzed the Portfolio's tax positions taken on federal, state and local income tax returns for all open tax years (for up to three tax years) and has concluded that no provisions for federal, state and local income tax are required in the Portfolio's financial statements. The Portfolio's federal, state and local income tax and federal excise tax returns for tax years for which the applicable statutes of limitations have not expired are subject to examination by the Internal Revenue Service and state and local departments of revenue.
(C) Foreign Taxes. The Portfolio may be subject to foreign taxes on income and other transaction-based taxes imposed by certain countries in which it invests. A portion of the taxes on gains on investments or currency purchases/repatriation may be reclaimable. The Portfolio will accrue such taxes and reclaims as applicable, based upon its current interpretation of tax rules and regulations that exist in the markets in which it invests.
The Portfolio may be subject to taxation on realized capital gains, repatriation proceeds and other transaction-based taxes imposed by certain countries in which it invests. The Portfolio will accrue such taxes as applicable based upon its current interpretation of tax rules and regulations that exist in the market in which it invests. Capital gains taxes relating to positions still held are reflected as a liability in the Statement of Assets and Liabilities, as well as an adjustment to the Portfolio's net unrealized appreciation (depreciation). Taxes related to capital gains realized, if any, are reflected as part of net realized gain (loss) in the Statement of Operations. Changes in tax liabilities related to capital gains taxes on unrealized investment gains, if any, are reflected as part of the change in net unrealized appreciation (depreciation) on investments in the Statement of Operations. Transaction-based charges are generally assessed as a percentage of the transaction amount.
(D) Dividends and Distributions to Shareholders. Dividends and distributions are recorded on the ex-dividend date. The Portfolio intends to declare and pay dividends from net investment income and distributions from net realized capital and currency gains, if any, at least annually. Unless a shareholder elects otherwise, all dividends and distributions are reinvested at NAV in the same class of shares of the Portfolio. Dividends and distributions to shareholders are determined in accordance with federal income tax regulations and may differ from determinations using GAAP.
| 32 | MainStay VP MacKay Strategic Bond Portfolio |
(E) Security Transactions and Investment Income. The Portfolio records security transactions on the trade date. Realized gains and losses on security transactions are determined using the identified cost method. Dividend income is recognized on the ex-dividend date, net of any foreign tax withheld at the source, and interest income is accrued as earned using the effective interest rate method and includes any realized gains and losses from repayments of principal on mortgage-backed securities. Discounts and premiums on securities purchased for the Portfolio are accreted and amortized, respectively, on the effective interest rate method.
Investment income and realized and unrealized gains and losses on investments of the Portfolio are allocated pro rata to the separate classes of shares based upon their relative net assets on the date the income is earned or realized and unrealized gains and losses are incurred.
The Portfolio may place a debt security on non-accrual status and reduce related interest income by ceasing current accruals and writing off all or a portion of any interest receivables when the collection of all or a portion of such interest has become doubtful. A debt security is removed from non-accrual status when the issuer resumes interest payments or when collectability of interest is reasonably assured.
(F) Expenses. Expenses of the Fund are allocated to the individual Portfolios in proportion to the net assets of the respective Portfolios when the expenses are incurred, except where direct allocations of expenses can be made. Expenses (other than fees incurred under the distribution and service plans, further discussed in Note 3(B), which are charged directly to the Service Class shares) are allocated to separate classes of shares pro rata based upon their relative net assets on the date the expenses are incurred. The expenses borne by the Portfolio, including those of related parties to the Portfolio, are shown in the Statement of Operations.
Additionally, the Portfolio may invest in mutual funds, which are subject to management fees and other fees that may cause the costs of investing in mutual funds to be greater than the costs of owning the underlying securities directly. These indirect expenses of mutual funds are not included in the amounts shown as expenses in the Statement of Operations or in the expense ratios included in the Financial Highlights.
(G) Use of Estimates. In preparing financial statements in conformity with GAAP, the Manager makes estimates and assumptions that affect the reported amounts and disclosures in the financial statements. Actual results could differ from those estimates and assumptions.
(H) Futures Contracts. A futures contract is an agreement to purchase or sell a specified quantity of an underlying instrument at a specified future date and price, or to make or receive a cash payment based on the value of a financial instrument (e.g., foreign currency, interest rate, security or securities index). The Portfolio is subject to risks such as market price risk and/or interest rate risk in the normal course of investing in these contracts. Upon entering into a futures contract, the Portfolio is required to pledge to the broker or futures commission merchant an amount of cash and/or U.S. government securities equal to
a certain percentage of the collateral amount, known as the “initial margin.” During the period the futures contract is open, changes in the value of the contract are recognized as unrealized appreciation or depreciation by marking to market such contract on a daily basis to reflect the market value of the contract at the end of each day’s trading. The Portfolio agrees to receive from or pay to the broker or futures commission merchant an amount of cash equal to the daily fluctuation in the value of the contract. Such receipts or payments are known as “variation margin.” When the futures contract is closed, the Portfolio records a realized gain or loss equal to the difference between the proceeds from (or cost of) the closing transaction and the Portfolio's basis in the contract.
The use of futures contracts involves, to varying degrees, elements of market risk in excess of the amount recognized in the Statement of Assets and Liabilities. The contract or notional amounts and variation margin reflect the extent of the Portfolio's involvement in open futures positions. There are several risks associated with the use of futures contracts as hedging techniques. There can be no assurance that a liquid market will exist at the time when the Portfolio seeks to close out a futures contract. If no liquid market exists, the Portfolio would remain obligated to meet margin requirements until the position is closed. Futures contracts may involve a small initial investment relative to the risk assumed, which could result in losses greater than if the Portfolio did not invest in futures contracts. Futures contracts may be more volatile than direct investments in the instrument underlying the futures and may not correlate to the underlying instrument, causing a given hedge not to achieve its objectives. The Portfolio's activities in futures contracts have minimal counterparty risk as they are conducted through regulated exchanges that guarantee the futures against default by the counterparty. In the event of a bankruptcy or insolvency of a futures commission merchant that holds margin on behalf of the Portfolio, the Portfolio may not be entitled to the return of the entire margin owed to the Portfolio, potentially resulting in a loss. The Portfolio may invest in futures contracts to seek enhanced returns or to reduce the risk of loss by hedging certain of its holdings. The Portfolio's investment in futures contracts and other derivatives may increase the volatility of the Portfolio's NAVs and may result in a loss to the Portfolio. Open futures contracts as of June 30, 2021 are shown in the Portfolio of Investments.
(I) Loan Assignments, Participations and Commitments. The Portfolio may invest in loan assignments and participations ("loans"). Commitments are agreements to make money available to a borrower in a specified amount, at a specified rate and within a specified time. The Portfolio records an investment when the borrower withdraws money on a commitment or when a funded loan is purchased (trade date) and records interest as earned. These loans pay interest at rates that are periodically reset by reference to a base lending rate plus a spread. These base lending rates are generally the prime rate offered by a designated U.S. bank or the London Interbank Offered Rate ("LIBOR").
The loans in which the Portfolio may invest are generally readily marketable, but may be subject to some restrictions on resale. For
Notes to Financial Statements (Unaudited) (continued)
example, the Portfolio may be contractually obligated to receive approval from the agent bank and/or borrower prior to the sale of these investments. If the Portfolio purchases an assignment from a lender, the Portfolio will generally have direct contractual rights against the borrower in favor of the lender. If the Portfolio purchases a participation interest either from a lender or a participant, the Portfolio typically will have established a direct contractual relationship with the seller of the participation interest, but not with the borrower. Consequently, the Portfolio is subject to the credit risk of the lender or participant who sold the participation interest to the Portfolio, in addition to the usual credit risk of the borrower. In the event that the borrower, selling participant or intermediate participants become insolvent or enter into bankruptcy, the Portfolio may incur certain costs and delays in realizing payment, or may suffer a loss of principal and/or interest.
Unfunded commitments represent the remaining obligation of the Portfolio to the borrower. At any point in time, up to the maturity date of the issue, the borrower may demand the unfunded portion. Unfunded amounts, if any, are marked to market and any unrealized gains or losses are recorded in the Statement of Assets and Liabilities. As of June 30, 2021, the Portfolio did not hold any unfunded commitments.
(J) Swap Contracts. The Portfolio may enter into credit default, interest rate, equity, index and currency exchange rate swap contracts (“swaps”). In a typical swap transaction, two parties agree to exchange the future returns (or differentials in rates of future returns) earned or realized at periodic intervals on a particular investment or instrument based on a notional principal amount. Generally, the Portfolio will enter into a swap on a net basis, which means that the two payment streams under the swap are netted, with the Portfolio receiving or paying (as the case may be) only the net amount of the two payment streams. Therefore, the Portfolio's current obligation under a swap generally will be equal to the net amount to be paid or received under the swap, based on the relative value of notional positions attributable to each counterparty to the swap. The payments may be adjusted for transaction costs, interest payments, the amount of interest paid on the investment or instrument or other factors. Collateral, in the form of cash or securities, may be required to be held in segregated accounts with the custodian bank or broker in accordance with the terms of the swap. Swap agreements are privately negotiated in the over the counter (“OTC”) market and may be executed in a multilateral or other trade facilities platform, such as a registered commodities exchange (“centrally cleared swaps”).
Certain standardized swaps, including certain credit default and interest rate swaps, are subject to mandatory clearing and exchange-trading, and more types of standardized swaps are expected to be subject to mandatory clearing and exchange-trading in the future. The counterparty risk for exchange-traded and cleared derivatives is expected to be generally lower than for uncleared derivatives, but cleared contracts are not risk-free. In a cleared derivative transaction, the Portfolio typically enters into the transaction with a financial institution counterparty, and performance of the transaction is effectively guaranteed by a central clearinghouse, thereby reducing or eliminating the Portfolio's exposure to
the credit risk of its original counterparty. The Portfolio will be required to post specified levels of margin with the clearinghouse or at the instruction of the clearinghouse; the margin required by a clearinghouse may be greater than the margin the Portfolio would be required to post in an uncleared transaction. As of June 30, 2021, all swap positions outstanding are shown in the Portfolio of Investments.
Swaps are marked to market daily based upon quotations from pricing agents, brokers, or market makers and the change in value, if any, is recorded as unrealized appreciation or depreciation. Any payments made or received upon entering into a swap would be amortized or accreted over the life of the swap and recorded as a realized gain or loss. Early termination of a swap is recorded as a realized gain or loss. Daily changes in valuation of centrally cleared swaps, if any, are recorded as a receivable or payable for the change in value as appropriate on the Statement of Assets and Liabilities.
The Portfolio bears the risk of loss of the amount expected to be received under a swap in the event of the default or bankruptcy of the swap counterparty. The Portfolio may be able to eliminate its exposure under a swap either by assignment or other disposition, or by entering into an offsetting swap with the same party or a similar credit-worthy party. Swaps are not actively traded on financial markets. Entering into swaps involves elements of credit, market, and documentation risk in excess of the amounts recognized on the Statement of Assets and Liabilities. Such risks involve the possibilities that there will be no liquid market for these swaps, that the counterparty to the swaps may default on its obligation to perform or disagree as to the meaning of the contractual terms in the swaps and that there may be unfavorable changes in interest rates, the price of the index or the security underlying these transactions.
Interest Rate Swaps : An interest rate swap is an agreement between two parties where one stream of future interest payments is exchanged for another based on a specified principal amount. Interest rate swaps often exchange a fixed payment for a floating payment that is linked to an interest rate (most often LIBOR). The Portfolio will typically use interest rate swaps to limit, or manage, its exposure to fluctuations in interest rates, or to obtain a marginally lower interest rate than it would have been able to get without the swap.
(K) Foreign Currency Forward Contracts. The Portfolio may enter into foreign currency forward contracts, which are agreements to buy or sell foreign currencies on a specified future date at a specified rate. The Portfolio is subject to foreign currency exchange rate risk in the normal course of investing in these transactions. During the period the forward contract is open, changes in the value of the contract are recognized as unrealized appreciation or depreciation by marking to market such contract on a daily basis to reflect the market value of the contract at the end of each day’s trading. Cash movement occurs on the settlement date. When the forward contract is closed, the Portfolio records a realized gain or loss equal to the difference between the proceeds from (or cost of) the closing transaction and the Portfolio's basis in the contract. The Portfolio may purchase and sell foreign currency forward contracts for purposes of seeking to enhance portfolio returns and manage portfolio risk more
| 34 | MainStay VP MacKay Strategic Bond Portfolio |
efficiently. Foreign currency forward contracts may also be used to gain exposure to a particular currency or to hedge against the risk of loss due to changing currency exchange rates. Foreign currency forward contracts to purchase or sell a foreign currency may also be used in anticipation of future purchases or sales of securities denominated in foreign currency, even if the specific investments have not yet been selected.
The use of foreign currency forward contracts involves, to varying degrees, elements of risk in excess of the amount recognized in the Statement of Assets and Liabilities, including counterparty risk, market risk and illiquidity risk. Counterparty risk is heightened for these instruments because foreign currency forward contracts are not exchange-traded and therefore no clearinghouse or exchange stands ready to meet the obligations under such contracts. Thus, the Portfolio faces the risk that its counterparties under such contracts may not perform their obligations. Market risk is the risk that the value of a foreign currency forward contract will depreciate due to unfavorable changes in exchange rates. Illiquidity risk arises because the secondary market for foreign currency forward contracts may have less liquidity relative to markets for other securities and financial instruments. Risks also arise from the possible movements in the foreign exchange rates underlying these instruments. While the Portfolio may enter into forward contracts to reduce currency exchange risks, changes in currency exchange rates may result in poorer overall performance for the Portfolio than if it had not engaged in such transactions. Exchange rate movements can be large, depending on the currency, and can last for extended periods of time, affecting the value of the Portfolio's assets. Moreover, there may be an imperfect correlation between the Portfolio's holdings of securities denominated in a particular currency and forward contracts entered into by the Portfolio. Such imperfect correlation may prevent the Portfolio from achieving the intended hedge or expose the Portfolio to the risk of currency exchange loss. The unrealized appreciation (depreciation) on forward contracts also reflects the Portfolio's exposure at the valuation date to credit loss in the event of a counterparty’s failure to perform its obligations. Open foreign currency forward contracts as of June 30, 2021, are shown in the Portfolio of Investments.
(L) Foreign Currency Transactions. The Portfolio's books and records are maintained in U.S. dollars. Prices of securities denominated in foreign currency amounts are translated into U.S. dollars at the mean between the buying and selling rates last quoted by any major U.S. bank at the following dates:
(i) market value of investment securities, other assets and liabilities— at the valuation date; and
(ii) purchases and sales of investment securities, income and expenses—at the date of such transactions.
The assets and liabilities that are denominated in foreign currency amounts are presented at the exchange rates and market values at the close of the period. The realized and unrealized changes in net assets arising from fluctuations in exchange rates and market prices of securities are not separately presented.
Net realized gain (loss) on foreign currency transactions represents net currency gains or losses realized as a result of differences between the amounts of securities sale proceeds or purchase cost, dividends, interest and withholding taxes as recorded on the Portfolio's books, and the U.S. dollar equivalent amount actually received or paid. Net currency gains or losses from valuing such foreign currency denominated assets and liabilities, other than investments at valuation date exchange rates, are reflected in unrealized foreign exchange gains or losses.
(M) Securities Sold Short. The Portfolio may engage in sales of securities it does not own ("short sales") as part of its investment strategies. When the Portfolio enters into a short sale, it must segregate or maintain with a broker the cash proceeds from the security sold short or other securities as collateral for its obligation to deliver the security upon conclusion of the sale. During the period a short position is open, depending on the nature and type of security, a short position is reflected as a liability and is marked to market in accordance with the valuation methodologies previously detailed (See Note 2(A)). Liabilities for securities sold short are closed out by purchasing the applicable securities for delivery to the counterparty broker. A gain, limited to the price at which the Portfolio sold the security short, or a loss, unlimited as to dollar amount, will be recognized upon termination of a short sale if the market price on the date the short position is closed out is less or greater, respectively, than the proceeds originally received. Any such gain or loss may be offset, completely or in part, by the change in the value of the hedged investments. Interest on short positions held is accrued daily, while dividends declared on short positions existing on the record date are recorded on the ex-dividend date as a dividend expense in the Statement of Operations. Broker fees and other expenses related to securities sold short are disclosed in the Statement of Operations. Short sales involve risk of loss in excess of the related amounts reflected in the Statement of Assets and Liabilities. For the six-month period ended June 30, 2021, the Portfolio did not enter into any securities sold short.
(N) Securities Lending. In order to realize additional income, the Portfolio may engage in securities lending, subject to the limitations set forth in the 1940 Act and relevant guidance by the staff of the Securities and Exchange Commission (“SEC”). If the Portfolio engages in securities lending, the Portfolio will lend through its custodian, JPMorgan Chase Bank, N.A., ("JPMorgan"), acting as securities lending agent on behalf of the Portfolio. Under the current arrangement, JPMorgan will manage the Portfolio's collateral in accordance with the securities lending agency agreement between the Portfolio and JPMorgan, and indemnify the Portfolio against counterparty risk. The loans will be collateralized by cash (which may be invested in a money market fund) and/or non-cash collateral (which may include U.S. Treasury securities and/or U.S. government agency securities issued or guaranteed by the United States government or its agencies or instrumentalities) at least equal at all times to the market value of the securities loaned. The Portfolio bears the risk of delay in recovery of, or loss of rights in, the securities loaned. The Portfolio may also record a realized gain or loss on securities deemed sold due to a borrower’s inability to return securities on loan. The Portfolio bears the risk of any loss on investment of cash collateral. The Portfolio
Notes to Financial Statements (Unaudited) (continued)
will receive compensation for lending its securities in the form of fees or it will retain a portion of interest earned on the investment of any cash collateral. The Portfolio will also continue to receive interest and dividends on the securities loaned and any gain or loss in the market price of the securities loaned that may occur during the term of the loan will be for the account of the Portfolio. Income earned from securities lending activities, if any, is reflected in the Statement of Operations. Securities on loan as of June 30, 2021, are shown in the Portfolio of Investments.
Prior to February 22, 2021, these services were provided by State Street Bank and Trust Company (“State Street”).
(O) Dollar Rolls. The Portfolio may enter into dollar roll transactions in which it sells mortgage-backed securities ("MBS") from its portfolio to a counterparty from whom it simultaneously agrees to buy a similar security on a delayed delivery basis. The Portfolio generally transfers MBS where the MBS are "to be announced," therefore, the Portfolio accounts for these transactions as purchases and sales.
When accounted for as purchase and sales, the securities sold in connection with the dollar rolls are removed from the portfolio and a realized gain or loss is recognized. The securities the Portfolio has agreed to acquire are included at market value in the Portfolio of Investments and liabilities for such purchase commitments are included as payables for investments purchased. During the roll period, the Portfolio foregoes principal and interest paid on the securities. The Portfolio is compensated by the difference between the current sales price and the forward price for the future as well as by the earnings on the cash proceeds of the initial sale. Dollar rolls may be renewed without physical delivery of the securities subject to the contract. The Portfolio maintains liquid assets from its portfolio having a value not less than the repurchase price, including accrued interest. Dollar roll transactions involve certain risks, including the risk that the securities returned to the Portfolio at the end of the roll period, while substantially similar, could be inferior to what was initially sold to the counterparty.
(P) Delayed Delivery Transactions. The Portfolio may purchase or sell securities on a delayed delivery basis. These transactions involve a commitment by the Portfolio to purchase or sell securities for a predetermined price or yield, with payment and delivery taking place beyond the customary settlement period. When delayed delivery purchases are outstanding, the Portfolio will designate liquid assets in an amount sufficient to meet the purchase price. When purchasing a security on a delayed delivery basis, the Portfolio assumes the rights and risks of ownership of the security, including the risk of price and yield fluctuations, and takes such fluctuations into account when determining its NAV. The Portfolio may dispose of or renegotiate a delayed delivery transaction after it is entered into, and may sell delayed delivery securities before they are delivered, which may result in a realized gain or loss. When the Portfolio has sold a security it owns on a delayed delivery basis, the Portfolio does not participate in future gains and losses with respect to the security. As of June 30, 2021, delayed delivery transactions are shown in the Portfolio of Investments.
(Q) Debt and Foreign Securities Risk. The ability of issuers of debt securities held by the Portfolio to meet their obligations may be affected by, among other things, economic or political developments in a specific country, industry or region. Debt securities are also subject to the risks associated with changes in interest rates. The Portfolio primarily invests in high yield debt securities (commonly referred to as “junk bonds”), which are considered speculative because they present a greater risk of loss, including default, than higher rated debt securities. These securities pay investors a premium—a higher interest rate or yield than investment grade debt securities—because of the increased risk of loss. These securities can also be subject to greater price volatility. In times of unusual or adverse market, economic or political conditions, these securities may experience higher than normal default rates.
Investments in the Portfolio are not guaranteed, even though some of the Portfolio’s underlying investments are guaranteed by the U.S. government or its agencies or instrumentalities. The principal risk of mortgage-related and asset-backed securities is that the underlying debt may be prepaid ahead of schedule, if interest rates fall, thereby reducing the value of the Portfolio’s investment. If interest rates rise, less of the debt may be prepaid and the Portfolio may lose money because the Portfolio may be unable to invest in higher yielding assets. The Portfolio is subject to interest-rate risk and can lose principal value when interest rates rise. Bonds are also subject to credit risk, in which the bond issuer may fail to pay interest and principal in a timely manner.
The Portfolio may invest in loans which are usually rated below investment grade and are generally considered speculative because they present a greater risk of loss, including default, than higher rated debt securities. These investments pay investors a higher interest rate than investment grade debt securities because of the increased risk of loss. Although certain loans are collateralized, there is no guarantee that the value of the collateral will be sufficient to repay the loan. In a recession or serious credit event, the value of these investments could decline significantly. As a result of these and other events, the Portfolio’s NAVs could go down and you could lose money.
In addition, loans generally are subject to the extended settlement periods that may be longer than seven days. As a result, the Portfolio may be adversely affected by selling other investments at an unfavorable time and/or under unfavorable conditions or engaging in borrowing trans-actions, such as borrowing against its credit facility, to raise cash to meet redemption obligations or pursue other investment opportunities.
In certain circumstances, loans may not be deemed to be securities. As a result, the Portfolio may not have the protection of anti-fraud provisions of the federal securities laws. In such cases, the Portfolio generally must rely on the contractual provisions in the loan agreement and common-law fraud protections under applicable state law.
The ability of issuers of debt securities held by the Portfolio to meet their obligations may be affected by, among other things, economic or political developments in a specific country, industry or region. Debt securities are also subject to the risks associated with changes in interest rates. The
| 36 | MainStay VP MacKay Strategic Bond Portfolio |
Portfolio may invest in foreign securities, which carry certain risks that are in addition to the usual risks inherent in domestic securities. These risks include those resulting from currency fluctuations, future adverse political or economic developments and possible imposition of currency exchange blockages or other foreign governmental laws or restrictions. These risks are likely to be greater in emerging markets than in developed markets. The ability of issuers of debt securities held by the Portfolio to meet their obligations may be affected by, among other things, economic or political developments in a specific country, industry or region.
(R) Counterparty Credit Risk. In order to better define its contractual rights and to secure rights that will help the Portfolio mitigate its counterparty risk, the Portfolio may enter into an International Swaps and Derivatives Association, Inc. Master Agreement (“ISDA Master Agreement”) or similar agreement with its counterparties. An ISDA Master Agreement is a bilateral agreement between the Portfolio and a counterparty that governs certain OTC derivatives and typically contains collateral posting terms and netting provisions. Under an ISDA Master Agreement, the Portfolio may, under certain circumstances, offset with the counterparty certain derivative financial instruments’ payables and/ or receivables with collateral held and/or posted and create one single net payment. The provisions of the ISDA Master Agreement typically permit a single net payment in the event of default including the bankruptcy or insolvency of the counterparty. Bankruptcy or insolvency laws of a particular jurisdiction may restrict or prohibit the right of offset in bankruptcy, insolvency or other events. In addition, certain ISDA Master Agreements may contain provisions for early termination of OTC derivative transactions in the event the net assets of the Portfolio decline below specific levels or if the Portfolio fails to meet the terms of its ISDA Master Agreements. The result would cause the Portfolio to accelerate payment of any net liability owed to the counterparty.
For financial reporting purposes, the Portfolio does not offset derivative assets and derivative liabilities that are subject to netting arrangements, if any, in the Statement of Assets and Liabilities.
(S) LIBOR Replacement Risk. The Portfolio may invest in certain debt securities, derivatives or other financial instruments that utilize the London Interbank Offered Rate ("LIBOR"), as a “benchmark” or “reference rate” for various interest rate calculations. The United Kingdom Financial Conduct Authority, which regulates LIBOR, announced that after 2021 it will cease its active encouragement of banks to provide the quotations needed to sustain LIBOR. However, it is possible that certain LIBOR tenors may continue beyond 2021 and the most widely used LIBOR tenors may continue until mid-2023. As a result, it is anticipated that LIBOR will be discontinued or will no longer be sufficiently robust to be representative of its underlying market around that time. Although financial regulators and industry working groups have suggested alternative reference rates, such as European Interbank Offer Rate (“EURIBOR”), Sterling Overnight Interbank Average Rate (“SONIA”) and Secured Overnight Financing Rate (“SOFR”), there are challenges to converting certain contracts and transactions to a new benchmark and neither the full effects of the transition process nor its ultimate outcome is known. New York Life
Investments is currently working to assess exposure and will modify contracts as necessary.
The elimination of LIBOR or changes to other reference rates or any other changes or reforms to the determination or supervision of reference rates could have an adverse impact on the market for, or value of, any securities or payments linked to those reference rates, which may adversely affect the Portfolio's performance and/or net asset value. Uncertainty and risk also remain regarding the willingness and ability of issuers and lenders to include revised provisions in new and existing contracts or instruments. Consequently, the transition away from LIBOR to other reference rates may lead to increased volatility and illiquidity in markets that are tied to LIBOR, fluctuations in values of LIBOR-related investments or investments in issuers that utilize LIBOR, increased difficulty in borrowing or refinancing and diminished effectiveness of hedging strategies, adversely affecting the Portfolio's performance. Furthermore, the risks associated with the expected discontinuation of LIBOR and transition may be exacerbated if the work necessary to effect an orderly transition to an alternative reference rate is not completed in a timely manner. Because the usefulness of LIBOR as a benchmark could deteriorate during the transition period, these effects could occur prior to the end of 2021 with respect to certain LIBOR tenors or mid-2023 for the remaining LIBOR tenors.
(T) Indemnifications. Under the Fund’s organizational documents, its officers and trustees are indemnified against certain liabilities that may arise out of performance of their duties to the Fund. Additionally, in the normal course of business, the Portfolio enters into contracts with third-party service providers that contain a variety of representations and warranties and that may provide general indemnifications. The Portfolio's maximum exposure under these arrangements is unknown, as this would involve future claims that may be made against the Portfolio that have not yet occurred. The Manager believes that the risk of loss in connection with these potential indemnification obligations is remote. However, there can be no assurance that material liabilities related to such obligations will not arise in the future, which could adversely impact the Portfolio.
(U) Quantitative Disclosure of Derivative Holdings. The following tables show additional disclosures related to the Portfolio's derivative and hedging activities, including how such activities are accounted for and their effect on the Portfolio's financial positions, performance and cash flows. These derivatives are not accounted for as hedging instruments.
The Portfolio entered into futures contracts in order to help manage the duration and yield curve of the portfolio while minimizing the exposure to wider bid/ask spreads in traditional bonds.
The Portfolio also entered into interest rate swaps to hedge the potential risk of rising short term interest rates.
The Portfolio entered into foreign currency forward contracts to hedge against the risk of loss due to changing currency exchange rates.
Notes to Financial Statements (Unaudited) (continued)
Fair value of derivative instruments as of June 30, 2021:
| Asset Derivatives | Foreign
Exchange
Contracts
Risk | Interest
Rate
Contracts
Risk | Total |
| Futures Contracts - Net Assets—Net unrealized appreciation on futures contracts (a) | $ — | $308,982 | $308,982 |
| Forward Contracts - Unrealized appreciation on foreign currency forward contracts | 57,430 | — | 57,430 |
| Total Fair Value | $57,430 | $308,982 | $366,412 |
| (a) | Includes cumulative appreciation (depreciation) of futures contracts as reported in the Portfolio of Investments. Only current day’s variation margin is reported within the Statement of Assets and Liabilities. |
| Liability Derivatives | Foreign
Exchange
Contracts
Risk | Interest
Rate
Contracts
Risk | Total |
| Futures Contracts - Net Assets—Net unrealized depreciation on futures contracts (a) | $ — | $(1,221,912) | $(1,221,912) |
| Centrally Cleared Swap Contracts - Net Assets—Net unrealized depreciation on swap contracts (b) | — | (4,333,980) | (4,333,980) |
| Forward Contracts - Unrealized depreciation on foreign currency forward contracts | (42,366) | — | (42,366) |
| Total Fair Value | $(42,366) | $(5,555,892) | $(5,598,258) |
| (a) | Includes cumulative appreciation (depreciation) of futures contracts as reported in the Portfolio of Investments. Only current day’s variation margin is reported within the Statement of Assets and Liabilities. |
| (b) | Includes cumulative appreciation (depreciation) of centrally cleared swap agreements as reported in the Portfolio of Investments. Only the current day’s variation margin is reported within the Statement of Assets and Liabilities. |
The effect of derivative instruments on the Statement of Operations for the six-month period ended June 30, 2021:
| Net Realized Gain (Loss) from: | Foreign
Exchange
Contracts
Risk | Interest
Rate
Contracts
Risk | Total |
| Futures Contracts | $ — | $ 7,849,411 | $ 7,849,411 |
| Swap Contracts | — | (1,303,362) | (1,303,362) |
| Forward Contracts | (96,029) | — | (96,029) |
| Total Net Realized Gain (Loss) | $(96,029) | $ 6,546,049 | $ 6,450,020 |
| Net Change in Unrealized Appreciation (Depreciation) | Foreign
Exchange
Contracts
Risk | Interest
Rate
Contracts
Risk | Total |
| Futures Contracts | $ — | $(1,191,205) | $(1,191,205) |
| Swap Contracts | — | 1,412,191 | 1,412,191 |
| Forward Contracts | 240,842 | — | 240,842 |
| Total Net Change in Unrealized Appreciation (Depreciation) | $240,842 | $ 220,986 | $ 461,828 |
| Average Notional Amount | Total |
| Futures Contracts Long | $ 64,737,294 |
| Futures Contracts Short | $(158,474,025) |
| Swap Contracts Long | $ 100,000,000 |
| Forward Contracts Long (a) | $ 4,210,953 |
| Forward Contracts Short | $ (7,501,775) |
| (a) | Positions were open four months during the reporting period. |
Note 3–Fees and Related Party Transactions
(A) Manager and Subadvisor. New York Life Investments, a registered investment adviser and an indirect, wholly-owned subsidiary of New York Life, serves as the Portfolio's Manager, pursuant to an Amended and Restated Management Agreement ("Management Agreement"). The Manager provides offices, conducts clerical, recordkeeping and bookkeeping services and keeps most of the financial and accounting records required to be maintained by the Portfolio. Except for the portion of salaries and expenses that are the responsibility of the Portfolio, the Manager pays the salaries and expenses of all personnel affiliated with the Portfolio and certain operational expenses of the Portfolio. The Portfolio reimburses New York Life Investments in an amount equal to the portion of the compensation of the Chief Compliance Officer attributable to the Portfolio. MacKay Shields LLC ("MacKay Shields" or the "Subadvisor"), a registered investment adviser and an indirect, wholly-owned subsidiary of New York Life, serves as Subadvisor to the Portfolio and is responsible for the day-to-day portfolio management of the Portfolio. Pursuant to the terms of an Amended and Restated Subadvisory Agreement ("Subadvisory Agreement") between New York Life Investments and MacKay Shields, New York Life Investments pays for the services of the Subadvisor.
Pursuant to the Management Agreement, the Fund pays the Manager, on behalf of the Portfolio, a monthly fee for the services performed and the facilities furnished at an annual rate of the Portfolio's average daily net assets as follows: 0.60% up to $500 million; 0.55% from $500 million to $1 billion; 0.50% from $1 billion to $5 billion; and 0.475% in excess of $5 billion. During the six-month period ended June 30, 2021, the effective management fee rate was 0.58%.
During the six-month period ended June 30, 2021, New York Life Investments earned fees from the Portfolio in the amount of $2,838,009 and paid the Subadvisor fees in the amount of $1,418,994.
| 38 | MainStay VP MacKay Strategic Bond Portfolio |
JPMorgan provides sub-administration and sub-accounting services to the Portfolio pursuant to an agreement with New York Life Investments. These services include calculating the daily NAVs of the Portfolio, maintaining the general ledger and sub-ledger accounts for the calculation of the Portfolio's NAVs, and assisting New York Life Investments in conducting various aspects of the Portfolio's administrative operations. For providing these services to the Portfolio, JPMorgan is compensated by New York Life Investments.
Prior to February 22, 2021, these services were provided by State Street.
Pursuant to an agreement between the Fund and New York Life Investments, New York Life Investments is responsible for providing or procuring certain regulatory reporting services for the Portfolio. The Portfolio will reimburse New York Life Investments for the actual costs incurred by New York Life Investments in connection with providing or procuring these services for the Portfolio.
(B) Distribution and Service Fees. The Fund, on behalf of the Portfolio, has entered into a distribution agreement with NYLIFE Distributors LLC (the “Distributor”), an affiliate of New York Life Investments. The Portfolio has adopted a distribution plan (the “Plan”) in accordance with the provisions of Rule 12b-1 under the 1940 Act. Under the Plan, the Distributor has agreed to provide, through its affiliates or independent third parties, various distribution-related, shareholder and administrative support services to the Service Class shareholders. For its services, the Distributor is entitled to a combined distribution and service fee accrued daily and paid monthly at an annual rate of 0.25% of the average daily net assets attributable to the Service Class shares of the Portfolio.
(C) Investments in Affiliates (in 000’s). During the six-month period ended June 30, 2021, purchases and sales transactions, income earned from investments and shares held of investment companies managed by New York Life Investments or its affiliates were as follows:
| Affiliated Investment Companies | Value,
Beginning
of Period | Purchases
at Cost | Proceeds
from
Sales | Net
Realized
Gain/(Loss)
on Sales | Change in
Unrealized
Appreciation/
(Depreciation) | Value,
End of
Period | Dividend
Income | Other
Distributions | Shares
End of
Period |
| MainStay U.S. Government Liquidity Fund | $ 63,644 | $ 244,682 | $ (206,381) | $ — | $ — | $ 101,945 | $ 3 | $ — | 101,945 |
Note 4-Federal Income Tax
As of June 30, 2021, the cost and unrealized appreciation (depreciation) of the Portfolio’s investment portfolio, including applicable derivative contracts and other financial instruments, as determined on a federal income tax basis, were as follows:
| | Federal Tax
Cost | Gross
Unrealized
Appreciation | Gross
Unrealized
(Depreciation) | Net
Unrealized
Appreciation/
(Depreciation) |
| Investments in Securities | $954,573,291 | $43,994,102 | $(2,954,278) | $41,039,824 |
As of December 31, 2020, for federal income tax purposes, capital loss carryforwards of $62,846,244, as shown in the table below, were available to the extent provided by the regulations to offset future realized gains of the Portfolio. Accordingly, no capital gains distributions are expected to be paid to shareholders until net gains have been realized in excess of such amounts.
Capital Loss
Available Through | Short-Term
Capital Loss
Amounts (000’s) | Long-Term
Capital Loss
Amounts (000’s) |
| Unlimited | $17,257 | $45,589 |
During the year ended December 31, 2020, the tax character of distributions paid as reflected in the Statements of Changes in Net Assets was as follows:
| | 2020 |
| Distributions paid from: | |
| Ordinary Income | $22,903,400 |
| Return of Capital | 537,305 |
| Total | $23,440,705 |
Note 5–Custodian
JPMorgan is the custodian of cash and securities held by the Portfolio. Custodial fees are charged to the Portfolio based on the Portfolio's net assets and/or the market value of securities held by the Portfolio and the number of certain transactions incurred by the Portfolio.
Prior to February 22, 2021, these services were provided by State Street. The services provided by State Street were a direct expense of the Portfolio and are included in the Statement of Operations as Custodian fees which totaled $6,055 for the period January 1, 2021 through February 21, 2021.
Notes to Financial Statements (Unaudited) (continued)
Note 6–Line of Credit
The Portfolio and certain other funds managed by New York Life Investments maintain a line of credit with a syndicate of banks in order to secure a source of funds for temporary purposes to meet unanticipated or excessive redemption requests.
Effective July 27, 2021, under the credit agreement (the “Credit Agreement”), the aggregate commitment amount is $600,000,000 with an additional uncommitted amount of $100,000,000. The commitment fee is an annual rate of 0.15% of the average commitment amount payable quarterly, regardless of usage, to JPMorgan, who serves as the agent to the syndicate. The commitment fee is allocated among the Portfolio and certain other funds managed by New York Life Investments based upon their respective net assets and other factors. Interest on any revolving credit loan is charged based upon the Federal Funds Rate or the one-month London Interbank Offered Rate ("LIBOR"), whichever is higher. The Credit Agreement expires on July 26, 2022, although the Portfolio, certain other funds managed by New York Life Investments and the syndicate of banks may renew the Credit Agreement for an additional year on the same or different terms or enter into a credit agreement with a different syndicate of banks. Prior to July 27, 2021, the aggregate commitment amount and the commitment fee were the same as those under the current Credit Agreement. During the six-month period ended June 30, 2021, there were no borrowings made or outstanding with respect to the Portfolio under the Credit Agreement.
Note 7–Interfund Lending Program
Pursuant to an exemptive order issued by the SEC, the Portfolio, along with certain other funds managed by New York Life Investments, may participate in an interfund lending program. The interfund lending program provides an alternative credit facility that permits the Portfolio and certain other funds managed by New York Life Investments to lend or borrow money for temporary purposes directly to or from one another, subject to the conditions of the exemptive order. During the six-month period ended June 30, 2021, there were no interfund loans made or outstanding with respect to the Portfolio.
Note 8–Purchases and Sales of Securities (in 000’s)
During the six-month period ended June 30, 2021, purchases and sales of U.S. government securities were $46,582 and $34,635, respectively. Purchases and sales of securities, other than U.S. government securities and short-term securities, were $244,553 and $276,927 respectively.
Note 9–Capital Share Transactions
Transactions in capital shares for the six-month period ended June 30, 2021 and the year ended December 31, 2020, were as follows:
| Initial Class | Shares | Amount |
| Period ended June 30, 2021: | | |
| Shares sold | 138,856 | $ 1,427,428 |
| Shares issued to shareholders in reinvestment of distributions | 28,929 | 296,260 |
| Shares redeemed | (31,607) | (324,492) |
| Net increase (decrease) | 136,178 | $ 1,399,196 |
| Year ended December 31, 2020: | | |
| Shares sold | 258,514 | $ 2,583,158 |
| Shares issued to shareholders in reinvestment of distributions | 73,639 | 709,162 |
| Shares redeemed | (3,101,043) | (29,875,147) |
| Net increase (decrease) | (2,768,890) | $ (26,582,827) |
| |
| Service Class | Shares | Amount |
| Period ended June 30, 2021: | | |
| Shares sold | 2,071,902 | $ 21,234,513 |
| Shares issued to shareholders in reinvestment of distributions | 1,081,194 | 11,035,425 |
| Shares redeemed | (3,756,979) | (38,492,636) |
| Net increase (decrease) | (603,883) | $ (6,222,698) |
| Year ended December 31, 2020: | | |
| Shares sold | 7,366,851 | $ 73,206,307 |
| Shares issued to shareholders in reinvestment of distributions | 2,339,365 | 22,731,543 |
| Shares redeemed | (14,977,424) | (143,763,395) |
| Net increase (decrease) | (5,271,208) | $ (47,825,545) |
Note 10–Other Matters
An outbreak of COVID-19, first detected in December 2019, has developed into a global pandemic and has resulted in travel restrictions, closure of international borders, certain businesses and securities markets, restrictions on securities trading activities, prolonged quarantines, supply chain disruptions, and lower consumer demand, as well as general concern and uncertainty. The continued impact of COVID-19 and related new variants is uncertain and could further adversely affect the global economy, national economies, individual issuers and capital markets in unforeseeable ways and result in a substantial and extended economic downturn. Developments that disrupt global economies and financial markets, such as COVID-19, may magnify factors that affect the Portfolio's performance.
Note 11–Subsequent Events
In connection with the preparation of the financial statements of the Portfolio as of and for the six-month period ended June 30, 2021, events and transactions subsequent to June 30, 2021, through the date the financial statements were issued have been evaluated by the Manager for possible adjustment and/or disclosure. No subsequent events requiring financial statement adjustment or disclosure have been identified.
| 40 | MainStay VP MacKay Strategic Bond Portfolio |
Discussion of the Operation and Effectiveness of the Portfolio's Liquidity Risk Management Program (Unaudited)
In compliance with Rule 22e-4 under the Investment Company Act of 1940, as amended (the “Liquidity Rule”), the Portfolio has adopted and implemented a liquidity risk management program (the “Program”), which New York Life Investment Management LLC believes is reasonably designed to assess and manage the Portfolio's liquidity risk (the risk that the Portfolio could not meet requests to redeem shares issued by the Portfolio without significant dilution of remaining investors’ interests in the Portfolio). The Board of Trustees of MainStay VP Funds Trust (the "Board") designated New York Life Investment Management LLC as administrator of the Program (the “Administrator”). The Administrator has established a Liquidity Risk Management Committee to assist the Administrator in the implementation and day-to-day administration of the Program and to otherwise support the Administrator in fulfilling its responsibilities under the Program.
At a meeting of the Board held on March 8, 2021, the Administrator provided the Board with a written report addressing the Program’s operation and assessing its adequacy and effectiveness of implementation for the period from January 1, 2020 through December 31, 2020 (the "Review Period"), as required under the Liquidity Rule. The report noted that the Administrator concluded that (i) the Program operated effectively to assess and manage the Portfolio's liquidity risk, (ii) the Program has been adequately and effectively implemented to monitor and, as applicable, respond to the Portfolio's liquidity developments and (iii) the Portfolio's investment strategy continues to be appropriate for an open-end fund. In addition, the report discussed notable events that impacted liquidity risk during the Review Period, including the COVID-19 pandemic and the resulting economic shutdown.
In accordance with the Program, the Portfolio's liquidity risk is assessed no less frequently than annually taking into consideration certain factors, as applicable, such as (i) investment strategy and liquidity of portfolio investments, (ii) short-term and long-term cash flow projections and (iii) holdings of cash and cash equivalents, as well as borrowing arrangements and other funding sources. Certain factors are considered under both normal and reasonably foreseeable stressed conditions.
Each Portfolio portfolio investment is classified into one of four liquidity categories. The classification is based on a determination of the number of days it is reasonably expected to take to convert the investment into cash, or sell or dispose of the investment, in current market conditions without significantly changing the market value of the investment. The Administrator has delegated liquidity classification determinations to the Portfolio’s subadvisor, subject to appropriate oversight by the Administrator, and classification determinations are made by taking into account the Portfolio's reasonably anticipated trade size, various market, trading and investment-specific considerations, as well as market depth, and, in certain cases, third-party vendor data.
The Liquidity Rule requires portfolios that do not primarily hold assets that are highly liquid investments to adopt a minimum amount of net assets that must be invested in highly liquid investments that are assets (an “HLIM”). In addition, the Liquidity Rule limits a portfolio's investments in illiquid investments. Specifically, the Liquidity Rule prohibits acquisition of illiquid investments if doing so would result in a portfolio holding more than 15% of its net assets in illiquid investments that are assets. The Program includes provisions reasonably designed to determine, periodically review and comply with the HLIM requirement, as applicable, and to comply with the 15% limit on illiquid investments.
There can be no assurance that the Program will achieve its objectives under all circumstances in the future. Please refer to the Portfolio's prospectus for more information regarding the Portfolio's exposure to liquidity risk and other risks to which it may be subject.
Proxy Voting Record
The Portfolio is required to file with the SEC its proxy voting records for the 12-month period ending June 30 on Form N-PX. The Portfolio's most recent Form N-PX or proxy voting record is available free of charge upon request (i) by calling 800-598-2019; (ii) by visiting New York Life Investments’ website at https://www.nylinvestments.com/mainstay/
products-and-performance/mainstay-vp-funds-trust; or (iii) by visiting the SEC’s website at www.sec.gov.
Shareholder Reports and Quarterly Portfolio Disclosure
The Portfolio is required to file its complete schedule of portfolio holdings with the SEC 60 days after its first and third fiscal quarter on Form N-PORT. The Portfolio's holdings report is available free of charge upon request by calling 800-598-2019 or by visiting the SEC’s website at www.sec.gov.
| 42 | MainStay VP MacKay Strategic Bond Portfolio |
MainStay VP Portfolios
MainStay VP offers a wide range of Portfolios. The full array of MainStay VP offerings is listed here, with information about the manager, subadvisors, legal counsel, and independent registered public accounting firm.
Equity
MainStay VP Candriam Emerging Markets Equity Portfolio
MainStay VP Epoch U.S. Equity Yield Portfolio
MainStay VP Fidelity Institutional AM® Utilities Portfolio†
MainStay VP MacKay International Equity Portfolio
MainStay VP MacKay S&P 500 Index Portfolio
MainStay VP Natural Resources Portfolio
MainStay VP Small Cap Growth Portfolio
MainStay VP T. Rowe Price Equity Income Portfolio
MainStay VP Wellington Growth Portfolio
MainStay VP Wellington Mid Cap Portfolio
MainStay VP Wellington Small Cap Portfolio
MainStay VP Wellington U.S. Equity Portfolio
MainStay VP Winslow Large Cap Growth Portfolio
Mixed Asset
MainStay VP Balanced Portfolio
MainStay VP Income Builder Portfolio
MainStay VP Janus Henderson Balanced Portfolio
MainStay VP MacKay Convertible Portfolio
Income
MainStay VP Bond Portfolio
MainStay VP Floating Rate Portfolio
MainStay VP Indexed Bond Portfolio
MainStay VP MacKay Government Portfolio
MainStay VP MacKay High Yield Corporate Bond Portfolio
MainStay VP MacKay Strategic Bond Portfolio
MainStay VP PIMCO Real Return Portfolio
Money Market
MainStay VP U.S. Government Money Market Portfolio
Alternative
MainStay VP CBRE Global Infrastructure Portfolio
MainStay VP IQ Hedge Multi-Strategy Portfolio
Asset Allocation
MainStay VP Conservative Allocation Portfolio
MainStay VP Equity Allocation Portfolio
MainStay VP Growth Allocation Portfolio
MainStay VP Moderate Allocation Portfolio
Manager
New York Life Investment Management LLC
New York, New York
Subadvisors
Brown Advisory LLC
Baltimore, Maryland
Candriam Belgium S.A.*
Brussels, Belgium
CBRE Clarion Securities LLC
Radnor, Pennsylvania
Epoch Investment Partners, Inc.
New York, New York
FIAM LLC
Smithfield, Rhode Island
IndexIQ Advisors LLC*
New York, New York
Janus Capital Management LLC
Denver, Colorado
MacKay Shields LLC*
New York, New York
Mellon Investments Corporation
Boston, Massachusetts
NYL Investors LLC*
New York, New York
Pacific Investment Management Company LLC
Newport Beach, California
Segall Bryant & Hamill, LLC
Chicago, Illinois
T. Rowe Price Associates, Inc.
Baltimore, Maryland
Wellington Management Company LLP
Boston, Massachusetts
Winslow Capital Management, LLC
Minneapolis, Minnesota
Legal Counsel
Dechert LLP
Washington, District of Columbia
Independent Registered Public Accounting Firm
PricewaterhouseCoopers LLP
New York, New York
Distributor
NYLIFE Distributors LLC*
Jersey City, New Jersey
Custodian
JPMorgan Chase Bank, N.A.
New York, New York
Some Portfolios may not be available in all products.
† Fidelity Institutional AM is a registered trade mark of FMR LLC. Used with permission.
* An affiliate of New York Life Investment Management LLC
Not part of the Semiannual Report
2021 Semiannual Report
This report is for the general information of New York Life Variable Annuities and NYLIAC Variable Universal Life Insurance Products policyowners. It must be preceded or accompanied by the appropriate product(s) and funds prospectuses if it is given to anyone who is not an owner of a New York Life variable annuity policy or a NYLIAC Variable Universal Life Insurance Product. This report does not offer for sale or solicit orders to purchase securities.
The performance data quoted in this report represents past performance. Past performance is no guarantee of future results. Due to market volatility and other factors, current performance may be lower or higher than the figures shown. The most recent month-end performance summary for your variable annuity or variable life policy is available by calling 800-598-2019 and is updated periodically on newyorklife.com.
The New York Life Variable Annuities and NYLIAC Variable Universal Life Insurance Products are issued by New York Life Insurance and Annuity Corporation (a Delaware Corporation) and distributed by NYLIFE Distributors LLC (Member FINRA/SIPC).
New York Life Insurance Company
New York Life Insurance and Annuity
Corporation (NYLIAC) (A Delaware Corporation)
51 Madison Avenue, Room 551
New York, NY 10010
newyorklife.com
nylinvestments.com
NYLIFE Distributors LLC, 30 Hudson Street, Jersey City, NJ 07302
New York Life Investment Management LLC is the investment manager to the MainStay VP Funds Trust
©2021 by NYLIFE Distributors LLC. All rights reserved.
You may obtain copies of the Prospectus and the Statement of Additional Information free of charge, upon request, by calling toll-free 800-598-2019 or writing to New York Life Insurance and Annuity Corporation, 51 Madison Avenue, New York, NY 10010.
| Not FDIC Insured | No Bank Guarantee | May Lose Value |
(NYLIAC) NI532
MainStay VP Allocation Portfolios
Message from the President and Semiannual Report
Unaudited | June 30, 2021
| MainStay VP Conservative Allocation Portfolio |
| MainStay VP Moderate Allocation Portfolio |
MainStay VP Growth Allocation Portfolio
(formerly known as MainStay VP Moderate Growth Allocation Portfolio) |
MainStay VP Equity Allocation Portfolio
(formerly known as MainStay VP Growth Allocation Portfolio) |
Sign up for e-delivery of your shareholder reports. For full details on e-delivery, including who can participate and what you can receive via e-delivery,
please log in to newyorklifeinvestments.com/accounts.
| Not FDIC/NCUA Insured | Not a Deposit | May Lose Value | No Bank Guarantee | Not Insured by Any Government Agency |
This page intentionally left blank
Message from the President
The COVID-19 pandemic continued to afflict our personal lives and broad segments of the U.S. and global economy throughout the six-month reporting period ended June 30, 2021. However, with the deployment of multiple vaccines around the world, including three highly effective versions approved for emergency use in the United States, investors began to turn their attention toward the gradual reopening of the economy and the shape the “new normal” would take.
The first half of the reporting period saw increasing inflationary concerns as fiscal stimulus business reopenings drove accelerating economic growth, rising commodity prices and increased consumer spending. However, the U.S. Federal Reserve noted that price increases were likely to prove temporary and made clear their intention to remain accommodative for the foreseeable future. Accordingly, after moving higher in the first quarter of 2021, interest rates declined in the second quarter.
In response to the uncertain inflation outlook, equity market leadership shifted from value in the first quarter of the year to growth in the second quarter. Nevertheless, investor sentiment remained buoyant throughout the reporting period, with all eleven sectors in the S&P 500® Index, a widely regarded benchmark of market performance, producing positive returns. Energy led the market’s rise fueled by rapidly increasing oil and gas prices, followed by financials and real estate, which benefited from rising interest rates and the economic reopening, respectively. Communication services produced the slowest growth, followed by the traditionally defensive utilities and consumer staples
sectors. In the fixed income market, lower-credit-quality issues tended to outperform their higher-grade counterparts, with high-yield corporate bonds generating the strongest performance. Among securitized products, commercial mortgage-backed securities generally produced the strongest returns, followed by mortgage-backed securities and asset-backed securities, while Treasury securities lagged.
Despite the tremendous progress we’ve seen so far this year, the United States and the world continue to face significant pandemic-related challenges. Newer, more contagious variants of COVID-19 threaten the return of restrictions and lockdowns that could stall the economic recovery. At the same time, supply chain shortages have led to rising prices on everything from laptops to autos, stoking fears of uncontrolled inflation despite reassurance from the U.S. Federal Reserve. At New York Life Investments, we recognize that the shape that the “new normal” eventually takes may differ from our expectations. You can depend on us to keep a sharp watch for the unexpected, and to continue to help you find your way through this rapidly evolving investment landscape.
Sincerely,
Kirk C. Lehneis
President
The opinions expressed are as of the date of this report and are subject to change. There is no guarantee that any forecast made will come to pass. This material does not constitute investment advice and is not intended as an endorsement of any specific investment. Past performance is no guarantee of future results.
Not part of the Semiannual Report
Investors should refer to the Portfolio’s Summary Prospectus and/or Prospectus and consider the Portfolio’s investment objectives, strategies, risks, charges and expenses carefully before investing. The Summary Prospectus and/or Prospectus contain this and other information about the Portfolio. You may obtain copies of the Portfolio’s Summary Prospectus and/or the Prospectus and the Statement of Additional Information free of charge, upon request, by calling toll-free 800-598-2019, by writing to New York Life Insurance and Annuity Corporation, 51 Madison Avenue, Room 251, New York, New York 10010 or by sending an email to MainStayShareholdersServices@nylim.com. These documents are also available at nylinvestments.com/vpdocuments. Please read the Portfolio's Summary Prospectus and/or Prospectus carefully before investing. MainStay VP Funds Trust portfolios are separate account options which are purchased through a variable insurance or variable annuity contract.
MainStay VP Conservative Allocation Portfolio
Investment and Performance Comparison (Unaudited)
Performance data quoted represents past performance. Past performance is no guarantee of future results. Because of market volatility and other factors, current performance may be lower or higher than the figures shown. Investment return and principal value will fluctuate, and as a result, when shares are redeemed, they may be worth more or less than their original cost. The performance table and graph do not reflect any deduction of sales charges, mortality and expense charges, contract charges or administrative charges. Please refer to the Performance Summary appropriate for your policy. For performance information current to the most recent month-end, please call 800-598-2019 or visit www.newyorklife.com.
Performance figures may reflect certain fee waivers and/or expense limitations, without which total returns may have been different. For information on current fee waivers and/or expense limitations (if any), please refer to the Notes to Financial Statements.
| Average Annual Total Returns for the Period-Ended June 30, 2021 |
| Class | Inception
Date | Six
Months | One
Year | Five
Years | Ten
Years | Gross
Expense
Ratio1 |
| Initial Class Shares | 2/13/2006 | 4.64% | 14.58% | 7.28% | 6.37% | 0.54% |
| Service Class Shares | 2/13/2006 | 4.51 | 14.29 | 7.02 | 6.11 | 0.79 |
| 1. | The gross expense ratios presented reflect the Portfolio’s “Total Annual Portfolio Operating Expenses” from the most recent Prospectus, as supplemented, and may differ from other expense ratios disclosed in this report. |
| Benchmark Performance | Six
Months | One
Year | Five
Years | Ten
Years |
| S&P 500® Index1 | 15.25% | 40.79% | 17.65% | 14.84% |
| MSCI EAFE® Index (Net)2 | 8.83 | 32.35 | 10.28 | 5.89 |
| Bloomberg Barclays U.S. Aggregate Bond Index3 | -1.60 | -0.33 | 3.03 | 3.39 |
| Conservative Allocation Composite Index4 | 4.30 | 14.12 | 8.26 | 7.34 |
| Morningstar Allocation—30% to 50% Equity Category Average5 | 5.91 | 18.19 | 6.98 | 5.46 |
| 1. | The S&P 500® Index is the Portfolio's primary benchmark. “S&P 500®" is a trademark of The McGraw-Hill Companies, Inc. The S&P 500® Index is widely regarded as the standard index for measuring large-cap U.S. stock market performance. Results assume reinvestment of all dividends and capital gains. An investment cannot be made directly in an index. |
| 2. | The MSCI EAFE® Index (Net) is the Portfolio's secondary benchmark. The MSCI EAFE® Index (Net) consists of international stocks representing the developed world outside of North America. Results assume reinvestment of all dividends and capital gains. An investment cannot be made directly in an index. |
| 3. | The Portfolio has selected the Bloomberg Barclays U.S. Aggregate Bond Index as an additional benchmark. The Bloomberg Barclays U.S. Aggregate Bond Index is a broad-based benchmark that measures the investment grade, U.S. dollar-denominated, fixed-rate taxable bond market, including Treasurys, government-related and corporate securities, mortgage-backed securities (agency fixed-rate and hybrid adjustable rate mortgage passthroughs), asset-backed securities, and commercial mortgage-backed securities. Results assume reinvestment of all dividends and capital gains. An investment cannot be made directly in an index. |
| 4. | The Portfolio has selected the Conservative Allocation Composite Index as an additional benchmark. The Conservative Allocation Composite Index consists of the S&P 500® Index, the MSCI EAFE® Index (Net) and the Bloomberg Barclays U.S. Aggregate Bond Index weighted 30%, 10% and 60%, respectively. Results assume reinvestment of all dividends and capital gains. An investment cannot be made directly in an index. |
| 5. | The Morningstar Allocation – 30% to 50% Equity Category Average is representative of funds that seek to provide both income and capital appreciation by investing in multiple asset classes, including stocks, bonds, and cash. These portfolios are dominated by domestic holdings and have equity exposures between 30% and 50%. Results are based on average total returns of similar funds with all dividends and capital gain distributions reinvested. |
Cost in Dollars of a $1,000 Investment in MainStay VP Conservative Allocation Portfolio (Unaudited)
The example below is intended to describe the fees and expenses borne by shareholders during the six-month period from January 1, 2021 to June 30, 2021, and the impact of those costs on your investment.
Example
As a shareholder of the Portfolio you incur two types of costs: (1) transaction costs, including exchange fees and sales charges (loads) on purchases (as applicable), and (2) ongoing costs, including management fees, distribution and/or service (12b-1) fees, and other Portfolio expenses (as applicable). This example is intended to help you understand your ongoing costs (in dollars) of investing in the Portfolio and to compare these costs with the ongoing costs of investing in other mutual funds. The example is based on an investment of $1,000 made at the beginning of the six-month period and held for the entire period from January 1, 2021 to June 30, 2021. Shares are only sold in connection with variable life and annuity contracts and the example does not reflect any contract level or transactional fees or expenses. If these costs had been included, your costs would have been higher.
This example illustrates your Portfolio’s ongoing costs in two ways:
Actual Expenses
The second and third data columns in the table below provide information about actual account values and actual expenses. You may use the information in these columns, together with the amount you invested, to estimate the expenses that you paid during the six months ended June
30, 2021. Simply divide your account value by $1,000 (for example, an $8,600 account value divided by $1,000 = 8.6), then multiply the result by the number under the heading entitled “Expenses Paid During Period” to estimate the expenses you paid on your account during this period.
Hypothetical Example for Comparison Purposes
The fourth and fifth data columns in the table below provide information about hypothetical account values and hypothetical expenses based on the Portfolio’s actual expense ratio and an assumed rate of return of 5% per year before expenses, which is not the Portfolio’s actual return. The hypothetical account values and expenses may not be used to estimate the actual ending account balances or expenses you paid for the six-month period shown. You may use this information to compare the ongoing costs of investing in the Portfolio with the ongoing costs of investing in other mutual funds. To do so, compare this 5% hypothetical example with the 5% hypothetical examples that appear in the shareholder reports of the other mutual funds.
Please note that the expenses shown in the table are meant to highlight your ongoing costs only and do not reflect any transactional costs, such as exchange fees or sales charges (loads). Therefore, the fourth and fifth data columns of the table are useful in comparing ongoing costs only and will not help you determine the relative total costs of owning different funds. In addition, if these transactional costs were included, your costs would have been higher.
| Share Class | Beginning
Account
Value
1/1/21 | Ending Account
Value (Based
on Actual
Returns and
Expenses)
6/30/21 | Expenses
Paid
During
Period1 | Ending Account
Value (Based
on Hypothetical
5% Annualized
Return and
Actual Expenses)
6/30/21 | Expenses
Paid
During
Period1 | Net Expense
Ratio
During
Period2 |
| Initial Class Shares | $1,000.00 | $1,046.40 | $0.15 | $1,024.65 | $0.15 | 0.03% |
| Service Class Shares | $1,000.00 | $1,045.10 | $1.42 | $1,023.41 | $1.40 | 0.28% |
| 1. | Expenses are equal to the Portfolio’s annualized expense ratio of each class multiplied by the average account value over the period, divided by 365 and multiplied by 181 (to reflect the six-month period). The table above represents the actual expenses incurred during the six-month period. In addition to the fees and expenses which the Portfolio bears directly, it also indirectly bears a pro rata share of the fees and expenses of the underlying Portfolios/Funds in which it invests. Such indirect expenses are not included in the above-reported expense figures. |
| 2. | Expenses are equal to the Portfolio's annualized expense ratio to reflect the six-month period. |
| 6 | MainStay VP Conservative Allocation Portfolio |
Asset Diversification as of June 30, 2021 (Unaudited)
| Equity Funds | 36.4 % |
| Fixed Income Funds | 55.6 |
| Short-Term Investments | 8.1 |
| Other Assets, Less Liabilities | (0.1) |
See Portfolio of Investments beginning on page 11 for specific holdings within these categories. The Portfolio’s holdings are subject to change.
Portfolio Management Discussion and Analysis (Unaudited)
Answers to the questions reflect the views of portfolio managers Jae S. Yoon, CFA, Jonathan Swaney, Poul Kristensen, CFA, and Amit Soni, CFA, of New York Life Investments1, the Portfolio’s Manager.
How did MainStay VP Conservative Allocation Portfolio perform relative to its benchmarks and peers during the six months ended June 30, 2021?
For the six months ended June 30, 2021, MainStay VP Conservative Allocation Portfolio returned 4.64% for Initial Class shares and 4.51% for Service Class shares. Over the same period, both share classes underperformed the 15.25% return of the S&P 500® Index, which is the Portfolio’s primary benchmark, and the 8.83% return of the MSCI EAFE® Index (Net), which is a secondary benchmark of the Portfolio. For the six months ended June 30, 2021, both share classes outperformed the −1.60% return of the Bloomberg Barclays U.S. Aggregate Bond Index and the 4.30% return of the Conservative Allocation Composite Index, which are additional benchmarks of the Portfolio. Over the same period, both share classes underperformed the 5.91% return of the Morningstar Allocation—30% to 50% Equity Category Average.2
What factors affected the Portfolio’s relative performance during the reporting period?
The Portfolio is a “fund of funds,” meaning that it seeks to achieve its investment objective by investing primarily in mutual funds and exchange-traded funds (“ETFs”) managed by New York Life Investments or its affiliates (the “Underlying Portfolios/Funds”). The Underlying Portfolios/Funds may invest in U.S. equities, international equities and fixed-income instruments, making comparisons to any single index generally less suitable than a weighted combination of indices, which is a more useful yardstick by which to measure performance. The most influential factor affecting relative performance for the Portfolio versus the performance of a weighted combination of indices is the net performance of the Underlying Portfolios/Funds relative to their respective benchmarks.
Performance among the Portfolio’s Underlying Portfolio/Fund investments during the reporting period proved mixed. with little positive or negative contribution to active return. Instead, asset class policy was primarily responsible for the Portfolio’s underperformance compared with the internally maintained blend of indices taken into consideration when managing the Portfolio. Three positions stand out, starting with the Portfolio’s non-U.S. equity exposure. Equity markets posted an historic rebound off their March 2020 lows, with U.S. markets leading due to a potent policy mix and ambitious vaccination rollout plans. We expected that stock markets in other nations would follow a similar trajectory as vaccination rates climbed and international economies more fully opened, closing the performance gap with U.S. equities. Accordingly, we increased the Portfolio’s exposure to
non-U.S. markets. However, during the reporting period, foreign markets generally failed to keep pace with U.S. markets, thereby undermining the Portfolio’s relative returns.
Second, the Portfolio maintained lower-than-benchmark exposure to the floating rate loan market. We adopted this position as, in our view, underwriting standards tend to be less rigorous in the loan market today than was the case a few years ago. This deterioration in creditworthiness, coupled with already tight spreads3 and pockets of economic instability, led us to hold underweight exposure to the floating rate loan market. However, during the reporting period, loans performed well amid an ongoing hunt for yield and as investors prepared for tighter monetary policy down the road.
Finally, the Portfolio started the reporting period emphasizing large companies over small, reflecting our distrust of the degree to which small-cap stocks outperformed the broader market in the closing months of 2020. However, small caps continued to lead the market higher well into 2021, creating a headwind to performance. While that trend reversed to a degree during the reporting period, it did not do so until the size bias within the Portfolio was largely eliminated.
During the reporting period, how was the Portfolio’s performance materially affected by investments in derivatives?
Total return swaps were used to express most of the Portfolio’s asset class policy views and can be seen as detracting from performance during the reporting period.
How did you allocate the Portfolio’s assets during the reporting period and why?
The announcements in late 2020 of highly successful clinical trials for both the Moderna and Pfizer vaccines, followed shortly thereafter by granting of emergency use authorization and rapid distribution to the most vulnerable elements of the population, played a significant role in our determination of how best to allocate the Portfolio’s assets. As the vaccines brought the end of pandemic restrictions into view, we adjusted the Portfolio to favor pro-cyclical sectors and businesses in industries we believed likely to benefit most from the reopening of the economy. Similarly, we slid the Portfolio’s holdings a little way down the capitalization spectrum, committing a larger allocation of assets to small- and mid-cap companies likely to fare well in this environment. We also reduced interest rate sensitivity within the bond portion of the Portfolio, anticipating that mounting inflationary pressures would result in higher bond yields. These
| 1. | “New York Life Investments” is a service mark used by New York Life Investment Management Holdings LLC and its subsidiary New York Life Investment Management LLC. |
| 2. | See page 5 for more information on benchmark and peer group returns. |
| 3. | The terms “spread” and “yield spread” may refer to the difference in yield between a security or type of security and comparable U.S. Treasury issues. The terms may also refer to the difference in yield between two specific securities or types of securities at a given time. |
| 8 | MainStay VP Conservative Allocation Portfolio |
adjustments provided a modest tailwind for much of 2021 before undergoing an abrupt and puzzling reversal from mid-May through the end of June, at which time they detracted from Portfolio performance.
How did the Portfolio’s allocations change over the course of the reporting period?
The asset class repositioning noted above was largely implemented using derivatives, specifically total return swaps. These instruments increased the Portfolio’s exposure to small- and mid-cap stocks, non-U.S. markets and a basket of companies specifically leveraged to the reopening of the economy. The same approach was used to reduce the Portfolio’s exposure to large-cap U.S. stocks and a basket of companies identified as having been beneficiaries of lockdown conditions.
We also made a few adjustments at the Underlying Portfolio/Fund level, the most pronounced being a reduction in the Portfolio’s holdings of MainStay VP Indexed Bond Portfolio and MainStay VP Bond Portfolio, with proceeds being redirected to a mix of cash, MainStay VP Floating Rate Portfolio, MainStay Short Term Bond Fund and MainStay MacKay Short Duration High Yield Fund. Our goal was to lessen the Portfolio’s interest rate sensitivity at a time when we believed yields might rise in response to mounting inflationary concerns.
Other notable changes arose from portfolio restructurings as Wellington Management Company was named the new subadvisor on several MainStay products that concurrently underwent name changes. A few funds were also subject to mergers. For example, MainStay MacKay Common Stock Fund was renamed MainStay WMC Enduring Capital Fund when Wellington took the helm in early March, and MainStay Epoch U.S. All Cap Fund was subsequently merged into the renamed fund a short while later, thereby making the Portfolio an investor in MainStay WMC Enduring Capital Fund. Similarly, “new” positions arising from restructurings can be found in MainStay VP Wellington Growth Portfolio, MainStay WMC International Research Equity Fund and MainStay WMC Value Fund, among others.
Which Underlying Equity Portfolios/Funds had the highest total returns during the reporting period, and which Underlying Equity Portfolios/Funds had the lowest total returns?
Of the Underlying Equity Funds held for the entire reporting period, those posting the largest total returns included IQ Chaikin U.S. Small Cap ETF, MainStay WMC Enduring Capital Fund
(encompassing MainStay Epoch U.S. All Cap Fund after the merger cited above) and MainStay VP T. Rowe Price Equity Income Portfolio. The Underlying Equity Funds with the lowest total returns (none generated losses) were MainStay Epoch International Choice Fund, MainStay VP MacKay International Equity Portfolio and IQ Candriam ESG International Equity ETF.
Which Underlying Equity Portfolios/Funds made the strongest positive contributions to the Portfolio’s overall performance, and which Underlying Equity Portfolios/ Funds were the greatest detractors?
Allowing for the size of the allocation, the variation of that allocation across the reporting period and performance during that window of time, the Underlying Equity Funds making the strongest positive contributions to the Fund’s total return included MainStay VP MacKay S&P 500 Index Portfolio, MainStay VP Winslow Large Cap Growth Portfolio and IQ Candriam ESG U.S. Equity ETF. Those detracting most from total returns were MainStay VP Wellington U.S. Equity Portfolio, MainStay Epoch Capital Growth Fund and MainStay Epoch International Choice Fund.
What factors and risks affected the Portfolio’s Underlying Fixed-Income Portfolio/Fund investments during the reporting period?
Long bond yields moved sharply higher in the first quarter of 2021, with the rise presumably linked to investors’ growing awareness of potential inflationary pressures. The increase was partially reversed in the second quarter with two factors at work in our view. First, evidence suggested that the U.S. economy was moving past “peak growth”. Second, commentary from U.S. Federal Reserve officials and the release of the Statement of Economic Projections by the Federal Open Market Committee (FOMC) suggested that the FOMC might be willing to tighten policy sooner than previously assumed. At the same time, credit spreads tightened further, likely due to ample liquidity coupled with strong corporate fundaments.
During the reporting period, which fixed-income market segments were the strongest positive contributors to the Portfolio’s performance and which segments were particularly weak?
As a rule, lower-quality credits (such as speculative-grade bonds and bank loans) and shorter-duration4 assets made the strongest positive contributions to the Portfolio’s performance. (Contributions take weightings and total returns into account.)
| 4. | Duration is a measure of the price sensitivity of a fixed-income investment to changes in interest rates. Duration is expressed as a number of years and is considered a more accurate sensitivity gauge than average maturity. |
Conversely, high-quality, long-maturity bonds gave up a little ground.
Which Underlying Fixed-Income Portfolios/Funds made the strongest positive contributions to the Portfolio’s performance, and which Underlying Fixed-Income Portfolios/Funds were the greatest detractors?
Allowing for the size of the allocation, the variation of that allocation across the reporting period and performance during that window of time, the Underlying Fixed-Income Portfolios/Funds contributing most to the Fund’s return were MainStay MacKay Short Duration High Yield Fund and MainStay VP Floating Rate Portfolio. MainStay VP Indexed Bond Portfolio and MainStay VP Bond Portfolio detracted most significantly from performance.
The opinions expressed are those of the portfolio managers as of the date of this report and are subject to change. There is no guarantee that any forecasts will come to pass. This material does not constitute investment advice and is not intended as an endorsement of any specific investment.
Not all MainStay VP Portfolios and/or share classes are available under all policies.
| 10 | MainStay VP Conservative Allocation Portfolio |
Portfolio of Investments June 30, 2021† (Unaudited)
| | Shares | Value |
| Affiliated Investment Companies 92.0% |
| Equity Funds 36.4% |
| IQ 50 Percent Hedged FTSE International ETF | 555,262 | $ 13,753,840 |
| IQ 500 International ETF | 364,522 | 11,892,348 |
| IQ Candriam ESG International Equity ETF (a) | 409,778 | 12,149,918 |
| IQ Candriam ESG U.S. Equity ETF | 558,538 | 20,552,746 |
| IQ Chaikin U.S. Large Cap ETF | 411,878 | 13,738,397 |
| IQ Chaikin U.S. Small Cap ETF | 164,898 | 5,871,160 |
| MainStay Epoch Capital Growth Fund Class I | 160,673 | 2,561,305 |
| MainStay Epoch International Choice Fund Class I | 168,696 | 7,033,835 |
| MainStay VP Candriam Emerging Markets Equity Portfolio Initial Class | 830,717 | 10,580,923 |
| MainStay VP Epoch U.S. Equity Yield Portfolio Initial Class | 710,000 | 12,192,970 |
| MainStay VP MacKay International Equity Portfolio Initial Class | 270,782 | 5,435,326 |
| MainStay VP MacKay S&P 500 Index Portfolio Initial Class | 321,402 | 26,429,875 |
| MainStay VP Small Cap Growth Portfolio Initial Class | 578,053 | 11,478,517 |
| MainStay VP T. Rowe Price Equity Income Portfolio Initial Class | 755,420 | 10,335,200 |
| MainStay VP Wellington Growth Portfolio Initial Class | 285,892 | 12,725,470 |
| MainStay VP Wellington Mid Cap Portfolio Initial Class | 582,612 | 9,437,318 |
| MainStay VP Wellington Small Cap Portfolio Initial Class | 456,360 | 6,251,175 |
| MainStay VP Wellington U.S. Equity Portfolio Initial Class | 126,622 | 4,162,913 |
| MainStay VP Winslow Large Cap Growth Portfolio Initial Class | 639,969 | 23,627,353 |
| MainStay WMC Enduring Capital Fund Class R6 | 375,853 | 12,605,334 |
| MainStay WMC International Research Equity Fund Class I | 833,925 | 6,787,234 |
| | Shares | | Value |
| |
| Equity Funds (continued) |
| MainStay WMC Value Fund Class R6 | 279,328 | | $ 15,235,963 |
Total Equity Funds
(Cost $199,788,758) | | | 254,839,120 |
| Fixed Income Funds 55.6% |
| MainStay MacKay Short Duration High Yield Fund Class I | 4,989,227 | | 49,436,257 |
| MainStay Short Term Bond Fund Class I | 356,112 | | 3,509,197 |
| MainStay VP Bond Portfolio Initial Class | 2,797,955 | | 42,496,463 |
| MainStay VP Floating Rate Portfolio Initial Class (a) | 5,148,168 | | 45,729,115 |
| MainStay VP Indexed Bond Portfolio Initial Class (a) | 20,517,275 | | 226,609,196 |
| MainStay VP MacKay High Yield Corporate Bond Portfolio Initial Class | 1,373,146 | | 14,146,015 |
| MainStay VP PIMCO Real Return Portfolio Initial Class | 732,695 | | 7,051,168 |
Total Fixed Income Funds
(Cost $371,117,094) | | | 388,977,411 |
Total Affiliated Investment Companies
(Cost $570,905,852) | | | 643,816,531 |
| Short-Term Investment 8.1% |
| Affiliated Investment Company 8.1% |
| MainStay U.S. Government Liquidity Fund, 0.01% (b) | 56,648,013 | | 56,648,013 |
Total Short-Term Investment
(Cost $56,648,013) | 8.1% | | 56,648,013 |
Total Investments
(Cost $627,553,865) | 100.1% | | 700,464,544 |
| Other Assets, Less Liabilities | (0.1) | | (573,314) |
| Net Assets | 100.0% | | $ 699,891,230 |
| † | Percentages indicated are based on Portfolio net assets. |
| (a) | As of June 30, 2021, the Portfolio’s ownership exceeds 5% of the outstanding shares of the Underlying Portfolio's/Fund's share class. |
| (b) | Current yield as of June 30, 2021. |
The notes to the financial statements are an integral part of, and should be read in conjunction with, the financial statements.
11
Portfolio of Investments June 30, 2021† (Unaudited) (continued)
Swap Contracts
Open OTC total return equity swap contracts as of June 30, 2021 were as follows1:
Swap
Counterparty | Reference Obligation | Floating Rate2 | Termination
Date(s) | Payment
Frequency
Paid/
Received | Notional
Amount
Long/
(Short)
(000)3 | Unrealized
Appreciation/
(Depreciation)4 |
| Citibank NA | Citi 2nd Wave Virus Basket | 1 month LIBOR BBA plus 0.35% | 12/2/21 | Monthly | 5,061 | $ — |
| Citibank NA | Citi Stay at Home Basket | 1 month LIBOR BBA minus 0.30% | 12/2/21 | Monthly | (6,115) | — |
| Citibank NA | iShares MSCI EAFE ETF | 1 month LIBOR BBA plus 0.40% | 12/2/21 | Monthly | 23,831 | — |
| Citibank NA | iShares MSCI EAFE Small-Cap ETF | 1 month LIBOR BBA plus 0.55% | 12/2/21 | Monthly | 6,806 | — |
| Citibank NA | Russell 1000 Growth Total Return Index | 1 month LIBOR BBA plus 0.03% | 12/3/21 | Monthly | (25,572) | — |
| Citibank NA | Russell 1000 Value Total Return Index | 1 month LIBOR BBA plus 0.30% | 12/2/21 | Monthly | 4,036 | — |
| Citibank NA | Russell 2000 Total Return Index | 1 month LIBOR BBA minus 0.06% | 12/2/21 | Monthly | (9,434) | — |
| Citibank NA | Russell Midcap Total Return Index | 1 month LIBOR BBA plus 0.31% | 12/2/21 | Monthly | 26,055 | — |
| Citibank NA | VanEck Vectors Gold Miners ETF | 1 month LIBOR BBA plus 0.50% | 12/2/21 | Monthly | 5,903 | — |
| | | | | | | $ — |
| 1. | As of June 30, 2021, cash in the amount $3,500,000 was pledged to brokers for OTC swap contracts. |
| 2. | Portfolio pays the floating rate and receives the total return of the reference entity. |
| 3. | Notional amounts reflected as a positive value indicate a long position held by the Portfolio or Index and a negative value indicates a short position. |
| 4. | Reflects the value at reset date as of June 30, 2021. |
| Abbreviation(s): |
| BBA—British Bankers’ Association |
| EAFE—Europe, Australasia and Far East |
| ETF—Exchange-Traded Fund |
| FTSE—Financial Times Stock Exchange |
| LIBOR—London Interbank Offered Rate |
| MSCI—Morgan Stanley Capital International |
The following is a summary of the fair valuations according to the inputs used as of June 30, 2021, for valuing the Portfolio’s assets:
| Description | Quoted
Prices in
Active
Markets for
Identical
Assets
(Level 1) | | Significant
Other
Observable
Inputs
(Level 2) | | Significant
Unobservable
Inputs
(Level 3) | | Total |
| Asset Valuation Inputs | | | | | | | |
| Investments in Securities (a) | | | | | | | |
| Affiliated Investment Companies | | | | | | | |
| Equity Funds | $ 254,839,120 | | $ — | | $ — | | $ 254,839,120 |
| Fixed Income Funds | 388,977,411 | | — | | — | | 388,977,411 |
| Total Affiliated Investment Companies | 643,816,531 | | — | | — | | 643,816,531 |
| Short-Term Investment | | | | | | | |
| Affiliated Investment Company | 56,648,013 | | — | | — | | 56,648,013 |
| Total Investments in Securities | $ 700,464,544 | | $ — | | $ — | | $ 700,464,544 |
| (a) | For a complete listing of investments, see the Portfolio of Investments. |
The notes to the financial statements are an integral part of, and should be read in conjunction with, the financial statements.
| 12 | MainStay VP Conservative Allocation Portfolio |
Statement of Assets and Liabilities as of June 30, 2021 (Unaudited)
| Assets |
Investment in affiliated investment companies, at value
(identified cost $627,553,865) | $700,464,544 |
| Cash collateral on deposit at broker for swap contracts | 3,500,000 |
| Receivables: | |
| Dividends | 109,289 |
| Portfolio shares sold | 316 |
| Other assets | 7,111 |
| Total assets | 704,081,260 |
| Liabilities |
| Payables: | |
| Dividends and interest on OTC swaps contracts | 3,643,825 |
| Portfolio shares redeemed | 181,528 |
| NYLIFE Distributors (See Note 3) | 140,627 |
| Investment securities purchased | 108,861 |
| Shareholder communication | 64,212 |
| Professional fees | 36,656 |
| Custodian | 14,119 |
| Trustees | 202 |
| Total liabilities | 4,190,030 |
| Net assets | $699,891,230 |
| Composition of Net Assets |
| Shares of beneficial interest outstanding (par value of $.001 per share) unlimited number of shares authorized | $ 54,420 |
| Additional paid-in-capital | 604,127,421 |
| | 604,181,841 |
| Total distributable earnings (loss) | 95,709,389 |
| Net assets | $699,891,230 |
| Initial Class | |
| Net assets applicable to outstanding shares | $ 17,268,474 |
| Shares of beneficial interest outstanding | 1,326,649 |
| Net asset value per share outstanding | $ 13.02 |
| Service Class | |
| Net assets applicable to outstanding shares | $682,622,756 |
| Shares of beneficial interest outstanding | 53,093,002 |
| Net asset value per share outstanding | $ 12.86 |
The notes to the financial statements are an integral part of, and should be read in conjunction with, the financial statements.
13
Statement of Operations for the six months ended June 30, 2021 (Unaudited)
| Investment Income (Loss) |
| Income | |
| Dividend distributions from affiliated investment companies | $ 2,599,530 |
| Expenses | |
| Distribution/Service—Service Class (See Note 3) | 848,287 |
| Professional fees | 41,205 |
| Shareholder communication | 34,352 |
| Custodian | 22,515 |
| Trustees | 7,385 |
| Miscellaneous | 7,821 |
| Total expenses | 961,565 |
| Net investment income (loss) | 1,637,965 |
| Realized and Unrealized Gain (Loss) |
| Net realized gain (loss) on: | |
| Affiliated investment company transactions | 20,359,287 |
| Realized capital gain distributions from affiliated investment companies | 5,642,044 |
| Swap transactions | 595,936 |
| Net realized gain (loss) | 26,597,267 |
Net change in unrealized appreciation (depreciation) on:
Affiliated investments companies | 2,740,264 |
| Net realized and unrealized gain (loss) | 29,337,531 |
| Net increase (decrease) in net assets resulting from operations | $30,975,496 |
The notes to the financial statements are an integral part of, and should be read in conjunction with, the financial statements.
| 14 | MainStay VP Conservative Allocation Portfolio |
Statements of Changes in Net Assets
for the six months ended June 30, 2021 (Unaudited) and the year ended December 31, 2020
| | 2021 | 2020 |
| Increase (Decrease) in Net Assets |
| Operations: | | |
| Net investment income (loss) | $ 1,637,965 | $ 10,323,185 |
| Net realized gain (loss) | 26,597,267 | 11,277,304 |
| Net change in unrealized appreciation (depreciation) | 2,740,264 | 40,337,689 |
| Net increase (decrease) in net assets resulting from operations | 30,975,496 | 61,938,178 |
| Distributions to shareholders: | | |
| Initial Class | — | (565,783) |
| Service Class | — | (22,500,681) |
| Total distributions to shareholders | — | (23,066,464) |
| Capital share transactions: | | |
| Net proceeds from sales of shares | 13,190,733 | 71,082,058 |
| Net asset value of shares issued to shareholder in reinvestment of distributions | — | 23,066,464 |
| Cost of shares redeemed | (47,325,935) | (162,373,215) |
| Increase (decrease) in net assets derived from capital share transactions | (34,135,202) | (68,224,693) |
| Net increase (decrease) in net assets | (3,159,706) | (29,352,979) |
| Net Assets |
| Beginning of period | 703,050,936 | 732,403,915 |
| End of period | $699,891,230 | $ 703,050,936 |
The notes to the financial statements are an integral part of, and should be read in conjunction with, the financial statements.
15
Financial Highlights selected per share data and ratios
| | Six months ended
June 30,
2021* | | Year Ended December 31, |
| Initial Class | 2020 | | 2019 | | 2018 | | 2017 | | 2016 |
| Net asset value at beginning of period | $ 12.44 | | $ 11.70 | | $ 10.77 | | $ 11.80 | | $ 10.87 | | $ 10.71 |
| Net investment income (loss) (a) | 0.05 | | 0.21 | | 0.20 | | 0.23 | | 0.22 | | 0.22 |
| Net realized and unrealized gain (loss) on investments | 0.53 | | 0.97 | | 1.38 | | (0.98) | | 0.95 | | 0.46 |
| Total from investment operations | 0.58 | | 1.18 | | 1.58 | | (0.75) | | 1.17 | | 0.68 |
| Less distributions: | | | | | | | | | | | |
| From net investment income | — | | (0.25) | | (0.34) | | (0.28) | | (0.24) | | (0.29) |
| From net realized gain on investments | — | | (0.19) | | (0.31) | | — | | — | | (0.23) |
| Total distributions | — | | (0.44) | | (0.65) | | (0.28) | | (0.24) | | (0.52) |
| Net asset value at end of period | $ 13.02 | | $ 12.44 | | $ 11.70 | | $ 10.77 | | $ 11.80 | | $ 10.87 |
| Total investment return (b) | 4.66%(c) | | 10.28% | | 14.83% | | (6.47)% | | 10.80% | | 6.36% |
| Ratios (to average net assets)/Supplemental Data: | | | | | | | | | | | |
| Net investment income (loss) | 0.72%†† | | 1.76% | | 1.75% | | 2.02% | | 1.89% | | 2.02% |
| Net expenses (d) | 0.03%†† | | 0.04% | | 0.03% | | 0.03% | | 0.02% | | 0.03% |
| Portfolio turnover rate | 11% | | 29% | | 42% | | 58% | | 44% | | 44% |
| Net assets at end of period (in 000’s) | $ 17,268 | | $ 16,707 | | $ 16,327 | | $ 14,616 | | $ 16,481 | | $ 16,599 |
| * | Unaudited. |
| †† | Annualized. |
| (a) | Per share data based on average shares outstanding during the period. |
| (b) | Total return does not reflect any deduction of sales charges, mortality and expense charges, contract charges or administrative charges. For periods of less than one year, total return is not annualized. |
| (c) | Total investment return may reflect adjustments to conform to generally accepted accounting principles. |
| (d) | In addition to the fees and expenses which the Portfolio bears directly, it also indirectly bears a pro-rata share of the fees and expenses of the underlying funds in which it invests. Such indirect expenses are not included in the above expense ratios. |
| | Six months ended
June 30,
2021* | | Year Ended December 31, |
| Service Class | 2020 | | 2019 | | 2018 | | 2017 | | 2016 |
| Net asset value at beginning of period | $ 12.30 | | $ 11.57 | | $ 10.66 | | $ 11.67 | | $ 10.75 | | $ 10.60 |
| Net investment income (loss) (a) | 0.03 | | 0.17 | | 0.17 | | 0.20 | | 0.19 | | 0.19 |
| Net realized and unrealized gain (loss) on investments | 0.53 | | 0.97 | | 1.35 | | (0.96) | | 0.94 | | 0.45 |
| Total from investment operations | 0.56 | | 1.14 | | 1.52 | | (0.76) | | 1.13 | | 0.64 |
| Less distributions: | | | | | | | | | | | |
| From net investment income | — | | (0.22) | | (0.30) | | (0.25) | | (0.21) | | (0.26) |
| From net realized gain on investments | — | | (0.19) | | (0.31) | | — | | — | | (0.23) |
| Total distributions | — | | (0.41) | | (0.61) | | (0.25) | | (0.21) | | (0.49) |
| Net asset value at end of period | $ 12.86 | | $ 12.30 | | $ 11.57 | | $ 10.66 | | $ 11.67 | | $ 10.75 |
| Total investment return (b) | 4.55%(c) | | 10.01% | | 14.55% | | (6.68)% | | 10.52% | | 6.10% |
| Ratios (to average net assets)/Supplemental Data: | | | | | | | | | | | |
| Net investment income (loss) | 0.46%†† | | 1.50% | | 1.47% | | 1.70% | | 1.66% | | 1.74% |
| Net expenses (d) | 0.28%†† | | 0.29% | | 0.28% | | 0.28% | | 0.27% | | 0.28% |
| Portfolio turnover rate | 11% | | 29% | | 42% | | 58% | | 44% | | 44% |
| Net assets at end of period (in 000’s) | $ 682,623 | | $ 686,344 | | $ 716,077 | | $ 714,720 | | $ 865,873 | | $ 850,124 |
| * | Unaudited. |
| †† | Annualized. |
| (a) | Per share data based on average shares outstanding during the period. |
| (b) | Total return does not reflect any deduction of sales charges, mortality and expense charges, contract charges or administrative charges. For periods of less than one year, total return is not annualized. |
| (c) | Total investment return may reflect adjustments to conform to generally accepted accounting principles. |
| (d) | In addition to the fees and expenses which the Portfolio bears directly, it also indirectly bears a pro-rata share of the fees and expenses of the underlying funds in which it invests. Such indirect expenses are not included in the above expense ratios. |
The notes to the financial statements are an integral part of, and should be read in conjunction with, the financial statements.
| 16 | MainStay VP Conservative Allocation Portfolio |
MainStay VP Moderate Allocation Portfolio
Investment and Performance Comparison (Unaudited)
Performance data quoted represents past performance. Past performance is no guarantee of future results. Because of market volatility and other factors, current performance may be lower or higher than the figures shown. Investment return and principal value will fluctuate, and as a result, when shares are redeemed, they may be worth more or less than their original cost. The performance table and graph do not reflect any deduction of sales charges, mortality and expense charges, contract charges or administrative charges. Please refer to the Performance Summary appropriate for your policy. For performance information current to the most recent month-end, please call 800-598-2019 or visit www.newyorklife.com.
Performance figures may reflect certain fee waivers and/or expense limitations, without which total returns may have been different. For information on current fee waivers and/or expense limitations (if any), please refer to the Notes to Financial Statements.
| Average Annual Total Returns for the Period-Ended June 30, 2021 |
| Class | Inception
Date | Six
Months | One
Year | Five
Years | Ten
Years | Gross
Expense
Ratio1 |
| Initial Class Shares | 2/13/2006 | 7.57% | 22.04% | 9.40% | 7.76% | 0.61% |
| Service Class Shares | 2/13/2006 | 7.43 | 21.73 | 9.13 | 7.49 | 0.86 |
| 1. | The gross expense ratios presented reflect the Portfolio’s “Total Annual Portfolio Operating Expenses” from the most recent Prospectus, as supplemented, and may differ from other expense ratios disclosed in this report. |
| Benchmark Performance | Six
Months | One
Year | Five
Years | Ten
Years |
| S&P 500® Index1 | 15.25% | 40.79% | 17.65% | 14.84% |
| MSCI EAFE® Index (Net)2 | 8.83 | 32.35 | 10.28 | 5.89 |
| Bloomberg Barclays U.S. Aggregate Bond Index3 | -1.60 | -0.33 | 3.03 | 3.39 |
| Moderate Allocation Composite Index4 | 7.35 | 21.92 | 10.83 | 9.19 |
| Morningstar Allocation—50% to 70% Equity Category Average5 | 9.54 | 26.62 | 10.00 | 7.89 |
| 1. | The S&P 500® Index is the Portfolio's primary benchmark. “S&P 500®" is a trademark of The McGraw-Hill Companies, Inc. The S&P 500® Index is widely regarded as the standard index for measuring large-cap U.S. stock market performance. Results assume reinvestment of all dividends and capital gains. An investment cannot be made directly in an index. |
| 2. | The MSCI EAFE® Index (Net) is the Portfolio's secondary benchmark. The MSCI EAFE® Index (Net) consists of international stocks representing the developed world outside of North America. Results assume reinvestment of all dividends and capital gains. An investment cannot be made directly in an index. |
| 3. | The Portfolio has selected the Bloomberg Barclays U.S. Aggregate Bond Index as an additional benchmark. The Bloomberg Barclays U.S. Aggregate Bond Index is a broad-based benchmark that measures the investment grade, U.S. dollar-denominated, fixed-rate taxable bond market, including Treasurys, government-related and corporate securities, mortgage-backed securities (agency fixed-rate and hybrid adjustable rate mortgage passthroughs), asset-backed securities, and commercial mortgage-backed securities. Results assume reinvestment of all dividends and capital gains. An investment cannot be made directly in an index. |
| 4. | The Portfolio has selected the Moderate Allocation Composite Index as an additional benchmark. The Moderate Allocation Composite Index consists of the S&P 500® Index, the MSCI EAFE® Index (Net) and the Bloomberg Barclays U.S. Aggregate Bond Index weighted 45%, 15% and 40%, respectively. Results assume reinvestment of all dividends and capital gains. An investment cannot be made directly in an index. |
| 5. | The Morningstar Allocation – 50% to 70% Equity Category Average is representative of funds that seek to provide both income and capital appreciation by investing in multiple asset classes, including stocks, bonds, and cash. These funds are dominated by domestic holdings and have equity exposures between 50% and 70%. Results are based on average total returns of similar funds with all dividends and capital gain distributions reinvested. |
Cost in Dollars of a $1,000 Investment in MainStay VP Moderate Allocation Portfolio (Unaudited)
The example below is intended to describe the fees and expenses borne by shareholders during the six-month period from January 1, 2021 to June 30, 2021, and the impact of those costs on your investment.
Example
As a shareholder of the Portfolio you incur two types of costs: (1) transaction costs, including exchange fees and sales charges (loads) on purchases (as applicable), and (2) ongoing costs, including management fees, distribution and/or service (12b-1) fees, and other Portfolio expenses (as applicable). This example is intended to help you understand your ongoing costs (in dollars) of investing in the Portfolio and to compare these costs with the ongoing costs of investing in other mutual funds. The example is based on an investment of $1,000 made at the beginning of the six-month period and held for the entire period from January 1, 2021 to June 30, 2021. Shares are only sold in connection with variable life and annuity contracts and the example does not reflect any contract level or transactional fees or expenses. If these costs had been included, your costs would have been higher.
This example illustrates your Portfolio’s ongoing costs in two ways:
Actual Expenses
The second and third data columns in the table below provide information about actual account values and actual expenses. You may use the information in these columns, together with the amount you invested, to estimate the expenses that you paid during the six months ended June
30, 2021. Simply divide your account value by $1,000 (for example, an $8,600 account value divided by $1,000 = 8.6), then multiply the result by the number under the heading entitled “Expenses Paid During Period” to estimate the expenses you paid on your account during this period.
Hypothetical Example for Comparison Purposes
The fourth and fifth data columns in the table below provide information about hypothetical account values and hypothetical expenses based on the Portfolio’s actual expense ratio and an assumed rate of return of 5% per year before expenses, which is not the Portfolio’s actual return. The hypothetical account values and expenses may not be used to estimate the actual ending account balances or expenses you paid for the six-month period shown. You may use this information to compare the ongoing costs of investing in the Portfolio with the ongoing costs of investing in other mutual funds. To do so, compare this 5% hypothetical example with the 5% hypothetical examples that appear in the shareholder reports of the other mutual funds.
Please note that the expenses shown in the table are meant to highlight your ongoing costs only and do not reflect any transactional costs, such as exchange fees or sales charges (loads). Therefore, the fourth and fifth data columns of the table are useful in comparing ongoing costs only and will not help you determine the relative total costs of owning different funds. In addition, if these transactional costs were included, your costs would have been higher.
| Share Class | Beginning
Account
Value
1/1/21 | Ending Account
Value (Based
on Actual
Returns and
Expenses)
6/30/21 | Expenses
Paid
During
Period1 | Ending Account
Value (Based
on Hypothetical
5% Annualized
Return and
Actual Expenses)
6/30/21 | Expenses
Paid
During
Period1 | Net Expense
Ratio
During
Period2 |
| Initial Class Shares | $1,000.00 | $1,075.70 | $0.15 | $1,024.65 | $0.15 | 0.03% |
| Service Class Shares | $1,000.00 | $1,074.30 | $1.44 | $1,023.41 | $1.40 | 0.28% |
| 1. | Expenses are equal to the Portfolio’s annualized expense ratio of each class multiplied by the average account value over the period, divided by 365 and multiplied by 181 (to reflect the six-month period). The table above represents the actual expenses incurred during the six-month period. In addition to the fees and expenses which the Portfolio bears directly, it also indirectly bears a pro rata share of the fees and expenses of the underlying Portfolios/Funds in which it invests. Such indirect expenses are not included in the above-reported expense figures. |
| 2. | Expenses are equal to the Portfolio's annualized expense ratio to reflect the six-month period. |
| 18 | MainStay VP Moderate Allocation Portfolio |
Asset Diversification as of June 30, 2021 (Unaudited)
| Equity Funds | 56.4 % |
| Fixed Income Funds | 35.2 |
| Short-Term Investments | 8.6 |
| Other Assets, Less Liabilities | (0.2) |
See Portfolio of Investments beginning on page 23 for specific holdings within these categories. The Portfolio’s holdings are subject to change.
Portfolio Management Discussion and Analysis (Unaudited)
Answers to the questions reflect the views of portfolio managers Jae S. Yoon, CFA, Jonathan Swaney, Poul Kristensen, CFA, and Amit Soni, CFA, of New York Life Investments1 the Portfolio’s Manager.
How did MainStay VP Moderate Allocation Portfolio perform relative to its benchmarks and peers during the six months ended June 30, 2021?
For the six months ended June 30, 2021, MainStay VP Moderate Allocation Portfolio returned 7.57% for Initial Class shares and 7.43% for Service Class shares. Over the same period, both share classes underperformed the 15.25% return of the S&P 500® Index, which is the Portfolio’s primary benchmark, and the 8.83% return of the MSCI EAFE® Index (Net), which is a secondary benchmark of the Portfolio. For the six months ended June 30, 2021, both share classes outperformed the −1.60% return of the Bloomberg Barclays U.S. Aggregate Bond Index and the 7.35% return of the Moderate Allocation Composite Index, which are additional benchmarks of the Portfolio. Over the same period, both share classes underperformed the 9.54% return of the Morningstar Allocation—50% to 70% Equity Category Average.2
What factors affected the Portfolio’s relative performance during the reporting period?
The Portfolio is a “fund of funds,” meaning that it seeks to achieve its investment objective by investing primarily in mutual funds and exchange-traded funds (“ETFs”) managed by New York Life Investments or its affiliates (the “Underlying Portfolios/Funds”). The Underlying Portfolios/Funds may invest in U.S. equities, international equities and fixed-income instruments, making comparisons to any single index generally less suitable than a weighted combination of indices, which is a more useful yardstick by which to measure performance. The most influential factor affecting relative performance for the Portfolio versus the performance of a weighted combination of indices is the net performance of the Underlying Portfolios/Funds relative to their respective benchmarks.
Performance among the Portfolio’s Underlying Portfolio/Fund investments during the reporting period proved mixed with little positive or negative contribution to active return. Instead, asset class policy was primarily responsible for the Portfolio’s underperformance compared with the internally maintained blend of indices taken into consideration when managing the Portfolio. Three positions stand out, starting with the Portfolio’s non-U.S. equity exposure. Equity markets posted an historic rebound off their March 2020 lows, with U.S. markets leading due to a potent policy mix and ambitious vaccination rollout plans. We expected that stock markets in other nations would follow a similar trajectory as vaccination rates climbed and international economies more fully opened, closing the performance gap with U.S. equities. Accordingly, we increased the Portfolio’s exposure to non-U.S. markets. However, during the reporting period, foreign
markets generally failed to keep pace with U.S. markets, thereby undermining the Portfolio’s relative returns.
Second, the Portfolio maintained lower-than-benchmark exposure to the floating rate loan market. We adopted this position as, in our view, underwriting standards tend to be less rigorous in the loan market today than was the case a few years ago. This deterioration in creditworthiness, coupled with already tight spreads3 and pockets of economic instability, led us to hold underweight exposure to the floating rate loan market. However, during the reporting period, loans performed well amid an ongoing hunt for yield and as investors prepared for tighter monetary policy down the road.
Finally, the Portfolio started the reporting period emphasizing large companies over small, reflecting our distrust of the degree to which small-cap stocks outperformed the broader market in the closing months of 2020. However, small caps continued to lead the market higher well into 2021, creating a headwind to performance. While that trend reversed to a degree during the reporting period, it did not do so until the size bias within the Portfolio was largely eliminated.
During the reporting period, how was the Portfolio’s performance materially affected by investments in derivatives?
Total return swaps were used to express most of the Portfolio’s asset class policy views and can be seen as detracting from performance during the reporting period.
How did you allocate the Portfolio’s assets during the reporting period and why?
The announcements in late 2020 of highly successful clinical trials for both the Moderna and Pfizer vaccines, followed shortly thereafter by granting of emergency use authorization and rapid distribution to the most vulnerable elements of the population, played a significant role in our determination of how best to allocate the Portfolio’s assets. As the vaccines brought the end of pandemic restrictions into view, we adjusted the Portfolio to favor pro-cyclical sectors and businesses in industries we believed likely to benefit most from the reopening of the economy. Similarly, we slid the Portfolio’s holdings a little way down the capitalization spectrum, committing a larger allocation of assets to small- and mid-cap companies likely to fare well in this environment. We also reduced interest rate sensitivity within the bond portion of the Portfolio, anticipating that mounting inflationary pressures would result in higher bond yields. These adjustments provided a modest tailwind for much of 2021 before
| 1. | “New York Life Investments” is a service mark used by New York Life Investment Management Holdings LLC and its subsidiary New York Life Investment Management LLC. |
| 2. | See page 17 for more information on benchmark and peer group returns. |
| 3. | The terms “spread” and “yield spread” may refer to the difference in yield between a security or type of security and comparable U.S. Treasury issues. The terms may also refer to the difference in yield between two specific securities or types of securities at a given time. |
| 20 | MainStay VP Moderate Allocation Portfolio |
undergoing an abrupt and puzzling reversal from mid-May through the end of June, at which time they detracted from Portfolio performance.
How did the Portfolio’s allocations change over the course of the reporting period?
The asset class repositioning noted above was largely implemented using derivatives, specifically total return swaps. These instruments increased the Portfolio’s exposure to small- and mid-cap stocks, non-U.S. markets and a basket of companies specifically leveraged to the reopening of the economy. The same approach was used to reduce the Portfolio’s exposure to large-cap U.S. stocks and a basket of companies identified as having been beneficiaries of lockdown conditions.
We also made a few adjustments at the Underlying Portfolio/Fund level, the most pronounced being a reduction in the Portfolio’s holdings of MainStay VP Indexed Bond Portfolio and MainStay VP Bond Portfolio, with proceeds being redirected to a mix of cash, MainStay VP Floating Rate Portfolio, MainStay VP MacKay High Yield Corporate Bond Portfolio and MainStay Short Term Bond Fund. Our goal was to lessen the Portfolio’s interest rate sensitivity at a time when we believed yields might rise in response to mounting inflationary concerns.
Other notable changes arose from portfolio restructurings as Wellington Management Company was named the new subadvisor on several MainStay products that concurrently underwent name changes. A few funds were also subject to mergers. For example, MainStay MacKay Common Stock Fund was renamed MainStay WMC Enduring Capital Fund when Wellington took the helm in early March, and MainStay Epoch U.S. All Cap Fund was subsequently merged into the renamed fund a short while later, thereby making the Portfolio an investor in MainStay WMC Enduring Capital Fund. Similarly, “new” positions arising from restructurings can be found in MainStay VP Wellington Growth Portfolio, MainStay WMC International Research Equity Fund and MainStay WMC Value Fund, among others.
Which Underlying Equity Portfolios/Funds had the highest total returns during the reporting period, and which Underlying Equity Portfolios/Funds had the lowest total returns?
Of the Underlying Equity Funds held for the entire reporting period, those posting the largest total returns included IQ Chaikin U.S. Small Cap ETF, MainStay WMC Enduring Capital Fund
(encompassing MainStay Epoch U.S. All Cap Fund after the merger cited above) and MainStay VP T. Rowe Price Equity Income Portfolio. The Underlying Equity Funds with the lowest total returns (none generated losses) were MainStay Epoch International Choice Fund, MainStay VP MacKay International Equity Portfolio and IQ Candriam ESG International Equity ETF.
Which Underlying Equity Portfolios/Funds made the strongest positive contributions to the Portfolio’s overall performance, and which Underlying Equity Portfolios/ Funds were the greatest detractors?
Allowing for the size of the allocation, the variation of that allocation across the reporting period and performance during that window of time, the Underlying Equity Funds making the strongest positive contributions to the Fund’s total return included MainStay VP MacKay S&P 500 Index Portfolio, MainStay VP Winslow Large Cap Growth Portfolio and IQ Candriam ESG U.S. Equity ETF. Those detracting most from total returns were MainStay VP Wellington U.S. Equity Portfolio, MainStay Epoch Capital Growth Fund and MainStay VP MacKay International Equity Portfolio.
What factors and risks affected the Portfolio’s Underlying Fixed-Income Portfolio/Fund investments during the reporting period?
Long bond yields moved sharply higher in the first quarter of 2021, with the rise presumably linked to investors’ growing awareness of potential inflationary pressures. The increase was partially reversed in the second quarter with two factors at work in our view. First, evidence suggested that the U.S. economy was moving past “peak growth”. Second, commentary from U.S. Federal Reserve officials and the release of the Statement of Economic Projections by the Federal Open Market Committee (FOMC) suggested that the FOMC might be willing to tighten policy sooner than previously assumed. At the same time, credit spreads tightened further, likely due to ample liquidity coupled with strong corporate fundaments.
During the reporting period, which fixed-income market segments were the strongest positive contributors to the Portfolio’s performance and which segments were particularly weak?
As a rule, lower-quality credits (such as speculative-grade bonds and bank loans) and shorter-duration4 assets made the strongest positive contributions to the Portfolio’s performance. (Contributions take weightings and total returns into account.)
| 4. | Duration is a measure of the price sensitivity of a fixed-income investment to changes in interest rates. Duration is expressed as a number of years and is considered a more accurate sensitivity gauge than average maturity. |
Conversely, high-quality, long-maturity bonds gave up a little ground.
Which Underlying Fixed-Income Portfolios/Funds made the strongest positive contributions to the Portfolio’s performance, and which Underlying Fixed-Income Portfolios/Funds were the greatest detractors?
Allowing for the size of the allocation, the variation of that allocation across the reporting period and performance during that window of time, the Underlying Fixed-Income Portfolios/Funds contributing most to the Fund’s return were MainStay MacKay Short Duration High Yield Fund and MainStay VP Floating Rate Portfolio. MainStay VP Indexed Bond Portfolio and MainStay VP Bond Portfolio detracted most significantly from performance.
The opinions expressed are those of the portfolio managers as of the date of this report and are subject to change. There is no guarantee that any forecasts will come to pass. This material does not constitute investment advice and is not intended as an endorsement of any specific investment.
Not all MainStay VP Portfolios and/or share classes are available under all policies.
| 22 | MainStay VP Moderate Allocation Portfolio |
Portfolio of Investments June 30, 2021† (Unaudited)
| | Shares | Value |
| Affiliated Investment Companies 91.6% |
| Equity Funds 56.4% |
| IQ 50 Percent Hedged FTSE International ETF (a) | 893,838 | $ 22,140,367 |
| IQ 500 International ETF (a) | 855,894 | 27,923,114 |
| IQ Candriam ESG International Equity ETF (a) | 839,260 | 24,884,059 |
| IQ Candriam ESG U.S. Equity ETF (a) | 1,357,865 | 49,965,902 |
| IQ Chaikin U.S. Large Cap ETF (a) | 1,022,876 | 34,118,540 |
| IQ Chaikin U.S. Small Cap ETF (a) | 542,353 | 19,310,370 |
| MainStay Epoch Capital Growth Fund Class I (a) | 262,408 | 4,183,067 |
| MainStay Epoch International Choice Fund Class I (a) | 485,655 | 20,249,534 |
| MainStay VP Candriam Emerging Markets Equity Portfolio Initial Class (a) | 2,215,505 | 28,219,115 |
| MainStay VP Epoch U.S. Equity Yield Portfolio Initial Class | 1,896,697 | 32,572,361 |
| MainStay VP MacKay International Equity Portfolio Initial Class | 768,820 | 15,432,293 |
| MainStay VP MacKay S&P 500 Index Portfolio Initial Class | 708,203 | 58,237,618 |
| MainStay VP Small Cap Growth Portfolio Initial Class (a) | 1,852,891 | 36,793,232 |
| MainStay VP T. Rowe Price Equity Income Portfolio Initial Class (a) | 2,029,158 | 27,761,716 |
| MainStay VP Wellington Growth Portfolio Initial Class | 486,834 | 21,669,712 |
| MainStay VP Wellington Mid Cap Portfolio Initial Class | 1,653,461 | 26,783,265 |
| MainStay VP Wellington Small Cap Portfolio Initial Class | 1,459,492 | 19,991,980 |
| MainStay VP Wellington U.S. Equity Portfolio Initial Class | 100,121 | 3,291,665 |
| MainStay VP Winslow Large Cap Growth Portfolio Initial Class | 1,460,296 | 53,913,395 |
| MainStay WMC Enduring Capital Fund Class R6 | 949,580 | 31,846,934 |
| MainStay WMC International Research Equity Fund Class I (a) | 2,442,608 | 19,880,143 |
| | Shares | | Value |
| |
| Equity Funds (continued) |
| MainStay WMC Value Fund Class R6 | 674,474 | | $ 36,789,163 |
Total Equity Funds
(Cost $486,569,882) | | | 615,957,545 |
| Fixed Income Funds 35.2% |
| MainStay MacKay Short Duration High Yield Fund Class I | 4,983,038 | | 49,374,929 |
| MainStay Short Term Bond Fund Class I | 553,261 | | 5,451,945 |
| MainStay VP Bond Portfolio Initial Class | 2,717,196 | | 41,269,861 |
| MainStay VP Floating Rate Portfolio Initial Class (a) | 4,921,340 | | 43,714,298 |
| MainStay VP Indexed Bond Portfolio Initial Class (a) | 19,162,420 | | 211,645,091 |
| MainStay VP MacKay High Yield Corporate Bond Portfolio Initial Class | 2,133,358 | | 21,977,637 |
| MainStay VP PIMCO Real Return Portfolio Initial Class | 1,138,398 | | 10,955,488 |
Total Fixed Income Funds
(Cost $378,397,180) | | | 384,389,249 |
Total Affiliated Investment Companies
(Cost $864,967,062) | | | 1,000,346,794 |
| Short-Term Investment 8.6% |
| Affiliated Investment Company 8.6% |
| MainStay U.S. Government Liquidity Fund, 0.01% (a)(b) | 93,848,757 | | 93,848,757 |
Total Short-Term Investment
(Cost $93,848,757) | 8.6% | | 93,848,757 |
Total Investments
(Cost $958,815,819) | 100.2% | | 1,094,195,551 |
| Other Assets, Less Liabilities | (0.2) | | (1,721,310) |
| Net Assets | 100.0% | | $ 1,092,474,241 |
| † | Percentages indicated are based on Portfolio net assets. |
| (a) | As of June 30, 2021, the Portfolio’s ownership exceeds 5% of the outstanding shares of the Underlying Portfolio's/Fund's share class. |
| (b) | Current yield as of June 30, 2021. |
The notes to the financial statements are an integral part of, and should be read in conjunction with, the financial statements.
23
Portfolio of Investments June 30, 2021† (Unaudited) (continued)
Swap Contracts
Open OTC total return equity swap contracts as of June 30, 2021 were as follows1:
Swap
Counterparty | Reference Obligation | Floating Rate2 | Termination
Date(s) | Payment
Frequency
Paid/
Received | Notional
Amount
Long/
(Short)
(000)3 | Unrealized
Appreciation/
(Depreciation)4 |
| Citibank NA | Citi 2nd Wave Virus Basket | 1 month LIBOR BBA plus 0.35% | 12/2/21 | Monthly | 7,784 | $ — |
| Citibank NA | Citi Stay at Home Basket | 1 month LIBOR BBA minus 0.30% | 12/2/21 | Monthly | (9,404) | — |
| Citibank NA | iShares MSCI EAFE ETF | 1 month LIBOR BBA plus 0.40% | 12/2/21 | Monthly | 37,025 | — |
| Citibank NA | iShares MSCI EAFE Small-Cap ETF | 1 month LIBOR BBA plus 0.55% | 12/2/21 | Monthly | 10,574 | — |
| Citibank NA | Russell 1000 Growth Total Return Index | 1 month LIBOR BBA plus 0.03% | 12/2/21 | Monthly | (39,740) | — |
| Citibank NA | Russell 1000 Value Total Return Index | 1 month LIBOR BBA plus 0.30% | 12/2/21 | Monthly | 6,270 | — |
| Citibank NA | Russell 2000 Total Return Index | 1 month LIBOR BBA minus 0.06% | 12/2/21 | Monthly | (17,072) | — |
| Citibank NA | Russell Midcap Total Return Index | 1 month LIBOR BBA plus 0.31% | 12/2/21 | Monthly | 42,940 | — |
| Citibank NA | VanEck Vectors Gold Miners ETF | 1 month LIBOR BBA plus 0.50% | 12/2/21 | Monthly | 9,170 | — |
| | | | | | | $ — |
| 1. | As of June 30, 2021, cash in the amount $5,361,054 was pledged to brokers for OTC swap contracts. |
| 2. | Portfolio pays the floating rate and receives the total return of the reference entity. |
| 3. | Notional amounts reflected as a positive value indicate a long position held by the Portfolio or Index and a negative value indicates a short position. |
| 4. | Reflects the value at reset date as of June 30, 2021. |
| Abbreviation(s): |
| BBA—British Bankers’ Association |
| EAFE—Europe, Australasia and Far East |
| ETF—Exchange-Traded Fund |
| FTSE—Financial Times Stock Exchange |
| LIBOR—London Interbank Offered Rate |
| MSCI—Morgan Stanley Capital International |
The following is a summary of the fair valuations according to the inputs used as of June 30, 2021, for valuing the Portfolio’s assets:
| Description | Quoted
Prices in
Active
Markets for
Identical
Assets
(Level 1) | | Significant
Other
Observable
Inputs
(Level 2) | | Significant
Unobservable
Inputs
(Level 3) | | Total |
| Asset Valuation Inputs | | | | | | | |
| Investments in Securities (a) | | | | | | | |
| Affiliated Investment Companies | | | | | | | |
| Equity Funds | $ 615,957,545 | | $ — | | $ — | | $ 615,957,545 |
| Fixed Income Funds | 384,389,249 | | — | | — | | 384,389,249 |
| Total Affiliated Investment Companies | 1,000,346,794 | | — | | — | | 1,000,346,794 |
| Short-Term Investment | | | | | | | |
| Affiliated Investment Company | 93,848,757 | | — | | — | | 93,848,757 |
| Total Investments in Securities | $ 1,094,195,551 | | $ — | | $ — | | $ 1,094,195,551 |
| (a) | For a complete listing of investments, see the Portfolio of Investments. |
The notes to the financial statements are an integral part of, and should be read in conjunction with, the financial statements.
| 24 | MainStay VP Moderate Allocation Portfolio |
Statement of Assets and Liabilities as of June 30, 2021 (Unaudited)
| Assets |
Investment in affiliated investment companies, at value
(identified cost $958,815,819) | $1,094,195,551 |
| Cash collateral on deposit at broker for swap contracts | 5,361,054 |
| Receivables: | |
| Dividends | 100,008 |
| Portfolio shares sold | 4,368 |
| Other assets | 11,267 |
| Total assets | 1,099,672,248 |
| Liabilities |
| Due to custodian | 361,054 |
| Payables: | |
| Dividends and interest on OTC swaps contracts | 5,606,114 |
| Portfolio shares redeemed | 755,358 |
| NYLIFE Distributors (See Note 3) | 214,372 |
| Investment securities purchased | 99,300 |
| Shareholder communication | 98,807 |
| Professional fees | 48,987 |
| Custodian | 13,748 |
| Trustees | 267 |
| Total liabilities | 7,198,007 |
| Net assets | $1,092,474,241 |
| Composition of Net Assets |
| Shares of beneficial interest outstanding (par value of $.001 per share) unlimited number of shares authorized | $ 85,589 |
| Additional paid-in-capital | 914,281,678 |
| | 914,367,267 |
| Total distributable earnings (loss) | 178,106,974 |
| Net assets | $1,092,474,241 |
| Initial Class | |
| Net assets applicable to outstanding shares | $ 52,715,215 |
| Shares of beneficial interest outstanding | 4,088,485 |
| Net asset value per share outstanding | $ 12.89 |
| Service Class | |
| Net assets applicable to outstanding shares | $1,039,759,026 |
| Shares of beneficial interest outstanding | 81,500,320 |
| Net asset value per share outstanding | $ 12.76 |
The notes to the financial statements are an integral part of, and should be read in conjunction with, the financial statements.
25
Statement of Operations for the six months ended June 30, 2021 (Unaudited)
| Investment Income (Loss) |
| Income | |
| Dividend distributions from affiliated investment companies | $ 3,505,869 |
| Expenses | |
| Distribution/Service—Service Class (See Note 3) | 1,285,761 |
| Professional fees | 54,633 |
| Shareholder communication | 52,885 |
| Custodian | 22,549 |
| Trustees | 11,313 |
| Miscellaneous | 11,515 |
| Total expenses | 1,438,656 |
| Net investment income (loss) | 2,067,213 |
| Realized and Unrealized Gain (Loss) |
| Net realized gain (loss) on: | |
| Affiliated investment company transactions | 35,018,822 |
| Realized capital gain distributions from affiliated investment companies | 13,581,726 |
| Swap transactions | 1,386,574 |
| Net realized gain (loss) | 49,987,122 |
Net change in unrealized appreciation (depreciation) on:
Affiliated investments companies | 25,986,553 |
| Net realized and unrealized gain (loss) | 75,973,675 |
| Net increase (decrease) in net assets resulting from operations | $78,040,888 |
The notes to the financial statements are an integral part of, and should be read in conjunction with, the financial statements.
| 26 | MainStay VP Moderate Allocation Portfolio |
Statements of Changes in Net Assets
for the six months ended June 30, 2021 (Unaudited) and the year ended December 31, 2020
| | 2021 | 2020 |
| Increase (Decrease) in Net Assets |
| Operations: | | |
| Net investment income (loss) | $ 2,067,213 | $ 16,200,095 |
| Net realized gain (loss) | 49,987,122 | 23,048,257 |
| Net change in unrealized appreciation (depreciation) | 25,986,553 | 68,669,592 |
| Net increase (decrease) in net assets resulting from operations | 78,040,888 | 107,917,944 |
| Distributions to shareholders: | | |
| Initial Class | — | (2,317,718) |
| Service Class | — | (49,413,476) |
| Total distributions to shareholders | — | (51,731,194) |
| Capital share transactions: | | |
| Net proceeds from sales of shares | 13,117,330 | 44,548,280 |
| Net asset value of shares issued to shareholder in reinvestment of distributions | — | 51,731,194 |
| Cost of shares redeemed | (84,609,221) | (213,972,555) |
| Increase (decrease) in net assets derived from capital share transactions | (71,491,891) | (117,693,081) |
| Net increase (decrease) in net assets | 6,548,997 | (61,506,331) |
| Net Assets |
| Beginning of period | 1,085,925,244 | 1,147,431,575 |
| End of period | $1,092,474,241 | $1,085,925,244 |
The notes to the financial statements are an integral part of, and should be read in conjunction with, the financial statements.
27
Financial Highlights selected per share data and ratios
| | Six months ended
June 30,
2021* | | Year Ended December 31, |
| Initial Class | 2020 | | 2019 | | 2018 | | 2017 | | 2016 |
| Net asset value at beginning of period | $ 11.99 | | $ 11.32 | | $ 10.33 | | $ 11.89 | | $ 10.57 | | $ 10.59 |
| Net investment income (loss) (a) | 0.04 | | 0.20 | | 0.23 | | 0.23 | | 0.20 | | 0.19 |
| Net realized and unrealized gain (loss) on investments | 0.86 | | 1.07 | | 1.60 | | (1.16) | | 1.36 | | 0.48 |
| Total from investment operations | 0.90 | | 1.27 | | 1.83 | | (0.93) | | 1.56 | | 0.67 |
| Less distributions: | | | | | | | | | | | |
| From net investment income | — | | (0.29) | | (0.36) | | (0.27) | | (0.19) | | (0.24) |
| From net realized gain on investments | — | | (0.31) | | (0.48) | | (0.36) | | (0.05) | | (0.45) |
| Total distributions | — | | (0.60) | | (0.84) | | (0.63) | | (0.24) | | (0.69) |
| Net asset value at end of period | $ 12.89 | | $ 11.99 | | $ 11.32 | | $ 10.33 | | $ 11.89 | | $ 10.57 |
| Total investment return (b) | 7.51%(c) | | 11.57% | | 18.29% | | (8.40)% | | 14.97% | | 6.41% |
| Ratios (to average net assets)/Supplemental Data: | | | | | | | | | | | |
| Net investment income (loss) | 0.63%†† | | 1.83% | | 2.04% | | 1.99% | | 1.79% | | 1.76% |
| Net expenses (d) | 0.03%†† | | 0.03% | | 0.03% | | 0.02% | | 0.02% | | 0.03% |
| Portfolio turnover rate | 13% | | 31% | | 40% | | 52% | | 33% | | 40% |
| Net assets at end of period (in 000’s) | $ 52,715 | | $ 48,025 | | $ 45,283 | | $ 43,161 | | $ 49,419 | | $ 43,873 |
| * | Unaudited. |
| †† | Annualized. |
| (a) | Per share data based on average shares outstanding during the period. |
| (b) | Total return does not reflect any deduction of sales charges, mortality and expense charges, contract charges or administrative charges. For periods of less than one year, total return is not annualized. |
| (c) | Total investment return may reflect adjustments to conform to generally accepted accounting principles. |
| (d) | In addition to the fees and expenses which the Portfolio bears directly, it also indirectly bears a pro-rata share of the fees and expenses of the underlying funds in which it invests. Such indirect expenses are not included in the above expense ratios. |
| | Six months ended
June 30,
2021* | | Year Ended December 31, |
| Service Class | 2020 | | 2019 | | 2018 | | 2017 | | 2016 |
| Net asset value at beginning of period | $ 11.88 | | $ 11.22 | | $ 10.23 | | $ 11.79 | | $ 10.48 | | $ 10.51 |
| Net investment income (loss) (a) | 0.02 | | 0.17 | | 0.20 | | 0.20 | | 0.17 | | 0.16 |
| Net realized and unrealized gain (loss) on investments | 0.86 | | 1.06 | | 1.60 | | (1.16) | | 1.36 | | 0.47 |
| Total from investment operations | 0.88 | | 1.23 | | 1.80 | | (0.96) | | 1.53 | | 0.63 |
| Less distributions: | | | | | | | | | | | |
| From net investment income | — | | (0.26) | | (0.33) | | (0.24) | | (0.17) | | (0.21) |
| From net realized gain on investments | — | | (0.31) | | (0.48) | | (0.36) | | (0.05) | | (0.45) |
| Total distributions | — | | (0.57) | | (0.81) | | (0.60) | | (0.22) | | (0.66) |
| Net asset value at end of period | $ 12.76 | | $ 11.88 | | $ 11.22 | | $ 10.23 | | $ 11.79 | | $ 10.48 |
| Total investment return (b) | 7.41%(c) | | 11.29% | | 18.00% | | (8.63)% | | 14.68% | | 6.14% |
| Ratios (to average net assets)/Supplemental Data: | | | | | | | | | | | |
| Net investment income (loss) | 0.37%†† | | 1.52% | | 1.76% | | 1.73% | | 1.53% | | 1.52% |
| Net expenses (d) | 0.28%†† | | 0.28% | | 0.27% | | 0.27% | | 0.27% | | 0.28% |
| Portfolio turnover rate | 13% | | 31% | | 40% | | 52% | | 33% | | 40% |
| Net assets at end of period (in 000’s) | $ 1,039,759 | | $ 1,037,900 | | $ 1,102,149 | | $ 1,103,235 | | $ 1,288,895 | | $ 1,171,213 |
| * | Unaudited. |
| †† | Annualized. |
| (a) | Per share data based on average shares outstanding during the period. |
| (b) | Total return does not reflect any deduction of sales charges, mortality and expense charges, contract charges or administrative charges. For periods of less than one year, total return is not annualized. |
| (c) | Total investment return may reflect adjustments to conform to generally accepted accounting principles. |
| (d) | In addition to the fees and expenses which the Portfolio bears directly, it also indirectly bears a pro-rata share of the fees and expenses of the underlying funds in which it invests. Such indirect expenses are not included in the above expense ratios. |
The notes to the financial statements are an integral part of, and should be read in conjunction with, the financial statements.
| 28 | MainStay VP Moderate Allocation Portfolio |
MainStay VP Growth Allocation Portfolio
Investment and Performance Comparison (Unaudited)
Performance data quoted represents past performance. Past performance is no guarantee of future results. Because of market volatility and other factors, current performance may be lower or higher than the figures shown. Investment return and principal value will fluctuate, and as a result, when shares are redeemed, they may be worth more or less than their original cost. The performance table and graph do not reflect any deduction of sales charges, mortality and expense charges, contract charges or administrative charges. Please refer to the Performance Summary appropriate for your policy. For performance information current to the most recent month-end, please call 800-598-2019 or visit www.newyorklife.com.
Performance figures may reflect certain fee waivers and/or expense limitations, without which total returns may have been different. For information on current fee waivers and/or expense limitations (if any), please refer to the Notes to Financial Statements.
| Average Annual Total Returns for the Period-Ended June 30, 2021 |
| Class | Inception
Date | Six
Months | One
Year | Five
Years | Ten
Years | Gross
Expense
Ratio1 |
| Initial Class Shares | 2/13/2006 | 10.95% | 32.37% | 11.51% | 9.07% | 0.71% |
| Service Class Shares | 2/13/2006 | 10.81 | 32.04 | 11.23 | 8.80 | 0.96 |
| 1. | The gross expense ratios presented reflect the Portfolio’s “Total Annual Portfolio Operating Expenses” from the most recent Prospectus, as supplemented, and may differ from other expense ratios disclosed in this report. |
| Benchmark Performance | Six
Months | One
Year | Five
Years | Ten
Years |
| S&P 500® Index1 | 15.25% | 40.79% | 17.65% | 14.84% |
| MSCI EAFE® Index (Net)2 | 8.83 | 32.35 | 10.28 | 5.89 |
| Bloomberg Barclays U.S. Aggregate Bond Index3 | -1.60 | -0.33 | 3.03 | 3.39 |
| Growth Allocation Composite Index4 | 10.46 | 30.11 | 13.35 | 10.98 |
| Morningstar Allocation—70% to 85% Equity Category Average5 | 15.45 | 32.58 | 10.98 | 8.41 |
| 1. | The S&P 500® Index is the Portfolio's primary benchmark. “S&P 500®" is a trademark of The McGraw-Hill Companies, Inc. The S&P 500® Index is widely regarded as the standard index for measuring large-cap U.S. stock market performance. Results assume reinvestment of all dividends and capital gains. An investment cannot be made directly in an index. |
| 2. | The MSCI EAFE® Index (Net) is the Portfolio's secondary benchmark. The MSCI EAFE® Index (Net) consists of international stocks representing the developed world outside of North America. Results assume reinvestment of all dividends and capital gains. An investment cannot be made directly in an index. |
| 3. | The Portfolio has selected the Bloomberg Barclays U.S. Aggregate Bond Index as an additional benchmark. The Bloomberg Barclays U.S. Aggregate Bond Index is a broad-based benchmark that measures the investment grade, U.S. dollar-denominated, fixed-rate taxable bond market, including Treasurys, government-related and corporate securities, mortgage-backed securities (agency fixed-rate and hybrid adjustable rate mortgage passthroughs), asset-backed securities, and commercial mortgage-backed securities. Results assume reinvestment of all dividends and capital gains. An investment cannot be made directly in an index. |
| 4. | The Portfolio has selected the Growth Allocation Composite Index as an additional benchmark. The Growth Allocation Composite Index consists of the S&P 500® Index, the MSCI EAFE® Index (Net) and the Bloomberg Barclays U.S. Aggregate Bond Index weighted 60%, 20% and 20%, respectively. Results assume reinvestment of all dividends and capital gains. An investment cannot be made directly in an index. |
| 5. | The Morningstar Allocation—70% to 85% Equity Category Average is representative of funds that seek to provide both income and capital appreciation by investing in multiple asset classes, including stocks, bonds, and cash. These funds are dominated by domestic holdings and have equity exposures between 70% and 85%. Results are based on average total returns of similar funds with all dividends and capital gain distributions reinvested. |
Cost in Dollars of a $1,000 Investment in MainStay VP Growth Allocation Portfolio (Unaudited)
The example below is intended to describe the fees and expenses borne by shareholders during the six-month period from January 1, 2021 to June 30, 2021, and the impact of those costs on your investment.
Example
As a shareholder of the Portfolio you incur two types of costs: (1) transaction costs, including exchange fees and sales charges (loads) on purchases (as applicable), and (2) ongoing costs, including management fees, distribution and/or service (12b-1) fees, and other Portfolio expenses (as applicable). This example is intended to help you understand your ongoing costs (in dollars) of investing in the Portfolio and to compare these costs with the ongoing costs of investing in other mutual funds. The example is based on an investment of $1,000 made at the beginning of the six-month period and held for the entire period from January 1, 2021 to June 30, 2021. Shares are only sold in connection with variable life and annuity contracts and the example does not reflect any contract level or transactional fees or expenses. If these costs had been included, your costs would have been higher.
This example illustrates your Portfolio’s ongoing costs in two ways:
Actual Expenses
The second and third data columns in the table below provide information about actual account values and actual expenses. You may use the information in these columns, together with the amount you invested, to estimate the expenses that you paid during the six months ended June
30, 2021. Simply divide your account value by $1,000 (for example, an $8,600 account value divided by $1,000 = 8.6), then multiply the result by the number under the heading entitled “Expenses Paid During Period” to estimate the expenses you paid on your account during this period.
Hypothetical Example for Comparison Purposes
The fourth and fifth data columns in the table below provide information about hypothetical account values and hypothetical expenses based on the Portfolio’s actual expense ratio and an assumed rate of return of 5% per year before expenses, which is not the Portfolio’s actual return. The hypothetical account values and expenses may not be used to estimate the actual ending account balances or expenses you paid for the six-month period shown. You may use this information to compare the ongoing costs of investing in the Portfolio with the ongoing costs of investing in other mutual funds. To do so, compare this 5% hypothetical example with the 5% hypothetical examples that appear in the shareholder reports of the other mutual funds.
Please note that the expenses shown in the table are meant to highlight your ongoing costs only and do not reflect any transactional costs, such as exchange fees or sales charges (loads). Therefore, the fourth and fifth data columns of the table are useful in comparing ongoing costs only and will not help you determine the relative total costs of owning different funds. In addition, if these transactional costs were included, your costs would have been higher.
| Share Class | Beginning
Account
Value
1/1/21 | Ending Account
Value (Based
on Actual
Returns and
Expenses)
6/30/21 | Expenses
Paid
During
Period1 | Ending Account
Value (Based
on Hypothetical
5% Annualized
Return and
Actual Expenses)
6/30/21 | Expenses
Paid
During
Period1 | Net Expense
Ratio
During
Period2 |
| Initial Class Shares | $1,000.00 | $1,109.50 | $0.10 | $1,024.70 | $0.10 | 0.02% |
| Service Class Shares | $1,000.00 | $1,108.10 | $1.41 | $1,023.46 | $1.35 | 0.27% |
| 1. | Expenses are equal to the Portfolio’s annualized expense ratio of each class multiplied by the average account value over the period, divided by 365 and multiplied by 181 (to reflect the six-month period). The table above represents the actual expenses incurred during the six-month period. In addition to the fees and expenses which the Portfolio bears directly, it also indirectly bears a pro rata share of the fees and expenses of the underlying Portfolios/Funds in which it invests. Such indirect expenses are not included in the above-reported expense figures. |
| 2. | Expenses are equal to the Portfolio's annualized expense ratio to reflect the six-month period. |
| 30 | MainStay VP Growth Allocation Portfolio |
Asset Diversification as of June 30, 2021 (Unaudited)
| Equity Funds | 77.3 % |
| Fixed Income Funds | 15.2 |
| Short-Term Investments | 7.7 |
| Other Assets, Less Liabilities | (0.2) |
See Portfolio of Investments beginning on page 35 for specific holdings within these categories. The Portfolio’s holdings are subject to change.
Portfolio Management Discussion and Analysis (Unaudited)
Answers to the questions reflect the views of portfolio managers Jae S. Yoon, CFA, Jonathan Swaney, Poul Kristensen, CFA, and Amit Soni, CFA, of New York Life Investments1 the Portfolio’s Manager .
How did MainStay VP Growth Allocation Portfolio perform relative to its benchmarks and peers during the six months ended June 30, 2021?
For the six months ended June 30, 2021, MainStay VP Growth Allocation Portfolio returned 10.95% for Initial Class shares and 10.81% for Service Class shares. Over the same period, both share classes underperformed the 15.25% return of the S&P 500® Index, which is the Portfolio’s primary benchmark, and outperformed the 8.83% return of the MSCI EAFE® Index (Net), which is a secondary benchmark of the Portfolio. For the six months ended June 30, 2021, both share classes outperformed the −1.60% return of the Bloomberg Barclays U.S. Aggregate Bond Index and the 10.46% return of the Growth Allocation Composite Index, which are additional benchmarks of the Portfolio. Over the same period, both share classes underperformed the 15.45% return of the Morningstar Allocation—70% to 85% Equity Category Average.2
Were there any changes to the Portfolio during the reporting period?
Effective May 1, 2021 the Portfolio’s name changed from MainStay VP Moderate Growth Allocation Portfolio to MainStay VP Growth Allocation Portfolio.
What factors affected the Portfolio’s relative performance during the reporting period?
The Portfolio is a “fund of funds,” meaning that it seeks to achieve its investment objective by investing primarily in mutual funds and exchange-traded funds (“ETFs”) managed by New York Life Investments or its affiliates (the “Underlying Portfolios/Funds”). The Underlying Portfolios/Funds may invest in U.S. equities, international equities and fixed-income instruments, making comparisons to any single index generally less suitable than a weighted combination of indices, which is a more useful yardstick by which to measure performance. The most influential factor affecting relative performance for the Portfolio versus the performance of a weighted combination of indices is the net performance of the Underlying Portfolios/Funds relative to their respective benchmarks.
Performance among the Portfolio’s Underlying Portfolio/Fund investments during the reporting period proved mixed, with little positive or negative contribution to active return. Instead, asset class policy was primarily responsible for the Portfolio’s underperformance compared with the internally maintained blend of indices taken into consideration when managing the Portfolio. Three positions stand out, starting with the Portfolio’s non-U.S. equity exposure. Equity markets posted an historic rebound off
their March 2020 lows, with U.S. markets leading due to a potent policy mix and ambitious vaccination rollout plans. We expected that stock markets in other nations would follow a similar trajectory as vaccination rates climbed and international economies more fully opened, closing the performance gap with U.S. equities. Accordingly, we increased the Portfolio’s exposure to non-U.S. markets. However, during the reporting period, foreign markets generally failed to keep pace with U.S. markets, thereby undermining the Portfolio’s relative returns.
Second, the Portfolio maintained lower-than-benchmark exposure to the floating rate loan market. We adopted this position as, in our view, underwriting standards tend to be less rigorous in the loan market today than was the case a few years ago. This deterioration in creditworthiness, coupled with already tight spreads3 and pockets of economic instability, led us to hold underweight exposure to the floating rate loan market. However, during the reporting period, loans performed well amid an ongoing hunt for yield and as investors prepared for tighter monetary policy down the road.
Finally, the Portfolio started the reporting period emphasizing large companies over small, reflecting our distrust of the degree to which small-cap stocks outperformed the broader market in the closing months of 2020. However, small caps continued to lead the market higher well into 2021, creating a headwind to performance. While that trend reversed to a degree during the reporting period, it did not do so until the size bias within the Portfolio was largely eliminated.
During the reporting period, how was the Portfolio’s performance materially affected by investments in derivatives?
Total return swaps were used to express most of the Portfolio’s asset class policy views and can be seen as detracting from performance during the reporting period.
How did you allocate the Portfolio’s assets during the reporting period and why?
The announcements in late 2020 of highly successful clinical trials for both the Moderna and Pfizer vaccines, followed shortly thereafter by granting of emergency use authorization and rapid distribution to the most vulnerable elements of the population, played a significant role in our determination of how best to allocate the Portfolio’s assets. As the vaccines brought the end of pandemic restrictions into view, we adjusted the Portfolio to favor pro-cyclical sectors and businesses in industries we believed likely to benefit most from the reopening of the economy.
| 1. | “New York Life Investments” is a service mark used by New York Life Investment Management Holdings LLC and its subsidiary New York Life Investment Management LLC. |
| 2. | See page 29 for more information on benchmark and peer group returns. |
| 3. | The terms “spread” and “yield spread” may refer to the difference in yield between a security or type of security and comparable U.S. Treasury issues. The terms may also refer to the difference in yield between two specific securities or types of securities at a given time. |
| 32 | MainStay VP Growth Allocation Portfolio |
Similarly, we slid the Portfolio’s holdings a little way down the capitalization spectrum, committing a larger allocation of assets to small- and mid-cap companies likely to fare well in this environment. We also reduced interest rate sensitivity within the bond portion of the Portfolio, anticipating that mounting inflationary pressures would result in higher bond yields. These adjustments provided a modest tailwind for much of 2021 before undergoing an abrupt and puzzling reversal from mid-May through the end of June, at which time they detracted from Portfolio performance.
How did the Portfolio’s allocations change over the course of the reporting period?
The asset class repositioning noted above was largely implemented using derivatives, specifically total return swaps. These instruments increased the Portfolio’s exposure to small- and mid-cap stocks, non-U.S. markets and a basket of companies specifically leveraged to the reopening of the economy. The same approach was used to reduce the Portfolio’s exposure to large-cap U.S. stocks and a basket of companies identified as having been beneficiaries of lockdown conditions.
We also made a few adjustments at the Underlying Portfolio/Fund level, the most pronounced being a reduction in the Portfolio’s holdings of MainStay VP Indexed Bond Portfolio and MainStay VP Bond Portfolio, with proceeds being redirected to a mix of cash, MainStay VP Floating Rate Portfolio, MainStay VP MacKay High Yield Corporate Bond Portfolio and MainStay Short Term Bond Fund. Our goal was to lessen the Portfolio’s interest rate sensitivity at a time when we believed yields might rise in response to mounting inflationary concerns.
Other notable changes arose from portfolio restructurings as Wellington Management Company was named the new subadvisor on several MainStay products that concurrently underwent name changes. A few funds were also subject to mergers. For example, MainStay MacKay Common Stock Fund was renamed MainStay WMC Enduring Capital Fund when Wellington took the helm in early March, and MainStay Epoch U.S. All Cap Fund was subsequently merged into the renamed fund a short while later, thereby making the Portfolio an investor in MainStay WMC Enduring Capital Fund. Similarly, “new” positions arising from restructurings can be found in MainStay VP Wellington Growth Portfolio, MainStay WMC International Research Equity Fund and MainStay WMC Value Fund, among others.
Which Underlying Equity Portfolios/Funds had the highest total returns during the reporting period, and which Underlying Equity Portfolios/Funds had the lowest total returns?
Of the Underlying Equity Funds held for the entire reporting period, those posting the largest total returns included IQ Chaikin U.S. Small Cap ETF, MainStay WMC Enduring Capital Fund (encompassing MainStay Epoch U.S. All Cap Fund after the merger cited above) and MainStay VP T. Rowe Price Equity Income Portfolio. The Underlying Equity Funds with the lowest total returns (none generated losses) were MainStay Epoch International Choice Fund, MainStay VP MacKay International Equity Portfolio and IQ Candriam ESG International Equity ETF.
Which Underlying Equity Portfolios/Funds made the strongest positive contributions to the Portfolio’s overall performance, and which Underlying Equity Portfolios/ Funds were the greatest detractors?
Allowing for the size of the allocation, the variation of that allocation across the reporting period and performance during that window of time, the Underlying Equity Funds making the strongest positive contributions to the Fund’s total return included MainStay VP MacKay S&P 500 Index Portfolio, MainStay VP Winslow Large Cap Growth Portfolio and MainStay WMC Enduring Capital Fund (encompassing MainStay Epoch U.S. All Cap Fund after the merger). Those detracting most from total returns were MainStay VP Wellington U.S. Equity Portfolio, MainStay Epoch Capital Growth Fund and MainStay VP MacKay International Equity Portfolio.
What factors and risks affected the Portfolio’s Underlying Fixed-Income Portfolio/Fund investments during the reporting period?
Long bond yields moved sharply higher in the first quarter of 2021, with the rise presumably linked to investors’ growing awareness of potential inflationary pressures. The increase was partially reversed in the second quarter with two factors at work, in our view. First, evidence suggested that the U.S. economy was moving past “peak growth”. Second, commentary from U.S. Federal Reserve officials and the release of the Statement of Economic Projections by the Federal Open Market Committee (FOMC) suggested that the FOMC might be willing to tighten policy sooner than previously assumed. At the same time, credit spreads tightened further, likely due to ample liquidity coupled with strong corporate fundaments.
During the reporting period, which fixed-income market segments were the strongest positive contributors to the Portfolio’s performance and which segments were particularly weak?
As a rule, lower-quality credits (such as speculative-grade bonds and bank loans) and shorter-duration4 assets made the strongest positive contributions to the Portfolio’s performance. (Contributions take weightings and total returns into account.) Conversely, high-quality, long-maturity bonds gave up a little ground.
Which Underlying Fixed-Income Portfolios/Funds made the strongest positive contributions to the Portfolio’s performance, and which Underlying Fixed-Income Portfolios/Funds were the greatest detractors?
Allowing for the size of the allocation, the variation of that allocation across the reporting period and performance during that window of time, the Underlying Fixed-Income Portfolios/Funds contributing most to the Fund’s return were MainStay MacKay Short Duration High Yield Fund and MainStay VP Floating Rate Portfolio. MainStay VP Indexed Bond Portfolio and MainStay VP Bond Portfolio detracted most significantly from performance.
| 4. | Duration is a measure of the price sensitivity of a fixed-income investment to changes in interest rates. Duration is expressed as a number of years and is considered a more accurate sensitivity gauge than average maturity. |
The opinions expressed are those of the portfolio managers as of the date of this report and are subject to change. There is no guarantee that any forecasts will come to pass. This material does not constitute investment advice and is not intended as an endorsement of any specific investment.
Not all MainStay VP Portfolios and/or share classes are available under all policies.
| 34 | MainStay VP Growth Allocation Portfolio |
Portfolio of Investments June 30, 2021† (Unaudited)
| | Shares | Value |
| Affiliated Investment Companies 92.5% |
| Equity Funds 77.3% |
| IQ 50 Percent Hedged FTSE International ETF (a) | 1,705,039 | $ 42,233,816 |
| IQ 500 International ETF (a) | 2,056,710 | 67,099,135 |
| IQ Candriam ESG International Equity ETF (a) | 1,216,519 | 36,069,788 |
| IQ Candriam ESG U.S. Equity ETF (a) | 2,871,868 | 105,677,275 |
| IQ Chaikin U.S. Large Cap ETF (a) | 2,425,477 | 80,902,998 |
| IQ Chaikin U.S. Small Cap ETF (a) | 711,422 | 25,330,038 |
| MainStay Epoch Capital Growth Fund Class I (a) | 440,640 | 7,024,279 |
| MainStay Epoch International Choice Fund Class I (a) | 1,290,054 | 53,789,198 |
| MainStay VP Candriam Emerging Markets Equity Portfolio Initial Class (a) | 5,580,184 | 71,075,363 |
| MainStay VP Epoch U.S. Equity Yield Portfolio Initial Class (a) | 4,664,097 | 80,097,472 |
| MainStay VP MacKay International Equity Portfolio Initial Class (a) | 1,594,183 | 31,999,563 |
| MainStay VP MacKay S&P 500 Index Portfolio Initial Class | 1,600,017 | 131,574,172 |
| MainStay VP Small Cap Growth Portfolio Initial Class (a) | 5,039,444 | 100,069,246 |
| MainStay VP T. Rowe Price Equity Income Portfolio Initial Class (a) | 4,955,200 | 67,794,071 |
| MainStay VP Wellington Growth Portfolio Initial Class (a) | 914,306 | 40,697,119 |
| MainStay VP Wellington Mid Cap Portfolio Initial Class (a) | 3,816,000 | 61,812,718 |
| MainStay VP Wellington Small Cap Portfolio Initial Class (a) | 4,104,760 | 56,226,597 |
| MainStay VP Wellington U.S. Equity Portfolio Initial Class | 8,225 | 270,409 |
| MainStay VP Winslow Large Cap Growth Portfolio Initial Class (a) | 3,408,977 | 125,857,726 |
| MainStay WMC Enduring Capital Fund Class R6 (a) | 2,115,393 | 70,945,849 |
| MainStay WMC International Research Equity Fund Class I (a) | 6,499,522 | 52,898,962 |
| MainStay WMC Value Fund Class R6 (a) | 1,616,171 | 88,154,040 |
Total Equity Funds
(Cost $1,116,847,820) | | 1,397,599,834 |
| | Shares | | Value |
| |
| Fixed Income Funds 15.2% |
| MainStay MacKay Short Duration High Yield Fund Class I (a) | 8,333,670 | | $ 82,574,999 |
| MainStay Short Term Bond Fund Class I (a) | 925,295 | | 9,118,043 |
| MainStay VP Bond Portfolio Initial Class | 910,023 | | 13,821,793 |
| MainStay VP Floating Rate Portfolio Initial Class (a) | 8,230,639 | | 73,109,475 |
| MainStay VP Indexed Bond Portfolio Initial Class (a) | 3,747,942 | | 41,395,268 |
| MainStay VP MacKay High Yield Corporate Bond Portfolio Initial Class | 3,567,932 | | 36,756,480 |
| MainStay VP PIMCO Real Return Portfolio Initial Class | 1,903,843 | | 18,321,822 |
Total Fixed Income Funds
(Cost $272,581,834) | | | 275,097,880 |
Total Affiliated Investment Companies
(Cost $1,389,429,654) | | | 1,672,697,714 |
| Short-Term Investment 7.7% |
| Affiliated Investment Company 7.7% |
| MainStay U.S. Government Liquidity Fund, 0.01% (a)(b) | 138,892,599 | | 138,892,599 |
Total Short-Term Investment
(Cost $138,892,599) | 7.7% | | 138,892,599 |
Total Investments
(Cost $1,528,322,253) | 100.2% | | 1,811,590,313 |
| Other Assets, Less Liabilities | (0.2) | | (3,443,863) |
| Net Assets | 100.0% | | $ 1,808,146,450 |
| † | Percentages indicated are based on Portfolio net assets. |
| (a) | As of June 30, 2021, the Portfolio’s ownership exceeds 5% of the outstanding shares of the Underlying Portfolio's/Fund's share class. |
| (b) | Current yield as of June 30, 2021. |
The notes to the financial statements are an integral part of, and should be read in conjunction with, the financial statements.
35
Portfolio of Investments June 30, 2021† (Unaudited) (continued)
Swap Contracts
Open OTC total return equity swap contracts as of June 30, 2021 were as follows1:
Swap
Counterparty | Reference Obligation | Floating Rate2 | Termination
Date(s) | Payment
Frequency
Paid/
Received | Notional
Amount
Long/
(Short)
(000)3 | Unrealized
Appreciation/
(Depreciation)4 |
| Citibank NA | Citi 2nd Wave Virus Basket | 1 month LIBOR BBA plus 0.35% | 12/2/21 | Monthly | 13,084 | $ — |
| Citibank NA | Citi Stay at Home Basket | 1 month LIBOR BBA minus 0.30% | 12/2/21 | Monthly | (15,807) | — |
| Citibank NA | iShares MSCI EAFE ETF | 1 month LIBOR BBA plus 0.40% | 12/2/21 | Monthly | 61,923 | — |
| Citibank NA | iShares MSCI EAFE Small-Cap ETF | 1 month LIBOR BBA plus 0.55% | 12/2/21 | Monthly | 17,684 | — |
| Citibank NA | iShares MSCI USA Momentum Factor ETF | 1 month LIBOR BBA plus 0.55% | 12/2/21 | Monthly | 42,827 | — |
| Citibank NA | Russell 1000 Growth Total Return Index | 1 month LIBOR BBA plus 0.03% | 12/2/21 | Monthly | (77,802) | — |
| Citibank NA | Russell 2000 Total Return Index | 1 month LIBOR BBA minus 0.07% | 12/2/21 | Monthly | (24,496) | — |
| Citibank NA | Russell Midcap Total Return Index | 1 month LIBOR BBA plus 0.31% | 12/2/21 | Monthly | 73,845 | — |
| Citibank NA | S&P 500 Total Return Index | 1 month LIBOR BBA plus 0.10% | 12/2/21 | Monthly | (37,782) | — |
| Citibank NA | VanEck Vectors Gold Miners ETF | 1 month LIBOR BBA plus 0.50% | 12/2/21 | Monthly | 15,331 | — |
| | | | | | | $ — |
| 1. | As of June 30, 2021, cash in the amount $9,000,000 was pledged to brokers for OTC swap contracts. |
| 2. | Portfolio pays the floating rate and receives the total return of the reference entity. |
| 3. | Notional amounts reflected as a positive value indicate a long position held by the Portfolio or Index and a negative value indicates a short position. |
| 4. | Reflects the value at reset date as of June 30, 2021. |
| Abbreviation(s): |
| BBA—British Bankers’ Association |
| EAFE—Europe, Australasia and Far East |
| ETF—Exchange-Traded Fund |
| FTSE—Financial Times Stock Exchange |
| LIBOR—London Interbank Offered Rate |
| MSCI—Morgan Stanley Capital International |
The following is a summary of the fair valuations according to the inputs used as of June 30, 2021, for valuing the Portfolio’s assets:
| Description | Quoted
Prices in
Active
Markets for
Identical
Assets
(Level 1) | | Significant
Other
Observable
Inputs
(Level 2) | | Significant
Unobservable
Inputs
(Level 3) | | Total |
| Asset Valuation Inputs | | | | | | | |
| Investments in Securities (a) | | | | | | | |
| Affiliated Investment Companies | | | | | | | |
| Equity Funds | $ 1,397,599,834 | | $ — | | $ — | | $ 1,397,599,834 |
| Fixed Income Funds | 275,097,880 | | — | | — | | 275,097,880 |
| Total Affiliated Investment Companies | 1,672,697,714 | | — | | — | | 1,672,697,714 |
| Short-Term Investment | | | | | | | |
| Affiliated Investment Company | 138,892,599 | | — | | — | | 138,892,599 |
| Total Investments in Securities | $ 1,811,590,313 | | $ — | | $ — | | $ 1,811,590,313 |
| (a) | For a complete listing of investments, see the Portfolio of Investments. |
The notes to the financial statements are an integral part of, and should be read in conjunction with, the financial statements.
| 36 | MainStay VP Growth Allocation Portfolio |
Statement of Assets and Liabilities as of June 30, 2021 (Unaudited)
| Assets |
Investment in affiliated investment companies, at value
(identified cost $1,528,322,253) | $1,811,590,313 |
| Cash collateral on deposit at broker for swap contracts | 9,000,000 |
| Receivables: | |
| Dividends | 167,430 |
| Other assets | 18,986 |
| Total assets | 1,820,776,729 |
| Liabilities |
| Payables: | |
| Dividends and interest on OTC swaps contracts | 9,630,169 |
| Portfolio shares redeemed | 2,241,140 |
| NYLIFE Distributors (See Note 3) | 352,602 |
| Investment securities purchased | 166,363 |
| Shareholder communication | 161,767 |
| Professional fees | 62,699 |
| Custodian | 15,211 |
| Trustees | 328 |
| Total liabilities | 12,630,279 |
| Net assets | $1,808,146,450 |
| Composition of Net Assets |
| Shares of beneficial interest outstanding (par value of $.001 per share) unlimited number of shares authorized | $ 135,307 |
| Additional paid-in-capital | 1,447,849,302 |
| | 1,447,984,609 |
| Total distributable earnings (loss) | 360,161,841 |
| Net assets | $1,808,146,450 |
| Initial Class | |
| Net assets applicable to outstanding shares | $ 104,816,602 |
| Shares of beneficial interest outstanding | 7,751,923 |
| Net asset value per share outstanding | $ 13.52 |
| Service Class | |
| Net assets applicable to outstanding shares | $1,703,329,848 |
| Shares of beneficial interest outstanding | 127,555,117 |
| Net asset value per share outstanding | $ 13.35 |
The notes to the financial statements are an integral part of, and should be read in conjunction with, the financial statements.
37
Statement of Operations for the six months ended June 30, 2021 (Unaudited)
| Investment Income (Loss) |
| Income | |
| Dividend distributions from affiliated investment companies | $ 6,482,039 |
| Expenses | |
| Distribution/Service—Service Class (See Note 3) | 2,131,156 |
| Shareholder communication | 86,532 |
| Professional fees | 77,055 |
| Custodian | 23,611 |
| Trustees | 18,793 |
| Miscellaneous | 18,676 |
| Total expenses | 2,355,823 |
| Net investment income (loss) | 4,126,216 |
| Realized and Unrealized Gain (Loss) |
| Net realized gain (loss) on: | |
| Affiliated investment company transactions | 49,335,530 |
| Realized capital gain distributions from affiliated investment companies | 31,598,405 |
| Swap transactions | 2,835,398 |
| Net realized gain (loss) | 83,769,333 |
Net change in unrealized appreciation (depreciation) on:
Affiliated investments companies | 99,490,874 |
| Net realized and unrealized gain (loss) | 183,260,207 |
| Net increase (decrease) in net assets resulting from operations | $187,386,423 |
The notes to the financial statements are an integral part of, and should be read in conjunction with, the financial statements.
| 38 | MainStay VP Growth Allocation Portfolio |
Statements of Changes in Net Assets
for the six months ended June 30, 2021 (Unaudited) and the year ended December 31, 2020
| | 2021 | 2020 |
| Increase (Decrease) in Net Assets |
| Operations: | | |
| Net investment income (loss) | $ 4,126,216 | $ 27,223,667 |
| Net realized gain (loss) | 83,769,333 | 32,814,256 |
| Net change in unrealized appreciation (depreciation) | 99,490,874 | 137,830,502 |
| Net increase (decrease) in net assets resulting from operations | 187,386,423 | 197,868,425 |
| Distributions to shareholders: | | |
| Initial Class | — | (5,689,162) |
| Service Class | — | (99,239,141) |
| Total distributions to shareholders | — | (104,928,303) |
| Capital share transactions: | | |
| Net proceeds from sales of shares | 4,707,236 | 31,035,516 |
| Net asset value of shares issued to shareholder in reinvestment of distributions | — | 104,928,303 |
| Cost of shares redeemed | (193,883,799) | (379,216,886) |
| Increase (decrease) in net assets derived from capital share transactions | (189,176,563) | (243,253,067) |
| Net increase (decrease) in net assets | (1,790,140) | (150,312,945) |
| Net Assets |
| Beginning of period | 1,809,936,590 | 1,960,249,535 |
| End of period | $1,808,146,450 | $1,809,936,590 |
The notes to the financial statements are an integral part of, and should be read in conjunction with, the financial statements.
39
Financial Highlights selected per share data and ratios
| | Six months ended
June 30,
2021* | | Year Ended December 31, |
| Initial Class | 2020 | | 2019 | | 2018 | | 2017 | | 2016 |
| Net asset value at beginning of period | $ 12.19 | | $ 11.51 | | $ 10.57 | | $ 12.61 | | $ 11.00 | | $ 11.08 |
| Net investment income (loss) (a) | 0.04 | | 0.21 | | 0.26 | | 0.21 | | 0.17 | | 0.18 |
| Net realized and unrealized gain (loss) on investments | 1.29 | | 1.21 | | 1.91 | | (1.47) | | 1.86 | | 0.64 |
| Total from investment operations | 1.33 | | 1.42 | | 2.17 | | (1.26) | | 2.03 | | 0.82 |
| Less distributions: | | | | | | | | | | | |
| From net investment income | — | | (0.34) | | (0.39) | | (0.24) | | (0.18) | | (0.24) |
| From net realized gain on investments | — | | (0.40) | | (0.84) | | (0.54) | | (0.24) | | (0.66) |
| Total distributions | — | | (0.74) | | (1.23) | | (0.78) | | (0.42) | | (0.90) |
| Net asset value at end of period | $ 13.52 | | $ 12.19 | | $ 11.51 | | $ 10.57 | | $ 12.61 | | $ 11.00 |
| Total investment return (b) | 10.91%(c) | | 12.94% | | 21.42% | | (10.73)% | | 18.62% | | 7.56% |
| Ratios (to average net assets)/Supplemental Data: | | | | | | | | | | | |
| Net investment income (loss) | 0.70%†† | | 1.87% | | 2.22% | | 1.71% | | 1.43% | | 1.60% |
| Net expenses (d) | 0.02%†† | | 0.03% | | 0.02% | | 0.02% | | 0.02% | | 0.03% |
| Portfolio turnover rate | 11% | | 32% | | 41% | | 44% | | 31% | | 33% |
| Net assets at end of period (in 000’s) | $ 104,817 | | $ 98,314 | | $ 91,615 | | $ 80,133 | | $ 90,089 | | $ 76,025 |
| * | Unaudited. |
| †† | Annualized. |
| (a) | Per share data based on average shares outstanding during the period. |
| (b) | Total return does not reflect any deduction of sales charges, mortality and expense charges, contract charges or administrative charges. For periods of less than one year, total return is not annualized. |
| (c) | Total investment return may reflect adjustments to conform to generally accepted accounting principles. |
| (d) | In addition to the fees and expenses which the Portfolio bears directly, it also indirectly bears a pro-rata share of the fees and expenses of the underlying funds in which it invests. Such indirect expenses are not included in the above expense ratios. |
| | Six months ended
June 30,
2021* | | Year Ended December 31, |
| Service Class | 2020 | | 2019 | | 2018 | | 2017 | | 2016 |
| Net asset value at beginning of period | $ 12.05 | | $ 11.38 | | $ 10.47 | | $ 12.49 | | $ 10.90 | | $ 10.99 |
| Net investment income (loss) (a) | 0.03 | | 0.17 | | 0.22 | | 0.17 | | 0.14 | | 0.14 |
| Net realized and unrealized gain (loss) on investments | 1.27 | | 1.21 | | 1.88 | | (1.44) | | 1.84 | | 0.64 |
| Total from investment operations | 1.30 | | 1.38 | | 2.10 | | (1.27) | | 1.98 | | 0.78 |
| Less distributions: | | | | | | | | | | | |
| From net investment income | — | | (0.31) | | (0.35) | | (0.21) | | (0.15) | | (0.21) |
| From net realized gain on investments | — | | (0.40) | | (0.84) | | (0.54) | | (0.24) | | (0.66) |
| Total distributions | — | | (0.71) | | (1.19) | | (0.75) | | (0.39) | | (0.87) |
| Net asset value at end of period | $ 13.35 | | $ 12.05 | | $ 11.38 | | $ 10.47 | | $ 12.49 | | $ 10.90 |
| Total investment return (b) | 10.79%(c) | | 12.65% | | 21.12% | | (10.95)% | | 18.32% | | 7.30% |
| Ratios (to average net assets)/Supplemental Data: | | | | | | | | | | | |
| Net investment income (loss) | 0.44%†† | | 1.55% | | 1.90% | | 1.42% | | 1.17% | | 1.32% |
| Net expenses (d) | 0.27%†† | | 0.28% | | 0.27% | | 0.27% | | 0.27% | | 0.28% |
| Portfolio turnover rate | 11% | | 32% | | 41% | | 44% | | 31% | | 33% |
| Net assets at end of period (in 000’s) | $ 1,703,330 | | $ 1,711,623 | | $ 1,868,634 | | $ 1,849,974 | | $ 2,263,952 | | $ 1,990,699 |
| * | Unaudited. |
| †† | Annualized. |
| (a) | Per share data based on average shares outstanding during the period. |
| (b) | Total return does not reflect any deduction of sales charges, mortality and expense charges, contract charges or administrative charges. For periods of less than one year, total return is not annualized. |
| (c) | Total investment return may reflect adjustments to conform to generally accepted accounting principles. |
| (d) | In addition to the fees and expenses which the Portfolio bears directly, it also indirectly bears a pro-rata share of the fees and expenses of the underlying funds in which it invests. Such indirect expenses are not included in the above expense ratios. |
The notes to the financial statements are an integral part of, and should be read in conjunction with, the financial statements.
| 40 | MainStay VP Growth Allocation Portfolio |
MainStay VP Equity Allocation Portfolio
Investment and Performance Comparison (Unaudited)
Performance data quoted represents past performance. Past performance is no guarantee of future results. Because of market volatility and other factors, current performance may be lower or higher than the figures shown. Investment return and principal value will fluctuate, and as a result, when shares are redeemed, they may be worth more or less than their original cost. The performance table and graph do not reflect any deduction of sales charges, mortality and expense charges, contract charges or administrative charges. Please refer to the Performance Summary appropriate for your policy. For performance information current to the most recent month-end, please call 800-598-2019 or visit www.newyorklife.com.
Performance figures may reflect certain fee waivers and/or expense limitations, without which total returns may have been different. For information on current fee waivers and/or expense limitations (if any), please refer to the Notes to Financial Statements.
| Average Annual Total Returns for the Period-Ended June 30, 2021 |
| Class | Inception
Date | Six
Months | One
Year | Five
Years | Ten
Years | Gross
Expense
Ratio1 |
| Initial Class Shares | 2/13/2006 | 13.80% | 41.15% | 13.49% | 10.16% | 0.74% |
| Service Class Shares | 2/13/2006 | 13.66 | 40.80 | 13.21 | 9.88 | 0.99 |
| 1. | The gross expense ratios presented reflect the Portfolio’s “Total Annual Portfolio Operating Expenses” from the most recent Prospectus, as supplemented, and may differ from other expense ratios disclosed in this report. |
| Benchmark Performance | Six
Months | One
Year | Five
Years | Ten
Years |
| S&P 500® Index1 | 15.25% | 40.79% | 17.65% | 14.84% |
| MSCI EAFE® Index (Net)2 | 8.83 | 32.35 | 10.28 | 5.89 |
| Equity Allocation Composite Index3 | 13.64 | 38.71 | 15.82 | 12.71 |
| Morningstar Allocation—85%+ Equity Category Average4 | 13.45 | 40.06 | 13.11 | 9.97 |
| 1. | The S&P 500® Index is the Portfolio's primary benchmark. “S&P 500®" is a trademark of The McGraw-Hill Companies, Inc. The S&P 500® Index is widely regarded as the standard index for measuring large-cap U.S. stock market performance. Results assume reinvestment of all dividends and capital gains. An investment cannot be made directly in an index. |
| 2. | The MSCI EAFE® Index (Net) is the Portfolio's secondary benchmark. The MSCI EAFE® Index (Net) consists of international stocks representing the developed world outside of North America. Results assume reinvestment of all dividends and capital gains. An investment cannot be made directly in an index. |
| 3. | The Portfolio has selected the Equity Allocation Composite Index as an additional benchmark. The Equity Allocation Composite Index consists of the S&P 500® Index and the MSCI EAFE® Index (Net) weighted 75% and 25%, respectively. Prior to February 28, 2014, the Equity Allocation Composite Index consisted of the S&P 500® Index and the MSCI EAFE® Index (Net) weighted 80% and 20%, respectively. Results assume reinvestment of all dividends and capital gains. An investment cannot be made directly in an index. |
| 4. | The Morningstar Allocation—85%+ Equity Category Average is representative of funds that seek to provide both income and capital appreciation by investing in multiple asset classes, including stocks, bonds, and cash. These funds are dominated by domestic holdings and have equity exposures of over 85%. These funds typically allocate at least 10% to equities of foreign companies and do not exclusively allocate between cash and equities. Results are based on average total returns of similar funds with all dividends and capital gain distributions reinvested. |
Cost in Dollars of a $1,000 Investment in MainStay VP Equity Allocation Portfolio (Unaudited)
The example below is intended to describe the fees and expenses borne by shareholders during the six-month period from January 1, 2021 to June 30, 2021, and the impact of those costs on your investment.
Example
As a shareholder of the Portfolio you incur two types of costs: (1) transaction costs, including exchange fees and sales charges (loads) on purchases (as applicable), and (2) ongoing costs, including management fees, distribution and/or service (12b-1) fees, and other Portfolio expenses (as applicable). This example is intended to help you understand your ongoing costs (in dollars) of investing in the Portfolio and to compare these costs with the ongoing costs of investing in other mutual funds. The example is based on an investment of $1,000 made at the beginning of the six-month period and held for the entire period from January 1, 2021 to June 30, 2021. Shares are only sold in connection with variable life and annuity contracts and the example does not reflect any contract level or transactional fees or expenses. If these costs had been included, your costs would have been higher.
This example illustrates your Portfolio’s ongoing costs in two ways:
Actual Expenses
The second and third data columns in the table below provide information about actual account values and actual expenses. You may use the information in these columns, together with the amount you invested, to estimate the expenses that you paid during the six months ended June
30, 2021. Simply divide your account value by $1,000 (for example, an $8,600 account value divided by $1,000 = 8.6), then multiply the result by the number under the heading entitled “Expenses Paid During Period” to estimate the expenses you paid on your account during this period.
Hypothetical Example for Comparison Purposes
The fourth and fifth data columns in the table below provide information about hypothetical account values and hypothetical expenses based on the Portfolio’s actual expense ratio and an assumed rate of return of 5% per year before expenses, which is not the Portfolio’s actual return. The hypothetical account values and expenses may not be used to estimate the actual ending account balances or expenses you paid for the six-month period shown. You may use this information to compare the ongoing costs of investing in the Portfolio with the ongoing costs of investing in other mutual funds. To do so, compare this 5% hypothetical example with the 5% hypothetical examples that appear in the shareholder reports of the other mutual funds.
Please note that the expenses shown in the table are meant to highlight your ongoing costs only and do not reflect any transactional costs, such as exchange fees or sales charges (loads). Therefore, the fourth and fifth data columns of the table are useful in comparing ongoing costs only and will not help you determine the relative total costs of owning different funds. In addition, if these transactional costs were included, your costs would have been higher.
| Share Class | Beginning
Account
Value
1/1/21 | Ending Account
Value (Based
on Actual
Returns and
Expenses)
6/30/21 | Expenses
Paid
During
Period1 | Ending Account
Value (Based
on Hypothetical
5% Annualized
Return and
Actual Expenses)
6/30/21 | Expenses
Paid
During
Period1 | Net Expense
Ratio
During
Period2 |
| Initial Class Shares | $1,000.00 | $1,138.00 | $0.16 | $1,024.65 | $0.15 | 0.03% |
| Service Class Shares | $1,000.00 | $1,136.60 | $1.48 | $1,023.41 | $1.40 | 0.28% |
| 1. | Expenses are equal to the Portfolio’s annualized expense ratio of each class multiplied by the average account value over the period, divided by 365 and multiplied by 181 (to reflect the six-month period). The table above represents the actual expenses incurred during the six-month period. In addition to the fees and expenses which the Portfolio bears directly, it also indirectly bears a pro rata share of the fees and expenses of the underlying Portfolios/Funds in which it invests. Such indirect expenses are not included in the above-reported expense figures. |
| 2. | Expenses are equal to the Portfolio's annualized expense ratio to reflect the six-month period. |
| 42 | MainStay VP Equity Allocation Portfolio |
Asset Diversification as of June 30, 2021 (Unaudited)
| Equity Funds | 97.1 % |
| Short-Term Investments | 2.9 |
| Other Assets, Less Liabilities | 0.0 ‡ |
| ‡ | Less than one-tenth of a percent. |
See Portfolio of Investments beginning on page 46 for specific holdings within these categories. The Portfolio’s holdings are subject to change.
Portfolio Management Discussion and Analysis (Unaudited)
Answers to the questions reflect the views of portfolio managers Jae S. Yoon, CFA, Jonathan Swaney, Poul Kristensen, CFA, and Amit Soni, CFA, of New York Life Investments1 the Portfolio’s Manager.
How did MainStay VP Equity Allocation Portfolio perform relative to its benchmarks and peers during the six months ended June 30, 2021?
For the six months ended June 30, 2021, MainStay VP Equity Allocation Portfolio returned 13.80% for Initial Class shares and 13.66% for Service Class shares. Over the same period, both share classes underperformed the 15.25% return of the S&P 500® Index, which is the Portfolio’s primary benchmark, and outperformed the 8.83% return of the MSCI EAFE® Index (Net), which is a secondary benchmark of the Portfolio. For the six months ended June 30, 2021, both share classes outperformed the 13.64% return of the Equity Allocation Composite Index and the 13.45% return of Morningstar Allocation—85%+ Equity Category Average.2
Were there any changes to the Portfolio during the reporting period?
Effective May 1, 2021 the Portfolio’s name changed from MainStay VP Growth Allocation Portfolio to MainStay VP Equity Allocation Portfolio. Additionally, the Portfolio’s investment strategy was changed to provide that the Portfolio invests, under normal circumstances, at least 80% of its assets (net assets plus any borrowings for investment purposes) in Underlying Equity Portfolios/Funds.
What factors affected the Portfolio’s relative performance during the reporting period?
The Portfolio is a “fund of funds,” meaning that it seeks to achieve its investment objective by investing primarily in mutual funds and exchange-traded funds (“ETFs”) managed by New York Life Investments or its affiliates (the “Underlying Portfolios/Funds”). The Underlying Portfolios/Funds may invest in a range of capitalizations and geographies, making comparisons to any single index generally less suitable than a weighted combination of indices, which is a more useful yardstick by which to measure performance. The most influential factor affecting relative performance for the Portfolio versus the performance of a weighted combination of indices is the net performance of the Underlying Portfolios/Funds relative to their respective benchmarks.
Performance among the Portfolio’s Underlying Portfolio/Fund investments during the reporting period proved mixed with little positive or negative contribution to active return. Instead, asset class policy was primarily responsible for the Portfolio’s underperformance compared with the internally maintained blend of indices taken into consideration when managing the Portfolio. Two positions stand out, starting with the Portfolio’s non-U.S. equity exposure. Equity markets posted an historic rebound off
their March 2020 lows, with U.S. markets leading due to a potent policy mix and ambitious vaccination rollout plans. We expected that stock markets in other nations would follow a similar trajectory as vaccination rates climbed and international economies more fully opened, closing the performance gap with U.S. equities. Accordingly, we increased the Portfolio’s exposure to non-U.S. markets. However, during the reporting period, foreign markets generally failed to keep pace with U.S. markets, thereby undermining the Portfolio’s relative returns.
Second, the Portfolio started the reporting period emphasizing large companies over small, reflecting our distrust of the degree to which small-cap stocks outperformed the broader market in the closing months of 2020. However, small caps continued to lead the market higher well into 2021, creating a headwind to performance. While that trend reversed to a degree during the reporting period, it did not do so until the size bias within the Portfolio was largely eliminated.
During the reporting period, how was the Portfolio’s performance materially affected by investments in derivatives?
Total return swaps were used to express most of the Portfolio’s asset class policy views and can be seen as detracting from performance during the reporting period. Swaps were also employed to mitigate certain systematic biases evident in the Underlying Portfolio/Fund holdings. Contracts held for that purpose contributed positively to return.
How did you allocate the Portfolio’s assets during the reporting period and why?
The announcements in late 2020 of highly successful clinical trials for both the Moderna and Pfizer vaccines, followed shortly thereafter by granting of emergency use authorization and rapid distribution to the most vulnerable elements of the population, played a significant role in our determination of how best to allocate the Portfolio’s assets. As the vaccines brought the end of pandemic restrictions into view, we adjusted the Portfolio to favor pro-cyclical sectors and businesses in industries we believed likely to benefit most from the reopening of the economy. Similarly, we slid the Portfolio’s holdings a little way down the capitalization spectrum, committing a larger allocation of assets to small- and mid-cap companies likely to fare well in this environment. These adjustments provided a modest tailwind for much of 2021 before undergoing an abrupt and puzzling reversal from mid-May through the end of June, at which time they detracted from Portfolio performance.
| 1. | “New York Life Investments” is a service mark used by New York Life Investment Management Holdings LLC and its subsidiary New York Life Investment Management LLC. |
| 2. | See page 41 for more information on benchmark and peer group returns. |
| 44 | MainStay VP Equity Allocation Portfolio |
How did the Portfolio’s allocations change over the course of the reporting period?
The asset class repositioning noted above was largely implemented using derivatives, specifically total return swaps. These instruments increased the Portfolio’s exposure to small- and mid-cap stocks, non-U.S. markets and a basket of companies specifically leveraged to the reopening of the economy. The same approach was used to reduce the Portfolio’s exposure to large-cap U.S. stocks and a basket of companies identified as having been beneficiaries of lockdown conditions.
At the Underlying Portfolio/Fund level, notable changes arose from portfolio restructurings as Wellington Management Company was named the new subadvisor on several MainStay products that concurrently underwent name changes. A few funds were also subject to mergers. For example, MainStay MacKay Common Stock Fund was renamed MainStay WMC Enduring Capital Fund when Wellington took the helm in early March, and MainStay Epoch U.S. All Cap Fund was subsequently merged into the renamed fund a short while later, thereby making the Portfolio an investor in MainStay WMC Enduring Capital Fund. Similarly, “new” positions arising from restructurings can be found in MainStay VP Wellington Growth Portfolio, MainStay WMC International Research Equity Fund and MainStay WMC Value Fund, among others.
Which Underlying Equity Portfolios/Funds had the highest total returns during the reporting period, and which Underlying Equity Portfolios/Funds had the lowest total returns?
Of the Underlying Equity Funds held for the entire reporting period, those posting the largest total returns included IQ Chaikin U.S. Small Cap ETF, MainStay WMC Enduring Capital Fund (encompassing MainStay Epoch U.S. All Cap Fund after the merger cited above) and MainStay VP T. Rowe Price Equity Income Portfolio. The Underlying Equity Funds with the lowest total returns (none generated losses) were MainStay Epoch International Choice Fund, MainStay VP MacKay International Equity Portfolio and IQ Candriam ESG International Equity ETF.
Which Underlying Equity Portfolios/Funds made the strongest positive contributions to the Portfolio’s overall performance, and which Underlying Equity Portfolios/ Funds were the greatest detractors?
Allowing for the size of the allocation, the variation of that allocation across the reporting period and performance during that window of time, the Underlying Equity Funds making the strongest positive contributions to the Fund’s total return included MainStay
VP MacKay S&P 500 Index Portfolio, MainStay MAP Equity/WMC Value Fund and MainStay VP Winslow Large Cap Growth Portfolio. Those detracting most were MainStay VP Wellington U.S. Equity Portfolio, MainStay Epoch Capital Growth Fund and IQ Chaikin U.S. Small Cap ETF.
The opinions expressed are those of the portfolio managers as of the date of this report and are subject to change. There is no guarantee that any forecasts will come to pass. This material does not constitute investment advice and is not intended as an endorsement of any specific investment.
Not all MainStay VP Portfolios and/or share classes are available under all policies.
Portfolio of Investments June 30, 2021† (Unaudited)
| | Shares | Value |
| Affiliated Investment Companies 97.1% |
| Equity Funds 97.1% |
| IQ 50 Percent Hedged FTSE International ETF (a) | 1,001,996 | $ 24,819,441 |
| IQ 500 International ETF (a) | 1,520,411 | 49,602,649 |
| IQ Candriam ESG International Equity ETF (a) | 1,059,579 | 31,416,517 |
| IQ Candriam ESG U.S. Equity ETF (a) | 2,418,403 | 88,990,942 |
| IQ Chaikin U.S. Large Cap ETF (a) | 1,622,491 | 54,118,999 |
| IQ Chaikin U.S. Small Cap ETF (a) | 327,996 | 11,678,232 |
| MainStay Epoch Capital Growth Fund Class I (a) | 276,057 | 4,400,656 |
| MainStay Epoch International Choice Fund Class I (a) | 988,702 | 41,224,235 |
| MainStay VP Candriam Emerging Markets Equity Portfolio Initial Class (a) | 4,856,185 | 61,853,718 |
| MainStay VP Epoch U.S. Equity Yield Portfolio Initial Class (a) | 3,921,398 | 67,342,947 |
| MainStay VP MacKay International Equity Portfolio Initial Class (a) | 1,786,613 | 35,862,151 |
| MainStay VP MacKay S&P 500 Index Portfolio Initial Class | 1,685,731 | 138,622,728 |
| MainStay VP Small Cap Growth Portfolio Initial Class (a) | 2,612,562 | 51,878,168 |
| MainStay VP T. Rowe Price Equity Income Portfolio Initial Class (a) | 4,314,149 | 59,023,599 |
| MainStay VP Wellington Growth Portfolio Initial Class (a) | 1,042,991 | 46,425,084 |
| MainStay VP Wellington Mid Cap Portfolio Initial Class | 2,881,221 | 46,670,874 |
| MainStay VP Wellington Small Cap Portfolio Initial Class (a) | 1,985,390 | 27,195,673 |
| | Shares | | Value |
| |
| Equity Funds (continued) |
| MainStay VP Wellington U.S. Equity Portfolio Initial Class | 809,513 | | $ 26,614,186 |
| MainStay VP Winslow Large Cap Growth Portfolio Initial Class (a) | 2,592,061 | | 95,697,578 |
| MainStay WMC Enduring Capital Fund Class R6 (a) | 1,355,240 | | 45,451,901 |
| MainStay WMC International Research Equity Fund Class I (a) | 4,993,996 | | 40,645,631 |
| MainStay WMC Value Fund Class R6 (a) | 1,490,892 | | 81,320,688 |
Total Affiliated Investment Companies
(Cost $911,096,835) | | | 1,130,856,597 |
| Short-Term Investment 2.9% |
| Affiliated Investment Company 2.9% |
| MainStay U.S. Government Liquidity Fund, 0.01% (b) | 33,724,598 | | 33,724,598 |
Total Short-Term Investment
(Cost $33,724,598) | 2.9% | | 33,724,598 |
Total Investments
(Cost $944,821,433) | 100.0% | | 1,164,581,195 |
| Other Assets, Less Liabilities | 0.0‡ | | 357,625 |
| Net Assets | 100.0% | | $ 1,164,938,820 |
| † | Percentages indicated are based on Portfolio net assets. |
| ‡ | Less than one-tenth of a percent. |
| (a) | As of June 30, 2021, the Portfolio’s ownership exceeds 5% of the outstanding shares of the Underlying Portfolio's/Fund's share class. |
| (b) | Current yield as of June 30, 2021. |
Swap Contracts
Open OTC total return equity swap contracts as of June 30, 2021 were as follows1:
Swap
Counterparty | Reference Obligation | Floating Rate2 | Termination
Date(s) | Payment
Frequency
Paid/
Received | Notional
Amount
Long/
(Short)
(000)3 | Unrealized
Appreciation/
(Depreciation)4 |
| Citibank NA | Citi 2nd Wave Virus Basket | 1 month LIBOR BBA plus 0.35% | 12/2/21 | Monthly | 8,218 | $ — |
| Citibank NA | Citi Stay at Home Basket | 1 month LIBOR BBA minus 0.30% | 12/2/21 | Monthly | (9,928) | — |
| Citibank NA | iShares MSCI EAFE ETF | 1 month LIBOR BBA plus 0.40% | 12/2/21 | Monthly | 39,639 | — |
| Citibank NA | iShares MSCI EAFE Small-Cap ETF | 1 month LIBOR BBA plus 0.55% | 12/2/21 | Monthly | 11,320 | — |
| Citibank NA | iShares MSCI USA Momentum Factor ETF | 1 month LIBOR BBA plus 0.55% | 12/2/21 | Monthly | 48,280 | — |
| Citibank NA | Russell 1000 Growth Total Return Index | 1 month LIBOR BBA plus 0.03% | 12/2/21 | Monthly | (49,800) | — |
| Citibank NA | Russell 2000 Total Return Index | 1 month LIBOR BBA minus 0.08% | 12/2/21 | Monthly | (14,122) | — |
| Citibank NA | Russell Midcap Total Return Index | 1 month LIBOR BBA plus 0.31% | 12/2/21 | Monthly | 44,902 | — |
| Citibank NA | S&P 500 Total Return Index | 1 month LIBOR BBA plus 0.10% | 12/2/21 | Monthly | (50,633) | — |
The notes to the financial statements are an integral part of, and should be read in conjunction with, the financial statements.
| 46 | MainStay VP Equity Allocation Portfolio |
Swap
Counterparty | Reference Obligation | Floating Rate2 | Termination
Date(s) | Payment
Frequency
Paid/
Received | Notional
Amount
Long/
(Short)
(000)3 | Unrealized
Appreciation/
(Depreciation)4 |
| Citibank NA | VanEck Vectors Gold Miners ETF | 1 month LIBOR BBA plus 0.50% | 12/2/21 | Monthly | 5,362 | $ — |
| | | | | | | $ — |
| 1. | As of June 30, 2021, cash in the amount $5,743,897 was pledged to brokers for OTC swap contracts. |
| 2. | Portfolio pays the floating rate and receives the total return of the reference entity. |
| 3. | Notional amounts reflected as a positive value indicate a long position held by the Portfolio or Index and a negative value indicates a short position. |
| 4. | Reflects the value at reset date as of June 30, 2021. |
| Abbreviation(s): |
| BBA—British Bankers’ Association |
| EAFE—Europe, Australasia and Far East |
| ETF—Exchange-Traded Fund |
| FTSE—Financial Times Stock Exchange |
| LIBOR—London Interbank Offered Rate |
| MSCI—Morgan Stanley Capital International |
The following is a summary of the fair valuations according to the inputs used as of June 30, 2021, for valuing the Portfolio’s assets:
| Description | Quoted
Prices in
Active
Markets for
Identical
Assets
(Level 1) | | Significant
Other
Observable
Inputs
(Level 2) | | Significant
Unobservable
Inputs
(Level 3) | | Total |
| Asset Valuation Inputs | | | | | | | |
| Investments in Securities (a) | | | | | | | |
| Affiliated Investment Companies | | | | | | | |
| Equity Funds | $ 1,130,856,597 | | $ — | | $ — | | $ 1,130,856,597 |
| Short-Term Investment | | | | | | | |
| Affiliated Investment Company | 33,724,598 | | — | | — | | 33,724,598 |
| Total Investments in Securities | $ 1,164,581,195 | | $ — | | $ — | | $ 1,164,581,195 |
| (a) | For a complete listing of investments, see the Portfolio of Investments. |
The notes to the financial statements are an integral part of, and should be read in conjunction with, the financial statements.
47
Statement of Assets and Liabilities as of June 30, 2021 (Unaudited)
| Assets |
Investment in affiliated investment companies, at value
(identified cost $944,821,433) | $1,164,581,195 |
| Cash | 842,074 |
| Cash collateral on deposit at broker for swap contracts | 5,743,897 |
| Receivables: | |
| Dividends | 298 |
| Other assets | 13,722 |
| Total assets | 1,171,181,186 |
| Liabilities |
| Payables: | |
| Dividends and interest on OTC swaps contracts | 5,454,839 |
| Portfolio shares redeemed | 412,306 |
| NYLIFE Distributors (See Note 3) | 219,093 |
| Shareholder communication | 92,831 |
| Professional fees | 48,499 |
| Custodian | 14,731 |
| Trustees | 67 |
| Total liabilities | 6,242,366 |
| Net assets | $1,164,938,820 |
| Composition of Net Assets |
| Shares of beneficial interest outstanding (par value of $.001 per share) unlimited number of shares authorized | $ 82,087 |
| Additional paid-in-capital | 871,968,341 |
| | 872,050,428 |
| Total distributable earnings (loss) | 292,888,392 |
| Net assets | $1,164,938,820 |
| Initial Class | |
| Net assets applicable to outstanding shares | $ 101,153,709 |
| Shares of beneficial interest outstanding | 7,044,021 |
| Net asset value per share outstanding | $ 14.36 |
| Service Class | |
| Net assets applicable to outstanding shares | $1,063,785,111 |
| Shares of beneficial interest outstanding | 75,042,479 |
| Net asset value per share outstanding | $ 14.18 |
The notes to the financial statements are an integral part of, and should be read in conjunction with, the financial statements.
| 48 | MainStay VP Equity Allocation Portfolio |
Statement of Operations for the six months ended June 30, 2021 (Unaudited)
| Investment Income (Loss) |
| Income | |
| Dividend distributions from affiliated investment companies | $ 2,681,661 |
| Interest | 1,643 |
| Total income | 2,683,304 |
| Expenses | |
| Distribution/Service—Service Class (See Note 3) | 1,311,835 |
| Professional fees | 55,113 |
| Shareholder communication | 50,819 |
| Custodian | 22,444 |
| Trustees | 11,660 |
| Miscellaneous | 10,574 |
| Total expenses | 1,462,445 |
| Net investment income (loss) | 1,220,859 |
| Realized and Unrealized Gain (Loss) |
| Net realized gain (loss) on: | |
| Affiliated investment company transactions | 33,478,046 |
| Realized capital gain distributions from affiliated investment companies | 22,603,950 |
| Swap transactions | 2,218,404 |
| Net realized gain (loss) | 58,300,400 |
Net change in unrealized appreciation (depreciation) on:
Affiliated investments companies | 88,469,498 |
| Net realized and unrealized gain (loss) | 146,769,898 |
| Net increase (decrease) in net assets resulting from operations | $147,990,757 |
The notes to the financial statements are an integral part of, and should be read in conjunction with, the financial statements.
49
Statements of Changes in Net Assets
for the six months ended June 30, 2021 (Unaudited) and the year ended December 31, 2020
| | 2021 | 2020 |
| Increase (Decrease) in Net Assets |
| Operations: | | |
| Net investment income (loss) | $ 1,220,859 | $ 13,999,807 |
| Net realized gain (loss) | 58,300,400 | 41,630,464 |
| Net change in unrealized appreciation (depreciation) | 88,469,498 | 97,042,610 |
| Net increase (decrease) in net assets resulting from operations | 147,990,757 | 152,672,881 |
| Distributions to shareholders: | | |
| Initial Class | — | (5,868,206) |
| Service Class | — | (66,857,357) |
| Total distributions to shareholders | — | (72,725,563) |
| Capital share transactions: | | |
| Net proceeds from sales of shares | 1,632,359 | 46,065,158 |
| Net asset value of shares issued to shareholder in reinvestment of distributions | — | 72,725,563 |
| Cost of shares redeemed | (119,149,032) | (181,229,820) |
| Increase (decrease) in net assets derived from capital share transactions | (117,516,673) | (62,439,099) |
| Net increase (decrease) in net assets | 30,474,084 | 17,508,219 |
| Net Assets |
| Beginning of period | 1,134,464,736 | 1,116,956,517 |
| End of period | $1,164,938,820 | $1,134,464,736 |
The notes to the financial statements are an integral part of, and should be read in conjunction with, the financial statements.
| 50 | MainStay VP Equity Allocation Portfolio |
Financial Highlights selected per share data and ratios
| | Six months ended
June 30,
2021* | | Year Ended December 31, |
| Initial Class | 2020 | | 2019 | | 2018 | | 2017 | | 2016 |
| Net asset value at beginning of period | $ 12.62 | | $ 11.80 | | $ 10.50 | | $ 12.65 | | $ 10.60 | | $ 10.63 |
| Net investment income (loss) (a) | 0.03 | | 0.18 | | 0.21 | | 0.18 | | 0.12 | | 0.12 |
| Net realized and unrealized gain (loss) on investments | 1.71 | | 1.49 | | 2.25 | | (1.67) | | 2.26 | | 0.68 |
| Total from investment operations | 1.74 | | 1.67 | | 2.46 | | (1.49) | | 2.38 | | 0.80 |
| Less distributions: | | | | | | | | | | | |
| From net investment income | — | | (0.27) | | (0.36) | | (0.19) | | (0.12) | | (0.17) |
| From net realized gain on investments | — | | (0.58) | | (0.80) | | (0.47) | | (0.21) | | (0.66) |
| Total distributions | — | | (0.85) | | (1.16) | | (0.66) | | (0.33) | | (0.83) |
| Net asset value at end of period | $ 14.36 | | $ 12.62 | | $ 11.80 | | $ 10.50 | | $ 12.65 | | $ 10.60 |
| Total investment return (b) | 13.79%(c) | | 15.02% | | 24.58% | | (12.78)% | | 22.67% | | 7.59% |
| Ratios (to average net assets)/Supplemental Data: | | | | | | | | | | | |
| Net investment income (loss) | 0.45%†† | | 1.64% | | 1.80% | | 1.42% | | 1.05% | | 1.19% |
| Net expenses (d) | 0.03%†† | | 0.03% | | 0.03% | | 0.02% | | 0.02% | | 0.03% |
| Portfolio turnover rate | 8% | | 26% | | 38% | | 28% | | 26% | | 21% |
| Net assets at end of period (in 000’s) | $ 101,154 | | $ 92,647 | | $ 83,143 | | $ 66,326 | | $ 76,504 | | $ 60,070 |
| * | Unaudited. |
| †† | Annualized. |
| (a) | Per share data based on average shares outstanding during the period. |
| (b) | Total return does not reflect any deduction of sales charges, mortality and expense charges, contract charges or administrative charges. For periods of less than one year, total return is not annualized. |
| (c) | Total investment return may reflect adjustments to conform to generally accepted accounting principles. |
| (d) | In addition to the fees and expenses which the Portfolio bears directly, it also indirectly bears a pro-rata share of the fees and expenses of the underlying funds in which it invests. Such indirect expenses are not included in the above expense ratios. |
| | Six months ended
June 30,
2021* | | Year Ended December 31, |
| Service Class | 2020 | | 2019 | | 2018 | | 2017 | | 2016 |
| Net asset value at beginning of period | $ 12.47 | | $ 11.67 | | $ 10.39 | | $ 12.53 | | $ 10.51 | | $ 10.55 |
| Net investment income (loss) (a) | 0.01 | | 0.15 | | 0.17 | | 0.14 | | 0.09 | | 0.10 |
| Net realized and unrealized gain (loss) on investments | 1.70 | | 1.47 | | 2.24 | | (1.65) | | 2.24 | | 0.66 |
| Total from investment operations | 1.71 | | 1.62 | | 2.41 | | (1.51) | | 2.33 | | 0.76 |
| Less distributions: | | | | | | | | | | | |
| From net investment income | — | | (0.24) | | (0.33) | | (0.16) | | (0.10) | | (0.14) |
| From net realized gain on investments | — | | (0.58) | | (0.80) | | (0.47) | | (0.21) | | (0.66) |
| Total distributions | — | | (0.82) | | (1.13) | | (0.63) | | (0.31) | | (0.80) |
| Net asset value at end of period | $ 14.18 | | $ 12.47 | | $ 11.67 | | $ 10.39 | | $ 12.53 | | $ 10.51 |
| Total investment return (b) | 13.71%(c) | | 14.74% | | 24.27% | | (12.99)% | | 22.36% | | 7.32% |
| Ratios (to average net assets)/Supplemental Data: | | | | | | | | | | | |
| Net investment income (loss) | 0.19%†† | | 1.34% | | 1.49% | | 1.16% | | 0.81% | | 0.95% |
| Net expenses (d) | 0.28%†† | | 0.28% | | 0.28% | | 0.27% | | 0.27% | | 0.28% |
| Portfolio turnover rate | 8% | | 26% | | 38% | | 28% | | 26% | | 21% |
| Net assets at end of period (in 000’s) | $ 1,063,785 | | $ 1,041,818 | | $ 1,033,813 | | $ 929,230 | | $ 1,074,280 | | $ 829,780 |
| * | Unaudited. |
| †† | Annualized. |
| (a) | Per share data based on average shares outstanding during the period. |
| (b) | Total return does not reflect any deduction of sales charges, mortality and expense charges, contract charges or administrative charges. For periods of less than one year, total return is not annualized. |
| (c) | Total investment return may reflect adjustments to conform to generally accepted accounting principles. |
| (d) | In addition to the fees and expenses which the Portfolio bears directly, it also indirectly bears a pro-rata share of the fees and expenses of the underlying funds in which it invests. Such indirect expenses are not included in the above expense ratios. |
The notes to the financial statements are an integral part of, and should be read in conjunction with, the financial statements.
51
Notes to Financial Statements (Unaudited)
Note 1–Organization and Business
MainStay VP Funds Trust (the “Fund”) was organized as a Delaware statutory trust on February 1, 2011. The Fund is registered under the Investment Company Act of 1940, as amended (the “1940 Act”), as an open-end management investment company. The Fund is comprised of thirty-one separate series (collectively referred to as the “Portfolios” and each individually, referred to as a "Portfolio"). These financial statements and notes relate to the MainStay VP Conservative Allocation Portfolio, MainStay VP Moderate Allocation Portfolio, MainStay VP Growth Allocation Portfolio (formerly known as MainStay VP Moderate Growth Allocation Portfolio) and MainStay VP Equity Allocation Portfolio (formerly known as MainStay VP Growth Allocation Portfolio) (collectively referred to as the “Allocation Portfolios” and each individually referred to as an “Allocation Portfolio”). Each is a "diversified” portfolio, as that term is defined in the 1940 Act, as interpreted or modified by regulatory authorities having jurisdiction, from time to time.
Shares of the Allocation Portfolios are currently offered to certain separate accounts to fund variable annuity policies and variable universal life insurance policies issued by New York Life Insurance and Annuity Corporation (“NYLIAC”), a wholly-owned subsidiary of New York Life Insurance Company (“New York Life”) and may also be offered to fund variable annuity policies and variable universal life insurance policies issued by other insurance companies. NYLIAC allocates shares of the Allocation Portfolios to, among others, certain NYLIAC separate accounts. The separate accounts are used to fund flexible premium deferred variable annuity contracts and variable life insurance policies.
The following table lists each Portfolio's share classes that have been registered and commenced operations:
| Fund | Share Classes Commenced Operations1 |
| MainStay VP Conservative Allocation Fund | Initial Class, Service Class |
| MainStay VP Moderate Allocation Fund | Initial Class, Service Class |
| MainStay VP Growth Allocation Fund | Initial Class, Service Class |
| MainStay VP Equity Allocation Fund | Initial Class, Service Class |
| 1. | For each VP Allocation Portfolio, Initial Class and Service Class shares were registered for sale as of February 13, 2006. |
Shares of the Allocation Portfolios are offered and are redeemed at a price equal to their respective net asset value (“NAV”) per share. No sales or redemption charge is applicable to the purchase or redemption of the Allocation Portfolios' shares. Under the terms of the Fund’s multiple class plan, adopted pursuant to Rule 18f-3 under the 1940 Act, the classes differ in that, among other things, Service Class shares of the Allocation Portfolios pay a combined distribution and service fee of 0.25% of average daily net assets attributable to Service Class shares of the Allocation Portfolios to the Distributor (as defined in Note 3(B)) pursuant to a plan adopted in accordance with Rule 12b-1 under the 1940 Act. Contract owners of variable annuity contracts purchased after June 2, 2003, are permitted to invest only in the Service Class shares.
The investment objective for each of the Allocation Portfolios is as follows:
The MainStay VP Conservative Allocation Portfolio seeks current income and, secondarily, long-term growth of capital.
The MainStay VP Moderate Allocation Portfolio seeks long-term growth of capital and, secondarily, current income.
The MainStay VP Growth Allocation Portfolio seeks long-term growth of capital and, secondarily, current income.
The MainStay VP Equity Allocation Portfolio seeks long-term growth of capital.
The Allocation Portfolios are "fund-of-funds" that seek to achieve their investment objectives by investing in mutual funds and exchange-traded funds ("ETFs") managed by New York Life Investment Management LLC ("New York Life Investments" or "Manager") or its affiliates (the “Underlying Portfolios/Funds”).
Note 2–Significant Accounting Policies
The Allocation Portfolios are investment companies and accordingly follow the investment company accounting and reporting guidance of the Financial Accounting Standards Board (“FASB”) Accounting Standard Codification Topic 946 Financial Services—Investment Companies. The Allocation Portfolios prepare their financial statements in accordance with generally accepted accounting principles (“GAAP”) in the United States of America and follow the significant accounting policies described below.
(A) Securities Valuation. Investments are usually valued as of the close of regular trading on the New York Stock Exchange (the "Exchange") (usually 4:00 p.m. Eastern time) on each day the Allocation Portfolios are open for business ("valuation date").
The Board of Trustees of the Fund (the "Board") adopted procedures establishing methodologies for the valuation of each Allocation Portfolio's securities and other assets and delegated the responsibility for valuation determinations under those procedures to the Valuation Committee of the Fund (the “Valuation Committee”). The procedures state that, subject to the oversight of the Board and unless otherwise noted, the responsibility for the day-to-day valuation of portfolio assets (including fair value measurements for the Allocation Portfolios' assets and liabilities) rests with New York Life Investment Management LLC (“New York Life Investments” or the "Manager"). To assess the appropriateness of security valuations, the Manager, the Subadvisor or the Allocation Portfolios' third-party service provider, who is subject to oversight by the Manager, regularly compares prior day prices, prices on comparable securities and the sale prices to the prior and current day prices and challenges prices with changes exceeding certain tolerance levels with third-party pricing services or broker sources.
The Board authorized the Valuation Committee to appoint a Valuation Subcommittee (the “Subcommittee”) to establish the prices of securities for which market quotations are not readily available or the prices of which are not otherwise readily determinable under the procedures. The
| 52 | MainStay VP Asset Allocation Funds |
Subcommittee meets (in person, via electronic mail or via teleconference) on an as-needed basis. The Valuation Committee meets to ensure that actions taken by the Subcommittee were appropriate.
For those securities valued through either a standardized fair valuation methodology or a fair valuation measurement, the Subcommittee deals with such valuation and the Valuation Committee reviews and affirms, if appropriate, the reasonableness of the valuation based on such methodologies and measurements on a regular basis after considering information that is reasonably available and deemed relevant by the Valuation Committee. Any action taken by the Subcommittee with respect to the valuation of a portfolio security or other asset is submitted for review and ratification (if appropriate) to the Valuation Committee and the Board at the next regularly scheduled meeting.
"Fair value" is defined as the price an Allocation Portfolio would reasonably expect to receive upon selling an asset or liability in an orderly transaction to an independent buyer in the principal or most advantageous market for the asset or liability. Fair value measurements are determined within a framework that establishes a three-tier hierarchy that maximizes the use of observable market data and minimizes the use of unobservable inputs to establish a classification of fair value measurements for disclosure purposes. "Inputs" refer broadly to the assumptions that market participants would use in pricing the asset or liability, including assumptions about risk, such as the risk inherent in a particular valuation technique used to measure fair value using a pricing model and/or the risk inherent in the inputs for the valuation technique. Inputs may be observable or unobservable. Observable inputs reflect the assumptions market participants would use in pricing the asset or liability based on market data obtained from sources independent of each Allocation Portfolio. Unobservable inputs reflect each Allocation Portfolio’s own assumptions about the assumptions market participants would use in pricing the asset or liability based on the information available. The inputs or methodology used for valuing assets or liabilities may not be an indication of the risks associated with investing in those assets or liabilities. The three-tier hierarchy of inputs is summarized below.
| • | Level 1—quoted prices in active markets for an identical asset or liability |
| • | Level 2—other significant observable inputs (including quoted prices for a similar asset or liability in active markets, interest rates and yield curves, prepayment speeds, credit risk, etc.) |
| • | Level 3—significant unobservable inputs (including each Allocation Portfolio's own assumptions about the assumptions that market participants would use in measuring fair value of an asset or liability) |
The level of an asset or liability within the fair value hierarchy is based on the lowest level of an input, both individually and in the aggregate, that is significant to the fair value measurement. The aggregate value by input level of each Allocation Portfolio’s assets and liabilities as of June 30, 2021, is included at the end of the Portfolio of Investments.
Investments in Underlying Portfolios/Funds are valued at their respective NAVs at the close of business each day, except for investment in ETFs.
Investments in ETFs are valued at the last quoted sales price as of the close of regular trading on the relevant exchange on each valuation date. These securities are generally categorized as Level 1 in the hierarchy.
Securities held by the Underlying Portfolios/Funds are valued using policies consistent with those used by the Underlying Portfolios/Funds. Equity securities, including shares of ETFs, are generally valued at the last quoted sales price as of the close of regular trading on the relevant exchange on each valuation date.
Swaps are marked to market daily based upon quotations from pricing agents, brokers or market makers. These securities are generally categorized as Level 2 in the hierarchy.
Total return swap contracts, which are arrangements to exchange a market-linked return for a periodic payment, are based on a notional principal amount. To the extent that the total return of the security, index or other financial measure underlying the transaction exceeds or falls short of the offsetting interest rate obligation, the Allocation Portfolios will receive a payment from or make a payment to the counterparty. Total return swap contracts are marked to market daily based upon quotations from market makers and these securities are generally categorized as Level 2 in the hierarchy.
Temporary cash investments acquired in excess of 60 days to maturity at the time of purchase are valued using the latest bid prices or using valuations based on a matrix system (which considers such factors as security prices, yields, maturities and ratings), both as furnished by independent pricing services. Temporary cash investments that mature in 60 days or less at the time of purchase ("Short-Term Investments") are valued using the amortized cost method of valuation, unless the use of such method would be inappropriate. The amortized cost method involves valuing a security at its cost on the date of purchase and thereafter assuming a constant amortization to maturity of the difference between such cost and the value on maturity date. Amortized cost approximates the current fair value of a security. Securities valued using the amortized cost method are not valued using quoted prices in an active market and are generally categorized as Level 2 in the hierarchy.
The information above is not intended to reflect an exhaustive list of the methodologies that may be used to value portfolio investments. The valuation procedures permit the use of a variety of valuation methodologies in connection with valuing portfolio investments. The methodology used for a specific type of investment may vary based on the market data available or other considerations. The methodologies summarized above may not represent the specific means by which portfolio investments are valued on any particular business day.
(B) Income Taxes. The Allocation Portfolios' policy is to comply with the requirements of the Internal Revenue Code of 1986, as amended (the “Internal Revenue Code”), applicable to regulated investment companies and to distribute all of its taxable income to the shareholders of each Allocation Portfolio within the allowable time limits.
Notes to Financial Statements (Unaudited) (continued)
The Manager evaluates each Allocation Portfolio’s tax positions to determine if the tax positions taken meet the minimum recognition threshold in connection with accounting for uncertainties in income tax positions taken or expected to be taken for the purposes of measuring and recognizing tax liabilities in the financial statements. Recognition of tax benefits of an uncertain tax position is permitted only to the extent the position is “more likely than not” to be sustained assuming examination by taxing authorities. The Manager analyzed the Allocation Portfolios' tax positions taken on federal, state and local income tax returns for all open tax years (for up to three tax years) and has concluded that no provisions for federal, state and local income tax are required in the Allocation Portfolios' financial statements. The Allocation Portfolios' federal, state and local income tax and federal excise tax returns for tax years for which the applicable statutes of limitations have not expired are subject to examination by the Internal Revenue Service and state and local departments of revenue.
(C) Dividends and Distributions to Shareholders. Dividends and distributions are recorded on the ex-dividend date. The Allocation Portfolios intend to declare and pay dividends from net investment income and distributions from net realized capital and currency gains, if any, at least annually. Unless a shareholder elects otherwise, all dividends and distributions are reinvested at NAV in the same class of shares of the respective Allocation Portfolio. Dividends and distributions to shareholders are determined in accordance with federal income tax regulations and may differ from determinations using GAAP.
(D) Security Transactions and Investment Income. The Allocation Portfolios record security transactions on the trade date. Realized gains and losses on security transactions are determined using the identified cost method. Dividends and distributions received by the Allocation Portfolios from the Underlying Portfolios are recorded on the ex-dividend date. Distributions received from real estate investment trusts may be classified as dividends, capital gains and/or return of capital.
Investment income and realized and unrealized gains and losses on investments of the Allocation Portfolios are allocated pro rata to the separate classes of shares based upon their relative net assets on the date the income is earned or realized and unrealized gains and losses are incurred.
(E) Expenses. Expenses of the Fund are allocated to the individual Portfolios in proportion to the net assets of the respective Portfolios when the expenses are incurred, except where direct allocations of expenses can be made. Expenses (other than fees incurred under the distribution and service plans, further discussed in Note 3(B), which are charged directly to the Service Class shares) are allocated to separate classes of shares pro rata based upon their relative net assets on the date the expenses are incurred. The expenses borne by the Allocation Portfolios, including those of related parties to the Allocation Portfolios, are shown in the Statement of Operations.
Additionally, the Allocation Portfolios may invest in mutual funds, which are subject to management fees and other fees that may cause the costs
of investing in mutual funds to be greater than the costs of owning the underlying securities directly. These indirect expenses of mutual funds are not included in the amounts shown as expenses in the Statement of Operations or in the expense ratios included in the Financial Highlights. In addition, the Allocation Portfolios bear a pro rata share of the fees and expenses of the Underlying Portfolios/Funds in which they invest. Because the Underlying Portfolios/Funds have varied expense and fee levels and the Allocation Portfolios may own different pro-portions of the Underlying Portfolios/Funds at different times, the amount of fees and expenses incurred indirectly by each Allocation Portfolio may vary.
(F) Use of Estimates. In preparing financial statements in conformity with GAAP, the Manager makes estimates and assumptions that affect the reported amounts and disclosures in the financial statements. Actual results could differ from those estimates and assumptions.
(G) Swap Contracts. The Allocation Portfolios may enter into credit default, interest rate, equity, index and currency exchange rate swap contracts (“swaps”). In a typical swap transaction, two parties agree to exchange the future returns (or differentials in rates of future returns) earned or realized at periodic intervals on a particular investment or instrument based on a notional principal amount. Generally, the Allocation Portfolios will enter into a swap on a net basis, which means that the two payment streams under the swap are netted, with the Allocation Portfolios receiving or paying (as the case may be) only the net amount of the two payment streams. Therefore, the Allocation Portfolios' current obligation under a swap generally will be equal to the net amount to be paid or received under the swap, based on the relative value of notional positions attributable to each counterparty to the swap. The payments may be adjusted for transaction costs, interest payments, the amount of interest paid on the investment or instrument or other factors. Collateral, in the form of cash or securities, may be required to be held in segregated accounts with the custodian bank or broker in accordance with the terms of the swap. Swap agreements are privately negotiated in the over the counter (“OTC”) market and may be executed in a multilateral or other trade facilities platform, such as a registered commodities exchange (“centrally cleared swaps”).
Certain standardized swaps, including certain credit default and interest rate swaps, are subject to mandatory clearing and exchange-trading, and more types of standardized swaps are expected to be subject to mandatory clearing and exchange-trading in the future. The counterparty risk for exchange-traded and cleared derivatives is expected to be generally lower than for uncleared derivatives, but cleared contracts are not risk-free. In a cleared derivative transaction, the Allocation Portfolios typically enters into the transaction with a financial institution counterparty, and performance of the transaction is effectively guaranteed by a central clearinghouse, thereby reducing or eliminating the Allocation Portfolios' exposure to the credit risk of its original counterparty. The Allocation Portfolios will be required to post specified levels of margin with the clearinghouse or at the instruction of the clearinghouse; the margin required by a clearinghouse may be greater than the margin the Allocation Portfolios would be required to post in an uncleared
| 54 | MainStay VP Asset Allocation Funds |
transaction. As of June 30, 2021, all swap positions outstanding are shown in the Portfolio of Investments.
Swaps are marked to market daily based upon quotations from pricing agents, brokers, or market makers and the change in value, if any, is recorded as unrealized appreciation or depreciation. Any payments made or received upon entering into a swap would be amortized or accreted over the life of the swap and recorded as a realized gain or loss. Early termination of a swap is recorded as a realized gain or loss. Daily changes in valuation of centrally cleared swaps, if any, are recorded as a receivable or payable for the change in value as appropriate on the Statement of Assets and Liabilities.
The Allocation Portfolios bears the risk of loss of the amount expected to be received under a swap in the event of the default or bankruptcy of the swap counterparty. The Allocation Portfolios may be able to eliminate its exposure under a swap either by assignment or other disposition, or by entering into an offsetting swap with the same party or a similar credit-worthy party. Swaps are not actively traded on financial markets. Entering into swaps involves elements of credit, market, and documentation risk in excess of the amounts recognized on the Statement of Assets and Liabilities. Such risks involve the possibilities that there will be no liquid market for these swaps, that the counterparty to the swaps may default on its obligation to perform or disagree as to the meaning of the contractual terms in the swaps and that there may be unfavorable changes in interest rates, the price of the index or the security underlying these transactions.
Equity Swaps (Total Return Swaps). Total return swap contracts are agreements between counterparties to exchange cash flow, one based on a market-linked return of an individual asset or group of assets (such as an index), and the other on a fixed or floating rate. As a total return swap, an equity swap may be structured in different ways. For example, when the Allocation Portfolios enter into a “long” equity swap, the counterparty may agree to pay the Allocation Portfolios the amount, if any, by which the notional amount of the equity swap would have increased in value had it been invested in a particular referenced security or securities, plus the dividends that would have been received on those securities. In return, the Allocation Portfolios will generally agree to pay the counterparty interest on the notional amount of the equity swap plus the amount, if any, by which that notional amount would have decreased in value had it been invested in such referenced security or securities, plus, in certain instances, commissions or trading spreads on the notional amounts. Therefore, the Allocation Portfolios' return on the equity swap generally should equal the gain or loss on the notional amount, plus dividends on the referenced security or securities less the interest paid by the Allocation Portfolios on the notional amount. Alternatively, when the Allocation Portfolios enter into a “short” equity swap, the counterparty will generally agree to pay the Allocation Portfolios the amount, if any, by which the notional amount of the equity swap would have decreased in value had the Allocation Portfolios sold a particular referenced security or securities short, less the dividend expense that the Allocation Portfolios would have incurred on the referenced security or securities, as adjusted for interest payments or other economic factors. In this situation, the
Allocation Portfolios will generally be obligated to pay the amount, if any, by which the notional amount of the swap would have increased in value had it been invested directly in the referenced security or securities.
Equity swaps generally do not involve the delivery of securities or other referenced assets. Accordingly, the risk of loss with respect to equity swaps is normally limited to the net amount of payments that the Allocation Portfolios are contractually obligated to make. If the other party to an equity swap defaults, the Allocation Portfolios' risk of loss consists of the net amount of payments that the Allocation Portfolios are contractually entitled to receive, if any. The Allocation Portfolios will segregate cash or liquid assets, enter into offsetting transactions or use other measures permitted by applicable law to “cover” the Allocation Portfolios' current obligations. The Allocation Portfolios and New York Life Investments, however, believe these transactions do not constitute senior securities under the 1940 Act and, accordingly, will not treat them as being subject to the Allocation Portfolios' borrowing restrictions.
Equity swaps are derivatives and their value can be very volatile. The Allocation Portfolios may engage in total return swaps to gain exposure to emerging markets securities, along with offsetting long total return swap positions to maintain appropriate currency balances and risk exposures across all swap positions. To the extent that the Manager, or the Subadvisor do not accurately analyze and predict future market trends, the values or assets or economic factors, the Allocation Portfolios may suffer a loss, which may be substantial.
(H) LIBOR Replacement Risk. The Allocation Portfolio may invest in certain debt securities, derivatives or other financial instruments that utilize the London Interbank Offered Rate ("LIBOR"), as a “benchmark” or “reference rate” for various interest rate calculations. The United Kingdom Financial Conduct Authority, which regulates LIBOR, announced that after 2021 it will cease its active encouragement of banks to provide the quotations needed to sustain LIBOR. However, it is possible that certain LIBOR tenors may continue beyond 2021 and the most widely used LIBOR tenors may continue until mid-2023. As a result, it is anticipated that LIBOR will be discontinued or will no longer be sufficiently robust to be representative of its underlying market around that time. Although financial regulators and industry working groups have suggested alternative reference rates, such as European Interbank Offer Rate (“EURIBOR”), Sterling Overnight Interbank Average Rate (“SONIA”) and Secured Overnight Financing Rate (“SOFR”), there are challenges to converting certain contracts and transactions to a new benchmark and neither the full effects of the transition process nor its ultimate outcome is known. New York Life Investments is currently working to assess exposure and will modify contracts as necessary.
The elimination of LIBOR or changes to other reference rates or any other changes or reforms to the determination or supervision of reference rates could have an adverse impact on the market for, or value of, any securities or payments linked to those reference rates, which may adversely affect the Allocation Portfolios' performance and/or net asset value. Uncertainty and risk also remain regarding the willingness and ability of issuers and lenders to include revised provisions in new and
Notes to Financial Statements (Unaudited) (continued)
existing contracts or instruments. Consequently, the transition away from LIBOR to other reference rates may lead to increased volatility and illiquidity in markets that are tied to LIBOR, fluctuations in values of LIBOR-related investments or investments in issuers that utilize LIBOR, increased difficulty in borrowing or refinancing and diminished effectiveness of hedging strategies, adversely affecting the Allocation Portfolios' performance. Furthermore, the risks associated with the expected discontinuation of LIBOR and transition may be exacerbated if the work necessary to effect an orderly transition to an alternative reference rate is not completed in a timely manner. Because the usefulness of LIBOR as a benchmark could deteriorate during the transition period, these effects could occur prior to the end of 2021 with respect to certain LIBOR tenors or mid-2023 for the remaining LIBOR tenors.
(I) Indemnifications. Under the Fund’s organizational documents, its officers and trustees are indemnified against certain liabilities that may arise out of performance of their duties to the Fund. Additionally, in the normal course of business, the Allocation Portfolios enter into contracts with third-party service providers that contain a variety of representations and warranties and that may provide general indemnifications. The Allocation Portfolios' maximum exposure under these arrangements is unknown, as this would involve future claims that may be made against the Allocation Portfolios that have not yet occurred. The Manager believes that the risk of loss in connection with these potential indemnification obligations is remote. However, there can be no assurance that material liabilities related to such obligations will not arise in the future, which could adversely impact the Allocation Portfolios.
(J) Quantitative Disclosure of Derivative Holdings. The following tables show additional disclosures related to the Allocation Portfolios' derivative and hedging activities, including how such activities are accounted for and their effect on the Allocation Portfolios' financial positions, performance and cash flows.
MainStay VP Conservative Allocation Portfolio
The effect of derivative instruments on the Statement of Operations for the six-month period ended June 30, 2021:
| Net Realized Gain (Loss) from: | Equity
Contracts
Risk | Total |
| Swap Contracts | $595,936 | $595,936 |
| Total Net Realized Gain (Loss) | $595,936 | $595,936 |
| Average Notional Amount | Total |
| Swap Contracts Long | $ 73,320,450 |
| Swap Contracts Short | $(34,241,245) |
MainStay VP Moderate Allocation Portfolio
The effect of derivative instruments on the Statement of Operations for the six-month period ended June 30, 2021:
| Net Realized Gain (Loss) from: | Equity
Contracts
Risk | Total |
| Swap Contracts | $1,386,574 | $1,386,574 |
| Total Net Realized Gain (Loss) | $1,386,574 | $1,386,574 |
| Average Notional Amount | Total |
| Swap Contracts Long | $128,931,231 |
| Swap Contracts Short | $ (66,682,944) |
MainStay VP Growth Allocation Portfolio
The effect of derivative instruments on the Statement of Operations for the six-month period ended June 30, 2021:
| Net Realized Gain (Loss) from: | Equity
Contracts
Risk | Total |
| Swap Contracts | $2,835,398 | $2,835,398 |
| Total Net Realized Gain (Loss) | $2,835,398 | $2,835,398 |
| Average Notional Amount | Total |
| Swap Contracts Long | $ 203,113,950 |
| Swap Contracts Short | $(103,776,056) |
MainStay VP Equity Allocation Portfolio
The effect of derivative instruments on the Statement of Operations for the six-month period ended June 30, 2021:
| Net Realized Gain (Loss) from: | Equity
Contracts
Risk | Total |
| Swap Contracts | $2,218,404 | $2,218,404 |
| Total Net Realized Gain (Loss) | $2,218,404 | $2,218,404 |
| Average Notional Amount | Total |
| Swap Contracts Long | $115,416,602 |
| Swap Contracts Short | $ (74,661,945) |
Note 3–Fees and Related Party Transactions
(A) Manager. New York Life Investments, a registered investment adviser and an indirect, wholly-owned subsidiary of New York Life, serves as the Allocation Portfolios' Manager pursuant to an Amended and Restated Management Agreement (“Management Agreement”) and is responsible for the day-to-day portfolio management of the Allocation Portfolios. The Manager provides offices, conducts clerical, recordkeeping and bookkeeping services, and keeps most of the financial and accounting records required to be maintained by the Allocation Portfolios. Except for the portion of salaries and expenses that are the responsibility
| 56 | MainStay VP Asset Allocation Funds |
of the Allocation Portfolios, the Manager pays the salaries and expenses of all personnel affiliated with the Allocation Portfolios and certain operational expenses of the Allocation Portfolios. The Allocation Portfolios reimburse New York Life Investments in an amount equal to the portion of the compensation of the Chief Compliance Officer attributable to the Allocation Portfolios.
The Allocation Portfolios do not pay any fees to the Manager in return for the services performed under the Management Agreement. The Allocation Portfolios do, however, indirectly pay a proportionate share of the management fees paid to the managers of the Underlying Portfolios/Funds in which the Allocation Portfolios invest.
JPMorgan Chase Bank, N.A. ("JPMorgan") provides sub-administration and sub-accounting services to the Allocation Portfolios pursuant to an agreement with New York Life Investments. These services include calculating the daily NAVs of the Allocation Portfolios, maintaining the general ledger and sub-ledger accounts for the calculation of the Allocation Portfolios' respective NAVs, and assisting New York Life Investments in conducting various aspects of the Allocation Portfolios' administrative operations. For providing these services to the Allocation Portfolios, JPMorgan is compensated by New York Life Investments.
Prior to February 22, 2021, these services were provided by State Street.
Pursuant to an agreement between the Fund and New York Life Investments, New York Life Investments is responsible for providing or procuring certain regulatory reporting services for the Allocation Portfolios. The Allocation Portfolios will reimburse New York Life Investments for the actual costs incurred by New York Life Investments in connection with providing or procuring these services for the Allocation Portfolios.
(B) Distribution and Service Fees. The Fund, on behalf of the Allocation Portfolios, has entered into a distribution agreement with NYLIFE Distributors LLC (the “Distributor”), an affiliate of New York Life Investments. The Allocation Portfolios have adopted a distribution plan (the “Plan”) in accordance with the provisions of Rule 12b-1 under the 1940 Act. Under the Plan, the Distributor has agreed to provide, through its affiliates or independent third parties, various distribution-related, shareholder and administrative support services to the Service Class shareholders. For its services, the Distributor is entitled to a combined distribution and service fee accrued daily and paid monthly at an annual rate of 0.25% of the average daily net assets attributable to the Service Class shares of the respective Portfolio.
(C) Investments in Affiliates (in 000’s). During the six-month period ended June 30, 2021, purchases and sales transactions, income earned from investments and shares held of investment companies managed by New York Life Investments or its affiliates were as follows:
| MainStay VP Conservative Allocation Portfolio |
| Affiliated Investment Companies | Value,
Beginning
of Period | Purchases
at Cost | Proceeds
from
Sales | Net
Realized
Gain/(Loss)
on Sales | Change in
Unrealized
Appreciation/
(Depreciation) | Value,
End of
Period | Dividend
Income | Other
Distributions | Shares
End of
Period |
| IQ 50 Percent Hedged FTSE International ETF | $ 14,322 | $ — | $ (1,838) | $ 195 | $ 1,075 | $ 13,754 | $ 238 | $ — | 555 |
| IQ 500 International ETF | 11,409 | 212 | (1,056) | 121 | 1,206 | 11,892 | 232 | — | 365 |
| IQ Candriam ESG International Equity ETF | 12,059 | — | (895) | 249 | 737 | 12,150 | 179 | — | 410 |
| IQ Candriam ESG U.S. Equity ETF | 19,112 | 844 | (1,942) | 393 | 2,146 | 20,553 | 116 | — | 559 |
| IQ Chaikin U.S. Large Cap ETF | 13,446 | 6 | (1,529) | 348 | 1,467 | 13,738 | 71 | — | 412 |
| IQ Chaikin U.S. Small Cap ETF | 6,251 | — | (1,631) | 462 | 789 | 5,871 | 27 | — | 165 |
| IQ S&P High Yield Low Volatility Bond ETF | 7,049 | 151 | (7,100) | 76 | (176) | — | 105 | — | — |
| MainStay Epoch Capital Growth Fund Class I | 2,548 | 44 | (353) | 35 | 287 | 2,561 | — | — | 161 |
| MainStay Epoch International Choice Fund Class I | 7,627 | 1 | (1,022) | 108 | 320 | 7,034 | — | — | 169 |
| MainStay MacKay Short Duration High Yield Fund Class I | 53,201 | 4,602 | (9,225) | 41 | 818 | 49,437 | 1,157 | — | 4,989 |
| MainStay Short Term Bond Fund Class I | — | 3,575 | (50) | — | (16) | 3,509 | 16 | — | 356 |
| MainStay U.S. Government Liquidity Fund | 22,830 | 129,722 | (95,904) | — | — | 56,648 | 2 | — | 56,648 |
| MainStay VP Bond Portfolio Initial Class | 49,624 | 445 | (6,999) | 738 | (1,312) | 42,496 | — | — | 2,798 |
| MainStay VP Candriam Emerging Markets Equity Portfolio Initial Class (a) | 11,057 | 346 | (1,991) | 531 | 638 | 10,581 | — | — | 831 |
| MainStay VP Epoch U.S. Equity Yield Portfolio Initial Class | 11,941 | 20 | (1,307) | 165 | 1,374 | 12,193 | — | — | 710 |
| MainStay VP Floating Rate Portfolio Initial Class | 21,199 | 25,012 | (655) | (19) | 193 | 45,730 | 452 | — | 5,148 |
Notes to Financial Statements (Unaudited) (continued)
| MainStay VP Conservative Allocation Portfolio (continued) |
| Affiliated Investment Companies | Value,
Beginning
of Period | Purchases
at Cost | Proceeds
from
Sales | Net
Realized
Gain/(Loss)
on Sales | Change in
Unrealized
Appreciation/
(Depreciation) | Value,
End of
Period | Dividend
Income | Other
Distributions | Shares
End of
Period |
| MainStay VP Indexed Bond Portfolio Initial Class | $ 280,683 | $ 2,921 | $ (51,972) | $ 5,594 | $ (10,617) | $ 226,609 | $ — | $ — | 20,517 |
| MainStay VP MacKay High Yield Corporate Bond Portfolio Initial Class | — | 14,013 | — | — | 134 | 14,147 | — | — | 1,373 |
| MainStay VP MacKay International Equity Portfolio Initial Class | 8,073 | — | (3,181) | 617 | (74) | 5,435 | — | — | 271 |
| MainStay VP MacKay S&P 500 Index Portfolio Initial Class | 37,381 | — | (15,970) | 6,508 | (1,489) | 26,430 | — | — | 321 |
| MainStay VP PIMCO Real Return Portfolio Initial Class | 7,078 | 43 | (186) | 16 | 100 | 7,051 | — | — | 733 |
| MainStay VP Small Cap Growth Portfolio Initial Class | 16,155 | 923 | (6,801) | 2,253 | (1,051) | 11,479 | — | — | 578 |
| MainStay VP T. Rowe Price Equity Income Portfolio Initial Class | 10,147 | 86 | (1,651) | 127 | 1,626 | 10,335 | — | — | 755 |
| MainStay VP Wellington Growth Portfolio Initial Class (b) | 5,992 | 6,302 | (758) | 221 | 969 | 12,726 | — | — | 286 |
| MainStay VP Wellington Mid Cap Portfolio Initial Class (c) | 9,783 | — | (1,815) | 45 | 1,424 | 9,437 | — | — | 583 |
| MainStay VP Wellington Small Cap Portfolio Initial Class (d) | 6,717 | — | (1,569) | 401 | 702 | 6,251 | — | — | 456 |
| MainStay VP Wellington U.S. Equity Portfolio Initial Class (e) | — | 4,069 | — | — | 94 | 4,163 | — | — | 127 |
| MainStay VP Winslow Large Cap Growth Portfolio Initial Class | 22,519 | 793 | (2,439) | 676 | 2,078 | 23,627 | — | — | 640 |
| MainStay WMC Enduring Capital Fund Class R6 (f)(g) | 12,942 | 5,647 | (2,787) | 154 | (3,351) | 12,605 | 5 | 5,642 | 376 |
| MainStay WMC International Research Equity Fund Class I (h) | 6,116 | 1,082 | (1,070) | (156) | 815 | 6,787 | — | — | 834 |
| MainStay WMC Value Fund Class R6 (i)(j) | 14,991 | 7 | (2,056) | 460 | 1,834 | 15,236 | — | — | 279 |
| | $ 702,252 | $ 200,866 | $ (225,752) | $ 20,359 | $ 2,740 | $ 700,465 | $ 2,600 | $ 5,642 | |
| (a) | Prior to May 1, 2021, known as MainStay VP Emerging Markets Equity Portfolio Initial Class. |
| (b) | Prior to May 1, 2021, known as MainStay VP MacKay Growth Portfolio Initial Class. |
| (c) | Prior to May 1, 2021, known as MainStay VP MacKay Mid Cap Core Portfolio Initial Class. |
| (d) | Prior to May 1, 2021, known as MainStay VP MacKay Small Cap Core Portfolio Initial Class. |
| (e) | Prior to May 1, 2021, known as MainStay VP MacKay Common Stock Portfolio Initial Class. |
| (f) | As of April 26, 2021, the Fund exchanged in a nontaxable transfer all shares of the MainStay Epoch U.S. All Cap Fund Class R6 into the newly launched MainStay WMC Enduring Capital Fund Class R6. |
| (g) | As of April 27, 2021, the Fund exchanged in a nontaxable transfer all shares of the MainStay WMC Enduring Capital Fund Class I into the newly launched MainStay WMC Enduring Capital Fund Class R6. |
| (h) | Prior to March 5, 2021, known as MainStay MacKay International Opportunities Fund Class I. |
| (i) | Prior to April 26, 2021, known as MainStay MAP Equity Fund Class I. |
| (j) | As of April 27, 2021, the Fund exchanged in a nontaxable transfer all shares of the MainStay WMC Value Fund Class I into the newly launched MainStay WMC Value Fund Class R6. |
| MainStay VP Moderate Allocation Portfolio |
| Affiliated Investment Companies | Value,
Beginning
of Period | Purchases
at Cost | Proceeds
from
Sales | Net
Realized
Gain/(Loss)
on Sales | Change in
Unrealized
Appreciation/
(Depreciation) | Value,
End of
Period | Dividend
Income | Other
Distributions | Shares
End of
Period |
| IQ 50 Percent Hedged FTSE International ETF | $ 24,322 | $ — | $ (4,342) | $ 543 | $ 1,617 | $ 22,140 | $ 387 | $ — | 894 |
| 58 | MainStay VP Asset Allocation Funds |
| MainStay VP Moderate Allocation Portfolio (continued) |
| Affiliated Investment Companies | Value,
Beginning
of Period | Purchases
at Cost | Proceeds
from
Sales | Net
Realized
Gain/(Loss)
on Sales | Change in
Unrealized
Appreciation/
(Depreciation) | Value,
End of
Period | Dividend
Income | Other
Distributions | Shares
End of
Period |
| IQ 500 International ETF | $ 30,000 | $ — | $ (5,504) | $ 709 | $ 2,718 | $ 27,923 | $ 543 | $ — | 856 |
| IQ Candriam ESG International Equity ETF | 19,430 | 4,180 | (445) | 141 | 1,578 | 24,884 | 362 | — | 839 |
| IQ Candriam ESG U.S. Equity ETF | 36,733 | 7,653 | — | — | 5,580 | 49,966 | 268 | — | 1,358 |
| IQ Chaikin U.S. Large Cap ETF | 35,922 | 9 | (6,498) | 1,490 | 3,196 | 34,119 | 179 | — | 1,023 |
| IQ Chaikin U.S. Small Cap ETF | 10,445 | 7,927 | (1,608) | 366 | 2,180 | 19,310 | 87 | — | 542 |
| IQ S&P High Yield Low Volatility Bond ETF | 10,834 | 374 | (11,052) | 114 | (270) | — | 162 | — | — |
| MainStay Epoch Capital Growth Fund Class I | 3,917 | — | (246) | 38 | 474 | 4,183 | — | — | 262 |
| MainStay Epoch International Choice Fund Class I | 25,145 | — | (6,262) | 929 | 438 | 20,250 | — | — | 486 |
| MainStay MacKay Short Duration High Yield Fund Class I | 54,503 | 6,517 | (12,527) | 43 | 839 | 49,375 | 1,201 | — | 4,983 |
| MainStay Short Term Bond Fund Class I | — | 5,616 | (138) | (1) | (25) | 5,452 | 26 | — | 553 |
| MainStay U.S. Government Liquidity Fund | 35,517 | 220,610 | (162,278) | — | — | 93,849 | 4 | — | 93,849 |
| MainStay VP Bond Portfolio Initial Class | 51,927 | 688 | (10,738) | 617 | (1,224) | 41,270 | — | — | 2,717 |
| MainStay VP Candriam Emerging Markets Equity Portfolio Initial Class (a) | 32,779 | — | (7,929) | 1,653 | 1,716 | 28,219 | — | — | 2,216 |
| MainStay VP Epoch U.S. Equity Yield Portfolio Initial Class | 36,333 | 13 | (8,079) | 107 | 4,198 | 32,572 | — | — | 1,897 |
| MainStay VP Floating Rate Portfolio Initial Class | 5,429 | 38,516 | (280) | (3) | 52 | 43,714 | 275 | — | 4,921 |
| MainStay VP Indexed Bond Portfolio Initial Class | 293,707 | 4,027 | (80,793) | 9,252 | (14,548) | 211,645 | — | — | 19,162 |
| MainStay VP MacKay High Yield Corporate Bond Portfolio Initial Class | — | 21,769 | — | — | 209 | 21,978 | — | — | 2,133 |
| MainStay VP MacKay International Equity Portfolio Initial Class | 10,397 | 3,950 | (84) | 24 | 1,145 | 15,432 | — | — | 769 |
| MainStay VP MacKay S&P 500 Index Portfolio Initial Class | 71,458 | — | (23,177) | 7,625 | 2,332 | 58,238 | — | — | 708 |
| MainStay VP PIMCO Real Return Portfolio Initial Class | 10,893 | 116 | (233) | 21 | 159 | 10,956 | — | — | 1,138 |
| MainStay VP Small Cap Growth Portfolio Initial Class | 33,784 | 5,762 | (5,671) | 2,109 | 809 | 36,793 | — | — | 1,853 |
| MainStay VP T. Rowe Price Equity Income Portfolio Initial Class | 31,943 | 18 | (9,313) | (466) | 5,580 | 27,762 | — | — | 2,029 |
| MainStay VP Wellington Growth Portfolio Initial Class (b) | 18,846 | 6,327 | (6,084) | 1,451 | 1,130 | 21,670 | — | — | 487 |
| MainStay VP Wellington Mid Cap Portfolio Initial Class (c) | 31,932 | 10 | (9,743) | 2,070 | 2,514 | 26,783 | — | — | 1,653 |
| MainStay VP Wellington Small Cap Portfolio Initial Class (d) | 15,554 | 1,842 | (7) | (1) | 2,604 | 19,992 | — | — | 1,459 |
| MainStay VP Wellington U.S. Equity Portfolio Initial Class (e) | — | 3,219 | — | — | 73 | 3,292 | — | — | 100 |
| MainStay VP Winslow Large Cap Growth Portfolio Initial Class | 55,366 | 6 | (7,872) | 2,668 | 3,745 | 53,913 | — | — | 1,460 |
| MainStay WMC Enduring Capital Fund Class R6 (f)(g) | 35,599 | 13,594 | (10,035) | 2,615 | (9,926) | 31,847 | 12 | 13,582 | 950 |
| MainStay WMC International Research Equity Fund Class I (h) | 21,815 | — | (4,096) | (865) | 3,026 | 19,880 | — | — | 2,443 |
Notes to Financial Statements (Unaudited) (continued)
| MainStay VP Moderate Allocation Portfolio (continued) |
| Affiliated Investment Companies | Value,
Beginning
of Period | Purchases
at Cost | Proceeds
from
Sales | Net
Realized
Gain/(Loss)
on Sales | Change in
Unrealized
Appreciation/
(Depreciation) | Value,
End of
Period | Dividend
Income | Other
Distributions | Shares
End of
Period |
| MainStay WMC Value Fund Class R6 (i)(j) | $ 40,635 | $ 9 | $ (9,693) | $ 1,770 | $ 4,068 | $ 36,789 | $ — | $ — | 674 |
| | $ 1,085,165 | $ 352,752 | $ (404,727) | $ 35,019 | $ 25,987 | $ 1,094,196 | $ 3,506 | $ 13,582 | |
| (a) | Prior to May 1, 2021, known as MainStay VP Emerging Markets Equity Portfolio Initial Class. |
| (b) | Prior to May 1, 2021, known as MainStay VP MacKay Growth Portfolio Initial Class. |
| (c) | Prior to May 1, 2021, known as MainStay VP MacKay Mid Cap Core Portfolio Initial Class. |
| (d) | Prior to May 1, 2021, known as MainStay VP MacKay Small Cap Core Portfolio Initial Class. |
| (e) | Prior to May 1, 2021, known as MainStay VP MacKay Common Stock Portfolio Initial Class. |
| (f) | As of April 26, 2021, the Fund exchanged in a nontaxable transfer all shares of the MainStay Epoch U.S. All Cap Fund Class R6 into the newly launched MainStay WMC Enduring Capital Fund Class R6. |
| (g) | As of April 27, 2021, the Fund exchanged in a nontaxable transfer all shares of the MainStay WMC Enduring Capital Fund Class I into the newly launched MainStay WMC Enduring Capital Fund Class R6. |
| (h) | Prior to March 5, 2021, known as MainStay MacKay International Opportunities Fund Class I. |
| (i) | Prior to April 26, 2021, known as MainStay MAP Equity Fund Class I. |
| (j) | As of April 27, 2021, the Fund exchanged in a nontaxable transfer all shares of the MainStay WMC Value Fund Class I into the newly launched MainStay WMC Value Fund Class R6. |
| MainStay VP Growth Allocation Portfolio |
| Affiliated Investment Companies | Value,
Beginning
of Period | Purchases
at Cost | Proceeds
from
Sales | Net
Realized
Gain/(Loss)
on Sales | Change in
Unrealized
Appreciation/
(Depreciation) | Value,
End of
Period | Dividend
Income | Other
Distributions | Shares
End of
Period |
| IQ 50 Percent Hedged FTSE International ETF | $ 41,263 | $ — | $ (2,820) | $ 319 | $ 3,472 | $ 42,234 | $ 730 | $ — | 1,705 |
| IQ 500 International ETF | 70,393 | — | (11,481) | 2,294 | 5,893 | 67,099 | 1,306 | — | 2,057 |
| IQ Candriam ESG International Equity ETF | 24,894 | 9,115 | (256) | 84 | 2,233 | 36,070 | 520 | — | 1,217 |
| IQ Candriam ESG U.S. Equity ETF | 71,473 | 22,368 | — | — | 11,836 | 105,677 | 580 | — | 2,872 |
| IQ Chaikin U.S. Large Cap ETF | 74,711 | 10 | (4,351) | 1,049 | 9,484 | 80,903 | 418 | — | 2,425 |
| IQ Chaikin U.S. Small Cap ETF | 17,245 | 4,306 | (111) | 24 | 3,866 | 25,330 | 108 | — | 711 |
| IQ S&P High Yield Low Volatility Bond ETF | 18,024 | 766 | (18,527) | 181 | (444) | — | 273 | — | — |
| MainStay Epoch Capital Growth Fund Class I | 6,518 | — | (350) | 66 | 790 | 7,024 | — | — | 441 |
| MainStay Epoch International Choice Fund Class I | 63,234 | — | (12,994) | 3,833 | (284) | 53,789 | — | — | 1,290 |
| MainStay MacKay Short Duration High Yield Fund Class I | 90,674 | 12,282 | (21,851) | 66 | 1,404 | 82,575 | 2,011 | — | 8,334 |
| MainStay Short Term Bond Fund Class I | — | 9,444 | (283) | (1) | (42) | 9,118 | 43 | — | 925 |
| MainStay U.S. Government Liquidity Fund | 49,196 | 378,584 | (288,887) | — | — | 138,893 | 5 | — | 138,893 |
| MainStay VP Bond Portfolio Initial Class | 32,398 | 285 | (18,481) | 1,360 | (1,740) | 13,822 | — | — | 910 |
| MainStay VP Candriam Emerging Markets Equity Portfolio Initial Class (a) | 79,737 | — | (16,952) | 3,584 | 4,706 | 71,075 | — | — | 5,580 |
| MainStay VP Epoch U.S. Equity Yield Portfolio Initial Class | 82,128 | 12 | (12,300) | 241 | 10,016 | 80,097 | — | — | 4,664 |
| MainStay VP Floating Rate Portfolio Initial Class | 9,032 | 64,478 | (483) | (2) | 85 | 73,110 | 461 | — | 8,231 |
| 60 | MainStay VP Asset Allocation Funds |
| MainStay VP Growth Allocation Portfolio (continued) |
| Affiliated Investment Companies | Value,
Beginning
of Period | Purchases
at Cost | Proceeds
from
Sales | Net
Realized
Gain/(Loss)
on Sales | Change in
Unrealized
Appreciation/
(Depreciation) | Value,
End of
Period | Dividend
Income | Other
Distributions | Shares
End of
Period |
| MainStay VP Indexed Bond Portfolio Initial Class | $ 183,242 | $ 1,350 | $ (139,896) | $ (2,389) | $ (912) | $ 41,395 | $ — | $ — | 3,748 |
| MainStay VP MacKay High Yield Corporate Bond Portfolio Initial Class | — | 36,406 | — | — | 350 | 36,756 | — | — | 3,568 |
| MainStay VP MacKay International Equity Portfolio Initial Class | 29,531 | 29 | (178) | 49 | 2,569 | 32,000 | — | — | 1,594 |
| MainStay VP MacKay S&P 500 Index Portfolio Initial Class | 148,274 | — | (37,809) | 13,336 | 7,773 | 131,574 | — | — | 1,600 |
| MainStay VP PIMCO Real Return Portfolio Initial Class | 18,122 | 335 | (438) | 40 | 263 | 18,322 | — | — | 1,904 |
| MainStay VP Small Cap Growth Portfolio Initial Class | 121,943 | — | (32,196) | 13,114 | (2,792) | 100,069 | — | — | 5,039 |
| MainStay VP T. Rowe Price Equity Income Portfolio Initial Class | 71,125 | 16 | (15,273) | 459 | 11,467 | 67,794 | — | — | 4,955 |
| MainStay VP Wellington Growth Portfolio Initial Class (b) | 38,429 | 5,499 | (8,267) | 1,871 | 3,165 | 40,697 | — | — | 914 |
| MainStay VP Wellington Mid Cap Portfolio Initial Class (c) | 67,461 | 250 | (15,816) | 1,806 | 8,112 | 61,813 | — | — | 3,816 |
| MainStay VP Wellington Small Cap Portfolio Initial Class (d) | 60,390 | 239 | (14,530) | 880 | 9,248 | 56,227 | — | — | 4,105 |
| MainStay VP Wellington U.S. Equity Portfolio Initial Class (e) | — | 264 | — | — | 6 | 270 | — | — | 8 |
| MainStay VP Winslow Large Cap Growth Portfolio Initial Class | 122,219 | — | (11,047) | 3,154 | 11,532 | 125,858 | — | — | 3,409 |
| MainStay WMC Enduring Capital Fund Class R6 (f)(g) | 71,349 | 31,626 | (14,219) | 722 | (18,532) | 70,946 | 27 | 31,598 | 2,115 |
| MainStay WMC International Research Equity Fund Class I (h) | 55,766 | — | (8,524) | (1,375) | 7,032 | 52,899 | — | — | 6,500 |
| MainStay WMC Value Fund Class R6 (i)(j) | 90,137 | 10 | (15,499) | 4,571 | 8,935 | 88,154 | — | — | 1,616 |
| | $ 1,808,908 | $ 577,674 | $ (723,819) | $ 49,336 | $ 99,491 | $ 1,811,590 | $ 6,482 | $ 31,598 | |
| (a) | Prior to May 1, 2021, known as MainStay VP Emerging Markets Equity Portfolio Initial Class. |
| (b) | Prior to May 1, 2021, known as MainStay VP MacKay Growth Portfolio Initial Class. |
| (c) | Prior to May 1, 2021, known as MainStay VP MacKay Mid Cap Core Portfolio Initial Class. |
| (d) | Prior to May 1, 2021, known as MainStay VP MacKay Small Cap Core Portfolio Initial Class. |
| (e) | Prior to May 1, 2021, known as MainStay VP MacKay Common Stock Portfolio Initial Class. |
| (f) | As of April 26, 2021, the Fund exchanged in a nontaxable transfer all shares of the MainStay Epoch U.S. All Cap Fund Class R6 into the newly launched MainStay WMC Enduring Capital Fund Class R6. |
| (g) | As of April 27, 2021, the Fund exchanged in a nontaxable transfer all shares of the MainStay WMC Enduring Capital Fund Class I into the newly launched MainStay WMC Enduring Capital Fund Class R6. |
| (h) | Prior to March 5, 2021, known as MainStay MacKay International Opportunities Fund Class I. |
| (i) | Prior to April 26, 2021, known as MainStay MAP Equity Fund Class I. |
| (j) | As of April 27, 2021, the Fund exchanged in a nontaxable transfer all shares of the MainStay WMC Value Fund Class I into the newly launched MainStay WMC Value Fund Class R6. |
Notes to Financial Statements (Unaudited) (continued)
| MainStay VP Equity Allocation Portfolio |
| Affiliated Investment Companies | Value,
Beginning
of Period | Purchases
at Cost | Proceeds
from
Sales | Net
Realized
Gain/(Loss)
on Sales | Change in
Unrealized
Appreciation/
(Depreciation) | Value,
End of
Period | Dividend
Income | Other
Distributions | Shares
End of
Period |
| IQ 50 Percent Hedged FTSE International ETF | $ 23,239 | $ — | $ (556) | $ 79 | $ 2,057 | $ 24,819 | $ 425 | $ — | 1,002 |
| IQ 500 International ETF | 50,814 | — | (7,085) | 1,200 | 4,674 | 49,603 | 965 | — | 1,520 |
| IQ Candriam ESG International Equity ETF | 17,844 | 11,836 | (142) | 47 | 1,832 | 31,417 | 447 | — | 1,060 |
| IQ Candriam ESG U.S. Equity ETF | 69,281 | 10,048 | (919) | 290 | 10,291 | 88,991 | 502 | — | 2,418 |
| IQ Chaikin U.S. Large Cap ETF | 46,551 | 975 | (174) | 33 | 6,734 | 54,119 | 271 | — | 1,622 |
| IQ Chaikin U.S. Small Cap ETF | 8,540 | 1,317 | (31) | 5 | 1,847 | 11,678 | 51 | — | 328 |
| MainStay Epoch Capital Growth Fund Class I | 4,052 | — | (188) | 30 | 507 | 4,401 | — | — | 276 |
| MainStay Epoch International Choice Fund Class I | 46,636 | — | (8,046) | 2,430 | 204 | 41,224 | — | — | 989 |
| MainStay U.S. Government Liquidity Fund | 28,141 | 147,066 | (141,482) | — | — | 33,725 | 2 | — | 33,725 |
| MainStay VP Candriam Emerging Markets Equity Portfolio Initial Class (a) | 66,393 | 93 | (11,655) | 3,688 | 3,334 | 61,853 | — | — | 4,856 |
| MainStay VP Epoch U.S. Equity Yield Portfolio Initial Class | 67,585 | 33 | (8,871) | 269 | 8,327 | 67,343 | — | — | 3,921 |
| MainStay VP MacKay International Equity Portfolio Initial Class | 38,142 | — | (5,536) | 1,721 | 1,535 | 35,862 | — | — | 1,787 |
| MainStay VP MacKay S&P 500 Index Portfolio Initial Class | 146,224 | 300 | (29,234) | 9,332 | 12,000 | 138,622 | — | — | 1,686 |
| MainStay VP Small Cap Growth Portfolio Initial Class | 69,758 | — | (23,648) | 5,745 | 23 | 51,878 | — | — | 2,613 |
| MainStay VP T. Rowe Price Equity Income Portfolio Initial Class | 60,492 | 85 | (11,886) | (620) | 10,952 | 59,023 | — | — | 4,314 |
| MainStay VP Wellington Growth Portfolio Initial Class (b) | 35,564 | 11,914 | (6,211) | 1,431 | 3,727 | 46,425 | — | — | 1,043 |
| MainStay VP Wellington Mid Cap Portfolio Initial Class (c) | 50,281 | 313 | (11,391) | 1,782 | 5,686 | 46,671 | — | — | 2,881 |
| MainStay VP Wellington Small Cap Portfolio Initial Class (d) | 32,259 | 254 | (10,689) | 758 | 4,614 | 27,196 | — | — | 1,985 |
| MainStay VP Wellington U.S. Equity Portfolio Initial Class (e) | — | 26,060 | — | — | 554 | 26,614 | — | — | 810 |
| MainStay VP Winslow Large Cap Growth Portfolio Initial Class | 102,494 | — | (18,409) | 5,731 | 5,882 | 95,698 | — | — | 2,592 |
| MainStay WMC Enduring Capital Fund Class R6 (f)(g) | 44,574 | 22,651 | (8,237) | (2,580) | (10,956) | 45,452 | 19 | 22,604 | 1,355 |
| MainStay WMC International Research Equity Fund Class I (h) | 41,274 | — | (4,837) | (666) | 4,875 | 40,646 | — | — | 4,994 |
| MainStay WMC Value Fund Class R6 (i)(j) | 81,922 | — | (13,144) | 2,773 | 9,770 | 81,321 | — | — | 1,491 |
| | $ 1,132,060 | $ 232,945 | $ (322,371) | $ 33,478 | $ 88,469 | $ 1,164,581 | $ 2,682 | $ 22,604 | |
| (a) | Prior to May 1, 2021, known as MainStay VP Emerging Markets Equity Portfolio Initial Class. |
| (b) | Prior to May 1, 2021, known as MainStay VP MacKay Growth Portfolio Initial Class. |
| (c) | Prior to May 1, 2021, known as MainStay VP MacKay Mid Cap Core Portfolio Initial Class. |
| (d) | Prior to May 1, 2021, known as MainStay VP MacKay Small Cap Core Portfolio Initial Class. |
| (e) | Prior to May 1, 2021, known as MainStay VP MacKay Common Stock Portfolio Initial Class. |
| (f) | As of April 26, 2021, the Fund exchanged in a nontaxable transfer all shares of the MainStay Epoch U.S. All Cap Fund Class R6 into the newly launched MainStay WMC Enduring Capital Fund Class R6. |
| (g) | As of April 27, 2021, the Fund exchanged in a nontaxable transfer all shares of the MainStay WMC Enduring Capital Fund Class I into the newly launched MainStay WMC Enduring Capital Fund Class R6. |
| (h) | Prior to March 5, 2021, known as MainStay MacKay International Opportunities Fund Class I. |
| (i) | Prior to April 26, 2021, known as MainStay MAP Equity Fund Class I. |
| (j) | As of April 27, 2021, the Fund exchanged in a nontaxable transfer all shares of the MainStay WMC Value Fund Class I into the newly launched MainStay WMC Value Fund Class R6. |
| 62 | MainStay VP Asset Allocation Funds |
Note 4-Federal Income Tax
As of June 30, 2021, the cost and unrealized appreciation (depreciation) of each Allocation Portfolio’s investment portfolio, including applicable derivative contracts and other financial instruments, as determined on a federal income tax basis, were as follows:
| MainStay VP Conservative Allocation Portfolio |
| | Federal Tax
Cost | Gross
Unrealized
Appreciation | Gross
Unrealized
(Depreciation) | Net
Unrealized
Appreciation/
(Depreciation) |
| Investments in Securities | $629,806,230 | $72,464,482 | $(1,806,168) | $70,658,314 |
| MainStay VP Moderate Allocation Portfolio |
| | Federal Tax
Cost | Gross
Unrealized
Appreciation | Gross
Unrealized
(Depreciation) | Net
Unrealized
Appreciation/
(Depreciation) |
| Investments in Securities | $964,864,271 | $133,921,821 | $(4,590,541) | $129,331,280 |
| MainStay VP Growth Allocation Portfolio |
| | Federal Tax
Cost | Gross
Unrealized
Appreciation | Gross
Unrealized
(Depreciation) | Net
Unrealized
Appreciation/
(Depreciation) |
| Investments in Securities | $1,543,748,046 | $282,680,155 | $(14,837,888) | $267,842,267 |
| MainStay VP Equity Allocation Portfolio |
| | Federal Tax
Cost | Gross
Unrealized
Appreciation | Gross
Unrealized
(Depreciation) | Net
Unrealized
Appreciation/
(Depreciation) |
| Investments in Securities | $952,996,372 | $219,863,528 | $(8,278,705) | $211,584,823 |
During the year ended December 31, 2020, the tax character of distributions paid as reflected in the Statements of Changes in Net Assets was as follows:
| | 2020 |
| | Tax Based
Distributions
from Ordinary
Income | Tax Based
Distributions
from Long-Term
Capital Gains | Total |
| MainStay VP Conservative Allocation Portfolio | $12,422,569 | $10,643,895 | $ 23,066,464 |
| MainStay VP Moderate Allocation Portfolio | 24,336,060 | 27,395,134 | 51,731,194 |
| MainStay VP Growth Allocation Portfolio | 46,464,860 | 58,463,443 | 104,928,303 |
| MainStay VP Equity Allocation Portfolio | 21,490,445 | 51,235,118 | 72,725,563 |
Note 5–Custodian
JPMorgan is the custodian of cash and securities held by the Allocation Portfolios. Custodial fees are charged to each Allocation Portfolio based on each Allocation Portfolio's net assets and/or the market value of securities held by each Allocation Portfolio and the number of certain transactions incurred by each Allocation Portfolio.
Prior to February 22, 2021, these services were provided by State Street. The services provided by State Street were a direct expense of the Allocation Portfolio and are included in the Statement of Operations as Custodian fees which totaled $6,220, $6,229, $6,523, $6,200 for MainStay VP Conservative Allocation Portfolio, MainStay VP Moderate Allocation Portfolio, MainStay VP Growth Allocation Portfolio and MainStay VP Equity Allocation Portfolio, respectively, for the period January 1, 2021 through February 21, 2021.
Note 6–Line of Credit
The Allocation Portfolios and certain other funds managed by New York Life Investments maintain a line of credit with a syndicate of banks in order to secure a source of funds for temporary purposes to meet unanticipated or excessive redemption requests.
Effective July 27, 2021, under the credit agreement (the “Credit Agreement”), the aggregate commitment amount is $600,000,000 with an additional uncommitted amount of $100,000,000. The commitment fee is an annual rate of 0.15% of the average commitment amount payable quarterly, regardless of usage, to JPMorgan, who serves as the
Notes to Financial Statements (Unaudited) (continued)
agent to the syndicate. The commitment fee is allocated among the Allocation Portfolios and certain other funds managed by New York Life Investments based upon their respective net assets and other factors. Interest on any revolving credit loan is charged based upon the Federal Funds Rate or the one-month London Interbank Offered Rate ("LIBOR"), whichever is higher. The Credit Agreement expires on July 26, 2022, although the Allocation Portfolios, certain other funds managed by New York Life Investments and the syndicate of banks may renew the Credit Agreement for an additional year on the same or different terms or enter into a credit agreement with a different syndicate of banks. Prior to July 27, 2021, the aggregate commitment amount and the commitment fee were the same as those under the current Credit Agreement. During the six-month period ended June 30, 2021, there were no borrowings made or outstanding with respect to the Allocation Portfolios under the Credit Agreement.
Note 7–Interfund Lending Program
Pursuant to an exemptive order issued by the SEC, the Allocation Portfolios, along with certain other funds managed by New York Life Investments, may participate in an interfund lending program. The interfund lending program provides an alternative credit facility that permits the Allocation Portfolios and certain other funds managed by New York Life Investments to lend or borrow money for temporary purposes directly to or from one another, subject to the conditions of the exemptive order. During the six-month period ended June 30, 2021, there were no interfund loans made or outstanding with respect to the Allocation Portfolios.
Note 8–Purchases and Sales of Securities (in 000’s)
During the six-month period ended June 30, 2021, purchases and sales of securities, other than short-term securities, were as follows:
| Fund | Purchases | Sales |
| MainStay VP Conservative Allocation Portfolio | $ 71,146 | $129,851 |
| MainStay VP Moderate Allocation Portfolio | 132,144 | 242,450 |
| MainStay VP Growth Allocation Portfolio | 193,750 | 434,931 |
| MainStay VP Equity Allocation Portfolio | 85,881 | 180,892 |
Note 9–Capital Share Transactions
Transactions in capital shares for the six-month period ended June 30, 2021 and the year ended December 31, 2020, were as follows:
MainStay VP Conservative Allocation Portfolio
| Initial Class | Shares | Amount |
| Period ended June 30, 2021: | | |
| Shares sold | 37,183 | $ 473,119 |
| Shares redeemed | (53,637) | (679,204) |
| Net increase (decrease) | (16,454) | $ (206,085) |
| Year ended December 31, 2020: | | |
| Shares sold | 165,444 | $ 1,939,398 |
| Shares issued to shareholders in reinvestment of distributions | 47,741 | 565,783 |
| Shares redeemed | (265,881) | (3,099,423) |
| Net increase (decrease) | (52,696) | $ (594,242) |
| |
| Service Class | Shares | Amount |
| Period ended June 30, 2021: | | |
| Shares sold | 1,020,500 | $ 12,717,614 |
| Shares redeemed | (3,718,472) | (46,646,731) |
| Net increase (decrease) | (2,697,972) | $ (33,929,117) |
| Year ended December 31, 2020: | | |
| Shares sold | 6,002,972 | $ 69,142,660 |
| Shares issued to shareholders in reinvestment of distributions | 1,918,707 | 22,500,681 |
| Shares redeemed | (14,018,302) | (159,273,792) |
| Net increase (decrease) | (6,096,623) | $ (67,630,451) |
MainStay VP Moderate Allocation Portfolio
| Initial Class | Shares | Amount |
| Period ended June 30, 2021: | | |
| Shares sold | 173,680 | $ 2,192,117 |
| Shares redeemed | (91,680) | (1,133,285) |
| Net increase (decrease) | 82,000 | $ 1,058,832 |
| Year ended December 31, 2020: | | |
| Shares sold | 204,811 | $ 2,316,758 |
| Shares issued to shareholders in reinvestment of distributions | 206,627 | 2,317,718 |
| Shares redeemed | (404,204) | (4,421,650) |
| Net increase (decrease) | 7,234 | $ 212,826 |
| |
| Service Class | Shares | Amount |
| Period ended June 30, 2021: | | |
| Shares sold | 883,671 | $ 10,925,213 |
| Shares redeemed | (6,784,729) | (83,475,936) |
| Net increase (decrease) | (5,901,058) | $ (72,550,723) |
| Year ended December 31, 2020: | | |
| Shares sold | 3,821,150 | $ 42,231,522 |
| Shares issued to shareholders in reinvestment of distributions | 4,444,138 | 49,413,476 |
| Shares redeemed | (19,100,663) | (209,550,905) |
| Net increase (decrease) | (10,835,375) | $(117,905,907) |
| 64 | MainStay VP Asset Allocation Funds |
MainStay VP Growth Allocation Portfolio
| Initial Class | Shares | Amount |
| Period ended June 30, 2021: | | |
| Shares sold | 99,718 | $ 1,281,332 |
| Shares redeemed | (414,785) | (5,416,708) |
| Net increase (decrease) | (315,067) | $ (4,135,376) |
| Year ended December 31, 2020: | | |
| Shares sold | 282,309 | $ 3,077,867 |
| Shares issued to shareholders in reinvestment of distributions | 512,542 | 5,689,162 |
| Shares redeemed | (688,585) | (7,661,011) |
| Net increase (decrease) | 106,266 | $ 1,106,018 |
| |
| Service Class | Shares | Amount |
| Period ended June 30, 2021: | | |
| Shares sold | 276,163 | $ 3,425,904 |
| Shares redeemed | (14,752,895) | (188,467,091) |
| Net increase (decrease) | (14,476,732) | $(185,041,187) |
| Year ended December 31, 2020: | | |
| Shares sold | 2,702,839 | $ 27,957,649 |
| Shares issued to shareholders in reinvestment of distributions | 9,036,445 | 99,239,141 |
| Shares redeemed | (33,868,042) | (371,555,875) |
| Net increase (decrease) | (22,128,758) | $(244,359,085) |
MainStay VP Equity Allocation Portfolio
| Initial Class | Shares | Amount |
| Period ended June 30, 2021: | | |
| Shares sold | 44,351 | $ 600,384 |
| Shares redeemed | (342,329) | (4,640,589) |
| Net increase (decrease) | (297,978) | $ (4,040,205) |
| Year ended December 31, 2020: | | |
| Shares sold | 400,067 | $ 4,222,007 |
| Shares issued to shareholders in reinvestment of distributions | 520,600 | 5,868,206 |
| Shares redeemed | (626,769) | (7,005,903) |
| Net increase (decrease) | 293,898 | $ 3,084,310 |
| |
| Service Class | Shares | Amount |
| Period ended June 30, 2021: | | |
| Shares sold | 80,460 | $ 1,031,975 |
| Shares redeemed | (8,570,142) | (114,508,443) |
| Net increase (decrease) | (8,489,682) | $(113,476,468) |
| Year ended December 31, 2020: | | |
| Shares sold | 4,352,975 | $ 41,843,151 |
| Shares issued to shareholders in reinvestment of distributions | 5,997,574 | 66,857,357 |
| Shares redeemed | (15,422,860) | (174,223,917) |
| Net increase (decrease) | (5,072,311) | $ (65,523,409) |
Note 10–Other Matters
An outbreak of COVID-19, first detected in December 2019, has developed into a global pandemic and has resulted in travel restrictions, closure of international borders, certain businesses and securities markets, restrictions on securities trading activities, prolonged quarantines, supply chain disruptions, and lower consumer demand, as well as general concern and uncertainty. The continued impact of COVID-19 and related new variants is uncertain and could further adversely affect the global economy, national economies, individual issuers and capital markets in unforeseeable ways and result in a substantial and extended economic downturn. Developments that disrupt global economies and financial markets, such as COVID-19, may magnify factors that affect the Allocation Portfolios' performance.
Note 11–Subsequent Events
In connection with the preparation of the financial statements of the Allocation Portfolios as of and for the six-month period ended June 30, 2021, events and transactions subsequent to June 30, 2021, through the date the financial statements were issued have been evaluated by the Manager for possible adjustment and/or disclosure. No subsequent events requiring financial statement adjustment or disclosure have been identified.
Discussion of the Operation and Effectiveness of the Allocation Portfolios' Liquidity Risk Management Program (Unaudited)
In compliance with Rule 22e-4 under the Investment Company Act of 1940, as amended (the “Liquidity Rule”), the Allocation Portfolios have adopted and implemented a liquidity risk management program (the “Program”), which New York Life Investment Management LLC believes is reasonably designed to assess and manage the Allocation Portfolios' liquidity risk (the risk that the Allocation Portfolios could not meet requests to redeem shares issued by the Allocation Portfolios without significant dilution of remaining investors’ interests in the Allocation Portfolios). The Board of Trustees of MainStay VP Funds Trust (the "Board") designated New York Life Investment Management LLC as administrator of the Program (the “Administrator”). The Administrator has established a Liquidity Risk Management Committee to assist the Administrator in the implementation and day-to-day administration of the Program and to otherwise support the Administrator in fulfilling its responsibilities under the Program.
At a meeting of the Board held on March 8, 2021, the Administrator provided the Board with a written report addressing the Program’s operation and assessing its adequacy and effectiveness of implementation for the period from January 1, 2020 through December 31, 2020 (the "Review Period"), as required under the Liquidity Rule. The report noted that the Administrator concluded that (i) the Program operated effectively to assess and manage the Allocation Portfolios' liquidity risk, (ii) the Program has been adequately and effectively implemented to monitor and, as applicable, respond to the Allocation Portfolios' liquidity developments and (iii) the Allocation Portfolios' investment strategy continues to be appropriate for an open-end fund. In addition, the report discussed notable events that impacted liquidity risk during the Review Period, including the COVID-19 pandemic and the resulting economic shutdown.
In accordance with the Program, the Allocation Portfolios' liquidity risk is assessed no less frequently than annually taking into consideration certain factors, as applicable, such as (i) investment strategy and liquidity of portfolio investments, (ii) short-term and long-term cash flow projections and (iii) holdings of cash and cash equivalents, as well as borrowing arrangements and other funding sources. Certain factors are considered under both normal and reasonably foreseeable stressed conditions.
Each Allocation Portfolio's portfolio investment is classified into one of four liquidity categories. The classification is based on a determination of the number of days it is reasonably expected to take to convert the investment into cash, or sell or dispose of the investment, in current market conditions without significantly changing the market value of the investment. The Administrator's liquidity classification determinations are made by taking into account the Allocation Portfolios' reasonably anticipated trade size, various market, trading and investment-specific considerations, as well as market depth, and, in certain cases, third-party vendor data.
The Liquidity Rule requires portfolios that do not primarily hold assets that are highly liquid investments to adopt a minimum amount of net assets that must be invested in highly liquid investments that are assets (an “HLIM”). In addition, the Liquidity Rule limits a portfolio's investments in illiquid investments. Specifically, the Liquidity Rule prohibits acquisition of illiquid investments if doing so would result in a portfolio holding more than 15% of its net assets in illiquid investments that are assets. The Program includes provisions reasonably designed to determine, periodically review and comply with the HLIM requirement, as applicable, and to comply with the 15% limit on illiquid investments.
There can be no assurance that the Program will achieve its objectives under all circumstances in the future. Please refer to the Allocation Portfolios' prospectus for more information regarding the Allocation Portfolios' exposure to liquidity risk and other risks to which it may be subject.
| 66 | MainStay VP Asset Allocation Funds |
Proxy Voting Record
Each VP Allocation Fund is required to file with the SEC its proxy voting records for the 12-month period ending June 30 on Form N-PX. The most recent Form N-PX or proxy voting record is available free of charge upon request by calling 800-624-6782; visiting newyorklifeinvestments.com; or visiting the SEC’s website at www.sec.gov.
Shareholder Reports and Quarterly Portfolio Disclosure
Each VP Allocation Fund is required to file its complete schedule of portfolio holdings with the SEC 60 days after its first and third fiscal quarter on Form N-PORT. The Allocation Portfolios' holdings report is available free of charge upon request by calling New York Life Investments at 800-624-6782.
This page intentionally left blank.
This page intentionally left blank.
This page intentionally left blank.
MainStay VP Portfolios
MainStay VP offers a wide range of Portfolios. The full array of MainStay VP offerings is listed here, with information about the manager, subadvisors, legal counsel, and independent registered public accounting firm.
Equity
MainStay VP Candriam Emerging Markets Equity Portfolio
MainStay VP Epoch U.S. Equity Yield Portfolio
MainStay VP Fidelity Institutional AM® Utilities Portfolio†
MainStay VP MacKay International Equity Portfolio
MainStay VP MacKay S&P 500 Index Portfolio
MainStay VP Natural Resources Portfolio
MainStay VP Small Cap Growth Portfolio
MainStay VP T. Rowe Price Equity Income Portfolio
MainStay VP Wellington Growth Portfolio
MainStay VP Wellington Mid Cap Portfolio
MainStay VP Wellington Small Cap Portfolio
MainStay VP Wellington U.S. Equity Portfolio
MainStay VP Winslow Large Cap Growth Portfolio
Mixed Asset
MainStay VP Balanced Portfolio
MainStay VP Income Builder Portfolio
MainStay VP Janus Henderson Balanced Portfolio
MainStay VP MacKay Convertible Portfolio
Income
MainStay VP Bond Portfolio
MainStay VP Floating Rate Portfolio
MainStay VP Indexed Bond Portfolio
MainStay VP MacKay Government Portfolio
MainStay VP MacKay High Yield Corporate Bond Portfolio
MainStay VP MacKay Strategic Bond Portfolio
MainStay VP PIMCO Real Return Portfolio
Money Market
MainStay VP U.S. Government Money Market Portfolio
Alternative
MainStay VP CBRE Global Infrastructure Portfolio
MainStay VP IQ Hedge Multi-Strategy Portfolio
Asset Allocation
MainStay VP Conservative Allocation Portfolio
MainStay VP Equity Allocation Portfolio
MainStay VP Growth Allocation Portfolio
MainStay VP Moderate Allocation Portfolio
Manager
New York Life Investment Management LLC
New York, New York
Subadvisors
Brown Advisory LLC
Baltimore, Maryland
Candriam Belgium S.A.*
Brussels, Belgium
CBRE Clarion Securities LLC
Radnor, Pennsylvania
Epoch Investment Partners, Inc.
New York, New York
FIAM LLC
Smithfield, Rhode Island
IndexIQ Advisors LLC*
New York, New York
Janus Capital Management LLC
Denver, Colorado
MacKay Shields LLC*
New York, New York
Mellon Investments Corporation
Boston, Massachusetts
NYL Investors LLC*
New York, New York
Pacific Investment Management Company LLC
Newport Beach, California
Segall Bryant & Hamill, LLC
Chicago, Illinois
T. Rowe Price Associates, Inc.
Baltimore, Maryland
Wellington Management Company LLP
Boston, Massachusetts
Winslow Capital Management, LLC
Minneapolis, Minnesota
Legal Counsel
Dechert LLP
Washington, District of Columbia
Independent Registered Public Accounting Firm
PricewaterhouseCoopers LLP
New York, New York
Distributor
NYLIFE Distributors LLC*
Jersey City, New Jersey
Custodian
JPMorgan Chase Bank, N.A.
New York, New York
Some Portfolios may not be available in all products.
† Fidelity Institutional AM is a registered trade mark of FMR LLC. Used with permission.
* An affiliate of New York Life Investment Management LLC
Not part of the Semiannual Report
2021 Semiannual Report
This report is for the general information of New York Life Variable Annuities and NYLIAC Variable Universal Life Insurance Products policyowners. It must be preceded or accompanied by the appropriate product(s) and funds prospectuses if it is given to anyone who is not an owner of a New York Life variable annuity policy or a NYLIAC Variable Universal Life Insurance Product. This report does not offer for sale or solicit orders to purchase securities.
The performance data quoted in this report represents past performance. Past performance is no guarantee of future results. Due to market volatility and other factors, current performance may be lower or higher than the figures shown. The most recent month-end performance summary for your variable annuity or variable life policy is available by calling 800-598-2019 and is updated periodically on newyorklife.com.
The New York Life Variable Annuities and NYLIAC Variable Universal Life Insurance Products are issued by New York Life Insurance and Annuity Corporation (a Delaware Corporation) and distributed by NYLIFE Distributors LLC (Member FINRA/SIPC).
New York Life Insurance Company
New York Life Insurance and Annuity
Corporation (NYLIAC) (A Delaware Corporation)
51 Madison Avenue, Room 551
New York, NY 10010
newyorklife.com
nylinvestments.com
NYLIFE Distributors LLC, 30 Hudson Street, Jersey City, NJ 07302
New York Life Investment Management LLC is the investment manager to the MainStay VP Funds Trust
©2021 by NYLIFE Distributors LLC. All rights reserved.
You may obtain copies of the Prospectus and the Statement of Additional Information free of charge, upon request, by calling toll-free 800-598-2019 or writing to New York Life Insurance and Annuity Corporation, 51 Madison Avenue, New York, NY 10010.
| Not FDIC Insured | No Bank Guarantee | May Lose Value |
(NYLIAC) NI507
MainStay VP PIMCO Real Return Portfolio
Message from the President and Semiannual Report
Unaudited | June 30, 2021
Sign up for e-delivery of your shareholder reports. For full details on e-delivery, including who can participate and what you can receive via e-delivery,
please log in to newyorklifeinvestments.com/accounts.
| Not FDIC/NCUA Insured | Not a Deposit | May Lose Value | No Bank Guarantee | Not Insured by Any Government Agency |
This page intentionally left blank
Message from the President
The COVID-19 pandemic continued to afflict our personal lives and broad segments of the U.S. and global economy throughout the six-month reporting period ended June 30, 2021. However, with the deployment of multiple vaccines around the world, including three highly effective versions approved for emergency use in the United States, investors began to turn their attention toward the gradual reopening of the economy and the shape the “new normal” would take.
The first half of the reporting period saw increasing inflationary concerns as fiscal stimulus business reopenings drove accelerating economic growth, rising commodity prices and increased consumer spending. However, the U.S. Federal Reserve noted that price increases were likely to prove temporary and made clear their intention to remain accommodative for the foreseeable future. Accordingly, after moving higher in the first quarter of 2021, interest rates declined in the second quarter.
In response to the uncertain inflation outlook, equity market leadership shifted from value in the first quarter of the year to growth in the second quarter. Nevertheless, investor sentiment remained buoyant throughout the reporting period, with all eleven sectors in the S&P 500® Index, a widely regarded benchmark of market performance, producing positive returns. Energy led the market’s rise fueled by rapidly increasing oil and gas prices, followed by financials and real estate, which benefited from rising interest rates and the economic reopening, respectively. Communication services produced the slowest growth, followed by the traditionally defensive utilities and consumer staples
sectors. In the fixed income market, lower-credit-quality issues tended to outperform their higher-grade counterparts, with high-yield corporate bonds generating the strongest performance. Among securitized products, commercial mortgage-backed securities generally produced the strongest returns, followed by mortgage-backed securities and asset-backed securities, while Treasury securities lagged.
Despite the tremendous progress we’ve seen so far this year, the United States and the world continue to face significant pandemic-related challenges. Newer, more contagious variants of COVID-19 threaten the return of restrictions and lockdowns that could stall the economic recovery. At the same time, supply chain shortages have led to rising prices on everything from laptops to autos, stoking fears of uncontrolled inflation despite reassurance from the U.S. Federal Reserve. At New York Life Investments, we recognize that the shape that the “new normal” eventually takes may differ from our expectations. You can depend on us to keep a sharp watch for the unexpected, and to continue to help you find your way through this rapidly evolving investment landscape.
Sincerely,
Kirk C. Lehneis
President
The opinions expressed are as of the date of this report and are subject to change. There is no guarantee that any forecast made will come to pass. This material does not constitute investment advice and is not intended as an endorsement of any specific investment. Past performance is no guarantee of future results.
Not part of the Semiannual Report
Investors should refer to the Portfolio’s Summary Prospectus and/or Prospectus and consider the Portfolio’s investment objectives, strategies, risks, charges and expenses carefully before investing. The Summary Prospectus and/or Prospectus contain this and other information about the Portfolio. You may obtain copies of the Portfolio’s Summary Prospectus and/or the Prospectus and the Statement of Additional Information free of charge, upon request, by calling toll-free 800-598-2019, by writing to New York Life Insurance and Annuity Corporation, 51 Madison Avenue, Room 251, New York, New York 10010 or by sending an email to MainStayShareholdersServices@nylim.com. These documents are also available at nylinvestments.com/vpdocuments. Please read the Portfolio's Summary Prospectus and/or Prospectus carefully before investing. MainStay VP Funds Trust portfolios are separate account options which are purchased through a variable insurance or variable annuity contract.
Investment and Performance Comparison (Unaudited)
Performance data quoted represents past performance. Past performance is no guarantee of future results. Because of market volatility and other factors, current performance may be lower or higher than the figures shown. Investment return and principal value will fluctuate, and as a result, when shares are redeemed, they may be worth more or less than their original cost. The performance table and graph do not reflect any deduction of sales charges, mortality and expense charges, contract charges or administrative charges. Please refer to the Performance Summary appropriate for your policy. For performance information current to the most recent month-end, please call 800-598-2019 or visit www.newyorklife.com.
Performance figures may reflect certain fee waivers and/or expense limitations, without which total returns may have been different. For information on current fee waivers and/or expense limitations (if any), please refer to the Notes to Financial Statements.
| Average Annual Total Returns for the Period-Ended June 30, 2021 |
| Class | Inception
Date | Six
Months | One
Year | Five
Years | Since
Inception | Gross
Expense
Ratio1 |
| Initial Class Shares | 2/17/2012 | 1.64% | 7.16% | 4.41% | 2.53% | 0.83% |
| Service Class Shares | 2/17/2012 | 1.52 | 6.89 | 4.15 | 2.29 | 1.08 |
| 1. | The gross expense ratios presented reflect the Portfolio’s “Total Annual Portfolio Operating Expenses” from the most recent Prospectus, as supplemented, and may differ from other expense ratios disclosed in this report. |
| Benchmark Performance | Six
Months | One
Year | Five
Years | Since
Inception |
| Bloomberg Barclays U.S. TIPS Index1 | 1.73% | 6.51% | 4.17% | 2.70% |
| Morningstar Inflation-Protected Bond Category Average2 | 1.79 | 6.91 | 3.96 | 2.19 |
| 1. | The Bloomberg Barclays U.S. TIPS Index is the primary benchmark. The Bloomberg Barclays U.S. TIPS Index includes all publicly issued U.S. Treasury Inflation-Protected Securities (“TIPS”) that have at least one year remaining to maturity and are rated investment grade. Results assume reinvestment of all dividends and capital gains. An investment cannot be made directly in an index. |
| 2. | The Morningstar Inflation-Protected Bond Category Average is representative of funds that invest primarily in debt securities that adjust their principal values in line with the rate of inflation. These bonds can be issued by any organization, but the U.S. Treasury is currently the largest issuer for these types of securities. Results are based on average total returns of similar funds with all dividends and capital gain distributions reinvested. |
Cost in Dollars of a $1,000 Investment in MainStay VP PIMCO Real Return Portfolio (Unaudited)
The example below is intended to describe the fees and expenses borne by shareholders during the six-month period from January 1, 2021 to June 30, 2021, and the impact of those costs on your investment.
Example
As a shareholder of the Portfolio you incur two types of costs: (1) transaction costs, including exchange fees and sales charges (loads) on purchases (as applicable), and (2) ongoing costs, including management fees, distribution and/or service (12b-1) fees, and other Portfolio expenses (as applicable). This example is intended to help you understand your ongoing costs (in dollars) of investing in the Portfolio and to compare these costs with the ongoing costs of investing in other mutual funds. The example is based on an investment of $1,000 made at the beginning of the six-month period and held for the entire period from January 1, 2021 to June 30, 2021. Shares are only sold in connection with variable life and annuity contracts and the example does not reflect any contract level or transactional fees or expenses. If these costs had been included, your costs would have been higher.
This example illustrates your Portfolio’s ongoing costs in two ways:
Actual Expenses
The second and third data columns in the table below provide information about actual account values and actual expenses. You may use the information in these columns, together with the amount you invested, to estimate the expenses that you paid during the six months ended June
30, 2021. Simply divide your account value by $1,000 (for example, an $8,600 account value divided by $1,000 = 8.6), then multiply the result by the number under the heading entitled “Expenses Paid During Period” to estimate the expenses you paid on your account during this period.
Hypothetical Example for Comparison Purposes
The fourth and fifth data columns in the table below provide information about hypothetical account values and hypothetical expenses based on the Portfolio’s actual expense ratio and an assumed rate of return of 5% per year before expenses, which is not the Portfolio’s actual return. The hypothetical account values and expenses may not be used to estimate the actual ending account balances or expenses you paid for the six-month period shown. You may use this information to compare the ongoing costs of investing in the Portfolio with the ongoing costs of investing in other mutual funds. To do so, compare this 5% hypothetical example with the 5% hypothetical examples that appear in the shareholder reports of the other mutual funds.
Please note that the expenses shown in the table are meant to highlight your ongoing costs only and do not reflect any transactional costs, such as exchange fees or sales charges (loads). Therefore, the fourth and fifth data columns of the table are useful in comparing ongoing costs only and will not help you determine the relative total costs of owning different funds. In addition, if these transactional costs were included, your costs would have been higher.
| Share Class | Beginning
Account
Value
1/1/21 | Ending Account
Value (Based
on Actual
Returns and
Expenses)
6/30/21 | Expenses
Paid
During
Period1 | Ending Account
Value (Based
on Hypothetical
5% Annualized
Return and
Actual Expenses)
6/30/21 | Expenses
Paid
During
Period1 | Net Expense
Ratio
During
Period2, 3 |
| Initial Class Shares | $1,000.00 | $1,016.40 | $2.80 | $1,022.02 | $2.81 | 0.56% |
| Service Class Shares | $1,000.00 | $1,015.20 | $4.05 | $1,020.78 | $4.06 | 0.81% |
| 1. | Expenses are equal to the Portfolio’s annualized expense ratio of each class multiplied by the average account value over the period, divided by 365 and multiplied by 181 (to reflect the six-month period). The table above represents the actual expenses incurred during the six-month period. In addition to the fees and expenses which the Portfolio bears directly, it also indirectly bears a pro rata share of the fees and expenses of the underlying funds in which it invests. Such indirect expenses are not included in the above-reported expense figures. |
| 2. | Expenses are equal to the Portfolio's annualized expense ratio to reflect the six-month period. |
| 3. | Expenses are inclusive of dividends and interest on investments sold short. |
| 6 | MainStay VP PIMCO Real Return Portfolio |
Portfolio Composition as of June 30, 2021 (Unaudited)
‡ Less than one-tenth of percent.
See Portfolio of Investments beginning on page 10 for specific holdings within these categories. The Portfolio's holdings are subject to change.
Top Ten Issuers Held as of June 30, 2021 (excluding short-term investments) (Unaudited)
| 1. | U.S. Treasury Inflation Linked Notes, 0.125%-0.875%, due 1/15/22–1/15/31 |
| 2. | U.S. Treasury Inflation Linked Bonds, 0.125%-3.375%, due 1/15/25–2/15/51 |
| 3. | Italy Buoni Poliennali Del Tesoro, 0.40%-1.40%, due 5/26/25–5/15/30 |
| 4. | UMBS, Single Family, 30 Year, 3.50%-4.00%, due 8/25/51 |
| 5. | Japan Government CPI Linked Bond, 0.005%-0.10%, due 3/10/28–3/10/31 |
| 6. | Nykredit Realkredit A/S, 0.50%-2.50%, due 10/1/43–10/1/53 |
| 7. | France Government Bond, 0.10%-0.25%, due 7/25/24–3/1/26 |
| 8. | Jyske Realkredit A/S, 0.50%-2.50%, due 10/1/43–10/1/53 |
| 9. | Nordea Kredit Realkreditaktieselskab, 0.50%-2.50%, due 10/1/43–10/1/53 |
| 10. | New Zealand Government Inflation Linked Bond, 2.00%-3.00%, due 9/20/25–9/20/35 |
Portfolio Management Discussion and Analysis (Unaudited)
Answers to the questions reflect the views of portfolio managers Stephen A. Rodosky and Daniel He of Pacific Investment Management Company LLC, the Portfolio’s Subadvisor.
How did MainStay VP PIMCO Real Return Portfolio perform relative to its benchmark and peers during the six months ended June 30, 2021?
For the six months ended June 30, 2021, MainStay VP PIMCO Real Return Portfolio returned 1.64% for Initial Class shares and 1.52% for Service Class shares. Over the same period, both share classes underperformed the 1.73% return of the Bloomberg Barclays U.S. TIPS Index (“the Index”), which is the Portfolio’s benchmark, and the 1.79% return of the Morningstar Inflation-Protected Bond Category Average.1
What factors affected the Portfolio’s performance relative to its benchmark during the reporting period?
The following strategies detracted from the Portfolio’s performance relative to the Index during the reporting period:
• Short exposure to U.K. breakeven inflation exposure (the difference between nominal and real yields), and
• U.S. interest-rate positioning as rates broadly rose.
The following strategies made positive contributions to the Portfolio’s relative performance during the same period (Contributions take weightings and total returns into account.):
• Overweight U.S. and eurozone breakeven inflation exposure as inflation expectations in the region rose, and
• Positions in non-Agency mortgage-backed securities as a diversifying source of yield.
During the reporting period, how was the Portfolio’s performance materially affected by investments in derivatives?
Derivatives are used in the Portfolio to gain or decrease exposure to securities, markets or sectors; as a substitute for exposure that may not otherwise be accessible using cash bonds; for purposes of liquidity; or to take advantage of anticipated changes in market volatility.
U.S. breakeven inflation positioning, which was in part achieved using swaps, options and futures, contributed positively to the Portfolio’s performance relative to the Index. Additionally, European breakeven inflation positioning, which was in part
achieved using interest-rate swaps, was positive for performance. Within spread2 sectors, underweight exposure to high-yield credit default swaps indices (CDX) was neutral for performance. Finally, currency exposure, using currency forwards, was neutral for performance overall.
What was the Portfolio’s duration3 strategy during the reporting period?
The Portfolio remained overweight overall duration relative to the Index during the reporting period. More specifically, the Portfolio maintained modestly overweight exposure to real duration (nominal interest rates minus the inflation rate) in the United States. The Portfolio decreased its U.S. breakeven inflation exposure to realize profits at the end of April 2021. In turn, the Portfolio reduced its overweight to U.S. duration accordingly. The Portfolio held underweight exposure to U.K. breakeven inflation throughout the reporting period and modestly increased exposure to Japanese breakeven inflation exposure.
The Portfolio’s overall duration was increased over the reporting period, standing at 7.77 years as of June 30, 2021.
What specific factors, risks or market forces prompted significant decisions for the Portfolio during the reporting period?
The Portfolio entered the reporting period defensively positioned, however, it experienced bouts of volatility as rates sold off in the first quarter of 2021 amid expectations for higher growth and inflation. The Portfolio increased overall duration positioning, mainly sourced from U.S. rates given the potential for capital appreciation and more attractive levels after the February 2021 sell-off. The Portfolio reduced U.S. breakeven inflation positioning after profit taking in April and trimmed U.S. duration accordingly. The Portfolio closed short exposure to high-yield CDX given the updated cyclical outlook and our view of a preference for spread exposure from securitized4 products. The Portfolio reduced agency mortgage-backed security (MBS) exposure given our view of rich levels. At the end of the reporting period, the Portfolio favored non-agency mortgages for spread exposure. Within currencies, the Portfolio increased its short U.S. dollar position
| 1. | See page 5 for more information on benchmark and peer group returns. |
| 2. | The terms “spread” and “yield spread” may refer to the difference in yield between a security or type of security and comparable U.S. Treasury issues. The terms may also refer to the difference in yield between two specific securities or types of securities at a given time. |
| 3. | Duration is a measure of the price sensitivity of a fixed-income investment to changes in interest rates. Duration is expressed as a number of years and is considered a more accurate sensitivity gauge than average maturity. |
| 4. | A securitization is a financial instrument created by an issuer by combining a pool of financial assets (such as mortgages). The financial instrument is then marketed to investors, sometimes in tiers. |
| 8 | MainStay VP PIMCO Real Return Portfolio |
against developed- and emerging-market currencies given our view of the expectation that the U.S. Federal Reserve would remain accommodative.
During the reporting period, which market segments were the strongest positive contributors to the Portfolio’s absolute performance and which market segments were particularly weak?
Within real duration, tactical positioning in U.S. Treasury Inflation-Protected Securities (TIPS) added to performance as rates across the real yield curve5 modestly rose over the reporting period. Underweight nominal duration positions, specifically in the United States and the eurozone, added to performance amid rising global rates. Rising inflation expectations in the United States and the eurozone were positive for performance given the Portfolio’s long exposure to U.S. and eurozone inflation-linked bonds. Conversely, short exposure to U.K. inflation-linked bonds detracted from performance amid an increase in U.K. inflation expectations. Out-of-benchmark exposures to spread sectors such as non-agency mortgages added to performance. Lastly, currency strategies were neutral for performance, though we expect to continue to seek opportunities from overshoots and undershoots that provide attractive risk-reward profiles.
Did the Portfolio make any significant purchases or sales during the reporting period?
During the reporting period, the Portfolio maintained overweight exposure to overall duration relative to the Index. As previously mentioned, the Portfolio modestly trimmed U.S. breakeven inflation exposure in April to realize profits at heightened inflation expectations. Additionally, the Portfolio reduced agency MBS exposure given our view of rich levels and turned to non-agency mortgages for spread exposure.
How was the Portfolio positioned at the end of the reporting period?
As of June 30, 2021, the Portfolio continued to hold overweight exposure to U.S. breakeven inflation. The Portfolio was neutral on duration overall and favored U.S. rates over other developed markets. The Portfolio held increased exposure to Japanese inflation-linked bonds and Danish MBS after widening late in the reporting period. The Portfolio continued to hold out-of-index exposure to MBS, remained roughly neutral in corporate credit and held modest currency positions.
| 5. | The yield curve is a line that plots the yields of various securities of similar quality—typically U.S. Treasury issues—across a range of maturities. The U.S. Treasury yield curve serves as a benchmark for other debt and is used in economic forecasting. |
The opinions expressed are those of the portfolio managers as of the date of this report and are subject to change. There is no guarantee that any forecasts will come to pass. This material does not constitute investment advice and is not intended as an endorsement of any specific investment.
Not all MainStay VP Portfolios and/or share classes are available under all policies.
Portfolio of Investments June 30, 2021† (Unaudited)
| | Principal
Amount | Value |
| Long-Term Bonds 128.6% |
| Asset-Backed Securities 8.1% |
| Home Equity Asset-Backed Securities 2.0% |
| Argent Securities Trust | |
| Series 2006-W4, Class A2C | | |
| 0.412% (1 Month LIBOR + 0.32%), due 5/25/36 (a) | $ 307,230 | $ 110,759 |
| Countrywide Asset-Backed Certificates | |
| Series 2007-8, Class 1A1 | | |
| 0.281% (1 Month LIBOR + 0.19%), due 11/25/37 (a) | 1,860,029 | 1,774,084 |
| Credit Suisse First Boston Mortgage Securities Corp. | |
| Series 2001-HE17, Class A1 | | |
| 0.712% (1 Month LIBOR + 0.62%), due 1/25/32 (a) | 805,245 | 783,672 |
| Credit-Based Asset Servicing and Securitization LLC | |
| Series 2007-CB6, Class A3 | | |
| 0.312% (1 Month LIBOR + 0.22%), due 7/25/37 (a)(b) | 977,098 | 770,398 |
| First Franklin Mortgage Loan Trust | |
| Series 2006-FF17, Class A2 | | |
| 0.212% (1 Month LIBOR + 0.12%), due 12/25/36 (a) | 513,189 | 458,396 |
| GSAA Home Equity Trust | |
| Series 2006-17, Class A3A | | |
| 0.572% (1 Month LIBOR + 0.48%), due 11/25/36 (a) | 1,164,938 | 569,149 |
| Home Equity Asset Trust (a) | |
| Series 2005-8, Class M2 | | |
| 0.542% (1 Month LIBOR + 0.675%), due 2/25/36 | 300,000 | 297,745 |
| Series 2004-2, Class M1 | | |
| 0.887% (1 Month LIBOR + 0.795%), due 7/25/34 | 82,863 | 82,240 |
| Long Beach Mortgage Loan Trust | |
| Series 2006-7, Class 2A2 | | |
| 0.212% (1 Month LIBOR + 0.12%), due 8/25/36 (a) | 253,229 | 134,565 |
| Mastr Asset Backed Securities Trust | |
| Series 2006-WMC4, Class A5 | | |
| 0.241% (1 Month LIBOR + 0.15%), due 10/25/36 (a) | 122,242 | 53,360 |
| Morgan Stanley ABS Capital I, Inc. Trust | |
| Series 2005-WMC1, Class M3 | | |
| 0.871% (1 Month LIBOR + 0.78%), due 1/25/35 (a) | 197,533 | 196,018 |
| | Principal
Amount | Value |
| |
| Home Equity Asset-Backed Securities (continued) |
| New Century Home Equity Loan Trust | |
| Series 2004-4, Class M1 | | |
| 0.857% (1 Month LIBOR + 0.765%), due 2/25/35 (a) | $ 65,106 | $ 64,335 |
| Option One Mortgage Loan Trust | |
| Series 2006-1, Class M1 | | |
| 0.632% (1 Month LIBOR + 0.54%), due 1/25/36 (a) | 1,200,000 | 1,168,349 |
| Popular ABS Mortgage Pass-Through Trust | |
| Series 2006-A, Class M2 | | |
| 0.672% (1 Month LIBOR + 0.58%), due 2/25/36 (a) | 1,238,000 | 1,197,360 |
| RASC Trust (a) | |
| Series 2006-KS6, Class A4 | | |
| 0.341% (1 Month LIBOR + 0.25%), due 8/25/36 | 165,584 | 164,994 |
| Series 2006-EMX4, Class A4 | | |
| 0.551% (1 Month LIBOR + 0.23%), due 6/25/36 | 646,511 | 631,931 |
| Series 2005-KS8, Class M4 | | |
| 0.977% (1 Month LIBOR + 0.59%), due 8/25/35 | 471,942 | 472,124 |
| Series 2005-EMX1, Class M2 | | |
| 1.186% (1 Month LIBOR + 1.095%), due 3/25/35 | 631,322 | 626,536 |
| Saxon Asset Securities Trust | |
| Series 2007-3, Class 1A | | |
| 0.402% (1 Month LIBOR + 0.31%), due 9/25/37 (a) | 143,337 | 140,953 |
| Securitized Asset-Backed Receivables LLC Trust (a) | |
| Series 2006-HE2, Class A2C | | |
| 0.392% (1 Month LIBOR + 0.30%), due 7/25/36 | 372,373 | 208,751 |
| Series 2006-HE1, Class A2C | | |
| 0.412% (1 Month LIBOR + 0.32%), due 7/25/36 | 588,571 | 278,262 |
| Soundview Home Loan Trust (a) | |
| Series 2007-OPT2, Class 2A3 | | |
| 0.272% (1 Month LIBOR + 0.18%), due 7/25/37 | 205,679 | 197,580 |
| Series 2007-OPT1, Class 1A1 | | |
| 0.291% (1 Month LIBOR + 0.20%), due 6/25/37 | 320,764 | 263,896 |
| | | 10,645,457 |
The notes to the financial statements are an integral part of, and should be read in conjunction with, the financial statements.
| 10 | MainStay VP PIMCO Real Return Portfolio |
| | Principal
Amount | Value |
| Asset-Backed Securities (continued) |
| Other Asset-Backed Securities 6.1% |
| Anchorage Capital CLO 6 Ltd. | |
| Series 2015-6A, Class ARR | | |
| 1.234% (3 Month LIBOR + 1.05%), due 7/15/30 (a)(b) | $ 500,000 | $ 500,020 |
| Anchorage Capital CLO 16 Ltd. | |
| Series 2020-16A, Class A | | |
| 1.588% (3 Month LIBOR + 1.40%), due 10/20/31 (a)(b) | 1,100,000 | 1,100,951 |
| Apidos CLO XXVII | |
| Series 2017-27A, Class A1R | | |
| 1.049% (3 Month LIBOR + 0.93%), due 7/17/30 (a)(b) | 600,000 | 600,190 |
| Arch Street CLO Ltd. | |
| Series 2016-2A, Class AR2 | | |
| 1.188% (3 Month LIBOR + 1.00%), due 10/20/28 (a)(b) | 700,000 | 700,018 |
| Ares European CLO X DAC | |
| Series 10A, Class AR | | |
| 0.78% (3 Month EURIBOR + 0.78%), due 10/15/31 (a)(b) | EUR 1,100,000 | 1,303,896 |
| Atlas Senior Loan Fund Ltd. | |
| Series 2017-8A, Class A | | |
| 1.53% (3 Month LIBOR + 1.15%), due 1/16/30 (a)(b) | $ 1,200,000 | 1,199,944 |
| Atrium XII | |
| Series 12A, Class AR | | |
| 1.014% (3 Month LIBOR + 0.83%), due 4/22/27 (a)(b) | 271,696 | 271,532 |
| Benefit Street Partners CLO XVI Ltd. | |
| Series 2018-16A, Class A1R | | |
| 1.03% (3 Month LIBOR + 1.03%), due 1/17/32 (a)(b) | 300,000 | 300,095 |
| Black Diamond CLO Designated Activity Co. | |
| Series 2015-1A, Class A1R | | |
| 0.65% (3 Month EURIBOR + 0.65%), due 10/3/29 (a)(b) | EUR 152,724 | 181,093 |
| Black Diamond CLO Ltd. | |
| Series 2017-2A, Class A1 | | |
| 0.86% (3 Month EURIBOR + 0.86%), due 1/20/32 (a)(b) | 1,000,000 | 1,185,753 |
| BlueMountain Fuji Eur CLO V DAC | |
| Series 5A, Class A | | |
| 0.91% (3 Month EURIBOR + 0.91%), due 1/15/33 (a)(b) | 1,100,000 | 1,304,334 |
| Carlyle Global Market Strategies CLO Ltd. | |
| Series 2013-1A, Class A1RR | | |
| 1.061%, due 8/14/30 (b) | $ 600,000 | 600,000 |
| | Principal
Amount | Value |
| |
| Other Asset-Backed Securities (continued) |
| Carlyle Global Market Strategies Euro CLO Ltd. | |
| Series 2014-2A, Class AR1 | | |
| 0.75% (3 Month EURIBOR + 0.75%), due 11/15/31 (a)(b) | EUR 1,000,000 | $ 1,177,374 |
| Catamaran CLO Ltd. | |
| Series 2013-1A, Class AR | | |
| 1.031% (3 Month LIBOR + 0.85%), due 1/27/28 (a)(b) | $ 549,078 | 549,085 |
| CBAM Ltd. | |
| Series 2017-3A, Class A | | |
| 1.42% (3 Month LIBOR + 1.23%), due 10/17/29 (a)(b) | 500,000 | 500,157 |
| CIFC Funding 2017-IV Ltd. | |
| Series 2017-4A, Class A1R | | |
| 1.038% (3 Month LIBOR + 0.95%), due 10/24/30 (a)(b) | 400,000 | 400,102 |
| CoreVest American Finance Trust | |
| Series 2017-1, Class A | | |
| 2.968%, due 10/15/49 (b) | 14,977 | 15,010 |
| Dryden 52 Euro CLO DAC | |
| Series 2017-52A, Class AR | | |
| 0.86%, due 5/15/34 (b) | EUR 500,000 | 592,015 |
| Halcyon Loan Advisors Funding Ltd. | |
| Series 2015-1A, Class AR | | |
| 1.108% (3 Month LIBOR + 0.92%), due 4/20/27 (a)(b) | $ 37,473 | 37,474 |
| ICG US CLO Ltd. | |
| Series 2020-1A, Class A1 | | |
| 1.584% (3 Month LIBOR + 1.40%), due 10/22/31 (a)(b) | 1,100,000 | 1,100,829 |
| Jubilee CLO BV | |
| Series 2015-16A, Class A1R | | |
| 0.252% (3 Month EURIBOR + 0.80%), due 12/15/29 (a)(b) | EUR 1,637,258 | 1,932,714 |
| KKR CLO 18 Ltd. | |
| Series 18, Class A | | |
| 1.46% (3 Month LIBOR + 1.27%), due 7/18/30 (a)(b) | $ 900,000 | 900,103 |
| KVK CLO Ltd. | |
| Series 2013-1A, Class AR | | |
| 1.086% (3 Month LIBOR + 0.90%), due 1/14/28 (a)(b) | 625,364 | 625,378 |
| LCM 30 Ltd. | |
| Series 30A, Class AR | | |
| 1.203% (3 Month LIBOR + 1.08%), due 4/20/31 (a)(b) | 1,350,000 | 1,350,327 |
The notes to the financial statements are an integral part of, and should be read in conjunction with, the financial statements.
11
Portfolio of Investments June 30, 2021† (Unaudited) (continued)
| | Principal
Amount | Value |
| Asset-Backed Securities (continued) |
| Other Asset-Backed Securities (continued) |
| LCM XV LP | |
| Series 15A, Class AR2 | | |
| 1.188% (3 Month LIBOR + 1.00%), due 7/20/30 (a)(b) | $ 400,000 | $ 400,010 |
| Legacy Mortgage Asset Trust | |
| Series 2019-GS3, Class A1 | | |
| 3.75%, due 4/25/59 (b)(c) | 150,778 | 152,032 |
| MacKay Shields Euro DAC | |
| Series 2A, Class A | | |
| 1.55% (3 Month EURIBOR + 1.55%), due 8/15/33 (a)(b) | EUR 250,000 | 296,797 |
| Man GLG Euro CLO II DAC | |
| Series 2A, Class A1R | | |
| 0.87% (3 Month EURIBOR + 0.87%), due 1/15/30 (a)(b) | 249,868 | 296,429 |
| Marathon CLO V Ltd. | |
| Series 2013-5A, Class A1R | | |
| 1.019% (3 Month LIBOR + 0.87%), due 11/21/27 (a)(b) | $ 668,796 | 668,945 |
| Marlette Funding Trust | |
| Series 2019-3A, Class A | | |
| 2.69%, due 9/17/29 (b) | 17,366 | 17,421 |
| MidOcean Credit CLO II | |
| Series 2013-2A, Class ARR | | |
| 1.207% (3 Month LIBOR + 1.03%), due 1/29/30 (a)(b) | 300,000 | 300,011 |
| MP CLO VII Ltd. | |
| Series 2015-1A, Class AR3 | | |
| 0.891% (3 Month LIBOR + 0.89%), due 10/18/28 (a)(b) | 500,000 | 500,092 |
| Nassau Ltd. | |
| Series 2020-1A, Class A1 | | |
| 2.338% (3 Month LIBOR + 2.15%), due 7/20/29 (a)(b) | 1,100,000 | 1,100,447 |
| OCP CLO Ltd. (a)(b) | |
| Series 2015-9A, Class A1R | | |
| 0.984% (3 Month LIBOR + 0.80%), due 7/15/27 | 46,615 | 46,617 |
| Series 2015-10A, Class A1R | | |
| 0.996% (3 Month LIBOR + 0.82%), due 10/26/27 | 539,034 | 539,057 |
| Palmer Square European Loan Funding DAC | |
| Series 2020-1A, Class A | | |
| 1.15% (3 Month EURIBOR + 1.15%), due 1/15/30 (a)(b) | EUR 772,329 | 917,113 |
| | Principal
Amount | Value |
| |
| Other Asset-Backed Securities (continued) |
| Palmer Square Loan Funding Ltd. | |
| Series 2021-3A, Class A1 | | |
| 0.971%, due 7/20/29 (b)(d) | $ 1,400,000 | $ 1,400,000 |
| Romark CLO Ltd. | |
| Series 2017-1A, Class A1R | | |
| (zero coupon), due 10/23/30 (b)(d) | 400,000 | 400,042 |
| SLM Student Loan Trust | |
| Series 2003-5, Class A5 | | |
| (zero coupon), due 6/17/24 | EUR 1,778 | 2,108 |
| Series 2004-3A, Class A6B | | |
| 0.726% (3 Month LIBOR + 0.55%), due 10/25/64 (a)(b) | $ 428,671 | 427,628 |
| Sound Point CLO XIV Ltd. | |
| Series 2016-3A, Class AR2 | | |
| 1.163% (3 Month LIBOR + 0.99%), due 1/23/29 (a)(b) | 1,181,489 | 1,180,616 |
| Sound Point CLO XV Ltd. | |
| Series 2017-1A, Class ARR | | |
| 1.073% (3 Month LIBOR + 0.90%), due 1/23/29 (a)(b) | 1,100,000 | 1,100,033 |
| SP-STATIC CLO 1 Ltd. | |
| Series 2020-1A, Class A | | |
| 1.584% (3 Month LIBOR + 1.40%), due 7/22/28 (a)(b) | 386,407 | 386,474 |
| Stanwich Mortgage Loan Co. LLC | |
| Series 2019-NPB1, Class A1 | | |
| 3.375%, due 8/15/24 (b)(c) | 155,341 | 156,302 |
| Symphony CLO XIV Ltd. | |
| Series 2014-14A, Class AR | | |
| 1.136% (3 Month LIBOR + 0.95%), due 7/14/26 (a)(b) | 164,001 | 164,005 |
| Venture 36 CLO Ltd. | |
| Series 2019-36A, Class A1AR | | |
| 1.223% (3 Month LIBOR + 1.13%), due 4/20/32 (a)(b) | 600,000 | 601,241 |
| Venture XX CLO Ltd. | |
| Series 2015-20A, Class AR | | |
| 1.004% (3 Month LIBOR + 0.82%), due 4/15/27 (a)(b) | 298,105 | 298,112 |
| Venture XXI CLO Ltd. | |
| Series 2015-21A, Class AR | | |
| 1.064% (3 Month LIBOR + 0.88%), due 7/15/27 (a)(b) | 740,700 | 740,717 |
| Venture XXIV CLO Ltd. | |
| Series 2016-24A, Class ARR | | |
| 1.088% (3 Month LIBOR + 0.90%), due 10/20/28 (a)(b) | 393,051 | 392,797 |
The notes to the financial statements are an integral part of, and should be read in conjunction with, the financial statements.
| 12 | MainStay VP PIMCO Real Return Portfolio |
| | Principal
Amount | Value |
| Asset-Backed Securities (continued) |
| Other Asset-Backed Securities (continued) |
| Vibrant CLO VI Ltd. | |
| Series 2017-6A, Class AR | | |
| 1.085% (3 Month LIBOR + 0.95%), due 6/20/29 (a)(b) | $ 1,300,000 | $ 1,300,309 |
| Voya CLO Ltd. | |
| Series 2017-1A, Class A1R | | |
| 1.073% (3 Month LIBOR + 0.95%), due 4/17/30 (a)(b) | 1,000,000 | 1,000,025 |
| Z Capital Credit Partners CLO Ltd. | |
| Series 2015-1A, Class A1R | | |
| 1.134% (3 Month LIBOR + 0.95%), due 7/16/27 (a)(b) | 160,210 | 160,214 |
| | | 33,373,988 |
Total Asset-Backed Securities
(Cost $43,855,692) | | 44,019,445 |
| Corporate Bonds 5.7% |
| Auto Manufacturers 0.4% |
| BMW US Capital LLC | | |
| 3.40%, due 8/13/21 (b) | 600,000 | 602,177 |
| Nissan Motor Acceptance Corp. (b) | | |
| 1.90%, due 9/14/21 | 100,000 | 100,275 |
| 2.65%, due 7/13/22 | 200,000 | 203,263 |
| Volkswagen Group of America Finance LLC (b) | | |
| 0.994% (3 Month LIBOR + 0.86%), due 9/24/21 (a) | 900,000 | 901,658 |
| 4.00%, due 11/12/21 | 600,000 | 608,356 |
| | | 2,415,729 |
| Banks 2.4% |
| Banco Bilbao Vizcaya Argentaria SA | | |
| Series Reg S | | |
| 5.875% (EUR 5 Year Interest Swap Rate + 5.66%), due 9/24/23 (a)(e) | EUR 400,000 | 512,244 |
| Bank of America Corp. | | |
| Series FF | | |
| 5.875%, due 3/15/28 (e)(f) | $ 190,000 | 217,466 |
| Credit Suisse Group Funding Guernsey Ltd. | | |
| 3.80%, due 9/15/22 | 300,000 | 312,175 |
| Deutsche Bank AG | | |
| 4.25%, due 10/14/21 | 1,400,000 | 1,415,181 |
| ING Bank NV | | |
| 2.625%, due 12/5/22 (b) | 400,000 | 413,105 |
| | Principal
Amount | Value |
| |
| Banks (continued) |
| Lloyds Banking Group plc | | |
| Series Reg S | | |
| 4.947% (5 Month EURIBOR ICE Swap Rate + 5.29%), due 6/27/25 (a)(e) | EUR 200,000 | $ 261,465 |
| Natwest Group plc | | |
| 1.697% (3 Month LIBOR + 1.55%), due 6/25/24 (a) | $ 300,000 | 306,799 |
| 4.519%, due 6/25/24 (f) | 200,000 | 214,716 |
| Nykredit Realkredit A/S | | |
| Series Reg S | | |
| 0.50%, due 10/1/43 | DKK 13,177,748 | 1,985,724 |
| Series Reg S | | |
| 1.00%, due 10/1/50 | 26,743,148 | 4,100,225 |
| Series Reg S | | |
| 1.50%, due 10/1/53 | 6,500,000 | 1,016,472 |
| Series 01E | | |
| 2.50%, due 10/1/47 | 2,291 | 389 |
| UniCredit SpA | | |
| 7.83%, due 12/4/23 (b) | $ 1,800,000 | 2,075,868 |
| | | 12,831,829 |
| Beverages 0.0% ‡ |
| Keurig Dr Pepper, Inc. | | |
| 4.057%, due 5/25/23 | 52,000 | 55,433 |
| Biotechnology 0.1% |
| Amgen, Inc. | | |
| 3.625%, due 5/15/22 | 400,000 | 407,234 |
| Commercial Services 0.1% |
| ERAC USA Finance LLC | | |
| 4.50%, due 8/16/21 (b) | 400,000 | 402,051 |
| RELX Capital, Inc. | | |
| 3.50%, due 3/16/23 | 100,000 | 104,853 |
| | | 506,904 |
| Distribution & Wholesale 0.0% ‡ |
| Toyota Tsusho Corp. | | |
| 3.625%, due 9/13/23 | 200,000 | 212,785 |
| Diversified Financial Services 2.0% |
| Ally Financial, Inc. | | |
| 4.125%, due 2/13/22 | 200,000 | 204,558 |
| Avolon Holdings Funding Ltd. | | |
| 5.50%, due 1/15/23 (b) | 58,000 | 61,602 |
| BOC Aviation Ltd. | | |
| 2.375%, due 9/15/21 (b) | 200,000 | 200,292 |
The notes to the financial statements are an integral part of, and should be read in conjunction with, the financial statements.
13
Portfolio of Investments June 30, 2021† (Unaudited) (continued)
| | Principal
Amount | Value |
| Corporate Bonds (continued) |
| Diversified Financial Services (continued) |
| Jyske Realkredit A/S | | |
| Series CCE | | |
| 0.50%, due 10/1/43 | DKK 2,582,502 | $ 390,901 |
| Series Reg S | | |
| 1.00%, due 10/1/50 | 16,634,791 | 2,550,425 |
| Series CCE | | |
| 1.00%, due 10/1/53 | 6,685,856 | 1,000,546 |
| Series 111E | | |
| 2.50%, due 10/1/47 | 6,125 | 1,040 |
| Mitsubishi HC Capital, Inc. | | |
| 2.652%, due 9/19/22 (b) | $ 200,000 | 204,530 |
| Nordea Kredit Realkreditaktieselskab | | |
| 0.50%, due 10/1/43 | DKK 991,660 | 150,301 |
| Series Reg S | | |
| 1.00%, due 10/1/50 | 10,775,949 | 1,653,873 |
| 1.50%, due 10/1/53 | 9,500,000 | 1,486,446 |
| 2.50%, due 10/1/47 | 2,592 | 440 |
| Park Aerospace Holdings Ltd. | | |
| 5.25%, due 8/15/22 (b) | $ 14,000 | 14,650 |
| Realkredit Danmark A/S | | |
| Series Reg S | | |
| 1.00%, due 10/1/53 | DKK 18,251,673 | 2,729,929 |
| Series 23S | | |
| 2.50%, due 4/1/47 | 11,669 | 1,981 |
| | | 10,651,514 |
| Electric 0.0% ‡ |
| American Electric Power Co., Inc. | | |
| Series I | | |
| 3.65%, due 12/1/21 | $ 100,000 | 101,432 |
| LG&E and KU Energy LLC | | |
| 4.375%, due 10/1/21 | 100,000 | 100,000 |
| | | 201,432 |
| Food 0.1% |
| Conagra Brands, Inc. | | |
| 3.25%, due 9/15/22 | 200,000 | 206,568 |
| Danone SA (b) | | |
| 2.077%, due 11/2/21 | 200,000 | 200,921 |
| 3.00%, due 6/15/22 | 200,000 | 205,065 |
| | | 612,554 |
| Home Builders 0.0% ‡ |
| DR Horton, Inc. | | |
| 5.75%, due 8/15/23 | 100,000 | 109,665 |
| | Principal
Amount | Value |
| |
| Home Furnishings 0.2% |
| Panasonic Corp. | | |
| 2.536%, due 7/19/22 (b) | $ 800,000 | $ 815,818 |
| Media 0.1% |
| Charter Communications Operating LLC | | |
| 4.464%, due 7/23/22 | 600,000 | 621,173 |
| Oil & Gas 0.1% |
| Petrobras Global Finance BV | | |
| 5.093%, due 1/15/30 | 543,000 | 592,690 |
| Pharmaceuticals 0.0% ‡ |
| Cigna Corp. | | |
| 3.75%, due 7/15/23 | 73,000 | 77,739 |
| CVS Health Corp. | | |
| 3.70%, due 3/9/23 | 28,000 | 29,488 |
| | | 107,227 |
| Semiconductors 0.1% |
| NXP BV | | |
| 3.875%, due 9/1/22 (b) | 400,000 | 414,754 |
| Telecommunications 0.1% |
| Sprint Corp. | | |
| 7.25%, due 9/15/21 | 300,000 | 304,434 |
| Telstra Corp. Ltd. | | |
| 4.80%, due 10/12/21 (b) | 300,000 | 303,750 |
| | | 608,184 |
Total Corporate Bonds
(Cost $31,021,715) | | 31,164,925 |
| Foreign Government Bonds 8.5% |
| Argentina 0.0% ‡ |
| Argentine Republic Government Bond (h) | | |
| 34.087%, due 10/4/22 (g) | ARS 14,039 | 118 |
| 36.104% (BADLARPP + 2.00%), due 4/3/22 (a) | 2,854,000 | 28,932 |
| | | 29,050 |
| Australia 0.5% |
| Australia Government Bond (i) | | |
| Series Reg S | | |
| 1.25%, due 2/21/22 | AUD 1,157,772 | 887,882 |
The notes to the financial statements are an integral part of, and should be read in conjunction with, the financial statements.
| 14 | MainStay VP PIMCO Real Return Portfolio |
| | Principal
Amount | Value |
| Foreign Government Bonds (continued) |
| Australia (continued) |
Australia Government Bond (i)
(continued) | | |
| Series Reg S | | |
| 3.00%, due 9/20/25 | AUD 1,844,835 | $ 1,642,951 |
| | | 2,530,833 |
| Canada 0.2% |
| Canadian Government Real Return Bond | | |
| 4.25%, due 12/1/26 (i) | CAD 958,488 | 997,536 |
| France 1.1% |
| France Government Bond (i) | | |
| Series Reg S | | |
| 0.10%, due 3/1/26 (b) | EUR 3,146,004 | 4,057,230 |
| Series Reg S | | |
| 0.25%, due 7/25/24 | 1,406,223 | 1,781,314 |
| | | 5,838,544 |
| Italy 4.1% |
| Italy Buoni Poliennali Del Tesoro (b)(i) | | |
| Series Reg S | | |
| 0.40%, due 5/15/30 | 5,977,306 | 7,656,015 |
| Series Reg S | | |
| 1.40%, due 5/26/25 | 11,512,171 | 14,747,243 |
| | | 22,403,258 |
| Japan 1.8% |
| Japan Government CPI Linked Bond (i) | | |
| 0.005%, due 3/10/31 | JPY 230,710,700 | 2,122,385 |
| 0.10%, due 3/10/28 | 370,236,940 | 3,415,931 |
| 0.10%, due 3/10/29 | 493,769,080 | 4,566,792 |
| | | 10,105,108 |
| New Zealand 0.5% |
| New Zealand Government Inflation Linked Bond (i) | | |
| Series Reg S | | |
| 2.00%, due 9/20/25 | NZD 2,020,500 | 1,574,758 |
| Series Reg S | | |
| 2.50%, due 9/20/35 | 876,560 | 766,833 |
| Series Reg S | | |
| 3.00%, due 9/20/30 | 556,400 | 491,521 |
| | | 2,833,112 |
| | Principal
Amount | Value |
| |
| Peru 0.2% |
| Peru Government Bond | | |
| 5.94%, due 2/12/29 | PEN 1,300,000 | $ 369,132 |
| 6.15%, due 8/12/32 | 2,600,000 | 707,956 |
| | | 1,077,088 |
| Qatar 0.1% |
| Qatar Government Bond | | |
| Series Reg S | | |
| 3.875%, due 4/23/23 | $ 300,000 | 318,451 |
Total Foreign Government Bonds
(Cost $44,252,570) | | 46,132,980 |
| Mortgage-Backed Securities 5.1% |
| Agency (Collateralized Mortgage Obligations) 3.6% |
| FHLMC | |
| REMIC, Series 4779, Class WF | | |
| 0.46% (1 Month LIBOR + 0.35%), due 7/15/44 (a) | 250,876 | 252,755 |
| FHLMC, STRIPS | |
| Series 278, Class F1 | | |
| 0.523% (1 Month LIBOR + 0.45%), due 9/15/42 (a) | 273,146 | 276,511 |
| GNMA (a) | |
| REMIC, Series 2018-H15, Class FG | | |
| 0.599% (12 Month LIBOR + 0.15%), due 8/20/68 | 476,710 | 472,449 |
| REMIC, Series 2017-H10, Class FB | | |
| 1.029% (12 Month LIBOR + 0.75%), due 4/20/67 | 288,259 | 292,513 |
| UMBS, Single Family, 30 Year (j) | |
| 3.50%, due 8/25/51 TBA | 11,800,000 | 12,428,027 |
| 4.00%, due 8/25/51 TBA | 5,480,000 | 5,840,053 |
| | | 19,562,308 |
| Commercial Mortgage Loans (Collateralized Mortgage Obligation) 0.1% |
| AREIT Trust | |
| Series 2020-CRE4, Class A | | |
| 2.702% (1 Month LIBOR + 2.62%), due 4/15/37 (a)(b) | 269,419 | 270,872 |
| Whole Loan (Collateralized Mortgage Obligations) 1.4% |
| Alternative Loan Trust | |
| Series 2005-29CB, Class A4 | | |
| 5.00%, due 7/25/35 | 34,012 | 26,473 |
| Series 2007-1T1, Class 1A1 | | |
| 6.00%, due 3/25/37 | 610,324 | 364,592 |
The notes to the financial statements are an integral part of, and should be read in conjunction with, the financial statements.
15
Portfolio of Investments June 30, 2021† (Unaudited) (continued)
| | Principal
Amount | Value |
| Mortgage-Backed Securities (continued) |
| Whole Loan (Collateralized Mortgage Obligations) (continued) |
| CHL Mortgage Pass-Through Trust | |
| Series 2007-1, Class A1 | | |
| 6.00%, due 3/25/37 | $ 32,951 | $ 25,186 |
| Citigroup Mortgage Loan Trust | |
| Series 2007-AR4, Class 1A1A | | |
| 3.192%, due 3/25/37 (k) | 272,732 | 272,432 |
| Series 2019-B, Class A1 | | |
| 3.258%, due 4/25/66 (b)(g) | 240,819 | 242,851 |
| Citigroup Mortgage Loan Trust, Inc. | |
| Series 2004-NCM2, Class 1CB1 | | |
| 5.50%, due 8/25/34 | 194,375 | 198,721 |
| CSMC Trust | |
| Series 2019-RPL9, Class A1 | | |
| 2.98%, due 10/27/59 (b)(g) | 907,396 | 914,590 |
| Eurosail-UK plc (a) | |
| Series 2007-3X, Class A3A | | |
| 1.034% (3 Month Sterling LIBOR + 0.95%), due 6/13/45 | GBP 140,255 | 194,353 |
| Series 2007-3X, Class A3C | | |
| 1.034% (3 Month Sterling LIBOR + 0.95%), due 6/13/45 | 37,396 | 51,784 |
| Series 2007-3A, Class A3C | | |
| 1.034% (3 Month Sterling LIBOR + 0.95%), due 6/13/45 (b) | 37,397 | 51,784 |
| GreenPoint Mortgage Funding Trust | |
| Series 2006-AR4, Class A6A | | |
| 0.272% (1 Month LIBOR + 0.18%), due 9/25/46 (a) | $ 81,320 | 79,275 |
| IndyMac INDX Mortgage Loan Trust (a) | |
| Series 2005-AR12, Class 2A1A | | |
| 0.572% (1 Month LIBOR + 0.48%), due 7/25/35 | 127,958 | 124,024 |
| Series 2005-AR14, Class 1A1A | | |
| 0.651% (1 Month LIBOR + 0.56%), due 7/25/35 | 864,318 | 710,789 |
| Lehman XS Trust | |
| Series 2007-20N, Class A1 | | |
| 1.241% (1 Month LIBOR + 1.15%), due 12/25/37 (a) | 40,594 | 41,993 |
| Merrill Lynch Mortgage Investors Trust | |
| Series 2005-A4, Class 1A | | |
| 2.539%, due 7/25/35 (k) | 165,786 | 109,973 |
| New Residential Mortgage Loan Trust (b)(g) | |
| Series 2019-RPL3, Class A1 | | |
| 2.75%, due 7/25/59 | 305,780 | 318,603 |
| Series 2018-3A, Class A1 | | |
| 4.50%, due 5/25/58 | 170,315 | 184,722 |
| | Principal
Amount | Value |
| |
| Whole Loan (Collateralized Mortgage Obligations) (continued) |
| OBX Trust | |
| Series 2018-1, Class A2 | | |
| 0.741% (1 Month LIBOR + 0.65%), due 6/25/57 (a)(b) | $ 43,408 | $ 43,441 |
| Opteum Mortgage Acceptance Corp. Asset-Backed Pass-Through Certificates | |
| Series 2005-2, Class M7 | | |
| 1.892% (1 Month LIBOR + 1.80%), due 4/25/35 (a) | 100,000 | 100,656 |
| RALI Trust | |
| Series 2006-QH1, Class A1 | | |
| 0.471% (1 Month LIBOR + 0.38%), due 12/25/36 (a) | 975,283 | 934,615 |
| Residential Asset Securitization Trust | |
| Series 2006-A10, Class A5 | | |
| 6.50%, due 9/25/36 | 227,507 | 125,236 |
| Residential Mortgage Securities 32 plc | |
| Series 32A, Class A | | |
| 1.299% (SONIA3M + 1.25%), due 6/20/70 (a)(b) | GBP 176,290 | 246,538 |
| Structured Asset Securities Corp. Mortgage Loan Trust | |
| Series 2005-OPT1, Class A2 | | |
| 0.511% (1 Month LIBOR + 0.42%), due 11/25/35 (a) | $ 29,326 | 29,318 |
| Thornburg Mortgage Securities Trust | |
| Series 2004-2, Class A1 | | |
| 0.712% (1 Month LIBOR + 0.62%), due 6/25/44 (a) | 719,444 | 718,416 |
| Towd Point Mortgage Funding Granite4 plc | |
| Series 2019-GR4A, Class A1 | | |
| 1.109% (3 Month Sterling LIBOR + 1.025%), due 10/20/51 (a)(b) | GBP 904,778 | 1,258,628 |
| Washington Mutual Mortgage Pass-Through Certificates WMALT | |
| Series 2007-HY1, Class A2A | | |
| 0.251% (1 Month LIBOR + 0.16%), due 2/25/37 (a) | $ 525,609 | 471,815 |
| Series 2006-5, Class 2CB1 | | |
| 6.00%, due 7/25/36 | 39,773 | 34,595 |
| | | 7,875,403 |
Total Mortgage-Backed Securities
(Cost $27,777,513) | | 27,708,583 |
The notes to the financial statements are an integral part of, and should be read in conjunction with, the financial statements.
| 16 | MainStay VP PIMCO Real Return Portfolio |
| | Principal
Amount | Value |
| U.S. Government & Federal Agencies 101.2% |
| Federal National Mortgage Association (Mortgage Pass-Through Securities) 0.1% |
| FNMA (a) | | |
| 1.318% (12 Month Monthly Treasury Average Index + 1.20%), due 6/1/43 | $ 195,841 | $ 200,902 |
| 2.561% (1 Year Treasury Constant Maturity Rate + 2.36%), due 11/1/34 | 211,732 | 225,367 |
| 4.038% (11th District Cost of Funds Index + 1.926%), due 12/1/36 | 136,550 | 145,599 |
| | | 571,868 |
| United States Treasury Bond 0.3% |
| U.S. Treasury Bonds | | |
| 1.625%, due 11/15/50 | 2,080,000 | 1,868,100 |
| United States Treasury Inflation - Indexed Notes 100.7% |
| U.S. Treasury Inflation Linked Bonds (i) | | |
| 0.125%, due 2/15/51 | 1,497,580 | 1,643,868 |
| 0.25%, due 2/15/50 | 2,679,949 | 3,031,239 |
| 0.625%, due 2/15/43 | 2,067,559 | 2,468,310 |
| 0.75%, due 2/15/42 | 6,181,128 | 7,525,201 |
| 0.75%, due 2/15/45 | 6,509,619 | 8,024,123 |
| 0.875%, due 2/15/47 | 12,659,505 | 16,278,014 |
| 1.00%, due 2/15/46 | 7,427,391 | 9,701,933 |
| 1.00%, due 2/15/48 | 2,716,064 | 3,620,357 |
| 1.00%, due 2/15/49 | 3,236,874 | 4,355,660 |
| 1.375%, due 2/15/44 | 17,061,856 | 23,532,253 |
| 1.75%, due 1/15/28 | 14,817,578 | 17,906,502 |
| 2.00%, due 1/15/26 | 6,240,475 | 7,341,578 |
| 2.125%, due 2/15/40 | 4,275,038 | 6,370,140 |
| 2.125%, due 2/15/41 | 5,890,040 | 8,872,180 |
| 2.375%, due 1/15/25 | 12,878,348 | 14,964,540 |
| 2.375%, due 1/15/27 | 26,485 | 32,440 |
| 2.50%, due 1/15/29 | 6,505,336 | 8,378,669 |
| 3.375%, due 4/15/32 | 491,981 | 725,487 |
| U.S. Treasury Inflation Linked Notes (i) | | |
| 0.125%, due 1/15/22 | 4,519,055 | 4,620,734 |
| 0.125%, due 4/15/22 (d) | 37,059,777 | 38,014,259 |
| 0.125%, due 7/15/22 | 4,438,450 | 4,599,778 |
| 0.125%, due 1/15/23 | 13,574,729 | 14,182,675 |
| 0.125%, due 10/15/24 | 10,616,976 | 11,441,312 |
| 0.125%, due 4/15/25 | 8,064,342 | 8,703,504 |
| 0.125%, due 10/15/25 | 823,384 | 895,977 |
| 0.125%, due 4/15/26 | 7,484,652 | 8,141,508 |
| 0.125%, due 7/15/26 | 9,592,487 | 10,502,399 |
| | Principal
Amount | | Value |
| |
| United States Treasury Inflation - Indexed Notes (continued) |
U.S. Treasury Inflation Linked Notes (i)
(continued) | | | |
| 0.125%, due 1/15/30 | $ 10,151,347 | | $ 23,424,435 |
| 0.125%, due 7/15/30 | 7,811,925 | | 17,487,015 |
| 0.125%, due 1/15/31 | 29,176,027 | | 32,105,407 |
| 0.25%, due 1/15/25 | 11,951,500 | | 12,934,698 |
| 0.25%, due 7/15/29 | 21,235,367 | | 23,622,687 |
| 0.375%, due 7/15/23 | 6,577,699 | | 6,997,156 |
| 0.375%, due 1/15/27 | 15,455,449 | | 17,105,439 |
| 0.375%, due 7/15/27 | 18,144,387 | | 20,233,826 |
| 0.50%, due 4/15/24 (d) | 27,022,107 | | 29,125,469 |
| 0.50%, due 1/15/28 | 17,768,616 | | 19,919,590 |
| 0.625%, due 4/15/23 | 22,943,274 | | 24,269,234 |
| 0.625%, due 1/15/24 (l) | 22,348,093 | | 24,067,848 |
| 0.625%, due 1/15/26 | 9,699,343 | | 10,770,565 |
| 0.75%, due 7/15/28 | 10,197,386 | | 19,542,567 |
| 0.875%, due 1/15/29 | 4,177,639 | | 19,933,782 |
| | | | 547,414,358 |
| United States Treasury Note 0.1% |
| U.S. Treasury Notes | | | |
| 1.75%, due 12/31/24 | 330,000 | | 343,406 |
Total U.S. Government & Federal Agencies
(Cost $511,736,837) | | | 550,197,732 |
Total Long-Term Bonds
(Cost $658,644,327) | | | 699,223,665 |
| |
| | Shares | | |
| Short-Term Investment 0.6% |
| Affiliated Investment Company 0.6% |
| MainStay U.S. Government Liquidity Fund, 0.01% (m) | 3,369,769 | | 3,369,769 |
Total Short-Term Investment
(Cost $3,369,769) | | | 3,369,769 |
Total Investments Excluding Purchased Options
(Cost $662,014,096) | 129.2% | | 702,593,434 |
Total Purchased Options
(Cost $183,861) | 0.1% | | 224,462 |
Total Investments
(Cost $662,197,957) | 129.3% | | 702,817,896 |
| Other Assets, Less Liabilities | (29.3) | | (159,063,550) |
| Net Assets | 100.0% | | $ 543,754,346 |
The notes to the financial statements are an integral part of, and should be read in conjunction with, the financial statements.
17
Portfolio of Investments June 30, 2021† (Unaudited) (continued)
| † | Percentages indicated are based on Portfolio net assets. |
| ‡ | Less than one-tenth of a percent. |
| (a) | Floating rate—Rate shown was the rate in effect as of June 30, 2021. |
| (b) | May be sold to institutional investors only under Rule 144A or securities offered pursuant to Section 4(a)(2) of the Securities Act of 1933, as amended. |
| (c) | Step coupon—Rate shown was the rate in effect as of June 30, 2021. |
| (d) | Delayed delivery security. |
| (e) | Security is perpetual and, thus, does not have a predetermined maturity date. The date shown, if applicable, reflects the next call date. |
| (f) | Fixed to floating rate—Rate shown was the rate in effect as of June 30, 2021. |
| (g) | Coupon rate may change based on changes of the underlying collateral or prepayments of principal. Rate shown was the rate in effect as of June 30, 2021. |
| (h) | Illiquid security—As of June 30, 2021, the total market value deemed illiquid under procedures approved by the Board of Trustees was $29,050, which represented less than one-tenth of a percent of the Portfolio’s net assets. |
| (i) | Treasury Inflation Protected Security—Pays a fixed rate of interest on a principal amount that is continuously adjusted for inflation based on the Consumer Price Index-Urban Consumers. |
| (j) | TBA—Security purchased on a forward commitment basis with an approximate principal amount and maturity date. The actual principal amount and maturity date will be determined upon settlement. As of June 30, 2021, the total net market value was $18,268,080, which represented 3.4% of the Portfolio’s net assets. All or a portion of this security is a part of a mortgage dollar roll agreement. |
| (k) | Collateral strip rate—A bond whose interest was based on the weighted net interest rate of the collateral. The coupon rate adjusts periodically based on a predetermined schedule. Rate shown was the rate in effect as of June 30, 2021. |
| (l) | Security, or a portion thereof, was maintained in a segregated account at the Portfolio’s custodian as collateral for swap contracts. |
| (m) | Current yield as of June 30, 2021. |
The notes to the financial statements are an integral part of, and should be read in conjunction with, the financial statements.
| 18 | MainStay VP PIMCO Real Return Portfolio |
Foreign Currency Forward Contracts
As of June 30, 2021, the Portfolio held the following foreign currency forward contracts1:
| Currency Purchased | Currency Sold | Counterparty | Settlement
Date | Unrealized
Appreciation
(Depreciation) |
| DKK | 2,435,000 | USD | 387,125 | JPMorgan Chase Bank N.A. | 7/1/21 | $ 1,155 |
| USD | 1,451,060 | AUD | 1,876,000 | JPMorgan Chase Bank N.A. | 7/2/21 | 44,154 |
| USD | 1,030,850 | DKK | 6,325,000 | Bank of America N.A. | 7/1/21 | 22,279 |
| USD | 1,482,765 | DKK | 9,255,000 | JPMorgan Chase Bank N.A. | 7/1/21 | 6,982 |
| USD | 11,618,298 | DKK | 72,254,951 | JPMorgan Chase Bank N.A. | 10/1/21 | 75,632 |
| USD | 5,715,820 | DKK | 35,528,909 | Morgan Stanley & Co. International | 10/1/21 | 40,108 |
| USD | 1,658,649 | EUR | 1,394,000 | Bank of America N.A. | 7/2/21 | 5,713 |
| USD | 38,186,984 | EUR | 32,105,000 | JPMorgan Chase Bank N.A. | 8/3/21 | 92,539 |
| USD | 39,045,483 | EUR | 32,076,000 | Morgan Stanley & Co. International | 7/2/21 | 1,011,366 |
| USD | 2,261,287 | GBP | 1,594,000 | Bank of America N.A. | 7/2/21 | 56,307 |
| USD | 98,978 | GBP | 70,000 | Bank of America N.A. | 7/2/21 | 2,147 |
| USD | 85,190 | GBP | 61,000 | JPMorgan Chase Bank N.A. | 7/2/21 | 809 |
| USD | 113,123 | GBP | 81,000 | Morgan Stanley & Co. International | 7/2/21 | 1,076 |
| USD | 2,085,193 | JPY | 228,600,000 | Bank of America N.A. | 7/2/21 | 27,494 |
| USD | 10,339,662 | JPY | 1,142,123,631 | JPMorgan Chase Bank N.A. | 8/3/21 | 56,266 |
| USD | 2,857,400 | JPY | 311,052,380 | Morgan Stanley & Co. International | 7/2/21 | 57,523 |
| USD | 5,486,028 | JPY | 602,471,251 | Morgan Stanley & Co. International | 7/2/21 | 63,001 |
| USD | 3,038,046 | NZD | 4,186,000 | Bank of America N.A. | 7/2/21 | 112,032 |
| USD | 221,158 | PEN | 848,251 | JPMorgan Chase Bank N.A.* | 7/13/21 | 657 |
| USD | 880,015 | PEN | 3,380,136 | JPMorgan Chase Bank N.A.* | 7/13/21 | 1,358 |
| Total Unrealized Appreciation | 1,678,598 |
| CNY | 7,553,000 | USD | 1,174,738 | Bank of America N.A. | 9/15/21 | (12,101) |
| DKK | 35,528,909 | USD | 5,705,915 | Morgan Stanley & Co. International | 7/1/21 | (40,552) |
| EUR | 1,011,000 | USD | 1,207,033 | Morgan Stanley & Co. International | 7/2/21 | (8,239) |
| EUR | 354,000 | USD | 422,678 | Morgan Stanley & Co. International | 7/2/21 | (2,922) |
| GBP | 449,000 | USD | 622,419 | Morgan Stanley & Co. International | 7/2/21 | (1,317) |
| IDR | 17,663,047,000 | USD | 1,225,494 | Bank of America N.A. | 9/15/21 | (14,940) |
| NOK | 10,050,000 | USD | 1,194,514 | Morgan Stanley & Co. International | 8/17/21 | (27,014) |
| SEK | 9,845,000 | USD | 1,177,877 | Morgan Stanley & Co. International | 8/17/21 | (27,007) |
| USD | 5,721,854 | DKK | 35,956,200 | Bank of America N.A. | 7/1/21 | (11,644) |
| USD | 9,352,088 | DKK | 58,961,470 | JPMorgan Chase Bank N.A. | 7/1/21 | (49,781) |
| Total Unrealized Depreciation | (195,517) |
| Net Unrealized Appreciation | $ 1,483,081 |
| * | Non-deliverable forward. |
| 1. | Foreign Currency Forward Contracts are subject to limitations such that they cannot be “sold or repurchased,” although the Portfolio would be able to exit the transaction through other means, such as through the execution of an offsetting transaction. |
Futures Contracts
As of June 30, 2021, the Portfolio held the following futures contracts1:
| Type | Number of
Contracts | Expiration
Date | Value at
Trade Date | Current
Notional
Amount | Unrealized
Appreciation
(Depreciation)2 |
| Long Contracts | | | | | |
| Euro-Bobl | 78 | September 2021 | $ 12,405,616 | $ 12,407,332 | $ 1,716 |
| Euro-Bund | 79 | September 2021 | 16,050,919 | 16,169,112 | 118,193 |
| U.S. Treasury 5 Year Notes | 839 | September 2021 | 103,809,124 | 103,557,508 | (251,616) |
| Total Long Contracts | | | | | (131,707) |
| Short Contracts | | | | | |
| Australia 3 Year Bonds | (13) | September 2021 | (1,138,486) | (1,135,672) | 2,814 |
| Australia 10 Year Bonds | (7) | September 2021 | (738,008) | (741,193) | (3,185) |
The notes to the financial statements are an integral part of, and should be read in conjunction with, the financial statements.
19
Portfolio of Investments June 30, 2021† (Unaudited) (continued)
| Type | Number of
Contracts | Expiration
Date | Value at
Trade Date | Current
Notional
Amount | Unrealized
Appreciation
(Depreciation)2 |
| Euro-BTP | (8) | September 2021 | $ (1,072,189) | $ (1,073,436) | $ (1,247) |
| Euro-BTP | (40) | September 2021 | (7,129,654) | (7,181,376) | (51,722) |
| Euro-Buxl | (67) | September 2021 | (15,933,982) | (16,146,452) | (212,470) |
| Euro-Schatz | (698) | September 2021 | (92,811,661) | (92,813,063) | (1,402) |
| Japan 10 Year Bonds | (8) | September 2021 | (10,908,224) | (10,923,264) | (15,040) |
| U.S. Treasury 2 Year Notes | (116) | September 2021 | (25,597,790) | (25,557,156) | 40,634 |
| U.S. Treasury 10 Year Notes | (200) | September 2021 | (26,375,644) | (26,500,000) | (124,356) |
| U.S. Treasury 10 Year Ultra Bonds | (22) | September 2021 | (3,230,230) | (3,238,469) | (8,239) |
| U.S. Treasury Long Bonds | (91) | September 2021 | (14,166,011) | (14,628,250) | (462,239) |
| U.S. Treasury Ultra Bonds | (63) | September 2021 | (11,559,704) | (12,139,312) | (579,608) |
| Total Short Contracts | | | | | (1,416,060) |
| Net Unrealized Depreciation | | | | | $ (1,547,767) |
| 1. | As of June 30, 2021, cash in the amount of $1,379,000 was on deposit with a broker or futures commission merchant for futures transactions. |
| 2. | Represents the difference between the value of the contracts at the time they were opened and the value as of June 30, 2021. |
Purchased Options on Futures Contracts
| Description | Counterparty | Strike
Price | Expiration
Date | Number of
Contracts | Notional
Amount | Premiums Paid
(Received) | | Market
Value |
| Put-Federal National Mortgage Association | JPMorgan Chase Bank N.A. | $ 99.66 | 7/7/21 | 200,000 | $ 200,000 | $ 1,125 | | $ 27 |
| Put-Federal National Mortgage Association | JPMorgan Chase Bank N.A. | 100.47 | 8/5/21 | 200,000 | 200,000 | 1,875 | | 800 |
| Put-Federal National Mortgage Association | JPMorgan Chase Bank N.A. | 100.16 | 8/5/21 | 200,000 | 200,000 | 1,875 | | 631 |
| Put-Federal National Mortgage Association | JPMorgan Chase Bank N.A. | 103.24 | 8/5/21 | 300,000 | 300,000 | 1,711 | | 1,114 |
| | | | | | | $ 6,586 | | $2,572 |
| Description | Counterparty | Strike
Price | Expiration
Date | Number of
Contracts | Notional
Amount | Premiums Paid
(Received) | | Market
Value |
| Call-Euro-Schatz | Morgan Stanley & Co., LLC | $ 113.30 | 8/27/21 | 300 | EUR 30,000,000 | $ 2,086 | | $ 1,779 |
Purchased Swaptions
| Description | Counterparty | Strike
Price | Expiration
Date | Number of
Contracts | Notional
Amount | Premiums Paid
(Received) | | Market
Value |
| Put-5-Year Interest Rate Swap | Morgan Stanley & Co., LLC | $ 0.70 | 8/24/21 | 20,300,000 | $ 20,300,000 | $ 73,080 | | $ 9,853 |
| Description | Counterparty | Strike
Price | Expiration
Date | Number of
Contracts | Notional
Amount | Premiums Paid
(Received) | | Market
Value |
| Call-30-Year Interest Rate Swap | Morgan Stanley Capital Services LLC | $ 0.19 | 11/2/22 | 1,400,000 | EUR 1,400,000 | $ 102,109 | | $ 210,258 |
Written Inflation-Capped Options
| Description | Counterparty | Initial
Index | Floating Rate | Expiration
Date | Number of
Contracts | Notional
Amount | Premiums Paid
(Received) | | Market
Value |
| Call-Cap-OTC USA Non-Revised Consumer Price Index- Urban (CPI-U), American Style -Call | JPMorgan Chase Bank N.A. | $ 238.643 | Maximum of [0, Final Index/Initial Index - (1 + 4.00%10)] | 5/16/24 | (300,000) | $ (300,000) | $ (599) | | $ (4,478) |
The notes to the financial statements are an integral part of, and should be read in conjunction with, the financial statements.
| 20 | MainStay VP PIMCO Real Return Portfolio |
Written Options on Futures Contracts
| Description | Counterparty | Strike
Price | Expiration
Date | Number of
Contracts | Notional
Amount | Premiums Paid
(Received) | | Market
Value |
| Put-Federal National Mortgage Association | JPMorgan Chase Bank N.A. | $ 102.05 | 7/7/21 | (100,000) | $ (100,000) | $ (344) | | $ (3) |
| Put-Federal National Mortgage Association | JPMorgan Chase Bank N.A. | 99.47 | 8/5/21 | (400,000) | (400,000) | (2,484) | | (776) |
| Put-Federal National Mortgage Association | JPMorgan Chase Bank N.A. | 99.16 | 8/5/21 | (400,000) | (400,000) | (2,500) | | (628) |
| Put-Federal National Mortgage Association | JPMorgan Chase Bank N.A. | 101.98 | 8/5/21 | (200,000) | (200,000) | (688) | | (223) |
| Put-Federal National Mortgage Association | JPMorgan Chase Bank N.A. | 102.23 | 8/5/21 | (600,000) | (600,000) | (1,875) | | (830) |
| Put-Federal National Mortgage Association | JPMorgan Chase Bank N.A. | 102.30 | 8/12/21 | (500,000) | (500,000) | (1,680) | | (857) |
| Put-Federal National Mortgage Association | JPMorgan Chase Bank N.A. | 102.23 | 8/12/21 | (500,000) | (500,000) | (1,602) | | (816) |
| Put-Federal National Mortgage Association | JPMorgan Chase Bank N.A. | 104.14 | 8/5/21 | (200,000) | (200,000) | (344) | | (325) |
| Put-Federal National Mortgage Association | JPMorgan Chase Bank N.A. | 103.98 | 9/7/21 | (200,000) | (200,000) | (609) | | (471) |
| Put-Federal National Mortgage Association | JPMorgan Chase Bank N.A. | 103.70 | 9/7/21 | (200,000) | (200,000) | (609) | | (317) |
| | | | | | | $(12,735) | | $(5,246) |
| Description | Counterparty | Strike
Price | Expiration
Date | Number of
Contracts | Notional
Amount | Premiums Paid
(Received) | | Market
Value |
| Call-Federal National Mortgage Association | JPMorgan Chase Bank N.A. | $ 104.05 | 7/7/21 | (100,000) | $ (100,000) | $ (172) | | $ (7) |
| Call-Federal National Mortgage Association | JPMorgan Chase Bank N.A. | 103.99 | 8/5/21 | (200,000) | (200,000) | (406) | | (152) |
| Call-Federal National Mortgage Association | JPMorgan Chase Bank N.A. | 101.31 | 9/7/21 | (100,000) | (100,000) | (313) | | (405) |
| | | | | | | $ (891) | | $(564) |
Written Swaptions
| Description | Counterparty | Strike
Price | Expiration
Date | Number of
Contracts | Notional
Amount | Premiums Paid
(Received) | | Market
Value |
| Put-10-Year Interest Rate Swap | Morgan Stanley Capital Services LLC | $ 0.10 | 11/2/22 | (4,200,000) | EUR (4,200,000) | $ (101,882) | | $ (191,314) |
| Put-10-Year Interest Rate Swap | Morgan Stanley & Co., LLC | 2.30 | 9/29/21 | (10,100,000) | $ (10,100,000) | (71,565) | | (5,684) |
| Put-Sold Protection on 5-Year Credit Default Swap | Morgan Stanley & Co., LLC | 0.98 | 7/21/21 | (200,000) | (200,000) | (480) | | (4) |
| Put-Sold Protection on 5-Year Credit Default Swap | Bank of America N.A. | 0.75 | 7/21/21 | (700,000) | EUR (700,000) | (724) | | (29) |
| Put-10-Year Interest Rate Swap | Morgan Stanley & Co., LLC | 1.76 | 7/7/21 | (100,000) | $ (100,000) | (765) | | (1) |
| Put-Sold Protection on 5-Year Credit Default Swap | Bank of America N.A. | 0.75 | 8/18/21 | (800,000) | (800,000) | (780) | | (135) |
| | | | | | | $ (176,196) | | $ (197,167) |
| Description | Counterparty | Strike
Price | Expiration
Date | Number of
Contracts | Notional
Amount | Premiums Paid
(Received) | | Market
Value |
| Call-5-Year Interest Rate Swap | Morgan Stanley & Co., LLC | $ 0.55 | 8/24/21 | (40,600,000) | $ (40,600,000) | $ (63,945) | | $ (3,942) |
The notes to the financial statements are an integral part of, and should be read in conjunction with, the financial statements.
21
Portfolio of Investments June 30, 2021† (Unaudited) (continued)
Swap Contracts
As of June 30, 2021, the Portfolio held the following centrally cleared interest rate swap agreements1:
Notional
Amount | Currency | Expiration
Date | Payments
made by Portfolio | Payments
Received by Portfolio | Payment
Frequency
Paid/
Received | Upfront
Premiums
Paid/
(Received) | | Value | | Unrealized
Appreciation/
(Depreciation) |
| $ 14,000,000 | JPY | 9/21/27 | Fixed 0.30% | 6 month USD LIBOR | Semi-Annually/Semi-Annually | $ (150) | | $ (2,316) | | $ (2,166) |
| 1,600,000 | NZD | 3/21/28 | Fixed 3.25% | 3 month NZD BBR | Semi-Annually/Quarterly | 3,249 | | (121,269) | | (124,518) |
| 50,000,000 | JPY | 3/21/28 | Fixed 0.30% | 6 month USD LIBOR | Semi-Annually/Semi-Annually | (593) | | (8,693) | | (8,100) |
| 106,980,000 | JPY | 3/21/29 | Fixed 0.45% | 6 month USD LIBOR | Semi-Annually/Semi-Annually | (3,573) | | (31,115) | | (27,542) |
| | | | | | | $ (1,067) | | $ (163,393) | | $ (162,326) |
As of June 30, 2021, the Portfolio held the following centrally cleared inflation swap agreements1:
Notional
Amount | Currency | Expiration
Date | Payments
Made by Portfolio | Payments
Received by Portfolio | Payment
Frequency
Paid/
Received | Upfront
Premiums
Paid/
(Received) | | Value | | Unrealized
Appreciation/
(Depreciation) |
| $ 800,000 | EUR | 6/15/27 | 1-Month EUR-CPI | Fixed 1.36% | At Maturity | $ (7,189) | | $ 2,371 | | $ 9,560 |
| 1,000,000 | EUR | 3/15/28 | 1-Month EUR-CPI | Fixed 1.535% | At Maturity | 86 | | 24,531 | | 24,445 |
| 770,000 | USD | 5/9/28 | 1 Month USD-CPI | Fixed 2.36% | At Maturity | — | | (5,541) | | (5,541) |
| 510,000 | USD | 5/9/28 | 1 Month USD-CPI | Fixed 2.353% | At Maturity | — | | (4,111) | | (4,111) |
| 1,100,000 | EUR | 7/15/22 | Fixed 0.33% | 1-Month EUR-CPI | At Maturity | (60) | | 35,585 | | 35,645 |
| 2,500,000 | EUR | 5/15/22 | Fixed 0.09% | 1-Month EUR-CPI | At Maturity | — | | 78,589 | | 78,589 |
| 3,460,000 | GBP | 6/15/30 | UK RPI | Fixed 3.4% | At Maturity | 9,843 | | 143,711 | | 133,868 |
| 2,200,000 | GBP | 9/15/24 | UK RPI | Fixed 3.85% | At Maturity | 226 | | 125,862 | | 125,636 |
| 2,800,000 | GBP | 1/15/30 | UK RPI | Fixed 3.39% | At Maturity | (19,583) | | (52,818) | | (33,235) |
| 6,800,000 | GBP | 1/15/25 | UK RPI | Fixed 3.33% | At Maturity | 150,526 | | 43,202 | | (107,324) |
| 3,100,000 | GBP | 8/15/25 | UK RPI | Fixed 3.473% | At Maturity | — | | (38,524) | | (38,524) |
| 5,400,000 | USD | 2/26/26 | Fixed 2.31% | 1-Month USD-CPI | At Maturity | 1 | | 150,459 | | 150,458 |
| 2,700,000 | USD | 3/5/26 | Fixed 2.42% | 1-Month USD-CPI | At Maturity | — | | 59,424 | | 59,424 |
| 200,000 | EUR | 3/15/33 | Fixed 1.71% | 1-Month EUR-CPI | At Maturity | (302) | | (11,606) | | (11,304) |
| 1,100,000 | USD | 4/27/23 | Fixed 2.26% | 1-Month USD-CPI | At Maturity | — | | 11,176 | | 11,176 |
| 510,000 | USD | 5/9/23 | Fixed 2.26% | 1-Month USD-CPI | At Maturity | — | | 5,388 | | 5,388 |
| 780,000 | USD | 5/10/23 | Fixed 2.28% | 1-Month USD-CPI | At Maturity | — | | 7,511 | | 7,511 |
| 2,600,000 | USD | 11/4/29 | 1 Month USD-CPI | Fixed 1.76% | At Maturity | (1,182) | | (213,056) | | (211,874) |
| 2,200,000 | USD | 5/19/30 | 1 Month USD-CPI | Fixed 1.28% | At Maturity | — | | (296,112) | | (296,112) |
| 2,800,000 | EUR | 3/15/24 | Fixed 1.03% | 1-Month EUR-CPI | At Maturity | (563) | | (12,028) | | (11,465) |
| 1,100,000 | USD | 1/19/22 | 1 Month USD-CPI | Fixed 2.155% | At Maturity | — | | (29,939) | | (29,939) |
| 4,100,000 | USD | 1/19/22 | 1 Month USD-CPI | Fixed 2.18% | At Maturity | (33) | | (110,566) | | (110,533) |
| 1,800,000 | USD | 1/21/22 | 1 Month USD-CPI | Fixed 2.2% | At Maturity | — | | (48,114) | | (48,114) |
| 900,000 | USD | 2/1/22 | 1 Month USD-CPI | Fixed 2.17% | At Maturity | — | | (24,143) | | (24,143) |
| 5,500,000 | USD | 2/4/22 | 1 Month USD-CPI | Fixed 2.155% | At Maturity | — | | (147,795) | | (147,795) |
| 1,200,000 | USD | 2/5/22 | 1 Month USD-CPI | Fixed 2.2% | At Maturity | — | | (31,665) | | (31,665) |
| 1,100,000 | GBP | 3/15/22 | UK RPI | Fixed 3.22% | At Maturity | (11) | | (17,191) | | (17,180) |
| 600,000 | GBP | 3/15/36 | UK RPI | Fixed 3.566% | At Maturity | — | | (13,113) | | (13,113) |
| 800,000 | GBP | 3/15/36 | UK RPI | Fixed 3.58% | At Maturity | (7,081) | | (14,118) | | (7,037) |
| 4,500,000 | EUR | 3/15/31 | 1-Month EUR-CPI | Fixed 1.38% | At Maturity | (30,997) | | (154,555) | | (123,558) |
| 2,200,000 | USD | 5/13/26 | Fixed 2.77% | 1-Month USD-CPI | At Maturity | — | | (793) | | (793) |
| 1,000,000 | USD | 5/14/26 | Fixed 2.81% | 1-Month USD-CPI | At Maturity | — | | (2,901) | | (2,901) |
| 2,090,000 | GBP | 4/15/31 | 1 Month UK RPI | Fixed 3.75% | At Maturity | 725 | | (6,457) | | (7,182) |
| 1,250,000 | USD | 5/25/26 | Fixed 2.70% | 1-Month USD-CPI | At Maturity | 226 | | 2,534 | | 2,308 |
| 500,000 | USD | 6/1/26 | Fixed 2.69% | 1-Month USD-CPI | At Maturity | — | | 1,049 | | 1,049 |
| | | | | | | $ 94,632 | | $ (543,754) | | $ (638,386) |
The notes to the financial statements are an integral part of, and should be read in conjunction with, the financial statements.
| 22 | MainStay VP PIMCO Real Return Portfolio |
As of June 30, 2021, the Portfolio held the following centrally cleared credit default swap contracts1:
| Reference Entity | Termination
Date | Buy/Sell
Protection2 | Notional
Amount
(000)3 | (Pay)/
Receive
Fixed
Rate4 | Payment
Frequency
Paid/
Received | Upfront
Premiums
Paid/
(Received) | | Value | | Unrealized
Appreciation/
(Depreciation)5 |
| General Electric Co. 2.70%, 10/09/22 | 12/20/2023 | Sell | $ 100 | 1.00% | Quarterly | $ (2,388) | | $ 1,516 | | $ 3,904 |
| 1. | As of June 30, 2021, cash in the amount of $1,271,000 was on deposit with a broker for centrally cleared swap agreements. |
| 2. | Sell—Portfolio receives premium and sells credit protection. If a credit event occurs, as defined under the terms of that particular swap agreement, the Portfolio will either (i) pay to the buyer of protection an amount equal to the notional amount of the swap and take delivery of the referenced obligation or underlying securities comprising the referenced index or (ii) pay a net settlement amount in the form of cash or securities equal to the notional amount of the swap less the recovery value of the referenced obligation or underlying securities comprising the referenced index. |
| 3. | The maximum potential amount the Portfolio could be required to pay as a seller of credit protection or receive as a buyer of credit protection if a credit event occurs as defined under the terms of that particular swap contract. |
| 4. | The annual fixed rate represents the interest received by the Portfolio (as a seller of protection) or paid by the Portfolio (as a buyer of protection) annually on the notional amount of the credit default swap contract. |
| 5. | Represents the difference between the value of the credit default swap contracts at the time they were opened and the value at June 30, 2021. |
| Abbreviation(s): |
| ARS—Argentina Peso |
| AUD—Australia Dollar |
| BADLARPP—Average rate on 30-day deposits of at least 1 million Argentinian Pesos |
| BTP—Buoni del Tesoro Poliennali (Eurex Exchange index) |
| CAD—Canada Dollar |
| CNY—China Yuan Renminbi |
| DKK—Denmark Krone |
| EUR—Euro |
| EURIBOR—Euro Interbank Offered Rate |
| FHLMC—Federal Home Loan Mortgage Corp. |
| FNMA—Federal National Mortgage Association |
| GBP—British Pound Sterling |
| GNMA—Government National Mortgage Association |
| IDR—Indonesia Rupiah |
| JPY—Japanese Yen |
| LIBOR—London Interbank Offered Rate |
| NOK—Norway Krone |
| NZD—New Zealand Dollar |
| PEN—Peru Nuevo Sol |
| REMIC—Real Estate Mortgage Investment Conduit |
| SEK—Sweden Krona |
| TBA—To Be Announced |
| UMBS—Uniform Mortgage Backed Securities |
| USD—United States Dollar |
The notes to the financial statements are an integral part of, and should be read in conjunction with, the financial statements.
23
Portfolio of Investments June 30, 2021† (Unaudited) (continued)
The following is a summary of the fair valuations according to the inputs used as of June 30, 2021, for valuing the Portfolio’s assets and liabilities:
| Description | Quoted
Prices in
Active
Markets for
Identical
Assets
(Level 1) | | Significant
Other
Observable
Inputs
(Level 2) | | Significant
Unobservable
Inputs
(Level 3) | | Total |
| Asset Valuation Inputs | | | | | | | |
| Investments in Securities (a) | | | | | | | |
| Long-Term Bonds | | | | | | | |
| Asset-Backed Securities | $ — | | $ 44,019,445 | | $ — | | $ 44,019,445 |
| Corporate Bonds | — | | 31,164,925 | | — | | 31,164,925 |
| Foreign Government Bonds | — | | 46,132,980 | | — | | 46,132,980 |
| Mortgage-Backed Securities | — | | 27,708,583 | | — | | 27,708,583 |
| U.S. Government & Federal Agencies | — | | 550,197,732 | | — | | 550,197,732 |
| Total Long-Term Bonds | — | | 699,223,665 | | — | | 699,223,665 |
| Short-Term Investment | | | | | | | |
| Affiliated Investment Company | 3,369,769 | | — | | — | | 3,369,769 |
| Total Investments in Securities | 3,369,769 | | 699,223,665 | | — | | 702,593,434 |
| Other Financial Instruments | | | | | | | |
| Foreign Currency Forward Contracts (b) | — | | 1,678,598 | | — | | 1,678,598 |
| Futures Contracts (b) | 163,357 | | — | | — | | 163,357 |
| Purchased Options | 1,779 | | 222,683 | | — | | 224,462 |
| Credit Default Swaps (b) | — | | 3,904 | | — | | 3,904 |
| Inflation Swap Contracts (b) | — | | 645,057 | | — | | 645,057 |
| Total Other Financial Instruments | 163,049 | | 2,368,469 | | — | | 2,531,518 |
| Total Investments in Securities and Other Financial Instruments | $ 3,533,126 | | $ 701,551,224 | | $ — | | $ 705,084,350 |
| Liability Valuation Inputs | | | | | | | |
| Written Options | $ — | | $ (211,397) | | $ — | | $ (211,397) |
| Other Financial Instruments (b) | | | | | | | |
| Foreign Currency Forward Contracts | — | | (195,517) | | — | | (195,517) |
| Futures Contracts | (1,711,124) | | — | | — | | (1,711,124) |
| Interest Rate Swaps | — | | (162,326) | | — | | (162,326) |
| Inflation Swap Contracts | — | | (1,283,443) | | — | | (1,283,443) |
| Total Other Financial Instruments | (1,711,124) | | (1,641,286) | | — | | (3,352,410) |
| Total Investments in Securities and Other Financial Instruments | $ (1,711,124) | | $ (1,852,683) | | $ — | | $ (3,563,807) |
| (a) | For a complete listing of investments and their industries, see the Portfolio of Investments. |
| (b) | The value listed for these securities reflects unrealized appreciation (depreciation) as shown on the Portfolio of Investments. |
The notes to the financial statements are an integral part of, and should be read in conjunction with, the financial statements.
| 24 | MainStay VP PIMCO Real Return Portfolio |
Sale-Buyback Transactions:
| Counterparty | Borrowing
Rate (a) | Borrowing
Date | Maturity
Date | Amount
Borrowed (a) | | Payable for
Sale-Buyback
Transcations (b) |
| BofA Securities, Inc. | 0.05% | 6/24/2021 | 7/1/2021 | $ 803,160 | | $ 803,160 |
| BNP Paribas S.A. | 0.08 | 6/24/2021 | 7/2/2021 | 23,580,232 | | 23,585,318 |
| BNP Paribas S.A. | 0.09 | 6/25/2021 | 7/2/2021 | 15,100,146 | | 15,104,261 |
| BNP Paribas S.A. | 0.09 | 6/25/2021 | 7/2/2021 | 17,998,004 | | 18,002,542 |
| BNP Paribas S.A. | 0.09 | 6/25/2021 | 7/2/2021 | 16,222,086 | | 16,225,566 |
| BNP Paribas S.A. | 0.09 | 6/25/2021 | 7/2/2021 | 20,234,080 | | 20,238,879 |
| BNP Paribas S.A. | 0.09 | 6/25/2021 | 7/2/2021 | 19,925,227 | | 19,930,029 |
| BNP Paribas S.A. | 0.09 | 6/25/2021 | 7/2/2021 | 18,828,582 | | 18,833,476 |
| BNP Paribas S.A. | 0.09 | 6/25/2021 | 7/2/2021 | 12,943,845 | | 12,947,079 |
| BNP Paribas S.A. | 0.09 | 6/25/2021 | 7/2/2021 | 10,791,233 | | 10,793,883 |
| BNP Paribas S.A. | 0.09 | 6/25/2021 | 7/2/2021 | 10,497,341 | | 10,499,846 |
| BNP Paribas S.A. | 0.09 | 6/25/2021 | 7/2/2021 | 14,184,971 | | 14,188,504 |
| BNP Paribas S.A. | 0.09 | 6/25/2021 | 7/2/2021 | 17,109,881 | | 17,114,060 |
| BNP Paribas S.A. | 0.09 | 6/25/2021 | 7/2/2021 | 19,561,628 | | 19,566,430 |
| BNP Paribas S.A. | 0.09 | 6/25/2021 | 7/2/2021 | 11,439,294 | | 11,442,057 |
| BNP Paribas S.A. | 0.09 | 6/25/2021 | 7/2/2021 | 23,373,722 | | 23,379,292 |
| BNP Paribas S.A. | 0.09 | 6/25/2021 | 7/2/2021 | 17,452,439 | | 17,456,562 |
| BofA Securities, Inc. | 0.00 | 6/8/2021 | 7/6/2021 | 31,844,093 | | 31,883,925 |
| Barclays Capital Inc. | 0.06 | 5/11/2021 | 7/8/2021 | 21,025,478 | | 21,057,279 |
| Barclays Capital Inc. | 0.06 | 5/11/2021 | 7/8/2021 | 23,966,568 | | 24,005,725 |
| BNP Paribas S.A. | 0.05 | 6/9/2021 | 7/9/2021 | 5,458,673 | | 5,470,401 |
| Morgan Stanley & Co. LLC. | 0.08 | 6/17/2021 | 7/19/2021 | 22,049,634 | | 22,151,687 |
| Morgan Stanley & Co. LLC. | 0.08 | 6/17/2021 | 7/19/2021 | 37,933,421 | | 38,110,590 |
| | | | | $412,323,738 | | $412,790,552 |
(a) During the period ended June 30, 2021, the Portfolio’s average amount of borrowing was $156,130,087 at a weighted average interest rate of 0.09%.
(b) Payable for sale-buyback transactions includes $466,814 of deferred price drop.
The notes to the financial statements are an integral part of, and should be read in conjunction with, the financial statements.
25
Statement of Assets and Liabilities as of June 30, 2021 (Unaudited)
| Assets |
Investment in unaffiliated securities, at value
(identified cost $658,828,188) | $ 699,448,127 |
Investment in affiliated investment companies, at value
(identified cost $3,369,769) | 3,369,769 |
| Cash | 764,617 |
Cash denominated in foreign currencies
(identified cost $1,349,756) | 1,349,869 |
| Cash collateral on deposit at broker for futures contracts | 1,379,000 |
| Cash collateral on deposit at broker for swap contracts | 1,271,000 |
| Receivables: | |
| Investment securities sold | 307,262,725 |
| Interest | 1,356,833 |
| Portfolio shares sold | 530,269 |
| Variation margin on futures contracts | 22,361 |
| Unrealized appreciation on foreign currency forward contracts | 1,678,598 |
| Other assets | 8,445 |
| Total assets | 1,018,441,613 |
| Liabilities |
| Cash collateral due to broker for TBA | 659,245 |
| Written options, at value (premiums received $254,366) | 211,397 |
| Payables: | |
| Sale buyback transaction | 412,790,552 |
| Investment securities purchased | 59,455,101 |
| Variation margin on centrally cleared swap contracts | 727,730 |
| Manager (See Note 3) | 207,270 |
| Portfolio shares redeemed | 170,324 |
| NYLIFE Distributors (See Note 3) | 88,498 |
| Custodian | 71,789 |
| Professional fees | 62,715 |
| Shareholder communication | 47,008 |
| Trustees | 121 |
| Unrealized depreciation on foreign currency forward contracts | 195,517 |
| Total liabilities | 474,687,267 |
| Net assets | $ 543,754,346 |
| Composition of Net Assets |
| Shares of beneficial interest outstanding (par value of $.001 per share) unlimited number of shares authorized | $ 56,709 |
| Additional paid-in-capital | 561,984,349 |
| | 562,041,058 |
| Total distributable earnings (loss) | (18,286,712) |
| Net assets | $ 543,754,346 |
| Initial Class | |
| Net assets applicable to outstanding shares | $111,579,320 |
| Shares of beneficial interest outstanding | 11,592,275 |
| Net asset value per share outstanding | $ 9.63 |
| Service Class | |
| Net assets applicable to outstanding shares | $432,175,026 |
| Shares of beneficial interest outstanding | 45,116,251 |
| Net asset value per share outstanding | $ 9.58 |
The notes to the financial statements are an integral part of, and should be read in conjunction with, the financial statements.
| 26 | MainStay VP PIMCO Real Return Portfolio |
Statement of Operations for the six months ended June 30, 2021 (Unaudited)
| Investment Income (Loss) |
| Income | |
| Interest (net of foreign tax withholding of $4,169) | $11,300,446 |
| Dividends-affiliated | 89 |
| Other | 360 |
| Total income | 11,300,895 |
| Expenses | |
| Manager (See Note 3) | 1,227,142 |
| Distribution/Service—Service Class (See Note 3) | 531,395 |
| Interest expense | 73,308 |
| Professional fees | 65,305 |
| Custodian | 61,748 |
| Shareholder communication | 27,239 |
| Trustees | 4,994 |
| Miscellaneous | 7,034 |
| Total expenses before waiver/reimbursement | 1,998,165 |
| Expense waiver/reimbursement from Manager (See Note 3) | (92,686) |
| Net expenses | 1,905,479 |
| Net investment income (loss) | 9,395,416 |
| Realized and Unrealized Gain (Loss) |
| Net realized gain (loss) on: | |
| Unaffiliated investment transactions | 2,365,660 |
| Futures transactions | 3,778,795 |
| Swap transactions | (149,679) |
| Foreign currency transactions | (1,743,167) |
| Foreign currency forward transactions | 1,181,575 |
| Written option transactions | 136,136 |
| Net realized gain (loss) | 5,569,320 |
| Net change in unrealized appreciation (depreciation) on: | |
| Unaffiliated investments | (7,162,957) |
| Futures contracts | (1,594,056) |
| Swap contracts | (987,581) |
| Foreign currency forward contracts | 2,533,799 |
| Translation of other assets and liabilities in foreign currencies | (183,332) |
| Written option contracts | 13,653 |
| Net change in unrealized appreciation (depreciation) | (7,380,474) |
| Net realized and unrealized gain (loss) | (1,811,154) |
| Net increase (decrease) in net assets resulting from operations | $ 7,584,262 |
The notes to the financial statements are an integral part of, and should be read in conjunction with, the financial statements.
27
Statements of Changes in Net Assets
for the six months ended June 30, 2021 (Unaudited) and the year ended December 31, 2020
| | 2021 | 2020 |
| Increase (Decrease) in Net Assets |
| Operations: | | |
| Net investment income (loss) | $ 9,395,416 | $ 4,586,196 |
| Net realized gain (loss) | 5,569,320 | 1,156,058 |
| Net change in unrealized appreciation (depreciation) | (7,380,474) | 40,834,058 |
| Net increase (decrease) in net assets resulting from operations | 7,584,262 | 46,576,312 |
| Distributions to shareholders: | | |
| Initial Class | — | (998,898) |
| Service Class | — | (7,260,665) |
| Total distributions to shareholders | — | (8,259,563) |
| Capital share transactions: | | |
| Net proceeds from sales of shares | 84,633,813 | 116,839,503 |
| Net asset value of shares issued to shareholder in reinvestment of distributions | — | 8,259,563 |
| Cost of shares redeemed | (30,610,337) | (73,308,369) |
| Increase (decrease) in net assets derived from capital share transactions | 54,023,476 | 51,790,697 |
| Net increase (decrease) in net assets | 61,607,738 | 90,107,446 |
| Net Assets |
| Beginning of period | 482,146,608 | 392,039,162 |
| End of period | $543,754,346 | $482,146,608 |
The notes to the financial statements are an integral part of, and should be read in conjunction with, the financial statements.
| 28 | MainStay VP PIMCO Real Return Portfolio |
Statement of Cash Flows
for the six-month period ended June 30, 2021 (Unaudited)
| Cash flows from (used in) operating activities: |
| Net increase in net assets resulting from operations | $ 7,584,262 |
| Adjustments to reconcile net increase in net assets resulting from operations to net cash used in operating activities: | |
| Long term investments purchased | (478,164,973) |
| Long term investments sold | 479,067,191 |
| Purchase of short term investments, net | (37,201,459) |
| Sale of affiliated investments, net | 1,539,093 |
| Amortization (accretion) of discount and premium, net | (2,457,160) |
| Decrease in investment securities sold receivable | 64,512,322 |
| Decrease in dividends and interest receivable | 38,836 |
| Decrease in securities lending receivable | 60 |
| Increase in other assets | (8,445) |
| Increase in unrealized appreciation for open forward foreign currency contracts | (1,652,992) |
| Increase in premiums from written options | 130,991 |
| Decrease in investment securities purchased payable | (106,384,598) |
| Decrease in cash collateral due to broker for sale-buyback transactions | (1,580,000) |
| Increase in cash collateral due to broker for TBA | 389,245 |
| Decrease in due to NYLIFE Distributors | (2,225) |
| Decrease in professional fees payable | (5,122) |
| Increase in custodian payable | 40,403 |
| Increase in shareholder communication payable | 23,527 |
| Decrease in due to Trustees | (454) |
| Decrease in due to manager | (5,671) |
| Increase in variation margin on centrally cleared swap contracts | 851,981 |
| Decrease in variation margin on futures contracts | 45,183 |
| Decrease in unrealized depreciation for open forward foreign currency contracts | (880,807) |
| Decrease in accrued expenses | (2,416) |
| Net realized gain (loss) from unaffiliated investments | (2,365,660) |
| Net change in unrealized (appreciation) depreciation on unaffiliated investments | 7,162,957 |
| Net change in unrealized (appreciation) depreciation on written options | (13,653) |
| Net cash used in operating activities* | (69,339,584) |
| Cash flows from financing activities: |
| Proceeds from shares sold | 84,316,777 |
| Payment on shares redeemed | (30,625,035) |
| Decrease in due to custodian | (267,566) |
| Payments on sale-buyback transactions | (3,087,729,032) |
| Proceeds from sale-buyback transactions | 3,104,151,506 |
| Net cash from financing activities | 69,846,650 |
| Effect of exchange rate changes on cash | 27,423 |
| Net increase in cash and restricted cash | 534,488 |
| Cash, restricted cash and foreign currency at beginning of period | 4,229,998 |
| Cash, restricted cash and foreign currency at end of period | $ 4,764,486 |
| * Included in operating expenses is cash of $73,308 paid for interest on borrowings. | |
| Supplemental disclosure of cash flow information: |
| The following tables provide a reconciliation of cash and restricted cash reported within the Statement of Assets and Liabilities that sums to the total of the such amounts shown on the Statement of Cash Flows: |
| Cash and restricted cash at beginning of period | |
| Cash | $ 507 |
| Cash denominated in foreign currencies | 1,566,491 |
| Cash collateral on deposit at broker for futures contracts | 1,333,000 |
| Cash collateral on deposit at broker for swap contracts | 1,330,000 |
| Total cash and restricted cash shown in the Statement of Cash Flows | $4,229,998 |
| Cash and restricted cash at end of period | |
| Cash | $ 764,617 |
| Cash denominated in foreign currencies | 1,349,869 |
| Cash collateral on deposit at broker for futures contracts | 1,379,000 |
| Cash collateral on deposit at broker for swap contracts | 1,271,000 |
| Total cash and restricted cash shown in the Statement of Cash Flows | $4,764,486 |
| Restricted cash consists of cash that has been segregated to cover the Portfolio’s collateral or margin obligations under derivative contracts. It is separately reported on the Statement of Assets and Liabilities as cash collateral on deposit at brokers. |
The notes to the financial statements are an integral part of, and should be read in conjunction with, the financial statements.
29
Financial Highlights selected per share data and ratios
| | Six months ended
June 30,
2021* | | Year Ended December 31, |
| Initial Class | 2020 | | 2019 | | 2018 | | 2017 | | 2016 |
| Net asset value at beginning of period | $ 9.47 | | $ 8.63 | | $ 8.20 | | $ 8.54 | | $ 8.40 | | $ 8.11 |
| Net investment income (loss) (a) | 0.19 | | 0.12 | | 0.20 | | 0.23 | | 0.23 | | 0.17 |
| Net realized and unrealized gain (loss) on investments | — | | 0.96 | | 0.50 | | (0.53) | | 0.15 | | 0.21 |
| Net realized and unrealized gain (loss) on foreign currency transactions | (0.03) | | (0.05) | | 0.01 | | 0.10 | | (0.09) | | 0.05 |
| Total from investment operations | 0.16 | | 1.03 | | 0.71 | | (0.20) | | 0.29 | | 0.43 |
| Less distributions: | | | | | | | | | | | |
| From net investment income | — | | (0.19) | | (0.28) | | (0.14) | | (0.15) | | (0.14) |
| Net asset value at end of period | $ 9.63 | | $ 9.47 | | $ 8.63 | | $ 8.20 | | $ 8.54 | | $ 8.40 |
| Total investment return (b) | 1.69%(c) | | 11.93%(c) | | 8.56%(c) | | (2.38)%(c) | | 3.45% | | 5.28% |
| Ratios (to average net assets)/Supplemental Data: | | | | | | | | | | | |
| Net investment income (loss) | 4.04%†† | | 1.27% | | 2.35% | | 2.78% | | 2.71% | | 2.05%(d) |
| Net expenses (e) | 0.56%†† | | 0.78% | | 1.65% | | 1.43% | | 1.03% | | 0.91%(f) |
| Expenses (before waiver/reimbursement) (e) | 0.60%†† | | 0.83% | | 1.71% | | 1.43% | | 1.03% | | 0.91%(f) |
| Interest expense and fees | 0.03%†† | | 0.25% | | 1.09% | | 0.81% | | 0.42% | | 0.32% |
| Portfolio turnover rate (g) | 75% | | 199% | | 187% | | 157% | | 121% | | 143% |
| Net assets at end of period (in 000’s) | $ 111,579 | | $ 48,479 | | $ 48,707 | | $ 44,523 | | $ 45,563 | | $ 36,060 |
| * | Unaudited. |
| †† | Annualized. |
| (a) | Per share data based on average shares outstanding during the period. |
| (b) | Total return does not reflect any deduction of sales charges, mortality and expense charges, contract charges or administrative charges. For periods of less than one year, total return is not annualized. |
| (c) | Total investment return may reflect adjustments to conform to generally accepted accounting principles. |
| (d) | Without the custody fee reimbursement, net investment income (loss) would have been 2.04%. |
| (e) | In addition to the fees and expenses which the Portfolio bears directly, it also indirectly bears a pro-rata share of the fees and expenses of the underlying funds in which it invests. Such indirect expenses are not included in the above expense ratios. |
| (f) | Without the custody fee reimbursement, net expenses would have been 0.92%. |
| (g) | The portfolio turnover rates not including mortgage dollar rolls were 24%, 128%, 139%, 48%, 96% and 91% for the six months ended June 30, 2021 and for the years ended December 31, 2020, 2019, 2018, 2017 and 2016, respectively. |
The notes to the financial statements are an integral part of, and should be read in conjunction with, the financial statements.
| 30 | MainStay VP PIMCO Real Return Portfolio |
Financial Highlights selected per share data and ratios
| | Six months ended
June 30,
2021* | | Year Ended December 31, |
| Service Class | 2020 | | 2019 | | 2018 | | 2017 | | 2016 |
| Net asset value at beginning of period | $ 9.44 | | $ 8.61 | | $ 8.19 | | $ 8.53 | | $ 8.39 | | $ 8.10 |
| Net investment income (loss) (a) | 0.18 | | 0.09 | | 0.18 | | 0.21 | | 0.21 | | 0.18 |
| Net realized and unrealized gain (loss) on investments | (0.01) | | 0.96 | | 0.49 | | (0.54) | | 0.15 | | 0.19 |
| Net realized and unrealized gain (loss) on foreign currency transactions | (0.03) | | (0.05) | | 0.01 | | 0.10 | | (0.09) | | 0.04 |
| Total from investment operations | 0.14 | | 1.00 | | 0.68 | | (0.23) | | 0.27 | | 0.41 |
| Less distributions: | | | | | | | | | | | |
| From net investment income | — | | (0.17) | | (0.26) | | (0.11) | | (0.13) | | (0.12) |
| Net asset value at end of period | $ 9.58 | | $ 9.44 | | $ 8.61 | | $ 8.19 | | $ 8.53 | | $ 8.39 |
| Total investment return (b) | 1.48%(c) | | 11.61%(c) | | 8.30%(c) | | (2.63)%(c) | | 3.20% | | 5.03% |
| Ratios (to average net assets)/Supplemental Data: | | | | | | | | | | | |
| Net investment income (loss) | 3.79%†† | | 1.04% | | 2.14% | | 2.53% | | 2.46% | | 2.15%(d) |
| Net expenses (e) | 0.81%†† | | 1.03% | | 1.89% | | 1.68% | | 1.28% | | 1.16%(f) |
| Expenses (before waiver/reimbursement) (e) | 0.85%†† | | 1.08% | | 1.96% | | 1.68% | | 1.28% | | 1.16%(f) |
| Interest expense and fees | 0.03%†† | | 0.25% | | 1.09% | | 0.81% | | 0.42% | | 0.32% |
| Portfolio turnover rate (g) | 75% | | 199% | | 187% | | 157% | | 121% | | 143% |
| Net assets at end of period (in 000’s) | $ 432,175 | | $ 433,668 | | $ 343,332 | | $ 282,052 | | $ 287,520 | | $ 282,006 |
| * | Unaudited. |
| †† | Annualized. |
| (a) | Per share data based on average shares outstanding during the period. |
| (b) | Total return does not reflect any deduction of sales charges, mortality and expense charges, contract charges or administrative charges. For periods of less than one year, total return is not annualized. |
| (c) | Total investment return may reflect adjustments to conform to generally accepted accounting principles. |
| (d) | Without the custody fee reimbursement, net investment income (loss) would have been 2.14%. |
| (e) | In addition to the fees and expenses which the Portfolio bears directly, it also indirectly bears a pro-rata share of the fees and expenses of the underlying funds in which it invests. Such indirect expenses are not included in the above expense ratios. |
| (f) | Without the custody fee reimbursement, net expenses would have been 1.17%. |
| (g) | The portfolio turnover rates not including mortgage dollar rolls were 24%, 128%, 139%, 48%, 96% and 91% for the six months ended June 30, 2021 and for the years ended December 31, 2020, 2019, 2018, 2017 and 2016, respectively. |
The notes to the financial statements are an integral part of, and should be read in conjunction with, the financial statements.
31
Notes to Financial Statements (Unaudited)
Note 1–Organization and Business
MainStay VP Funds Trust (the “Fund”) was organized as a Delaware statutory trust on February 1, 2011. The Fund is registered under the Investment Company Act of 1940, as amended (the “1940 Act”), as an open-end management investment company. The Fund is comprised of thirty-one separate series (collectively referred to as the “Portfolios”). These financial statements and notes relate to the MainStay VP PIMCO Real Return Portfolio (the "Portfolio"), a "non-diversified” portfolio, as that term is defined in the 1940 Act, as interpreted or modified by regulatory authorities having jurisdiction, from time to time. However, due to its principal investment strategies and investment processes, the Portfolio has historically operated as a "diversified" portfolio. Therefore, the Portfolio will not operate as "non-diversified" portfolio without first obtaining shareholder approval.
Shares of the Portfolio are currently offered to certain separate accounts to fund variable annuity policies and variable universal life insurance policies issued by New York Life Insurance and Annuity Corporation (“NYLIAC”), a wholly-owned subsidiary of New York Life Insurance Company (“New York Life”) and may also be offered to fund variable annuity policies and variable universal life insurance policies issued by other insurance companies. NYLIAC allocates shares of the Portfolios to, among others, certain NYLIAC separate accounts. Shares of the Portfolio are also offered to the MainStay VP Conservative Allocation Portfolio, MainStay VP Moderate Allocation Portfolio, MainStay VP Growth Allocation Portfolio (formerly known as MainStay VP Moderate Growth Allocation Portfolio) and MainStay VP Equity Allocation Portfolio (formerly known as MainStay VP Growth Allocation Portfolio), which operate as “funds-of-funds," and other variable insurance funds.
The following table lists the Portfolio's share classes that have been registered and commenced operations:
| Class | Commenced Operations |
| Initial Class | February 17, 2012 |
| Service Class | February 17, 2012 |
Shares of the Portfolio are offered and are redeemed at a price equal to their respective net asset value (“NAV”) per share. No sales or redemption charge is applicable to the purchase or redemption of the Portfolio's shares. Under the terms of the Fund’s multiple class plan, adopted pursuant to Rule 18f-3 under the 1940 Act, the classes differ in that, among other things, Service Class shares of the Portfolio pay a combined distribution and service fee of 0.25% of average daily net assets attributable to Service Class shares of the Portfolio to the Distributor (as defined in Note 3(B)) pursuant to a plan adopted in accordance with Rule 12b-1 under the 1940 Act. Contract owners of variable annuity contracts purchased after June 2, 2003, are permitted to invest only in the Service Class shares.
The Portfolio's investment objective is to seek maximum real return, consistent with preservation of real capital and prudent investment management.
Note 2–Significant Accounting Policies
The Portfolio is an investment company and accordingly follows the investment company accounting and reporting guidance of the Financial Accounting Standards Board (“FASB”) Accounting Standard Codification Topic 946 Financial Services—Investment Companies. The Portfolio prepares its financial statements in accordance with generally accepted accounting principles (“GAAP”) in the United States of America and follows the significant accounting policies described below.
(A) Securities Valuation. Investments are usually valued as of the close of regular trading on the New York Stock Exchange (the "Exchange") (usually 4:00 p.m. Eastern time) on each day the Portfolio is open for business ("valuation date").
The Board of Trustees of the Fund (the "Board") adopted procedures establishing methodologies for the valuation of the Portfolio's securities and other assets and delegated the responsibility for valuation determinations under those procedures to the Valuation Committee of the Fund (the “Valuation Committee”). The procedures state that, subject to the oversight of the Board and unless otherwise noted, the responsibility for the day-to-day valuation of portfolio assets (including fair value measurements for the Portfolio's assets and liabilities) rests with New York Life Investment Management LLC (“New York Life Investments” or the "Manager"), aided to whatever extent necessary by the Subadvisor (as defined in Note 3(A)). To assess the appropriateness of security valuations, the Manager, the Subadvisor or the Portfolio's third-party service provider, who is subject to oversight by the Manager, regularly compares prior day prices, prices on comparable securities and the sale prices to the prior and current day prices and challenges prices with changes exceeding certain tolerance levels with third-party pricing services or broker sources.
The Board authorized the Valuation Committee to appoint a Valuation Subcommittee (the “Subcommittee”) to establish the prices of securities for which market quotations are not readily available or the prices of which are not otherwise readily determinable under the procedures. The Subcommittee meets (in person, via electronic mail or via teleconference) on an as-needed basis. The Valuation Committee meets to ensure that actions taken by the Subcommittee were appropriate.
For those securities valued through either a standardized fair valuation methodology or a fair valuation measurement, the Subcommittee deals with such valuation and the Valuation Committee reviews and affirms, if appropriate, the reasonableness of the valuation based on such methodologies and measurements on a regular basis after considering information that is reasonably available and deemed relevant by the Valuation Committee. Any action taken by the Subcommittee with respect to the valuation of a portfolio security or other asset is submitted for review and ratification (if appropriate) to the Valuation Committee and the Board at the next regularly scheduled meeting.
"Fair value" is defined as the price the Portfolio would reasonably expect to receive upon selling an asset or liability in an orderly transaction to an independent buyer in the principal or most advantageous market for the
| 32 | MainStay VP PIMCO Real Return Portfolio |
asset or liability. Fair value measurements are determined within a framework that establishes a three-tier hierarchy that maximizes the use of observable market data and minimizes the use of unobservable inputs to establish a classification of fair value measurements for disclosure purposes. "Inputs" refer broadly to the assumptions that market participants would use in pricing the asset or liability, including assumptions about risk, such as the risk inherent in a particular valuation technique used to measure fair value using a pricing model and/or the risk inherent in the inputs for the valuation technique. Inputs may be observable or unobservable. Observable inputs reflect the assumptions market participants would use in pricing the asset or liability based on market data obtained from sources independent of the Portfolio. Unobservable inputs reflect the Portfolio’s own assumptions about the assumptions market participants would use in pricing the asset or liability based on the information available. The inputs or methodology used for valuing assets or liabilities may not be an indication of the risks associated with investing in those assets or liabilities. The three-tier hierarchy of inputs is summarized below.
| • | Level 1—quoted prices in active markets for an identical asset or liability |
| • | Level 2—other significant observable inputs (including quoted prices for a similar asset or liability in active markets, interest rates and yield curves, prepayment speeds, credit risk, etc.) |
| • | Level 3—significant unobservable inputs (including the Portfolio's own assumptions about the assumptions that market participants would use in measuring fair value of an asset or liability) |
The level of an asset or liability within the fair value hierarchy is based on the lowest level of an input, both individually and in the aggregate, that is significant to the fair value measurement. The aggregate value by input level of the Portfolio’s assets and liabilities as of June 30, 2021, is included at the end of the Portfolio of Investments.
The Portfolio may use third-party vendor evaluations, whose prices may be derived from one or more of the following standard inputs, among others:
| • Benchmark yields | • Reported trades |
| • Broker/dealer quotes | • Issuer spreads |
| • Two-sided markets | • Benchmark securities |
| • Bids/offers | • Reference data (corporate actions or material event notices) |
| • Industry and economic events | • Comparable bonds |
| • Equity and credit default swap curves | • Monthly payment information |
An asset or liability for which market values cannot be measured using the methodologies described above is valued by methods deemed reasonable in good faith by the Valuation Committee, following the procedures established by the Board, to represent fair value. Under these procedures, the Portfolio generally uses a market-based approach which may use related or comparable assets or liabilities, recent transactions, market multiples, book values and other relevant information. The
Portfolio may also use an income-based valuation approach in which the anticipated future cash flows of the asset or liability are discounted to calculate fair value. Discounts may also be applied due to the nature and/or duration of any restrictions on the disposition of the asset or liability. Fair value represents a good faith approximation of the value of a security. Fair value determinations involve the consideration of a number of subjective factors, an analysis of applicable facts and circumstances and the exercise of judgment. As a result, it is possible that the fair value for a security determined in good faith in accordance with the Portfolio's valuation procedures may differ from valuations for the same security determined by other funds using their own valuation procedures. Although the Portfolio's valuation procedures are designed to value a security at the price the Portfolio may reasonably expect to receive upon the security's sale in an orderly transaction, there can be no assurance that any fair value determination thereunder would, in fact, approximate the amount that the Portfolio would actually realize upon the sale of the security or the price at which the security would trade if a reliable market price were readily available. During the six-month period ended June 30, 2021, there were no material changes to the fair value methodologies.
Securities which may be valued in this manner include, but are not limited to: (i) a security for which trading has been halted or suspended; (ii) a debt security that has recently gone into default and for which there is not a current market quotation; (iii) a security of an issuer that has entered into a restructuring; (iv) a security that has been delisted from a national exchange; (v) a security for which the market price is not readily available from a third-party pricing source or, if so provided, does not, in the opinion of the Manager or the Subadvisor, reflect the security's market value; (vi) a security subject to trading collars for which no or limited trading takes place; and (vii) a security whose principal market has been temporarily closed at a time when, under normal conditions, it would be open. Securities valued in this manner are generally categorized as Level 3 in the hierarchy. No securities held by the Portfolio as of June 30, 2021 were fair valued in such a manner.
Investments in mutual funds, including money market funds, are valued at their respective NAVs at the close of business each day on the valuation date. These securities are generally categorized as Level 1 in the hierarchy.
Futures contracts are valued at the last posted settlement price on the market where such futures are primarily traded. These securities are generally categorized as Level 1 in the hierarchy.
Options contracts are valued at the last posted settlement price on the market where such options are primarily traded.
Swaps are marked to market daily based upon quotations from pricing agents, brokers or market makers. These securities are generally categorized as Level 2 in the hierarchy.
Debt securities (other than convertible and municipal bonds) are valued at the evaluated bid prices (evaluated mean prices in the case of convertible and municipal bonds) supplied by a pricing agent or broker selected by the Manager, in consultation with the Subadvisor. The evaluations are
Notes to Financial Statements (Unaudited) (continued)
market-based measurements processed through a pricing application and represents the pricing agent’s good faith determination as to what a holder may receive in an orderly transaction under market conditions. The rules-based logic utilizes valuation techniques that reflect participants’ assumptions and vary by asset class and per methodology, maximizing the use of relevant observable data including quoted prices for similar assets, benchmark yield curves and market corroborated inputs. The evaluated bid or mean prices are deemed by the Manager, in consultation with the Subadvisor, to be representative of market values at the regular close of trading of the Exchange on each valuation date. Debt securities purchased on a delayed delivery basis are marked to market daily until settlement at the forward settlement date. Debt securities, including corporate bonds, U.S. government and federal agency bonds, municipal bonds, foreign bonds, convertible bonds, asset-backed securities and mortgage-backed securities are generally categorized as Level 2 in the hierarchy.
Foreign currency forward contracts are valued at their fair market values measured on the basis of the mean between the last current bid and ask prices based on dealer or exchange quotations and are generally categorized as Level 2 in the hierarchy.
Temporary cash investments acquired in excess of 60 days to maturity at the time of purchase are valued using the latest bid prices or using valuations based on a matrix system (which considers such factors as security prices, yields, maturities and ratings), both as furnished by independent pricing services. Temporary cash investments that mature in 60 days or less at the time of purchase ("Short-Term Investments") are valued using the amortized cost method of valuation, unless the use of such method would be inappropriate. The amortized cost method involves valuing a security at its cost on the date of purchase and thereafter assuming a constant amortization to maturity of the difference between such cost and the value on maturity date. Amortized cost approximates the current fair value of a security. Securities valued using the amortized cost method are not valued using quoted prices in an active market and are generally categorized as Level 2 in the hierarchy.
The information above is not intended to reflect an exhaustive list of the methodologies that may be used to value portfolio investments. The valuation procedures permit the use of a variety of valuation methodologies in connection with valuing portfolio investments. The methodology used for a specific type of investment may vary based on the market data available or other considerations. The methodologies summarized above may not represent the specific means by which portfolio investments are valued on any particular business day.
A portfolio investment may be classified as an illiquid investment under the Portfolio's written liquidity risk management program and related procedures (“Liquidity Program”). Illiquidity of an investment might prevent the sale of such investment at a time when the Manager or the Subadvisor might wish to sell, and these investments could have the effect of decreasing the overall level of the Portfolio's liquidity. Further, the lack of an established secondary market may make it more difficult to value illiquid investments, requiring the Portfolio to rely on judgments that
may be somewhat subjective in measuring value, which could vary materially from the amount that the Portfolio could realize upon disposition. Difficulty in selling illiquid investments may result in a loss or may be costly to the Portfolio. An illiquid investment is any investment that the Manager or Subadvisor reasonably expects cannot be sold or disposed of in current market conditions in seven calendar days or less without the sale or disposition significantly changing the market value of the investment. The liquidity classification of each investment will be made using information obtained after reasonable inquiry and taking into account, among other things, relevant market, trading and investment-specific considerations in accordance with the Liquidity Program. Illiquid investments are often valued in accordance with methods deemed by the Board in good faith to be reasonable and appropriate to accurately reflect their fair value. The liquidity of the Portfolio's investments was determined as of June 30, 2021, and can change at any time. Illiquid investments as of June 30, 2021, are shown in the Portfolio of Investments.
(B) Income Taxes. The Portfolio's policy is to comply with the requirements of the Internal Revenue Code of 1986, as amended (the “Internal Revenue Code”), applicable to regulated investment companies and to distribute all of its taxable income to the shareholders of the Portfolio within the allowable time limits.
The Manager evaluates the Portfolio’s tax positions to determine if the tax positions taken meet the minimum recognition threshold in connection with accounting for uncertainties in income tax positions taken or expected to be taken for the purposes of measuring and recognizing tax liabilities in the financial statements. Recognition of tax benefits of an uncertain tax position is permitted only to the extent the position is “more likely than not” to be sustained assuming examination by taxing authorities. The Manager analyzed the Portfolio's tax positions taken on federal, state and local income tax returns for all open tax years (for up to three tax years) and has concluded that no provisions for federal, state and local income tax are required in the Portfolio's financial statements. The Portfolio's federal, state and local income tax and federal excise tax returns for tax years for which the applicable statutes of limitations have not expired are subject to examination by the Internal Revenue Service and state and local departments of revenue.
(C) Foreign Taxes. The Portfolio may be subject to foreign taxes on income and other transaction-based taxes imposed by certain countries in which it invests. A portion of the taxes on gains on investments or currency purchases/repatriation may be reclaimable. The Portfolio will accrue such taxes and reclaims as applicable, based upon its current interpretation of tax rules and regulations that exist in the markets in which it invests.
The Portfolio may be subject to taxation on realized capital gains, repatriation proceeds and other transaction-based taxes imposed by certain countries in which it invests. The Portfolio will accrue such taxes as applicable based upon its current interpretation of tax rules and regulations that exist in the market in which it invests. Capital gains taxes relating to positions still held are reflected as a liability in the Statement of
| 34 | MainStay VP PIMCO Real Return Portfolio |
Assets and Liabilities, as well as an adjustment to the Portfolio's net unrealized appreciation (depreciation). Taxes related to capital gains realized, if any, are reflected as part of net realized gain (loss) in the Statement of Operations. Changes in tax liabilities related to capital gains taxes on unrealized investment gains, if any, are reflected as part of the change in net unrealized appreciation (depreciation) on investments in the Statement of Operations. Transaction-based charges are generally assessed as a percentage of the transaction amount.
(D) Dividends and Distributions to Shareholders. Dividends and distributions are recorded on the ex-dividend date. The Portfolio intends to declare and pay dividends from net investment income and distributions from net realized capital and currency gains, if any, at least annually. Unless a shareholder elects otherwise, all dividends and distributions are reinvested at NAV in the same class of shares of the Portfolio. Dividends and distributions to shareholders are determined in accordance with federal income tax regulations and may differ from determinations using GAAP.
(E) Security Transactions and Investment Income. The Portfolio records security transactions on the trade date. Realized gains and losses on security transactions are determined using the identified cost method. Dividend income is recognized on the ex-dividend date, net of any foreign tax withheld at the source, and interest income is accrued as earned using the effective interest rate method. Distributions received from real estate investment trusts may be classified as dividends, capital gains and/or return of capital. Discounts and premiums on securities purchased for the Portfolio are accreted and amortized, respectively, on the effective interest rate method.
Investment income and realized and unrealized gains and losses on investments of the Portfolio are allocated pro rata to the separate classes of shares based upon their relative net assets on the date the income is earned or realized and unrealized gains and losses are incurred.
The Portfolio may place a debt security on non-accrual status and reduce related interest income by ceasing current accruals and writing off all or a portion of any interest receivables when the collection of all or a portion of such interest has become doubtful. A debt security is removed from non-accrual status when the issuer resumes interest payments or when collectability of interest is reasonably assured.
(F) Expenses. Expenses of the Fund are allocated to the individual Portfolios in proportion to the net assets of the respective Portfolios when the expenses are incurred, except where direct allocations of expenses can be made. Expenses (other than fees incurred under the distribution and service plans, further discussed in Note 3(B), which are charged directly to the Service Class shares) are allocated to separate classes of shares pro rata based upon their relative net assets on the date the expenses are incurred. The expenses borne by the Portfolio, including those of related parties to the Portfolio, are shown in the Statement of Operations.
Additionally, the Portfolio may invest in mutual funds, which are subject to management fees and other fees that may cause the costs of investing in
mutual funds to be greater than the costs of owning the underlying securities directly. These indirect expenses of mutual funds are not included in the amounts shown as expenses in the Statement of Operations or in the expense ratios included in the Financial Highlights.
(G) Use of Estimates. In preparing financial statements in conformity with GAAP, the Manager makes estimates and assumptions that affect the reported amounts and disclosures in the financial statements. Actual results could differ from those estimates and assumptions.
(H) Futures Contracts. A futures contract is an agreement to purchase or sell a specified quantity of an underlying instrument at a specified future date and price, or to make or receive a cash payment based on the value of a financial instrument (e.g., foreign currency, interest rate, security or securities index). The Portfolio is subject to risks such as market price risk and/or interest rate risk in the normal course of investing in these contracts. Upon entering into a futures contract, the Portfolio is required to pledge to the broker or futures commission merchant an amount of cash and/or U.S. government securities equal to a certain percentage of the collateral amount, known as the “initial margin.” During the period the futures contract is open, changes in the value of the contract are recognized as unrealized appreciation or depreciation by marking to market such contract on a daily basis to reflect the market value of the contract at the end of each day’s trading. The Portfolio agrees to receive from or pay to the broker or futures commission merchant an amount of cash equal to the daily fluctuation in the value of the contract. Such receipts or payments are known as “variation margin.” When the futures contract is closed, the Portfolio records a realized gain or loss equal to the difference between the proceeds from (or cost of) the closing transaction and the Portfolio's basis in the contract.
The use of futures contracts involves, to varying degrees, elements of market risk in excess of the amount recognized in the Statement of Assets and Liabilities. The contract or notional amounts and variation margin reflect the extent of the Portfolio's involvement in open futures positions. There are several risks associated with the use of futures contracts as hedging techniques. There can be no assurance that a liquid market will exist at the time when the Portfolio seeks to close out a futures contract. If no liquid market exists, the Portfolio would remain obligated to meet margin requirements until the position is closed. Futures contracts may involve a small initial investment relative to the risk assumed, which could result in losses greater than if the Portfolio did not invest in futures contracts. Futures contracts may be more volatile than direct investments in the instrument underlying the futures and may not correlate to the underlying instrument, causing a given hedge not to achieve its objectives. The Portfolio's activities in futures contracts have minimal counterparty risk as they are conducted through regulated exchanges that guarantee the futures against default by the counterparty. In the event of a bankruptcy or insolvency of a futures commission merchant that holds margin on behalf of the Portfolio, the Portfolio may not be entitled to the return of the entire margin owed to the Portfolio, potentially resulting in a loss. The Portfolio may invest in futures contracts
Notes to Financial Statements (Unaudited) (continued)
to seek enhanced returns or to reduce the risk of loss by hedging certain of its holdings. The Portfolio's investment in futures contracts and other derivatives may increase the volatility of the Portfolio's NAVs and may result in a loss to the Portfolio. Open futures contracts as of June 30, 2021 are shown in the Portfolio of Investments.
(I) Swap Contracts. The Portfolio may enter into credit default, interest rate, equity, index and currency exchange rate swap contracts (“swaps”). In a typical swap transaction, two parties agree to exchange the future returns (or differentials in rates of future returns) earned or realized at periodic intervals on a particular investment or instrument based on a notional principal amount. Generally, the Portfolio will enter into a swap on a net basis, which means that the two payment streams under the swap are netted, with the Portfolio receiving or paying (as the case may be) only the net amount of the two payment streams. Therefore, the Portfolio's current obligation under a swap generally will be equal to the net amount to be paid or received under the swap, based on the relative value of notional positions attributable to each counterparty to the swap. The payments may be adjusted for transaction costs, interest payments, the amount of interest paid on the investment or instrument or other factors. Collateral, in the form of cash or securities, may be required to be held in segregated accounts with the custodian bank or broker in accordance with the terms of the swap. Swap agreements are privately negotiated in the over the counter (“OTC”) market and may be executed in a multilateral or other trade facilities platform, such as a registered commodities exchange (“centrally cleared swaps”).
Certain standardized swaps, including certain credit default and interest rate swaps, are subject to mandatory clearing and exchange-trading, and more types of standardized swaps are expected to be subject to mandatory clearing and exchange-trading in the future. The counterparty risk for exchange-traded and cleared derivatives is expected to be generally lower than for uncleared derivatives, but cleared contracts are not risk-free. In a cleared derivative transaction, the Portfolio typically enters into the transaction with a financial institution counterparty, and performance of the transaction is effectively guaranteed by a central clearinghouse, thereby reducing or eliminating the Portfolio's exposure to the credit risk of its original counterparty. The Portfolio will be required to post specified levels of margin with the clearinghouse or at the instruction of the clearinghouse; the margin required by a clearinghouse may be greater than the margin the Portfolio would be required to post in an uncleared transaction. As of June 30, 2021, all swap positions outstanding are shown in the Portfolio of Investments.
Swaps are marked to market daily based upon quotations from pricing agents, brokers, or market makers and the change in value, if any, is recorded as unrealized appreciation or depreciation. Any payments made or received upon entering into a swap would be amortized or accreted over the life of the swap and recorded as a realized gain or loss. Early termination of a swap is recorded as a realized gain or loss. Daily changes in valuation of centrally cleared swaps, if any, are recorded as a receivable or payable for the change in value as appropriate on the Statement of Assets and Liabilities.
The Portfolio bears the risk of loss of the amount expected to be received under a swap in the event of the default or bankruptcy of the swap counterparty. The Portfolio may be able to eliminate its exposure under a swap either by assignment or other disposition, or by entering into an offsetting swap with the same party or a similar credit-worthy party. Swaps are not actively traded on financial markets. Entering into swaps involves elements of credit, market, and documentation risk in excess of the amounts recognized on the Statement of Assets and Liabilities. Such risks involve the possibilities that there will be no liquid market for these swaps, that the counterparty to the swaps may default on its obligation to perform or disagree as to the meaning of the contractual terms in the swaps and that there may be unfavorable changes in interest rates, the price of the index or the security underlying these transactions.
Inflation Swaps: Inflation swap agreements are contracts in which one party agrees to pay the cumulative percentage increase in a price index (the Consumer Price Index with respect to CPI swaps) over the term of the swap (with some lag on the inflation index), and the other pays a compounded fixed rate. Inflation swaps may be used to protect the net asset value, or NAV, of a Fund against an unexpected change in the rate of inflation measured by an inflation index since the value of these agreements is expected to increase if there are unexpected inflation increases.
Interest Rate Swaps : An interest rate swap is an agreement between two parties where one stream of future interest payments is exchanged for another based on a specified principal amount. Interest rate swaps often exchange a fixed payment for a floating payment that is linked to an interest rate (most often LIBOR). The Portfolio will typically use interest rate swaps to limit, or manage, its exposure to fluctuations in interest rates, or to obtain a marginally lower interest rate than it would have been able to get without the swap.
Credit Default Swaps : The Portfolio may enter into credit default swaps to simulate long and short bond positions or to take an active long or short position with respect to the likelihood of a default or credit event by the issuer of the underlying reference obligation. The types of reference obligations underlying the swaps that may be entered into by the Portfolio include debt obligations of a single issuer of corporate or sovereign debt, a basket of obligations of different issuers or a credit index. A credit index is an equally-weighted credit default swap index that is designed to track a representative segment of the credit default swap market (e.g., investment grade, high volatility, below investment grade or emerging markets) and provides an investor with exposure to specific "baskets" of issuers of certain debt instruments. Index credit default swaps have standardized terms including a fixed spread and standard maturity dates. The composition of the obligations within a particular index changes periodically. Credit default swaps involve one party, the protection buyer, making a stream of payments to another party, the protection seller, in exchange for the right to receive a contingent payment if there is a credit event related to the underlying reference obligation. In the event that the reference obligation matures prior to the termination date of the contract, a similar security will be substituted for the duration of the contract term. Credit events are defined under individual swap agreements and
| 36 | MainStay VP PIMCO Real Return Portfolio |
generally include bankruptcy, failure to pay, restructuring, repudiation/moratorium, obligation acceleration and obligation default. Selling protection effectively adds leverage to a portfolio up to the notional amount of the swap agreement. Potential liabilities under these contracts may be reduced by: the auction rates of the underlying reference obligations; upfront payments received at the inception of a swap; and net amounts received from credit default swaps purchased with the identical reference obligation. As of June 30, 2021, open swap agreements are shown in the Portfolio of Investments.
(J) Foreign Currency Forward Contracts. The Portfolio may enter into foreign currency forward contracts, which are agreements to buy or sell foreign currencies on a specified future date at a specified rate. The Portfolio is subject to foreign currency exchange rate risk in the normal course of investing in these transactions. During the period the forward contract is open, changes in the value of the contract are recognized as unrealized appreciation or depreciation by marking to market such contract on a daily basis to reflect the market value of the contract at the end of each day’s trading. Cash movement occurs on the settlement date. When the forward contract is closed, the Portfolio records a realized gain or loss equal to the difference between the proceeds from (or cost of) the closing transaction and the Portfolio's basis in the contract. The Portfolio may purchase and sell foreign currency forward contracts for purposes of seeking to enhance portfolio returns and manage portfolio risk more efficiently. Foreign currency forward contracts may also be used to gain exposure to a particular currency or to hedge against the risk of loss due to changing currency exchange rates. Foreign currency forward contracts to purchase or sell a foreign currency may also be used in anticipation of future purchases or sales of securities denominated in foreign currency, even if the specific investments have not yet been selected.
The use of foreign currency forward contracts involves, to varying degrees, elements of risk in excess of the amount recognized in the Statement of Assets and Liabilities, including counterparty risk, market risk and illiquidity risk. Counterparty risk is heightened for these instruments because foreign currency forward contracts are not exchange-traded and therefore no clearinghouse or exchange stands ready to meet the obligations under such contracts. Thus, the Portfolio faces the risk that its counterparties under such contracts may not perform their obligations. Market risk is the risk that the value of a foreign currency forward contract will depreciate due to unfavorable changes in exchange rates. Illiquidity risk arises because the secondary market for foreign currency forward contracts may have less liquidity relative to markets for other securities and financial instruments. Risks also arise from the possible movements in the foreign exchange rates underlying these instruments. While the Portfolio may enter into forward contracts to reduce currency exchange risks, changes in currency exchange rates may result in poorer overall performance for the Portfolio than if it had not engaged in such transactions. Exchange rate movements can be large, depending on the currency, and can last for extended periods of time, affecting the value of the Portfolio's assets. Moreover, there may be an imperfect correlation between the Portfolio's holdings of securities denominated in a particular currency and forward contracts entered into
by the Portfolio. Such imperfect correlation may prevent the Portfolio from achieving the intended hedge or expose the Portfolio to the risk of currency exchange loss. The unrealized appreciation (depreciation) on forward contracts also reflects the Portfolio's exposure at the valuation date to credit loss in the event of a counterparty’s failure to perform its obligations. Open foreign currency forward contracts as of June 30, 2021, are shown in the Portfolio of Investments.
(K) Foreign Currency Transactions. The Portfolio's books and records are maintained in U.S. dollars. Prices of securities denominated in foreign currency amounts are translated into U.S. dollars at the mean between the buying and selling rates last quoted by any major U.S. bank at the following dates:
(i) market value of investment securities, other assets and liabilities— at the valuation date; and
(ii) purchases and sales of investment securities, income and expenses—at the date of such transactions.
The assets and liabilities that are denominated in foreign currency amounts are presented at the exchange rates and market values at the close of the period. The realized and unrealized changes in net assets arising from fluctuations in exchange rates and market prices of securities are not separately presented.
Net realized gain (loss) on foreign currency transactions represents net currency gains or losses realized as a result of differences between the amounts of securities sale proceeds or purchase cost, dividends, interest and withholding taxes as recorded on the Portfolio's books, and the U.S. dollar equivalent amount actually received or paid. Net currency gains or losses from valuing such foreign currency denominated assets and liabilities, other than investments at valuation date exchange rates, are reflected in unrealized foreign exchange gains or losses.
(L) Dollar Rolls. The Portfolio may enter into dollar roll transactions in which it sells mortgage-backed securities ("MBS") from its portfolio to a counterparty from whom it simultaneously agrees to buy a similar security on a delayed delivery basis. The Portfolio generally transfers MBS where the MBS are "to be announced," therefore, the Portfolio accounts for these transactions as purchases and sales.
When accounted for as purchase and sales, the securities sold in connection with the dollar rolls are removed from the portfolio and a realized gain or loss is recognized. The securities the Portfolio has agreed to acquire are included at market value in the Portfolio of Investments and liabilities for such purchase commitments are included as payables for investments purchased. During the roll period, the Portfolio foregoes principal and interest paid on the securities. The Portfolio is compensated by the difference between the current sales price and the forward price for the future as well as by the earnings on the cash proceeds of the initial sale. Dollar rolls may be renewed without physical delivery of the securities subject to the contract. The Portfolio maintains liquid assets from its portfolio having a value not less than the repurchase price, including accrued interest. Dollar roll transactions involve certain risks,
Notes to Financial Statements (Unaudited) (continued)
including the risk that the securities returned to the Portfolio at the end of the roll period, while substantially similar, could be inferior to what was initially sold to the counterparty.
(M) Options Contracts. The Portfolio may write call and put options on securities and financial derivative instruments it owns or in which it may invest. Writing put options tends to increase the Portfolio’s exposure to the underlying instrument. Writing call options tends to decrease the Portfolio’s exposure to the underlying instrument. When the Portfolio writes a call or put, an amount equal to the premium received is recorded as a liability and subsequently marked to market to reflect the current value of the option written. These liabilities are reflected as written options outstanding on the Statement of Assets and Liabilities. Premiums received from writing options which expire are treated as realized gains. Premiums received from writing options which are exercised or closed are added to the proceeds or offset against amounts paid on the underlying futures, swaps, security or currency transaction to determine the realized gain or loss. Certain options may be written with premiums to be determined on a future date. The Portfolio, as a writer of an option, has no control over whether the underlying instrument may be sold (call) or purchased (put) and as a result bears the market risk of an unfavorable change in the price of the instrument underlying the written option. There is the risk the Portfolio may not be able to enter into a closing transaction because of an illiquid market. Writing call options involves risk of loss in excess of the related amounts reflected in the Statement of Assets and Liabilities.
The Portfolio may also purchase put and call options. Purchasing call options tends to increase the Portfolio’s exposure to the underlying instrument. Alternatively, purchasing put options tends to decrease the Portfolio’s exposure to the underlying instrument. The Portfolio pays a premium which is included on the Portfolio’s Statement of Assets and Liabilities as an investment and subsequently marked to market to reflect the current value of the option. Premiums paid for purchasing options which expire are treated as realized losses. Certain options may be purchased with premiums to be determined on a future date. The premiums for these options are based upon implied volatility parameters at specified terms. The risk associated with purchasing put and call options is limited to the premium paid. Premiums paid for purchasing options which are exercised or closed are added to the amounts paid or offset against the proceeds on the underlying investment transaction to determine the realized gain or loss when the underlying transaction is sold.
The Portfolio may purchase or write foreign currency options. Purchasing a foreign currency option gives the Portfolio the right, but not the obligation, to buy or sell a specified amount of the currency at a specified rate of exchange that may be exercised on or before the option’s expiration date. Writing a foreign currency option obligates the Portfolio to buy or sell a specified amount of foreign currency at a specified rate of exchange, and such option may be exercised on or before the option’s expiration date in exchange for an option premium. These options may be used as a short or long hedge against possible variations in foreign
exchange rates or to gain exposure to foreign currencies. The risks associated with writing a foreign currency put option include the risk that the Portfolio may incur a loss if the value of the referenced foreign currency decreases and the option is exercised. The risks associated with writing a foreign currency call option include the risk that if the value of the referenced foreign currency increases, and if the option is exercised, the Portfolio must either acquire the referenced foreign currency at the then higher price for delivery or, if the Portfolio already owns the referenced foreign currency, forego the opportunity for profit with respect to such foreign currency. As of June 30, 2021, all open options are shown in the Portfolio of Investments.
(N) Sale-Buybacks. The Portfolio may enter into financing transactions referred to as ‘sale-buybacks’. A sale-buyback transaction consists of a sale of a security by the Portfolio to a financial institution, the counterparty, with a simultaneous agreement to repurchase the same or substantially the same security at an agreed-upon price and date. The Portfolio is not entitled to receive principal and interest payments, if any, made on the security sold to the counterparty during the term of the agreement. The agreed-upon proceeds for securities to be repurchased by the Portfolio are reflected as a liability on the Statement of Assets and Liabilities. The Portfolio will recognize net income represented by the price differential between the price received for the transferred security and the agreed-upon repurchase price. This is commonly referred to as the “price drop”. A price drop consists of (i) the foregone interest and inflationary income adjustments, if any, the Portfolio would have otherwise received had the security not been sold and (ii) the negotiated financing terms between the Portfolio and counterparty. Foregone interest and inflationary income adjustments, if any, are recorded as components of interest income on the Statement of Operations. Interest payments based upon negotiated financing terms made by the Portfolio to counterparties are recorded as a component of interest expense on the Statement of Operations. In periods of increased demand for the security, the Portfolio may receive a fee for use of the security by the counterparty, which may result in interest income to the Portfolio. The Portfolio will segregate cash or liquid assets, enter into off-setting transactions or use other measures permitted by applicable laws to “cover” the Portfolio’s current obligations.
(O) Delayed Delivery Transactions. The Portfolio may purchase or sell securities on a delayed delivery basis. These transactions involve a commitment by the Portfolio to purchase or sell securities for a predetermined price or yield, with payment and delivery taking place beyond the customary settlement period. When delayed delivery purchases are outstanding, the Portfolio will designate liquid assets in an amount sufficient to meet the purchase price. When purchasing a security on a delayed delivery basis, the Portfolio assumes the rights and risks of ownership of the security, including the risk of price and yield fluctuations, and takes such fluctuations into account when determining its NAV. The Portfolio may dispose of or renegotiate a delayed delivery transaction after it is entered into, and may sell delayed delivery securities before they are delivered, which may result in a realized gain or loss. When the Portfolio has sold a security it owns on a delayed delivery basis, the Portfolio does not participate in future gains and losses with respect to
| 38 | MainStay VP PIMCO Real Return Portfolio |
the security. As of June 30, 2021, delayed delivery transactions are shown in the Portfolio of Investments.
(P) Treasury Inflation-Protected Securities. The Portfolio invests in Treasury Inflation-Protected Securities (“TIPS”) which are specially structured bonds in which the principal amount is adjusted to keep pace with inflation. The inflation (deflation) adjustment is applied to the principal of each bond on a monthly basis and is accounted for as interest income on the Statement of Operations. TIPS are subject to interest rate risk. As of June 30, 2021, TIPS are shown in the Portfolio of Investments.
(Q) Debt Securities Risk. The ability of issuers of debt securities held by the Portfolio to meet their obligations may be affected by, among other things, economic or political developments in a specific country, industry or region. Debt securities are also subject to the risks associated with changes in interest rates.
The Portfolio primarily invests in high yield debt securities (commonly referred to as “junk bonds”), which are considered speculative because they present a greater risk of loss, including default, than higher rated debt securities. These securities pay investors a premium—a higher interest rate or yield than investment grade debt securities—because of the increased risk of loss. These securities can also be subject to greater price volatility. In times of unusual or adverse market, economic or political conditions, these securities may experience higher than normal default rates.
Investments in the Portfolio are not guaranteed, even though some of the Portfolio’s underlying investments are guaranteed by the U.S. government or its agencies or instrumentalities. The principal risk of mortgage-related and asset-backed securities is that the underlying debt may be prepaid ahead of schedule, if interest rates fall, thereby reducing the value of the Portfolio’s investment. If interest rates rise, less of the debt may be prepaid and the Portfolio may lose money because the Portfolio may be unable to invest in higher yielding assets. The Portfolio is subject to interest-rate risk and can lose principal value when interest rates rise. Bonds are also subject to credit risk, in which the bond issuer may fail to pay interest and principal in a timely manner.
The Portfolio may invest in foreign debt securities, which carry certain risks that are in addition to the usual risks inherent in domestic debt securities. These risks include those resulting from currency fluctuations, future adverse political or economic developments and possible imposition of currency exchange blockages or other foreign governmental laws or restrictions. These risks are likely to be greater in emerging markets than in developed markets. The ability of issuers of debt securities held by the Portfolio to meet their obligations may be affected by, among other things, economic or political developments in a specific country, industry or region.
(R) Counterparty Credit Risk. In order to better define its contractual rights and to secure rights that will help the Portfolio mitigate its counterparty risk, the Portfolio may enter into an International Swaps and Derivatives Association, Inc. Master Agreement (“ISDA Master Agreement”) or similar agreement with its counterparties. An ISDA Master
Agreement is a bilateral agreement between the Portfolio and a counterparty that governs certain OTC derivatives and typically contains collateral posting terms and netting provisions. Under an ISDA Master Agreement, the Portfolio may, under certain circumstances, offset with the counterparty certain derivative financial instruments’ payables and/ or receivables with collateral held and/or posted and create one single net payment. The provisions of the ISDA Master Agreement typically permit a single net payment in the event of default including the bankruptcy or insolvency of the counterparty. Bankruptcy or insolvency laws of a particular jurisdiction may restrict or prohibit the right of offset in bankruptcy, insolvency or other events. In addition, certain ISDA Master Agreements may contain provisions for early termination of OTC derivative transactions in the event the net assets of the Portfolio decline below specific levels or if the Portfolio fails to meet the terms of its ISDA Master Agreements. The result would cause the Portfolio to accelerate payment of any net liability owed to the counterparty.
For financial reporting purposes, the Portfolio does not offset derivative assets and derivative liabilities that are subject to netting arrangements, if any, in the Statement of Assets and Liabilities.
(S) LIBOR Replacement Risk. The Portfolio may invest in certain debt securities, derivatives or other financial instruments that utilize the London Interbank Offered Rate ("LIBOR"), as a “benchmark” or “reference rate” for various interest rate calculations. The United Kingdom Financial Conduct Authority, which regulates LIBOR, announced that after 2021 it will cease its active encouragement of banks to provide the quotations needed to sustain LIBOR. However, it is possible that certain LIBOR tenors may continue beyond 2021 and the most widely used LIBOR tenors may continue until mid-2023. As a result, it is anticipated that LIBOR will be discontinued or will no longer be sufficiently robust to be representative of its underlying market around that time. Although financial regulators and industry working groups have suggested alternative reference rates, such as European Interbank Offer Rate (“EURIBOR”), Sterling Overnight Interbank Average Rate (“SONIA”) and Secured Overnight Financing Rate (“SOFR”), there are challenges to converting certain contracts and transactions to a new benchmark and neither the full effects of the transition process nor its ultimate outcome is known. New York Life Investments is currently working to assess exposure and will modify contracts as necessary.
The elimination of LIBOR or changes to other reference rates or any other changes or reforms to the determination or supervision of reference rates could have an adverse impact on the market for, or value of, any securities or payments linked to those reference rates, which may adversely affect the Portfolio's performance and/or net asset value. Uncertainty and risk also remain regarding the willingness and ability of issuers and lenders to include revised provisions in new and existing contracts or instruments. Consequently, the transition away from LIBOR to other reference rates may lead to increased volatility and illiquidity in markets that are tied to LIBOR, fluctuations in values of LIBOR-related investments or investments in issuers that utilize LIBOR, increased difficulty in borrowing or refinancing and diminished effectiveness of
Notes to Financial Statements (Unaudited) (continued)
hedging strategies, adversely affecting the Portfolio's performance. Furthermore, the risks associated with the expected discontinuation of LIBOR and transition may be exacerbated if the work necessary to effect an orderly transition to an alternative reference rate is not completed in a timely manner. Because the usefulness of LIBOR as a benchmark could deteriorate during the transition period, these effects could occur prior to the end of 2021 with respect to certain LIBOR tenors or mid-2023 for the remaining LIBOR tenors.
(T) Indemnifications. Under the Fund’s organizational documents, its officers and trustees are indemnified against certain liabilities that may arise out of performance of their duties to the Fund. Additionally, in the normal course of business, the Portfolio enters into contracts with third-party service providers that contain a variety of representations and warranties and that may provide general indemnifications. The Portfolio's maximum exposure under these arrangements is unknown, as this would involve future claims that may be made against the Portfolio that have not yet occurred. The Manager believes that the risk of loss in connection with these potential indemnification obligations is remote. However, there can be no assurance that material liabilities related to such obligations will not arise in the future, which could adversely impact the Portfolio.
(U) Quantitative Disclosure of Derivative Holdings. The following tables show additional disclosures related to the Portfolio's derivative and hedging activities, including how such activities are accounted for and their effect on the Portfolio's financial positions, performance and cash flows.
The Portfolio wrote or purchased options to enhance returns or to hedge an existing position or future investment.
The Portfolio entered into futures contracts in order to manage its exposure to the securities markets or to movements in interest rates and currency values.
The Portfolio utilizes credit default, interest rate and inflation swap agreements to manage its exposure to credit, interest rate and inflation risk.
The Portfolio entered into foreign currency forward contracts to to hedge the currency exposure associated with some or all of the Portfolio's securities or as a part of an investment strategy.
Fair value of derivative instruments as of June 30, 2021:
| Asset Derivatives | Foreign
Exchange
Contracts
Risk | Credit
Contracts
Risk | Interest
Rate
Contracts
Risk | Total |
| Purchased Options - Investments in securities, at value | $ — | $ — | $ 224,462 | $ 224,462 |
| Futures Contracts - Net Assets—Net unrealized appreciation on futures contracts (a) | — | — | 163,357 | 163,357 |
| Forward Contracts - Unrealized appreciation on foreign currency forward contracts | 1,678,598 | — | — | 1,678,598 |
| Inflation Rate Contracts - Unrealized appreciation (b) | — | — | 645,057 | 645,057 |
| Credit Default Swaps (b) | — | 3,904 | — | 3,904 |
| Total Fair Value | $1,678,598 | $3,904 | $1,032,876 | $2,715,378 |
| (a) | Includes cumulative appreciation (depreciation) of futures contracts as reported in the Portfolio of Investments. Only current day’s variation margin is reported within the Statement of Assets and Liabilities. |
| (b) | Includes cumulative appreciation (depreciation) of centrally cleared swap agreements as reported in the Portfolio of Investments. Only the current day’s variation margin is reported within the Statement of Assets and Liabilities. |
| Liability Derivatives | Foreign
Exchange
Contracts
Risk | Interest
Rate
Contracts
Risk | Total |
| Written Options - Investments in written options, at value | $ — | $ (211,397) | $ (211,397) |
| Futures Contracts - Net Assets—Net unrealized depreciation on futures contracts (a) | — | (1,711,124) | (1,711,124) |
| Centrally Cleared Swap Contracts - Net Assets—Net unrealized depreciation on swap contracts (b) | — | (162,326) | (162,326) |
| Forward Contracts - Unrealized depreciation on foreign currency forward contracts | (195,517) | — | (195,517) |
| Inflation Rate Contracts - Unrealized appreciation depreciation (b) | — | (1,283,443) | (1,283,443) |
| Total Fair Value | $(195,517) | $(3,368,290) | $(3,563,807) |
| (a) | Includes cumulative appreciation (depreciation) of futures contracts as reported in the Portfolio of Investments. Only current day’s variation margin is reported within the Statement of Assets and Liabilities. |
| (b) | Includes cumulative appreciation (depreciation) of centrally cleared swap agreements as reported in the Portfolio of Investments. Only the current day’s variation margin is reported within the Statement of Assets and Liabilities. |
| 40 | MainStay VP PIMCO Real Return Portfolio |
The effect of derivative instruments on the Statement of Operations for the six-month period ended June 30, 2021:
| Net Realized Gain (Loss) from: | Foreign
Exchange
Contracts
Risk | Credit
Contracts
Risk | Interest
Rate
Contracts
Risk | Total |
| Purchased Options | $ — | $ — | $ (105,272) | $ (105,272) |
| Written Options | — | — | 136,136 | 136,136 |
| Futures Contracts | — | — | 3,778,795 | 3,778,795 |
| Swap Contracts | — | (191,813) | 42,134 | (149,679) |
| Forward Contracts | 1,181,575 | — | — | 1,181,575 |
| Total Net Realized Gain (Loss) | $1,181,575 | $(191,813) | $3,851,793 | $4,841,555 |
| Net Change in Unrealized Appreciation (Depreciation) | Foreign
Exchange
Contracts
Risk | Credit
Contracts
Risk | Interest
Rate
Contracts
Risk | Total |
| Purchased Options | $ — | $ — | $ 132,713 | $ 132,713 |
| Written Options | — | — | 13,653 | 13,653 |
| Futures Contracts | — | — | (1,594,056) | (1,594,056) |
| Swap Contracts | — | 126,549 | (1,114,130) | (987,581) |
| Forward Contracts | 2,533,799 | — | — | 2,533,799 |
| Total Net Change in Unrealized Appreciation (Depreciation) | $2,533,799 | $126,549 | $(2,561,820) | $ 98,528 |
| Average Notional Amount | Total |
| Purchased Options | $ 666,667 |
| Written Options | $ (6,673,453) |
| Purchased Swaptions | $ 18,595,908 |
| Written Swaptions | $ (55,209,073) |
| Written Inflation—Capped Options | $ (300,000) |
| Futures Contracts Long | $ 122,596,955 |
| Futures Contracts Short | $(242,071,270) |
| Swap Contracts Long | $ 76,784,926 |
| Forward Contracts Long | $ 14,575,434 |
| Forward Contracts Short | $ (95,497,622) |
(V) Borrowings and other financing transactions summary
The following is a summary by counterparty of the market value of Borrowings and Other Financing Transactions and collateral (received)/pledged as of June 30, 2021:
| Counterparty | Payable for
Sale-Buyback
Transactions | Total
Borrowings and
Other Financing
Transactions | Collateral
(Received)/
Pledged | Net
Exposure (a) |
| Master Securities Forward Transaction Agreement | | | | |
| Barclays Capital Inc. | $ (45,063,004) | $ (45,063,004) | $ 45,063,004 | $— |
| BofA Securities, Inc. | (32,687,085) | (32,687,085) | 32,687,085 | — |
| BNP Paribas S.A. | (274,778,186) | (274,778,186) | 274,778,186 | — |
| Morgan Stanley & Co. LLC. | (60,262,277) | (60,262,277) | 60,262,277 | — |
| Total Borrowings and Other Financing Transactions | $(412,790,552) | | | |
| (a) | Net Exposure represents the net receivable/(payable) that would be due from/to the counterparty in the event of default. Exposure from borrowings and other financing transactions can only be netted across transactions governed under the same master agreement with the same legal entity. |
Notes to Financial Statements (Unaudited) (continued)
Certain Transfers Accounted for as Secured Borrowings
Remaining Contractual Maturity of the Agreements
| | Overnight and
Continuous | Up to 30 days | 31-90 days | Greater than
90 days | Total |
| Sale-Buyback Transactions | | | | | |
| US Treasury Obligations | $— | $412,790,552 | $— | $— | $412,790,552 |
| Total Borrowings | $— | $412,790,552 | $— | $— | $412,790,552 |
Gross amount of recognized liabilities for reverse repurchase agreements and
sale-buyback financing transactions | | | | $412,790,552 |
Note 3–Fees and Related Party Transactions
(A) Manager and Subadvisor. New York Life Investments, a registered investment adviser and an indirect, wholly-owned subsidiary of New York Life, serves as the Portfolio’s Manager pursuant to an Amended and Restated Management Agreement (“Management Agreement”). The Manager provides offices, conducts clerical, recordkeeping and bookkeeping services, and keeps most of the financial and accounting records required to be maintained by the Portfolio. Except for the portion of salaries and expenses that are the responsibility of the Portfolio, the Manager pays the salaries and expenses of all personnel affiliated with the Portfolio and certain operational expenses of the Portfolio. The Portfolio reimburses New York Life Investments in an amount equal to the portion of the compensation of the Chief Compliance Officer attributable to the Portfolio. Pacific Investment Management Company LLC (“ PIMCO” or the “Subadvisor”), a registered investment adviser, serves as Subadvisor to the Portfolio and is responsible for the day-to-day portfolio management of the Portfolio. Pursuant to the terms of a Subadvisory Agreement (“Subadvisory Agreement”) between New York Life Investments and PIMCO, New York Life Investments pays for the services of the Subadvisor.
Pursuant to the Management Agreement, the Fund pays the Manager, on behalf of the Portfolio, a monthly fee for the services performed and the facilities furnished at an annual percentage of the Portfolio’s average daily net assets of 0.50% on all assets. During the six-month period ended June 30, 2021, the effective management fee rate (exclusive of any applicable waivers/reimbursements) was 0.50%.
New York Life Investments has contractually agreed to waive fees and/or reimburse expenses so that the Total Annual Portfolio Operating Expenses (excluding taxes, interest, litigation, extraordinary expenses, brokerage and other transaction expenses relating to the purchase or sale of portfolio investments and acquired (underlying) portfolio/fund fees and expenses) of Initial Class shares and Service Class shares do not exceed 0.53% and 0.78%, respectively, of the Portfolio's average daily net assets. This agreement will remain in effect until May 1, 2022, and shall renew automatically for one-year terms unless New York Life Investments
provides written notice of termination prior to the start of the next term or upon approval of the Board.
During the six-month period ended June 30, 2021, New York Life Investments earned fees from the Portfolio in the amount of $1,227,142 and waived fees and/or reimbursed expenses in the amount of $92,686 and paid the Subadvisor fees in the amount of $613,527.
JPMorgan provides sub-administration and sub-accounting services to the Portfolio pursuant to an agreement with New York Life Investments. These services include calculating the daily NAVs of the Portfolio, maintaining the general ledger and sub-ledger accounts for the calculation of the Portfolio's NAVs, and assisting New York Life Investments in conducting various aspects of the Portfolio's administrative operations. For providing these services to the Portfolio, JPMorgan is compensated by New York Life Investments.
Prior to February 22, 2021, these services were provided by State Street.
Pursuant to an agreement between the Fund and New York Life Investments, New York Life Investments is responsible for providing or procuring certain regulatory reporting services for the Portfolio. The Portfolio will reimburse New York Life Investments for the actual costs incurred by New York Life Investments in connection with providing or procuring these services for the Portfolio.
(B) Distribution and Service Fees. The Fund, on behalf of the Portfolio, has entered into a distribution agreement with NYLIFE Distributors LLC (the “Distributor”), an affiliate of New York Life Investments. The Portfolio has adopted a distribution plan (the “Plan”) in accordance with the provisions of Rule 12b-1 under the 1940 Act. Under the Plan, the Distributor has agreed to provide, through its affiliates or independent third parties, various distribution-related, shareholder and administrative support services to the Service Class shareholders. For its services, the Distributor is entitled to a combined distribution and service fee accrued daily and paid monthly at an annual rate of 0.25% of the average daily net assets attributable to the Service Class shares of the Portfolio.
| 42 | MainStay VP PIMCO Real Return Portfolio |
(C) Investments in Affiliates (in 000’s). During the six-month period ended June 30, 2021, purchases and sales transactions, income earned from investments and shares held of investment companies managed by New York Life Investments or its affiliates were as follows:
| Affiliated Investment Companies | Value,
Beginning
of Period | Purchases
at Cost | Proceeds
from
Sales | Net
Realized
Gain/(Loss)
on Sales | Change in
Unrealized
Appreciation/
(Depreciation) | Value,
End of
Period | Dividend
Income | Other
Distributions | Shares
End of
Period |
| MainStay U.S. Government Liquidity Fund | $ 1,440 | $ 115,525 | $ (113,595) | $ — | $ — | $ 3,370 | $ —(a) | $ — | 3,370 |
Note 4-Federal Income Tax
As of June 30, 2021, the cost and unrealized appreciation (depreciation) of the Portfolio’s investment portfolio, including applicable derivative contracts and other financial instruments, as determined on a federal income tax basis, were as follows:
| | Federal Tax
Cost | Gross
Unrealized
Appreciation | Gross
Unrealized
(Depreciation) | Net
Unrealized
Appreciation/
(Depreciation) |
| Investments in Securities | $662,394,645 | $43,741,607 | $(3,318,356) | $40,423,251 |
As of December 31, 2020, for federal income tax purposes, capital loss carryforwards of $74,637,686, as shown in the table below, were available to the extent provided by the regulations to offset future realized gains of the Portfolio. Accordingly, no capital gains distributions are expected to be paid to shareholders until net gains have been realized in excess of such amounts.
Capital Loss
Available Through | Short-Term
Capital Loss
Amounts (000’s) | Long-Term
Capital Loss
Amounts (000’s) |
| Unlimited | $20,380 | $54,258 |
During the year ended December 31, 2020, the tax character of distributions paid as reflected in the Statements of Changes in Net Assets was as follows:
| | 2020 |
| Distributions paid from: | |
| Ordinary Income | $8,259,563 |
Note 5–Custodian
JPMorgan is the custodian of cash and securities held by the Portfolio. Custodial fees are charged to the Portfolio based on the Portfolio's net assets and/or the market value of securities held by the Portfolio and the number of certain transactions incurred by the Portfolio.
Prior to February 22, 2021, these services were provided by State Street. The services provided by State Street were a direct expense of the Portfolio and are included in the Statement of Operations as Custodian fees which totaled $17,058 for the period January 1, 2021 through February 21, 2021.
Note 6–Line of Credit
The Portfolio and certain other funds managed by New York Life Investments maintain a line of credit with a syndicate of banks in order to secure a source of funds for temporary purposes to meet unanticipated or excessive redemption requests.
Effective July 27, 2021, under the credit agreement (the “Credit Agreement”), the aggregate commitment amount is $600,000,000 with an additional uncommitted amount of $100,000,000. The commitment fee is an annual rate of 0.15% of the average commitment amount payable quarterly, regardless of usage, to JPMorgan, who serves as the agent to the syndicate. The commitment fee is allocated among the Portfolio and certain other funds managed by New York Life Investments based upon their respective net assets and other factors. Interest on any revolving credit loan is charged based upon the Federal Funds Rate or the one-month London Interbank Offered Rate ("LIBOR"), whichever is higher. The Credit Agreement expires on July 26, 2022, although the Portfolio, certain other funds managed by New York Life Investments and the syndicate of banks may renew the Credit Agreement for an additional year on the same or different terms or enter into a credit agreement with a different syndicate of banks. Prior to July 27, 2021, the aggregate commitment amount and the commitment fee were the same as those under the current Credit Agreement. During the six-month period ended June 30, 2021, there were no borrowings made or outstanding with respect to the Portfolio under the Credit Agreement.
Note 7–Interfund Lending Program
Pursuant to an exemptive order issued by the SEC, the Portfolio, along with certain other funds managed by New York Life Investments, may participate in an interfund lending program. The interfund lending program provides an alternative credit facility that permits the Portfolio and certain other funds managed by New York Life Investments to lend or borrow money for temporary purposes directly to or from one another, subject to the conditions of the exemptive order. During the six-month period ended June 30, 2021, there were no interfund loans made or outstanding with respect to the Portfolio.
Note 8–Purchases and Sales of Securities (in 000’s)
During the six-month period ended June 30, 2021, purchases and sales of U.S. government securities were $111,724 and $153,650, respectively. Purchases and sales of securities, other than U.S.
Notes to Financial Statements (Unaudited) (continued)
government securities and short-term securities, were $366,441 and $325,418 respectively.
Note 9–Capital Share Transactions
Transactions in capital shares for the six-month period ended June 30, 2021 and the year ended December 31, 2020, were as follows:
| Initial Class | Shares | Amount |
| Period ended June 30, 2021: | | |
| Shares sold | 6,617,580 | $ 63,177,590 |
| Shares redeemed | (147,200) | (1,401,034) |
| Net increase (decrease) | 6,470,380 | $ 61,776,556 |
| Year ended December 31, 2020: | | |
| Shares sold | 362,350 | $ 3,332,081 |
| Shares issued to shareholders in reinvestment of distributions | 107,581 | 998,898 |
| Shares redeemed | (993,417) | (9,122,960) |
| Net increase (decrease) | (523,486) | $ (4,791,981) |
| |
| Service Class | Shares | Amount |
| Period ended June 30, 2021: | | |
| Shares sold | 2,278,270 | $ 21,456,223 |
| Shares redeemed | (3,091,268) | (29,209,303) |
| Net increase (decrease) | (812,998) | $ (7,753,080) |
| Year ended December 31, 2020: | | |
| Shares sold | 12,408,077 | $113,507,422 |
| Shares issued to shareholders in reinvestment of distributions | 783,454 | 7,260,665 |
| Shares redeemed | (7,132,197) | (64,185,409) |
| Net increase (decrease) | 6,059,334 | $ 56,582,678 |
Note 10–Other Matters
An outbreak of COVID-19, first detected in December 2019, has developed into a global pandemic and has resulted in travel restrictions, closure of international borders, certain businesses and securities markets, restrictions on securities trading activities, prolonged quarantines, supply chain disruptions, and lower consumer demand, as well as general concern and uncertainty. The continued impact of COVID-19 and related new variants is uncertain and could further adversely affect the global economy, national economies, individual issuers and capital markets in unforeseeable ways and result in a substantial and extended economic downturn. Developments that disrupt global economies and financial markets, such as COVID-19, may magnify factors that affect the Portfolio's performance.
Note 11–Subsequent Events
In connection with the preparation of the financial statements of the Portfolio as of and for the six-month period ended June 30, 2021, events and transactions subsequent to June 30, 2021, through the date the financial statements were issued have been evaluated by the Manager for
possible adjustment and/or disclosure. No subsequent events requiring financial statement adjustment or disclosure have been identified.
| 44 | MainStay VP PIMCO Real Return Portfolio |
Discussion of the Operation and Effectiveness of the Portfolio's Liquidity Risk Management Program (Unaudited)
In compliance with Rule 22e-4 under the Investment Company Act of 1940, as amended (the “Liquidity Rule”), the Portfolio has adopted and implemented a liquidity risk management program (the “Program”), which New York Life Investment Management LLC believes is reasonably designed to assess and manage the Portfolio's liquidity risk (the risk that the Portfolio could not meet requests to redeem shares issued by the Portfolio without significant dilution of remaining investors’ interests in the Portfolio). The Board of Trustees of MainStay VP Funds Trust (the "Board") designated New York Life Investment Management LLC as administrator of the Program (the “Administrator”). The Administrator has established a Liquidity Risk Management Committee to assist the Administrator in the implementation and day-to-day administration of the Program and to otherwise support the Administrator in fulfilling its responsibilities under the Program.
At a meeting of the Board held on March 8, 2021, the Administrator provided the Board with a written report addressing the Program’s operation and assessing its adequacy and effectiveness of implementation for the period from January 1, 2020 through December 31, 2020 (the "Review Period"), as required under the Liquidity Rule. The report noted that the Administrator concluded that (i) the Program operated effectively to assess and manage the Portfolio's liquidity risk, (ii) the Program has been adequately and effectively implemented to monitor and, as applicable, respond to the Portfolio's liquidity developments and (iii) the Portfolio's investment strategy continues to be appropriate for an open-end fund. In addition, the report discussed notable events that impacted liquidity risk during the Review Period, including the COVID-19 pandemic and the resulting economic shutdown.
In accordance with the Program, the Portfolio's liquidity risk is assessed no less frequently than annually taking into consideration certain factors, as applicable, such as (i) investment strategy and liquidity of portfolio investments, (ii) short-term and long-term cash flow projections and (iii) holdings of cash and cash equivalents, as well as borrowing arrangements and other funding sources. Certain factors are considered under both normal and reasonably foreseeable stressed conditions.
Each Portfolio portfolio investment is classified into one of four liquidity categories. The classification is based on a determination of the number of days it is reasonably expected to take to convert the investment into cash, or sell or dispose of the investment, in current market conditions without significantly changing the market value of the investment. The Administrator has delegated liquidity classification determinations to the Portfolio’s subadvisor, subject to appropriate oversight by the Administrator, and classification determinations are made by taking into account the Portfolio's reasonably anticipated trade size, various market, trading and investment-specific considerations, as well as market depth, and, in certain cases, third-party vendor data.
The Liquidity Rule requires portfolios that do not primarily hold assets that are highly liquid investments to adopt a minimum amount of net assets that must be invested in highly liquid investments that are assets (an “HLIM”). In addition, the Liquidity Rule limits a portfolio's investments in illiquid investments. Specifically, the Liquidity Rule prohibits acquisition of illiquid investments if doing so would result in a portfolio holding more than 15% of its net assets in illiquid investments that are assets. The Program includes provisions reasonably designed to determine, periodically review and comply with the HLIM requirement, as applicable, and to comply with the 15% limit on illiquid investments.
There can be no assurance that the Program will achieve its objectives under all circumstances in the future. Please refer to the Portfolio's prospectus for more information regarding the Portfolio's exposure to liquidity risk and other risks to which it may be subject.
Proxy Voting Record
The Portfolio is required to file with the SEC its proxy voting records for the 12-month period ending June 30 on Form N-PX. The Portfolio's most recent Form N-PX or proxy voting record is available free of charge upon request (i) by calling 800-598-2019; (ii) by visiting New York Life Investments’ website at https://www.nylinvestments.com/mainstay/
products-and-performance/mainstay-vp-funds-trust; or (iii) by visiting the SEC’s website at www.sec.gov.
Shareholder Reports and Quarterly Portfolio Disclosure
The Portfolio is required to file its complete schedule of portfolio holdings with the SEC 60 days after its first and third fiscal quarter on Form N-PORT. The Portfolio's holdings report is available free of charge upon request by calling 800-598-2019 or by visiting the SEC’s website at www.sec.gov.
| 46 | MainStay VP PIMCO Real Return Portfolio |
MainStay VP Portfolios
MainStay VP offers a wide range of Portfolios. The full array of MainStay VP offerings is listed here, with information about the manager, subadvisors, legal counsel, and independent registered public accounting firm.
Equity
MainStay VP Candriam Emerging Markets Equity Portfolio
MainStay VP Epoch U.S. Equity Yield Portfolio
MainStay VP Fidelity Institutional AM® Utilities Portfolio†
MainStay VP MacKay International Equity Portfolio
MainStay VP MacKay S&P 500 Index Portfolio
MainStay VP Natural Resources Portfolio
MainStay VP Small Cap Growth Portfolio
MainStay VP T. Rowe Price Equity Income Portfolio
MainStay VP Wellington Growth Portfolio
MainStay VP Wellington Mid Cap Portfolio
MainStay VP Wellington Small Cap Portfolio
MainStay VP Wellington U.S. Equity Portfolio
MainStay VP Winslow Large Cap Growth Portfolio
Mixed Asset
MainStay VP Balanced Portfolio
MainStay VP Income Builder Portfolio
MainStay VP Janus Henderson Balanced Portfolio
MainStay VP MacKay Convertible Portfolio
Income
MainStay VP Bond Portfolio
MainStay VP Floating Rate Portfolio
MainStay VP Indexed Bond Portfolio
MainStay VP MacKay Government Portfolio
MainStay VP MacKay High Yield Corporate Bond Portfolio
MainStay VP MacKay Strategic Bond Portfolio
MainStay VP PIMCO Real Return Portfolio
Money Market
MainStay VP U.S. Government Money Market Portfolio
Alternative
MainStay VP CBRE Global Infrastructure Portfolio
MainStay VP IQ Hedge Multi-Strategy Portfolio
Asset Allocation
MainStay VP Conservative Allocation Portfolio
MainStay VP Equity Allocation Portfolio
MainStay VP Growth Allocation Portfolio
MainStay VP Moderate Allocation Portfolio
Manager
New York Life Investment Management LLC
New York, New York
Subadvisors
Brown Advisory LLC
Baltimore, Maryland
Candriam Belgium S.A.*
Brussels, Belgium
CBRE Clarion Securities LLC
Radnor, Pennsylvania
Epoch Investment Partners, Inc.
New York, New York
FIAM LLC
Smithfield, Rhode Island
IndexIQ Advisors LLC*
New York, New York
Janus Capital Management LLC
Denver, Colorado
MacKay Shields LLC*
New York, New York
Mellon Investments Corporation
Boston, Massachusetts
NYL Investors LLC*
New York, New York
Pacific Investment Management Company LLC
Newport Beach, California
Segall Bryant & Hamill, LLC
Chicago, Illinois
T. Rowe Price Associates, Inc.
Baltimore, Maryland
Wellington Management Company LLP
Boston, Massachusetts
Winslow Capital Management, LLC
Minneapolis, Minnesota
Legal Counsel
Dechert LLP
Washington, District of Columbia
Independent Registered Public Accounting Firm
PricewaterhouseCoopers LLP
New York, New York
Distributor
NYLIFE Distributors LLC*
Jersey City, New Jersey
Custodian
JPMorgan Chase Bank, N.A.
New York, New York
Some Portfolios may not be available in all products.
† Fidelity Institutional AM is a registered trade mark of FMR LLC. Used with permission.
* An affiliate of New York Life Investment Management LLC
Not part of the Semiannual Report
2021 Semiannual Report
This report is for the general information of New York Life Variable Annuities and NYLIAC Variable Universal Life Insurance Products policyowners. It must be preceded or accompanied by the appropriate product(s) and funds prospectuses if it is given to anyone who is not an owner of a New York Life variable annuity policy or a NYLIAC Variable Universal Life Insurance Product. This report does not offer for sale or solicit orders to purchase securities.
The performance data quoted in this report represents past performance. Past performance is no guarantee of future results. Due to market volatility and other factors, current performance may be lower or higher than the figures shown. The most recent month-end performance summary for your variable annuity or variable life policy is available by calling 800-598-2019 and is updated periodically on newyorklife.com.
The New York Life Variable Annuities and NYLIAC Variable Universal Life Insurance Products are issued by New York Life Insurance and Annuity Corporation (a Delaware Corporation) and distributed by NYLIFE Distributors LLC (Member FINRA/SIPC).
New York Life Insurance Company
New York Life Insurance and Annuity
Corporation (NYLIAC) (A Delaware Corporation)
51 Madison Avenue, Room 551
New York, NY 10010
newyorklife.com
nylinvestments.com
NYLIFE Distributors LLC, 30 Hudson Street, Jersey City, NJ 07302
New York Life Investment Management LLC is the investment manager to the MainStay VP Funds Trust
©2021 by NYLIFE Distributors LLC. All rights reserved.
You may obtain copies of the Prospectus and the Statement of Additional Information free of charge, upon request, by calling toll-free 800-598-2019 or writing to New York Life Insurance and Annuity Corporation, 51 Madison Avenue, New York, NY 10010.
| Not FDIC Insured | No Bank Guarantee | May Lose Value |
(NYLIAC) NI528
Not applicable.
| Item 3. | Audit Committee Financial Expert. |
Not applicable.
| Item 4. | Principal Accountant Fees and Services. |
Not applicable.
| Item 5. | Audit Committee of Listed Registrants. |
Not applicable.
The Schedule of Investments is included as part of Item 1 of this report.
| Item 7. | Disclosure of Proxy Voting Policies and Procedures for Closed-End Management Investment Companies. |
Not applicable.
| Item 8. | Portfolio Managers of Closed-End Management Investment Companies. |
Not applicable.
| Item 9. | Purchases of Equity Securities by Closed-End Management Investment Company and Affiliated Purchasers. |
Not applicable.
| Item 10. | Submission of Matters to a Vote of Security Holders. |
Since the Registrant’s last response to this Item, there have been no material changes to the procedures by which shareholders may recommend nominees to the Registrant’s Board of Trustees.
| Item 11. | Controls and Procedures. |
| (a) | Based on an evaluation of the Registrant’s Disclosure Controls and Procedures (as defined in Rule 30a-3(c) under the Investment Company Act of 1940) (the “Disclosure Controls”), as of a date within 90 days prior to the filing date (the “Filing Date”) of this |
| | Form N-CSR (the “Report”), the Registrant’s principal executive officer and principal financial officer have concluded that the Disclosure Controls are reasonably designed to ensure that information required to be disclosed by the Registrant in the Report is recorded, processed, summarized and reported by the Filing Date, including ensuring that information required to be disclosed in the Report is accumulated and communicated to the Registrant’s management, including the Registrant’s principal executive officer and principal financial officer, as appropriate to allow timely decisions regarding required disclosure. |
| (b) | There were no changes in the Registrant’s internal control over financial reporting (as defined in Rule 30a-3(d)) under the Investment Company Act of 1940 that occurred during the period covered by this report that has materially affected, or is reasonably likely to materially affect, the Registrant’s internal control over financial reporting. |
| Item 12. | Disclosure of Securities Lending Activities for Closed-End Management |
Investment Companies.
Not applicable.
SIGNATURES
Pursuant to the requirements of the Securities Exchange Act of 1934 and the Investment Company Act of 1940, the Registrant has duly caused this Report to be signed on its behalf by the undersigned, thereunto duly authorized.
| | |
| MAINSTAY VP FUNDS TRUST |
| |
| By: | | /s/ Kirk C. Lehneis |
| | Kirk C. Lehneis |
| | President and Principal Executive Officer |
| |
| Date: | | September 2, 2021 |
Pursuant to the requirements of the Securities Exchange Act of 1934 and the Investment Company Act of 1940, this Report has been signed below by the following persons on behalf of the Registrant and in the capacities and on the dates indicated.
| | |
| By: | | /s/ Kirk C. Lehneis |
| |
| | Kirk C. Lehneis |
| | President and Principal Executive Officer |
| |
| Date: | | September 2, 2021 |
| |
| By: | | /s/ Jack R. Benintende |
| | Jack R. Benintende |
| | Treasurer and Principal Financial and Accounting Officer |
| |
| Date: | | September 2, 2021 |
EXHIBIT INDEX