UNITED STATES
SECURITIES AND EXCHANGE COMMISSION
Washington, D.C. 20549
FormN-CSR
CERTIFIED SHAREHOLDER REPORT OF REGISTERED MANAGEMENT
INVESTMENT COMPANIES
Investment Company Act File Number811-03833
MAINSTAY VP FUNDS TRUST
(Exact name of Registrant as specified in charter)
51 Madison Avenue, New York, NY 10010
(Address of principal executive offices) (Zip code)
J. Kevin Gao, Esq.
30 Hudson Street
Jersey City, New Jersey 07302
(Name and address of agent for service)
Registrant’s telephone number, including area code: (212)576-7000
Date of fiscal year end: December 31
Date of reporting period: June 30, 2019
| Item 1. | Reports to Stockholders. |
MainStay VP Balanced Portfolio
Message from the President and Semiannual Report
Unaudited | June 30, 2019

Beginning on January 1, 2021, as permitted by regulations adopted by the Securities and Exchange Commission, paper copies of the MainStay VP Portfolio annual and semi-annual shareholder reports may no longer be sent by mail, unless you specifically request paper copies of the reports from the insurance company that offers your policy. Instead, the reports will be made available online, and you will be notified by mail each time a report is posted and provided with a website link to access the report. Instructions for requesting paper copies will be provided by your insurance company.
If you already elected to receive shareholder reports electronically, you will not be affected by this change and you need not take any action. At any time, you may elect to receive reports and other communications from the insurance company electronically by following the instructions provided by the insurance company.
You may elect to receive all future shareholder reports in paper form free of charge. You can inform the insurance company that you wish to receive paper copies of reports by following the instructions provided by the insurance company. Your election to receive reports in paper form will apply to all portfolio companies available under your contract.
| | | | | | | | |
| | | | | |
| Not FDIC/NCUA Insured | | Not a Deposit | | May Lose Value | | No Bank Guarantee | | Not Insured by Any Government Agency |

This page intentionally left blank
Message from the President
Most equity and fixed-income markets in the United States and around the world advanced in the face of conflicting political and macroeconomic forces during thesix-month period ended June 30, 2019.
The reporting period began on the heels of tumultuous December 2018, during which equities and equity-sensitive bonds spiked sharply lower on concerns regarding the pace of economic growth, a U.S. government shutdown and the potential impact of trade disputes between the United States and other nations, particularly China. Markets recovered quickly in early 2019 as trade tensions eased, the government reopened and the U.S. Federal Reserve Board (Fed) adopted a more patient tone regarding the future direction of interest rates. Markets moved broadly higher from January through April, supported by encouraging economic data and generally strong corporate earnings.
During the first four months of the reporting period, the improving economic environment encouraged investors to favor areas of the market viewed as offering greater return potential along with higher risks. Among U.S. stocks, cyclical, growth-oriented sectors tended to outperform more defensive, value-oriented sectors, whilelarge-cap stocks outperformed theirsmaller-cap counterparts. Within the S&P 500® Index, the information technology sector led the market’s advance, followed by communication services, consumer discretionary and consumer staples. Industrials, utilities, financials, materials, real estate and energy produced more modest gains. While some international equity markets outperformed or underperformed the U.S. market, on average international stocks mirrored the performance of their U.S. counterparts. Fixed-income securities gained ground as well, albeit along a more gradual trajectory. Among U.S. fixed-income instruments, corporate issues generally outperformed government bonds, with lower credit quality, higher yielding securities leading the sector’s advance. Long-term U.S. Treasury bond yields proved particularly weak, with
10-year yields dipping at times below3-month yields, reflecting investors’ continued concerns about domestic economic growth.
May 2019 saw a return of uncertainty and volatility. Trade discussions between the United States and China faltered, driving global equity prices lower. Government bond prices rose as investors sought safe havens. June brought yet anotherU-turn as equity prices climbed again after comments from the Fed raised hopes of an interest rate cut in response to weak economic data. Stock and bond prices rose, with U.S. equity markets ending the reporting period in record territory.
We are pleased to see renewed signs of strength in broad areas of the financial market. At the same time, we remained sharply focused on providing you, as a MainStay VP investor, with the experienced and disciplined fund management that we believe underpins an effective, long-term investment strategy. Whatever tomorrow’s investment environment brings, you can rely on our portfolio managers to pursue the objectives of their individual Portfolios as outlined in the prospectus with the energy and dedication you have come to expect.
The report that follows contains additional information on the market events, investment decisions and specific securities that shaped your VP Portfolio’s performance during the six months ended June 30, 2019. We encourage you to read the report carefully and use it to evaluate your Portfolio’s performance in light of your long-range financial plan.
Sincerely,

Kirk C. Lehneis
President
The opinions expressed are as of the date of this report and are subject to change. There is no guarantee that any forecast made will come to pass. This material does not constitute investment advice and is not intended as an endorsement of any specific investment. Past performance is no guarantee of future results.
Not part of the Semiannual Report
Table of Contents
Investors should refer to the Portfolio’s Summary Prospectus and/or Prospectus and consider the Portfolio’s investment objectives, strategies, risks, charges and expenses carefully before investing. The Summary Prospectus and/or Prospectus contain this and other information about the Portfolio. You may obtain copies of the Portfolio’s Summary Prospectus and/or the Prospectus and the Statement of Additional Information free of charge, upon request, by calling toll-free 800-598-2019, by writing to New York Life Insurance and Annuity Corporation, 51 Madison Avenue, Room 251, New York, New York 10010 or by sending an email to MainStayShareholdersServices@nylim.com. These documents are also available at nylinvestments.com/vpdocuments. Please read the Summary Prospectus and/or Prospectus carefully before investing. MainStay VP Funds Trust portfolios are separate account options which are purchased through a variable insurance or variable annuity contract.
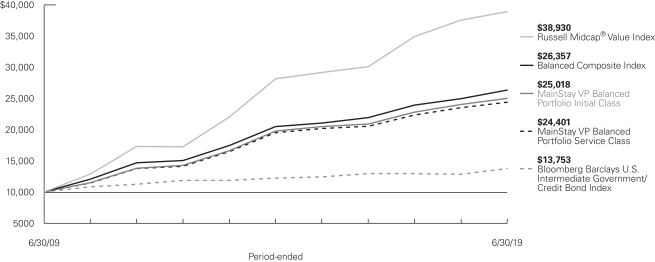
Investment and Performance Comparison1(Unaudited)
Performance data quoted represents past performance. Past performance is no guarantee of future results. Because of market volatility and other factors, current performance may be lower or higher than the figures shown. Investment return and principal value will fluctuate, and as a result, when shares are redeemed, they may be worth more or less than their original cost. The performance table and graph do not reflect any deduction of sales charges, mortality and expense charges, contract charges or administrative charges. Please refer to the Performance Summary appropriate for your policy. For performance information current to the most recent month-end, please call800-598-2019 or visit www.newyorklife.com.
Average Annual Total Returns for the Period-Ended June 30, 2019
| | | | | | | | | | | | | | | | | | | | | | |
| Class | | Inception
Date | | Six Months | | | One Year | | | Five Years | | | Ten Years | | | Gross
Expense
Ratio2 | |
| | | | | | |
Initial Class Shares | | 5/2/2005 | | | 11.81 | % | | | 4.07 | % | | | 4.82 | % | | | 9.60 | % | | | 0.75 | % |
Service Class Shares | | 5/2/2005 | | | 11.67 | | | | 3.81 | | | | 4.56 | | | | 9.33 | | | | 1.00 | |
| | | | | | | | | | | | | | | | |
| Benchmark Performance | | Six Months | | | One Year | | | Five Years | | | Ten Years | |
| | | | |
Russell Midcap® Value Index3 | | | 18.02 | % | | | 3.68 | % | | | 6.72 | % | | | 14.56 | % |
Bloomberg Barclays U.S. Intermediate Government/Credit Bond Index4 | | | 4.97 | | | | 6.93 | | | | 2.39 | | | | 3.24 | |
Balanced Composite Index5 | | | 12.88 | | | | 5.49 | | | | 5.18 | | | | 10.18 | |
Morningstar Allocation—50% to 70% Equity Category Average6 | | | 12.21 | | | | 5.73 | | | | 5.04 | | | | 8.93 | |
| 1. | Performance figures may reflect certain fee waivers and/or expense limitations, without which total returns may have been different. For information on current fee waivers and/or expense limitations (if any), please refer to the Notes to Financial Statements. |
| 2. | The gross expense ratios presented reflect the Portfolio’s “Total Annual Portfolio Operating Expenses” from the most recent Prospectus, as supplemented, and may differ from other expense ratios disclosed in this report. |
| 3. | The Russell Midcap® Value Index is the Portfolio’s primary broad-based securities market index for comparison purposes. The Russell Midcap® Value Index measures the performance of themid-cap value segment of the U.S. equity universe. It includes those Russell Midcap® Index companies with lowerprice-to-book ratios and lower forecasted growth values. Results assume reinvestment of all dividends and capital gains. An investment cannot be made directly in an index. |
| 4. | The Portfolio has selected the Bloomberg Barclays U.S. Intermediate Government/Credit Bond Index as a secondary benchmark. The Bloomberg Barclays U.S. Intermediate Government/Credit Bond Index measures the |
| | performance of U.S. dollar-denominated U.S. Treasurys, government-related and investment-grade U.S. corporate securities that have a remaining maturity of greater than one year and less than ten years. Results assume reinvestment of all dividends and capital gains. An investment cannot be made directly in an index. |
| 5. | The Portfolio has selected the Balanced Composite Index as an additional benchmark. The Balanced Composite Index consists of the Russell Midcap® Value Index (60% weighted) and the Bloomberg Barclays U.S. Intermediate Government/Credit Bond Index (40% weighted). Results assume reinvestment of all dividends and capital gains. An investment cannot be made directly in an index. |
| 6. | The Morningstar Allocation—50% to 70% Equity Category Average is representative of funds that seek to provide both income and capital appreciation by investing in multiple asset classes, including stocks, bonds, and cash. These funds are dominated by domestic holdings and have equity exposures between 50% and 70%. Results are based on average total returns of similar funds with all dividends and capital gain distributions reinvested. |
Cost in Dollars of a $1,000 Investment in MainStay VP Balanced Portfolio (Unaudited)
The example below is intended to describe the fees and expenses borne by shareholders during the six-month period from January 1, 2019, to June 30, 2019, and the impact of those costs on your investment.
Example
As a shareholder of the Portfolio you incur two types of costs: (1) transaction costs, including exchange fees and sales charges (loads) on purchases (as applicable), and (2) ongoing costs, including management fees, distribution and/or service (12b-1) fees, and other Portfolio expenses (as applicable). This example is intended to help you understand your ongoing costs (in dollars) of investing in the Portfolio and to compare these costs with the ongoing costs of investing in other mutual funds. The example is based on an investment of $1,000 made at the beginning of the six-month period and held for the entire period from January 1, 2019, to June 30, 2019. Shares are only sold in connection with variable life and annuity contracts and the example does not reflect any contract level or transactional fees or expenses. If these costs had been included, your costs would have been higher.
This example illustrates your Portfolio’s ongoing costs in two ways:
Actual Expenses
The second and third data columns in the table below provide information about actual account values and actual expenses. You may use the information in these columns, together with the amount you invested, to estimate the expenses that you paid during the six months ended June 30, 2019. Simply divide your account value by $1,000
(for example, an $8,600 account value divided by $1,000 = 8.6), then multiply the result by the number under the heading entitled “Expenses Paid During Period” to estimate the expenses you paid on your account during this period.
Hypothetical Example for Comparison Purposes
The fourth and fifth data columns in the table below provide information about hypothetical account values and hypothetical expenses based on the Portfolio’s actual expense ratio and an assumed rate of return of 5% per year before expenses, which is not the Portfolio’s actual return. The hypothetical account values and expenses may not be used to estimate the actual ending account balances or expenses you paid for thesix-month period shown. You may use this information to compare the ongoing costs of investing in the Portfolio with the ongoing costs of investing in other mutual funds. To do so, compare this 5% hypothetical example with the 5% hypothetical examples that appear in the shareholder reports of the other mutual funds.
Please note that the expenses shown in the table are meant to highlight your ongoing costs only and do not reflect any transactional costs, such as exchange fees or sales charges (loads). Therefore, the fourth and fifth data columns of the table are useful in comparing ongoing costs only and will not help you determine the relative total costs of owning different funds. In addition, if these transactional costs were included, your costs would have been higher.
| | | | | | | | | | | | | | | | | | | | | | |
| | | | | | | | | | | | | | | | | | |
| Share Class | | Beginning
Account
Value
1/1/19 | | | Ending Account
Value (Based
on Actual
Returns and
Expenses)
6/30/19 | | | Expenses
Paid
During
Period1 | | | Ending Account
Value (Based on Hypothetical
5% Annualized
Return and
Actual Expenses)
6/30/19 | | | Expenses
Paid
During
Period1 | | | Net Expense
Ratio
During
Period2 |
| | | | | | |
| Initial Class Shares | | $ | 1,000.00 | | | $ | 1,118.10 | | | $ | 3.99 | | | $ | 1,021.03 | | | $ | 3.81 | | | 0.76% |
| | | | | | |
| Service Class Shares | | $ | 1,000.00 | | | $ | 1,116.70 | | | $ | 5.30 | | | $ | 1,019.79 | | | $ | 5.06 | | | 1.01% |
| 1. | Expenses are equal to the Portfolio’s annualized expense ratio of each class multiplied by the average account value over the period, divided by 365 and multiplied by 181 (to reflect the six-month period). The table above represents the actual expenses incurred during the six-month period. In addition to the fees and expenses which the Portfolio bears directly, it also indirectly bears a pro rata share of the fees and expenses of the underlying funds in which it invests. Such indirect expenses are not included in the above-reported expense figures. |
| 2. | Expenses are equal to the Portfolio’s annualized expense ratio to reflect the six-month period. |
| | |
| 6 | | MainStay VP Balanced Portfolio |
Portfolio Composition as of June 30, 2019(Unaudited)
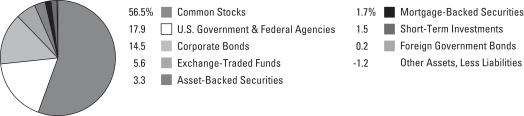
See Portfolio of Investments beginning on page 11 for specific holdings within these categories. The Portfolio’s holdings are subject to change.
Top Ten Holdings or Issuers Held as of June 30, 2019(excludingshort-term investments) (Unaudited)
| 1. | United States Treasury Notes, 1.75%–3.00%, due 4/30/20–5/15/29 |
| 2. | iShares Intermediate Government / Credit Bond ETF |
| 3. | Federal Home Loan Bank, 1.70%–3.25%, due 5/15/20–11/16/28 |
| 4. | Federal Home Loan Mortgage Corporation, 1.25%–2.90%, due 8/15/19–6/17/24 |
| 8. | iShares Russell 1000 Value ETF |
| 10. | Anadarko Petroleum Corp. |
Portfolio Management Discussion and Analysis(Unaudited)
Answers to the questions reflect the views of portfolio managers Jae S. Yoon, CFA, and Jonathan Swaney of New York Life Investment Management LLC, the Portfolio’s Manager; Kenneth Sommer and AJ Rzad, CFA, of NYL Investors LLC, the Portfolio’s fixed-income Subadvisor; and Migene Kim, CFA, and Mona Patni of MacKay Shields LLC, the Portfolio’s equity Subadvisor.
How did MainStay VP Balanced Portfolio perform relative to its benchmarks and peers during the six months ended June 30, 2019?
For the six months ended June 30, 2019, MainStay VP Balanced Portfolio returned 11.81% for Initial Class shares and 11.67% for Service Class shares. Over the same period, both share classes underperformed the 18.02% return of the Russell Midcap® Value Index, which is the Portfolio’s primary benchmark, and outperformed the 4.97% return of the Bloomberg Barclays U.S. Intermediate Government/Credit Bond Index, which is a secondary benchmark of the Portfolio. For the six months ended June 30, 2019, both share classes underperformed the 12.88% return of the Balanced Composite Index, which is an additional benchmark of the Portfolio, and the 12.21% return of the Morningstar Allocation—50% to 70% Equity Category Average.1
What factors affected the Portfolio’s performance relative to its benchmarks and peers during the reporting period?
In the equity portion of the Portfolio, stock selection was primarily responsible for the Portfolio’s underperformance relative to the Russell Midcap® Value Index during the reporting period, whereas sector allocation effect was neutral. The Portfolio’s performance directly reflected the performance of our stock selection model, particularly the weak effectiveness of the model’s valuation signals, which seek to evaluate companies across sales- and cash-based measures on a peer-relative basis. Valuation ranges across markets were compressed and value signals, which tend to prove most effective in an environment in which profits are accelerating, struggled amid a decelerating global growth outlook. Valuation signals proved more effective in June 2019 when value performance rebounded. Positive contributions from the stock selection model’s other factors provided only partial mitigation. (Contributions take weightings and total returns into account.) Momentum signals, which evaluate historical price trends, generated positive performance for the Portfolio during the reporting period, but proved volatile and inconsistent, hence difficult to capture. Sentiment signals, a gauge of institutional investor sentiment, were not effective during the first half of the reporting period but rebounded in the second half of the same period thanks to the Portfolio’s underweight positions.
The fixed-income portion of the Portfolio held overweight exposure relative to the Bloomberg Barclays U.S. Intermediate Government/Credit Bond Index in the corporate, asset-backed and commercial mortgage-backed sectors throughout the
reporting period. Of these, corporate sector holdings generated the strongest performance. Within the corporate sector, the Portfolio’s allocations to financials and industrials were most accretive to returns. Within the asset-backed sector, the Portfolio’s allocation to collateralized loan obligations bolstered performance. During the first half of the reporting period, the Portfolio’s overweight exposure to U.S. government agencies was accretive to performance. During the second half of the same period, the Portfolio’s overweight allocation to fixed-rate asset-backed securities detracted from performance. Throughout the reporting period, the Portfolio’s underweight position in thenon-corporate sector detracted from performance as well.
During the reporting period, how was the Portfolio’s performance materially affected by investments in derivatives?
During the reporting period, the equity portion of the Portfolio did not use derivatives. Over the same period, the use of derivatives by the fixed-income portion of Portfolio was limited to interest-rate derivatives used to keep the duration2 of the Portfolio in line with the Subadvisor’s target. These interest-rate derivatives had a slightly positive impact on the performance of the fixed-income portion of the Portfolio during the reporting period.
During the reporting period, which sectors were the strongest positive contributors to relative performance in the equity portion of Portfolio and which sectors were particularly weak?
During the reporting period, the sectors that made the greatest positive contributions to the performance of the equity portion of the Portfolio relative to the Russell Midcap® Value Index included consumer staples, consumer discretionary and materials. Over the same period, the sectors that detracted the most from the relative performance of the equity portion of the Portfolio included health care, information technology and industrials.
During the reporting period, which individual stocks made the strongest positive contributions to the absolute performance of the equity portion of the Portfolio and which individual stocks detracted the most?
The stocks that made the most substantial positive contributions to the absolute performance of the equity portion of the Portfolio during the reporting period included packing & containers
| 1. | See page 5 for more information on benchmark and peer group returns. |
| 2. | Duration is a measure of the price sensitivity of a fixed-income investment to changes in interest rates. Duration is expressed as a number of years and is considered a more accurate sensitivity gauge than average maturity. |
| | |
| 8 | | MainStay VP Balanced Portfolio |
manufacturer Ball, consumer finance company Synchrony Financial, and food manufacturer Tyson Foods. The stocks that detracted the most from the absolute performance of the equity portion of the Portfolio during the reporting period included communications equipment company CommScope, generic drug maker Mylan and department store chain Kohl’s.
Did the equity portion of the Portfolio make any significant purchases or sales during the reporting period?
During the reporting period, the equity portion of the Portfolio made its largest initial purchase in insurance company Arch Capital, and its largest increase in position size in payment processing firm Worldpay. Over the same period, the equity portion of the Portfolio made its largest complete sale of a position in reinsurance group Everest Re Group, and its most substantial decrease in position size in life sciences tools & services company Agilent Technologies.
How did sector weightings change in the equity portion of the Portfolio during the reporting period?
Relative to the Russell Midcap® Value Index, the equity portion of the Portfolio saw its most substantial weighting increases of the reporting period in the industrials and consumer staples sectors. Over the same period, the equity portion of the Portfolio saw its most significant decreases in sector exposures relative to the benchmark in utilities and energy.
How was the equity portion of the Portfolio positioned at the end of the reporting period?
As of June 30, 2019, the equity portion of the Portfolio held its most substantially overweight sector positions relative to the Russell Midcap® Value Index in communication services and consumer staples. As of the same date, the equity portion of the Portfolio held its most substantially underweight sector positions relative to the Index in real estate and utilities.
What was the duration strategy of the fixed-income portion of the Portfolio during the reporting period?
During the reporting period, the fixed-income portion of the Portfolio generally maintained a duration that was relatively close to that of the Bloomberg Barclays U.S. Intermediate Government/Credit Bond Index. However, on several occasions we shortened the duration of the Portfolio relative to the benchmark, a strategy that had a slightly positive impact on the Portfolio’s performance. As of June 30, 2019, the effective duration of the fixed-income portion of the Portfolio was 3.94 years, compared to a duration of
3.92 years for the Bloomberg Barclays U.S. Intermediate Government/Credit Bond Index.
What specific factors, risks or market forces prompted significant decisions for the fixed-income portion of the Portfolio during the reporting period?
The fixed-income portion of the Portfolio maintained overweight positions relative to the Bloomberg Barclays U.S. Intermediate Government/Credit Bond Index in corporate bonds, commercial mortgage-backed securities and asset-backed securities throughout the reporting period. During the reporting period, we reduced the Portfolio’s exposure to the corporate sector as yields declined and valuations became less attractive, despite lingering concerns about global growth and unresolved trade-related tensions with China. Specifically, we reduced the Portfolio’s exposure to financials, health care and wirelines as these sectors constituted the largest risk positions in the Portfolio. During the first half of the reporting period, we increased the Portfolio’s allocation to U.S. government agencies. Spreads3 on longer-duration U.S. government agency securities moved wider as market volatility picked up towards the end of 2018. This created an attractive opportunity to add to the Portfolio’s overweight exposure to the sector. Throughout the reporting period we maintained the Portfolio’s overweight allocation to asset-backed securities and commercial mortgage-backed securities, sectors that, in our opinion, offered favorable yield dynamics and superior credit quality.
During the reporting period, which market segments made the strongest positive contributions to the performance of the fixed-income portion of the Portfolio and which market segments were particularly weak?
During the reporting period, the fixed-income portion of the Portfolio maintained overweight exposure relative to the Bloomberg Barclays U.S. Intermediate Government/Credit Bond Index in the financial, industrial and utilities sectors. This positioning contributed positively to the Portfolio’s performance relative to the Index. Among financials, the banking subsector had the most positive impact on the Portfolio’s relative performance, with overweight positions in securities issued by Bank of America, Morgan Stanley and Citigroup all adding to relative performance. Leading holdings among industrial bonds included securities issued by Anheuser-Busch, InBev Worldwide and Verizon Communications. Among utilities, the Portfolio’s overweight exposure to the electric subsector enhanced relative performance. In thenon-corporate sector, the Portfolio’s underweight position versus the benchmark in the sovereign subsector detracted from relative performance.
| 3. | The terms “spread” and “yield spread” may refer to the difference in yield between a security or type of security and comparable U.S. Treasury issues. The terms may also refer to the difference in yield between two specific securities or types of securities at a given time. |
Did the fixed-income portion of the Portfolio make any significant purchases or sales during the reporting period?
During the reporting period, the fixed-income portion of the Portfolio generally sought to purchase corporate bonds during periods of market weakness. As the market stabilized, the fixed-income portion of the Portfolio sold corporate bonds to reduce the degree to which it was overweight relative to the Bloomberg Barclays U.S. Intermediate Government/Credit Bond Index.
During the reporting period, how did sector (or industry) weightings change in the fixed-income portion of the Portfolio?
The fixed-income portion of the Portfolio held overweight exposures to commercial mortgage-backed securities and asset-backed securities throughout the reporting period. In the second half of the reporting period, we moderately reduced the Portfolio’s allocation to commercial mortgage-backed securities and remained focused on asset-backed securities due to compelling relative value opportunities in collateralized loan obligations and student loans. As we trimmed the Portfolio’s corporate sector holdings, we increased the Portfolio’s exposure to the Treasury sector.
How was the fixed-income portion of the Portfolio positioned at the end of the reporting period?
As of June 30, 2019, the fixed-income portion of the Portfolio held an overweight position relative to the Bloomberg Barclays U.S. Intermediate Government/Credit Bond Index in corporate bonds. Within the corporate sector, the fixed-income portion of the Portfolio held overweight positions in financials and utilities. As of the same date, the fixed-income portion of the Portfolio also held overweight positions in asset-backed securities, commercial mortgage-backed securities and U.S. government agencies. The largest overweight allocation in spread assets at the end of the reporting period was in the asset-backed securities sector.
As of June 30, 2019, the fixed-income portion of the Portfolio held underweight positions relative to the Bloomberg Barclays U.S. Intermediate Government/Credit Bond Index in the sovereign, supranational, foreign agency and foreign local government sectors.
As of June 30, 2019, the fixed-income portion of the Portfolio maintained a duration that was slightly longer than the duration of the Bloomberg Barclays U.S. Intermediate Government/Credit Bond Index.
The opinions expressed are those of the portfolio managers as of the date of this report and are subject to change. There is no guarantee that any forecasts will come to pass. This material does not constitute investment advice and is not intended as an endorsement of any specific investment.
Not all MainStay VP Portfolios and/or share classes are available under all policies.
| | |
| 10 | | MainStay VP Balanced Portfolio |
Portfolio of InvestmentsJune 30, 2019 (Unaudited)
| | | | | | | | |
| | | Principal
Amount | | | Value | |
Long-Term Bonds 37.6%† Asset-Backed Securities 3.3% | | | | | | | | |
Automobile 0.2% | |
Avis Budget Rental Car Funding AESOP LLC
Series 2019-1A, Class A
3.45%, due 3/20/23 (a) | | $ | 100,000 | | | $ | 102,418 | |
Mercedes Benz Auto Lease Trust
Series 2019-A, Class A3
3.10%, due 11/15/21 | | | 150,000 | | | | 151,609 | |
Toyota Auto Loan Extended Note Trust
Series 2019-1A, Class A
2.56%, due 11/25/31 (a) | | | 750,000 | | | | 758,789 | |
| | | | | | | | |
| | | | | | | 1,012,816 | |
| | | | | | | | |
Other Asset-Backed Securities 3.1% | |
AIMCO CLO
Series 2017-AA, Class A
3.852% (3 Month LIBOR + 1.26%),
due 7/20/29 (a)(b) | | | 250,000 | | | | 250,098 | |
Apidos CLO
Series 2015-21A, Class A1R
3.531% (3 Month LIBOR + 0.93%),
due 7/18/27 (a)(b) | | | 400,000 | | | | 400,026 | |
Apidos CLO XXV
Series 2016-25A, Class A1R
3.762% (3 Month LIBOR + 1.17%),
due 10/20/31 (a)(b) | | | 400,000 | | | | 399,359 | |
Ares XXIX CLO, Ltd.
Series 2014-1A, Class A1R
3.778% (3 Month LIBOR + 1.19%),
due 4/17/26 (a)(b) | | | 113,759 | | | | 113,789 | |
Benefit Street Partners CLO, Ltd.
Series 2015-VIIA, Class A1AR
3.381% (3 Month LIBOR + 0.78%),
due 7/18/27 (a)(b) | | | 250,000 | | | | 249,264 | |
Benefit Street Partners CLO IV, Ltd.
Series 2014-IVA, Class A1
3.842% (3 Month LIBOR + 1.25%),
due 1/20/29 (a)(b) | | | 300,000 | | | | 300,067 | |
Cedar Funding IV CLO, Ltd.
Series 2014-4A, Class AR
3.822% (3 Month LIBOR + 1.23%),
due 7/23/30 (a)(b) | | | 750,000 | | | | 749,464 | |
DB Master Finance LLC
Series 2019-1A, Class A2I
3.787%, due 5/20/49 (a) | | | 550,000 | | | | 561,726 | |
Domino’s Pizza Master Issuer LLC
Series 2017-1A, Class A2II
3.082%, due 7/25/47 (a) | | | 1,277,250 | | | | 1,279,179 | |
Dryden Senior Loan Fund
Series 2018-71A, Class A
3.843% (3 Month LIBOR + 1.15%),
due 1/15/29 (a)(b) | | | 300,000 | | | | 300,003 | |
| | | | | | | | |
| | | Principal
Amount | | | Value | |
Other Asset-Backed Securities (continued) | |
Elara HGV Timeshare Issuer LLC
Series 2017-A, Class A
2.69%, due 3/25/30 (a) | | $ | 119,810 | | | $ | 120,034 | |
FOCUS Brands Funding LLC
Series 2017-1A, Class A2I
3.857%, due 4/30/47 (a) | | | 98,000 | | | | 100,731 | |
Galaxy XXII CLO, Ltd.
Series 2016-22A, Class A1R
3.779% (3 Month LIBOR + 1.00%),
due 7/16/28 (a)(b) | | | 250,000 | | | | 249,997 | |
Highbridge Loan Management, Ltd.
Series 2011-A17, Class A
3.825%, due 5/6/30 (a) | | | 850,000 | | | | 850,026 | |
Hilton Grand Vacations Trust
Series 2018-AA, Class A
3.54%, due 2/25/32 (a) | | | 350,260 | | | | 360,782 | |
Magnetite XVIII, Ltd.
Series 2016-18A, Class AR
3.598% (3 Month LIBOR + 1.08%),
due 11/15/28 (a)(b) | | | 400,000 | | | | 399,417 | |
MVW Owner Trust
Series 2019-1A, Class A
2.89%, due 11/20/36 (a) | | | 250,000 | | | | 253,294 | |
Navient Private Education Refi Loan Trust
Series 2019-CA, Class A2
3.13%, due 2/15/68 (a) | | | 300,000 | | | | 306,386 | |
Octagon Investment Partners 30, Ltd.
Series 2017-1A, Class A1
3.912% (3 Month LIBOR + 1.32%),
due 3/17/30 (a)(b) | | | 350,000 | | | | 350,907 | |
Palmer Square CLO, Ltd.
Series 2015-1A, Class A1R2
3.742% (3 Month LIBOR + 1.22%),
due 5/21/29 (a)(b) | | | 500,000 | | | | 499,997 | |
Regatta VI Funding, Ltd.
Series 2016-1A, Class AR
3.672% (3 Month LIBOR + 1.08%),
due 7/20/28 (a)(b) | | | 400,000 | | | | 399,741 | |
Sierra Receivables Funding Co. LLC
Series 2019-1A, Class A
3.20%, due 1/20/36 (a) | | | 173,829 | | | | 178,100 | |
SMB Private Education Loan Trust
Series 2019-B, Class A2A
2.84%, due 6/15/37 (a) | | | 500,000 | | | | 503,895 | |
SoFi Professional Loan Program LLC
Series 2019-A, Class A1FX
3.18%, due 6/15/48 (a) | | | 263,115 | | | | 265,610 | |
Sound Point CLO XVI, Ltd.
Series 2017-2A, Class A
3.86% (3 Month LIBOR + 1.28%),
due 7/25/30 (a)(b) | | | 450,000 | | | | 449,554 | |
| | | | | | |
The notes to the financial statements are an integral part of,
and should be read in conjunction with, the financial statements. | | | | | 11 | |
Portfolio of InvestmentsJune 30, 2019 (Unaudited) (continued)
| | | | | | | | |
| | | Principal
Amount | | | Value | |
| Asset-Backed Securities (continued) | |
Other Asset-Backed Securities (continued) | |
Taco Bell Funding, LLC
Series 2018-1A, Class A2I
4.318%, due 11/25/48 (a) | | $ | 398,000 | | | $ | 412,841 | |
THL Credit Wind River CLO, Ltd.
Series 2017-4A, Class A
3.67% (3 Month LIBOR + 1.15%),
due 11/20/30 (a)(b) | | | 250,000 | | | | 249,201 | |
TIAA CLO III, Ltd.
Series 2017-2A, Class A
3.751% (3 Month LIBOR + 1.15%),
due 1/16/31 (a)(b) | | | 350,000 | | | | 347,696 | |
TICP CLO XIII, Ltd.
Series 2019 13A, Class A
3.665% (3 Month LIBOR + 1.3%),
due 7/15/32 (a)(b) | | | 350,000 | | | | 349,992 | |
Treman Park CLO, Ltd.
Series 2015-1A, Class ARR
3.662% (3 Month LIBOR + 1.07%),
due 10/20/28 (a)(b) | | | 260,000 | | | | 260,001 | |
Voya CLO, Ltd.
Series 2019-1A, Class A
3.813% (3 Month LIBOR + 1.17%),
due 4/15/29 (a)(b) | | | 250,000 | | | | 250,007 | |
Westcott Park CLO, Ltd.
Series 2016 1A, Class AR
3.684% (3 Month LIBOR + 1.21%),
due 7/20/28 (a)(b) | | | 400,000 | | | | 400,021 | |
| | | | | | | | |
| | | | | | | 12,161,205 | |
| | | | | | | | |
Total Asset-Backed Securities
(Cost $13,103,736) | | | | | | | 13,174,021 | |
| | | | | | | | |
| | |
| Corporate Bonds 14.5% | | | | | | | | |
Aerospace & Defense 0.4% | |
BAE Systems PLC
4.75%, due 10/11/21 (a) | | | 1,050,000 | | | | 1,099,528 | |
Boeing Co.
3.10%, due 5/1/26 | | | 425,000 | | | | 437,379 | |
| | | | | | | | |
| | | | | | | 1,536,907 | |
| | | | | | | | |
Auto Manufacturers 0.6% | |
Ford Motor Credit Co. LLC | | | | | | | | |
4.25%, due 9/20/22 | | | 620,000 | | | | 635,888 | |
5.875%, due 8/2/21 | | | 365,000 | | | | 384,878 | |
General Motors Financial Co., Inc.
4.35%, due 4/9/25 | | | 500,000 | | | | 515,792 | |
Volkswagen Group of America Finance LLC
4.00%, due 11/12/21 (a) | | | 725,000 | | | | 748,298 | |
| | | | | | | | |
| | | | | | | 2,284,856 | |
| | | | | | | | |
| | | | | | | | |
| | | Principal
Amount | | | Value | |
Banks 4.2% | |
Bank of America Corp.
4.45%, due 3/3/26 | | $ | 1,920,000 | | | $ | 2,070,995 | |
Bank of Montreal
3.081% (3 Month LIBOR + 0.63%),
due 9/11/22 (b) | | | 600,000 | | | | 602,521 | |
Citigroup, Inc.
4.60%, due 3/9/26 | | | 1,600,000 | | | | 1,731,136 | |
Credit Agricole S.A.
3.375%, due 1/10/22 (a) | | | 250,000 | | | | 254,965 | |
Credit Suisse Group Funding Guernsey, Ltd.
3.80%, due 9/15/22 | | | 865,000 | | | | 896,747 | |
Discover Bank
3.20%, due 8/9/21 | | | 850,000 | | | | 862,583 | |
Fifth Third Bancorp
4.30%, due 1/16/24 | | | 750,000 | | | | 800,930 | |
Goldman Sachs Group, Inc. | | | | | | | | |
2.905%, due 7/24/23 (c) | | | 870,000 | | | | 878,414 | |
3.85%, due 1/26/27 | | | 475,000 | | | | 496,468 | |
HSBC Holdings PLC | | | | | | | | |
3.086% (3 Month LIBOR + 0.65%),
due 9/11/21 (b) | | | 900,000 | | | | 900,832 | |
3.973%, due 5/22/30 (c) | | | 250,000 | | | | 261,139 | |
JPMorgan Chase & Co. | | | | | | | | |
3.702%, due 5/6/30 (c) | | | 175,000 | | | | 184,515 | |
3.875%, due 9/10/24 | | | 2,275,000 | | | | 2,391,784 | |
Lloyds Banking Group PLC
2.907%, due 11/7/23 (c) | | | 1,000,000 | | | | 1,001,661 | |
Morgan Stanley | | | | | | | | |
3.625%, due 1/20/27 | | | 250,000 | | | | 262,384 | |
4.10%, due 5/22/23 | | | 1,000,000 | | | | 1,052,664 | |
4.35%, due 9/8/26 | | | 595,000 | | | | 638,034 | |
Santander UK PLC
3.40%, due 6/1/21 | | | 200,000 | | | | 203,321 | |
SunTrust Bank
3.115% (3 Month LIBOR + 0.59%),
due 5/17/22 (b) | | | 800,000 | | | | 801,245 | |
UBS Group Funding Switzerland A.G.
4.125%, due 4/15/26 (a) | | | 500,000 | | | | 534,157 | |
| | | | | | | | |
| | | | | | | 16,826,495 | |
| | | | | | | | |
Beverages 0.3% | |
Anheuser-Busch InBev Worldwide, Inc. | | | | | | | | |
4.00%, due 4/13/28 | | | 350,000 | | | | 378,018 | |
4.75%, due 1/23/29 | | | 770,000 | | | | 874,109 | |
| | | | | | | | |
| | | | | | | 1,252,127 | |
| | | | | | | | |
Building Materials 0.4% | |
Fortune Brands Home & Security, Inc.
4.00%, due 6/15/25 | | | 850,000 | | | | 894,360 | |
Masco Corp.
4.45%, due 4/1/25 | | | 850,000 | | | | 905,265 | |
| | | | | | | | |
| | | | | | | 1,799,625 | |
| | | | | | | | |
| | | | |
| 12 | | MainStay VP Balanced Portfolio | | The notes to the financial statements are an integral part of,
and should be read in conjunction with, the financial statements. |
| | | | | | | | |
| | | Principal
Amount | | | Value | |
| Corporate Bonds (continued) | |
Chemicals 0.2% | |
Dow Chemical Co. (a) | | | | | | | | |
3.15%, due 5/15/24 | | $ | 175,000 | | | $ | 178,481 | |
4.80%, due 11/30/28 | | | 250,000 | | | | 281,171 | |
NewMarket Corp.
4.10%, due 12/15/22 | | | 400,000 | | | | 414,793 | |
| | | | | | | | |
| | | | | | | 874,445 | |
| | | | | | | | |
Diversified Financial Services 0.5% | |
American Express Co.
3.70%, due 11/5/21 | | | 500,000 | | | | 515,435 | |
Discover Financial Services
5.20%, due 4/27/22 | | | 25,000 | | | | 26,768 | |
GE Capital International Funding Co.
3.373%, due 11/15/25 | | | 1,015,000 | | | | 1,027,487 | |
TD Ameritrade Holding Corp.
2.95%, due 4/1/22 | | | 300,000 | | | | 305,425 | |
| | | | | | | | |
| | | | | | | 1,875,115 | |
| | | | | | | | |
Electric 1.6% | |
Arizona Public Service Co.
2.20%, due 1/15/20 | | | 250,000 | | | | 249,674 | |
Commonwealth Edison Co.
3.10%, due 11/1/24 | | | 400,000 | | | | 412,807 | |
DTE Electric Co.
2.65%, due 6/15/22 | | | 375,000 | | | | 379,516 | |
Electricite de France S.A.
2.35%, due 10/13/20 (a) | | | 1,500,000 | | | | 1,500,827 | |
Emera U.S. Finance, L.P.
2.70%, due 6/15/21 | | | 750,000 | | | | 752,564 | |
Entergy Arkansas LLC
3.70%, due 6/1/24 | | | 375,000 | | | | 397,028 | |
Entergy Corp.
4.00%, due 7/15/22 | | | 750,000 | | | | 780,244 | |
Evergy, Inc.
4.85%, due 6/1/21 | | | 280,000 | | | | 290,003 | |
Exelon Corp.
2.85%, due 6/15/20 | | | 425,000 | | | | 426,346 | |
FirstEnergy Transmission LLC
4.35%, due 1/15/25 (a) | | | 500,000 | | | | 536,641 | |
NextEra Energy Capital Holdings, Inc.
3.25%, due 4/1/26 (d) | | | 375,000 | | | | 385,495 | |
WEC Energy Group, Inc.
3.375%, due 6/15/21 | | | 350,000 | | | | 356,869 | |
| | | | | | | | |
| | | | | | | 6,468,014 | |
| | | | | | | | |
Food 0.3% | |
Conagra Brands, Inc.
4.85%, due 11/1/28 | | | 350,000 | | | | 388,194 | |
Ingredion, Inc.
4.625%, due 11/1/20 | | | 175,000 | | | | 179,757 | |
Kraft Heinz Foods Co.
3.00%, due 6/1/26 | | | 140,000 | | | | 136,232 | |
| | | | | | | | |
| | | Principal
Amount | | | Value | |
Food (continued) | | | | | | | | |
Tyson Foods, Inc.
4.00%, due 3/1/26 | | $ | 325,000 | | | $ | 345,666 | |
| | | | | | | | |
| | | | | | | 1,049,849 | |
| | | | | | | | |
Forest Products & Paper 0.1% | |
Fibria Overseas Finance, Ltd.
4.00%, due 1/14/25 | | | 375,000 | | | | 377,812 | |
| | | | | | | | |
|
Health Care—Products 0.3% | |
Becton Dickinson & Co.
2.894%, due 6/6/22 | | | 1,213,000 | | | | 1,229,479 | |
| | | | | | | | |
|
Health Care—Services 0.3% | |
Cigna Corp.
4.125%, due 11/15/25 (a) | | | 965,000 | | | | 1,027,668 | |
| | | | | | | | |
|
Iron & Steel 0.2% | |
Carpenter Technology Corp.
4.45%, due 3/1/23 | | | 125,000 | | | | 126,869 | |
Reliance Steel & Aluminum Co.
4.50%, due 4/15/23 | | | 700,000 | | | | 734,977 | |
| | | | | | | | |
| | | | | | | 861,846 | |
| | | | | | | | |
Media 0.1% | |
Fox Corp.
4.709%, due 1/25/29 (a) | | | 265,000 | | | | 296,468 | |
| | | | | | | | |
|
Miscellaneous—Manufacturing 0.1% | |
Parker-Hannifin Corp.
3.25%, due 6/14/29 | | | 250,000 | | | | 259,298 | |
| | | | | | | | |
|
Multi-National 0.6% | |
International Bank for Reconstruction & Development | | | | | | | | |
2.00%, due 10/30/20 | | | 600,000 | | | | 600,001 | |
2.60%, due 6/28/24 | | | 350,000 | | | | 349,560 | |
2.70%, due 5/16/22 | | | 575,000 | | | | 582,880 | |
2.88%, due 5/15/24 | | | 650,000 | | | | 665,377 | |
| | | | | | | | |
| | | | | | | 2,197,818 | |
| | | | | | | | |
Oil & Gas 0.6% | |
Anadarko Petroleum Corp. | | | | | | | | |
4.85%, due 3/15/21 | | | 797,000 | | | | 825,035 | |
5.55%, due 3/15/26 | | | 675,000 | | | | 758,619 | |
Cenovus Energy, Inc.
4.25%, due 4/15/27 (d) | | | 200,000 | | | | 207,175 | |
Helmerich & Payne, Inc.
4.65%, due 3/15/25 | | | 400,000 | | | | 423,469 | |
Nabors Industries, Inc.
5.00%, due 9/15/20 (d) | | | 126,000 | | | | 126,315 | |
| | | | | | |
The notes to the financial statements are an integral part of,
and should be read in conjunction with, the financial statements. | | | | | 13 | |
Portfolio of InvestmentsJune 30, 2019 (Unaudited) (continued)
| | | | | | | | |
| | | Principal
Amount | | | Value | |
| Corporate Bonds (continued) | |
Oil & Gas (continued) | |
Petroleos Mexicanos | | | | | | | | |
3.50%, due 1/30/23 | | $ | 100,000 | | | $ | 94,890 | |
4.875%, due 1/24/22 | | | 75,000 | | | | 74,812 | |
5.35%, due 2/12/28 | | | 50,000 | | | | 45,505 | |
| | | | | | | | |
| | | | | | | 2,555,820 | |
| | | | | | | | |
Oil & Gas Services 0.2% | |
Schlumberger Holdings Corp.
3.75%, due 5/1/24 (a) | | | 925,000 | | | | 963,831 | |
| | | | | | | | |
|
Packaging & Containers 0.2% | |
WRKCo., Inc.
3.75%, due 3/15/25 | | | 675,000 | | | | 700,312 | |
| | | | | | | | |
|
Pharmaceuticals 0.3% | |
Bayer U.S. Finance II LLC
3.875%, due 12/15/23 (a) | | | 425,000 | | | | 441,321 | |
Bristol-Myers Squibb Co.
3.20%, due 6/15/26 (a) | | | 625,000 | | | | 649,382 | |
| | | | | | | | |
| | | | | | | 1,090,703 | |
| | | | | | | | |
Pipelines 0.6% | |
Energy Transfer Partners, L.P. / Regency Energy Finance Corp.
5.875%, due 3/1/22 | | | 850,000 | | | | 911,800 | |
Kinder Morgan, Inc.
5.00%, due 2/15/21 (a) | | | 1,264,000 | | | | 1,310,971 | |
Texas Eastern Transmission, L.P.
2.80%, due 10/15/22 (a) | | | 175,000 | | | | 174,770 | |
| | | | | | | | |
| | | | | | | 2,397,541 | |
| | | | | | | | |
Real Estate Investment Trusts 1.0% | |
American Campus Communities Operating Partnership, L.P.
3.30%, due 7/15/26 | | | 650,000 | | | | 656,569 | |
HCP, Inc.
3.25%, due 7/15/26 | | | 450,000 | | | | 453,518 | |
Highwoods Realty, L.P.
3.625%, due 1/15/23 | | | 1,000,000 | | | | 1,021,670 | |
Realty Income Corp.
3.25%, due 10/15/22 | | | 475,000 | | | | 487,337 | |
VEREIT Operating Partnership, L.P.
4.875%, due 6/1/26 | | | 1,230,000 | | | | 1,330,101 | |
| | | | | | | | |
| | | | | | | 3,949,195 | |
| | | | | | | | |
Retail 0.3% | |
CVS Health Corp.
4.30%, due 3/25/28 | | | 975,000 | | | | 1,028,116 | |
Home Depot, Inc.
2.95%, due 6/15/29 | | | 300,000 | | | | 307,746 | |
| | | | | | | | |
| | | | | | | 1,335,862 | |
| | | | | | | | |
| | | | | | | | |
| | | Principal
Amount | | | Value | |
Software 0.5% | |
Fidelity National Information Services, Inc.
2.25%, due 8/15/21 | | $ | 1,075,000 | | | $ | 1,072,797 | |
Fiserv, Inc. | | | | | | | | |
3.20%, due 7/1/26 | | | 300,000 | | | | 306,204 | |
4.20%, due 10/1/28 | | | 475,000 | | | | 514,225 | |
4.75%, due 6/15/21 | | | 200,000 | | | | 208,868 | |
| | | | | | | | |
| | | | | | | 2,102,094 | |
| | | | | | | | |
Telecommunications 0.4% | |
AT&T, Inc.
4.35%, due 3/1/29 | | | 575,000 | | | | 619,321 | |
Verizon Communications, Inc. | | | | | | | | |
3.376%, due 2/15/25 | | | 131,000 | | | | 136,736 | |
4.016%, due 12/3/29 (a) | | | 862,000 | | | | 933,323 | |
| | | | | | | | |
| | | | | | | 1,689,380 | |
| | | | | | | | |
Transportation 0.2% | |
Union Pacific Corp.
3.70%, due 3/1/29 | | | 600,000 | | | | 645,556 | |
| | | | | | | | |
Total Corporate Bonds
(Cost $55,717,443) | | | | | | | 57,648,116 | |
| | | | | | | | |
|
| Foreign Government Bonds 0.2% | |
Colombia 0.1% | |
Colombia Government International Bond
3.875%, due 4/25/27 | | | 220,000 | | | | 229,460 | |
| | | | | | | | |
|
Mexico 0.1% | |
Mexico Government International Bond
3.75%, due 1/11/28 | | | 300,000 | | | | 305,625 | |
| | | | | | | | |
|
Philippines 0.0%‡ | |
Philippine Government International Bond
3.00%, due 2/1/28 | | | 200,000 | | | | 205,370 | |
| | | | | | | | |
|
Poland 0.0%‡ | |
Republic of Poland Government International Bond
5.00%, due 3/23/22 | | | 50,000 | | | | 53,688 | |
| | | | | | | | |
Total Foreign Government Bonds
(Cost $746,488) | | | | | | | 794,143 | |
| | | | | | | | |
|
| Mortgage-Backed Securities 1.7% | |
Commercial Mortgage Loans
(Collateralized Mortgage Obligations) 1.7% | |
Bank | | | | | | | | |
Series 2017-BNK5, Class A2
2.987%, due 6/15/60 | | | 300,000 | | | | 305,636 | |
Series 2018-BN14, Class A2
4.128%, due 9/15/60 | | | 400,000 | | | | 428,052 | |
| | | | |
| 14 | | MainStay VP Balanced Portfolio | | The notes to the financial statements are an integral part of,
and should be read in conjunction with, the financial statements. |
| | | | | | | | |
| | | Principal
Amount | | | Value | |
| Mortgage-Backed Securities (continued) | |
Commercial Mortgage Loans
(Collateralized Mortgage Obligations) (continued) | |
Benchmark Mortgage Trust | | | | | | | | |
Series 2018-B1, Class A2
3.571%, due 1/15/51 | | $ | 200,000 | | | $ | 208,222 | |
Series 2018-B2, Class A2
3.662%, due 2/15/51 | | | 150,000 | | | | 156,754 | |
CD Mortgage Trust
Series 2017-CD4, Class A2
3.03%, due 5/10/50 | | | 600,000 | | | | 610,796 | |
CFCRE Commercial Mortgage Trust
Series 2017-C8, Class A2
2.982%, due 6/15/50 | | | 900,000 | | | | 912,150 | |
DBJPM Mortgage Trust
Series 2017-C6, Class A2
2.917%, due 6/10/50 | | | 800,000 | | | | 813,345 | |
Federal Home Loan Mortgage Corporation Multifamily Structured Pass Through Certificates | | | | | | | | |
Series K090, Class A2
3.422%, due 2/25/29 | | | 300,000 | | | | 322,797 | |
Series K091, Class A2
3.505%, due 3/25/29 | | | 195,000 | | | | 211,386 | |
GRACE Mortgage Trust
Series 2014-GRCE, Class A
3.369%, due 6/10/28 (a) | | | 200,000 | | | | 203,777 | |
Morgan Stanley Bank of America Merrill Lynch Trust | | | | | | | | |
Series 2013-C13, Class A2
2.936%, due 11/15/46 | | | 5,323 | | | | 5,417 | |
Series 2017-C33, Class A2
3.14%, due 5/15/50 | | | 1,000,000 | | | | 1,021,497 | |
Morgan Stanley Capital I Trust
Series 2017-H1, Class A2
3.089%, due 6/15/50 | | | 900,000 | | | | 923,217 | |
UBS Commercial Mortgage Trust
Series 2018-C8, Class A2
3.713%, due 2/15/51 | | | 500,000 | | | | 521,353 | |
| | | | | | | | |
Total Mortgage-Backed Securities
(Cost $6,634,602) | | | | | | | 6,644,399 | |
| | | | | | | | |
|
| U.S. Government & Federal Agencies 17.9% | |
Federal Home Loan Bank 1.6% | | | | | | | | |
1.70%, due 5/15/20 | | | 500,000 | | | | 498,545 | |
2.30%, due 1/26/21 | | | 475,000 | | | | 475,107 | |
2.50%, due 12/10/27 | | | 1,050,000 | | | | 1,070,672 | |
2.51%, due 12/29/22 | | | 400,000 | | | | 400,447 | |
2.65%, due 5/23/22 | | | 275,000 | | | | 275,079 | |
3.00%, due 3/10/28 | | | 300,000 | | | | 316,958 | |
3.125%, due 9/12/25 | | | 800,000 | | | | 850,968 | |
| | | | | | | | |
| | | Principal
Amount | | | Value | |
Federal Home Loan Bank (continued) | | | | | | | | |
3.25%, due 6/9/28 | | $ | 800,000 | | | $ | 864,211 | |
3.25%, due 11/16/28 | | | 1,375,000 | | | | 1,494,223 | |
| | | | | | | | |
| | | | | | | 6,246,210 | |
| | | | | | | | |
Federal Home Loan Mortgage Corporation 1.0% | |
1.25%, due 8/15/19 | | | 350,000 | | | | 349,580 | |
2.55%, due 6/6/22 | | | 400,000 | | | | 400,149 | |
2.55%, due 6/20/22 | | | 325,000 | | | | 325,058 | |
2.70%, due 9/27/21 | | | 400,000 | | | | 400,489 | |
2.70%, due 4/5/22 | | | 400,000 | | | | 400,024 | |
2.70%, due 4/8/22 | | | 400,000 | | | | 400,629 | |
2.75%, due 6/17/24 | | | 400,000 | | | | 400,076 | |
2.753%, due 1/30/23 | | | 400,000 | | | | 400,215 | |
2.89%, due 4/16/24 | | | 400,000 | | | | 400,667 | |
2.90%, due 5/9/24 | | | 500,000 | | | | 500,318 | |
| | | | | | | | |
| | | | | | | 3,977,205 | |
| | | | | | | | |
Federal National Mortgage Association 0.4% | |
1.25%, due 7/26/19 | | | 450,000 | | | | 449,698 | |
1.875%, due 9/24/26 (d) | | | 1,125,000 | | | | 1,113,534 | |
| | | | | | | | |
| | | | | | | 1,563,232 | |
| | | | | | | | |
United States Treasury Notes 14.9% | | | | | | | | |
1.75%, due 6/15/22 | | | 8,000,000 | | | | 8,011,250 | |
1.875%, due 9/30/22 | | | 300,000 | | | | 301,477 | |
2.00%, due 5/31/24 | | | 9,900,000 | | | | 10,016,402 | |
2.125%, due 5/31/21 | | | 7,700,000 | | | | 7,752,336 | |
2.125%, due 5/31/26 | | | 900,000 | | | | 915,047 | |
2.25%, due 11/15/25 | | | 1,075,000 | | | | 1,100,909 | |
2.375%, due 4/30/20 | | | 425,000 | | | | 426,245 | |
2.375%, due 5/15/29 (d) | | | 1,825,000 | | | | 1,885,952 | |
2.50%, due 2/15/22 | | | 7,375,000 | | | | 7,519,907 | |
2.75%, due 4/30/23 | | | 3,825,000 | | | | 3,968,438 | |
2.875%, due 10/31/20 | | | 15,925,000 | | | | 16,132,149 | |
3.00%, due 9/30/25 | | | 1,200,000 | | | | 1,282,031 | |
| | | | | | | | |
| | | | | | | 59,312,143 | |
| | | | | | | | |
Total U.S. Government & Federal Agencies
(Cost $70,094,347) | | | | | | | 71,098,790 | |
| | | | | | | | |
TotalLong-Term Bonds
(Cost $146,296,616) | | | | | | | 149,359,469 | |
| | | | | | | | |
| | |
| | | | | | | | |
| | | Shares | | | | |
| Common Stocks 56.5% | |
Aerospace & Defense 0.8% | |
Arconic, Inc. | | | 6,422 | | | | 165,816 | |
Curtiss-Wright Corp. | | | 1,459 | | | | 185,483 | |
General Dynamics Corp. | | | 3,368 | | | | 612,370 | |
Hexcel Corp. | | | 2,161 | | | | 174,782 | |
Huntington Ingalls Industries, Inc. | | | 439 | | | | 98,661 | |
| | | | | | |
The notes to the financial statements are an integral part of,
and should be read in conjunction with, the financial statements. | | | | | 15 | |
Portfolio of InvestmentsJune 30, 2019 (Unaudited) (continued)
| | | | | | | | |
| | | Shares | | | Value | |
| Common Stocks (continued) | |
Aerospace & Defense (continued) | |
Raytheon Co. | | | 3,371 | | | $ | 586,149 | |
Spirit AeroSystems Holdings, Inc., Class A | | | 3,068 | | | | 249,643 | |
Textron, Inc. | | | 5,251 | | | | 278,513 | |
United Technologies Corp. | | | 5,452 | | | | 709,850 | |
| | | | | | | | |
| | | | | | | 3,061,267 | |
| | | | | | | | |
Air Freight & Logistics 0.2% | |
FedEx Corp. | | | 3,767 | | | | 618,504 | |
XPO Logistics, Inc. (e) | | | 1,040 | | | | 60,122 | |
| | | | | | | | |
| | | | | | | 678,626 | |
| | | | | | | | |
Airlines 1.0% | |
Alaska Air Group, Inc. | | | 10,895 | | | | 696,300 | |
Copa Holdings S.A., Class A | | | 2,942 | | | | 287,051 | |
Delta Air Lines, Inc. | | | 14,023 | | | | 795,805 | |
JetBlue Airways Corp. (e) | | | 16,752 | | | | 309,745 | |
Southwest Airlines Co. | | | 15,594 | | | | 791,863 | |
United Continental Holdings, Inc. (e) | | | 12,366 | | | | 1,082,643 | |
| | | | | | | | |
| | | | | | | 3,963,407 | |
| | | | | | | | |
Auto Components 0.2% | |
Aptiv PLC | | | 165 | | | | 13,337 | |
Lear Corp. | | | 4,726 | | | | 658,190 | |
| | | | | | | | |
| | | | | | | 671,527 | |
| | | | | | | | |
Automobiles 0.4% | |
Ford Motor Co. | | | 79,787 | | | | 816,221 | |
General Motors Co. | | | 15,803 | | | | 608,890 | |
| | | | | | | | |
| | | | | | | 1,425,111 | |
| | | | | | | | |
Banks 2.5% | |
Bank of America Corp. | | | 28,329 | | | | 821,541 | |
Bank OZK | | | 19,986 | | | | 601,379 | |
BB&T Corp. | | | 12,533 | | | | 615,746 | |
CIT Group, Inc. | | | 12,706 | | | | 667,573 | |
Citigroup, Inc. | | | 11,762 | | | | 823,693 | |
Citizens Financial Group, Inc. | | | 16,547 | | | | 585,102 | |
Comerica, Inc. | | | 6,618 | | | | 480,732 | |
Fifth Third Bancorp | | | 12,436 | | | | 346,964 | |
First Citizens BancShares, Inc., Class A | | | 722 | | | | 325,095 | |
First Hawaiian, Inc. | | | 20,661 | | | | 534,500 | |
JPMorgan Chase & Co. | | | 6,421 | | | | 717,868 | |
KeyCorp | | | 158 | | | | 2,804 | |
M&T Bank Corp. | | | 938 | | | | 159,526 | |
PNC Financial Services Group, Inc. | | | 4,509 | | | | 618,995 | |
Signature Bank | | | 2,782 | | | | 336,177 | |
SunTrust Banks, Inc. | | | 12,946 | | | | 813,656 | |
Synovus Financial Corp. | | | 7,553 | | | | 264,355 | |
U.S. Bancorp | | | 11,592 | | | | 607,421 | |
Wells Fargo & Co. | | | 15,210 | | | | 719,737 | |
| | | | | | | | |
| | | | | | | 10,042,864 | |
| | | | | | | | |
| | | | | | | | |
| | | Shares | | | Value | |
Beverages 0.8% | |
Coca-Cola Co. | | | 11,787 | | | $ | 600,194 | |
Constellation Brands, Inc., Class A | | | 3,256 | | | | 641,237 | |
Keurig Dr. Pepper, Inc. | | | 24,222 | | | | 700,016 | |
Molson Coors Brewing Co., Class B | | | 6,631 | | | | 371,336 | |
PepsiCo., Inc. | | | 5,264 | | | | 690,268 | |
| | | | | | | | |
| | | | | | | 3,003,051 | |
| | | | | | | | |
Biotechnology 1.0% | |
Alexion Pharmaceuticals, Inc. (e) | | | 4,807 | | | | 629,621 | |
Alkermes PLC (e) | | | 4,832 | | | | 108,913 | |
Amgen, Inc. | | | 3,803 | | | | 700,817 | |
Biogen, Inc. (e) | | | 3,320 | | | | 776,448 | |
Bluebird Bio, Inc. (e) | | | 231 | | | | 29,383 | |
Gilead Sciences, Inc. | | | 11,857 | | | | 801,059 | |
Regeneron Pharmaceuticals, Inc. (e) | | | 1,974 | | | | 617,862 | |
United Therapeutics Corp. (e) | | | 2,782 | | | | 217,163 | |
| | | | | | | | |
| | | | | | | 3,881,266 | |
| | | | | | | | |
Building Products 0.5% | |
Johnson Controls International PLC | | | 19,465 | | | | 804,099 | |
Masco Corp. | | | 18,505 | | | | 726,136 | |
Owens Corning | | | 7,384 | | | | 429,749 | |
| | | | | | | | |
| | | | | | | 1,959,984 | |
| | | | | | | | |
Capital Markets 1.8% | |
Ameriprise Financial, Inc. | | | 3,525 | | | | 511,689 | |
Bank of New York Mellon Corp. | | | 18,336 | | | | 809,534 | |
BlackRock, Inc. | | | 1,510 | | | | 708,643 | |
Charles Schwab Corp. | | | 17,560 | | | | 705,736 | |
CME Group, Inc. | | | 3,137 | | | | 608,923 | |
E*TRADE Financial Corp. | | | 8,557 | | | | 381,642 | |
Goldman Sachs Group, Inc. | | | 3,058 | | | | 625,667 | |
Intercontinental Exchange, Inc. | | | 8,241 | | | | 708,232 | |
Janus Henderson Group PLC | | | 13,894 | | | | 297,332 | |
Lazard, Ltd., Class A | | | 5,674 | | | | 195,129 | |
Morgan Stanley | | | 16,204 | | | | 709,897 | |
Northern Trust Corp. | | | 155 | | | | 13,950 | |
Raymond James Financial, Inc. | | | 2,575 | | | | 217,716 | |
State Street Corp. | | | 623 | | | | 34,925 | |
TD Ameritrade Holding Corp. | | | 14,318 | | | | 714,755 | |
| | | | | | | | |
| | | | | | | 7,243,770 | |
| | | | | | | | |
Chemicals 1.8% | |
Air Products & Chemicals, Inc. | | | 3,530 | | | | 799,086 | |
Celanese Corp. | | | 3,921 | | | | 422,684 | |
CF Industries Holdings, Inc. | | | 17,384 | | | | 812,007 | |
Corteva, Inc. (e) | | | 9,936 | | | | 293,808 | |
Dow, Inc. (e) | | | 15,672 | | | | 772,786 | |
DuPont de Nemours, Inc. | | | 8,160 | | | | 612,571 | |
FMC Corp. | | | 2,998 | | | | 248,684 | |
Huntsman Corp. | | | 21,811 | | | | 445,817 | |
Linde PLC | | | 3,003 | | | | 603,002 | |
LyondellBasell Industries N.V., Class A | | | 9,164 | | | | 789,295 | |
| | | | |
| 16 | | MainStay VP Balanced Portfolio | | The notes to the financial statements are an integral part of,
and should be read in conjunction with, the financial statements. |
| | | | | | | | |
| | | Shares | | | Value | |
| Common Stocks (continued) | |
Chemicals (continued) | |
Mosaic Co. | | | 6,976 | | | $ | 174,609 | |
PPG Industries, Inc. | | | 6,843 | | | | 798,647 | |
Valvoline, Inc. | | | 13,682 | | | | 267,210 | |
| | | | | | | | |
| | | | | | | 7,040,206 | |
| | | | | | | | |
Commercial Services & Supplies 0.4% | |
ADT, Inc. (d) | | | 32,695 | | | | 200,093 | |
Clean Harbors, Inc. (e) | | | 8,829 | | | | 627,742 | |
IAA, Inc. (e) | | | 578 | | | | 22,415 | |
KAR Auction Services, Inc. | | | 578 | | | | 14,450 | |
Republic Services, Inc. | | | 818 | | | | 70,871 | |
Waste Management, Inc. | | | 6,899 | | | | 795,938 | |
| | | | | | | | |
| | | | | | | 1,731,509 | |
| | | | | | | | |
Communications Equipment 0.2% | |
CommScope Holding Co., Inc. (e) | | | 13,606 | | | | 214,022 | |
EchoStar Corp., Class A (e) | | | 9,336 | | | | 413,771 | |
Motorola Solutions, Inc. | | | 461 | | | | 76,863 | |
| | | | | | | | |
| | | | | | | 704,656 | |
| | | | | | | | |
Construction & Engineering 0.2% | |
AECOM (e) | | | 19,101 | | | | 722,973 | |
| | | | | | | | |
|
Construction Materials 0.3% | |
Eagle Materials, Inc. | | | 5,813 | | | | 538,865 | |
Martin Marietta Materials, Inc. | | | 1,862 | | | | 428,465 | |
Vulcan Materials Co. | | | 504 | | | | 69,204 | |
| | | | | | | | |
| | | | | | | 1,036,534 | |
| | | | | | | | |
Consumer Finance 1.0% | |
American Express Co. | | | 5,636 | | | | 695,708 | |
Capital One Financial Corp. | | | 8,846 | | | | 802,686 | |
Discover Financial Services | | | 12,088 | | | | 937,908 | |
OneMain Holdings, Inc. | | | 1,810 | | | | 61,196 | |
SLM Corp. | | | 65,430 | | | | 635,980 | |
Synchrony Financial | | | 28,639 | | | | 992,914 | |
| | | | | | | | |
| | | | | | | 4,126,392 | |
| | | | | | | | |
Containers & Packaging 0.5% | |
Ardagh Group S.A. | | | 9,164 | | | | 160,370 | |
Ball Corp. | | | 9,458 | | | | 661,965 | |
Berry Global Group, Inc. (e) | | | 12,347 | | | | 649,329 | |
International Paper Co. | | | 720 | | | | 31,190 | |
Silgan Holdings, Inc. | | | 18,018 | | | | 551,351 | |
WestRock Co. | | | 2,899 | | | | 105,727 | |
| | | | | | | | |
| | | | | | | 2,159,932 | |
| | | | | | | | |
Diversified Consumer Services 0.3% | |
Graham Holdings Co., Class B | | | 714 | | | | 492,682 | |
H&R Block, Inc. | | | 23,193 | | | | 679,555 | |
ServiceMaster Global Holdings, Inc. (e) | | | 1,515 | | | | 78,916 | |
| | | | | | | | |
| | | | | | | 1,251,153 | |
| | | | | | | | |
| | | | | | | | |
| | | Shares | | | Value | |
Diversified Financial Services 0.5% | |
AXA Equitable Holdings, Inc. | | | 31,542 | | | $ | 659,228 | |
Berkshire Hathaway, Inc., Class B (e) | | | 3,341 | | | | 712,201 | |
Voya Financial, Inc. | | | 13,392 | | | | 740,577 | |
| | | | | | | | |
| | | | | | | 2,112,006 | |
| | | | | | | | |
Diversified Telecommunication Services 0.4% | |
AT&T, Inc. | | | 21,414 | | | | 717,583 | |
CenturyLink, Inc. | | | 14,422 | | | | 169,603 | |
Verizon Communications, Inc. | | | 12,223 | | | | 698,300 | |
| | | | | | | | |
| | | | | | | 1,585,486 | |
| | | | | | | | |
Electric Utilities 2.0% | |
American Electric Power Co., Inc. | | | 7,871 | | | | 692,727 | |
Avangrid, Inc. | | | 2,915 | | | | 147,208 | |
Duke Energy Corp. | | | 6,849 | | | | 604,356 | |
Edison International | | | 1,974 | | | | 133,067 | |
Entergy Corp. | | | 7,843 | | | | 807,280 | |
Evergy, Inc. | | | 1,520 | | | | 91,428 | |
Eversource Energy | | | 3,290 | | | | 249,250 | |
Exelon Corp. | | | 14,576 | | | | 698,773 | |
FirstEnergy Corp. | | | 4,473 | | | | 191,489 | |
Hawaiian Electric Industries, Inc. | | | 15,049 | | | | 655,384 | |
NextEra Energy, Inc. | | | 2,967 | | | | 607,820 | |
OGE Energy Corp. | | | 6,214 | | | | 264,468 | |
PG&E Corp. (e) | | | 12,791 | | | | 293,170 | |
Pinnacle West Capital Corp. | | | 4,791 | | | | 450,785 | |
PPL Corp. | | | 17,011 | | | | 527,511 | |
Southern Co. | | | 12,670 | | | | 700,398 | |
Xcel Energy, Inc. | | | 16,029 | | | | 953,565 | |
| | | | | | | | |
| | | | | | | 8,068,679 | |
| | | | | | | | |
Electrical Equipment 0.7% | |
Acuity Brands, Inc. | | | 4,576 | | | | 631,076 | |
Eaton Corp. PLC | | | 8,430 | | | | 702,050 | |
Emerson Electric Co. | | | 10,577 | | | | 705,697 | |
GrafTech International, Ltd. | | | 10,735 | | | | 123,453 | |
Regal Beloit Corp. | | | 6,756 | | | | 552,033 | |
| | | | | | | | |
| | | | | | | 2,714,309 | |
| | | | | | | | |
Electronic Equipment, Instruments & Components 0.4% | |
Avnet, Inc. | | | 14,645 | | | | 662,979 | |
Corning, Inc. | | | 3,566 | | | | 118,498 | |
Jabil, Inc. | | | 21,342 | | | | 674,408 | |
| | | | | | | | |
| | | | | | | 1,455,885 | |
| | | | | | | | |
Energy Equipment & Services 0.5% | |
Halliburton Co. | | | 1,281 | | | | 29,130 | |
Helmerich & Payne, Inc. | | | 6,194 | | | | 313,540 | |
Nabors Industries, Ltd. | | | 87,444 | | | | 253,588 | |
Patterson-UTI Energy, Inc. | | | 47,249 | | | | 543,836 | |
RPC, Inc. (d) | | | 30,349 | | | | 218,816 | |
Schlumberger, Ltd. | | | 17,852 | | | | 709,439 | |
| | | | | | | | |
| | | | | | | 2,068,349 | |
| | | | | | | | |
| | | | | | |
The notes to the financial statements are an integral part of,
and should be read in conjunction with, the financial statements. | | | | | 17 | |
Portfolio of InvestmentsJune 30, 2019 (Unaudited) (continued)
| | | | | | | | |
| | | Shares | | | Value | |
| Common Stocks (continued) | |
Entertainment 0.9% | |
Activision Blizzard, Inc. | | | 12,895 | | | $ | 608,644 | |
Cinemark Holdings, Inc. | | | 13,795 | | | | 497,999 | |
Electronic Arts, Inc. (e) | | | 6,191 | | | | 626,901 | |
Take-Two Interactive Software, Inc. (e) | | | 5,395 | | | | 612,494 | |
Viacom, Inc. | | | | | | | | |
Class A (d) | | | 3,735 | | | | 127,364 | |
Class B | | | 21,159 | | | | 632,019 | |
Walt Disney Co. | | | 4,292 | | | | 599,335 | |
| | | | | | | | |
| | | | | | | 3,704,756 | |
| | | | | | | | |
Equity Real Estate Investment Trusts 4.7% | |
American Campus Communities, Inc. | | | 13,909 | | | | 642,039 | |
American Homes 4 Rent, Class A | | | 13,767 | | | | 334,676 | |
Apartment Investment & Management Co., Class A | | | 10,015 | | | | 501,952 | |
Apple Hospitality REIT, Inc. | | | 38,064 | | | | 603,695 | |
AvalonBay Communities, Inc. | | | 3,633 | | | | 738,153 | |
Boston Properties, Inc. | | | 608 | | | | 78,432 | |
Brandywine Realty Trust | | | 15,197 | | | | 217,621 | |
Brixmor Property Group, Inc. | | | 19,470 | | | | 348,124 | |
Brookfield Property REIT, Inc., Class A | | | 15,462 | | | | 292,077 | |
Camden Property Trust | | | 4,514 | | | | 471,216 | |
Colony Capital, Inc. | | | 113,615 | | | | 568,075 | |
Corporate Office Properties Trust | | | 7,046 | | | | 185,803 | |
Digital Realty Trust, Inc. | | | 2,485 | | | | 292,708 | |
Douglas Emmett, Inc. | | | 4,334 | | | | 172,667 | |
Empire State Realty Trust, Inc., Class A | | | 37,705 | | | | 558,411 | |
EPR Properties | | | 8,826 | | | | 658,331 | |
Equity Residential | | | 9,811 | | | | 744,851 | |
Essex Property Trust, Inc. | | | 2,062 | | | | 601,960 | |
Gaming and Leisure Properties, Inc. | | | 17,739 | | | | 691,466 | |
Hospitality Properties Trust | | | 23,015 | | | | 575,375 | |
Host Hotels & Resorts, Inc. | | | 48,619 | | | | 885,838 | |
Iron Mountain, Inc. | | | 10,035 | | | | 314,095 | |
Kimco Realty Corp. | | | 2,426 | | | | 44,832 | |
Lamar Advertising Co., Class A | | | 516 | | | | 41,646 | |
Medical Properties Trust, Inc. | | | 4,124 | | | | 71,923 | |
Mid-America Apartment Communities, Inc. | | | 6,866 | | | | 808,540 | |
National Retail Properties, Inc. | | | 2,558 | | | | 135,600 | |
Omega Healthcare Investors, Inc. | | | 19,664 | | | | 722,652 | |
Outfront Media, Inc. | | | 4,116 | | | | 106,152 | |
Park Hotels & Resorts, Inc. | | | 17,703 | | | | 487,895 | |
Prologis, Inc. | | | 7,711 | | | | 617,651 | |
Public Storage | | | 3,377 | | | | 804,300 | |
Rayonier, Inc. | | | 7,487 | | | | 226,856 | |
Realty Income Corp. | | | 7,216 | | | | 497,688 | |
Retail Properties of America, Inc., Class A | | | 379 | | | | 4,457 | |
Simon Property Group, Inc. | | | 4,964 | | | | 793,049 | |
Sun Communities, Inc. | | | 804 | | | | 103,065 | |
Taubman Centers, Inc. | | | 270 | | | | 11,024 | |
| | | | | | | | |
| | | Shares | | | Value | |
Equity Real Estate Investment Trusts (continued) | |
UDR, Inc. | | | 2,544 | | | $ | 114,200 | |
Ventas, Inc. | | | 14,021 | | | | 958,335 | |
VEREIT, Inc. | | | 67,660 | | | | 609,617 | |
Weingarten Realty Investors | | | 5,766 | | | | 158,104 | |
Welltower, Inc. | | | 12,000 | | | | 978,360 | |
Weyerhaeuser Co. | | | 913 | | | | 24,048 | |
| | | | | | | | |
| | | | | | | 18,797,559 | |
| | | | | | | | |
Food & Staples Retailing 0.4% | |
Casey’s General Stores, Inc. | | | 60 | | | | 9,359 | |
Kroger Co. | | | 2,632 | | | | 57,141 | |
Walgreens Boots Alliance, Inc. | | | 13,299 | | | | 727,056 | |
Walmart, Inc. | | | 7,177 | | | | 792,987 | |
| | | | | | | | |
| | | | | | | 1,586,543 | |
| | | | | | | | |
Food Products 1.9% | |
Archer-Daniels-Midland Co. | | | 3,635 | | | | 148,308 | |
Campbell Soup Co. | | | 14,700 | | | | 589,029 | |
Flowers Foods, Inc. | | | 27,516 | | | | 640,297 | |
General Mills, Inc. | | | 13,576 | | | | 713,011 | |
Ingredion, Inc. | | | 3,835 | | | | 316,349 | |
J.M. Smucker Co. | | | 7,360 | | | | 847,798 | |
Kellogg Co. | | | 3,633 | | | | 194,620 | |
Kraft Heinz Co. | | | 22,588 | | | | 701,132 | |
McCormick & Co., Inc. | | | 78 | | | | 12,091 | |
Mondelez International, Inc., Class A | | | 11,064 | | | | 596,350 | |
Pilgrim’s Pride Corp. (e) | | | 20,848 | | | | 529,331 | |
Post Holdings, Inc. (e) | | | 5,267 | | | | 547,610 | |
TreeHouse Foods, Inc. (e) | | | 10,712 | | | | 579,519 | |
Tyson Foods, Inc., Class A | | | 14,719 | | | | 1,188,412 | |
| | | | | | | | |
| | | | | | | 7,603,857 | |
| | | | | | | | |
Gas Utilities 0.2% | |
National Fuel Gas Co. | | | 5,531 | | | | 291,760 | |
UGI Corp. | | | 6,994 | | | | 373,550 | |
| | | | | | | | |
| | | | | | | 665,310 | |
| | | | | | | | |
Health Care Equipment & Supplies 1.5% | |
Abbott Laboratories | | | 8,397 | | | | 706,188 | |
Baxter International, Inc. | | | 8,640 | | | | 707,616 | |
Becton, Dickinson and Co. | | | 2,428 | | | | 611,880 | |
Cooper Cos., Inc. | | | 2,500 | | | | 842,225 | |
Danaher Corp. | | | 4,276 | | | | 611,126 | |
DENTSPLY SIRONA, Inc. | | | 11,157 | | | | 651,122 | |
Hill-Rom Holdings, Inc. | | | 4,899 | | | | 512,533 | |
Hologic, Inc. (e) | | | 482 | | | | 23,146 | |
Medtronic PLC | | | 7,165 | | | | 697,799 | |
STERIS PLC (e) | | | 2,528 | | | | 376,369 | |
Zimmer Biomet Holdings, Inc. | | | 1,539 | | | | 181,202 | |
| | | | | | | | |
| | | | | | | 5,921,206 | |
| | | | | | | | |
| | | | |
| 18 | | MainStay VP Balanced Portfolio | | The notes to the financial statements are an integral part of,
and should be read in conjunction with, the financial statements. |
| | | | | | | | |
| | | Shares | | | Value | |
| Common Stocks (continued) | |
Health Care Providers & Services 1.2% | |
Anthem, Inc. | | | 2,159 | | | $ | 609,291 | |
Cardinal Health, Inc. | | | 8,977 | | | | 422,817 | |
Cigna Corp. (e) | | | 3,840 | | | | 604,992 | |
CVS Health Corp. | | | 11,221 | | | | 611,432 | |
Encompass Health Corp. | | | 193 | | | | 12,228 | |
HCA Healthcare, Inc. | | | 5,915 | | | | 799,531 | |
Henry Schein, Inc. (e) | | | 3,755 | | | | 262,474 | |
Humana, Inc. | | | 2,299 | | | | 609,925 | |
McKesson Corp. | | | 4,087 | | | | 549,252 | |
Universal Health Services, Inc., Class B | | | 2,645 | | | | 344,882 | |
| | | | | | | | |
| | | | | | | 4,826,824 | |
| | | | | | | | |
Hotels, Restaurants & Leisure 1.6% | |
Aramark | | | 20,145 | | | | 726,429 | |
Caesars Entertainment Corp. (e) | | | 16,787 | | | | 198,422 | |
Carnival Corp. | | | 17,423 | | | | 811,041 | |
Darden Restaurants, Inc. | | | 2,032 | | | | 247,355 | |
Las Vegas Sands Corp. | | | 11,871 | | | | 701,457 | |
McDonald’s Corp. | | | 2,945 | | | | 611,559 | |
MGM Resorts International | | | 14,897 | | | | 425,607 | |
Norwegian Cruise Line Holdings, Ltd. (e) | | | 9,927 | | | | 532,385 | |
Royal Caribbean Cruises, Ltd. | | | 4,955 | | | | 600,596 | |
Yum China Holdings, Inc. | | | 17,821 | | | | 823,330 | |
Yum! Brands, Inc. | | | 5,472 | | | | 605,586 | |
| | | | | | | | |
| | | | | | | 6,283,767 | |
| | | | | | | | |
Household Durables 0.6% | |
Garmin, Ltd. | | | 2,490 | | | | 198,702 | |
Lennar Corp., Class A | | | 150 | | | | 7,269 | |
Newell Brands, Inc. | | | 2,392 | | | | 36,885 | |
PulteGroup, Inc. | | | 22,098 | | | | 698,739 | |
Toll Brothers, Inc. | | | 16,486 | | | | 603,717 | |
Whirlpool Corp. | | | 5,428 | | | | 772,730 | |
| | | | | | | | |
| | | | | | | 2,318,042 | |
| | | | | | | | |
Household Products 0.5% | |
Colgate-Palmolive Co. | | | 8,328 | | | | 596,868 | |
Kimberly-Clark Corp. | | | 5,926 | | | | 789,817 | |
Procter & Gamble Co. | | | 6,348 | | | | 696,058 | |
| | | | | | | | |
| | | | | | | 2,082,743 | |
| | | | | | | | |
Independent Power & Renewable Electricity Producers 0.5% | |
AES Corp. | | | 26,835 | | | | 449,754 | |
NRG Energy, Inc. | | | 20,707 | | | | 727,230 | |
Vistra Energy Corp. | | | 32,853 | | | | 743,792 | |
| | | | | | | | |
| | | | | | | 1,920,776 | |
| | | | | | | | |
Industrial Conglomerates 0.9% | |
3M Co. | | | 4,052 | | | | 702,374 | |
Carlisle Cos., Inc. | | | 4,707 | | | | 660,910 | |
General Electric Co. | | | 58,675 | | | | 616,088 | |
Honeywell International, Inc. | | | 4,012 | | | | 700,455 | |
| | | | | | | | |
| | | Shares | | | Value | |
Industrial Conglomerates (continued) | |
Roper Technologies, Inc. | | | 2,245 | | | $ | 822,253 | |
| | | | | | | | |
| | | | | | | 3,502,080 | |
| | | | | | | | |
Insurance 4.6% | |
Aflac, Inc. | | | 12,843 | | | | 703,925 | |
Allstate Corp. | | | 7,947 | | | | 808,130 | |
American International Group, Inc. | | | 15,129 | | | | 806,073 | |
American National Insurance Co. | | | 2,209 | | | | 257,282 | |
Arch Capital Group, Ltd. (e) | | | 24,071 | | | | 892,553 | |
Arthur J. Gallagher & Co. | | | 2,583 | | | | 226,245 | |
Assured Guaranty, Ltd. | | | 14,528 | | | | 611,338 | |
Athene Holding, Ltd., Class A (e) | | | 7,601 | | | | 327,299 | |
AXIS Capital Holdings, Ltd. | | | 6,187 | | | | 369,055 | |
Brighthouse Financial, Inc. (e) | | | 13,983 | | | | 513,036 | |
Chubb, Ltd. | | | 4,738 | | | | 697,860 | |
Cincinnati Financial Corp. | | | 323 | | | | 33,485 | |
CNA Financial Corp. | | | 5,837 | | | | 274,748 | |
Fidelity National Financial, Inc. | | | 20,591 | | | | 829,817 | |
First American Financial Corp. | | | 12,486 | | | | 670,498 | |
Hanover Insurance Group, Inc. | | | 4,098 | | | | 525,773 | |
Hartford Financial Services Group, Inc. | | | 13,320 | | | | 742,190 | |
Kemper Corp. | | | 3,461 | | | | 298,650 | |
Lincoln National Corp. | | | 13,466 | | | | 867,884 | |
Marsh & McLennan Cos., Inc. | | | 6,175 | | | | 615,956 | |
Mercury General Corp. | | | 9,432 | | | | 589,500 | |
MetLife, Inc. | | | 16,178 | | | | 803,561 | |
Old Republic International Corp. | | | 30,861 | | | | 690,669 | |
Principal Financial Group, Inc. | | | 9,264 | | | | 536,571 | |
Progressive Corp. | | | 10,060 | | | | 804,096 | |
Prudential Financial, Inc. | | | 8,025 | | | | 810,525 | |
Reinsurance Group of America, Inc. | | | 5,166 | | | | 806,051 | |
RenaissanceRe Holdings, Ltd. | | | 1,070 | | | | 190,471 | |
Travelers Cos., Inc. | | | 5,313 | | | | 794,400 | |
Unum Group | | | 10,779 | | | | 361,636 | |
W.R. Berkley Corp. | | | 4,165 | | | | 274,599 | |
Willis Towers Watson PLC | | | 2,617 | | | | 501,260 | |
| | | | | | | | |
| | | | | | | 18,235,136 | |
| | | | | | | | |
Interactive Media & Services 0.1% | |
IAC/InterActiveCorp (e) | | | 1,072 | | | | 233,192 | |
| | | | | | | | |
|
IT Services 1.7% | |
Akamai Technologies, Inc. (e) | | | 5,886 | | | | 471,704 | |
Amdocs, Ltd. | | | 2,078 | | | | 129,023 | |
Booz Allen Hamilton Holding Corp. | | | 1,995 | | | | 132,089 | |
CACI International, Inc., Class A (e) | | | 1,508 | | | | 308,522 | |
Cognizant Technology Solutions Corp., Class A | | | 12,538 | | | | 794,784 | |
Conduent, Inc. (e) | | | 32,621 | | | | 312,835 | |
DXC Technology Co. | | | 7,779 | | | | 429,012 | |
Euronet Worldwide, Inc. (e) | | | 36 | | | | 6,057 | |
Fidelity National Information Services, Inc. | | | 9,336 | | | | 1,145,340 | |
International Business Machines Corp. | | | 5,707 | | | | 786,995 | |
| | | | | | |
The notes to the financial statements are an integral part of,
and should be read in conjunction with, the financial statements. | | | | | 19 | |
Portfolio of InvestmentsJune 30, 2019 (Unaudited) (continued)
| | | | | | | | |
| | | Shares | | | Value | |
| Common Stocks (continued) | |
IT Services (continued) | |
Leidos Holdings, Inc. | | | 10,556 | | | $ | 842,897 | |
Western Union Co. | | | 15,922 | | | | 316,689 | |
Worldpay, Inc. (e) | | | 9,959 | | | | 1,220,475 | |
| | | | | | | | |
| | | | | | | 6,896,422 | |
| | | | | | | | |
Life Sciences Tools & Services 0.3% | |
Agilent Technologies, Inc. | | | 1,593 | | | | 118,949 | |
Charles River Laboratories International, Inc. (e) | | | 1,484 | | | | 210,580 | |
IQVIA Holdings, Inc. (e) | | | 1,756 | | | | 282,540 | |
Thermo Fisher Scientific, Inc. | | | 2,383 | | | | 699,840 | |
| | | | | | | | |
| | | | | | | 1,311,909 | |
| | | | | | | | |
Machinery 1.5% | |
AGCO Corp. | | | 8,911 | | | | 691,226 | |
Caterpillar, Inc. | | | 5,154 | | | | 702,439 | |
Cummins, Inc. | | | 6,582 | | | | 1,127,760 | |
Deere & Co. | | | 3,627 | | | | 601,030 | |
Dover Corp. | | | 3,354 | | | | 336,071 | |
Flowserve Corp. | | | 270 | | | | 14,226 | |
Fortive Corp. | | | 59 | | | | 4,810 | |
ITT, Inc. | | | 1,020 | | | | 66,790 | |
Oshkosh Corp. | | | 8,429 | | | | 703,737 | |
PACCAR, Inc. | | | 7,273 | | | | 521,183 | |
Parker-Hannifin Corp. | | | 344 | | | | 58,483 | |
Pentair PLC | | | 4,724 | | | | 175,733 | |
Stanley Black & Decker, Inc. | | | 766 | | | | 110,771 | |
Timken Co. | | | 12,450 | | | | 639,183 | |
| | | | | | | | |
| | | | | | | 5,753,442 | |
| | | | | | | | |
Media 1.5% | |
Charter Communications, Inc., Class A (e) | | | 2,036 | | | | 804,587 | |
Comcast Corp., Class A | | | 18,776 | | | | 793,849 | |
Discovery, Inc. (e) | | | | | | | | |
Class A (d) | | | 18,410 | | | | 565,187 | |
Class C | | | 8,654 | | | | 246,206 | |
DISH Network Corp., Class A (e) | | | 20,457 | | | | 785,753 | |
Fox Corp., Class A (e) | | | 1,151 | | | | 42,173 | |
Interpublic Group of Cos., Inc. | | | 32,658 | | | | 737,744 | |
Liberty Media Corp-Liberty SiriusXM (e) | | | | | | | | |
Class A | | | 6,351 | | | | 240,131 | |
Class C | | | 2,103 | | | | 79,872 | |
News Corp. | | | | | | | | |
Class A | | | 18,085 | | | | 243,967 | |
Class B | | | 12,855 | | | | 179,456 | |
Nexstar Media Group, Inc., Class A | | | 2,538 | | | | 256,338 | |
Omnicom Group, Inc. | | | 8,833 | | | | 723,864 | |
Sinclair Broadcast Group, Inc., Class A | | | 4,458 | | | | 239,083 | |
| | | | | | | | |
| | | | | | | 5,938,210 | |
| | | | | | | | |
Metals & Mining 0.4% | |
Newmont Goldcorp Corp. | | | 8,943 | | | | 344,037 | |
Nucor Corp. | | | 2,494 | | | | 137,419 | |
| | | | | | | | |
| | | Shares | | | Value | |
Metals & Mining (continued) | |
Southern Copper Corp. | | | 17,852 | | | $ | 693,550 | |
Steel Dynamics, Inc. | | | 14,198 | | | | 428,780 | |
| | | | | | | | |
| | | | | | | 1,603,786 | |
| | | | | | | | |
Multi-Utilities 1.7% | |
Ameren Corp. | | | 12,912 | | | | 969,820 | |
CenterPoint Energy, Inc. | | | 31,959 | | | | 914,986 | |
CMS Energy Corp. | | | 5,555 | | | | 321,690 | |
Consolidated Edison, Inc. | | | 6,457 | | | | 566,150 | |
Dominion Energy, Inc. | | | 7,880 | | | | 609,282 | |
DTE Energy Co. | | | 9,249 | | | | 1,182,762 | |
Public Service Enterprise Group, Inc. | | | 8,085 | | | | 475,560 | |
Sempra Energy | | | 4,434 | | | | 609,409 | |
WEC Energy Group, Inc. | | | 12,815 | | | | 1,068,386 | |
| | | | | | | | |
| | | | | | | 6,718,045 | |
| | | | | | | | |
Multiline Retail 0.5% | |
Dollar Tree, Inc. (e) | | | 9,351 | | | | 1,004,204 | |
Target Corp. | | | 9,237 | | | | 800,017 | |
| | | | | | | | |
| | | | | | | 1,804,221 | |
| | | | | | | | |
Oil, Gas & Consumable Fuels 3.1% | |
Anadarko Petroleum Corp. | | | 11,216 | | | | 791,401 | |
Apache Corp. | | | 10,533 | | | | 305,141 | |
Cabot Oil & Gas Corp. | | | 24,150 | | | | 554,484 | |
Chevron Corp. | | | 6,379 | | | | 793,803 | |
Concho Resources, Inc. | | | 659 | | | | 67,996 | |
ConocoPhillips | | | 12,600 | | | | 768,600 | |
Continental Resources, Inc. (e) | | | 8,609 | | | | 362,353 | |
Devon Energy Corp. | | | 29,755 | | | | 848,613 | |
EOG Resources, Inc. | | | 8,493 | | | | 791,208 | |
EQT Corp. | | | 4,033 | | | | 63,762 | |
Equitrans Midstream Corp. (e) | | | 3,341 | | | | 65,851 | |
Exxon Mobil Corp. | | | 9,094 | | | | 696,873 | |
Hess Corp. | | | 81 | | | | 5,149 | |
HollyFrontier Corp. | | | 16,042 | | | | 742,424 | |
Kinder Morgan, Inc. | | | 29,195 | | | | 609,592 | |
Marathon Oil Corp. | | | 43,555 | | | | 618,917 | |
Marathon Petroleum Corp. | | | 12,850 | | | | 718,058 | |
Occidental Petroleum Corp. | | | 11,951 | | | | 600,896 | |
ONEOK, Inc. | | | 176 | | | | 12,111 | |
PBF Energy, Inc., Class A | | | 20,038 | | | | 627,189 | |
Phillips 66 | | | 8,523 | | | | 797,241 | |
Valero Energy Corp. | | | 9,309 | | | | 796,943 | |
Williams Cos., Inc. | | | 16,613 | | | | 465,828 | |
| | | | | | | | |
| | | | | | | 12,104,433 | |
| | | | | | | | |
Paper & Forest Products 0.1% | |
Domtar Corp. | | | 9,159 | | | | 407,850 | |
| | | | | | | | |
|
Pharmaceuticals 1.0% | |
Allergan PLC | | | 4,247 | | | | 711,075 | |
Bristol-Myers Squibb Co. | | | 15,508 | | | | 703,288 | |
| | | | |
| 20 | | MainStay VP Balanced Portfolio | | The notes to the financial statements are an integral part of,
and should be read in conjunction with, the financial statements. |
| | | | | | | | |
| | | Shares | | | Value | |
| Common Stocks (continued) | |
Pharmaceuticals (continued) | |
Elanco Animal Health, Inc. (e) | | | 7,658 | | | $ | 258,841 | |
Horizon Therapeutics PLC (e) | | | 12,197 | | | | 293,460 | |
Jazz Pharmaceuticals PLC (e) | | | 1,820 | | | | 259,459 | |
Johnson & Johnson | | | 4,247 | | | | 591,522 | |
Merck & Co., Inc. | | | 8,338 | | | | 699,141 | |
Perrigo Co. PLC | | | 197 | | | | 9,381 | |
Pfizer, Inc. | | | 14,016 | | | | 607,173 | |
| | | | | | | | |
| | | | | | | 4,133,340 | |
| | | | | | | | |
Professional Services 0.4% | |
IHS Markit, Ltd. (e) | | | 1,505 | | | | 95,899 | |
ManpowerGroup, Inc. | | | 7,175 | | | | 693,105 | |
Nielsen Holdings PLC | | | 31,614 | | | | 714,476 | |
| | | | | | | | |
| | | | | | | 1,503,480 | |
| | | | | | | | |
Real Estate Management & Development 0.0%‡ | |
Realogy Holdings Corp. (d) | | | 13,101 | | | | 94,851 | |
| | | | | | | | |
|
Road & Rail 0.6% | |
CSX Corp. | | | 10,379 | | | | 803,023 | |
Genesee & Wyoming, Inc., Class A (e) | | | 1,612 | | | | 161,200 | |
Norfolk Southern Corp. | | | 3,613 | | | | 720,179 | |
Uber Technologies, Inc. (e) | | | 16,391 | | | | 760,215 | |
| | | | | | | | |
| | | | | | | 2,444,617 | |
| | | | | | | | |
Semiconductors & Semiconductor Equipment 1.7% | |
Analog Devices, Inc. | | | 8,495 | | | | 958,831 | |
Applied Materials, Inc. | | | 18,143 | | | | 814,802 | |
Cypress Semiconductor Corp. | | | 29,681 | | | | 660,106 | |
Intel Corp. | | | 16,407 | | | | 785,403 | |
Lam Research Corp. | | | 1,554 | | | | 291,903 | |
Microchip Technology, Inc. | | | 317 | | | | 27,484 | |
Micron Technology, Inc. (e) | | | 21,347 | | | | 823,781 | |
ON Semiconductor Corp. (e) | | | 17,258 | | | | 348,784 | |
Qorvo, Inc. (e) | | | 11,541 | | | | 768,746 | |
Skyworks Solutions, Inc. | | | 8,670 | | | | 669,931 | |
Teradyne, Inc. | | | 8,488 | | | | 406,660 | |
| | | | | | | | |
| | | | | | | 6,556,431 | |
| | | | | | | | |
Software 0.7% | |
Autodesk, Inc. (e) | | | 3,708 | | | | 604,033 | |
LogMeIn, Inc. | | | 7,779 | | | | 573,157 | |
Nuance Communications, Inc. (e) | | | 38,487 | | | | 614,637 | |
SS&C Technologies Holdings, Inc. | | | 613 | | | | 35,315 | |
Symantec Corp. | | | 38,160 | | | | 830,362 | |
Teradata Corp. (e) | | | 8,063 | | | | 289,058 | |
| | | | | | | | |
| | | | | | | 2,946,562 | |
| | | | | | | | |
Specialty Retail 1.1% | |
Advance Auto Parts, Inc. | | | 2,935 | | | | 452,401 | |
AutoZone, Inc. (e) | | | 311 | | | | 341,935 | |
Best Buy Co., Inc. | | | 12,446 | | | | 867,860 | |
| | | | | | | | |
| | | Shares | | | Value | |
Specialty Retail (continued) | |
Dick’s Sporting Goods, Inc. | | | 14,486 | | | $ | 501,650 | |
Foot Locker, Inc. | | | 6,554 | | | | 274,744 | |
Home Depot, Inc. | | | 3,374 | | | | 701,691 | |
L Brands, Inc. | | | 17,840 | | | | 465,624 | |
Michaels Cos., Inc. (e) | | | 27,592 | | | | 240,050 | |
Williams-Sonoma, Inc. (d) | | | 10,510 | | | | 683,150 | |
| | | | | | | | |
| | | | | | | 4,529,105 | |
| | | | | | | | |
Technology Hardware, Storage & Peripherals 0.7% | |
Dell Technologies, Inc. (e) | | | 19,133 | | | | 971,957 | |
Hewlett Packard Enterprise Co. | | | 2,265 | | | | 33,862 | |
HP, Inc. | | | 38,031 | | | | 790,664 | |
NCR Corp. (e) | | | 8,737 | | | | 271,721 | |
Western Digital Corp. | | | 126 | | | | 5,991 | |
Xerox Corp. | | | 20,523 | | | | 726,719 | |
| | | | | | | | |
| | | | | | | 2,800,914 | |
| | | | | | | | |
Textiles, Apparel & Luxury Goods 0.3% | |
Ralph Lauren Corp. | | | 5,934 | | | | 674,043 | |
Skechers U.S.A., Inc., Class A (e) | | | 19,332 | | | | 608,765 | |
| | | | | | | | |
| | | | | | | 1,282,808 | |
| | | | | | | | |
Thrifts & Mortgage Finance 0.2% | |
MGIC Investment Corp. (e) | | | 23,004 | | | | 302,273 | |
New York Community Bancorp, Inc. | | | 33,196 | | | | 331,296 | |
| | | | | | | | |
| | | | | | | 633,569 | |
| | | | | | | | |
Tobacco 0.3% | |
Altria Group, Inc. | | | 14,531 | | | | 688,043 | |
Philip Morris International, Inc. | | | 7,787 | | | | 611,513 | |
| | | | | | | | |
| | | | | | | 1,299,556 | |
| | | | | | | | |
Trading Companies & Distributors 0.2% | |
HD Supply Holdings, Inc. (e) | | | 8,294 | | | | 334,082 | |
United Rentals, Inc. (e) | | | 580 | | | | 76,926 | |
WESCO International, Inc. (e) | | | 7,509 | | | | 380,331 | |
| | | | | | | | |
| | | | | | | 791,339 | |
| | | | | | | | |
Transportation Infrastructure 0.2% | |
Macquarie Infrastructure Corp. | | | 14,737 | | | | 597,438 | |
| | | | | | | | |
|
Water Utilities 0.0%‡ | |
American Water Works Co., Inc. | | | 951 | | | | 110,316 | |
| | | | | | | | |
|
Wireless Telecommunication Services 0.3% | |
T-Mobile U.S., Inc. (e) | | | 9,537 | | | | 707,073 | |
Telephone & Data Systems, Inc. | | | 19,372 | | | | 588,909 | |
United States Cellular Corp. (e) | | | 341 | | | | 15,232 | |
| | | | | | | | |
| | | | | | | 1,311,214 | |
| | | | | | | | |
Total Common Stocks
(Cost $189,068,052) | | | | | | | 223,964,591 | |
| | | | | | | | |
| | | | | | |
The notes to the financial statements are an integral part of,
and should be read in conjunction with, the financial statements. | | | | | 21 | |
Portfolio of InvestmentsJune 30, 2019 (Unaudited) (continued)
| | | | | | | | |
| | | Shares | | | Value | |
| Exchange-Traded Funds 5.6% | |
iShares Intermediate Government / Credit Bond ETF | | | 132,524 | | | $ | 14,879,795 | |
iShares Russell 1000 Value ETF | | | 20,849 | | | | 2,652,410 | |
SPDR S&P 500 ETF Trust | | | 4,135 | | | | 1,211,555 | |
SPDR S&P MidCap 400 ETF Trust | | | 3,365 | | | | 1,193,195 | |
Vanguard Mid-Cap Value ETF (d) | | | 20,727 | | | | 2,307,744 | |
| | | | | | | | |
Total Exchange-Traded Funds
(Cost $21,732,129) | | | | | | | 22,244,699 | |
| | | | | | | | |
| | |
| | | | | | | | |
| | | Principal
Amount | | | | |
| Short-Term Investments 1.5% | |
Repurchase Agreement 0.3% | |
Fixed Income Clearing Corp.
0.50%, dated 6/28/19
due 7/1/19
Proceeds at Maturity $1,302,606 (Collateralized by a United States Treasury Note with rate of 2.375% and maturity date of 3/15/22, with a Principal Amount of $1,305,000 and a Market Value of $1,336,915) | | $ | 1,302,552 | | | | 1,302,552 | |
| | | | | | | | |
Total Repurchase Agreement
(Cost $1,302,552) | | | | | | | 1,302,552 | |
| | | | | | | | |
| | |
| | | | | | | | |
| | | Shares | | | | |
Unaffiliated Investment Company 1.2% | |
State Street Navigator Securities Lending Government Money Market Portfolio, 2.33% (f)(g) | | | 4,762,504 | | | | 4,762,504 | |
| | | | | | | | |
Total Unaffiliated Investment Company
(Cost $4,762,504) | | | | | | | 4,762,504 | |
| | | | | | | | |
TotalShort-Term Investments
(Cost $6,065,056) | | | | | | | 6,065,056 | |
| | | | | | | | |
Total Investments
(Cost $363,161,853) | | | 101.2 | % | | | 401,633,815 | |
Other Assets, Less Liabilities | | | (1.2 | ) | | | (4,821,281 | ) |
Net Assets | | | 100.0 | % | | $ | 396,812,534 | |
| † | Percentages indicated are based on Portfolio net assets. |
| ‡ | Less than one-tenth of a percent. |
| (a) | May be sold to institutional investors only under Rule 144A or securities offered pursuant to Section 4(a)(2) of the Securities Act of 1933, as amended. |
| (b) | Floating rate—Rate shown was the rate in effect as of June 30, 2019. |
| (c) | Fixed to floating rate—Rate shown was the rate in effect as of June 30, 2019. |
| (d) | All or a portion of this security was held on loan. As of June 30, 2019, the aggregate market value of securities on loan was $5,965,144; the total market value of collateral held by the Portfolio was $6,097,250. The market value of the collateral held included non-cash collateral in the form of U.S. Treasury securities with a value of $1,334,746 (See Note 2(J)). |
| (e) | Non-income producing security. |
| (f) | Current yield as of June 30, 2019. |
| (g) | Represents security purchased with cash collateral received for securities on loan. |
The following abbreviations are used in the preceding pages:
CME—Chicago Mercantile Exchange
ETF—Exchange-Traded Fund
LIBOR—London Interbank Offered Rate
REIT—Real Estate Investment Trust
SPDR—Standard & Poor’s Depositary Receipt
| | | | |
| 22 | | MainStay VP Balanced Portfolio | | The notes to the financial statements are an integral part of,
and should be read in conjunction with, the financial statements. |
Futures Contracts
As of June 30, 2019, the Portfolio held the following futures contracts1:
| | | | | | | | | | | | | | | | | | |
Type | | Number of
Contracts | | | Expiration
Date | | Value at
Trade Date | | | Current
Notional
Amount | | | Unrealized Appreciation
(Depreciation)2 | |
Long Contracts | | | | | | | | | | | | | | | | | | |
| 2-Year United States Treasury Note | | | 14 | | | September 2019 | | $ | 2,998,398 | | | $ | 3,012,516 | | | $ | 14,118 | |
| 5-Year United States Treasury Note | | | 84 | | | September 2019 | | | 9,806,140 | | | | 9,925,125 | | | | 118,985 | |
| 10-Year United States Treasury Note | | | 48 | | | September 2019 | | | 6,058,523 | | | | 6,142,500 | | | | 83,977 | |
| | | | | | | | | | | | | | | | | | |
| Total Long Contracts | | | | | | | | | | | | | | | | | 217,080 | |
| | | | | | | | | | | | | | | | | | |
Short Contracts | | | | | | | | | | | | |
| 10-Year United States Treasury Ultra Note | | | (4 | ) | | September 2019 | | | (539,586 | ) | | | (552,500 | ) | | | (12,914 | ) |
| United States Treasury Long Bond | | | (2 | ) | | September 2019 | | | (301,966 | ) | | | (311,188 | ) | | | (9,222 | ) |
| | | | | | | | | | | | | | | | | | |
| Total Short Contracts | | | | | | | | | | | | | | | | | (22,136 | ) |
| | | | | | | | | | | | | | | | | | |
| Net Unrealized Appreciation | | | | | | | | | | | | | | | | $ | 194,944 | |
| | | | | | | | | | | | | | | | | | |
| 1. | As of June 30, 2019, cash in the amount of $105,140 was on deposit with a broker or futures commission merchant for futures transactions. |
| 2. | Represents the difference between the value of the contracts at the time they were opened and the value as of June 30, 2019. |
The following is a summary of the fair valuations according to the inputs used as of June 30, 2019, for valuing the Portfolio’s assets and liabilities:
| | | | | | | | | | | | | | | | |
Description | | Quoted
Prices in Active
Markets for
Identical Assets
(Level 1) | | | Significant Other
Observable Inputs (Level 2) | | | Significant
Unobservable Inputs (Level 3) | | | Total | |
| | | | |
Asset Valuation Inputs | | | | | | | | | | | | | | | | |
| Investments in Securities (a) | | | | | | | | | | | | | | | | |
| Long-Term Bonds | | | | | | | | | | | | | | | | |
Asset-Backed Securities | | $ | — | | | $ | 13,174,021 | | | $ | — | | | $ | 13,174,021 | |
Corporate Bonds | | | — | | | | 57,648,116 | | | | — | | | | 57,648,116 | |
Foreign Government Bonds | | | — | | | | 794,143 | | | | — | | | | 794,143 | |
Mortgage-Backed Securities | | | — | | | | 6,644,399 | | | | — | | | | 6,644,399 | |
U.S. Government & Federal Agencies | | | — | | | | 71,098,790 | | | | — | | | | 71,098,790 | |
| | | | | | | | | | | | | | | | |
| TotalLong-Term Bonds | | | — | | | | 149,359,469 | | | | — | | | | 149,359,469 | |
| | | | | | | | | | | | | | | | |
| Common Stocks | | | 223,964,591 | | | | — | | | | — | | | | 223,964,591 | |
| Exchange-Traded Funds | | | 22,244,699 | | | | — | | | | — | | | | 22,244,699 | |
| Short-Term Investments | | | | | | | | | | | | | | | | |
Repurchase Agreement | | | — | | | | 1,302,552 | | | | — | | | | 1,302,552 | |
Unaffiliated Investment Company | | | 4,762,504 | | | | — | | | | — | | | | 4,762,504 | |
| | | | | | | | | | | | | | | | |
| TotalShort-Term Investments | | | 4,762,504 | | | | 1,302,552 | | | | — | | | | 6,065,056 | |
| | | | | | | | | | | | | | | | |
| Total Investments in Securities | | | 250,971,794 | | | | 150,662,021 | | | | — | | | | 401,633,815 | |
| | | | | | | | | | | | | | | | |
| Other Financial Instruments | | | | | | | | | | | | | | | | |
Futures Contracts (b) | | | 217,080 | | | | — | | | | — | | | | 217,080 | |
| | | | | | | | | | | | | | | | |
| Total Investments in Securities and Other Financial Instruments | | $ | 251,188,874 | | | $ | 150,662,021 | | | $ | — | | | $ | 401,850,895 | |
| | | | | | | | | | | | | | | | |
| | | | |
Liability Valuation Inputs | | | | | | | | | | | | | | | | |
| Other Financial Instruments | | | | | | | | | | | | | | | | |
Futures Contracts (b) | | $ | (22,136 | ) | | $ | — | | | $ | — | | | $ | (22,136 | ) |
| | | | | | | | | | | | | | | | |
| (a) | For a complete listing of investments and their industries, see the Portfolio of Investments. |
| (b) | The value listed for these securities reflects unrealized appreciation (depreciation) as shown on the Portfolio of Investments. |
| | | | | | |
The notes to the financial statements are an integral part of,
and should be read in conjunction with, the financial statements. | | | | | 23 | |
Statement of Assets and Liabilitiesas of June 30, 2019 (Unaudited)
| | | | |
| Assets | | | | |
Investment in unaffiliated securities, at value
(identified cost $363,161,853) including securities
on loan of $5,965,144 | | $ | 401,633,815 | |
Cash collateral on deposit at broker for futures contracts | | | 105,140 | |
Cash | | | 4,114 | |
Receivables: | | | | |
Investment securities sold | | | 38,480,262 | |
Dividends and interest | | | 1,204,936 | |
Portfolio shares sold | | | 149,332 | |
Securities lending | | | 3,279 | |
Other assets | | | 1,823 | |
| | | | |
Total assets | | | 441,582,701 | |
| | | | |
| |
| Liabilities | | | | |
Cash collateral received for securities on loan | | | 4,762,504 | |
Payables: | | | | |
Investment securities purchased | | | 39,303,267 | |
Portfolio shares redeemed | | | 312,862 | |
Manager (See Note 3) | | | 223,177 | |
NYLIFE Distributors (See Note 3) | | | 77,035 | |
Professional fees | | | 31,158 | |
Shareholder communication | | | 25,255 | |
Custodian | | | 22,523 | |
Variation margin on futures contracts | | | 6,489 | |
Trustees | | | 560 | |
Accrued expenses | | | 5,337 | |
| | | | |
Total liabilities | | | 44,770,167 | |
| | | | |
Net assets | | $ | 396,812,534 | |
| | | | |
| |
| Composition of Net Assets | | | | |
Shares of beneficial interest outstanding (par value of $.001 per share) unlimited number of shares authorized | | $ | 27,122 | |
Additional paid-in capital | | | 333,257,432 | |
| | | | |
| | | 333,284,554 | |
Total distributable earnings (loss) | | | 63,527,980 | |
| | | | |
Net assets | | $ | 396,812,534 | |
| | | | |
| | | | |
Initial Class | | | | |
Net assets applicable to outstanding shares | | $ | 17,732,437 | |
| | | | |
Shares of beneficial interest outstanding | | | 1,198,808 | |
| | | | |
Net asset value per share outstanding | | $ | 14.79 | |
| | | | |
Service Class | | | | |
Net assets applicable to outstanding shares | | $ | 379,080,097 | |
| | | | |
Shares of beneficial interest outstanding | | | 25,922,827 | |
| | | | |
Net asset value per share outstanding | | $ | 14.62 | |
| | | | |
| | | | |
| 24 | | MainStay VP Balanced Portfolio | | The notes to the financial statements are an integral part of,
and should be read in conjunction with, the financial statements. |
Statement of Operationsfor the six months ended June 30, 2019 (Unaudited)
| | | | |
| Investment Income (Loss) | | | | |
Income | | | | |
Dividends-unaffiliated (a) | | $ | 3,072,450 | |
Interest | | | 2,101,052 | |
Securities lending | | | 172,334 | |
Dividends-affiliated | | | 123 | |
| | | | |
Total income | | | 5,345,959 | |
| | | | |
Expenses | | | | |
Manager (See Note 3) | | | 1,357,570 | |
Distribution/Service—Service Class (See Note 3) | | | 463,448 | |
Professional fees | | | 39,309 | |
Custodian | | | 28,844 | |
Shareholder communication | | | 25,104 | |
Trustees | | | 4,882 | |
Miscellaneous | | | 9,433 | |
| | | | |
Total expenses | | | 1,928,590 | |
| | | | |
Net investment income (loss) | | | 3,417,369 | |
| | | | |
| |
| Realized and Unrealized Gain (Loss) on Investments and Futures Contracts | | | | |
Net realized gain (loss) on: | | | | |
Investment transactions | | | 6,247,290 | |
Futures transactions | | | 344,367 | |
| | | | |
Net realized gain (loss) on investments and futures transactions | | | 6,591,657 | |
| | | | |
Net change in unrealized appreciation (depreciation) on: | | | | |
Investments | | | 32,440,533 | |
Futures contracts | | | 42,428 | |
| | | | |
Net change in unrealized appreciation (depreciation) on investments and futures contracts | | | 32,482,961 | |
| | | | |
Net realized and unrealized gain (loss) on investments and futures transactions | | | 39,074,618 | |
| | | | |
Net increase (decrease) in net assets resulting from operations | | $ | 42,491,987 | |
| | | | |
| (a) | Dividends recorded net of foreign withholding taxes in the amount of $657. |
| | | | | | |
The notes to the financial statements are an integral part of,
and should be read in conjunction with, the financial statements. | | | | | 25 | |
Statements of Changes in Net Assets
for the six months ended June 30, 2019 (Unaudited) and the year ended December 31, 2018
| | | | | | | | |
| | | 2019 | | | 2018 | |
| Increase (Decrease) in Net Assets | |
Operations: | | | | | | | | |
Net investment income (loss) | | $ | 3,417,369 | | | $ | 6,842,372 | |
Net realized gain (loss) on investments and futures contracts | | | 6,591,657 | | | | 10,570,339 | |
Net change in unrealized appreciation (depreciation) on investments and futures contracts | | | 32,482,961 | | | | (47,973,404 | ) |
| | | | |
Net increase (decrease) in net assets resulting from operations | | | 42,491,987 | | | | (30,560,693 | ) |
| | | | |
Distributions to shareholders: | | | | | | | | |
Initial Class | | | — | | | | (1,036,372 | ) |
Service Class | | | — | | | | (23,051,784 | ) |
| | | | |
Total distributions to shareholders | | | — | | | | (24,088,156 | ) |
| | | | |
Capital share transactions: | | | | | | | | |
Net proceeds from sale of shares | | | 15,234,295 | | | | 29,344,794 | |
Net asset value of shares issued to shareholders in reinvestment of dividends and distributions | | | — | | | | 24,088,156 | |
Cost of shares redeemed | | | (29,493,591 | ) | | | (74,059,337 | ) |
| | | | |
Increase (decrease) in net assets derived from capital share transactions | | | (14,259,296 | ) | | | (20,626,387 | ) |
| | | | |
Net increase (decrease) in net assets | | | 28,232,691 | | | | (75,275,236 | ) |
| | |
| Net Assets | | | | | | | | |
Beginning of period | | | 368,579,843 | | | | 443,855,079 | |
| | | | |
End of period | | $ | 396,812,534 | | | $ | 368,579,843 | |
| | | | |
| | | | |
| 26 | | MainStay VP Balanced Portfolio | | The notes to the financial statements are an integral part of,
and should be read in conjunction with, the financial statements. |
Financial Highlightsselected per share data and ratios
| | | | | | | | | | | | | | | | | | | | | | | | | | | | |
| | | |
| | | Six months
ended
June 30, | | | | | | Year ended December 31, | |
| | | | | | | |
| Initial Class | | 2019* | | | | | | 2018 | | | 2017 | | | 2016 | | | 2015 | | | 2014 | |
| | | | | | | |
Net asset value at beginning of period | | $ | 13.23 | | | | | | | $ | 15.18 | | | $ | 14.26 | | | $ | 13.57 | | | $ | 15.04 | | | $ | 14.72 | |
| | | | | | | | | | | | | | | | | | | | | | | | | | | | |
| | | | | | | |
Net investment income (loss) (a) | | | 0.14 | | | | | | | | 0.28 | | | | 0.23 | | | | 0.21 | | | | 0.22 | | | | 0.20 | |
| | | | | | | |
Net realized and unrealized gain (loss) on investments | | | 1.42 | | | | | | | | (1.31 | ) | | | 1.18 | | | | 1.15 | | | | (0.61 | ) | | | 1.35 | |
| | | | | | | | | | | | | | | | | | | | | | | | | | | | |
| | | | | | | |
Total from investment operations | | | 1.56 | | | | | | | | (1.03 | ) | | | 1.41 | | | | 1.36 | | | | (0.39 | ) | | | 1.55 | |
| | | | | | | | | | | | | | | | | | | | | | | | | | | | |
| | | | | | | |
| Less dividends and distributions: | | | | | | | | | | | | | | | | | | | | | | | | | | | | |
| | | | | | | |
From net investment income | | | — | | | | | | | | (0.25 | ) | | | (0.19 | ) | | | (0.20 | ) | | | (0.16 | ) | | | (0.14 | ) |
| | | | | | | |
From net realized gain on investments | | | — | | | | | | | | (0.67 | ) | | | (0.30 | ) | | | (0.47 | ) | | | (0.92 | ) | | | (1.09 | ) |
| | | | | | | | | | | | | | | | | | | | | | | | | | | | |
| | | | | | | |
Total dividends and distributions | | | — | | | | | | | | (0.92 | ) | | | (0.49 | ) | | | (0.67 | ) | | | (1.08 | ) | | | (1.23 | ) |
| | | | | | | | | | | | | | | | | | | | | | | | | | | | |
| | | | | | | |
Net asset value at end of period | | $ | 14.79 | | | | | | | $ | 13.23 | | | $ | 15.18 | | | $ | 14.26 | | | $ | 13.57 | | | $ | 15.04 | |
| | | | | | | | | | | | | | | | | | | | | | | | | | | | |
| | | | | | | |
Total investment return (b) | | | 11.79 | %(c) | | | | | | | (7.36 | %) | | | 10.02 | % | | | 10.24 | % | | | (2.59 | %) | | | 10.88 | % |
| | | | | | | |
| Ratios (to average net assets)/Supplemental Data: | | | | | | | | | | | | | | | | | | | | | | | | | | | | |
| | | | | | | |
Net investment income (loss) | | | 2.00 | %†† | | | | | | | 1.88 | % | | | 1.54 | % | | | 1.47 | %(d) | | | 1.49 | % | | | 1.33 | % |
| | | | | | | |
Net expenses (e) | | | 0.76 | %†† | | | | | | | 0.74 | % | | | 0.74 | % | | | 0.74 | %(f) | | | 0.76 | % | | | 0.76 | % |
| | | | | | | |
Expenses (before waiver/reimbursement) (e) | | | 0.76 | %†† | | | | | | | 0.74 | % | | | 0.74 | % | | | 0.76 | % | | | 0.76 | % | | | 0.76 | % |
| | | | | | | |
Portfolio turnover rate | | | 95 | % | | | | | | | 209 | % | | | 174 | % | | | 253 | % | | | 214 | % | | | 171 | % |
| | | | | | | |
Net assets at end of period (in 000’s) | | $ | 17,732 | | | | | | | $ | 16,084 | | | $ | 17,209 | | | $ | 15,666 | | | $ | 14,037 | | | $ | 14,274 | |
| (a) | Per share data based on average shares outstanding during the period. |
| (b) | Total return does not reflect any deduction of sales charges, mortality and expense charges, contract charges or administrative charges. For periods of less than one year, total return is not annualized. |
| (c) | Total investment return may reflect adjustments to conform to generally accepted accounting principles. |
| (d) | Without the custody fee reimbursement, net investment income (loss) would have been 1.45%. |
| (e) | In addition to the fees and expenses which the Portfolio bears directly, it also indirectly bears a pro-rata share of the fees and expenses of the underlying funds in which it invests. Such indirect expenses are not included in the above expense ratios. |
| (f) | Without the custody fee reimbursement, net expenses would have been 0.76%. |
| | | | | | | | | | | | | | | | | | | | | | | | | | | | |
| | | |
| | | Six months
ended
June 30, | | | | | | Year ended December 31, | |
| | | | | | | |
| Service Class | | 2019* | | | | | | 2018 | | | 2017 | | | 2016 | | | 2015 | | | 2014 | |
| | | | | | | |
Net asset value at beginning of period | | $ | 13.09 | | | | | | | $ | 15.03 | | | $ | 14.13 | | | $ | 13.45 | | | $ | 14.92 | | | $ | 14.63 | |
| | | | | | | | | | | | | | | | | | | | | | | | | | | | |
| | | | | | | |
Net investment income (loss) (a) | | | 0.12 | | | | | | | | 0.24 | | | | 0.19 | | | | 0.17 | | | | 0.18 | | | | 0.16 | |
| | | | | | | |
Net realized and unrealized gain (loss) on investments | | | 1.41 | | | | | | | | (1.30 | ) | | | 1.17 | | | | 1.15 | | | | (0.60 | ) | | | 1.33 | |
| | | | | | | | | | | | | | | | | | | | | | | | | | | | |
| | | | | | | |
Total from investment operations | | | 1.53 | | | | | | | | (1.06 | ) | | | 1.36 | | | | 1.32 | | | | (0.42 | ) | | | 1.49 | |
| | | | | | | | | | | | | | | | | | | | | | | | | | | | |
| | | | | | | |
| Less dividends and distributions: | | | | | | | | | | | | | | | | | | | | | | | | | | | | |
| | | | | | | |
From net investment income | | | — | | | | | | | | (0.21 | ) | | | (0.16 | ) | | | (0.17 | ) | | | (0.13 | ) | | | (0.11 | ) |
| | | | | | | |
From net realized gain on investments | | | — | | | | | | | | (0.67 | ) | | | (0.30 | ) | | | (0.47 | ) | | | (0.92 | ) | | | (1.09 | ) |
| | | | | | | | | | | | | | | | | | | | | | | | | | | | |
| | | | | | | |
Total dividends and distributions | | | — | | | | | | | | (0.88 | ) | | | (0.46 | ) | | | (0.64 | ) | | | (1.05 | ) | | | (1.20 | ) |
| | | | | | | | | | | | | | | | | | | | | | | | | | | | |
| | | | | | | |
Net asset value at end of period | | $ | 14.62 | | | | | | | $ | 13.09 | | | $ | 15.03 | | | $ | 14.13 | | | $ | 13.45 | | | $ | 14.92 | |
| | | | | | | | | | | | | | | | | | | | | | | | | | | | |
| | | | | | | |
Total investment return (b) | | | 11.69 | %(c) | | | | | | | (7.59 | %) | | | 9.75 | % | | | 9.96 | % | | | (2.83 | %) | | | 10.60 | % |
| | | | | | | |
| Ratios (to average net assets)/Supplemental Data: | | | | | | | | | | | | | | | | | | | | | | | | | | | | |
| | | | | | | |
Net investment income (loss) | | | 1.75 | %†† | | | | | | | 1.62 | % | | | 1.28 | % | | | 1.22 | %(d) | | | 1.24 | % | | | 1.09 | % |
| | | | | | | |
Net expenses (e) | | | 1.01 | %†† | | | | | | | 0.99 | % | | | 0.99 | % | | | 0.99 | %(f) | | | 1.01 | % | | | 1.01 | % |
| | | | | | | |
Expenses (before waiver/reimbursement) (e) | | | 1.01 | %†† | | | | | | | 0.99 | % | | | 0.99 | % | | | 1.01 | % | | | 1.01 | % | | | 1.01 | % |
| | | | | | | |
Portfolio turnover rate | | | 95 | % | | | | | | | 209 | % | | | 174 | % | | | 253 | % | | | 214 | % | | | 171 | % |
| | | | | | | |
Net assets at end of period (in 000’s) | | $ | 379,080 | | | | | | | $ | 352,496 | | | $ | 426,646 | | | $ | 395,611 | | | $ | 353,238 | | | $ | 338,667 | |
| (a) | Per share data based on average shares outstanding during the period. |
| (b) | Total return does not reflect any deduction of sales charges, mortality and expense charges, contract charges or administrative charges. For periods of less than one year, total return is not annualized. |
| (c) | Total investment return may reflect adjustments to conform to generally accepted accounting principles. |
| (d) | Without the custody fee reimbursement, net investment income (loss) would have been 1.20%. |
| (e) | In addition to the fees and expenses which the Portfolio bears directly, it also indirectly bears a pro-rata share of the fees and expenses of the underlying funds in which it invests. Such indirect expenses are not included in the above expense ratios. |
| (f) | Without the custody fee reimbursement, net expenses would have been 1.01%. |
| | | | | | |
The notes to the financial statements are an integral part of,
and should be read in conjunction with, the financial statements. | | | | | 27 | |
Notes to Financial Statements(Unaudited)
Note 1–Organization and Business
MainStay VP Funds Trust (the “Fund”) was organized as a Delaware statutory trust on February 1, 2011. The Fund is registered under the Investment Company Act of 1940, as amended (the “1940 Act”), as an open-end management investment company. The Fund is comprised of thirty-one separate series (collectively referred to as the “Portfolios”). These financial statements and notes relate to the MainStay VP Balanced Portfolio (the “Portfolio”), a “diversified” portfolio, as that term is defined in the 1940 Act, as interpreted or modified by regulatory authorities having jurisdiction, from time to time.
Shares of the Portfolio are currently offered to certain separate accounts to fund variable annuity policies and variable universal life insurance policies issued by New York Life Insurance and Annuity Corporation (“NYLIAC”), awholly-owned subsidiary of New York Life Insurance Company (“New York Life”) and may also be offered to fund variable annuity policies and variable universal life insurance policies issued by other insurance companies. NYLIAC allocates shares of the Portfolios to, among others, certain NYLIAC separate accounts. Shares of the Portfolio are also offered to the MainStay VP Conservative Allocation Portfolio, MainStay VP Moderate Allocation Portfolio, MainStay VP Moderate Growth Allocation Portfolio and MainStay VP Growth Allocation Portfolio, which operate as “funds-of-funds.”
The Portfolio currently offers two classes of shares. Initial Class and Service Class shares commenced operations on May 2, 2005. Shares of the Portfolio are offered and are redeemed at a price equal to their respective net asset value (“NAV”) per share. No sales or redemption charge is applicable to the purchase or redemption of the Portfolio’s shares. Under the terms of the Fund’s multiple class plan, adopted pursuant to Rule 18f-3 under the 1940 Act, the classes differ in that, among other things, Service Class shares of the Portfolio pay a combined distribution and service fee of 0.25% of average daily net assets attributable to Service Class shares of the Portfolio to the Distributor (as defined in Note 3(B)) pursuant to a plan adopted in accordance with Rule 12b-1 under the 1940 Act. Contract owners of variable annuity contracts purchased after June 2, 2003, are permitted to invest only in the Service Class shares.
The Portfolio’s investment objective is to seek total return.
Note 2–Significant Accounting Policies
The Portfolio is an investment company and accordingly follows the investment company accounting and reporting guidance of the Financial Accounting Standards Board (“FASB”) Accounting Standard CodificationTopic 946 Financial Services—Investment Companies. The Portfolio prepares its financial statements in accordance with generally accepted accounting principles (“GAAP”) in the United States of America and follows the significant accounting policies described below.
(A) Securities Valuation. Investments are usually valued as of the close of regular trading on the New York Stock Exchange (the “Exchange”) (usually 4:00 p.m. Eastern time) on each day the Portfolio is open for business (“valuation date”).
The Board of Trustees of the Fund (the “Board”) adopted procedures establishing methodologies for the valuation of the Portfolio’s securities and other assets and delegated the responsibility for valuation determi-
nations under those procedures to the Valuation Committee of the Fund (the “Valuation Committee”). The Board authorized the Valuation Committee to appoint a Valuation Subcommittee (the “Subcommittee”) to deal in the first instance with establishing the prices of securities for which market quotations are not readily available or the prices of which are not otherwise readily determinable under these procedures. The Subcommittee meets (in person, via electronic mail or via teleconference) on an as-needed basis. Subsequently, the Valuation Committee meets to ensure that actions taken by the Subcommittee were appropriate. The procedures state that, subject to the oversight of the Board and unless otherwise noted, the responsibility for theday-to-day valuation of portfolio assets (including fair value measurements for the Portfolio’s assets and liabilities) rests with New York Life Investment Management LLC (“New York Life Investments” or the “Manager”), aided to whatever extent necessary by the Subadvisors (as defined in Note 3(A)).
To assess the appropriateness of security valuations, the Manager, the Subadvisors or the Portfolio’s third-party service provider, who is subject to oversight by the Manager, regularly compares prior day prices, prices on comparable securities and the sale prices to the prior and current day prices and challenges prices with changes exceeding certain tolerance levels with third-party pricing services or broker sources. For those securities valued through either a standardized fair valuation methodology or a fair valuation measurement, the Subcommittee deals in the first instance with such valuation and the Valuation Committee reviews and affirms, if appropriate, the reasonableness of the valuation based on such methodologies and measurements on a regular basis after considering information that is reasonably available and deemed relevant by the Valuation Committee. Any action taken by the Subcommittee with respect to the valuation of a portfolio security or other asset is submitted for review and ratification (if appropriate) to the Valuation Committee and the Board at the next regularly scheduled meeting.
“Fair value” is defined as the price the Portfolio would reasonably expect to receive upon selling an asset or liability in an orderly transaction to an independent buyer in the principal or most advantageous market for the asset or liability. Fair value measurements are determined within a framework that establishes a three-tier hierarchy which maximizes the use of observable market data and minimizes the use of unobservable inputs to establish a classification of fair value measurements for disclosure purposes. “Inputs” refer broadly to the assumptions that market participants would use in pricing the asset or liability, including assumptions about risk, such as the risk inherent in a particular valuation technique used to measure fair value using a pricing model and/or the risk inherent in the inputs for the valuation technique. Inputs may be observable or unobservable. Observable inputs reflect the assumptions market participants would use in pricing the asset or liability based on market data obtained from sources independent of the Portfolio. Unobservable inputs reflect the Portfolio’s own assumptions about the assumptions market participants would use in pricing the asset or liability based on the information available. The inputs or methodology used for valuing assets or liabilities may not be an indication of the risks associated with investing in those assets or liabilities. The three-tier hierarchy of inputs is summarized below.
| • | | Level 1—quoted prices in active markets for an identical asset or liability |
| | |
| 28 | | MainStay VP Balanced Portfolio |
| • | | Level 2—other significant observable inputs (including quoted prices for a similar asset or liability in active markets, interest rates and yield curves, prepayment speeds, credit risk, etc.) |
| • | | Level 3—significant unobservable inputs (including the Portfolio’s own assumptions about the assumptions that market participants would use in measuring fair value of an asset or liability) |
The level of an asset or liability within the fair value hierarchy is based on the lowest level of an input, both individually and in the aggregate, that is significant to the fair value measurement. As of June 30, 2019, the aggregate value by input level of the Portfolio’s assets and liabilities is included at the end of the Portfolio’s Portfolio of Investments.
The Portfolio may use third-party vendor evaluations, whose prices may be derived from one or more of the following standard inputs, among others:
| | |
• Benchmark yields | | • Reported trades |
• Broker/dealer quotes | | • Issuer spreads |
• Two-sided markets | | • Benchmark securities |
• Bids/offers | | • Reference data (corporate actions or material event notices) |
• Industry and economic events | | • Comparable bonds |
• Monthly payment information | | |
An asset or liability for which market values cannot be measured using the methodologies described above is valued by methods deemed reasonable in good faith by the Valuation Committee, following the procedures established by the Board, to represent fair value. Under these procedures, the Portfolio generally uses a market-based approach which may use related or comparable assets or liabilities, recent transactions, market multiples, book values and other relevant information. The Portfolio may also use an income-based valuation approach in which the anticipated future cash flows of the asset or liability are discounted to calculate fair value. Discounts may also be applied due to the nature and/or duration of any restrictions on the disposition of the asset or liability. Fair value represents a good faith approximation of the value of a security. Fair value determinations involve the consideration of a number of subjective factors, an analysis of applicable facts and circumstances and the exercise of judgment. As a result, it is possible that the fair value for a security determined in good faith in accordance with the Portfolio’s valuation procedures may differ from valuations for the same security determined by other funds using their own valuation procedures. Although the Portfolio’s valuation procedures are designed to value a security at the price the Portfolio may reasonably expect to receive upon the security’s sale in an orderly transaction, there can be no assurance that any fair value determination thereunder would, in fact, approximate the amount that the Portfolio would actually realize upon the sale of the security or the price at which the security would trade if a reliable market price were readily available. During the six-month period ended June 30, 2019, there were no material changes to the fair value methodologies.
Securities which may be valued in this manner include, but are not limited to: (i) a security for which trading has been halted or suspended; (ii) a debt security that has recently gone into default and for which there is not a current market quotation; (iii) a security of an issuer that has entered into a restructuring; (iv) a security that has been delisted
from a national exchange; (v) a security for which the market price is not readily available from a third-party pricing source or, if so provided, does not, in the opinion of the Manager or the Subadvisors, reflect the security’s market value; (vi) a security subject to trading collars for which no or limited trading takes place; and (vii) a security whose principal market has been temporarily closed at a time when, under normal conditions, it would be open. Securities valued in this manner are generally categorized as Level 3 in the hierarchy. As of June 30, 2019, there were no securities held by the Portfolio that were fair valued in such a manner.
Equity securities, including exchange-traded funds (“ETFs”), are valued at the last quoted sales prices as of the close of regular trading on the relevant exchange on each valuation date. Securities that are not traded on the valuation date are valued at the mean of the last quoted bid and ask prices. Prices are normally taken from the principal market in which each security trades. Futures contracts are valued at the last posted settlement price on the market where such futures are primarily traded. These securities are generally categorized as Level 1 in the hierarchy.
Investments in mutual funds, including money market funds, are valued at their respective NAVs as of the close of the Exchange on the valuation date. These securities are generally categorized as Level 1 in the hierarchy.
Debt securities (other than convertible and municipal bonds) are valued at the evaluated bid prices (evaluated mean prices in the case of convertible and municipal bonds) supplied by a pricing agent or brokers selected by the Manager, in consultation with the Subadvisors. The evaluations are market-based measurements processed through a pricing application and represents the pricing agent’s good faith determination as to what a holder may receive in an orderly transaction under market conditions. The rules based logic utilizes valuation techniques that reflect participants’ assumptions and vary by asset class and per methodology, maximizing the use of relevant observable data including quoted prices for similar assets, benchmark yield curves and market corroborated inputs. The evaluated bid or mean prices are deemed by the Manager, in consultation with the Subadvisors, to be representative of market values at the regular close of trading of the Exchange on each valuation date. Debt securities purchased on a delayed delivery basis are marked to market daily until settlement at the forward settlement date. Debt securities, including corporate bonds, U.S. government and federal agency bonds, municipal bonds, foreign bonds, convertible bonds, asset-backed securities and mortgage-backed securities are generally categorized as Level 2 in the hierarchy.
Temporary cash investments acquired in excess of 60 days to maturity at the time of purchase are valued using the latest bid prices or using valuations based on a matrix system (which considers such factors as security prices, yields, maturities and ratings), both as furnished by independent pricing services. Other temporary cash investments which mature in 60 days or less at the time of purchase (“Short-Term Investments”) are valued using the amortized cost method of valuation, unless the use of such method would be inappropriate. The amortized cost method involves valuing a security at its cost on the date of purchase and thereafter assuming a constant amortization to maturity of the difference between such cost and the value on maturity date. Amortized cost approximates the current fair value of a security. Securities valued using the amortized cost method are not valued using quoted
Notes to Financial Statements(Unaudited) (continued)
prices in an active market and are generally categorized as Level 2 in the hierarchy.
The information above is not intended to reflect an exhaustive list of the methodologies that may be used to value portfolio investments. The valuation procedures permit the use of a variety of valuation methodologies in connection with valuing portfolio investments. The methodology used for a specific type of investment may vary based on the market data available or other considerations. The methodologies summarized above may not represent the specific means by which portfolio investments are valued on any particular business day.
(B) Income Taxes. The Portfolio’s policy is to comply with the requirements of the Internal Revenue Code of 1986, as amended (the “Internal Revenue Code”), applicable to regulated investment companies and to distribute all of its taxable income to the shareholders of the Portfolio within the allowable time limits. Therefore, no federal, state and local income tax provisions are required.
Management evaluates the Portfolio’s tax positions to determine if the tax positions taken meet the minimum recognition threshold in connection with accounting for uncertainties in income tax positions taken or expected to be taken for the purposes of measuring and recognizing tax liabilities in the financial statements. Recognition of tax benefits of an uncertain tax position is permitted only to the extent the position is “more likely than not” to be sustained assuming examination by taxing authorities. Management has analyzed the Portfolio’s tax positions taken on federal, state and local income tax returns for all open tax years (for up to three tax years) and has concluded that no provisions for federal, state and local income tax are required in the Portfolio’s financial statements. The Portfolio’s federal, state and local income tax and federal excise tax returns for tax years for which the applicable statutes of limitations have not expired are subject to examination by the Internal Revenue Service and state and local departments of revenue.
(C) Dividends and Distributions to Shareholders. Dividends and distributions are recorded on the ex-dividend date. The Portfolio intends to declare and pay dividends from net investment income and distributions from net realized capital and currency gains, if any, at least annually. Unless the shareholder elects otherwise, all dividends and distributions are reinvested in the same class of shares of the Portfolio, at NAV. Dividends and distributions to shareholders are determined in accordance with federal income tax regulations and may differ from determinations using GAAP.
(D) Security Transactions and Investment Income. The Portfolio records security transactions on the trade date. Realized gains and losses on security transactions are determined using the identified cost method. Dividend income is recognized on the ex-dividend date; net of any foreign tax withheld at the source, and interest income is accrued as earned using the effective interest rate method. Discounts and premiums on securities purchased for the Portfolio are accreted and amortized, respectively, on the effective interest rate method over the life of the respective securities.
Investment income and realized and unrealized gains and losses on investments of the Portfolio are allocated pro rata to the separate classes of shares based upon their relative net assets on the date the income is earned or realized and unrealized gains and losses are incurred.
The Portfolio may place a debt security on non-accrual status and reduce related interest income by ceasing current accruals and writing off all or a portion of any interest receivables when the collection of all or a portion of such interest has become doubtful. A debt security is removed from non-accrual status when the issuer resumes interest payments or when collectability of interest is reasonably assured.
(E) Expenses. Expenses of the Fund are allocated to the individual Portfolios in proportion to the net assets of the respective Portfolios when the expenses are incurred, except where direct allocations of expenses can be made. Expenses (other than fees incurred under the distribution and service plans, further discussed in Note 3(B), which are charged directly to the Service Class shares) are allocated to separate classes of shares pro rata based upon their relative net assets on the date the expenses are incurred. The expenses borne by the Portfolio, including those of related parties to the Portfolio, are shown in the Statement of Operations.
Additionally, the Portfolio may invest in ETFs and mutual funds, which are subject to management fees and other fees that may cause the costs of investing in ETFs and mutual funds to be greater than the costs of owning the underlying securities directly. These indirect expenses of ETFs and mutual funds are not included in the amounts shown as expenses in the Portfolio’s Statement of Operations or in the expense ratios included in the Financial Highlights.
(F) Use of Estimates. In preparing financial statements in conformity with GAAP, management makes estimates and assumptions that affect the reported amounts and disclosures in the financial statements. Actual results could differ from those estimates.
(G) Repurchase Agreements. The Portfolio may enter into repurchase agreements (i.e., buy a security from another party with the agreement that it be sold back in the future) to earn income. The Portfolio may enter into repurchase agreements only with counterparties, usually financial institutions, that are deemed by the Manager or the Subadvisors to be creditworthy, pursuant to guidelines established by the Board. During the term of any repurchase agreement, the Manager or the Subadvisors will continue to monitor the creditworthiness of the counterparty. Under the 1940 Act, repurchase agreements are considered to be collateralized loans by the Portfolio to the counterparty secured by the securities transferred to the Portfolio.
Repurchase agreements are subject to counterparty risk, meaning the Portfolio could lose money by the counterparty’s failure to perform under the terms of the agreement. The Portfolio mitigates this risk by ensuring the repurchase agreement is collateralized by cash, U.S. government securities, fixed income securities and/or other securities. The collateral is held by the Portfolio’s custodian and valued daily on a mark to market basis to determine if the value, including accrued interest, exceeds the repurchase price. In the event of the counterparty’s default on the obligation to repurchase, the Portfolio has the right to liquidate the collateral and apply the proceeds in satisfaction of the obligation. Under certain circumstances, such as in the event of default or bankruptcy by the counterparty, realization and/or retention of the collateral may be limited or subject to delay, to legal proceedings and possible realized loss to the Portfolio. As of June 30, 2019, repurchase agreements are shown in the Portfolio of Investments.
| | |
| 30 | | MainStay VP Balanced Portfolio |
(H) Futures Contracts. A futures contract is an agreement to purchase or sell a specified quantity of an underlying instrument at a specified future date and price, or to make or receive a cash payment based on the value of a financial instrument (e.g., foreign currency, interest rate, security, or securities index). The Portfolio is subject to risks such as market price risk and/or interest rate risk in the normal course of investing in these transactions. Upon entering into a futures contract, the Portfolio is required to pledge to the broker or futures commission merchant an amount of cash and/or U.S. government securities equal to a certain percentage of the collateral amount, known as the “initial margin.” During the period the futures contract is open, changes in the value of the contract are recognized as unrealized appreciation or depreciation by marking to market such contract on a daily basis to reflect the market value of the contract at the end of each day’s trading. The Portfolio agrees to receive from or pay to the broker or futures commission merchant an amount of cash equal to the daily fluctuation in the value of the contract. Such receipts or payments are known as “variation margin.” When the futures contract is closed, the Portfolio records a realized gain or loss equal to the difference between the proceeds from (or cost of) the closing transaction and the Portfolio’s basis in the contract.
The use of futures contracts involves, to varying degrees, elements of market risk in excess of the amount recognized in the Statement of Assets and Liabilities. The contract or notional amounts and variation margin reflect the extent of the Portfolio’s involvement in open futures positions. There are several risks associated with the use of futures contracts as hedging techniques. There can be no assurance that a liquid market will exist at the time when the Portfolio seeks to close out a futures contract. If no liquid market exists, the Portfolio would remain obligated to meet margin requirements until the position is closed. Futures may involve a small initial investment relative to the risk assumed, which could result in losses greater than if they had not been used. Futures may be more volatile than direct investments in the instrument underlying the futures, and may not correlate to the underlying instrument, causing a given hedge not to achieve its objectives. The Portfolio’s activities in futures contracts have minimal counterparty risk as they are conducted through regulated exchanges that guarantee the futures against default by the counterparty. In the event of a bankruptcy or insolvency of a futures commission merchant that holds margin on behalf of the Portfolio, the Portfolio may not be entitled to the return of the entire margin owed to the Portfolio, potentially resulting in a loss. The Portfolio’s investment in futures contracts and other derivatives may increase the volatility of the Portfolio’s NAVs and may result in a loss to the Portfolio. As of June 30, 2019, open futures contracts are shown in the Portfolio of Investments.
(I) Rights and Warrants. Rights are certificates that permit the holder to purchase a certain number of shares, or a fractional share, of a new stock from the issuer at a specific price. Warrants are instruments that entitle the holder to buy an equity security at a specific price for a specific period of time. These investments can provide a greater potential for profit or loss than an equivalent investment in the underlying security. Prices of these investments do not necessarily move in tandem with the prices of the underlying securities.
There is risk involved in the purchase of rights and warrants in that these investments are speculative investments. The Portfolio could also
lose the entire value of its investment in warrants if such warrants are not exercised by the date of its expiration. The Portfolio is exposed to risk until the sale or exercise of each right or warrant is completed. As of June 30, 2019, the Portfolio did not hold any rights or warrants.
(J) Securities Lending. In order to realize additional income, the Portfolio may engage in securities lending, subject to the limitations set forth in the 1940 Act and relevant guidance by the staff of the Securities and Exchange Commission (“SEC”). In the event the Portfolio does engage in securities lending, the Portfolio will lend through its custodian, State Street Bank and Trust Company (“State Street”), acting as securities lending agent on behalf of the Portfolio. State Street will manage the Portfolio’s collateral in accordance with the securities lending agency agreement between the Portfolio and State Street, and indemnify the Portfolio against counterparty risk. The loans will be collateralized by cash (which may be invested in a money market fund) and/ornon-cash collateral (which may include, U.S. Treasury securities and/or U.S. Government Agency securities issued or guaranteed by the United States government or its agencies or instrumentalities) at least equal at all times to the market value of the securities loaned. The Portfolio may bear the risk of delay in recovery of, or loss of rights in, the securities loaned should the borrower of the securities experience financial difficulty. The Portfolio may also record a realized gain or loss on securities deemed sold due to a borrower’s inability to return securities on loan. The Portfolio bears the risk of any loss on investment of cash collateral. The Portfolio will receive compensation for lending its securities in the form of fees or it will retain a portion of interest on the investment of any cash collateral. The Portfolio will also continue to receive interest and dividends on the securities loaned and any gain or loss in the market price of the securities loaned that may occur during the term of the loan will be for the account of the Portfolio. Income earned from securities lending activities, if any, is reflected in the Statement of Operations. As of June 30, 2019, the Portfolio had securities on loan with an aggregate market value of $5,965,144; the total market value of collateral held by the Portfolio was $6,097,250. The market value of the collateral held includednon-cash collateral in the form of U.S. Treasury securities with a value of $1,334,746 and cash collateral which was invested into the State Street Navigator Securities Lending Government Money Market Portfolio with a value of $4,762,504.
(K) Securities Risk. The ability of issuers of debt securities held by the Portfolio to meet their obligations may be affected by, among other things, economic or political developments in a specific country, industry or region. Debt securities are also subject to the risks associated with changes in interest rates.
Investments in the Portfolio are not guaranteed, even though some of the Portfolio’s underlying investments are guaranteed by the U.S. government or its agencies or instrumentalities. The principal risk of mortgage-related and asset-backed securities is that the underlying debt may be prepaid ahead of schedule, if interest rates fall, thereby reducing the value of the Portfolio’s investment. If interest rates rise, less of the debt may be prepaid and the Portfolio may lose money because the Portfolio may be unable to invest in higher yielding assets. The Portfolio is subject to interest-rate risk and can lose principal value when interest rates rise. Bonds are also subject to credit risk, in which the bond issuer may fail to pay interest and principal in a timely manner.
Notes to Financial Statements(Unaudited) (continued)
The Portfolio may invest in foreign securities, which carry certain risks that are in addition to the usual risks inherent in domestic instruments. These risks include those resulting from currency fluctuations, future adverse political or economic developments and possible imposition of currency exchange blockages or other foreign governmental laws or restrictions. These risks are likely to be greater in emerging markets than in developed markets.
(L) Indemnifications. Under the Fund’s organizational documents, its officers and trustees are indemnified against certain liabilities that may arise out of performance of their duties to the Fund. Additionally, in the normal course of business, the Portfolio enters into contracts with third-party service providers that contain a variety of representations and warranties and which may provide general indemnifications. The Portfolio’s maximum exposure under these arrangements is unknown, as this would involve future claims that may be made against the Portfolio that have not yet occurred. Based on experience, management is of the view that the risk of loss in connection with these potential indemnification obligations is remote. However, there can be no assurance that material liabilities related to such obligations will not arise in the future, which could adversely impact the Portfolio.
(M) Quantitative Disclosure of Derivative Holdings. The following tables show additional disclosures related to the Portfolio’s derivative and hedging activities, including how such activities are accounted for and their effect on the Portfolio’s financial positions, performance and cash flows. The Portfolio entered into futures contracts to help manage the duration and yield curve positioning of the portfolio while minimizing the exposure to wider bid/ask spreads in traditional bonds. These derivatives are not accounted for as hedging instruments.
Fair value of derivative instruments as of June 30, 2019:
Asset Derivatives
| | | | | | | | | | |
| | | Statement of
Assets and
Liabilities
Location | | Interest
Rate
Contracts
Risk | | | Total | |
| | | |
Futures Contracts | | Net Assets—Net unrealized appreciation on investments and futures contracts (a) | | $ | 217,080 | | | $ | 217,080 | |
| | | | | | |
Total Fair Value | | | | $ | 217,080 | | | $ | 217,080 | |
| | | | | | |
Liability Derivatives
| | | | | | | | | | |
| | | Statement of
Assets and
Liabilities
Location | | Interest
Rate
Contracts
Risk | | | Total | |
| | | |
Futures Contracts | | Net Assets—Net unrealized depreciation on investments and futures contracts (a) | | $ | (22,136 | ) | | $ | (22,136 | ) |
| | | | | | |
Total Fair Value | | | | $ | (22,136 | ) | | $ | (22,136 | ) |
| | | | | | |
| (a) | Includes cumulative appreciation (depreciation) of futures contracts as reported in the Portfolio of Investments. Only current day’s variation margin is reported within the Statement of Assets and Liabilities. |
The effect of derivative instruments on the Statement of Operations for the period ended June 30, 2019:
Realized Gain (Loss)
| | | | | | | | | | |
| | | Statement of
Operations
Location | | Interest Rate Contracts Risk | | | Total | |
| | | |
Futures Contracts | | Net realized gain (loss) on futures transactions | | $ | 344,367 | | | $ | 344,367 | |
| | | | | | |
Total Realized Gain (Loss) | | | | $ | 344,367 | | | $ | 344,367 | |
| | | | | | |
Change in Unrealized Appreciation (Depreciation)
| | | | | | | | | | |
| | | Statement of
Operations
Location | | Interest Rate Contracts
Risk | | | Total | |
| | | |
Futures Contracts | | Net change in unrealized appreciation (depreciation) on futures contracts | | $ | 42,428 | | | $ | 42,428 | |
| | | | | | |
Total Change in Unrealized Appreciation (Depreciation) | | | | $ | 42,428 | | | $ | 42,428 | |
| | | | | | |
Average Notional Amount
| | | | | | |
| | | Interest Rate Contracts Risk | | Total | |
| | |
Futures Contracts Long | | $13,898,157 | | $ | 13,898,157 | |
Futures Contracts Short | | $ (960,779) | | $ | (960,779 | ) |
| | | |
Note 3–Fees and Related Party Transactions
(A) Manager and Subadvisors. New York Life Investments, a registered investment adviser and an indirect,wholly-owned subsidiary of New York Life, serves as the Portfolio’s Manager pursuant to an Amended and Restated Management Agreement (“Management Agreement”). The Manager provides offices, conducts clerical, recordkeeping and bookkeeping services, and keeps most of the financial and accounting records required to be maintained by the Portfolio. Except for the portion of salaries and expenses that are the responsibility of the Portfolio, the Manager pays the salaries and expenses of all personnel affiliated with the Portfolio and certain operational expenses of the Portfolio. The Portfolio reimburses New York Life Investments in an amount equal to a portion of the compensation of the Chief Compliance Officer attributable to the Portfolio. MacKay Shields LLC (“MacKay Shields” or “Subadvisor”), a registered investment adviser and an indirect,wholly-owned subsidiary of New York Life, serves as a Subadvisor to the Portfolio and is responsible for theday-to-day portfolio
| | |
| 32 | | MainStay VP Balanced Portfolio |
management of the equity portion of the Portfolio, pursuant to the terms of an Amended and Restated Subadvisory Agreement (a “Subadvisory Agreement”) between New York Life Investments and MacKay Shields. NYL Investors LLC (“NYL Investors” or “Subadvisor,” and, together with MacKay Shields, the “Subadvisors”), a registered investment adviser and a direct,wholly-owned subsidiary of New York Life, serves as a Subadvisor to the Portfolio, pursuant to the terms of a Subadvisory Agreement between New York Life Investments and NYL Investors and is responsible for theday-to-day portfolio management of the fixed-income portion of the Portfolio. New York Life Investments pays for the services of the Subadvisors.
The Fund, on behalf of the Portfolio, pays New York Life Investments in its capacity as the Portfolio’s investment manager and administrator, pursuant to the Management Agreement, a monthly fee for the services performed and the facilities furnished at an annual rate of the Portfolio’s average daily net assets as follows: 0.70% up to $1 billion; 0.65% from $1 billion to $2 billion; and 0.60% in excess of $2 billion. During the six-month period ended June 30, 2019, the effective management fee rate was 0.70%.
During the six-month period ended June 30, 2019, New York Life Investments earned fees from the Portfolio in the amount of $1,357,570, and paid MacKay Shields and NYL Investors in the amounts of $411,300 and $236,299, respectively.
State Street providessub-administration andsub-accounting services to the Portfolio pursuant to an agreement with New York Life Investments. These services include calculating the daily NAVs of the Portfolio, maintaining the general ledger andsub-ledger accounts for the
calculation of the Portfolio’s NAVs and assisting New York Life Investments in conducting various aspects of the Portfolio’s administrative operations. For providing these services to the Portfolio, State Street is compensated by New York Life Investments.
Pursuant to an agreement between the Fund and New York Life Investments, New York Life Investments is responsible for providing or procuring certain regulatory reporting services for the Portfolio. The Portfolio will reimburse New York Life Investments for the actual costs incurred by New York Life Investments in connection with providing or procuring these services for the Portfolio.
(B) Distribution and Service Fees. The Fund, on behalf of the Portfolio, has entered into a distribution agreement with NYLIFE Distributors LLC (the “Distributor”), an indirect,wholly-owned subsidiary of New York Life. The Portfolio has adopted a distribution plan (the “Plan”) in accordance with the provisions of Rule 12b-1 under the 1940 Act. Under the Plan, the Distributor has agreed to provide, through its affiliates or independent third parties, various distribution-related, shareholder and administrative support services to the Service Class shareholders. For its services, the Distributor is entitled to a combined distribution and service fee accrued daily and paid monthly at an annual rate of 0.25% of the average daily net assets attributable to the Service Class shares of the Portfolio.
(C) Investments in Affiliates (in 000’s). During the six-month period ended June 30, 2019, purchases and sales transactions, income earned from investments and shares held of investment companies managed by New York Life Investments or its affiliates were as follows:
| | | | | | | | | | | | | | | | | | | | | | | | | | | | | | | | | | | | |
Affiliated Investment Company | | Value,
Beginning
of Period | | | Purchases
at Cost | | | Proceeds
from
Sales | | | Net
Realized
Gain/
(Loss)
on Sales | | | Change in
Unrealized
Appreciation/
(Depreciation) | | | Value,
End of
Period | | | Dividend
Income | | | Other
Distributions | | | Shares
End of
Period | |
MainStay U.S. Government Liquidity Fund | | $ | — | | | $ | 220 | | | $ | (220 | ) | | $ | — | | | $ | — | | | $ | — | | | $ | 0 | (a) | | $ | — | | | | — | |
Note 4–Federal Income Tax
As of June 30, 2019, the cost and unrealized appreciation (depreciation) of the Portfolio’s investment portfolio, including applicable derivative contracts and other financial instruments, as determined on a federal income tax basis, were as follows:
| | | | | | | | | | | | | | | | |
| | | Federal Tax
Cost | | | Gross
Unrealized
Appreciation | | | Gross
Unrealized
(Depreciation) | | | Net
Unrealized
Appreciation/
(Depreciation) | |
Investments in Securities | | $ | 368,962,438 | | | $ | 42,291,142 | | | $ | (9,619,765 | ) | | $ | 32,671,377 | |
During the year ended December 31, 2018, the tax character of distributions paid as reflected in the Statements of Changes in Net Assets was as follows:
| | |
|
| 2018 |
Tax-Based
Distributions
from Ordinary
Income | | Tax-Based
Distributions
from Long-Term
Gains |
| |
| $11,880,265 | | $12,207,891 |
Note 5–Custodian
State Street is the custodian of cash and securities held by the Portfolio. Custodial fees are charged to the Portfolio based on the Portfolio’s net assets and/or the market value of securities held by the Portfolio and the number of certain transactions incurred by the Portfolio.
Notes to Financial Statements(Unaudited) (continued)
Note 6–Line of Credit
The Portfolio and certain other funds managed by New York Life Investments maintain a line of credit with a syndicate of banks in order to secure a source of funds for temporary purposes to meet unanticipated or excessive redemption requests.
Effective July 30, 2019, under the credit agreement (the “Credit Agreement”), the aggregate commitment amount is $600,000,000 with an additional uncommitted amount of $100,000,000. The commitment fee is an annual rate of 0.15% of the average commitment amount payable quarterly, regardless of usage, to State Street, who serves as the agent to the syndicate. The commitment fee is allocated among the Portfolio and certain other funds managed by New York Life Investments based upon their respective net assets and other factors. Interest on any revolving credit loan is charged based upon the Federal Funds Rate or the one-month London Interbank Offered Rate (“LIBOR”), whichever is higher. The Credit Agreement expires on July 28, 2020, although the Portfolio, certain other funds managed by New York Life Investments and the syndicate of banks may renew the Credit Agreement for an additional year on the same or different terms. Prior to July 30, 2019, the aggregate commitment amount and the commitment fee were the same as those under the current Credit Agreement. During the six-month period ended June 30, 2019, there were no borrowings made or outstanding with respect to the Portfolio under the Credit Agreement.
Note 7–Interfund Lending Program
Pursuant to an exemptive order issued by the SEC, the Portfolio, along with certain other funds managed by New York Life Investments, may participate in an interfund lending program. The interfund lending program provides an alternative credit facility that permits the Portfolio and certain other funds managed by New York Life Investments to lend or borrow money for temporary purposes directly to or from one another, subject to the conditions of the exemptive order. During the six-month period ended June 30, 2019, there were no interfund loans made or outstanding with respect to the Portfolio.
Note 8–Purchases and Sales of Securities (in 000’s)
During the six-month period ended June 30, 2019, purchases and sales of U.S. government securities were $128,401 and $108,818, respectively. Purchases and sales of securities, other than U.S. government securities andshort-term securities, were $238,851 and $268,173, respectively.
Note 9–Capital Share Transactions
Transactions in capital shares for the six-month period ended June 30, 2019 and the year ended December 31, 2018, were as follows:
| | | | | | | | |
Initial Class | | Shares | | | Amount | |
| | |
Six-month period ended June 30, 2019: | | | | | | | | |
Shares sold | | | 35,625 | | | $ | 513,496 | |
Shares redeemed | | | (52,616 | ) | | | (752,293 | ) |
| | | | |
Net increase (decrease) | | | (16,991 | ) | | $ | (238,797 | ) |
| | | | |
Year ended December 31, 2018: | | | | | | | | |
Shares sold | | | 126,378 | | | $ | 1,824,918 | |
Shares issued to shareholders in reinvestment of dividends and distributions | | | 71,020 | | | | 1,036,372 | |
Shares redeemed | | | (115,188 | ) | | | (1,702,995 | ) |
| | | | |
Net increase (decrease) | | | 82,210 | | | $ | 1,158,295 | |
| | | | |
| | |
| | | | | | | | |
Service Class | | Shares | | | Amount | |
Six-month period ended June 30, 2019: | | | | | | | | |
Shares sold | | | 1,036,308 | | | $ | 14,720,799 | |
Shares redeemed | | | (2,032,101 | ) | | | (28,741,298 | ) |
| | | | |
Net increase (decrease) | | | (995,793 | ) | | $ | (14,020,499 | ) |
| | | | |
Year ended December 31, 2018: | | | | | | | | |
Shares sold | | | 1,868,209 | | | $ | 27,519,876 | |
Shares issued to shareholders in reinvestment of dividends and distributions | | | 1,594,924 | | | | 23,051,784 | |
Shares redeemed | | | (4,922,133 | ) | | | (72,356,342 | ) |
| | | | |
Net increase (decrease) | | | (1,459,000 | ) | | $ | (21,784,682 | ) |
| | | | |
Note 10–Recent Accounting Pronouncements
To improve the effectiveness of fair value disclosure requirements, the Financial Accounting Standards Board recently issued Accounting Standard Update (ASU)2018-13, Fair Value Measurement Disclosure Framework—Changes to the Disclosure Requirements for Fair Value Measurement (ASU2018-13), which adds, removes, and modifies certain aspects relating to fair value disclosure. ASU2018-13 is effective for interim and annual reporting periods beginning after December 15, 2019; early adoption of the additions relating toASU 2018-13 is not required. Management has evaluated the implications of certain other provisions of the ASU and has determined to early adopt aspects related to the removal and modifications of certain fair value measurement disclosures under the ASU effective immediately. At this time, management is evaluating the implications of certain other provisions of the ASU related to new disclosure requirements and any impact on the financial statement disclosures has not yet been determined.
Note 11–Subsequent Events
In connection with the preparation of the financial statements of the Portfolio as of and for the six-month period ended June 30, 2019, events and transactions subsequent to June 30, 2019, through the date the financial statements were issued have been evaluated by the Portfolio’s management for possible adjustment and/or disclosure. No subsequent events requiring financial statement adjustment or disclosure have been identified.
| | |
| 34 | | MainStay VP Balanced Portfolio |
Proxy Voting Policies and Procedures and Proxy Voting Record
A description of the policies and procedures that New York Life Investments uses to vote proxies related to the Portfolio’s securities is available without charge, upon request (i) by calling800-598-2019; (ii) by visiting New York Life Investments website at https://www.nylinvestments.com/mainstay/products-and-performance/mainstay-vp-funds-trust; or (iii) by visiting the SEC’s website at www.sec.gov.
The Portfolio is required to file with the SEC its proxy voting record for the12-month period ending June 30 on Form N-PX. The Portfolio’s most recent Form N-PX or proxy voting record is available free of charge upon request (i) by calling800-598-2019; (ii) by visiting New York Life Investments website at https://www.nylinvestments.com/mainstay/products-and-performance/mainstay-vp-funds-trust; or (iii) by visiting the SEC’s website atwww.sec.gov.
Shareholder Reports and Quarterly Portfolio Disclosure
The Portfolio is required to file its complete schedule of portfolio holdings with the SEC 60 days after each fiscal quarter onForm N-PORT. The Portfolio’s holdings report is available without charge upon request (i) by calling800-598-2019; (ii) by visiting New York Life Investments website at https://www.nylinvestments.com/mainstay/products-and-performance/mainstay-vp-funds-trust; or (iii) on the SEC’s website at www.sec.gov.
MainStay VP Portfolios
MainStay VP offers a wide range of Portfolios. The full array of MainStay VP offerings is listed here, with information about the manager, subadvisors, legal counsel, and independent registered public accounting firm.
Equity Portfolios
MainStay VP Eagle Small Cap Growth Portfolio
MainStay VP Emerging Markets Equity Portfolio
MainStay VP Epoch U.S. Equity Yield Portfolio
MainStay VP Fidelity Institutional AM® Utilities Portfolio†
MainStay VP Large Cap Growth Portfolio
MainStay VP MacKay Common Stock Portfolio
MainStay VP MacKay Growth Portfolio
MainStay VP MacKay International Equity Portfolio
MainStay VP MacKay Mid Cap Core Portfolio
MainStay VP MacKay S&P 500 Index Portfolio
MainStay VP MacKay Small Cap Core Portfolio
MainStay VP Mellon Natural Resources Portfolio
MainStay VP T. Rowe Price Equity Income Portfolio
Mixed Asset Portfolios
MainStay VP Balanced Portfolio
MainStay VP Income Builder Portfolio
MainStay VP Janus Henderson Balanced Portfolio
MainStay VP MacKay Convertible Portfolio
Income Portfolios
MainStay VP Bond Portfolio
MainStay VP Floating Rate Portfolio
MainStay VP Indexed Bond Portfolio
MainStay VP MacKay Government Portfolio
MainStay VP MacKay High Yield Corporate Bond Portfolio
MainStay VP MacKay Unconstrained Bond Portfolio
MainStay VP PIMCO Real Return Portfolio
Money Market
MainStay VP U.S. Government Money Market Portfolio
Alternative
MainStay VP Cushing Renaissance Advantage Portfolio
MainStay VP IQ Hedge Multi-Strategy Portfolio
Asset Allocation Portfolios
MainStay VP Conservative Allocation Portfolio
MainStay VP Growth Allocation Portfolio
MainStay VP Moderate Allocation Portfolio
MainStay VP Moderate Growth Allocation Portfolio
Manager
New York Life Investment Management LLC
New York, New York
Subadvisors
Candriam Belgium*
Brussels, Belgium
Cushing Asset Management, LP
Dallas, Texas
Eagle Asset Management, Inc.
St Petersburg, Florida
Epoch Investment Partners, Inc.
New York, New York
FIAM LLC
Smithfield, Rhode Island
IndexIQ Advisors LLC*
New York, New York
Janus Capital Management LLC
Denver, Colorado
MacKay Shields LLC*
New York, New York
Mellon Investments Corporation
Boston, Massachusetts
NYL Investors LLC*
New York, New York
Pacific Investment Management Company LLC
Newport Beach, California
T. Rowe Price Associates, Inc.
Baltimore, Maryland
Winslow Capital Management, LLC
Minneapolis, Minnesota
Distributor
NYLIFE Distributors LLC*
Jersey City, New Jersey
Custodian
State Street Bank and Trust Company
Boston, Massachusetts
Independent Registered Public Accounting Firm
PricewaterhouseCoopers LLP
New York, New York
Legal Counsel
Dechert LLP
Washington, District of Columbia
Some Portfolios may not be available in all products.
| † | Fidelity Institutional AM is a registered trade mark of FMR LLC. Used with permission. |
| * | An affiliate of New York Life Investment Management LLC |
Not part of the Semiannual Report
2019 Semiannual Report
This report is for the general information of New York Life Variable Annuities and NYLIAC Variable Universal Life Insurance Products policyowners. It must be preceded or accompanied by the appropriate product(s) and funds prospectuses if it is given to anyone who is not an owner of a New York Life variable annuity policy or a NYLIAC Variable Universal Life Insurance Product. This report does not offer for sale or solicit orders to purchase securities.
The performance data quoted in this report represents past performance. Past performance is no guarantee of future results. Due to market volatility and other factors, current performance may be lower or higher than the figures shown. The most recent month-end performance summary for your variable annuity or variable life policy is available by calling 800-598-2019 and is updated periodically on www.newyorklife.com.
The New York Life Variable Annuities and NYLIAC Variable Universal Life Insurance Products are issued by New York Life Insurance and Annuity Corporation (a Delaware Corporation) and distributed by NYLIFE Distributors LLC (Member FINRA/SIPC).
New York Life Insurance Company
New York Life Insurance and Annuity Corporation (NYLIAC) (A Delaware Corporation)
51 Madison Avenue, Room 551
New York, NY 10010
www.newyorklife.com
Printed on recycled paper
nylinvestments.com
NYLIFE Distributors LLC, 30 Hudson Street, Jersey City, NJ 07302
New York Life Investment Management LLC is the investment manager to the MainStay VP Funds Trust
©2019 by NYLIFE Distributors LLC. All rights reserved.
You may obtain copies of the Prospectus and the Statement of Additional Information free of charge, upon request, by callingtoll-free 800-598-2019 or writing to New York Life Insurance and Annuity Corporation, 51 Madison Avenue, New York, NY 10010.
| | | | |
| | | |
| Not FDIC Insured | | No Bank Guarantee | | May Lose Value |
| | | | |
| 1781603 | | | | MSVPBL10-08/19 (NYLIAC) NI508 |
MainStay VP MacKay Common
Stock Portfolio
Message from the President and Semiannual Report
Unaudited | June 30, 2019

Beginning on January 1, 2021, as permitted by regulations adopted by the Securities and Exchange Commission, paper copies of the MainStay VP Portfolio annual and semi-annual shareholder reports may no longer be sent by mail, unless you specifically request paper copies of the reports from the insurance company that offers your policy. Instead, the reports will be made available online, and you will be notified by mail each time a report is posted and provided with a website link to access the report. Instructions for requesting paper copies will be provided by your insurance company.
If you already elected to receive shareholder reports electronically, you will not be affected by this change and you need not take any action. At any time, you may elect to receive reports and other communications from the insurance company electronically by following the instructions provided by the insurance company.
You may elect to receive all future shareholder reports in paper form free of charge. You can inform the insurance company that you wish to receive paper copies of reports by following the instructions provided by the insurance company. Your election to receive reports in paper form will apply to all portfolio companies available under your contract.
| | | | | | | | |
| | | | | |
| Not FDIC/NCUA Insured | | Not a Deposit | | May Lose Value | | No Bank Guarantee | | Not Insured by Any Government Agency |

This page intentionally left blank
Message from the President
Most equity and fixed-income markets in the United States and around the world advanced in the face of conflicting political and macroeconomic forces during thesix-month period ended June 30, 2019.
The reporting period began on the heels of tumultuous December 2018, during which equities and equity-sensitive bonds spiked sharply lower on concerns regarding the pace of economic growth, a U.S. government shutdown and the potential impact of trade disputes between the United States and other nations, particularly China. Markets recovered quickly in early 2019 as trade tensions eased, the government reopened and the U.S. Federal Reserve Board (Fed) adopted a more patient tone regarding the future direction of interest rates. Markets moved broadly higher from January through April, supported by encouraging economic data and generally strong corporate earnings.
During the first four months of the reporting period, the improving economic environment encouraged investors to favor areas of the market viewed as offering greater return potential along with higher risks. Among U.S. stocks, cyclical, growth-oriented sectors tended to outperform more defensive, value-oriented sectors, whilelarge-cap stocks outperformed theirsmaller-cap counterparts. Within the S&P 500® Index, the information technology sector led the market’s advance, followed by communication services, consumer discretionary and consumer staples. Industrials, utilities, financials, materials, real estate and energy produced more modest gains. While some international equity markets outperformed or underperformed the U.S. market, on average international stocks mirrored the performance of their U.S. counterparts. Fixed-income securities gained ground as well, albeit along a more gradual trajectory. Among U.S. fixed-income instruments, corporate issues generally outperformed government bonds, with lower credit quality, higher yielding securities leading the sector’s advance. Long-term U.S. Treasury bond yields proved particularly weak, with
10-year yields dipping at times below3-month yields, reflecting investors’ continued concerns about domestic economic growth.
May 2019 saw a return of uncertainty and volatility. Trade discussions between the United States and China faltered, driving global equity prices lower. Government bond prices rose as investors sought safe havens. June brought yet anotherU-turn as equity prices climbed again after comments from the Fed raised hopes of an interest rate cut in response to weak economic data. Stock and bond prices rose, with U.S. equity markets ending the reporting period in record territory.
We are pleased to see renewed signs of strength in broad areas of the financial market. At the same time, we remained sharply focused on providing you, as a MainStay VP investor, with the experienced and disciplined fund management that we believe underpins an effective, long-term investment strategy. Whatever tomorrow’s investment environment brings, you can rely on our portfolio managers to pursue the objectives of their individual Portfolios as outlined in the prospectus with the energy and dedication you have come to expect.
The report that follows contains additional information on the market events, investment decisions and specific securities that shaped your VP Portfolio’s performance during the six months ended June 30, 2019. We encourage you to read the report carefully and use it to evaluate your Portfolio’s performance in light of your long-range financial plan.
Sincerely,

Kirk C. Lehneis
President
The opinions expressed are as of the date of this report and are subject to change. There is no guarantee that any forecast made will come to pass. This material does not constitute investment advice and is not intended as an endorsement of any specific investment. Past performance is no guarantee of future results.
Not part of the Semiannual Report
Table of Contents
Investors should refer to the Portfolio’s Summary Prospectus and/or Prospectus and consider the Portfolio’s investment objectives, strategies, risks, charges and expenses carefully before investing. The Summary Prospectus and/or Prospectus contain this and other information about the Portfolio. You may obtain copies of the Portfolio’s Summary Prospectus and/or the Prospectus and the Statement of Additional Information free of charge, upon request, by calling toll-free 800-598-2019, by writing to New York Life Insurance and Annuity Corporation, 51 Madison Avenue, Room 251, New York, New York 10010 or by sending an email to MainStayShareholdersServices@nylim.com. These documents are also available at nylinvestments.com/vpdocuments. Please read the Summary Prospectus and/or Prospectus carefully before investing. MainStay VP Funds Trust portfolios are separate account options which are purchased through a variable insurance or variable annuity contract.
Investment and Performance Comparison1(Unaudited)
Performance data quoted represents past performance. Past performance is no guarantee of future results. Because of market volatility and other factors, current performance may be lower or higher than the figures shown. Investment return and principal value will fluctuate, and as a result, when shares are redeemed, they may be worth more or less than their original cost. The performance table and graph do not reflect any deduction of sales charges, mortality and expense charges, contract charges or administrative charges. Please refer to the Performance Summary appropriate for your policy. For performance information current to the most recent month-end, please call800-598-2019 or visit www.newyorklife.com.
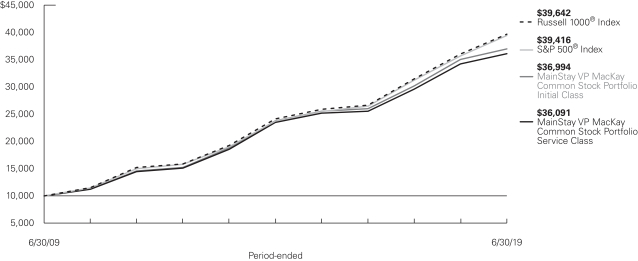
Average Annual Total Returns for the Period-Ended June 30, 2019
| | | | | | | | | | | | | | | | | | | | | | |
| Class | | Inception
Date | | Six Months | | | One Year | | | Five Years | | | Ten Years | | | Gross
Expense
Ratio2 | |
| | | | | | |
| Initial Class Shares | | 1/23/1984 | | | 15.17 | % | | | 5.69 | % | | | 9.28 | % | | | 13.98 | % | | | 0.57 | % |
| Service Class Shares | | 6/5/2003 | | | 15.03 | | | | 5.43 | | | | 9.01 | | | | 13.69 | | | | 0.82 | |
| | | | | | | | | | | | | | | | |
| Benchmark Performance | | Six Months | | | One Year | | | Five
Years | | | Ten
Years | |
| | | | |
S&P 500® Index3 | | | 18.54 | % | | | 10.42 | % | | | 10.71 | % | | | 14.70 | % |
Russell 1000® Index4 | | | 18.84 | | | | 10.02 | | | | 10.45 | | | | 14.77 | |
Morningstar Large Blend Category Average5 | | | 17.21 | | | | 8.20 | | | | 8.76 | | | | 13.24 | |
| 1. | Performance figures may reflect certain fee waivers and/or expense limitations, without which total returns may have been different. For information on current fee waivers and/or expense limitations (if any), please refer to the Notes to Financial Statements. |
| 2. | The gross expense ratios presented reflect the Portfolio’s “Total Annual Portfolio Operating Expenses” from the most recent Prospectus, as supplemented, and may differ from other expense ratios disclosed in this report. |
| 3. | The S&P 500® Index is the Portfolio’s primary broad-based securities market index for comparison purposes. “S&P 500®” is a trademark of The McGraw-Hill Companies, Inc. The S&P 500® Index is widely regarded as the standard index for measuringlarge-cap U.S. stock market performance. Results assume reinvestment of all dividends and capital gains. An investment cannot be made directly in an index. |
| 4. | The Russell 1000® Index is the Portfolio’s secondary benchmark. The Russell 1000® Index measures the performance of thelarge-cap segment of |
| | the U.S. equity universe. It is a subset of the Russell 3000® Index and includes approximately 1,000 of the largest securities based on a combination of their market cap and current index membership. Results assume reinvestment of all dividends and capital gains. An investment cannot be made directly in an index. |
| 5. | The Morningstar Large Blend Category Average is representative of funds that represent the overall US stock market in size, growth rates and price. Stocks in the top 70% of the capitalization of the US equity market are defined as large cap. The blend style is assigned to funds where neither growth nor value characteristics predominate. These funds tend to invest across the spectrum of US industries, and owing to their broad exposure, the funds’ returns are often similar to those of the S&P 500® Index. Results are based on average total returns of similar funds with all dividends and capital gain distributions reinvested. |
Cost in Dollars of a $1,000 Investment in MainStay VP MacKay Common Stock Portfolio (Unaudited)
The example below is intended to describe the fees and expenses borne by shareholders during the six-month period from January 1, 2019, to June 30, 2019, and the impact of those costs on your investment.
Example
As a shareholder of the Portfolio you incur two types of costs: (1) transaction costs, including exchange fees and sales charges (loads) on purchases (as applicable), and (2) ongoing costs, including management fees, distribution and/or service (12b-1) fees, and other Portfolio expenses (as applicable). This example is intended to help you understand your ongoing costs (in dollars) of investing in the Portfolio and to compare these costs with the ongoing costs of investing in other mutual funds. The example is based on an investment of $1,000 made at the beginning of the six-month period and held for the entire period from January 1, 2019, to June 30, 2019. Shares are only sold in connection with variable life and annuity contracts and the example does not reflect any contract level or transactional fees or expenses. If these costs had been included, your costs would have been higher.
This example illustrates your Portfolio’s ongoing costs in two ways:
Actual Expenses
The second and third data columns in the table below provide information about actual account values and actual expenses. You may use the information in these columns, together with the amount you invested, to estimate the expenses that you paid during the six months ended June 30, 2019. Simply divide your account value by $1,000
(for example, an $8,600 account value divided by $1,000 = 8.6), then multiply the result by the number under the heading entitled “Expenses Paid During Period” to estimate the expenses you paid on your account during this period.
Hypothetical Example for Comparison Purposes
The fourth and fifth data columns in the table below provide information about hypothetical account values and hypothetical expenses based on the Portfolio’s actual expense ratio and an assumed rate of return of 5% per year before expenses, which is not the Portfolio’s actual return. The hypothetical account values and expenses may not be used to estimate the actual ending account balances or expenses you paid for the six-month period shown. You may use this information to compare the ongoing costs of investing in the Portfolio with the ongoing costs of investing in other mutual funds. To do so, compare this 5% hypothetical example with the 5% hypothetical examples that appear in the shareholder reports of the other mutual funds.
Please note that the expenses shown in the table are meant to highlight your ongoing costs only and do not reflect any transactional costs, such as exchange fees or sales charges (loads). Therefore, the fourth and fifth data columns of the table are useful in comparing ongoing costs only and will not help you determine the relative total costs of owning different funds. In addition, if these transactional costs were included, your costs would have been higher.
| | | | | | | | | | | | | | | | | | | | | | |
| | | | | | | | | | | | | | | | | | |
| Share Class | | Beginning
Account
Value
1/1/19 | | | Ending Account
Value (Based
on Actual
Returns and
Expenses)
6/30/19 | | | Expenses
Paid
During
Period1 | | | Ending Account
Value (Based
on Hypothetical
5% Annualized
Return and
Actual Expenses)
6/30/19 | | | Expenses
Paid
During
Period1 | | | Net Expense
Ratio
During
Period2 |
| | | | | | |
| Initial Class Shares | | $ | 1,000.00 | | | $ | 1,151.70 | | | $ | 3.09 | | | $ | 1,021.92 | | | $ | 2.91 | | | 0.58% |
| | | | | | |
| Service Class Shares | | $ | 1,000.00 | | | $ | 1,150.30 | | | $ | 4.43 | | | $ | 1,020.68 | | | $ | 4.16 | | | 0.83% |
| 1. | Expenses are equal to the Portfolio’s annualized expense ratio of each class multiplied by the average account value over the period, divided by 365 and multiplied by 181 (to reflect the six-month period). The table above represents the actual expenses incurred during the six-month period. In addition to the fees and expenses which the Portfolio bears directly, it also indirectly bears a pro rata share of the fees and expenses of the underlying funds in which it invests. Such indirect expenses are not included in the above-reported expense figures. |
| 2. | Expenses are equal to the Portfolio’s annualized expense ratio to reflect the six-month period. |
| | |
| 6 | | MainStay VP MacKay Common Stock Portfolio |
Industry Composition as of June 30, 2019(Unaudited)
| | | | |
| |
| Software | | | 7.3 | % |
| |
| IT Services | | | 6.3 | |
| |
| Interactive Media & Services | | | 5.3 | |
| |
| Oil, Gas & Consumable Fuels | | | 5.2 | |
| |
| Banks | | | 4.7 | |
| |
| Semiconductors & Semiconductor Equipment | | | 4.6 | |
| |
| Insurance | | | 4.2 | |
| |
| Technology Hardware, Storage & Peripherals | | | 4.1 | |
| |
| Internet & Direct Marketing Retail | | | 4.0 | |
| |
| Specialty Retail | | | 3.2 | |
| |
| Media | | | 3.0 | |
| |
| Pharmaceuticals | | | 3.0 | |
| |
| Health Care Providers & Services | | | 2.7 | |
| |
| Equity Real Estate Investment Trusts | | | 2.6 | |
| |
| Health Care Equipment & Supplies | | | 2.4 | |
| |
| Biotechnology | | | 2.2 | |
| |
| Hotels, Restaurants & Leisure | | | 2.1 | |
| |
| Diversified Telecommunication Services | | | 1.9 | |
| |
| Household Products | | | 1.9 | |
| |
| Beverages | | | 1.8 | |
| |
| Exchange-Traded Funds | | | 1.7 | |
| |
| Chemicals | | | 1.6 | |
| |
| Entertainment | | | 1.6 | |
| |
| Food & Staples Retailing | | | 1.6 | |
| |
| Food Products | | | 1.6 | |
| |
| Aerospace & Defense | | | 1.4 | |
| |
| Diversified Financial Services | | | 1.4 | |
| |
| Capital Markets | | | 1.3 | |
| | | | |
| |
| Life Sciences Tools & Services | | | 1.3 | % |
| |
| Machinery | | | 1.2 | |
| |
| Professional Services | | | 1.2 | |
| |
| Electric Utilities | | | 1.0 | |
| |
| Textiles, Apparel & Luxury Goods | | | 1.0 | |
| |
| Consumer Finance | | | 0.9 | |
| |
| Household Durables | | | 0.9 | |
| |
| Commercial Services & Supplies | | | 0.8 | |
| |
| Industrial Conglomerates | | | 0.8 | |
| |
| Road & Rail | | | 0.8 | |
| |
| Tobacco | | | 0.8 | |
| |
| Communications Equipment | | | 0.7 | |
| |
| Independent Power & Renewable Electricity Producers | | | 0.6 | |
| |
| Airlines | | | 0.5 | |
| |
| Multi-Utilities | | | 0.5 | |
| |
| Building Products | | | 0.4 | |
| |
| Containers & Packaging | | | 0.4 | |
| |
| Diversified Consumer Services | | | 0.4 | |
| |
| Health Care Technology | | | 0.3 | |
| |
| Construction & Engineering | | | 0.2 | |
| |
| Electronic Equipment, Instruments & Components | | | 0.2 | |
| |
| Multiline Retail | | | 0.2 | |
| |
| Trading Companies & Distributors | | | 0.2 | |
| |
| Air Freight & Logistics | | | 0.0 | ‡ |
| |
| Short-Term Investments | | | 0.2 | |
| |
| Other Assets, Less Liabilities | | | –0.2 | |
| | | | |
| |
| | | 100.0 | % |
| | | | |
See Portfolio of Investments beginning on page 9 for specific holdings within these categories. The Portfolio’s holdings are subject to change.
| ‡ | Less than one-tenth of a percent. |
Top Ten Holdings as of June 30, 2019 (excluding short-term investments) (Unaudited)
| 5. | Facebook, Inc., Class A |
Portfolio Management Discussion and Analysis(Unaudited)
Answers to the questions reflect the views of portfolio managers Migene Kim, CFA, and Mona Patni of MacKay Shields LLC, the Portfolio’s Subadvisor.
How did MainStay VP MacKay Common Stock Portfolio perform relative to its benchmarks and peers during the six months ended June 30, 2019?
For the six months ended June 30, 2019, MainStay VP MacKay Common Stock Portfolio returned 15.17% for Initial Class shares and 15.03% for Service Class shares. Over the same period, both share classes underperformed the 18.54% return of the S&P 500® Index, which is the Portfolio’s primary benchmark, the 18.84% return of the Russell 1000® Index, which is the secondary benchmark of the Portfolio, and the 17.21% return of the Morningstar Large Blend Category Average.1
What factors affected the Portfolio’s relative performance during the reporting period?
The Portfolio’s underperformance, relative to the S&P 500® Index, directly reflected the performance of our stock selection model, particularly the weak effectiveness of the model’s valuation signals, which seek to evaluate companies across sales- and cash-based measures on a peer-relative basis. Valuation ranges across markets were compressed and value signals, which tend to prove most effective in an environment in which profits are accelerating, struggled amid a decelerating global growth outlook. Valuation signals proved more effective in June 2019 when value performance rebounded. Positive contributions from the stock selection model’s other factors provided only partial mitigation. (Contributions take weightings and total returns into account.) Momentum signals, which evaluate historical price trends, generated positive relative performance for the Portfolio during the reporting period, but proved volatile and inconsistent, hence difficult to capture. Sentiment signals, a gauge of institutional investor sentiment, were not effective during the first half of the reporting period but rebounded in the second half of the same period thanks to the Portfolio’s underweight positions.
Which sectors were the strongest positive contributors to the Portfolio’s relative performance, and which sectors were particularly weak?
Although still detracting from performance, the strongest sectors during the period were real estate, financials, and utilities. During the same period, the sectors that detracted most from the Portfolio’s relative performance were technology, consumer discretionary and health care.
During the reporting period, which individual stocks made the strongest positive contributions to the Portfolio’s absolute performance and which stocks detracted the most?
Software company Microsoft, consumer electronics leader Apple ande-commerce company Amazon.com provided the strongest contributions to the Portfolio’s absolute performance during the reporting period. Biopharmaceuticals company AbbVie, specialty pharmaceuticals company Mylan, and pharmacy retailer Walgreens were the weakest contributors to the Portfolio’s absolute performance during the same period.
Did the Portfolio make any significant purchases or sales during the reporting period?
During the reporting period, the Portfolio’s largest initial purchase was a position in insurance provider American International Group, while its largest increase in position size was in social media platform Facebook. During the same period, the largest position that the Portfolio sold entirely was in energy refiner Marathon Petroleum, and its most substantial decrease in position size was in insurance holding company Berkshire Hathaway.
How did the Portfolio’s sector weightings change during the reporting period?
Relative to the S&P 500® Index, the Portfolio’s most-substantial increases in sector exposure during the reporting period were in consumer staples and communication services. Conversely, the Portfolio’s largest decreases in benchmark-relative sector exposures were in health care and utilities.
How was the Portfolio positioned at the end of the reporting period?
As of June 30, 2019, the Portfolio’s most substantially overweight positions relative to the S&P 500® Index were in the information technology and communication services sectors. As of the same date, the Portfolio held its most substantially underweight positions relative to the S&P 500® Index in the health care and industrials sectors.
| 1. | See page 5 for more information on benchmark and peer group returns. |
The opinions expressed are those of the portfolio managers as of the date of this report and are subject to change. There is no guarantee that any forecasts will come to pass. This material does not constitute investment advice and is not intended as an endorsement of any specific investment.
Not all MainStay VP Portfolios and/or share classes are available under all policies.
| | |
| 8 | | MainStay VP MacKay Common Stock Portfolio |
Portfolio of InvestmentsJune 30, 2019 (Unaudited)
| | | | | | | | |
| | |
| | | Shares | | | Value | |
| Common Stocks 98.3%† | |
Aerospace & Defense 1.4% | |
Boeing Co. | | | 23,860 | | | $ | 8,685,279 | |
Huntington Ingalls Industries, Inc. | | | 973 | | | | 218,672 | |
L3harris Technologies, Inc. | | | 2,627 | | | | 496,845 | |
Lockheed Martin Corp. | | | 121 | | | | 43,988 | |
Northrop Grumman Corp. | | | 3,103 | | | | 1,002,610 | |
United Technologies Corp. | | | 6,009 | | | | 782,372 | |
| | | | | | | | |
| | | | | | | 11,229,766 | |
| | | | | | | | |
Air Freight & Logistics 0.0%‡ | |
United Parcel Service, Inc., Class B | | | 1,647 | | | | 170,086 | |
| | | | | | | | |
|
Airlines 0.5% | |
Delta Air Lines, Inc. | | | 145 | | | | 8,229 | |
Southwest Airlines Co. | | | 52,948 | | | | 2,688,699 | |
United Continental Holdings, Inc. (a) | | | 14,506 | | | | 1,270,000 | |
| | | | | | | | |
| | | | | | | 3,966,928 | |
| | | | | | | | |
Banks 4.7% | |
Bank of America Corp. | | | 374,481 | | | | 10,859,949 | |
Citigroup, Inc. | | | 113,418 | | | | 7,942,663 | |
JPMorgan Chase & Co. | | | 126,619 | | | | 14,156,004 | |
Wells Fargo & Co. | | | 80,932 | | | | 3,829,702 | |
| | | | | | | | |
| | | | | | | 36,788,318 | |
| | | | | | | | |
Beverages 1.8% | |
Coca-Cola Co. | | | 67,812 | | | | 3,452,987 | |
Molson Coors Brewing Co., Class B | | | 32,720 | | | | 1,832,320 | |
PepsiCo., Inc. | | | 64,081 | | | | 8,402,942 | |
| | | | | | | | |
| | | | | | | 13,688,249 | |
| | | | | | | | |
Biotechnology 2.2% | |
AbbVie, Inc. | | | 79,972 | | | | 5,815,564 | |
Amgen, Inc. | | | 22,064 | | | | 4,065,954 | |
Biogen, Inc. (a) | | | 14,158 | | | | 3,311,131 | |
Gilead Sciences, Inc. | | | 61,404 | | | | 4,148,454 | |
United Therapeutics Corp. (a) | | | 1,963 | | | | 153,232 | |
| | | | | | | | |
| | | | | | | 17,494,335 | |
| | | | | | | | |
Building Products 0.4% | |
Masco Corp. | | | 78,884 | | | | 3,095,408 | |
| | | | | | | | |
|
Capital Markets 1.3% | |
Ameriprise Financial, Inc. | | | 22,393 | | | | 3,250,568 | |
Bank of New York Mellon Corp. | | | 42,333 | | | | 1,869,002 | |
Charles Schwab Corp. | | | 13,038 | | | | 523,997 | |
E*TRADE Financial Corp. | | | 31,957 | | | | 1,425,282 | |
MSCI, Inc. | | | 3,755 | | | | 896,657 | |
Raymond James Financial, Inc. | | | 23,301 | | | | 1,970,100 | |
Stifel Financial Corp. | | | 22 | | | | 1,299 | |
| | | | | | | | |
| | | | | | | 9,936,905 | |
| | | | | | | | |
| | | | | | | | |
| | |
| | | Shares | | | Value | |
Chemicals 1.6% | |
Air Products & Chemicals, Inc. | | | 2,164 | | | $ | 489,865 | |
CF Industries Holdings, Inc. | | | 67,374 | | | | 3,147,040 | |
Corteva, Inc. (a) | | | 11,979 | | | | 354,219 | |
Dow, Inc. (a) | | | 23,537 | | | | 1,160,609 | |
DuPont de Nemours, Inc. | | | 23,249 | | | | 1,745,302 | |
Linde PLC | | | 3,416 | | | | 685,933 | |
LyondellBasell Industries N.V., Class A | | | 41,269 | | | | 3,554,499 | |
Mosaic Co. | | | 46,174 | | | | 1,155,735 | |
| | | | | | | | |
| | | | | | | 12,293,202 | |
| | | | | | | | |
Commercial Services & Supplies 0.8% | |
Brink’s Co. | | | 3,552 | | | | 288,351 | |
Republic Services, Inc. | | | 21,853 | | | | 1,893,344 | |
Waste Management, Inc. | | | 36,076 | | | | 4,162,088 | |
| | | | | | | | |
| | | | | | | 6,343,783 | |
| | | | | | | | |
Communications Equipment 0.7% | |
Arista Networks, Inc. (a) | | | 854 | | | | 221,715 | |
Cisco Systems, Inc. | | | 95,071 | | | | 5,203,236 | |
| | | | | | | | |
| | | | | | | 5,424,951 | |
| | | | | | | | |
Construction & Engineering 0.2% | |
AECOM (a) | | | 47,538 | | | | 1,799,313 | |
| | | | | | | | |
|
Consumer Finance 0.9% | |
American Express Co. | | | 682 | | | | 84,186 | |
Discover Financial Services | | | 44,220 | | | | 3,431,030 | |
Synchrony Financial | | | 97,110 | | | | 3,366,804 | |
| | | | | | | | |
| | | | | | | 6,882,020 | |
| | | | | | | | |
Containers & Packaging 0.4% | |
Ball Corp. | | | 37,851 | | | | 2,649,191 | |
Packaging Corp. of America | | | 6,827 | | | | 650,750 | |
| | | | | | | | |
| | | | | | | 3,299,941 | |
| | | | | | | | |
Diversified Consumer Services 0.4% | |
H&R Block, Inc. | | | 102,354 | | | | 2,998,972 | |
| | | | | | | | |
|
Diversified Financial Services 1.4% | |
Berkshire Hathaway, Inc., Class B (a) | | | 49,511 | | | | 10,554,260 | |
| | | | | | | | |
|
Diversified Telecommunication Services 1.9% | |
AT&T, Inc. | | | 149,638 | | | | 5,014,369 | |
CenturyLink, Inc. | | | 37,388 | | | | 439,683 | |
Verizon Communications, Inc. | | | 165,344 | | | | 9,446,103 | |
| | | | | | | | |
| | | | | | | 14,900,155 | |
| | | | | | | | |
Electric Utilities 1.0% | |
American Electric Power Co., Inc. | | | 20,395 | | | | 1,794,964 | |
Duke Energy Corp. | | | 5,228 | | | | 461,319 | |
Exelon Corp. | | | 83,629 | | | | 4,009,174 | |
NextEra Energy, Inc. | | | 1,985 | | | | 406,647 | |
Pinnacle West Capital Corp. | | | 499 | | | | 46,951 | |
| | | | | | |
The notes to the financial statements are an integral part of,
and should be read in conjunction with, the financial statements. | | | | | 9 | |
Portfolio of InvestmentsJune 30, 2019 (Unaudited) (continued)
| | | | | | | | |
| | |
| | | Shares | | | Value | |
| Common Stocks (continued) | |
Electric Utilities (continued) | |
Southern Co. | | | 17,635 | | | $ | 974,863 | |
| | | | | | | | |
| | | | | | | 7,693,918 | |
| | | | | | | | |
Electronic Equipment, Instruments & Components 0.2% | |
Jabil, Inc. | | | 37,132 | | | | 1,173,371 | |
| | | | | | | | |
|
Entertainment 1.6% | |
Cinemark Holdings, Inc. | | | 40,812 | | | | 1,473,313 | |
Live Nation Entertainment, Inc. (a) | | | 5,811 | | | | 384,979 | |
Netflix, Inc. (a) | | | 13,683 | | | | 5,026,040 | |
Viacom, Inc., Class B | | | 33,499 | | | | 1,000,615 | |
Walt Disney Co. | | | 35,497 | | | | 4,956,801 | |
| | | | | | | | |
| | | | | | | 12,841,748 | |
| | | | | | | | |
Equity Real Estate Investment Trusts 2.6% | |
American Tower Corp. | | | 26,604 | | | | 5,439,188 | |
Apartment Investment & Management Co., Class A | | | 272 | | | | 13,633 | |
AvalonBay Communities, Inc. | | | 966 | | | | 196,272 | |
EPR Properties | | | 5,111 | | | | 381,230 | |
Equinix, Inc. | | | 605 | | | | 305,095 | |
Equity Residential | | | 9,130 | | | | 693,150 | |
Essex Property Trust, Inc. | | | 151 | | | | 44,081 | |
Host Hotels & Resorts, Inc. | | | 163,787 | | | | 2,984,199 | |
Iron Mountain, Inc. | | | 24,917 | | | | 779,902 | |
Mid-America Apartment Communities, Inc. | | | 8,112 | | | | 955,269 | |
Omega Healthcare Investors, Inc. | | | 16,647 | | | | 611,777 | |
Pebblebrook Hotel Trust | | | 1,112 | | | | 31,336 | |
Public Storage | | | 15,981 | | | | 3,806,195 | |
Rayonier, Inc. | | | 5,735 | | | | 173,771 | |
SBA Communications Corp. (a) | | | 9,135 | | | | 2,053,913 | |
Simon Property Group, Inc. | | | 5,741 | | | | 917,182 | |
Ventas, Inc. | | | 12,263 | | | | 838,176 | |
Welltower, Inc. | | | 2,022 | | | | 164,854 | |
| | | | | | | | |
| | | | | | | 20,389,223 | |
| | | | | | | | |
Food & Staples Retailing 1.6% | |
Costco Wholesale Corp. | | | 8,786 | | | | 2,321,788 | |
Kroger Co. | | | 24,052 | | | | 522,169 | |
Sysco Corp. | | | 33,291 | | | | 2,354,340 | |
Walmart, Inc. | | | 62,518 | | | | 6,907,614 | |
| | | | | | | | |
| | | | | | | 12,105,911 | |
| | | | | | | | |
Food Products 1.6% | |
Campbell Soup Co. | | | 66,684 | | | | 2,672,028 | |
General Mills, Inc. | | | 50,079 | | | | 2,630,149 | |
J.M. Smucker Co. | | | 12,344 | | | | 1,421,905 | |
Post Holdings, Inc. (a) | | | 18,949 | | | | 1,970,128 | |
Tyson Foods, Inc., Class A | | | 42,256 | | | | 3,411,749 | |
| | | | | | | | |
| | | | | | | 12,105,959 | |
| | | | | | | | |
| | | | | | | | |
| | |
| | | Shares | | | Value | |
Health Care Equipment & Supplies 2.4% | |
Abbott Laboratories | | | 71,932 | | | $ | 6,049,481 | |
ABIOMED, Inc. (a) | | | 1,416 | | | | 368,854 | |
Baxter International, Inc. | | | 4,367 | | | | 357,657 | |
Cooper Cos., Inc. | | | 10,194 | | | | 3,434,257 | |
Danaher Corp. | | | 410 | | | | 58,597 | |
DENTSPLY SIRONA, Inc. | | | 26,024 | | | | 1,518,761 | |
Hill-Rom Holdings, Inc. | | | 2,125 | | | | 222,317 | |
Hologic, Inc. (a) | | | 16,215 | | | | 778,644 | |
Intuitive Surgical, Inc. (a) | | | 3,587 | | | | 1,881,561 | |
Medtronic PLC | | | 38,592 | | | | 3,758,475 | |
Stryker Corp. | | | 122 | | | | 25,081 | |
| | | | | | | | |
| | | | | | | 18,453,685 | |
| | | | | | | | |
Health Care Providers & Services 2.7% | |
AmerisourceBergen Corp. | | | 37,635 | | | | 3,208,760 | |
Cardinal Health, Inc. | | | 24,781 | | | | 1,167,185 | |
Encompass Health Corp. | | | 21,191 | | | | 1,342,662 | |
HCA Healthcare, Inc. | | | 29,519 | | | | 3,990,083 | |
McKesson Corp. | | | 26,396 | | | | 3,547,358 | |
UnitedHealth Group, Inc. | | | 20,560 | | | | 5,016,846 | |
Universal Health Services, Inc., Class B | | | 24,010 | | | | 3,130,664 | |
| | | | | | | | |
| | | | | | | 21,403,558 | |
| | | | | | | | |
Health Care Technology 0.3% | |
Cerner Corp. | | | 35,587 | | | | 2,608,527 | |
| | | | | | �� | | |
|
Hotels, Restaurants & Leisure 2.1% | |
Cracker Barrel Old Country Store, Inc. (b) | | | 15,887 | | | | 2,712,388 | |
Darden Restaurants, Inc. | | | 25,938 | | | | 3,157,433 | |
Hilton Worldwide Holdings, Inc. | | | 2,473 | | | | 241,711 | |
McDonald’s Corp. | | | 10,862 | | | | 2,255,603 | |
Norwegian Cruise Line Holdings, Ltd. (a) | | | 27,599 | | | | 1,480,134 | |
Royal Caribbean Cruises, Ltd. | | | 7,501 | | | | 909,196 | |
Starbucks Corp. | | | 71,821 | | | | 6,020,754 | |
| | | | | | | | |
| | | | | | | 16,777,219 | |
| | | | | | | | |
Household Durables 0.9% | |
NVR, Inc. (a) | | | 411 | | | | 1,385,173 | |
PulteGroup, Inc. | | | 89,698 | | | | 2,836,251 | |
Toll Brothers, Inc. | | | 66,305 | | | | 2,428,089 | |
Whirlpool Corp. | | | 1,162 | | | | 165,422 | |
| | | | | | | | |
| | | | | | | 6,814,935 | |
| | | | | | | | |
Household Products 1.9% | |
Kimberly-Clark Corp. | | | 26,836 | | | | 3,576,702 | |
Procter & Gamble Co. | | | 101,895 | | | | 11,172,787 | |
| | | | | | | | |
| | | | | | | 14,749,489 | |
| | | | | | | | |
Independent Power & Renewable Electricity Producers 0.6% | |
AES Corp. | | | 125,892 | | | | 2,109,950 | |
NRG Energy, Inc. | | | 82,990 | | | | 2,914,609 | |
| | | | | | | | |
| | | | | | | 5,024,559 | |
| | | | | | | | |
| | | | |
| 10 | | MainStay VP MacKay Common Stock Portfolio | | The notes to the financial statements are an integral part of,
and should be read in conjunction with, the financial statements. |
| | | | | | | | |
| | |
| | | Shares | | | Value | |
| Common Stocks (continued) | |
Industrial Conglomerates 0.8% | |
3M Co. | | | 4,260 | | | $ | 738,429 | |
Carlisle Cos., Inc. | | | 13,234 | | | | 1,858,186 | |
General Electric Co. | | | 20,262 | | | | 212,751 | |
Honeywell International, Inc. | | | 18,870 | | | | 3,294,513 | |
| | | | | | | | |
| | | | | | | 6,103,879 | |
| | | | | | | | |
Insurance 4.2% | |
Aflac, Inc. | | | 631 | | | | 34,585 | |
Allstate Corp. | | | 34,688 | | | | 3,527,423 | |
American International Group, Inc. | | | 77,338 | | | | 4,120,569 | |
Brighthouse Financial, Inc. (a) | | | 53,059 | | | | 1,946,735 | |
Chubb, Ltd. | | | 420 | | | | 61,862 | |
Cincinnati Financial Corp. | | | 4,515 | | | | 468,070 | |
First American Financial Corp. | | | 48,033 | | | | 2,579,372 | |
Hartford Financial Services Group, Inc. | | | 7,174 | | | | 399,735 | |
Kemper Corp. | | | 18,433 | | | | 1,590,583 | |
Lincoln National Corp. | | | 38,061 | | | | 2,453,031 | |
MetLife, Inc. | | | 84,625 | | | | 4,203,324 | |
Old Republic International Corp. | | | 19,047 | | | | 426,272 | |
Progressive Corp. | | | 52,443 | | | | 4,191,769 | |
Prudential Financial, Inc. | | | 11,536 | | | | 1,165,136 | |
Reinsurance Group of America, Inc. | | | 10,467 | | | | 1,633,166 | |
Travelers Cos., Inc. | | | 26,020 | | | | 3,890,510 | |
Willis Towers Watson PLC | | | 152 | | | | 29,114 | |
| | | | | | | | |
| | | | | | | 32,721,256 | |
| | | | | | | | |
Interactive Media & Services 5.3% | |
Alphabet, Inc. (a) | | | | | | | | |
Class A | | | 10,913 | | | | 11,816,596 | |
Class C | | | 11,145 | | | | 12,046,742 | |
Facebook, Inc., Class A (a) | | | 89,078 | | | | 17,192,054 | |
TripAdvisor, Inc. (a) | | | 7,859 | | | | 363,793 | |
| | | | | | | | |
| | | | | | | 41,419,185 | |
| | | | | | | | |
Internet & Direct Marketing Retail 4.0% | |
Amazon.com, Inc. (a) | | | 12,931 | | | | 24,486,529 | |
Booking Holdings, Inc. (a) | | | 1,255 | | | | 2,352,761 | |
eBay, Inc. | | | 25,793 | | | | 1,018,824 | |
Expedia Group, Inc. | | | 24,953 | | | | 3,319,498 | |
| | | | | | | | |
| | | | | | | 31,177,612 | |
| | | | | | | | |
IT Services 6.3% | |
Accenture PLC, Class A | | | 34,691 | | | | 6,409,856 | |
Akamai Technologies, Inc. (a) | | | 39,137 | | | | 3,136,439 | |
Alliance Data Systems Corp. | | | 2,431 | | | | 340,656 | |
CACI International, Inc., Class A (a) | | | 8,960 | | | | 1,833,127 | |
Cognizant Technology Solutions Corp., Class A | | | 10,508 | | | | 666,102 | |
International Business Machines Corp. | | | 47,347 | | | | 6,529,151 | |
Leidos Holdings, Inc. | | | 34,421 | | | | 2,748,517 | |
Mastercard, Inc., Class A | | | 28,300 | | | | 7,486,199 | |
MAXIMUS, Inc. | | | 35,904 | | | | 2,604,476 | |
| | | | | | | | |
| | |
| | | Shares | | | Value | |
IT Services (continued) | |
PayPal Holdings, Inc. (a) | | | 60,060 | | | $ | 6,874,468 | |
VeriSign, Inc. (a) | | | 5,508 | | | | 1,152,053 | |
Visa, Inc., Class A | | | 54,869 | | | | 9,522,515 | |
| | | | | | | | |
| | | | | | | 49,303,559 | |
| | | | | | | | |
Life Sciences Tools & Services 1.3% | |
Agilent Technologies, Inc. | | | 218 | | | | 16,278 | |
Charles River Laboratories International, Inc. (a) | | | 5,780 | | | | 820,182 | |
Illumina, Inc. (a) | | | 4,613 | | | | 1,698,276 | |
IQVIA Holdings, Inc. (a) | | | 468 | | | | 75,301 | |
PRA Health Sciences, Inc. (a) | | | 21,945 | | | | 2,175,847 | |
Thermo Fisher Scientific, Inc. | | | 18,540 | | | | 5,444,827 | |
Waters Corp. (a) | | | 703 | | | | 151,314 | |
| | | | | | | | |
| | | | | | | 10,382,025 | |
| | | | | | | | |
Machinery 1.2% | |
AGCO Corp. | | | 36,106 | | | | 2,800,742 | |
Caterpillar, Inc. | | | 734 | | | | 100,037 | |
Cummins, Inc. | | | 20,493 | | | | 3,511,271 | |
Oshkosh Corp. | | | 28,088 | | | | 2,345,067 | |
PACCAR, Inc. | | | 11,264 | | | | 807,178 | |
| | | | | | | | |
| | | | | | | 9,564,295 | |
| | | | | | | | |
Media 3.0% | |
Charter Communications, Inc., Class A (a) | | | 12,302 | | | | 4,861,504 | |
Comcast Corp., Class A | | | 183,313 | | | | 7,750,474 | |
Discovery, Inc. (a) | | | | | | | | |
Class A (b) | | | 80,932 | | | | 2,484,612 | |
Class C | | | 54,630 | | | | 1,554,223 | |
DISH Network Corp., Class A (a) | | | 54,877 | | | | 2,107,826 | |
Interpublic Group of Cos., Inc. | | | 73,646 | | | | 1,663,663 | |
News Corp. | | | | | | | | |
Class A | | | 728 | | | | 9,821 | |
Class B | | | 1,362 | | | | 19,014 | |
Omnicom Group, Inc. | | | 40,201 | | | | 3,294,472 | |
| | | | | | | | |
| | | | | | | 23,745,609 | |
| | | | | | | | |
Multi-Utilities 0.5% | |
Ameren Corp. | | | 17,047 | | | | 1,280,400 | |
CenterPoint Energy, Inc. | | | 19,012 | | | | 544,314 | |
DTE Energy Co. | | | 12,958 | | | | 1,657,069 | |
WEC Energy Group, Inc. | | | 4,208 | | | | 350,821 | |
| | | | | | | | |
| | | | | | | 3,832,604 | |
| | | | | | | | |
Multiline Retail 0.2% | |
Dollar Tree, Inc. (a) | | | 1,212 | | | | 130,157 | |
Target Corp. | | | 17,478 | | | | 1,513,769 | |
| | | | | | | | |
| | | | | | | 1,643,926 | |
| | | | | | | | |
Oil, Gas & Consumable Fuels 5.2% | |
Apache Corp. | | | 32,955 | | | | 954,706 | |
Cabot Oil & Gas Corp. | | | 119,512 | | | | 2,743,995 | |
Chevron Corp. | | | 81,066 | | | | 10,087,853 | |
ConocoPhillips | | | 78,553 | | | | 4,791,733 | |
| | | | | | |
The notes to the financial statements are an integral part of,
and should be read in conjunction with, the financial statements. | | | | | 11 | |
Portfolio of InvestmentsJune 30, 2019 (Unaudited) (continued)
| | | | | | | | |
| | |
| | | Shares | | | Value | |
| Common Stocks (continued) | |
Oil, Gas & Consumable Fuels (continued) | |
Devon Energy Corp. | | | 76,778 | | | $ | 2,189,709 | |
EOG Resources, Inc. | | | 2,746 | | | | 255,817 | |
Exxon Mobil Corp. | | | 162,065 | | | | 12,419,041 | |
HollyFrontier Corp. | | | 52,984 | | | | 2,452,100 | |
Phillips 66 | | | 5,116 | | | | 478,551 | |
Valero Energy Corp. | | | 45,597 | | | | 3,903,559 | |
| | | | | | | | |
| | | | | | | 40,277,064 | |
| | | | | | | | |
Pharmaceuticals 3.0% | |
Allergan PLC | | | 4,669 | | | | 781,731 | |
Bristol-Myers Squibb Co. | | | 254 | | | | 11,519 | |
Eli Lilly & Co. | | | 4,377 | | | | 484,928 | |
Johnson & Johnson | | | 69,212 | | | | 9,639,847 | |
Merck & Co., Inc. | | | 85,880 | | | | 7,201,038 | |
Pfizer, Inc. | | | 127,366 | | | | 5,517,495 | |
| | | | | | | | |
| | | | | | | 23,636,558 | |
| | | | | | | | |
Professional Services 1.2% | |
Insperity, Inc. | | | 20,409 | | | | 2,492,755 | |
ManpowerGroup, Inc. | | | 28,044 | | | | 2,709,051 | |
Nielsen Holdings PLC | | | 73,975 | | | | 1,671,835 | |
Robert Half International, Inc. | | | 37,426 | | | | 2,133,656 | |
| | | | | | | | |
| | | | | | | 9,007,297 | |
| | | | | | | | |
Road & Rail 0.8% | |
CSX Corp. | | | 1,944 | | | | 150,407 | |
Genesee & Wyoming, Inc., Class A (a) | | | 7,730 | | | | 773,000 | |
Landstar System, Inc. | | | 1,466 | | | | 158,314 | |
Norfolk Southern Corp. | | | 6,616 | | | | 1,318,767 | |
Union Pacific Corp. | | | 20,991 | | | | 3,549,788 | |
| | | | | | | | |
| | | | | | | 5,950,276 | |
| | | | | | | | |
Semiconductors & Semiconductor Equipment 4.6% | |
Applied Materials, Inc. | | | 82,374 | | | | 3,699,416 | |
Broadcom, Inc. | | | 21,521 | | | | 6,195,035 | |
Cypress Semiconductor Corp. | | | 14,022 | | | | 311,849 | |
Intel Corp. | | | 191,975 | | | | 9,189,843 | |
KLA-Tencor Corp. | | | 13,954 | | | | 1,649,363 | |
Lam Research Corp. | | | 18,828 | | | | 3,536,651 | |
Micron Technology, Inc. (a) | | | 108,068 | | | | 4,170,344 | |
NVIDIA Corp. | | | 10,633 | | | | 1,746,258 | |
Qorvo, Inc. (a) | | | 42,324 | | | | 2,819,202 | |
QUALCOMM, Inc. | | | 4,438 | | | | 337,599 | |
Skyworks Solutions, Inc. | | | 352 | | | | 27,199 | |
Teradyne, Inc. | | | 40,457 | | | | 1,938,295 | |
Texas Instruments, Inc. | | | 5,528 | | | | 634,393 | |
| | | | | | | | |
| | | | | | | 36,255,447 | |
| | | | | | | | |
Software 7.3% | |
Adobe, Inc. (a) | | | 10,654 | | | | 3,139,201 | |
Cadence Design Systems, Inc. (a) | | | 5,276 | | | | 373,594 | |
CDK Global, Inc. | | | 12,540 | | | | 619,978 | |
| | | | | | | | |
| | |
| | | Shares | | | Value | |
Software (continued) | |
Citrix Systems, Inc. | | | 25,857 | | | $ | 2,537,606 | |
Fortinet, Inc. (a) | | | 37,985 | | | | 2,918,387 | |
j2 Global, Inc. | | | 30,640 | | | | 2,723,590 | |
LogMeIn, Inc. | | | 17,494 | | | | 1,288,958 | |
Microsoft Corp. | | | 228,386 | | | | 30,594,589 | |
Oracle Corp. | | | 127,563 | | | | 7,267,264 | |
salesforce.com, Inc. (a) | | | 23,974 | | | | 3,637,575 | |
Symantec Corp. | | | 80,004 | | | | 1,740,887 | |
Teradata Corp. (a) | | | 3,370 | | | | 120,814 | |
| | | | | | | | |
| | | | | | | 56,962,443 | |
| | | | | | | | |
Specialty Retail 3.2% | |
Aaron’s, Inc. | | | 17,143 | | | | 1,052,752 | |
Advance Auto Parts, Inc. | | | 19,362 | | | | 2,984,459 | |
AutoZone, Inc. (a) | | | 3,293 | | | | 3,620,555 | |
Best Buy Co., Inc. | | | 46,229 | | | | 3,223,548 | |
Foot Locker, Inc. | | | 25,709 | | | | 1,077,721 | |
Home Depot, Inc. | | | 25,653 | | | | 5,335,054 | |
L Brands, Inc. | | | 6,570 | | | | 171,477 | |
Lowe’s Cos., Inc. | | | 50,652 | | | | 5,111,293 | |
O’Reilly Automotive, Inc. (a) | | | 566 | | | | 209,035 | |
TJX Cos., Inc. | | | 5,782 | | | | 305,752 | |
Ulta Beauty, Inc. (a) | | | 646 | | | | 224,091 | |
Williams-Sonoma, Inc. (b) | | | 21,002 | | | | 1,365,130 | |
| | | | | | | | |
| | | | | | | 24,680,867 | |
| | | | | | | | |
Technology Hardware, Storage & Peripherals 4.1% | |
Apple, Inc. | | | 129,971 | | | | 25,723,860 | |
Hewlett Packard Enterprise Co. | | | 7,212 | | | | 107,820 | |
Seagate Technology PLC | | | 66,259 | | | | 3,122,124 | |
Xerox Corp. | | | 85,802 | | | | 3,038,249 | |
| | | | | | | | |
| | | | | | | 31,992,053 | |
| | | | | | | | |
Textiles, Apparel & Luxury Goods 1.0% | |
Deckers Outdoor Corp. (a) | | | 16,760 | | | | 2,949,257 | |
NIKE, Inc., Class B | | | 8,156 | | | | 684,696 | |
Ralph Lauren Corp. | | | 21,336 | | | | 2,423,556 | |
Skechers U.S.A., Inc., Class A (a) | | | 45,319 | | | | 1,427,096 | |
| | | | | | | | |
| | | | | | | 7,484,605 | |
| | | | | | | | |
Tobacco 0.8% | |
Altria Group, Inc. | | | 104,419 | | | | 4,944,240 | |
Philip Morris International, Inc. | | | 18,174 | | | | 1,427,204 | |
| | | | | | | | |
| | | | | | | 6,371,444 | |
| | | | | | | | |
Trading Companies & Distributors 0.2% | |
United Rentals, Inc. (a) | | | 12,949 | | | | 1,717,426 | |
| | | | | | | | |
Total Common Stocks
(Cost $659,730,744) | | | | | | | 767,238,124 | |
| | | | | | | | |
| | | | |
| 12 | | MainStay VP MacKay Common Stock Portfolio | | The notes to the financial statements are an integral part of,
and should be read in conjunction with, the financial statements. |
| | | | | | | | |
| | |
| | | Shares | | | Value | |
| Exchange-Traded Funds 1.7% | |
SPDR S&P 500 ETF Trust | | | 44,777 | | | $ | 13,119,661 | |
| | | | | | | | |
Total Exchange-Traded Funds
(Cost $12,882,697) | | | | | | | 13,119,661 | |
| | | | | | | | |
|
| Short-Term Investments 0.2% | |
Affiliated Investment Company 0.0%‡ | |
MainStay U.S. Government Liquidity Fund, 2.03% (c) | | | 29,071 | | | | 29,071 | |
| | | | | | | | |
|
Unaffiliated Investment Company 0.2% | |
State Street Navigator Securities Lending Government Money Market Portfolio, 2.33% (c)(d) | | | 1,398,786 | | | | 1,398,786 | |
| | | | | | | | |
TotalShort-Term Investments
(Cost $1,427,857) | | | | | | | 1,427,857 | |
| | | | | | | | |
Total Investments
(Cost $674,041,298) | | | 100.2 | % | | | 781,785,642 | |
Other Assets, Less Liabilities | | | (0.2 | ) | | | (1,425,663 | ) |
Net Assets | | | 100.0 | % | | $ | 780,359,979 | |
| † | Percentages indicated are based on Portfolio net assets. |
| ‡ | Less than one-tenth of a percent. |
| (a) | Non-income producing security. |
| (b) | All or a portion of this security was held on loan. As of June 30, 2019, the aggregate market value of securities on loan was $5,375,652; the total market value of collateral held by the Portfolio was $5,536,557. The market value of the collateral held included non-cash collateral in the form of U.S. Treasury securities with a value of $4,137,771. (See Note 2(G)) |
| (c) | Current yield as of June 30, 2019. |
| (d) | Represents security purchased with cash collateral received for securities on loan. |
The following abbreviations are used in the preceding pages:
| SPDR—Standard | & Poor’s Depositary Receipt |
The following is a summary of the fair valuations according to the inputs used as of June 30, 2019, for valuing the Portfolio’s assets:
| | | | | | | | | | | | | | | | |
Description | | Quoted
Prices in
Active
Markets for
Identical
Assets
(Level 1) | | | Significant
Other
Observable
Inputs
(Level 2) | | | Significant
Unobservable
Inputs
(Level 3) | | | Total | |
| | | | |
Asset Valuation Inputs | | | | | | | | | | | | | | | | |
| Investments in Securities (a) | | | | | | | | | | | | | | | | |
| Common Stocks | | $ | 767,238,124 | | | $ | — | | | $ | — | | | $ | 767,238,124 | |
| Exchange-Traded Funds | | | 13,119,661 | | | | — | | | | — | | | | 13,119,661 | |
| Short-Term Investments | | | | | | | | | | | | | | | | |
Affiliated Investment Company | | | 29,071 | | | | — | | | | — | | | | 29,071 | |
Unaffiliated Investment Company | | | 1,398,786 | | | | — | | | | — | | | | 1,398,786 | |
| | | | | | | | | | | | | | | | |
| TotalShort-Term Investments | | | 1,427,857 | | | | — | | | | — | | | | 1,427,857 | |
| | | | | | | | | | | | | | | | |
| Total Investments in Securities | | $ | 781,785,642 | | | $ | — | | | $ | — | | | $ | 781,785,642 | |
| | | | | | | | | | | | | | | | |
| (a) | For a complete listing of investments and their industries, see the Portfolio of Investments. |
| | | | | | |
The notes to the financial statements are an integral part of,
and should be read in conjunction with, the financial statements. | | | | | 13 | |
Statement of Assets and Liabilitiesas of June 30, 2019 (Unaudited)
| | | | |
| Assets | | | | |
Investment in unaffiliated securities, at
value (identified cost $674,012,227) including
securities on loan of $5,375,652 | | $ | 781,756,571 | |
Investment in affiliated investment company, at value (identified cost $29,071) | | | 29,071 | |
Receivables: | | | | |
Dividends | | | 754,341 | |
Investment securities sold | | | 158,462 | |
Portfolio shares sold | | | 12,088 | |
Securities lending | | | 675 | |
Other assets | | | 3,562 | |
| | | | |
Total assets | | | 782,714,770 | |
| | | | |
|
| Liabilities | |
Cash collateral received for securities on loan | | | 1,398,786 | |
Payables: | | | | |
Portfolio shares redeemed | | | 476,143 | |
Manager (See Note 3) | | | 339,582 | |
NYLIFE Distributors (See Note 3) | | | 53,077 | |
Shareholder communication | | | 38,910 | |
Professional fees | | | 31,035 | |
Custodian | | | 10,125 | |
Trustees | | | 938 | |
Accrued expenses | | | 6,195 | |
| | | | |
Total liabilities | | | 2,354,791 | |
| | | | |
Net assets | | $ | 780,359,979 | |
| | | | |
|
| Composition of Net Assets | |
Shares of beneficial interest outstanding (par value of $.001 per share) unlimited number of shares authorized | | $ | 26,973 | |
Additional paid-in capital | | | 541,791,098 | |
| | | | |
| | | 541,818,071 | |
Total distributable earnings (loss) | | | 238,541,908 | |
| | | | |
Net assets | | $ | 780,359,979 | |
| | | | |
| | | | |
Initial Class | | | | |
Net assets applicable to outstanding shares | | $ | 517,903,541 | |
| | | | |
Shares of beneficial interest outstanding | | | 17,823,571 | |
| | | | |
Net asset value per share outstanding | | $ | 29.06 | |
| | | | |
Service Class | | | | |
Net assets applicable to outstanding shares | | $ | 262,456,438 | |
| | | | |
Shares of beneficial interest outstanding | | | 9,149,865 | |
| | | | |
Net asset value per share outstanding | | $ | 28.68 | |
| | | | |
| | | | |
| 14 | | MainStay VP MacKay Common Stock Portfolio | | The notes to the financial statements are an integral part of,
and should be read in conjunction with, the financial statements. |
Statement of Operationsfor the six months ended June 30, 2019 (Unaudited)
| | | | |
| Investment Income (Loss) | | | | |
Income | | | | |
Dividends—unaffiliated | | $ | 7,815,659 | |
Securities lending | | | 18,441 | |
Dividends—affiliated | | | 3,084 | |
| | | | |
Total income | | | 7,837,184 | |
| | | | |
Expenses | | | | |
Manager (See Note 3) | | | 2,036,133 | |
Distribution/Service—Service Class (See Note 3) | | | 321,409 | |
Professional fees | | | 46,119 | |
Shareholder communication | | | 40,347 | |
Custodian | | | 13,593 | |
Trustees | | | 9,273 | |
Miscellaneous | | | 15,053 | |
| | | | |
Total expenses | | | 2,481,927 | |
| | | | |
Net investment income (loss) | | | 5,355,257 | |
| | | | |
|
| Realized and Unrealized Gain (Loss) on Investments | |
Net realized gain (loss) on unaffiliated investments | | | 13,292,753 | |
Net change in unrealized appreciation (depreciation) on unaffiliated investments | | | 85,756,322 | |
| | | | |
Net realized and unrealized gain (loss) on investments | | | 99,049,075 | |
| | | | |
Net increase (decrease) in net assets resulting from operations | | $ | 104,404,332 | |
| | | | |
| | | | | | |
The notes to the financial statements are an integral part of,
and should be read in conjunction with, the financial statements. | | | | | 15 | |
Statements of Changes in Net Assets
for the six months ended June 30, 2019 (Unaudited) and the year ended December 31, 2018
| | | | | | | | |
| | | 2019 | | | 2018 | |
| Increase (Decrease) in Net Assets | |
Operations: | | | | | | | | |
Net investment income (loss) | | $ | 5,355,257 | | | $ | 10,579,315 | |
Net realized gain (loss) on investments | | | 13,292,753 | | | | 103,117,981 | |
Net change in unrealized appreciation (depreciation) on investments | | | 85,756,322 | | | | (156,124,053 | ) |
| | | | |
Net increase (decrease) in net assets resulting from operations | | | 104,404,332 | | | | (42,426,757 | ) |
| | | | |
Distributions to shareholders: | | | | | | | | |
Initial Class | | | — | | | | (58,346,116 | ) |
Service Class | | | — | | | | (27,700,228 | ) |
| | | | |
Total distributions to shareholders | | | — | | | | (86,046,344 | ) |
| | | | |
Capital share transactions: | | | | | | | | |
Net proceeds from sale of shares | | | 33,708,981 | | | | 163,997,932 | |
Net asset value of shares issued to shareholders in reinvestment of dividends and distributions | | | — | | | | 86,046,344 | |
Cost of shares redeemed | | | (49,651,843 | ) | | | (337,318,691 | ) |
| | | | |
Increase (decrease) in net assets derived from capital share transactions | | | (15,942,862 | ) | | | (87,274,415 | ) |
| | | | |
Net increase (decrease) in net assets | | | 88,461,470 | | | | (215,747,516 | ) |
| | |
| Net Assets | | | | | | | | |
Beginning of period | | | 691,898,509 | | | | 907,646,025 | |
| | | | |
End of period | | $ | 780,359,979 | | | $ | 691,898,509 | |
| | | | |
| | | | |
| 16 | | MainStay VP MacKay Common Stock Portfolio | | The notes to the financial statements are an integral part of,
and should be read in conjunction with, the financial statements. |
Financial Highlightsselected per share data and ratios
| | | | | | | | | | | | | | | | | | | | | | | | | | | | | | | | | | | |
| | | |
| | | Six months
ended
June 30, | | | | Year ended December 31, |
| | | | | | | |
| Initial Class | | 2019* | | | | 2018 | | 2017 | | 2016 | | 2015 | | 2014 |
| | | | | | | |
Net asset value at beginning of period | | | $ | 25.23 | | | | | | | | | $ | 29.75 | | | | $ | 25.60 | | | | $ | 25.43 | | | | $ | 27.80 | | | | $ | 24.58 | |
| | | | | | | | | | | | | | | | | | | | | | | | | | | | | | | | | | | |
| | | | | | | |
Net investment income (loss) (a) | | | | 0.21 | | | | | | | | | | 0.42 | | | | | 0.43 | | | | | 0.40 | | | | | 0.42 | | | | | 0.37 | |
| | | | | | | |
Net realized and unrealized gain (loss) on investments | | | | 3.62 | | | | | | | | | | (1.69 | ) | | | | 5.30 | | | | | 1.82 | | | | | (0.28 | ) | | | | 3.19 | |
| | | | | | | | | | | | | | | | | | | | | | | | | | | | | | | | | | | |
| | | | | | | |
Total from investment operations | | | | 3.83 | | | | | | | | | | (1.27 | ) | | | | 5.73 | | | | | 2.22 | | | | | 0.14 | | | | | 3.56 | |
| | | | | | | | | | | | | | | | | | | | | | | | | | | | | | | | | | | |
| | | | | | | |
| Less dividends and distributions: | | | | | | | | | | | | | | | | | | | | | | | | | | | | | | | | | | | |
| | | | | | | |
From net investment income | | | | — | | | | | | | | | | (0.49 | ) | | | | (0.39 | ) | | | | (0.40 | ) | | | | (0.38 | ) | | | | (0.34 | ) |
| | | | | | | |
From net realized gain on investments | | | | — | | | | | | | | | | (2.76 | ) | | | | (1.19 | ) | | | | (1.65 | ) | | | | (2.13 | ) | | | | — | |
| | | | | | | | | | | | | | | | | | | | | | | | | | | | | | | | | | | |
| | | | | | | |
Total dividends and distributions | | | | — | | | | | | | | | | (3.25 | ) | | | | (1.58 | ) | | | | (2.05 | ) | | | | (2.51 | ) | | | | (0.34 | ) |
| | | | | | | | | | | | | | | | | | | | | | | | | | | | | | | | | | | |
| | | | | | | |
Net asset value at end of period | | | $ | 29.06 | | | | | | | | | $ | 25.23 | | | | $ | 29.75 | | | | $ | 25.60 | | | | $ | 25.43 | | | | $ | 27.80 | |
| | | | | | | | | | | | | | | | | | | | | | | | | | | | | | | | | | | |
| | | | | | | |
Total investment return (b) | | | | 15.18 | %(c) | | | | | | | | | (5.84 | %) | | | | 22.83 | % | | | | 9.12 | % | | | | 0.85 | % | | | | 14.53 | % |
| | | | | | | |
| Ratios (to average net assets)/Supplemental Data: | | | | | | | | | | | | | | | | | | | | | | | | | | | | | | | | | | | |
| | | | | | | |
Net investment income (loss) | | | | 1.51 | %†† | | | | | | | | | 1.40 | % | | | | 1.53 | % | | | | 1.57 | % | | | | 1.55 | % | | | | 1.44 | % |
| | | | | | | |
Net expenses (d) | | | | 0.58 | %†† | | | | | | | | | 0.57 | % | | | | 0.57 | % | | | | 0.58 | % | | | | 0.57 | % | | | | 0.58 | % |
| | | | | | | |
Portfolio turnover rate | | | | 45 | % | | | | | | | | | 125 | % | | | | 98 | % | | | | 125 | % | | | | 112 | % | | | | 111 | % |
| | | | | | | |
Net assets at end of period (in 000’s) | | | $ | 517,904 | | | | | | | | | $ | 454,804 | | | | $ | 639,120 | | | | $ | 577,310 | | | | $ | 580,635 | | | | $ | 605,679 | |
| (a) | Per share data based on average shares outstanding during the period. |
| (b) | Total return does not reflect any deduction of sales charges, mortality and expense charges, contract charges or administrative charges. For periods of less than one year, total return is not annualized. |
| (c) | Total investment return may reflect adjustments to conform to generally accepted accounting principles. |
| (d) | In addition to the fees and expenses which the Portfolio bears directly, it also indirectly bears a pro-rata share of the fees and expenses of the underlying funds in which it invests. Such indirect expenses are not included in the above expense ratios. |
| | | | | | | | | | | | | | | | | | | | | | | | | | | | | | | | | | | |
| | | |
| | | Six months
ended
June 30, | | | | Year ended December 31, |
| | | | | | | |
| Service Class | | 2019* | | | | 2018 | | 2017 | | 2016 | | 2015 | | 2014 |
| | | | | | | |
Net asset value at beginning of period | | | $ | 24.94 | | | | | | | | | $ | 29.45 | | | | $ | 25.37 | | | | $ | 25.23 | | | | $ | 27.61 | | | | $ | 24.44 | |
| | | | | | | | | | | | | | | | | | | | | | | | | | | | | | | | | | | |
| | | | | | | |
Net investment income (loss) (a) | | | | 0.17 | | | | | | | | | | 0.35 | | | | | 0.35 | | | | | 0.33 | | | | | 0.35 | | | | | 0.31 | |
| | | | | | | |
Net realized and unrealized gain (loss) on investments | | | | 3.57 | | | | | | | | | | (1.68 | ) | | | | 5.26 | | | | | 1.81 | | | | | (0.27 | ) | | | | 3.15 | |
| | | | | | | | | | | | | | | | | | | | | | | | | | | | | | | | | | | |
| | | | | | | |
Total from investment operations | | | | 3.74 | | | | | | | | | | (1.33 | ) | | | | 5.61 | | | | | 2.14 | | | | | 0.08 | | | | | 3.46 | |
| | | | | | | | | | | | | | | | | | | | | | | | | | | | | | | | | | | |
| | | | | | | |
| Less dividends and distributions: | | | | | | | | | | | | | | | | | | | | | | | | | | | | | | | | | | | |
| | | | | | | |
From net investment income | | | | — | | | | | | | | | | (0.42 | ) | | | | (0.34 | ) | | | | (0.35 | ) | | | | (0.33 | ) | | | | (0.29 | ) |
| | | | | | | |
From net realized gain on investments | | | | — | | | | | | | | | | (2.76 | ) | | | | (1.19 | ) | | | | (1.65 | ) | | | | (2.13 | ) | | | | — | |
| | | | | | | | | | | | | | | | | | | | | | | | | | | | | | | | | | | |
| | | | | | | |
Total dividends and distributions | | | | — | | | | | | | | | | (3.18 | ) | | | | (1.53 | ) | | | | (2.00 | ) | | | | (2.46 | ) | | | | (0.29 | ) |
| | | | | | | | | | | | | | | | | | | | | | | | | | | | | | | | | | | |
| | | | | | | |
Net asset value at end of period | | | $ | 28.68 | | | | | | | | | $ | 24.94 | | | | $ | 29.45 | | | | $ | 25.37 | | | | $ | 25.23 | | | | $ | 27.61 | |
| | | | | | | | | | | | | | | | | | | | | | | | | | | | | | | | | | | |
| | | | | | | |
Total investment return (b) | | | | 15.00 | %(c) | | | | | | | | | (6.08 | %) | | | | 22.52 | % | | | | 8.85 | % | | | | 0.60 | % | | | | 14.25 | % |
| | | | | | | |
| Ratios (to average net assets)/Supplemental Data: | | | | | | | | | | | | | | | | | | | | | | | | | | | | | | | | | | | |
| | | | | | | |
Net investment income (loss) | | | | 1.26 | %†† | | | | | | | | | 1.17 | % | | | | 1.28 | % | | | | 1.32 | % | | | | 1.30 | % | | | | 1.19 | % |
| | | | | | | |
Net expenses (d) | | | | 0.83 | %†† | | | | | | | | | 0.82 | % | | | | 0.82 | % | | | | 0.83 | % | | | | 0.82 | % | | | | 0.83 | % |
| | | | | | | |
Portfolio turnover rate | | | | 45 | % | | | | | | | | | 125 | % | | | | 98 | % | | | | 125 | % | | | | 112 | % | | | | 111 | % |
| | | | | | | |
Net assets at end of period (in 000’s) | | | $ | 262,456 | | | | | | | | | $ | 237,094 | | | | $ | 268,526 | | | | $ | 194,992 | | | | $ | 149,358 | | | | $ | 141,170 | |
| (a) | Per share data based on average shares outstanding during the period. |
| (b) | Total return does not reflect any deduction of sales charges, mortality and expense charges, contract charges or administrative charges. For periods of less than one year, total return is not annualized. |
| (c) | Total investment return may reflect adjustments to conform to generally accepted accounting principles. |
| (d) | In addition to the fees and expenses which the Portfolio bears directly, it also indirectly bears a pro-rata share of the fees and expenses of the underlying funds in which it invests. Such indirect expenses are not included in the above expense ratios. |
| | | | | | |
The notes to the financial statements are an integral part of,
and should be read in conjunction with, the financial statements. | | | | | 17 | |
Notes to Financial Statements(Unaudited)
Note 1–Organization and Business
MainStay VP Funds Trust (the “Fund”) was organized as a Delaware statutory trust on February 1, 2011. The Fund is registered under the Investment Company Act of 1940, as amended (the “1940 Act”), as an open-end management investment company. The Fund is comprised of thirty-one separate series (collectively referred to as the “Portfolios”). These financial statements and notes relate to the MainStay VP MacKay Common Stock Portfolio (the “Portfolio”), a “diversified” portfolio, as that term is defined in the 1940 Act, as interpreted or modified by regulatory authorities having jurisdiction, from time to time.
Shares of the Portfolio are currently offered to certain separate accounts to fund variable annuity policies and variable universal life insurance policies issued by New York Life Insurance and Annuity Corporation (“NYLIAC”), awholly-owned subsidiary of New York Life Insurance Company (“New York Life”) and may also be offered to fund variable annuity policies and variable universal life insurance policies issued by other insurance companies. NYLIAC allocates shares of the Portfolios to, among others, certain NYLIAC separate accounts. Shares of the Portfolio are also offered to the MainStay VP Conservative Allocation Portfolio, MainStay VP Moderate Allocation Portfolio, MainStay VP Moderate Growth Allocation Portfolio and MainStay VP Growth Allocation Portfolio, which operate as “funds-of-funds.”
The Portfolio currently offers two classes of shares. Initial Class shares commenced operations on January 23, 1984. Service Class shares commenced operations on June 5, 2003. Shares of the Portfolio are offered and are redeemed at a price equal to their respective net asset value (“NAV”) per share. No sales or redemption charge is applicable to the purchase or redemption of the Portfolio’s shares. Under the terms of the Fund’s multiple class plan adopted pursuant to Rule 18f-3 under the 1940 Act, the classes differ in that, among other things, Service Class shares of the Portfolio pay a combined distribution and service fee of 0.25% of average daily net assets attributable to Service Class shares of the Portfolio to the Distributor (as defined in Note 3(B)) pursuant to a plan adopted in accordance with Rule 12b-1 under the 1940 Act. Contract owners of variable annuity contracts purchased after June 2, 2003, are permitted to invest only in the Service Class shares.
The Portfolio’s investment objective is to seeklong-term growth of capital.
Note 2–Significant Accounting Policies
The Portfolio is an investment company and accordingly follows the investment company accounting and reporting guidance of the Financial Accounting Standards Board (“FASB”) Accounting Standard CodificationTopic 946 Financial Services—Investment Companies. The Portfolio prepares its financial statements in accordance with generally accepted accounting principles (“GAAP”) in the United States of America and follows the significant accounting policies described below.
(A) Securities Valuation. Investments are usually valued as of the close of regular trading on the New York Stock Exchange (the “Exchange”) (usually 4:00 p.m. Eastern time) on each day the Portfolio is open for business (“valuation date”).
The Board of Trustees of the Fund (the “Board”) adopted procedures establishing methodologies for the valuation of the Portfolio’s securities
and other assets and delegated the responsibility for valuation determinations under those procedures to the Valuation Committee of the Fund (the “Valuation Committee”). The Board authorized the Valuation Committee to appoint a Valuation Subcommittee (the “Subcommittee”) to deal in the first instance with establishing the prices of securities for which market quotations are not readily available or the prices of which are not otherwise readily determinable under these procedures. The Subcommittee meets (in person, via electronic mail or via teleconference) on an as-needed basis. Subsequently, the Valuation Committee meets to ensure that actions taken by the Subcommittee were appropriate. The procedures state that, subject to the oversight of the Board and unless otherwise noted, the responsibility for theday-to-day valuation of portfolio assets (including fair value measurements for the Portfolio’s assets and liabilities) rests with New York Life Investment Management LLC (“New York Life Investments” or the “Manager”), aided to whatever extent necessary by the Subadvisor (as defined in Note 3(A)).
To assess the appropriateness of security valuations, the Manager, the Subadvisor or the Portfolio’s third-party service provider, who is subject to oversight by the Manager, regularly compares prior day prices, prices on comparable securities and the sale prices to the prior and current day prices and challenges prices with changes exceeding certain tolerance levels with third-party pricing services or broker sources. For those securities valued through either a standardized fair valuation methodology or a fair valuation measurement, the Subcommittee deals in the first instance with such valuation and the Valuation Committee reviews and affirms, if appropriate, the reasonableness of the valuation based on such methodologies and measurements on a regular basis after considering information that is reasonably available and deemed relevant by the Valuation Committee. Any action taken by the Subcommittee with respect to the valuation of a portfolio security or other asset is submitted for review and ratification (if appropriate) to the Valuation Committee and the Board at the next regularly scheduled meeting.
“Fair value” is defined as the price the Portfolio would reasonably expect to receive upon selling an asset or liability in an orderly transaction to an independent buyer in the principal or most advantageous market for the asset or liability. Fair value measurements are determined within a framework that establishes a three-tier hierarchy which maximizes the use of observable market data and minimizes the use of unobservable inputs to establish a classification of fair value measurements for disclosure purposes. “Inputs” refer broadly to the assumptions that market participants would use in pricing the asset or liability, including assumptions about risk, such as the risk inherent in a particular valuation technique used to measure fair value using a pricing model and/or the risk inherent in the inputs for the valuation technique. Inputs may be observable or unobservable. Observable inputs reflect the assumptions market participants would use in pricing the asset or liability based on market data obtained from sources independent of the Portfolio. Unobservable inputs reflect the Portfolio’s own assumptions about the assumptions market participants would use in pricing the asset or liability based on the information available. The inputs or methodology used for valuing assets or liabilities may not be an indication of the risks
| | |
| 18 | | MainStay VP MacKay Common Stock Portfolio |
associated with investing in those assets or liabilities. The three-tier hierarchy of inputs is summarized below.
| • | | Level 1—quoted prices in active markets for an identical asset or liability |
| • | | Level 2—other significant observable inputs (including quoted prices for a similar asset or liability in active markets, interest rates and yield curves, prepayment speeds, credit risk, etc.) |
| • | | Level 3—significant unobservable inputs (including the Portfolio’s own assumptions about the assumptions that market participants would use in measuring fair value of an asset or liability) |
The level of an asset or liability within the fair value hierarchy is based on the lowest level of an input, both individually and in the aggregate, that is significant to the fair value measurement. As of June 30, 2019, the aggregate value by input level of the Portfolio’s assets and liabilities is included at the end of the Portfolio’s Portfolio of Investments.
The Portfolio may use third-party vendor evaluations, whose prices may be derived from one or more of the following standard inputs, among others:
| | |
• Broker/dealer quotes | | • Benchmark securities |
• Two-sided markets | | • Reference data (corporate actions or material event notices) |
• Bids/offers | | • Monthly payment information |
• Industry and economic events | | • Reported trades |
An asset or liability for which market values cannot be measured using the methodologies described above is valued by methods deemed reasonable in good faith by the Valuation Committee, following the procedures established by the Board, to represent fair value. Under these procedures, the Portfolio generally uses a market-based approach which may use related or comparable assets or liabilities, recent transactions, market multiples, book values and other relevant information. The Portfolio may also use an income-based valuation approach in which the anticipated future cash flows of the asset or liability are discounted to calculate fair value. Discounts may also be applied due to the nature and/or duration of any restrictions on the disposition of the asset or liability. Fair value represents a good faith approximation of the value of a security. Fair value determinations involve the consideration of a number of subjective factors, an analysis of applicable facts and circumstances and the exercise of judgment. As a result, it is possible that the fair value for a security determined in good faith in accordance with the Portfolio’s valuation procedures may differ from valuations for the same security determined by other funds using their own valuation procedures. Although the Portfolio’s valuation procedures are designed to value a security at the price the Portfolio may reasonably expect to receive upon the security’s sale in an orderly transaction, there can be no assurance that any fair value determination thereunder would, in fact, approximate the amount that the Portfolio would actually realize upon the sale of the security or the price at which the security would trade if a reliable market price were readily available. During the six-month period ended June 30, 2019, there were no material changes to the fair value methodologies.
Securities which may be valued in this manner include, but are not limited to: (i) a security for which trading has been halted or suspended;
(ii) a debt security that has recently gone into default and for which there is not a current market quotation; (iii) a security of an issuer that has entered into a restructuring; (iv) a security that has been delisted from a national exchange; (v) a security for which the market price is not readily available from a third-party pricing source or, if so provided, does not, in the opinion of the Manager or the Subadvisor, reflect the security’s market value; (vi) a security subject to trading collars for which no or limited trading takes place; and (vii) a security whose principal market has been temporarily closed at a time when, under normal conditions, it would be open. Securities valued in this manner are generally categorized as Level 3 in the hierarchy. As of June 30, 2019, there were no securities held by the Portfolio that were fair valued in such a manner.
Equity securities, including exchange-traded funds (“ETFs”), are valued at the last quoted sales prices as of the close of regular trading on the relevant exchange on each valuation date. Securities that are not traded on the valuation date are valued at the mean of the last quoted bid and ask prices. Prices are normally taken from the principal market in which each security trades. These securities are generally categorized as Level 1 in the hierarchy.
Investments in mutual funds, including money market funds, are valued at their respective NAVs as of the close of the Exchange on the valuation date. These securities are generally categorized as Level 1 in the hierarchy.
The information above is not intended to reflect an exhaustive list of the methodologies that may be used to value portfolio investments. The valuation procedures permit the use of a variety of valuation methodologies in connection with valuing portfolio investments. The methodology used for a specific type of investment may vary based on the market data available or other considerations. The methodologies summarized above may not represent the specific means by which portfolio investments are valued on any particular business day.
(B) Income Taxes. The Portfolio’s policy is to comply with the requirements of the Internal Revenue Code of 1986, as amended (the “Internal Revenue Code”), applicable to regulated investment companies and to distribute all of its taxable income to the shareholders of the Portfolio within the allowable time limits. Therefore, no federal, state and local income tax provisions are required.
Management evaluates the Portfolio’s tax positions to determine if the tax positions taken meet the minimum recognition threshold in connection with accounting for uncertainties in income tax positions taken or expected to be taken for the purposes of measuring and recognizing tax liabilities in the financial statements. Recognition of tax benefits of an uncertain tax position is permitted only to the extent the position is “more likely than not” to be sustained assuming examination by taxing authorities. Management has analyzed the Portfolio’s tax positions taken on federal, state and local income tax returns for all open tax years (for up to three tax years) and has concluded that no provisions for federal, state and local income tax are required in the Portfolio’s financial statements. The Portfolio’s federal, state and local income tax and federal excise tax returns for tax years for which the applicable statutes of limitations have not expired are subject to examination by the Internal Revenue Service and state and local departments of revenue.
Notes to Financial Statements(Unaudited) (continued)
(C) Dividends and Distributions to Shareholders. Dividends and distributions are recorded on the ex-dividend date. The Portfolio intends to declare and pay dividends from net investment income and distributions from net realized capital and currency gains, if any, at least annually. Unless the shareholder elects otherwise, all dividends and distributions are reinvested in the same class of shares of the Portfolio, at NAV. Dividends and distributions to shareholders are determined in accordance with federal income tax regulations and may differ from determinations using GAAP.
(D) Security Transactions and Investment Income. The Portfolio records security transactions on the trade date. Realized gains and losses on security transactions are determined using the identified cost method. Dividend income is recognized on the ex-dividend date; net of any foreign tax withheld at the source, and interest income is accrued as earned using the effective interest rate method.
Investment income and realized and unrealized gains and losses on investments of the Portfolio are allocated pro rata to the separate classes of shares based upon their relative net assets on the date the income is earned or realized and unrealized gains and losses are incurred.
(E) Expenses. Expenses of the Fund are allocated to the individual Portfolios in proportion to the net assets of the respective Portfolios when the expenses are incurred, except where direct allocations of expenses can be made. Expenses (other than fees incurred under the distribution and service plans, further discussed in Note 3(B), which are charged directly to the Service Class shares) are allocated to separate classes of shares pro rata based upon their relative net assets on the date the expenses are incurred. The expenses borne by the Portfolio, including those of related parties to the Portfolio, are shown in the Statement of Operations.
Additionally, the Portfolio may invest in ETFs and mutual funds, which are subject to management fees and other fees that may cause the costs of investing in ETFs and mutual funds to be greater than the costs of owning the underlying securities directly. These indirect expenses of ETFs and mutual funds are not included in the amounts shown as expenses in the Portfolio’s Statement of Operations or in the expense ratios included in the Financial Highlights.
(F) Use of Estimates. In preparing financial statements in conformity with GAAP, management makes estimates and assumptions that affect the reported amounts and disclosures in the financial statements. Actual results could differ from those estimates.
(G) Securities Lending. In order to realize additional income, the Portfolio may engage in securities lending, subject to the limitations set forth in the 1940 Act and relevant guidance by the staff of the Securities and Exchange Commission (“SEC”). In the event the Portfolio does engage in securities lending, the Portfolio will lend through its custodian, State Street Bank and Trust Company (“State Street”), acting as securities lending agent on behalf of the Portfolio. State Street will manage the Portfolio’s collateral in accordance with the securities lending agency agreement between the Portfolio and State Street, and indemnify the Portfolio against counterparty risk. The loans will be collateralized by cash (which may be invested in a money market fund) and/ornon-cash collateral (which may include, U.S. Treasury securities and/or U.S. Government Agency securities issued or guaranteed by the United States
government or its agencies or instrumentalities) at least equal at all times to the market value of the securities loaned. The Portfolio may bear the risk of delay in recovery of, or loss of rights in, the securities loaned should the borrower of the securities experience financial difficulty. The Portfolio may also record a realized gain or loss on securities deemed sold due to a borrower’s inability to return securities on loan. The Portfolio bears the risk of any loss on investment of cash collateral. The Portfolio will receive compensation for lending its securities in the form of fees or it will retain a portion of interest on the investment of any cash collateral. The Portfolio will also continue to receive interest and dividends on the securities loaned and any gain or loss in the market price of the securities loaned that may occur during the term of the loan will be for the account of the Portfolio. Income earned from securities lending activities, if any, is reflected in the Statement of Operations. As of June 30, 2019, the Portfolio had securities on loan with an aggregate market value of $5,375,652; the total market value of collateral held by the Portfolio was $5,536,557. The market value of the collateral held includednon-cash collateral in the form of U.S. Treasury securities with a value of $4,137,771 and cash collateral which was invested into the State Street Navigator Securities Lending Government Money Market Portfolio with a value of $1,398,786.
(H) Indemnifications. Under the Fund’s organizational documents, its officers and trustees are indemnified against certain liabilities that may arise out of performance of their duties to the Fund. Additionally, in the normal course of business, the Portfolio enters into contracts with third-party service providers that contain a variety of representations and warranties and which may provide general indemnifications. The Portfolio’s maximum exposure under these arrangements is unknown, as this would involve future claims that may be made against the Portfolio that have not yet occurred. Based on experience, management is of the view that the risk of loss in connection with these potential indemnification obligations is remote. However, there can be no assurance that material liabilities related to such obligations will not arise in the future, which could adversely impact the Portfolio.
Note 3–Fees and Related Party Transactions
(A) Manager and Subadvisor. New York Life Investments, a registered investment adviser and an indirect,wholly-owned subsidiary of New York Life, serves as the Portfolio’s Manager pursuant to an Amended and Restated Management Agreement (“Management Agreement”). The Manager provides offices, conducts clerical, recordkeeping and bookkeeping services, and keeps most of the financial and accounting records required to be maintained by the Portfolio. Except for the portion of salaries and expenses that are the responsibility of the Portfolio, the Manager pays the salaries and expenses of all personnel affiliated with the Portfolio and certain operational expenses of the Portfolio. The Portfolio reimburses New York Life Investments in an amount equal to a portion of the compensation of the Chief Compliance Officer attributable to the Portfolio. MacKay Shields LLC (“MacKay Shields” or the “Subadvisor”), a registered investment adviser and an indirect,wholly-owned subsidiary of New York Life, serves as Subadvisor to the Portfolio and is responsible for theday-to-day portfolio management of the Portfolio. Pursuant to the terms of an Amended and Restated Subadvisory Agreement (“Subadvisory Agreement”) between New York Life Investments and MacKay Shields, New York Life Investments pays for the services of the Subadvisor.
| | |
| 20 | | MainStay VP MacKay Common Stock Portfolio |
The Fund, on behalf of the Portfolio, pays New York Life Investments in its capacity as the Portfolio’s investment manager and administrator, pursuant to the Management Agreement, a monthly fee for the services performed and facilities furnished at an annual rate of the Portfolio’s average daily net assets as follows: 0.55% up to $500 million; 0.525% from $500 million to $1 billion; and 0.50% in excess of $1 billion. During the six-month period ended June 30, 2019, the effective management fee rate was 0.54%.
During the six-month period ended June 30, 2019, New York Life Investments earned fees from the Portfolio in the amount of $2,036,133, and paid the Subadvisor in the amount of $1,018,066.
State Street providessub-administration andsub-accounting services to the Portfolio pursuant to an agreement with New York Life Investments. These services include calculating the daily NAVs of the Portfolio, maintaining the general ledger andsub-ledger accounts for the calculation of the Portfolio’s NAVs and assisting New York Life Investments in conducting various aspects of the Portfolio’s administrative operations. For providing these services to the Portfolio, State Street is compensated by New York Life Investments.
Pursuant to an agreement between the Fund and New York Life Investments, New York Life Investments is responsible for providing or
procuring certain regulatory reporting services for the Portfolio. The Portfolio will reimburse New York Life Investments for the actual costs incurred by New York Life Investments in connection with providing or procuring these services for the Portfolio.
(B) Distribution and Service Fees. The Fund, on behalf of the Portfolio, has entered into a distribution agreement with NYLIFE Distributors LLC (the “Distributor”), an indirect,wholly-owned subsidiary of New York Life. The Portfolio has adopted a distribution plan (the “Plan”) in accordance with the provisions of Rule 12b-1 under the 1940 Act. Under the Plan, the Distributor has agreed to provide, through its affiliates or independent third parties, various distribution-related, shareholder and administrative support services to the Service Class shareholders. For its services, the Distributor is entitled to a combined distribution and service fee accrued daily and paid monthly at an annual rate of 0.25% of the average daily net assets attributable to the Service Class shares of the Portfolio.
(C) Investments in Affiliates (in 000’s). During the six-month period ended June 30, 2019, purchases and sales transactions, income earned from investments and shares held of investment companies managed by New York Life Investments or its affiliates were as follows:
| | | | | | | | | | | | | | | | | | | | | | | | | | | | | | | | | | | | |
Affiliated Investment
Company | | Value,
Beginning of
Period | | | Purchases
at Cost | | | Proceeds
from Sales | | | Net
Realized
Gain/(Loss)
on Sales | | | Change in
Unrealized
Appreciation/
(Depreciation) | | | Value,
End of
Period | | | Dividend
Income | | | Other
Distributions | | | Shares
End of
Period | |
MainStay U.S. Government Liquidity Fund | | $ | 644 | | | $ | 22,760 | | | $ | (23,375 | ) | | $ | — | | | $ | — | | | $ | 29 | | | $ | 3 | | | $ | — | | | | 29 | |
Note 4–Federal Income Tax
As of June 30, 2019, the cost and unrealized appreciation (depreciation) of the Portfolio’s investment portfolio, including applicable derivative contracts and other financial instruments, as determined on a federal income tax basis, were as follows:
| | | | | | | | | | | | | | | | |
| | | Federal Tax
Cost | | | Gross
Unrealized
Appreciation | | | Gross
Unrealized
(Depreciation) | | | Net
Unrealized
Appreciation/
(Depreciation) | |
| | | | |
Investments in Securities | | $ | 679,565,730 | | | $ | 120,348,202 | | | $ | (18,128,290 | ) | | $ | 102,219,912 | |
During the year ended December 31, 2018, the tax character of distributions paid as reflected in the Statements of Changes in Net Assets was as follows:
| | |
|
| 2018 |
Tax-Based
Distributions
from Ordinary
Income | | Tax-Based
Distributions
from Long-Term
Gains |
| |
| $29,837,845 | | $56,208,499 |
Note 5–Custodian
State Street is the custodian of cash and securities held by the Portfolio. Custodial fees are charged to the Portfolio based on the Portfolio’s net assets and/or the market value of securities held by the Portfolio and the number of certain transactions incurred by the Portfolio.
Note 6–Line of Credit
The Portfolio and certain other funds managed by New York Life Investments maintain a line of credit with a syndicate of banks in order to secure a source of funds for temporary purposes to meet unanticipated or excessive redemption requests.
Effective July 30, 2019, under the credit agreement (the “Credit Agreement”), the aggregate commitment amount is $600,000,000 with an additional uncommitted amount of $100,000,000. The commitment fee is an annual rate of 0.15% of the average commitment amount payable quarterly, regardless of usage, to State Street, who serves as the agent to the syndicate. The commitment fee is allocated among the Portfolio and certain other funds managed by New York Life Investments based upon their respective net assets and other factors. Interest on any revolving credit loan is charged based upon the Federal Funds Rate or the one-month London Interbank Offered Rate (“LIBOR”), whichever is higher. The Credit Agreement expires on July 28, 2020, although the Portfolio, certain other funds managed by New York Life Investments and the syndicate of banks may renew the Credit Agreement for an additional year on the same or different terms. Prior to July 30, 2019,
Notes to Financial Statements(Unaudited) (continued)
the aggregate commitment amount and the commitment fee were the same as those under the current Credit Agreement. During the six-month period ended June 30, 2019, there were no borrowings made or outstanding with respect to the Portfolio under the Credit Agreement.
Note 7–Interfund Lending Program
Pursuant to an exemptive order issued by the SEC, the Portfolio, along with certain other funds managed by New York Life Investments, may participate in an interfund lending program. The interfund lending program provides an alternative credit facility that permits the Portfolio and certain other funds managed by New York Life Investments to lend or borrow money for temporary purposes directly to or from one another subject to the conditions of the exemptive order. During the six-month period ended June 30, 2019, there were no interfund loans made or outstanding with respect to the Portfolio.
Note 8–Purchases and Sales of Securities (in 000’s)
During the six-month period ended June 30, 2019, purchases and sales of securities, other thanshort-term securities, were $338,129 and $347,709, respectively.
Note 9–Capital Share Transactions
Transactions in capital shares for the six-month period ended June 30, 2019 and year ended December 31, 2018, were as follows:
| | | | | | | | |
Initial Class | | Shares | | | Amount | |
| | |
Six-month period ended June 30, 2019: | | | | | | | | |
Shares sold | | | 835,083 | | | $ | 23,455,130 | |
Shares redeemed | | | (1,037,742 | ) | | | (29,187,883 | ) |
| | | | |
Net increase (decrease) | | | (202,659 | ) | | $ | (5,732,753 | ) |
| | | | |
Year ended December 31, 2018: | | | | | | | | |
Shares sold | | | 3,972,204 | | | $ | 115,973,349 | |
Shares issued to shareholders in reinvestment of dividends and distributions | | | 1,983,971 | | | | 58,346,116 | |
Shares redeemed | | | (9,411,326 | ) | | | (272,388,002 | ) |
| | | | |
Net increase (decrease) | | | (3,455,151 | ) | | $ | (98,068,537 | ) |
| | | | |
| | |
| | | | | | | | |
Service Class | | Shares | | | Amount | |
| | |
Six-month period ended June 30, 2019: | | | | | | | | |
Shares sold | | | 376,047 | | | $ | 10,253,851 | |
Shares redeemed | | | (733,870 | ) | | | (20,463,960 | ) |
| | | | |
Net increase (decrease) | | | (357,823 | ) | | $ | (10,210,109 | ) |
| | | | |
Year ended December 31, 2018: | | | | | | | | |
Shares sold | | | 1,624,167 | | | $ | 48,024,583 | |
Shares issued to shareholders in reinvestment of dividends and distributions | | | 952,396 | | | | 27,700,228 | |
Shares redeemed | | | (2,185,800 | ) | | | (64,930,689 | ) |
| | | | |
Net increase (decrease) | | | 390,763 | | | $ | 10,794,122 | |
| | | | |
Note 10–Litigation
The Portfolio has been named as a defendant in the case entitledKirschner v. FitzSimons, No.12-2652 (S.D.N.Y.) (the “FitzSimonsaction”) as a result of its ownership of shares in the Tribune Company (“Tribune”) in 2007 when Tribune effected a leveraged buyout trans-
action (“LBO”) by which Tribune converted to a privately-held company. In its complaint, the plaintiff asserts claims against certain insiders, major shareholders, professional advisers, and others involved in the LBO. Separately, the complaint also seeks to obtain from former Tribune shareholders, including the Portfolio, any proceeds they received in connection with the LBO. The sole claim and cause of action brought against the Portfolio is for fraudulent conveyance pursuant to United States Bankruptcy Code Section 548(a)(1)(A).
In June 2011, certain Tribune creditors filed numerous additional actions asserting state law constructive fraudulent conveyance claims (the “SLCFC actions”) against specifically-named former Tribune shareholders and, in some cases, putative defendant classes comprised of former Tribune shareholders. One of the SLCFC actions, entitledDeutsche Bank Trust Co. Americas v. Blackrock Institutional Trust Co., No.11-9319 (S.D.N.Y.) (the “Deutsche Bank action”), named the Portfolio as a defendant.
The FitzSimons action andDeutsche Bank action have been consolidated with the majority of the other Tribune LBO related lawsuits in a multidistrict litigation proceeding entitled In re Tribune Co. Fraudulent Conveyance Litig., No. 11-md-2296 (S.D.N.Y.) (the “MDL Proceeding”).
On September 23, 2013, the District Court granted the defendants’ motion to dismiss the SLCFC actions, including theDeutsche Bankaction, on the basis that the plaintiffs did not have standing to pursue their claims. On September 30, 2013, the plaintiffs in the SLCFC actions filed a notice of appeal to the United States Court of Appeals for the Second Circuit. On October 28, 2013, the defendants filed a joint notice of cross-appeal of that same order. On March 29, 2016, the United States Court of Appeals for the Second Circuit issued its opinion on the appeal of the SLCFC actions. The appeals court affirmed the district court’s dismissal of those lawsuits, but on different grounds than the district court. The appeals court held that while the plaintiffs have standing under the U.S. Bankruptcy Code, their claims were preempted by Section 546(e) of the Bankruptcy Code-the statutory safe harbor for settlement payments. On April 12, 2016 the Plaintiffs in the SLCFC actions filed a petition seeking rehearing en banc before the appeals court. On July 22, 2016, the appeals court denied the petition. On September 9, 2016, the plaintiffs filed a petition for writ of certiorari in the U.S. Supreme Court challenging the Second Circuit’s decision that the safe harbor of Section 546(e) applied to their claims. Certain shareholder defendants filed a joint brief in opposition to the petition for certiorari on October 24, 2016. The plaintiffs filed a reply in support of the petition on November 4, 2016. On April 3, 2018, Justice Kennedy and Justice Thomas issued a “Statement” related to the petition for certiorari suggesting that the Second Circuit and/or District Court may want to take steps to reexamine the application of the Section 546(e) safe harbor to the previously dismissed state law constructive fraudulent transfer claims based on the Supreme Court’s decision inMerit Management Group LP v. FTI Consulting, Inc. On April 10, 2018, the plaintiffs filed in the Second Circuit a motion for that court to recall its mandate, vacate its prior decision, and remand to the district court for further proceedings consistent withMerit Management. On April 20, 2018, the shareholder defendants filed a response to the plaintiffs’ motion to recall the mandate. On May 15, 2018, the Second Circuit issued an order recalling the mandate “in anticipation of further panel review.”
| | |
| 22 | | MainStay VP MacKay Common Stock Portfolio |
On August 2, 2013, the plaintiff in theFitzSimonsaction filed a Fifth Amended Complaint. On May 23, 2014, the defendants filed motions to dismiss theFitzSimonsaction, including a global motion to dismiss Count I, which is the claim brought against former Tribune shareholders, for intentional fraudulent conveyance under U.S. federal law.
On January 6, 2017, the United States District Court for the Southern District of New York granted the shareholder defendants’ motion to dismiss the intentional fraudulent conveyance claim in the FitzSimons action. In dismissing the intentional fraudulent conveyance claim, the Court denied the plaintiff’s request to amend the complaint. While the District Court’s dismissal of the intentional fraudulent conveyance claim was not immediately appealable, the Trustee asked the District Court to enter judgment immediately so that an appeal could be taken. On February 23, 2017, the Court issued an order stating that it intended to permit an interlocutory appeal of the dismissal order, but would wait to do so until it has resolved outstanding motions to dismiss filed by other defendants.
On July 18, 2017, the plaintiff submitted a letter to the District Court seeking leave to amend its complaint to add a constructive fraudulent transfer claim. The shareholder defendants opposed that request.
On August 24, 2017, the Court denied the plaintiff’s request without prejudice to renewal of the request in the event of an intervening change in the law. On March 8, 2018, the plaintiff renewed the request for leave to file a motion to amend the complaint to assert a constructive fraudulent transfer claim based on the Supreme Court’s ruling inMerit Management. The shareholder defendants opposed that request. On June 18, 2018, the District Court ordered that the request would be stayed pending further action by the Second Circuit in the still-pending appeal, discussed above. On December 18, 2018, the plaintiff filed a letter with the District Court requesting that the stay be dissolved in order to permit briefing on the motion to amend the complaint and indicating the plaintiff’s intention to file another motion to amend the complaint to reinstate claims for intentional fraudulent transfer. The shareholder defendants opposed that request. On January 14, 2019, the court held a case management conference, during which the court stated that it would not lift the stay prior to further action from the Second Circuit. The court stated that it would allow the plantiff to file a motion to amend to try to reinstate its intentional fraudulent transfer claim. On January 23, 2019, the court ordered the parties still facing pending claims to participate in a mediation. On March 27, 2019, the court held a telephone conference and decided to allow the plaintiff to file a motion for leave to amend. On April 4, 2019, the plaintiff filed a motion to amend the Fifth Amended Complaint to assert a federal con-
structive fraudulent transfer claim against certain shareholder defendants. On April 10, 2019, the shareholder defendants filed a brief in opposition to the plaintiff’s motion to amend. On April 12, 2019, the plaintiff filed a reply brief. The court denied leave to amend the complaint on April 23, 2019. On June 13, 2019, the court entered judgment pursuant to Rule 54(b), which would permit an appeal of the court’s dismissal of the claim against the shareholder defendants.
The value of the proceeds received by the Portfolio in connection with the LBO and the Portfolio’s cost basis in shares of Tribune was as follows:
| | | | | | | | |
Portfolio | | Proceeds | | | Cost Basis | |
MainStay VP MacKay Common Stock Portfolio | | $ | 1,300,602 | | | $ | 1,174,184 | |
At this stage of the proceedings, it would be difficult to assess with any reasonable certainty the probable outcome of the pending litigation or the effect, if any, on the Portfolio’s net asset value.
Note 11–Recent Accounting Pronouncement
To improve the effectiveness of fair value disclosure requirements, the Financial Accounting Standards Board recently issued Accounting Standard Update (ASU)2018-13, Fair Value Measurement Disclosure Framework—Changes to the Disclosure Requirements for Fair Value Measurement (ASU2018-13), which adds, removes, and modifies certain aspects relating to fair value disclosure. ASU2018-13 is effective for interim and annual reporting periods beginning after December 15, 2019; early adoption of the additions relating to ASU2018-13 is not required. Management has evaluated the implications of certain other provisions of the ASU and has determined to early adopt aspects related to the removal and modifications of certain fair value measurement disclosures under the ASU effective immediately. At this time, management is evaluating the implications of certain other provisions of the ASU related to new disclosure requirements and any impact on the financial statement disclosures has not yet been determined.
Note 12–Subsequent Events
In connection with the preparation of the financial statements of the Portfolio as of and for the six-month period ended June 30, 2019, events and transactions subsequent to June 30, 2019, through the date the financial statements were issued have been evaluated by the Portfolio’s management for possible adjustment and/or disclosure. No subsequent events requiring financial statement adjustment or disclosure have been identified.
Proxy Voting Policies and Procedures and Proxy Voting Record
A description of the policies and procedures that New York Life Investments uses to vote proxies related to the Portfolio’s securities is available without charge, upon request, (i) by calling800-598-2019; (ii) by visiting New York Life Investments website at https://www.nylinvestments.com/mainstay/products-and-performance/mainstay-vp-funds-trust; or (iii) by visiting the SEC’s website at www.sec.gov.
The Portfolio is required to file with the SEC its proxy voting record for the12-month period ending June 30 on Form N-PX. The Portfolio’s most recent Form N-PX or proxy voting record is available free of charge upon request (i) by calling800-598-2019; (ii) by visiting New York Life Investments website at https://www.nylinvestments.com/mainstay/products-and-performance/mainstay-vp-funds-trust; or (iii) by visiting the SEC’s website atwww.sec.gov.
Shareholder Reports and Quarterly Portfolio Disclosure
The Portfolio is required to file its complete schedule of portfolio holdings with the SEC 60 days after each fiscal quarter onForm N-PORT. The Portfolio’s holdings report is available without charge upon request, (i) by calling800-598-2019; (ii) by visiting New York Life Investments website at https://www.nylinvestments.com/mainstay/products-and-performance/mainstay-vp-funds-trust; or (iii) on the SEC’s website at www.sec.gov.
| | |
| 24 | | MainStay VP MacKay Common Stock Portfolio |
MainStay VP Portfolios
MainStay VP offers a wide range of Portfolios. The full array of MainStay VP offerings is listed here, with information about the manager, subadvisors, legal counsel, and independent registered public accounting firm.
Equity Portfolios
MainStay VP Eagle Small Cap Growth Portfolio
MainStay VP Emerging Markets Equity Portfolio
MainStay VP Epoch U.S. Equity Yield Portfolio
MainStay VP Fidelity Institutional AM® Utilities Portfolio†
MainStay VP Large Cap Growth Portfolio
MainStay VP MacKay Common Stock Portfolio
MainStay VP MacKay Growth Portfolio
MainStay VP MacKay International Equity Portfolio
MainStay VP MacKay Mid Cap Core Portfolio
MainStay VP MacKay S&P 500 Index Portfolio
MainStay VP MacKay Small Cap Core Portfolio
MainStay VP Mellon Natural Resources Portfolio
MainStay VP T. Rowe Price Equity Income Portfolio
Mixed Asset Portfolios
MainStay VP Balanced Portfolio
MainStay VP Income Builder Portfolio
MainStay VP Janus Henderson Balanced Portfolio
MainStay VP MacKay Convertible Portfolio
Income Portfolios
MainStay VP Bond Portfolio
MainStay VP Floating Rate Portfolio
MainStay VP Indexed Bond Portfolio
MainStay VP MacKay Government Portfolio
MainStay VP MacKay High Yield Corporate Bond Portfolio
MainStay VP MacKay Unconstrained Bond Portfolio
MainStay VP PIMCO Real Return Portfolio
Money Market
MainStay VP U.S. Government Money Market Portfolio
Alternative
MainStay VP Cushing Renaissance Advantage Portfolio
MainStay VP IQ Hedge Multi-Strategy Portfolio
Asset Allocation Portfolios
MainStay VP Conservative Allocation Portfolio
MainStay VP Growth Allocation Portfolio
MainStay VP Moderate Allocation Portfolio
MainStay VP Moderate Growth Allocation Portfolio
Manager
New York Life Investment Management LLC
New York, New York
Subadvisors
Candriam Belgium*
Brussels, Belgium
Cushing Asset Management, LP
Dallas, Texas
Eagle Asset Management, Inc.
St Petersburg, Florida
Epoch Investment Partners, Inc.
New York, New York
FIAM LLC
Smithfield, Rhode Island
IndexIQ Advisors LLC*
New York, New York
Janus Capital Management LLC
Denver, Colorado
MacKay Shields LLC*
New York, New York
Mellon Investments Corporation
Boston, Massachusetts
NYL Investors LLC*
New York, New York
Pacific Investment Management Company LLC
Newport Beach, California
T. Rowe Price Associates, Inc.
Baltimore, Maryland
Winslow Capital Management, LLC
Minneapolis, Minnesota
Distributor
NYLIFE Distributors LLC*
Jersey City, New Jersey
Custodian
State Street Bank and Trust Company
Boston, Massachusetts
Independent Registered Public Accounting Firm
PricewaterhouseCoopers LLP
New York, New York
Legal Counsel
Dechert LLP
Washington, District of Columbia
Some Portfolios may not be available in all products.
| † | Fidelity Institutional AM is a registered trade mark of FMR LLC. Used with permission. |
| * | An affiliate of New York Life Investment Management LLC |
Not part of the Semiannual Report
2019 Semiannual Report
This report is for the general information of New York Life Variable Annuities and NYLIAC Variable Universal Life Insurance Products policyowners. It must be preceded or accompanied by the appropriate product(s) and funds prospectuses if it is given to anyone who is not an owner of a New York Life variable annuity policy or a NYLIAC Variable Universal Life Insurance Product. This report does not offer for sale or solicit orders to purchase securities.
The performance data quoted in this report represents past performance. Past performance is no guarantee of future results. Due to market volatility and other factors, current performance may be lower or higher than the figures shown. The most recent month-end performance summary for your variable annuity or variable life policy is available by calling 800-598-2019 and is updated periodically on www.newyorklife.com.
The New York Life Variable Annuities and NYLIAC Variable Universal Life Insurance Products are issued by New York Life Insurance and Annuity Corporation (a Delaware Corporation) and distributed by NYLIFE Distributors LLC (Member FINRA/SIPC).
New York Life Insurance Company
New York Life Insurance and Annuity Corporation (NYLIAC) (A Delaware Corporation)
51 Madison Avenue, Room 551
New York, NY 10010
www.newyorklife.com
Printed on recycled paper
nylinvestments.com
NYLIFE Distributors LLC, 30 Hudson Street, Jersey City, NJ 07302
New York Life Investment Management LLC is the investment manager to the MainStay VP Funds Trust
©2019 by NYLIFE Distributors LLC. All rights reserved.
You may obtain copies of the Prospectus and the Statement of Additional Information free of charge, upon request, by callingtoll-free 800-598-2019 or writing to New York Life Insurance and Annuity Corporation, 51 Madison Avenue, New York, NY 10010.
| | | | |
| | | |
| Not FDIC Insured | | No Bank Guarantee | | May Lose Value |
| | | | |
| 1781606 | | | | MSVPCS10-08/19 (NYLIAC) NI511 |
MainStay VP MacKay Convertible Portfolio
Message from the President and Semiannual Report
Unaudited | June 30, 2019

Beginning on January 1, 2021, as permitted by regulations adopted by the Securities and Exchange Commission, paper copies of the MainStay VP Portfolio annual and semi-annual shareholder reports may no longer be sent by mail, unless you specifically request paper copies of the reports from the insurance company that offers your policy. Instead, the reports will be made available online, and you will be notified by mail each time a report is posted and provided with a website link to access the report. Instructions for requesting paper copies will be provided by your insurance company.
If you already elected to receive shareholder reports electronically, you will not be affected by this change and you need not take any action. At any time, you may elect to receive reports and other communications from the insurance company electronically by following the instructions provided by the insurance company.
You may elect to receive all future shareholder reports in paper form free of charge. You can inform the insurance company that you wish to receive paper copies of reports by following the instructions provided by the insurance company. Your election to receive reports in paper form will apply to all portfolio companies available under your contract.
| | | | | | | | |
| | | | | |
| Not FDIC/NCUA Insured | | Not a Deposit | | May Lose Value | | No Bank Guarantee | | Not Insured by Any Government Agency |

This page intentionally left blank
Message from the President
Most equity and fixed-income markets in the United States and around the world advanced in the face of conflicting political and macroeconomic forces during thesix-month period ended June 30, 2019.
The reporting period began on the heels of tumultuous December 2018, during which equities and equity-sensitive bonds spiked sharply lower on concerns regarding the pace of economic growth, a U.S. government shutdown and the potential impact of trade disputes between the United States and other nations, particularly China. Markets recovered quickly in early 2019 as trade tensions eased, the government reopened and the U.S. Federal Reserve Board (Fed) adopted a more patient tone regarding the future direction of interest rates. Markets moved broadly higher from January through April, supported by encouraging economic data and generally strong corporate earnings.
During the first four months of the reporting period, the improving economic environment encouraged investors to favor areas of the market viewed as offering greater return potential along with higher risks. Among U.S. stocks, cyclical, growth-oriented sectors tended to outperform more defensive, value-oriented sectors, whilelarge-cap stocks outperformed theirsmaller-cap counterparts. Within the S&P 500® Index, the information technology sector led the market’s advance, followed by communication services, consumer discretionary and consumer staples. Industrials, utilities, financials, materials, real estate and energy produced more modest gains. While some international equity markets outperformed or underperformed the U.S. market, on average international stocks mirrored the performance of their U.S. counterparts. Fixed-income securities gained ground as well, albeit along a more gradual trajectory. Among U.S. fixed-income instruments, corporate issues generally outperformed government bonds, with lower credit quality, higher yielding securities leading the sector’s advance. Long-term U.S. Treasury bond yields proved particularly weak, with
10-year yields dipping at times below3-month yields, reflecting investors’ continued concerns about domestic economic growth.
May 2019 saw a return of uncertainty and volatility. Trade discussions between the United States and China faltered, driving global equity prices lower. Government bond prices rose as investors sought safe havens. June brought yet anotherU-turn as equity prices climbed again after comments from the Fed raised hopes of an interest rate cut in response to weak economic data. Stock and bond prices rose, with U.S. equity markets ending the reporting period in record territory.
We are pleased to see renewed signs of strength in broad areas of the financial market. At the same time, we remained sharply focused on providing you, as a MainStay VP investor, with the experienced and disciplined fund management that we believe underpins an effective, long-term investment strategy. Whatever tomorrow’s investment environment brings, you can rely on our portfolio managers to pursue the objectives of their individual Portfolios as outlined in the prospectus with the energy and dedication you have come to expect.
The report that follows contains additional information on the market events, investment decisions and specific securities that shaped your VP Portfolio’s performance during the six months ended June 30, 2019. We encourage you to read the report carefully and use it to evaluate your Portfolio’s performance in light of your long-range financial plan.
Sincerely,

Kirk C. Lehneis
President
The opinions expressed are as of the date of this report and are subject to change. There is no guarantee that any forecast made will come to pass. This material does not constitute investment advice and is not intended as an endorsement of any specific investment. Past performance is no guarantee of future results.
Not part of the Semiannual Report
Table of Contents
Investors should refer to the Portfolio’s Summary Prospectus and/or Prospectus and consider the Portfolio’s investment objectives, strategies, risks, charges and expenses carefully before investing. The Summary Prospectus and/or Prospectus contain this and other information about the Portfolio. You may obtain copies of the Portfolio’s Summary Prospectus and/or the Prospectus and the Statement of Additional Information free of charge, upon request, by calling toll-free 800-598-2019, by writing to New York Life Insurance and Annuity Corporation, 51 Madison Avenue, Room 251, New York, New York 10010 or the insurance company that offers your policy, or by sending an email to MainStayShareholdersServices@nylim.com. These documents are also available at nylinvestments.com/vpdocuments. Please read the Summary Prospectus and/or Prospectus carefully before investing. MainStay VP Funds Trust portfolios are separate account options which are purchased through a variable insurance or variable annuity contract.
Investment and Performance Comparison1(Unaudited)
Performance data quoted represents past performance. Past performance is no guarantee of future results. Because of market volatility and other factors, current performance may be lower or higher than the figures shown. Investment return and principal value will fluctuate, and as a result, when shares are redeemed, they may be worth more or less than their original cost. The performance table and graph do not reflect any deduction of sales charges, mortality and expense charges, contract charges or administrative charges. Please refer to the Performance Summary appropriate for your policy. For performance information current to the most recent month-end, please call800-598-2019 or visit www.newyorklife.com.
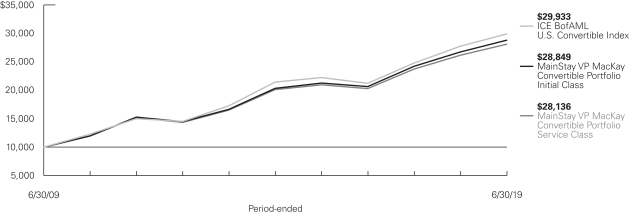
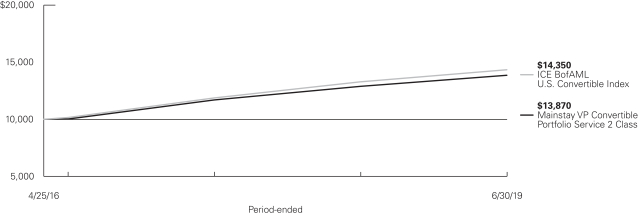
Average Annual Total Returns for the Period Ended June 30, 2019
| | | | | | | | | | | | | | | | | | | | | | |
| Class | | Inception
Date | | Six Months | | | One Year | | | Five Years or Since
Inception | | | Ten Years
or Since
Inception | | | Gross
Expense
Ratio2 | |
| | | | | | |
| Initial Class Shares | | 10/1/1996 | | | 16.17 | % | | | 7.91 | % | | | 7.22 | % | | | 11.18 | % | | | 0.61 | % |
| Service Class Shares | | 6/5/2003 | | | 16.03 | | | | 7.64 | | | | 6.95 | | | | 10.90 | | | | 0.86 | |
| Service 2 Class Shares | | 4/26/2016 | | | 15.97 | | | | 7.56 | | | | 10.83 | | | | 10.83 | | | | 0.96 | |
| | | | | | | | | | | | | | | | |
| Benchmark Performance | | Six Months | | | One
Year | | | Five
Years | | | Ten
Years | |
| | | | |
ICE BofAML U.S. Convertible Index3 | | | 14.51 | % | | | 7.93 | % | | | 6.90 | % | | | 11.60 | % |
Morningstar Convertibles Category Average4 | | | 14.59 | | | | 7.21 | | | | 5.92 | | | | 10.14 | |
| 1. | Performance figures may reflect certain fee waivers and/or expense limitations, without which total returns may have been different. For information on current fee waivers and/or expense limitations (if any), please refer to the Notes to Financial Statements. |
| 2. | The gross expense ratios presented reflect the Portfolio’s “Total Annual Portfolio Operating Expenses” from the most recent Prospectus, as supplemented, and may differ from other expense ratios disclosed in this report. |
| 3. | The ICE BofAML U.S. Convertible Index is the Portfolio’s primary broad-based securities market index for comparison purposes. The ICE BofAML |
| | U.S. Convertible Index is a market-capitalization weighted index of domestic corporate convertible securities. In order to be included in this Index, bonds and preferred stocks must be convertible only to common stock. Results assume reinvestment of all dividends and capital gains. An investment cannot be made directly in an index. |
| 4. | The Morningstar Convertibles Category Average is representative of funds that are designed to offer some of the capital-appreciation potential of stock portfolios while also supplying some of the safety and yield of bond portfolios. Results are based on average total returns of similar funds with all dividends and capital gain distributions reinvested. |
Cost in Dollars of a $1,000 Investment in MainStay VP MacKay Convertible Portfolio (Unaudited)
The example below is intended to describe the fees and expenses borne by shareholders during the six-month period from January 1, 2019, to June 30, 2019, and the impact of those costs on your investment.
Example
As a shareholder of the Portfolio you incur two types of costs: (1) transaction costs, including exchange fees and sales charges (loads) on purchases (as applicable), and (2) ongoing costs, including management fees, distribution and/or service (12b-1) fees, and other Portfolio expenses (as applicable). This example is intended to help you understand your ongoing costs (in dollars) of investing in the Portfolio and to compare these costs with the ongoing costs of investing in other mutual funds. The example is based on an investment of $1,000 made at the beginning of the six-month period and held for the entire period from January 1, 2019, to June 30, 2019. Shares are only sold in connection with variable life and annuity contracts and the example does not reflect any contract level or transactional fees or expenses. If these costs had been included, your costs would have been higher.
This example illustrates your Portfolio’s ongoing costs in two ways:
Actual Expenses
The second and third data columns in the table below provide information about actual account values and actual expenses. You may use the information in these columns, together with the amount you invested, to estimate the expenses that you paid during the six months ended June 30, 2019. Simply divide your account value by $1,000
(for example, an $8,600 account value divided by $1,000 = 8.6), then multiply the result by the number under the heading entitled “Expenses Paid During Period” to estimate the expenses you paid on your account during this period.
Hypothetical Example for Comparison Purposes
The fourth and fifth data columns in the table below provide information about hypothetical account values and hypothetical expenses based on the Portfolio’s actual expense ratio and an assumed rate of return of 5% per year before expenses, which is not the Portfolio’s actual return. The hypothetical account values and expenses may not be used to estimate the actual ending account balances or expenses you paid for the six-month period shown. You may use this information to compare the ongoing costs of investing in the Portfolio with the ongoing costs of investing in other mutual funds. To do so, compare this 5% hypothetical example with the 5% hypothetical examples that appear in the shareholder reports of the other mutual funds.
Please note that the expenses shown in the table are meant to highlight your ongoing costs only and do not reflect any transactional costs, such as exchange fees or sales charges (loads). Therefore, the fourth and fifth data columns of the table are useful in comparing ongoing costs only and will not help you determine the relative total costs of owning different funds. In addition, if these transactional costs were included, your costs would have been higher.
| | | | | | | | | | | | | | | | | | | | | | |
| | | | | | | | | | | | | | | | | | |
| Share Class | | Beginning
Account
Value
1/1/19 | | | Ending Account
Value (Based
on Actual
Returns and
Expenses)
6/30/19 | | | Expenses
Paid
During
Period1 | | | Ending Account
Value (Based
on Hypothetical
5% Annualized
Return and
Actual Expenses)
6/30/19 | | | Expenses
Paid
During
Period1 | | | Net Expense
Ratio
During
Period2 |
| | | | | | |
| Initial Class Shares | | $ | 1,000.00 | | | $ | 1,161.70 | | | $ | 3.27 | | | $ | 1,021.77 | | | $ | 3.06 | | | 0.61% |
| | | | | | |
| Service Class Shares | | $ | 1,000.00 | | | $ | 1,160.30 | | | $ | 4.61 | | | $ | 1,020.53 | | | $ | 4.31 | | | 0.86% |
| | | | | | |
| Service 2 Class Shares | | $ | 1,000.00 | | | $ | 1,159.70 | | | $ | 5.14 | | | $ | 1,020.03 | | | $ | 4.81 | | | 0.96% |
| 1. | Expenses are equal to the Portfolio’s annualized expense ratio of each class multiplied by the average account value over the period, divided by 365 and multiplied by 181 (to reflect the six-month period). The table above represents the actual expenses incurred during the six-month period. In addition to the fees and expenses which the Portfolio bears directly, it also indirectly bears a pro rata share of the fees and expenses of the underlying funds in which it invests. Such indirect expenses are not included in the above-reported expense figures. |
| 2. | Expenses are equal to the Portfolio’s annualized expense ratio to reflect the six-month period. |
| | |
| 6 | | MainStay VP MacKay Convertible Portfolio |
Portfolio Composition as of June 30, 2019(Unaudited)
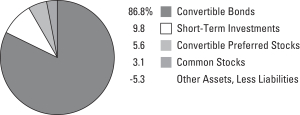
See Portfolio of Investments beginning on page 10 for specific holdings within these categories. The Portfolio’s holdings are subject to change.
Top Ten Holdings or Issuers Held as of June 30, 2019(excludingshort-term investments) (Unaudited)
| 1. | Danaher Corp., (zero coupon), due 1/22/21 |
| 2. | Microchip Technology, Inc., 1.625%, due 2/15/25–2/15/27 |
| 3. | Anthem, Inc., 2.75%, due 10/15/42 |
| 4. | NICE Systems, Inc., 1.25%, due 1/15/24 |
| 5. | Illumina, Inc. (zero coupon)–0.50%, due 6/15/21–8/15/23 |
| 7. | Teladoc Health, Inc., 1.375%, due 5/15/25 |
| 8. | Lumentum Holdings, Inc., 0.25%, due 3/15/24 |
| 9. | DISH Network Corp., 3.375%, due 8/15/26 |
| 10. | Workday, Inc., 0.25%, due 10/1/22 |
Portfolio Management Discussion and Analysis(Unaudited)
Answers to the questions reflect the views of Edward Silverstein, CFA, of MacKay Shields LLC, the Portfolio’s Subadvisor.
How did MainStay VP MacKay Convertible Portfolio perform relative to its benchmark and peers during the six months ended June 30, 2019?
For the six months ended June 30, 2019, MainStay VP MacKay Convertible Portfolio returned 16.17% for Initial Class shares, 16.03% for Service Class shares and 15.97% for Service 2 Class shares. Over the same period, all share classes outperformed the 14.51% return of the ICE BofAML U.S. Convertible Index, which is the Portfolio’s benchmark, and the 14.59% return of the Morningstar Convertibles Category Average.1
What factors affected the Portfolio’s relative performance during the reporting period?
The gains in the Portfolio and the ICE BofAML U.S. Convertible Index were almost entirely due to the rise in equity markets during the reporting period, which largely determine the performance of equity-sensitive convertible bonds. The Fund’s outperformance relative to the Index was the result of owning overweighted exposure to several strong-performing issues. Standout holdings included internet retailer Etsy, healthcare equipment manufacturer Danaher, Latin American internet site MercadoLibre and software firm NICE Systems. The Portfolio also benefited from holding no exposure to the convertible bonds of carmaker Tesla, which had a large weighting in the Index and was a weak performer.
What was the Portfolio’s duration2 strategy during the reporting period? Please include the Portfolio’s duration at the end of the reporting period.
Convertible bond prices tend to vary with changes in the price of the underlying equity security rather than with changes in interest rates. For this reason, duration does not guide our investment decisions regarding the Portfolio’s convertible security holdings. As of June 30, 2019, the Portfolio’s effective duration was 3.87 years.
What specific factors, risks or market forces prompted significant decisions for the Portfolio during the reporting period?
The Portfolio is managed through abottom-up, fundamental investment process. Accordingly, there were no material factors or market forces that prompted significant decisions.
During the reporting period, which market segments were the strongest positive contributors to the Portfolio’s absolute performance and which market segments were particularly weak?
The Portfolio’s holdings in the software industry made the strongest contributions to the absolute performance during the reporting period. (Contributions take weightings and total returns into account.) Several substantial software holdings, including NICE Systems, Workday and ServiceNow, had a significant positive impact on the Portfolio’s performance. All three companies cited above reported better than expected quarterly earnings and raised guidance for the coming quarters. The Internet retailing area also made a significant positive contribution to the Portfolio’s absolute performance, led by holdings of Etsy and MercadoLibre, both of which reported earnings that were above analyst expectations.
The weakest contributors to the Portfolio’s absolute performance included the energy and health care sectors. Energy fell in sympathy with the price of crude oil, which declined sharply from the highs of the fall of 2018 and remained below that recent peak. The Portfolio’s position in the convertible bonds of oilfield service company Weatherford International, which filed for bankruptcy during the reporting period, was by far the Portfolio’s worst performer. The health care sector in general was weighed down by fears that a “Medicare for All” plan proposed by several Presidential candidates would negatively impact the industry if companies were forced to negotiate pricing with a single monopoly payor, the U.S. government. Several of the Portfolio holdings within the health care sector, such as Ligand Pharmaceuticals, BioMarin and Novavax, detracted from Portfolio performance.
Did the Portfolio make any significant purchases or sales during the reporting period?
All the Portfolio’s purchases during the reporting period were convertible bonds of drug or medical device makers. They included existing convertible bonds and a new offering of convertible securities from medical device maker ConMed; convertible bonds of biotechnology developer Sarepta Pharmaceutical, which is developing a treatment for a form of muscular dystrophy that we believe would likely be a very profitable product if successful; and convertible bonds of Exact Sciences, the maker of colon cancer test, Cologuard, that we believe is likely to experience rapid adoption from patients who do not wish to undergo a colonoscopy procedure.
| 1. | See page 5 for more information on benchmark and peer group returns. |
| 2. | Duration is a measure of the price sensitivity of a fixed-income investment to changes in interest rates. Duration is expressed as a number of years and is considered a more accurate sensitivity gauge than average maturity. |
| | |
| 8 | | MainStay VP MacKay Convertible Portfolio |
Three of the Portfolio’s larger holdings, Citrix Systems, Post and Hess matured during the reporting period and were converted into common shares, which the Portfolio sold. Air Lease, another of the Portfolio’s common stock holdings, was also sold during the period. In addition, the Portfolio sold its holdings of the convertible bonds of Ligand Pharmaceutical as new information related to the company’s management and history reduced our level of confidence in the investment.
How did the Portfolio’s sector weightings change during the reporting period?
During the reporting period, the Portfolio’s exposure to the energy sector decreased. During the same period, the Portfolio’s exposure to the information technology sector increased.
All of the Portfolio’s other sector weightings remained relatively unchanged.
How was the Portfolio positioned at the end of the reporting period?
As of June 30, 2019, the Portfolio held overweighted exposure to the energy, health care, information technology and industrials sectors relative to the ICE BofAML U.S. Convertible Index. As of the same date, the Portfolio held relatively underweighted exposure to the financial, real estate and utilities sectors. As of June 30, 2019, the Portfolio held roughly market weight positions in the communications, consumer cyclical, consumer discretionary and materials sectors.
Portfolio of InvestmentsJune 30, 2019 (Unaudited)
| | | | | | | | |
| | | Principal
Amount | | | Value | |
Convertible Securities 92.4%† Convertible Bonds 86.8% | |
Advertising 0.6% | |
Quotient Technology, Inc.
1.75%, due 12/1/22 | | $ | 5,756,000 | | | $ | 5,571,174 | |
| | | | | | | | |
|
Aerospace & Defense 1.2% | |
Aerojet Rocketdyne Holdings, Inc.
2.25%, due 12/15/23 | | | 6,133,000 | | | | 10,922,798 | |
| | | | | | | | |
|
Biotechnology 7.4% | |
BioMarin Pharmaceutical, Inc.
0.599%, due 8/1/24 (a) | | | 15,124,000 | | | | 15,738,413 | |
Exact Sciences Corp.
1.00%, due 1/15/25 | | | 6,160,000 | | | | 10,651,549 | |
Illumina, Inc. (a) | | | | | | | | |
(zero coupon), due 8/15/23 (b) | | | 7,893,000 | | | | 9,147,587 | |
0.50%, due 6/15/21 | | | 7,153,000 | | | | 11,067,597 | |
Intercept Pharmaceuticals, Inc.
3.25%, due 7/1/23 | | | 5,052,000 | | | | 4,529,703 | |
Ionis Pharmaceuticals, Inc.
1.00%, due 11/15/21 | | | 8,329,000 | | | | 9,870,341 | |
Medicines Co.
2.75%, due 7/15/23 | | | 5,185,000 | | | | 5,211,852 | |
Radius Health, Inc.
3.00%, due 9/1/24 | | | 444,000 | | | | 402,885 | |
| | | | | | | | |
| | | | | | | 66,619,927 | |
| | | | | | | | |
Building Materials 0.9% | |
Patrick Industries, Inc.
1.00%, due 2/1/23 | | | 9,317,000 | | | | 8,494,295 | |
| | | | | | | | |
|
Commercial Services 4.0% | |
Chegg, Inc.
0.125%, due 3/15/25 (b) | | | 6,835,000 | | | | 6,893,859 | |
Euronet Worldwide, Inc.
0.75%, due 3/15/49 (a)(b) | | | 7,730,000 | | | | 9,400,995 | |
Macquarie Infrastructure Corp.
2.875%, due 7/15/19 | | | 15,467,000 | | | | 15,473,279 | |
Square, Inc.
0.50%, due 5/15/23 | | | 3,658,000 | | | | 4,383,552 | |
| | | | | | | | |
| | | | | | | 36,151,685 | |
| | | | | | | | |
Computers 2.9% | |
Lumentum Holdings, Inc.
0.25%, due 3/15/24 | | | 14,385,000 | | | | 16,962,602 | |
Nutanix, Inc.
(zero coupon), due 1/15/23 | | | 1,844,000 | | | | 1,726,314 | |
Pure Storage, Inc.
0.125%, due 4/15/23 | | | 2,934,000 | | | | 2,823,975 | |
Western Digital Corp.
1.50%, due 2/1/24 (b) | | | 4,634,000 | | | | 4,173,060 | |
| | | | | | | | |
| | | | | | | 25,685,951 | |
| | | | | | | | |
| | | | | | | | |
| | | Principal
Amount | | | Value | |
Diversified Financial Services 0.6% | |
LendingTree, Inc.
0.625%, due 6/1/22 | | $ | 2,437,000 | | | $ | 5,088,722 | |
| | | | | | | | |
|
Electric 0.9% | |
NRG Energy, Inc.
2.75%, due 6/1/48 | | | 7,722,000 | | | | 8,267,027 | |
| | | | | | | | |
|
Entertainment 0.2% | |
Live Nation Entertainment, Inc.
2.50%, due 3/15/23 | | | 1,447,000 | | | | 1,716,372 | |
| | | | | | | | |
|
Health Care—Products 6.1% | |
CONMED Corp.
2.625%, due 2/1/24 (b) | | | 7,840,000 | | | | 9,051,952 | |
Danaher Corp.
(zero coupon), due 1/22/21 | | | 6,483,000 | | | | 35,388,175 | |
NuVasive, Inc.
2.25%, due 3/15/21 | | | 3,296,000 | | | | 3,751,260 | |
Wright Medical Group, Inc.
1.625%, due 6/15/23 | | | 5,820,000 | | | | 6,382,619 | |
| | | | | | | | |
| | | | | | | 54,574,006 | |
| | | | | | | | |
Health Care—Services 5.7% | |
Anthem, Inc.
2.75%, due 10/15/42 | | | 6,256,000 | | | | 24,445,803 | |
Molina Healthcare, Inc.
1.125%, due 1/15/20 | | | 2,690,000 | | | | 9,365,923 | |
Teladoc Health, Inc.
1.375%, due 5/15/25 | | | 12,046,000 | | | | 17,923,773 | |
| | | | | | | | |
| | | | | | | 51,735,499 | |
| | | | | | | | |
Internet 14.0% | |
At Home Corp.
4.75%, due 12/15/06 (c)(d)(e)(f)(g) | | | 2,640,000 | | | | 34,320 | |
Boingo Wireless, Inc.
1.00%, due 10/1/23 (b) | | | 4,790,000 | | | | 4,112,190 | |
Booking Holdings, Inc.
0.90%, due 9/15/21 (a) | | | 13,680,000 | | | | 15,682,719 | |
Etsy, Inc.
(zero coupon), due 3/1/23 | | | 7,162,000 | | | | 12,984,356 | |
FireEye, Inc.
0.875%, due 6/1/24 | | | 3,663,000 | | | | 3,588,810 | |
IAC Financeco 2, Inc.
0.875%, due 6/15/26 (b) | | | 4,435,000 | | | | 4,477,642 | |
IAC FinanceCo, Inc.
0.875%, due 10/1/22 (b) | | | 2,615,000 | | | | 3,952,777 | |
Liberty Expedia Holdings, Inc.
1.00%, due 6/30/47 (b) | | | 7,641,000 | | | | 7,646,963 | |
MercadoLibre, Inc.
2.00%, due 8/15/28 (b) | | | 5,643,000 | | | | 8,706,762 | |
Okta, Inc.
0.25%, due 2/15/23 | | | 4,261,000 | | | | 11,051,378 | |
| | | | |
| 10 | | MainStay VP MacKay Convertible Portfolio | | The notes to the financial statements are an integral part of,
and should be read in conjunction with, the financial statements. |
| | | | | | | | |
| | | Principal
Amount | | | Value | |
| Convertible Bonds (continued) | |
Internet (continued) | |
Palo Alto Networks, Inc.
0.75%, due 7/1/23 (b) | | $ | 8,986,000 | | | $ | 9,512,338 | |
Q2 Holdings, Inc.
0.75%, due 6/1/26 (b) | | | 2,800,000 | | | | 3,025,512 | |
RingCentral, Inc.
(zero coupon), due 3/15/23 | | | 7,337,000 | | | | 11,034,641 | |
Twitter, Inc.
0.25%, due 9/15/19 | | | 9,402,000 | | | | 9,370,361 | |
Wix.com, Ltd.
(zero coupon), due 7/1/23 (a)(b) | | | 10,770,000 | | | | 13,193,250 | |
Zendesk, Inc.
0.25%, due 3/15/23 | | | 1,447,000 | | | | 2,221,423 | |
Zillow Group, Inc.
1.50%, due 7/1/23 | | | 5,760,000 | | | | 5,683,442 | |
| | | | | | | | |
| | | | | | | 126,278,884 | |
| | | | | | | | |
Iron & Steel 0.3% | |
Cleveland-Cliffs, Inc.
1.50%, due 1/15/25 | | | 2,050,000 | | | | 2,963,455 | |
| | | | | | | | |
|
Lodging 0.5% | |
Caesars Entertainment Corp.
5.00%, due 10/1/24 | | | 2,616,000 | | | | 4,484,284 | |
| | | | | | | | |
|
Machinery—Diversified 1.6% | |
Chart Industries, Inc.
1.00%, due 11/15/24 (b) | | | 10,263,000 | | | | 14,645,144 | |
| | | | | | | | |
|
Media 3.4% | |
DISH Network Corp.
3.375%, due 8/15/26 | | | 17,289,000 | | | | 16,851,313 | |
Liberty Media Corp-Liberty Formula One
1.00%, due 1/30/23 | | | 6,664,000 | | | | 7,861,929 | |
Liberty Media Corp.
1.375%, due 10/15/23 | | | 5,512,000 | | | | 6,200,700 | |
| | | | | | | | |
| | | | | | | 30,913,942 | |
| | | | | | | | |
Oil & Gas 2.0% | |
Ensco Jersey Finance, Ltd.
3.00%, due 1/31/24 (a) | | | 11,037,000 | | | | 8,634,545 | |
Oasis Petroleum, Inc.
2.625%, due 9/15/23 | | | 3,737,000 | | | | 3,428,180 | |
Transocean, Inc.
0.50%, due 1/30/23 (a) | | | 5,990,000 | | | | 5,948,211 | |
| | | | | | | | |
| | | | | | | 18,010,936 | |
| | | | | | | | |
Oil & Gas Services 3.8% | |
Helix Energy Solutions Group, Inc. | | | | | | | | |
4.125%, due 9/15/23 | | | 5,115,000 | | | | 6,170,144 | |
4.25%, due 5/1/22 | | | 1,953,000 | | | | 1,969,708 | |
Newpark Resources, Inc.
4.00%, due 12/1/21 | | | 5,174,000 | | | | 5,763,067 | |
| | | | | | | | |
| | | Principal
Amount | | | Value | |
Oil & Gas Services (continued) | |
Oil States International, Inc.
1.50%, due 2/15/23 | | $ | 13,438,000 | | | $ | 12,019,051 | |
Weatherford International, Ltd.
5.875%, due 7/1/21 (g) | | | 16,859,000 | | | | 8,724,532 | |
| | | | | | | | |
| | | | | | | 34,646,502 | |
| | | | | | | | |
Pharmaceuticals 3.6% | |
DexCom, Inc.
0.75%, due 12/1/23 (b) | | | 3,894,000 | | | | 4,577,017 | |
Herbalife Nutrition, Ltd.
2.625%, due 3/15/24 | | | 6,582,000 | | | | 6,401,306 | |
Neurocrine Biosciences, Inc.
2.25%, due 5/15/24 | | | 5,395,000 | | | | 7,105,197 | |
Pacira BioSciences, Inc.
2.375%, due 4/1/22 | | | 5,779,000 | | | | 5,931,340 | |
Sarepta Therapeutics, Inc.
1.50%, due 11/15/24 | | | 2,059,000 | | | | 4,588,368 | |
Supernus Pharmaceuticals, Inc.
0.625%, due 4/1/23 | | | 4,136,000 | | | | 4,056,799 | |
| | | | | | | | |
| | | | | | | 32,660,027 | |
| | | | | | | | |
Semiconductors 10.1% | |
Cypress Semiconductor Corp.
2.00%, due 2/1/23 | | | 3,980,000 | | | | 4,714,452 | |
Inphi Corp.
1.125%, due 12/1/20 | | | 9,461,000 | | | | 12,729,099 | |
Intel Corp.
3.25%, due 8/1/39 | | | 3,685,000 | | | | 8,677,659 | |
Microchip Technology, Inc. | | | | | | | | |
1.625%, due 2/15/25 | | | 12,203,000 | | | | 21,566,794 | |
1.625%, due 2/15/27 | | | 5,198,000 | | | | 6,136,759 | |
Micron Technology, Inc.
3.125%, due 5/1/32 | | | 1,501,000 | | | | 5,787,206 | |
Novellus Systems, Inc.
2.625%, due 5/15/41 | | | 724,000 | | | | 4,212,910 | |
ON Semiconductor Corp.
1.00%, due 12/1/20 | | | 8,174,000 | | | | 10,062,137 | |
Rambus, Inc.
1.375%, due 2/1/23 | | | 6,552,000 | | | | 6,459,039 | |
Silicon Laboratories, Inc.
1.375%, due 3/1/22 | | | 9,006,000 | | | | 11,226,081 | |
| | | | | | | | |
| | | | | | | 91,572,136 | |
| | | | | | | | |
Software 12.3% | |
Atlassian Corp.
0.625%, due 5/1/23 | | | 5,325,000 | | | | 9,065,812 | |
Coupa Software, Inc.
0.125%, due 6/15/25 (b) | | | 3,509,000 | | | | 3,763,690 | |
NICE Systems, Inc.
1.25%, due 1/15/24 | | | 13,581,000 | | | | 23,164,093 | |
Nuance Communications, Inc.
1.25%, due 4/1/25 | | | 8,331,000 | | | | 8,205,237 | |
| | | | | | |
The notes to the financial statements are an integral part of,
and should be read in conjunction with, the financial statements. | | | | | 11 | |
Portfolio of InvestmentsJune 30, 2019 (Unaudited) (continued)
| | | | | | | | |
| | | Principal
Amount | | | Value | |
| Convertible Bonds (continued) | |
Software (continued) | |
Red Hat, Inc.
0.25%, due 10/1/19 | | $ | 2,510,000 | | | $ | 6,396,023 | |
ServiceNow, Inc.
(zero coupon), due 6/1/22 | | | 6,076,000 | | | | 12,612,667 | |
Splunk, Inc.
0.50%, due 9/15/23 (b) | | | 8,049,000 | | | | 8,880,123 | |
Twilio, Inc.
0.25%, due 6/1/23 | | | 2,263,000 | | | | 4,544,677 | |
Verint Systems, Inc.
1.50%, due 6/1/21 | | | 12,098,000 | | | | 13,024,448 | |
Workday, Inc.
0.25%, due 10/1/22 | | | 11,205,000 | | | | 16,836,085 | |
Zynga, Inc.
0.25%, due 6/1/24 (b) | | | 4,515,000 | | | | 4,519,295 | |
| | | | | | | | |
| | | | | | | 111,012,150 | |
| | | | | | | | |
Telecommunications 2.6% | |
Finisar Corp.
0.50%, due 12/15/36 | | | 6,207,000 | | | | 6,066,880 | |
InterDigital, Inc.
2.00%, due 6/1/24 (b) | | | 2,860,000 | | | | 2,916,242 | |
Viavi Solutions Inc.
1.00%, due 3/1/24 | | | 9,569,000 | | | | 11,267,497 | |
Vonage Holdings Corp.
1.75%, due 6/1/24 (b) | | | 2,860,000 | | | | 2,893,389 | |
| | | | | | | | |
| | | | | | | 23,144,008 | |
| | | | | | | | |
Transportation 2.1% | |
Atlas Air Worldwide Holdings, Inc.
2.25%, due 6/1/22 | | | 11,348,000 | | | | 11,266,467 | |
Echo Global Logistics, Inc.
2.50%, due 5/1/20 | | | 7,629,000 | | | | 7,586,087 | |
| | | | | | | | |
| | | | | | | 18,852,554 | |
| | | | | | | | |
Total Convertible Bonds
(Cost $676,727,470) | | | | | | | 784,011,478 | |
| | | | | | | | |
| | |
| | | | | | | | |
| | |
| | | Shares | | | | |
| Convertible Preferred Stocks 5.6% | |
Banks 2.6% | |
Bank of America Corp.
Series L
7.25% | | | 8,636 | | | | 11,848,592 | |
Wells Fargo & Co.
Series L
7.50% | | | 8,264 | | | | 11,273,749 | |
| | | | | | | | |
| | | | | | | 23,122,341 | |
| | | | | | | | |
| | | | | | | | |
| | |
Shares | | | Value | |
Chemicals 0.5% | |
A. Schulman, Inc.
6.00% | | | 4,110 | | | $ | 4,215,833 | |
| | | | | | | | |
|
Equity Real Estate Investment Trusts 0.8% | |
Crown Castle International Corp.
6.875% | | | 5,982 | | | | 7,189,467 | |
| | | | | | | | |
|
Health Care Equipment & Supplies 1.0% | |
Becton Dickinson & Co.
6.125% | | | 146,239 | | | | 9,053,656 | |
| | | | | | | | |
|
Machinery 0.7% | |
Rexnord Corp.
5.75% | | | 75,817 | | | | 4,651,373 | |
Stanley Black & Decker, Inc.
5.375% | | | 20,480 | | | | 2,071,142 | |
| | | | | | | | |
| | | | | | | 6,722,515 | |
| | | | | | | | |
Total Convertible Preferred Stocks
(Cost $45,511,797) | | | | | | | 50,303,812 | |
| | | | | | | | |
Total Convertible Securities
(Cost $722,239,267) | | | | | | | 834,315,290 | |
| | | | | | | | |
| | |
| Common Stocks 3.1% | | | | | | | | |
Air Freight & Logistics 0.6% | |
XPO Logistics, Inc. (h) | | | 87,557 | | | | 5,061,670 | |
| | | | | | | | |
|
Airlines 0.9% | |
Delta Air Lines, Inc. | | | 151,688 | | | | 8,608,294 | |
| | | | | | | | |
|
Banks 0.8% | |
Bank of America Corp. | | | 267,678 | | | | 7,762,662 | |
| | | | | | | | |
|
Health Care Equipment & Supplies 0.8% | |
Teleflex, Inc. | | | 21,245 | | | | 7,035,282 | |
| | | | | | | | |
Total Common Stocks
(Cost $15,968,085) | | | | | | | 28,467,908 | |
| | | | | | | | |
| | |
| Short-Term Investments 9.8% | | | | | | | | |
Affiliated Investment Company 4.5% | |
MainStay U.S. Government Liquidity Fund, 2.03% (i) | | | 40,355,327 | | | | 40,355,327 | |
| | | | | | | | |
| | | | |
| 12 | | MainStay VP MacKay Convertible Portfolio | | The notes to the financial statements are an integral part of,
and should be read in conjunction with, the financial statements. |
| | | | | | | | |
| | |
Shares | | | Value | |
Unaffiliated Investment Company 5.3% | |
State Street Navigator Securities Lending Government Money Market Portfolio, 2.33% (i)(j) | | | 47,965,355 | | | $ | 47,965,355 | |
| | | | | | | | |
TotalShort-Term Investments
(Cost $88,320,682) | | | | | | | 88,320,682 | |
| | | | | | | | |
Total Investments
(Cost $826,528,034) | | | 105.3 | % | | | 951,103,880 | |
Other Assets, Less Liabilities | | | (5.3 | ) | | | (48,171,695 | ) |
Net Assets | | | 100.0 | % | | $ | 902,932,185 | |
| † | Percentages indicated are based on Portfolio net assets. |
| (a) | All or a portion of this security was held on loan. As of June 30, 2019, the aggregate market value of securities on loan was $53,745,326; the total market value of collateral held by the Portfolio was $54,355,973. The market value of the collateral held included non-cash collateral in the form of U.S. Treasury securities with a value of $6,390,618 (See Note 2(H)). |
| (b) | May be sold to institutional investors only under Rule 144A or securities offered pursuant to Section 4(a)(2) of the Securities Act of 1933, as amended. |
| (c) | Security in which significant unobservable inputs (Level 3) were used in determining fair value. |
| (d) | Illiquid security—As of June 30, 2019, the total market value of the security deemed illiquid under procedures approved by the Board of Trustees was $34,320, which represented less than one-tenth of a percent of the Portfolio’s net assets. |
| (e) | Fair valued security—Represents fair value as measured in good faith under procedures approved by the Board of Trustees. As of June 30, 2019, the total market value of fair valued security was $34,320, which represented less than one-tenth of a percent of the Portfolio’s net assets. |
| (f) | Restricted security (See Note 5). |
| (g) | Issue in non-accrual status. |
| (h) | Non-income producing security. |
| (i) | Current yield as of June 30, 2019. |
| (j) | Represents security purchased with cash collateral received for securities on loan. |
The following is a summary of the fair valuations according to the inputs used as of June 30, 2019, for valuing the Portfolio’s assets:
| | | | | | | | | | | | | | | | |
Description | | Quoted
Prices in Active
Markets for
Identical Assets (Level 1) | | | Significant Other
Observable Inputs (Level 2) | | | Significant
Unobservable Inputs (Level 3) | | | Total | |
| | | | |
Asset Valuation Inputs | | | | | | | | | | | | | | | | |
| Investments in Securities (a) | | | | | | | | | | | | | | | | |
| Convertible Securities | | | | | | | | | | | | | | | | |
Convertible Bonds (b) | | $ | — | | | $ | 783,977,158 | | | $ | 34,320 | | | $ | 784,011,478 | |
Convertible Preferred Stocks (c) | | | 46,087,979 | | | | 4,215,833 | | | | — | | | | 50,303,812 | |
| | | | | | | | | | | | | | | | |
| Total Convertible Securities | | | 46,087,979 | | | | 788,192,991 | | | | 34,320 | | | | 834,315,290 | |
| | | | | | | | | | | | | | | | |
| Common Stocks | | | | | | | | | | | | | | | | |
| Short-Term Investments | | | 28,467,908 | | | | — | | | | — | | | | 28,467,908 | |
Affiliated Investment Company | | | 40,355,327 | | | | — | | | | — | | | | 40,355,327 | |
Unaffiliated Investment Company | | | 47,965,355 | | | | — | | | | — | | | | 47,965,355 | |
| | | | | | | | | | | | | | | | |
| TotalShort-Term Investments | | | 88,320,682 | | | | — | | | | — | | | | 88,320,682 | |
| | | | | | | | | | | | | | | | |
| Total Investments in Securities | | $ | 162,876,569 | | | $ | 788,192,991 | | | $ | 34,320 | | | $ | 951,103,880 | |
| | | | | | | | | | | | | | | | |
| (a) | For a complete listing of investments and their industries, see the Portfolio of Investments. |
| (b) | The Level 3 security valued at $34,320 is held in Internet within the Convertible Bonds section of the Portfolio of Investments. |
| (c) | The Level 2 security valued at $4,215,833 is held in Chemicals within the Convertible Preferred Stocks section of the Portfolio of Investments. |
| | | | | | |
The notes to the financial statements are an integral part of,
and should be read in conjunction with, the financial statements. | | | | | 13 | |
Portfolio of InvestmentsJune 30, 2019 (Unaudited) (continued)
The following is a reconciliation of investments in which significant unobservable inputs (Level 3) were used in determining value:
| | | | | | | | | | | | | | | | | | | | | | | | | | | | | | | | | | | | | | | | |
Investments in Securities | | Balance as of
December 31,
2018 | | | Accrued
Discounts
(Premiums) | | | Realized
Gain
(Loss) | | | Change in
Unrealized
Appreciation
(Depreciation) | | | Purchases | | | Sales | | | Transfers
in to
Level 3 | | | Transfers
out of
Level 3 | | | Balance
as of
June 30,
2019 | | | Change in
Unrealized
Appreciation
(Depreciation)
from
Investments
Still Held at
June 30,
2019 (a) | |
| Long-Term Bonds | | | | | | | | | | | | | | | | | | | | | | | | | | | | | | | | | | | | | | | | |
Convertible Bonds Internet | | $ | — | | | $ | — | | | $ | — | | | $ | 34,320 | | | $ | — | | | $ | — | | | $ | — | | | $ | — | | | $ | 34,320 | | | $ | 34,320 | |
| | | | | | | | | | | | | | | | | | | | | | | | | | | | | | | | | | | | | | | | |
| (a) | Included in “Net change in unrealized appreciation (depreciation) on investments” in the Statement of Operations. |
| | | | |
| 14 | | MainStay VP MacKay Convertible Portfolio | | The notes to the financial statements are an integral part of,
and should be read in conjunction with, the financial statements. |
Statement of Assets and Liabilitiesas of June 30, 2019 (Unaudited)
| | | | |
| Assets | | | | |
Investment in unaffiliated securities, at value (identified cost $786,172,707) including securities on loan of $53,745,326 | | $ | 910,748,553 | |
Investment in affiliated investment company, at value (identified cost $40,355,327) | | | 40,355,327 | |
Receivables: | | | | |
Dividends and interest | | | 2,554,374 | |
Investment securities sold | | | 1,274,158 | |
Portfolio shares sold | | | 398,995 | |
Securities lending | | | 30,996 | |
Other assets | | | 3,932 | |
| | | | |
Total assets | | | 955,366,335 | |
| | | | |
| |
| Liabilities | | | | |
Cash collateral received for securities on loan | | | 47,965,355 | |
Payables: | | | | |
Investment securities purchased | | | 3,411,265 | |
Manager (See Note 3) | | | 421,228 | |
Portfolio shares redeemed | | | 405,614 | |
NYLIFE Distributors (See Note 3) | | | 142,125 | |
Professional fees | | | 44,806 | |
Shareholder communication | | | 29,824 | |
Custodian | | | 9,190 | |
Trustees | | | 1,011 | |
Accrued expenses | | | 3,732 | |
| | | | |
Total liabilities | | | 52,434,150 | |
| | | | |
Net assets | | $ | 902,932,185 | |
| | | | |
| |
| Composition of Net Assets | | | | |
Shares of beneficial interest outstanding (par value of $.001 per share) unlimited number of shares authorized | | $ | 64,033 | |
Additional paid-in capital | | | 716,995,477 | |
| | | | |
| | | 717,059,510 | |
Total distributable earnings (loss) | | | 185,872,675 | |
| | | | |
Net assets | | $ | 902,932,185 | |
| | | | |
| | | | |
Initial Class | | | | |
Net assets applicable to outstanding shares | | $ | 196,583,131 | |
| | | | |
Shares of beneficial interest outstanding | | | 13,845,643 | |
| | | | |
Net asset value per share outstanding | | $ | 14.20 | |
| | | | |
Service Class | | | | |
Net assets applicable to outstanding shares | | $ | 699,701,676 | |
| | | | |
Shares of beneficial interest outstanding | | | 49,715,158 | |
| | | | |
Net asset value per share outstanding | | $ | 14.07 | |
| | | | |
Service 2 Class | | | | |
Net assets applicable to outstanding shares | | $ | 6,647,378 | |
| | | | |
Shares of beneficial interest outstanding | | | 472,360 | |
| | | | |
Net asset value and offering price per share outstanding | | $ | 14.07 | |
| | | | |
| | | | | | |
The notes to the financial statements are an integral part of,
and should be read in conjunction with, the financial statements. | | | | | 15 | |
Statement of Operationsfor the six months ended June 30, 2019 (Unaudited)
| | | | |
| Investment Income (Loss) | | | | |
Income | | | | |
Interest | | $ | 4,491,013 | |
Dividends-unaffiliated | | | 1,842,326 | |
Dividends-affiliated | | | 553,394 | |
Securities lending | | | 209,113 | |
| | | | |
Total income | | | 7,095,846 | |
| | | | |
Expenses | | | | |
Manager (See Note 3) | | | 2,475,508 | |
Distribution/Service—Service Class (See Note 3) | | | 825,729 | |
Distribution/Service—Service 2 Class (See Note 3) | | | 6,667 | |
Professional fees | | | 62,245 | |
Shareholder communication | | | 36,027 | |
Custodian | | | 12,524 | |
Trustees | | | 10,419 | |
Miscellaneous | | | 17,526 | |
| | | | |
Total expenses | | | 3,446,645 | |
| | | | |
Net investment income (loss) | | | 3,649,201 | |
| | | | |
|
| Realized and Unrealized Gain (Loss) on Investments | |
Net realized gain (loss) on unaffiliated investments | | | 14,821,962 | |
Net change in unrealized appreciation (depreciation) on unaffiliated investments | | | 105,975,576 | |
| | | | |
Net realized and unrealized gain (loss) on investments | | | 120,797,538 | |
| | | | |
Net increase (decrease) in net assets resulting from operations | | $ | 124,446,739 | |
| | | | |
| | | | |
| 16 | | MainStay VP MacKay Convertible Portfolio | | The notes to the financial statements are an integral part of,
and should be read in conjunction with, the financial statements. |
Statements of Changes in Net Assets
for the six months ended June 30, 2019 (Unaudited) and the year ended December 31, 2018
| | | | | | | | |
| | | 2019 | | | 2018 | |
| Increase (Decrease) in Net Assets | |
Operations: | | | | | | | | |
Net investment income (loss) | | $ | 3,649,201 | | | $ | 8,636,981 | |
Net realized gain (loss) on investments | | | 14,821,962 | | | | 57,465,817 | |
Net change in unrealized appreciation (depreciation) on investments | | | 105,975,576 | | | | (86,430,824 | ) |
| | | | |
Net increase (decrease) in net assets resulting from operations | | | 124,446,739 | | | | (20,328,026 | ) |
| | | | |
Distributions to shareholders: | | | | | | | | |
Initial Class | | | (1,466,326 | ) | | | (10,585,861 | ) |
Service Class | | | (4,335,401 | ) | | | (31,875,069 | ) |
Service 2 Class | | | (25,834 | ) | | | (161,160 | ) |
| | | | |
Total distributions to shareholders | | | (5,827,561 | ) | | | (42,622,090 | ) |
| | | | |
Capital share transactions: | | | | | | | | |
Net proceeds from sale of shares | | | 62,393,569 | | | | 132,526,463 | |
Net asset value of shares issued to shareholders in reinvestment of dividends and distributions | | | 5,827,561 | | | | 42,622,090 | |
Cost of shares redeemed | | | (56,733,678 | ) | | | (134,810,863 | ) |
| | | | |
Increase (decrease) in net assets derived from capital share transactions | | | 11,487,452 | | | | 40,337,690 | |
| | | | |
Net increase (decrease) in net assets | | | 130,106,630 | | | | (22,612,426 | ) |
| | |
| Net Assets | | | | | | | | |
Beginning of period | | | 772,825,555 | | | | 795,437,981 | |
| | | | |
End of period | | $ | 902,932,185 | | | $ | 772,825,555 | |
| | | | |
| | | | | | |
The notes to the financial statements are an integral part of,
and should be read in conjunction with, the financial statements. | | | | | 17 | |
Financial Highlightsselected per share data and ratios
| | | | | | | | | | | | | | | | | | | | | | | | |
| | |
| | | Six months
ended
June 30, | | | Year ended December 31, | |
| | | | | | |
| Initial Class | | 2019* | | | 2018 | | | 2017 | | | 2016 | | | 2015 | | | 2014 | |
| | | | | | |
Net asset value at beginning of period | | $ | 12.31 | | | $ | 13.29 | | | $ | 12.28 | | | $ | 11.86 | | | $ | 13.41 | | | $ | 13.38 | |
| | | | | | | | | | | | | | | | | | | | | | | | |
| | | | | | |
Net investment income (loss) (a) | | | 0.07 | | | | 0.17 | | | | 0.18 | | | | 0.19 | | | | 0.14 | | | | 0.16 | |
| | | | | | |
Net realized and unrealized gain (loss) on investments | | | 1.92 | | | | (0.41 | ) | | | 1.28 | | | | 1.18 | | | | (0.32 | ) | | | 0.88 | |
| | | | | | | | | | | | | | | | | | | | | | | | |
| | | | | | |
Total from investment operations | | | 1.99 | | | | (0.24 | ) | | | 1.46 | | | | 1.37 | | | | (0.18 | ) | | | 1.04 | |
| | | | | | | | | | | | | | | | | | | | | | | | |
| | | | | | |
| Less dividends and distributions: | | | | | | | | | | | | | | | | | | | | | | | | |
| | | | | | |
From net investment income | | | (0.10 | ) | | | (0.23 | ) | | | (0.23 | ) | | | (0.47 | ) | | | (0.36 | ) | | | (0.45 | ) |
| | | | | | |
From net realized gain on investments | | | — | | | | (0.51 | ) | | | (0.22 | ) | | | (0.48 | ) | | | (1.01 | ) | | | (0.56 | ) |
| | | | | | | | | | | | | | | | | | | | | | | | |
| | | | | | |
Total dividends and distributions | | | (0.10 | ) | | | (0.74 | ) | | | (0.45 | ) | | | (0.95 | ) | | | (1.37 | ) | | | (1.01 | ) |
| | | | | | | | | | | | | | | | | | | | | | | | |
| | | | | | |
Net asset value at end of period | | $ | 14.20 | | | $ | 12.31 | | | $ | 13.29 | | | $ | 12.28 | | | $ | 11.86 | | | $ | 13.41 | |
| | | | | | | | | | | | | | | | | | | | | | | | |
| | | | | | |
Total investment return (b) | | | 16.17 | % | | | (2.27 | %) | | | 11.99 | % | | | 12.07 | % | | | (1.33 | %) | | | 7.98 | % |
| | | | | | |
| Ratios (to average net assets)/Supplemental Data: | | | | | | | | | | | | | | | | | | | | | | | | |
| | | | | | |
Net investment income (loss) | | | 1.05 | %†† | | | 1.24 | % | | | 1.40 | % | | | 1.59 | % | | | 1.08 | % | | | 1.21 | % |
| | | | | | |
Net expenses (c) | | | 0.61 | %†† | | | 0.61 | % | | | 0.62 | % | | | 0.64 | % | | | 0.62 | % | | | 0.63 | % |
| | | | | | |
Portfolio turnover rate | | | 11 | % | | | 43 | % | | | 34 | % | | | 39 | % | | | 58 | % | | | 55 | % |
| | | | | | |
Net assets at end of period (in 000’s) | | $ | 196,583 | | | $ | 177,136 | | | $ | 227,285 | | | $ | 162,462 | | | $ | 142,942 | | | $ | 158,220 | |
| (a) | Per share data based on average shares outstanding during the period. |
| (b) | Total return does not reflect any deduction of sales charges, mortality and expense charges, contract charges or administrative charges. For periods of less than one year, total return is not annualized. |
| (c) | In addition to the fees and expenses which the Portfolio bears directly, it also indirectly bears a pro-rata share of the fees and expenses of the underlying funds in which it invests. Such indirect expenses are not included in the above expense ratios. |
| | | | | | | | | | | | | | | | | | | | | | | | |
| | |
| | | Six months
ended
June 30, | | | Year ended December 31, | |
| | | | | | |
| Service Class | | 2019* | | | 2018 | | | 2017 | | | 2016 | | | 2015 | | | 2014 | |
| | | | | | |
Net asset value at beginning of period | | $ | 12.21 | | | $ | 13.18 | | | $ | 12.18 | | | $ | 11.77 | | | $ | 13.32 | | | $ | 13.27 | |
| | | | | | | | | | | | | | | | | | | | | | | | |
| | | | | | |
Net investment income (loss) (a) | | | 0.05 | | | | 0.13 | | | | 0.15 | | | | 0.16 | | | | 0.11 | | | | 0.13 | |
| | | | | | |
Net realized and unrealized gain (loss) on investments | | | 1.90 | | | | (0.40 | ) | | | 1.26 | | | | 1.17 | | | | (0.32 | ) | | | 0.86 | |
| | | | | | | | | | | | | | | | | | | | | | | | |
| | | | | | |
Total from investment operations | | | 1.95 | | | | (0.27 | ) | | | 1.41 | | | | 1.33 | | | | (0.21 | ) | | | 0.99 | |
| | | | | | | | | | | | | | | | | | | | | | | | |
| | | | | | |
| Less dividends and distributions: | | | | | | | | | | | | | | | | | | | | | | | | |
| | | | | | |
From net investment income | | | (0.09 | ) | | | (0.19 | ) | | | (0.19 | ) | | | (0.44 | ) | | | (0.33 | ) | | | (0.38 | ) |
| | | | | | |
From net realized gain on investments | | | — | | | | (0.51 | ) | | | (0.22 | ) | | | (0.48 | ) | | | (1.01 | ) | | | (0.56 | ) |
| | | | | | | | | | | | | | | | | | | | | | | | |
| | | | | | |
Total dividends and distributions | | | (0.09 | ) | | | (0.70 | ) | | | (0.41 | ) | | | (0.92 | ) | | | (1.34 | ) | | | (0.94 | ) |
| | | | | | | | | | | | | | | | | | | | | | | | |
| | | | | | |
Net asset value at end of period | | $ | 14.07 | | | $ | 12.21 | | | $ | 13.18 | | | $ | 12.18 | | | $ | 11.77 | | | $ | 13.32 | |
| | | | | | | | | | | | | | | | | | | | | | | | |
| | | | | | |
Total investment return (b) | | | 16.03 | % | | | (2.52 | %) | | | 11.72 | % | | | 11.79 | % | | | (1.57 | %) | | | 7.71 | % |
| | | | | | |
| Ratios (to average net assets)/Supplemental Data: | | | | | | | | | | | | | | | | | | | | | | | | |
| | | | | | |
Net investment income (loss) | | | 0.80 | %†† | | | 0.99 | % | | | 1.15 | % | | | 1.35 | % | | | 0.84 | % | | | 0.97 | % |
| | | | | | |
Net expenses (c) | | | 0.86 | %†† | | | 0.86 | % | | | 0.87 | % | | | 0.89 | % | | | 0.87 | % | | | 0.88 | % |
| | | | | | |
Portfolio turnover rate | | | 11 | % | | | 43 | % | | | 34 | % | | | 39 | % | | | 58 | % | | | 55 | % |
| | | | | | |
Net assets at end of period (in 000’s) | | $ | 699,702 | | | $ | 592,673 | | | $ | 565,974 | | | $ | 476,926 | | | $ | 460,883 | | | $ | 460,406 | |
| (a) | Per share data based on average shares outstanding during the period. |
| (b) | Total return does not reflect any deduction of sales charges, mortality and expense charges, contract charges or administrative charges. For periods of less than one year, total return is not annualized. |
| (c) | In addition to the fees and expenses which the Portfolio bears directly, it also indirectly bears a pro-rata share of the fees and expenses of the underlying funds in which it invests. Such indirect expenses are not included in the above expense ratios. |
| | | | |
| 18 | | MainStay VP MacKay Convertible Portfolio | | The notes to the financial statements are an integral part of,
and should be read in conjunction with, the financial statements. |
Financial Highlightsselected per share data and ratios
| | | | | | | | | | | | | | | | | | | | |
| | | | |
| | | Six months ended June 30, | | | | | | Year ended December 31, | | | April 26, 2016** through
December 31, | |
| | | | | |
| Service 2 Class | | 2019* | | | | | | 2018 | | | 2017 | | | 2016 | |
| | | | | |
Net asset value at beginning of period | | $ | 12.21 | | | | | | | $ | 13.18 | | | $ | 12.18 | | | $ | 11.63 | |
| | | | | | | | | | | | | | | | | | | | |
| | | | | |
Net investment income (loss) (a) | | | 0.05 | | | | | | | | 0.12 | | | | 0.14 | | | | 0.11 | |
| | | | | |
Net realized and unrealized gain (loss) on investments | | | 1.89 | | | | | | | | (0.40 | ) | | | 1.26 | | | | 1.04 | |
| | | | | | | | | | | | | | | | | | | | |
| | | | | |
Total from investment operations | | | 1.94 | | | | | | | | (0.28 | ) | | | 1.40 | | | | 1.15 | |
| | | | | | | | | | | | | | | | | | | | |
| | | | | |
| Less dividends and distributions: | | | | | | | | | | | | | | | | | | | | |
| | | | | |
From net investment income | | | (0.08 | ) | | | | | | | (0.18 | ) | | | (0.18 | ) | | | (0.12 | ) |
| | | | | |
From net realized gain on investments | | | — | | | | | | | | (0.51 | ) | | | (0.22 | ) | | | (0.48 | ) |
| | | | | | | | | | | | | | | | | | | | |
| | | | | |
Total dividends and distributions | | | (0.08 | ) | | | | | | | (0.69 | ) | | | (0.40 | ) | | | (0.60 | ) |
| | | | | | | | | | | | | | | | | | | | |
| | | | | |
Net asset value at end of period | | $ | 14.07 | | | | | | | $ | 12.21 | | | $ | 13.18 | | | $ | 12.18 | |
| | | | | | | | | | | | | | | | | | | | |
| | | | | |
Total investment return (b) | | | 15.97 | % | | | | | | | (2.59 | %) | | | 11.60 | % | | | 10.01 | % |
| | | | | |
| Ratios (to average net assets)/Supplemental Data: | | | | | | | | | | | | | | | | | | | | |
| | | | | |
Net investment income (loss) | | | 0.68 | %†† | | | | | | | 0.88 | % | | | 1.05 | % | | | 1.33 | %†† |
| | | | | |
Net expenses (c) | | | 0.96 | %†† | | | | | | | 0.96 | % | | | 0.97 | % | | | 1.00 | %†† |
| | | | | |
Portfolio turnover rate | | | 11 | % | | | | | | | 43 | % | | | 34 | % | | | 39 | % |
| | | | | |
Net assets at end of period (in 000’s) | | $ | 6,647 | | | | | | | $ | 3,016 | | | $ | 2,179 | | | $ | 797 | |
| (a) | Per share data based on average shares outstanding during the period. |
| (b) | Total return does not reflect any deduction of sales charges, mortality and expense charges, contract charges or administrative charges. For periods of less than one year, total return is not annualized. |
| (c) | In addition to the fees and expenses which the Portfolio bears directly, it also indirectly bears a pro-rata share of the fees and expenses of the underlying funds in which it invests. Such indirect expenses are not included in the above expense ratios. |
| | | | | | |
The notes to the financial statements are an integral part of,
and should be read in conjunction with, the financial statements. | | | | | 19 | |
Notes to Financial Statements(Unaudited)
Note 1–Organization and Business
MainStay VP Funds Trust (the “Fund”) was organized as a Delaware statutory trust on February 1, 2011. The Fund is registered under the Investment Company Act of 1940, as amended (the “1940 Act”), as an open-end management investment company. The Fund is comprised of thirty-one separate series (collectively referred to as the “Portfolios”). These financial statements and notes relate to the MainStay VP MacKay Convertible Portfolio (the “Portfolio”), a “diversified” portfolio, as that term is defined in the 1940 Act, as interpreted or modified by regulatory authorities having jurisdiction, from time to time.
Shares of the Portfolio are currently offered to certain separate accounts to fund variable annuity policies and variable universal life insurance policies issued by New York Life Insurance and Annuity Corporation (“NYLIAC”), awholly-owned subsidiary of New York Life Insurance Company (“New York Life”) and may also be offered to fund variable annuity policies and variable universal life insurance policies issued by other insurance companies. NYLIAC allocates shares of the Portfolios to, among others, certain NYLIAC separate accounts. Service 2 Class shares of the Portfolio are currently offered to certain separate accounts to fund variable annuity policies and variable universal life insurance policies issued by participating insurance companies. Shares of the Portfolio are also offered to the MainStay VP Conservative Allocation Portfolio, MainStay VP Moderate Allocation Portfolio, MainStay VP Moderate Growth Allocation Portfolio and MainStay VP Growth Allocation Portfolio, which operate as “funds-of-funds.”
The Portfolio currently offers three classes of shares. Initial Class shares commenced operations on October 1, 1996. Service Class shares commenced operations on June 5, 2003. Service 2 Class shares commenced operations on April 26, 2016. Shares of the Portfolio are offered and are redeemed at a price equal to their respective net asset value (“NAV”) per share. No sales or redemption charge is applicable to the purchase or redemption of the Portfolio’s shares. Under the terms of the Fund’s multiple class plan adopted pursuant to Rule 18f-3 under the 1940 Act, the classes differ in that, among other things, Service Class and Service 2 Class shares of the Portfolio pay a combined distribution and service fee of 0.25% of average daily net assets attributable to Service Class and Service 2 Class shares of the Portfolio to the Distributor (as defined in Note 3(B)) pursuant to a plan adopted in accordance with Rule 12b-1 under the 1940 Act. Contract owners of variable annuity contracts purchased after June 2, 2003, are permitted to invest only in the Service Class and Service 2 Class shares.
The Portfolio’s investment objective is to seek capital appreciation together with current income.
Note 2–Significant Accounting Policies
The Portfolio is an investment company and accordingly follows the investment company accounting and reporting guidance of the Financial Accounting Standards Board (“FASB”) Accounting Standard CodificationTopic 946 Financial Services—Investment Companies. The Portfolio prepares its financial statements in accordance with generally accepted accounting principles (“GAAP”) in the United States of America and follows the significant accounting policies described below.
(A) Securities Valuation. Investments are usually valued as of the close of regular trading on the New York Stock Exchange (the
“Exchange”) (usually 4:00 p.m. Eastern time) on each day the Portfolio is open for business (“valuation date”).
The Board of Trustees of the Fund (the “Board”) adopted procedures establishing methodologies for the valuation of the Portfolio’s securities and other assets and delegated the responsibility for valuation determinations under those procedures to the Valuation Committee of the Fund (the “Valuation Committee”). The Board authorized the Valuation Committee to appoint a Valuation Subcommittee (the “Subcommittee”) to deal in the first instance with establishing the prices of securities for which market quotations are not readily available or the prices of which are not otherwise readily determinable under these procedures. The Subcommittee meets (in person, via electronic mail or via teleconference) on an as-needed basis. Subsequently, the Valuation Committee meets to ensure that actions taken by the Subcommittee were appropriate. The procedures state that, subject to the oversight of the Board and unless otherwise noted, the responsibility for theday-to-day valuation of portfolio assets (including fair value measurements for the Portfolio’s assets and liabilities) rests with New York Life Investment Management LLC (“New York Life Investments” or the “Manager”), aided to whatever extent necessary by the Subadvisor (as defined in Note 3(A)).
To assess the appropriateness of security valuations, the Manager, the Subadvisor or the Portfolio’s third-party service provider, who is subject to oversight by the Manager, regularly compares prior day prices, prices on comparable securities and the sale prices to the prior and current day prices and challenges prices with changes exceeding certain tolerance levels with third-party pricing services or broker sources. For those securities valued through either a standardized fair valuation methodology or a fair valuation measurement, the Subcommittee deals in the first instance with such valuation and the Valuation Committee reviews and affirms, if appropriate, the reasonableness of the valuation based on such methodologies and measurements on a regular basis after considering information that is reasonably available and deemed relevant by the Valuation Committee. Any action taken by the Subcommittee with respect to the valuation of a portfolio security or other asset is submitted for review and ratification (if appropriate) to the Valuation Committee and the Board at the next regularly scheduled meeting.
“Fair value” is defined as the price the Portfolio would reasonably expect to receive upon selling an asset or liability in an orderly transaction to an independent buyer in the principal or most advantageous market for the asset or liability. Fair value measurements are determined within a framework that establishes a three-tier hierarchy which maximizes the use of observable market data and minimizes the use of unobservable inputs to establish a classification of fair value measurements for disclosure purposes. “Inputs” refer broadly to the assumptions that market participants would use in pricing the asset or liability, including assumptions about risk, such as the risk inherent in a particular valuation technique used to measure fair value using a pricing model and/or the risk inherent in the inputs for the valuation technique. Inputs may be observable or unobservable. Observable inputs reflect the assumptions market participants would use in pricing the asset or liability based on market data obtained from sources independent of the Portfolio. Unobservable inputs reflect the Portfolio’s own assumptions about the assumptions market participants would use in pricing the asset or liability based on the information available. The inputs or methodology
| | |
| 20 | | MainStay VP MacKay Convertible Portfolio |
used for valuing assets or liabilities may not be an indication of the risks associated with investing in those assets or liabilities. The three-tier hierarchy of inputs is summarized below.
| • | | Level 1—quoted prices in active markets for an identical asset or liability |
| • | | Level 2—other significant observable inputs (including quoted prices for a similar asset or liability in active markets, interest rates and yield curves, prepayment speeds, credit risk, etc.) |
| • | | Level 3—significant unobservable inputs (including the Portfolio’s own assumptions about the assumptions that market participants would use in measuring fair value of an asset or liability) |
The level of an asset or liability within the fair value hierarchy is based on the lowest level of an input, both individually and in the aggregate, that is significant to the fair value measurement. As of June 30, 2019, the aggregate value by input level of the Portfolio’s assets and liabilities is included at the end of the Portfolio’s Portfolio of Investments.
The Portfolio may use third party vendor evaluations, whose prices may be derived from one or more of the following standard inputs, among others:
| | |
• Benchmark yields | | • Reported trades |
• Broker/dealer quotes | | • Issuer spreads |
• Two-sided markets | | • Benchmark securities |
• Bids/offers | | • Reference data (corporate actions or material event notices) |
• Industry and economic events | | • Comparable bonds |
• Monthly payment information | | |
An asset or liability for which market values cannot be measured using the methodologies described above is valued by methods deemed reasonable in good faith by the Valuation Committee, following the procedures established by the Board, to represent fair value. Under these procedures, the Portfolio generally uses a market-based approach which may use related or comparable assets or liabilities, recent transactions, market multiples, book values and other relevant information. The Portfolio may also use an income-based valuation approach in which the anticipated future cash flows of the asset or liability are discounted to calculate fair value. Discounts may also be applied due to the nature and/or duration of any restrictions on the disposition of the asset or liability. Fair value represents a good faith approximation of the value of a security. Fair value determinations involve the consideration of a number of subjective factors, an analysis of applicable facts and circumstances and the exercise of judgment. As a result, it is possible that the fair value for a security determined in good faith in accordance with the Portfolio’s valuation procedures may differ from valuations for the same security determined by other funds using their own valuation procedures. Although the Portfolio’s valuation procedures are designed to value a security at the price the Portfolio may reasonably expect to receive upon the security’s sale in an orderly transaction, there can be no assurance that any fair value determination thereunder would, in fact, approximate the amount that the Portfolio would actually realize upon the sale of the security or the price at which the security would trade if a reliable market price were readily available. During the
six-month period ended June 30, 2019, there were no material changes to the fair value methodologies.
Securities which may be valued in this manner include, but are not limited to: (i) a security for which trading has been halted or suspended; (ii) a debt security that has recently gone into default and for which there is not a current market quotation; (iii) a security of an issuer that has entered into a restructuring; (iv) a security that has been delisted from a national exchange; (v) a security for which the market price is not readily available from a third-party pricing source or, if so provided, does not, in the opinion of the Manager or the Subadvisor, reflect the security’s market value; (vi) a security subject to trading collars for which no or limited trading takes place; and (vii) a security whose principal market has been temporarily closed at a time when, under normal conditions, it would be open. Securities valued in this manner are generally categorized as Level 3 in the hierarchy. As of June 30, 2019, securities that were fair valued in such a manner are shown in the Portfolio of Investments.
Equity securities are valued at the last quoted sales prices as of the close of regular trading on the relevant exchange on each valuation date. Securities that are not traded on the valuation date are valued at the mean of the last quoted bid and ask prices. Prices are normally taken from the principal market in which each security trades. These securities are generally categorized as Level 1 in the hierarchy.
Investments in mutual funds, including money market funds, are valued at their respective NAVs as of the close of the Exchange on the valuation date. These securities are generally categorized as Level 1 in the hierarchy.
Debt securities (other than convertible and municipal bonds) are valued at the evaluated bid prices (evaluated mean prices in the case of convertible and municipal bonds) supplied by a pricing agent or brokers selected by the Manager, in consultation with the Subadvisor. The evaluations are market-based measurements processed through a pricing application and represents the pricing agent’s good faith determination as to what a holder may receive in an orderly transaction under market conditions. The rules based logic utilizes valuation techniques that reflect participants’ assumptions and vary by asset class and per methodology, maximizing the use of relevant observable data including quoted prices for similar assets, benchmark yield curves and market corroborated inputs. The evaluated bid or mean prices are deemed by the Manager, in consultation with the Subadvisor, to be representative of market values at the regular close of trading of the Exchange on each valuation date. Debt securities purchased on a delayed delivery basis are marked to market daily until settlement at the forward settlement date. Debt securities, including corporate bonds, U.S. government and federal agency bonds, municipal bonds, foreign bonds, convertible bonds, asset-backed securities and mortgage-backed securities are generally categorized as Level 2 in the hierarchy.
Temporary cash investments acquired in excess of 60 days to maturity at the time of purchase are valued using the latest bid prices or using valuations based on a matrix system (which considers such factors as security prices, yields, maturities and ratings), both as furnished by independent pricing services. Other temporary cash investments which mature in 60 days or less at the time of purchase (“Short-Term Investments”) are valued using the amortized cost method of valuation,
Notes to Financial Statements(Unaudited) (continued)
unless the use of such method would be inappropriate. The amortized cost method involves valuing a security at its cost on the date of purchase and thereafter assuming a constant amortization to maturity of the difference between such cost and the value on maturity date. Amortized cost approximates the current fair value of a security. Securities valued using the amortized cost method are not valued using quoted prices in an active market and are generally categorized as Level 2 in the hierarchy.
The information above is not intended to reflect an exhaustive list of the methodologies that may be used to value portfolio investments. The valuation procedures permit the use of a variety of valuation methodologies in connection with valuing portfolio investments. The methodology used for a specific type of investment may vary based on the market data available or other considerations. The methodologies summarized above may not represent the specific means by which portfolio investments are valued on any particular business day.
(B) Income Taxes. The Portfolio’s policy is to comply with the requirements of the Internal Revenue Code of 1986, as amended (the “Internal Revenue Code”), applicable to regulated investment companies and to distribute all of its taxable income to the shareholders of the Portfolio within the allowable time limits. Therefore, no federal, state and local income tax provisions are required.
Management evaluates the Portfolio’s tax positions to determine if the tax positions taken meet the minimum recognition threshold in connection with accounting for uncertainties in income tax positions taken or expected to be taken for the purposes of measuring and recognizing tax liabilities in the financial statements. Recognition of tax benefits of an uncertain tax position is permitted only to the extent the position is “more likely than not” to be sustained assuming examination by taxing authorities. Management has analyzed the Portfolio’s tax positions taken on federal, state and local income tax returns for all open tax years (for up to three tax years) and has concluded that no provisions for federal, state and local income tax are required in the Portfolio’s financial statements. The Portfolio’s federal, state and local income tax and federal excise tax returns for tax years for which the applicable statutes of limitations have not expired are subject to examination by the Internal Revenue Service and state and local departments of revenue.
(C) Dividends and Distributions to Shareholders. Dividends and distributions are recorded on the ex-dividend date. The Portfolio intends to declare and pay dividends from net investment income, if any, at least quarterly and distributions from net realized capital and currency gains, if any, at least annually. Unless the shareholder elects otherwise, all dividends and distributions are reinvested in the same class of shares of the Portfolio, at NAV. Dividends and distributions to shareholders are determined in accordance with federal income tax regulations and may differ from determinations using GAAP.
(D) Security Transactions and Investment Income. The Portfolio records security transactions on the trade date. Realized gains and losses on security transactions are determined using the identified cost method. Dividend income is recognized on the ex-dividend date; net of any foreign tax withheld at the source, and interest income is accrued as earned using the effective interest rate method. Discounts and premiums on securities purchased for the Portfolio are accreted and amortized, respectively, on the effective interest rate method over the life of the respective securities.
Investment income and realized and unrealized gains and losses on investments of the Portfolio are allocated pro rata to the separate classes of shares based upon their relative net assets on the date the income is earned or realized and unrealized gains and losses are incurred.
The Portfolio may place a debt security on non-accrual status and reduce related interest income by ceasing current accruals and writing off all or a portion of any interest receivables when the collection of all or a portion of such interest has become doubtful. A debt security is removed from non-accrual status when the issuer resumes interest payments or when collectability of interest is reasonably assured.
(E) Expenses. Expenses of the Fund are allocated to the individual Portfolios in proportion to the net assets of the respective Portfolios when the expenses are incurred, except where direct allocations of expenses can be made. Expenses (other than fees incurred under the distribution and service plans and shareholder service plans, further discussed in Note 3(B), which are charged directly to the Service Class shares and Service 2 Class shares, as applicable) are allocated to separate classes of shares pro rata based upon their relative net assets on the date the expenses are incurred. The expenses borne by the Portfolio, including those of related parties to the Portfolio, are shown in the Statement of Operations.
Additionally, the Portfolio may invest in mutual funds, which are subject to management fees and other fees that may cause the costs of investing in mutual funds to be greater than the costs of owning the underlying securities directly. These indirect expenses of mutual funds are not included in the amounts shown as expenses in the Portfolio’s Statement of Operations or in the expense ratios included in the Financial Highlights.
(F) Use of Estimates. In preparing financial statements in conformity with GAAP, management makes estimates and assumptions that affect the reported amounts and disclosures in the financial statements. Actual results could differ from those estimates.
(G) Repurchase Agreements. The Portfolio may enter into repurchase agreements (i.e., buy a security from another party with the agreement that it be sold back in the future) to earn income. The Portfolio may enter into repurchase agreements only with counterparties, usually financial institutions, that are deemed by the Manager or the Subadvisor to be creditworthy, pursuant to guidelines established by the Board. During the term of any repurchase agreement, the Manager or the Subadvisor will continue to monitor the creditworthiness of the counterparty. Under the 1940 Act, repurchase agreements are considered to be collateralized loans by the Portfolio to the counterparty secured by the securities transferred to the Portfolio.
Repurchase agreements are subject to counterparty risk, meaning the Portfolio could lose money by the counterparty’s failure to perform under the terms of the agreement. The Portfolio mitigates this risk by ensuring the repurchase agreement is collateralized by cash, U.S. government securities, fixed income securities and/or other securities. The collateral is held by the Portfolio’s custodian and valued daily on a mark to market basis to determine if the value, including accrued interest, exceeds the repurchase price. In the event of the counterparty’s default on the obligation to repurchase, the Portfolio has the right to liquidate the collateral and apply the proceeds in satisfaction
| | |
| 22 | | MainStay VP MacKay Convertible Portfolio |
of the obligation. Under certain circumstances, such as in the event of default or bankruptcy by the counterparty, realization and/or retention of the collateral may be limited or subject to delay, to legal proceedings and possible realized loss to the Portfolio. As of June 30, 2019, the Portfolio did not hold any repurchase agreements.
(H) Securities Lending. In order to realize additional income, the Portfolio may engage in securities lending, subject to the limitations set forth in the 1940 Act and relevant guidance by the staff of the Securities and Exchange Commission (“SEC”). In the event the Portfolio does engage in securities lending, the Portfolio will lend through its custodian, State Street Bank and Trust Company (“State Street”), acting as securities lending agent on behalf of the Portfolio. State Street will manage the Portfolio’s collateral in accordance with the securities lending agency agreement between the Portfolio and State Street, and indemnify the Portfolio against counterparty risk. The loans will be collateralized by cash (which may be invested in a money market fund) and/ornon-cash collateral (which may include, U.S. Treasury securities and/or U.S. Government Agency securities issued or guaranteed by the United States government or its agencies or instrumentalities) at least equal at all times to the market value of the securities loaned. The Portfolio may bear the risk of delay in recovery of, or loss of rights in, the securities loaned should the borrower of the securities experience financial difficulty. The Portfolio may also record a realized gain or loss on securities deemed sold due to a borrower’s inability to return securities on loan. The Portfolio bears the risk of any loss on investment of cash collateral. The Portfolio will receive compensation for lending its securities in the form of fees or it will retain a portion of interest on the investment of any cash collateral. The Portfolio will also continue to receive interest and dividends on the securities loaned and any gain or loss in the market price of the securities loaned that may occur during the term of the loan will be for the account of the Portfolio. Income earned from securities lending activities, if any, is reflected in the Statement of Operations. As of June 30, 2019, the Portfolio had securities on loan with an aggregate market value of $53,745,326; the total market value of collateral held by the Portfolio was $54,355,973. The market value of the collateral held includednon-cash collateral in the form of U.S. Treasury securities with a value of $6,390,618 and cash collateral which was invested into the State Street Navigator Securities Lending Government Money Market Portfolio with a value of $47,965,355.
(I) Convertible Securities Risk. Convertible securities may be subordinate to other securities. In part, the total return for a convertible security depends upon the performance of the underlying stock into which it can be converted. Also, issuers of convertible securities are often not as strong financially as those issuing securities with higher credit ratings, are more likely to encounter financial difficulties and typically are more vulnerable to changes in the economy, such as a recession or a sustained period of rising interest rates, which could affect their ability to make interest and principal payments.
(J) Indemnifications. Under the Fund’s organizational documents, its officers and trustees are indemnified against certain liabilities that may arise out of performance of their duties to the Fund. Additionally, in the normal course of business, the Portfolio enters into contracts with third-party service providers that contain a variety of representations and warranties and which may provide general indemnifications. The
Portfolio’s maximum exposure under these arrangements is unknown, as this would involve future claims that may be made against the Portfolio that have not yet occurred. Based on experience, management is of the view that the risk of loss in connection with these potential indemnification obligations is remote. However, there can be no assurance that material liabilities related to such obligations will not arise in the future, which could adversely impact the Portfolio.
Note 3–Fees and Related Party Transactions
(A) Manager and Subadvisor. New York Life Investments, a registered investment adviser and an indirect,wholly-owned subsidiary of New York Life, serves as the Portfolio’s Manager pursuant to an Amended and Restated Management Agreement (“Management Agreement”). The Manager provides offices, conducts clerical, recordkeeping and bookkeeping services, and keeps most of the financial and accounting records required to be maintained by the Portfolio. Except for the portion of salaries and expenses that are the responsibility of the Portfolio, the Manager pays the salaries and expenses of all personnel affiliated with the Portfolio and certain operational expenses of the Portfolio. The Portfolio reimburses New York Life Investments in an amount equal to a portion of the compensation of the Chief Compliance Officer attributable to the Portfolio. MacKay Shields LLC (“MacKay Shields” or “Subadvisor”), a registered investment adviser and an indirect,wholly-owned subsidiary of New York Life, serves as Subadvisor to the Portfolio and is responsible for theday-to-day portfolio management of the Portfolio. Pursuant to the terms of an Amended and Restated Subadvisory Agreement (“Subadvisory Agreement”) between New York Life Investments and MacKay Shields, New York Life Investments pays for the services of the Subadvisor.
Effective May 1, 2019, the Fund, on behalf of the Portfolio, pays New York Life Investments in its capacity as the Portfolio’s investment manager and administrator, pursuant to the Management Agreement, a monthly fee for the services performed and the facilities furnished at an annual rate of the Portfolio’s average daily net assets as follows: 0.60% up to $500 million; 0.55% from $500 million to $1 billion; 0.50% from $1 billion to $2 billion; and 0.49% in excess of $2 billion. Prior to May 1, 2019, the Fund paid New York Life Investments in its capacity as the Portfolio’s investment manager and administrator, pursuant to the Management Agreement, a monthly fee for the services performed and the facilities furnished at an annual rate of the Portfolio’s average daily net assets as follows: 0.60% up to $500 million; 0.55% from $500 million to $1 billion; and 0.50% in excess of $1 billion. During the six-month period ended June 30, 2019, the effective management fee rate was 0.58%.
During the six-month period ended June 30, 2019, New York Life Investments earned fees from the Portfolio in the amount of $2,475,508, and paid the Subadvisor in the amount of $1,237,754.
State Street providessub-administration andsub-accounting services to the Portfolio pursuant to an agreement with New York Life Investments. These services include calculating the daily NAVs of the Portfolio, maintaining the general ledger andsub-ledger accounts for the calculation of the Portfolio’s NAVs and assisting New York Life Investments in
conducting various aspects of the Portfolio’s administrative operations. For providing these services to the Portfolio, State Street is compensated by New York Life Investments.
Notes to Financial Statements(Unaudited) (continued)
Pursuant to an agreement between the Fund and New York Life Investments, New York Life Investments is responsible for providing or procuring certain regulatory reporting services for the Portfolio. The Portfolio will reimburse New York Life Investments for the actual costs incurred by New York Life Investments in connection with providing or procuring these services for the Portfolio.
(B) Distribution, Service and Shareholder Service Fees. The Fund, on behalf of the Portfolio, has entered into a distribution agreement with NYLIFE Distributors LLC (the “Distributor”), an indirect,wholly-owned subsidiary of New York Life. The Portfolio has adopted a distribution plan (the “Plan”) in accordance with the provisions of Rule 12b-1 under the 1940 Act. Under the Plan, the Distributor has agreed to provide, through its affiliates or independent third parties, various distribution-related, shareholder and administrative support services to the Service Class and Service 2 Class shareholders. For its services, the Distributor is entitled to a combined distribution and service fee accrued daily and paid monthly at an annual rate of 0.25% of the average daily net assets attributable to the Service Class and Service 2 Class shares of the Portfolio.
The Board has adopted a shareholder services plan (the “Service Plan”) with respect to the Service 2 Class shares of the Portfolio. Under the
terms of the Services Plan, the Portfolio is authorized to pay to New York Life Investments, its affiliates or independent third-party service providers, as compensation for services rendered to shareholders of the Service 2 Class shares, in connection with the administration of plans or programs that use Portfolio shares as their funding medium a shareholder servicing fee at the rate of 0.10% on an annualized basis of the average daily net assets of the Service 2 Class shares.
(C) Transfer and Dividend Disbursing Agent. NYLIM Service Company LLC, an affiliate of New York Life Investments, serves as the transfer agent and dividend disbursing agent for the Service 2 Class shares of the Portfolio. NYLIM Service Company LLC has entered into an agreement with DST Asset Manager Solutions, Inc. (“DST”), pursuant to which DST performs certain transfer agent services on behalf of NYLIM Service Company LLC. During the six-month period ended June 30, 2019, all associated fees were paid by the Manager.
(D) Investments in Affiliates (in 000’s). During the six-month period ended June 30, 2019, purchases and sales transactions, income earned from investments and shares held of investment companies managed by New York Life Investments or its affiliates were as follows:
| | | | | | | | | | | | | | | | | | | | | | | | | | | | | | | | | | | | |
Affiliated Investment
Company | | Value,
Beginning of
Period | | | Purchases at
Cost | | | Proceeds
from
Sales | | | Net
Realized
Gain/
(Loss)
on Sales | | | Change in
Unrealized
Appreciation/
(Depreciation) | | | Value,
End of
Period | | | Dividend
Income | | | Other
Distributions | | | Shares
End of
Period | |
MainStay U.S. Government Liquidity Fund | | $ | 32,141 | | | $ | 86,987 | | | $ | (78,773 | ) | | $ | — | | | $ | — | | | $ | 40,355 | | | $ | 553 | | | $ | — | | | | 40,355 | |
Note 4–Federal Income Tax
As of June 30, 2019, the cost and unrealized appreciation (depreciation) of the Portfolio’s investment portfolio, including applicable derivative contracts and other financial instruments, as determined on a federal income tax basis, were as follows:
| | | | | | | | | | | | | | | | |
| | | Federal
Tax
Cost | | | Gross
Unrealized
Appreciation | | | Gross
Unrealized
(Depreciation) | | | Net
Unrealized
Appreciation/
(Depreciation) | |
| | | | |
Investments in Securities | | $ | 835,560,450 | | | $ | 156,091,179 | | | $ | (40,547,749 | ) | | $ | 115,543,430 | |
During the year ended December 31, 2018, the tax character of distributions paid as reflected in the Statements of Changes in Net Assets was as follows:
| | | | |
|
| 2018 | |
Tax-Based
Distributions
from Ordinary
Income | | Tax-Based
Distributions
from Long-Term
Gains | |
| $15,200,280 | | $ | 27,421,810 | |
Note 5–Restricted Security
Restricted securities, are securities which have been purchased through a private offering and cannot be resold to the general public without
prior registration under the Securities Act of 1933, as amended. Disposal of these securities may involve time-consuming negotiations and expenses, and it may be difficult to obtain a prompt sale at an acceptable price.
As of June 30, 2019, the Fund held the following restricted securities:
| | | | | | | | | | | | | | | | | | | | |
Security | | Date of
Acquisition | | | Shares/
Principal
Amount | | | Cost | | | 6/30/19
Value | | | Percent
of Net
Assets | |
| | | | | |
At Home Corp
Convertible Bonds 4.75%, due 12/15/06 | | | 5/4/01 | | | | 2,640,000 | | | | — | | | | 34,320 | | | | 0.0 | %‡ |
| ‡ | Less than one-tenth of a percent. |
Note 6–Custodian
State Street is the custodian of cash and securities held by the Portfolio. Custodial fees are charged to the Portfolio based on the Portfolio’s net assets and/or the market value of securities held by the Portfolio and the number of certain transactions incurred by the Portfolio.
Note 7–Line of Credit
The Portfolio and certain other funds managed by New York Life Investments maintain a line of credit with a syndicate of banks in order to secure a source of funds for temporary purposes to meet unanticipated or excessive redemption requests.
| | |
| 24 | | MainStay VP MacKay Convertible Portfolio |
Effective July 30, 2019, under the credit agreement (the “Credit Agreement”), the aggregate commitment amount is $600,000,000 with an additional uncommitted amount of $100,000,000. The commitment fee is an annual rate of 0.15% of the average commitment amount payable quarterly, regardless of usage, to State Street, who serves as the agent to the syndicate. The commitment fee is allocated among the Portfolio and certain other funds managed by New York Life Investments based upon their respective net assets and other factors. Interest on any revolving credit loan is charged based upon the Federal Funds Rate or the one-month London Interbank Offered Rate (“LIBOR”), whichever is higher. The Credit Agreement expires on July 28, 2020, although the Portfolio, certain other funds managed by New York Life Investments and the syndicate of banks may renew the Credit Agreement for an additional year on the same or different terms. Prior to July 30, 2019, the aggregate commitment amount and the commitment fee were the same as those under the current Credit Agreement. During the six-month period ended June 30, 2019, there were no borrowings made or outstanding with respect to the Portfolio under the Credit Agreement.
Note 8–Interfund Lending Program
Pursuant to an exemptive order issued by the SEC, the Portfolio, along with certain other funds managed by New York Life Investments, may participate in an interfund lending program. The interfund lending program provides an alternative credit facility that permits the Portfolio and certain other funds managed by New York Life Investments to lend or borrow money for temporary purposes directly to or from one another subject to the conditions of the exemptive order. During the six-month period ended June 30, 2019, there were no interfund loans made or outstanding with respect to the Portfolio.
Note 9–Purchases and Sales of Securities (in 000’s)
During the six-month period ended June 30, 2019, purchases and sales of securities, other thanshort-term securities, were $97,367 and $92,945, respectively.
Note 10–Capital Share Transactions
Transactions in capital shares for the six-month period ended June 30, 2019 and the year ended December 31, 2018, were as follows:
| | | | | | | | |
Initial Class | | Shares | | | Amount | |
| | |
Six-month period ended June 30, 2019: | | | | | | | | |
Shares sold | | | 237,097 | | | $ | 3,242,801 | |
Shares issued to shareholders in reinvestment of dividends and distributions | | | 105,774 | | | | 1,466,326 | |
Shares redeemed | | | (881,931 | ) | | | (12,034,543 | ) |
| | | | |
Net increase (decrease) | | | (539,060 | ) | | $ | (7,325,416 | ) |
| | | | |
Year ended December 31, 2018: | | | | | | | | |
Shares sold | | | 532,691 | | | $ | 7,345,452 | |
Shares issued to shareholders in reinvestment of dividends and distributions | | | 780,017 | | | | 10,585,861 | |
Shares redeemed | | | (4,033,632 | ) | | | (55,826,634 | ) |
| | | | |
Net increase (decrease) | | | (2,720,924 | ) | | $ | (37,895,321 | ) |
| | | | |
| | |
| | | | | | | | |
| | | | | | | | |
Service Class | | Shares | | | Amount | |
| | |
Six-month period ended June 30, 2019: | | | | | | | | |
Shares sold | | | 4,118,218 | | | $ | 55,666,553 | |
Shares issued to shareholders in reinvestment of dividends and distributions | | | 315,869 | | | | 4,335,401 | |
Shares redeemed | | | (3,267,105 | ) | | | (44,305,524 | ) |
| | | | |
Net increase (decrease) | | | 1,166,982 | | | $ | 15,696,430 | |
| | | | |
Year ended December 31, 2018: | | | | | | | | |
Shares sold | | | 9,092,375 | | | $ | 123,686,878 | |
Shares issued to shareholders in reinvestment of dividends and distributions | | | 2,366,938 | | | | 31,875,069 | |
Shares redeemed | | | (5,859,020 | ) | | | (78,465,159 | ) |
| | | | |
Net increase (decrease) | | | 5,600,293 | | | $ | 77,096,788 | |
| | | | |
| | |
| | | | | | | | |
Service 2 Class | | Shares | | | Amount | |
| | |
Six-month period ended June 30, 2019: | | | | | | | | |
Shares sold | | | 252,201 | | | $ | 3,484,215 | |
Shares issued to shareholders in reinvestment of dividends and distributions | | | 1,876 | | | | 25,834 | |
Shares redeemed | | | (28,789 | ) | | | (393,611 | ) |
| | | | |
Net increase (decrease) | | | 225,288 | | | $ | 3,116,438 | |
| | | | |
Year ended December 31, 2018: | | | | | | | | |
Shares sold | | | 109,084 | | | $ | 1,494,133 | |
Shares issued to shareholders in reinvestment of dividends and distributions | | | 11,963 | | | | 161,160 | |
Shares redeemed | | | (39,365 | ) | | | (519,070 | ) |
| | | | |
Net increase (decrease) | | | 81,682 | | | $ | 1,136,223 | |
| | | | |
Note 11–Recent Accounting Pronouncement
To improve the effectiveness of fair value disclosure requirements, the Financial Accounting Standards Board recently issued Accounting Standard Update (ASU)2018-13, Fair Value Measurement Disclosure Framework—Changes to the Disclosure Requirements for Fair Value Measurement (ASU2018-13), which adds, removes, and modifies certain aspects relating to fair value disclosure. ASU2018-13 is effective for interim and annual reporting periods beginning after December 15, 2019; early adoption of the additions relating toASU 2018-13 is not required. Management has evaluated the implications of certain other provisions of the ASU and has determined to early adopt aspects related to the removal and modifications of certain fair value measurement disclosures under the ASU effective immediately. At this time, management is evaluating the implications of certain other provisions of the ASU related to new disclosure requirements and any impact on the financial statement disclosures has not yet been determined.
Note 12–Subsequent Events
In connection with the preparation of the financial statements of the Portfolio as of and for the six-month period ended June 30, 2019, events and transactions subsequent to June 30, 2019, through the date the financial statements were issued have been evaluated by the Portfolio’s management for possible adjustment and/or disclosure. No subsequent events requiring financial statement adjustment or disclosure have been identified.
Proxy Voting Policies and Procedures and Proxy Voting Record
A description of the policies and procedures that New York Life Investments uses to vote proxies related to the Portfolio’s securities is available without charge, upon request (i) by calling800-598-2019; (ii) by visiting New York Life Investments website at https://www.nylinvestments.com/mainstay/products-and-performance/mainstay-vp-funds-trust; or (iii) by visiting the SEC’s website at www.sec.gov.
The Portfolio is required to file with the SEC its proxy voting record for the12-month period ending June 30 on Form N-PX. The Portfolio’s most recent Form N-PX or proxy voting record is available free of charge upon request (i) by calling800-598-2019; (ii) by visiting New York Life Investments website at https://www.nylinvestments.com/mainstay/products-and-performance/mainstay-vp-funds-trust; or (iii) by visiting the SEC’s website atwww.sec.gov.
Shareholder Reports and Quarterly Portfolio Disclosure
The Portfolio is required to file its complete schedule of portfolio holdings with the SEC 60 days after each fiscal quarter onForm N-PORT. The Portfolio’s holdings report is available without charge upon request (i) by calling800-598-2019; (ii) by visiting New York Life Investments website at https://www.nylinvestments.com/mainstay/products-and-performance/mainstay-vp-funds-trust; or (iii) on the SEC’s website at www.sec.gov.
| | |
| 26 | | MainStay VP MacKay Convertible Portfolio |
MainStay VP Portfolios
MainStay VP offers a wide range of Portfolios. The full array of MainStay VP offerings is listed here, with information about the manager, subadvisors, legal counsel, and independent registered public accounting firm.
Equity Portfolios
MainStay VP Eagle Small Cap Growth Portfolio
MainStay VP Emerging Markets Equity Portfolio
MainStay VP Epoch U.S. Equity Yield Portfolio
MainStay VP Fidelity Institutional AM® Utilities Portfolio†
MainStay VP Large Cap Growth Portfolio
MainStay VP MacKay Common Stock Portfolio
MainStay VP MacKay Growth Portfolio
MainStay VP MacKay International Equity Portfolio
MainStay VP MacKay Mid Cap Core Portfolio
MainStay VP MacKay S&P 500 Index Portfolio
MainStay VP MacKay Small Cap Core Portfolio
MainStay VP Mellon Natural Resources Portfolio
MainStay VP T. Rowe Price Equity Income Portfolio
Mixed Asset Portfolios
MainStay VP Balanced Portfolio
MainStay VP Income Builder Portfolio
MainStay VP Janus Henderson Balanced Portfolio
MainStay VP MacKay Convertible Portfolio
Income Portfolios
MainStay VP Bond Portfolio
MainStay VP Floating Rate Portfolio
MainStay VP Indexed Bond Portfolio
MainStay VP MacKay Government Portfolio
MainStay VP MacKay High Yield Corporate Bond Portfolio
MainStay VP MacKay Unconstrained Bond Portfolio
MainStay VP PIMCO Real Return Portfolio
Money Market
MainStay VP U.S. Government Money Market Portfolio
Alternative
MainStay VP Cushing Renaissance Advantage Portfolio
MainStay VP IQ Hedge Multi-Strategy Portfolio
Asset Allocation Portfolios
MainStay VP Conservative Allocation Portfolio
MainStay VP Growth Allocation Portfolio
MainStay VP Moderate Allocation Portfolio
MainStay VP Moderate Growth Allocation Portfolio
Manager
New York Life Investment Management LLC
New York, New York
Subadvisors
Candriam Belgium*
Brussels, Belgium
Cushing Asset Management, LP
Dallas, Texas
Eagle Asset Management, Inc.
St Petersburg, Florida
Epoch Investment Partners, Inc.
New York, New York
FIAM LLC
Smithfield, Rhode Island
IndexIQ Advisors LLC*
New York, New York
Janus Capital Management LLC
Denver, Colorado
MacKay Shields LLC*
New York, New York
Mellon Investments Corporation
Boston, Massachusetts
NYL Investors LLC*
New York, New York
Pacific Investment Management Company LLC
Newport Beach, California
T. Rowe Price Associates, Inc.
Baltimore, Maryland
Winslow Capital Management, LLC
Minneapolis, Minnesota
Distributor
NYLIFE Distributors LLC*
Jersey City, New Jersey
Custodian
State Street Bank and Trust Company
Boston, Massachusetts
Independent Registered Public Accounting Firm
PricewaterhouseCoopers LLP
New York, New York
Legal Counsel
Dechert LLP
Washington, District of Columbia
Some Portfolios may not be available in all products.
| † | Fidelity Institutional AM is a registered trade mark of FMR LLC. Used with permission. |
| * | An affiliate of New York Life Investment Management LLC |
Not part of the Semiannual Report
2019 Semiannual Report
This report is for the general information of policyowners of New York Life Variable Annuities and NYLIAC Variable Universal Life Insurance Products or policies issued by other insurance companies. It must be preceded or accompanied by the appropriate product(s) and funds prospectuses if it is given to anyone who is not an owner of a New York Life variable annuity policy or a NYLIAC Variable Universal Life Insurance Product. This report does not offer for sale or solicit orders to purchase securities.
The performance data quoted in this report represents past performance. Past performance is no guarantee of future results. Due to market volatility and other factors, current performance may be lower or higher than the figures shown. The most recent month-end performance summary for your New York Life Variable Annuities and NYLIAC Variable Universal Life Insurance Product is available by calling 800-598-2019 and is updated periodically on www.newyorklife.com.
The New York Life Variable Annuities and NYLIAC Variable Universal Life Insurance Products are issued by New York Life Insurance and Annuity Corporation (a Delaware Corporation) and distributed by NYLIFE Distributors LLC (Member FINRA/SIPC).
New York Life Insurance Company
New York Life Insurance and Annuity Corporation (NYLIAC) (A Delaware Corporation)
51 Madison Avenue, Room 551
New York, NY 10010
www.newyorklife.com
Printed on recycled paper
nylinvestments.com
NYLIFE Distributors LLC, 30 Hudson Street, Jersey City, NJ 07302
New York Life Investment Management LLC is the investment manager to the MainStay VP Funds Trust
©2019 by NYLIFE Distributors LLC. All rights reserved.
You may obtain copies of the Prospectus and the Statement of Additional Information free of charge, upon request, by callingtoll-free 800-598-2019 or writing to New York Life Insurance and Annuity Corporation, 51 Madison Avenue, New York, NY 10010.
| | | | |
| | | |
| Not FDIC Insured | | No Bank Guarantee | | May Lose Value |
| | | | |
| 1781608 | | | | MSVPC10-08/19 (NYLIAC) NI512 |
MainStay VP MacKay Growth Portfolio
Message from the President and Semiannual Report
Unaudited | June 30, 2019

Beginning on January 1, 2021, as permitted by regulations adopted by the Securities and Exchange Commission, paper copies of the MainStay VP Portfolio annual and semi-annual shareholder reports may no longer be sent by mail, unless you specifically request paper copies of the reports from the insurance company that offers your policy. Instead, the reports will be made available online, and you will be notified by mail each time a report is posted and provided with a website link to access the report. Instructions for requesting paper copies will be provided by your insurance company.
If you already elected to receive shareholder reports electronically, you will not be affected by this change and you need not take any action. At any time, you may elect to receive reports and other communications from the insurance company electronically by following the instructions provided by the insurance company.
You may elect to receive all future shareholder reports in paper form free of charge. You can inform the insurance company that you wish to receive paper copies of reports by following the instructions provided by the insurance company. Your election to receive reports in paper form will apply to all portfolio companies available under your contract.
| | | | | | | | |
| | | | | |
| Not FDIC/NCUA Insured | | Not a Deposit | | May Lose Value | | No Bank Guarantee | | Not Insured by Any Government Agency |

This page intentionally left blank
Message from the President
Most equity and fixed-income markets in the United States and around the world advanced in the face of conflicting political and macroeconomic forces during thesix-month period ended June 30, 2019.
The reporting period began on the heels of tumultuous December 2018, during which equities and equity-sensitive bonds spiked sharply lower on concerns regarding the pace of economic growth, a U.S. government shutdown and the potential impact of trade disputes between the United States and other nations, particularly China. Markets recovered quickly in early 2019 as trade tensions eased, the government reopened and the U.S. Federal Reserve Board (Fed) adopted a more patient tone regarding the future direction of interest rates. Markets moved broadly higher from January through April, supported by encouraging economic data and generally strong corporate earnings.
During the first four months of the reporting period, the improving economic environment encouraged investors to favor areas of the market viewed as offering greater return potential along with higher risks. Among U.S. stocks, cyclical, growth-oriented sectors tended to outperform more defensive, value-oriented sectors, whilelarge-cap stocks outperformed theirsmaller-cap counterparts. Within the S&P 500® Index, the information technology sector led the market’s advance, followed by communication services, consumer discretionary and consumer staples. Industrials, utilities, financials, materials, real estate and energy produced more modest gains. While some international equity markets outperformed or underperformed the U.S. market, on average international stocks mirrored the performance of their U.S. counterparts. Fixed-income securities gained ground as well, albeit along a more gradual trajectory. Among U.S. fixed-income instruments, corporate issues generally outperformed government bonds, with lower credit quality, higher yielding securities leading the sector’s advance. Long-term U.S. Treasury bond yields proved particularly weak, with
10-year yields dipping at times below3-month yields, reflecting investors’ continued concerns about domestic economic growth.
May 2019 saw a return of uncertainty and volatility. Trade discussions between the United States and China faltered, driving global equity prices lower. Government bond prices rose as investors sought safe havens. June brought yet anotherU-turn as equity prices climbed again after comments from the Fed raised hopes of an interest rate cut in response to weak economic data. Stock and bond prices rose, with U.S. equity markets ending the reporting period in record territory.
We are pleased to see renewed signs of strength in broad areas of the financial market. At the same time, we remained sharply focused on providing you, as a MainStay VP investor, with the experienced and disciplined fund management that we believe underpins an effective, long-term investment strategy. Whatever tomorrow’s investment environment brings, you can rely on our portfolio managers to pursue the objectives of their individual Portfolios as outlined in the prospectus with the energy and dedication you have come to expect.
The report that follows contains additional information on the market events, investment decisions and specific securities that shaped your VP Portfolio’s performance during the six months ended June 30, 2019. We encourage you to read the report carefully and use it to evaluate your Portfolio’s performance in light of your long-range financial plan.
Sincerely,

Kirk C. Lehneis
President
The opinions expressed are as of the date of this report and are subject to change. There is no guarantee that any forecast made will come to pass. This material does not constitute investment advice and is not intended as an endorsement of any specific investment. Past performance is no guarantee of future results.
Not part of the Semiannual Report
Table of Contents
Investors should refer to the Portfolio’s Summary Prospectus and/or Prospectus and consider the Portfolio’s investment objectives, strategies, risks, charges and expenses carefully before investing. The Summary Prospectus and/or Prospectus contain this and other information about the Portfolio. You may obtain copies of the Portfolio’s Summary Prospectus and/or the Prospectus and the Statement of Additional Information free of charge, upon request, by calling toll-free 800-598-2019, by writing to New York Life Insurance and Annuity Corporation, 51 Madison Avenue, Room 251, New York, New York 10010 or by sending an email to MainStayShareholdersServices@nylim.com. These documents are also available at nylinvestments.com/vpdocuments. Please read the Summary Prospectus and/or Prospectus carefully before investing. MainStay VP Funds Trust portfolios are separate account options which are purchased through a variable insurance or variable annuity contract.
Investment and Performance Comparison1(Unaudited)
Performance data quoted represents past performance. Past performance is no guarantee of future results. Because of market volatility and other factors, current performance may be lower or higher than the figures shown. Investment return and principal value will fluctuate, and as a result, when shares are redeemed, they may be worth more or less than their original cost. The performance table and graph do not reflect any deduction of sales charges, mortality and expense charges, contract charges or administrative charges. Please refer to the Performance Summary appropriate for your policy. For performance information current to the most recent month-end, please call800-598-2019 or visit www.newyorklife.com.
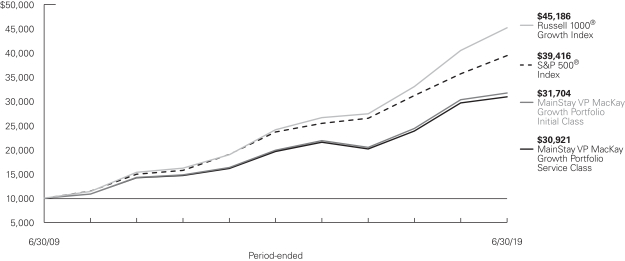
Average Annual Total Returns for the Period-Ended June 30, 2019
| | | | | | | | | | | | | | | | | | | | | | |
| Class | | Inception Date | | Six Months | | | One Year | | | Five Years | | | Ten Years | | | Gross
Expense
Ratio2 | |
| | | | | | |
| Initial Class Shares | | 1/29/1993 | | | 17.17 | % | | | 4.44 | % | | | 9.76 | % | | | 12.23 | % | | | 0.73 | % |
| Service Class Shares | | 6/5/2003 | | | 17.03 | | | | 4.18 | | | | 9.48 | | | | 11.95 | | | | 0.98 | |
| | | | | | | | | | | | | | | | |
| Benchmark Performance | | Six Months | | | One Year | | | Five Years | | | Ten Years | |
| | | | |
Russell 1000® Growth Index3 | | | 21.49 | % | | | 11.56 | % | | | 13.39 | % | | | 16.28 | % |
| | | | |
S&P 500® Index4 | | | 18.54 | | | | 10.42 | | | | 10.71 | | | | 14.70 | |
Morningstar Large Growth Category Average5 | | | 21.11 | | | | 10.02 | | | | 11.33 | | | | 14.71 | |
| 1. | Performance figures may reflect certain fee waivers and/or expense limitations, without which total returns may have been different. For information on current fee waivers and/or expense limitations (if any), please refer to the Notes to Financial Statements. |
| 2. | The gross expense ratios presented reflect the Portfolio’s “Total Annual Portfolio Operating Expenses” from the most recent Prospectus, as supplemented, and may differ from other expense ratios disclosed in this report. |
| 3. | The Russell 1000® Growth Index is the Portfolio’s primary broad-based securities market index for comparison purposes. The Russell 1000® Growth Index measures the performance of thelarge-cap growth segment of the U.S. equity universe. It includes those Russell 1000® Index companies with higherprice-to-book ratios and higher forecasted growth values. Results assume reinvestment of all dividends and capital gains. An investment cannot be made directly in an index. |
| 4. | The S&P 500® Index is the Portfolio’s secondary benchmark. “S&P 500®” is a trademark of The McGraw-Hill Companies, Inc. The S&P 500® Index is widely regarded as the standard index for measuringlarge-cap U.S. stock market performance. Results assume reinvestment of all dividends and capital gains. An investment cannot be made directly in an index. |
| 5. | The Morningstar Large Growth Category Average is representative of funds that invest primarily in big U.S. companies that are projected to grow faster than other large-cap stocks. Stocks in the top 70% of the capitalization of the U.S. equity market are defined as large cap. Growth is defined based on fast growth and high valuations. Most of these funds focus on companies in rapidly expanding industries. Results are based on average total returns of similar funds with all dividends and capital gain distributions reinvested. |
Cost in Dollars of a $1,000 Investment in MainStay VP MacKay Growth Portfolio (Unaudited)
The example below is intended to describe the fees and expenses borne by shareholders during the six-month period from January 1, 2019, to June 30, 2019, and the impact of those costs on your investment.
Example
As a shareholder of the Portfolio you incur two types of costs: (1) transaction costs, including exchange fees and sales charges (loads) on purchases (as applicable), and (2) ongoing costs, including management fees, distribution and/or service (12b-1) fees, and other Portfolio expenses (as applicable). This example is intended to help you understand your ongoing costs (in dollars) of investing in the Portfolio and to compare these costs with the ongoing costs of investing in other mutual funds. The example is based on an investment of $1,000 made at the beginning of the six-month period and held for the entire period from January 1, 2019, to June 30, 2019. Shares are only sold in connection with variable life and annuity contracts and the example does not reflect any contract level or transactional fees or expenses. If these costs had been included, your costs would have been higher.
This example illustrates your Portfolio’s ongoing costs in two ways:
Actual Expenses
The second and third data columns in the table below provide information about actual account values and actual expenses. You may use the information in these columns, together with the amount you invested, to estimate the expenses that you paid during the six months ended June 30, 2019. Simply divide your account value by $1,000
(for example, an $8,600 account value divided by $1,000 = 8.6), then multiply the result by the number under the heading entitled “Expenses Paid During Period” to estimate the expenses you paid on your account during this period.
Hypothetical Example for Comparison Purposes
The fourth and fifth data columns in the table below provide information about hypothetical account values and hypothetical expenses based on the Portfolio’s actual expense ratio and an assumed rate of return of 5% per year before expenses, which is not the Portfolio’s actual return. The hypothetical account values and expenses may not be used to estimate the actual ending account balances or expenses you paid for thesix-month period shown. You may use this information to compare the ongoing costs of investing in the Portfolio with the ongoing costs of investing in other mutual funds. To do so, compare this 5% hypothetical example with the 5% hypothetical examples that appear in the shareholder reports of the other mutual funds.
Please note that the expenses shown in the table are meant to highlight your ongoing costs only and do not reflect any transactional costs, such as exchange fees or sales charges (loads). Therefore, the fourth and fifth data columns of the table are useful in comparing ongoing costs only and will not help you determine the relative total costs of owning different funds. In addition, if these transactional costs were included, your costs would have been higher.
| | | | | | | | | | | | | | | | | | | | | | |
| | | | | | | | | | | | | | | | | | |
| Share Class | | Beginning
Account
Value
1/1/19 | | | Ending Account
Value (Based
on Actual
Returns and
Expenses)
6/30/19 | | | Expenses
Paid
During
Period1 | | | Ending Account
Value (Based
on Hypothetical
5% Annualized
Return and
Actual Expenses)
6/30/19 | | | Expenses
Paid
During
Period1 | | | Net Expense
Ratio
During
Period2 |
| | | | | | |
| Initial Class Shares | | $ | 1,000.00 | | | $ | 1,171.70 | | | $ | 3.93 | | | $ | 1,021.17 | | | $ | 3.66 | | | 0.73% |
| | | | | | |
| Service Class Shares | | $ | 1,000.00 | | | $ | 1,170.30 | | | $ | 5.27 | | | $ | 1,019.93 | | | $ | 4.91 | | | 0.98% |
| 1. | Expenses are equal to the Portfolio’s annualized expense ratio of each class multiplied by the average account value over the period, divided by 365 and multiplied by 181 (to reflect the six-month period). The table above represents the actual expenses incurred during the six-month period. In addition to the fees and expenses which the Portfolio bears directly, it also indirectly bears a pro rata share of the fees and expenses of the underlying funds in which it invests. Such indirect expenses are not included in the above-reported expense figures. |
| 2. | Expenses are equal to the Portfolio’s annualized expense ratio to reflect the six-month period. |
| | |
| 6 | | MainStay VP MacKay Growth Portfolio |
Industry Composition as of June 30, 2019(Unaudited)
| | | | |
| |
| Software | | | 14.2 | % |
| |
| Interactive Media & Services | | | 9.8 | |
| |
| IT Services | | | 9.2 | |
| |
| Internet & Direct Marketing Retail | | | 7.3 | |
| |
| Technology Hardware, Storage & Peripherals | | | 7.3 | |
| |
| Semiconductors & Semiconductor Equipment | | | 5.4 | |
| |
| Specialty Retail | | | 4.7 | |
| |
| Biotechnology | | | 3.3 | |
| |
| Aerospace & Defense | | | 3.0 | |
| |
| Health Care Providers & Services | | | 2.7 | |
| |
| Equity Real Estate Investment Trusts | | | 2.6 | |
| |
| Hotels, Restaurants & Leisure | | | 2.5 | |
| |
| Media | | | 2.5 | |
| |
| Entertainment | | | 1.8 | |
| |
| Health Care Equipment & Supplies | | | 1.8 | |
| |
| Capital Markets | | | 1.7 | |
| |
| Beverages | | | 1.4 | |
| |
| Exchange Traded Funds | | | 1.4 | |
| |
| Insurance | | | 1.4 | |
| |
| Machinery | | | 1.3 | |
| |
| Household Durables | | | 1.2 | |
| |
| Life Sciences Tools & Services | | | 1.1 | |
| |
| Communications Equipment | | | 1.0 | |
| |
| Food Products | | | 1.0 | |
| |
| Pharmaceuticals | | | 1.0 | |
| |
| Professional Services | | | 1.0 | |
| | | | |
| |
| Road & Rail | | | 1.0 | % |
| |
| Electronic Equipment, Instruments & Components | | | 0.9 | |
| |
| Food & Staples Retailing | | | 0.9 | |
| |
| Textiles, Apparel & Luxury Goods | | | 0.9 | |
| |
| Consumer Finance | | | 0.7 | |
| |
| Diversified Consumer Services | | | 0.7 | |
| |
| Health Care Technology | | | 0.6 | |
| |
| Industrial Conglomerates | | | 0.5 | |
| |
| Tobacco | | | 0.5 | |
| |
| Commercial Services & Supplies | | | 0.4 | |
| |
| Oil, Gas & Consumable Fuels | | | 0.4 | |
| |
| Air Freight & Logistics | | | 0.2 | |
| |
| Chemicals | | | 0.2 | |
| |
| Containers & Packaging | | | 0.2 | |
| |
| Thrifts & Mortgage Finance | | | 0.2 | |
| |
| Airlines | | | 0.1 | |
| |
| Trading Companies & Distributors | | | 0.1 | |
| |
| Building Products | | | 0.0 | ‡ |
| |
| Household Products | | | 0.0 | ‡ |
| |
| Multiline Retail | | | 0.0 | ‡ |
| |
| Personal Products | | | 0.0 | ‡ |
| |
| Short-Term Investments | | | 0.0 | ‡ |
| |
| Other Assets, Less Liabilities | | | –0.1 | |
| | | | |
| | | 100.0 | % |
| | | | |
See Portfolio of Investments beginning on page 9 for specific holdings within these categories. The Portfolio’s holdings are subject to change.
| ‡ | Less than one-tenth of a percent. |
Top Ten Holdings or Issuers as of June 30, 2019 (excludingshort-term investments) (Unaudited)
| 5. | Facebook, Inc., Class A |
| 8. | Mastercard, Inc., Class A |
| 9. | iShares Russell 1000 Growth ETF |
Portfolio Management Discussion and Analysis(Unaudited)
Answers to the questions reflect the views of Migene Kim, CFA, and Mona Patni of MacKay Shields LLC, the Portfolio’s subadvisor.
How did MainStay VP MacKay Growth Portfolio perform relative to its benchmarks and peers during the six months ended June 30, 2019?
For the six months ended June 30, 2019, MainStay VP MacKay Growth Portfolio returned 17.17% for Initial Class shares and 17.03% for Service Class shares. Over the same period, both share classes underperformed the 21.49% return of the Russell 1000® Growth Index, which is the Portfolio’s primary benchmark; the 18.54% return of the S&P 500® Index, which is a secondary benchmark of the Portfolio; and the 21.11% return of the Morningstar Large Growth Category Average.1
What factors affected the Portfolio’s relative performance during the reporting period?
Stock selection was the primary reason why the Portfolio underperformed relative to the Russell 1000® Growth Index during the reporting period. The Portfolio’s performance directly reflected the performance of our stock selection model, particularly the weak effectiveness of the model’s valuation signals, which seek to evaluate companies across sales- and cash-based measures on a peer-relative basis. Valuation ranges across markets were compressed during the first five months of 2019, and value signals, which tend to prove most effective in an environment in which profits are accelerating, struggled amid a decelerating global growth outlook. Valuation signals proved more effective in June 2019 when value performance rebounded. Positive contributions from the stock selection model’s other factors provided only partial mitigation. (Contributions take weightings and total returns into account.) Momentum signals, which evaluate historical price trends, generated positive performance for the Portfolio during the reporting period, but proved volatile and inconsistent, hence difficult to capture. Sentiment signals, a gauge of institutional investor sentiment, were not effective during the first half of the reporting period but rebounded in the second half of the reporting period thanks to the Portfolio’s underweight positions.
Which sectors were the strongest positive contributors to the Portfolio’s relative performance, and which sectors were particularly weak?
Although no sectors contributed positively to the Portfolio’s performance relative to the Russell 1000® Growth Index during the reporting period, the strongest contributors to the Portfolio’s relative performance included energy, utilities and real estate. During the same period, the most significant detractors from
benchmark-relative performance were the health care, information technology and materials sectors
During the reporting period, which individual stocks made the strongest positive contributions to the Portfolio’s absolute performance and which stocks detracted the most?
The stocks that made the most substantial positive contribution to the Portfolio’s absolute performance during the reporting period included software giant Microsoft, consumer electronics leader Apple and dominante-commerce retailer Amazon.com. The stocks that detracted the most from the Portfolio’s absolute performance during the reporting period included biotechnology developers AbbVie and Biogen, and commodity-focused specialty chemicals company Chemours.
Did the Portfolio make any significant purchases or sales during the reporting period?
The Portfolio’s largest initial purchase during the reporting period was in shares of communication equipment maker Cisco Systems, while the Portfolio’s largest increase in position size was in social media platform Facebook. Over the same period, the most substantial position that the Portfolio exited completely was in business conglomerate Berkshire Hathaway, while the Portfolio’s most substantial decrease in position size was in health care provider UnitedHealth Group.
How did the Portfolio’s sector weightings change during the reporting period?
During the reporting period, the Portfolio’s largest sector-weighting increases relative to the Russell 1000® Growth Index were in information technology, communication services and consumer discretionary. Over the same period, the Portfolio’s most substantial sector-weighting decreases relative to the benchmark were in industrials, materials and consumer staples.
How was the Portfolio positioned at the end of the reporting period?
As of June 30, 2019, the Portfolio’s largest overweight positions relative to the Russell 1000® Growth Index included the information technology and communication services sectors. As of the same date, the Portfolio sector exposures that were most substantially underweight relative to the benchmark included industrials and health care.
| 1. | See page 5 for more information on benchmark and peer group returns. |
The opinions expressed are those of the portfolio managers as of the date of this report and are subject to change. There is no guarantee that any forecasts will come to pass. This material does not constitute investment advice and is not intended as an endorsement of any specific investment.
Not all MainStay VP Portfolios and/or share classes are available under all policies.
| | |
| 8 | | MainStay VP MacKay Growth Portfolio |
Portfolio of InvestmentsJune 30, 2019 (Unaudited)
| | | | | | | | |
| | |
Shares | | | Value | |
| Common Stocks 98.7%† | |
Aerospace & Defense 3.0% | |
Boeing Co. | | | 32,292 | | | $ | 11,754,611 | |
L3harris Technologies, Inc. | | | 120 | | | | 22,696 | |
Lockheed Martin Corp. | | | 10,154 | | | | 3,691,385 | |
Northrop Grumman Corp. | | | 7,917 | | | | 2,558,062 | |
Raytheon Co. | | | 210 | | | | 36,515 | |
Spirit AeroSystems Holdings, Inc., Class A | | | 20,487 | | | | 1,667,027 | |
| | | | | | | | |
| | | | | | | 19,730,296 | |
| | | | | | | | |
Air Freight & Logistics 0.2% | |
United Parcel Service, Inc., Class B | | | 10,867 | | | | 1,122,235 | |
| | | | | | | | |
|
Airlines 0.1% | |
Southwest Airlines Co. | | | 12,676 | | | | 643,687 | |
| | | | | | | | |
|
Beverages 1.4% | |
Coca-Cola Co. | | | 79,961 | | | | 4,071,614 | |
Keurig Dr. Pepper, Inc. | | | 17,922 | | | | 517,946 | |
PepsiCo., Inc. | | | 37,663 | | | | 4,938,749 | |
| | | | | | | | |
| | | | | | | 9,528,309 | |
| | | | | | | | |
Biotechnology 3.3% | |
AbbVie, Inc. | | | 103,491 | | | | 7,525,866 | |
Alkermes PLC (a) | | | 78,343 | | | | 1,765,851 | |
Amgen, Inc. | | | 25,622 | | | | 4,721,622 | |
Biogen, Inc. (a) | | | 8,539 | | | | 1,997,016 | |
Gilead Sciences, Inc. | | | 63,128 | | | | 4,264,928 | |
Regeneron Pharmaceuticals, Inc. (a) | | | 4,626 | | | | 1,447,938 | |
| | | | | | | | |
| | | | | | | 21,723,221 | |
| | | | | | | | |
Building Products 0.0%‡ | |
Masco Corp. | | | 2,994 | | | | 117,485 | |
| | | | | | | | |
|
Capital Markets 1.7% | |
Ameriprise Financial, Inc. | | | 3,147 | | | | 456,818 | |
Charles Schwab Corp. | | | 30,377 | | | | 1,220,852 | |
E*TRADE Financial Corp. | | | 27,723 | | | | 1,236,446 | |
Evercore, Inc., Class A | | | 15,726 | | | | 1,392,852 | |
Lazard, Ltd., Class A | | | 33,015 | | | | 1,135,386 | |
LPL Financial Holdings, Inc. | | | 35,051 | | | | 2,859,110 | |
MSCI, Inc. | | | 7,618 | | | | 1,819,102 | |
S&P Global, Inc. | | | 329 | | | | 74,943 | |
TD Ameritrade Holding Corp. | | | 18,929 | | | | 944,936 | |
| | | | | | | | |
| | | | | | | 11,140,445 | |
| | | | | �� | | | |
Chemicals 0.2% | |
CF Industries Holdings, Inc. | | | 25,411 | | | | 1,186,948 | |
Linde PLC | | | 643 | | | | 129,114 | |
| | | | | | | | |
| | | | | | | 1,316,062 | |
| | | | | | | | |
Commercial Services & Supplies 0.4% | |
Cintas Corp. | | | 4,773 | | | | 1,132,585 | |
| | | | | | | | |
| | |
Shares | | | Value | |
Commercial Services & Supplies (continued) | |
Clean Harbors, Inc. (a) | | | 21,312 | | | $ | 1,515,283 | |
IAA, Inc. (a) | | | 354 | | | | 13,728 | |
KAR Auction Services, Inc. | | | 354 | | | | 8,850 | |
Waste Management, Inc. | | | 321 | | | | 37,034 | |
| | | | | | | | |
| | | | | | | 2,707,480 | |
| | | | | | | | |
Communications Equipment 1.0% | |
Arista Networks, Inc. (a) | | | 1,340 | | | | 347,891 | |
Cisco Systems, Inc. | | | 112,812 | | | | 6,174,201 | |
| | | | | | | | |
| | | | | | | 6,522,092 | |
| | | | | | | | |
Consumer Finance 0.7% | |
American Express Co. | | | 401 | | | | 49,499 | |
Discover Financial Services | | | 19,845 | | | | 1,539,774 | |
Synchrony Financial | | | 84,741 | | | | 2,937,971 | |
| | | | | | | | |
| | | | | | | 4,527,244 | |
| | | | | | | | |
Containers & Packaging 0.2% | |
Ardagh Group S.A. | | | 1,107 | | | | 19,373 | |
Ball Corp. | | | 18,211 | | | | 1,274,588 | |
Silgan Holdings, Inc. | | | 1,359 | | | | 41,585 | |
| | | | | | | | |
| | | | | | | 1,335,546 | |
| | | | | | | | |
Diversified Consumer Services 0.7% | |
Frontdoor, Inc. (a) | | | 10,799 | | | | 470,297 | |
H&R Block, Inc. | | | 82,779 | | | | 2,425,425 | |
Service Corporation International | | | 32,585 | | | | 1,524,326 | |
| | | | | | | | |
| | | | | | | 4,420,048 | |
| | | | | | | | |
Electronic Equipment, Instruments & Components 0.9% | |
CDW Corp. | | | 31,647 | | | | 3,512,817 | |
Jabil, Inc. | | | 39,401 | | | | 1,245,071 | |
Zebra Technologies Corp., Class A (a) | | | 6,371 | | | | 1,334,661 | |
| | | | | | | | |
| | | | | | | 6,092,549 | |
| | | | | | | | |
Entertainment 1.8% | |
Live Nation Entertainment, Inc. (a) | | | 40,749 | | | | 2,699,621 | |
Netflix, Inc. (a) | | | 19,766 | | | | 7,260,447 | |
Walt Disney Co. | | | 15,539 | | | | 2,169,866 | |
| | | | | | | | |
| | | | | | | 12,129,934 | |
| | | | | | | | |
Equity Real Estate Investment Trusts 2.6% | |
American Tower Corp. | | | 33,148 | | | | 6,777,109 | |
Americold Realty Trust | | | 18,063 | | | | 585,602 | |
Brookfield Property REIT, Inc., Class A | | | 72,383 | | | | 1,367,315 | |
Colony Capital, Inc. | | | 502,188 | | | | 2,510,940 | |
Crown Castle International Corp. | | | 194 | | | | 25,288 | |
Equity LifeStyle Properties, Inc. | | | 12,685 | | | | 1,539,198 | |
Lamar Advertising Co., Class A | | | 4,453 | | | | 359,402 | |
OUTFRONT Media, Inc. | | | 1,477 | | | | 38,092 | |
Public Storage | | | 8,968 | | | | 2,135,908 | |
SBA Communications Corp. (a) | | | 8,429 | | | | 1,895,176 | |
| | | | | | | | |
| | | | | | | 17,234,030 | |
| | | | | | | | |
| | | | | | |
The notes to the financial statements are an integral part of,
and should be read in conjunction with, the financial statements. | | | | | 9 | |
Portfolio of InvestmentsJune 30, 2019 (Unaudited) (continued)
| | | | | | | | |
| | |
Shares | | | Value | |
| | | | | | | | |
| Common Stocks (continued) | |
Food & Staples Retailing 0.9% | |
Costco Wholesale Corp. | | | 15,180 | | | $ | 4,011,467 | |
Sysco Corp. | | | 27,980 | | | | 1,978,745 | |
| | | | | | | | |
| | | | | | | 5,990,212 | |
| | | | | | | | |
Food Products 1.0% | |
Campbell Soup Co. | | | 5,476 | | | | 219,423 | |
Pilgrim’s Pride Corp. (a) | | | 73,232 | | | | 1,859,360 | |
Post Holdings, Inc. (a) | | | 11,655 | | | | 1,211,770 | |
TreeHouse Foods, Inc. (a) | | | 45,797 | | | | 2,477,618 | |
Tyson Foods, Inc., Class A | | | 6,494 | | | | 524,326 | |
| | | | | | | | |
| | | | | | | 6,292,497 | |
| | | | | | | | |
Health Care Equipment & Supplies 1.8% | |
Abbott Laboratories | | | 2,399 | | | | 201,756 | |
ABIOMED, Inc. (a) | | | 2,048 | | | | 533,484 | |
Align Technology, Inc. (a) | | | 6,419 | | | | 1,756,880 | |
Boston Scientific Corp. (a) | | | 887 | | | | 38,123 | |
Cooper Cos., Inc. | | | 4,226 | | | | 1,423,697 | |
Hill-Rom Holdings, Inc. | | | 14,775 | | | | 1,545,760 | |
Intuitive Surgical, Inc. (a) | | | 5,381 | | | | 2,822,604 | |
STERIS PLC | | | 48 | | | | 7,146 | |
Stryker Corp. | | | 16,708 | | | | 3,434,831 | |
| | | | | | | | |
| | | | | | | 11,764,281 | |
| | | | | | | | |
Health Care Providers & Services 2.7% | |
AmerisourceBergen Corp. | | | 38,855 | | | | 3,312,777 | |
Encompass Health Corp. | | | 441 | | | | 27,942 | |
HCA Healthcare, Inc. | | | 28,838 | | | | 3,898,033 | |
McKesson Corp. | | | 19,428 | | | | 2,610,929 | |
UnitedHealth Group, Inc. | | | 34,145 | | | | 8,331,721 | |
| | | | | | | | |
| | | | | | | 18,181,402 | |
| | | | | | | | |
Health Care Technology 0.6% | |
Cerner Corp. | | | 26,398 | | | | 1,934,974 | |
Veeva Systems, Inc., Class A (a) | | | 10,939 | | | | 1,773,321 | |
| | | | | | | | |
| | | | | | | 3,708,295 | |
| | | | | | | | |
Hotels, Restaurants & Leisure 2.5% | |
Chipotle Mexican Grill, Inc. (a) | | | 2,093 | | | | 1,533,918 | |
Darden Restaurants, Inc. | | | 25,777 | | | | 3,137,834 | |
Hilton Worldwide Holdings, Inc. | | | 10,961 | | | | 1,071,328 | |
Starbucks Corp. | | | 89,197 | | | | 7,477,385 | |
Yum China Holdings, Inc. | | | 68,456 | | | | 3,162,667 | |
| | | | | | | | |
| | | | | | | 16,383,132 | |
| | | | | | | | |
Household Durables 1.2% | |
NVR, Inc. (a) | | | 910 | | | | 3,066,928 | |
PulteGroup, Inc. | | | 81,444 | | | | 2,575,259 | |
Toll Brothers, Inc. | | | 67,474 | | | | 2,470,898 | |
| | | | | | | | |
| | | | | | | 8,113,085 | |
| | | | | | | | |
Household Products 0.0%‡ | |
Kimberly-Clark Corp. | | | 274 | | | | 36,519 | |
| | | | | | | | |
| | | | | | | | |
| | |
Shares | | | Value | |
| | | | | | | | |
Industrial Conglomerates 0.5% | |
3M Co. | | | 6,203 | | | $ | 1,075,228 | |
Carlisle Cos., Inc. | | | 10,822 | | | | 1,519,517 | |
Honeywell International, Inc. | | | 4,060 | | | | 708,835 | |
| | | | | | | | |
| | | | | | | 3,303,580 | |
| | | | | | | | |
Insurance 1.4% | |
American International Group, Inc. | | | 39,607 | | | | 2,110,261 | |
Brighthouse Financial, Inc. (a) | | | 33,383 | | | | 1,224,822 | |
First American Financial Corp. | | | 24,868 | | | | 1,335,412 | |
Mercury General Corp. | | | 7,024 | | | | 439,000 | |
Progressive Corp. | | | 50,552 | | | | 4,040,621 | |
| | | | | | | | |
| | | | | | | 9,150,116 | |
| | | | | | | | |
Interactive Media & Services 9.8% | |
Alphabet, Inc. (a) | | | | | | | | |
Class A | | | 15,306 | | | | 16,573,337 | |
Class C | | | 15,736 | | | | 17,009,200 | |
Facebook, Inc., Class A (a) | | | 126,263 | | | | 24,368,759 | |
IAC/InterActiveCorp (a) | | | 14,059 | | | | 3,058,254 | |
Match Group, Inc. (b) | | | 6,579 | | | | 442,569 | |
TripAdvisor, Inc. (a) | | | 29,071 | | | | 1,345,697 | |
Twitter, Inc. (a) | | | 53,108 | | | | 1,853,469 | |
| | | | | | | | |
| | | | | | | 64,651,285 | |
| | | | | | | | |
Internet & Direct Marketing Retail 7.3% | |
Amazon.com, Inc. (a) | | | 19,470 | | | | 36,868,976 | |
Booking Holdings, Inc. (a) | | | 3,336 | | | | 6,254,033 | |
eBay, Inc. | | | 52,938 | | | | 2,091,051 | |
Expedia Group, Inc. | | | 22,947 | | | | 3,052,639 | |
| | | | | | | | |
| | | | | | | 48,266,699 | |
| | | | | | | | |
IT Services 9.2% | |
Accenture PLC, Class A | | | 44,548 | | | | 8,231,134 | |
Akamai Technologies, Inc. (a) | | | 40,264 | | | | 3,226,757 | |
Automatic Data Processing, Inc. | | | 4,781 | | | | 790,443 | |
Booz Allen Hamilton Holding Corp. | | | 11,440 | | | | 757,442 | |
CACI International, Inc., Class A (a) | | | 3,179 | | | | 650,392 | |
Euronet Worldwide, Inc. (a) | | | 9,613 | | | | 1,617,291 | |
FleetCor Technologies, Inc. (a) | | | 2,703 | | | | 759,138 | |
Genpact, Ltd. | | | 24,539 | | | | 934,690 | |
GoDaddy, Inc., Class A (a) | | | 42,033 | | | | 2,948,615 | |
International Business Machines Corp. | | | 24,983 | | | | 3,445,156 | |
Leidos Holdings, Inc. | | | 16,774 | | | | 1,339,404 | |
Mastercard, Inc., Class A | | | 42,616 | | | | 11,273,210 | |
PayPal Holdings, Inc. (a) | | | 78,101 | | | | 8,939,440 | |
Square, Inc., Class A (a) | | | 14,755 | | | | 1,070,180 | |
VeriSign, Inc. (a) | | | 2,022 | | | | 422,922 | |
Visa, Inc., Class A | | | 84,177 | | | | 14,608,918 | |
| | | | | | | | |
| | | | | | | 61,015,132 | |
| | | | | | | | |
Life Sciences Tools & Services 1.1% | |
Bruker Corp. | | | 7,710 | | | | 385,115 | |
Charles River Laboratories International, Inc. (a) | | | 4,072 | | | | 577,817 | |
Illumina, Inc. (a) | | | 6,920 | | | | 2,547,598 | |
| | | | |
| 10 | | MainStay VP MacKay Growth Portfolio | | The notes to the financial statements are an integral part of,
and should be read in conjunction with, the financial statements. |
| | | | | | | | |
| | |
Shares | | | Value | |
| | | | | | | | |
| Common Stocks (continued) | |
Life Sciences Tools & Services (continued) | |
Mettler-Toledo International, Inc. (a) | | | 762 | | | $ | 640,080 | |
PRA Health Sciences, Inc. (a) | | | 28,026 | | | | 2,778,778 | |
Thermo Fisher Scientific, Inc. | | | 1,906 | | | | 559,754 | |
Waters Corp. (a) | | | 422 | | | | 90,831 | |
| | | | | | | | |
| | | | | | | 7,579,973 | |
| | | | | | | | |
Machinery 1.3% | |
AGCO Corp. | | | 34,403 | | | | 2,668,641 | |
Allison Transmission Holdings, Inc. | | | 63,282 | | | | 2,933,121 | |
Caterpillar, Inc. | | | 2,398 | | | | 326,823 | |
Cummins, Inc. | | | 9,046 | | | | 1,549,941 | |
Illinois Tool Works, Inc. | | | 231 | | | | 34,837 | |
Oshkosh Corp. | | | 9,124 | | | | 761,763 | |
Toro Co. | | | 6,292 | | | | 420,935 | |
| | | | | | | | |
| | | | | | | 8,696,061 | |
| | | | | | | | |
Media 2.5% | |
Altice U.S.A., Inc., Class A (a) | | | 64,239 | | | | 1,564,220 | |
Cable One, Inc. | | | 771 | | | | 902,833 | |
Charter Communications, Inc., Class A (a) | | | 11,712 | | | | 4,628,348 | |
Comcast Corp., Class A | | | 56,612 | | | | 2,393,555 | |
Discovery, Inc., Class A (a)(b) | | | 35,258 | | | | 1,082,421 | |
DISH Network Corp., Class A (a) | | | 12,646 | | | | 485,733 | |
Nexstar Media Group, Inc., Class A | | | 13,772 | | | | 1,390,972 | |
Omnicom Group, Inc. | | | 22,271 | | | | 1,825,108 | |
Sinclair Broadcast Group, Inc., Class A | | | 26,256 | | | | 1,408,109 | |
Tribune Media Co., Class A | | | 15,044 | | | | 695,334 | |
| | | | | | | | |
| | | | | | | 16,376,633 | |
| | | | | | | | |
Multiline Retail 0.0%‡ | |
Dollar General Corp. | | | 66 | | | | 8,921 | |
| | | | | | | | |
|
Oil, Gas & Consumable Fuels 0.4% | |
Cabot Oil & Gas Corp. | | | 110,617 | | | | 2,539,766 | |
| | | | | | | | |
|
Personal Products 0.0%‡ | |
Estee Lauder Cos., Inc., Class A | | | 730 | | | | 133,670 | |
| | | | | | | | |
|
Pharmaceuticals 1.0% | |
Eli Lilly & Co. | | | 12,038 | | | | 1,333,690 | |
Horizon Therapeutics PLC (a) | | | 56,693 | | | | 1,364,034 | |
Johnson & Johnson | | | 2,232 | | | | 310,873 | |
Merck & Co., Inc. | | | 42,637 | | | | 3,575,112 | |
| | | | | | | | |
| | | | | | | 6,583,709 | |
| | | | | | | | |
Professional Services 1.0% | |
ManpowerGroup, Inc. | | | 8,636 | | | | 834,238 | |
Nielsen Holdings PLC | | | 108,959 | | | | 2,462,473 | |
Robert Half International, Inc. | | | 25,225 | | | | 1,438,077 | |
Verisk Analytics, Inc. | | | 11,284 | | | | 1,652,655 | |
| | | | | | | | |
| | | | | | | 6,387,443 | |
| | | | | | | | |
| | | | | | | | |
| | |
Shares | | | Value | |
| | | | | | | | |
Road & Rail 1.0% | |
Genesee & Wyoming, Inc., Class A (a) | | | 6,793 | | | $ | 679,300 | |
Landstar System, Inc. | | | 3,027 | | | | 326,886 | |
Union Pacific Corp. | | | 32,887 | | | | 5,561,520 | |
| | | | | | | | |
| | | | | | | 6,567,706 | |
| | | | | | | | |
Semiconductors & Semiconductor Equipment 5.4% | |
Applied Materials, Inc. | | | 95,868 | | | | 4,305,432 | |
Broadcom, Inc. | | | 23,767 | | | | 6,841,569 | |
Cypress Semiconductor Corp. | | | 54,350 | | | | 1,208,744 | |
KLA-Tencor Corp. | | | 15,201 | | | | 1,796,758 | |
Lam Research Corp. | | | 20,445 | | | | 3,840,389 | |
Micron Technology, Inc. (a) | | | 53,178 | | | | 2,052,139 | |
MKS Instruments, Inc. | | | 16,369 | | | | 1,274,981 | |
NVIDIA Corp. | | | 19,235 | | | | 3,158,964 | |
NXP Semiconductors N.V. | | | 12,975 | | | | 1,266,490 | |
ON Semiconductor Corp. (a) | | | 71,839 | | | | 1,451,866 | |
Qorvo, Inc. (a) | | | 11,647 | | | | 775,807 | |
QUALCOMM, Inc. | | | 34,305 | | | | 2,609,581 | |
Teradyne, Inc. | | | 60,438 | | | | 2,895,585 | |
Texas Instruments, Inc. | | | 21,481 | | | | 2,465,159 | |
| | | | | | | | |
| | | | | | | 35,943,464 | |
| | | | | | | | |
Software 14.2% | |
Adobe, Inc. (a) | | | 18,430 | | | | 5,430,399 | |
Atlassian Corp. PLC, Class A (a) | | | 638 | | | | 83,476 | |
Cadence Design Systems, Inc. (a) | | | 50,530 | | | | 3,578,029 | |
CDK Global, Inc. | | | 57,887 | | | | 2,861,933 | |
Citrix Systems, Inc. | | | 13,608 | | | | 1,335,489 | |
Dropbox, Inc., Class A (a) | | | 303 | | | | 7,590 | |
Fair Isaac Corp. (a) | | | 6,179 | | | | 1,940,330 | |
Fortinet, Inc. (a) | | | 39,846 | | | | 3,061,368 | |
Intuit, Inc. | | | 6,905 | | | | 1,804,484 | |
LogMeIn, Inc. | | | 35,446 | | | | 2,611,661 | |
Manhattan Associates, Inc. (a) | | | 23,463 | | | | 1,626,690 | |
Microsoft Corp. | | | 347,748 | | | | 46,584,322 | |
Nuance Communications, Inc. (a) | | | 139,414 | | | | 2,226,442 | |
Oracle Corp. | | | 108,324 | | | | 6,171,218 | |
Palo Alto Networks, Inc. (a) | | | 15,108 | | | | 3,078,406 | |
salesforce.com, Inc. (a) | | | 39,675 | | | | 6,019,888 | |
ServiceNow, Inc. (a) | | | 3,639 | | | | 999,160 | |
Teradata Corp. (a) | | | 41,888 | | | | 1,501,685 | |
VMware, Inc., Class A | | | 17,560 | | | | 2,936,208 | |
Workday, Inc., Class A (a) | | | 47 | | | | 9,662 | |
| | | | | | | | |
| | | | | | | 93,868,440 | |
| | | | | | | | |
Specialty Retail 4.7% | |
Advance Auto Parts, Inc. | | | 10,879 | | | | 1,676,889 | |
AutoZone, Inc. (a) | | | 3,560 | | | | 3,914,113 | |
Best Buy Co., Inc. | | | 40,287 | | | | 2,809,213 | |
Dick’s Sporting Goods, Inc. | | | 71,986 | | | | 2,492,875 | |
Foot Locker, Inc. | | | 22,544 | | | | 945,044 | |
Home Depot, Inc. | | | 34,030 | | | | 7,077,219 | |
Lowe’s Cos., Inc. | | | 62,760 | | | | 6,333,112 | |
| | | | | | |
The notes to the financial statements are an integral part of,
and should be read in conjunction with, the financial statements. | | | | | 11 | |
Portfolio of InvestmentsJune 30, 2019 (Unaudited) (continued)
| | | | | | | | |
| | |
Shares | | | Value | |
| Common Stocks (continued) | |
Specialty Retail (continued) | |
Michaels Cos., Inc. (a) | | | 2,485 | | | $ | 21,620 | |
O’Reilly Automotive, Inc. (a) | | | 6,270 | | | | 2,315,636 | |
TJX Cos., Inc. | | | 22,220 | | | | 1,174,994 | |
Ulta Beauty, Inc. (a) | | | 5,144 | | | | 1,784,402 | |
Urban Outfitters, Inc. (a) | | | 9,550 | | | | 217,262 | |
Williams-Sonoma, Inc. (b) | | | 4,790 | | | | 311,350 | |
| | | | | | | | |
| | | | | | | 31,073,729 | |
| | | | | | | | |
Technology Hardware, Storage & Peripherals 7.3% | |
Apple, Inc. | | | 213,915 | | | | 42,338,057 | |
Dell Technologies, Inc., Class C (a) | | | 41,735 | | | | 2,120,138 | |
NCR Corp. (a) | | | 45,002 | | | | 1,399,562 | |
Xerox Corp. | | | 62,083 | | | | 2,198,359 | |
| | | | | | | | |
| | | | | | | 48,056,116 | |
| | | | | | | | |
Textiles, Apparel & Luxury Goods 0.9% | |
NIKE, Inc., Class B | | | 37,384 | | | | 3,138,387 | |
Skechers U.S.A., Inc., Class A (a) | | | 89,246 | | | | 2,810,356 | |
| | | | | | | | |
| | | | | | | 5,948,743 | |
| | | | | | | | |
Thrifts & Mortgage Finance 0.2% | |
LendingTree, Inc. (a)(b) | | | 1,013 | | | | 425,490 | |
MGIC Investment Corp. (a) | | | 82,340 | | | | 1,081,948 | |
| | | | | | | | |
| | | | | | | 1,507,438 | |
| | | | | | | | |
Tobacco 0.5% | |
Altria Group, Inc. | | | 68,342 | | | | 3,235,994 | |
| | | | | | | | |
|
Trading Companies & Distributors 0.1% | |
United Rentals, Inc. (a) | | | 5,561 | | | | 737,555 | |
| | | | | | | | |
Total Common Stocks
(Cost $544,919,506) | | | | | | | 652,392,259 | |
| | | | | | | | |
|
| Exchange-Traded Funds 1.4% | |
iShares Russell 1000 Growth ETF | | | 59,811 | | | | 9,410,663 | |
| | | | | | | | |
Total Exchange-Traded Funds
(Cost $9,302,802) | | | | | | | 9,410,663 | |
| | | | | | | | |
|
| Short-Term Investments 0.0%‡ | |
Affiliated Investment Company 0.0%‡ | |
MainStay U.S. Government Liquidity Fund, 2.03% (c) | | | 15,459 | | | | 15,459 | |
| | | | | | | | |
| | | | | | | | |
| | |
Shares | | | Value | |
Unaffiliated Investment Company 0.0%‡ | |
State Street Navigator Securities Lending Government Money Market Portfolio, 2.33% (c)(d) | | | 263,835 | | | $ | 263,835 | |
| | | | | | | | |
TotalShort-Term Investments
(Cost $279,294) | | | | | | | 279,294 | |
| | | | | | | | |
Total Investments
(Cost $554,501,602) | | | 100.1 | % | | | 662,082,216 | |
Other Assets, Less Liabilities | | | (0.1 | ) | | | (770,334 | ) |
Net Assets | | | 100.0 | % | | $ | 661,311,882 | |
| † | Percentages indicated are based on Portfolio net assets. |
| ‡ | Less than one-tenth of a percent. |
| (a) | Non-income producing security. |
| (b) | All or a portion of this security was held on loan. As of June 30, 2019, the aggregate market value of securities on loan was $2,045,496; the total market value of collateral held by the Portfolio was $2,093,852. The market value of the collateral held Included non-cash collateral in the form of U.S. Treasury securities with a value of $1,830,017 (See Note 2(G)). |
| (c) | Current yield as of June 30, 2019. |
| (d) | Represents security purchased with cash collateral received for securities on loan. |
The following abbreviation is used in the preceding pages:
ETF—Exchange-Traded Fund
| | | | |
| 12 | | MainStay VP MacKay Growth Portfolio | | The notes to the financial statements are an integral part of,
and should be read in conjunction with, the financial statements. |
The following is a summary of the fair valuations according to the inputs used as of June 30, 2019, for valuing the Portfolio’s assets:
| | | | | | | | | | | | | | | | |
Description | | Quoted
Prices in Active
Markets for
Identical
Assets
(Level 1) | | | Significant
Other
Observable
Inputs
(Level 2) | | | Significant
Unobservable
Inputs
(Level 3) | | | Total | |
| | | | |
Asset Valuation Inputs | | | | | | | | | | | | | | | | |
| Investments in Securities (a) | | | | | | | | | | | | | | | | |
| Common Stocks | | $ | 652,392,259 | | | $ | — | | | $ | — | | | $ | 652,392,259 | |
| Exchange-Traded Funds | | | 9,410,663 | | | | — | | | | — | | | | 9,410,663 | |
| Short-Term Investments | | | | | | | | | | | | | | | | |
Affiliated Investment Company | | | 15,459 | | | | — | | | | — | | | | 15,459 | |
Unaffiliated Investment Company | | | 263,835 | | | | — | | | | — | | | | 263,835 | |
| | | | | | | | | | | | | | | | |
| TotalShort-Term Investments | | | 279,294 | | | | — | | | | — | | | | 279,294 | |
| | | | | | | | | | | | | | | | |
| Total Investments in Securities | | $ | 662,082,216 | | | $ | — | | | $ | — | | | $ | 662,082,216 | |
| | | | | | | | | | | | | | | | |
| (a) | For a complete listing of investments and their industries, see the Portfolio of Investments. |
| | | | | | |
The notes to the financial statements are an integral part of,
and should be read in conjunction with, the financial statements. | | | | | 13 | |
Statement of Assets and Liabilitiesas of June 30, 2019 (Unaudited)
| | | | |
| Assets | |
Investment in unaffiliated securities, at value (identified cost $554,486,143) including securities on loan of $2,045,496 | | $ | 662,066,757 | |
Investment in affiliated investment company, at value (identified cost $15,459) | | | 15,459 | |
Receivables: | | | | |
Dividends | | | 440,261 | |
Portfolio shares sold | | | 1,861 | |
Securities lending | | | 186 | |
Other assets | | | 2,628 | |
| | | | |
Total assets | | | 662,527,152 | |
| | | | |
|
| Liabilities | |
Cash collateral received for securities on loan | | | 263,835 | |
Payables: | | | | |
Portfolio shares redeemed | | | 497,995 | |
Manager (See Note 3) | | | 364,368 | |
Shareholder communication | | | 32,075 | |
Professional fees | | | 30,019 | |
NYLIFE Distributors (See Note 3) | | | 11,248 | |
Custodian | | | 9,850 | |
Trustees | | | 776 | |
Accrued expenses | | | 5,104 | |
| | | | |
Total liabilities | | | 1,215,270 | |
| | | | |
Net assets | | $ | 661,311,882 | |
| | | | |
|
| Composition of Net Assets | |
Shares of beneficial interest outstanding (par value of $.001 per share) unlimited number of shares authorized | | $ | 20,389 | |
Additional paid-in capital | | | 476,660,948 | |
| | | | |
| | | 476,681,337 | |
Total distributable earnings (loss) | | | 184,630,545 | |
| | | | |
Net assets | | $ | 661,311,882 | |
| | | | |
| | | | |
Initial Class | | | | |
Net assets applicable to outstanding shares | | $ | 605,964,434 | |
| | | | |
Shares of beneficial interest outstanding | | | 18,659,846 | |
| | | | |
Net asset value per share outstanding | | $ | 32.47 | |
| | | | |
Service Class | | | | |
Net assets applicable to outstanding shares | | $ | 55,347,448 | |
| | | | |
Shares of beneficial interest outstanding | | | 1,728,689 | |
| | | | |
Net asset value per share outstanding | | $ | 32.02 | |
| | | | |
| | | | |
| 14 | | MainStay VP MacKay Growth Portfolio | | The notes to the financial statements are an integral part of,
and should be read in conjunction with, the financial statements. |
Statement of Operationsfor the six months ended June 30, 2019 (Unaudited)
| | | | |
| Investment Income (Loss) | |
Income | | | | |
Dividends-unaffiliated (a) | | $ | 4,252,392 | |
Securities lending | | | 258,662 | |
Dividends-affiliated | | | 7,137 | |
Interest | | | 7 | |
| | | | |
Total income | | | 4,518,198 | |
| | | | |
Expenses | | | | |
Manager (See Note 3) | | | 2,106,971 | |
Distribution/Service—Service Class (See Note 3) | | | 69,330 | |
Professional fees | | | 42,333 | |
Shareholder communication | | | 30,144 | |
Custodian | | | 12,116 | |
Trustees | | | 7,292 | |
Miscellaneous | | | 11,988 | |
| | | | |
Total expenses | | | 2,280,174 | |
| | | | |
Net investment income (loss) | | | 2,238,024 | |
| | | | |
|
| Realized and Unrealized Gain (Loss) on Investments | |
Net realized gain (loss) on unaffiliated investments | | | 17,720,624 | |
Net change in unrealized appreciation (depreciation) on unaffiliated investments | | | 71,791,707 | |
| | | | |
Net realized and unrealized gain (loss) on investments | | | 89,512,331 | |
| | | | |
Net increase (decrease) in net assets resulting from operations | | $ | 91,750,355 | |
| | | | |
| (a) | Dividends recorded net of foreign withholding taxes in the amount of $1,452. |
| | | | | | |
The notes to the financial statements are an integral part of,
and should be read in conjunction with, the financial statements. | | | | | 15 | |
Statements of Changes in Net Assets
for the six months ended June 30, 2019 (Unaudited) and the year ended December 31, 2018
| | | | | | | | |
| | | 2019 | | | 2018 | |
| Increase (Decrease) in Net Assets | |
Operations: | | | | | | | | |
Net investment income (loss) | | $ | 2,238,024 | | | $ | 3,514,999 | |
Net realized gain (loss) on investments | | | 17,720,624 | | | | 54,007,968 | |
Net change in unrealized appreciation (depreciation) on investments | | | 71,791,707 | | | | (74,749,567 | ) |
| | | | |
Net increase (decrease) in net assets resulting from operations | | | 91,750,355 | | | | (17,226,600 | ) |
| | | | |
Distributions to shareholders: | | | | | | | | |
Initial Class | | | — | | | | (34,652,191 | ) |
Service Class | | | — | | | | (3,951,441 | ) |
| | | | |
Total distributions to shareholders | | | — | | | | (38,603,632 | ) |
| | | | |
Capital share transactions: | | | | | | | | |
Net proceeds from sale of shares | | | 99,280,269 | | | | 13,966,153 | |
Net asset value of shares issued to shareholders in reinvestment of dividends and distributions | | | — | | | | 38,603,632 | |
Cost of shares redeemed | | | (42,929,607 | ) | | | (75,746,341 | ) |
| | | | |
Increase (decrease) in net assets derived from capital share transactions | | | 56,350,662 | | | | (23,176,556 | ) |
| | | | |
Net increase (decrease) in net assets | | | 148,101,017 | | | | (79,006,788 | ) |
|
| Net Assets | |
Beginning of period | | | 513,210,865 | | | | 592,217,653 | |
| | | | |
End of period | | $ | 661,311,882 | | | $ | 513,210,865 | |
| | | | |
| | | | |
| 16 | | MainStay VP MacKay Growth Portfolio | | The notes to the financial statements are an integral part of,
and should be read in conjunction with, the financial statements. |
Financial Highlightsselected per share data and ratios
| | | | | | | | | | | | | | | | | | | | | | | | | | | | |
| | | |
| | | Six months
ended
June 30, | | | | | | Year ended December 31, | |
| | | | | | | |
| Initial Class | | 2019* | | | | | | 2018 | | | 2017 | | | 2016 | | | 2015 | | | 2014 | |
| | | | | | | |
Net asset value at beginning of period | | $ | 27.74 | | | | | | | $ | 30.87 | | | $ | 23.90 | | | $ | 26.09 | | | $ | 29.42 | | | $ | 34.19 | |
| | | | | | | | | | | | | | | | | | | | | | | | | | | | |
| | | | | | | |
Net investment income (loss) (a) | | | 0.12 | | | | | | | | 0.19 | | | | 0.19 | | | | 0.09 | | | | 0.04 | | | | 0.01 | |
| | | | | | | |
Net realized and unrealized gain (loss) on investments | | | 4.61 | | | | | | | | (1.10 | ) | | | 7.05 | | | | (0.02 | ) | | | 0.58 | | | | 2.63 | |
| | | | | | | | | | | | | | | | | | | | | | | | | | | | |
| | | | | | | |
Total from investment operations | | | 4.73 | | | | | | | | (0.91 | ) | | | 7.24 | | | | 0.07 | | | | 0.62 | | | | 2.64 | |
| | | | | | | | | | | | | | | | | | | | | | | | | | | | |
| | | | | | | |
| Less dividends and distributions: | | | | | | | | | | | | | | | | | | | | | | | | | | | | |
| | | | | | | |
From net investment income | | | — | | | | | | | | (0.21 | ) | | | (0.07 | ) | | | (0.04 | ) | | | — | | | | (0.23 | ) |
| | | | | | | |
From net realized gain on investments | | | — | | | | | | | | (2.01 | ) | | | (0.20 | ) | | | (2.22 | ) | | | (3.95 | ) | | | (7.18 | ) |
| | | | | | | | | | | | | | | | | | | | | | | | | | | | |
| | | | | | | |
Total dividends and distributions | | | — | | | | | | | | (2.22 | ) | | | (0.27 | ) | | | (2.26 | ) | | | (3.95 | ) | | | (7.41 | ) |
| | | | | | | | | | | | | | | | | | | | | | | | | | | | |
| | | | | | | |
Net asset value at end of period | | $ | 32.47 | | | | | | | $ | 27.74 | | | $ | 30.87 | | | $ | 23.90 | | | $ | 26.09 | | | $ | 29.42 | |
| | | | | | | | | | | | | | | | | | | | | | | | | | | | |
| | | | | | | |
Total investment return (b) | | | 17.05 | %(c) | | | | | | | (4.24 | %) | | | 30.41 | % | | | 0.40 | % | | | 2.58 | % | | | 8.81 | % |
| | | | | | | |
| Ratios (to average net assets)/Supplemental Data: | | | | | | | | | | | | | | | | | | | | | | | | | | | | |
| | | | | | | |
Net investment income (loss) | | | 0.76 | %†† | | | | | | | 0.60 | % | | | 0.71 | % | | | 0.35 | %(d) | | | 0.15 | % | | | 0.02 | % |
| | | | | | | |
Net expenses (e) | | | 0.73 | %†† | | | | | | | 0.73 | % | | | 0.74 | % | | | 0.76 | %(f) | | | 0.73 | % | | | 0.73 | % |
| | | | | | | |
Portfolio turnover rate | | | 61 | % | | | | | | | 127 | % | | | 141 | % | | | 177 | % | | | 112 | % | | | 88 | % |
| | | | | | | |
Net assets at end of period (in 000’s) | | $ | 605,964 | | | | | | | $ | 461,537 | | | $ | 525,483 | | | $ | 337,401 | | | $ | 370,679 | | | $ | 405,444 | |
| (a) | Per share data based on average shares outstanding during the period. |
| (b) | Total return does not reflect any deduction of sales charges, mortality and expense charges, contract charges or administrative charges. For periods of less than one year, total return is not annualized. |
| (c) | Total investment return may reflect adjustments to conform to generally accepted accounting principles. |
| (d) | Without the custody fee reimbursement, net investment income (loss) would have been 0.34%. |
| (e) | In addition to the fees and expenses which the Portfolio bears directly, it also indirectly bears a pro-rata share of the fees and expenses of the underlying funds in which it invests. Such indirect expenses are not included in the above expense ratios. |
| (f) | Without the custody fee reimbursement, net expenses would have been 0.77%. |
| | | | | | | | | | | | | | | | | | | | | | | | | | | | |
| | | |
| | | Six months
ended
June 30, | | | | | | Year ended December 31, | |
| | | | | | | |
| Service Class | | 2019* | | | | | | 2018 | | | 2017 | | | 2016 | | | 2015 | | | 2014 | |
| | | | | | | |
Net asset value at beginning of period | | $ | 27.38 | | | | | | | $ | 30.50 | | | $ | 23.62 | | | $ | 25.83 | | | $ | 29.24 | | | $ | 34.03 | |
| | | | | | | | | | | | | | | | | | | | | | | | | | | | |
| | | | | | | |
Net investment income (loss) (a) | | | 0.08 | | | | | | | | 0.11 | | | | 0.12 | | | | 0.02 | | | | (0.03 | ) | | | (0.08 | ) |
| | | | | | | |
Net realized and unrealized gain (loss) on investments | | | 4.56 | | | | | | | | (1.10 | ) | | | 6.97 | | | | (0.01 | ) | | | 0.57 | | | | 2.61 | |
| | | | | | | | | | | | | | | | | | | | | | | | | | | | |
| | | | | | | |
Total from investment operations | | | 4.64 | | | | | | | | (0.99 | ) | | | 7.09 | | | | 0.01 | | | | 0.54 | | | | 2.53 | |
| | | | | | | | | | | | | | | | | | | | | | | | | | | | |
| | | | | | | |
| Less dividends and distributions: | | | | | | | | | | | | | | | | | | | | | | | | | | | | |
| | | | | | | |
From net investment income | | | — | | | | | | | | (0.12 | ) | | | (0.01 | ) | | | — | | | | — | | | | (0.14 | ) |
| | | | | | | |
From net realized gain on investments | | | — | | | | | | | | (2.01 | ) | | | (0.20 | ) | | | (2.22 | ) | | | (3.95 | ) | | | (7.18 | ) |
| | | | | | | | | | | | | | | | | | | | | | | | | | | | |
| | | | | | | |
Total dividends and distributions | | | — | | | | | | | | (2.13 | ) | | | (0.21 | ) | | | (2.22 | ) | | | (3.95 | ) | | | (7.32 | ) |
| | | | | | | | | | | | | | | | | | | | | | | | | | | | |
| | | | | | | |
Net asset value at end of period | | $ | 32.02 | | | | | | | $ | 27.38 | | | $ | 30.50 | | | $ | 23.62 | | | $ | 25.83 | | | $ | 29.24 | |
| | | | | | | | | | | | | | | | | | | | | | | | | | | | |
| | | | | | | |
Total investment return (b) | | | 16.95 | %(c) | | | | | | | (4.48 | %) | | | 30.09 | % | | | 0.15 | % | | | 2.33 | % | | | 8.54 | % |
| | | | | | | |
| Ratios (to average net assets)/Supplemental Data: | | | | | | | | | | | | | | | | | | | | | | | | | | | | |
| | | | | | | |
Net investment income (loss) | | | 0.51 | %†† | | | | | | | 0.35 | % | | | 0.46 | % | | | 0.10 | %(d) | | | (0.09 | %) | | | (0.23 | %) |
| | | | | | | |
Net expenses (e) | | | 0.98 | %†† | | | | | | | 0.98 | % | | | 0.99 | % | | | 1.01 | %(f) | | | 0.98 | % | | | 0.98 | % |
| | | | | | | |
Portfolio turnover rate | | | 61 | % | | | | | | | 127 | % | | | 141 | % | | | 177 | % | | | 112 | % | | | 88 | % |
| | | | | | | |
Net assets at end of period (in 000’s) | | $ | 55,347 | | | | | | | $ | 51,674 | | | $ | 66,735 | | | $ | 58,448 | | | $ | 63,846 | | | $ | 64,445 | |
| (a) | Per share data based on average shares outstanding during the period. |
| (b) | Total return does not reflect any deduction of sales charges, mortality and expense charges, contract charges or administrative charges. For periods of less than one year, total return is not annualized. |
| (c) | Total investment return may reflect adjustments to conform to generally accepted accounting principles. |
| (d) | Without the custody fee reimbursement, net investment income (loss) would have been 0.09%. |
| (e) | In addition to the fees and expenses which the Portfolio bears directly, it also indirectly bears a pro-rata share of the fees and expenses of the underlying funds in which it invests. Such indirect expenses are not included in the above expense ratios. |
| (f) | Without the custody fee reimbursement, net expenses would have been 1.02%. |
| | | | | | |
The notes to the financial statements are an integral part of,
and should be read in conjunction with, the financial statements. | | | | | 17 | |
Notes to Financial Statements(Unaudited)
Note 1–Organization and Business
MainStay VP Funds Trust (the “Fund”) was organized as a Delaware statutory trust on February 1, 2011. The Fund is registered under the Investment Company Act of 1940, as amended (the “1940 Act”), as an open-end management investment company. The Fund is comprised of thirty-one separate series (collectively referred to as the “Portfolios”). These financial statements and notes relate to the MainStay VP MacKay Growth Portfolio (the “Portfolio”), a “diversified” portfolio, as that term is defined in the 1940 Act, as interpreted or modified by regulatory authorities having jurisdiction, from time to time.
Shares of the Portfolio are currently offered to certain separate accounts to fund variable annuity policies and variable universal life insurance policies issued by New York Life Insurance and Annuity Corporation (“NYLIAC”), awholly-owned subsidiary of New York Life Insurance Company (“New York Life”) and may also be offered to fund variable annuity policies and variable universal life insurance policies issued by other insurance companies. NYLIAC allocates shares of the Portfolios to, among others, certain NYLIAC separate accounts. Shares of the Portfolio are also offered to the MainStay VP Conservative Allocation Portfolio, MainStay VP Moderate Allocation Portfolio, MainStay VP Moderate Growth Allocation Portfolio and MainStay VP Growth Allocation Portfolio, which operate as “funds-of-funds.”
The Portfolio currently offers two classes of shares. Initial Class shares commenced operations on January 29, 1993. Service Class shares commenced operations on June 5, 2003. Shares of the Portfolio are offered and are redeemed at a price equal to their respective net asset value (“NAV”) per share. No sales or redemption charge is applicable to the purchase or redemption of the Portfolio’s shares. Under the terms of the Fund’s multiple class plan adopted pursuant to Rule 18f-3 under the 1940 Act, the classes differ in that, among other things, Service Class shares of the Portfolio pay a combined distribution and service fee of 0.25% of average daily net assets attributable to Service Class shares of the Portfolio to the Distributor (as defined in Note 3(B)) pursuant to a plan adopted in accordance with Rule 12b-1 under the 1940 Act. Contract owners of variable annuity contracts purchased after June 2, 2003, are permitted to invest only in the Service Class shares.
The Portfolio’s investment objective is to seeklong-term growth of capital.
Note 2–Significant Accounting Policies
The Portfolio is an investment company and accordingly follows the investment company accounting and reporting guidance of the Financial Accounting Standards Board (“FASB”) Accounting Standard CodificationTopic 946 Financial Services—Investment Companies. The Portfolio prepares its financial statements in accordance with generally accepted accounting principles (“GAAP”) in the United States of America and follows the significant accounting policies described below.
(A) Securities Valuation. Investments are usually valued as of the close of regular trading on the New York Stock Exchange (the “Exchange”) (usually 4:00 p.m. Eastern time) on each day the Portfolio is open for business (“valuation date”).
The Board of Trustees of the Fund (the “Board”) adopted procedures establishing methodologies for the valuation of the Portfolio’s securities and other assets and delegated the responsibility for valuation determi-
nations under those procedures to the Valuation Committee of the Fund (the “Valuation Committee”). The Board authorized the Valuation Committee to appoint a Valuation Subcommittee (the “Subcommittee”) to deal in the first instance with establishing the prices of securities for which market quotations are not readily available or the prices of which are not otherwise readily determinable under these procedures. The Subcommittee meets (in person, via electronic mail or via teleconference) on an as-needed basis. Subsequently, the Valuation Committee meets to ensure that actions taken by the Subcommittee were appropriate. The procedures state that, subject to the oversight of the Board and unless otherwise noted, the responsibility for theday-to-day valuation of portfolio assets (including fair value measurements for the Portfolio’s assets and liabilities) rests with New York Life Investment Management LLC (“New York Life Investments” or the “Manager”), aided to whatever extent necessary by the Subadvisor (as defined in Note 3(A)).
To assess the appropriateness of security valuations, the Manager, the Subadvisor or the Portfolio’s third-party service provider, who is subject to oversight by the Manager, regularly compares prior day prices, prices on comparable securities and the sale prices to the prior and current day prices and challenges prices with changes exceeding certain tolerance levels with third-party pricing services or broker sources. For those securities valued through either a standardized fair valuation methodology or a fair valuation measurement, the Subcommittee deals in the first instance with such valuation and the Valuation Committee reviews and affirms, if appropriate, the reasonableness of the valuation based on such methodologies and measurements on a regular basis after considering information that is reasonably available and deemed relevant by the Valuation Committee. Any action taken by the Subcommittee with respect to the valuation of a portfolio security or other asset is submitted for review and ratification (if appropriate) to the Valuation Committee and the Board at the next regularly scheduled meeting.
“Fair value” is defined as the price the Portfolio would reasonably expect to receive upon selling an asset or liability in an orderly transaction to an independent buyer in the principal or most advantageous market for the asset or liability. Fair value measurements are determined within a framework that establishes a three-tier hierarchy which maximizes the use of observable market data and minimizes the use of unobservable inputs to establish a classification of fair value measurements for disclosure purposes. “Inputs” refer broadly to the assumptions that market participants would use in pricing the asset or liability, including assumptions about risk, such as the risk inherent in a particular valuation technique used to measure fair value using a pricing model and/or the risk inherent in the inputs for the valuation technique. Inputs may be observable or unobservable. Observable inputs reflect the assumptions market participants would use in pricing the asset or liability based on market data obtained from sources independent of the Portfolio. Unobservable inputs reflect the Portfolio’s own assumptions about the assumptions market participants would use in pricing the asset or liability based on the information available. The inputs or methodology used for valuing assets or liabilities may not be an indication of the risks associated with investing in those assets or liabilities. The three-tier hierarchy of inputs is summarized below.
| • | | Level 1—quoted prices in active markets for an identical asset or liability |
| | |
| 18 | | MainStay VP MacKay Growth Portfolio |
| • | | Level 2—other significant observable inputs (including quoted prices for a similar asset or liability in active markets, interest rates and yield curves, prepayment speeds, credit risk, etc.) |
| • | | Level 3—significant unobservable inputs (including the Portfolio’s own assumptions about the assumptions that market participants would use in measuring fair value of an asset or liability) |
The level of an asset or liability within the fair value hierarchy is based on the lowest level of an input, both individually and in the aggregate, that is significant to the fair value measurement. As of June 30, 2019, the aggregate value by input level of the Portfolio’s assets and liabilities is included at the end of the Portfolio’s Portfolio of Investments.
The Portfolio may use third-party vendor evaluations, whose prices may be derived from one or more of the following standard inputs, among others:
| | |
• Broker/dealer quotes | | • Benchmark securities |
• Two-sided markets | | • Reference data (corporate actions or material event notices) |
• Bids/offers | | • Monthly payment information |
• Industry and economic events | | • Reported trades |
An asset or liability for which market values cannot be measured using the methodologies described above is valued by methods deemed reasonable in good faith by the Valuation Committee, following the procedures established by the Board, to represent fair value. Under these procedures, the Portfolio generally uses a market-based approach which may use related or comparable assets or liabilities, recent transactions, market multiples, book values and other relevant information. The Portfolio may also use an income-based valuation approach in which the anticipated future cash flows of the asset or liability are discounted to calculate fair value. Discounts may also be applied due to the nature and/or duration of any restrictions on the disposition of the asset or liability. Fair value represents a good faith approximation of the value of a security. Fair value determinations involve the consideration of a number of subjective factors, an analysis of applicable facts and circumstances and the exercise of judgment. As a result, it is possible that the fair value for a security determined in good faith in accordance with the Portfolio’s valuation procedures may differ from valuations for the same security determined by other funds using their own valuation procedures. Although the Portfolio’s valuation procedures are designed to value a security at the price the Portfolio may reasonably expect to receive upon the security’s sale in an orderly transaction, there can be no assurance that any fair value determination thereunder would, in fact, approximate the amount that the Portfolio would actually realize upon the sale of the security or the price at which the security would trade if a reliable market price were readily available. During thesix-month period ended June 30, 2019, there were no material changes to the fair value methodologies.
Securities which may be valued in this manner include, but are not limited to: (i) a security for which trading has been halted or suspended; (ii) a debt security that has recently gone into default and for which there is not a current market quotation; (iii) a security of an issuer that has entered into a restructuring; (iv) a security that has been delisted from a national exchange; (v) a security for which the market price is not readily available from a third-party pricing source or, if so provided,
does not, in the opinion of the Manager or the Subadvisor, reflect the security’s market value; (vi) a security subject to trading collars for which no or limited trading takes place; and (vii) a security whose principal market has been temporarily closed at a time when, under normal conditions, it would be open. Securities valued in this manner are generally categorized as Level 3 in the hierarchy. As of June 30, 2019, there were no securities held by the Portfolio that were fair valued in such a manner.
Equity securities, including exchange-traded funds (“ETFs”), are valued at the last quoted sales prices as of the close of regular trading on the relevant exchange on each valuation date. Securities that are not traded on the valuation date are valued at the mean of the last quoted bid and ask prices. Prices are normally taken from the principal market in which each security trades. These securities are generally categorized as Level 1 in the hierarchy.
Investments in mutual funds, including money market funds, are valued at their respective NAVs as of the close of the Exchange on the valuation date. These securities are generally categorized as Level 1 in the hierarchy.
Temporary cash investments acquired in excess of 60 days to maturity at the time of purchase are valued using the latest bid prices or using valuations based on a matrix system (which considers such factors as security prices, yields, maturities and ratings), both as furnished by independent pricing services. Other temporary cash investments which mature in 60 days or less at the time of purchase (“Short-Term Investments”) are valued using the amortized cost method of valuation, unless the use of such method would be inappropriate. The amortized cost method involves valuing a security at its cost on the date of purchase and thereafter assuming a constant amortization to maturity of the difference between such cost and the value on maturity date. Amortized cost approximates the current fair value of a security. Securities valued using the amortized cost method are not valued using quoted prices in an active market and are generally categorized as Level 2 in the hierarchy.
The information above is not intended to reflect an exhaustive list of the methodologies that may be used to value portfolio investments. The valuation procedures permit the use of a variety of valuation methodologies in connection with valuing portfolio investments. The methodology used for a specific type of investment may vary based on the market data available or other considerations. The methodologies summarized above may not represent the specific means by which portfolio investments are valued on any particular business day.
(B) Income Taxes. The Portfolio’s policy is to comply with the requirements of the Internal Revenue Code of 1986, as amended (the “Internal Revenue Code”), applicable to regulated investment companies and to distribute all of its taxable income to the shareholders of the Portfolio within the allowable time limits. Therefore, no federal, state and local income tax provisions are required.
Management evaluates the Portfolio’s tax positions to determine if the tax positions taken meet the minimum recognition threshold in connection with accounting for uncertainties in income tax positions taken or expected to be taken for the purposes of measuring and recognizing tax liabilities in the financial statements. Recognition of tax benefits of an uncertain tax position is permitted only to the extent the position is
Notes to Financial Statements(Unaudited) (continued)
“more likely than not” to be sustained assuming examination by taxing authorities. Management has analyzed the Portfolio’s tax positions taken on federal, state and local income tax returns for all open tax years (for up to three tax years) and has concluded that no provisions for federal, state and local income tax are required in the Portfolio’s financial statements. The Portfolio’s federal, state and local income tax and federal excise tax returns for tax years for which the applicable statutes of limitations have not expired are subject to examination by the Internal Revenue Service and state and local departments of revenue.
(C) Dividends and Distributions to Shareholders. Dividends and distributions are recorded on the ex-dividend date. The Portfolio intends to declare and pay dividends from net investment income and distributions from net realized capital and currency gains, if any, at least annually. Unless the shareholder elects otherwise, all dividends and distributions are reinvested in the same class of shares of the Portfolio, at NAV. Dividends and distributions to shareholders are determined in accordance with federal income tax regulations and may differ from determinations using GAAP.
(D) Security Transactions and Investment Income. The Portfolio records security transactions on the trade date. Realized gains and losses on security transactions are determined using the identified cost method. Dividend income is recognized on the ex-dividend date; net of any foreign tax withheld at the source, and interest income is accrued as earned using the effective interest rate method.
Investment income and realized and unrealized gains and losses on investments of the Portfolio are allocated pro rata to the separate classes of shares based upon their relative net assets on the date the income is earned or realized and unrealized gains and losses are incurred.
(E) Expenses. Expenses of the Fund are allocated to the individual Portfolios in proportion to the net assets of the respective Portfolios when the expenses are incurred, except where direct allocations of expenses can be made. Expenses (other than fees incurred under the distribution and service plans, further discussed in Note 3(B), which are charged directly to the Service Class shares) are allocated to separate classes of shares pro rata based upon their relative net assets on the date the expenses are incurred. The expenses borne by the Portfolio, including those of related parties to the Portfolio, are shown in the Statement of Operations.
Additionally, the Portfolio may invest in ETFs and mutual funds, which are subject to management fees and other fees that may cause the costs of investing in ETFs and mutual funds to be greater than the costs of owning the underlying securities directly. These indirect expenses of ETFs and mutual funds are not included in the amounts shown as expenses in the Portfolio’s Statement of Operations or in the expense ratios included in the Financial Highlights.
(F) Use of Estimates. In preparing financial statements in conformity with GAAP, management makes estimates and assumptions that affect the reported amounts and disclosures in the financial statements. Actual results could differ from those estimates.
(G) Securities Lending. In order to realize additional income, the Portfolio may engage in securities lending, subject to the limitations set forth in the 1940 Act and relevant guidance by the staff of the Securities
and Exchange Commission (“SEC”). In the event the Portfolio does engage in securities lending, the Portfolio will lend through its custodian, State Street Bank and Trust Company (“State Street”), acting as securities lending agent on behalf of the Portfolio. State Street will manage the Portfolio’s collateral in accordance with the securities lending agency agreement between the Portfolio and State Street, and indemnify the Portfolio against counterparty risk. The loans will be collateralized by cash (which may be invested in a money market fund) and/ornon-cash collateral (which may include, U.S. Treasury securities and/or U.S. Government Agency securities issued or guaranteed by the United States government or its agencies or instrumentalities) at least equal at all times to the market value of the securities loaned. The Portfolio may bear the risk of delay in recovery of, or loss of rights in, the securities loaned should the borrower of the securities experience financial difficulty. The Portfolio may also record a realized gain or loss on securities deemed sold due to a borrower’s inability to return securities on loan. The Portfolio bears the risk of any loss on investment of cash collateral. The Portfolio will receive compensation for lending its securities in the form of fees or it will retain a portion of interest on the investment of any cash collateral. The Portfolio will also continue to receive interest and dividends on the securities loaned and any gain or loss in the market price of the securities loaned that may occur during the term of the loan will be for the account of the Portfolio. Income earned from securities lending activities, if any, is reflected in the Statement of Operations. As of June 30, 2019, the Portfolio had securities on loan with an aggregate market value of $2,045,496; the total market value of collateral held by the Portfolio was $2,093,852. The market value of the collateral held includednon-cash collateral in the form of U.S. Treasury securities with a value of $1,830,017 and cash collateral which was invested into the State Street Navigator Securities Lending Government Money Market Portfolio with a value of $263,835.
(H) Indemnifications. Under the Fund’s organizational documents, its officers and trustees are indemnified against certain liabilities that may arise out of performance of their duties to the Fund. Additionally, in the normal course of business, the Portfolio enters into contracts with third-party service providers that contain a variety of representations and warranties and which may provide general indemnifications. The Portfolio’s maximum exposure under these arrangements is unknown, as this would involve future claims that may be made against the Portfolio that have not yet occurred. Based on experience, management is of the view that the risk of loss in connection with these potential indemnification obligations is remote. However, there can be no assurance that material liabilities related to such obligations will not arise in the future, which could adversely impact the Portfolio.
Note 3–Fees and Related Party Transactions
(A) Manager and Subadvisor. New York Life Investments, a registered investment adviser and an indirect,wholly-owned subsidiary of New York Life, serves as the Portfolio’s Manager, pursuant to an Amended and Restated Management Agreement (“Management Agreement”). The Manager provides offices, conducts clerical, recordkeeping and bookkeeping services and keeps most of the financial and accounting records required to be maintained by the Portfolio. Except for the portion of salaries and expenses that are the responsibility of the Portfolio, the Manager pays the salaries and expenses of all personnel affiliated with the Portfolio and certain operational expenses of the
| | |
| 20 | | MainStay VP MacKay Growth Portfolio |
Portfolio. The Portfolio reimburses New York Life Investments in an amount equal to a portion of the compensation of the Chief Compliance Officer attributable to the Portfolio. MacKay Shields LLC (“MacKay Shields” or the “Subadvisor”), a registered investment adviser and an indirect,wholly-owned subsidiary of New York Life, serves as Subadvisor to the Portfolio and is responsible for theday-to-day portfolio management of the Portfolio. Pursuant to the terms of an Amended and Restated Subadvisory Agreement (“Subadvisory Agreement”) between New York Life Investments and MacKay Shields, New York Life Investments pays for the services of the Subadvisor.
The Fund, on behalf of the Portfolio, pays New York Life Investments in its capacity as the Portfolio’s investment manager and administrator, pursuant to the Management Agreement, a monthly fee for the services performed and the facilities furnished at an annual rate of the Portfolio’s average daily net assets as follows: 0.70% up to $500 million; 0.65% from $500 million to $1 billion; 0.625% from $1 billion to $2 billion; and 0.60% in excess of $2 billion. During the six-month period ended June 30, 2019, the effective management fee rate was 0.69%.
During the six-month period ended June 30, 2019, New York Life Investments earned fees from the Portfolio in the amount of $2,106,971, and paid the Subadvisor in the amount of $1,053,485.
State Street providessub-administration andsub-accounting services to the Portfolio pursuant to an agreement with New York Life Investments.
These services include calculating the daily NAVs of the Portfolio, maintaining the general ledger andsub-ledger accounts for the calculation of the Portfolio’s NAVs and assisting New York Life Investments in conducting various aspects of the Portfolio’s administrative operations. For providing these services to the Portfolio, State Street is compensated by New York Life Investments.
Pursuant to an agreement between the Fund and New York Life Investments, New York Life Investments is responsible for providing or procuring certain regulatory reporting services for the Portfolio. The Portfolio will reimburse New York Life Investments for the actual costs incurred by New York Life Investments in connection with providing or procuring these services for the Portfolio.
(B) Distribution and Service Fees. The Fund, on behalf of the Portfolio, has entered into a distribution agreement with NYLIFE Distributors LLC (the “Distributor”), an indirect,wholly-owned subsidiary of New York Life. The Portfolio has adopted a distribution plan (the “Plan”) in accordance with the provisions of Rule 12b-1 under the 1940 Act. Under the Plan, the Distributor has agreed to provide, through its affiliates or independent third parties, various distribution-related, shareholder and administrative support services to the Service Class shareholders. For its services, the Distributor is entitled to a combined distribution and service fee accrued daily and paid monthly at an annual rate of 0.25% of the average daily net assets attributable to the Service Class shares of the Portfolio.
(C) Investments in Affiliates (in 000’s). During the six-month period ended June 30, 2019, purchases and sales transactions, income earned from investments and shares held of investment companies managed by New York Life Investments or its affiliates were as follows:
| | | | | | | | | | | | | | | | | | | | | | | | | | | | | | | | | | | | |
Affiliated Investment Company | | Value,
Beginning of
Period | | | Purchases
at Cost | | | Proceeds
from Sales | | | Net Realized
Gain/(Loss)
on Sales | | | Change in
Unrealized
Appreciation/
(Depreciation) | | | Value,
End of
Period | | | Dividend
Income | | | Other
Distributions | | | Shares
End of
Period | |
MainStay U.S. Government Liquidity Fund | | $ | 342 | | | $ | 100,121 | | | $ | (100,448 | ) | | $ | — | | | $ | — | | | $ | 15 | | | $ | 7 | | | $ | — | | | | 15 | |
Note 4–Federal Income Tax
As of June 30, 2019, the cost and unrealized appreciation (depreciation) of the Portfolio’s investment portfolio, including applicable derivative contracts and other financial instruments, as determined on a federal income tax basis, were as follows:
| | | | | | | | | | | | | | | | |
| | | Federal Tax
Cost | | | Gross
Unrealized
Appreciation | | | Gross
Unrealized
(Depreciation) | | | Net
Unrealized
Appreciation/
(Depreciation) | |
Investments in Securities | | $ | 558,657,694 | | | $ | 118,600,502 | | | $ | (15,175,980 | ) | | $ | 103,424,522 | |
During the year ended December 31, 2018, the tax character of distributions paid as reflected in the Statements of Changes in Net Assets was as follows:
| | |
|
| 2018 |
Tax-Based
Distributions
from Ordinary
Income | | Tax-Based
Distributions
from Long-Term
Gains |
| |
| $25,568,617 | | $13,035,015 |
Note 5–Custodian
State Street is the custodian of cash and securities held by the Portfolio. Custodial fees are charged to the Portfolio based on the Portfolio’s net assets and/or the market value of securities held by the Portfolio and the number of certain transactions incurred by the Portfolio.
Note 6–Line of Credit
The Portfolio and certain other funds managed by New York Life Investments maintain a line of credit with a syndicate of banks in order to secure a source of funds for temporary purposes to meet unanticipated or excessive redemption requests.
Effective July 30, 2019, under the credit agreement (the “Credit Agreement”), the aggregate commitment amount is $600,000,000 with an additional uncommitted amount of $100,000,000. The commitment fee is an annual rate of 0.15% of the average commitment amount payable quarterly, regardless of usage, to State Street, who serves as the agent to the syndicate. The commitment fee is allocated among the Portfolio and certain other funds managed by New York Life Investments based upon their respective net assets and other factors. Interest on any revolving credit loan is charged based upon the Federal Funds Rate or the one-month London Interbank Offered Rate (“LIBOR”), whichever is
Notes to Financial Statements(Unaudited) (continued)
higher. The Credit Agreement expires on July 28, 2020, although the Portfolio, certain other funds managed by New York Life Investments and the syndicate of banks may renew the Credit Agreement for an additional year on the same or different terms. Prior to July 30, 2019, the aggregate commitment amount and the commitment fee were the same as those under the current Credit Agreement. During the six-month period ended June 30, 2019, there were no borrowings made or outstanding with respect to the Portfolio under the Credit Agreement.
Note 7–Interfund Lending Program
Pursuant to an exemptive order issued by the SEC, the Portfolio, along with certain other funds managed by New York Life Investments, may participate in an interfund lending program. The interfund lending program provides an alternative credit facility that permits the Portfolio and certain other funds managed by New York Life Investments to lend or borrow money for temporary purposes directly to or from one another subject to the conditions of the exemptive order. During the six-month period ended June 30, 2019, there were no interfund loans made or outstanding with respect to the Portfolio.
Note 8–Purchases and Sales of Securities (in 000’s)
During the six-month period ended June 30, 2019, purchases and sales of securities, other thanshort-term securities, were $432,857 and $373,201, respectively.
Note 9–Capital Share Transactions
Transactions in capital shares for the six-month period ended June 30, 2019 and year ended December 31, 2018, were as follows:
| | | | | | | | |
Initial Class | | Shares | | | Amount | |
| | |
Six-month period ended June 30, 2019: | | | | | | | | |
Shares sold | | | 3,205,566 | | | $ | 98,769,782 | |
Shares redeemed | | | (1,186,052 | ) | | | (37,453,011 | ) |
| | | | |
Net increase (decrease) | | | 2,019,514 | | | $ | 61,316,771 | |
| | | | |
Year ended December 31, 2018: | | | | | | | | |
Shares sold | | | 428,320 | | | $ | 12,632,732 | |
Shares issued to shareholders in reinvestment of dividends and distributions | | | 1,039,798 | | | | 34,652,191 | |
Shares redeemed | | | (1,851,094 | ) | | | (60,985,824 | ) |
| | | | |
Net increase (decrease) | | | (382,976 | ) | | $ | (13,700,901 | ) |
| | | | |
| | | | | | | | |
Service Class | | Shares | | | Amount | |
Six-month period ended June 30, 2019: | | | | | | | | |
Shares sold | | | 17,270 | | | $ | 510,487 | |
Shares redeemed | | | (175,919 | ) | | | (5,476,596 | ) |
| | | | |
Net increase (decrease) | | | (158,649 | ) | | $ | (4,966,109 | ) |
| | | | |
Year ended December 31, 2018: | | | | | | | | |
Shares sold | | | 42,818 | | | $ | 1,333,421 | |
Shares issued to shareholders in reinvestment of dividends and distributions | | | 120,043 | | | | 3,951,441 | |
Shares redeemed | | | (463,786 | ) | | | (14,760,517 | ) |
| | | | |
Net increase (decrease) | | | (300,925 | ) | | $ | (9,475,655 | ) |
| | | | |
Note 10–Recent Accounting Pronouncement
To improve the effectiveness of fair value disclosure requirements, the Financial Accounting Standards Board recently issued Accounting Standard Update (ASU)2018-13, Fair Value Measurement Disclosure Framework—Changes to the Disclosure Requirements for Fair Value Measurement (ASU2018-13), which adds, removes, and modifies certain aspects relating to fair value disclosure. ASU2018-13 is effective for interim and annual reporting periods beginning after December 15, 2019; early adoption of the additions relating toASU 2018-13 is not required. Management has evaluated the implications of certain other provisions of the ASU and has determined to early adopt aspects related to the removal and modifications of certain fair value measurement disclosures under the ASU effective immediately. At this time, management is evaluating the implications of certain other provisions of the ASU related to new disclosure requirements and any impact on the financial statement disclosures has not yet been determined.
Note 11–Subsequent Events
In connection with the preparation of the financial statements of the Portfolio as of and for the six-month period ended June 30, 2019, events and transactions subsequent to June 30, 2019, through the date the financial statements were issued have been evaluated by the Portfolio’s management for possible adjustment and/or disclosure. No subsequent events requiring financial statement adjustment or disclosure have been identified.
| | |
| 22 | | MainStay VP MacKay Growth Portfolio |
Proxy Voting Policies and Procedures and Proxy Voting Record
A description of the policies and procedures that New York Life Investments uses to vote proxies related to the Portfolio’s securities is available without charge, upon request, (i) by calling800-598-2019; (ii) by visiting New York Life Investments website at https://www.nylinvestments.com/mainstay/products-and-performance/mainstay-vp-funds-trust; or (iii) by visiting the SEC’s website at www.sec.gov.
The Portfolio is required to file with the SEC its proxy voting record for the12-month period ending June 30 on Form N-PX. The Portfolio’s most recent Form N-PX or proxy voting record is available free of charge upon request (i) by calling800-598-2019; (ii) by visiting New York Life Investments website at https://www.nylinvestments.com/mainstay/products-and-performance/mainstay-vp-funds-trust; or (iii) by visiting the SEC’s website atwww.sec.gov.
Shareholder Reports and Quarterly Portfolio Disclosure
The Portfolio is required to file its complete schedule of portfolio holdings with the SEC 60 days after each fiscal quarter onForm N-PORT. The Portfolio’s holdings report is available without charge upon request, (i) by calling800-598-2019; (ii) by visiting New York Life Investments website at https://www.nylinvestments.com/mainstay/products-and-performance/mainstay-vp-funds-trust; or (iii) on the SEC’s website at www.sec.gov.
MainStay VP Portfolios
MainStay VP offers a wide range of Portfolios. The full array of MainStay VP offerings is listed here, with information about the manager, subadvisors, legal counsel, and independent registered public accounting firm.
Equity Portfolios
MainStay VP Eagle Small Cap Growth Portfolio
MainStay VP Emerging Markets Equity Portfolio
MainStay VP Epoch U.S. Equity Yield Portfolio
MainStay VP Fidelity Institutional AM® Utilities Portfolio†
MainStay VP Large Cap Growth Portfolio
MainStay VP MacKay Common Stock Portfolio
MainStay VP MacKay Growth Portfolio
MainStay VP MacKay International Equity Portfolio
MainStay VP MacKay Mid Cap Core Portfolio
MainStay VP MacKay S&P 500 Index Portfolio
MainStay VP MacKay Small Cap Core Portfolio
MainStay VP Mellon Natural Resources Portfolio
MainStay VP T. Rowe Price Equity Income Portfolio
Mixed Asset Portfolios
MainStay VP Balanced Portfolio
MainStay VP Income Builder Portfolio
MainStay VP Janus Henderson Balanced Portfolio
MainStay VP MacKay Convertible Portfolio
Income Portfolios
MainStay VP Bond Portfolio
MainStay VP Floating Rate Portfolio
MainStay VP Indexed Bond Portfolio
MainStay VP MacKay Government Portfolio
MainStay VP MacKay High Yield Corporate Bond Portfolio
MainStay VP MacKay Unconstrained Bond Portfolio
MainStay VP PIMCO Real Return Portfolio
Money Market
MainStay VP U.S. Government Money Market Portfolio
Alternative
MainStay VP Cushing Renaissance Advantage Portfolio
MainStay VP IQ Hedge Multi-Strategy Portfolio
Asset Allocation Portfolios
MainStay VP Conservative Allocation Portfolio
MainStay VP Growth Allocation Portfolio
MainStay VP Moderate Allocation Portfolio
MainStay VP Moderate Growth Allocation Portfolio
Manager
New York Life Investment Management LLC
New York, New York
Subadvisors
Candriam Belgium*
Brussels, Belgium
Cushing Asset Management, LP
Dallas, Texas
Eagle Asset Management, Inc.
St Petersburg, Florida
Epoch Investment Partners, Inc.
New York, New York
FIAM LLC
Smithfield, Rhode Island
IndexIQ Advisors LLC*
New York, New York
Janus Capital Management LLC
Denver, Colorado
MacKay Shields LLC*
New York, New York
Mellon Investments Corporation
Boston, Massachusetts
NYL Investors LLC*
New York, New York
Pacific Investment Management Company LLC
Newport Beach, California
T. Rowe Price Associates, Inc.
Baltimore, Maryland
Winslow Capital Management, LLC
Minneapolis, Minnesota
Distributor
NYLIFE Distributors LLC*
Jersey City, New Jersey
Custodian
State Street Bank and Trust Company
Boston, Massachusetts
Independent Registered Public Accounting Firm
PricewaterhouseCoopers LLP
New York, New York
Legal Counsel
Dechert LLP
Washington, District of Columbia
Some Portfolios may not be available in all products.
| † | Fidelity Institutional AM is a registered trade mark of FMR LLC. Used with permission. |
| * | An affiliate of New York Life Investment Management LLC |
Not part of the Semiannual Report
2019 Semiannual Report
This report is for the general information of New York Life Variable Annuities and NYLIAC Variable Universal Life Insurance Products policyowners. It must be preceded or accompanied by the appropriate product(s) and funds prospectuses if it is given to anyone who is not an owner of a New York Life variable annuity policy or a NYLIAC Variable Universal Life Insurance Product. This report does not offer for sale or solicit orders to purchase securities.
The performance data quoted in this report represents past performance. Past performance is no guarantee of future results. Due to market volatility and other factors, current performance may be lower or higher than the figures shown. The most recent month-end performance summary for your variable annuity or variable life policy is available by calling 800-598-2019 and is updated periodically on www.newyorklife.com.
The New York Life Variable Annuities and NYLIAC Variable Universal Life Insurance Products are issued by New York Life Insurance and Annuity Corporation (a Delaware Corporation) and distributed by NYLIFE Distributors LLC (Member FINRA/SIPC).
New York Life Insurance Company
New York Life Insurance and Annuity Corporation (NYLIAC) (A Delaware Corporation)
51 Madison Avenue, Room 551
New York, NY 10010
www.newyorklife.com
Printed on recycled paper
nylinvestments.com
NYLIFE Distributors LLC, 30 Hudson Street, Jersey City, NJ 07302
New York Life Investment Management LLC is the investment manager to the MainStay VP Funds Trust
©2019 by NYLIFE Distributors LLC. All rights reserved.
You may obtain copies of the Prospectus and the Statement of Additional Information free of charge, upon request, by callingtoll-free 800-598-2019 or writing to New York Life Insurance and Annuity Corporation, 51 Madison Avenue, New York, NY 10010.
| | | | |
| | | |
| Not FDIC Insured | | No Bank Guarantee | | May Lose Value |
| | | | |
| 1781610 | | | | MSVPCG10-08/19 (NYLIAC) NI513 |
MainStay VP Cushing® Renaissance Advantage Portfolio
Message from the President and Semiannual Report
Unaudited | June 30, 2019

Beginning on January 1, 2021, as permitted by regulations adopted by the Securities and Exchange Commission, paper copies of the MainStay VP Portfolio annual and semi-annual shareholder reports may no longer be sent by mail, unless you specifically request paper copies of the reports from the insurance company that offers your policy. Instead, the reports will be made available online, and you will be notified by mail each time a report is posted and provided with a website link to access the report. Instructions for requesting paper copies will be provided by your insurance company.
If you already elected to receive shareholder reports electronically, you will not be affected by this change and you need not take any action. At any time, you may elect to receive reports and other communications from the insurance company electronically by following the instructions provided by the insurance company.
You may elect to receive all future shareholder reports in paper form free of charge. You can inform the insurance company that you wish to receive paper copies of reports by following the instructions provided by the insurance company. Your election to receive reports in paper form will apply to all portfolio companies available under your contract.
| | | | | | | | |
| | | | | |
| Not FDIC/NCUA Insured | | Not a Deposit | | May Lose Value | | No Bank Guarantee | | Not Insured by Any Government Agency |

This page intentionally left blank
Message from the President
Most equity and fixed-income markets in the United States and around the world advanced in the face of conflicting political and macroeconomic forces during thesix-month period ended June 30, 2019.
The reporting period began on the heels of tumultuous December 2018, during which equities and equity-sensitive bonds spiked sharply lower on concerns regarding the pace of economic growth, a U.S. government shutdown and the potential impact of trade disputes between the United States and other nations, particularly China. Markets recovered quickly in early 2019 as trade tensions eased, the government reopened and the U.S. Federal Reserve Board (Fed) adopted a more patient tone regarding the future direction of interest rates. Markets moved broadly higher from January through April, supported by encouraging economic data and generally strong corporate earnings.
During the first four months of the reporting period, the improving economic environment encouraged investors to favor areas of the market viewed as offering greater return potential along with higher risks. Among U.S. stocks, cyclical, growth-oriented sectors tended to outperform more defensive, value-oriented sectors, whilelarge-cap stocks outperformed theirsmaller-cap counterparts. Within the S&P 500® Index, the information technology sector led the market’s advance, followed by communication services, consumer discretionary and consumer staples. Industrials, utilities, financials, materials, real estate and energy produced more modest gains. While some international equity markets outperformed or underperformed the U.S. market, on average international stocks mirrored the performance of their U.S. counterparts. Fixed-income securities gained ground as well, albeit along a more gradual trajectory. Among U.S. fixed-income instruments, corporate issues generally outperformed government bonds, with lower credit quality, higher yielding securities leading the sector’s advance. Long-term U.S. Treasury bond yields proved particularly weak, with
10-year yields dipping at times below3-month yields, reflecting investors’ continued concerns about domestic economic growth.
May 2019 saw a return of uncertainty and volatility. Trade discussions between the United States and China faltered, driving global equity prices lower. Government bond prices rose as investors sought safe havens. June brought yet anotherU-turn as equity prices climbed again after comments from the Fed raised hopes of an interest rate cut in response to weak economic data. Stock and bond prices rose, with U.S. equity markets ending the reporting period in record territory.
We are pleased to see renewed signs of strength in broad areas of the financial market. At the same time, we remained sharply focused on providing you, as a MainStay VP investor, with the experienced and disciplined fund management that we believe underpins an effective, long-term investment strategy. Whatever tomorrow’s investment environment brings, you can rely on our portfolio managers to pursue the objectives of their individual Portfolios as outlined in the prospectus with the energy and dedication you have come to expect.
The report that follows contains additional information on the market events, investment decisions and specific securities that shaped your VP Portfolio’s performance during the six months ended June 30, 2019. We encourage you to read the report carefully and use it to evaluate your Portfolio’s performance in light of your long-range financial plan.
Sincerely,

Kirk C. Lehneis
President
The opinions expressed are as of the date of this report and are subject to change. There is no guarantee that any forecast made will come to pass. This material does not constitute investment advice and is not intended as an endorsement of any specific investment. Past performance is no guarantee of future results.
Not part of the Semiannual Report
Table of Contents
Investors should refer to the Portfolio’s Summary Prospectus and/or Prospectus and consider the Portfolio’s investment objectives, strategies, risks, charges and expenses carefully before investing. The Summary Prospectus and/or Prospectus contain this and other information about the Portfolio. You may obtain copies of the Portfolio’s Summary Prospectus and/or the Prospectus and the Statement of Additional Information free of charge, upon request, by calling toll-free 800-598-2019, by writing to New York Life Insurance and Annuity Corporation, 51 Madison Avenue, Room 251, New York, New York 10010 or by sending an email to MainStayShareholdersServices@nylim.com. These documents are also available at nylinvestments.com/vpdocuments. Please read the Summary Prospectus and/or Prospectus carefully before investing. MainStay VP Funds Trust portfolios are separate account options which are purchased through a variable insurance or variable annuity contract.
Investment and Performance Comparison1(Unaudited)
Performance data quoted represents past performance. Past performance is no guarantee of future results. Because of market volatility and other factors, current performance may be lower or higher than the figures shown. Investment return and principal value will fluctuate, and as a result, when shares are redeemed, they may be worth more or less than their original cost. The performance table and graph do not reflect any deduction of sales charges, mortality and expense charges, contract charges or administrative charges. Please refer to the Performance Summary appropriate for your policy. For performance information current to the most recent month-end, please call800-598-2019 or visit www.newyorklife.com.
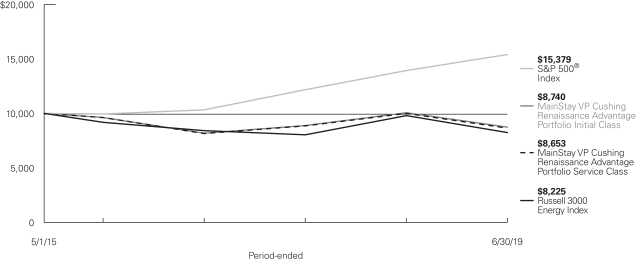
Average Annual Total Returns for the Period-Ended June 30, 2019
| | | | | | | | | | | | | | | | | | |
| Class | | Inception Date | | Six Months | | | One Year | | | Since Inception | | | Gross
Expense
Ratio2 | |
| | | | | |
| Initial Class Shares | | 5/1/2015 | | | 13.84 | % | | | –13.16 | % | | | –3.18 | % | | | 1.16 | % |
| Service Class Shares | | 5/1/2015 | | | 13.70 | | | | –13.38 | | | | –3.41 | | | | 1.41 | |
| | | | | | | | | | | | |
| Benchmark Performance | | Six
Months | | | One
Year | | | Since Inception | |
| | | |
S&P 500® Index3 | | | 18.54 | % | | | 10.42 | % | | | 10.88 | % |
Russell 3000 Energy Index4 | | | 12.29 | | | | –16.07 | | | | –4.58 | |
Morningstar Natural Resources Category Average5 | | | 11.97 | | | | –7.94 | | | | –1.32 | |
| 1. | Performance figures may reflect certain fee waivers and/or expense limitations, without which total returns may have been different. For information on current fee waivers and/or expense limitations (if any), please refer to the Notes to Financial Statements. |
| 2. | The gross expense ratios presented reflect the Portfolio’s “Total Annual Portfolio Operating Expenses” from the most recent Prospectus, as supplemented, and may differ from other expense ratios disclosed in this report. |
| 3. | The S&P 500® Index is the Portfolio’s primary broad-based securities market index for comparison purposes. “S&P 500®” is a trademark of The McGraw-Hill Companies, Inc. The S&P 500® Index is widely regarded as the standard index for measuringlarge-cap U.S. stock market performance. Results assume reinvestment of all dividends and capital gains. An investment cannot be made directly in an index. |
| 4. | The Russell 3000 Energy Index is the Fund’s secondary benchmark. The Russell 3000 Energy Index represents the energy sector of the Russell 3000 Index, an index that measures the performance of the largest 3,000 U.S. companies representing approximately 98% of the investable U.S. equity market. |
| 5. | The Morningstar Natural Resources Category Average is representative of funds that invest primarily on commodity-based industries such as energy, chemicals, minerals, and forest products in the United States or outside of the United States. Some funds invest across this spectrum to offer broad natural-resources exposure. Others concentrate heavily or even exclusively in specific industries. Funds that concentrate primarily in energy-related industries are part of the equity energy category. Results are based on average total returns of similar funds with all dividends and capital gain distributions reinvested. |
Cost in Dollars of a $1,000 Investment in MainStay VP Cushing Renaissance Advantage Portfolio (Unaudited)
The example below is intended to describe the fees and expenses borne by shareholders during the six-month period from January 1, 2019, to June 30, 2019, and the impact of those costs on your investment.
Example
As a shareholder of the Portfolio you incur two types of costs: (1) transaction costs, including exchange fees and sales charges (loads) on purchases (as applicable), and (2) ongoing costs, including management fees, distribution and/or service (12b-1) fees, and other Portfolio expenses (as applicable). This example is intended to help you understand your ongoing costs (in dollars) of investing in the Portfolio and to compare these costs with the ongoing costs of investing in other mutual funds. The example is based on an investment of $1,000 made at the beginning of the six-month period and held for the entire period from January 1, 2019, to June 30, 2019. Shares are only sold in connection with variable life and annuity contracts and the example does not reflect any contract level or transactional fees or expenses. If these costs had been included, your costs would have been higher.
This example illustrates your Portfolio’s ongoing costs in two ways:
Actual Expenses
The second and third data columns in the table below provide information about actual account values and actual expenses. You may use the information in these columns, together with the amount you invested, to estimate the expenses that you paid during the six months ended June 30, 2019. Simply divide your account value by $1,000
(for example, an $8,600 account value divided by $1,000 = 8.6), then multiply the result by the number under the heading entitled “Expenses Paid During Period” to estimate the expenses you paid on your account during this period.
Hypothetical Example for Comparison Purposes
The fourth and fifth data columns in the table below provide information about hypothetical account values and hypothetical expenses based on the Portfolio’s actual expense ratio and an assumed rate of return of 5% per year before expenses, which is not the Portfolio’s actual return. The hypothetical account values and expenses may not be used to estimate the actual ending account balances or expenses you paid for the six-month period shown. You may use this information to compare the ongoing costs of investing in the Portfolio with the ongoing costs of investing in other mutual funds. To do so, compare this 5% hypothetical example with the 5% hypothetical examples that appear in the shareholder reports of the other mutual funds.
Please note that the expenses shown in the table are meant to highlight your ongoing costs only and do not reflect any transactional costs, such as exchange fees or sales charges (loads). Therefore, the fourth and fifth data columns of the table are useful in comparing ongoing costs only and will not help you determine the relative total costs of owning different funds. In addition, if these transactional costs were included, your costs would have been higher.
| | | | | | | | | | | | | | | | | | | | | | |
| | | | | | | | | | | | | | | | | | |
| Share Class | | Beginning
Account
Value
1/1/19 | | | Ending Account
Value (Based
on Actual
Returns and
Expenses)
6/30/19 | | | Expenses
Paid
During
Period1 | | | Ending Account
Value (Based
on Hypothetical
5% Annualized
Return and
Actual Expenses)
6/30/19 | | | Expenses
Paid
During
Period1 | | | Net Expense
Ratio
During
Period2 |
| | | | | | |
| Initial Class Shares | | $ | 1,000.00 | | | $ | 1,138.40 | | | $ | 6.36 | | | $ | 1,018.84 | | | $ | 6.01 | | | 1.20% |
| | | | | | |
| Service Class Shares | | $ | 1,000.00 | | | $ | 1,137.00 | | | $ | 7.68 | | | $ | 1,017.60 | | | $ | 7.25 | | | 1.45% |
| 1. | Expenses are equal to the Portfolio’s annualized expense ratio of each class multiplied by the average account value over the period, divided by 365 and multiplied by 181 (to reflect the six-month period). The table above represents the actual expenses incurred during the six-month period. In addition to the fees and expenses which the Portfolio bears directly, it also indirectly bears a pro rata share of the fees and expenses of the underlying funds in which it invests. Such indirect expenses are not included in the above-reported expense figures. |
| 2. | Expenses are equal to the Portfolio’s annualized expense ratio to reflect the six-month period. |
| | |
| 6 | | MainStay VP Cushing Renaissance Advantage Portfolio |
Industry Composition as of June 30, 2019(Unaudited)
| | | | |
| |
| Oil, Gas & Consumable Fuels | | | 65.3 | % |
| |
| Energy Equipment & Services | | | 11.5 | |
| |
| Machinery | | | 5.0 | |
| |
| Chemicals | | | 3.8 | |
| |
| Construction & Engineering | | | 2.3 | |
| |
| Airlines | | | 2.1 | |
| |
| Electrical Equipment | | | 1.6 | |
| |
| Trading Companies & Distributors | | | 1.5 | |
| | | | |
| |
| Independent Power & Renewable Electricity Producers | | | 1.0 | % |
| |
| Metals & Mining | | | 1.0 | |
| |
| Marine | | | 0.7 | |
| |
| Short-Term Investments | | | 1.9 | |
| |
| Other Assets, Less Liabilities | | | 2.3 | |
| | | | |
| |
| | | 100.0 | % |
| | | | |
See Portfolio of Investments beginning on page 10 for specific holdings within these categories. The Portfolio’s holdings are subject to change.
Top Ten Holdings as of June 30, 2019(excluding short-term investments) (Unaudited)
| 2. | New Fortress Energy LLC |
| 5. | Viper Energy Partners, L.P. |
| 6. | Diamondback Energy, Inc. |
| 9. | Plains All American Pipeline, L.P. |
| 10. | Marathon Petroleum Corp. |
Portfolio Management Discussion and Analysis(Unaudited)
Answers to the questions reflect the views of portfolio managers Jerry V. Swank, Matthew A. Lemme, CFA, and Saket Kumar of Cushing® Asset Management, LP, the Portfolio’s Subadvisor.
How did MainStay VP Cushing Renaissance Advantage Portfolio perform relative to its benchmarks and peers during the six months ended June 30, 2019?
For the six months ended June 30, 2019, MainStay VP Cushing Renaissance Advantage Portfolio returned 13.84% for Initial Class shares and 13.70% for Service Class shares. Over the same period, both share classes underperformed the 18.54% return of the S&P 500® Index1, which is the Portfolio’s primary benchmark, and outperformed the 12.29% performance of the Russell 3000® Energy Index1, which is the Portfolio’s secondary benchmark. Both share classes also outperformed the 11.97% return of the Morningstar Natural Resources Category Average.
What factors affected the Portfolio’s performance relative to the S&P 500® Index during the reporting period?
The Portfolio’s relative performance lagged that of its benchmark, the S&P 500® Index, primarily due to fluctuating energy commodity prices. The Portfolio invests in companies along the energy value chain, as well as “Renaissance” companies anticipated to benefit from growing energy production and lower feedstock costs relative to global costs. For the energy value chain portion of the Portfolio’s strategy, commodity price uncertainty during the reporting period undermined equity performance. The Portfolio’s relative performance was also hurt by macroeconomic factors, related to expansion or contraction of gross domestic product (GDP). These factors appeared to constrain U.S. GDP during the same period, detracting from the equity performance of some of the Portfolio’s industrial holdings that are traditionally extremely sensitive to GDP growth. Although the Portfolio’s holdings are U.S.-focused, the Portfolio may still be susceptible to changes in currencies, trade policies, and global growth expectations.
Which subsectors were the strongest contributors to the Portfolio’s relative performance, and which subsectors were particularly weak?
During the reporting period, the subsectors making the strongest contributions to the Portfolio’s performance relative to the S&P 500® Index included midstream, industrial and exploration & production. (Contributions take weightings and total returns into account.) Holdings in these subsectors benefited from a rebound in energy commodity prices and economic expectations following high levels of volatility in late 2018. The most significant lagging subsectors—all of which still contributed positively to the Portfolio’s relative returns—included chemicals, utilities and transportation.
During the reporting period, which individual holdings made the strongest contributions to the Portfolio’s absolute performance and which holdings detracted the most?
During the reporting period, two of the Portfolio’s top three performers were energy companies benefiting from a rebound in energy prices in early 2019: land rig drillerPatterson-UTI Energy and Permian Basin exploration & production (E&P) company, Diamondback Energy. The Portfolio’s third leading holding was engineering and construction company, Jacobs Engineering, which showed evidence of effectively transitioning from cyclical construction work to more stable engineering markets.
The most significant detractor from the Portfolio’s absolute performance during the reporting period was oil services company Halliburton, which lagged because of an oversupplied pressure pumping market and expectations for pricing declines. Shares of Encana, a North American E&P company, underperformed because of gas exposure and negative investor reaction to an announced acquisition. Shares of liquefied natural gas importer New Fortress Energy faltered because of investor expectations of an equity raise.
Did the Portfolio make any significant purchases or sales during the reporting period?
The Portfolio’s largest purchase during the reporting period was in shares of oil mineral rights company Viper Energy Partners, reflecting our belief that the company’s unit price did not appropriately reflect the impact of crude oil prices in early 2019. The Portfolio also purchased shares of liquefied natural gas (LNG) importer New Fortress Energy because, in our opinion, the company occupied a unique market position from which to profit from declining LNG prices.
The Portfolio’s largest sales during the same period included logistics provider XPO Logistics, which in our view failed to execute on their stated company goals, and pump manufacturer Xylem, which we trimmed on valuation concerns following strong stock performance.
How did the Portfolio’s subsector weightings change during the reporting period?
The Portfolio’s largest subsector weighting increases during the reporting period included exploration & production and engineering & construction. The Portfolio’s largest sales during the same period were in the industrial and transportation subsectors.
| 1. | See footnote on page 5 for more information on benchmark and peer group returns. |
| | |
| 8 | | MainStay VP Cushing Renaissance Advantage Portfolio |
How was the Portfolio positioned at the end of the reporting period?
As of June 30, 2019, we see signs that current growth prospects for companies in the Portfolio’s universe are slowing. We project that growth is likely to wane, but not likely to turn negative in 2019. In our opinion, the recent sell-off provided a good
opportunity for the Portfolio to buy shares in companies with strong balance sheets and growth prospects at discounted prices. As of the end of the reporting period, we continue to believe the Portfolio’s focus on companies with strong balance sheets and growth prospects to be a prudent strategy in the current choppy market environment.
The opinions expressed are those of the portfolio managers as of the date of this report and are subject to change. There is no guarantee that any forecasts will come to pass. This material does not constitute investment advice and is not intended as an endorsement of any specific investment.
Not all MainStay VP Portfolios and/or share classes are available under all policies.
Portfolio of InvestmentsJune 30, 2019 (Unaudited)
| | | | | | | | |
| | |
Shares | | | Value | |
| Common Stocks 74.2%† | |
Airlines 2.1% | |
Southwest Airlines Co. | | | 24,724 | | | $ | 1,255,485 | |
| | | | | | | | |
|
Chemicals 3.8% | |
Dow, Inc. (a) | | | 18,917 | | | | 932,797 | |
LyondellBasell Industries N.V., Class A | | | 10,622 | | | | 914,873 | |
Westlake Chemical Corp. | | | 7,290 | | | | 506,363 | |
| | | | | | | | |
| | | | | | | 2,354,033 | |
| | | | | | | | |
Construction & Engineering 2.3% | |
Jacobs Engineering Group, Inc. | | | 16,335 | | | | 1,378,511 | |
| | | | | | | | |
|
Electrical Equipment 1.6% | |
Eaton Corp. PLC | | | 11,508 | | | | 958,386 | |
| | | | | | | | |
|
Energy Equipment & Services 11.5% | |
Apergy Corp. (a) | | | 24,604 | | | | 825,218 | |
Cactus, Inc., Class A (a) | | | 33,215 | | | | 1,100,081 | |
FTS International, Inc. (a) | | | 61,653 | | | | 344,024 | |
Halliburton Co. | | | 51,668 | | | | 1,174,930 | |
McDermott International, Inc. (a)(b) | | | 71,420 | | | | 689,917 | |
Patterson-UTI Energy, Inc. | | | 66,252 | | | | 762,560 | |
Schlumberger, Ltd. | | | 18,942 | | | | 752,755 | |
Select Energy Services, Inc., Class A (a) | | | 90,542 | | | | 1,051,193 | |
U.S. Well Services, Inc. (a) | | | 76,184 | | | | 367,207 | |
| | | | | | | | |
| | | | | | | 7,067,885 | |
| | | | | | | | |
Independent Power & Renewable Electricity Producers 1.0% | |
Clearway Energy, Inc., Class C | | | 35,449 | | | | 597,670 | |
| | | | | | | | |
|
Machinery 5.0% | |
Oshkosh Corp. | | | 15,026 | | | | 1,254,521 | |
Wabtec Corp. (b) | | | 16,596 | | | | 1,190,929 | |
Xylem, Inc. | | | 7,321 | | | | 612,328 | |
| | | | | | | | |
| | | | | | | 3,057,778 | |
| | | | | | | | |
Marine 0.7% | |
Kirby Corp. (a) | | | 5,678 | | | | 448,562 | |
| | | | | | | | |
|
Metals & Mining 1.0% | |
Allegheny Technologies, Inc. (a) | | | 24,764 | | | | 624,053 | |
| | | | | | | | |
|
Oil, Gas & Consumable Fuels 43.7% | |
Cheniere Energy, Inc. (a) | | | 35,809 | | | | 2,451,126 | |
Cimarex Energy Co. | | | 10,862 | | | | 644,443 | |
Concho Resources, Inc. | | | 11,082 | | | | 1,143,441 | |
Diamondback Energy, Inc. | | | 21,007 | | | | 2,289,133 | |
Encana Corp. | | | 192,884 | | | | 989,495 | |
EnLink Midstream LLC | | | 36,671 | | | | 370,010 | |
Golar LNG, Ltd. | | | 65,805 | | | | 1,216,077 | |
HollyFrontier Corp. | | | 17,679 | | | | 818,184 | |
| | | | | | | | |
| | |
Shares | | | Value | |
Oil, Gas & Consumable Fuels (continued) | |
Marathon Petroleum Corp. | | | 27,974 | | | $ | 1,563,187 | |
Matador Resources Co. (a) | | | 30,955 | | | | 615,385 | |
New Fortress Energy LLC (a) | | | 229,417 | | | | 2,686,473 | |
Occidental Petroleum Corp. | | | 11,540 | | | | 580,231 | |
Parsley Energy, Inc., Class A (a) | | | 68,544 | | | | 1,303,022 | |
Pembina Pipeline Corp. | | | 19,697 | | | | 732,925 | |
Phillips 66 | | | 6,264 | | | | 585,935 | |
Pioneer Natural Resources Co. | | | 7,405 | | | | 1,139,333 | |
Rosehill Resources, Inc. (a)(b) | | | 240,961 | | | | 891,556 | |
Targa Resources Corp. | | | 50,178 | | | | 1,969,988 | |
Tellurian, Inc. (a)(b) | | | 115,424 | | | | 906,078 | |
Valero Energy Corp. | | | 29,253 | | | | 2,504,349 | |
WPX Energy, Inc. (a) | | | 124,964 | | | | 1,438,336 | |
| | | | | | | | |
| | | | | | | 26,838,707 | |
| | | | | | | | |
Trading Companies & Distributors 1.5% | |
United Rentals, Inc. (a) | | | 7,006 | | | | 929,206 | |
| | | | | | | | |
Total Common Stocks
(Cost $47,901,709) | | | | | | | 45,510,276 | |
| | | | | | | | |
|
| MLPs and Related Companies 21.6% | |
Oil, Gas & Consumable Fuels 21.6% | |
DCP Midstream, L.P. | | | 77,167 | | | | 2,260,993 | |
Energy Transfer, L.P. | | | 201,644 | | | | 2,839,148 | |
Enterprise Products Partners, L.P. | | | 45,117 | | | | 1,302,528 | |
EQM Midstream Partners, L.P. | | | 15,204 | | | | 679,315 | |
GasLog Partners, L.P. | | | 71,671 | | | | 1,521,575 | |
Plains All American Pipeline, L.P. | | | 70,601 | | | | 1,719,134 | |
Tallgrass Energy L.P. | | | 23,394 | | | | 493,847 | |
Viper Energy Partners, L.P. | | | 78,885 | | | | 2,431,236 | |
| | | | | | | | |
Total MLPs and Related Companies
(Cost $13,929,133) | | | | | | | 13,247,776 | |
| | | | | | | | |
|
| Short-Term Investments 1.9% | |
Affiliated Investment Company 0.1% | |
MainStay U.S. Government Liquidity Fund, 2.03% (c) | | | 70,943 | | | | 70,943 | |
| | | | | | | | |
|
Unaffiliated Investment Company 1.8% | |
State Street Navigator Securities Lending Government Money Market Portfolio, 2.33% (c)(d) | | | 1,139,182 | | | | 1,139,182 | |
| | | | | | | | |
TotalShort-Term Investments
(Cost $1,210,125) | | | | | | | 1,210,125 | |
| | | | | | | | |
Total Investments
(Cost $63,040,967) | | | 97.7 | % | | | 59,968,177 | |
Other Assets, Less Liabilities | | | 2.3 | | | | 1,400,350 | |
Net Assets | | | 100.0 | % | | $ | 61,368,527 | |
| | | | |
| 10 | | MainStay VP Cushing Renaissance Advantage Portfolio | | The notes to the financial statements are an integral part of,
and should be read in conjunction with, the financial statements. |
| † | Percentages indicated are based on Portfolio net assets. |
| (a) | Non-income producing security. |
| (b) | All or a portion of this security was held on loan. As of June 30, 2019, the aggregate market value of securities on loan was $2,311,646; the total market value of collateral held by the Portfolio was $2,356,476. The market value of the collateral held included non-cash collateral in the form of U.S. Treasury securities with a value of $1,217,294 (See Note 2(J)). |
| (c) | Current yield as of June 30, 2019. |
| (d) | Represents security purchased with cash collateral received for securities on loan. |
The following abbreviation is used in the preceding pages:
MLP—Master limited partnership
The following is a summary of the fair valuations according to the inputs used as of June 30, 2019, for valuing the Portfolio’s assets:
| | | | | | | | | | | | | | | | |
Description | | Quoted
Prices in
Active
Markets for
Identical
Assets
(Level 1) | | | Significant
Other
Observable
Inputs
(Level 2) | | | Significant
Unobservable
Inputs
(Level 3) | | | Total | |
| | | | |
Asset Valuation Inputs | | | | | | | | | | | | | | | | |
| Investments in Securities (a) | | | | | | | | | | | | | | | | |
| Common Stocks | | $ | 45,510,276 | | | $ | — | | | $ | — | | | $ | 45,510,276 | |
| MLPs and Related Companies | | | 13,247,776 | | | | — | | | | — | | | | 13,247,776 | |
| Short-Term Investments | | | | | | | | | | | | | | | | |
Affiliated Investment Company | | | 70,943 | | | | — | | | | — | | | | 70,943 | |
Unaffiliated Investment Company | | | 1,139,182 | | | | — | | | | — | | | | 1,139,182 | |
| | | | | | | | | | | | | | | | |
| TotalShort-Term Investments | | | 1,210,125 | | | | — | | | | — | | | | 1,210,125 | |
| | | | | | | | | | | | | | | | |
| Total Investments in Securities | | $ | 59,968,177 | | | $ | — | | | $ | — | | | $ | 59,968,177 | |
| | | | | | | | | | | | | | | | |
| (a) | For a complete listing of investments and their industries, see the Portfolio of Investments. |
| | | | | | |
The notes to the financial statements are an integral part of,
and should be read in conjunction with, the financial statements. | | | | | 11 | |
Statement of Assets and Liabilitiesas of June 30, 2019 (Unaudited)
| | | | |
| Assets | | | | |
Investment in unaffiliated securities, at value
(identified cost $62,970,024) including securities on loan of $2,311,646 | | $ | 59,897,234 | |
Investment in affiliated investment company, at value (identified cost $70,943) | | | 70,943 | |
Cash | | | 3,074 | |
Receivables: | | | | |
Investment securities sold | | | 2,861,343 | |
Dividends | | | 42,460 | |
Portfolio shares sold | | | 26,013 | |
Securities lending | | | 2,101 | |
Other assets | | | 546 | |
| | | | |
Total assets | | | 62,903,714 | |
| | | | |
|
| Liabilities | |
Cash collateral received for securities on loan | | | 1,139,182 | |
Payables: | | | | |
Portfolio shares redeemed | | | 292,888 | |
Manager (See Note 3) | | | 58,982 | |
Professional fees | | | 26,025 | |
Custodian | | | 6,639 | |
NYLIFE Distributors (See Note 3) | | | 5,007 | |
Shareholder communication | | | 3,915 | |
Trustees | | | 186 | |
Accrued expenses | | | 2,363 | |
| | | | |
Total liabilities | | | 1,535,187 | |
| | | | |
Net assets | | $ | 61,368,527 | |
| | | | |
| |
| Composition of Net Assets | | | | |
Shares of beneficial interest outstanding (par value of $.001 per share) unlimited number of shares authorized | | $ | 7,113 | |
Additional paid-in capital | | | 87,143,894 | |
| | | | |
| | | 87,151,007 | |
Total distributable earnings (loss) | | | (25,782,480 | ) |
| | | | |
Net assets | | $ | 61,368,527 | |
| | | | |
| | | | |
Initial Class | | | | |
Net assets applicable to outstanding shares | | $ | 35,973,252 | |
| | | | |
Shares of beneficial interest outstanding | | | 4,154,565 | |
| | | | |
Net asset value per share outstanding | | $ | 8.66 | |
| | | | |
Service Class | | | | |
Net assets applicable to outstanding shares | | $ | 25,395,275 | |
| | | | |
Shares of beneficial interest outstanding | | | 2,958,331 | |
| | | | |
Net asset value per share outstanding | | $ | 8.58 | |
| | | | |
| | | | |
| 12 | | MainStay VP Cushing Renaissance Advantage Portfolio | | The notes to the financial statements are an integral part of,
and should be read in conjunction with, the financial statements. |
Statement of Operationsfor the six months ended June 30, 2019 (Unaudited)
| | | | |
| Investment Income (Loss) | | | | |
Income | | | | |
Dividends-unaffiliated (a) | | $ | 1,578,998 | |
Securities lending | | | 60,949 | |
Dividends-affiliated | | | 54,268 | |
Interest | | | 59 | |
| | | | |
Total income | | | 1,694,274 | |
| | | | |
Expenses | | | | |
Manager (See Note 3) | | | 556,790 | |
Distribution/Service—Service Class (See Note 3) | | | 32,368 | |
Professional fees | | | 28,916 | |
Custodian | | | 10,048 | |
Shareholder communication | | | 6,039 | |
Trustees | | | 1,581 | |
Miscellaneous | | | 4,551 | |
| | | | |
Total expenses | | | 640,293 | |
| | | | |
Net investment income (loss) | | | 1,053,981 | |
| | | | |
|
| Realized and Unrealized Gain (Loss) on Investments and Foreign Currency Transactions | |
Net realized gain (loss) on: | | | | |
Unaffiliated investment transactions | | | (11,624,917 | ) |
Foreign currency transactions | | | 50 | |
| | | | |
Net realized gain (loss) on investments and foreign currency transactions | | | (11,624,867 | ) |
| | | | |
Net change in unrealized appreciation (depreciation) on: | | | | |
Unaffiliated investments | | | 25,615,797 | |
Translation of other assets and liabilities in foreign currencies | | | 26 | |
| | | | |
Net change in unrealized appreciation (depreciation) on investments and foreign currency transactions | | | 25,615,823 | |
| | | | |
Net realized and unrealized gain (loss) on investments and foreign currency transactions | | | 13,990,956 | |
| | | | |
Net increase (decrease) in net assets resulting from operations | | $ | 15,044,937 | |
| | | | |
| (a) | Dividends recorded net of foreign withholding taxes in the amount of $3,644. |
| | | | | | |
The notes to the financial statements are an integral part of,
and should be read in conjunction with, the financial statements. | | | | | 13 | |
Statements of Changes in Net Assets
for the six months ended June 30, 2019 (Unaudited) and the year ended December 31, 2018
| | | | | | | | |
| | | 2019 | | | 2018 | |
| Increase (Decrease) in Net Assets | |
Operations: | | | | | | | | |
Net investment income (loss) | | $ | 1,053,981 | | | $ | (1,176,255 | ) |
Net realized gain (loss) on investments and foreign currency transactions | | | (11,624,867 | ) | | | 541,802 | |
Net change in unrealized appreciation (depreciation) on investments and foreign currency transactions | | | 25,615,823 | | | | (46,014,505 | ) |
| | | | |
Net increase (decrease) in net assets resulting from operations | | | 15,044,937 | | | | (46,648,958 | ) |
| | | | |
Capital share transactions: | | | | | | | | |
Net proceeds from sale of shares | | | 4,459,328 | | | | 29,557,119 | |
Cost of shares redeemed | | | (70,949,494 | ) | | | (61,396,911 | ) |
| | | | |
Increase (decrease) in net assets derived from capital share transactions | | | (66,490,166 | ) | | | (31,839,792 | ) |
| | | | |
Net increase (decrease) in net assets | | | (51,445,229 | ) | | | (78,488,750 | ) |
| | |
| Net Assets | | | | | | | | |
Beginning of period | | | 112,813,756 | | | | 191,302,506 | |
| | | | |
End of period | | $ | 61,368,527 | | | $ | 112,813,756 | |
| | | | |
| | | | |
| 14 | | MainStay VP Cushing Renaissance Advantage Portfolio | | The notes to the financial statements are an integral part of,
and should be read in conjunction with, the financial statements. |
Financial Highlightsselected per share data and ratios
| | | | | | | | | | | | | | | | | | | | |
| | | |
| | | Six months
ended
June 30, | | | Year ended December 31, | | | May 1,
2015**
through
December 31, | |
| | | | | |
| Initial Class | | 2019* | | | 2018 | | | 2017 | | | 2016 | | | 2015 | |
| | | | | |
Net asset value at beginning of period | | $ | 7.61 | | | $ | 10.52 | | | $ | 9.75 | | | $ | 7.59 | | | $ | 10.00 | |
| | | | | | | | | | | | | | | | | | | | |
| | | | | |
Net investment income (loss) (a) | | | 0.09 | | | | (0.07 | ) | | | (0.05 | ) | | | 0.00 | ‡ | | | 0.04 | |
| | | | | |
Net realized and unrealized gain (loss) on investments | | | 0.96 | | | | (2.84 | ) | | | 0.82 | | | | 2.18 | | | | (2.40 | ) |
| | | | | |
Net realized and unrealized gain (loss) on foreign currency transactions | | | 0.00 | ‡ | | | (0.00 | )‡ | | | (0.00 | )‡ | | | 0.00 | ‡ | | | (0.00 | )‡ |
| | | | | | | | | | | | | | | | | | | | |
| | | | | |
Total from investment operations | | | 1.05 | | | | (2.91 | ) | | | 0.77 | | | | 2.18 | | | | (2.36 | ) |
| | | | | | | | | | | | | | | | | | | | |
| | | | | |
From net investment income | | | — | | | | — | | | | — | | | | (0.02 | ) | | | (0.05 | ) |
| | | | | | | | | | | | | | | | | | | | |
| | | | | |
Net asset value at end of period | | $ | 8.66 | | | $ | 7.61 | | | $ | 10.52 | | | $ | 9.75 | | | $ | 7.59 | |
| | | | | | | | | | | | | | | | | | | | |
| | | | | |
Total investment return (b) | | | 13.80 | %(c) | | | (27.66 | %)(c) | | | 7.90 | % | | | 28.77 | % | | | (23.58 | %) |
| | | | | |
| Ratios (to average net assets)/Supplemental Data: | | | | | | | | | | | | | | | | | | | | |
| | | | | |
Net investment income (loss) | | | 2.20 | %†† | | | (0.66 | %) | | | (0.49 | %) | | | 0.06 | % | | | 0.60 | % †† |
| | | | | |
Net expenses (d) | | | 1.20 | %†† | | | 1.21 | % | | | 1.31 | % | | | 1.38 | % | | | 1.35 | % †† |
| | | | | |
Portfolio turnover rate | | | 77 | % | | | 162 | % | | | 116 | % | | | 356 | % | | | 122 | % (e) |
| | | | | |
Net assets at end of period (in 000’s) | | $ | 35,973 | | | $ | 90,681 | | | $ | 158,846 | | | $ | 71,036 | | | $ | 58,364 | |
| ‡ | Less than one cent per share. |
| (a) | Per share data based on average shares outstanding during the period. |
| (b) | Total return does not reflect any deduction of sales charges, mortality and expense charges, contract charges or administrative charges. For periods of less than one year, total return is not annualized. |
| (c) | Total investment return may reflect adjustments to conform to generally accepted accounting principles. |
| (d) | In addition to the fees and expenses which the Portfolio bears directly, it also indirectly bears a pro-rata share of the fees and expenses of the underlying funds in which it invests. Such indirect expenses are not included in the above expense ratios. |
| (e) | Portfolio turnover rate is not annualized. |
| | | | | | | | | | | | | | | | | | | | |
| | | |
| | | Six months
ended
June 30, | | | Year ended December 31, | | | May 1,
2015**
through
December 31, | |
| | | | | |
| Service Class | | 2019* | | | 2018 | | | 2017 | | | 2016 | | | 2015 | |
| | | | | |
Net asset value at beginning of period | | $ | 7.55 | | | $ | 10.47 | | | $ | 9.73 | | | $ | 7.59 | | | $ | 10.00 | |
| | | | | | | | | | | | | | | | | | | | |
| | | | | |
Net investment income (loss) (a) | | | 0.07 | | | | (0.09 | ) | | | (0.07 | ) | | | (0.02 | ) | | | 0.02 | |
| | | | | |
Net realized and unrealized gain (loss) on investments | | | 0.96 | | | | (2.83 | ) | | | 0.81 | | | | 2.18 | | | | (2.39 | ) |
| | | | | |
Net realized and unrealized gain (loss) on foreign currency transactions | | | 0.00 | ‡ | | | (0.00 | )‡ | | | (0.00 | )‡ | | | 0.00 | ‡ | | | (0.00 | )‡ |
| | | | | | | | | | | | | | | | | | | | |
| | | | | |
Total from investment operations | | | 1.03 | | | | (2.92 | ) | | | 0.74 | | | | 2.16 | | | | (2.37 | ) |
| | | | | | | | | | | | | | | | | | | | |
| | | | | |
| Less dividends: | | | | | | | | | | | | | | | | | | | | |
| | | | | |
From net investment income | | | — | | | | — | | | | — | | | | (0.02 | ) | | | (0.04 | ) |
| | | | | | | | | | | | | | | | | | | | |
| | | | | |
Net asset value at end of period | | $ | 8.58 | | | $ | 7.55 | | | $ | 10.47 | | | $ | 9.73 | | | $ | 7.59 | |
| | | | | | | | | | | | | | | | | | | | |
| | | | | |
Total investment return (b) | | | 13.64 | %(c) | | | (27.89 | %)(c) | | | 7.61 | % (c) | | | 28.48 | % | | | (23.70 | %) |
| | | | | |
| Ratios (to average net assets)/Supplemental Data: | | | | | | | | | | | | | | | | | | | | |
| | | | | |
Net investment income (loss) | | | 1.74 | %†† | | | (0.91 | %) | | | (0.74 | %) | | | (0.37 | %) | | | 0.37 | % †† |
| | | | | |
Net expenses (d) | | | 1.45 | %†† | | | 1.46 | % | | | 1.56 | % | | | 1.64 | % | | | 1.60 | % †† |
| | | | | |
Portfolio turnover rate | | | 77 | % | | | 162 | % | | | 116 | % | | | 356 | % | | | 122 | % (e) |
| | | | | |
Net assets at end of period (in 000’s) | | $ | 25,395 | | | $ | 22,133 | | | $ | 32,457 | | | $ | 26,714 | | | $ | 5,927 | |
| ‡ | Less than one cent per share. |
| (a) | Per share data based on average shares outstanding during the period. |
| (b) | Total return does not reflect any deduction of sales charges, mortality and expense charges, contract charges or administrative charges. For periods of less than one year, total return is not annualized. |
| (c) | Total investment return may reflect adjustments to conform to generally accepted accounting principles. |
| (d) | In addition to the fees and expenses which the Portfolio bears directly, it also indirectly bears a pro-rata share of the fees and expenses of the underlying funds in which it invests. Such indirect expenses are not included in the above expense ratios. |
| (e) | Portfolio turnover rate is not annualized. |
| | | | | | |
The notes to the financial statements are an integral part of,
and should be read in conjunction with, the financial statements. | | | | | 15 | |
Notes to Financial Statements(Unaudited)
Note 1–Organization and Business
MainStay VP Funds Trust (the “Fund”) was organized as a Delaware statutory trust on February 1, 2011. The Fund is registered under the Investment Company Act of 1940, as amended (the “1940 Act”), as an open-end management investment company. The Fund is comprised of thirty-one separate series (collectively referred to as the “Portfolios”). These financial statements and notes relate to the MainStay VP Cushing Renaissance Advantage Portfolio (the “Portfolio”), a “non-diversified” portfolio, as that term is defined in the 1940 Act, as interpreted or modified by regulatory authorities having jurisdiction, from time to time. Since the Portfolio has historically operated as a “diversified” portfolio, it will not operate as “non-diversified” without first obtaining shareholder approval.
Shares of the Portfolio are currently offered to certain separate accounts to fund variable annuity policies and variable universal life insurance policies issued by New York Life Insurance and Annuity Corporation (“NYLIAC”), awholly-owned subsidiary of New York Life Insurance Company (“New York Life”) and may also be offered to fund variable annuity policies and variable universal life insurance policies issued by other insurance companies. NYLIAC allocates shares of the Portfolios to, among others, certain NYLIAC separate accounts. Shares of the Portfolio are also offered to the MainStay VP Conservative Allocation Portfolio, MainStay VP Moderate Allocation Portfolio, MainStay VP Moderate Growth Allocation Portfolio and MainStay VP Growth Allocation Portfolio, which operate as “funds-of-funds.”
The Portfolio currently offers two classes of shares. Initial Class and Service Class shares commenced operations on May 1, 2015. Shares of the Portfolio are offered and are redeemed at a price equal to their respective net asset value (“NAV”) per share. No sales or redemption charge is applicable to the purchase or redemption of the Portfolio’s shares. Under the terms of the Fund’s multiple class plan, adopted pursuant to Rule 18f-3 under the 1940 Act, the classes differ in that, among other things, Service Class shares of the Portfolio pay a combined distribution and service fee of 0.25% of average daily net assets attributable to Service Class shares of the Portfolio to the Distributor (as defined in Note 3(B)) pursuant to a plan adopted in accordance with Rule 12b-1 under the 1940 Act. Contract owners of variable annuity contracts purchased after June 2, 2003, are permitted to invest only in the Service Class shares.
The Portfolio’s investment objective is to seek total return.
Note 2–Significant Accounting Policies
The Portfolio is an investment company and accordingly follows the investment company accounting and reporting guidance of the Financial Accounting Standards Board (“FASB”) Accounting Standard CodificationTopic 946 Financial Services—Investment Companies. The Portfolio prepares its financial statements in accordance with generally accepted accounting principles (“GAAP”) in the United States of America and follows the significant accounting policies described below.
(A) Securities Valuation. Investments are usually valued as of the close of regular trading on the New York Stock Exchange (the “Exchange”) (usually 4:00 p.m. Eastern time) on each day the Portfolio is open for business (“valuation date”).
The Board of Trustees of the Fund (the “Board”) adopted procedures establishing methodologies for the valuation of the Portfolio’s securities and other assets and delegated the responsibility for valuation determinations under those procedures to the Valuation Committee of the Fund (the “Valuation Committee”). The Board authorized the Valuation Committee to appoint a Valuation Subcommittee (the “Subcommittee”) to deal in the first instance with establishing the prices of securities for which market quotations are not readily available or the prices of which are not otherwise readily determinable under these procedures. The Subcommittee meets (in person, via electronic mail or via teleconference) on an as-needed basis. Subsequently, the Valuation Committee meets to ensure that actions taken by the Subcommittee were appropriate. The procedures state that, subject to the oversight of the Board and unless otherwise noted, the responsibility for theday-to-day valuation of portfolio assets (including fair value measurements for the Portfolio’s assets and liabilities) rests with New York Life Investment Management LLC (“New York Life Investments” or the “Manager”), aided to whatever extent necessary by the Subadvisor (as defined in Note 3(A)).
To assess the appropriateness of security valuations, the Manager, the Subadvisor or the Portfolio’s third-party service provider, who is subject to oversight by the Manager, regularly compares prior day prices, prices on comparable securities and the sale prices to the prior and current day prices and challenges prices with changes exceeding certain tolerance levels with third-party pricing services or broker sources. For those securities valued through either a standardized fair valuation methodology or a fair valuation measurement, the Subcommittee deals in the first instance with such valuation and the Valuation Committee reviews and affirms, if appropriate, the reasonableness of the valuation based on such methodologies and measurements on a regular basis after considering information that is reasonably available and deemed relevant by the Valuation Committee. Any action taken by the Subcommittee with respect to the valuation of a portfolio security or other asset is submitted for review and ratification (if appropriate) to the Valuation Committee and the Board at the next regularly scheduled meeting.
“Fair value” is defined as the price the Portfolio would reasonably expect to receive upon selling an asset or liability in an orderly transaction to an independent buyer in the principal or most advantageous market for the asset or liability. Fair value measurements are determined within a framework that establishes a three-tier hierarchy which maximizes the use of observable market data and minimizes the use of unobservable inputs to establish a classification of fair value measurements for disclosure purposes. “Inputs” refer broadly to the assumptions that market participants would use in pricing the asset or liability, including assumptions about risk, such as the risk inherent in a particular valuation technique used to measure fair value using a pricing model and/or the risk inherent in the inputs for the valuation technique. Inputs may be observable or unobservable. Observable inputs reflect the assumptions market participants would use in pricing the asset or liability based on market data obtained from sources independent of the Portfolio. Unobservable inputs reflect the Portfolio’s own assumptions about the assumptions market participants would use in pricing the asset or liability based on the information available. The inputs or methodology used for valuing assets or liabilities may not be an indication of the risks
| | |
| 16 | | MainStay VP Cushing Renaissance Advantage Portfolio |
associated with investing in those assets or liabilities. The three-tier hierarchy of inputs is summarized below.
| • | | Level 1—quoted prices in active markets for an identical asset or liability |
| • | | Level 2—other significant observable inputs (including quoted prices for a similar asset or liability in active markets, interest rates and yield curves, prepayment speeds, credit risk, etc.) |
| • | | Level 3—significant unobservable inputs (including the Portfolio’s own assumptions about the assumptions that market participants would use in measuring fair value of an asset or liability) |
The level of an asset or liability within the fair value hierarchy is based on the lowest level of an input, both individually and in the aggregate, that is significant to the fair value measurement. As of June 30, 2019, the aggregate value by input level of the Portfolio’s assets and liabilities is included at the end of the Portfolio’s Portfolio of Investments.
The Portfolio may use third-party vendor evaluations, whose prices may be derived from one or more of the following standard inputs, among others:
| | |
• Broker/dealer quotes | | • Benchmark securities |
• Two-sided markets | | • Reference data (corporate actions or material event notices) |
• Bids/offers | | • Monthly payment information |
• Industry and economic events | | • Reported trades |
An asset or liability for which market values cannot be measured using the methodologies described above is valued by methods deemed reasonable in good faith by the Valuation Committee, following the procedures established by the Board, to represent fair value. Under these procedures, the Portfolio generally uses a market-based approach which may use related or comparable assets or liabilities, recent transactions, market multiples, book values and other relevant information. The Portfolio may also use an income-based valuation approach in which the anticipated future cash flows of the asset or liability are discounted to calculate fair value. Discounts may also be applied due to the nature and/or duration of any restrictions on the disposition of the asset or liability. Fair value represents a good faith approximation of the value of a security. Fair value determinations involve the consideration of a number of subjective factors, an analysis of applicable facts and circumstances and the exercise of judgment. As a result, it is possible that the fair value for a security determined in good faith in accordance with the Portfolio’s valuation procedures may differ from valuations for the same security determined by other funds using their own valuation procedures. Although the Portfolio’s valuation procedures are designed to value a security at the price the Portfolio may reasonably expect to receive upon the security’s sale in an orderly transaction, there can be no assurance that any fair value determination thereunder would, in fact, approximate the amount that the Portfolio would actually realize upon the sale of the security or the price at which the security would trade if a reliable market price were readily available. During the six-month period ended June 30, 2019, there were no material changes to the fair value methodologies.
Securities which may be valued in this manner include, but are not limited to: (i) a security for which trading has been halted or suspended;
(ii) a debt security that has recently gone into default and for which there is not a current market quotation; (iii) a security of an issuer that has entered into a restructuring; (iv) a security that has been delisted from a national exchange; (v) a security for which the market price is not readily available from a third-party pricing source or, if so provided, does not, in the opinion of the Manager or the Subadvisor, reflect the security’s market value; (vi) a security subject to trading collars for which no or limited trading takes place; and (vii) a security whose principal market has been temporarily closed at a time when, under normal conditions, it would be open. Securities valued in this manner are generally categorized as Level 3 in the hierarchy. As of June 30, 2019, there were no securities held by the Portfolio that were fair valued in such a manner.
Certain securities held by the Portfolio may principally trade in foreign markets. Events may occur between the time the foreign markets close and the time at which the Portfolio’s NAVs are calculated. These events may include, but are not limited to, situations relating to a single issuer in a market sector, significant fluctuations in U.S. or foreign markets, natural disasters, armed conflicts, governmental actions or other developments not tied directly to the securities markets. Should the Manager or the Subadvisor conclude that such events may have affected the accuracy of the last price of such securities reported on the local foreign market, the Subcommittee may, pursuant to procedures adopted by the Board, adjust the value of the local price to reflect the estimated impact on the price of such securities as a result of such events. In this instance, securities are generally categorized as Level 3 in the hierarchy. Additionally, certain foreign equity securities are also fair valued whenever the movement of a particular index exceeds certain thresholds. In such cases, the securities are fair valued by applying factors provided by a third-party vendor in accordance with valuation procedures adopted by the Board and are generally categorized as Level 2 in the hierarchy.
Equity securities are valued at the last quoted sales prices as of the close of regular trading on the relevant exchange on each valuation date. Securities that are not traded on the valuation date are valued at the mean of the last quoted bid and ask prices. Prices are normally taken from the principal market in which each security trades. These securities are generally categorized as Level 1 in the hierarchy.
Investments in mutual funds, including money market funds, are valued at their respective NAVs as of the close of the Exchange on the valuation date. These securities are generally categorized as Level 1 in the hierarchy.
Temporary cash investments acquired in excess of 60 days to maturity at the time of purchase are valued using the latest bid prices or using valuations based on a matrix system (which considers such factors as security prices, yields, maturities and ratings), both as furnished by independent pricing services. Other temporary cash investments which mature in 60 days or less at the time of purchase (“Short-Term Investments”) are valued using the amortized cost method of valuation, unless the use of such method would be inappropriate. The amortized cost method involves valuing a security at its cost on the date of purchase and thereafter assuming a constant amortization to maturity of the difference between such cost and the value on maturity date. Amortized cost approximates the current fair value of a security. Securities valued using the amortized cost method are not valued using quoted
Notes to Financial Statements(Unaudited) (continued)
prices in an active market and are generally categorized as Level 2 in the hierarchy.
The information above is not intended to reflect an exhaustive list of the methodologies that may be used to value portfolio investments. The valuation procedures permit the use of a variety of valuation methodologies in connection with valuing portfolio investments. The methodology used for a specific type of investment may vary based on the market data available or other considerations. The methodologies summarized above may not represent the specific means by which portfolio investments are valued on any particular business day.
(B) Income Taxes. The Portfolio’s policy is to comply with the requirements of the Internal Revenue Code of 1986, as amended (the “Internal Revenue Code”), applicable to regulated investment companies and to distribute all of its taxable income to the shareholders of the Portfolio within the allowable time limits. Therefore, no federal, state and local income tax provisions are required.
Management evaluates the Portfolio’s tax positions to determine if the tax positions taken meet the minimum recognition threshold in connection with accounting for uncertainties in income tax positions taken or expected to be taken for the purposes of measuring and recognizing tax liabilities in the financial statements. Recognition of tax benefits of an uncertain tax position is permitted only to the extent the position is “more likely than not” to be sustained assuming examination by taxing authorities. Management has analyzed the Portfolio’s tax positions taken on federal, state and local income tax returns for all open tax years (for up to three tax years) and has concluded that no provisions for federal, state and local income tax are required in the Portfolio’s financial statements. The Portfolio’s federal, state and local income tax and federal excise tax returns for tax years for which the applicable statutes of limitations have not expired are subject to examination by the Internal Revenue Service and state and local departments of revenue.
(C) Foreign Taxes. The Portfolio may be subject to foreign taxes on income and other transaction-based taxes imposed by certain countries in which it invests. A portion of the taxes on gains on investments or currency purchases/repatriation may be reclaimable. The Portfolio will accrue such taxes and reclaims as applicable, based upon its current interpretation of tax rules and regulations that exist in the markets in which it invests.
The Portfolio may be subject to taxation on realized capital gains, repatriation proceeds and other transaction-based taxes imposed by certain countries in which it invests. The Portfolio will accrue such taxes as applicable based upon its current interpretation of tax rules and regulations that exist in the market in which it invests. Capital gains taxes relating to positions still held are reflected as a liability on the Statement of Assets and Liabilities, as well as an adjustment to the Portfolio’s net unrealized appreciation (depreciation). Taxes related to capital gains realized, if any, are reflected as part of net realized gain (loss) in the Statement of Operations. Changes in tax liabilities related to capital gains taxes on unrealized investment gains, if any, are reflected as part of the change in net unrealized appreciation (depreciation) on investments in the Statement of Operations. Transaction-based charges are generally assessed as a percentage of the transaction amount.
(D) Dividends and Distributions to Shareholders. Dividends and distributions are recorded on the ex-dividend date. The Portfolio
intends to declare and pay dividends from net investment income and distributions from net realized capital and currency gains, if any, at least annually. Unless the shareholder elects otherwise, all dividends and distributions are reinvested in the same class of shares of the Portfolio, at NAV. Dividends and distributions to shareholders are determined in accordance with federal income tax regulations and may differ from determinations using GAAP.
(E) Security Transactions and Investment Income. The Portfolio records security transactions on the trade date. Realized gains and losses on security transactions are determined using the identified cost method. Dividend income is recognized on the ex-dividend date; net of any foreign tax withheld at the source, and interest income is accrued as earned using the effective interest rate method. Income frompayment-in-kind securities is accreted daily based on the effective interest method.
The Portfolio may invest no more than 25% of its total assets in certain master limited partnerships (“MLPs”) on an annual basis. Distributions on a MLP are generally recorded based on the characterization reported on the Portfolio’s Form 1065, Schedule K-1, received from the MLP. The Portfolio records its pro rata share of the income and deductions, and capital gains and losses allocated from each MLP on the Statement of Operations, as well as adjusting the cost basis of each MLP accordingly, as reported on the Portfolio of Investments.
Distributions received from investments in energy related U.S. and Canadian royalty trusts and exploration and production companies (collectively, “Energy Trusts”) and MLPs generally are comprised of ordinary income, capital gains and return of capital from the Energy Trusts and MLPs. The Portfolio records its investment income on the ex-date of the distributions from Energy Trusts and MLPs. For financial statement purposes, the Portfolio uses return of capital and income estimates to allocate the distributions received. Such estimates are based on historical information available from each Energy Trust, MLP and other industry sources.
Investment income and realized and unrealized gains and losses on investments of the Portfolio are allocated pro rata to the separate classes of shares based upon their relative net assets on the date the income is earned or realized and unrealized gains and losses are incurred.
(F) Expenses. Expenses of the Fund are allocated to the individual Portfolios in proportion to the net assets of the respective Portfolios when the expenses are incurred, except where direct allocations of expenses can be made. Expenses (other than fees incurred under the distribution and service plans, further discussed in Note 3(B), which are charged directly to the Service Class shares) are allocated to separate classes of shares pro rata based upon their relative net assets on the date the expenses are incurred. The expenses borne by the Portfolio, including those of related parties to the Portfolio, are shown in the Statement of Operations.
Additionally, the Portfolio may invest in mutual funds, which are subject to management fees and other fees that may cause the costs of investing in mutual funds to be greater than the costs of owning the underlying securities directly. These indirect expenses of mutual funds are not included in the amounts shown as expenses in the Portfolio’s Statement
| | |
| 18 | | MainStay VP Cushing Renaissance Advantage Portfolio |
of Operations or in the expense ratios included in the Financial Highlights.
(G) Use of Estimates. In preparing financial statements in conformity with GAAP, management makes estimates and assumptions that affect the reported amounts and disclosures in the financial statements. Actual results could differ from those estimates.
(H) Repurchase Agreements. The Portfolio may enter into repurchase agreements (i.e., buy a security from another party with the agreement that it be sold back in the future) to earn income. The Portfolio may enter into repurchase agreements only with counterparties, usually financial institutions, that are deemed by the Manager or the Subadvisor to be creditworthy, pursuant to guidelines established by the Board. During the term of any repurchase agreement, the Manager or the Subadvisor will continue to monitor the creditworthiness of the counterparty. Under the 1940 Act, repurchase agreements are considered to be collateralized loans by the Portfolio to the counterparty secured by the securities transferred to the Portfolio.
Repurchase agreements are subject to counterparty risk, meaning the Portfolio could lose money by the counterparty’s failure to perform under the terms of the agreement. The Portfolio mitigates this risk by ensuring the repurchase agreement is collateralized by cash, U.S. government securities, fixed income securities and/or other securities. The collateral is held by the Portfolio’s custodian and valued daily on a mark to market basis to determine if the value, including accrued interest, exceeds the repurchase price. In the event of the counterparty’s default on the obligation to repurchase, the Portfolio has the right to liquidate the collateral and apply the proceeds in satisfaction of the obligation. Under certain circumstances, such as in the event of default or bankruptcy by the counterparty, realization and/or retention of the collateral may be limited or subject to delay, to legal proceedings and possible realized loss to the Portfolio. As of June 30, 2019, the Portfolio did not hold any repurchase agreements.
(I) Foreign Currency Transactions. The Portfolio’s books and records are maintained in U.S. dollars. Prices of securities denominated in foreign currency amounts are translated into U.S. dollars at the mean between the buying and selling rates last quoted by any major U.S. bank at the following dates:
| (i) | market value of investment securities, other assets and liabilities— at the valuation date; and |
| (ii) | purchases and sales of investment securities, income and expenses—at the date of such transactions. |
The assets and liabilities that are denominated in foreign currency amounts are presented at the exchange rates and market values at the close of the period. The realized and unrealized changes in net assets arising from fluctuations in exchange rates and market prices of securities are not separately presented.
Net realized gain (loss) on foreign currency transactions represents net gains and losses on foreign currency forward contracts, net currency gains or losses realized as a result of differences between the amounts of securities sale proceeds or purchase cost, dividends, interest and withholding taxes as recorded on the Portfolio’s books, and the U.S. dollar equivalent amount actually received or paid. Net currency gains or losses from valuing such foreign currency denominated assets and
liabilities, other than investments at valuation date exchange rates, are reflected in unrealized foreign exchange gains or losses.
(J) Securities Lending. In order to realize additional income, the Portfolio may engage in securities lending, subject to the limitations set forth in the 1940 Act and relevant guidance by the staff of the Securities and Exchange Commission (“SEC”). In the event the Portfolio does engage in securities lending, the Portfolio will lend through its custodian, State Street Bank and Trust Company (“State Street”), acting as securities lending agent on behalf of the Portfolio. State Street will manage the Portfolio’s collateral in accordance with the securities lending agency agreement between the Portfolio and State Street, and indemnify the Portfolio against counterparty risk. The loans will be collateralized by cash (which may be invested in a money market fund) and/ornon-cash collateral (which may include, U.S. Treasury securities and/or U.S. Government Agency securities issued or guaranteed by the United States government or its agencies or instrumentalities) at least equal at all times to the market value of the securities loaned. The Portfolio may bear the risk of delay in recovery of, or loss of rights in, the securities loaned should the borrower of the securities experience financial difficulty. The Portfolio may also record a realized gain or loss on securities deemed sold due to a borrower’s inability to return securities on loan. The Portfolio bears the risk of any loss on investment of cash collateral. The Portfolio will receive compensation for lending its securities in the form of fees or it will retain a portion of interest on the investment of any cash collateral. The Portfolio will also continue to receive interest and dividends on the securities loaned and any gain or loss in the market price of the securities loaned that may occur during the term of the loan will be for the account of the Portfolio. Income earned from securities lending activities, if any, is reflected in the Statement of Operations. As of June 30, 2019, the Portfolio had securities on loan with an aggregate market value of $2,311,646; the total market value of collateral held by the Portfolio was $2,356,476. The market value of the collateral held includednon-cash collateral in the form of U.S. Treasury securities with a value of $1,217,294 and cash collateral which was invested into the State Street Navigator Securities Lending Government Money Market Portfolio with a value of $1,139,182.
(K) Energy Companies Risk. The Portfolio may invest up to 25% of its total assets in securities of domestic and foreign publicly traded partnerships and/or other issuers (including U.S. and Canadian royalty trusts and Canadian energy companies) engaged in the transportation, storage, processing, refining, marketing, exploration, production or mining of crude oil, natural gas, minerals or other natural resources (“Energy Companies”). The Portfolio may be particularly vulnerable to adverse events affecting Energy Companies as a result of its focus in Energy Companies.
The Portfolio may invest as a limited partner in the equity securities of MLPs. As limited partners of MLPs, holders of MLP equity securities are subject to certain risks inherent in the structure of MLPs, including (i) tax risks, (ii) the limited ability to elect or remove management or the general partner or managing member, (iii) limited voting rights, except with respect to extraordinary transactions, and (iv) conflicts of interest between the general partner or managing member and its affiliates, on the one hand, and the limited partners or members, on the other hand,
including those arising from incentive distribution payments or corporate opportunities.
Notes to Financial Statements(Unaudited) (continued)
(L) Indemnifications. Under the Fund’s organizational documents, its officers and trustees are indemnified against certain liabilities that may arise out of performance of their duties to the Fund. Additionally, in the normal course of business, the Portfolio enters into contracts with third-party service providers that contain a variety of representations and warranties and which may provide general indemnifications. The Portfolio’s maximum exposure under these arrangements is unknown, as this would involve future claims that may be made against the Portfolio that have not yet occurred. Based on experience, management is of the view that the risk of loss in connection with these potential indemnification obligations is remote. However, there can be no assurance that material liabilities related to such obligations will not arise in the future, which could adversely impact the Portfolio.
Note 3–Fees and Related Party Transactions
(A) Manager and Subadvisor. New York Life Investments, a registered investment adviser and an indirect,wholly-owned subsidiary of New York Life, serves as the Portfolio’s Manager pursuant to an Amended and Restated Management Agreement (“Management Agreement”). The Manager provides offices, conducts clerical, recordkeeping and bookkeeping services, and keeps most of the financial and accounting records required to be maintained by the Portfolio. Except for the portion of salaries and expenses that are the responsibility of the Portfolio, the Manager pays the salaries and expenses of all personnel affiliated with the Portfolio and certain operational expenses of the Portfolio. The Portfolio reimburses New York Life Investments in an amount equal to a portion of the compensation of the Chief Compliance Officer attributable to the Portfolio. Cushing® Asset Management, LP (“Cushing” or “Subadvisor”), a registered investment adviser, serves as Subadvisor to the Portfolio and is responsible for theday-to-day portfolio management of the Portfolio. Pursuant to the terms of a Subadvisory Agreement (“Subadvisory Agreement”) between New York Life Investments and Cushing, New York Life Investments pays for the services of the Subadvisor.
The Fund, on behalf of the Portfolio, pays New York Life Investments in its capacity as the Portfolio’s investment manager and administrator,
pursuant to the Management Agreement, a monthly fee for the services performed and the facilities furnished at an annual rate of the Portfolio’s average daily net assets as follows: 1.10% up to $500 million; and 1.05% in excess of $500 million. During the six-month period ended June 30, 2019, the effective management fee rate was 1.10%.
During the six-month period ended June 30, 2019, New York Life Investments earned fees from the Portfolio in the amount of $556,790, and paid the Subadvisor in the amount of $278,395.
State Street providessub-administration andsub-accounting services to the Portfolio pursuant to an agreement with New York Life Investments. These services include calculating the daily NAVs of the Portfolio, maintaining the general ledger andsub-ledger accounts for the calculation of the Portfolio’s NAVs and assisting New York Life Investments in conducting various aspects of the Portfolio’s administrative operations. For providing these services to the Portfolio, State Street is compensated by New York Life Investments.
Pursuant to an agreement between the Fund and New York Life Investments, New York Life Investments is responsible for providing or procuring certain regulatory reporting services for the Portfolio. The Portfolio will reimburse New York Life Investments for the actual costs incurred by New York Life Investments in connection with providing or procuring these services for the Portfolio.
(B) Distribution and Service Fees. The Fund, on behalf of the Portfolio, has entered into a distribution agreement with NYLIFE Distributors LLC (the “Distributor”), an indirect,wholly-owned subsidiary of New York Life. The Portfolio has adopted a distribution plan (the “Plan”) in accordance with the provisions of Rule 12b-1 under the 1940 Act. Under the Plan, the Distributor has agreed to provide, through its affiliates or independent third parties, various distribution-related, shareholder and administrative support services to the Service Class shareholders. For its services, the Distributor is entitled to a combined distribution and service fee accrued daily and paid monthly at an annual rate of 0.25% of the average daily net assets attributable to the Service Class shares of the Portfolio.
(C) Investments in Affiliates (in 000’s). During the six-month period ended June 30, 2019, purchases and sales transactions, income earned from investments and shares held of investment companies managed by New York Life Investments or its affiliates were as follows:
| | | | | | | | | | | | | | | | | | | | | | | | | | | | | | | | | | | | |
Affiliated Investment Company | | Value,
Beginning
of Period | | | Purchases
at Cost | | | Proceeds
from
Sales | | | Net
Realized
Gain/
(Loss)
on Sales | | | Change in
Unrealized
Appreciation/
(Depreciation) | | | Value,
End of
Period | | | Dividend
Income | | | Other
Distributions | | | Shares
End of
Period | |
MainStay U.S. Government Liquidity Fund | | $ | 7,333 | | | $ | 81,143 | | | $ | (88,405 | ) | | $ | — | | | $ | — | | | $ | 71 | | | $ | 54 | | | $ | — | | | | 71 | |
| | |
| 20 | | MainStay VP Cushing Renaissance Advantage Portfolio |
Note 4–Federal Income Tax
As of June 30, 2019, the cost and unrealized appreciation (depreciation) of the Portfolio’s investment portfolio, including applicable derivative contracts and other financial instruments, as determined on a federal income tax basis, were as follows:
| | | | | | | | | | | | | | | | |
| | | Federal Tax
Cost | | | Gross
Unrealized
Appreciation | | | Gross
Unrealized
(Depreciation) | | | Net
Unrealized
Appreciation/
(Depreciation) | |
Investments in Securities | | $ | 66,549,227 | | | $ | 2,771,846 | | | $ | (9,352,896 | ) | | $ | (6,581,050 | ) |
As of December 31, 2018, for federal income tax purposes, capital loss carryforwards of $8,630,565, as shown in the table below, were available to the extent provided by the regulations to offset future realized gains of the Portfolio through the years indicated. Accordingly, no capital gains distributions are expected to be paid to shareholders until net gains have been realized in excess of such amounts.
| | | | |
Capital Loss
Available Through | | Short-Term
Capital Loss
Amounts (000’s) | | Long-Term
Capital Loss
Amounts (000’s) |
| | |
| Unlimited | | $8,631 | | $— |
During the year ended December 31, 2018, the tax character of distributions paid as reflected in the Statements of Changes in Net Assets was as follows:
| | | | | | |
|
| 2018 | |
Tax-Based
Distributions
from Ordinary
Income | | | Tax-Based
Distributions
from Long-Term
Gains | |
| |
| $ | — | | | $ | — | |
Note 5–Custodian
State Street is the custodian of cash and securities held by the Portfolio. Custodial fees are charged to the Portfolio based on the Portfolio’s net assets and/or the market value of securities held by the Portfolio and the number of certain transactions incurred by the Portfolio.
Note 6–Line of Credit
The Portfolio and certain other funds managed by New York Life Investments maintain a line of credit with a syndicate of banks in order to secure a source of funds for temporary purposes to meet unanticipated or excessive redemption requests.
Effective July 30, 2019, under the credit agreement (the “Credit Agreement”), the aggregate commitment amount is $600,000,000 with an additional uncommitted amount of $100,000,000. The commitment fee is an annual rate of 0.15% of the average commitment amount payable quarterly, regardless of usage, to State Street, who serves as the agent to the syndicate. The commitment fee is allocated among the Portfolio and certain other funds managed by New York Life Investments based upon their respective net assets and other factors. Interest on any revolving credit loan is charged based upon the Federal Funds Rate or the one-month London Interbank Offered Rate (“LIBOR”), whichever is higher. The Credit Agreement expires on July 28, 2020, although the
Portfolio, certain other funds managed by New York Life Investments and the syndicate of banks may renew the Credit Agreement for an additional year on the same or different terms. Prior to July 30, 2019, the aggregate commitment amount and the commitment fee were the same as those under the current Credit Agreement. During the six-month period ended June 30, 2019, there were no borrowings made or outstanding with respect to the Portfolio under the Credit Agreement.
Note 7–Interfund Lending Program
Pursuant to an exemptive order issued by the SEC, the Portfolio, along with certain other funds managed by New York Life Investments, may participate in an interfund lending program. The interfund lending program provides an alternative credit facility that permits the Portfolio and certain other funds managed by New York Life Investments to lend or borrow money for temporary purposes directly to or from one another, subject to the conditions of the exemptive order. During the six-month period ended June 30, 2019, there were no interfund loans made or outstanding with respect to the Portfolio.
Note 8–Purchases and Sales of Securities (in 000’s)
During the six-month period ended June 30, 2019, purchases and sales of securities, other thanshort-term securities, were $73,584 and $133,786, respectively.
Note 9–Capital Share Transactions
Transactions in capital shares for the six-month period ended June 30, 2019 and the year ended December 31, 2018, were as follows:
| | | | | | | | |
Initial Class | | Shares | | | Amount | |
| | |
Six-month period ended June 30, 2019: | | | | | | | | |
Shares sold | | | 54,556 | | | $ | 467,367 | |
Shares redeemed | | | (7,820,275 | ) | | | (67,123,128 | ) |
| | | | |
Net increase (decrease) | | | (7,765,719 | ) | | $ | (66,655,761 | ) |
| | | | |
Year ended December 31, 2018: | | | | | | | | |
Shares sold | | | 2,687,442 | | | $ | 23,874,500 | |
Shares redeemed | | | (5,866,286 | ) | | | (53,791,151 | ) |
| | | | |
Net increase (decrease) | | | (3,178,844 | ) | | $ | (29,916,651 | ) |
| | | | |
| | |
| | | | | | | | |
Service Class | | Shares | | | Amount | |
Six-month period ended June 30, 2019: | | | | | | | | |
Shares sold | | | 468,946 | | | $ | 3,991,961 | |
Shares redeemed | | | (441,596 | ) | | | (3,826,366 | ) |
| | | | |
Net increase (decrease) | | | 27,350 | | | $ | 165,595 | |
| | | | |
Year ended December 31, 2018: | | | | | | | | |
Shares sold | | | 601,349 | | | $ | 5,682,619 | |
Shares redeemed | | | (770,676 | ) | | | (7,605,760 | ) |
| | | | |
Net increase (decrease) | | | (169,327 | ) | | $ | (1,923,141 | ) |
| | | | |
Note 10–Recent Accounting Pronouncement
To improve the effectiveness of fair value disclosure requirements, the Financial Accounting Standards Board recently issued Accounting Standard Update (ASU)2018-13, Fair Value Measurement Disclosure Framework—Changes to the Disclosure Requirements for Fair Value Measurement (ASU2018-13), which adds, removes, and modifies certain aspects relating to fair value disclosure. ASU2018-13 is
Notes to Financial Statements(Unaudited) (continued)
effective for interim and annual reporting periods beginning after December 15, 2019; early adoption of the additions relating toASU 2018-13 is not required. Management has evaluated the implications of certain other provisions of the ASU and has determined to early adopt aspects related to the removal and modifications of certain fair value measurement disclosures under the ASU effective immediately. At this time, management is evaluating the implications of certain other provisions of the ASU related to new disclosure requirements and any impact on the financial statement disclosures has not yet been determined.
Note 11–Subsequent Events
In connection with the preparation of the financial statements of the Portfolio as of and for the six-month period ended June 30, 2019, events and transactions subsequent to June 30, 2019, through the date the financial statements were issued have been evaluated by the Portfolio’s management for possible adjustment and/or disclosure. No subsequent events requiring financial statement adjustment or disclosure have been identified.
| | |
| 22 | | MainStay VP Cushing Renaissance Advantage Portfolio |
Proxy Voting Policies and Procedures and Proxy Voting Record
A description of the policies and procedures that New York Life Investments uses to vote proxies related to the Portfolio’s securities is available without charge, upon request (i) by calling800-598-2019; (ii) by visiting New York Life Investments website at https://www.nylinvestments.com/mainstay/products-and-performance/mainstay-vp-funds-trust; or (iii) by visiting the SEC’s website at www.sec.gov.
The Portfolio is required to file with the SEC its proxy voting record for the12-month period ending June 30 on Form N-PX. The Portfolio’s most recent Form N-PX or proxy voting record is available free of charge upon request (i) by calling800-598-2019; (ii) by visiting New York Life Investments website at https://www.nylinvestments.com/mainstay/products-and-performance/mainstay-vp-funds-trust; or (iii) by visiting the SEC’s website atwww.sec.gov.
Shareholder Reports and Quarterly Portfolio Disclosure
The Portfolio is required to file its complete schedule of portfolio holdings with the SEC 60 days after each fiscal quarter on Form N-PORT. The Portfolio’s holdings report is available without charge upon request (i) by calling800-598-2019; (ii) by visiting New York Life Investments website at https://www.nylinvestments.com/mainstay/products-and-performance/mainstay-vp-funds-trust; or (iii) on the SEC’s website at www.sec.gov.
MainStay VP Portfolios
MainStay VP offers a wide range of Portfolios. The full array of MainStay VP offerings is listed here, with information about the manager, subadvisors, legal counsel, and independent registered public accounting firm.
Equity Portfolios
MainStay VP Eagle Small Cap Growth Portfolio
MainStay VP Emerging Markets Equity Portfolio
MainStay VP Epoch U.S. Equity Yield Portfolio
MainStay VP Fidelity Institutional AM® Utilities Portfolio†
MainStay VP Large Cap Growth Portfolio
MainStay VP MacKay Common Stock Portfolio
MainStay VP MacKay Growth Portfolio
MainStay VP MacKay International Equity Portfolio
MainStay VP MacKay Mid Cap Core Portfolio
MainStay VP MacKay S&P 500 Index Portfolio
MainStay VP MacKay Small Cap Core Portfolio
MainStay VP Mellon Natural Resources Portfolio
MainStay VP T. Rowe Price Equity Income Portfolio
Mixed Asset Portfolios
MainStay VP Balanced Portfolio
MainStay VP Income Builder Portfolio
MainStay VP Janus Henderson Balanced Portfolio
MainStay VP MacKay Convertible Portfolio
Income Portfolios
MainStay VP Bond Portfolio
MainStay VP Floating Rate Portfolio
MainStay VP Indexed Bond Portfolio
MainStay VP MacKay Government Portfolio
MainStay VP MacKay High Yield Corporate Bond Portfolio
MainStay VP MacKay Unconstrained Bond Portfolio
MainStay VP PIMCO Real Return Portfolio
Money Market
MainStay VP U.S. Government Money Market Portfolio
Alternative
MainStay VP Cushing Renaissance Advantage Portfolio
MainStay VP IQ Hedge Multi-Strategy Portfolio
Asset Allocation Portfolios
MainStay VP Conservative Allocation Portfolio
MainStay VP Growth Allocation Portfolio
MainStay VP Moderate Allocation Portfolio
MainStay VP Moderate Growth Allocation Portfolio
Manager
New York Life Investment Management LLC
New York, New York
Subadvisors
Candriam Belgium*
Brussels, Belgium
Cushing Asset Management, LP
Dallas, Texas
Eagle Asset Management, Inc.
St Petersburg, Florida
Epoch Investment Partners, Inc.
New York, New York
FIAM LLC
Smithfield, Rhode Island
IndexIQ Advisors LLC*
New York, New York
Janus Capital Management LLC
Denver, Colorado
MacKay Shields LLC*
New York, New York
Mellon Investments Corporation
Boston, Massachusetts
NYL Investors LLC*
New York, New York
Pacific Investment Management Company LLC
Newport Beach, California
T. Rowe Price Associates, Inc.
Baltimore, Maryland
Winslow Capital Management, LLC
Minneapolis, Minnesota
Distributor
NYLIFE Distributors LLC*
Jersey City, New Jersey
Custodian
State Street Bank and Trust Company
Boston, Massachusetts
Independent Registered Public Accounting Firm
PricewaterhouseCoopers LLP
New York, New York
Legal Counsel
Dechert LLP
Washington, District of Columbia
Some Portfolios may not be available in all products.
| † | Fidelity Institutional AM is a registered trade mark of FMR LLC. Used with permission. |
| * | An affiliate of New York Life Investment Management LLC |
Not part of the Semiannual Report
2019 Semiannual Report
This report is for the general information of New York Life Variable Annuities and NYLIAC Variable Universal Life Insurance Products policyowners. It must be preceded or accompanied by the appropriate product(s) and funds prospectuses if it is given to anyone who is not an owner of a New York Life variable annuity policy or a NYLIAC Variable Universal Life Insurance Product. This report does not offer for sale or solicit orders to purchase securities.
The performance data quoted in this report represents past performance. Past performance is no guarantee of future results. Due to market volatility and other factors, current performance may be lower or higher than the figures shown. The most recent month-end performance summary for your variable annuity or variable life policy is available by calling 800-598-2019 and is updated periodically on www.newyorklife.com.
The New York Life Variable Annuities and NYLIAC Variable Universal Life Insurance Products are issued by New York Life Insurance and Annuity Corporation (a Delaware Corporation) and distributed by NYLIFE Distributors LLC (Member FINRA/SIPC).
New York Life Insurance Company
New York Life Insurance and Annuity Corporation (NYLIAC) (A Delaware Corporation)
51 Madison Avenue, Room 551
New York, NY 10010
www.newyorklife.com
Printed on recycled paper
nylinvestments.com
NYLIFE Distributors LLC, 30 Hudson Street, Jersey City, NJ 07302
New York Life Investment Management LLC is the investment manager to the MainStay VP Funds Trust
©2019 by NYLIFE Distributors LLC. All rights reserved.
You may obtain copies of the Prospectus and the Statement of Additional Information free of charge, upon request, by callingtoll-free 800-598-2019 or writing to New York Life Insurance and Annuity Corporation, 51 Madison Avenue, New York, NY 10010.
| | | | |
| | | |
| Not FDIC Insured | | No Bank Guarantee | | May Lose Value |
| | | | |
| 1781612 | | | | MSVPCRA10-08/19 (NYLIAC) NI514 |
MainStay VP Eagle Small Cap Growth Portfolio
Message from the President and Semiannual Report
Unaudited | June 30, 2019

Beginning on January 1, 2021, as permitted by regulations adopted by the Securities and Exchange Commission, paper copies of the MainStay VP Portfolio annual and semi-annual shareholder reports may no longer be sent by mail, unless you specifically request paper copies of the reports from the insurance company that offers your policy. Instead, the reports will be made available online, and you will be notified by mail each time a report is posted and provided with a website link to access the report. Instructions for requesting paper copies will be provided by your insurance company.
If you already elected to receive shareholder reports electronically, you will not be affected by this change and you need not take any action. At any time, you may elect to receive reports and other communications from the insurance company electronically by following the instructions provided by the insurance company.
You may elect to receive all future shareholder reports in paper form free of charge. You can inform the insurance company that you wish to receive paper copies of reports by following the instructions provided by the insurance company. Your election to receive reports in paper form will apply to all portfolio companies available under your contract.
| | | | | | | | |
| | | | | |
| Not FDIC/NCUA Insured | | Not a Deposit | | May Lose Value | | No Bank Guarantee | | Not Insured by Any Government Agency |

This page intentionally left blank
Message from the President
Most equity and fixed-income markets in the United States and around the world advanced in the face of conflicting political and macroeconomic forces during thesix-month period ended June 30, 2019.
The reporting period began on the heels of tumultuous December 2018, during which equities and equity-sensitive bonds spiked sharply lower on concerns regarding the pace of economic growth, a U.S. government shutdown and the potential impact of trade disputes between the United States and other nations, particularly China. Markets recovered quickly in early 2019 as trade tensions eased, the government reopened and the U.S. Federal Reserve Board (Fed) adopted a more patient tone regarding the future direction of interest rates. Markets moved broadly higher from January through April, supported by encouraging economic data and generally strong corporate earnings.
During the first four months of the reporting period, the improving economic environment encouraged investors to favor areas of the market viewed as offering greater return potential along with higher risks. Among U.S. stocks, cyclical, growth-oriented sectors tended to outperform more defensive, value-oriented sectors, whilelarge-cap stocks outperformed theirsmaller-cap counterparts. Within the S&P 500® Index, the information technology sector led the market’s advance, followed by communication services, consumer discretionary and consumer staples. Industrials, utilities, financials, materials, real estate and energy produced more modest gains. While some international equity markets outperformed or underperformed the U.S. market, on average international stocks mirrored the performance of their U.S. counterparts. Fixed-income securities gained ground as well, albeit along a more gradual trajectory. Among U.S. fixed-income instruments, corporate issues generally outperformed government bonds, with lower credit quality, higher yielding securities leading the sector’s advance. Long-term U.S. Treasury bond yields proved particularly weak, with
10-year yields dipping at times below3-month yields, reflecting investors’ continued concerns about domestic economic growth.
May 2019 saw a return of uncertainty and volatility. Trade discussions between the United States and China faltered, driving global equity prices lower. Government bond prices rose as investors sought safe havens. June brought yet anotherU-turn as equity prices climbed again after comments from the Fed raised hopes of an interest rate cut in response to weak economic data. Stock and bond prices rose, with U.S. equity markets ending the reporting period in record territory.
We are pleased to see renewed signs of strength in broad areas of the financial market. At the same time, we remained sharply focused on providing you, as a MainStay VP investor, with the experienced and disciplined fund management that we believe underpins an effective, long-term investment strategy. Whatever tomorrow’s investment environment brings, you can rely on our portfolio managers to pursue the objectives of their individual Portfolios as outlined in the prospectus with the energy and dedication you have come to expect.
The report that follows contains additional information on the market events, investment decisions and specific securities that shaped your VP Portfolio’s performance during the six months ended June 30, 2019. We encourage you to read the report carefully and use it to evaluate your Portfolio’s performance in light of your long-range financial plan.
Sincerely,

Kirk C. Lehneis
President
The opinions expressed are as of the date of this report and are subject to change. There is no guarantee that any forecast made will come to pass. This material does not constitute investment advice and is not intended as an endorsement of any specific investment. Past performance is no guarantee of future results.
Not part of the Semiannual Report
Table of Contents
Investors should refer to the Portfolio’s Summary Prospectus and/or Prospectus and consider the Portfolio’s investment objectives, strategies, risks, charges and expenses carefully before investing. The Summary Prospectus and/or Prospectus contain this and other information about the Portfolio. You may obtain copies of the Portfolio’s Summary Prospectus and/or the Prospectus and the Statement of Additional Information free of charge, upon request, by calling toll-free 800-598-2019, by writing to New York Life Insurance and Annuity Corporation, 51 Madison Avenue, Room 251, New York, New York 10010 or by sending an email to MainStayShareholdersServices@nylim.com. These documents are also available at nylinvestments.com/vpdocuments. Please read the Summary Prospectus and/or Prospectus carefully before investing. MainStay VP Funds Trust portfolios are separate account options which are purchased through a variable insurance or variable annuity contract.
Investment and Performance Comparison1(Unaudited)
Performance data quoted represents past performance. Past performance is no guarantee of future results. Because of market volatility and other factors, current performance may be lower or higher than the figures shown. Investment return and principal value will fluctuate, and as a result, when shares are redeemed, they may be worth more or less than their original cost. The performance table and graph do not reflect any deduction of sales charges, mortality and expense charges, contract charges or administrative charges. Please refer to the Performance Summary appropriate for your policy. For performance information current to the most recent month-end, please call800-598-2019 or visit www.newyorklife.com.
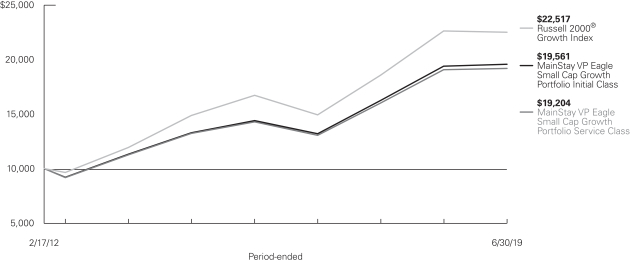
Average Annual Total Returns for the Period-Ended June 30, 2019
| | | | | | | | | | | | | | | | | | | | | | | | |
| Class | | Inception Date | | | Six Months | | | One Year | | | Five Years | | | Since
Inception | | | Gross Expense Ratio2 | |
| | | | | | |
| Initial Class Shares | | | 2/17/2012 | | | | 19.53 | % | | | 0.84 | % | | | 8.02 | % | | | 9.53 | % | | | 0.85 | % |
| Service Class Shares | | | 2/17/2012 | | | | 19.38 | | | | 0.59 | | | | 7.75 | | | | 9.26 | | | | 1.10 | |
| | | | | | | | | | | | | | | | |
| Benchmark Performance | | Six
Months | | | One Year | | | Five Years | | | Since
Inception | |
| | | | |
Russell 2000® Growth Index3 | | | 20.36 | % | | | –0.49 | % | | | 8.63 | % | | | 11.65 | % |
Morningstar Small Growth Category Average4 | | | 21.82 | | | | 3.22 | | | | 9.18 | | | | 11.23 | |
| 1. | Performance figures may reflect certain fee waivers and/or expense limitations, without which total returns may have been different. For information on current fee waivers and/or expense limitations (if any), please refer to the Notes to Financial Statements. |
| 2. | The gross expense ratios presented reflect the Portfolio’s “Total Annual Portfolio Operating Expenses” from the most recent Prospectus, as supplemented, and may differ from other expense ratios disclosed in this report. |
| 3. | The Russell 2000® Growth Index is the Portfolio’s primary broad-based securities market index for comparison purposes. The Russell 2000® Growth Index measures the performance of the small-cap growth segment of the U.S. equity universe. It includes those Russell 2000® Index companies with |
| | higher price-to-book ratios and higher forecasted growth values. Results assume reinvestment of all dividends and capital gains. An investment cannot be made directly in an index. |
| 4. | The Morningstar Small Growth Category Average is representative of funds that focus on faster-growing companies whose shares are at the lower end of the market-capitalization range. These funds tend to favor companies in up-and-coming industries or young firms in their early growth stages. Results are based on average total returns of similar funds with all dividends and capital gain distributions reinvested. |
Cost in Dollars of a $1,000 Investment in MainStay VP Eagle Small Cap Growth Portfolio (Unaudited)
The example below is intended to describe the fees and expenses borne by shareholders during the six-month period from January 1, 2019, to June 30, 2019, and the impact of those costs on your investment.
Example
As a shareholder of the Portfolio you incur two types of costs: (1) transaction costs, including exchange fees and sales charges (loads) on purchases (as applicable), and (2) ongoing costs, including management fees, distribution and/or service (12b-1) fees, and other Portfolio expenses (as applicable). This example is intended to help you understand your ongoing costs (in dollars) of investing in the Portfolio and to compare these costs with the ongoing costs of investing in other mutual funds. The example is based on an investment of $1,000 made at the beginning of the six-month period and held for the entire period from January 1, 2019, to June 30, 2019. Shares are only sold in connection with variable life and annuity contracts and the example does not reflect any contract level or transactional fees or expenses. If these costs had been included, your costs would have been higher.
This example illustrates your Portfolio’s ongoing costs in two ways:
Actual Expenses
The second and third data columns in the table below provide information about actual account values and actual expenses. You may use the information in these columns, together with the amount you invested, to estimate the expenses that you paid during the six months ended June 30, 2019. Simply divide your account value by $1,000
(for example, an $8,600 account value divided by $1,000 = 8.6), then multiply the result by the number under the heading entitled “Expenses Paid During Period” to estimate the expenses you paid on your account during this period.
Hypothetical Example for Comparison Purposes
The fourth and fifth data columns in the table below provide information about hypothetical account values and hypothetical expenses based on the Portfolio’s actual expense ratio and an assumed rate of return of 5% per year before expenses, which is not the Portfolio’s actual return. The hypothetical account values and expenses may not be used to estimate the actual ending account balances or expenses you paid for thesix-month period shown. You may use this information to compare the ongoing costs of investing in the Portfolio with the ongoing costs of investing in other mutual funds. To do so, compare this 5% hypothetical example with the 5% hypothetical examples that appear in the shareholder reports of the other mutual funds.
Please note that the expenses shown in the table are meant to highlight your ongoing costs only and do not reflect any transactional costs, such as exchange fees or sales charges (loads). Therefore, the fourth and fifth data columns of the table are useful in comparing ongoing costs only and will not help you determine the relative total costs of owning different funds. In addition, if these transactional costs were included, your costs would have been higher.
| | | | | | | | | | | | | | | | | | | | | | |
| | | | | | | | | | | | | | | | | | |
| Share Class | | Beginning
Account
Value
1/1/19 | | | Ending Account
Value (Based
on Actual
Returns and
Expenses)
6/30/19 | | | Expenses
Paid
During
Period1 | | | Ending Account
Value (Based
on Hypothetical
5% Annualized
Return and
Actual Expenses)
6/30/19 | | | Expenses
Paid
During
Period1 | | | Net Expense
Ratio
During
Period2 |
| | | | | | |
| Initial Class Shares | | $ | 1,000.00 | | | $ | 1,195.30 | | | $ | 4.63 | | | $ | 1,020.58 | | | $ | 4.26 | | | 0.85% |
| | | | | | |
| Service Class Shares | | $ | 1,000.00 | | | $ | 1,193.80 | | | $ | 5.98 | | | $ | 1,019.34 | | | $ | 5.51 | | | 1.10% |
| 1. | Expenses are equal to the Portfolio’s annualized expense ratio of each class multiplied by the average account value over the period, divided by 365 and multiplied by 181 (to reflect the six-month period). The table above represents the actual expenses incurred during the six-month period. In addition to the fees and expenses which the Portfolio bears directly, it also indirectly bears a pro rata share of the fees and expenses of the underlying funds in which it invests. Such indirect expenses are not included in the above-reported expense figures. |
| 2. | Expenses are equal to the Portfolio’s annualized expense ratio to reflect the six-month period. |
| | |
| 6 | | MainStay VP Eagle Small Cap Growth Portfolio |
Industry Composition as of June 30, 2019(Unaudited)
| | | | |
| |
| Biotechnology | | | 12.3 | % |
| |
| Software | | | 9.9 | |
| |
| Health Care Equipment & Supplies | | | 7.3 | |
| |
| Machinery | | | 6.7 | |
| |
| Hotels, Restaurants & Leisure | | | 5.5 | |
| |
| Chemicals | | | 3.9 | |
| |
| Semiconductors & Semiconductor Equipment | | | 3.9 | |
| |
| Aerospace & Defense | | | 3.5 | |
| |
| Commercial Services & Supplies | | | 3.5 | |
| |
| Electronic Equipment, Instruments & Components | | | 3.2 | |
| |
| Specialty Retail | | | 3.1 | |
| |
| Consumer Finance | | | 2.2 | |
| |
| Health Care Technology | | | 2.2 | |
| |
| Pharmaceuticals | | | 2.1 | |
| |
| Building Products | | | 1.9 | |
| |
| Health Care Providers & Services | | | 1.9 | |
| |
| Electrical Equipment | | | 1.8 | |
| |
| Textiles, Apparel & Luxury Goods | | | 1.8 | |
| |
| Capital Markets | | | 1.7 | |
| |
| Communications Equipment | | | 1.7 | |
| |
| Food & Staples Retailing | | | 1.5 | |
| | | | |
| |
| IT Services | | | 1.5 | % |
| |
| Life Sciences Tools & Services | | | 1.5 | |
| |
| Household Durables | | | 1.4 | |
| |
| Internet & Direct Marketing Retail | | | 1.3 | |
| |
| Road & Rail | | | 1.3 | |
| |
| Banks | | | 1.1 | |
| |
| Equity Real Estate Investment Trusts | | | 1.1 | |
| |
| Oil, Gas & Consumable Fuels | | | 1.1 | |
| |
| Construction Materials | | | 1.0 | |
| |
| Distributors | | | 1.0 | |
| |
| Food Products | | | 1.0 | |
| |
| Auto Components | | | 0.8 | |
| |
| Thrifts & Mortgage Finance | | | 0.7 | |
| |
| Multiline Retail | | | 0.6 | |
| |
| Diversified Telecommunication Services | | | 0.5 | |
| |
| Leisure Products | | | 0.5 | |
| |
| Media | | | 0.5 | |
| |
| Short-Term Investments | | | 3.8 | |
| |
| Other Assets, Less Liabilities | | | –2.3 | |
| | | | |
| | | 100.0 | % |
| | | | |
See Portfolio of Investments beginning on page 10 for specific holdings within these categories. The Portfolio’s holdings are subject to change.
Top Ten Holdings as of June 30, 2019(excludingshort-term investments) (Unaudited)
| 2. | Planet Fitness, Inc., Class A |
| 4. | John Bean Technologies Corp. |
| 8. | Cornerstone OnDemand, Inc. |
Portfolio Management Discussion and Analysis(Unaudited)
Answers to the questions reflect the views of portfolio managers Bert L. Boksen, CFA, Eric Mintz, CFA, and Christopher Sassouni of Eagle Asset Management, Inc. (“Eagle”), the Portfolio’s Subadvisor.
How did MainStay VP Eagle Small Cap Growth Portfolio perform relative to its primary benchmark and peers during the six months ended June 30, 2019?
For the six months ended June 30, 2019, MainStay VP Eagle Small Cap Growth Portfolio returned 19.53% for Initial Class shares and 19.38% for Service Class shares. Over the same period, both share classes underperformed the 20.36% return of the Russell 2000® Growth Index, which is the Portfolio’s broad-based securities-market index, and underperformed the 21.82% return of the Morningstar Small Growth Category Average.1
What factors affected the Portfolio’s relative performance during the reporting period?
All sectors generated positive returns during the reporting period, led by information technology and industrials, followed by real estate, health care and consumer discretionary. No sectors generated negative performance during the reporting period; however, consumer staples, communication services and energy lagged other sectors in the Russell 2000® Growth Index. The Portfolio underperformed the benchmark primarily due to relatively weak returns from financial sector holdings. The Portfolio’s consumer discretionary holdings also underperformed the benchmark. These detractors were partly offset by relatively strong contributions to positive performance from holdings in the industrials, consumer staples and materials sectors. (Contributions take weighting and total returns into account.)
Which sectors were the strongest positive contributors to the Portfolio’s relative performance, and which sectors were particularly weak?
The sectors providing the strongest positive contributions to the Portfolio’s performance relative to the Russell 2000® Growth Index included industrials, consumer staples and materials. Good individual stock selections drove positive performance in industrials, where the Portfolio’s allocation remained in line with the benchmark. In consumer staples, relative performance benefited from the Portfolio’s modestly underweight exposure. In materials, good individual stock selections produced most of the Portfolio’s relatively strong performance, bolstered by slightly overweight exposure to the sector.
The Portfolio’s worst-performing sectors on a relative basis included financials, health care and consumer discretionary. The Portfolio held slightly underweight exposure to financials, but the performance of individual holdings detracted from returns relative to the benchmark. In health care, the Portfolio held anin-line position with the benchmark but saw returns slightly trail their benchmark counterparts despite posting solid double-digit absolute returns. In the consumer discretionary sector, the Portfolio benefited from modestly overweight
exposure relative to the benchmark, but the performance of individual holdings lagged.
During the reporting period, which individual stocks made the strongest positive contributions to the Portfolio’s absolute performance and which stocks detracted the most?
The Portfolio’s best-performing stocks on an absolute basis during the year included biopharmaceutical developer Loxo Oncology, casino systems and services provider Everi and food processing technology company John Bean Technologies. Loxo shares surged during the reporting period when the firm’s acquisition by Eli Lilly was announced at a substantial premium over the prior share price. Everi reported solid results within its core operating segments while providing encouraging full-year 2019 guidance as well as additional clarity on progress towards deleveraging its balance sheet. John Bean Technologies benefited from the growing recognition of the efficiencies and added value provided by the firm’s technologies as part of the food products supply chain.
The most substantial detractors from the Portfolio’s relative performance during the year included financial and credit services provider Green Dot, home furnishings and accessories retailer At Home Group and health care software provider and consultant Evolent Health. Shares in Green Dot declined as revenue growth moderated and concerns arose involving the company’s relationship with major customer Walmart, which is up for renewal in 2020. At Home reported weak financial results due, in part, to poor weather, and lowered forward-looking guidance in the face of intensified competitive pressure, leading us to sell the Portfolio’s holdings. Shares in Evolent Health fell after markets reacted negatively to the company’s announced acquisition of Passport Health Plan. However, we remained cautiously optimistic on the company’s ability to meet the industry’s evolving need for information and analytics that improve efficiency and results.
Did the Portfolio make any significant purchases or sales during the reporting period?
One of the Portfolio’s significant purchases during the reporting period was Simply Good Foods, which develops and markets nutritional and snacking products. We initiated the position because we believe the company’s track record of effectively marketing its products beyond dieters to also include the much larger segment of lifestyle users bodes well for future sales of its Atkins shakes and bars.
The Portfolio’s notable sales during the same period included At Home Group, described earlier, and online subscription billing and management platforms operator Zuora. Zuora saw shares decline due to difficulties with the firm’s expanding sales force
| 1. | See footnote on page 5 for more information on benchmark and peer group returns. |
| | |
| 8 | | MainStay VP Eagle Small Cap Growth Portfolio |
as well as integration issues with a recent acquisition. Although we believed Zuora’s acquisition of revenue automation platform RevPro was ultimately strategic, we remained concerned regarding integration of the deal and the firm’s ability to leverage it.
How did the Portfolio’s sector weightings change during the reporting period?
During the reporting period, the Portfolio increased its exposure relative to the Russell 2000® Growth Index in the consumer staples and materials sectors. Consumer staples exposure changed from a modest underweight relative to the benchmark to a slightly underweight position, while the materials sector changed from a slightly overweight position to one that was modestly overweight. Over the same period, the Portfolio decreased its relative exposure to the consumer discretionary and information technology sectors. Consumer discretionary changed from a modestly overweight position to anin-line position relative to the benchmark. Information technology exposure
shifted from an overweight position to one that was slightly overweight. Generally, the Portfolio’s overweight and underweight positions tended to result from the appreciation (or depreciation) of its holdings.
How was the Portfolio positioned at the end of the reporting period?
As of June 30, 2019, the Portfolio held a modestly overweight position relative to the Russell 2000® Growth Index in the information technology and materials sectors, and a slightly overweight position in the health care sector. The Portfolio maintained effectivelyin-line positions relative to the benchmark in the consumer discretionary and industrials sectors.
As of the same date, the Portfolio held an underweight position in communication services and real estate, and a slightly underweight position relative to the benchmark in the financials, consumer staples and energy sectors.
The opinions expressed are those of the portfolio managers as of the date of this report and are subject to change. There is no guarantee that any forecasts will come to pass. This material does not constitute investment advice and is not intended as an endorsement of any specific investment.
Not all MainStay VP Portfolios and/or share classes are available under all policies.
Portfolio of InvestmentsJune 30, 2019 (Unaudited)
| | | | | | | | |
| | | Shares | | |
Value | |
| Common Stocks 98.5%† | |
Aerospace & Defense 3.5% | |
Aerojet Rocketdyne Holdings, Inc. (a) | | | 124,022 | | | $ | 5,552,465 | |
Aerovironment, Inc. (a) | | | 38,616 | | | | 2,192,230 | |
Hexcel Corp. | | | 77,118 | | | | 6,237,304 | |
| | | | | | | | |
| | | | | | | 13,981,999 | |
| | | | | | | | |
Auto Components 0.8% | |
Fox Factory Holding Corp. (a) | | | 24,585 | | | | 2,028,509 | |
Visteon Corp. (a) | | | 21,828 | | | | 1,278,684 | |
| | | | | | | | |
| | | | | | | 3,307,193 | |
| | | | | | | | |
Banks 1.1% | |
Glacier Bancorp, Inc. | | | 106,121 | | | | 4,303,207 | |
| | | | | | | | |
|
Biotechnology 12.3% | |
ACADIA Pharmaceuticals, Inc. (a) | | | 62,255 | | | | 1,664,076 | |
Acceleron Pharma, Inc. (a) | | | 50,024 | | | | 2,054,986 | |
Amicus Therapeutics, Inc. (a) | | | 167,442 | | | | 2,089,676 | |
Arena Pharmaceuticals, Inc. (a) | | | 57,563 | | | | 3,374,919 | |
ArQule, Inc. (a)(b) | | | 208,585 | | | | 2,296,521 | |
Atara Biotherapeutics, Inc. (a) | | | 77,119 | | | | 1,550,863 | |
Biohaven Pharmaceutical Holding Co., Ltd. (a) | | | 58,865 | | | | 2,577,698 | |
Blueprint Medicines Corp. (a) | | | 42,143 | | | | 3,975,349 | |
Dynavax Technologies Corp. (a)(b) | | | 181,348 | | | | 723,578 | |
Exact Sciences Corp. (a) | | | 23,365 | | | | 2,758,005 | |
Genomic Health, Inc. (a) | | | 54,698 | | | | 3,181,783 | |
Global Blood Therapeutics, Inc. (a) | | | 26,755 | | | | 1,407,313 | |
Heron Therapeutics, Inc. (a) | | | 96,681 | | | | 1,797,300 | |
Insmed, Inc. (a) | | | 91,011 | | | | 2,329,882 | |
Kura Oncology, Inc. (a) | | | 111,873 | | | | 2,202,779 | |
Ligand Pharmaceuticals, Inc. (a) | | | 23,894 | | | | 2,727,500 | |
Progenics Pharmaceuticals, Inc. (a) | | | 382,430 | | | | 2,359,593 | |
Ra Pharmaceuticals, Inc. (a) | | | 49,265 | | | | 1,481,399 | |
Repligen Corp. (a) | | | 29,652 | | | | 2,548,589 | |
Sage Therapeutics, Inc. (a)(b) | | | 14,990 | | | | 2,744,519 | |
Sarepta Therapeutics, Inc. (a) | | | 19,524 | | | | 2,966,672 | |
| | | | | | | | |
| | | | | | | 48,813,000 | |
| | | | | | | | |
Building Products 1.9% | |
Trex Co., Inc. (a) | | | 106,522 | | | | 7,637,627 | |
| | | | | | | | |
|
Capital Markets 1.7% | |
PJT Partners, Inc., Class A | | | 69,915 | | | | 2,832,956 | |
Stifel Financial Corp. | | | 63,369 | | | | 3,742,573 | |
| | | | | | | | |
| | | | | | | 6,575,529 | |
| | | | | | | | |
Chemicals 3.9% | |
Quaker Chemical Corp. | | | 53,526 | | | | 10,859,355 | |
Sensient Technologies Corp. | | | 62,781 | | | | 4,613,148 | |
| | | | | | | | |
| | | | | | | 15,472,503 | |
| | | | | | | | |
Commercial Services & Supplies 3.5% | |
Brink’s Co. | | | 54,513 | | | | 4,425,365 | |
| | | | | | | | |
| | | Shares | | |
Value | |
Commercial Services & Supplies (continued) | |
MSA Safety, Inc. | | | 49,994 | | | $ | 5,268,868 | |
Ritchie Brothers Auctioneers, Inc. | | | 127,084 | | | | 4,221,730 | |
| | | | | | | | |
| | | | | | | 13,915,963 | |
| | | | | | | | |
Communications Equipment 1.7% | |
Acacia Communications, Inc. (a) | | | 78,092 | | | | 3,682,819 | |
Lumentum Holdings, Inc. (a) | | | 54,316 | | | | 2,901,017 | |
| | | | | | | | |
| | | | | | | 6,583,836 | |
| | | | | | | | |
Construction Materials 1.0% | |
Summit Materials, Inc., Class A (a) | | | 204,653 | | | | 3,939,570 | |
| | | | | | | | |
|
Consumer Finance 2.2% | |
FirstCash, Inc. | | | 48,219 | | | | 4,822,864 | |
Green Dot Corp., Class A (a) | | | 81,132 | | | | 3,967,355 | |
| | | | | | | | |
| | | | | | | 8,790,219 | |
| | | | | | | | |
Distributors 1.0% | |
Pool Corp. | | | 20,921 | | | | 3,995,911 | |
| | | | | | | | |
|
Diversified Telecommunication Services 0.5% | |
Bandwidth, Inc., Class A (a) | | | 27,496 | | | | 2,062,750 | |
| | | | | | | | |
|
Electrical Equipment 1.8% | |
Bloom Energy Corp., Class A (a)(b) | | | 200,080 | | | | 2,454,982 | |
Thermon Group Holdings, Inc. (a) | | | 189,494 | | | | 4,860,521 | |
| | | | | | | | |
| | | | | | | 7,315,503 | |
| | | | | | | | |
Electronic Equipment, Instruments & Components 3.2% | |
Cognex Corp. | | | 110,260 | | | | 5,290,275 | |
Coherent, Inc. (a) | | | 35,297 | | | | 4,813,452 | |
II-VI, Inc. (a) | | | 74,448 | | | | 2,721,819 | |
| | | | | | | | |
| | | | | | | 12,825,546 | |
| | | | | | | | |
Equity Real Estate Investment Trusts 1.1% | |
Seritage Growth Properties, Class A (b) | | | 105,655 | | | | 4,538,939 | |
| | | | | | | | |
|
Food & Staples Retailing 1.5% | |
Casey’s General Stores, Inc. | | | 37,488 | | | | 5,847,753 | |
| | | | | | | | |
|
Food Products 1.0% | |
Freshpet, Inc. (a) | | | 42,833 | | | | 1,949,330 | |
Simply Good Foods Co. (a) | | | 84,000 | | | | 2,022,720 | |
| | | | | | | | |
| | | | | | | 3,972,050 | |
| | | | | | | | |
Health Care Equipment & Supplies 7.3% | |
Haemonetics Corp. (a) | | | 35,386 | | | | 4,258,351 | |
Insulet Corp. (a) | | | 30,767 | | | | 3,672,965 | |
Merit Medical Systems, Inc. (a) | | | 86,170 | | | | 5,132,285 | |
NuVasive, Inc. (a) | | | 39,084 | | | | 2,287,977 | |
Penumbra, Inc. (a)(b) | | | 14,715 | | | | 2,354,400 | |
Quidel Corp. (a) | | | 38,398 | | | | 2,277,769 | |
Tandem Diabetes Care, Inc. (a) | | | 62,038 | | | | 4,002,692 | |
| | | | |
| 10 | | MainStay VP Eagle Small Cap Growth Portfolio | | The notes to the financial statements are an integral part of,
and should be read in conjunction with, the financial statements. |
| | | | | | | | |
| | | Shares | | |
Value | |
| Common Stocks (continued) | |
Health Care Equipment & Supplies (continued) | |
West Pharmaceutical Services, Inc. | | | 17,751 | | | $ | 2,221,538 | |
Wright Medical Group N.V. (a) | | | 91,272 | | | | 2,721,731 | |
| | | | | | | | |
| | | | | | | 28,929,708 | |
| | | | | | | | |
Health Care Providers & Services 1.9% | |
Amedisys, Inc. (a) | | | 16,735 | | | | 2,031,796 | |
AMN Healthcare Services, Inc. (a) | | | 30,470 | | | | 1,652,998 | |
BioTelemetry, Inc. (a) | | | 30,873 | | | | 1,486,535 | |
HealthEquity, Inc. (a) | | | 34,002 | | | | 2,223,731 | |
| | | | | | | | |
| | | | | | | 7,395,060 | |
| | | | | | | | |
Health Care Technology 2.2% | |
Evolent Health, Inc., Class A (a) | | | 122,963 | | | | 977,556 | |
Omnicell, Inc. (a) | | | 43,846 | | | | 3,772,071 | |
Teladoc Health, Inc. (a)(b) | | | 60,837 | | | | 4,040,185 | |
| | | | | | | | |
| | | | | | | 8,789,812 | |
| | | | | | | | |
Hotels, Restaurants & Leisure 5.5% | |
Everi Holdings, Inc. (a) | | | 423,278 | | | | 5,049,706 | |
Lindblad Expeditions Holdings, Inc. (a) | | | 112,126 | | | | 2,012,662 | |
Penn National Gaming, Inc. (a) | | | 216,683 | | | | 4,173,314 | |
Planet Fitness, Inc., Class A (a) | | | 109,136 | | | | 7,905,812 | |
Wingstop, Inc. | | | 28,521 | | | | 2,702,365 | |
| | | | | | | | |
| | | | | | | 21,843,859 | |
| | | | | | | | |
Household Durables 1.4% | |
Universal Electronics, Inc. (a) | | | 133,242 | | | | 5,465,587 | |
| | | | | | | | |
|
Internet & Direct Marketing Retail 1.3% | |
Etsy, Inc. (a) | | | 46,240 | | | | 2,837,749 | |
Revolve Group, Inc. (a)(b) | | | 66,895 | | | | 2,307,877 | |
| | | | | | | | |
| | | | | | | 5,145,626 | |
| | | | | | | | |
IT Services 1.5% | |
Evo Payments, Inc., Class A (a) | | | 100,539 | | | | 3,169,995 | |
Verra Mobility Corp. (a) | | | 227,116 | | | | 2,972,948 | |
| | | | | | | | |
| | | | | | | 6,142,943 | |
| | | | | | | | |
Leisure Products 0.5% | |
Yeti Holdings, Inc. (a)(b) | | | 69,609 | | | | 2,015,181 | |
| | | | | | | | |
|
Life Sciences Tools & Services 1.5% | |
NeoGenomics, Inc. (a) | | | 183,838 | | | | 4,033,406 | |
PRA Health Sciences, Inc. (a) | | | 20,497 | | | | 2,032,277 | |
| | | | | | | | |
| | | | | | | 6,065,683 | |
| | | | | | | | |
Machinery 6.7% | |
Chart Industries, Inc. (a) | | | 89,171 | | | | 6,855,467 | |
John Bean Technologies Corp. | | | 59,625 | | | | 7,222,376 | |
Kennametal, Inc. | | | 75,699 | | | | 2,800,106 | |
Kornit Digital, Ltd. (a) | | | 85,012 | | | | 2,691,480 | |
Woodward, Inc. | | | 63,125 | | | | 7,143,225 | |
| | | | | | | | |
| | | | | | | 26,712,654 | |
| | | | | | | | |
| | | | | | | | |
| | | Shares | | |
Value | |
Media 0.5% | |
Sinclair Broadcast Group, Inc., Class A | | | 34,430 | | | $ | 1,846,481 | |
| | | | | | | | |
|
Multiline Retail 0.6% | |
Ollie’s Bargain Outlet Holdings, Inc. (a) | | | 27,972 | | | | 2,436,641 | |
| | | | | | | | |
|
Oil, Gas & Consumable Fuels 1.1% | |
Viper Energy Partners, L.P. | | | 148,426 | | | | 4,574,489 | |
| | | | | | | | |
|
Pharmaceuticals 2.1% | |
Cymabay Therapeutics, Inc. (a) | | | 150,830 | | | | 1,079,943 | |
Horizon Therapeutics PLC (a) | | | 135,418 | | | | 3,258,157 | |
Odonate Therapeutics, Inc. (a) | | | 40,032 | | | | 1,468,774 | |
Zogenix, Inc. (a)(b) | | | 56,442 | | | | 2,696,799 | |
| | | | | | | | |
| | | | | | | 8,503,673 | |
| | | | | | | | |
Road & Rail 1.3% | |
Landstar System, Inc. | | | 47,133 | | | | 5,089,893 | |
| | | | | | | | |
|
Semiconductors & Semiconductor Equipment 3.9% | |
Cabot Microelectronics Corp. | | | 29,099 | | | | 3,203,218 | |
Entegris, Inc. | | | 165,707 | | | | 6,184,185 | |
Lattice Semiconductor Corp. (a) | | | 182,928 | | | | 2,668,919 | |
Silicon Laboratories, Inc. (a) | | | 33,322 | | | | 3,445,495 | |
| | | | | | | | |
| | | | | | | 15,501,817 | |
| | | | | | | | |
Software 9.9% | |
AppFolio, Inc., Class A (a) | | | 22,859 | | | | 2,337,790 | |
Cornerstone OnDemand, Inc. (a) | | | 114,771 | | | | 6,648,684 | |
Everbridge, Inc. (a) | | | 27,847 | | | | 2,490,079 | |
Guidewire Software, Inc. (a) | | | 57,845 | | | | 5,864,326 | |
Pegasystems, Inc. | | | 86,185 | | | | 6,137,234 | |
Q2 Holdings, Inc. (a) | | | 47,729 | | | | 3,644,586 | |
RealPage, Inc. (a) | | | 120,515 | | | | 7,092,308 | |
SailPoint Technologies Holding, Inc. (a) | | | 112,461 | | | | 2,253,718 | |
Tenable Holdings, Inc. (a) | | | 105,000 | | | | 2,996,700 | |
| | | | | | | | |
| | | | | | | 39,465,425 | |
| | | | | | | | |
Specialty Retail 3.1% | |
Floor & Decor Holdings, Inc., Class A (a) | | | 103,612 | | | | 4,341,343 | |
Genesco, Inc. (a) | | | 50,943 | | | | 2,154,380 | |
MarineMax, Inc. (a) | | | 168,023 | | | | 2,762,298 | |
National Vision Holdings, Inc. (a) | | | 98,707 | | | | 3,033,266 | |
| | | | | | | | |
| | | | | | | 12,291,287 | |
| | | | | | | | |
Textiles, Apparel & Luxury Goods 1.8% | |
Canada Goose Holdings, Inc. (a)(b) | | | 65,860 | | | | 2,550,758 | |
Steven Madden, Ltd. | | | 137,933 | | | | 4,682,825 | |
| | | | | | | | |
| | | | | | | 7,233,583 | |
| | | | | | | | |
Thrifts & Mortgage Finance 0.7% | |
NMI Holdings, Inc., Class A (a) | | | 103,252 | | | | 2,931,324 | |
| | | | | | | | |
Total Common Stocks
(Cost $312,555,066) | | | | | | | 392,259,824 | |
| | | | | | | | |
| | | | | | |
The notes to the financial statements are an integral part of,
and should be read in conjunction with, the financial statements. | | | | | 11 | |
Portfolio of InvestmentsJune 30, 2019 (Unaudited) (continued)
| | | | | | | | |
| | | Shares | | |
Value | |
| Short-Term Investments 3.8% | |
Affiliated Investment Company 0.8% | |
MainStay U.S. Government Liquidity Fund, 2.03% (c) | | | 3,074,519 | | | $ | 3,074,519 | |
| | | | | | | | |
|
Unaffiliated Investment Company 3.0% | |
State Street Navigator Securities Lending Government Money Market Portfolio, 2.33% (c)(d) | | | 11,781,112 | | | | 11,781,112 | |
| | | | | | | | |
TotalShort-Term Investments
(Cost $14,855,631) | | | | | | | 14,855,631 | |
| | | | | | | | |
Total Investments
(Cost $327,410,697) | | | 102.3 | % | | | 407,115,455 | |
Other Assets, Less Liabilities | | | (2.3 | ) | | | (9,063,826 | ) |
Net Assets | | | 100.0 | % | | $ | 398,051,629 | |
| † | Percentages indicated are based on Portfolio net assets. |
| (a) | Non-income producing security. |
| (b) | All or a portion of this security was held on loan. As of June 30, 2019, the aggregate market value of securities on loan was $21,476,194; the total market value of collateral held by the Portfolio was $21,946,221. The market value of the collateral held included non-cash collateral in the form of U.S. Treasury securities with a value of $10,165,109 (See Note 2(H)). |
| (c) | Current yield as of June 30, 2019. |
| (d) | Represents security purchased with cash collateral received for securities on loan. |
The following is a summary of the fair valuations according to the inputs used as of June 30, 2019, for valuing the Portfolio’s assets:
| | | | | | | | | | | | | | | | |
Description | | Quoted
Prices in
Active
Markets for
Identical
Assets
(Level 1) | | | Significant
Other
Observable
Inputs
(Level 2) | | | Significant
Unobservable
Inputs
(Level 3) | | | Total | |
| | | | |
Asset Valuation Inputs | | | | | | | | | | | | | | | | |
| Investments in Securities (a) | | | | | | | | | | | | | | | | |
| Common Stocks | | $ | 392,259,824 | | | $ | — | | | $ | — | | | $ | 392,259,824 | |
| Short-Term Investments | | | | | | | | | | | | | | | | |
Affiliated Investment Company | | | 3,074,519 | | | | — | | | | — | | | | 3,074,519 | |
Unaffiliated Investment Company | | | 11,781,112 | | | | — | | | | — | | | | 11,781,112 | |
| | | | | | | | | | | | | | | | |
| TotalShort-Term Investments | | | 14,855,631 | | | | — | | | | — | | | | 14,855,631 | |
| | | | | | | | | | | | | | | | |
| Total Investments in Securities | | $ | 407,115,455 | | | $ | — | | | $ | — | | | $ | 407,115,455 | |
| | | | | | | | | | | | | | | | |
| (a) | For a complete listing of investments and their industries, see the Portfolio of Investments. |
| | | | |
| 12 | | MainStay VP Eagle Small Cap Growth Portfolio | | The notes to the financial statements are an integral part of,
and should be read in conjunction with, the financial statements. |
Statement of Assets and Liabilitiesas of June 30, 2019 (Unaudited)
| | | | |
| Assets | | | | |
Investment in unaffiliated securities, at value
(identified cost $324,336,178) including securities on loan of $21,476,194 | | $ | 404,040,936 | |
Investment in affiliated investment company, at value (identified cost $3,074,519) | | | 3,074,519 | |
Receivables: | | | | |
Investment securities sold | | | 3,583,537 | |
Portfolio shares sold | | | 72,280 | |
Dividends | | | 30,915 | |
Securities lending | | | 8,894 | |
Other assets | | | 1,791 | |
| | | | |
Total assets | | | 410,812,872 | |
| | | | |
| |
| Liabilities | | | | |
Cash collateral received for securities on loan | | | 11,781,112 | |
Payables: | | | | |
Investment securities purchased | | | 460,261 | |
Manager (See Note 3) | | | 257,921 | |
Portfolio shares redeemed | | | 175,945 | |
Professional fees | | | 28,981 | |
NYLIFE Distributors (See Note 3) | | | 24,165 | |
Shareholder communication | | | 15,800 | |
Custodian | | | 12,351 | |
Trustees | | | 454 | |
Accrued expenses | | | 4,253 | |
| | | | |
Total liabilities | | | 12,761,243 | |
| | | | |
Net assets | | $ | 398,051,629 | |
| | | | |
| |
| Composition of Net Assets | | | | |
Shares of beneficial interest outstanding (par value of $.001 per share) unlimited number of shares authorized | | $ | 27,471 | |
Additional paid-in capital | | | 257,032,862 | |
| | | | |
| | | 257,060,333 | |
Total distributable earnings (loss) | | | 140,991,296 | |
| | | | |
Net assets | | $ | 398,051,629 | |
| | | | |
| | | | |
Initial Class | | | | |
Net assets applicable to outstanding shares | | $ | 276,324,443 | |
| | | | |
Shares of beneficial interest outstanding | | | 18,947,321 | |
| | | | |
Net asset value per share outstanding | | $ | 14.58 | |
| | | | |
Service Class | | | | |
Net assets applicable to outstanding shares | | $ | 121,727,186 | |
| | | | |
Shares of beneficial interest outstanding | | | 8,524,012 | |
| | | | |
Net asset value per share outstanding | | $ | 14.28 | |
| | | | |
| | | | | | |
The notes to the financial statements are an integral part of,
and should be read in conjunction with, the financial statements. | | | | | 13 | |
Statement of Operationsfor the six months ended June 30, 2019 (Unaudited)
| | | | |
| Investment Income (Loss) | | | | |
Income | | | | |
Dividends—unaffiliated (a) | | $ | 721,997 | |
Dividends—affiliated | | | 71,857 | |
Securities lending | | | 56,495 | |
Interest | | | 18 | |
| | | | |
Total income | | | 850,367 | |
| | | | |
Expenses | | | | |
Manager (See Note 3) | | | 1,582,885 | |
Distribution/Service—Service Class (See Note 3) | | | 142,384 | |
Professional fees | | | 37,150 | |
Shareholder communication | | | 18,309 | |
Custodian | | | 11,945 | |
Trustees | | | 4,919 | |
Miscellaneous | | | 8,537 | |
| | | | |
Total expenses | | | 1,806,129 | |
| | | | |
Net investment income (loss) | | | (955,762 | ) |
| | | | |
|
| Realized and Unrealized Gain (Loss) on Investments | |
Net realized gain (loss) on unaffiliated investments | | | 12,042,466 | |
Net change in unrealized appreciation (depreciation) on unaffiliated investments | | | 56,645,893 | |
| | | | |
Net realized and unrealized gain (loss) on investments | | | 68,688,359 | |
| | | | |
Net increase (decrease) in net assets resulting from operations | | $ | 67,732,597 | |
| | | | |
| (a) | Dividends recorded net of foreign withholding taxes in the amount of $6,863. |
| | | | |
| 14 | | MainStay VP Eagle Small Cap Growth Portfolio | | The notes to the financial statements are an integral part of,
and should be read in conjunction with, the financial statements. |
Statements of Changes in Net Assets
for the six months ended June 30, 2019 (Unaudited) and the year ended December 31, 2018
| | | | | | | | |
| | | 2019 | | | 2018 | |
| Increase (Decrease) in Net Assets | |
Operations: | | | | | | | | |
Net investment income (loss) | | $ | (955,762 | ) | | $ | (1,847,781 | ) |
Net realized gain (loss) on investments | | | 12,042,466 | | | | 51,592,156 | |
Net change in unrealized appreciation (depreciation) on investments | | | 56,645,893 | | | | (82,610,573 | ) |
| | | | |
Net increase (decrease) in net assets resulting from operations | | | 67,732,597 | | | | (32,866,198 | ) |
| | | | |
Distributions to shareholders: | | | | | | | | |
Initial Class | | | — | | | | (15,228,718 | ) |
Service Class | | | — | | | | (5,875,041 | ) |
| | | | |
Total distributions to shareholders | | | — | | | | (21,103,759 | ) |
| | | | |
Capital share transactions: | | | | | | | | |
Net proceeds from sale of shares | | | 23,299,899 | | | | 55,355,833 | |
Net asset value of shares issued to shareholders in reinvestment of distributions | | | — | | | | 21,103,759 | |
Cost of shares redeemed | | | (41,024,760 | ) | | | (77,438,688 | ) |
| | | | |
Increase (decrease) in net assets derived from capital share transactions | | | (17,724,861 | ) | | | (979,096 | ) |
| | | | |
Net increase (decrease) in net assets | | | 50,007,736 | | | | (54,949,053 | ) |
| | |
| Net Assets | | | | | | | | |
Beginning of period | | | 348,043,893 | | | | 402,992,946 | |
| | | | |
End of period | | $ | 398,051,629 | | | $ | 348,043,893 | |
| | | | |
| | | | | | |
The notes to the financial statements are an integral part of,
and should be read in conjunction with, the financial statements. | | | | | 15 | |
Financial Highlightsselected per share data and ratios
| | | | | | | | | | | | | | | | | | | | | | | | |
| | |
| | | Six months
ended
June 30, | | | Year ended December 31, | |
| | | | | | |
| Initial Class | | 2019* | | | 2018 | | | 2017 | | | 2016 | | | 2015 | | | 2014 | |
| | | | | | |
Net asset value at beginning of period | | $ | 12.20 | | | $ | 14.09 | | | $ | 12.03 | | | $ | 11.53 | | | $ | 13.33 | | | $ | 13.07 | |
| | | | | | | | | | | | | | | | | | | | | | | | |
| | | | | | |
Net investment income (loss) (a) | | | (0.03 | ) | | | (0.06 | ) | | | (0.06 | ) | | | (0.05 | ) | | | (0.07 | ) | | | (0.04 | ) |
| | | | | | |
Net realized and unrealized gain (loss) on investments | | | 2.41 | | | | (1.04 | ) | | | 2.78 | | | | 1.19 | | | | (0.09 | ) | | | 0.36 | |
| | | | | | | | | | | | | | | | | | | | | | | | |
| | | | | | |
Total from investment operations | | | 2.38 | | | | (1.10 | ) | | | 2.72 | | | | 1.14 | | | | (0.16 | ) | | | 0.32 | |
| | | | | | | | | | | | | | | | | | | | | | | | |
| | | | | | |
| Less distributions: | | | | | | | | | | | | | | | | | | | | | | | | |
| | | | | | |
From net realized gain on investments | | | — | | | | (0.79 | ) | | | (0.66 | ) | | | (0.64 | ) | | | (1.64 | ) | | | (0.06 | ) |
| | | | | | | | | | | | | | | | | | | | | | | | |
| | | | | | |
Net asset value at end of period | | $ | 14.58 | | | $ | 12.20 | | | $ | 14.09 | | | $ | 12.03 | | | $ | 11.53 | | | $ | 13.33 | |
| | | | | | | | | | | | | | | | | | | | | | | | |
| | | | | | |
Total investment return (b) | | | 19.51 | % (c) | | | (8.88 | %) | | | 22.83 | % | | | 10.01 | % | | | (0.91 | %) | | | 2.52 | % |
| | | | | | |
| Ratios (to average net assets)/Supplemental Data: | | | | | | | | | | | | | | | | | | | | | | | | |
| | | | | | |
Net investment income (loss) | | | (0.42 | %)†† | | | (0.40 | %) | | | (0.48 | %) | | | (0.41 | %) | | | (0.53 | %) | | | (0.30 | %) |
| | | | | | |
Net expenses (d) | | | 0.85 | % †† | | | 0.85 | % | | | 0.85 | % | | | 0.86 | % | | | 0.85 | % | | | 0.85 | % |
| | | | | | |
Portfolio turnover rate | | | 22 | % | | | 41 | % | | | 41 | % | | | 36 | % | | | 50 | % | | | 51 | % |
| | | | | | |
Net assets at end of period (in 000’s) | | $ | 276,324 | | | $ | 251,547 | | | $ | 312,106 | | | $ | 282,378 | | | $ | 319,580 | | | $ | 343,965 | |
| (a) | Per share data based on average shares outstanding during the period. |
| (b) | Total return does not reflect any deduction of sales charges, mortality and expense charges, contract charges or administrative charges. For periods of less than one year, total return is not annualized. |
| (c) | Total investment return may reflect adjustments to conform to generally accepted accounting principles. |
| (d) | In addition to the fees and expenses which the Portfolio bears directly, it also indirectly bears a pro-rata share of the fees and expenses of the underlying funds in which it invests. Such indirect expenses are not included in the above expense ratios. |
| | | | | | | | | | | | | | | | | | | | | | | | |
| | |
| | | Six months
ended
June 30, | | | Year ended December 31, | |
| | | | | | |
| Service Class | | 2019* | | | 2018 | | | 2017 | | | 2016 | | | 2015 | | | 2014 | |
| | | | | | |
Net asset value at beginning of period | | $ | 11.96 | | | $ | 13.87 | | | $ | 11.88 | | | $ | 11.42 | | | $ | 13.25 | | | $ | 13.02 | |
| | | | | | | | | | | | | | | | | | | | | | | | |
| | | | | | |
Net investment income (loss) (a) | | | (0.05 | ) | | | (0.09 | ) | | | (0.09 | ) | | | (0.07 | ) | | | (0.10 | ) | | | (0.07 | ) |
| | | | | | |
Net realized and unrealized gain (loss) on investments | | | 2.37 | | | | (1.03 | ) | | | 2.74 | | | | 1.17 | | | | (0.09 | ) | | | 0.36 | |
| | | | | | | | | | | | | | | | | | | | | | | | |
| | | | | | |
Total from investment operations | | | 2.32 | | | | (1.12 | ) | | | 2.65 | | | | 1.10 | | | | (0.19 | ) | | | 0.29 | |
| | | | | | | | | | | | | | | | | | | | | | | | |
| | | | | | |
| Less distributions: | | | | | | | | | | | | | | | | | | | | | | | | |
| | | | | | |
From net realized gain on investments | | | — | | | | (0.79 | ) | | | (0.66 | ) | | | (0.64 | ) | | | (1.64 | ) | | | (0.06 | ) |
| | | | | | | | | | | | | | | | | | | | | | | | |
| | | | | | |
Net asset value at end of period | | $ | 14.28 | | | $ | 11.96 | | | $ | 13.87 | | | $ | 11.88 | | | $ | 11.42 | | | $ | 13.25 | |
| | | | | | | | | | | | | | | | | | | | | | | | |
| | | | | | |
Total investment return (b) | | | 19.40 | % (c) | | | (9.11 | %) | | | 22.53 | % | | | 9.73 | % | | | (1.16 | %) | | | 2.27 | % |
| | | | | | |
| Ratios (to average net assets)/Supplemental Data: | | | | | | | | | | | | | | | | | | | | | | | | |
| | | | | | |
Net investment income (loss) | | | (0.67 | %)†† | | | (0.64 | %) | | | (0.72 | %) | | | (0.66 | %) | | | (0.79 | %) | | | (0.55 | %) |
| | | | | | |
Net expenses (d) | | | 1.10 | % †† | | | 1.10 | % | | | 1.10 | % | | | 1.11 | % | | | 1.10 | % | | | 1.10 | % |
| | | | | | |
Portfolio turnover rate | | | 22 | % | | | 41 | % | | | 41 | % | | | 36 | % | | | 50 | % | | | 51 | % |
| | | | | | |
Net assets at end of period (in 000’s) | | $ | 121,727 | | | $ | 96,497 | | | $ | 90,887 | | | $ | 70,131 | | | $ | 71,135 | | | $ | 61,536 | |
| (a) | Per share data based on average shares outstanding during the period. |
| (b) | Total return does not reflect any deduction of sales charges, mortality and expense charges, contract charges or administrative charges. For periods of less than one year, total return is not annualized. |
| (c) | Total investment return may reflect adjustments to conform to generally accepted accounting principles. |
| (d) | In addition to the fees and expenses which the Portfolio bears directly, it also indirectly bears a pro-rata share of the fees and expenses of the underlying funds in which it invests. Such indirect expenses are not included in the above expense ratios. |
| | | | |
| 16 | | MainStay VP Eagle Small Cap Growth Portfolio | | The notes to the financial statements are an integral part of,
and should be read in conjunction with, the financial statements. |
Notes to Financial Statements(Unaudited)
Note 1–Organization and Business
MainStay VP Funds Trust (the “Fund”) was organized as a Delaware statutory trust on February 1, 2011. The Fund is registered under the Investment Company Act of 1940, as amended (the “1940 Act”), as an open-end management investment company. The Fund is comprised of thirty-one separate series (collectively referred to as the “Portfolios”). These financial statements and notes relate to the MainStay VP Eagle Small Cap Growth Portfolio (the “Portfolio”), a “diversified” portfolio, as that term is defined in the 1940 Act, as interpreted or modified by regulatory authorities having jurisdiction, from time to time.
Shares of the Portfolio are currently offered to certain separate accounts to fund variable annuity policies and variable universal life insurance policies issued by New York Life Insurance and Annuity Corporation (“NYLIAC”), awholly-owned subsidiary of New York Life Insurance Company (“New York Life”) and may also be offered to fund variable annuity policies and variable universal life insurance policies issued by other insurance companies. NYLIAC allocates shares of the Portfolios to, among others, certain NYLIAC separate accounts. Shares of the Portfolio are also offered to the MainStay VP Conservative Allocation Portfolio, MainStay VP Moderate Allocation Portfolio, MainStay VP Moderate Growth Allocation Portfolio and MainStay VP Growth Allocation Portfolio, which operate as “funds-of-funds.”
The Portfolio currently offers two classes of shares. Initial Class and Service Class shares commenced operations on February 17, 2012. Shares of the Portfolio are offered and are redeemed at a price equal to their respective net asset value (“NAV”) per share. No sales or redemption charge is applicable to the purchase or redemption of the Portfolio’s shares. Under the terms of the Fund’s multiple class plan adopted pursuant to Rule 18f-3 under the 1940 Act, the classes differ in that, among other things, Service Class shares of the Portfolio pay a combined distribution and service fee of 0.25% of average daily net assets attributable to Service Class shares of the Portfolio to the Distributor (as defined in Note 3(B)) pursuant to a plan adopted in accordance with Rule 12b-1 under the 1940 Act. Contract owners of variable annuity contracts purchased after June 2, 2003, are permitted to invest only in the Service Class shares.
The Portfolio’s investment objective is to seeklong-term capital appreciation.
Note 2–Significant Accounting Policies
The Portfolio is an investment company and accordingly follows the investment company accounting and reporting guidance of the Financial Accounting Standards Board (“FASB”) Accounting Standard CodificationTopic 946 Financial Services—Investment Companies. The Portfolio prepares its financial statements in accordance with generally accepted accounting principles (“GAAP”) in the United States of America and follows the significant accounting policies described below.
(A) Securities Valuation. Investments are usually valued as of the close of regular trading on the New York Stock Exchange (the “Exchange”) (usually 4:00 p.m. Eastern time) on each day the Portfolio is open for business (“valuation date”).
The Board of Trustees of the Fund (the “Board”) adopted procedures establishing methodologies for the valuation of the Portfolio’s securities
and other assets and delegated the responsibility for valuation determinations under those procedures to the Valuation Committee of the Fund (the “Valuation Committee”). The Board authorized the Valuation Committee to appoint a Valuation Subcommittee (the “Subcommittee”) to deal in the first instance with establishing the prices of securities for which market quotations are not readily available or the prices of which are not otherwise readily determinable under these procedures. The Subcommittee meets (in person, via electronic mail or via teleconference) on an as-needed basis. Subsequently, the Valuation Committee meets to ensure that actions taken by the Subcommittee were appropriate. The procedures state that, subject to the oversight of the Board and unless otherwise noted, the responsibility for theday-to-day valuation of portfolio assets (including fair value measurements for the Portfolio’s assets and liabilities) rests with New York Life Investment Management LLC (“New York Life Investments” or the “Manager”), aided to whatever extent necessary by the Subadvisor (as defined in Note 3(A)).
To assess the appropriateness of security valuations, the Manager, the Subadvisor or the Portfolio’s third-party service provider, who is subject to oversight by the Manager, regularly compares prior day prices, prices on comparable securities and the sale prices to the prior and current day prices and challenges prices with changes exceeding certain tolerance levels with third-party pricing services or broker sources. For those securities valued through either a standardized fair valuation methodology or a fair valuation measurement, the Subcommittee deals in the first instance with such valuation and the Valuation Committee reviews and affirms, if appropriate, the reasonableness of the valuation based on such methodologies and measurements on a regular basis after considering information that is reasonably available and deemed relevant by the Valuation Committee. Any action taken by the Subcommittee with respect to the valuation of a portfolio security or other asset is submitted for review and ratification (if appropriate) to the Valuation Committee and the Board at the next regularly scheduled meeting.
“Fair value” is defined as the price the Portfolio would reasonably expect to receive upon selling an asset or liability in an orderly transaction to an independent buyer in the principal or most advantageous market for the asset or liability. Fair value measurements are determined within a framework that establishes a three-tier hierarchy which maximizes the use of observable market data and minimizes the use of unobservable inputs to establish a classification of fair value measurements for disclosure purposes. “Inputs” refer broadly to the assumptions that market participants would use in pricing the asset or liability, including assumptions about risk, such as the risk inherent in a particular valuation technique used to measure fair value using a pricing model and/or the risk inherent in the inputs for the valuation technique. Inputs may be observable or unobservable. Observable inputs reflect the assumptions market participants would use in pricing the asset or liability based on market data obtained from sources independent of the Portfolio. Unobservable inputs reflect the Portfolio’s own assumptions about the assumptions market participants would use in pricing the asset or liability based on the information available. The inputs or methodology used for valuing assets or liabilities may not be an indication of the risks associated with investing in those assets or liabilities. The three-tier hierarchy of inputs is summarized below.
| • | | Level 1—quoted prices in active markets for an identical asset or liability |
Notes to Financial Statements(Unaudited) (continued)
| • | | Level 2—other significant observable inputs (including quoted prices for a similar asset or liability in active markets, interest rates and yield curves, prepayment speeds, credit risk, etc.) |
| • | | Level 3—significant unobservable inputs (including the Portfolio’s own assumptions about the assumptions that market participants would use in measuring fair value of an asset or liability) |
The level of an asset or liability within the fair value hierarchy is based on the lowest level of an input, both individually and in the aggregate, that is significant to the fair value measurement. As of June 30, 2019, the aggregate value by input level of the Portfolio’s assets and liabilities is included at the end of the Portfolio’s Portfolio of Investments.
The Portfolio may use third-party vendor evaluations, whose prices may be derived from one or more of the following standard inputs, among others:
| | |
• Broker/dealer quotes | | • Benchmark securities |
• Two-sided markets | | • Reference data (corporate actions or material event notices) |
• Bids/offers | | • Monthly payment information |
• Industry and economic events | | • Reported trades |
An asset or liability for which market values cannot be measured using the methodologies described above is valued by methods deemed reasonable in good faith by the Valuation Committee, following the procedures established by the Board, to represent fair value. Under these procedures, the Portfolio generally uses a market-based approach which may use related or comparable assets or liabilities, recent transactions, market multiples, book values and other relevant information. The Portfolio may also use an income-based valuation approach in which the anticipated future cash flows of the asset or liability are discounted to calculate fair value. Discounts may also be applied due to the nature and/or duration of any restrictions on the disposition of the asset or liability. Fair value represents a good faith approximation of the value of a security. Fair value determinations involve the consideration of a number of subjective factors, an analysis of applicable facts and circumstances and the exercise of judgment. As a result, it is possible that the fair value for a security determined in good faith in accordance with the Portfolio’s valuation procedures may differ from valuations for the same security determined by other funds using their own valuation procedures. Although the Portfolio’s valuation procedures are designed to value a security at the price the Portfolio may reasonably expect to receive upon the security’s sale in an orderly transaction, there can be no assurance that any fair value determination thereunder would, in fact, approximate the amount that the Portfolio would actually realize upon the sale of the security or the price at which the security would trade if a reliable market price were readily available. During the six-month period ended June 30, 2019, there were no material changes to the fair value methodologies.
Securities which may be valued in this manner include, but are not limited to: (i) a security for which trading has been halted or suspended; (ii) a debt security that has recently gone into default and for which there is not a current market quotation; (iii) a security of an issuer that has entered into a restructuring; (iv) a security that has been delisted from a national exchange; (v) a security for which the market price is not readily available from a third-party pricing source or, if so provided,
does not, in the opinion of the Manager or the Subadvisor, reflect the security’s market value; (vi) a security subject to trading collars for which no or limited trading takes place; and (vii) a security whose principal market has been temporarily closed at a time when, under normal conditions, it would be open. Securities valued in this manner are generally categorized as Level 3 in the hierarchy. As of June 30, 2019, there were no securities held by the Portfolio that were fair valued in such a manner.
Equity securities are valued at the last quoted sales prices as of the close of regular trading on the relevant exchange on each valuation date. Securities that are not traded on the valuation date are valued at the mean of the last quoted bid and ask prices. Prices are normally taken from the principal market in which each security trades. These securities are generally categorized as Level 1 in the hierarchy.
Investments in mutual funds, including money market funds, are valued at their respective NAVs as of the close of the Exchange on the valuation date. These securities are generally categorized as Level 1 in the hierarchy.
Temporary cash investments acquired in excess of 60 days to maturity at the time of purchase are valued using the latest bid prices or using valuations based on a matrix system (which considers such factors as security prices, yields, maturities and ratings), both as furnished by independent pricing services. Other temporary cash investments which mature in 60 days or less at the time of purchase (“Short-Term Investments”) are valued using the amortized cost method of valuation, unless the use of such method would be inappropriate. The amortized cost method involves valuing a security at its cost on the date of purchase and thereafter assuming a constant amortization to maturity of the difference between such cost and the value on maturity date. Amortized cost approximates the current fair value of a security. Securities valued using the amortized cost method are not valued using quoted prices in an active market and are generally categorized as Level 2 in the hierarchy.
The information above is not intended to reflect an exhaustive list of the methodologies that may be used to value portfolio investments. The valuation procedures permit the use of a variety of valuation methodologies in connection with valuing portfolio investments. The methodology used for a specific type of investment may vary based on the market data available or other considerations. The methodologies summarized above may not represent the specific means by which portfolio investments are valued on any particular business day.
(B) Income Taxes. The Portfolio’s policy is to comply with the requirements of the Internal Revenue Code of 1986, as amended (the “Internal Revenue Code”), applicable to regulated investment companies and to distribute all of its taxable income to the shareholders of the Portfolio within the allowable time limits. Therefore, no federal, state and local income tax provisions are required.
Management evaluates the Portfolio’s tax positions to determine if the tax positions taken meet the minimum recognition threshold in connection with accounting for uncertainties in income tax positions taken or expected to be taken for the purposes of measuring and recognizing tax liabilities in the financial statements. Recognition of tax benefits of an uncertain tax position is permitted only to the extent the position is “more likely than not” to be sustained assuming examination by taxing
| | |
| 18 | | MainStay VP Eagle Small Cap Growth Portfolio |
authorities. Management has analyzed the Portfolio’s tax positions taken on federal, state and local income tax returns for all open tax years (for up to three tax years) and has concluded that no provisions for federal, state and local income tax are required in the Portfolio’s financial statements. The Portfolio’s federal, state and local income tax and federal excise tax returns for tax years for which the applicable statutes of limitations have not expired are subject to examination by the Internal Revenue Service and state and local departments of revenue.
(C) Dividends and Distributions to Shareholders. Dividends and distributions are recorded on the ex-dividend date. The Portfolio intends to declare and pay dividends from net investment income and distributions from net realized capital and currency gains, if any, at least annually. Unless the shareholder elects otherwise, all dividends and distributions are reinvested in the same class of shares of the Portfolio, at NAV. Dividends and distributions to shareholders are determined in accordance with federal income tax regulations and may differ from determinations using GAAP.
(D) Security Transactions and Investment Income. The Portfolio records security transactions on the trade date. Realized gains and losses on security transactions are determined using the identified cost method. Dividend income is recognized on the ex-dividend date; net of any foreign tax withheld at the source, and interest income is accrued as earned using the effective interest rate method.
Investment income and realized and unrealized gains and losses on investments of the Portfolio are allocated pro rata to the separate classes of shares based upon their relative net assets on the date the income is earned or realized and unrealized gains and losses are incurred.
(E) Expenses. Expenses of the Fund are allocated to the individual Portfolios in proportion to the net assets of the respective Portfolios when the expenses are incurred, except where direct allocations of expenses can be made. Expenses (other than fees incurred under the distribution and service plans, further discussed in Note 3(B), which are charged directly to the Service Class shares) are allocated to separate classes of shares pro rata based upon their relative net assets on the date the expenses are incurred. The expenses borne by the Portfolio, including those of related parties to the Portfolio, are shown in the Statement of Operations.
Additionally, the Portfolio may invest in mutual funds, which are subject to management fees and other fees that may cause the costs of investing in mutual funds to be greater than the costs of owning the underlying securities directly. These indirect expenses of mutual funds are not included in the amounts shown as expenses in the Portfolio’s Statement of Operations or in the expense ratios included in the Financial Highlights.
(F) Use of Estimates. In preparing financial statements in conformity with GAAP, management makes estimates and assumptions that affect the reported amounts and disclosures in the financial statements. Actual results could differ from those estimates.
(G) Repurchase Agreements. The Portfolio may enter into repurchase agreements (i.e., buy a security from another party with the agreement that it be sold back in the future) to earn income. The Portfolio may enter into repurchase agreements only with counter-
parties, usually financial institutions, that are deemed by the Manager or the Subadvisor to be creditworthy, pursuant to guidelines established by the Board. During the term of any repurchase agreement, the Manager or the Subadvisor will continue to monitor the creditworthiness of the counterparty. Under the 1940 Act, repurchase agreements are considered to be collateralized loans by the Portfolio to the counterparty secured by the securities transferred to the Portfolio.
Repurchase agreements are subject to counterparty risk, meaning the Portfolio could lose money by the counterparty’s failure to perform under the terms of the agreement. The Portfolio mitigates this risk by ensuring the repurchase agreement is collateralized by cash, U.S. government securities, fixed income securities and/or other securities. The collateral is held by the Portfolio’s custodian and valued daily on a mark to market basis to determine if the value, including accrued interest, exceeds the repurchase price. In the event of the counterparty’s default on the obligation to repurchase, the Portfolio has the right to liquidate the collateral and apply the proceeds in satisfaction of the obligation. Under certain circumstances, such as in the event of default or bankruptcy by the counterparty, realization and/or retention of the collateral may be limited or subject to delay, to legal proceedings and possible realized loss to the Portfolio. As of June 30, 2019, the Portfolio did not hold any repurchase agreements.
(H) Securities Lending. In order to realize additional income, the Portfolio may engage in securities lending, subject to the limitations set forth in the 1940 Act and relevant guidance by the staff of the Securities and Exchange Commission (“SEC”). In the event the Portfolio does engage in securities lending, the Portfolio will lend through its custodian, State Street Bank and Trust Company (“State Street”), acting as securities lending agent on behalf of the Portfolio. State Street will manage the Portfolio’s collateral in accordance with the securities lending agency agreement between the Portfolio and State Street, and indemnify the Portfolio against counterparty risk. The loans will be collateralized by cash (which may be invested in a money market fund) and/ornon-cash collateral (which may include, U.S. Treasury securities and/or U.S. Government Agency securities issued or guaranteed by the United States government or its agencies or instrumentalities) at least equal at all times to the market value of the securities loaned. The Portfolio may bear the risk of delay in recovery of, or loss of rights in, the securities loaned should the borrower of the securities experience financial difficulty. The Portfolio may also record a realized gain or loss on securities deemed sold due to a borrower’s inability to return securities on loan. The Portfolio bears the risk of any loss on investment of cash collateral. The Portfolio will receive compensation for lending its securities in the form of fees or it will retain a portion of interest on the investment of any cash collateral. The Portfolio will also continue to receive interest and dividends on the securities loaned and any gain or loss in the market price of the securities loaned that may occur during the term of the loan will be for the account of the Portfolio. Income earned from securities lending activities, if any, is reflected in the Statement of Operations. As of June 30, 2019, the Portfolio had securities on loan with an aggregate market value of $21,476,194; the total market value of collateral held by the Portfolio was $21,946,221. The market value of the collateral held includednon-cash collateral in the form of U.S. Treasury securities with a value of $10,165,109 and cash collateral which was invested into the State Street Navigator Securities Lending Government Money Market Portfolio with a value of $11,781,112.
Notes to Financial Statements(Unaudited) (continued)
(I) Indemnifications. Under the Fund’s organizational documents, its officers and trustees are indemnified against certain liabilities that may arise out of performance of their duties to the Fund. Additionally, in the normal course of business, the Portfolio enters into contracts with third-party service providers that contain a variety of representations and warranties and which may provide general indemnifications. The Portfolio’s maximum exposure under these arrangements is unknown, as this would involve future claims that may be made against the Portfolio that have not yet occurred. Based on experience, management is of the view that the risk of loss in connection with these potential indemnification obligations is remote. However, there can be no assurance that material liabilities related to such obligations will not arise in the future, which could adversely impact the Portfolio.
Note 3–Fees and Related Party Transactions
(A) Manager and Subadvisor. New York Life Investments, a registered investment adviser and an indirect,wholly-owned subsidiary of New York Life, serves as the Portfolio’s Manager pursuant to an Amended and Restated Management Agreement (“Management Agreement”). The Manager provides offices, conducts clerical, recordkeeping and bookkeeping services, and keeps most of the financial and accounting records required to be maintained by the Portfolio. Except for the portion of salaries and expenses that are the responsibility of the Portfolio, the Manager pays the salaries and expenses of all personnel affiliated with the Portfolio and certain operational expenses of the Portfolio. The Portfolio reimburses New York Life Investments in an amount equal to a portion of the compensation of the Chief Compliance Officer attributable to the Portfolio. Pursuant to the terms of a Subadvisory Agreement with New York Life Investments, Eagle Asset Management, Inc. (“Eagle” or the “Subadvisor”) a registered investment adviser, serves as Subadvisor to the Portfolio and is responsible for theday-to-day portfolio management of the Portfolio. Pursuant to the terms of a Subadvisory Agreement (“Subadvisory Agreement”) between New York Life Investments and Eagle, New York Life Investments pays for the services of the Subadvisor.
Effective May 1, 2019, the Fund, on behalf of the Portfolio, pays New York Life Investments in its capacity as the Portfolio’s investment manager and administrator, pursuant to the Management Agreement, a monthly fee for the services performed and the facilities furnished at an
annual percentage of the average daily net assets as follows: 0.81% up to $1 billion and 0.785% in excess of $1 billion. Prior to May 1, 2019, the Fund, on behalf of the Portfolio, paid New York Life Investments in its capacity as the portfolio’s investment manager and administrator, pursuant to the Management Agreement, a monthly fee for the services performed and the facilities furnished at an annual percentage of the Portfolio’s average daily net assets of 0.81%. During the six-month period ended June 30, 2019, the effective management fee rate was 0.81%.
During the six-month period ended June 30, 2019, New York Life Investments earned fees from the Portfolio in the amount of $1,582,885, and paid the Subadvisor in the amount of $806,466.
State Street providessub-administration andsub-accounting services to the Portfolio pursuant to an agreement with New York Life Investments. These services include calculating the daily NAVs of the Portfolio, maintaining the general ledger andsub-ledger accounts for the calculation of the Portfolio’s NAVs and assisting New York Life Investments in conducting various aspects of the Portfolio’s administrative operations. For providing these services to the Portfolio, State Street is compensated by New York Life Investments.
Pursuant to an agreement between the Fund and New York Life Investments, New York Life Investments is responsible for providing or procuring certain regulatory reporting services for the Portfolio. The Portfolio will reimburse New York Life Investments for the actual costs incurred by New York Life Investments in connection with providing or procuring these services for the Portfolio.
(B) Distribution and Service Fees. The Fund, on behalf of the Portfolio, has entered into a distribution agreement with NYLIFE Distributors LLC (the “Distributor”), an indirect,wholly-owned subsidiary of New York Life. The Portfolio has adopted a distribution plan (the “Plan”) in accordance with the provisions of Rule 12b-1 under the 1940 Act. Under the Plan, the Distributor has agreed to provide, through its affiliates or independent third parties, various distribution-related, shareholder and administrative support services to the Service Class shareholders. For its services, the Distributor is entitled to a combined distribution and service fee accrued daily and paid monthly at an annual rate of 0.25% of the average daily net assets attributable to the Service Class shares of the Portfolio.
(C) Investments in Affiliates (in 000’s). During the six-month period ended June 30, 2019, purchases and sales transactions, income earned from investments and shares held of investment companies managed by New York Life Investments or its affiliates were as follows:
| | | | | | | | | | | | | | | | | | | | | | | | | | | | | | | | | | | | |
Affiliated Investment Company | | Value,
Beginning of
Period | | | Purchases
at Cost | | | Proceeds
from Sales | | | Net
Realized
Gain/(Loss)
on Sales | | | Change in
Unrealized
Appreciation/
(Depreciation) | | | Value,
End of
Period | | | Dividend
Income | | | Other
Distributions | | | Shares
End of
Period | |
MainStay U.S. Government Liquidity Fund | | $ | 11,324 | | | $ | 61,763 | | | $ | (70,012 | ) | | $ | — | | | $ | — | | | $ | 3,075 | | | $ | 72 | | | $ | — | | | | 3,075 | |
| | |
| 20 | | MainStay VP Eagle Small Cap Growth Portfolio |
Note 4–Federal Income Tax
As of June 30, 2019, the cost and unrealized appreciation (depreciation) of the Portfolio’s investment portfolio, including applicable derivative contracts and other financial instruments, as determined on a federal income tax basis, were as follows:
| | | | | | | | | | | | | | | | |
| | | Federal Tax
Cost | | | Gross
Unrealized
Appreciation | | | Gross
Unrealized
(Depreciation) | | | Net
Unrealized
Appreciation/
(Depreciation) | |
Investments in Securities | | $ | 327,804,609 | | | $ | 96,008,390 | | | $ | (16,697,544 | ) | | $ | 79,310,846 | |
During the year ended December 31, 2018, the tax character of distributions paid as reflected in the Statements of Changes in Net Assets was as follows:
| | |
|
| 2018 |
Tax-Based
Distributions
from Ordinary
Income | | Tax-Based
Distributions
from Long-Term
Gains |
| |
| $6,001,466 | | $15,102,293 |
Note 5–Custodian
State Street is the custodian of cash and securities held by the Portfolio. Custodial fees are charged to the Portfolio based on the Portfolio’s net assets and/or the market value of securities held by the Portfolio and the number of certain transactions incurred by the Portfolio.
Note 6–Line of Credit
The Portfolio and certain other funds managed by New York Life Investments maintain a line of credit with a syndicate of banks in order to secure a source of funds for temporary purposes to meet unanticipated or excessive redemption requests.
Effective July 30, 2019, under the credit agreement (the “Credit Agreement”), the aggregate commitment amount is $600,000,000 with an additional uncommitted amount of $100,000,000. The commitment fee is an annual rate of 0.15% of the average commitment amount payable quarterly, regardless of usage, to State Street, who serves as the agent to the syndicate. The commitment fee is allocated among the Portfolio and certain other funds managed by New York Life Investments based upon their respective net assets and other factors. Interest on any revolving credit loan is charged based upon the Federal Funds Rate or the one-month London Interbank Offered Rate (“LIBOR”), whichever is higher. The Credit Agreement expires on July 28, 2020, although the Portfolio, certain other funds managed by New York Life Investments and the syndicate of banks may renew the Credit Agreement for an additional year on the same or different terms. Prior to July 30, 2019, the aggregate commitment amount and the commitment fee were the same as those under the current Credit Agreement. During the six-month period ended June 30, 2019, there were no borrowings made or outstanding with respect to the Portfolio under the Credit Agreement.
Note 7–Interfund Lending Program
Pursuant to an exemptive order issued by the SEC, the Portfolio, along with certain other funds managed by New York Life Investments, may
participate in an interfund lending program. The interfund lending program provides an alternative credit facility that permits the Portfolio and certain other funds managed by New York Life Investments to lend or borrow money for temporary purposes directly to or from one another subject to the conditions of the exemptive order. During the six-month period ended June 30, 2019, there were no interfund loans made or outstanding with respect to the Portfolio.
Note 8–Purchases and Sales of Securities (in 000’s)
During the six-month period ended June 30, 2019, purchases and sales of securities, other thanshort-term securities, were $83,112 and $101,831, respectively.
Note 9–Capital Share Transactions
Transactions in capital shares for the six-month period ended June 30, 2019 and the year ended December 31, 2018, were as follows:
| | | | | | | | |
Initial Class | | Shares | | | Amount | |
| | |
Six-month period ended June 30, 2019: | | | | | | | | |
Shares sold | | | 466,774 | | | $ | 6,342,604 | |
Shares redeemed | | | (2,138,631 | ) | | | (30,322,181 | ) |
| | | | |
Net increase (decrease) | | | (1,671,857 | ) | | $ | (23,979,577 | ) |
| | | | |
Year ended December 31, 2018: | | | | | | | | |
Shares sold | | | 1,386,685 | | | $ | 19,758,474 | |
Shares issued to shareholders in reinvestment of dividends and distributions | | | 1,020,434 | | | | 15,228,717 | |
Shares redeemed | | | (3,931,627 | ) | | | (58,870,220 | ) |
| | | | |
Net increase (decrease) | | | (1,524,508 | ) | | $ | (23,883,029 | ) |
| | | | |
| | |
| | | | | | | | |
Service Class | | Shares | | | Amount | |
| | |
Six-month period ended June 30, 2019: | | | | | | | | |
Shares sold | | | 1,231,114 | | | $ | 16,957,295 | |
Shares redeemed | | | (774,922 | ) | | | (10,702,579 | ) |
| | | | |
Net increase (decrease) | | | 456,192 | | | $ | 6,254,716 | |
| | | | |
Year ended December 31, 2018: | | | | | | | | |
Shares sold | | | 2,419,281 | | | $ | 35,597,359 | |
Shares issued to shareholders in reinvestment of dividends and distributions | | | 401,292 | | | | 5,875,042 | |
Shares redeemed | | | (1,307,173 | ) | | | (18,568,468 | ) |
| | | | |
Net increase (decrease) | | | 1,513,400 | | | $ | 22,903,933 | |
| | | | |
Note 10–Recent Accounting Pronouncement
To improve the effectiveness of fair value disclosure requirements, the Financial Accounting Standards Board recently issued Accounting Standard Update (ASU)2018-13, Fair Value Measurement Disclosure Framework—Changes to the Disclosure Requirements for Fair Value Measurement (ASU2018-13), which adds, removes, and modifies certain aspects relating to fair value disclosure. ASU2018-13 is effective for interim and annual reporting periods beginning after December 15, 2019; early adoption of the additions relating to ASU2018-13 is not required. Management has evaluated the implications of certain other provisions of the ASU and has determined to early adopt aspects related to the removal and modifications of certain fair value measurement disclosures under the ASU effective immediately. At this time, management
Notes to Financial Statements(Unaudited) (continued)
is evaluating the implications of certain other provisions of the ASU related to new disclosure requirements and any impact on the financial statement disclosures has not yet been determined.
Note 11–Subsequent Events
In connection with the preparation of the financial statements of the Portfolio as of and for the six-month period ended June 30, 2019,
events and transactions subsequent to June 30, 2019, through the date the financial statements were issued have been evaluated by the Portfolio’s management for possible adjustment and/or disclosure. No subsequent events requiring financial statement adjustment or disclosure have been identified.
| | |
| 22 | | MainStay VP Eagle Small Cap Growth Portfolio |
Proxy Voting Policies and Procedures and Proxy Voting Record
A description of the policies and procedures that New York Life Investments uses to vote proxies related to the Portfolio’s securities is available without charge, upon request (i) by calling800-598-2019; (ii) by visiting New York Life Investments website at https://www.nylinvestments.com/mainstay/products-and-performance/mainstay-vp-funds-trust; or (iii) by visiting the SEC’s website at www.sec.gov.
The Portfolio is required to file with the SEC its proxy voting record for the12-month period ending June 30 on Form N-PX. The Portfolio’s most recent Form N-PX or proxy voting record is available free of charge upon request (i) by calling800-598-2019; (ii) by visiting New York Life Investments website at https://www.nylinvestments.com/mainstay/products-and-performance/mainstay-vp-funds-trust; or (iii) by visiting the SEC’s website atwww.sec.gov.
Shareholder Reports and Quarterly Portfolio Disclosure
The Portfolio is required to file its complete schedule of portfolio holdings with the SEC 60 days after each fiscal quarter onForm N-PORT. The Portfolio’s holdings report is available without charge upon request (i) by calling800-598-2019; (ii) by visiting New York Life Investments website at https://www.nylinvestments.com/mainstay/products-and-performance/mainstay-vp-funds-trust; or (iii) on the SEC’s website at www.sec.gov.
MainStay VP Portfolios
MainStay VP offers a wide range of Portfolios. The full array of MainStay VP offerings is listed here, with information about the manager, subadvisors, legal counsel, and independent registered public accounting firm.
Equity Portfolios
MainStay VP Eagle Small Cap Growth Portfolio
MainStay VP Emerging Markets Equity Portfolio
MainStay VP Epoch U.S. Equity Yield Portfolio
MainStay VP Fidelity Institutional AM® Utilities Portfolio†
MainStay VP Large Cap Growth Portfolio
MainStay VP MacKay Common Stock Portfolio
MainStay VP MacKay Growth Portfolio
MainStay VP MacKay International Equity Portfolio
MainStay VP MacKay Mid Cap Core Portfolio
MainStay VP MacKay S&P 500 Index Portfolio
MainStay VP MacKay Small Cap Core Portfolio
MainStay VP Mellon Natural Resources Portfolio
MainStay VP T. Rowe Price Equity Income Portfolio
Mixed Asset Portfolios
MainStay VP Balanced Portfolio
MainStay VP Income Builder Portfolio
MainStay VP Janus Henderson Balanced Portfolio
MainStay VP MacKay Convertible Portfolio
Income Portfolios
MainStay VP Bond Portfolio
MainStay VP Floating Rate Portfolio
MainStay VP Indexed Bond Portfolio
MainStay VP MacKay Government Portfolio
MainStay VP MacKay High Yield Corporate Bond Portfolio
MainStay VP MacKay Unconstrained Bond Portfolio
MainStay VP PIMCO Real Return Portfolio
Money Market
MainStay VP U.S. Government Money Market Portfolio
Alternative
MainStay VP Cushing Renaissance Advantage Portfolio
MainStay VP IQ Hedge Multi-Strategy Portfolio
Asset Allocation Portfolios
MainStay VP Conservative Allocation Portfolio
MainStay VP Growth Allocation Portfolio
MainStay VP Moderate Allocation Portfolio
MainStay VP Moderate Growth Allocation Portfolio
Manager
New York Life Investment Management LLC
New York, New York
Subadvisors
Candriam Belgium*
Brussels, Belgium
Cushing Asset Management, LP
Dallas, Texas
Eagle Asset Management, Inc.
St Petersburg, Florida
Epoch Investment Partners, Inc.
New York, New York
FIAM LLC
Smithfield, Rhode Island
IndexIQ Advisors LLC*
New York, New York
Janus Capital Management LLC
Denver, Colorado
MacKay Shields LLC*
New York, New York
Mellon Investments Corporation
Boston, Massachusetts
NYL Investors LLC*
New York, New York
Pacific Investment Management Company LLC
Newport Beach, California
T. Rowe Price Associates, Inc.
Baltimore, Maryland
Winslow Capital Management, LLC
Minneapolis, Minnesota
Distributor
NYLIFE Distributors LLC*
Jersey City, New Jersey
Custodian
State Street Bank and Trust Company
Boston, Massachusetts
Independent Registered Public Accounting Firm
PricewaterhouseCoopers LLP
New York, New York
Legal Counsel
Dechert LLP
Washington, District of Columbia
Some Portfolios may not be available in all products.
| † | Fidelity Institutional AM is a registered trade mark of FMR LLC. Used with permission. |
| * | An affiliate of New York Life Investment Management LLC |
Not part of the Semiannual Report
2019 Semiannual Report
This report is for the general information of New York Life Variable Annuities and NYLIAC Variable Universal Life Insurance Products policyowners. It must be preceded or accompanied by the appropriate product(s) and funds prospectuses if it is given to anyone who is not an owner of a New York Life variable annuity policy or a NYLIAC Variable Universal Life Insurance Product. This report does not offer for sale or solicit orders to purchase securities.
The performance data quoted in this report represents past performance. Past performance is no guarantee of future results. Due to market volatility and other factors, current performance may be lower or higher than the figures shown. The most recent month-end performance summary for your variable annuity or variable life policy is available by calling 800-598-2019 and is updated periodically on www.newyorklife.com.
The New York Life Variable Annuities and NYLIAC Variable Universal Life Insurance Products are issued by New York Life Insurance and Annuity Corporation (a Delaware Corporation) and distributed by NYLIFE Distributors LLC (Member FINRA/SIPC).
New York Life Insurance Company
New York Life Insurance and Annuity Corporation (NYLIAC) (A Delaware Corporation)
51 Madison Avenue, Room 551
New York, NY 10010
www.newyorklife.com
Printed on recycled paper
nylinvestments.com
NYLIFE Distributors LLC, 30 Hudson Street, Jersey City, NJ 07302
New York Life Investment Management LLC is the investment manager to the MainStay VP Funds Trust
©2019 by NYLIFE Distributors LLC. All rights reserved.
You may obtain copies of the Prospectus and the Statement of Additional Information free of charge, upon request, by callingtoll-free 800-598-2019 or writing to New York Life Insurance and Annuity Corporation, 51 Madison Avenue, New York, NY 10010.
| | | | |
| | | |
| Not FDIC Insured | | No Bank Guarantee | | May Lose Value |
| | | | |
| 1781614 | | | | MSVPESCG10-08/19 (NYLIAC) NI515 |
MainStay VP Epoch U.S. Equity Yield Portfolio
Message from the President and Semiannual Report
Unaudited | June 30, 2019

Beginning on January 1, 2021, as permitted by regulations adopted by the Securities and Exchange Commission, paper copies of the MainStay VP Portfolio annual and semi-annual shareholder reports may no longer be sent by mail, unless you specifically request paper copies of the reports from the insurance company that offers your policy. Instead, the reports will be made available online, and you will be notified by mail each time a report is posted and provided with a website link to access the report. Instructions for requesting paper copies will be provided by your insurance company.
If you already elected to receive shareholder reports electronically, you will not be affected by this change and you need not take any action. At any time, you may elect to receive reports and other communications from the insurance company electronically by following the instructions provided by the insurance company.
You may elect to receive all future shareholder reports in paper form free of charge. You can inform the insurance company that you wish to receive paper copies of reports by following the instructions provided by the insurance company. Your election to receive reports in paper form will apply to all portfolio companies available under your contract.
| | | | | | | | |
| | | | | |
| Not FDIC/NCUA Insured | | Not a Deposit | | May Lose Value | | No Bank Guarantee | | Not Insured by Any Government Agency |

This page intentionally left blank
Message from the President
Most equity and fixed-income markets in the United States and around the world advanced in the face of conflicting political and macroeconomic forces during thesix-month period ended June 30, 2019.
The reporting period began on the heels of tumultuous December 2018, during which equities and equity-sensitive bonds spiked sharply lower on concerns regarding the pace of economic growth, a U.S. government shutdown and the potential impact of trade disputes between the United States and other nations, particularly China. Markets recovered quickly in early 2019 as trade tensions eased, the government reopened and the U.S. Federal Reserve Board (Fed) adopted a more patient tone regarding the future direction of interest rates. Markets moved broadly higher from January through April, supported by encouraging economic data and generally strong corporate earnings.
During the first four months of the reporting period, the improving economic environment encouraged investors to favor areas of the market viewed as offering greater return potential along with higher risks. Among U.S. stocks, cyclical, growth-oriented sectors tended to outperform more defensive, value-oriented sectors, whilelarge-cap stocks outperformed theirsmaller-cap counterparts. Within the S&P 500® Index, the information technology sector led the market’s advance, followed by communication services, consumer discretionary and consumer staples. Industrials, utilities, financials, materials, real estate and energy produced more modest gains. While some international equity markets outperformed or underperformed the U.S. market, on average international stocks mirrored the performance of their U.S. counterparts. Fixed-income securities gained ground as well, albeit along a more gradual trajectory. Among U.S. fixed-income instruments, corporate issues generally outperformed government bonds, with lower credit quality, higher yielding securities leading the sector’s advance. Long-term U.S. Treasury bond yields proved particularly weak, with
10-year yields dipping at times below3-month yields, reflecting investors’ continued concerns about domestic economic growth.
May 2019 saw a return of uncertainty and volatility. Trade discussions between the United States and China faltered, driving global equity prices lower. Government bond prices rose as investors sought safe havens. June brought yet anotherU-turn as equity prices climbed again after comments from the Fed raised hopes of an interest rate cut in response to weak economic data. Stock and bond prices rose, with U.S. equity markets ending the reporting period in record territory.
We are pleased to see renewed signs of strength in broad areas of the financial market. At the same time, we remained sharply focused on providing you, as a MainStay VP investor, with the experienced and disciplined fund management that we believe underpins an effective, long-term investment strategy. Whatever tomorrow’s investment environment brings, you can rely on our portfolio managers to pursue the objectives of their individual Portfolios as outlined in the prospectus with the energy and dedication you have come to expect.
The report that follows contains additional information on the market events, investment decisions and specific securities that shaped your VP Portfolio’s performance during the six months ended June 30, 2019. We encourage you to read the report carefully and use it to evaluate your Portfolio’s performance in light of your long-range financial plan.
Sincerely,

Kirk C. Lehneis
President
The opinions expressed are as of the date of this report and are subject to change. There is no guarantee that any forecast made will come to pass. This material does not constitute investment advice and is not intended as an endorsement of any specific investment. Past performance is no guarantee of future results.
Not part of the Semiannual Report
Table of Contents
Investors should refer to the Portfolio’s Summary Prospectus and/or Prospectus and consider the Portfolio’s investment objectives, strategies, risks, charges and expenses carefully before investing. The Summary Prospectus and/or Prospectus contain this and other information about the Portfolio. You may obtain copies of the Portfolio’s Summary Prospectus and/or the Prospectus and the Statement of Additional Information free of charge, upon request, by calling toll-free 800-598-2019, by writing to New York Life Insurance and Annuity Corporation, 51 Madison Avenue, Room 251, New York, New York 10010 or by sending an email to MainStayShareholdersServices@nylim.com. These documents are also available at nylinvestments.com/vpdocuments. Please read the Summary Prospectus and/or Prospectus carefully before investing. MainStay VP Funds Trust portfolios are separate account options which are purchased through a variable insurance or variable annuity contract.
Investment and Performance Comparison1(Unaudited)
Performance data quoted represents past performance. Past performance is no guarantee of future results. Because of market volatility and other factors, current performance may be lower or higher than the figures shown. Investment return and principal value will fluctuate, and as a result, when shares are redeemed, they may be worth more or less than their original cost. The performance table and graph do not reflect any deduction of sales charges, mortality and expense charges, contract charges or administrative charges. Please refer to the Performance Summary appropriate for your policy. For performance information current to the most recent month-end, please call800-598-2019 or visit www.newyorklife.com.
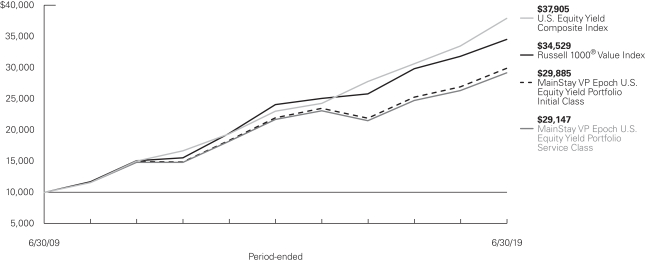
Average Annual Total Returns for the Period-Ended June 30, 2019
| | | | | | | | | | | | | | | | | | |
| Class | | Inception
Date | | Six Months | | One Year | | Five Years | | | Ten Years | | | Gross
Expense
Ratio2 | |
| | | | | | |
| Initial Class Shares | | 5/1/1998 | | 14.54% | | 10.95% | | | 6.36 | % | | | 11.57 | % | | | 0.71 | % |
| Service Class Shares | | 6/5/2003 | | 14.40 | | 10.67 | | | 6.10 | | | | 11.29 | | | | 0.96 | |
| | | | | | | | | | | | | | | | |
| Benchmark Performance | | Six Months | | | One Year | | | Five Years | | | Ten Years | |
| | | | |
Russell 1000® Value Index3 | | | 16.24 | % | | | 8.46 | % | | | 7.46 | % | | | 13.19 | % |
U.S. Equity Yield Composite Index4 | | | 14.62 | | | | 13.20 | | | | 10.48 | | | | 14.25 | |
Morningstar Large Value Category Average5 | | | 14.59 | | | | 5.79 | | | | 6.84 | | | | 12.20 | |
| 1. | Performance figures may reflect certain fee waivers and/or expense limitations, without which total returns may have been different. For information on current fee waivers and/or expense limitations (if any), please refer to the Notes to Financial Statements. |
| 2. | The gross expense ratios presented reflect the Portfolio’s “Total Annual Portfolio Operating Expenses” from the most recent Prospectus, as supplemented, and may differ from other expense ratios disclosed in this report. |
| 3. | The Russell 1000® Value Index is the Portfolio’s primary broad-based securities market index for comparison purposes. The Russell 1000® Value Index measures the performance of the large-cap value segment of the U.S. equity universe. It includes those Russell 1000® Index companies with lower price-to-book ratios and lower expected growth values. Results assume reinvestment of all dividends and capital gains. An investment cannot be made directly in an index. |
| 4. | The Portfolio has selected the U.S. Equity Yield Composite Index as its secondary benchmark. The U.S. Equity Yield Composite Index consists of the MSCI USA High Dividend Yield Index and the MSCI USA Minimum Volatility |
| | (USD) Index weighted at 60% and 40%, respectively. The MSCI USA High Dividend Yield Index is based on the MSCI USA Index and includes large and mid-cap stocks. The MSCI USA High Dividend Yield Index is designed to reflect the performance of equities in the MSCI USA Index (excluding real estate investment trusts) with higher dividend income and quality characteristics than average dividend yields that are both sustainable and persistent. The MSCI USA Minimum Volatility (USD) Index aims to reflect the performance characteristics of a minimum variance strategy applied to the large and mid-cap USA equity universe. The MSCI USA Minimum Volatility (USD) Index is calculated by optimizing the MSCI USA Index in USD for the lowest absolute risk (within a given set of constraints). Results assume reinvestment of all dividends and capital gains. An investment cannot be made directly in an index. |
| 5. | The Morningstar Large Value Category Average is representative of funds that invest primarily in big U.S. companies that are less expensive or growing more slowly than other large-cap stocks. Results are based on average total returns of similar funds with all dividends and capital gain distributions reinvested. |
Cost in Dollars of a $1,000 Investment in MainStay VP Epoch U.S. Equity Yield Portfolio (Unaudited)
The example below is intended to describe the fees and expenses borne by shareholders during the six-month period from January 1, 2019, to June 30, 2019, and the impact of those costs on your investment.
Example
As a shareholder of the Portfolio you incur two types of costs: (1) transaction costs, including exchange fees and sales charges (loads) on purchases (as applicable), and (2) ongoing costs, including management fees, distribution and/or service (12b-1) fees, and other Portfolio expenses (as applicable). This example is intended to help you understand your ongoing costs (in dollars) of investing in the Portfolio and to compare these costs with the ongoing costs of investing in other mutual funds. The example is based on an investment of $1,000 made at the beginning of the six-month period and held for the entire period from January 1, 2019, to June 30, 2019. Shares are only sold in connection with variable life and annuity contracts and the example does not reflect any contract level or transactional fees or expenses. If these costs had been included, your costs would have been higher.
This example illustrates your Portfolio’s ongoing costs in two ways:
Actual Expenses
The second and third data columns in the table below provide information about actual account values and actual expenses. You may use the information in these columns, together with the amount you invested, to estimate the expenses that you paid during the six months ended June 30, 2019. Simply divide your account value by $1,000
(for example, an $8,600 account value divided by $1,000 = 8.6), then multiply the result by the number under the heading entitled “Expenses Paid During Period” to estimate the expenses you paid on your account during this period.
Hypothetical Example for Comparison Purposes
The fourth and fifth data columns in the table below provide information about hypothetical account values and hypothetical expenses based on the Portfolio’s actual expense ratio and an assumed rate of return of 5% per year before expenses, which is not the Portfolio’s actual return. The hypothetical account values and expenses may not be used to estimate the actual ending account balances or expenses you paid for thesix-month period shown. You may use this information to compare the ongoing costs of investing in the Portfolio with the ongoing costs of investing in other mutual funds. To do so, compare this 5% hypothetical example with the 5% hypothetical examples that appear in the shareholder reports of the other mutual funds.
Please note that the expenses shown in the table are meant to highlight your ongoing costs only and do not reflect any transactional costs, such as exchange fees or sales charges (loads). Therefore, the fourth and fifth data columns of the table are useful in comparing ongoing costs only and will not help you determine the relative total costs of owning different funds. In addition, if these transactional costs were included, your costs would have been higher.
| | | | | | | | | | | | | | | | | | | | | | |
| | | | | | | | | | | | | | | | | | |
| Share Class | | Beginning
Account
Value
1/1/19 | | | Ending Account
Value (Based
on Actual
Returns and
Expenses)
6/30/19 | | | Expenses
Paid
During
Period1 | | | Ending Account
Value (Based
on Hypothetical
5% Annualized
Return and
Actual Expenses)
6/30/19 | | | Expenses
Paid
During
Period1 | | | Net Expense
Ratio
During
Period2 |
| | | | | | |
| Initial Class Shares | | $ | 1,000.00 | | | $ | 1,145.40 | | | $ | 3.62 | | | $ | 1,021.42 | | | $ | 3.41 | | | 0.68% |
| | | | | | |
| Service Class Shares | | $ | 1,000.00 | | | $ | 1,144.00 | | | $ | 4.94 | | | $ | 1,020.18 | | | $ | 4.66 | | | 0.93% |
| 1. | Expenses are equal to the Portfolio’s annualized expense ratio of each class multiplied by the average account value over the period, divided by 365 and multiplied by 181 (to reflect the six-month period). The table above represents the actual expenses incurred during the six-month period. In addition to the fees and expenses which the Portfolio bears directly, it also indirectly bears a pro rata share of the fees and expenses of the underlying funds in which it invests. Such indirect expenses are not included in the above-reported expense figures. |
| 2. | Expenses are equal to the Portfolio’s annualized expense ratio to reflect the six-month period. |
| | |
| 6 | | MainStay VP Epoch U.S. Equity Yield Portfolio |
Industry Composition as of June 30, 2019(Unaudited)
| | | | |
| |
| Electric Utilities | | | 10.5 | % |
| |
| Oil, Gas & Consumable Fuels | | | 7.2 | |
| |
| Insurance | | | 6.2 | |
| |
| Multi-Utilities | | | 5.6 | |
| |
| Semiconductors & Semiconductor Equipment | | | 5.1 | |
| |
| Pharmaceuticals | | | 4.6 | |
| |
| Aerospace & Defense | | | 4.3 | |
| |
| Banks | | | 4.2 | |
| |
| Diversified Telecommunication Services | | | 4.1 | |
| |
| Equity Real Estate Investment Trusts | | | 3.4 | |
| |
| Beverages | | | 3.3 | |
| |
| Household Products | | | 3.1 | |
| |
| Tobacco | | | 3.1 | |
| |
| Commercial Services & Supplies | | | 2.9 | |
| |
| Capital Markets | | | 2.7 | |
| |
| Hotels, Restaurants & Leisure | | | 2.7 | |
| |
| Electrical Equipment | | | 2.6 | |
| |
| Software | | | 2.3 | |
| |
| Chemicals | | | 2.2 | |
| |
| Industrial Conglomerates | | | 2.1 | |
| | | | |
| |
| IT Services | | | 2.0 | % |
| |
| Biotechnology | | | 1.6 | |
| |
| Communications Equipment | | | 1.4 | |
| |
| Health Care Providers & Services | | | 1.3 | |
| |
| Multiline Retail | | | 1.2 | |
| |
| Food & Staples Retailing | | | 1.1 | |
| |
| Specialty Retail | | | 0.9 | |
| |
| Technology Hardware, Storage & Peripherals | | | 0.9 | |
| |
| Containers & Packaging | | | 0.8 | |
| |
| Health Care Equipment & Supplies | | | 0.7 | |
| |
| Air Freight & Logistics | | | 0.6 | |
| |
| Distributors | | | 0.6 | |
| |
| Food Products | | | 0.6 | |
| |
| Household Durables | | | 0.6 | |
| |
| Metals & Mining | | | 0.6 | |
| |
| Textiles, Apparel & Luxury Goods | | | 0.6 | |
| |
| Trading Companies & Distributors | | | 0.6 | |
| |
| Short-Term Investments | | | 0.3 | |
| |
| Other Assets, Less Liabilities | | | 1.4 | |
| | | | |
| | | 100.0 | % |
| | | | |
See Portfolio of Investments beginning on page 10 for specific holdings within these categories. The Portfolio’s holdings are subject to change.
Top Ten Holdings as of June 30, 2019(excludingshort-term investment) (Unaudited)
| 2. | Arthur J. Gallagher & Co. |
| 5. | Verizon Communications, Inc. |
| 6. | Texas Instruments, Inc. |
Portfolio Management Discussion and Analysis(Unaudited)
Answers to the questions reflect the views of portfolio managers Michael A. Welhoelter, CFA, William W. Priest, CFA, John M. Tobin, PhD, CFA, Kera Van Valen, CFA, of Epoch Investment Partners, Inc. (“Epoch”), the Portfolio’s Subadvisor.
How did MainStay VP Epoch U.S. Equity Yield Portfolio perform relative to its benchmarks and peers during the six months ended June 30, 2019?
For the six months ended June 30, 2019, MainStay VP Epoch U.S. Equity Yield Portfolio returned 14.54% for Initial Class shares and 14.40% for Service Class shares. Over the same period, both share classes underperformed the 16.24% return of the Russell 1000® Value Index, which is the Portfolio’s primary benchmark; the 14.62% return of the U.S. Equity Yield Composite Index, which is the Portfolio’s secondary benchmark; and the 14.59% return of the Morningstar Large Value Category Average.1
What factors affected the Portfolio’s relative performance during the reporting period?
The Portfolio participated in the market’s strong gains to a significant degree. However, performance trailed the Russell 1000® Value Index largely due to lagging individual stock selections in the health care sector. Performance relative to the Index also suffered to a lesser extent due to disappointing stock selections in the industrials sector. The Portfolio’s sector weightings in both health care and industrials helped offset some of the negative effects of individual stock selections. Positive contributions to the Portfolio’s relative performance came from stock selections in the information technology and financials sectors. (Contributions take weightings and total returns into account.)
Which sectors were the strongest positive contributors to the Portfolio’s relative performance, and which sectors were particularly weak?
The information technology sector, which led equity market advances during the reporting period, made the strongest positive contribution to the Portfolio’s relative performance, with returns bolstered by strong individual stock selections as well as overweight sector exposure. The Portfolio’s stock selections in financials further enhanced relative performance. The most significant detractors from the Portfolio’s relative performance during the same period included stock selections in health care and industrials, although sector allocations in both sectors partially compensated for those negative effects. Stock selections in communication services also detracted from relative results.
During the reporting period, which individual stocks made the strongest positive contributions to the Portfolio’s absolute performance and which stocks detracted the most?
The Portfolio’stop-performing holdings during the reporting period included two information technology firms, global soft-
ware company Microsoft and communications hardware maker Cisco Systems, as well as leading defense contractor Lockheed Martin. Shares of Microsoft benefited from sustained growth in most business lines as the company’s shift to subscription-based services and growth in its cloud and data center businesses enabled it to outpace industry expansion. Cisco Systems shares rose on the inclusion of subscription services in the company’s refreshed product lineup. Lockheed Martin reported solid volume and performance across its contracts.
The most significant detractors from the Portfolio’s absolute performance included global biotechnology company AbbVie, North American packaged food and beverage company Kraft Heinz and global energy company Occidental Petroleum. Shares of AbbVie traded lower due to near-term pressure on international sales of the company’s immunosuppressive drug Humira, as well as its announced acquisition of drug manufacturer Allergan. Shares of Kraft Heinz dipped following the announcement of disappointing financial results and an abrupt change in its capital allocation policy, which led the Portfolio to exit its position in the stock. Shares of Occidental Petroleum underperformed as management entered and eventually won a competing bid for Anadarko Petroleum.
Did the Portfolio make any significant purchases or sales during the reporting period?
One of several new positions established by the Portfolio during the reporting period was in integrated energy company Phillips 66, reflecting our favorable view of the company’s capacity to drive cash flow growth and increase production volumes, as well as what we believe are effective cost controls and shareholder-friendly policies. The Portfolio established a significant new position in International Business Machines (IBM), prompted by our positive evaluation of the company’s strategic imperatives, such as cloud computing, big data and security, in addition to its well-covered, growing dividend. During the same period, the Portfolio closed several positions, including regulated utility company Southern Company and next-generation wireless technology leader Qualcomm.
How did the Portfolio’s sector weightings change during the reporting period?
During the reporting period, the Portfolio increased its exposure most significantly to the financials and energy sectors. Over the same period, the Portfolio notably decreased its exposure to consumer staples and communication services.
The Portfolio’s sector allocations result from ourbottom-up fundamental investment process and reflect the companies and securities that we confidently believe can collect and distribute
| 1. | See footnote on page 5 for more information on benchmark and peer group returns. |
| | |
| 8 | | MainStay VP Epoch U.S. Equity Yield Portfolio |
sustainable, growing shareholder yield. Relative performance of sectors during each reporting period may affect sector weightings.
How was the Portfolio positioned at the end of the reporting period?
As of June 30, 2019, the Portfolio held its most substantially overweight sector position relative to the Russell 1000® Value Index in utilities, a defensive sector that is typically more heavily
represented in the Portfolio than in the benchmark. Within the utilities sector, the Portfolio focused on more regulated utilities where an aging infrastructure, the emergence of renewables, the shale revolution and digitization have driven growth in rate bases, earnings and cash flows. The Portfolio’s other significantly overweight exposures as of the end of the reporting period included the information technology and industrials sectors. As of the same date, the Portfolio’s most substantially underweight sector positions relative to the benchmark included financials and health care.
The opinions expressed are those of the portfolio managers as of the date of this report and are subject to change. There is no guarantee that any forecasts will come to pass. This material does not constitute investment advice and is not intended as an endorsement of any specific investment.
Not all MainStay VP Portfolios and/or share classes are available under all policies.
Portfolio of InvestmentsJune 30, 2019 (Unaudited)
| | | | | | | | |
| | |
Shares | | | Value | |
| | | | | | | | |
| Common Stocks 98.3%† | |
Aerospace & Defense 4.3% | |
Boeing Co. | | | 19,310 | | | $ | 7,029,033 | |
General Dynamics Corp. | | | 39,425 | | | | 7,168,253 | |
Lockheed Martin Corp. | | | 38,218 | | | | 13,893,772 | |
Raytheon Co. | | | 35,402 | | | | 6,155,700 | |
United Technologies Corp. | | | 61,150 | | | | 7,961,730 | |
| | | | | | | | |
| | | | | | | 42,208,488 | |
| | | | | | | | |
Air Freight & Logistics 0.6% | |
United Parcel Service, Inc., Class B | | | 54,310 | | | | 5,608,594 | |
| | | | | | | | |
|
Banks 4.2% | |
BB&T Corp. | | | 238,967 | | | | 11,740,449 | |
M&T Bank Corp. | | | 46,264 | | | | 7,868,118 | |
People’s United Financial, Inc. | | | 399,486 | | | | 6,703,375 | |
U.S. Bancorp | | | 171,783 | | | | 9,001,429 | |
Wells Fargo & Co. | | | 126,349 | | | | 5,978,835 | |
| | | | | | | | |
| | | | | | | 41,292,206 | |
| | | | | | | | |
Beverages 3.3% | |
Coca-Cola Co. | | | 150,863 | | | | 7,681,944 | |
Coca-Cola European Partners PLC | | | 160,921 | | | | 9,092,036 | |
Molson Coors Brewing Co., Class B | | | 96,897 | | | | 5,426,232 | |
PepsiCo., Inc. | | | 79,253 | | | | 10,392,446 | |
| | | | | | | | |
| | | | | | | 32,592,658 | |
| | | | | | | | |
Biotechnology 1.6% | |
AbbVie, Inc. | | | 119,483 | | | | 8,688,804 | |
Amgen, Inc. | | | 37,816 | | | | 6,968,732 | |
| | | | | | | | |
| | | | | | | 15,657,536 | |
| | | | | | | | |
Capital Markets 2.7% | |
BlackRock, Inc. | | | 23,735 | | | | 11,138,836 | |
CME Group, Inc. | | | 76,437 | | | | 14,837,186 | |
| | | | | | | | |
| | | | | | | 25,976,022 | |
| | | | | | | | |
Chemicals 2.2% | |
Dow, Inc. | | | 144,426 | | | | 7,121,646 | |
LyondellBasell Industries N.V., Class A | | | 84,483 | | | | 7,276,521 | |
Nutrien, Ltd. | | | 140,001 | | | | 7,484,453 | |
| | | | | | | | |
| | | | | | | 21,882,620 | |
| | | | | | | | |
Commercial Services & Supplies 2.9% | |
Deluxe Corp. | | | 67,673 | | | | 2,751,584 | |
Republic Services, Inc. | | | 140,734 | | | | 12,193,194 | |
Waste Management, Inc. | | | 112,242 | | | | 12,949,360 | |
| | | | | | | | |
| | | | | | | 27,894,138 | |
| | | | | | | | |
Communications Equipment 1.4% | |
Cisco Systems, Inc. | | | 253,048 | | | | 13,849,317 | |
| | | | | | | | |
|
Containers & Packaging 0.8% | |
Amcor PLC (a) | | | 674,661 | | | | 7,751,855 | |
| | | | | | | | |
| | | | | | | | |
| | |
Shares | | | Value | |
| | | | | | | | |
Distributors 0.6% | |
Genuine Parts Co. | | | 52,299 | | | $ | 5,417,130 | |
| | | | | | | | |
|
Diversified Telecommunication Services 4.1% | |
AT&T, Inc. | | | 419,199 | | | | 14,047,359 | |
BCE, Inc. | | | 207,588 | | | | 9,441,102 | |
Verizon Communications, Inc. | | | 292,071 | | | | 16,686,016 | |
| | | | | | | | |
| | | | | | | 40,174,477 | |
| | | | | | | | |
Electric Utilities 10.5% | |
Alliant Energy Corp. | | | 118,679 | | | | 5,824,765 | |
American Electric Power Co., Inc. | | | 135,576 | | | | 11,932,044 | |
Duke Energy Corp. | | | 161,725 | | | | 14,270,614 | |
Entergy Corp. | | | 177,415 | | | | 18,261,326 | |
Evergy, Inc. | | | 129,819 | | | | 7,808,613 | |
Eversource Energy | | | 128,334 | | | | 9,722,584 | |
FirstEnergy Corp. | | | 403,912 | | | | 17,291,472 | |
Pinnacle West Capital Corp. | | | 82,069 | | | | 7,721,872 | |
PPL Corp. | | | 311,382 | | | | 9,655,956 | |
| | | | | | | | |
| | | | | | | 102,489,246 | |
| | | | | | | | |
Electrical Equipment 2.6% | |
Eaton Corp. PLC | | | 167,760 | | | | 13,971,053 | |
Emerson Electric Co. | | | 178,622 | | | | 11,917,660 | |
| | | | | | | | |
| | | | | | | 25,888,713 | |
| | | | | | | | |
Equity Real Estate Investment Trusts 3.4% | |
Iron Mountain, Inc. | | | 296,497 | | | | 9,280,356 | |
Public Storage | | | 31,781 | | | | 7,569,281 | |
Welltower, Inc. | | | 199,139 | | | | 16,235,803 | |
| | | | | | | | |
| | | | | | | 33,085,440 | |
| | | | | | | | |
Food & Staples Retailing 1.1% | |
Walmart, Inc. | | | 94,943 | | | | 10,490,252 | |
| | | | | | | | |
|
Food Products 0.6% | |
Campbell Soup Co. | | | 137,185 | | | | 5,497,003 | |
| | | | | | | | |
|
Health Care Equipment & Supplies 0.7% | |
Medtronic PLC | | | 73,219 | | | | 7,130,798 | |
| | | | | | | | |
|
Health Care Providers & Services 1.3% | |
CVS Health Corp. | | | 97,941 | | | | 5,336,805 | |
UnitedHealth Group, Inc. | | | 28,563 | | | | 6,969,658 | |
| | | | | | | | |
| | | | | | | 12,306,463 | |
| | | | | | | | |
Hotels, Restaurants & Leisure 2.7% | |
Brinker International, Inc. | | | 137,328 | | | | 5,403,857 | |
Las Vegas Sands Corp. | | | 165,346 | | | | 9,770,295 | |
McDonald’s Corp. | | | 55,115 | | | | 11,445,181 | |
| | | | | | | | |
| | | | | | | 26,619,333 | |
| | | | | | | | |
| | | | |
| 10 | | MainStay VP Epoch U.S. Equity Yield Portfolio | | The notes to the financial statements are an integral part of,
and should be read in conjunction with, the financial statements. |
| | | | | | | | |
| | |
Shares | | | Value | |
| | | | | | | | |
| Common Stocks (continued) | |
Household Durables 0.6% | |
Leggett & Platt, Inc. | | | 160,116 | | | $ | 6,143,651 | |
| | | | | | | | |
|
Household Products 3.1% | |
Colgate-Palmolive Co. | | | 76,437 | | | | 5,478,240 | |
Kimberly-Clark Corp. | | | 90,920 | | | | 12,117,817 | |
Procter & Gamble Co. | | | 117,472 | | | | 12,880,805 | |
| | | | | | | | |
| | | | | | | 30,476,862 | |
| | | | | | | | |
Industrial Conglomerates 2.1% | |
3M Co. | | | 53,506 | | | | 9,274,730 | |
Honeywell International, Inc. | | | 64,484 | | | | 11,258,262 | |
| | | | | | | | |
| | | | | | | 20,532,992 | |
| | | | | | | | |
Insurance 6.2% | |
Allianz S.E., Sponsored ADR | | | 455,004 | | | | 10,956,496 | |
Arthur J. Gallagher & Co. | | | 200,346 | | | | 17,548,306 | |
Marsh & McLennan Cos., Inc. | | | 78,046 | | | | 7,785,089 | |
MetLife, Inc. | | | 266,324 | | | | 13,228,313 | |
Travelers Cos., Inc. | | | 72,012 | | | | 10,767,234 | |
| | | | | | | | |
| | | | | | | 60,285,438 | |
| | | | | | | | |
IT Services 2.0% | |
Automatic Data Processing, Inc. | | | 35,000 | | | | 5,786,550 | |
International Business Machines Corp. | | | 47,471 | | | | 6,546,251 | |
Paychex, Inc. | | | 92,931 | | | | 7,647,292 | |
| | | | | | | | |
| | | | | | | 19,980,093 | |
| | | | | | | | |
Metals & Mining 0.6% | |
Reliance Steel & Aluminum Co. | | | 62,759 | | | | 5,938,257 | |
| | | | | | | | |
|
Multi-Utilities 5.6% | |
Ameren Corp. | | | 195,921 | | | | 14,715,626 | |
Black Hills Corp. | | | 25,043 | | | | 1,957,611 | |
CMS Energy Corp. | | | 150,058 | | | | 8,689,859 | |
Dominion Energy, Inc. | | | 137,989 | | | | 10,669,310 | |
NiSource, Inc. | | | 195,921 | | | | 5,642,525 | |
WEC Energy Group, Inc. | | | 158,105 | | | | 13,181,214 | |
| | | | | | | | |
| | | | | | | 54,856,145 | |
| | | | | | | | |
Multiline Retail 1.2% | |
Target Corp. | | | 136,222 | | | | 11,798,187 | |
| | | | | | | | |
|
Oil, Gas & Consumable Fuels 7.2% | |
Chevron Corp. | | | 78,449 | | | | 9,762,193 | |
Enterprise Products Partners, L.P. | | | 424,027 | | | | 12,241,659 | |
Exxon Mobil Corp. | | | 140,001 | | | | 10,728,277 | |
Magellan Midstream Partners, L.P. | | | 129,943 | | | | 8,316,352 | |
Occidental Petroleum Corp. | | | 127,127 | | | | 6,391,946 | |
Phillips 66 | | | 95,619 | | | | 8,944,201 | |
Royal Dutch Shell PLC, Class A, Sponsored ADR | | | 209,599 | | | | 13,638,607 | |
| | | | | | | | |
| | | | | | | 70,023,235 | |
| | | | | | | | |
| | | | | | | | |
| | |
Shares | | | Value | |
| | | | | | | | |
Pharmaceuticals 4.6% | |
Johnson & Johnson | | | 100,575 | | | $ | 14,008,086 | |
Merck & Co., Inc. | | | 191,863 | | | | 16,087,713 | |
Pfizer, Inc. | | | 347,992 | | | | 15,075,013 | |
| | | | | | | | |
| | | | | | | 45,170,812 | |
| | | | | | | | |
Semiconductors & Semiconductor Equipment 5.1% | |
Analog Devices, Inc. | | | 101,380 | | | | 11,442,761 | |
Broadcom, Inc. | | | 17,299 | | | | 4,979,690 | |
Intel Corp. | | | 112,242 | | | | 5,373,024 | |
Maxim Integrated Products, Inc. | | | 104,598 | | | | 6,257,052 | |
Microchip Technology, Inc. (b) | | | 64,368 | | | | 5,580,706 | |
Texas Instruments, Inc. | | | 144,829 | | | | 16,620,576 | |
| | | | | | | | |
| | | | | | | 50,253,809 | |
| | | | | | | | |
Software 2.3% | |
Microsoft Corp. | | | 127,932 | | | | 17,137,771 | |
Oracle Corp. | | | 99,368 | | | | 5,660,995 | |
| | | | | | | | |
| | | | | | | 22,798,766 | |
| | | | | | | | |
Specialty Retail 0.9% | |
Home Depot, Inc. | | | 44,655 | | | | 9,286,900 | |
| | | | | | | | |
|
Technology Hardware, Storage & Peripherals 0.9% | |
Apple, Inc. | | | 43,046 | | | | 8,519,664 | |
| | | | | | | | |
|
Textiles, Apparel & Luxury Goods 0.6% | |
Hanesbrands, Inc. | | | 331,899 | | | | 5,715,301 | |
| | | | | | | | |
|
Tobacco 3.1% | |
Altria Group, Inc. | | | 240,979 | | | | 11,410,356 | |
British American Tobacco PLC, Sponsored ADR | | | 240,577 | | | | 8,388,920 | |
Philip Morris International, Inc. | | | 137,989 | | | | 10,836,276 | |
| | | | | | | | |
| | | | | | | 30,635,552 | |
| | | | | | | | |
Trading Companies & Distributors 0.6% | |
Watsco, Inc. | | | 37,414 | | | | 6,118,311 | |
| | | | | | | | |
Total Common Stocks
(Cost $856,104,797) | | | | | | | 962,346,264 | |
| | | | | | | | |
|
| Short-Term Investment 0.3% | |
Affiliated Investment Company 0.3% | |
MainStay U.S. Government Liquidity Fund, 2.03% (c) | | | 2,873,988 | | | | 2,873,988 | |
| | | | | | | | |
TotalShort-Term Investment
(Cost $2,873,988) | | | | | | | 2,873,988 | |
| | | | | | | | |
Total Investments
(Cost $858,978,785) | | | 98.6 | % | | | 965,220,252 | |
Other Assets, Less Liabilities | | | 1.4 | | | | 13,400,647 | |
Net Assets | | | 100.0 | % | | $ | 978,620,899 | |
| | | | | | |
The notes to the financial statements are an integral part of,
and should be read in conjunction with, the financial statements. | | | | | 11 | |
Portfolio of InvestmentsJune 30, 2019 (Unaudited) (continued)
| † | Percentages indicated are based on Portfolio net assets. |
| (a) | Non-income producing security. |
| (b) | All or a portion of this security was held on loan. As of June 30, 2019, the aggregate market value of securities on loan was $5,793,678. The Portfolio received non-cash collateral in the form of U.S. Treasury securities with a value of $5,679,524 (See Note 2(H)). |
| (c) | Current yield as of June 30, 2019. |
The following abbreviation is used in the preceding pages:
ADR—American Depositary Receipt
The following is a summary of the fair valuations according to the inputs used as of June 30, 2019, for valuing the Portfolio’s assets:
| | | | | | | | | | | | | | | | |
Description | | Quoted
Prices in
Active
Markets for
Identical
Assets
(Level 1) | | | Significant
Other
Observable
Inputs
(Level 2) | | | Significant
Unobservable
Inputs
(Level 3) | | | Total | |
| | | | |
Asset Valuation Inputs | | | | | | | | | | | | | | | | |
| Investments in Securities (a) | | | | | | | | | | | | | | | | |
| Common Stocks | | $ | 962,346,264 | | | $ | — | | | $ | — | | | $ | 962,346,264 | |
| Short-Term Investment | | | | | | | | | | | | | | | | |
Affiliated Investment Company | | | 2,873,988 | | | | — | | | | — | | | | 2,873,988 | |
| | | | | | | | | | | | | | | | |
| Total Investments in Securities | | $ | 965,220,252 | | | $ | — | | | $ | — | | | $ | 965,220,252 | |
| | | | | | | | | | | | | | | | |
| (a) | For a complete listing of investments and their industries, see the Portfolio of Investments. |
| | | | |
| 12 | | MainStay VP Epoch U.S. Equity Yield Portfolio | | The notes to the financial statements are an integral part of,
and should be read in conjunction with, the financial statements. |
Statement of Assets and Liabilitiesas of June 30, 2019 (Unaudited)
| | | | |
| Assets | | | | |
Investment in unaffiliated securities, at value (identified cost $856,104,797) including securities on loan of $5,793,678 | | $ | 962,346,264 | |
Investment in affiliated investment company, at value (identified cost $2,873,988) | | | 2,873,988 | |
Receivables: | | | | |
Investment securities sold | | | 26,602,480 | |
Dividends | | | 2,254,933 | |
Portfolio shares sold | | | 163,435 | |
Securities lending | | | 2,224 | |
Other assets | | | 10,311 | |
| | | | |
Total assets | | | 994,253,635 | |
| | | | |
| |
| Liabilities | | | | |
Payables: | | | | |
Investment securities purchased | | | 14,233,369 | |
Portfolio shares redeemed | | | 689,240 | |
Manager (See Note 3) | | | 518,877 | |
NYLIFE Distributors (See Note 3) | | | 93,584 | |
Professional fees | | | 39,325 | |
Shareholder communication | | | 39,047 | |
Custodian | | | 9,570 | |
Trustees | | | 1,192 | |
Accrued expenses | | | 8,532 | |
| | | | |
Total liabilities | | | 15,632,736 | |
| | | | |
Net assets | | $ | 978,620,899 | |
| | | | |
| |
| Composition of Net Assets | | | | |
Shares of beneficial interest outstanding (par value of $.001 per share) unlimited number of shares authorized | | $ | 61,445 | |
Additional paid-in capital | | | 785,939,937 | |
| | | | |
| | | 786,001,382 | |
Total distributable earnings (loss) | | | 192,619,517 | |
| | | | |
Net assets | | $ | 978,620,899 | |
| | | | |
| | | | |
Initial Class | | | | |
Net assets applicable to outstanding shares | | $ | 520,841,037 | |
| | | | |
Shares of beneficial interest outstanding | | | 32,470,393 | |
| | | | |
Net asset value per share outstanding | | $ | 16.04 | |
| | | | |
Service Class | | | | |
Net assets applicable to outstanding shares | | $ | 457,779,862 | |
| | | | |
Shares of beneficial interest outstanding | | | 28,974,656 | |
| | | | |
Net asset value per share outstanding | | $ | 15.80 | |
| | | | |
| | | | | | |
The notes to the financial statements are an integral part of,
and should be read in conjunction with, the financial statements. | | | | | 13 | |
Statement of Operationsfor the six months ended June 30, 2019 (Unaudited)
| | | | |
| Investment Income (Loss) | | | | |
Income | | | | |
Dividends-unaffiliated (a) | | $ | 17,317,058 | |
Dividends-affiliated | | | 164,900 | |
Securities lending | | | 7,260 | |
Interest | | | 15 | |
| | | | |
Total income | | | 17,489,233 | |
| | | | |
Expenses | | | | |
Manager (See Note 3) | | | 3,493,729 | |
Distribution/Service—Service Class (See Note 3) | | | 565,288 | |
Professional fees | | | 59,415 | |
Shareholder communication | | | 41,071 | |
Trustees | | | 12,978 | |
Custodian | | | 12,701 | |
Miscellaneous | | | 20,431 | |
| | | | |
Total expenses before waiver/reimbursement | | | 4,205,613 | |
Expense waiver/reimbursement from Manager (See Note 3) | | | (193,010 | ) |
| | | | |
Net expenses | | | 4,012,603 | |
| | | | |
Net investment income (loss) | | | 13,476,630 | |
| | | | |
|
| Realized and Unrealized Gain (Loss) on Investments and Foreign Currency Transactions | |
Net realized gain (loss) on: | | | | |
Unaffiliated investment transactions | | | 5,870,684 | |
Foreign currency transactions | | | (11 | ) |
| | | | |
Net realized gain (loss) on investments and foreign currency transactions | | | 5,870,673 | |
| | | | |
Net change in unrealized appreciation (depreciation) on: | | | | |
Unaffiliated investments | | | 118,050,640 | |
Translation of other assets and liabilities in foreign currencies | | | 4,365 | |
| | | | |
Net change in unrealized appreciation (depreciation) on investments and foreign currency transactions | | | 118,055,005 | |
| | | | |
Net realized and unrealized gain (loss) on investments and foreign currency transactions | | | 123,925,678 | |
| | | | |
Net increase (decrease) in net assets resulting from operations | | $ | 137,402,308 | |
| | | | |
| (a) | Dividends recorded net of foreign withholding taxes in the amount of $199,637. |
| | | | |
| 14 | | MainStay VP Epoch U.S. Equity Yield Portfolio | | The notes to the financial statements are an integral part of,
and should be read in conjunction with, the financial statements. |
Statements of Changes in Net Assets
for the six months ended June 30, 2019 (Unaudited) and the year ended December 31, 2018
| | | | | | | | |
| | | 2019 | | | 2018 | |
| Increase (Decrease) in Net Assets | |
Operations: | | | | | | | | |
Net investment income (loss) | | $ | 13,476,630 | | | $ | 28,584,455 | |
Net realized gain (loss) on investments and foreign currency transactions | | | 5,870,673 | | | | 38,353,280 | |
Net change in unrealized appreciation (depreciation) on investments and foreign currency transactions | | | 118,055,005 | | | | (127,970,431 | ) |
| | | | |
Net increase (decrease) in net assets resulting from operations | | | 137,402,308 | | | | (61,032,696 | ) |
| | | | |
Distributions to shareholders: | | | | | | | | |
Initial Class | | | — | | | | (59,595,916 | ) |
Service Class | | | — | | | | (40,976,827 | ) |
| | | | |
Total distributions to shareholders | | | — | | | | (100,572,743 | ) |
| | | | |
Capital share transactions: | | | | | | | | |
Net proceeds from sale of shares | | | 12,810,835 | | | | 178,505,173 | |
Net asset value of shares issued to shareholders in reinvestment of dividends and distributions | | | — | | | | 100,572,743 | |
Cost of shares redeemed | | | (152,107,842 | ) | | | (464,462,351 | ) |
| | | | |
Increase (decrease) in net assets derived from capital share transactions | | | (139,297,007 | ) | | | (185,384,435 | ) |
| | | | |
Net increase (decrease) in net assets | | | (1,894,699 | ) | | | (346,989,874 | ) |
| | |
| Net Assets | | | | | | | | |
Beginning of period | | | 980,515,598 | | | | 1,327,505,472 | |
| | | | |
End of period | | $ | 978,620,899 | | | $ | 980,515,598 | |
| | | | |
| | | | | | |
The notes to the financial statements are an integral part of,
and should be read in conjunction with, the financial statements. | | | | | 15 | |
Financial Highlightsselected per share data and ratios
| | | | | | | | | | | | | | | | | | | | | | | | | | | | |
| | | |
| | | Six months
ended
June 30, | | | | | | Year ended December 31, | |
| | | | | | | |
| Initial Class | | 2019* | | | | | | 2018 | | | 2017 | | | 2016 | | | 2015 | | | 2014 | |
| | | | | | | |
Net asset value at beginning of period | | $ | 14.01 | | | | | | | $ | 16.15 | | | $ | 13.79 | | | $ | 15.58 | | | $ | 18.94 | | | $ | 17.64 | |
| | | | | | | | | | | | | | | | | | | | | | | | | | | | |
| | | | | | | |
Net investment income (loss) (a) | | | 0.21 | | | | | | | | 0.39 | | | | 0.30 | | | | 0.21 | | | | 0.19 | | | | 0.48 | (b) |
| | | | | | | |
Net realized and unrealized gain (loss) on investments | | | 1.82 | | | | | | | | (1.12 | ) | | | 2.26 | | | | 0.47 | | | | (0.95 | ) | | | 1.07 | |
| | | | | | | | | | | | | | | | | | | | | | | | | | | | |
| | | | | | | |
Total from investment operations | | | 2.03 | | | | | | | | (0.73 | ) | | | 2.56 | | | | 0.68 | | | | (0.76 | ) | | | 1.55 | |
| | | | | | | | | | | | | | | | | | | | | | | | | | | | |
| | | | | | | |
| Less dividends and distributions: | | | | | | | | | | | | | | | | | | | | | | | | | | | | |
| | | | | | | |
From net investment income | | | — | | | | | | | | (0.35 | ) | | | (0.20 | ) | | | (0.18 | ) | | | (0.51 | ) | | | (0.25 | ) |
| | | | | | | |
From net realized gain on investments | | | — | | | | | | | | (1.06 | ) | | | — | | | | (2.29 | ) | | | (2.09 | ) | | | — | |
| | | | | | | | | | | | | | | | | | | | | | | | | | | | |
| | | | | | | |
Total dividends and distributions | | | — | | | | | | | | (1.41 | ) | | | (0.20 | ) | | | (2.47 | ) | | | (2.60 | ) | | | (0.25 | ) |
| | | | | | | | | | | | | | | | | | | | | | | | | | | | |
| | | | | | | |
Net asset value at end of period | | $ | 16.04 | | | | | | | $ | 14.01 | | | $ | 16.15 | | | $ | 13.79 | | | $ | 15.58 | | | $ | 18.94 | |
| | | | | | | | | | | | | | | | | | | | | | | | | | | | |
| | | | | | | |
Total investment return (c) | | | 14.49 | %(d) | | | | | | | (5.23 | %) | | | 18.66 | % | | | 4.90 | % | | | (3.78 | %) | | | 8.88 | % |
| | | | | | | |
| Ratios (to average net assets)/Supplemental Data: | | | | | | | | | | | | | | | | | | | | | | | | | | | | |
| | | | | | | |
Net investment income (loss) | | | 2.77 | %†† | | | | | | | 2.49 | % | | | 2.01 | % | | | 1.41 | % | | | 1.07 | % | | | 2.64 | %(b) |
| | | | | | | |
Net expenses (e) | | | 0.68 | %†† | | | | | | | 0.68 | % | | | 0.73 | % | | | 0.79 | % | | | 0.78 | % | | | 0.79 | % |
| | | | | | | |
Expenses (before waiver/reimbursement) (e) | | | 0.72 | %†† | | | | | | | 0.71 | % | | | 0.74 | % | | | 0.79 | % | | | 0.78 | % | | | 0.79 | % |
| | | | | | | |
Portfolio turnover rate | | | 7 | % | | | | | | | 25 | % | | | 122 | % | | | 99 | % | | | 86 | % | | | 68 | % |
| | | | | | | |
Net assets at end of period (in 000’s) | | $ | 520,841 | | | | | | | $ | 548,881 | | | $ | 791,462 | | | $ | 637,936 | | | $ | 655,690 | | | $ | 722,647 | |
| (a) | Per share data based on average shares outstanding during the period. |
| (b) | Included in net investment income per share and the ratio of net investment income to average net assets are $0.07 and 0.39%, respectively, resulting from a special one-time dividend from Vodafone Group PLC that paid $4.92 per share. |
| (c) | Total return does not reflect any deduction of sales charges, mortality and expense charges, contract charges or administrative charges. For periods of less than one year, total return is not annualized. |
| (d) | Total investment return may reflect adjustments to conform to generally accepted accounting principles. |
| (e) | In addition to the fees and expenses which the Portfolio bears directly, it also indirectly bears a pro-rata share of the fees and expenses of the underlying funds in which it invests. Such indirect expenses are not included in the above expense ratios. |
| | | | |
| 16 | | MainStay VP Epoch U.S. Equity Yield Portfolio | | The notes to the financial statements are an integral part of,
and should be read in conjunction with, the financial statements. |
Financial Highlightsselected per share data and ratios
| | | | | | | | | | | | | | | | | | | | | | | | | | | | |
| | | |
| | | Six months
ended
June 30, | | | | | | Year ended December 31, | |
| | | | | | | |
| Service Class | | 2019* | | | | | | 2018 | | | 2017 | | | 2016 | | | 2015 | | | 2014 | |
| | | | | | | |
Net asset value at beginning of period | | $ | 13.81 | | | | | | | $ | 15.94 | | | $ | 13.61 | | | $ | 15.40 | | | $ | 18.75 | | | $ | 17.48 | |
| | | | | | | | | | | | | | | | | | | | | | | | | | | | |
| | | | | | | |
Net investment income (loss) (a) | | | 0.19 | | | | | | | | 0.35 | | | | 0.26 | | | | 0.17 | | | | 0.15 | | | | 0.42 | (b) |
| | | | | | | |
Net realized and unrealized gain (loss) on investments | | | 1.80 | | | | | | | | (1.12 | ) | | | 2.24 | | | | 0.46 | | | | (0.95 | ) | | | 1.07 | |
| | | | | | | | | | | | | | | | | | | | | | | | | | | | |
| | | | | | | |
Total from investment operations | | | 1.99 | | | | | | | | (0.77 | ) | | | 2.50 | | | | 0.63 | | | | (0.80 | ) | | | 1.49 | |
| | | | | | | | | | | | | | | | | | | | | | | | | | | | |
| | | | | | | |
| Less dividends and distributions: | | | | | | | | | | | | | | | | | | | | | | | | | | | | |
| | | | | | | |
From net investment income | | | — | | | | | | | | (0.30 | ) | | | (0.17 | ) | | | (0.13 | ) | | | (0.46 | ) | | | (0.22 | ) |
| | | | | | | |
From net realized gain on investments | | | — | | | | | | | | (1.06 | ) | | | — | | | | (2.29 | ) | | | (2.09 | ) | | | — | |
| | | | | | | | | | | | | | | | | | | | | | | | | | | | |
| | | | | | | |
Total dividends and distributions | | | — | | | | | | | | (1.36 | ) | | | (0.17 | ) | | | (2.42 | ) | | | (2.55 | ) | | | (0.22 | ) |
| | | | | | | | | | | | | | | | | | | | | | | | | | | | |
| | | | | | | |
Net asset value at end of period | | $ | 15.80 | | | | | | | $ | 13.81 | | | $ | 15.94 | | | $ | 13.61 | | | $ | 15.40 | | | $ | 18.75 | |
| | | | | | | | | | | | | | | | | | | | | | | | | | | | |
| | | | | | | |
Total investment return (c) | | | 14.41 | %(d) | | | | | | | (5.46 | %) | | | 18.37 | % | | | 4.63 | % | | | (4.02 | %) | | | 8.61 | % |
| | | | | | | |
| Ratios (to average net assets)/Supplemental Data: | | | | | | | | | | | | | | | | | | | | | | | | | | | | |
| | | | | | | |
Net investment income (loss) | | | 2.53 | %†† | | | | | | | 2.23 | % | | | 1.73 | % | | | 1.16 | % | | | 0.82 | % | | | 2.36 | %(b) |
| | | | | | | |
Net expenses (e) | | | 0.93 | %†† | | | | | | | 0.93 | % | | | 0.98 | % | | | 1.04 | % | | | 1.03 | % | | | 1.04 | % |
| | | | | | | |
Expenses (before waiver/reimbursement) (e) | | | 0.97 | %†† | | | | | | | 0.96 | % | | | 0.99 | % | | | 1.04 | % | | | 1.03 | % | | | 1.04 | % |
| | | | | | | |
Portfolio turnover rate | | | 7 | % | | | | | | | 25 | % | | | 122 | % | | | 99 | % | | | 86 | % | | | 68 | % |
| | | | | | | |
Net assets at end of period (in 000’s) | | $ | 457,780 | | | | | | | $ | 431,635 | | | $ | 536,044 | | | $ | 526,452 | | | $ | 569,660 | | | $ | 647,096 | |
| (a) | Per share data based on average shares outstanding during the period. |
| (b) | Included in net investment income per share and the ratio of net investment income to average net assets are $0.07 and 0.39%, respectively, resulting from a special one-time dividend from Vodafone Group PLC that paid $4.92 per share. |
| (c) | Total return does not reflect any deduction of sales charges, mortality and expense charges, contract charges or administrative charges. For periods of less than one year, total return is not annualized. |
| (d) | Total investment return may reflect adjustments to conform to generally accepted accounting principles. |
| (e) | In addition to the fees and expenses which the Portfolio bears directly, it also indirectly bears a pro-rata share of the fees and expenses of the underlying funds in which it invests. Such indirect expenses are not included in the above expense ratios. |
| | | | | | |
The notes to the financial statements are an integral part of,
and should be read in conjunction with, the financial statements. | | | | | 17 | |
Notes to Financial Statements(Unaudited)
Note 1–Organization and Business
MainStay VP Funds Trust (the “Fund”) was organized as a Delaware statutory trust on February 1, 2011. The Fund is registered under the Investment Company Act of 1940, as amended (the “1940 Act”), as an open-end management investment company. The Fund is comprised of thirty-one separate series (collectively referred to as the “Portfolios”). These financial statements and notes relate to the MainStay VP Epoch U.S. Equity Yield Portfolio (the “Portfolio”), a “diversified” portfolio, as that term is defined in the 1940 Act, as interpreted or modified by regulatory authorities having jurisdiction, from time to time.
Shares of the Portfolio are currently offered to certain separate accounts to fund variable annuity policies and variable universal life insurance policies issued by New York Life Insurance and Annuity Corporation (“NYLIAC”), awholly-owned subsidiary of New York Life Insurance Company (“New York Life”) and may also be offered to fund variable annuity policies and variable universal life insurance policies issued by other insurance companies. NYLIAC allocates shares of the Portfolios to, among others, certain NYLIAC separate accounts. Shares of the Portfolio are also offered to the MainStay VP Conservative Allocation Portfolio, MainStay VP Moderate Allocation Portfolio, MainStay VP Moderate Growth Allocation Portfolio and MainStay VP Growth Allocation Portfolio, which operate as “funds-of-funds.”
The Portfolio currently offers two classes of shares. Initial Class shares commenced operations on May 1, 1998. Service Class shares commenced operations on June 5, 2003. Shares of the Portfolio are offered and are redeemed at a price equal to their respective net asset value (“NAV”) per share. No sales or redemption charge is applicable to the purchase or redemption of the Portfolio’s shares. Under the terms of the Fund’s multiple class plan adopted pursuant to Rule 18f-3 under the 1940 Act, the classes differ in that, among other things, Service Class shares of the Portfolio pay a combined distribution and service fee of 0.25% of average daily net assets attributable to Service Class shares of the Portfolio to the Distributor (as defined in Note 3(B)) pursuant to a plan adopted in accordance with Rule 12b-1 under the 1940 Act. Contract owners of variable annuity contracts purchased after June 2, 2003, are permitted to invest only in the Service Class shares.
The Portfolio’s investment objective is to seek current income and capital appreciation.
Note 2–Significant Accounting Policies
The Portfolio is an investment company and accordingly follows the investment company accounting and reporting guidance of the Financial Accounting Standards Board (“FASB”) Accounting Standard CodificationTopic 946 Financial Services—Investment Companies. The Portfolio prepares its financial statements in accordance with generally accepted accounting principles (“GAAP”) in the United States of America and follows the significant accounting policies described below.
(A) Securities Valuation. Investments are usually valued as of the close of regular trading on the New York Stock Exchange (the “Exchange”) (usually 4:00 p.m. Eastern time) on each day the Portfolio is open for business (“valuation date”).
The Board of Trustees of the Fund (the “Board”) adopted procedures establishing methodologies for the valuation of the Portfolio’s securities
and other assets and delegated the responsibility for valuation determinations under those procedures to the Valuation Committee of the Fund (the “Valuation Committee”). The Board authorized the Valuation Committee to appoint a Valuation Subcommittee (the “Subcommittee”) to deal in the first instance with establishing the prices of securities for which market quotations are not readily available or the prices of which are not otherwise readily determinable under these procedures. The Subcommittee meets (in person, via electronic mail or via teleconference) on an as-needed basis. Subsequently, the Valuation Committee meets to ensure that actions taken by the Subcommittee were appropriate. The procedures state that, subject to the oversight of the Board and unless otherwise noted, the responsibility for theday-to-day valuation of portfolio assets (including fair value measurements for the Portfolio’s assets and liabilities) rests with New York Life Investment Management LLC (“New York Life Investments” or the “Manager”), aided to whatever extent necessary by the Subadvisor (as defined in Note 3(A)).
To assess the appropriateness of security valuations, the Manager, the Subadvisor or the Portfolio’s third-party service provider, who is subject to oversight by the Manager, regularly compares prior day prices, prices on comparable securities and the sale prices to the prior and current day prices and challenges prices with changes exceeding certain tolerance levels with third-party pricing services or broker sources. For those securities valued through either a standardized fair valuation methodology or a fair valuation measurement, the Subcommittee deals in the first instance with such valuation and the Valuation Committee reviews and affirms, if appropriate, the reasonableness of the valuation based on such methodologies and measurements on a regular basis after considering information that is reasonably available and deemed relevant by the Valuation Committee. Any action taken by the Subcommittee with respect to the valuation of a portfolio security or other asset is submitted for review and ratification (if appropriate) to the Valuation Committee and the Board at the next regularly scheduled meeting.
“Fair value” is defined as the price the Portfolio would reasonably expect to receive upon selling an asset or liability in an orderly transaction to an independent buyer in the principal or most advantageous market for the asset or liability. Fair value measurements are determined within a framework that establishes a three-tier hierarchy which maximizes the use of observable market data and minimizes the use of unobservable inputs to establish a classification of fair value measurements for disclosure purposes. “Inputs” refer broadly to the assumptions that market participants would use in pricing the asset or liability, including assumptions about risk, such as the risk inherent in a particular valuation technique used to measure fair value using a pricing model and/or the risk inherent in the inputs for the valuation technique. Inputs may be observable or unobservable. Observable inputs reflect the assumptions market participants would use in pricing the asset or liability based on market data obtained from sources independent of the Portfolio. Unobservable inputs reflect the Portfolio’s own assumptions about the assumptions market participants would use in pricing the asset or liability based on the information available. The inputs or methodology used for valuing assets or liabilities may not be an indication of the risks
| | |
| 18 | | MainStay VP Epoch U.S. Equity Yield Portfolio |
associated with investing in those assets or liabilities. The three-tier hierarchy of inputs is summarized below.
| • | | Level 1—quoted prices in active markets for an identical asset or liability |
| • | | Level 2—other significant observable inputs (including quoted prices for a similar asset or liability in active markets, interest rates and yield curves, prepayment speeds, credit risk, etc.) |
| • | | Level 3—significant unobservable inputs (including the Portfolio’s own assumptions about the assumptions that market participants would use in measuring fair value of an asset or liability) |
The level of an asset or liability within the fair value hierarchy is based on the lowest level of an input, both individually and in the aggregate, that is significant to the fair value measurement. As of June 30, 2019, the aggregate value by input level of the Portfolio’s assets and liabilities is included at the end of the Portfolio’s Portfolio of Investments.
The Portfolio may use third-party vendor evaluations, whose prices may be derived from one or more of the following standard inputs, among others:
| | |
• Broker/dealer quotes | | • Benchmark securities |
• Two-sided markets | | • Reference data (corporate actions or material event notices) |
• Bids/offers | | • Monthly payment information |
• Industry and economic events | | • Reported trades |
An asset or liability for which market values cannot be measured using the methodologies described above is valued by methods deemed reasonable in good faith by the Valuation Committee, following the procedures established by the Board, to represent fair value. Under these procedures, the Portfolio generally uses a market-based approach which may use related or comparable assets or liabilities, recent transactions, market multiples, book values and other relevant information. The Portfolio may also use an income-based valuation approach in which the anticipated future cash flows of the asset or liability are discounted to calculate fair value. Discounts may also be applied due to the nature and/or duration of any restrictions on the disposition of the asset or liability. Fair value represents a good faith approximation of the value of a security. Fair value determinations involve the consideration of a number of subjective factors, an analysis of applicable facts and circumstances and the exercise of judgment. As a result, it is possible that the fair value for a security determined in good faith in accordance with the Portfolio’s valuation procedures may differ from valuations for the same security determined by other funds using their own valuation procedures. Although the Portfolio’s valuation procedures are designed to value a security at the price the Portfolio may reasonably expect to receive upon the security’s sale in an orderly transaction, there can be no assurance that any fair value determination thereunder would, in fact, approximate the amount that the Portfolio would actually realize upon the sale of the security or the price at which the security would trade if a reliable market price were readily available. During thesix-month period ended June 30, 2019, there were no material changes to the fair value methodologies.
Securities which may be valued in this manner include, but are not limited to: (i) a security for which trading has been halted or suspended;
(ii) a debt security that has recently gone into default and for which there is not a current market quotation; (iii) a security of an issuer that has entered into a restructuring; (iv) a security that has been delisted from a national exchange; (v) a security for which the market price is not readily available from a third-party pricing source or, if so provided, does not, in the opinion of the Manager or the Subadvisor, reflect the security’s market value; (vi) a security subject to trading collars for which no or limited trading takes place; and (vii) a security whose principal market has been temporarily closed at a time when, under normal conditions, it would be open. Securities valued in this manner are generally categorized as Level 3 in the hierarchy. As of June 30, 2019, there were no securities held by the Portfolio that were fair valued in such a manner.
Equity securities are valued at the last quoted sales prices as of the close of regular trading on the relevant exchange on each valuation date. Securities that are not traded on the valuation date are valued at the mean of the last quoted bid and ask prices. Prices are normally taken from the principal market in which each security trades. These securities are generally categorized as Level 1 in the hierarchy.
Investments in mutual funds, including money market funds, are valued at their respective NAVs as of the close of the Exchange on the valuation date. These securities are generally categorized as Level 1 in the hierarchy.
Temporary cash investments acquired in excess of 60 days to maturity at the time of purchase are valued using the latest bid prices or using valuations based on a matrix system (which considers such factors as security prices, yields, maturities and ratings), both as furnished by independent pricing services. Other temporary cash investments which mature in 60 days or less at the time of purchase (“Short-Term Investments”) are valued using the amortized cost method of valuation, unless the use of such method would be inappropriate. The amortized cost method involves valuing a security at its cost on the date of purchase and thereafter assuming a constant amortization to maturity of the difference between such cost and the value on maturity date. Amortized cost approximates the current fair value of a security. Securities valued using the amortized cost method are not valued using quoted prices in an active market and are generally categorized as Level 2 in the hierarchy.
The information above is not intended to reflect an exhaustive list of the methodologies that may be used to value portfolio investments. The valuation procedures permit the use of a variety of valuation methodologies in connection with valuing portfolio investments. The methodology used for a specific type of investment may vary based on the market data available or other considerations. The methodologies summarized above may not represent the specific means by which portfolio investments are valued on any particular business day.
(B) Income Taxes. The Portfolio’s policy is to comply with the requirements of the Internal Revenue Code of 1986, as amended (the “Internal Revenue Code”), applicable to regulated investment companies and to distribute all of its taxable income to the shareholders of the Portfolio within the allowable time limits. Therefore, no federal, state and local income tax provisions are required.
Management evaluates the Portfolio’s tax positions to determine if the tax positions taken meet the minimum recognition threshold in
Notes to Financial Statements(Unaudited) (continued)
connection with accounting for uncertainties in income tax positions taken or expected to be taken for the purposes of measuring and recognizing tax liabilities in the financial statements. Recognition of tax benefits of an uncertain tax position is permitted only to the extent the position is “more likely than not” to be sustained assuming examination by taxing authorities. Management has analyzed the Portfolio’s tax positions taken on federal, state and local income tax returns for all open tax years (for up to three tax years) and has concluded that no provisions for federal, state and local income tax are required in the Portfolio’s financial statements. The Portfolio’s federal, state and local income tax and federal excise tax returns for tax years for which the applicable statutes of limitations have not expired are subject to examination by the Internal Revenue Service and state and local departments of revenue.
(C) Dividends and Distributions to Shareholders. Dividends and distributions are recorded on the ex-dividend date. The Portfolio intends to declare and pay dividends from net investment income and distributions from net realized capital and currency gains, if any, at least annually. Unless the shareholder elects otherwise, all dividends and distributions are reinvested in the same class of shares of the Portfolio, at NAV. Dividends and distributions to shareholders are determined in accordance with federal income tax regulations and may differ from determinations using GAAP.
(D) Security Transactions and Investment Income. The Portfolio records security transactions on the trade date. Realized gains and losses on security transactions are determined using the identified cost method. Dividend income is recognized on the ex-dividend date; net of any foreign tax withheld at the source, and interest income is accrued as earned using the effective interest rate method.
Investment income and realized and unrealized gains and losses on investments of the Portfolio are allocated pro rata to the separate classes of shares based upon their relative net assets on the date the income is earned or realized and unrealized gains and losses are incurred.
(E) Expenses. Expenses of the Fund are allocated to the individual Portfolios in proportion to the net assets of the respective Portfolios when the expenses are incurred, except where direct allocations of expenses can be made. Expenses (other than fees incurred under the distribution and service plans, further discussed in Note 3(B), which are charged directly to the Service Class shares) are allocated to separate classes of shares pro rata based upon their relative net assets on the date the expenses are incurred. The expenses borne by the Portfolio, including those of related parties to the Portfolio, are shown in the Statement of Operations.
Additionally, the Portfolio may invest in ETFs and mutual funds, which are subject to management fees and other fees that may cause the costs of investing in ETFs and mutual funds to be greater than the costs of owning the underlying securities directly. These indirect expenses of ETFs and mutual funds are not included in the amounts shown as expenses in the Portfolio’s Statement of Operations or in the expense ratios included in the Financial Highlights.
(F) Use of Estimates. In preparing financial statements in conformity with GAAP, management makes estimates and assumptions that affect the reported amounts and disclosures in the financial statements. Actual results could differ from those estimates.
(G) Repurchase Agreements. The Portfolio may enter into repurchase agreements (i.e., buy a security from another party with the agreement that it be sold back in the future) to earn income. The Portfolio may enter into repurchase agreements only with counterparties, usually financial institutions, that are deemed by the Manager or the Subadvisor to be creditworthy, pursuant to guidelines established by the Board. During the term of any repurchase agreement, the Manager or the Subadvisor will continue to monitor the creditworthiness of the counterparty. Under the 1940 Act, repurchase agreements are considered to be collateralized loans by the Portfolio to the counterparty secured by the securities transferred to the Portfolio.
Repurchase agreements are subject to counterparty risk, meaning the Portfolio could lose money by the counterparty’s failure to perform under the terms of the agreement. The Portfolio mitigates this risk by ensuring the repurchase agreement is collateralized by cash, U.S. government securities, fixed income securities and/or other securities. The collateral is held by the Portfolio’s custodian and valued daily on a mark to market basis to determine if the value, including accrued interest, exceeds the repurchase price. In the event of the counterparty’s default on the obligation to repurchase, the Portfolio has the right to liquidate the collateral and apply the proceeds in satisfaction of the obligation. Under certain circumstances, such as in the event of default or bankruptcy by the counterparty, realization and/or retention of the collateral may be limited or subject to delay, to legal proceedings and possible realized loss to the Portfolio. As of June 30, 2019, the Portfolio did not hold any repurchase agreements.
(H) Securities Lending. In order to realize additional income, the Portfolio may engage in securities lending, subject to the limitations set forth in the 1940 Act and relevant guidance by the staff of the Securities and Exchange Commission (“SEC”). In the event the Portfolio does engage in securities lending, the Portfolio will lend through its custodian, State Street Bank and Trust Company (“State Street”), acting as securities lending agent on behalf of the Portfolio. State Street will manage the Portfolio’s collateral in accordance with the securities lending agency agreement between the Portfolio and State Street, and indemnify the Portfolio against counterparty risk. The loans will be collateralized by cash (which may be invested in a money market fund) and/ornon-cash collateral (which may include, U.S. Treasury securities and/or U.S. Government Agency securities issued or guaranteed by the United States government or its agencies or instrumentalities) at least equal at all times to the market value of the securities loaned. The Portfolio may bear the risk of delay in recovery of, or loss of rights in, the securities loaned should the borrower of the securities experience financial difficulty. The Portfolio may also record a realized gain or loss on securities deemed sold due to a borrower’s inability to return securities on loan. The Portfolio bears the risk of any loss on investment of cash collateral. The Portfolio will receive compensation for lending its securities in the form of fees or it will retain a portion of interest on the investment of any cash collateral. The Portfolio will also continue to receive interest and dividends on the securities loaned and any gain or loss in the market price of the securities loaned that may occur during the term of the loan will be for the account of the Portfolio. Income earned from securities lending activities, if any, is reflected in the Statement of Operations. As of June 30, 2019, the Portfolio had securities on loan with an aggregate market value of $5,793,678 and receivednon-cash collateral in the form of U.S. Treasury securities with a value of $5,679,524.
| | |
| 20 | | MainStay VP Epoch U.S. Equity Yield Portfolio |
(I) Indemnifications. Under the Fund’s organizational documents, its officers and trustees are indemnified against certain liabilities that may arise out of performance of their duties to the Fund. Additionally, in the normal course of business, the Portfolio enters into contracts with third-party service providers that contain a variety of representations and warranties and which may provide general indemnifications. The Portfolio’s maximum exposure under these arrangements is unknown, as this would involve future claims that may be made against the Portfolio that have not yet occurred. Based on experience, management is of the view that the risk of loss in connection with these potential indemnification obligations is remote. However, there can be no assurance that material liabilities related to such obligations will not arise in the future, which could adversely impact the Portfolio.
Note 3–Fees and Related Party Transactions
(A) Manager and Subadvisor. New York Life Investments, a registered investment adviser and an indirect,wholly-owned subsidiary of New York Life, serves as the Portfolio’s Manager pursuant to an Amended and Restated Management Agreement (“Management Agreement”). The Manager provides offices, conducts clerical, recordkeeping and bookkeeping services, and keeps most of the financial and accounting records required to be maintained by the Portfolio. Except for the portion of salaries and expenses that are the responsibility of the Portfolio, the Manager pays the salaries and expenses of all personnel affiliated with the Portfolio and certain operational expenses of the Portfolio. The Portfolio reimburses New York Life Investments in an amount equal to a portion of the compensation of the Chief Compliance Officer attributable to the Portfolio. Epoch Investment Partners, Inc. (“Epoch” or the “Subadvisor”), a registered investment adviser, serves as Subadvisor to the Portfolio and is responsible for theday-to-day portfolio management of the Portfolio. Pursuant to the terms of an Amended and Restated Subadvisory Agreement (“Subadvisory Agreement”) between New York Life Investments and Epoch, New York Life Investments pays for the services of the Subadvisor.
The Fund, on behalf of the Portfolio, pays New York Life Investments in its capacity as the Portfolio’s investment manager and administrator, pursuant to the Management Agreement, a monthly fee for the services performed and the facilities furnished at an annual percentage of the Portfolio’s average daily net assets. The Fund, on behalf of the Portfolio, pays New York Life Investments at the rate of 0.70% up to $500 million; 0.68% from $500 million to $1 billion; 0.66% from $1 billion to $2 billion; and 0.65% on assets over $2 billion. During the six-month period ended June 30, 2019, the effective management fee rate was 0.69% (exclusive of any applicable waivers/reimbursements).
New York Life Investments has contractually agreed to waive fees and/or reimburse expenses so that Total Annual Portfolio Operating Expenses (excluding taxes, interest, litigation, extraordinary expenses, brokerage and other transaction expenses relating to the purchase or sale of portfolio investments, and acquired (underlying) portfolio/fund fees and expenses) of Service Class shares do not exceed 0.93% of average daily net assets. New York Life Investments will apply an equivalent waiver or reimbursement to Initial Class shares. This agreement will remain in effect until May 1, 2020, and shall renew automatically for one-year terms unless New York Life Investments provides written notice of termination prior to the start of the next term or upon approval of the Board.
During the six-month period ended June 30, 2019, New York Life Investments earned fees from the Portfolio in the amount of $3,493,729 and waived fees/reimbursed expenses in the amount of $193,010, and paid the Subadvisor in the amount of $1,650,360.
State Street providessub-administration andsub-accounting services to the Portfolio pursuant to an agreement with New York Life Investments. These services include calculating the daily NAVs of the Portfolio, maintaining the general ledger andsub-ledger accounts for the calculation of the Portfolio’s NAVs and assisting New York Life Investments in conducting various aspects of the Portfolio’s administrative operations. For providing these services to the Portfolio, State Street is compensated by New York Life Investments.
Pursuant to an agreement between the Fund and New York Life Investments, New York Life Investments is responsible for providing or procuring certain regulatory reporting services for the Portfolio. The Portfolio will reimburse New York Life Investments for the actual costs incurred by New York Life Investments in connection with providing or procuring these services for the Portfolio.
(B) Distribution and Service Fees. The Fund, on behalf of the Portfolio, has entered into a distribution agreement with NYLIFE Distributors LLC (the “Distributor”), an indirect,wholly-owned subsidiary of New York Life. The Portfolio has adopted a distribution plan (the “Plan”) in accordance with the provisions of Rule 12b-1 under the 1940 Act. Under the Plan, the Distributor has agreed to provide, through its affiliates or independent third parties, various distribution-related, shareholder and administrative support services to the Service Class shareholders. For its services, the Distributor is entitled to a combined distribution and service fee accrued daily and paid monthly at an annual rate of 0.25% of the average daily net assets attributable to the Service Class shares of the Portfolio.
(C) Investments in Affiliates (in 000’s). During the six-month period ended June 30, 2019, purchases and sales transactions, income earned from investments and shares held of investment companies managed by New York Life Investments or its affiliates were as follows:
| | | | | | | | | | | | | | | | | | | | | | | | | | | | | | | | | | | | |
Affiliated Investment Company | | Value,
Beginning
of Period | | | Purchases
at Cost | | | Proceeds
from Sales | | | Net
Realized
Gain/(Loss)
on Sales | | | Change in
Unrealized
Appreciation/
(Depreciation) | | | Value,
End of
Period | | | Dividend
Income | | | Other
Distributions | | | Shares
End of
Period | |
MainStay U.S. Government Liquidity Fund | | $ | 17,828 | | | $ | 73,033 | | | $ | (87,987 | ) | | $ | — | | | $ | — | | | $ | 2,874 | | | $ | 165 | | | $ | — | | | | 2,874 | |
Notes to Financial Statements(Unaudited) (continued)
Note 4–Federal Income Tax
As of June 30, 2019, the cost and unrealized appreciation (depreciation) of the Portfolio’s investment portfolio, including applicable derivative contracts and other financial instruments, as determined on a federal income tax basis, were as follows:
| | | | | | | | | | | | | | | | |
| | | Federal Tax
Cost | | | Gross
Unrealized
Appreciation | | | Gross
Unrealized
(Depreciation) | | | Net
Unrealized
Appreciation/
(Depreciation) | |
Investments in Securities | | $ | 862,656,284 | | | $ | 151,174,611 | | | $ | (48,610,643 | ) | | $ | 102,563,968 | |
During the year ended December 31, 2018, the tax character of distributions paid as reflected in the Statements of Changes in Net Assets was as follows:
| | |
|
| 2018 |
Tax-Based
Distributions
from Ordinary
Income | | Tax-Based
Distributions
from Long-Term
Gains |
| |
| $93,044,241 | | $7,528,502 |
Note 5–Custodian
State Street is the custodian of cash and securities held by the Portfolio. Custodial fees are charged to the Portfolio based on the Portfolio’s net assets and/or the market value of securities held by the Portfolio and the number of certain transactions incurred by the Portfolio.
Note 6–Line of Credit
The Portfolio and certain other funds managed by New York Life Investments maintain a line of credit with a syndicate of banks in order to secure a source of funds for temporary purposes to meet unanticipated or excessive redemption requests.
Effective July 30, 2019, under the credit agreement (the “Credit Agreement”), the aggregate commitment amount is $600,000,000 with an additional uncommitted amount of $100,000,000. The commitment fee is an annual rate of 0.15% of the average commitment amount payable quarterly, regardless of usage, to State Street, who serves as the agent to the syndicate. The commitment fee is allocated among the Portfolio and certain other funds managed by New York Life Investments based upon their respective net assets and other factors. Interest on any revolving credit loan is charged based upon the Federal Funds Rate or the one-month London Interbank Offered Rate (“LIBOR”), whichever is higher. The Credit Agreement expires on July 28, 2020, although the Portfolio, certain other funds managed by New York Life Investments and the syndicate of banks may renew the Credit Agreement for an additional year on the same or different terms. Prior to July 30, 2019, the aggregate commitment amount and the commitment fee were the same as those under the current Credit Agreement.
During the six-month period ended June 30, 2019, the Portfolio utilized the line of credit for 1 day, maintained a balance of $58,363,000 at a rate of 3.29% and incurred interest expense in the amount of $5,333. As of June 30, 2019, there were no borrowings outstanding with respect to the Portfolio under the Credit Agreement.
Note 7–Interfund Lending Program
Pursuant to an exemptive order issued by the SEC, the Portfolio, along with certain other funds managed by New York Life Investments, may participate in an interfund lending program. The interfund lending program provides an alternative credit facility that permits the Portfolio and certain other funds managed by New York Life Investments to lend or borrow money for temporary purposes directly to or from one another subject to the conditions of the exemptive order. During the six-month period ended June 30, 2019, there were no interfund loans made or outstanding with respect to the Portfolio.
Note 8–Purchases and Sales of Securities (in 000’s)
During the six-month period ended June 30, 2019, purchases and sales of securities, other thanshort-term securities, were $69,039 and $191,295, respectively.
Note 9–Capital Share Transactions
Transactions in capital shares for the six-month period ended June 30, 2019 and the year ended December 31, 2018, were as follows:
| | | | | | | | |
Initial Class | | Shares | | | Amount | |
| | |
Six-month period ended June 30, 2019: | | | | | | | | |
Shares sold | | | 272,921 | | | $ | 4,121,629 | |
Shares redeemed | | | (6,993,426 | ) | | | (108,899,829 | ) |
| | | | |
Net increase (decrease) | | | (6,720,505 | ) | | $ | (104,778,200 | ) |
| | | | |
Year ended December 31, 2018: | | | | | | | | |
Shares sold | | | 10,090,454 | | | $ | 159,187,338 | |
Shares issued to shareholders in reinvestment of dividends and distributions | | | 3,922,337 | | | | 59,595,915 | |
Shares redeemed | | | (23,831,268 | ) | | | (366,163,878 | ) |
| | | | |
Net increase (decrease) | | | (9,818,477 | ) | | $ | (147,380,625 | ) |
| | | | |
| | |
| | | | | | | | |
Service Class | | Shares | | | Amount | |
| | |
Six-month period ended June 30, 2019: | | | | | | | | |
Shares sold | | | 576,259 | | | $ | 8,689,206 | |
Shares redeemed | | | (2,852,691 | ) | | | (43,208,013 | ) |
| | | | |
Net increase (decrease) | | | (2,276,432 | ) | | $ | (34,518,807 | ) |
| | | | |
Year ended December 31, 2018: | | | | | | | | |
Shares sold | | | 1,242,268 | | | $ | 19,317,835 | |
Shares issued to shareholders in reinvestment of dividends and distributions | | | 2,733,043 | | | | 40,976,828 | |
Shares redeemed | | | (6,351,626 | ) | | | (98,298,473 | ) |
| | | | |
Net increase (decrease) | | | (2,376,315 | ) | | $ | (38,003,810 | ) |
| | | | |
Note 10–Recent Accounting Pronouncement
To improve the effectiveness of fair value disclosure requirements, the Financial Accounting Standards Board recently issued Accounting Standard Update (ASU)2018-13, Fair Value Measurement Disclosure Framework—Changes to the Disclosure Requirements for Fair Value Measurement (ASU2018-13), which adds, removes, and modifies certain aspects relating to fair value disclosure. ASU2018-13 is effective for interim and annual reporting periods beginning after
| | |
| 22 | | MainStay VP Epoch U.S. Equity Yield Portfolio |
December 15, 2019; early adoption of the additions relating to ASU2018-13 is not required. Management has evaluated the implications of certain other provisions of the ASU and has determined to early adopt aspects related to the removal and modifications of certain fair value measurement disclosures under the ASU effective immediately. At this time, management is evaluating the implications of certain other provisions of the ASU related to new disclosure requirements and any impact on the financial statement disclosures has not yet been determined.
Note 11–Subsequent Events
In connection with the preparation of the financial statements of the Portfolio as of and for the six-month period ended June 30, 2019, events and transactions subsequent to June 30, 2019, through the date the financial statements were issued have been evaluated by the Portfolio’s management for possible adjustment and/or disclosure. No subsequent events requiring financial statement adjustment or disclosure have been identified.
Proxy Voting Policies and Procedures and Proxy Voting Record
A description of the policies and procedures that New York Life Investments uses to vote proxies related to the Portfolio’s securities is available without charge, upon request, (i) by calling800-598-2019; (ii) by visiting New York Life Investments website at https://www.nylinvestments.com/mainstay/products-and-performance/mainstay-vp-funds-trust; or (iii) by visiting the SEC’s website at www.sec.gov.
The Portfolio is required to file with the SEC its proxy voting record for the12-month period ending June 30 on Form N-PX. The Portfolio’s most recent Form N-PX or proxy voting record is available free of charge upon request (i) by calling800-598-2019; (ii) by visiting New York Life Investments website at https://www.nylinvestments.com/mainstay/products-and-performance/mainstay-vp-funds-trust; or (iii) by visiting the SEC’s website atwww.sec.gov.
Shareholder Reports and Quarterly Portfolio Disclosure
The Portfolio is required to file its complete schedule of portfolio holdings with the SEC 60 days after each fiscal quarter onForm N-PORT. The Portfolio’s holdings report is available without charge upon request, (i) by calling800-598-2019; (ii) by visiting New York Life Investments website at https://www.nylinvestments.com/mainstay/products-and-performance/mainstay-vp-funds-trust; or (iii) on the SEC’s website at www.sec.gov.
| | |
| 24 | | MainStay VP Epoch U.S. Equity Yield Portfolio |
MainStay VP Portfolios
MainStay VP offers a wide range of Portfolios. The full array of MainStay VP offerings is listed here, with information about the manager, subadvisors, legal counsel, and independent registered public accounting firm.
Equity Portfolios
MainStay VP Eagle Small Cap Growth Portfolio
MainStay VP Emerging Markets Equity Portfolio
MainStay VP Epoch U.S. Equity Yield Portfolio
MainStay VP Fidelity Institutional AM® Utilities Portfolio†
MainStay VP Large Cap Growth Portfolio
MainStay VP MacKay Common Stock Portfolio
MainStay VP MacKay Growth Portfolio
MainStay VP MacKay International Equity Portfolio
MainStay VP MacKay Mid Cap Core Portfolio
MainStay VP MacKay S&P 500 Index Portfolio
MainStay VP MacKay Small Cap Core Portfolio
MainStay VP Mellon Natural Resources Portfolio
MainStay VP T. Rowe Price Equity Income Portfolio
Mixed Asset Portfolios
MainStay VP Balanced Portfolio
MainStay VP Income Builder Portfolio
MainStay VP Janus Henderson Balanced Portfolio
MainStay VP MacKay Convertible Portfolio
Income Portfolios
MainStay VP Bond Portfolio
MainStay VP Floating Rate Portfolio
MainStay VP Indexed Bond Portfolio
MainStay VP MacKay Government Portfolio
MainStay VP MacKay High Yield Corporate Bond Portfolio
MainStay VP MacKay Unconstrained Bond Portfolio
MainStay VP PIMCO Real Return Portfolio
Money Market
MainStay VP U.S. Government Money Market Portfolio
Alternative
MainStay VP Cushing Renaissance Advantage Portfolio
MainStay VP IQ Hedge Multi-Strategy Portfolio
Asset Allocation Portfolios
MainStay VP Conservative Allocation Portfolio
MainStay VP Growth Allocation Portfolio
MainStay VP Moderate Allocation Portfolio
MainStay VP Moderate Growth Allocation Portfolio
Manager
New York Life Investment Management LLC
New York, New York
Subadvisors
Candriam Belgium*
Brussels, Belgium
Cushing Asset Management, LP
Dallas, Texas
Eagle Asset Management, Inc.
St Petersburg, Florida
Epoch Investment Partners, Inc.
New York, New York
FIAM LLC
Smithfield, Rhode Island
IndexIQ Advisors LLC*
New York, New York
Janus Capital Management LLC
Denver, Colorado
MacKay Shields LLC*
New York, New York
Mellon Investments Corporation
Boston, Massachusetts
NYL Investors LLC*
New York, New York
Pacific Investment Management Company LLC
Newport Beach, California
T. Rowe Price Associates, Inc.
Baltimore, Maryland
Winslow Capital Management, LLC
Minneapolis, Minnesota
Distributor
NYLIFE Distributors LLC*
Jersey City, New Jersey
Custodian
State Street Bank and Trust Company
Boston, Massachusetts
Independent Registered Public Accounting Firm
PricewaterhouseCoopers LLP
New York, New York
Legal Counsel
Dechert LLP
Washington, District of Columbia
Some Portfolios may not be available in all products.
| † | Fidelity Institutional AM is a registered trade mark of FMR LLC. Used with permission. |
| * | An affiliate of New York Life Investment Management LLC |
Not part of the Semiannual Report
2019 Semiannual Report
This report is for the general information of New York Life Variable Annuities and NYLIAC Variable Universal Life Insurance Products policyowners. It must be preceded or accompanied by the appropriate product(s) and funds prospectuses if it is given to anyone who is not an owner of a New York Life variable annuity policy or a NYLIAC Variable Universal Life Insurance Product. This report does not offer for sale or solicit orders to purchase securities.
The performance data quoted in this report represents past performance. Past performance is no guarantee of future results. Due to market volatility and other factors, current performance may be lower or higher than the figures shown. The most recent month-end performance summary for your variable annuity or variable life policy is available by calling 800-598-2019 and is updated periodically on www.newyorklife.com.
The New York Life Variable Annuities and NYLIAC Variable Universal Life Insurance Products are issued by New York Life Insurance and Annuity Corporation (a Delaware Corporation) and distributed by NYLIFE Distributors LLC (Member FINRA/SIPC).
New York Life Insurance Company
New York Life Insurance and Annuity Corporation (NYLIAC) (A Delaware Corporation)
51 Madison Avenue, Room 551
New York, NY 10010
www.newyorklife.com
Printed on recycled paper
nylinvestments.com
NYLIFE Distributors LLC, 30 Hudson Street, Jersey City, NJ 07302
New York Life Investment Management LLC is the investment manager to the MainStay VP Funds Trust
©2019 by NYLIFE Distributors LLC. All rights reserved.
You may obtain copies of the Prospectus and the Statement of Additional Information free of charge, upon request, by callingtoll-free 800-598-2019 or writing to New York Life Insurance and Annuity Corporation, 51 Madison Avenue, New York, NY 10010.
| | | | |
| | | |
| Not FDIC Insured | | No Bank Guarantee | | May Lose Value |
| | | | |
1781616 | | | | MSVPEUE10-08/19 (NYLIAC) NI521 |
MainStay VP MacKay International
Equity Portfolio
Message from the President and Semiannual Report
Unaudited | June 30, 2019

Beginning on January 1, 2021, as permitted by regulations adopted by the Securities and Exchange Commission, paper copies of the MainStay VP Portfolio annual and semi-annual shareholder reports may no longer be sent by mail, unless you specifically request paper copies of the reports from the insurance company that offers your policy. Instead, the reports will be made available online, and you will be notified by mail each time a report is posted and provided with a website link to access the report. Instructions for requesting paper copies will be provided by your insurance company.
If you already elected to receive shareholder reports electronically, you will not be affected by this change and you need not take any action. At any time, you may elect to receive reports and other communications from the insurance company electronically by following the instructions provided by the insurance company.
You may elect to receive all future shareholder reports in paper form free of charge. You can inform the insurance company that you wish to receive paper copies of reports by following the instructions provided by the insurance company. Your election to receive reports in paper form will apply to all portfolio companies available under your contract.
| | | | | | | | |
| | | | | |
| Not FDIC/NCUA Insured | | Not a Deposit | | May Lose Value | | No Bank Guarantee | | Not Insured by Any Government Agency |

This page intentionally left blank
Message from the President
Most equity and fixed-income markets in the United States and around the world advanced in the face of conflicting political and macroeconomic forces during thesix-month period ended June 30, 2019.
The reporting period began on the heels of tumultuous December 2018, during which equities and equity-sensitive bonds spiked sharply lower on concerns regarding the pace of economic growth, a U.S. government shutdown and the potential impact of trade disputes between the United States and other nations, particularly China. Markets recovered quickly in early 2019 as trade tensions eased, the government reopened and the U.S. Federal Reserve Board (Fed) adopted a more patient tone regarding the future direction of interest rates. Markets moved broadly higher from January through April, supported by encouraging economic data and generally strong corporate earnings.
During the first four months of the reporting period, the improving economic environment encouraged investors to favor areas of the market viewed as offering greater return potential along with higher risks. Among U.S. stocks, cyclical, growth-oriented sectors tended to outperform more defensive, value-oriented sectors, whilelarge-cap stocks outperformed theirsmaller-cap counterparts. Within the S&P 500® Index, the information technology sector led the market’s advance, followed by communication services, consumer discretionary and consumer staples. Industrials, utilities, financials, materials, real estate and energy produced more modest gains. While some international equity markets outperformed or underperformed the U.S. market, on average international stocks mirrored the performance of their U.S. counterparts. Fixed-income securities gained ground as well, albeit along a more gradual trajectory. Among U.S. fixed-income instruments, corporate issues generally outperformed government bonds, with lower credit quality, higher yielding securities leading the sector’s advance. Long-term U.S. Treasury bond yields proved particularly weak, with
10-year yields dipping at times below3-month yields, reflecting investors’ continued concerns about domestic economic growth.
May 2019 saw a return of uncertainty and volatility. Trade discussions between the United States and China faltered, driving global equity prices lower. Government bond prices rose as investors sought safe havens. June brought yet anotherU-turn as equity prices climbed again after comments from the Fed raised hopes of an interest rate cut in response to weak economic data. Stock and bond prices rose, with U.S. equity markets ending the reporting period in record territory.
We are pleased to see renewed signs of strength in broad areas of the financial market. At the same time, we remained sharply focused on providing you, as a MainStay VP investor, with the experienced and disciplined fund management that we believe underpins an effective, long-term investment strategy. Whatever tomorrow’s investment environment brings, you can rely on our portfolio managers to pursue the objectives of their individual Portfolios as outlined in the prospectus with the energy and dedication you have come to expect.
The report that follows contains additional information on the market events, investment decisions and specific securities that shaped your VP Portfolio’s performance during the six months ended June 30, 2019. We encourage you to read the report carefully and use it to evaluate your Portfolio’s performance in light of your long-range financial plan.
Sincerely,

Kirk C. Lehneis
President
The opinions expressed are as of the date of this report and are subject to change. There is no guarantee that any forecast made will come to pass. This material does not constitute investment advice and is not intended as an endorsement of any specific investment. Past performance is no guarantee of future results.
Not part of the Semiannual Report
Table of Contents
Investors should refer to the Portfolio’s Summary Prospectus and/or Prospectus and consider the Portfolio’s investment objectives, strategies, risks, charges and expenses carefully before investing. The Summary Prospectus and/or Prospectus contain this and other information about the Portfolio. You may obtain copies of the Portfolio’s Summary Prospectus and/or the Prospectus and the Statement of Additional Information free of charge, upon request, by calling toll-free 800-598-2019, by writing to New York Life Insurance and Annuity Corporation, 51 Madison Avenue, Room 251, New York, New York 10010 or by sending an email to MainStayShareholdersServices@nylim.com. These documents are also available at nylinvestments.com/vpdocuments. Please read the Summary Prospectus and/or Prospectus carefully before investing. MainStay VP Funds Trust portfolios are separate account options which are purchased through a variable insurance or variable annuity contract.
Investment and Performance Comparison1(Unaudited)
Performance data quoted represents past performance. Past performance is no guarantee of future results. Because of market volatility and other factors, current performance may be lower or higher than the figures shown. Investment return and principal value will fluctuate, and as a result, when shares are redeemed, they may be worth more or less than their original cost. The performance table and graph do not reflect any deduction of sales charges, mortality and expense charges, contract charges or administrative charges. Please refer to the Performance Summary appropriate for your policy. For performance information current to the most recent month-end, please call800-598-2019 or visit www.newyorklife.com.
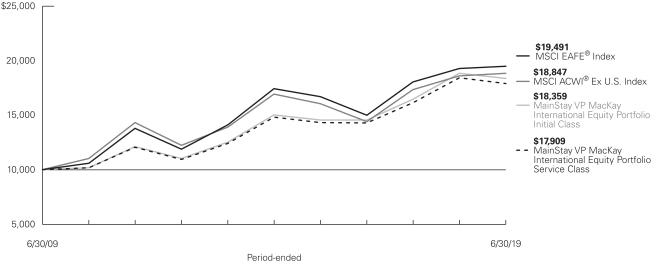
Average Annual Total Returns for the Period-Ended June 30, 2019
| | | | | | | | | | | | | | | | | | | | |
| Class | | Inception Date | | | Six Months | | One Year | | Five Years | | | Ten Years | | | Gross
Expense
Ratio2 | |
| | | | | | |
| Initial Class Shares | | | 5/1/1995 | | | 12.68% | | –2.63% | | | 4.10 | % | | | 6.26 | % | | | 0.96 | % |
| Service Class Shares | | | 6/5/2003 | | | 12.54 | | –2.87 | | | 3.84 | | | | 6.00 | | | | 1.21 | |
| | | | | | | | | | | | | | | | |
| Benchmark Performance | | Six
Months | | | One
Year | | | Five
Years | | | Ten
Years | |
| | | | |
MSCI ACWI® Ex U.S. Index3 | | | 13.60 | % | | | 1.29 | % | | | 2.16 | % | | | 6.54 | % |
| | | | |
MSCI EAFE® Index4 | | | 14.03 | | | | 1.08 | | | | 2.25 | | | | 6.90 | |
Morningstar Foreign Large Growth Category Average5 | | | 18.29 | | | | 2.25 | | | | 4.09 | | | | 8.20 | |
| 1. | Performance figures may reflect certain fee waivers and/or expense limitations, without which total returns may have been different. For information on current fee waivers and/or expense limitations (if any), please refer to the Notes to Financial Statements. |
| 2. | The gross expense ratios presented reflect the Portfolio’s “Total Annual Portfolio Operating Expenses” from the most recent Prospectus, as supplemented, and may differ from other expense ratios disclosed in this report. |
| 3. | The Portfolio has selected the MSCI ACWI® (All Country World Index) Ex U.S. Index as its primary broad-based securities market index. The MSCI ACWI® Ex U.S. Index is a free float-adjusted market capitalization weighted index that is designed to measure the equity market performance of developed and emerging markets, excluding the U.S. Results assume reinvestment of all dividends and capital gains. An investment cannot be made directly in an index. |
| 4. | The MSCI EAFE® Index is the Portfolio’s secondary benchmark. The MSCI EAFE® Index consists of international stocks representing the developed world outside of North America. Results assume reinvestment of all dividends and capital gains. An investment cannot be made directly in an index. |
| 5. | The Morningstar Foreign Large Growth Category Average is representative of funds that focus on high-priced growth stocks, mainly outside of the United States. Most of these funds divide their assets among a dozen or more developed markets, including Japan, Britain, France, and Germany. These funds primarily invest in stocks that have market caps in the top 70% of each economically integrated market and will have less than 20% of assets invested in U.S. stocks. Results are based on average total returns of similar funds with all dividends and capital gain distributions reinvested. |
Cost in Dollars of a $1,000 Investment in MainStay VP MacKay International Equity Portfolio (Unaudited)
The example below is intended to describe the fees and expenses borne by shareholders during the six-month period from January 1, 2019, to June 30, 2019, and the impact of those costs on your investment.
Example
As a shareholder of the Portfolio you incur two types of costs: (1) transaction costs, including exchange fees and sales charges (loads) on purchases (as applicable), and (2) ongoing costs, including management fees, distribution and/or service (12b-1) fees, and other Portfolio expenses (as applicable). This example is intended to help you understand your ongoing costs (in dollars) of investing in the Portfolio and to compare these costs with the ongoing costs of investing in other mutual funds. The example is based on an investment of $1,000 made at the beginning of the six-month period and held for the entire period from January 1, 2019, to June 30, 2019. Shares are only sold in connection with variable life and annuity contracts and the example does not reflect any contract level or transactional fees or expenses. If these costs had been included, your costs would have been higher.
This example illustrates your Portfolio’s ongoing costs in two ways:
Actual Expenses
The second and third data columns in the table below provide information about actual account values and actual expenses. You may use the information in these columns, together with the amount you invested, to estimate the expenses that you paid during the six months ended June 30, 2019. Simply divide your account value by $1,000
(for example, an $8,600 account value divided by $1,000 = 8.6), then multiply the result by the number under the heading entitled “Expenses Paid During Period” to estimate the expenses you paid on your account during this period.
Hypothetical Example for Comparison Purposes
The fourth and fifth data columns in the table below provide information about hypothetical account values and hypothetical expenses based on the Portfolio’s actual expense ratio and an assumed rate of return of 5% per year before expenses, which is not the Portfolio’s actual return. The hypothetical account values and expenses may not be used to estimate the actual ending account balances or expenses you paid for thesix-month period shown. You may use this information to compare the ongoing costs of investing in the Portfolio with the ongoing costs of investing in other mutual funds. To do so, compare this 5% hypothetical example with the 5% hypothetical examples that appear in the shareholder reports of the other mutual funds.
Please note that the expenses shown in the table are meant to highlight your ongoing costs only and do not reflect any transactional costs, such as exchange fees or sales charges (loads). Therefore, the fourth and fifth data columns of the table are useful in comparing ongoing costs only and will not help you determine the relative total costs of owning different funds. In addition, if these transactional costs were included, your costs would have been higher.
| | | | | | | | | | | | | | | | | | | | | | |
| | | | | | | | | | | | | | | | | | |
| Share Class | | Beginning
Account
Value
1/1/19 | | | Ending Account
Value (Based
on Actual
Returns and
Expenses)
6/30/19 | | | Expenses
Paid
During
Period1 | | | Ending Account
Value (Based
on Hypothetical
5% Annualized
Return and
Actual Expenses)
6/30/19 | | | Expenses
Paid
During
Period1 | | | Net Expense
Ratio
During
Period2 |
| | | | | | |
| Initial Class Shares | | $ | 1,000.00 | | | $ | 1,126.80 | | | $ | 5.06 | | | $ | 1,020.03 | | | $ | 4.81 | | | 0.96% |
| | | | | | |
| Service Class Shares | | $ | 1,000.00 | | | $ | 1,125.40 | | | $ | 6.38 | | | $ | 1,018.79 | | | $ | 6.06 | | | 1.21% |
| 1. | Expenses are equal to the Portfolio’s annualized expense ratio of each class multiplied by the average account value over the period, divided by 365 and multiplied by 181 (to reflect the six-month period). The table above represents the actual expenses incurred during the six-month period. In addition to the fees and expenses which the Portfolio bears directly, it also indirectly bears a pro rata share of the fees and expenses of the underlying funds in which it invests. Such indirect expenses are not included in the above-reported expense figures. |
| 2. | Expenses are equal to the Portfolio’s annualized expense ratio to reflect the six-month period. |
| | |
| 6 | | MainStay VP MacKay International Equity Portfolio |
Country Composition as of June 30, 2019(Unaudited)
| | | | |
| |
| United Kingdom | | | 19.0 | % |
| |
| Japan | | | 14.0 | |
| |
| Netherlands | | | 9.8 | |
| |
| Germany | | | 7.6 | |
| |
| Ireland | | | 6.6 | |
| |
| Spain | | | 5.4 | |
| |
| Canada | | | 4.8 | |
| |
| Switzerland | | | 4.6 | |
| |
| Sweden | | | 3.9 | |
| |
| China | | | 3.2 | |
| | | | |
| |
| Denmark | | | 2.9 | % |
| |
| India | | | 2.9 | |
| |
| France | | | 2.8 | |
| |
| Italy | | | 2.8 | |
| |
| United States | | | 2.0 | |
| |
| Mexico | | | 1.4 | |
| |
| Taiwan | | | 1.4 | |
| |
| Other Assets, Less Liabilities | | | 4.9 | |
| | | | |
| | | 100.0 | % |
| | | | |
See Portfolio of Investments beginning on page 9 for specific holdings within these categories. The Portfolio’s holdings are subject to change.
Top Ten Holdings as of June 30, 2019(excludingshort-term investment) (Unaudited)
| 3. | Koninklijke Philips N.V. |
| 7. | Industria de Diseno Textil S.A. |
| 8. | Housing Development Finance Corp., Ltd. |
| 9. | Novo Nordisk A/S, Class B |
Portfolio Management Discussion and Analysis(Unaudited)
Questions answered by portfolio managers Carlos Garcia-Tunon, CFA, Ian Murdoch and Lawrence Rosenberg of MacKay Shields LLC, the Portfolio’s Subadvisor.
How did MainStay VP MacKay International Equity Portfolio perform relative to its benchmarks and peers during the six months ended June 30, 2019?
For the six months ended June 30, 2019, MainStay VP MacKay International Equity Portfolio returned 12.68% for Initial Class shares and 12.54% for Service Class shares. Over the same period, both share classes underperformed the 13.60% return of the MSCI ACWI® Ex U.S. Index, which is the Portfolio’s primary benchmark; the 14.03% return of the MSCI EAFE® Index, which is a secondary benchmark of the Portfolio; and the 18.29% return of the Morningstar Foreign Large Growth Category Average.1
What factors affected the Portfolio’s relative performance during the reporting period?
The Portfolio underperformed its primary benchmark, the MSCI ACWI® Ex U.S. Index, during the reporting period primarily due to stock selection, particularly in the consumer discretionary, communication services and consumer staples sectors. The impact on the Portfolio’s performance of relatively weak performing sectors was partially offset by positive contributions to the Portfolio’s relative performance from other sectors, including industrials, materials and information technology. (Contributions take weightings and total returns into account.)
Which sectors were the strongest positive contributors to the Portfolio’s relative performance, and which sectors were particularly weak?
The sectors that made the strongest positive contributions to the Portfolio’s performance relative to the MSCI ACWI® Ex U.S. Index included industrials, information technology, and materials. The Portfolio’s relatively strong performance in industrials resulted largely from positive stock selection, with the effect of relatively underweight sector allocation essentially neutral. Information technology holdings benefited both from positive stock selection and the positive effect of the Portfolio’s overweight allocation to the sector, which outperformed the Index. Materials holdings benefited mainly from positive stock selection, with the effect of underweight sector allocation again essentially neutral.
The sectors that detracted most from the Portfolio’s performance relative to the MSCI ACWI® Ex U.S. Index included consumer discretionary, communication services and consumer staples. The Portfolio’s consumer discretionary position suffered from unfavorable stock selection, partially offset by overweight exposure to the sector, which outperformed the Index. The Portfolio’s communication services positions suffered from both unfavorable stock selection as well as the negative effect of overweight exposure to the sector, which underperformed Index. The Portfolio’s consumer staples positions suffered from
unfavorable stock selection, with the effect of underweight sector allocation essentially neutral.
During the reporting period, which individual stocks made the strongest positive contributions to the Portfolio’s absolute performance and which stocks detracted the most?
The individual stocks that made the strongest positive contributions to the Portfolio’s absolute performance during the reporting period included Canadian software company Constellation Software, global management and technology consulting firm Accenture andU.K.-domiciled global life insurer Prudential. The stocks that detracted the most from the Portfolio’s absolute performance included German Internet access and services provider United Internet, U.K. medical technology company LivaNova and Luxembourg-based global luggage brand Samsonite.
Did the Portfolio make any significant purchases or sales during the reporting period?
The Portfolio’s most substantial initial purchases during the reporting period included shares of British food servicer Compass Group and Dutch nutrition, health and sustainable living solutions producer Koninklijke DSM. Compass Group is the leading global catering company and a beneficiary of a long-term outsourcing trend. Koninklijke DSM is a differentiated specialty chemicals company benefiting from increased consumer focus on human and animal health, among other secular growth trends.
The Portfolio’s largest full sales during the reporting period included its positions in German digital payments provider Wirecard and U.K. hospitality group Whitbread. The Portfolio sold its Wirecard holdings on corporate governance concerns following a short-seller report. The Portfolio exited Whitbread largely on valuation grounds.
How did the Portfolio’s sector weightings change during the reporting period?
The Portfolio’s most substantial sector-weighting increases relative to the MSCI ACWI® Ex U.S. Index were in materials, industrials and health care. The Portfolio’s most substantial decreases in sector weightings relative to the Index were in information technology, communication services and financials.
How was the Portfolio positioned at the end of the reporting period?
As of June 30, 2019, the Portfolio held its most substantially overweight sector positions relative to the MSCI ACWI® Ex U.S. Index in health care, information technology and materials. As of the same date, the Portfolio’s most substantially underweight sector positions relative to the Index were in financials, energy and consumer staples.
| 1. | See page 5 for more information on benchmark and peer group returns. |
The opinions expressed are those of the portfolio managers as of the date of this report and are subject to change. There is no guarantee that any forecasts will come to pass. This material does not constitute investment advice and is not intended as an endorsement of any specific investment.
Not all MainStay VP Portfolios and/or share classes are available under all policies.
| | |
| 8 | | MainStay VP MacKay International Equity Portfolio |
Portfolio of InvestmentsJune 30, 2019 (Unaudited)
| | | | | | | | |
| | | Shares | | |
Value | |
| Common Stocks 95.0%† | |
Canada 4.8% | |
Bank of Nova Scotia (Banks) | | | 232,225 | | | $ | 12,473,527 | |
Constellation Software, Inc. (Software) | | | 10,879 | | | | 10,253,450 | |
| | | | | | | | |
| | | | | | | 22,726,977 | |
| | | | | | | | |
China 3.2% | |
Tencent Holdings, Ltd. (Interactive Media & Services) | | | 333,134 | | | | 15,036,810 | |
| | | | | | | | |
|
Denmark 2.9% | |
Novo Nordisk A/S, Class B (Pharmaceuticals) | | | 266,059 | | | | 13,557,999 | |
| | | | | | | | |
|
France 2.8% | |
Teleperformance S.E. (Professional Services) | | | 65,576 | | | | 13,138,614 | |
| | | | | | | | |
|
Germany 7.6% | |
Fresenius Medical Care A.G. & Co. KGaA (Health Care Providers & Services) | | | 166,122 | | | | 13,041,473 | |
Scout24 A.G. (Interactive Media & Services) (a) | | | 242,681 | | | | 12,892,506 | |
Symrise A.G. (Chemicals) | | | 68,658 | | | | 6,607,932 | |
United Internet A.G., Registered (Diversified Telecommunication Services) | | | 102,052 | | | | 3,360,615 | |
| | | | | | | | |
| | | | | | | 35,902,526 | |
| | | | | | | | |
India 2.9% | |
Housing Development Finance Corp., Ltd. (Thrifts & Mortgage Finance) | | | 430,989 | | | | 13,701,239 | |
| | | | | | | | |
|
Ireland 6.6% | |
Accenture PLC, Class A (IT Services) | | | 68,550 | | | | 12,665,984 | |
ICON PLC (Life Sciences Tools & Services) (b) | | | 119,166 | | | | 18,347,989 | |
| | | | | | | | |
| | | | | | | 31,013,973 | |
| | | | | | | | |
Italy 2.8% | |
Banca IFIS S.p.A. (Diversified Financial Services) | | | 349,117 | | | | 4,712,165 | |
DiaSorin S.p.A. (Health Care Equipment & Supplies) | | | 72,445 | | | | 8,410,714 | |
| | | | | | | | |
| | | | | | | 13,122,879 | |
| | | | | | | | |
Japan 14.0% | |
CyberAgent, Inc. (Media) | | | 180,500 | | | | 6,537,611 | |
Lion Corp. (Household Products) | | | 386,800 | | | | 7,200,367 | |
Relo Group, Inc. (Real Estate Management & Development) | | | 379,300 | | | | 9,544,506 | |
Takeda Pharmaceutical Co., Ltd. (Pharmaceuticals) | | | 163,844 | | | | 5,809,726 | |
TechnoPro Holdings, Inc. (Professional Services) | | | 149,000 | | | | 7,905,022 | |
Tsuruha Holdings, Inc. (Food & Staples Retailing) (c) | | | 153,740 | | | | 14,202,573 | |
ZOZO, Inc. (Internet & Direct Marketing Retail) | | | 776,858 | | | | 14,547,849 | |
| | | | | | | | |
| | | | | | | 65,747,654 | |
| | | | | | | | |
| | | | | | | | |
| | | Shares | | |
Value | |
Mexico 1.4% | |
Regional S.A.B. de C.V. (Banks) | | | 1,239,251 | | | $ | 6,383,575 | |
| | | | | | | | |
|
Netherlands 9.8% | |
GrandVision N.V. (Specialty Retail) (a) | | | 234,769 | | | | 5,456,578 | |
IMCD N.V. (Trading Companies & Distributors) | | | 125,462 | | | | 11,498,627 | |
Koninklijke DSM N.V. (Chemicals) | | | 103,266 | | | | 12,763,965 | |
Koninklijke Philips N.V. (Health Care Equipment & Supplies) | | | 375,406 | | | | 16,300,192 | |
| | | | | | | | |
| | | | | | | 46,019,362 | |
| | | | | | | | |
Spain 5.4% | |
Amadeus IT Group S.A. (IT Services) | | | 143,779 | | | | 11,388,792 | |
Industria de Diseno Textil S.A. (Specialty Retail) | | | 464,860 | | | | 13,981,268 | |
| | | | | | | | |
| | | | | | | 25,370,060 | |
| | | | | | | | |
Sweden 3.9% | |
Hexagon AB, Class B (Electronic Equipment, Instruments & Components) | | | 327,172 | | | | 18,165,750 | |
| | | | | | | | |
|
Switzerland 4.6% | |
Sika A.G., Registered (Chemicals) | | | 51,301 | | | | 8,755,118 | |
TE Connectivity, Ltd. (Electronic Equipment, Instruments & Components) | | | 135,061 | | | | 12,936,143 | |
| | | | | | | | |
| | | | | | | 21,691,261 | |
| | | | | | | | |
Taiwan 1.4% | |
Taiwan Semiconductor Manufacturing Co., Ltd., Sponsored ADR (Semiconductors & Semiconductor Equipment) | | | 173,912 | | | | 6,812,133 | |
| | | | | | | | |
|
United Kingdom 19.0% | |
Big Yellow Group PLC (Equity Real Estate Investment Trusts) | | | 508,227 | | | | 6,386,456 | |
BTG PLC (Pharmaceuticals) (b) | | | 631,028 | | | | 6,695,476 | |
Compass Group PLC (Hotels, Restaurants & Leisure) | | | 544,805 | | | | 13,055,676 | |
Experian PLC (Professional Services) | | | 293,660 | | | | 8,890,730 | |
HomeServe PLC (Commercial Services & Supplies) | | | 530,730 | | | | 8,000,382 | |
Johnson Matthey PLC (Chemicals) | | | 315,679 | | | | 13,345,839 | |
LivaNova PLC (Health Care Equipment & Supplies) (b) | | | 147,438 | | | | 10,609,639 | |
Prudential PLC (Insurance) | | | 566,431 | | | | 12,343,852 | |
St. James’s Place PLC (Capital Markets) | | | 699,125 | | | | 9,748,629 | |
| | | | | | | | |
| | | | | | | 89,076,679 | |
| | | | | | | | |
United States 1.9% | |
Samsonite International S.A. (Textiles, Apparel & Luxury Goods) (a) | | | 3,796,069 | | | | 8,708,163 | |
| | | | | | | | |
Total Common Stocks
(Cost $413,574,889) | | | | | | | 446,175,654 | |
| | | | | | | | |
| | | | | | |
The notes to the financial statements are an integral part of,
and should be read in conjunction with, the financial statements. | | | | | 9 | |
Portfolio of InvestmentsJune 30, 2019 (Unaudited) (continued)
| | | | | | | | |
| | | Shares | | |
Value | |
| Short-Term Investment 0.1% | | | | | | | | |
Affiliated Investment Company 0.1% | |
United States 0.1% | |
MainStay U.S. Government Liquidity Fund, 2.03% (d) | | | 720,898 | | | $ | 720,898 | |
| | | | | | | | |
TotalShort-Term Investment
(Cost $720,898) | | | | | | | 720,898 | |
| | | | | | | | |
Total Investments
(Cost $414,295,787) | | | 95.1 | % | | | 446,896,552 | |
Other Assets, Less Liabilities | | | 4.9 | | | | 22,881,594 | |
Net Assets | | | 100.0 | % | | $ | 469,778,146 | |
| † | Percentages indicated are based on Portfolio net assets. |
| (a) | May be sold to institutional investors only under Rule 144A or securities offered pursuant to Section 4(a)(2) of the Securities Act of 1933, as amended. |
| (b) | Non-income producing security. |
| (c) | All or a portion of this security was held on loan. As of June 30, 2019, the aggregate market value of the security on loan was $101,672 and the Portfolio received non-cash collateral in the form of U.S. Treasury securities with a value of $112,809 (See Note 2(J)). |
| (d) | Current yield as of June 30, 2019. |
The following abbreviation is used in the preceding pages:
ADR—American Depositary Receipt
The following is a summary of the fair valuations according to the inputs used as of June 30, 2019, for valuing the Portfolio’s assets:
| | | | | | | | | | | | | | | | |
Description | | Quoted
Prices in
Active
Markets for
Identical
Assets
(Level 1) | | | Significant
Other
Observable
Inputs
(Level 2) | | | Significant
Unobservable
Inputs
(Level 3) | | | Total | |
| | | | |
Asset Valuation Inputs | | | | | | | | | | | | | | | | |
| Investments in Securities (a) | | | | | | | | | | | | | | | | |
| Common Stocks | | $ | 446,175,654 | | | $ | — | | | $ | — | | | $ | 446,175,654 | |
| Short-Term Investment | | | | | | | | | | | | | | | | |
Affiliated Investment Company | | | 720,898 | | | | — | | | | — | | | | 720,898 | |
| | | | | | | | | | | | | | | | |
| Total Investments in Securities | | $ | 446,896,552 | | | $ | — | | | $ | — | | | $ | 446,896,552 | |
| | | | | | | | | | | | | | | | |
| (a) | For a complete listing of investments and their industries, see the Portfolio of Investments. |
| | | | |
| 10 | | MainStay VP MacKay International Equity Portfolio | | The notes to the financial statements are an integral part of,
and should be read in conjunction with, the financial statements. |
The table below sets forth the diversification of the Portfolio ’s investments by industry.
Industry Diversification (Unaudited)
| | | | | | | | |
| | | Value | | | Percent † | |
Banks | | $ | 18,857,102 | | | | 4.0 | % |
Capital Markets | | | 9,748,629 | | | | 2.1 | |
Chemicals | | | 41,472,854 | | | | 8.8 | |
Commercial Services & Supplies | | | 8,000,382 | | | | 1.7 | |
Diversified Financial Services | | | 4,712,165 | | | | 1.0 | |
Diversified Telecommunication Services | | | 3,360,615 | | | | 0.7 | |
Electronic Equipment, Instruments & Components | | | 31,101,893 | | | | 6.6 | |
Equity Real Estate Investment Trusts | | | 6,386,456 | | | | 1.4 | |
Food & Staples Retailing | | | 14,202,573 | | | | 3.0 | |
Health Care Equipment & Supplies | | | 35,320,545 | | | | 7.5 | |
Health Care Providers & Services | | | 13,041,473 | | | | 2.8 | |
Hotels, Restaurants & Leisure | | | 13,055,676 | | | | 2.8 | |
Household Products | | | 7,200,367 | | | | 1.5 | |
Insurance | | | 12,343,852 | | | | 2.6 | |
Interactive Media & Services | | | 27,929,316 | | | | 5.9 | |
Internet & Direct Marketing Retail | | | 14,547,849 | | | | 3.1 | |
IT Services | | | 24,054,776 | | | | 5.1 | |
Life Sciences Tools & Services | | | 18,347,989 | | | | 3.9 | |
Media | | | 6,537,611 | | | | 1.4 | |
Pharmaceuticals | | | 26,063,201 | | | | 5.6 | |
Professional Services | | | 29,934,366 | | | | 6.4 | |
Real Estate Management & Development | | | 9,544,506 | | | | 2.0 | |
Semiconductors & Semiconductor Equipment | | | 6,812,133 | | | | 1.5 | |
Software | | | 10,253,450 | | | | 2.2 | |
Specialty Retail | | | 19,437,846 | | | | 4.1 | |
Textiles, Apparel & Luxury Goods | | | 8,708,163 | | | | 1.9 | |
Thrifts & Mortgage Finance | | | 13,701,239 | | | | 2.9 | |
Trading Companies & Distributors | | | 11,498,627 | | | | 2.5 | |
| | | | | | | | |
| | | 446,175,654 | | | | 95.0 | |
Short-Term Investment | | | 720,898 | | | | 0.1 | |
Other Assets, Less Liabilities | | | 22,881,594 | | | | 4.9 | |
| | | | | | | | |
Net Assets | | $ | 469,778,146 | | | | 100.0 | % |
| | | | | | | | |
| † | Percentages indicated are based on Portfolio net assets. |
| | | | | | |
The notes to the financial statements are an integral part of,
and should be read in conjunction with, the financial statements. | | | | | 11 | |
Statement of Assets and Liabilitiesas of June 30, 2019 (Unaudited)
| | | | |
| Assets | | | | |
Investment in unaffiliated securities, at value
(identified cost $413,574,889) including securities on loan of $101,672 | | $ | 446,175,654 | |
Investment in affiliated investment company, at value (identified cost $720,898) | | | 720,898 | |
Cash denominated in foreign currencies
(identified cost $17,121,511) | | | 17,486,371 | |
Receivables: | | | | |
Portfolio shares sold | | | 4,291,151 | |
Dividends and interest | | | 1,870,558 | |
Securities lending | | | 30,824 | |
Other assets | | | 2,123 | |
| | | | |
Total assets | | | 470,577,579 | |
| | | | |
| |
| Liabilities | | | | |
Payables: | | | | |
Manager (See Note 3) | | | 331,713 | |
Portfolio shares redeemed | | | 281,463 | |
Custodian | | | 64,199 | |
NYLIFE Distributors (See Note 3) | | | 57,789 | |
Professional fees | | | 29,500 | |
Shareholder communication | | | 26,761 | |
Trustees | | | 525 | |
Investment securities purchased | | | 99 | |
Accrued expenses | | | 7,384 | |
| | | | |
Total liabilities | | | 799,433 | |
| | | | |
Net assets | | $ | 469,778,146 | |
| | | | |
| |
| Composition of Net Assets | | | | |
Shares of beneficial interest outstanding (par value of
$.001 per share) unlimited number of shares authorized | | $ | 27,998 | |
Additional paid-in capital | | | 371,166,337 | |
| | | | |
| | | 371,194,335 | |
Total distributable earnings (loss) | | | 98,583,811 | |
| | | | |
Net assets | | $ | 469,778,146 | |
| | | | |
| | | | |
Initial Class | | | | |
Net assets applicable to outstanding shares | | $ | 181,349,091 | |
| | | | |
Shares of beneficial interest outstanding | | | 10,742,461 | |
| | | | |
Net asset value per share outstanding | | $ | 16.88 | |
| | | | |
Service Class | | | | |
Net assets applicable to outstanding shares | | $ | 288,429,055 | |
| | | | |
Shares of beneficial interest outstanding | | | 17,255,192 | |
| | | | |
Net asset value per share outstanding | | $ | 16.72 | |
| | | | |
| | | | |
| 12 | | MainStay VP MacKay International Equity Portfolio | | The notes to the financial statements are an integral part of,
and should be read in conjunction with, the financial statements. |
Statement of Operationsfor the six months ended June 30, 2019 (Unaudited)
| | | | |
| Investment Income (Loss) | | | | |
Income | | | | |
Dividends—unaffiliated (a) | | $ | 5,169,536 | |
Securities lending | | | 41,202 | |
Interest | | | 10,066 | |
Dividends-affiliated | | | 7,979 | |
| | | | |
Total income | | | 5,228,783 | |
| | | | |
Expenses | | | | |
Manager (See Note 3) | | | 1,991,639 | |
Distribution/Service—Service Class (See Note 3) | | | 347,035 | |
Custodian | | | 59,362 | |
Professional fees | | | 45,271 | |
Shareholder communication | | | 29,876 | |
Trustees | | | 5,484 | |
Miscellaneous | | | 15,592 | |
| | | | |
Total expenses | | | 2,494,259 | |
| | | | |
Net investment income (loss) | | | 2,734,524 | |
| | | | |
|
| Realized and Unrealized Gain (Loss) on Investments and Foreign Currency Transactions | |
Net realized gain (loss) on: | | | | |
Unaffiliated investment transactions | | | 6,910,020 | |
Foreign currency transactions | | | 103,032 | |
| | | | |
Net realized gain (loss) on investments and foreign currency transactions | | | 7,013,052 | |
| | | | |
Net change in unrealized appreciation (depreciation) on: | | | | |
Unaffiliated investments | | | 42,121,303 | |
Translation of other assets and liabilities in foreign currencies | | | 659,016 | |
| | | | |
Net change in unrealized appreciation (depreciation) on investments and foreign currency transactions | | | 42,780,319 | |
| | | | |
Net realized and unrealized gain (loss) on investments and foreign currency transactions | | | 49,793,371 | |
| | | | |
Net increase (decrease) in net assets resulting from operations | | $ | 52,527,895 | |
| | | | |
| (a) | Dividends recorded net of foreign withholding taxes in the amount of $583,329. |
| | | | | | |
The notes to the financial statements are an integral part of,
and should be read in conjunction with, the financial statements. | | | | | 13 | |
Statements of Changes in Net Assets
for the six months ended June 30, 2019 (Unaudited) and the year ended December 31, 2018
| | | | | | | | |
| | | 2019 | | | 2018 | |
| Increase (Decrease) in Net Assets | |
Operations: | | | | | | | | |
Net investment income (loss) | | $ | 2,734,524 | | | $ | 1,965,271 | |
Net realized gain (loss) on investments and foreign currency transactions | | | 7,013,052 | | | | 59,141,904 | |
Net change in unrealized appreciation (depreciation) on investments and foreign currency transactions | | | 42,780,319 | | | | (115,839,285 | ) |
| | | | |
Net increase (decrease) in net assets resulting from operations | | | 52,527,895 | | | | (54,732,110 | ) |
| | | | |
Distributions to shareholders: | | | | | | | | |
Initial Class | | | — | | | | (5,332,706 | ) |
Service Class | | | — | | | | (8,219,947 | ) |
| | | | |
Total distributions to shareholders | | | — | | | | (13,552,653 | ) |
| | | | |
Capital share transactions: | | | | | | | | |
Net proceeds from sale of shares | | | 30,087,835 | | | | 66,083,849 | |
Net asset value of shares issued to shareholders in reinvestment of dividends and distributions | | | — | | | | 13,552,653 | |
Cost of shares redeemed | | | (29,359,959 | ) | | | (102,298,109 | ) |
| | | | |
Increase (decrease) in net assets derived from capital share transactions | | | 727,876 | | | | (22,661,607 | ) |
| | | | |
Net increase (decrease) in net assets | | | 53,255,771 | | | | (90,946,370 | ) |
| | |
| Net Assets | | | | | | | | |
Beginning of period | | | 416,522,375 | | | | 507,468,745 | |
| | | | |
End of period | | $ | 469,778,146 | | | $ | 416,522,375 | |
| | | | | | | | |
| | | | |
| 14 | | MainStay VP MacKay International Equity Portfolio | | The notes to the financial statements are an integral part of,
and should be read in conjunction with, the financial statements. |
Financial Highlightsselected per share data and ratios
| | | | | | | | | | | | | | | | | | | | | | | | | | | | |
| | | |
| | | Six months
ended
June 30, | | | | | | Year ended December 31, | |
| | | | | | | |
| Initial Class | | 2019* | | | | | | 2018 | | | 2017 | | | 2016 | | | 2015 | | | 2014 | |
| | | | | | | |
Net asset value at beginning of period | | $ | 14.99 | | | | | | | $ | 17.46 | | | $ | 13.24 | | | $ | 14.04 | | | $ | 13.36 | | | $ | 13.81 | |
| | | | | | | | | | | | | | | | | | | | | | | | | | | | |
| | | | | | | |
Net investment income (loss) (a) | | | 0.11 | | | | | | | | 0.10 | | | | 0.07 | | | | 0.10 | | | | 0.10 | | | | 0.12 | |
| | | | | | | |
Net realized and unrealized gain (loss) on investments | | | 1.75 | | | | | | | | (2.00 | ) | | | 4.21 | | | | (0.77 | ) | | | 0.75 | | | | (0.44 | ) |
| | | | | | | |
Net realized and unrealized gain (loss) on foreign currency transactions | | | 0.03 | | | | | | | | (0.04 | ) | | | 0.03 | | | | (0.02 | ) | | | (0.03 | ) | | | (0.04 | ) |
| | | | | | | | | | | | | | | | | | | | | | | | | | | | |
| | | | | | | |
Total from investment operations | | | 1.89 | | | | | | | | (1.94 | ) | | | 4.31 | | | | (0.69 | ) | | | 0.82 | | | | (0.36 | ) |
| | | | | | | | | | | | | | | | | | | | | | | | | | | | |
| | | | | | | |
| Less dividends and distributions: | | | | | | | | | | | | | | | | | | | | | | | | | | | | |
| | | | | | | |
From net investment income | | | — | | | | | | | | (0.21 | ) | | | (0.09 | ) | | | (0.11 | ) | | | (0.14 | ) | | | (0.09 | ) |
| | | | | | | |
From net realized gain on investments | | | — | | | | | | | | (0.32 | ) | | | — | | | | — | | | | — | | | | — | |
| | | | | | | | | | | | | | | | | | | | | | | | | | | | |
| | | | | | | |
Total dividends and distributions | | | — | | | | | | | | (0.53 | ) | | | (0.09 | ) | | | (0.11 | ) | | | (0.14 | ) | | | (0.09 | ) |
| | | | | | | | | | | | | | | | | | | | | | | | | | | | |
| | | | | | | |
Net asset value at end of period | | $ | 16.88 | | | | | | | $ | 14.99 | | | $ | 17.46 | | | $ | 13.24 | | | $ | 14.04 | | | $ | 13.36 | |
| | | | | | | | | | | | | | | | | | | | | | | | | | | | |
| | | | | | | |
Total investment return (b) | | | 12.61 | %(c) | | | | | | | (11.56 | %) | | | 32.61 | % | | | (4.95 | %) | | | 6.17 | % | | | (2.62 | %) |
| | | | | | | |
| Ratios (to average net assets)/Supplemental Data: | | | | | | | | | | | | | | | | | | | | | | | | | | | | |
| | | | | | | |
Net investment income (loss) | | | 1.37 | %†† | | | | | | | 0.55 | % | | | 0.43 | % | | | 0.71 | % (d) | | | 0.74 | % | | | 0.85 | % |
| | | | | | | |
Net expenses (e) | | | 0.96 | %†† | | | | | | | 0.96 | % | | | 0.96 | % | | | 0.95 | % (f) | | | 0.95 | % | | | 0.95 | % |
| | | | | | | |
Portfolio turnover rate | | | 25 | % | | | | | | | 46 | % | | | 49 | % | | | 28 | % | | | 40 | % | | | 38 | % |
| | | | | | | |
Net assets at end of period (in 000’s) | | $ | 181,349 | | | | | | | $ | 158,215 | | | $ | 196,676 | | | $ | 171,048 | | | $ | 243,076 | | | $ | 217,936 | |
| (a) | Per share data based on average shares outstanding during the period. |
| (b) | Total return does not reflect any deduction of sales charges, mortality and expense charges, contract charges or administrative charges. For periods of less than one year, total return is not annualized. |
| (c) | Total investment return may reflect adjustments to conform to generally accepted accounting principles. |
| (d) | Without the custody fee reimbursement, net investment income (loss) would have been 0.70%. |
| (e) | In addition to the fees and expenses which the Portfolio bears directly, it also indirectly bears a pro-rata share of the fees and expenses of the underlying funds in which it invests. Such indirect expenses are not included in the above expense ratios. |
| (f) | Without the custody fee reimbursement, net expenses would have been 0.96%. |
| | | | | | | | | | | | | | | | | | | | | | | | | | | | |
| | | |
| | | Six months
ended
June 30, | | | | | | Year ended December 31, | |
| | | | | | | |
| Service Class | | 2019* | | | | | | 2018 | | | 2017 | | | 2016 | | | 2015 | | | 2014 | |
| | | | | | | |
Net asset value at beginning of period | | $ | 14.86 | | | | | | | $ | 17.32 | | | $ | 13.13 | | | $ | 13.92 | | | $ | 13.24 | | | $ | 13.70 | |
| | | | | | | | | | | | | | | | | | | | | | | | | | | | |
| | | | | | | |
Net investment income (loss) (a) | | | 0.09 | | | | | | | | 0.05 | | | | 0.03 | | | | 0.05 | | | | 0.07 | | | | 0.08 | |
| | | | | | | |
Net realized and unrealized gain (loss) on investments | | | 1.74 | | | | | | | | (1.99 | ) | | | 4.18 | | | | (0.74 | ) | | | 0.74 | | | | (0.44 | ) |
| | | | | | | |
Net realized and unrealized gain (loss) on foreign currency transactions | | | 0.03 | | | | | | | | (0.04 | ) | | | 0.03 | | | | (0.03 | ) | | | (0.03 | ) | | | (0.04 | ) |
| | | | | | | | | | | | | | | | | | | | | | | | | | | | |
| | | | | | | |
Total from investment operations | | | 1.86 | | | | | | | | (1.98 | ) | | | 4.24 | | | | (0.72 | ) | | | 0.78 | | | | (0.40 | ) |
| | | | | | | | | | | | | | | | | | | | | | | | | | | | |
| | | | | | | |
| Less dividends and distributions: | | | | | | | | | | | | | | | | | | | | | | | | | | | | |
| | | | | | | |
From net investment income | | | — | | | | | | | | (0.16 | ) | | | (0.05 | ) | | | (0.07 | ) | | | (0.10 | ) | | | (0.06 | ) |
| | | | | | | |
From net realized gain on investments | | | — | | | | | | | | (0.32 | ) | | | — | | | | — | | | | — | | | | — | |
| | | | | | | | | | | | | | | | | | | | | | | | | | | | |
| | | | | | | |
Total dividends and distributions | | | — | | | | | | | | (0.48 | ) | | | (0.05 | ) | | | (0.07 | ) | | | (0.10 | ) | | | (0.06 | ) |
| | | | | | | | | | | | | | | | | | | | | | | | | | | | |
| | | | | | | |
Net asset value at end of period | | $ | 16.72 | | | | | | | $ | 14.86 | | | $ | 17.32 | | | $ | 13.13 | | | $ | 13.92 | | | $ | 13.24 | |
| | | | | | | | | | | | | | | | | | | | | | | | | | | | |
| | | | | | | |
Total investment return (b) | | | 12.52 | %(c) | | | | | | | (11.78 | %) | | | 32.28 | % | | | (5.17 | %) | | | 5.90 | % | | | (2.86 | %) |
| | | | | | | |
| Ratios (to average net assets)/Supplemental Data: | | | | | | | | | | | | | | | | | | | | | | | | | | | | |
| | | | | | | |
Net investment income (loss) | | | 1.13 | %†† | | | | | | | 0.32 | % | | | 0.18 | % | | | 0.40 | % (d) | | | 0.48 | % | | | 0.60 | % |
| | | | | | | |
Net expenses (e) | | | 1.21 | %†† | | | | | | | 1.21 | % | | | 1.21 | % | | | 1.20 | % (f) | | | 1.20 | % | | | 1.20 | % |
| | | | | | | |
Portfolio turnover rate | | | 25 | % | | | | | | | 46 | % | | | 49 | % | | | 28 | % | | | 40 | % | | | 38 | % |
| | | | | | | |
Net assets at end of period (in 000’s) | | $ | 288,429 | | | | | | | $ | 258,307 | | | $ | 310,793 | | | $ | 251,474 | | | $ | 300,184 | | | $ | 309,428 | |
| (a) | Per share data based on average shares outstanding during the period. |
| (b) | Total return does not reflect any deduction of sales charges, mortality and expense charges, contract charges or administrative charges. For periods of less than one year, total return is not annualized. |
| (c) | Total investment return may reflect adjustments to conform to generally accepted accounting principles. |
| (d) | Without the custody fee reimbursement, net investment income (loss) would have been 0.39%. |
| (e) | In addition to the fees and expenses which the Portfolio bears directly, it also indirectly bears a pro-rata share of the fees and expenses of the underlying funds in which it invests. Such indirect expenses are not included in the above expense ratios. |
| (f) | Without the custody fee reimbursement, net expenses would have been 1.21%. |
| | | | | | |
The notes to the financial statements are an integral part of,
and should be read in conjunction with, the financial statements. | | | | | 15 | |
Notes to Financial Statements(Unaudited)
Note 1–Organization and Business
MainStay VP Funds Trust (the “Fund”) was organized as a Delaware statutory trust on February 1, 2011. The Fund is registered under the Investment Company Act of 1940, as amended (the “1940 Act”), as an open-end management investment company. The Fund is comprised of thirty-one separate series (collectively referred to as the “Portfolios”). These financial statements and notes relate to the MainStay VP MacKay International Equity Portfolio (the “Portfolio”), a “diversified” portfolio, as that term is defined in the 1940 Act, as interpreted or modified by regulatory authorities having jurisdiction, from time to time.
Shares of the Portfolio are currently offered to certain separate accounts to fund variable annuity policies and variable universal life insurance policies issued by New York Life Insurance and Annuity Corporation (“NYLIAC”), awholly-owned subsidiary of New York Life Insurance Company (“New York Life”) and may also be offered to fund variable annuity policies and variable universal life insurance policies issued by other insurance companies. NYLIAC allocates shares of the Portfolios to, among others, certain NYLIAC separate accounts. Shares of the Portfolio are also offered to the MainStay VP Conservative Allocation Portfolio, MainStay VP Moderate Allocation Portfolio, MainStay VP Moderate Growth Allocation Portfolio and MainStay VP Growth Allocation Portfolio, which operate as “funds-of-funds.”
The Portfolio currently offers two classes of shares. Initial Class shares commenced operations on May 1, 1995. Service Class shares commenced operations on June 5, 2003. Shares of the Portfolio are offered and are redeemed at a price equal to their respective net asset value (“NAV”) per share. No sales or redemption charge is applicable to the purchase or redemption of the Portfolio’s shares. Under the terms of the Fund’s multiple class plan, adopted pursuant to Rule 18f-3 under the 1940 Act, the classes differ in that, among other things, Service Class shares of the Portfolio pay a combined distribution and service fee of 0.25% of average daily net assets attributable to Service Class shares of the Portfolio to the Distributor (as defined in Note 3(B)) pursuant to a plan adopted in accordance with Rule 12b-1 under the 1940 Act. Contract owners of variable annuity contracts purchased after June 2, 2003, are permitted to invest only in the Service Class shares.
The Portfolio’s investment objective is to seeklong-term growth of capital.
Note 2–Significant Accounting Policies
The Portfolio is an investment company and accordingly follows the investment company accounting and reporting guidance of the Financial Accounting Standards Board (“FASB”) Accounting Standard CodificationTopic 946 Financial Services—Investment Companies. The Portfolio prepares its financial statements in accordance with generally accepted accounting principles (“GAAP”) in the United States of America and follows the significant accounting policies described below.
(A) Securities Valuation. Investments are usually valued as of the close of regular trading on the New York Stock Exchange (the “Exchange”) (usually 4:00 p.m. Eastern time) on each day the Portfolio is open for business (“valuation date”).
The Board of Trustees of the Fund (the “Board”) adopted procedures establishing methodologies for the valuation of the Portfolio’s securities and other assets and delegated the responsibility for valuation
determinations under those procedures to the Valuation Committee of the Fund (the “Valuation Committee”). The Board authorized the Valuation Committee to appoint a Valuation Subcommittee (the “Subcommittee”) to deal in the first instance with establishing the prices of securities for which market quotations are not readily available or the prices of which are not otherwise readily determinable under these procedures. The Subcommittee meets (in person, via electronic mail or via teleconference) on an as-needed basis. Subsequently, the Valuation Committee meets to ensure that actions taken by the Subcommittee were appropriate. The procedures state that, subject to the oversight of the Board and unless otherwise noted, the responsibility for theday-to-day valuation of portfolio assets (including fair value measurements for the Portfolio’s assets and liabilities) rests with New York Life Investment Management LLC (“New York Life Investments” or the “Manager”), aided to whatever extent necessary by the Subadvisor (as defined in Note 3(A)).
To assess the appropriateness of security valuations, the Manager, the Subadvisor or the Portfolio’s third-party service provider, who is subject to oversight by the Manager, regularly compares prior day prices, prices on comparable securities and the sale prices to the prior and current day prices and challenges prices with changes exceeding certain tolerance levels with third-party pricing services or broker sources. For those securities valued through either a standardized fair valuation methodology or a fair valuation measurement, the Subcommittee deals in the first instance with such valuation and the Valuation Committee reviews and affirms, if appropriate, the reasonableness of the valuation based on such methodologies and measurements on a regular basis after considering information that is reasonably available and deemed relevant by the Valuation Committee. Any action taken by the Subcommittee with respect to the valuation of a portfolio security or other asset is submitted for review and ratification (if appropriate) to the Valuation Committee and the Board at the next regularly scheduled meeting.
“Fair value” is defined as the price the Portfolio would reasonably expect to receive upon selling an asset or liability in an orderly transaction to an independent buyer in the principal or most advantageous market for the asset or liability. Fair value measurements are determined within a framework that establishes a three-tier hierarchy which maximizes the use of observable market data and minimizes the use of unobservable inputs to establish a classification of fair value measurements for disclosure purposes. “Inputs” refer broadly to the assumptions that market participants would use in pricing the asset or liability, including assumptions about risk, such as the risk inherent in a particular valuation technique used to measure fair value using a pricing model and/or the risk inherent in the inputs for the valuation technique. Inputs may be observable or unobservable. Observable inputs reflect the assumptions market participants would use in pricing the asset or liability based on market data obtained from sources independent of the Portfolio. Unobservable inputs reflect the Portfolio’s own assumptions about the assumptions market participants would use in pricing the asset or liability based on the information available. The inputs or methodology used for valuing assets or liabilities may not be an indication of the risks associated with investing in those assets or liabilities. The three-tier hierarchy of inputs is summarized below.
| • | | Level 1—quoted prices in active markets for an identical asset or liability |
| | |
| 16 | | MainStay VP MacKay International Equity Portfolio |
| • | | Level 2—other significant observable inputs (including quoted prices for a similar asset or liability in active markets, interest rates and yield curves, prepayment speeds, credit risk, etc.) |
| • | | Level 3—significant unobservable inputs (including the Portfolio’s own assumptions about the assumptions that market participants would use in measuring fair value of an asset or liability) |
The level of an asset or liability within the fair value hierarchy is based on the lowest level of an input, both individually and in the aggregate, that is significant to the fair value measurement. As of June 30, 2019, the aggregate value by input level of the Portfolio’s assets and liabilities is included at the end of the Portfolio’s Portfolio of Investments.
The Portfolio may use third-party vendor evaluations, whose prices may be derived from one or more of the following standard inputs, among others:
| | |
• Broker/dealer quotes | | • Benchmark securities |
• Two-sided markets | | • Reference data (corporate actions or material event notices) |
• Bids/offers | | • Monthly payment information |
• Industry and economic events | | • Reported trades |
An asset or liability for which market values cannot be measured using the methodologies described above is valued by methods deemed reasonable in good faith by the Valuation Committee, following the procedures established by the Board, to represent fair value. Under these procedures, the Portfolio generally uses a market-based approach which may use related or comparable assets or liabilities, recent transactions, market multiples, book values and other relevant information. The Portfolio may also use an income-based valuation approach in which the anticipated future cash flows of the asset or liability are discounted to calculate fair value. Discounts may also be applied due to the nature and/or duration of any restrictions on the disposition of the asset or liability. Fair value represents a good faith approximation of the value of a security. Fair value determinations involve the consideration of a number of subjective factors, an analysis of applicable facts and circumstances and the exercise of judgment. As a result, it is possible that the fair value for a security determined in good faith in accordance with the Portfolio’s valuation procedures may differ from valuations for the same security determined by other funds using their own valuation procedures. Although the Portfolio’s valuation procedures are designed to value a security at the price the Portfolio may reasonably expect to receive upon the security’s sale in an orderly transaction, there can be no assurance that any fair value determination thereunder would, in fact, approximate the amount that the Portfolio would actually realize upon the sale of the security or the price at which the security would trade if a reliable market price were readily available. During thesix-month period ended June 30, 2019, there were no material changes to the fair value methodologies.
Securities which may be valued in this manner include, but are not limited to: (i) a security for which trading has been halted or suspended; (ii) a debt security that has recently gone into default and for which there is not a current market quotation; (iii) a security of an issuer that has entered into a restructuring; (iv) a security that has been delisted from a national exchange; (v) a security for which the market price is not readily available from a third-party pricing source or, if so provided,
does not, in the opinion of the Manager or the Subadvisor, reflect the security’s market value; (vi) a security subject to trading collars for which no or limited trading takes place; and (vii) a security whose principal market has been temporarily closed at a time when, under normal conditions, it would be open. Securities valued in this manner are generally categorized as Level 3 in the hierarchy. As of June 30, 2019, there were no securities held by the Portfolio that were fair valued in such a manner.
Certain securities held by the Portfolio may principally trade in foreign markets. Events may occur between the time the foreign markets close and the time at which the Portfolio’s NAVs are calculated. These events may include, but are not limited to, situations relating to a single issuer in a market sector, significant fluctuations in U.S. or foreign markets, natural disasters, armed conflicts, governmental actions or other developments not tied directly to the securities markets. Should the Manager or the Subadvisor conclude that such events may have affected the accuracy of the last price of such securities reported on the local foreign market, the Subcommittee may, pursuant to procedures adopted by the Board, adjust the value of the local price to reflect the estimated impact on the price of such securities as a result of such events. In this instance, securities are generally categorized as Level 3 in the hierarchy. Additionally, certain foreign equity securities are also fair valued whenever the movement of a particular index exceeds certain thresholds. In such cases, the securities are fair valued by applying factors provided by a third-party vendor in accordance with valuation procedures adopted by the Board and are generally categorized as Level 2 in the hierarchy. As of June 30, 2019, no foreign equity securities held by the Portfolio were fair valued in such a manner.
Equity securities, including exchange-traded funds (“ETFs”), are valued at the last quoted sales prices as of the close of regular trading on the relevant exchange on each valuation date. Securities that are not traded on the valuation date are valued at the mean of the last quoted bid and ask prices. Prices are normally taken from the principal market in which each security trades. These securities are generally categorized as Level 1 in the hierarchy.
Investments in mutual funds, including money market funds, are valued at their respective NAVs as of the close of the Exchange on the valuation date. These securities are generally categorized as Level 1 in the hierarchy.
Temporary cash investments acquired in excess of 60 days to maturity at the time of purchase are valued using the latest bid prices or using valuations based on a matrix system (which considers such factors as security prices, yields, maturities and ratings), both as furnished by independent pricing services. Other temporary cash investments which mature in 60 days or less at the time of purchase (“Short-Term Investments”) are valued using the amortized cost method of valuation, unless the use of such method would be inappropriate. The amortized cost method involves valuing a security at its cost on the date of purchase and thereafter assuming a constant amortization to maturity of the difference between such cost and the value on maturity date. Amortized cost approximates the current fair value of a security. Securities valued using the amortized cost method are not valued using quoted prices in an active market and are generally categorized as Level 2 in the hierarchy.
Notes to Financial Statements(Unaudited) (continued)
The information above is not intended to reflect an exhaustive list of the methodologies that may be used to value portfolio investments. The valuation procedures permit the use of a variety of valuation methodologies in connection with valuing portfolio investments. The methodology used for a specific type of investment may vary based on the market data available or other considerations. The methodologies summarized above may not represent the specific means by which portfolio investments are valued on any particular business day.
(B) Income Taxes. The Portfolio’s policy is to comply with the requirements of the Internal Revenue Code of 1986, as amended (the “Internal Revenue Code”), applicable to regulated investment companies and to distribute all of its taxable income to the shareholders of the Portfolio within the allowable time limits. Therefore, no federal, state and local income tax provisions are required.
Management evaluates the Portfolio’s tax positions to determine if the tax positions taken meet the minimum recognition threshold in connection with accounting for uncertainties in income tax positions taken or expected to be taken for the purposes of measuring and recognizing tax liabilities in the financial statements. Recognition of tax benefits of an uncertain tax position is permitted only to the extent the position is “more likely than not” to be sustained assuming examination by taxing authorities. Management has analyzed the Portfolio’s tax positions taken on federal, state and local income tax returns for all open tax years (for up to three tax years) and has concluded that no provisions for federal, state and local income tax are required in the Portfolio’s financial statements. The Portfolio’s federal, state and local income tax and federal excise tax returns for tax years for which the applicable statutes of limitations have not expired are subject to examination by the Internal Revenue Service and state and local departments of revenue.
(C) Foreign Taxes. The Portfolio may be subject to foreign taxes on income and other transaction-based taxes imposed by certain countries in which it invests. A portion of the taxes on gains on investments or currency purchases/repatriation may be reclaimable. The Portfolio will accrue such taxes and reclaims as applicable, based upon its current interpretation of tax rules and regulations that exist in the markets in which it invests.
The Portfolio may be subject to taxation on realized capital gains, repatriation proceeds and other transaction-based taxes imposed by certain countries in which it invests. The Portfolio will accrue such taxes as applicable based upon its current interpretation of tax rules and regulations that exist in the market in which it invests. Capital gains taxes relating to positions still held are reflected as a liability on the Statement of Assets and Liabilities, as well as an adjustment to the Portfolio’s net unrealized appreciation (depreciation). Taxes related to capital gains realized, if any, are reflected as part of net realized gain (loss) in the Statement of Operations. Changes in tax liabilities related to capital gains taxes on unrealized investment gains, if any, are reflected as part of the change in net unrealized appreciation (depreciation) on investments in the Statement of Operations. Transaction-based charges are generally assessed as a percentage of the transaction amount.
(D) Dividends and Distributions to Shareholders. Dividends and distributions are recorded on the ex-dividend date. The Portfolio intends to declare and pay dividends from net investment income and distributions from net realized capital and currency gains, if any, at least
annually. Unless the shareholder elects otherwise, all dividends and distributions are reinvested in the same class of shares of the Portfolio, at NAV. Dividends and distributions to shareholders are determined in accordance with federal income tax regulations and may differ from determinations using GAAP.
(E) Security Transactions and Investment Income. The Portfolio records security transactions on the trade date. Realized gains and losses on security transactions are determined using the identified cost method. Dividend income is recognized on the ex-dividend date; net of any foreign tax withheld at the source, and interest income is accrued as earned using the effective interest rate method.
Investment income and realized and unrealized gains and losses on investments of the Portfolio are allocated pro rata to the separate classes of shares based upon their relative net assets on the date the income is earned or realized and unrealized gains and losses are incurred.
(F) Expenses. Expenses of the Fund are allocated to the individual Portfolios in proportion to the net assets of the respective Portfolios when the expenses are incurred, except where direct allocations of expenses can be made. Expenses (other than fees incurred under the distribution and service plans, further discussed in Note 3(B), which are charged directly to the Service Class shares) are allocated to separate classes of shares pro rata based upon their relative net assets on the date the expenses are incurred. The expenses borne by the Portfolio, including those of related parties to the Portfolio, are shown in the Statement of Operations.
Additionally, the Portfolio may invest in ETFs and mutual funds, which are subject to management fees and other fees that may cause the costs of investing in ETFs and mutual funds to be greater than the costs of owning the underlying securities directly. These indirect expenses of ETFs and mutual funds are not included in the amounts shown as expenses in the Portfolio’s Statement of Operations or in the expense ratios included in the Financial Highlights.
(G) Use of Estimates. In preparing financial statements in conformity with GAAP, management makes estimates and assumptions that affect the reported amounts and disclosures in the financial statements. Actual results could differ from those estimates.
(H) Repurchase Agreements. The Portfolio may enter into repurchase agreements (i.e., buy a security from another party with the agreement that it be sold back in the future) to earn income. The Portfolio may enter into repurchase agreements only with counterparties, usually financial institutions, that are deemed by the Manager or the Subadvisor to be creditworthy, pursuant to guidelines established by the Board. During the term of any repurchase agreement, the Manager or the Subadvisor will continue to monitor the creditworthiness of the counterparty. Under the 1940 Act, repurchase agreements are considered to be collateralized loans by the Portfolio to the counterparty secured by the securities transferred to the Portfolio.
Repurchase agreements are subject to counterparty risk, meaning the Portfolio could lose money by the counterparty’s failure to perform under the terms of the agreement. The Portfolio mitigates this risk by ensuring the repurchase agreement is collateralized by cash, U.S. government securities, fixed income securities and/or other securities.
| | |
| 18 | | MainStay VP MacKay International Equity Portfolio |
The collateral is held by the Portfolio’s custodian and valued daily on a mark to market basis to determine if the value, including accrued interest, exceeds the repurchase price. In the event of the counterparty’s default on the obligation to repurchase, the Portfolio has the right to liquidate the collateral and apply the proceeds in satisfaction of the obligation. Under certain circumstances, such as in the event of default or bankruptcy by the counterparty, realization and/or retention of the collateral may be limited or subject to delay, to legal proceedings and possible realized loss to the Portfolio. As of June 30, 2019, the Portfolio did not hold any repurchase agreements.
(I) Foreign Currency Transactions. The Portfolio’s books and records are maintained in U.S. dollars. Prices of securities denominated in foreign currency amounts are translated into U.S. dollars at the mean between the buying and selling rates last quoted by any major U.S. bank at the following dates:
| (i) | market value of investment securities, other assets and liabilities—at the valuation date; and |
| (ii) | purchases and sales of investment securities, income and expenses—at the date of such transactions. |
The assets and liabilities that are denominated in foreign currency amounts are presented at the exchange rates and market values at the close of the period. The realized and unrealized changes in net assets arising from fluctuations in exchange rates and market prices of securities are not separately presented.
Net realized gain (loss) on foreign currency transactions represents net gains and losses on foreign currency forward contracts, net currency gains or losses realized as a result of differences between the amounts of securities sale proceeds or purchase cost, dividends, interest and withholding taxes as recorded on the Portfolio’s books, and the U.S. dollar equivalent amount actually received or paid. Net currency gains or losses from valuing such foreign currency denominated assets and liabilities, other than investments at valuation date exchange rates, are reflected in unrealized foreign exchange gains or losses.
(J) Securities Lending. In order to realize additional income, the Portfolio may engage in securities lending, subject to the limitations set forth in the 1940 Act and relevant guidance by the staff of the Securities and Exchange Commission (“SEC”). In the event the Portfolio does engage in securities lending, the Portfolio will lend through its custodian, State Street Bank and Trust Company (“State Street”), acting as securities lending agent on behalf of the Portfolio. State Street will manage the Portfolio’s collateral in accordance with the securities lending agency agreement between the Portfolio and State Street, and indemnify the Portfolio against counterparty risk. The loans will be collateralized by cash (which may be invested in a money market fund) and/ornon-cash collateral (which may include, U.S. Treasury securities and/or U.S. Government Agency securities issued or guaranteed by the United States government or its agencies or instrumentalities) at least equal at all times to the market value of the securities loaned. The Portfolio may bear the risk of delay in recovery of, or loss of rights in, the securities loaned should the borrower of the securities experience financial difficulty. The Portfolio may also record a realized gain or loss on securities deemed sold due to a borrower’s inability to return securities on loan. The Portfolio bears the risk of any loss on investment of cash collateral. The Portfolio will receive compensation for lending its
securities in the form of fees or it will retain a portion of interest on the investment of any cash collateral. The Portfolio will also continue to receive interest and dividends on the securities loaned and any gain or loss in the market price of the securities loaned that may occur during the term of the loan will be for the account of the Portfolio. Income earned from securities lending activities, if any, is reflected in the Statement of Operations. As of June 30, 2019, the Portfolio had securities on loan with an aggregate market value of $101,672 and receivednon-cash collateral in the form of U.S. Treasury securities with a value of $112,809.
(K) Foreign Securities Risk. The Portfolio invests in foreign securities, which carry certain risks that are in addition to the usual risks inherent in domestic securities. These risks include those resulting from currency fluctuations, future adverse political or economic developments and possible imposition of currency exchange blockages or other foreign governmental laws or restrictions. These risks are likely to be greater in emerging markets than in developed markets. The ability of issuers of securities held by the Portfolio to meet their obligations may be affected by, among other things, economic or political developments in a specific country, industry or region.
(L) Indemnifications. Under the Fund’s organizational documents, its officers and trustees are indemnified against certain liabilities that may arise out of performance of their duties to the Fund. Additionally, in the normal course of business, the Portfolio enters into contracts with third-party service providers that contain a variety of representations and warranties and which may provide general indemnifications. The Portfolio’s maximum exposure under these arrangements is unknown, as this would involve future claims that may be made against the Portfolio that have not yet occurred. Based on experience, management is of the view that the risk of loss in connection with these potential indemnification obligations is remote. However, there can be no assurance that material liabilities related to such obligations will not arise in the future, which could adversely impact the Portfolio.
Note 3–Fees and Related Party Transactions
(A) Manager and Subadvisor. New York Life Investments, a registered investment adviser and an indirect,wholly-owned subsidiary of New York Life, serves as the Portfolio’s Manager, pursuant to an Amended and Restated Management Agreement (“Management Agreement”). The Manager provides offices, conducts clerical, recordkeeping and bookkeeping services and keeps most of the financial and accounting records required to be maintained by the Portfolio. Except for the portion of salaries and expenses that are the responsibility of the Portfolio, the Manager pays the salaries and expenses of all personnel affiliated with the Portfolio and certain operational expenses of the Portfolio. The Portfolio reimburses New York Life Investments in an amount equal to a portion of the compensation of the Chief Compliance Officer attributable to the Portfolio. MacKay Shields LLC (“MacKay Shields” or the “Subadvisor”), a registered investment adviser and an indirect,wholly-owned subsidiary of New York Life, serves as Subadvisor to the Portfolio and is responsible for theday-to-day portfolio management of the Portfolio. Pursuant to the terms of an Amended and Restated Subadvisory Agreement (“Subadvisory Agreement”) between New York Life Investments and MacKay Shields, New York Life Investments pays for the services of the Subadvisor.
Notes to Financial Statements(Unaudited) (continued)
The Fund, on behalf of the Portfolio, pays New York Life Investments in its capacity as the Portfolio’s investment manager and administrator, pursuant to the Management Agreement, a monthly fee for the services performed and the facilities furnished at an annual rate of the Portfolio’s average daily net assets as follows: 0.89% up to $500 million; and 0.85% in excess of $500 million. During the six-month period ended June 30, 2019, the effective management fee rate was 0.89%.
During the six-month period ended June 30, 2019, New York Life Investments earned fees from the Portfolio in the amount of $1,991,639, and paid the Subadvisor in the amount of $995,820.
State Street providessub-administration andsub-accounting services to the Portfolio pursuant to an agreement with New York Life Investments. These services include calculating the daily NAVs of the Portfolio, maintaining the general ledger andsub-ledger accounts for the calculation of the Portfolio’s NAVs and assisting New York Life Investments in conducting various aspects of the Portfolio’s administrative operations. For providing these services to the Portfolio, State Street is compensated by New York Life Investments.
Pursuant to an agreement between the Fund and New York Life Investments, New York Life Investments is responsible for providing or
procuring certain regulatory reporting services for the Portfolio. The Portfolio will reimburse New York Life Investments for the actual costs incurred by New York Life Investments in connection with providing or procuring these services for the Portfolio.
(B) Distribution and Service Fees. The Fund, on behalf of the Portfolio, has entered into a distribution agreement with NYLIFE Distributors LLC (the “Distributor”), an indirect,wholly-owned subsidiary of New York Life. The Portfolio has adopted a distribution plan (the “Plan”) in accordance with the provisions of Rule 12b-1 under the 1940 Act. Under the Plan, the Distributor has agreed to provide, through its affiliates or independent third parties, various distribution-related, shareholder and administrative support services to the Service Class shareholders. For its services, the Distributor is entitled to a combined distribution and service fee accrued daily and paid monthly at an annual rate of 0.25% of the average daily net assets attributable to the Service Class shares of the Portfolio.
(C) Investments in Affiliates (in 000’s). During the six-month period ended June 30, 2019, purchases and sales transactions, income earned from investments and shares held of investment companies managed by New York Life Investments or its affiliates were as follows:
| | | | | | | | | | | | | | | | | | | | | | | | | | | | | | | | | | | | |
Affiliated Investment Company | | Value,
Beginning of
Period | | | Purchases
at Cost | | | Proceeds
from
Sales | | | Net
Realized
Gain/
(Loss)
on Sales | | | Change in
Unrealized
Appreciation/
(Depreciation) | | | Value,
End of
Period | | | Dividend
Income | | | Other
Distributions | | | Shares
End of
Period | |
MainStay U.S. Government Liquidity Fund | | $ | 880 | | | $ | 14,731 | | | $ | (14,890 | ) | | $ | — | | | $ | — | | | $ | 721 | | | $ | 8 | | | $ | — | | | | 721 | |
Note 4–Federal Income Tax
As of June 30, 2019, the cost and unrealized appreciation (depreciation) of the Portfolio’s investment portfolio, including applicable derivative contracts and other financial instruments, as determined on a federal income tax basis, were as follows:
| | | | | | | | | | | | | | | | |
| | | Federal Tax
Cost | | | Gross
Unrealized
Appreciation | | | Gross
Unrealized
(Depreciation) | | | Net
Unrealized
Appreciation/
(Depreciation) | |
Investments in Securities | | $ | 418,420,485 | | | $ | 57,011,550 | | | $ | (28,535,483 | ) | | $ | 28,476,067 | |
During the year ended December 31, 2018, the tax character of distributions paid as reflected in the Statements of Changes in Net Assets was as follows:
| | |
|
| 2018 |
Tax-Based
Distributions
from Ordinary
Income | | Tax-Based
Distributions
from Long-
Term Gains |
| |
| $4,899,861 | | $8,652,792 |
Note 5–Custodian
State Street is the custodian of cash and securities held by the Portfolio. Custodial fees are charged to the Portfolio based on the Portfolio’s net assets and/or the market value of securities held by the Portfolio and the number of certain transactions incurred by the Portfolio.
Note 6–Line of Credit
The Portfolio and certain other funds managed by New York Life Investments maintain a line of credit with a syndicate of banks in order to secure a source of funds for temporary purposes to meet unanticipated or excessive redemption requests.
Effective July 30, 2019, under the credit agreement (the “Credit Agreement”), the aggregate commitment amount is $600,000,000 with an additional uncommitted amount of $100,000,000. The commitment fee is an annual rate of 0.15% of the average commitment amount payable quarterly, regardless of usage, to State Street, who serves as the agent to the syndicate. The commitment fee is allocated among the Portfolio and certain other funds managed by New York Life Investments based upon their respective net assets and other factors. Interest on any revolving credit loan is charged based upon the Federal Funds Rate or the one-month London Interbank Offered Rate (“LIBOR”), whichever is higher. The Credit Agreement expires on July 28, 2020, although the Portfolio, certain other funds managed by New York Life Investments and the syndicate of banks may renew the Credit Agreement for an additional year on the same or different terms. Prior to July 30, 2019, the aggregate commitment amount and the commitment fee were the same as those under the current Credit Agreement. During the six-month period ended June 30, 2019, there were no borrowings made or outstanding with respect to the Portfolio under the Credit Agreement.
Note 7–Interfund Lending Program
Pursuant to an exemptive order issued by the SEC, the Portfolio, along with certain other funds managed by New York Life Investments, may
| | |
| 20 | | MainStay VP MacKay International Equity Portfolio |
participate in an interfund lending program. The interfund lending program provides an alternative credit facility that permits the Portfolio and certain other funds managed by New York Life Investments to lend or borrow money for temporary purposes directly to or from one another subject to the conditions of the exemptive order. During the six-month period ended June 30, 2019, there were no interfund loans made or outstanding with respect to the Portfolio.
Note 8–Purchases and Sales of Securities (in 000’s)
During the six-month period ended June 30, 2019, purchases and sales of securities, other thanshort-term securities, were $105,794 and $107,065, respectively.
Note 9–Capital Share Transactions
Transactions in capital shares for the six-month period ended June 30, 2019 and the year ended December 31, 2018, were as follows:
| | | | | | | | |
Initial Class | | Shares | | | Amount | |
| | |
Six-month period ended June 30, 2019: | | | | | | | | |
Shares sold | | | 687,245 | | | $ | 11,198,251 | |
Shares redeemed | | | (501,942 | ) | | | (8,209,041 | ) |
| | | | |
Net increase (decrease) | | | 185,303 | | | $ | 2,989,210 | |
| | | | |
Year ended December 31, 2018: | | | | | | | | |
Shares sold | | | 1,475,541 | | | $ | 25,782,475 | |
Shares issued to shareholders in reinvestment of dividends and distributions | | | 312,024 | | | | 5,332,706 | |
Shares redeemed | | | (2,491,904 | ) | | | (43,806,947 | ) |
| | | | |
Net increase (decrease) | | | (704,339 | ) | | $ | (12,691,766 | ) |
| | | | |
| | |
| | | | | | | | |
Service Class | | Shares | | | Amount | |
Six-month period ended June 30, 2019: | | | | | | | | |
Shares sold | | | 1,178,257 | | | $ | 18,889,584 | |
Shares redeemed | | | (1,308,704 | ) | | | (21,150,918 | ) |
| | | | |
Net increase (decrease) | | | (130,447 | ) | | $ | (2,261,334 | ) |
| | | | |
Year ended December 31, 2018: | | | | | | | | |
Shares sold | | | 2,365,452 | | | $ | 40,301,374 | |
Shares issued to shareholders in reinvestment of dividends and distributions | | | 484,842 | | | | 8,219,947 | |
Shares redeemed | | | (3,408,644 | ) | | | (58,491,162 | ) |
| | | | |
Net increase (decrease) | | | (558,350 | ) | | $ | (9,969,841 | ) |
| | | | |
Note 10–Recent Accounting Pronouncement
To improve the effectiveness of fair value disclosure requirements, the Financial Accounting Standards Board recently issued Accounting Standard Update (ASU)2018-13, Fair Value Measurement Disclosure Framework—Changes to the Disclosure Requirements for Fair Value Measurement (ASU2018-13), which adds, removes, and modifies certain aspects relating to fair value disclosure. ASU2018-13 is effective for interim and annual reporting periods beginning after December 15, 2019; early adoption of the additions relating toASU 2018-13 is not required. Management has evaluated the implications of certain other provisions of the ASU and has determined to early adopt aspects related to the removal and modifications of certain fair value measurement disclosures under the ASU effective immediately. At this time, management is evaluating the implications of certain other provisions of the ASU related to new disclosure requirements and any impact on the financial statement disclosures has not yet been determined.
Note 11–Subsequent Events
In connection with the preparation of the financial statements of the Portfolio as of and for the six-month period ended June 30, 2019, events and transactions subsequent to June 30, 2019, through the date the financial statements were issued have been evaluated by the Portfolio’s management for possible adjustment and/or disclosure. No subsequent events requiring financial statement adjustment or disclosure have been identified.
Proxy Voting Policies and Procedures and Proxy Voting Record
A description of the policies and procedures that New York Life Investments uses to vote proxies related to the Portfolio’s securities is available without charge, upon request (i) by calling800-598-2019; (ii) by visiting New York Life Investments website at https://www.nylinvestments.com/mainstay/products-and-performance/mainstay-vp-funds-trust; or (iii) by visiting the SEC’s website at www.sec.gov.
The Portfolio is required to file with the SEC its proxy voting record for the12-month period ending June 30 on Form N-PX. The Portfolio’s most recent Form N-PX or proxy voting record is available free of charge upon request (i) by calling800-598-2019; (ii) by visiting New York Life Investments website at https://www.nylinvestments.com/mainstay/products-and-performance/mainstay-vp-funds-trust; or (iii) by visiting the SEC’s website atwww.sec.gov.
Shareholder Reports and Quarterly Portfolio Disclosure
The Portfolio is required to file its complete schedule of portfolio holdings with the SEC 60 days after each fiscal quarter onForm N-PORT. The Portfolio’s holdings report is available without charge upon request (i) by calling800-598-2019; (ii) by visiting New York Life Investments website at https://www.nylinvestments.com/mainstay/products-and-performance/mainstay-vp-funds-trust; or (iii) on the SEC’s website at www.sec.gov.
| | |
| 22 | | MainStay VP MacKay International Equity Portfolio |
MainStay VP Portfolios
MainStay VP offers a wide range of Portfolios. The full array of MainStay VP offerings is listed here, with information about the manager, subadvisors, legal counsel, and independent registered public accounting firm.
Equity Portfolios
MainStay VP Eagle Small Cap Growth Portfolio
MainStay VP Emerging Markets Equity Portfolio
MainStay VP Epoch U.S. Equity Yield Portfolio
MainStay VP Fidelity Institutional AM® Utilities Portfolio†
MainStay VP Large Cap Growth Portfolio
MainStay VP MacKay Common Stock Portfolio
MainStay VP MacKay Growth Portfolio
MainStay VP MacKay International Equity Portfolio
MainStay VP MacKay Mid Cap Core Portfolio
MainStay VP MacKay S&P 500 Index Portfolio
MainStay VP MacKay Small Cap Core Portfolio
MainStay VP Mellon Natural Resources Portfolio
MainStay VP T. Rowe Price Equity Income Portfolio
Mixed Asset Portfolios
MainStay VP Balanced Portfolio
MainStay VP Income Builder Portfolio
MainStay VP Janus Henderson Balanced Portfolio
MainStay VP MacKay Convertible Portfolio
Income Portfolios
MainStay VP Bond Portfolio
MainStay VP Floating Rate Portfolio
MainStay VP Indexed Bond Portfolio
MainStay VP MacKay Government Portfolio
MainStay VP MacKay High Yield Corporate Bond Portfolio
MainStay VP MacKay Unconstrained Bond Portfolio
MainStay VP PIMCO Real Return Portfolio
Money Market
MainStay VP U.S. Government Money Market Portfolio
Alternative
MainStay VP Cushing Renaissance Advantage Portfolio
MainStay VP IQ Hedge Multi-Strategy Portfolio
Asset Allocation Portfolios
MainStay VP Conservative Allocation Portfolio
MainStay VP Growth Allocation Portfolio
MainStay VP Moderate Allocation Portfolio
MainStay VP Moderate Growth Allocation Portfolio
Manager
New York Life Investment Management LLC
New York, New York
Subadvisors
Candriam Belgium*
Brussels, Belgium
Cushing Asset Management, LP
Dallas, Texas
Eagle Asset Management, Inc.
St Petersburg, Florida
Epoch Investment Partners, Inc.
New York, New York
FIAM LLC
Smithfield, Rhode Island
IndexIQ Advisors LLC*
New York, New York
Janus Capital Management LLC
Denver, Colorado
MacKay Shields LLC*
New York, New York
Mellon Investments Corporation
Boston, Massachusetts
NYL Investors LLC*
New York, New York
Pacific Investment Management Company LLC
Newport Beach, California
T. Rowe Price Associates, Inc.
Baltimore, Maryland
Winslow Capital Management, LLC
Minneapolis, Minnesota
Distributor
NYLIFE Distributors LLC*
Jersey City, New Jersey
Custodian
State Street Bank and Trust Company
Boston, Massachusetts
Independent Registered Public Accounting Firm
PricewaterhouseCoopers LLP
New York, New York
Legal Counsel
Dechert LLP
Washington, District of Columbia
Some Portfolios may not be available in all products.
| † | Fidelity Institutional AM is a registered trade mark of FMR LLC. Used with permission. |
| * | An affiliate of New York Life Investment Management LLC |
Not part of the Semiannual Report
2019 Semiannual Report
This report is for the general information of New York Life Variable Annuities and NYLIAC Variable Universal Life Insurance Products policyowners. It must be preceded or accompanied by the appropriate product(s) and funds prospectuses if it is given to anyone who is not an owner of a New York Life variable annuity policy or a NYLIAC Variable Universal Life Insurance Product. This report does not offer for sale or solicit orders to purchase securities.
The performance data quoted in this report represents past performance. Past performance is no guarantee of future results. Due to market volatility and other factors, current performance may be lower or higher than the figures shown. The most recent month-end performance summary for your variable annuity or variable life policy is available by calling 800-598-2019 and is updated periodically on www.newyorklife.com.
The New York Life Variable Annuities and NYLIAC Variable Universal Life Insurance Products are issued by New York Life Insurance and Annuity Corporation (a Delaware Corporation) and distributed by NYLIFE Distributors LLC (Member FINRA/SIPC).
New York Life Insurance Company
New York Life Insurance and Annuity Corporation (NYLIAC) (A Delaware Corporation)
51 Madison Avenue, Room 551
New York, NY 10010
www.newyorklife.com
Printed on recycled paper
nylinvestments.com
NYLIFE Distributors LLC, 30 Hudson Street, Jersey City, NJ 07302
New York Life Investment Management LLC is the investment manager to the MainStay VP Funds Trust
©2019 by NYLIFE Distributors LLC. All rights reserved.
You may obtain copies of the Prospectus and the Statement of Additional Information free of charge, upon request, by callingtoll-free 800-598-2019 or writing to New York Life Insurance and Annuity Corporation, 51 Madison Avenue, New York, NY 10010.
| | | | |
| | | |
| Not FDIC Insured | | No Bank Guarantee | | May Lose Value |
| | | | |
| 1781629 | | | | MSVPIE10-08/19 (NYLIAC) NI523 |
MainStay VP Large Cap Growth Portfolio
Message from the President and Semiannual Report
Unaudited | June 30, 2019

Beginning on January 1, 2021, as permitted by regulations adopted by the Securities and Exchange Commission, paper copies of the MainStay VP Portfolio annual and semi-annual shareholder reports may no longer be sent by mail, unless you specifically request paper copies of the reports from the insurance company that offers your policy. Instead, the reports will be made available online, and you will be notified by mail each time a report is posted and provided with a website link to access the report. Instructions for requesting paper copies will be provided by your insurance company.
If you already elected to receive shareholder reports electronically, you will not be affected by this change and you need not take any action. At any time, you may elect to receive reports and other communications from the insurance company electronically by following the instructions provided by the insurance company.
You may elect to receive all future shareholder reports in paper form free of charge. You can inform the insurance company that you wish to receive paper copies of reports by following the instructions provided by the insurance company. Your election to receive reports in paper form will apply to all portfolio companies available under your contract.
| | | | | | | | |
| | | | | |
| Not FDIC/NCUA Insured | | Not a Deposit | | May Lose Value | | No Bank Guarantee | | Not Insured by Any Government Agency |

This page intentionally left blank
Message from the President
Most equity and fixed-income markets in the United States and around the world advanced in the face of conflicting political and macroeconomic forces during thesix-month period ended June 30, 2019.
The reporting period began on the heels of tumultuous December 2018, during which equities and equity-sensitive bonds spiked sharply lower on concerns regarding the pace of economic growth, a U.S. government shutdown and the potential impact of trade disputes between the United States and other nations, particularly China. Markets recovered quickly in early 2019 as trade tensions eased, the government reopened and the U.S. Federal Reserve Board (Fed) adopted a more patient tone regarding the future direction of interest rates. Markets moved broadly higher from January through April, supported by encouraging economic data and generally strong corporate earnings.
During the first four months of the reporting period, the improving economic environment encouraged investors to favor areas of the market viewed as offering greater return potential along with higher risks. Among U.S. stocks, cyclical, growth-oriented sectors tended to outperform more defensive, value-oriented sectors, whilelarge-cap stocks outperformed theirsmaller-cap counterparts. Within the S&P 500® Index, the information technology sector led the market’s advance, followed by communication services, consumer discretionary and consumer staples. Industrials, utilities, financials, materials, real estate and energy produced more modest gains. While some international equity markets outperformed or underperformed the U.S. market, on average international stocks mirrored the performance of their U.S. counterparts. Fixed-income securities gained ground as well, albeit along a more gradual trajectory. Among U.S. fixed-income instruments, corporate issues generally outperformed government bonds, with lower credit quality, higher yielding securities leading the sector’s advance. Long-term U.S. Treasury bond yields proved particularly weak, with
10-year yields dipping at times below3-month yields, reflecting investors’ continued concerns about domestic economic growth.
May 2019 saw a return of uncertainty and volatility. Trade discussions between the United States and China faltered, driving global equity prices lower. Government bond prices rose as investors sought safe havens. June brought yet anotherU-turn as equity prices climbed again after comments from the Fed raised hopes of an interest rate cut in response to weak economic data. Stock and bond prices rose, with U.S. equity markets ending the reporting period in record territory.
We are pleased to see renewed signs of strength in broad areas of the financial market. At the same time, we remained sharply focused on providing you, as a MainStay VP investor, with the experienced and disciplined fund management that we believe underpins an effective, long-term investment strategy. Whatever tomorrow’s investment environment brings, you can rely on our portfolio managers to pursue the objectives of their individual Portfolios as outlined in the prospectus with the energy and dedication you have come to expect.
The report that follows contains additional information on the market events, investment decisions and specific securities that shaped your VP Portfolio’s performance during the six months ended June 30, 2019. We encourage you to read the report carefully and use it to evaluate your Portfolio’s performance in light of your long-range financial plan.
Sincerely,

Kirk C. Lehneis
President
The opinions expressed are as of the date of this report and are subject to change. There is no guarantee that any forecast made will come to pass. This material does not constitute investment advice and is not intended as an endorsement of any specific investment. Past performance is no guarantee of future results.
Not part of the Semiannual Report
Table of Contents
Investors should refer to the Portfolio’s Summary Prospectus and/or Prospectus and consider the Portfolio’s investment objectives, strategies, risks, charges and expenses carefully before investing. The Summary Prospectus and/or Prospectus contain this and other information about the Portfolio. You may obtain copies of the Portfolio’s Summary Prospectus and/or the Prospectus and the Statement of Additional Information free of charge, upon request, by calling toll-free 800-598-2019, by writing to New York Life Insurance and Annuity Corporation, 51 Madison Avenue, Room 251, New York, New York 10010 or by sending an email to MainStayShareholdersServices@nylim.com. These documents are also available at nylinvestments.com/vpdocuments. Please read the Summary Prospectus and/or Prospectus carefully before investing. MainStay VP Funds Trust portfolios are separate account options which are purchased through a variable insurance or variable annuity contract.
Investment and Performance Comparison1(Unaudited)
Performance data quoted represents past performance. Past performance is no guarantee of future results. Because of market volatility and other factors, current performance may be lower or higher than the figures shown. Investment return and principal value will fluctuate, and as a result, when shares are redeemed, they may be worth more or less than their original cost. The performance table and graph do not reflect any deduction of sales charges, mortality and expense charges, contract charges or administrative charges. Please refer to the Performance Summary appropriate for your policy. For performance information current to the most recent month-end, please call800-598-2019 or visit www.newyorklife.com.
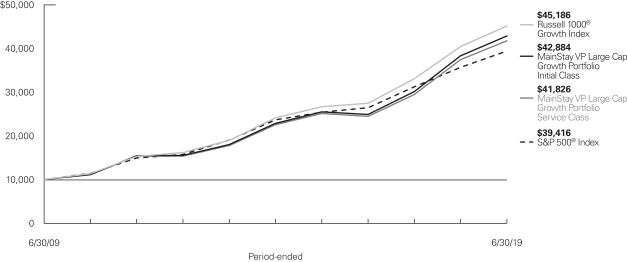
Average Annual Total Returns for the Period-Ended June 30, 2019
| | | | | | | | | | | | | | | | |
| Class | | Inception
Date | | Six Months | | One Year | | Five Years | | Ten Years | | | Gross
Expense
Ratio2 | |
| | | | | | |
| Initial Class Shares | | 5/1/1998 | | 23.01% | | 11.85% | | 13.43% | | | 15.67 | % | | | 0.76 | % |
| Service Class Shares | | 6/6/2003 | | 22.85 | | 11.57 | | 13.14 | | | 15.38 | | | | 1.01 | |
| | | | | | | | | | | | | | | | |
| Benchmark Performance | | Six Months | | | One
Year | | | Five
Years | | | Ten
Years | |
| | | | |
Russell 1000® Growth Index3 | | | 21.49 | % | | | 11.56 | % | | | 13.39 | % | | | 16.28 | % |
| | | | |
S&P 500® Index4 | | | 18.54 | | | | 10.42 | | | | 10.71 | | | | 14.70 | |
Morningstar Large Growth Category Average5 | | | 21.11 | | | | 10.02 | | | | 11.33 | | | | 14.71 | |
| 1. | Performance figures may reflect certain fee waivers and/or expense limitations, without which total returns may have been different. For information on current fee waivers and/or expense limitations (if any), please refer to the Notes to Financial Statements. |
| 2. | The gross expense ratios presented reflect the Portfolio’s “Total Annual Portfolio Operating Expenses” from the most recent Prospectus, as supplemented, and may differ from other expense ratios disclosed in this report. |
| 3. | The Russell 1000® Growth Index is the Portfolio’s primary broad-based securities market index for comparison purposes. The Russell 1000® Growth Index measures the performance of thelarge-cap growth segment of the U.S. equity universe. It includes those Russell 1000® Index companies with higherprice-to-book ratios and higher forecasted growth values. Results assume reinvestment of all dividends and capital gains. An investment cannot be made directly in an index. |
| 4. | The S&P 500® Index is the Portfolio’s secondary benchmark. “S&P 500®” is a trademark of The McGraw-Hill Companies, Inc. The S&P 500® Index is widely regarded as the standard index for measuringlarge-cap U.S. stock market performance. Results assume reinvestment of all dividends and capital gains. An investment cannot be made directly in an index. |
| 5. | The Morningstar Large Growth Category Average is representative of funds that invest primarily in big U.S. companies that are projected to grow faster than other large-cap stocks. Stocks in the top 70% of the capitalization of the U.S. equity market are defined as large cap. Growth is defined based on fast growth and high valuations. Most of these funds focus on companies in rapidly expanding industries. Results are based on average total returns of similar funds with all dividends and capital gain distributions reinvested. |
Cost in Dollars of a $1,000 Investment in MainStay VP Large Cap Growth Portfolio (Unaudited)
The example below is intended to describe the fees and expenses borne by shareholders during the six-month period from January 1, 2019, to June 30, 2019, and the impact of those costs on your investment.
Example
As a shareholder of the Portfolio you incur two types of costs: (1) transaction costs, including exchange fees and sales charges (loads) on purchases (as applicable), and (2) ongoing costs, including management fees, distribution and/or service (12b-1) fees, and other Portfolio expenses (as applicable). This example is intended to help you understand your ongoing costs (in dollars) of investing in the Portfolio and to compare these costs with the ongoing costs of investing in other mutual funds. The example is based on an investment of $1,000 made at the beginning of the six-month period and held for the entire period from January 1, 2019, to June 30, 2019. Shares are only sold in connection with variable life and annuity contracts and the example does not reflect any contract level or transactional fees or expenses. If these costs had been included, your costs would have been higher.
This example illustrates your Portfolio’s ongoing costs in two ways:
Actual Expenses
The second and third data columns in the table below provide information about actual account values and actual expenses. You may use the information in these columns, together with the amount you invested, to estimate the expenses that you paid during the six months ended June 30, 2019. Simply divide your account value by $1,000
(for example, an $8,600 account value divided by $1,000 = 8.6), then multiply the result by the number under the heading entitled “Expenses Paid During Period” to estimate the expenses you paid on your account during this period.
Hypothetical Example for Comparison Purposes
The fourth and fifth data columns in the table below provide information about hypothetical account values and hypothetical expenses based on the Portfolio’s actual expense ratio and an assumed rate of return of 5% per year before expenses, which is not the Portfolio’s actual return. The hypothetical account values and expenses may not be used to estimate the actual ending account balances or expenses you paid for thesix-month period shown. You may use this information to compare the ongoing costs of investing in the Portfolio with the ongoing costs of investing in other mutual funds. To do so, compare this 5% hypothetical example with the 5% hypothetical examples that appear in the shareholder reports of the other mutual funds.
Please note that the expenses shown in the table are meant to highlight your ongoing costs only and do not reflect any transactional costs, such as exchange fees or sales charges (loads). Therefore, the fourth and fifth data columns of the table are useful in comparing ongoing costs only and will not help you determine the relative total costs of owning different funds. In addition, if these transactional costs were included, your costs would have been higher.
| | | | | | | | | | | | | | | | | | | | | | |
| | | | | | | | | | | | | | | | | | |
| Share Class | | Beginning
Account
Value
1/1/19 | | | Ending Account
Value (Based
on Actual
Returns and
Expenses)
6/30/19 | | | Expenses
Paid
During
Period1 | | | Ending Account
Value (Based
on Hypothetical
5% Annualized
Return and
Actual Expenses)
6/30/19 | | | Expenses
Paid
During
Period1 | | | Net Expense
Ratio
During
Period2 |
| | | | | | |
| Initial Class Shares | | $ | 1,000.00 | | | $ | 1,230.10 | | | $ | 4.15 | | | $ | 1,021.08 | | | $ | 3.76 | | | 0.75% |
| | | | | | |
| Service Class Shares | | $ | 1,000.00 | | | $ | 1,228.50 | | | $ | 5.53 | | | $ | 1,019.84 | | | $ | 5.01 | | | 1.00% |
| 1. | Expenses are equal to the Portfolio’s annualized expense ratio of each class multiplied by the average account value over the period, divided by 365 and multiplied by 181 (to reflect the six-month period). The table above represents the actual expenses incurred during the six-month period. In addition to the fees and expenses which the Portfolio bears directly, it also indirectly bears a pro rata share of the fees and expenses of the underlying funds in which it invests. Such indirect expenses are not included in the above-reported expense figures. |
| 2. | Expenses are equal to the Portfolio’s annualized expense ratio to reflect the six-month period. |
| | |
| 6 | | MainStay VP Large Cap Growth Portfolio |
Industry Composition as of June 30, 2019(Unaudited)
| | | | |
| |
| Software | | | 17.7 | % |
| |
| IT Services | | | 16.7 | |
| |
| Interactive Media & Services | | | 9.6 | |
| |
| Internet & Direct Marketing Retail | | | 7.9 | |
| |
| Health Care Equipment & Supplies | | | 4.9 | |
| |
| Life Sciences Tools & Services | | | 4.6 | |
| |
| Entertainment | | | 4.3 | |
| |
| Textiles, Apparel & Luxury Goods | | | 3.7 | |
| |
| Aerospace & Defense | | | 3.5 | |
| |
| Pharmaceuticals | | | 3.4 | |
| |
| Specialty Retail | | | 3.2 | |
| |
| Semiconductors & Semiconductor Equipment | | | 3.0 | |
| |
| Chemicals | | | 2.7 | |
| |
| Automobiles | | | 1.9 | |
| | | | |
| |
| Health Care Providers & Services | | | 1.7 | % |
| |
| Road & Rail | | | 1.7 | |
| |
| Capital Markets | | | 1.6 | |
| |
| Biotechnology | | | 1.4 | |
| |
| Industrial Conglomerates | | | 1.4 | |
| |
| Professional Services | | | 1.3 | |
| |
| Health Care Technology | | | 1.2 | |
| |
| Banks | | | 1.0 | |
| |
| Machinery | | | 1.0 | |
| |
| Short-Term Investment | | | 0.7 | |
| |
| Other Assets, Less Liabilities | | | –0.1 | |
| | | | |
| | | 100.0 | % |
| | | | |
See Portfolio of Investments beginning on page 10 for specific holdings within these categories. The Portfolio’s holdings are subject to change.
Top Ten Holdings as of June 30, 2019(excluding short-term investment) (Unaudited)
| 5. | Facebook, Inc., Class A |
| 6. | Mastercard, Inc., Class A |
8. salesforce.com, Inc.
Portfolio Management Discussion and Analysis(Unaudited)
Answers to the questions reflect the views of portfolio managers Justin H. Kelly, CFA, and Patrick M. Burton, CFA, of Winslow Capital Management, LLC, the Portfolio’s Subadvisor.
How did MainStay VP Large Cap Growth Portfolio perform relative to its benchmarks and peers during the six months ended June 30, 2019?
For the six months ended June 30, 2019, MainStay VP Large Cap Growth Portfolio returned 23.01% for Initial Class shares and 22.85% for Service Class shares. Over the same period, both share classes outperformed the 21.49% return of the Russell 1000® Growth Index, which is the Portfolio’s primary benchmark and a broad-based securities-market index; the 18.54% return of the S&P 500® Index, which is a secondary benchmark of the Portfolio; and the 21.11% return of the Morningstar Large Growth Category Average.1
What factors affected the Portfolio’s relative performance during the reporting period?
The Portfolio’s outperformance relative to the Russell 1000® Growth Index was driven entirely by strong individual stock selections. Sector allocation detracted from relative performance.
The first half of the reporting period produced strong results for the Portfolio in virtually every respect. During the first three months of 2019, accommodative central bank monetary policy and increased optimism on trade negotiations drove strong returns in global equity markets, particularly among growth-oriented shares.
The second quarter of 2019 also produced positive equity returns relative to the Russell 1000® Growth Index, adding to a very strong reporting period. Offsetting forces were at play as solid domestic consumer demand was counterbalanced by geopolitical tensions that acted as a drag on the economy and the market. Growth-oriented stocks again outperformed their value-oriented counterparts as the market continued to reward the scarcity of earnings growth across the U.S. equity landscape. In March 2019, the yield curve2 inverted for the first time since 2006, giving rise to concerns of a possible impending recession. These concerns were exacerbated by slowing global growth and rising trade tensions, driving equity markets lower in May 2019. Markets recovered in early June 2019 after the U.S. Federal Reserve signaled a shift in posture to combat the slowdown and support the economy with potential rate cuts.
Which sectors were the strongest positive contributors to the Portfolio’s relative performance, and which sectors were particularly weak?
The three leading contributors to the Portfolio’s strong performance relative to the Russell 1000® Growth Index during the reporting period included health care, industrials and
information technology. (Contributions take weightings and total returns into account.) In each case, the Portfolio’s outperformance was largely driven by strong individual stock selections. The portfolio’s lack of exposure to the consumer staples and energy sectors also enhanced relative performance. The most significant detractors from the Portfolio’s relative performance included stock selections in the communication services and consumer discretionary sectors.
During the reporting period, which individual stocks made the strongest positive contributions to the Portfolio’s absolute performance and which stocks detracted the most?
The strongest positive individual contributors to the Portfolio’s absolute performance during the reporting period included holdings in software giant Microsoft, e-commerce leader Amazon.com and electronic payments provider Visa. Microsoft capitalized on the growing success of its subscription software model and the rapid expansion of its Azure cloud computing business. Amazon continued to dominate thee-commerce retail space and fueled additional growth through its public cloud offering, Amazon Web Services, with both business segments experiencing strong topline growth and expanding margins. Visa, the global leader in digital payments, benefited from the world’s continuing transition from cash and check to electronic transactions. The company’s Visa Direct segment generated exceptional growth in the area of directperson-to-person andbusiness-to-business electronic disbursements.
Notable detractors from the Portfolio’s absolute performance during the same period included semiconductor maker Microchip Technology, health insurer UnitedHealth Group and Chinese internet services provider Alibaba. Microchip Technology shares experienced weakness as negative investor sentiment weighed on the broader semiconductor industry. UnitedHealth Group was weakened along with other health care insurers by uncertainties arising from the“Medicare-for-All” policy proposals offered by a number of Democratic presidential candidates. Alibaba suffered in response to trade tensions between the United States and China, and from unsettling Chinese macroeconomic trends.
Did the Portfolio make any significant purchases or sales during the reporting period?
The Portfolio repurchased shares in global social media leader Facebook during the reporting period, after selling its position in the company during the fourth quarter of 2018. Large advertisers did not pull advertising dollars amid privacy concerns as the street feared, and some of those that did simply redeployed their expenditures to Instagram, which remained part of the
| 1. | See page 5 for more information on benchmark and peer group returns. |
| 2. | The yield curve is a line that plots the yields of various securities of similar quality—typically U.S. Treasury issues—across a range of maturities. The U.S. Treasury yield curve serves as a benchmark for other debt and is used in economic forecasting. |
| | |
| 8 | | MainStay VP Large Cap Growth Portfolio |
Facebook ecosystem. The Portfolio also purchased shares in diversified mass media and entertainment conglomerate The Walt Disney Company during the same period. The purchase reflected our favorable view of the pending launch of streaming service Disney+, as well as the potential of the company’s existing content brands, including Pixar, Lucas and Marvel, to drive growth for the company.
Significant sales during the reporting period included the Portfolio’s holdings of wireless communications infrastructure/tower company American Tower due to the stock’s high valuation, and medical supply company Becton Dickinson due to safety concerns regarding one key new product and an FDA rejection of another key new product application.
How did the Portfolio’s sector weightings change during the reporting period?
The Portfolio increased its exposure relative to the Russell 1000® Growth Index of holdings in the communication services and information technology sectors during the reporting period. During the same period, we trimmed the Portfolio’s health care holdings in response to the risks of policy shifts. In selling the Portfolio’s American Tower holdings, mentioned above, we reduced the Portfolio’s real estate exposure to zero.
How was the Portfolio positioned at the end of the reporting period?
Although we reduced the Portfolio’s exposure to the health care sector, health care remained the Portfolio’s largest overweight
position relative to the Russell 1000® Growth Index as of the end of the reporting period. However, as of June 30, 2019, the Portfolio’s health care holdings are primarily focused in industries where we identified positive fundamentals, such as medical technology and life sciences tools, and away from industries pressured by political uncertainties related to drug pricing and health insurance.
As of June 30, 2019, the Portfolio held its largest exposure in absolute terms and second largest relative to its benchmark in the information technology sector. This position arose from research showing strong anticipated spending levels on software through 2019, as well as a likelihood of increasing expenditures on digital marketing and the continued displacement of cash by electronic payments.
As of the same date, the Portfolio held zero exposure to consumer staples, a sector where we modeled little or no growth coupled with unattractive valuations. The Portfolio also held underweight exposure to industrials, a sector where fundamentals remained muted by soft demand from China and Europe. Among industrials, the Portfolio emphasized stocks in companies positioned to benefit from strong domestic capital spending bolstered by the tailwinds of tax reform, as well as aerospace and defense stocks likely to rise on growing defense spending.
The opinions expressed are those of the portfolio managers as of the date of this report and are subject to change. There is no guarantee that any forecasts will come to pass. This material does not constitute investment advice and is not intended as an endorsement of any specific investment.
Not all MainStay VP Portfolios and/or share classes are available under all policies.
Portfolio of InvestmentsJune 30, 2019 (Unaudited)
| | | | | | | | |
| | | Shares | | |
Value | |
| Common Stocks 99.4%† | |
Aerospace & Defense 3.5% | |
Boeing Co. | | | 51,150 | | | $ | 18,619,112 | |
Northrop Grumman Corp. | | | 62,550 | | | | 20,210,530 | |
| | | | | | | | |
| | | | | | | 38,829,642 | |
| | | | | | | | |
Automobiles 1.9% | |
Ferrari N.V. | | | 131,500 | | | | 21,226,730 | |
| | | | | | | | |
|
Banks 1.0% | |
JPMorgan Chase & Co. | | | 96,000 | | | | 10,732,800 | |
| | | | | | | | |
|
Biotechnology 1.4% | |
Exact Sciences Corp. (a) | | | 135,100 | | | | 15,947,204 | |
| | | | | | | | |
|
Capital Markets 1.6% | |
Moody’s Corp. | | | 92,240 | | | | 18,015,394 | |
| | | | | | | | |
|
Chemicals 2.7% | |
Linde PLC | | | 88,500 | | | | 17,770,800 | |
Sherwin-Williams Co. | | | 28,320 | | | | 12,978,773 | |
| | | | | | | | |
| | | | | | | 30,749,573 | |
| | | | | | | | |
Entertainment 4.3% | |
Netflix, Inc. (a) | | | 68,150 | | | | 25,032,858 | |
Walt Disney Co. | | | 168,300 | | | | 23,501,412 | |
| | | | | | | | |
| | | | | | | 48,534,270 | |
| | | | | | | | |
Health Care Equipment & Supplies 4.9% | |
Abbott Laboratories | | | 182,100 | | | | 15,314,610 | |
Align Technology, Inc. (a) | | | 24,550 | | | | 6,719,335 | |
Intuitive Surgical, Inc. (a) | | | 28,480 | | | | 14,939,184 | |
Stryker Corp. | | | 85,600 | | | | 17,597,648 | |
| | | | | | | | |
| | | | | | | 54,570,777 | |
| | | | | | | | |
Health Care Providers & Services 1.7% | |
UnitedHealth Group, Inc. | | | 75,910 | | | | 18,522,799 | |
| | | | | | | | |
|
Health Care Technology 1.2% | |
Veeva Systems, Inc., Class A (a) | | | 80,650 | | | | 13,074,172 | |
| | | | | | | | |
|
Industrial Conglomerates 1.4% | |
Honeywell International, Inc. | | | 92,290 | | | | 16,112,911 | |
| | | | | | | | |
|
Interactive Media & Services 9.6% | |
Alphabet, Inc. (a) | | | | | | | | |
Class A | | | 27,465 | | | | 29,739,102 | |
Class C | | | 27,839 | | | | 30,091,453 | |
Facebook, Inc., Class A (a) | | | 244,000 | | | | 47,092,000 | |
| | | | | | | | |
| | | | | | | 106,922,555 | |
| | | | | | | | |
| | | | | | | | |
| | | Shares | | |
Value | |
Internet & Direct Marketing Retail 7.9% | |
Alibaba Group Holding, Ltd., Sponsored ADR (a) | | | 35,150 | | | $ | 5,956,167 | |
Amazon.com, Inc. (a) | | | 38,360 | | | | 72,639,647 | |
MercadoLibre, Inc. (a) | | | 16,410 | | | | 10,039,146 | |
| | | | | | | | |
| | | | | | | 88,634,960 | |
| | | | | | | | |
IT Services 16.7% | |
Automatic Data Processing, Inc. | | | 108,300 | | | | 17,905,239 | |
Fiserv, Inc. (a) | | | 176,200 | | | | 16,062,392 | |
GoDaddy, Inc., Class A (a) | | | 239,600 | | | | 16,807,940 | |
Mastercard, Inc., Class A | | | 139,650 | | | | 36,941,615 | |
Pagseguro Digital, Ltd., Class A (a) | | | 430,600 | | | | 16,780,482 | |
PayPal Holdings, Inc. (a) | | | 225,250 | | | | 25,782,115 | |
Visa, Inc., Class A | | | 324,150 | | | | 56,256,232 | |
| | | | | | | | |
| | | | | | | 186,536,015 | |
| | | | | | | | |
Life Sciences Tools & Services 4.6% | |
Agilent Technologies, Inc. | | | 162,100 | | | | 12,104,007 | |
Illumina, Inc. (a) | | | 61,770 | | | | 22,740,625 | |
Thermo Fisher Scientific, Inc. | | | 56,300 | | | | 16,534,184 | |
| | | | | | | | |
| | | | | | | 51,378,816 | |
| | | | | | | | |
Machinery 1.0% | |
Fortive Corp. | | | 141,900 | | | | 11,567,688 | |
| | | | | | | | |
|
Pharmaceuticals 3.4% | |
AstraZeneca PLC, Sponsored ADR | | | 370,300 | | | | 15,285,984 | |
Zoetis, Inc. | | | 199,550 | | | | 22,646,930 | |
| | | | | | | | |
| | | | | | | 37,932,914 | |
| | | | | | | | |
Professional Services 1.3% | |
CoStar Group, Inc. (a) | | | 26,755 | | | | 14,823,875 | |
| | | | | | | | |
|
Road & Rail 1.7% | |
Union Pacific Corp. | | | 111,450 | | | | 18,847,310 | |
| | | | | | | | |
|
Semiconductors & Semiconductor Equipment 3.0% | |
Microchip Technology, Inc. | | | 153,400 | | | | 13,299,780 | |
Texas Instruments, Inc. | | | 95,850 | | | | 10,999,746 | |
Xilinx, Inc. | | | 80,450 | | | | 9,486,664 | |
| | | | | | | | |
| | | | | | | 33,786,190 | |
| | | | | | | | |
Software 17.7% | |
Adobe, Inc. (a) | | | 114,550 | | | | 33,752,157 | |
Autodesk, Inc. (a) | | | 82,700 | | | | 13,471,830 | |
Intuit, Inc. | | | 91,000 | | | | 23,781,030 | |
Microsoft Corp. | | | 641,900 | | | | 85,988,924 | |
salesforce.com, Inc. (a) | | | 221,950 | | | | 33,676,474 | |
Workday, Inc., Class A (a) | | | 37,450 | | | | 7,698,971 | |
| | | | | | | | |
| | | | | | | 198,369,386 | |
| | | | | | | | |
| | | | |
| 10 | | MainStay VP Large Cap Growth Portfolio | | The notes to the financial statements are an integral part of,
and should be read in conjunction with, the financial statements. |
| | | | | | | | |
| | | Shares | | |
Value | |
| Common Stocks (continued) | |
Specialty Retail 3.2% | |
Five Below, Inc. (a) | | | 91,700 | | | $ | 11,005,834 | |
Lowe’s Cos., Inc. | | | 248,600 | | | | 25,086,226 | |
| | | | | | | | |
| | | | | | | 36,092,060 | |
| | | | | | | | |
Textiles, Apparel & Luxury Goods 3.7% | |
NIKE, Inc., Class B | | | 337,950 | | | | 28,370,903 | |
VF Corp. | | | 148,400 | | | | 12,962,740 | |
| | | | | | | | |
| | | | | | | 41,333,643 | |
| | | | | | | | |
Total Common Stocks
(Cost $814,041,880) | | | | | | | 1,112,541,684 | |
| | | | | | | | |
|
| Short-Term Investment 0.7% | |
Affiliated Investment Company 0.7% | |
MainStay U.S. Government Liquidity Fund, 2.03% (b) | | | 7,395,332 | | | | 7,395,332 | |
| | | | | | | | |
TotalShort-Term Investment
(Cost $7,395,332) | | | | | | | 7,395,332 | |
| | | | | | | | |
Total Investments
(Cost $821,437,212) | | | 100.1 | % | | | 1,119,937,016 | |
Other Assets, Less Liabilities | | | (0.1 | ) | | | (851,671 | ) |
Net Assets | | | 100.0 | % | | $ | 1,119,085,345 | |
| † | Percentages indicated are based on Portfolio net assets. |
| (a) | Non-income producing security. |
| (b) | Current yield as of June 30, 2019. |
The following abbreviation is used in the preceding pages:
ADR—American Depositary Receipt
The following is a summary of the fair valuations according to the inputs used as of June 30, 2019, for valuing the Portfolio’s assets:
| | | | | | | | | | | | | | | | |
Description | | Quoted
Prices in
Active
Markets for
Identical
Assets
(Level 1) | | | Significant
Other
Observable
Inputs
(Level 2) | | | Significant
Unobservable
Inputs
(Level 3) | | | Total | |
| | | | |
Asset Valuation Inputs | | | | | | | | | | | | | | | | |
| Investments in Securities (a) | | | | | | | | | | | | | | | | |
| Common Stocks | | $ | 1,112,541,684 | | | $ | — | | | $ | — | | | $ | 1,112,541,684 | |
| Short-Term Investment | | | | | | | | | | | | | | | | |
Affiliated Investment Company | | | 7,395,332 | | | | — | | | | — | | | | 7,395,332 | |
| | | | | | | | | | | | | | | | |
| Total Investments in Securities | | $ | 1,119,937,016 | | | $ | — | | | $ | — | | | $ | 1,119,937,016 | |
| | | | | | | | | | | | | | | | |
| (a) | For a complete listing of investments and their industries, see the Portfolio of Investments. |
| | | | | | |
The notes to the financial statements are an integral part of,
and should be read in conjunction with, the financial statements. | | | | | 11 | |
Statement of Assets and Liabilitiesas of June 30, 2019 (Unaudited)
| | | | |
| Assets | | | | |
Investment in securities, at value
(identified cost $814,041,880) | | $ | 1,112,541,684 | |
Investment in affiliated investment company, at value (identified cost $7,395,332) | | | 7,395,332 | |
Receivables: | | | | |
Investment securities sold | | | 1,059,984 | |
Dividends | | | 228,700 | |
Portfolio shares sold | | | 143,780 | |
Other assets | | | 4,420 | |
| | | | |
Total assets | | | 1,121,373,900 | |
| | | | |
| |
| Liabilities | | | | |
Payables: | | | | |
Investment securities purchased | | | 726,303 | |
Portfolio shares redeemed | | | 670,192 | |
Manager (See Note 3) | | | 659,537 | |
NYLIFE Distributors (See Note 3) | | | 151,308 | |
Professional fees | | | 33,791 | |
Shareholder communication | | | 25,689 | |
Custodian | | | 13,055 | |
Trustees | | | 1,071 | |
Accrued expenses | | | 7,609 | |
| | | | |
Total liabilities | | | 2,288,555 | |
| | | | |
Net assets | | $ | 1,119,085,345 | |
| | | | |
| |
| Composition of Net Assets | | | | |
Shares of beneficial interest outstanding (par value of $.001 per share) unlimited number of shares authorized | | $ | 43,503 | |
Additional paid-in capital | | | 631,833,908 | |
| | | | |
| | | 631,877,411 | |
Total distributable earnings (loss) | | | 487,207,934 | |
| | | | |
Net assets | | $ | 1,119,085,345 | |
| | | | |
| | | | |
Initial Class | | | | |
Net assets applicable to outstanding shares | | $ | 367,869,358 | |
| | | | |
Shares of beneficial interest outstanding | | | 13,818,326 | |
| | | | |
Net asset value per share outstanding | | $ | 26.62 | |
| | | | |
Service Class | | | | |
Net assets applicable to outstanding shares | | $ | 751,215,987 | |
| | | | |
Shares of beneficial interest outstanding | | | 29,684,746 | |
| | | | |
Net asset value per share outstanding | | $ | 25.31 | |
| | | | |
| | | | |
| 12 | | MainStay VP Large Cap Growth Portfolio | | The notes to the financial statements are an integral part of,
and should be read in conjunction with, the financial statements. |
Statement of Operationsfor the six months ended June 30, 2019 (Unaudited)
| | | | |
| Investment Income (Loss) | |
Income | | | | |
Dividends—unaffiliated (a) | | $ | 3,634,260 | |
Dividends—affiliated | | | 100,222 | |
Securities lending | | | 46,363 | |
Interest | | | 5 | |
| | | | |
Total income | | | 3,780,850 | |
| | | | |
Expenses | | | | |
Manager (See Note 3) | | | 3,781,015 | |
Distribution/Service—Service Class (See Note 3) | | | 882,359 | |
Professional fees | | | 52,374 | |
Shareholder communication | | | 31,816 | |
Custodian | | | 12,150 | |
Trustees | | | 12,135 | |
Miscellaneous | | | 18,833 | |
| | | | |
Total expenses before waiver/reimbursement | | | 4,790,682 | |
Expense waiver/reimbursement from Manager (See Note 3) | | | (14,409 | ) |
| | | | |
Net expenses | | | 4,776,273 | |
| | | | |
Net investment income (loss) | | | (995,423 | ) |
| | | | |
|
| Realized and Unrealized Gain (Loss) on Investments | |
Net realized gain (loss) on unaffiliated investments | | | 51,498,927 | |
Net change in unrealized appreciation (depreciation) on unaffiliated investments | | | 154,848,794 | |
| | | | |
Net realized and unrealized gain (loss) on investments | | | 206,347,721 | |
| | | | |
Net increase (decrease) in net assets resulting from operations | | $ | 205,352,298 | |
| | | | |
| (a) | Dividends recorded net of foreign withholding taxes in the amount of $24,219. |
| | | | | | |
The notes to the financial statements are an integral part of,
and should be read in conjunction with, the financial statements. | | | | | 13 | |
Statements of Changes in Net Assets
for the six months ended June 30, 2019 (Unaudited) and the year ended December 31, 2018
| | | | | | | | |
| | | 2019 | | | 2018 | |
| Increase (Decrease) in Net Assets | |
Operations: | | | | | | | | |
Net investment income (loss) | | $ | (995,423 | ) | | $ | (1,447,963 | ) |
Net realized gain (loss) on investments | | | 51,498,927 | | | | 139,169,478 | |
Net change in unrealized appreciation (depreciation) on investments | | | 154,848,794 | | | | (98,221,042 | ) |
| | | | |
Net increase (decrease) in net assets resulting from operations | | | 205,352,298 | | | | 39,500,473 | |
| | | | |
Distributions to shareholders: | | | | | | | | |
Initial Class | | | — | | | | (34,707,849 | ) |
Service Class | | | — | | | | (93,948,035 | ) |
| | | | |
Total distributions to shareholders | | | — | | | | (128,655,884 | ) |
| | | | |
Capital share transactions: | | | | | | | | |
Net proceeds from sale of shares | | | 140,628,719 | | | | 198,201,726 | |
Net asset value of shares issued to shareholders in reinvestment of distributions | | | — | | | | 128,655,884 | |
Cost of shares redeemed | | | (88,905,789 | ) | | | (320,067,442 | ) |
| | | | |
Increase (decrease) in net assets derived from capital share transactions | | | 51,722,930 | | | | 6,790,168 | |
| | | | |
Net increase (decrease) in net assets | | | 257,075,228 | | | | (82,365,243 | ) |
| | |
| Net Assets | | | | | | | | |
Beginning of period | | | 862,010,117 | | | | 944,375,360 | |
| | | | |
End of period | | $ | 1,119,085,345 | | | $ | 862,010,117 | |
| | | | |
| | | | |
| 14 | | MainStay VP Large Cap Growth Portfolio | | The notes to the financial statements are an integral part of,
and should be read in conjunction with, the financial statements. |
Financial Highlightsselected per share data and ratios
| | | | | | | | | | | | | | | | | | | | | | | | | | | | | | | | | | | |
| | | |
| | | Six months
ended
June 30, | | | | Year ended December 31, |
| | | | | | | |
| Initial Class | | 2019* | | | | 2018 | | 2017 | | 2016 | | 2015 | | 2014 |
| | | | | | | |
Net asset value at beginning of period | | | $ | 21.64 | | | | | | | | | $ | 23.92 | | | | $ | 18.71 | | | | $ | 20.83 | | | | $ | 22.48 | | | | $ | 22.83 | |
| | | | | | | | | | | | | | | | | | | | | | | | | | | | | | | | | | | |
| | | | | | | |
Net investment income (loss) (a) | | | | (0.00 | )‡ | | | | | | | | | 0.00 | ‡ | | | | 0.02 | | | | | 0.01 | | | | | (0.00 | )‡ | | | | (0.01 | ) |
| | | | | | | |
Net realized and unrealized gain (loss) on investments | | | | 4.98 | | | | | | | | | | 1.36 | | | | | 6.00 | | | | | (0.43 | ) | | | | 1.22 | | | | | 2.29 | |
| | | | | | | | | | | | | | | | | | | | | | | | | | | | | | | | | | | |
| | | | | | | |
Total from investment operations | | | | 4.98 | | | | | | | | | | 1.36 | | | | | 6.02 | | | | | (0.42 | ) | | | | 1.22 | | | | | 2.28 | |
| | | | | | | | | | | | | | | | | | | | | | | | | | | | | | | | | | | |
| | | | | | | |
| Less distributions: | | | | | | | | | | | | | | | | | | | | | | | | | | | | | | | | | | | |
| | | | | | | |
From net realized gain on investments | | | | — | | | | | | | | | | (3.64 | ) | | | | (0.81 | ) | | | | (1.70 | ) | | | | (2.87 | ) | | | | (2.63 | ) |
| | | | | | | | | | | | | | | | | | | | | | | | | | | | | | | | | | | |
| | | | | | | |
Net asset value at end of period | | | $ | 26.62 | | | | | | | | | $ | 21.64 | | | | $ | 23.92 | | | | $ | 18.71 | | | | $ | 20.83 | | | | $ | 22.48 | |
| | | | | | | | | | | | | | | | | | | | | | | | | | | | | | | | | | | |
| | | | | | | |
Total investment return (b) | | | | 23.01 | % | | | | | | | | | 3.57 | % | | | | 32.39 | % | | | | (2.27 | %) | | | | 6.18 | % | | | | 10.63 | % |
| | | | | | | |
| Ratios (to average net assets)/Supplemental Data: | | | | | | | | | | | | | | | | | | | | | | | | | | | | | | | | | | | |
| | | | | | | |
Net investment income (loss) | | | | (0.02 | %)†† | | | | | | | | | 0.01 | % | | | | 0.10 | % | | | | 0.07 | % | | | | (0.01 | %) | | | | (0.03 | %) |
| | | | | | | |
Net expenses (c) | | | | 0.75 | % ††(d) | | | | | | | | | 0.76 | %(d) | | | | 0.76 | %(d) | | | | 0.77 | % | | | | 0.77 | % | | | | 0.77 | % |
| | | | | | | |
Portfolio turnover rate | | | | 32 | % | | | | | | | | | 58 | % | | | | 53 | % | | | | 94 | % | | | | 71 | % | | | | 78 | % |
| | | | | | | |
Net assets at end of period (in 000’s) | | | $ | 367,869 | | | | | | | | | $ | 238,174 | | | | $ | 368,861 | | | | $ | 518,425 | | | | $ | 448,409 | | | | $ | 410,122 | |
| ‡ | Less than one cent per share. |
| (a) | Per share data based on average shares outstanding during the period. |
| (b) | Total return does not reflect any deduction of sales charges, mortality and expense charges, contract charges or administrative charges. For periods of less than one year, total return is not annualized. |
| (c) | In addition to the fees and expenses which the Portfolio bears directly, it also indirectly bears a pro-rata share of the fees and expenses of the underlying funds in which it invests. Such indirect expenses are not included in the above expense ratios. |
| (d) | Expense waiver/reimbursement less than 0.01%. |
| | | | | | | | | | | | | | | | | | | | | | | | | | | | | | | | | | | |
| | | |
| | | Six months
ended
June 30, | | | | Year ended December 31, |
| | | | | | | |
| Service Class | | 2019* | | | | 2018 | | 2017 | | 2016 | | 2015 | | 2014 |
| | | | | | | |
Net asset value at beginning of period | | | $ | 20.60 | | | | | | | | | $ | 22.96 | | | | $ | 18.03 | | | | $ | 20.18 | | | | $ | 21.93 | | | | $ | 22.39 | |
| | | | | | | | | | | | | | | | | | | | | | | | | | | | | | | | | | | |
| | | | | | | |
Net investment income (loss) (a) | | | | (0.03 | ) | | | | | | | | | (0.06 | ) | | | | (0.03 | ) | | | | (0.03 | ) | | | | (0.06 | ) | | | | (0.06 | ) |
| | | | | | | |
Net realized and unrealized gain (loss) on investments | | | | 4.74 | | | | | | | | | | 1.34 | | | | | 5.77 | | | | | (0.42 | ) | | | | 1.18 | | | | | 2.23 | |
| | | | | | | | | | | | | | | | | | | | | | | | | | | | | | | | | | | |
| | | | | | | |
Total from investment operations | | | | 4.71 | | | | | | | | | | 1.28 | | | | | 5.74 | | | | | (0.45 | ) | | | | 1.12 | | | | | 2.17 | |
| | | | | | | | | | | | | | | | | | | | | | | | | | | | | | | | | | | |
| | | | | | | |
| Less distributions: | | | | | | | | | | | | | | | | | | | | | | | | | | | | | | | | | | | |
| | | | | | | |
From net realized gain on investments | | | | — | | | | | | | | | | (3.64 | ) | | | | (0.81 | ) | | | | (1.70 | ) | | | | (2.87 | ) | | | | (2.63 | ) |
| | | | | | | | | | | | | | | | | | | | | | | | | | | | | | | | | | | |
| | | | | | | |
Net asset value at end of period | | | $ | 25.31 | | | | | | | | | $ | 20.60 | | | | $ | 22.96 | | | | $ | 18.03 | | | | $ | 20.18 | | | | $ | 21.93 | |
| | | | | | | | | | | | | | | | | | | | | | | | | | | | | | | | | | | |
| | | | | | | |
Total investment return (b) | | | | 22.86 | % (c) | | | | | | | | | 3.31 | % | | | | 32.06 | % | | | | (2.52 | %) | | | | 5.91 | % | | | | 10.35 | % |
| | | | | | | |
| Ratios (to average net assets)/Supplemental Data: | | | | | | | | | | | | | | | | | | | | | | | | | | | | | | | | | | | |
| | | | | | | |
Net investment income (loss) | | | | (0.27 | %)†† | | | | | | | | | (0.23 | %) | | | | (0.15 | %) | | | | (0.17 | %) | | | | (0.26 | %) | | | | (0.28 | %) |
| | | | | | | |
Net expenses (d) | | | | 1.00 | % ††(e) | | | | | | | | | 1.01 | % (e) | | | | 1.01 | % (e) | | | | 1.02 | % | | | | 1.02 | % | | | | 1.02 | % |
| | | | | | | |
Portfolio turnover rate | | | | 32 | % | | | | | | | | | 58 | % | | | | 53 | % | | | | 94 | % | | | | 71 | % | | | | 78 | % |
| | | | | | | |
Net assets at end of period (in 000’s) | | | $ | 751,216 | | | | | | | | | $ | 623,836 | | | | $ | 575,514 | | | | $ | 435,029 | | | | $ | 440,891 | | | | $ | 373,762 | |
| (a) | Per share data based on average shares outstanding during the period. |
| (b) | Total return does not reflect any deduction of sales charges, mortality and expense charges, contract charges or administrative charges. For periods of less than one year, total return is not annualized. |
| (c) | Total investment return may reflect adjustments to conform to generally accepted accounting principles. |
| (d) | In addition to the fees and expenses which the Portfolio bears directly, it also indirectly bears a pro-rata share of the fees and expenses of the underlying funds in which it invests. Such indirect expenses are not included in the above expense ratios. |
| (e) | Expense waiver/reimbursement less than 0.01%. |
| | | | | | |
The notes to the financial statements are an integral part of,
and should be read in conjunction with, the financial statements. | | | | | 15 | |
Notes to Financial Statements(Unaudited)
Note 1–Organization and Business
MainStay VP Funds Trust (the “Fund”) was organized as a Delaware statutory trust on February 1, 2011. The Fund is registered under the Investment Company Act of 1940, as amended (the “1940 Act”), as an open-end management investment company. The Fund is comprised of thirty-one separate series (collectively referred to as the “Portfolios”). These financial statements and notes relate to the MainStay VP Large Cap Growth Portfolio (the “Portfolio”), a “diversified” portfolio, as that term is defined in the 1940 Act, as interpreted or modified by regulatory authorities having jurisdiction, from time to time.
Shares of the Portfolio are currently offered to certain separate accounts to fund variable annuity policies and variable universal life insurance policies issued by New York Life Insurance and Annuity Corporation (“NYLIAC”), awholly-owned subsidiary of New York Life Insurance Company (“New York Life”) and may also be offered to fund variable annuity policies and variable universal life insurance policies issued by other insurance companies. NYLIAC allocates shares of the Portfolios to, among others, certain NYLIAC separate accounts. Shares of the Portfolio are also offered to the MainStay VP Conservative Allocation Portfolio, MainStay VP Moderate Allocation Portfolio, MainStay VP Moderate Growth Allocation Portfolio and MainStay VP Growth Allocation Portfolio, which operate as “funds-of-funds.”
The Portfolio currently offers two classes of shares. Initial Class shares commenced operations on May 1, 1998. Service Class shares commenced operations on June 6, 2003. Shares of the Portfolio are offered and are redeemed at a price equal to their respective net asset value (“NAV”) per share. No sales or redemption charge is applicable to the purchase or redemption of the Portfolio’s shares. Under the terms of the Fund’s multiple class plan adopted pursuant to Rule 18f-3 under the 1940 Act, the classes differ in that, among other things, Service Class shares of the Portfolio pay a combined distribution and service fee of 0.25% of average daily net assets attributable to Service Class shares of the Portfolio to the Distributor (as defined in Note 3(B)) pursuant to a plan adopted in accordance with Rule 12b-1 under the 1940 Act. Contract owners of variable annuity contracts purchased after June 2, 2003, are permitted to invest only in the Service Class shares.
The Portfolio’s investment objective is to seeklong-term growth of capital.
Note 2–Significant Accounting Policies
The Portfolio is an investment company and accordingly follows the investment company accounting and reporting guidance of the Financial Accounting Standards Board (“FASB”) Accounting Standard CodificationTopic 946 Financial Services—Investment Companies. The Portfolio prepares its financial statements in accordance with generally accepted accounting principles (“GAAP”) in the United States of America and follows the significant accounting policies described below.
(A) Securities Valuation. Investments are usually valued as of the close of regular trading on the New York Stock Exchange (the “Exchange”) (usually 4:00 p.m. Eastern time) on each day the Portfolio is open for business (“valuation date”).
The Board of Trustees of the Fund (the “Board”) adopted procedures establishing methodologies for the valuation of the Portfolio’s securities and other assets and delegated the responsibility for valuation
determinations under those procedures to the Valuation Committee of the Fund (the “Valuation Committee”). The Board authorized the Valuation Committee to appoint a Valuation Subcommittee (the “Subcommittee”) to deal in the first instance with establishing the prices of securities for which market quotations are not readily available or the prices of which are not otherwise readily determinable under these procedures. The Subcommittee meets (in person, via electronic mail or via teleconference) on an as-needed basis. Subsequently, the Valuation Committee meets to ensure that actions taken by the Subcommittee were appropriate. The procedures state that, subject to the oversight of the Board and unless otherwise noted, the responsibility for theday-to-day valuation of portfolio assets (including fair value measurements for the Portfolio’s assets and liabilities) rests with New York Life Investment Management LLC (“New York Life Investments” or the “Manager”), aided to whatever extent necessary by the Subadvisor (as defined in Note 3(A)).
To assess the appropriateness of security valuations, the Manager, the Subadvisor or the Portfolio’s third-party service provider, who is subject to oversight by the Manager, regularly compares prior day prices, prices on comparable securities and the sale prices to the prior and current day prices and challenges prices with changes exceeding certain tolerance levels with third-party pricing services or broker sources. For those securities valued through either a standardized fair valuation methodology or a fair valuation measurement, the Subcommittee deals in the first instance with such valuation and the Valuation Committee reviews and affirms, if appropriate, the reasonableness of the valuation based on such methodologies and measurements on a regular basis after considering information that is reasonably available and deemed relevant by the Valuation Committee. Any action taken by the Subcommittee with respect to the valuation of a portfolio security or other asset is submitted for review and ratification (if appropriate) to the Valuation Committee and the Board at the next regularly scheduled meeting.
“Fair value” is defined as the price the Portfolio would reasonably expect to receive upon selling an asset or liability in an orderly transaction to an independent buyer in the principal or most advantageous market for the asset or liability. Fair value measurements are determined within a framework that establishes a three-tier hierarchy which maximizes the use of observable market data and minimizes the use of unobservable inputs to establish a classification of fair value measurements for disclosure purposes. “Inputs” refer broadly to the assumptions that market participants would use in pricing the asset or liability, including assumptions about risk, such as the risk inherent in a particular valuation technique used to measure fair value using a pricing model and/or the risk inherent in the inputs for the valuation technique. Inputs may be observable or unobservable. Observable inputs reflect the assumptions market participants would use in pricing the asset or liability based on market data obtained from sources independent of the Portfolio. Unobservable inputs reflect the Portfolio’s own assumptions about the assumptions market participants would use in pricing the asset or liability based on the information available. The inputs or methodology used for valuing assets or liabilities may not be an indication of the risks associated with investing in those assets or liabilities. The three-tier hierarchy of inputs is summarized below.
| • | | Level 1—quoted prices in active markets for an identical asset or liability |
| | |
| 16 | | MainStay VP Large Cap Growth Portfolio |
| • | | Level 2—other significant observable inputs (including quoted prices for a similar asset or liability in active markets, interest rates and yield curves, prepayment speeds, credit risk, etc.) |
| • | | Level 3—significant unobservable inputs (including the Portfolio’s own assumptions about the assumptions that market participants would use in measuring fair value of an asset or liability) |
The level of an asset or liability within the fair value hierarchy is based on the lowest level of an input, both individually and in the aggregate, that is significant to the fair value measurement. As of June 30, 2019, the aggregate value by input level of the Portfolio’s assets and liabilities is included at the end of the Portfolio’s Portfolio of Investments.
The Portfolio may use third-party vendor evaluations, whose prices may be derived from one or more of the following standard inputs, among others:
| | |
• Broker/dealer quotes | | • Benchmark securities |
• Two-sided markets | | • Reference data (corporate actions or material event notices) |
• Bids/offers | | • Monthly payment information |
• Industry and economic events | | • Reported trades |
An asset or liability for which market values cannot be measured using the methodologies described above is valued by methods deemed reasonable in good faith by the Valuation Committee, following the procedures established by the Board, to represent fair value. Under these procedures, the Portfolio generally uses a market-based approach which may use related or comparable assets or liabilities, recent transactions, market multiples, book values and other relevant information. The Portfolio may also use an income-based valuation approach in which the anticipated future cash flows of the asset or liability are discounted to calculate fair value. Discounts may also be applied due to the nature and/or duration of any restrictions on the disposition of the asset or liability. Fair value represents a good faith approximation of the value of a security. Fair value determinations involve the consideration of a number of subjective factors, an analysis of applicable facts and circumstances and the exercise of judgment. As a result, it is possible that the fair value for a security determined in good faith in accordance with the Portfolio’s valuation procedures may differ from valuations for the same security determined by other funds using their own valuation procedures. Although the Portfolio’s valuation procedures are designed to value a security at the price the Portfolio may reasonably expect to receive upon the security’s sale in an orderly transaction, there can be no assurance that any fair value determination thereunder would, in fact, approximate the amount that the Portfolio would actually realize upon the sale of the security or the price at which the security would trade if a reliable market price were readily available. During the six-month period ended June 30, 2019, there were no material changes to the fair value methodologies.
Securities which may be valued in this manner include, but are not limited to: (i) a security for which trading has been halted or suspended; (ii) a debt security that has recently gone into default and for which there is not a current market quotation; (iii) a security of an issuer that has entered into a restructuring; (iv) a security that has been delisted from a national exchange; (v) a security for which the market price is not readily available from a third-party pricing source or, if so provided,
does not, in the opinion of the Manager or the Subadvisor, reflect the security’s market value; (vi) a security subject to trading collars for which no or limited trading takes place; and (vii) a security whose principal market has been temporarily closed at a time when, under normal conditions, it would be open. Securities valued in this manner are generally categorized as Level 3 in the hierarchy. As of June 30, 2019, there were no securities held by the Portfolio that were fair valued in such a manner.
Equity securities are valued at the last quoted sales prices as of the close of regular trading on the relevant exchange on each valuation date. Securities that are not traded on the valuation date are valued at the mean of the last quoted bid and ask prices. Prices are normally taken from the principal market in which each security trades. These securities are generally categorized as Level 1 in the hierarchy.
Investments in mutual funds, including money market funds, are valued at their respective NAVs as of the close of the Exchange on the valuation date. These securities are generally categorized as Level 1 in the hierarchy.
Temporary cash investments acquired in excess of 60 days to maturity at the time of purchase are valued using the latest bid prices or using valuations based on a matrix system (which considers such factors as security prices, yields, maturities and ratings), both as furnished by independent pricing services. Other temporary cash investments which mature in 60 days or less at the time of purchase (“Short-Term Investments”) are valued using the amortized cost method of valuation, unless the use of such method would be inappropriate. The amortized cost method involves valuing a security at its cost on the date of purchase and thereafter assuming a constant amortization to maturity of the difference between such cost and the value on maturity date. Amortized cost approximates the current fair value of a security. Securities valued using the amortized cost method are not valued using quoted prices in an active market and are generally categorized as Level 2 in the hierarchy.
The information above is not intended to reflect an exhaustive list of the methodologies that may be used to value portfolio investments. The valuation procedures permit the use of a variety of valuation methodologies in connection with valuing portfolio investments. The methodology used for a specific type of investment may vary based on the market data available or other considerations. The methodologies summarized above may not represent the specific means by which portfolio investments are valued on any particular business day.
(B) Income Taxes. The Portfolio’s policy is to comply with the requirements of the Internal Revenue Code of 1986, as amended (the “Internal Revenue Code”), applicable to regulated investment companies and to distribute all of its taxable income to the shareholders of the Portfolio within the allowable time limits. Therefore, no federal, state and local income tax provisions are required.
Management evaluates the Portfolio’s tax positions to determine if the tax positions taken meet the minimum recognition threshold in connection with accounting for uncertainties in income tax positions taken or expected to be taken for the purposes of measuring and recognizing tax liabilities in the financial statements. Recognition of tax benefits of an uncertain tax position is permitted only to the extent the position is “more likely than not” to be sustained assuming examination by taxing
Notes to Financial Statements(Unaudited) (continued)
authorities. Management has analyzed the Portfolio’s tax positions taken on federal, state and local income tax returns for all open tax years (for up to three tax years) and has concluded that no provisions for federal, state and local income tax are required in the Portfolio’s financial statements. The Portfolio’s federal, state and local income tax and federal excise tax returns for tax years for which the applicable statutes of limitations have not expired are subject to examination by the Internal Revenue Service and state and local departments of revenue.
(C) Dividends and Distributions to Shareholders. Dividends and distributions are recorded on the ex-dividend date. The Portfolio intends to declare and pay dividends from net investment income and distributions from net realized capital and currency gains, if any, at least annually. Unless the shareholder elects otherwise, all dividends and distributions are reinvested in the same class of shares of the Portfolio, at NAV. Dividends and distributions to shareholders are determined in accordance with federal income tax regulations and may differ from determinations using GAAP.
(D) Security Transactions and Investment Income. The Portfolio records security transactions on the trade date. Realized gains and losses on security transactions are determined using the identified cost method. Dividend income is recognized on the ex-dividend date; net of any foreign tax withheld at the source, and interest income is accrued as earned using the effective interest rate method.
Investment income and realized and unrealized gains and losses on investments of the Portfolio are allocated pro rata to the separate classes of shares based upon their relative net assets on the date the income is earned or realized and unrealized gains and losses are incurred.
(E) Expenses. Expenses of the Fund are allocated to the individual Portfolios in proportion to the net assets of the respective Portfolios when the expenses are incurred, except where direct allocations of expenses can be made. Expenses (other than fees incurred under the distribution and service plans, further discussed in Note 3(B), which are charged directly to the Service Class shares) are allocated to separate classes of shares pro rata based upon their relative net assets on the date the expenses are incurred. The expenses borne by the Portfolio, including those of related parties to the Portfolio, are shown in the Statement of Operations.
Additionally, the Portfolio may invest in mutual funds, which are subject to management fees and other fees that may cause the costs of investing in mutual funds to be greater than the costs of owning the underlying securities directly. These indirect expenses of mutual funds are not included in the amounts shown as expenses in the Portfolio’s Statement of Operations or in the expense ratios included in the Financial Highlights.
(F) Use of Estimates. In preparing financial statements in conformity with GAAP, management makes estimates and assumptions that affect the reported amounts and disclosures in the financial statements. Actual results could differ from those estimates.
(G) Repurchase Agreements. The Portfolio may enter into repurchase agreements (i.e., buy a security from another party with the agreement that it be sold back in the future) to earn income. The Portfolio may enter into repurchase agreements only with counterparties, usually financial institutions, that are deemed by the Manager or
the Subadvisor to be creditworthy, pursuant to guidelines established by the Board. During the term of any repurchase agreement, the Manager or the Subadvisor will continue to monitor the creditworthiness of the counterparty. Under the 1940 Act, repurchase agreements are considered to be collateralized loans by the Portfolio to the counterparty secured by the securities transferred to the Portfolio.
Repurchase agreements are subject to counterparty risk, meaning the Portfolio could lose money by the counterparty’s failure to perform under the terms of the agreement. The Portfolio mitigates this risk by ensuring the repurchase agreement is collateralized by cash, U.S. government securities, fixed income securities and/or other securities. The collateral is held by the Portfolio’s custodian and valued daily on a mark to market basis to determine if the value, including accrued interest, exceeds the repurchase price. In the event of the counterparty’s default on the obligation to repurchase, the Portfolio has the right to liquidate the collateral and apply the proceeds in satisfaction of the obligation. Under certain circumstances, such as in the event of default or bankruptcy by the counterparty, realization and/or retention of the collateral may be limited or subject to delay, to legal proceedings and possible realized loss to the Portfolio. As of June 30, 2019, the Portfolio did not hold any repurchase agreements.
(H) Securities Lending. In order to realize additional income, the Portfolio may engage in securities lending, subject to the limitations set forth in the 1940 Act and relevant guidance by the staff of the Securities and Exchange Commission (“SEC”). In the event the Portfolio does engage in securities lending, the Portfolio will lend through its custodian, State Street Bank and Trust Company (“State Street”), acting as securities lending agent on behalf of the Portfolio. State Street will manage the Portfolio’s collateral in accordance with the securities lending agency agreement between the Portfolio and State Street, and indemnify the Portfolio against counterparty risk. The loans will be collateralized by cash (which may be invested in a money market fund) and/ornon-cash collateral (which may include, U.S. Treasury securities and/or U.S. Government Agency securities issued or guaranteed by the United States government or its agencies or instrumentalities) at least equal at all times to the market value of the securities loaned. The Portfolio may bear the risk of delay in recovery of, or loss of rights in, the securities loaned should the borrower of the securities experience financial difficulty. The Portfolio may also record a realized gain or loss on securities deemed sold due to a borrower’s inability to return securities on loan. The Portfolio bears the risk of any loss on investment of cash collateral. The Portfolio will receive compensation for lending its securities in the form of fees or it will retain a portion of interest on the investment of any cash collateral. The Portfolio will also continue to receive interest and dividends on the securities loaned and any gain or loss in the market price of the securities loaned that may occur during the term of the loan will be for the account of the Portfolio. Income earned from securities lending activities, if any, is reflected in the Statement of Operations. As of June 30, 2019, the Portfolio did not have any portfolio securities on loan.
(I) Indemnifications. Under the Fund’s organizational documents, its officers and trustees are indemnified against certain liabilities that
may arise out of performance of their duties to the Fund. Additionally, in the normal course of business, the Portfolio enters into contracts with third-party service providers that contain a variety of representations
| | |
| 18 | | MainStay VP Large Cap Growth Portfolio |
and warranties and which may provide general indemnifications. The Portfolio’s maximum exposure under these arrangements is unknown, as this would involve future claims that may be made against the Portfolio that have not yet occurred. Based on experience, management is of the view that the risk of loss in connection with these potential indemnification obligations is remote. However, there can be no assurance that material liabilities related to such obligations will not arise in the future, which could adversely impact the Portfolio.
Note 3–Fees and Related Party Transactions
(A) Manager and Subadvisor. New York Life Investments, a registered investment adviser and an indirect,wholly-owned subsidiary of New York Life, serves as the Portfolio’s Manager pursuant to an Amended and Restated Management Agreement (“Management Agreement”). The Manager provides offices, conducts clerical, recordkeeping and bookkeeping services, and keeps most of the financial and accounting records required to be maintained by the Portfolio. Except for the portion of salaries and expenses that are the responsibility of the Portfolio, the Manager pays the salaries and expenses of all personnel affiliated with the Portfolio and certain operational expenses of the Portfolio. The Portfolio reimburses New York Life Investments in an amount equal to a portion of the compensation of the Chief Compliance Officer attributable to the Portfolio. Winslow Capital Management, LLC. (“Winslow” or “Subadvisor”), a registered investment adviser, serves as Subadvisor to the Portfolio and is responsible for theday-to-day portfolio management of the Portfolio. Pursuant to the terms of a Subadvisory Agreement (“Subadvisory Agreement”) between New York Life Investments and Winslow, New York Life Investments pays for the services of the Subadvisor.
The Fund, on behalf of the Portfolio, pays New York Life Investments in its capacity as the Portfolio’s investment manager and administrator, pursuant to the Management Agreement, a monthly fee for services performed and facilities furnished at an annual rate of the average daily net assets as follows: 0.75% up to $500 million; 0.725% from $500 million to $750 million; 0.71% from $750 million to $1 billion; 0.70% from $1 billion to $2 billion; 0.66% from $2 billion to $3 billion; 0.61% from $3 billion to $7 billion; 0.585% from $7 billion to $9 billion and; 0.575% in excess of $9 billion.
New York Life Investments has voluntarily agreed to waive a portion of its management fee when the subadvisory fee is reduced as a result of achieving breakpoints in the subadvisory fee schedule. The savings that result from the reduced subadvisory fee will be shared equally with the Portfolio provided that the amount of the management fee retained by New York Life Investments, after payment of the subadvisory fee,
exceeds 0.35% of the average daily net assets of the Portfolio. This waiver may be discontinued at any time.
New York Life Investments has contractually agreed to waive a portion of its management fee so that the management fee does not exceed 0.55% of the Portfolio’s average daily net assets from $11 billion to $13 billion; and 0.525% of the Portfolio’s average daily net assets over $13 billion. This agreement expires May 1, 2020, and may only be amended or terminated prior to that date by action of the Board. During the six-month period ended June 30, 2019, the effective management fee rate was 0.73% (exclusive of any applicable waivers/reimbursements).
During the six-month period ended June 30, 2019, New York Life Investments earned fees from the Portfolio in the amount of $3,781,015 and waived fees/reimbursed expenses in the amount of $14,409, and paid the Subadvisor in the amount of $1,508,458.
State Street providessub-administration andsub-accounting services to the Portfolio pursuant to an agreement with New York Life Investments. These services include calculating the daily NAVs of the Portfolio, maintaining the general ledger andsub-ledger accounts for the calculation of the Portfolio’s NAVs and assisting New York Life Investments in conducting various aspects of the Portfolio’s administrative operations. For providing these services to the Portfolio, State Street is compensated by New York Life Investments.
Pursuant to an agreement between the Fund and New York Life Investments, New York Life Investments is responsible for providing or procuring certain regulatory reporting services for the Portfolio. The Portfolio will reimburse New York Life Investments for the actual costs incurred by New York Life Investments in connection with providing or procuring these services for the Portfolio.
(B) Distribution and Service Fees. The Fund, on behalf of the Portfolio, has entered into a distribution agreement with NYLIFE Distributors LLC (the “Distributor”), an indirect,wholly-owned subsidiary of New York Life. The Portfolio has adopted a distribution plan (the “Plan”) in accordance with the provisions of Rule 12b-1 under the 1940 Act. Under the Plan, the Distributor has agreed to provide, through its affiliates or independent third parties, various distribution-related, shareholder and administrative support services to the Service Class shareholders. For its services, the Distributor is entitled to a combined distribution and service fee accrued daily and paid monthly at an annual rate of 0.25% of the average daily net assets attributable to the Service Class shares of the Portfolio.
(C) Investments in Affiliates (in 000’s). During the six-month period ended June 30, 2019, purchases and sales transactions, income earned from investments and shares held of investment companies managed by New York Life Investments or its affiliates were as follows:
| | | | | | | | | | | | | | | | | | | | | | | | | | | | | | | | | | | | |
Affiliated Investment Company | | Value,
Beginning of
Period | | | Purchases
at Cost | | | Proceeds from
Sales | | | Net
Realized
Gain/
(Loss)
on Sales | | | Change in
Unrealized
Appreciation/
(Depreciation) | | | Value,
End of
Period | | | Dividend
Income | | | Other
Distributions | | | Shares End
of Period | |
MainStay U.S. Government Liquidity Fund | | $ | 8,968 | | | $ | 186,104 | | | $ | (187,677 | ) | | $ | — | | | $ | — | | | $ | 7,395 | | | $ | 100 | | | $ | — | | | | 7,395 | |
Notes to Financial Statements(Unaudited) (continued)
Note 4–Federal Income Tax
As of June 30, 2019, the cost and unrealized appreciation (depreciation) of the Portfolio’s investment portfolio, including applicable derivative contracts and other financial instruments, as determined on a federal income tax basis, were as follows:
| | | | | | | | | | | | | | | | |
| | | Federal Tax
Cost | | | Gross
Unrealized
Appreciation | | | Gross
Unrealized
(Depreciation) | | | Net
Unrealized
Appreciation/
(Depreciation) | |
Investments in Securities | | $ | 822,020,610 | | | $ | 302,395,441 | | | $ | (4,479,035 | ) | | $ | 297,916,406 | |
During the year ended December 31, 2018, the tax character of distributions paid as reflected in the Statements of Changes in Net Assets was as follows:
| | |
|
| 2018 |
Tax-Based
Distributions
from Ordinary
Income | | Tax-Based
Distributions
from Long-Term
Gains |
| |
| $21,428,939 | | $107,226,945 |
Note 5–Custodian
State Street is the custodian of cash and securities held by the Portfolio. Custodial fees are charged to the Portfolio based on the Portfolio’s net assets and/or the market value of securities held by the Portfolio and the number of certain transactions incurred by the Portfolio.
Note 6–Line of Credit
The Portfolio and certain other funds managed by New York Life Investments maintain a line of credit with a syndicate of banks in order to secure a source of funds for temporary purposes to meet unanticipated or excessive redemption requests.
Effective July 30, 2019, under the credit agreement (the “Credit Agreement”), the aggregate commitment amount is $600,000,000 with an additional uncommitted amount of $100,000,000. The commitment fee is an annual rate of 0.15% of the average commitment amount payable quarterly, regardless of usage, to State Street, who serves as the agent to the syndicate. The commitment fee is allocated among the Portfolio and certain other funds managed by New York Life Investments based upon their respective net assets and other factors. Interest on any revolving credit loan is charged based upon the Federal Funds Rate or the one-month London Interbank Offered Rate (“LIBOR”), whichever is higher. The Credit Agreement expires on July 28, 2020, although the Portfolio, certain other funds managed by New York Life Investments and the syndicate of banks may renew the Credit Agreement for an additional year on the same or different terms. Prior to July 30, 2019, the aggregate commitment amount and the commitment fee were the same as those under the current Credit Agreement. During the six-month period ended June 30, 2019, there were no borrowings made or outstanding with respect to the Portfolio under the Credit Agreement.
Note 7–Interfund Lending Program
Pursuant to an exemptive order issued by the SEC, the Portfolio, along with certain other funds managed by New York Life Investments, may
participate in an interfund lending program. The interfund lending program provides an alternative credit facility that permits the Portfolio and certain other funds managed by New York Life Investments to lend or borrow money for temporary purposes directly to or from one another subject to the conditions of the exemptive order. During the six-month period ended June 30, 2019, there were no interfund loans made or outstanding with respect to the Portfolio.
Note 8–Purchases and Sales of Securities (in 000’s)
During the six-month period ended June 30, 2019, purchases and sales of securities, other thanshort-term securities, were $381,906 and $328,928, respectively.
Note 9–Capital Share Transactions
Transactions in capital shares for the six-month period ended June 30, 2019 and the year ended December 31, 2018, were as follows:
| | | | | | | | |
Initial Class | | Shares | | | Amount | |
| | |
Six-month period ended June 30, 2019: | | | | | | | | |
Shares sold | | | 4,052,160 | | | $ | 97,665,215 | |
Shares redeemed | | | (1,238,677 | ) | | | (31,293,616 | ) |
| | | | |
Net increase (decrease) | | | 2,813,483 | | | $ | 66,371,599 | |
| | | | |
Year ended December 31, 2018: | | | | | | | | |
Shares sold | | | 878,713 | | | $ | 21,647,590 | |
Shares issued to shareholders in reinvestment of dividends and distributions | | | 1,376,844 | | | | 34,707,849 | |
Shares redeemed | | | (6,673,215 | ) | | | (176,781,249 | ) |
| | | | |
Net increase (decrease) | | | (4,417,658 | ) | | $ | (120,425,810 | ) |
| | | | |
| | |
| | | | | | | | |
Service Class | | Shares | | | Amount | |
| | |
Six-month period ended June 30, 2019: | | | | | | | | |
Shares sold | | | 1,837,573 | | | $ | 42,963,504 | |
Shares redeemed | | | (2,437,809 | ) | | | (57,612,173 | ) |
| | | | |
Net increase (decrease) | | | (600,236 | ) | | $ | (14,648,669 | ) |
| | | | |
Year ended December 31, 2018: | | | | | | | | |
Shares sold | | | 7,282,865 | | | $ | 176,554,136 | |
Shares issued to shareholders in reinvestment of dividends and distributions | | | 3,913,368 | | | | 93,948,035 | |
Shares redeemed | | | (5,972,059 | ) | | | (143,286,193 | ) |
| | | | |
Net increase (decrease) | | | 5,224,174 | | | $ | 127,215,978 | |
| | | | |
Note 10–Recent Accounting Pronouncement
To improve the effectiveness of fair value disclosure requirements, the Financial Accounting Standards Board recently issued Accounting Standard Update (ASU)2018-13, Fair Value Measurement Disclosure Framework—Changes to the Disclosure Requirements for Fair Value Measurement (ASU2018-13), which adds, removes, and modifies certain aspects relating to fair value disclosure. ASU2018-13 is effective for interim and annual reporting periods beginning after December 15, 2019; early adoption of the additions relating to ASU2018-13 is not required. Management has evaluated the implications of certain other provisions of the ASU and has determined to early adopt aspects related to the removal and modifications of certain fair value measurement disclosures under the ASU effective immediately. At this
| | |
| 20 | | MainStay VP Large Cap Growth Portfolio |
time, management is evaluating the implications of certain other provisions of the ASU related to new disclosure requirements and any impact on the financial statement disclosures has not yet been determined.
Note 11–Subsequent Events
In connection with the preparation of the financial statements of the Portfolio as of and for the six-month period ended June 30, 2019, events and transactions subsequent to June 30, 2019, through the date
the financial statements were issued have been evaluated by the Portfolio’s management for possible adjustment and/or disclosure. No subsequent events requiring financial statement adjustment or disclosure have been identified.
Proxy Voting Policies and Procedures and Proxy Voting Record
A description of the policies and procedures that New York Life Investments uses to vote proxies related to the Portfolio’s securities is available without charge, upon request (i) by calling800-598-2019; (ii) by visiting New York Life Investments website at https://www.nylinvestments.com/mainstay/products-and-performance/mainstay-vp-funds-trust; or (iii) by visiting the SEC’s website at www.sec.gov.
The Portfolio is required to file with the SEC its proxy voting record for the12-month period ending June 30 on Form N-PX. The Portfolio’s most recent Form N-PX or proxy voting record is available free of charge upon request (i) by calling800-598-2019; (ii) by visiting New York Life Investments website at https://www.nylinvestments.com/mainstay/products-and-performance/mainstay-vp-funds-trust; or (iii) by visiting the SEC’s website atwww.sec.gov.
Shareholder Reports and Quarterly Portfolio Disclosure
The Portfolio is required to file its complete schedule of portfolio holdings with the SEC 60 days after each fiscal quarter onForm N-PORT. The Portfolio’s holdings report is available without charge upon request (i) by calling800-598-2019; (ii) by visiting New York Life Investments website at https://www.nylinvestments.com/mainstay/products-and-performance/mainstay-vp-funds-trust; or (iii) on the SEC’s website at www.sec.gov.
| | |
| 22 | | MainStay VP Large Cap Growth Portfolio |
MainStay VP Portfolios
MainStay VP offers a wide range of Portfolios. The full array of MainStay VP offerings is listed here, with information about the manager, subadvisors, legal counsel, and independent registered public accounting firm.
Equity Portfolios
MainStay VP Eagle Small Cap Growth Portfolio
MainStay VP Emerging Markets Equity Portfolio
MainStay VP Epoch U.S. Equity Yield Portfolio
MainStay VP Fidelity Institutional AM® Utilities Portfolio†
MainStay VP Large Cap Growth Portfolio
MainStay VP MacKay Common Stock Portfolio
MainStay VP MacKay Growth Portfolio
MainStay VP MacKay International Equity Portfolio
MainStay VP MacKay Mid Cap Core Portfolio
MainStay VP MacKay S&P 500 Index Portfolio
MainStay VP MacKay Small Cap Core Portfolio
MainStay VP Mellon Natural Resources Portfolio
MainStay VP T. Rowe Price Equity Income Portfolio
Mixed Asset Portfolios
MainStay VP Balanced Portfolio
MainStay VP Income Builder Portfolio
MainStay VP Janus Henderson Balanced Portfolio
MainStay VP MacKay Convertible Portfolio
Income Portfolios
MainStay VP Bond Portfolio
MainStay VP Floating Rate Portfolio
MainStay VP Indexed Bond Portfolio
MainStay VP MacKay Government Portfolio
MainStay VP MacKay High Yield Corporate Bond Portfolio
MainStay VP MacKay Unconstrained Bond Portfolio
MainStay VP PIMCO Real Return Portfolio
Money Market
MainStay VP U.S. Government Money Market Portfolio
Alternative
MainStay VP Cushing Renaissance Advantage Portfolio
MainStay VP IQ Hedge Multi-Strategy Portfolio
Asset Allocation Portfolios
MainStay VP Conservative Allocation Portfolio
MainStay VP Growth Allocation Portfolio
MainStay VP Moderate Allocation Portfolio
MainStay VP Moderate Growth Allocation Portfolio
Manager
New York Life Investment Management LLC
New York, New York
Subadvisors
Candriam Belgium*
Brussels, Belgium
Cushing Asset Management, LP
Dallas, Texas
Eagle Asset Management, Inc.
St Petersburg, Florida
Epoch Investment Partners, Inc.
New York, New York
FIAM LLC
Smithfield, Rhode Island
IndexIQ Advisors LLC*
New York, New York
Janus Capital Management LLC
Denver, Colorado
MacKay Shields LLC*
New York, New York
Mellon Investments Corporation
Boston, Massachusetts
NYL Investors LLC*
New York, New York
Pacific Investment Management Company LLC
Newport Beach, California
T. Rowe Price Associates, Inc.
Baltimore, Maryland
Winslow Capital Management, LLC
Minneapolis, Minnesota
Distributor
NYLIFE Distributors LLC*
Jersey City, New Jersey
Custodian
State Street Bank and Trust Company
Boston, Massachusetts
Independent Registered Public Accounting Firm
PricewaterhouseCoopers LLP
New York, New York
Legal Counsel
Dechert LLP
Washington, District of Columbia
Some Portfolios may not be available in all products.
| † | Fidelity Institutional AM is a registered trade mark of FMR LLC. Used with permission. |
| * | An affiliate of New York Life Investment Management LLC |
Not part of the Semiannual Report
2019 Semiannual Report
This report is for the general information of New York Life Variable Annuities and NYLIAC Variable Universal Life Insurance Products policyowners. It must be preceded or accompanied by the appropriate product(s) and funds prospectuses if it is given to anyone who is not an owner of a New York Life variable annuity policy or a NYLIAC Variable Universal Life Insurance Product. This report does not offer for sale or solicit orders to purchase securities.
The performance data quoted in this report represents past performance. Past performance is no guarantee of future results. Due to market volatility and other factors, current performance may be lower or higher than the figures shown. The most recent month-end performance summary for your variable annuity or variable life policy is available by calling 800-598-2019 and is updated periodically on www.newyorklife.com.
The New York Life Variable Annuities and NYLIAC Variable Universal Life Insurance Products are issued by New York Life Insurance and Annuity Corporation (a Delaware Corporation) and distributed by NYLIFE Distributors LLC (Member FINRA/SIPC).
New York Life Insurance Company
New York Life Insurance and Annuity Corporation (NYLIAC) (A Delaware Corporation)
51 Madison Avenue, Room 551
New York, NY 10010
www.newyorklife.com
Printed on recycled paper
nylinvestments.com
NYLIFE Distributors LLC, 30 Hudson Street, Jersey City, NJ 07302
New York Life Investment Management LLC is the investment manager to the MainStay VP Funds Trust
©2019 by NYLIFE Distributors LLC. All rights reserved.
You may obtain copies of the Prospectus and the Statement of Additional Information free of charge, upon request, by callingtoll-free 800-598-2019 or writing to New York Life Insurance and Annuity Corporation, 51 Madison Avenue, New York, NY 10010.
| | | | |
| | | |
| Not FDIC Insured | | No Bank Guarantee | | May Lose Value |
| | | | |
| 1781631 | | | | MSVPLG10-08/19 (NYLIAC) NI525 |
MainStay VP Fidelity Institutional AM® Utilities Portfolio*
(Formerly known as MainStay VP MFS® Utilities Portfolio)
Message from the President and Semiannual Report
Unaudited | June 30, 2019

Beginning on January 1, 2021, as permitted by regulations adopted by the Securities and Exchange Commission, paper copies of the MainStay VP Portfolio annual and semi-annual shareholder reports may no longer be sent by mail, unless you specifically request paper copies of the reports from the insurance company that offers your policy. Instead, the reports will be made available online, and you will be notified by mail each time a report is posted and provided with a website link to access the report. Instructions for requesting paper copies will be provided by your insurance company.
If you already elected to receive shareholder reports electronically, you will not be affected by this change and you need not take any action. At any time, you may elect to receive reports and other communications from the insurance company electronically by following the instructions provided by the insurance company.
You may elect to receive all future shareholder reports in paper form free of charge. You can inform the insurance company that you wish to receive paper copies of reports by following the instructions provided by the insurance company. Your election to receive reports in paper form will apply to all portfolio companies available under your contract.
| | | | | | | | |
| | | | | |
| Not FDIC/NCUA Insured | | Not a Deposit | | May Lose Value | | No Bank Guarantee | | Not Insured by Any Government Agency |
| * | Fidelity Institutional AM is a registered trade mark of FMR LLC. Used with permission. |

This page intentionally left blank
Message from the President
Most equity and fixed-income markets in the United States and around the world advanced in the face of conflicting political and macroeconomic forces during thesix-month period ended June 30, 2019.
The reporting period began on the heels of tumultuous December 2018, during which equities and equity-sensitive bonds spiked sharply lower on concerns regarding the pace of economic growth, a U.S. government shutdown and the potential impact of trade disputes between the United States and other nations, particularly China. Markets recovered quickly in early 2019 as trade tensions eased, the government reopened and the U.S. Federal Reserve Board (Fed) adopted a more patient tone regarding the future direction of interest rates. Markets moved broadly higher from January through April, supported by encouraging economic data and generally strong corporate earnings.
During the first four months of the reporting period, the improving economic environment encouraged investors to favor areas of the market viewed as offering greater return potential along with higher risks. Among U.S. stocks, cyclical, growth-oriented sectors tended to outperform more defensive, value-oriented sectors, whilelarge-cap stocks outperformed theirsmaller-cap counterparts. Within the S&P 500® Index, the information technology sector led the market’s advance, followed by communication services, consumer discretionary and consumer staples. Industrials, utilities, financials, materials, real estate and energy produced more modest gains. While some international equity markets outperformed or underperformed the U.S. market, on average international stocks mirrored the performance of their U.S. counterparts. Fixed-income securities gained ground as well, albeit along a more gradual trajectory. Among U.S. fixed-income instruments, corporate issues generally outperformed government bonds, with lower credit quality, higher yielding securities leading the sector’s advance. Long-term U.S. Treasury bond yields proved particularly weak, with
10-year yields dipping at times below3-month yields, reflecting investors’ continued concerns about domestic economic growth.
May 2019 saw a return of uncertainty and volatility. Trade discussions between the United States and China faltered, driving global equity prices lower. Government bond prices rose as investors sought safe havens. June brought yet anotherU-turn as equity prices climbed again after comments from the Fed raised hopes of an interest rate cut in response to weak economic data. Stock and bond prices rose, with U.S. equity markets ending the reporting period in record territory.
We are pleased to see renewed signs of strength in broad areas of the financial market. At the same time, we remained sharply focused on providing you, as a MainStay VP investor, with the experienced and disciplined fund management that we believe underpins an effective, long-term investment strategy. Whatever tomorrow’s investment environment brings, you can rely on our portfolio managers to pursue the objectives of their individual Portfolios as outlined in the prospectus with the energy and dedication you have come to expect.
The report that follows contains additional information on the market events, investment decisions and specific securities that shaped your VP Portfolio’s performance during the six months ended June 30, 2019. We encourage you to read the report carefully and use it to evaluate your Portfolio’s performance in light of your long-range financial plan.
Sincerely,

Kirk C. Lehneis
President
The opinions expressed are as of the date of this report and are subject to change. There is no guarantee that any forecast made will come to pass. This material does not constitute investment advice and is not intended as an endorsement of any specific investment. Past performance is no guarantee of future results.
Not part of the Semiannual Report
Table of Contents
Investors should refer to the Portfolio’s Summary Prospectus and/or Prospectus and consider the Portfolio’s investment objectives, strategies, risks, charges and expenses carefully before investing. The Summary Prospectus and/or Prospectus contain this and other information about the Portfolio. You may obtain copies of the Portfolio’s Summary Prospectus and/or the Prospectus and the Statement of Additional Information free of charge, upon request, by calling toll-free 800-598-2019, by writing to New York Life Insurance and Annuity Corporation, 51 Madison Avenue, Room 251, New York, New York 10010 or by sending an email to MainStayShareholdersServices@nylim.com. These documents are also available at nylinvestments.com/vpdocuments. Please read the Summary Prospectus and/or Prospectus carefully before investing. MainStay VP Funds Trust portfolios are separate account options which are purchased through a variable insurance or variable annuity contract.
Investment and Performance Comparison1(Unaudited)
Performance data quoted represents past performance. Past performance is no guarantee of future results. Because of market volatility and other factors, current performance may be lower or higher than the figures shown. Investment return and principal value will fluctuate, and as a result, when shares are redeemed, they may be worth more or less than their original cost. The performance table and graph do not reflect any deduction of sales charges, mortality and expense charges, contract charges or administrative charges. Please refer to the Performance Summary appropriate for your policy. For performance information current to the most recent month-end, please call800-598-2019 or visit www.newyorklife.com.
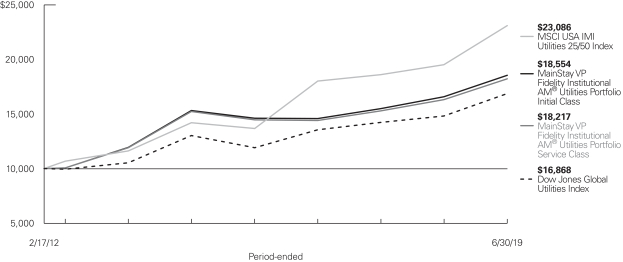
Average Annual Total Returns for the Period-Ended June 30, 2019
| | | | | | | | | | | | | | | | | | | | | | | | |
| Class | | Inception
Date | | | Six Months | | | One Year | | | Five Years | | | Since Inception2 | | | Gross
Expense
Ratio3 | |
| | | | | | |
| Initial Class Shares | | | 2/17/2012 | | | | 13.82 | % | | | 11.96 | % | | | 3.89 | % | | | 8.75 | % | | | 0.68 | % |
| Service Class Shares | | | 2/17/2012 | | | | 13.68 | | | | 11.68 | | | | 3.64 | | | | 8.48 | | | | 0.93 | |
| | | | | | | | | | | | | | | | |
| Benchmark Performance | | Six Months | | | One Year | | | Five
Years | | | Since Inception | |
| | | | |
MSCI USA IMI Utilities 25/50 Index4 | | | 14.46 | % | | | 18.34 | % | | | 10.19 | % | | | 12.03 | % |
Dow Jones Global Utilities Index5 | | | 12.83 | | | | 13.87 | | | | 5.32 | | | | 7.36 | |
Morningstar Utilities Category Average6 | | | 14.06 | | | | 15.62 | | | | 7.93 | | | | 9.94 | |
| 1. | Performance figures may reflect certain fee waivers and/or expense limitations, without which total returns may have been different. For information on current fee waivers and/or expense limitations (if any), please refer to the Notes to Financial Statements. |
| 2. | The Portfolio replaced its subadvisor and modified its principal investment strategies and changed its classification from a diversified fund to a non-diversified fund as of November 30, 2018. Therefore, the performance information shown in this report prior to November 30, 2018 reflects the Portfolio’s prior subadvisor, principal investment strategies and diversification status. |
| 3. | The gross expense ratios presented reflect the Portfolio’s “Total Annual Portfolio Operating Expenses” from the most recent Prospectus, as supplemented, and may differ from other expense ratios disclosed in this report. |
| 4. | The MSCI USA IMI Utilities 25/50 Index is the Portfolio’s primary benchmark. The MSCI USA IMI Utilities 25/50 Index is a modified market capitalization-weighted index of stocks designed to measure the performance of utilities companies in the MSCI U.S. Investable Market 2500 Index, the aggregation |
| | of the MSCI U.S. Large Cap 300, Mid Cap 450, and Small Cap 1750 Indices, covering approximately 99% of the free float-adjusted market capitalization in the United States. The MSCI USA IMI Utilities 25/50 Index includes providers of electricity, gas and water; independent power producers and energy traders; generation and distribution of electricity as in renewable sources. Results assume reinvestment of all dividends and capital gains. An investment cannot be made directly in an index. |
| 5. | Prior to November 30, 2018, the Dow Jones Global Utilities Index was the Portfolio’s primary benchmark. The Dow Jones Global Utilities Index is a free-float market-capitalization-weighted index that measures the performance of utility companies in developed and emerging markets. Results assume reinvestment of all dividends and capital gains. An investment cannot be made directly in an index. |
| 6. | The Morningstar Utilities Category Average is representative of funds that seek capital appreciation by investing primarily in equity securities of U.S. or non-U.S. public utilities including electric, gas, and telephone-service providers. Results are based on average total returns of similar funds with all dividends and capital gain distributions reinvested. |
Cost in Dollars of a $1,000 Investment in MainStay VP Fidelity Institutional AM® Utilities Portfolio (Unaudited)
The example below is intended to describe the fees and expenses borne by shareholders during the six-month period from January 1, 2019, to June 30, 2019, and the impact of those costs on your investment.
Example
As a shareholder of the Portfolio you incur two types of costs: (1) transaction costs, including exchange fees and sales charges (loads) on purchases (as applicable), and (2) ongoing costs, including management fees, distribution and/or service (12b-1) fees, and other Portfolio expenses (as applicable). This example is intended to help you understand your ongoing costs (in dollars) of investing in the Portfolio and to compare these costs with the ongoing costs of investing in other mutual funds. The example is based on an investment of $1,000 made at the beginning of the six-month period and held for the entire period from January 1, 2019, to June 30, 2019. Shares are only sold in connection with variable life and annuity contracts and the example does not reflect any contract level or transactional fees or expenses. If these costs had been included, your costs would have been higher.
This example illustrates your Portfolio’s ongoing costs in two ways:
Actual Expenses
The second and third data columns in the table below provide information about actual account values and actual expenses. You may use the information in these columns, together with the amount you invested, to estimate the expenses that you paid during the six months ended June 30, 2019. Simply divide your account value by $1,000
(for example, an $8,600 account value divided by $1,000 = 8.6), then multiply the result by the number under the heading entitled “Expenses Paid During Period” to estimate the expenses you paid on your account during this period.
Hypothetical Example for Comparison Purposes
The fourth and fifth data columns in the table below provide information about hypothetical account values and hypothetical expenses based on the Portfolio’s actual expense ratio and an assumed rate of return of 5% per year before expenses, which is not the Portfolio’s actual return. The hypothetical account values and expenses may not be used to estimate the actual ending account balances or expenses you paid for the six-month period shown. You may use this information to compare the ongoing costs of investing in the Portfolio with the ongoing costs of investing in other mutual funds. To do so, compare this 5% hypothetical example with the 5% hypothetical examples that appear in the shareholder reports of the other mutual funds.
Please note that the expenses shown in the table are meant to highlight your ongoing costs only and do not reflect any transactional costs, such as exchange fees or sales charges (loads). Therefore, the fourth and fifth data columns of the table are useful in comparing ongoing costs only and will not help you determine the relative total costs of owning different funds. In addition, if these transactional costs were included, your costs would have been higher.
| | | | | | | | | | | | | | | | | | | | | | |
| | | | | | | | | | | | | | | | | | |
| Share Class | | Beginning
Account
Value
1/1/19 | | | Ending Account
Value (Based
on Actual
Returns and
Expenses)
6/30/19 | | | Expenses
Paid
During
Period1 | | | Ending Account
Value (Based
on Hypothetical
5% Annualized
Return and
Actual Expenses)
6/30/19 | | | Expenses
Paid
During
Period1 | | | Net Expense
Ratio
During
Period2 |
| | | | | | |
| Initial Class Shares | | $ | 1,000.00 | | | $ | 1,138.20 | | | $ | 3.66 | | | $ | 1,021.37 | | | $ | 3.46 | | | 0.69% |
| | | | | | |
| Service Class Shares | | $ | 1,000.00 | | | $ | 1,136.80 | | | $ | 4.98 | | | $ | 1,020.13 | | | $ | 4.71 | | | 0.94% |
| 1. | Expenses are equal to the Portfolio’s annualized expense ratio of each class multiplied by the average account value over the period, divided by 365 and multiplied by 181 (to reflect the six-month period). The table above represents the actual expenses incurred during the six-month period. In addition to the fees and expenses which the Portfolio bears directly, it also indirectly bears a pro rata share of the fees and expenses of the underlying funds in which it invests. Such indirect expenses are not included in the above-reported expense figures. |
| 2. | Expenses are equal to the Portfolio’s annualized expense ratio to reflect the six-month period. |
| | |
| 6 | | MainStay VP Fidelity Institutional AM Utilities Portfolio |
Industry Composition as of June 30, 2019(Unaudited)
| | | | |
| |
| Electric Utilities | | | 53.3 | % |
| |
| Multi-Utilities | | | 26.2 | |
| |
| Independent Power & Renewable Electricity Producers | | | 8.7 | |
| |
| Gas Utilities | | | 4.8 | |
| |
| Oil, Gas & Consumable Fuels | | | 2.8 | |
| |
| Media | | | 1.4 | |
| | | | |
| |
| Water Utilities | | | 0.5 | % |
| |
| Short-Term Investment | | | 2.9 | |
| |
| Other Assets, Less Liabilities | | | –0.6 | |
| | | | |
| | | 100.0 | % |
| | | | |
See Portfolio of Investments beginning on page 10 for specific holdings within these categories. The Portfolio’s holdings are subject to change.
Top Ten Holdings as of June 30, 2019(excluding short-term investment) (Unaudited)
| 9. | Public Service Enterprise Group, Inc. |
Portfolio Management Discussion and Analysis(Unaudited)
Answers to the questions reflect the views of portfolio manager Douglas Simmons of FIAM LLC (“FIAM”) the Portfolio’s Subadvisor.
How did MainStay VP Fidelity Institutional AM® Utilities Portfolio1 perform relative to its benchmarks and peers during the six months ended June 30, 2019?
For the six months ended June 30, 2019, MainStay VP Fidelity Institutional AM® Utilities Portfolio returned 13.82% for Initial Class shares and 13.68% for Service Class shares. Over the same period, both share classes underperformed the 14.46% return of the MSCI USA IMI Utilities 25/50 Index,which is the Portfolio’s primary benchmark, and outperformed the 12.83% return of the Dow Jones Global Utilities Index, which is the Portfolio’s secondary benchmark. For the six months ended June 30, 2019, both share classes underperformed the 14.06% return of the Morningstar Utilities Category Average.2
What factors affected the Portfolio’s relative performance during the reporting period?
The Portfolio’s performance lagged that of its benchmark, the S&P MSCI USA IMI Utilities 25/50 Index, primarily due to disappointing allocations to the independent power producers & energy traders and water utilities subsectors.
Which subsectors were the strongest positive contributors to the Portfolio’s relative performance, and which subsectors were particularly weak?
During the reporting period, water utilities recorded the strongest performance of any industry in the index, however, the subsector represented only a small portion of the Portfolio and index. The subsectors making the weakest contributions to the Portfolio’s performance relative to the MSCI USA IMI Utilities 25/50 Index included independent power producers & energy traders (IPP’s) and water utilities. (Contributions take weightings and total returns into account.) In general, IPPs generated substantially lower returns than other subsectors in the benchmark, and the Portfolio held overweight exposure to the industry. Anout-of-index position in the cable & satellite subsector was a significant contributor to relative performance during the period
During the reporting period, which individual stocks made the strongest positive contributions to the Portfolio’s absolute performance and which stocks detracted the most?
The Portfolio’s best-performing stocks on an absolute basis during the reporting period included diversified utility Sempra Energy and electric utilities Southern Company and NexEra Energy. Shares in Sempra Energy rose after the company
reported strong guidance during its first quarterly earnings
release of 2019. The stock also benefited from constructive action by the government in California to address wildfire issues, which had affected some of the company’s local operations. Southern Company shares have benefited since the U.S. government approved almost $4B in loan guarantees for the company’s nuclear plant in Georgia that will help them reduce costs. NextEra continues to be a gold standard in the utility sector and boasts the largest renewables business of any company in the space. However, we have trimmed our position as the company’s valuation has risen.
The most substantial detractors from the Portfolio’s absolute performance during the year included two independent power producers & energy traders (IPP), Vistra Energy, and NRG Energy, as well as electric utility PG&E. Both Vistra Energy and NRG Energy suffered due to falling energy prices prompted by mild weather in some of their areas of operation. PG&E, the largest detractor of absolute performance, has struggled after the fallout of litigation and bankruptcy issues stemming from deadly wildfires in northern California last year.
Did the Portfolio make any significant purchases or sales during the reporting period?
The Portfolio’s most significant purchases during the reporting period included adding to its existing positions in electric utilities Duke Energy and The Southern Company. In notable sales, the Portfolio exited its positions in integrated telecommunications company AT&T and oil & gas storage & transportation provider The Williams Companies.
How did the Portfolio’s subsector weightings change during the reporting period?
The Portfolio increased its exposure to electric utilities during the reporting period primarily by adding to existing positions in Duke Energy and The Southern Company, as mentioned earlier. During the same period, the Portfolio reduced its exposure to oil & gas storage & transportation, anout-of-benchmark subsector, as a result of exiting from its position in The Williams Companies. The Portfolio also decreased its exposure in the multi-utilities subsector, primarily as a result of trimming existing holdings.
How was the Portfolio positioned at the end of the reporting period?
As of June 30, 2019, the Portfolio held relatively large overweight exposures relative to the MSCI USA IMI Utilities 25/50 Index in the independent power producers & energy traders and oil & gas storage & transportation subsectors. As of the same
| 1. | Fidelity Institutional AM is a registered trade mark of FMR LLC. Used with permission. |
| 2. | See page 5 for more information on benchmark and peer group returns. |
| | |
| 8 | | MainStay VP Fidelity Institutional AM Utilities Portfolio |
date, the Portfolio’s most significant underweighted exposures included the multi-utilities and water utilities subsectors. Consistent with our investment philosophy, the portfolio is predominately positioned in what we believe are likely to be the fastest growing dividend names going forward, as these names have historically tended to outperform the utilities sector over time. We generally add names that we believe provide enticing valuations in addition to an attractive overall risk/return profile.
The opinions expressed are those of the portfolio managers as of the date of this report and are subject to change. There is no guarantee that any forecasts will come to pass. This material does not constitute investment advice and is not intended as an endorsement of any specific investment.
Not all MainStay VP Portfolios and/or share classes are available under all policies.
Portfolio of InvestmentsJune 30, 2019 (Unaudited)
| | | | | | | | |
| | |
Shares | | | Value | |
| Common Stocks 97.7%† | |
Electric Utilities 53.3% | |
American Electric Power Co., Inc. | | | 458,200 | | | $ | 40,326,182 | |
Avangrid, Inc. | | | 492,767 | | | | 24,884,733 | |
Duke Energy Corp. | | | 530,800 | | | | 46,837,792 | |
Edison International | | | 1,232,387 | | | | 83,075,208 | |
Entergy Corp. | | | 579,544 | | | | 59,652,464 | |
Evergy, Inc. | | | 345,343 | | | | 20,772,381 | |
Exelon Corp. | | | 2,527,077 | | | | 121,148,071 | |
FirstEnergy Corp. | | | 1,384,218 | | | | 59,258,373 | |
NextEra Energy, Inc. | | | 299,133 | | | | 61,280,386 | |
PG&E Corp. (a) | | | 606,626 | | | | 13,903,868 | |
PPL Corp. | | | 560,063 | | | | 17,367,554 | |
Southern Co. | | | 1,712,700 | | | | 94,678,056 | |
| | | | | | | | |
| | | | | | | 643,185,068 | |
| | | | | | | | |
Gas Utilities 4.8% | |
Atmos Energy Corp. | | | 351,000 | | | | 37,051,560 | |
Southwest Gas Holdings, Inc. | | | 224,000 | | | | 20,074,880 | |
| | | | | | | | |
| | | | | | | 57,126,440 | |
| | | | | | | | |
Independent Power & Renewable Electricity Producers 8.7% | |
AES Corp. | | | 829,250 | | | | 13,898,230 | |
Atlantica Yield PLC (Spain) | | | 155,880 | | | | 3,533,800 | |
Clearway Energy, Inc., Class C | | | 105,000 | | | | 1,770,300 | |
NextEra Energy Partners, L.P. | | | 437,114 | | | | 21,090,750 | |
NRG Energy, Inc. | | | 671,846 | | | | 23,595,232 | |
Vistra Energy Corp. | | | 1,826,542 | | | | 41,352,911 | |
| | | | | | | | |
| | | | | | | 105,241,223 | |
| | | | | | | | |
Media 1.4% | |
Altice U.S.A., Inc., Class A (a) | | | 707,732 | | | | 17,233,274 | |
| | | | | | | | |
| | | | | | | | |
| | |
Shares | | | Value | |
Multi-Utilities 26.2% | |
CenterPoint Energy, Inc. | | | 1,358,248 | | | $ | 38,886,640 | |
Dominion Energy, Inc. | | | 1,585,239 | | | | 122,570,680 | |
Public Service Enterprise Group, Inc. | | | 994,784 | | | | 58,513,195 | |
Sempra Energy | | | 700,882 | | | | 96,329,222 | |
| | | | | | | | |
| | | | | | | 316,299,737 | |
| | | | | | | | |
Oil, Gas & Consumable Fuels 2.8% | |
Cheniere Energy, Inc. (a) | | | 493,253 | | | | 33,763,168 | |
| | | | | | | | |
|
Water Utilities 0.5% | |
SJW Corp. | | | 97,864 | | | | 5,947,195 | |
| | | | | | | | |
Total Common Stocks
(Cost $1,019,966,541) | | | | | | | 1,178,796,105 | |
| | | | | | | | |
|
| Short-Term Investment 2.9% | |
Affiliated Investment Company 2.9% | |
MainStay U.S. Government Liquidity Fund, 2.03% (b) | | | 35,459,958 | | | | 35,459,958 | |
| | | | | | | | |
TotalShort-Term Investment
(Cost $35,459,958) | | | | | | | 35,459,958 | |
| | | | | | | | |
Total Investments
(Cost $1,055,426,499) | | | 100.6 | % | | | 1,214,256,063 | |
Other Assets, Less Liabilities | | | (0.6 | ) | | | (7,247,422 | ) |
Net Assets | | | 100.0 | % | | $ | 1,207,008,641 | |
| † | Percentages indicated are based on Portfolio net assets. |
| (a) | Non-income producing security. |
| (b) | Current yield as of June 30, 2019. |
The following is a summary of the fair valuations according to the inputs used as of June 30, 2019, for valuing the Portfolio’s assets:
| | | | | | | | | | | | | | | | |
Description | | Quoted
Prices in Active
Markets for
Identical Assets (Level 1) | | | Significant Other
Observable Inputs
(Level 2) | | | Significant
Unobservable Inputs (Level 3) | | | Total | |
| | | | |
Asset Valuation Inputs | | | | | | | | | | | | | | | | |
| Investments in Securities (a) | | | | | | | | | | | | | | | | |
| Common Stocks | | $ | 1,178,796,105 | | | $ | — | | | $ | — | | | $ | 1,178,796,105 | |
| Short-Term Investment | | | | | | | | | | | | | | | | |
Affiliated Investment Company | | | 35,459,958 | | | | — | | | | — | | | | 35,459,958 | |
| | | | | | | | | | | | | | | | |
| Total Investments in Securities | | $ | 1,214,256,063 | | | $ | — | | | $ | — | | | $ | 1,214,256,063 | |
| | | | | | | | | | | | | | | | |
| (a) | For a complete listing of investments and their industries, see the Portfolio of Investments. |
| | | | |
| 10 | | MainStay VP Fidelity Institutional AM Utilities Portfolio | | The notes to the financial statements are an integral part of,
and should be read in conjunction with, the financial statements. |
Statement of Assets and Liabilitiesas of June 30, 2019 (Unaudited)
| | | | |
| Assets | | | | |
Investment in securities, at value
(identified cost $1,019,966,541) | | $ | 1,178,796,105 | |
Investment in affiliated investment company, at value (identified cost $35,459,958) | | | 35,459,958 | |
Cash denominated in foreign currencies
(identified cost $365,278) | | | 367,764 | |
| |
Receivables: | | | | |
Investment securities sold | | | 2,740,963 | |
Dividends | | | 1,225,783 | |
Portfolio shares sold | | | 283,518 | |
Other assets | | | 5,772 | |
| | | | |
Total assets | | | 1,218,879,863 | |
| | | | |
| |
| Liabilities | | | | |
Payables: | | | | |
Investment securities purchased | | | 10,374,062 | |
Manager (See Note 3) | | | 630,758 | |
Portfolio shares redeemed | | | 507,031 | |
NYLIFE Distributors (See Note 3) | | | 229,629 | |
Custodian | | | 80,615 | |
Professional fees | | | 39,746 | |
Trustees | | | 3,527 | |
Accrued expenses | | | 5,854 | |
| | | | |
Total liabilities | | | 11,871,222 | |
| | | | |
Net assets | | $ | 1,207,008,641 | |
| | | | |
| |
| Composition of Net Assets | | | | |
Shares of beneficial interest outstanding (par value of $.001 per share) unlimited number of shares authorized | | $ | 91,275 | |
Additional paid-in capital | | | 944,190,993 | |
| | | | |
| | | 944,282,268 | |
Total distributable earnings (loss) | | | 262,726,373 | |
| | | | |
Net assets | | $ | 1,207,008,641 | |
| | | | |
| | | | |
Initial Class | | | | |
Net assets applicable to outstanding shares | | $ | 91,575,173 | |
| | | | |
Shares of beneficial interest outstanding | | | 6,888,264 | |
| | | | |
Net asset value per share outstanding | | $ | 13.29 | |
| | | | |
Service Class | | | | |
Net assets applicable to outstanding shares | | $ | 1,115,433,468 | |
| | | | |
Shares of beneficial interest outstanding | | | 84,386,651 | |
| | | | |
Net asset value per share outstanding | | $ | 13.22 | |
| | | | |
| | | | | | |
The notes to the financial statements are an integral part of,
and should be read in conjunction with, the financial statements. | | | | | 11 | |
Statement of Operationsfor the six months ended June 30, 2019 (Unaudited)
| | | | |
| Investment Income (Loss) | | | | |
Income | | | | |
Dividends-unaffiliated (a) | | $ | 18,760,516 | |
Dividends-affiliated | | | 106,970 | |
Interest | | | 51,082 | |
| | | | |
Total income | | | 18,918,568 | |
| | | | |
Expenses | | | | |
Manager (See Note 3) | | | 3,765,002 | |
Distribution/Service—Service Class (See Note 3) | | | 1,375,154 | |
Shareholder communication | | | 131,971 | |
Custodian | | | 75,249 | |
Professional fees | | | 62,909 | |
Trustees | | | 14,505 | |
Miscellaneous | | | 23,390 | |
| | | | |
Total expenses | | | 5,448,180 | |
| | | | |
Net investment income (loss) | | | 13,470,388 | |
| | | | |
|
| Realized and Unrealized Gain (Loss) on Investments and Foreign Currency Transactions | |
Net realized gain (loss) on: | | | | |
Unaffiliated investment transactions | | | 6,852,530 | |
Foreign currency transactions | | | 4,755 | |
| | | | |
Net realized gain (loss) on investments and foreign currency transactions | | | 6,857,285 | |
| | | | |
Net change in unrealized appreciation (depreciation) on: | | | | |
Unaffiliated investments | | | 132,186,191 | |
Translation of other assets and liabilities in foreign currencies | | | 3,773 | |
| | | | |
Net change in unrealized appreciation (depreciation) on investments and foreign currency transactions | | | 132,189,964 | |
| | | | |
Net realized and unrealized gain (loss) on investments and foreign currency transactions | | | 139,047,249 | |
| | | | |
Net increase (decrease) in net assets resulting from operations | | $ | 152,517,637 | |
| | | | |
| (a) | Dividends recorded net of foreign withholding taxes in the amount of $15,987. |
| | | | |
| 12 | | MainStay VP Fidelity Institutional AM Utilities Portfolio | | The notes to the financial statements are an integral part of,
and should be read in conjunction with, the financial statements. |
Statements of Changes in Net Assets
for the six months ended June 30, 2019 (Unaudited) and the year ended December 31, 2018
| | | | | | | | |
| | | 2019 | | | 2018 | |
| Increase (Decrease) in Net Assets | |
Operations: | | | | | | | | |
Net investment income (loss) | | $ | 13,470,388 | | | $ | 26,491,768 | |
Net realized gain (loss) on investments and foreign currency transactions | | | 6,857,285 | | | | 61,314,371 | |
Net change in unrealized appreciation (depreciation) on investments and foreign currency transactions | | | 132,189,964 | | | | (77,218,603 | ) |
| | | | |
Net increase (decrease) in net assets resulting from operations | | | 152,517,637 | | | | 10,587,536 | |
| | | | |
Distributions to shareholders: | | | | | | | | |
Initial Class | | | — | | | | (1,159,233 | ) |
Service Class | | | — | | | | (12,737,521 | ) |
| | | | |
Total distributions to shareholders | | | — | | | | (13,896,754 | ) |
| | | | |
Capital share transactions: | | | | | | | | |
Net proceeds from sale of shares | | | 15,159,826 | | | | 56,429,346 | |
Net asset value of shares issued to shareholders in reinvestment of dividends and distributions | | | — | | | | 13,896,754 | |
Cost of shares redeemed | | | (109,347,361 | ) | | | (241,813,209 | ) |
| | | | |
Increase (decrease) in net assets derived from capital share transactions | | | (94,187,535 | ) | | | (171,487,109 | ) |
| | | | |
Net increase (decrease) in net assets | | | 58,330,102 | | | | (174,796,327 | ) |
| | |
| Net Assets | | | | | | | | |
Beginning of period | | | 1,148,678,539 | | | | 1,323,474,866 | |
| | | | |
End of period | | $ | 1,207,008,641 | | | $ | 1,148,678,539 | |
| | | | |
| | | | | | |
The notes to the financial statements are an integral part of,
and should be read in conjunction with, the financial statements. | | | | | 13 | |
Financial Highlightsselected per share data and ratios
| | | | | | | | | | | | | | | | | | | | | | | | | | | | |
| | | |
| | | Six months ended June 30, | | | | | | Year ended December 31, | |
| | | | | | | |
| Initial Class | | 2019* | | | | | | 2018 | | | 2017 | | | 2016 | | | 2015 | | | 2014 | |
| | | | | | | |
Net asset value at beginning of period | | $ | 11.68 | | | | | | | $ | 11.75 | | | $ | 10.66 | | | $ | 10.15 | | | $ | 13.42 | | | $ | 12.65 | |
| | | | | | | | | | | | | | | | | | | | | | | | | | | | |
| | | | | | | |
Net investment income (loss) (a) | | | 0.16 | | | | | | | | 0.28 | | | | 0.25 | | | | 0.19 | | | | 0.28 | | | | 0.38 | |
| | | | | | | |
Net realized and unrealized gain (loss) on investments | | | 1.45 | | | | | | | | (0.32 | ) | | | 1.49 | | | | 0.88 | | | | (2.25 | ) | | | 1.05 | |
| | | | | | | |
Net realized and unrealized gain (loss) on foreign currency transactions | | | 0.00 | ‡ | | | | | | | 0.14 | | | | (0.16 | ) | | | 0.08 | | | | 0.13 | | | | 0.16 | |
| | | | | | | | | | | | | | | | | | | | | | | | | | | | |
| | | | | | | |
Total from investment operations | | | 1.61 | | | | | | | | 0.10 | | | | 1.58 | | | | 1.15 | | | | (1.84 | ) | | | 1.59 | |
| | | | | | | | | | | | | | | | | | | | | | | | | | | | |
| | | | | | | |
| Less dividends and distributions: | | | | | | | | | | | | | | | | | | | | | | | | | | | | |
| | | | | | | |
From net investment income | | | — | | | | | | | | (0.15 | ) | | | (0.49 | ) | | | (0.34 | ) | | | (0.51 | ) | | | (0.24 | ) |
| | | | | | | |
From net realized gain on investments | | | — | | | | | | | | (0.02 | ) | | | — | | | | (0.30 | ) | | | (0.92 | ) | | | (0.58 | ) |
| | | | | | | | | | | | | | | | | | | | | | | | | | | | |
| | | | | | | |
Total dividends and distributions | | | — | | | | | | | | (0.17 | ) | | | (0.49 | ) | | | (0.64 | ) | | | (1.43 | ) | | | (0.82 | ) |
| | | | | | | | | | | | | | | | | | | | | | | | | | | | |
| | | | | | | |
Net asset value at end of period | | $ | 13.29 | | | | | | | $ | 11.68 | | | $ | 11.75 | | | $ | 10.66 | | | $ | 10.15 | | | $ | 13.42 | |
| | | | | | | | | | | | | | | | | | | | | | | | | | | | |
| | | | | | | |
Total investment return (b) | | | 13.78 | %(c) | | | | | | | 0.80 | % | | | 14.72 | % | | | 11.43 | % | | | (14.35 | %) | | | 12.68 | % |
| | | | | | | |
| Ratios (to average net assets)/Supplemental Data: | | | | | | | | | | | | | | | | | | | | | | | | | | | | |
| | | | | | | |
Net investment income (loss) | | | 2.50 | %†† | | | | | | | 2.31 | % | | | 2.11 | % | | | 1.76 | %(d) | | | 2.23 | % | | | 2.81 | % |
| | | | | | | |
Net expenses (e) | | | 0.69 | %†† | | | | | | | 0.76 | % | | | 0.76 | % | | | 0.75 | %(f) | | | 0.77 | % | | | 0.78 | %(g) |
| | | | | | | |
Portfolio turnover rate | | | 20 | % | | | | | | | 84 | % | | | 30 | % | | | 35 | % | | | 43 | % | | | 47 | % |
| | | | | | | |
Net assets at end of period (in 000’s) | | $ | 91,575 | | | | | | | $ | 81,716 | | | $ | 83,261 | | | $ | 75,772 | | | $ | 70,368 | | | $ | 82,495 | |
| ‡ | Less than one cent per share. |
| (a) | Per share data based on average shares outstanding during the period. |
| (b) | Total return does not reflect any deduction of sales charges, mortality and expense charges, contract charges or administrative charges. For periods of less than one year, total return is not annualized. |
| (c) | Total investment return may reflect adjustments to conform to generally accepted accounting principles. |
| (d) | Without the custody fee reimbursement, net investment income (loss) would have been 1.74%. |
| (e) | In addition to the fees and expenses which the Portfolio bears directly, it also indirectly bears a pro-rata share of the fees and expenses of the underlying funds in which it invests. Such indirect expenses are not included in the above expense ratios. |
| (f) | Without the custody fee reimbursement, net expenses would have been 0.77%. |
| (g) | Expense waiver/reimbursement less than 0.01%. |
| | | | |
| 14 | | MainStay VP Fidelity Institutional AM Utilities Portfolio | | The notes to the financial statements are an integral part of,
and should be read in conjunction with, the financial statements. |
Financial Highlightsselected per share data and ratios
| | | | | | | | | | | | | | | | | | | | | | | | | | | | |
| | | |
| | | Six months
ended
June 30, | | | | | | Year ended December 31, | |
| | | | | | | |
| Service Class | | 2019* | | | | | | 2018 | | | 2017 | | | 2016 | | | 2015 | | | 2014 | |
| | | | | | | |
Net asset value at beginning of period | | $ | 11.63 | | | | | | | $ | 11.69 | | | $ | 10.62 | | | $ | 10.10 | | | $ | 13.36 | | | $ | 12.61 | |
| | | | | | | | | | | | | | | | | | | | | | | | | | | | |
| | | | | | | |
Net investment income (loss) (a) | | | 0.14 | | | | | | | | 0.25 | | | | 0.22 | | | | 0.16 | | | | 0.25 | | | | 0.35 | |
| | | | | | | |
Net realized and unrealized gain (loss) on investments | | | 1.45 | | | | | | | | (0.32 | ) | | | 1.47 | | | | 0.89 | | | | (2.24 | ) | | | 1.04 | |
| | | | | | | |
Net realized and unrealized gain (loss) on foreign currency transactions | | | 0.00 | ‡ | | | | | | | 0.14 | | | | (0.16 | ) | | | 0.08 | | | | 0.13 | | | | 0.16 | |
| | | | | | | | | | | | | | | | | | | | | | | | | | | | |
| | | | | | | |
Total from investment operations | | | 1.59 | | | | | | | | 0.07 | | | | 1.53 | | | | 1.13 | | | | (1.86 | ) | | | 1.55 | |
| | | | | | | | | | | | | | | | | | | | | | | | | | | | |
| | | | | | | |
| Less dividends and distributions: | | | | | | | | | | | | | | | | | | | | | | | | | | | | |
| | | | | | | |
From net investment income | | | — | | | | | | | | (0.11 | ) | | | (0.46 | ) | | | (0.31 | ) | | | (0.48 | ) | | | (0.22 | ) |
| | | | | | | |
From net realized gain on investments | | | — | | | | | | | | (0.02 | ) | | | — | | | | (0.30 | ) | | | (0.92 | ) | | | (0.58 | ) |
| | | | | | | | | | | | | | | | | | | | | | | | | | | | |
| | | | | | | |
Total dividends and distributions | | | — | | | | | | | | (0.13 | ) | | | (0.46 | ) | | | (0.61 | ) | | | (1.40 | ) | | | (0.80 | ) |
| | | | | | | | | | | | | | | | | | | | | | | | | | | | |
| | | | | | | |
Net asset value at end of period | | $ | 13.22 | | | | | | | $ | 11.63 | | | $ | 11.69 | | | $ | 10.62 | | | $ | 10.10 | | | $ | 13.36 | |
| | | | | | | | | | | | | | | | | | | | | | | | | | | | |
| | | | | | | |
Total investment return (b) | | | 13.67 | %(c) | | | | | | | 0.55 | % | | | 14.44 | % | | | 11.15 | % | | | (14.57 | %) | | | 12.40 | % |
| | | | | | | |
| Ratios (to average net assets)/Supplemental Data: | | | | | | | | | | | | | | | | | | | | | | | | | | | | |
| | | | | | | |
Net investment income (loss) | | | 2.25 | %†† | | | | | | | 2.08 | % | | | 1.87 | % | | | 1.52 | %(d) | | | 1.98 | % | | | 2.53 | % |
| | | | | | | |
Net expenses (e) | | | 0.94 | %†† | | | | | | | 1.01 | % | | | 1.01 | % | | | 1.00 | %(f) | | | 1.02 | % | | | 1.03 | %(g) |
| | | | | | | |
Portfolio turnover rate | | | 20 | % | | | | | | | 84 | % | | | 30 | % | | | 35 | % | | | 43 | % | | | 47 | % |
| | | | | | | |
Net assets at end of period (in 000’s) | | $ | 1,115,433 | | | | | | | $ | 1,066,963 | | | $ | 1,240,213 | | | $ | 1,160,397 | | | $ | 1,131,252 | | | $ | 1,357,229 | |
| ‡ | Less than one cent per share. |
| (a) | Per share data based on average shares outstanding during the period. |
| (b) | Total return does not reflect any deduction of sales charges, mortality and expense charges, contract charges or administrative charges. For periods of less than one year, total return is not annualized. |
| (c) | Total investment return may reflect adjustments to conform to generally accepted accounting principles. |
| (d) | Without the custody fee reimbursement, net investment income (loss) would have been 1.50%. |
| (e) | In addition to the fees and expenses which the Portfolio bears directly, it also indirectly bears a pro-rata share of the fees and expenses of the underlying funds in which it invests. Such indirect expenses are not included in the above expense ratios. |
| (f) | Without the custody fee reimbursement, net expenses would have been 1.02%. |
| (g) | Expense waiver/reimbursement less than 0.01%. |
| | | | | | |
The notes to the financial statements are an integral part of,
and should be read in conjunction with, the financial statements. | | | | | 15 | |
Notes to Financial Statements(Unaudited)
Note 1–Organization and Business
MainStay VP Funds Trust (the “Fund”) was organized as a Delaware statutory trust on February 1, 2011. The Fund is registered under the Investment Company Act of 1940, as amended (the “1940 Act”), as an open-end management investment company. The Fund is comprised of thirty-one separate series (collectively referred to as the “Portfolios”). These financial statements and notes relate to the MainStay VP Fidelity Institutional AM® Utilities Portfolio (formerly known as MainStay VP MFS® Utilities Portfolio) (the “Portfolio”), a “non-diversified” portfolio, as that term is defined in the 1940 Act, as interpreted or modified by regulatory authorities having jurisdiction, from time to time. Prior to November 30, 2018, MainStay VP Fidelity Institutional AM® Utilities Portfolio operated as a “diversified” portfolio.
Shares of the Portfolio are currently offered to certain separate accounts to fund variable annuity policies and variable universal life insurance policies issued by New York Life Insurance and Annuity Corporation (“NYLIAC”), awholly-owned subsidiary of New York Life Insurance Company (“New York Life”) and may also be offered to fund variable annuity policies and variable universal life insurance policies issued by other insurance companies. NYLIAC allocates shares of the Portfolios, among others, certain NYLIAC separate accounts. Shares of the Portfolio are also offered to the MainStay VP Conservative Allocation Portfolio, MainStay VP Moderate Allocation Portfolio, MainStay VP Moderate Growth Allocation Portfolio and MainStay VP Growth Allocation Portfolio, which operate as “funds-of-funds.”
The Portfolio currently offers two classes of shares. Initial Class and Service Class shares commenced operations on February 17, 2012. Shares of the Portfolio are offered and are redeemed at a price equal to their respective net asset value (“NAV”) per share. No sales or redemption charge is applicable to the purchase or redemption of the Portfolio’s shares. Under the terms of the Fund’s multiple class plan adopted pursuant to Rule 18f-3 under the 1940 Act, the classes differ in that, among other things, Service Class shares of the Portfolio pay a combined distribution and service fee of 0.25% of average daily net assets attributable to Service Class shares of the Portfolio to the Distributor (as defined in Note 3(B)) pursuant to a plan adopted in accordance with Rule 12b-1 under the 1940 Act. Contract owners of variable annuity contracts are permitted to invest only in the Service Class shares.
The Portfolio’s investment objective is to seek total return.
Note 2–Significant Accounting Policies
The Portfolio is an investment company and accordingly follows the investment company accounting and reporting guidance of the Financial Accounting Standards Board (“FASB”) Accounting Standard CodificationTopic 946 Financial Services—Investment Companies. The Portfolio prepares its financial statements in accordance with generally accepted accounting principles (“GAAP”) in the United States of America and follows the significant accounting policies described below.
(A) Securities Valuation. Investments are usually valued as of the close of regular trading on the New York Stock Exchange (the “Exchange”) (usually 4:00 p.m. Eastern time) on each day the Portfolio is open for business (“valuation date”).
The Board of Trustees of the Fund (the “Board”) adopted procedures establishing methodologies for the valuation of the Portfolio’s securities and other assets and delegated the responsibility for valuation determinations under those procedures to the Valuation Committee of the Fund (the “Valuation Committee”). The Board authorized the Valuation Committee to appoint a Valuation Subcommittee (the “Subcommittee”) to deal in the first instance with establishing the prices of securities for which market quotations are not readily available or the prices of which are not otherwise readily determinable under these procedures. The Subcommittee meets (in person, via electronic mail or via teleconference) on an as-needed basis. Subsequently, the Valuation Committee meets to ensure that actions taken by the Subcommittee were appropriate. The procedures state that, subject to the oversight of the Board and unless otherwise noted, the responsibility for theday-to-day valuation of portfolio assets (including fair value measurements for the Portfolio’s assets and liabilities) rests with New York Life Investment Management LLC (“New York Life Investments” or the “Manager”), aided to whatever extent necessary by the Subadvisor (as defined in Note 3(A)).
To assess the appropriateness of security valuations, the Manager, the Subadvisor or the Portfolio’s third-party service provider, who is subject to oversight by the Manager, regularly compares prior day prices, prices on comparable securities and the sale prices to the prior and current day prices and challenges prices with changes exceeding certain tolerance levels with third-party pricing services or broker sources. For those securities valued through either a standardized fair valuation methodology or a fair valuation measurement, the Subcommittee deals in the first instance with such valuation and the Valuation Committee reviews and affirms, if appropriate, the reasonableness of the valuation based on such methodologies and measurements on a regular basis after considering information that is reasonably available and deemed relevant by the Valuation Committee. Any action taken by the Subcommittee with respect to the valuation of a portfolio security or other asset is submitted for review and ratification (if appropriate) to the Valuation Committee and the Board at the next regularly scheduled meeting.
“Fair value” is defined as the price the Portfolio would reasonably expect to receive upon selling an asset or liability in an orderly transaction to an independent buyer in the principal or most advantageous market for the asset or liability. Fair value measurements are determined within a framework that establishes a three-tier hierarchy which maximizes the use of observable market data and minimizes the use of unobservable inputs to establish a classification of fair value measurements for disclosure purposes. “Inputs” refer broadly to the assumptions that market participants would use in pricing the asset or liability, including assumptions about risk, such as the risk inherent in a particular valuation technique used to measure fair value using a pricing model and/or the risk inherent in the inputs for the valuation technique. Inputs may be observable or unobservable. Observable inputs reflect the assumptions market participants would use in pricing the asset or liability based on market data obtained from sources independent of the Portfolio. Unobservable inputs reflect the Portfolio’s own assumptions about the assumptions market participants would use in pricing the asset or liability based on the information available. The inputs or methodology used for valuing assets or liabilities may not be an indication of the risks
| | |
| 16 | | MainStay VP Fidelity Institutional AM Utilities Portfolio |
associated with investing in those assets or liabilities. The three-tier hierarchy of inputs is summarized below.
| • | | Level 1—quoted prices in active markets for an identical asset or liability |
| • | | Level 2—other significant observable inputs (including quoted prices for a similar asset or liability in active markets, interest rates and yield curves, prepayment speeds, credit risk, etc.) |
| • | | Level 3—significant unobservable inputs (including the Portfolio’s own assumptions about the assumptions that market participants would use in measuring fair value of an asset or liability) |
The level of an asset or liability within the fair value hierarchy is based on the lowest level of an input, both individually and in the aggregate, that is significant to the fair value measurement. As of June 30, 2019, the aggregate value by input level of the Portfolio’s assets and liabilities is included at the end of the Portfolio’s Portfolio of Investments.
The Portfolio may use third-party vendor evaluations, whose prices may be derived from one or more of the following standard inputs, among others:
| | |
• Benchmark yields | | • Reported trades |
• Broker/dealer quotes | | • Issuer spreads |
• Two-sided markets | | • Benchmark securities |
• Bids/offers | | • Reference data (corporate actions or material event notices) |
• Industry and economic events | | • Monthly payment information |
An asset or liability for which market values cannot be measured using the methodologies described above is valued by methods deemed reasonable in good faith by the Valuation Committee, following the procedures established by the Board, to represent fair value. Under these procedures, the Portfolio generally uses a market-based approach which may use related or comparable assets or liabilities, recent transactions, market multiples, book values and other relevant information. The Portfolio may also use an income-based valuation approach in which the anticipated future cash flows of the asset or liability are discounted to calculate fair value. Discounts may also be applied due to the nature and/or duration of any restrictions on the disposition of the asset or liability. Fair value represents a good faith approximation of the value of a security. Fair value determinations involve the consideration of a number of subjective factors, an analysis of applicable facts and circumstances and the exercise of judgment. As a result, it is possible that the fair value for a security determined in good faith in accordance with the Portfolio’s valuation procedures may differ from valuations for the same security determined by other funds using their own valuation procedures. Although the Portfolio’s valuation procedures are designed to value a security at the price the Portfolio may reasonably expect to receive upon the security’s sale in an orderly transaction, there can be no assurance that any fair value determination thereunder would, in fact, approximate the amount that the Portfolio would actually realize upon the sale of the security or the price at which the security would trade if a reliable market price were readily available. During the six-month period ended June 30, 2019, there were no material changes to the fair value methodologies.
Securities which may be valued in this manner include, but are not limited to: (i) a security for which trading has been halted or suspended; (ii) a debt security that has recently gone into default and for which there is not a current market quotation; (iii) a security of an issuer that has entered into a restructuring; (iv) a security that has been delisted from a national exchange; (v) a security for which the market price is not readily available from a third-party pricing source or, if so provided, does not, in the opinion of the Manager or the Subadvisor, reflect the security’s market value; (vi) a security subject to trading collars for which no or limited trading takes place; and (vii) a security whose principal market has been temporarily closed at a time when, under normal conditions, it would be open. Securities valued in this manner are generally categorized as Level 3 in the hierarchy.
Certain securities held by the Portfolio may principally trade in foreign markets. Events may occur between the time the foreign markets close and the time at which the Portfolio’s NAVs are calculated. These events may include, but are not limited to, situations relating to a single issuer in a market sector, significant fluctuations in U.S. or foreign markets, natural disasters, armed conflicts, governmental actions or other developments not tied directly to the securities markets. Should the Manager or the Subadvisor conclude that such events may have affected the accuracy of the last price of such securities reported on the local foreign market, the Subcommittee may, pursuant to procedures adopted by the Board, adjust the value of the local price to reflect the estimated impact on the price of such securities as a result of such events. In this instance, securities are generally categorized as Level 3 in the hierarchy. Additionally, certain foreign equity securities are also fair valued whenever the movement of a particular index exceeds certain thresholds. In such cases, the securities are fair valued by applying factors provided by a third party vendor in accordance with valuation procedures adopted by the Board and are generally categorized as Level 2 in the hierarchy. As of June 30, 2019, there were no securities held by the Portfolio that were fair valued in such a manner.
Equity securities are valued at the last quoted sales prices as of the close of regular trading on the relevant exchange on each valuation date. Securities that are not traded on the valuation date are valued at the mean of the last quoted bid and ask prices. Prices are normally taken from the principal market in which each security trades. These securities are generally categorized as Level 1 in the hierarchy.
Investments in mutual funds, including money market funds, are valued at their respective NAVs as of the close of the Exchange on the valuation date. These securities are generally categorized as Level 1 in the hierarchy.
Temporary cash investments acquired in excess of 60 days to maturity at the time of purchase are valued using the latest bid prices or using valuations based on a matrix system (which considers such factors as security prices, yields, maturities and ratings), both as furnished by independent pricing services. Other temporary cash investments which mature in 60 days or less at the time of purchase (“Short-Term Investments”) are valued using the amortized cost method of valuation, unless the use of such method would be inappropriate. The amortized cost method involves valuing a security at its cost on the date of purchase and thereafter assuming a constant amortization to maturity of the difference between such cost and the value on maturity date. Amortized cost approximates the current fair value of a security. Securities
Notes to Financial Statements(Unaudited) (continued)
valued using the amortized cost method are not valued using quoted prices in an active market and are generally categorized as Level 2 in the hierarchy.
The information above is not intended to reflect an exhaustive list of the methodologies that may be used to value portfolio investments. The valuation procedures permit the use of a variety of valuation methodologies in connection with valuing portfolio investments. The methodology used for a specific type of investment may vary based on the market data available or other considerations. The methodologies summarized above may not represent the specific means by which portfolio investments are valued on any particular business day.
(B) Income Taxes. The Portfolio’s policy is to comply with the requirements of the Internal Revenue Code of 1986, as amended (the “Internal Revenue Code”), applicable to regulated investment companies and to distribute all of its taxable income to the shareholders of the Portfolio within the allowable time limits. Therefore, no federal, state and local income tax provisions are required.
Management evaluates the Portfolio’s tax positions to determine if the tax positions taken meet the minimum recognition threshold in connection with accounting for uncertainties in income tax positions taken or expected to be taken for the purposes of measuring and recognizing tax liabilities in the financial statements. Recognition of tax benefits of an uncertain tax position is permitted only to the extent the position is “more likely than not” to be sustained assuming examination by taxing authorities. Management has analyzed the Portfolio’s tax positions taken on federal, state and local income tax returns for all open tax years (for up to three tax years) and has concluded that no provisions for federal, state and local income tax are required in the Portfolio’s financial statements. The Portfolio’s federal, state and local income tax and federal excise tax returns for tax years for which the applicable statutes of limitations have not expired are subject to examination by the Internal Revenue Service and state and local departments of revenue.
(C) Foreign Taxes. The Portfolio may be subject to foreign taxes on income and other transaction-based taxes imposed by certain countries in which it invests. A portion of the taxes on gains on investments or currency purchases/repatriation may be reclaimable. The Portfolio will accrue such taxes and reclaims as applicable, based upon its current interpretation of tax rules and regulations that exist in the markets in which it invests.
The Portfolio may be subject to taxation on realized capital gains, repatriation proceeds and other transaction-based taxes imposed by certain countries in which it invests. The Portfolio will accrue such taxes as applicable based upon its current interpretation of tax rules and regulations that exist in the market in which it invests. Capital gains taxes relating to positions still held are reflected as a liability on the Statement of Assets and Liabilities, as well as an adjustment to the Portfolio’s net unrealized appreciation (depreciation). Taxes related to capital gains realized, if any, are reflected as part of net realized gain (loss) in the Statement of Operations. Changes in tax liabilities related to capital gains taxes on unrealized investment gains, if any, are reflected as part of the change in net unrealized appreciation (depreciation) on investments in the Statement of Operations. Transaction-based charges are generally assessed as a percentage of the transaction amount.
(D) Dividends and Distributions to Shareholders. Dividends and distributions are recorded on the ex-dividend date. The Portfolio intends to declare and pay dividends from net investment income and distributions from net realized capital and currency gains, if any, at least annually. Unless the shareholder elects otherwise, all dividends and distributions are reinvested in the same class of shares of the Portfolio, at NAV. Dividends and distributions to shareholders are determined in accordance with federal income tax regulations and may differ from determinations using GAAP.
(E) Security Transactions and Investment Income. The Portfolio records security transactions on the trade date. Realized gains and losses on security transactions are determined using the identified cost method. Dividend income is recognized on the ex-dividend date; net of any foreign tax withheld at the source, and interest income is accrued as earned using the effective interest rate method.
Investment income and realized and unrealized gains and losses on investments of the Portfolio are allocated pro rata to the separate classes of shares based upon their relative net assets on the date the income is earned or realized and unrealized gains and losses are incurred.
The Portfolio may place a debt security on non-accrual status and reduce related interest income by ceasing current accruals and writing off all or a portion of any interest receivables when the collection of all or a portion of such interest has become doubtful. A debt security is removed from non-accrual status when the issuer resumes interest payments or when collectability of interest is reasonably assured.
(F) Expenses. Expenses of the Fund are allocated to the individual Portfolios in proportion to the net assets of the respective Portfolios when the expenses are incurred, except where direct allocations of expenses can be made. Expenses (other than fees incurred under the distribution and service plans, further discussed in Note 3(B), which are charged directly to the Service Class shares) are allocated to separate classes of shares pro rata based upon their relative net assets on the date the expenses are incurred. The expenses borne by the Portfolio, including those of related parties to the Portfolio, are shown in the Statement of Operations.
Additionally, the Portfolio may invest in mutual funds, which are subject to management fees and other fees that may cause the costs of investing in mutual funds to be greater than the costs of owning the underlying securities directly. These indirect expenses of mutual funds are not included in the amounts shown as expenses in the Portfolio’s Statement of Operations or in the expense ratios included in the Financial Highlights.
(G) Use of Estimates. In preparing financial statements in conformity with GAAP, management makes estimates and assumptions that affect the reported amounts and disclosures in the financial statements. Actual results could differ from those estimates.
(H) Repurchase Agreements. The Portfolio may enter into repurchase agreements (i.e., buy a security from another party with the agreement that it be sold back in the future) to earn income. The Portfolio may enter into repurchase agreements only with counterparties, usually financial institutions, that are deemed by the Manager or the Subadvisor to be creditworthy, pursuant to guidelines established by
| | |
| 18 | | MainStay VP Fidelity Institutional AM Utilities Portfolio |
the Board. During the term of any repurchase agreement, the Manager or the Subadvisor will continue to monitor the creditworthiness of the counterparty. Under the 1940 Act, repurchase agreements are considered to be collateralized loans by the Portfolio to the counterparty secured by the securities transferred to the Portfolio.
Repurchase agreements are subject to counterparty risk, meaning the Portfolio could lose money by the counterparty’s failure to perform under the terms of the agreement. The Portfolio mitigates this risk by ensuring the repurchase agreement is collateralized by cash, U.S. government securities, fixed income securities and/or other securities. The collateral is held by the Portfolio’s custodian and valued daily on a mark to market basis to determine if the value, including accrued interest, exceeds the repurchase price. In the event of the counterparty’s default on the obligation to repurchase, the Portfolio has the right to liquidate the collateral and apply the proceeds in satisfaction of the obligation. Under certain circumstances, such as in the event of default or bankruptcy by the counterparty, realization and/or retention of the collateral may be limited or subject to delay, to legal proceedings and possible realized loss to the Portfolio. As of June 30, 2019, the Portfolio did not hold any repurchase agreements.
(I) Foreign Currency Forward Contracts. The Portfolio may enter into foreign currency forward contracts, which are agreements to buy or sell foreign currencies on a specified future date at a specified rate. The Portfolio is subject to foreign currency exchange rate risk in the normal course of investing in these transactions. During the period the forward contract is open, changes in the value of the contract are recognized as unrealized appreciation or depreciation by marking to market such contract on a daily basis to reflect the market value of the contract at the end of each day’s trading. Cash movement occurs on settlement date. When the forward contract is closed, the Portfolio records a realized gain or loss equal to the difference between the proceeds from (or cost of) the closing transaction and the Portfolio’s basis in the contract. The Portfolio may purchase and sell foreign currency forward contracts for purposes of seeking to enhance portfolio returns and manage portfolio risk more efficiently. Foreign currency forward contracts may also be used to gain exposure to a particular currency or to hedge against the risk of loss due to changing currency exchange rates. Foreign currency forward contracts to purchase or sell a foreign currency may also be used in anticipation of future purchases or sales of securities denominated in foreign currency, even if the specific investments have not yet been selected.
The use of foreign currency forward contracts involves, to varying degrees, elements of risk in excess of the amount recognized in the Statement of Assets and Liabilities, including counterparty risk, market risk and illiquidity risk. Counterparty risk is heightened for these instruments because foreign currency forward contracts are not exchange-traded and therefore no clearinghouse or exchange stands ready to meet the obligations under such contracts. Thus, the Portfolio faces the risk that its counterparties under such contracts may not perform their obligations. Market risk is the risk that the value of a foreign currency forward contract will depreciate due to unfavorable changes in exchange rates. Illiquidity risk arises because the secondary market for foreign currency forward contracts may have less liquidity relative to markets for other securities and financial instruments. Risks also arise from the possible movements in the foreign exchange rates underlying
these instruments. While the Portfolio may enter into forward contracts to reduce currency exchange risks, changes in currency exchange rates may result in poorer overall performance for the Portfolio than if it had not engaged in such transactions. Exchange rate movements can be large, depending on the currency, and can last for extended periods of time, affecting the value of the Portfolio’s assets. Moreover, there may be an imperfect correlation between the Portfolio’s holdings of securities denominated in a particular currency and forward contracts entered into by the Portfolio. Such imperfect correlation may prevent the Portfolio from achieving the intended hedge or expose the Portfolio to the risk of currency exchange loss. The unrealized appreciation (depreciation) on forward contracts also reflects the Portfolio’s exposure at the valuation date to credit loss in the event of a counterparty’s failure to perform its obligations. As of June 30, 2019, the Portfolio did not hold any foreign currency forward contracts.
(J) Foreign Currency Transactions. The Portfolio’s books and records are maintained in U.S. dollars. Prices of securities denominated in foreign currency amounts are translated into U.S. dollars at the mean between the buying and selling rates last quoted by any major U.S. bank at the following dates:
| (i) | market value of investment securities, other assets and liabilities— at the valuation date; and |
| (ii) | purchases and sales of investment securities, income and expenses—at the date of such transactions. |
The assets and liabilities that are denominated in foreign currency amounts are presented at the exchange rates and market values at the close of the period. The realized and unrealized changes in net assets arising from fluctuations in exchange rates and market prices of securities are not separately presented.
Net realized gain (loss) on foreign currency transactions represents net gains and losses on foreign currency forward contracts, net currency gains or losses realized as a result of differences between the amounts of securities sale proceeds or purchase cost, dividends, interest and withholding taxes as recorded on the Portfolio’s books, and the U.S. dollar equivalent amount actually received or paid. Net currency gains or losses from valuing such foreign currency denominated assets and liabilities, other than investments at valuation date exchange rates, are reflected in unrealized foreign exchange gains or losses.
(K) Securities Lending. In order to realize additional income, the Portfolio may engage in securities lending, subject to the limitations set forth in the 1940 Act and relevant guidance by the staff of the Securities and Exchange Commission (“SEC”). In the event the Portfolio does engage in securities lending, the Portfolio will lend through its custodian, State Street Bank and Trust Company (“State Street”), acting as securities lending agent on behalf of the Portfolio. State Street will manage the Portfolio’s collateral in accordance with the securities lending agency agreement between the Portfolio and State Street, and indemnify the Portfolio against counterparty risk. The loans will be collateralized by cash (which may be invested in a money market fund) and/ornon-cash collateral (which may include, U.S. Treasury securities and/or U.S. Government Agency securities issued or guaranteed by the United States government or its agencies or instrumentalities) at least equal at all times to the market value of the securities loaned. The Portfolio may bear the risk of delay in recovery of, or loss of rights in,
Notes to Financial Statements(Unaudited) (continued)
the securities loaned should the borrower of the securities experience financial difficulty. The Portfolio may also record a realized gain or loss on securities deemed sold due to a borrower’s inability to return securities on loan. The Portfolio bears the risk of any loss on investment of cash collateral. The Portfolio will receive compensation for lending its securities in the form of fees or it will retain a portion of interest on the investment of any cash collateral. The Portfolio will also continue to receive interest and dividends on the securities loaned and any gain or loss in the market price of the securities loaned that may occur during the term of the loan will be for the account of the Portfolio. Income earned from securities lending activities, if any, is reflected in the Statement of Operations. As of June 30, 2019, the Portfolio did not have any portfolio securities on loan.
(L) Foreign Securities Risk. The Portfolio may invest in foreign securities, which carry certain risks that are in addition to the usual risks inherent in domestic securities. These risks include those resulting from currency fluctuations, future adverse political or economic developments and possible imposition of currency exchange blockages or other foreign governmental laws or restrictions. These risks are likely to be greater in emerging markets than in developed markets. The ability of issuers of debt securities held by the Portfolio to meet their obligations may be affected by, among other things, economic or political developments in a specific country, industry or region.
(M) Indemnifications. Under the Fund’s organizational documents, its officers and trustees are indemnified against certain liabilities that may arise out of performance of their duties to the Fund. Additionally, in the normal course of business, the Portfolio enters into contracts with third-party service providers that contain a variety of representations and warranties and which may provide general indemnifications. The Portfolio’s maximum exposure under these arrangements is unknown, as this would involve future claims that may be made against the Portfolio that have not yet occurred. Based on experience, management is of the view that the risk of loss in connection with these potential indemnification obligations is remote. However, there can be no assurance that material liabilities related to such obligations will not arise in the future, which could adversely impact the Portfolio.
Note 3–Fees and Related Party Transactions
(A) Manager and Subadvisor. New York Life Investments, a registered investment adviser and an indirect,wholly-owned subsidiary of New York Life, serves as the Portfolio’s Manager pursuant to an Amended and Restated Management Agreement (“Management Agreement”). The Manager provides offices, conducts clerical, recordkeeping and bookkeeping services, and keeps most of the financial and accounting records required to be maintained by the Portfolio. Except for the portion of salaries and expenses that are the responsibility of the Portfolio, the Manager pays the salaries and expenses of all personnel affiliated with the Portfolio
and certain operational expenses of the Portfolio. The Portfolio reimburses New York Life Investments in an amount equal to a portion of the compensation of the Chief Compliance Officer attributable to the Portfolio. FIAM LLC (“FIAM or the “Subadvisor”) a registered investment adviser, serves as Subadvisor to the Portfolio and is responsible for theday-to-day portfolio management of the Portfolio. Pursuant to the terms of a Subadvisory Agreement (“Subadvisory Agreement”) between New York Life Investments and FIAM, New York Life Investments pays for the services of the Subadvisor.
The Fund, on behalf of the Portfolio, pays New York Life Investments in its capacity as the Portfolio’s investment manager and administrator, pursuant to the Management Agreement, a monthly fee for the services performed and the facilities furnished at an annual percentage of the Portfolio’s average daily net assets as follows: 0.64% up to $1 billion; 0.61% from $1 billion to $3 billion; and 0.60% in excess of $3 billion. During the six-month period ended June 30, 2019, the effective management fee rate was 0.63%.
During the six-month period ended June 30, 2019, New York Life Investments earned fees from the Portfolio in the amount of $3,765,002, and paid the Subadvisor in the amount of $1,470,089.
State Street providessub-administration andsub-accounting services to the Portfolio pursuant to an agreement with New York Life Investments. These services include calculating the daily NAVs of the Portfolio, maintaining the general ledger andsub-ledger accounts for the calculation of the Portfolio’s NAVs and assisting New York Life Investments in conducting various aspects of the Portfolio’s administrative operations. For providing these services to the Portfolio, State Street is compensated by New York Life Investments.
Pursuant to an agreement between the Fund and New York Life Investments, New York Life Investments is responsible for providing or procuring certain regulatory reporting services for the Portfolio. The Portfolio will reimburse New York Life Investments for the actual costs incurred by New York Life Investments in connection with providing or procuring these services for the Portfolio.
(B) Distribution and Service Fees. The Fund, on behalf of the Portfolio, has entered into a distribution agreement with NYLIFE Distributors LLC (the “Distributor”), an indirect,wholly-owned subsidiary of New York Life. The Portfolio has adopted a distribution plan (the “Plan”) in accordance with the provisions of Rule 12b-1 under the 1940 Act. Under the Plan, the Distributor has agreed to provide, through its affiliates or independent third parties, various distribution-related, shareholder and administrative support services to the Service Class shareholders. For its services, the Distributor is entitled to a combined distribution and service fee accrued daily and paid monthly at an annual rate of 0.25% of the average daily net assets attributable to the Service Class shares of the Portfolio.
(C) Investments in Affiliates (in 000’s). During the six-month period ended June 30, 2019, purchases and sales transactions, income earned from investments and shares held of investment companies managed by New York Life Investments or its affiliates were as follows:
| | | | | | | | | | | | | | | | | | | | | | | | | | | | | | | | | | | | |
Affiliated Investment
Company | | Value,
Beginning of
Period | | | Purchases
at Cost | | | Proceeds
from
Sales | | | Net
Realized
Gain/(Loss)
on Sales | | | Change in
Unrealized
Appreciation/
(Depreciation) | | | Value,
End of
Period | | | Dividend
Income | | | Other
Distributions | | | Shares
End of
Period | |
| | | | | | | | | |
MainStay U.S. Government Liquidity Fund | | $ | 3,972 | | | $ | 197,035 | | | $ | (165,547 | ) | | $ | — | | | $ | — | | | $ | 35,460 | | | $ | 107 | | | $ | — | | | | 35,460 | |
| | |
| 20 | | MainStay VP Fidelity Institutional AM Utilities Portfolio |
Note 4–Federal Income Tax
As of June 30, 2019, the cost and unrealized appreciation (depreciation) of the Portfolio’s investment portfolio, including applicable derivative contracts and other financial instruments, as determined on a federal income tax basis, were as follows:
| | | | | | | | | | | | | | | | |
| | | Federal Tax
Cost | | | Gross
Unrealized
Appreciation | | | Gross
Unrealized
(Depreciation) | | | Net
Unrealized
Appreciation/
(Depreciation) | |
| | | | |
Investments in Securities | | $ | 1,060,718,911 | | | $ | 168,793,886 | | | $ | (15,256,734 | ) | | $ | 153,537,152 | |
During the year ended December 31, 2018, the tax character of distributions paid as reflected in the Statements of Changes in Net Assets was as follows:
| | | | | | |
|
| 2018 | |
Tax-Based
Distributions
from Ordinary
Income | | | Tax-Based
Distributions
from Long-Term
Gains | |
| |
| $ | 13,896,754 | | | $ | — | |
Note 5–Custodian
State Street is the custodian of cash and securities held by the Portfolio. Custodial fees are charged to the Portfolio based on the Portfolio’s net assets and/or the market value of securities held by the Portfolio and the number of certain transactions incurred by the Portfolio.
Note 6–Line of Credit
The Portfolio and certain other funds managed by New York Life Investments maintain a line of credit with a syndicate of banks in order to secure a source of funds for temporary purposes to meet unanticipated or excessive redemption requests.
Effective July 30, 2019, under the credit agreement (the “Credit Agreement”), the aggregate commitment amount is $600,000,000 with an additional uncommitted amount of $100,000,000. The commitment fee is an annual rate of 0.15% of the average commitment amount payable quarterly, regardless of usage, to State Street, who serves as the agent to the syndicate. The commitment fee is allocated among the Portfolio and certain other funds managed by New York Life Investments based upon their respective net assets and other factors. Interest on any revolving credit loan is charged based upon the Federal Funds Rate or the one-month London Interbank Offered Rate (“LIBOR”), whichever is higher. The Credit Agreement expires on July 28, 2020, although the Portfolio, certain other funds managed by New York Life Investments and the syndicate of banks may renew the Credit Agreement for an additional year on the same or different terms. Prior to July 30, 2019, the aggregate commitment amount and the commitment fee were the same as those under the current Credit Agreement. During thesix-month period ended June 30, 2019, there were no borrowings made or outstanding with respect to the Portfolio under the Credit Agreement.
Note 7–Interfund Lending Program
Pursuant to an exemptive order issued by the SEC, the Portfolio, along with certain other funds managed by New York Life Investments, may participate in an interfund lending program. The interfund lending program provides an alternative credit facility that permits the Portfolio and certain other funds managed by New York Life Investments to lend or borrow money for temporary purposes directly to or from one another subject to the conditions of the exemptive order. During the six-month period ended June 30, 2019, there were no interfund loans made or outstanding with respect to the Portfolio.
Note 8–Purchases and Sales of Securities (in 000’s)
During the six-month period ended June 30, 2019, purchases and sales of securities, other thanshort-term securities, were $232,265 and $304,613, respectively.
The Portfolio may purchase securities from or sell securities to other portfolios managed by the Subadvisor. These interportfolio transactions are primarily used for cash management purposes and are made pursuant to Rule 17a-7 under the 1940 Act. The Rule 17a-7 transactions during the six-month period ended June 30, 2019, were as follows:
| | | | |
Purchases
(000’s) | | Sales
(000’s) | | Realized Gain/
(Loss) (000’s) |
| | |
| $24,350 | | $1,026 | | $202 |
Note 9–Capital Share Transactions
Transactions in capital shares for the six-month period ended June 30, 2019 and the year ended December 31, 2018, were as follows:
| | | | | | | | |
Initial Class | | Shares | | | Amount | |
| | |
Six-month period ended June 30, 2019: | | | | | | | | |
Shares sold | | | 108,713 | | | $ | 1,375,997 | |
Shares redeemed | | | (216,516 | ) | | | (2,744,961 | ) |
| | | | |
Net increase (decrease) | | | (107,803 | ) | | $ | (1,368,964 | ) |
| | | | |
Year ended December 31, 2018: | | | | | | | | |
Shares sold | | | 527,083 | | | $ | 6,178,386 | |
Shares issued to shareholders in reinvestment of dividends and distributions | | | 96,208 | | | | 1,159,233 | |
Shares redeemed | | | (714,654 | ) | | | (8,541,009 | ) |
| | | | |
Net increase (decrease) | | | (91,363 | ) | | $ | (1,203,390 | ) |
| | | | |
| | |
| | | | | | | | |
Service Class | | Shares | | | Amount | |
Six-month period ended June 30, 2019: | | | | | | | | |
Shares sold | | | 1,086,334 | | | $ | 13,783,829 | |
Shares redeemed | | | (8,460,452 | ) | | | (106,602,400 | ) |
| | | | |
Net increase (decrease) | | | (7,374,118 | ) | | $ | (92,818,571 | ) |
| | | | |
Year ended December 31, 2018: | | | | | | | | |
Shares sold | | | 4,300,629 | | | $ | 50,250,960 | |
Shares issued to shareholders in reinvestment of dividends and distributions | | | 1,061,264 | | | | 12,737,521 | |
Shares redeemed | | | (19,660,783 | ) | | | (233,272,200 | ) |
| | | | |
Net increase (decrease) | | | (14,298,890 | ) | | $ | (170,283,719 | ) |
| | | | |
Notes to Financial Statements(Unaudited) (continued)
Note 10–Recent Accounting Pronouncement
To improve the effectiveness of fair value disclosure requirements, the Financial Accounting Standards Board recently issued Accounting Standard Update (ASU)2018-13, Fair Value Measurement Disclosure Framework—Changes to the Disclosure Requirements for Fair Value Measurement (ASU2018-13), which adds, removes, and modifies certain aspects relating to fair value disclosure. ASU2018-13 is effective for interim and annual reporting periods beginning after December 15, 2019; early adoption of the additions relating to ASU2018-13 is not required. Management has evaluated the implications of certain other provisions of the ASU and has determined to early adopt aspects related to the removal and modifications of certain fair value measurement disclosures under the ASU effective immediately. At this
time, management is evaluating the implications of certain other provisions of the ASU related to new disclosure requirements and any impact on the financial statement disclosures has not yet been determined.
Note 11–Subsequent Events
In connection with the preparation of the financial statements of the Portfolio as of and for the six-month period ended June 30, 2019, events and transactions subsequent to June 30, 2019, through the date the financial statements were issued have been evaluated by the Portfolio’s management for possible adjustment and/or disclosure. No subsequent events requiring financial statement adjustment or disclosure have been identified.
| | |
| 22 | | MainStay VP Fidelity Institutional AM Utilities Portfolio |
Proxy Voting Policies and Procedures and Proxy Voting Record
A description of the policies and procedures that New York Life Investments uses to vote proxies related to the Portfolio’s securities is available without charge, upon request (i) by calling800-598-2019; (ii) by visiting New York Life Investments website at https://www.nylinvestments.com/mainstay/products-and-performance/mainstay-vp-funds-trust; or (iii) by visiting the SEC’s website at www.sec.gov.
The Portfolio is required to file with the SEC its proxy voting record for the12-month period ending June 30 on Form N-PX. The Portfolio’s most recent Form N-PX or proxy voting record is available free of charge upon request (i) by calling800-598-2019; (ii) by visiting New York Life Investments website at https://www.nylinvestments.com/mainstay/products-and-performance/mainstay-vp-funds-trust; or (iii) by visiting the SEC’s website atwww.sec.gov.
Shareholder Reports and Quarterly Portfolio Disclosure
The Portfolio is required to file its complete schedule of portfolio holdings with the SEC 60 days after each fiscal quarter onForm N-PORT. The Portfolio’s holdings report is available without charge upon request (i) by calling800-598-2019; (ii) by visiting New York Life Investments website at https://www.nylinvestments.com/mainstay/products-and-performance/mainstay-vp-funds-trust; or (iii) on the SEC’s website at www.sec.gov.
MainStay VP Portfolios
MainStay VP offers a wide range of Portfolios. The full array of MainStay VP offerings is listed here, with information about the manager, subadvisors, legal counsel, and independent registered public accounting firm.
Equity Portfolios
MainStay VP Eagle Small Cap Growth Portfolio
MainStay VP Emerging Markets Equity Portfolio
MainStay VP Epoch U.S. Equity Yield Portfolio
MainStay VP Fidelity Institutional AM® Utilities Portfolio†
MainStay VP Large Cap Growth Portfolio
MainStay VP MacKay Common Stock Portfolio
MainStay VP MacKay Growth Portfolio
MainStay VP MacKay International Equity Portfolio
MainStay VP MacKay Mid Cap Core Portfolio
MainStay VP MacKay S&P 500 Index Portfolio
MainStay VP MacKay Small Cap Core Portfolio
MainStay VP Mellon Natural Resources Portfolio
MainStay VP T. Rowe Price Equity Income Portfolio
Mixed Asset Portfolios
MainStay VP Balanced Portfolio
MainStay VP Income Builder Portfolio
MainStay VP Janus Henderson Balanced Portfolio
MainStay VP MacKay Convertible Portfolio
Income Portfolios
MainStay VP Bond Portfolio
MainStay VP Floating Rate Portfolio
MainStay VP Indexed Bond Portfolio
MainStay VP MacKay Government Portfolio
MainStay VP MacKay High Yield Corporate Bond Portfolio
MainStay VP MacKay Unconstrained Bond Portfolio
MainStay VP PIMCO Real Return Portfolio
Money Market
MainStay VP U.S. Government Money Market Portfolio
Alternative
MainStay VP Cushing Renaissance Advantage Portfolio
MainStay VP IQ Hedge Multi-Strategy Portfolio
Asset Allocation Portfolios
MainStay VP Conservative Allocation Portfolio
MainStay VP Growth Allocation Portfolio
MainStay VP Moderate Allocation Portfolio
MainStay VP Moderate Growth Allocation Portfolio
Manager
New York Life Investment Management LLC
New York, New York
Subadvisors
Candriam Belgium*
Brussels, Belgium
Cushing Asset Management, LP
Dallas, Texas
Eagle Asset Management, Inc.
St Petersburg, Florida
Epoch Investment Partners, Inc.
New York, New York
FIAM LLC
Smithfield, Rhode Island
IndexIQ Advisors LLC*
New York, New York
Janus Capital Management LLC
Denver, Colorado
MacKay Shields LLC*
New York, New York
Mellon Investments Corporation
Boston, Massachusetts
NYL Investors LLC*
New York, New York
Pacific Investment Management Company LLC
Newport Beach, California
T. Rowe Price Associates, Inc.
Baltimore, Maryland
Winslow Capital Management, LLC
Minneapolis, Minnesota
Distributor
NYLIFE Distributors LLC*
Jersey City, New Jersey
Custodian
State Street Bank and Trust Company
Boston, Massachusetts
Independent Registered Public Accounting Firm
PricewaterhouseCoopers LLP
New York, New York
Legal Counsel
Dechert LLP
Washington, District of Columbia
Some Portfolios may not be available in all products.
| † | Fidelity Institutional AM is a registered trade mark of FMR LLC. Used with permission. |
| * | An affiliate of New York Life Investment Management LLC |
Not part of the Semiannual Report
2019 Semiannual Report
This report is for the general information of New York Life Variable Annuities and NYLIAC Variable Universal Life Insurance Products policyowners. It must be preceded or accompanied by the appropriate product(s) and funds prospectuses if it is given to anyone who is not an owner of a New York Life variable annuity policy or a NYLIAC Variable Universal Life Insurance Product. This report does not offer for sale or solicit orders to purchase securities.
The performance data quoted in this report represents past performance. Past performance is no guarantee of future results. Due to market volatility and other factors, current performance may be lower or higher than the figures shown. The most recent month-end performance summary for your variable annuity or variable life policy is available by calling 800-598-2019 and is updated periodically on www.newyorklife.com.
The New York Life Variable Annuities and NYLIAC Variable Universal Life Insurance Products are issued by New York Life Insurance and Annuity Corporation (a Delaware Corporation) and distributed by NYLIFE Distributors LLC (Member FINRA/SIPC).
New York Life Insurance Company
New York Life Insurance and Annuity Corporation (NYLIAC) (A Delaware Corporation)
51 Madison Avenue, Room 551
New York, NY 10010
www.newyorklife.com
Printed on recycled paper
nylinvestments.com
NYLIFE Distributors LLC, 30 Hudson Street, Jersey City, NJ 07302
New York Life Investment Management LLC is the investment manager to the MainStay VP Funds Trust
©2019 by NYLIFE Distributors LLC. All rights reserved.
You may obtain copies of the Prospectus and the Statement of Additional Information free of charge, upon request, by callingtoll-free 800-598-2019 or writing to New York Life Insurance and Annuity Corporation, 51 Madison Avenue, New York, NY 10010.
| | | | |
| | | |
| Not FDIC Insured | | No Bank Guarantee | | May Lose Value |
| | | | |
| 1781634 | | | | MSVPMFS10-08/19 (NYLIAC) NI526 |
MainStay VP MacKay Mid Cap Core Portfolio
Message from the President and Semiannual Report
Unaudited | June 30, 2019

Beginning on January 1, 2021, as permitted by regulations adopted by the Securities and Exchange Commission, paper copies of the MainStay VP Portfolio annual and semi-annual shareholder reports may no longer be sent by mail, unless you specifically request paper copies of the reports from the insurance company that offers your policy. Instead, the reports will be made available online, and you will be notified by mail each time a report is posted and provided with a website link to access the report. Instructions for requesting paper copies will be provided by your insurance company.
If you already elected to receive shareholder reports electronically, you will not be affected by this change and you need not take any action. At any time, you may elect to receive reports and other communications from the insurance company electronically by following the instructions provided by the insurance company.
You may elect to receive all future shareholder reports in paper form free of charge. You can inform the insurance company that you wish to receive paper copies of reports by following the instructions provided by the insurance company. Your election to receive reports in paper form will apply to all portfolio companies available under your contract.
| | | | | | | | |
| | | | | |
| Not FDIC/NCUA Insured | | Not a Deposit | | May Lose Value | | No Bank Guarantee | | Not Insured by Any Government Agency |

This page intentionally left blank
Message from the President
Most equity and fixed-income markets in the United States and around the world advanced in the face of conflicting political and macroeconomic forces during thesix-month period ended June 30, 2019.
The reporting period began on the heels of tumultuous December 2018, during which equities and equity-sensitive bonds spiked sharply lower on concerns regarding the pace of economic growth, a U.S. government shutdown and the potential impact of trade disputes between the United States and other nations, particularly China. Markets recovered quickly in early 2019 as trade tensions eased, the government reopened and the U.S. Federal Reserve Board (Fed) adopted a more patient tone regarding the future direction of interest rates. Markets moved broadly higher from January through April, supported by encouraging economic data and generally strong corporate earnings.
During the first four months of the reporting period, the improving economic environment encouraged investors to favor areas of the market viewed as offering greater return potential along with higher risks. Among U.S. stocks, cyclical, growth-oriented sectors tended to outperform more defensive, value-oriented sectors, whilelarge-cap stocks outperformed theirsmaller-cap counterparts. Within the S&P 500® Index, the information technology sector led the market’s advance, followed by communication services, consumer discretionary and consumer staples. Industrials, utilities, financials, materials, real estate and energy produced more modest gains. While some international equity markets outperformed or underperformed the U.S. market, on average international stocks mirrored the performance of their U.S. counterparts. Fixed-income securities gained ground as well, albeit along a more gradual trajectory. Among U.S. fixed-income instruments, corporate issues generally outperformed government bonds, with lower credit quality, higher yielding securities leading the sector’s advance. Long-term U.S. Treasury bond yields proved particularly weak, with
10-year yields dipping at times below3-month yields, reflecting investors’ continued concerns about domestic economic growth.
May 2019 saw a return of uncertainty and volatility. Trade discussions between the United States and China faltered, driving global equity prices lower. Government bond prices rose as investors sought safe havens. June brought yet anotherU-turn as equity prices climbed again after comments from the Fed raised hopes of an interest rate cut in response to weak economic data. Stock and bond prices rose, with U.S. equity markets ending the reporting period in record territory.
We are pleased to see renewed signs of strength in broad areas of the financial market. At the same time, we remained sharply focused on providing you, as a MainStay VP investor, with the experienced and disciplined fund management that we believe underpins an effective, long-term investment strategy. Whatever tomorrow’s investment environment brings, you can rely on our portfolio managers to pursue the objectives of their individual Portfolios as outlined in the prospectus with the energy and dedication you have come to expect.
The report that follows contains additional information on the market events, investment decisions and specific securities that shaped your VP Portfolio’s performance during the six months ended June 30, 2019. We encourage you to read the report carefully and use it to evaluate your Portfolio’s performance in light of your long-range financial plan.
Sincerely,

Kirk C. Lehneis
President
The opinions expressed are as of the date of this report and are subject to change. There is no guarantee that any forecast made will come to pass. This material does not constitute investment advice and is not intended as an endorsement of any specific investment. Past performance is no guarantee of future results.
Not part of the Semiannual Report
Table of Contents
Investors should refer to the Portfolio’s Summary Prospectus and/or Prospectus and consider the Portfolio’s investment objectives, strategies, risks, charges and expenses carefully before investing. The Summary Prospectus and/or Prospectus contain this and other information about the Portfolio. You may obtain copies of the Portfolio’s Summary Prospectus and/or the Prospectus and the Statement of Additional Information free of charge, upon request, by calling toll-free 800-598-2019, by writing to New York Life Insurance and Annuity Corporation, 51 Madison Avenue, Room 251, New York, New York 10010 or by sending an email to MainStayShareholdersServices@nylim.com. These documents are also available at nylinvestments.com/vpdocuments. Please read the Summary Prospectus and/or Prospectus carefully before investing. MainStay VP Funds Trust portfolios are separate account options which are purchased through a variable insurance or variable annuity contract.
Investment and Performance Comparison1(Unaudited)
Performance data quoted represents past performance. Past performance is no guarantee of future results. Because of market volatility and other factors, current performance may be lower or higher than the figures shown. Investment return and principal value will fluctuate, and as a result, when shares are redeemed, they may be worth more or less than their original cost. The performance table and graph do not reflect any deduction of sales charges, mortality and expense charges, contract charges or administrative charges. Please refer to the Performance Summary appropriate for your policy. For performance information current to the most recent month-end, please call800-598-2019 or visit www.newyorklife.com.
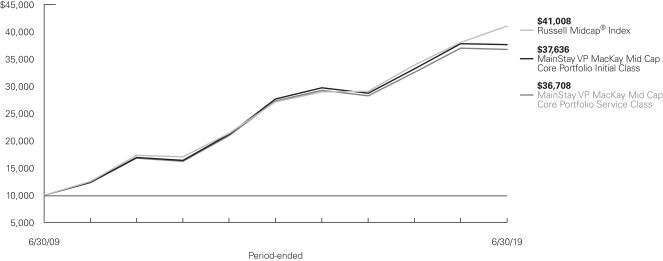
Average Annual Total Returns for the Period-Ended June 30, 2019
| | | | | | | | | | | | | | | | | | | | | | | | |
| Class | | Inception
Date | | | Six Months | | | One Year | | | Five Years | | | Ten Years | | | Gross
Expense
Ratio2 | |
| | | | | | |
| Initial Class Shares | | | 7/2/2001 | | | | 15.45 | % | | | –0.38 | % | | | 6.38 | % | | | 14.17 | % | | | 0.88 | % |
| Service Class Shares | | | 6/5/2003 | | | | 15.31 | | | | –0.63 | | | | 6.11 | | | | 13.89 | | | | 1.13 | |
| | | | | | | | | | | | | | | | |
| Benchmark Performance | | Six
Months | | | One
Year | | | Five
Years | | | Ten
Years | |
| | | | |
Russell Midcap® Index3 | | | 21.35 | % | | | 7.83 | % | | | 8.63 | % | | | 15.16 | % |
Morningstar Mid-Cap Blend Category Average4 | | | 17.52 | | | | 2.41 | | | | 6.04 | | | | 12.87 | |
| 1. | Performance figures may reflect certain fee waivers and/or expense limitations, without which total returns may have been different. For information on current fee waivers and/or expense limitations (if any), please refer to the Notes to Financial Statements. |
| 2. | The gross expense ratios presented reflect the Portfolio’s “Total Annual Portfolio Operating Expenses” from the most recent Prospectus, as supplemented, and may differ from other expense ratios disclosed in this report. |
| 3. | The Russell Midcap® Index is the Portfolio’s primary broad-based securities market index for comparison purposes. The Russell Midcap® Index measures the performance of themid-cap segment of the U.S. equity universe. The Russell Midcap® Index is a subset of the Russell 1000® Index and it includes approximately 800 of the smallest securities based on a |
| | combination of their market cap and current index membership. The Russell Midcap® Index represents approximately 31% of the total market capitalization of the Russell 1000® Index companies. Results assume reinvestment of all dividends and capital gains. An investment cannot be made directly in an index. |
| 4. | The Morningstar Mid-Cap Blend Category Average is representative of funds that invest primarily in U.S. stocks of various sizes and styles, giving it a middle-of-the-road profile. The U.S. mid-cap range for market capitalization typically falls between $1 billion and $8 billion and represents 20% of the total capitalization of the U.S. equity market. The blend style is assigned to funds where neither growth nor value characteristics predominate. Results are based on average total returns of similar funds with all dividends and capital gain distributions reinvested. |
Cost in Dollars of a $1,000 Investment in MainStay VP MacKay Mid Cap Core Portfolio (Unaudited)
The example below is intended to describe the fees and expenses borne by shareholders during the six-month period from January 1, 2019, to June 30, 2019, and the impact of those costs on your investment.
Example
As a shareholder of the Portfolio you incur two types of costs: (1) transaction costs, including exchange fees and sales charges (loads) on purchases (as applicable), and (2) ongoing costs, including management fees, distribution and/or service (12b-1) fees, and other Portfolio expenses (as applicable). This example is intended to help you understand your ongoing costs (in dollars) of investing in the Portfolio and to compare these costs with the ongoing costs of investing in other mutual funds. The example is based on an investment of $1,000 made at the beginning of the six-month period and held for the entire period from January 1, 2019, to June 30, 2019. Shares are only sold in connection with variable life and annuity contracts and the example does not reflect any contract level or transactional fees or expenses. If these costs had been included, your costs would have been higher.
This example illustrates your Portfolio’s ongoing costs in two ways:
Actual Expenses
The second and third data columns in the table below provide information about actual account values and actual expenses. You may use the information in these columns, together with the amount you invested, to estimate the expenses that you paid during the six months ended June 30, 2019. Simply divide your account value by $1,000
(for example, an $8,600 account value divided by $1,000 = 8.6), then multiply the result by the number under the heading entitled “Expenses Paid During Period” to estimate the expenses you paid on your account during this period.
Hypothetical Example for Comparison Purposes
The fourth and fifth data columns in the table below provide information about hypothetical account values and hypothetical expenses based on the Portfolio’s actual expense ratio and an assumed rate of return of 5% per year before expenses, which is not the Portfolio’s actual return. The hypothetical account values and expenses may not be used to estimate the actual ending account balances or expenses you paid for thesix-month period shown. You may use this information to compare the ongoing costs of investing in the Portfolio with the ongoing costs of investing in other mutual funds. To do so, compare this 5% hypothetical example with the 5% hypothetical examples that appear in the shareholder reports of the other mutual funds.
Please note that the expenses shown in the table are meant to highlight your ongoing costs only and do not reflect any transactional costs, such as exchange fees or sales charges (loads). Therefore, the fourth and fifth data columns of the table are useful in comparing ongoing costs only and will not help you determine the relative total costs of owning different funds. In addition, if these transactional costs were included, your costs would have been higher.
| | | | | | | | | | | | | | | | | | | | | | |
| | | | | | | | | | | | | | | | | | |
| Share Class | | Beginning
Account
Value
1/1/19 | | | Ending Account
Value (Based
on Actual
Returns and
Expenses)
6/30/19 | | | Expenses
Paid
During
Period1 | | | Ending Account
Value (Based
on Hypothetical
5% Annualized
Return and
Actual Expenses)
6/30/19 | | | Expenses
Paid
During
Period1 | | | Net Expense
Ratio
During
Period2 |
| | | | | | |
| Initial Class Shares | | $ | 1,000.00 | | | $ | 1,154.50 | | | $ | 4.59 | | | $ | 1,020.53 | | | $ | 4.31 | | | 0.86% |
| | | | | | |
| Service Class Shares | | $ | 1,000.00 | | | $ | 1,153.10 | | | $ | 5.93 | | | $ | 1,019.29 | | | $ | 5.56 | | | 1.11% |
| 1. | Expenses are equal to the Portfolio’s annualized expense ratio of each class multiplied by the average account value over the period, divided by 365 and multiplied by 181 (to reflect the six-month period). The table above represents the actual expenses incurred during the six-month period. In addition to the fees and expenses which the Portfolio bears directly, it also indirectly bears a pro rata share of the fees and expenses of the underlying funds in which it invests. Such indirect expenses are not included in the above-reported expense figures. |
| 2. | Expenses are equal to the Portfolio’s annualized expense ratio to reflect the six-month period. |
| | |
| 6 | | MainStay VP MacKay Mid Cap Core Portfolio |
Industry Composition as of June 30, 2019(Unaudited)
| | | | |
| |
| Equity Real Estate Investment Trusts | | | 8.8 | % |
| |
| Software | | | 7.4 | |
| |
| IT Services | | | 5.9 | |
| |
| Insurance | | | 5.8 | |
| |
| Semiconductors & Semiconductor Equipment | | | 4.1 | |
| |
| Specialty Retail | | | 3.8 | |
| |
| Hotels, Restaurants & Leisure | | | 3.3 | |
| |
| Health Care Equipment & Supplies | | | 3.2 | |
| |
| Food Products | | | 3.0 | |
| |
| Machinery | | | 3.0 | |
| |
| Media | | | 2.9 | |
| |
| Capital Markets | | | 2.8 | |
| |
| Oil, Gas & Consumable Fuels | | | 2.8 | |
| |
| Commercial Services & Supplies | | | 2.5 | |
| |
| Multi-Utilities | | | 2.5 | |
| |
| Household Durables | | | 2.3 | |
| |
| Diversified Consumer Services | | | 2.1 | |
| |
| Professional Services | | | 2.1 | |
| |
| Banks | | | 2.0 | |
| |
| Electronic Equipment, Instruments & Components | | | 2.0 | |
| |
| Exchange-Traded Funds | | | 2.0 | |
| |
| Consumer Finance | | | 1.8 | |
| |
| Containers & Packaging | | | 1.8 | |
| |
| Interactive Media & Services | | | 1.8 | |
| |
| Health Care Providers & Services | | | 1.5 | |
| |
| Entertainment | | | 1.4 | |
| |
| Electric Utilities | | | 1.2 | |
| |
| Aerospace & Defense | | | 1.0 | |
| |
| Biotechnology | | | 1.0 | |
| |
| Health Care Technology | | | 0.9 | |
| |
| Life Sciences Tools & Services | | | 0.9 | |
| | | | |
| |
| Technology Hardware, Storage & Peripherals | | | 0.9 | % |
| |
| Textiles, Apparel & Luxury Goods | | | 0.9 | |
| |
| Multiline Retail | | | 0.8 | |
| |
| Airlines | | | 0.7 | |
| |
| Chemicals | | | 0.7 | |
| |
| Construction Materials | | | 0.7 | |
| |
| Independent Power & Renewable Electricity Producers | | | 0.7 | |
| |
| Thrifts & Mortgage Finance | | | 0.7 | |
| |
| Building Products | | | 0.6 | |
| |
| Construction & Engineering | | | 0.6 | |
| |
| Diversified Financial Services | | | 0.6 | |
| |
| Industrial Conglomerates | | | 0.6 | |
| |
| Internet & Direct Marketing Retail | | | 0.5 | |
| |
| Pharmaceuticals | | | 0.5 | |
| |
| Trading Companies & Distributors | | | 0.5 | |
| |
| Communications Equipment | | | 0.4 | |
| |
| Electrical Equipment | | | 0.4 | |
| |
| Transportation Infrastructure | | | 0.4 | |
| |
| Beverages | | | 0.3 | |
| |
| Energy Equipment & Services | | | 0.2 | |
| |
| Wireless Telecommunication Services | | | 0.2 | |
| |
| Auto Components | | | 0.1 | |
| |
| Gas Utilities | | | 0.1 | |
| |
| Metals & Mining | | | 0.1 | |
| |
| Household Products | | | 0.0 | ‡ |
| |
| Paper & Forest Products | | | 0.0 | ‡ |
| |
| Water Utilities | | | 0.0 | ‡ |
| |
| Short-Term Investments | | | 0.7 | |
| |
| Other Assets, Less Liabilities | | | –0.5 | |
| | | | |
| | | 100.0 | % |
| | | | |
See Portfolio of Investments beginning on page 9 for specific holdings within these categories. The Portfolio’s holdings are subject to change.
| ‡ | Less than one-tenth of a percent. |
Top Ten Holdings or Issuers as of June 30, 2019(excluding short-term investment) (Unaudited)
| 1. | SPDR S&P MidCap 400 ETF Trust |
| 9. | Tyson Foods, Inc., Class A |
| 10. | Discover Financial Services |
Portfolio Management Discussion and Analysis(Unaudited)
Answers to the questions reflect the views of portfolio managers Migene Kim, CFA, and Mona Patni of MacKay Shields LLC, the Portfolio’s Subadvisor.
How did MainStay VP MacKay Mid Cap Core Portfolio perform relative to its benchmark and peers during the six months ended June 30, 2019?
For the six months ended June 30, 2019, MainStay VP MacKay Mid Cap Core Portfolio returned 15.45% for Initial Class shares and 15.31% for Service Class shares. Over the same period, both share classes underperformed the 21.35% return of the Russell Midcap® Index, which is the Portfolio’s benchmark, and the 17.52% return of the MorningstarMid-Cap Blend Category Average.1
What factors affected the Portfolio’s relative performance during the reporting period?
Stock selection was primarily responsible for the Portfolio’s underperformance relative to the Russell Midcap® Index during the reporting period, whereas sector allocation effect was neutral. The Portfolio’s relative performance directly reflected the performance of our stock selection model, particularly the weak effectiveness of the model’s valuation signals, which seek to evaluate companies across sales- and cash-based measures on a peer-relative basis. Valuation ranges across markets were compressed and value signals, which tend to prove most effective in an environment in which profits are accelerating, struggled amid a decelerating global growth outlook. Valuation signals proved more effective in June 2019 when value performance rebounded. Positive contributions from the stock selection model’s other factors provided only partial mitigation. (Contributions take weightings and total returns into account.) Momentum signals, which evaluate historical price trends, generated positive relative performance for the Portfolio during the reporting period, but proved volatile and inconsistent, hence difficult to capture. Sentiment signals, a gauge of institutional investor sentiment, were not effective during the first half of the reporting period but rebounded in the second half of the same period thanks to the Portfolio’s underweight positions.
Which sectors were the strongest positive contributors to the Portfolio’s relative performance, and which sectors were particularly weak?
The consumer staples sector made the strongest positive contribution to the Portfolio’s performance relative to the Russell Midcap® Index. The sectors that detracted the most from the Portfolio’s relative performance during the reporting period included information technology, health care and industrials.
During the reporting period, which individual stocks made the strongest positive contributions to the Portfolio’s absolute performance and which stocks detracted the most?
The stocks that made the most substantial positive contribution to the Portfolio’s absolute performance during the reporting period included software company Cadence Design Systems, restaurant chain Chipotle Mexican Grill, and semiconductor equipment maker Lam Research. The stocks that detracted the most from the Portfolio’s absolute performance during the reporting period included specialty pharmaceuticals company Mylan, communications infrastructure provider CommScope, and commodity-focused global chemical producer The Chemours Company.
Did the Portfolio make any significant purchases or sales during the reporting period?
The Portfolio’s largest initial purchase during the reporting period was in shares of orthodontics company Align Technology, while the Portfolio’s largest increase in position size was in construction materials manufacturer Carlisle. Over the same period, the most substantial position that the Portfolio exited completely was in multiline health maintenance organization (HMO) Centene, while the Portfolio’s most substantial decrease in position size was in computer hardware company Dell Technologies.
How did the Portfolio’s sector weightings change during the reporting period?
During the reporting period, the Portfolio’s most substantial sector-weighting increases relative to the Russell Midcap® Index were in consumer discretionary and financials. Over the same period, the Portfolio’s most substantial sector-weighting decreases relative to the benchmark were in utilities and health care.
How was the Portfolio positioned at the end of the reporting period?
As of June 30, 2019, the Portfolio sector exposures most substantially overweight relative to the Russell Midcap® Index included communication services and consumer discretionary. As of the same date, the Portfolio sector exposures that were most substantially underweight relative to the benchmark included health care and utilities.
| 1. | See page 5 for more information on benchmark and peer group returns. |
The opinions expressed are those of the portfolio managers as of the date of this report and are subject to change. There is no guarantee that any forecasts will come to pass. This material does not constitute investment advice and is not intended as an endorsement of any specific investment.
Not all MainStay VP Portfolios and/or share classes are available under all policies.
| | |
| 8 | | MainStay VP MacKay Mid Cap Core Portfolio |
Portfolio of InvestmentsJune 30, 2019 (Unaudited)
| | | | | | | | |
| | |
| | | Shares | | | Value | |
| Common Stocks 97.8%† | |
Aerospace & Defense 1.0% | |
Curtiss-Wright Corp. | | | 3,067 | | | $ | 389,908 | |
Huntington Ingalls Industries, Inc. | | | 14,840 | | | | 3,335,142 | |
L3 Technologies, Inc. | | | 1,384 | | | | 339,315 | |
Spirit AeroSystems Holdings, Inc., Class A | | | 54,650 | | | | 4,446,870 | |
Textron, Inc. | | | 6,457 | | | | 342,479 | |
TransDigm Group, Inc. (a) | | | 936 | | | | 452,837 | |
| | | | | | | | |
| | | | | | | 9,306,551 | |
| | | | | | | | |
Airlines 0.7% | |
Alaska Air Group, Inc. | | | 21,738 | | | | 1,389,276 | |
United Continental Holdings, Inc. (a) | | | 58,141 | | | | 5,090,244 | |
| | | | | | | | |
| | | | | | | 6,479,520 | |
| | | | | | | | |
Auto Components 0.1% | |
Lear Corp. | | | 5,683 | | | | 791,471 | |
| | | | | | | | |
|
Banks 2.0% | |
Bank OZK | | | 125,767 | | | | 3,784,329 | |
CIT Group, Inc. | | | 79,887 | | | | 4,197,263 | |
Citizens Financial Group, Inc. | | | 32,054 | | | | 1,133,429 | |
Comerica, Inc. | | | 57,054 | | | | 4,144,403 | |
Fifth Third Bancorp | | | 98,512 | | | | 2,748,485 | |
First Citizens BancShares, Inc., Class A | | | 290 | | | | 130,578 | |
First Hawaiian, Inc. | | | 28,134 | | | | 727,827 | |
KeyCorp | | | 14,134 | | | | 250,878 | |
Signature Bank | | | 4,093 | | | | 494,598 | |
| | | | | | | | |
| | | | | | | 17,611,790 | |
| | | | | | | | |
Beverages 0.3% | |
Keurig Dr. Pepper, Inc. | | | 69,690 | | | | 2,014,041 | |
Molson Coors Brewing Co., Class B | | | 5,706 | | | | 319,536 | |
| | | | | | | | |
| | | | | | | 2,333,577 | |
| | | | | | | | |
Biotechnology 1.0% | |
Alkermes PLC (a) | | | 93,602 | | | | 2,109,789 | |
Exact Sciences Corp. (a) | | | 13,564 | | | | 1,601,095 | |
Exelixis, Inc. (a) | | | 987 | | | | 21,092 | |
Incyte Corp. (a) | | | 25,050 | | | | 2,128,248 | |
Ionis Pharmaceuticals, Inc. (a) | | | 13,375 | | | | 859,611 | |
United Therapeutics Corp. (a) | | | 25,744 | | | | 2,009,577 | |
| | | | | | | | |
| | | | | | | 8,729,412 | |
| | | | | | | | |
Building Products 0.6% | |
Armstrong World Industries, Inc. | | | 805 | | | | 78,246 | |
Masco Corp. | | | 125,368 | | | | 4,919,440 | |
| | | | | | | | |
| | | | | | | 4,997,686 | |
| | | | | | | | |
Capital Markets 2.8% | |
Ameriprise Financial, Inc. | | | 17,295 | | | | 2,510,542 | |
E*TRADE Financial Corp. | | | 103,599 | | | | 4,620,516 | |
Evercore, Inc., Class A | | | 23,590 | | | | 2,089,366 | |
FactSet Research Systems, Inc. | | | 8,396 | | | | 2,405,958 | |
| | | | | | | | |
| | |
| | | Shares | | | Value | |
Capital Markets (continued) | |
Franklin Resources, Inc. | | | 10,699 | | | $ | 372,325 | |
Janus Henderson Group PLC | | | 46,484 | | | | 994,758 | |
Lazard, Ltd., Class A | | | 49,652 | | | | 1,707,532 | |
LPL Financial Holdings, Inc. | | | 50,585 | | | | 4,126,219 | |
Moody’s Corp. | | | 1,152 | | | | 224,997 | |
MSCI, Inc. | | | 8,332 | | | | 1,989,598 | |
Northern Trust Corp. | | | 9,358 | | | | 842,220 | |
Raymond James Financial, Inc. | | | 33,764 | | | | 2,854,746 | |
| | | | | | | | |
| | | | | | | 24,738,777 | |
| | | | | | | | |
Chemicals 0.7% | |
Celanese Corp. | | | 7,922 | | | | 853,992 | |
CF Industries Holdings, Inc. | | | 99,762 | | | | 4,659,883 | |
Corteva, Inc. (a) | | | 1,433 | | | | 42,374 | |
Valvoline, Inc. | | | 43,084 | | | | 841,430 | |
| | | | | | | | |
| | | | | | | 6,397,679 | |
| | | | | | | | |
Commercial Services & Supplies 2.5% | |
ADT, Inc. (b) | | | 546,267 | | | | 3,343,154 | |
Cintas Corp. | | | 20,987 | | | | 4,980,005 | |
Clean Harbors, Inc. (a) | | | 57,870 | | | | 4,114,557 | |
Copart, Inc. (a) | | | 16,304 | | | | 1,218,561 | |
IAA, Inc. (a) | | | 68,928 | | | | 2,673,028 | |
KAR Auction Services, Inc. | | | 68,928 | | | | 1,723,200 | |
Republic Services, Inc. | | | 46,056 | | | | 3,990,292 | |
| | | | | | | | |
| | | | | | | 22,042,797 | |
| | | | | | | | |
Communications Equipment 0.4% | |
Arista Networks, Inc. (a) | | | 33 | | | | 8,567 | |
EchoStar Corp., Class A (a) | | | 64,261 | | | | 2,848,048 | |
F5 Networks, Inc. (a) | | | 3,155 | | | | 459,463 | |
| | | | | | | | |
| | | | | | | 3,316,078 | |
| | | | | | | | |
Construction & Engineering 0.6% | |
AECOM (a) | | | 98,604 | | | | 3,732,162 | |
Arcosa, Inc. | | | 52,340 | | | | 1,969,554 | |
| | | | | | | | |
| | | | | | | 5,701,716 | |
| | | | | | | | |
Construction Materials 0.7% | |
Eagle Materials, Inc. | | | 36,032 | | | | 3,340,166 | |
Martin Marietta Materials, Inc. | | | 8,169 | | | | 1,879,769 | |
Vulcan Materials Co. | | | 10,083 | | | | 1,384,497 | |
| | | | | | | | |
| | | | | | | 6,604,432 | |
| | | | | | | | |
Consumer Finance 1.8% | |
Discover Financial Services | | | 78,015 | | | | 6,053,184 | |
SLM Corp. | | | 403,270 | | | | 3,919,785 | |
Synchrony Financial | | | 181,517 | | | | 6,293,194 | |
| | | | | | | | |
| | | | | | | 16,266,163 | |
| | | | | | | | |
Containers & Packaging 1.8% | |
Ardagh Group S.A. | | | 21,680 | | | | 379,400 | |
Ball Corp. | | | 92,530 | | | | 6,476,175 | |
Berry Global Group, Inc. (a) | | | 84,582 | | | | 4,448,167 | |
| | | | | | |
The notes to the financial statements are an integral part of,
and should be read in conjunction with, the financial statements. | | | | | 9 | |
Portfolio of InvestmentsJune 30, 2019 (Unaudited) (continued)
| | | | | | | | |
| | |
| | | Shares | | | Value | |
| Common Stocks (continued) | |
Containers & Packaging (continued) | |
Owens-Illinois, Inc. | | | 6,980 | | | $ | 120,545 | |
Packaging Corp. of America | | | 13,472 | | | | 1,284,151 | |
Silgan Holdings, Inc. | | | 95,997 | | | | 2,937,508 | |
WestRock Co. | | | 22,147 | | | | 807,701 | |
| | | | | | | | |
| | | | | | | 16,453,647 | |
| | | | | | | | |
Diversified Consumer Services 2.1% | |
Frontdoor, Inc. (a) | | | 92,660 | | | | 4,035,343 | |
Graham Holdings Co., Class B | | | 2,515 | | | | 1,735,426 | |
H&R Block, Inc. | | | 146,171 | | | | 4,282,810 | |
Service Corporation International | | | 97,422 | | | | 4,557,401 | |
ServiceMaster Global Holdings, Inc. (a) | | | 79,638 | | | | 4,148,343 | |
| | | | | | | | |
| | | | | | | 18,759,323 | |
| | | | | | | | |
Diversified Financial Services 0.6% | |
AXA Equitable Holdings, Inc. | | | 164,523 | | | | 3,438,531 | |
Voya Financial, Inc. | | | 34,998 | | | | 1,935,389 | |
| | | | | | | | |
| | | | | | | 5,373,920 | |
| | | | | | | | |
Electric Utilities 1.2% | |
Avangrid, Inc. | | | 7,215 | | | | 364,357 | |
Entergy Corp. | | | 29,071 | | | | 2,992,278 | |
Evergy, Inc. | | | 658 | | | | 39,579 | |
Eversource Energy | | | 10,449 | | | | 791,616 | |
Hawaiian Electric Industries, Inc. | | | 16,212 | | | | 706,033 | |
PG&E Corp. (a) | | | 38,469 | | | | 881,709 | |
Pinnacle West Capital Corp. | | | 7,326 | | | | 689,303 | |
Xcel Energy, Inc. | | | 67,991 | | | | 4,044,785 | |
| | | | | | | | |
| | | | | | | 10,509,660 | |
| | | | | | | | |
Electrical Equipment 0.4% | |
Acuity Brands, Inc. | | | 11,736 | | | | 1,618,512 | |
GrafTech International, Ltd. | | | 59,281 | | | | 681,732 | |
Hubbell, Inc. | | | 2,526 | | | | 329,390 | |
Regal Beloit Corp. | | | 16,819 | | | | 1,374,280 | |
| | | | | | | | |
| | | | | | | 4,003,914 | |
| | | | | | | | |
Electronic Equipment, Instruments & Components 2.0% | |
Avnet, Inc. | | | 90,607 | | | | 4,101,779 | |
CDW Corp. | | | 49,854 | | | | 5,533,794 | |
Coherent, Inc. (a) | | | 6,953 | | | | 948,181 | |
Jabil, Inc. | | | 147,783 | | | | 4,669,943 | |
Keysight Technologies, Inc. (a) | | | 714 | | | | 64,124 | |
Zebra Technologies Corp., Class A (a) | | | 10,555 | | | | 2,211,167 | |
| | | | | | | | |
| | | | | | | 17,528,988 | |
| | | | | | | | |
Energy Equipment & Services 0.2% | |
Patterson-UTI Energy, Inc. | | | 67,918 | | | | 781,736 | |
RPC, Inc. (b) | | | 87,461 | | | | 630,594 | |
| | | | | | | | |
| | | | | | | 1,412,330 | |
| | | | | | | | |
| | | | | | | | |
| | |
| | | Shares | | | Value | |
Entertainment 1.4% | |
Cinemark Holdings, Inc. | | | 55,270 | | | $ | 1,995,247 | |
Live Nation Entertainment, Inc. (a) | | | 51,357 | | | | 3,402,401 | |
Take-Two Interactive Software, Inc. (a) | | | 10,130 | | | | 1,150,059 | |
Viacom, Inc. | | | | | | | | |
Class A (b) | | | 38,494 | | | | 1,312,645 | |
Class B | | | 147,525 | | | | 4,406,572 | |
| | | | | | | | |
| | | | | | | 12,266,924 | |
| | | | | | | | |
Equity Real Estate Investment Trusts 8.8% | |
American Campus Communities, Inc. | | | 12,039 | | | | 555,720 | |
American Homes 4 Rent, Class A | | | 158,831 | | | | 3,861,182 | |
Americold Realty Trust | | | 62,341 | | | | 2,021,095 | |
Apartment Investment & Management Co., Class A | | | 9,358 | | | | 469,023 | |
Apple Hospitality REIT, Inc. | | | 11,151 | | | | 176,855 | |
AvalonBay Communities, Inc. | | | 9,492 | | | | 1,928,585 | |
Brookfield Property REIT, Inc., Class A | | | 192,351 | | | | 3,633,510 | |
Camden Property Trust | | | 4,899 | | | | 511,407 | |
Colony Capital, Inc. | | | 729,421 | | | | 3,647,105 | |
Digital Realty Trust, Inc. | | | 730 | | | | 85,987 | |
Empire State Realty Trust, Inc., Class A | | | 40,366 | | | | 597,821 | |
EPR Properties | | | 50,795 | | | | 3,788,799 | |
Equity LifeStyle Properties, Inc. | | | 37,671 | | | | 4,570,999 | |
Equity Residential | | | 31,341 | | | | 2,379,409 | |
Essex Property Trust, Inc. | | | 3,072 | | | | 896,809 | |
Extra Space Storage, Inc. | | | 5,242 | | | | 556,176 | |
Gaming and Leisure Properties, Inc. | | | 82,587 | | | | 3,219,241 | |
Hospitality Properties Trust | | | 35,219 | | | | 880,475 | |
Host Hotels & Resorts, Inc. | | | 268,620 | | | | 4,894,256 | |
Iron Mountain, Inc. | | | 45,514 | | | | 1,424,588 | |
Lamar Advertising Co., Class A | | | 51,103 | | | | 4,124,523 | |
Medical Properties Trust, Inc. | | | 27,373 | | | | 477,385 | |
Mid-America Apartment Communities, Inc. | | | 15,850 | | | | 1,866,496 | |
Omega Healthcare Investors, Inc. | | | 113,297 | | | | 4,163,665 | |
Outfront Media, Inc. | | | 78,347 | | | | 2,020,569 | |
Park Hotels & Resorts, Inc. | | | 102,120 | | | | 2,814,427 | |
Rayonier, Inc. | | | 66,907 | | | | 2,027,282 | |
Realty Income Corp. | | | 3,133 | | | | 216,083 | |
Retail Value, Inc. | | | 4,262 | | | | 148,318 | |
SBA Communications Corp. (a) | | | 25,862 | | | | 5,814,812 | |
SITE Centers Corp. | | | 270,674 | | | | 3,583,724 | |
Taubman Centers, Inc. | | | 19,001 | | | | 775,811 | |
Ventas, Inc. | | | 73,466 | | | | 5,021,401 | |
VEREIT, Inc. | | | 50,429 | | | | 454,365 | |
Welltower, Inc. | | | 66,900 | | | | 5,454,357 | |
| | | | | | | | |
| | | | | | | 79,062,260 | |
| | | | | | | | |
Food Products 3.0% | |
Campbell Soup Co. | | | 104,482 | | | | 4,186,594 | |
Flowers Foods, Inc. | | | 141,532 | | | | 3,293,450 | |
J.M. Smucker Co. | | | 20,084 | | | | 2,313,476 | |
Pilgrim’s Pride Corp. (a) | | | 134,402 | | | | 3,412,467 | |
| | | | |
| 10 | | MainStay VP MacKay Mid Cap Core Portfolio | | The notes to the financial statements are an integral part of,
and should be read in conjunction with, the financial statements. |
| | | | | | | | |
| | |
| | | Shares | | | Value | |
| Common Stocks (continued) | |
Food Products (continued) | |
Post Holdings, Inc. (a) | | | 39,986 | | | $ | 4,157,344 | |
TreeHouse Foods, Inc. (a) | | | 68,450 | | | | 3,703,145 | |
Tyson Foods, Inc., Class A | | | 75,723 | | | | 6,113,875 | |
| | | | | | | | |
| | | | | | | 27,180,351 | |
| | | | | | | | |
Gas Utilities 0.1% | |
UGI Corp. | | | 13,813 | | | | 737,752 | |
| | | | | | | | |
|
Health Care Equipment & Supplies 3.2% | |
ABIOMED, Inc. (a) | | | 5,060 | | | | 1,318,079 | |
Align Technology, Inc. (a) | | | 20,396 | | | | 5,582,385 | |
Cooper Cos., Inc. | | | 16,575 | | | | 5,583,952 | |
DENTSPLY SIRONA, Inc. | | | 43,327 | | | | 2,528,564 | |
Edwards Lifesciences Corp. (a) | | | 2,297 | | | | 424,348 | |
Hill-Rom Holdings, Inc. | | | 39,017 | | | | 4,081,959 | |
Hologic, Inc. (a) | | | 52,501 | | | | 2,521,098 | |
Masimo Corp. (a) | | | 1,709 | | | | 254,333 | |
STERIS PLC | | | 31,359 | | | | 4,668,728 | |
Varian Medical Systems, Inc. (a) | | | 365 | | | | 49,687 | |
Zimmer Biomet Holdings, Inc. | | | 18,023 | | | | 2,122,028 | |
| | | | | | | | |
| | | | | | | 29,135,161 | |
| | | | | | | | |
Health Care Providers & Services 1.5% | |
AmerisourceBergen Corp. | | | 58,899 | | | | 5,021,729 | |
Cardinal Health, Inc. | | | 18,786 | | | | 884,820 | |
Encompass Health Corp. | | | 61,538 | | | | 3,899,048 | |
McKesson Corp. | | | 23,773 | | | | 3,194,853 | |
Premier, Inc., Class A (a) | | | 1,155 | | | | 45,172 | |
Universal Health Services, Inc., Class B | | | 4,151 | | | | 541,249 | |
| | | | | | | | |
| | | | | | | 13,586,871 | |
| | | | | | | | |
Health Care Technology 0.9% | |
Cerner Corp. | | | 69,116 | | | | 5,066,203 | |
Veeva Systems, Inc., Class A (a) | | | 18,489 | | | | 2,997,252 | |
| | | | | | | | |
| | | | | | | 8,063,455 | |
| | | | | | | | |
Hotels, Restaurants & Leisure 3.3% | |
Aramark | | | 131,654 | | | | 4,747,443 | |
Caesars Entertainment Corp. (a) | | | 22,676 | | | | 268,030 | |
Chipotle Mexican Grill, Inc. (a) | | | 3,007 | | | | 2,203,770 | |
Darden Restaurants, Inc. | | | 43,046 | | | | 5,239,990 | |
Hilton Worldwide Holdings, Inc. | | | 21,626 | | | | 2,113,725 | |
MGM Resorts International | | | 7,772 | | | | 222,046 | |
Norwegian Cruise Line Holdings, Ltd. (a) | | | 81,900 | | | | 4,392,297 | |
Royal Caribbean Cruises, Ltd. | | | 21,003 | | | | 2,545,774 | |
Wyndham Destinations, Inc. | | | 52,765 | | | | 2,316,384 | |
Yum China Holdings, Inc. | | | 127,645 | | | | 5,897,199 | |
| | | | | | | | |
| | | | | | | 29,946,658 | |
| | | | | | | | |
| | | | | | | | |
| | |
| | | Shares | | | Value | |
Household Durables 2.3% | |
Garmin, Ltd. | | | 29,602 | | | $ | 2,362,240 | |
Lennar Corp. | | | | | | | | |
Class A | | | 34,591 | | | | 1,676,280 | |
Class B | | | 1,064 | | | | 40,975 | |
NVR, Inc. (a) | | | 1,388 | | | | 4,677,907 | |
PulteGroup, Inc. | | | 135,291 | | | | 4,277,901 | |
Tempur Sealy International, Inc. (a) | | | 775 | | | | 56,862 | |
Toll Brothers, Inc. | | | 107,599 | | | | 3,940,275 | |
Whirlpool Corp. | | | 25,032 | | | | 3,563,555 | |
| | | | | | | | |
| | | | | | | 20,595,995 | |
| | | | | | | | |
Household Products 0.0%‡ | |
Church & Dwight Co., Inc. | | | 3,227 | | | | 235,765 | |
| | | | | | | | |
|
Independent Power & Renewable Electricity Producers 0.7% | |
NRG Energy, Inc. | | | 130,043 | | | | 4,567,110 | |
Vistra Energy Corp. | | | 87,905 | | | | 1,990,169 | |
| | | | | | | | |
| | | | | | | 6,557,279 | |
| | | | | | | | |
Industrial Conglomerates 0.6% | |
Carlisle Cos., Inc. | | | 31,715 | | | | 4,453,103 | |
Roper Technologies, Inc. | | | 2,942 | | | | 1,077,537 | |
| | | | | | | | |
| | | | | | | 5,530,640 | |
| | | | | | | | |
Insurance 5.8% | |
American Financial Group, Inc. | | | 15,622 | | | | 1,600,786 | |
American National Insurance Co. | | | 4,193 | | | | 488,359 | |
Arch Capital Group, Ltd. (a) | | | 118,879 | | | | 4,408,033 | |
Arthur J. Gallagher & Co. | | | 8,812 | | | | 771,843 | |
Assured Guaranty, Ltd. | | | 92,433 | | | | 3,889,581 | |
Athene Holding, Ltd., Class A (a) | | | 59,381 | | | | 2,556,946 | |
AXIS Capital Holdings, Ltd. | | | 5,018 | | | | 299,324 | |
Brighthouse Financial, Inc. (a) | | | 97,021 | | | | 3,559,701 | |
Cincinnati Financial Corp. | | | 12,872 | | | | 1,334,440 | |
CNA Financial Corp. | | | 26,844 | | | | 1,263,547 | |
Fidelity National Financial, Inc. | | | 118,100 | | | | 4,759,430 | |
First American Financial Corp. | | | 77,769 | | | | 4,176,195 | |
Hanover Insurance Group, Inc. | | | 10,611 | | | | 1,361,391 | |
Hartford Financial Services Group, Inc. | | | 50,040 | | | | 2,788,229 | |
Kemper Corp. | | | 21,265 | | | | 1,834,957 | |
Lincoln National Corp. | | | 42,685 | | | | 2,751,048 | |
Mercury General Corp. | | | 36,078 | | | | 2,254,875 | |
Old Republic International Corp. | | | 183,957 | | | | 4,116,958 | |
Principal Financial Group, Inc. | | | 12,753 | | | | 738,654 | |
Reinsurance Group of America, Inc. | | | 29,841 | | | | 4,656,091 | |
Unum Group | | | 10,268 | | | | 344,491 | |
W.R. Berkley Corp. | | | 10,015 | | | | 660,289 | |
Willis Towers Watson PLC | | | 8,038 | | | | 1,539,599 | |
| | | | | | | | |
| | | | | | | 52,154,767 | |
| | | | | | | | |
Interactive Media & Services 1.8% | |
IAC/InterActiveCorp (a) | | | 23,713 | | | | 5,158,289 | |
Match Group, Inc. (b) | | | 15,941 | | | | 1,072,351 | |
| | | | | | |
The notes to the financial statements are an integral part of,
and should be read in conjunction with, the financial statements. | | | | | 11 | |
Portfolio of InvestmentsJune 30, 2019 (Unaudited) (continued)
| | | | | | | | |
| | |
| | | Shares | | | Value | |
| Common Stocks (continued) | |
Interactive Media & Services (continued) | |
TripAdvisor, Inc. (a) | | | 81,490 | | | $ | 3,772,172 | |
Twitter, Inc. (a) | | | 178,411 | | | | 6,226,544 | |
| | | | | | | | |
| | | | | | | 16,229,356 | |
| | | | | | | | |
Internet & Direct Marketing Retail 0.5% | |
Expedia Group, Inc. | | | 34,337 | | | | 4,567,851 | |
| | | | | | | | |
|
IT Services 5.9% | |
Akamai Technologies, Inc. (a) | | | 62,161 | | | | 4,981,582 | |
Alliance Data Systems Corp. | | | 1,951 | | | | 273,394 | |
Amdocs, Ltd. | | | 42,696 | | | | 2,650,995 | |
Booz Allen Hamilton Holding Corp. | | | 30,818 | | | | 2,040,460 | |
CACI International, Inc., Class A (a) | | | 9,784 | | | | 2,001,708 | |
Conduent, Inc. (a) | | | 185,110 | | | | 1,775,205 | |
CoreLogic, Inc. (a) | | | 84,781 | | | | 3,546,389 | |
DXC Technology Co. | | | 97,276 | | | | 5,364,771 | |
Euronet Worldwide, Inc. (a) | | | 27,273 | | | | 4,588,409 | |
Fidelity National Information Services, Inc. | | | 12,106 | | | | 1,485,164 | |
Fiserv, Inc. (a) | | | 7,310 | | | | 666,380 | |
FleetCor Technologies, Inc. (a) | | | 1,508 | | | | 423,522 | |
Genpact, Ltd. | | | 881 | | | | 33,557 | |
GoDaddy, Inc., Class A (a) | | | 66,981 | | | | 4,698,717 | |
Leidos Holdings, Inc. | | | 60,496 | | | | 4,830,606 | |
Sabre Corp. | | | 142,674 | | | | 3,167,363 | |
Square, Inc., Class A (a) | | | 36,383 | | | | 2,638,859 | |
Total System Services, Inc. | | | 14,205 | | | | 1,822,075 | |
VeriSign, Inc. (a) | | | 25,036 | | | | 5,236,530 | |
Western Union Co. | | | 36,646 | | | | 728,889 | |
Worldpay, Inc., Class A (a) | | | 3,507 | | | | 429,783 | |
| | | | | | | | |
| | | | | | | 53,384,358 | |
| | | | | | | | |
Life Sciences Tools & Services 0.9% | |
Agilent Technologies, Inc. | | | 30,295 | | | | 2,262,127 | |
Charles River Laboratories International, Inc. (a) | | | 8,352 | | | | 1,185,149 | |
IQVIA Holdings, Inc. (a) | | | 1,223 | | | | 196,781 | |
Mettler-Toledo International, Inc. (a) | | | 165 | | | | 138,600 | |
PRA Health Sciences, Inc. (a) | | | 42,112 | | | | 4,175,405 | |
| | | | | | | | |
| | | | | | | 7,958,062 | |
| | | | | | | | |
Machinery 3.0% | |
AGCO Corp. | | | 56,681 | | | | 4,396,745 | |
Allison Transmission Holdings, Inc. | | | 91,888 | | | | 4,259,009 | |
Cummins, Inc. | | | 38,142 | | | | 6,535,250 | |
Ingersoll-Rand PLC | | | 240 | | | | 30,401 | |
Oshkosh Corp. | | | 52,132 | | | | 4,352,501 | |
PACCAR, Inc. | | | 39,865 | | | | 2,856,726 | |
Timken Co. | | | 82,765 | | | | 4,249,155 | |
| | | | | | | | |
| | | | | | | 26,679,787 | |
| | | | | | | | |
Media 2.9% | |
Altice U.S.A., Inc., Class A (a) | | | 92,817 | | | | 2,260,094 | |
AMC Networks, Inc., Class A (a) | | | 5,281 | | | | 287,762 | |
| | | | | | | | |
| | |
| | | Shares | | | Value | |
Media (continued) | |
Cable One, Inc. | | | 739 | | | $ | 865,362 | |
Discovery, Inc. (a) | | | | | | | | |
Class A (b) | | | 99,828 | | | | 3,064,719 | |
Class C | | | 129,604 | | | | 3,687,234 | |
DISH Network Corp., Class A (a) | | | 119,818 | | | | 4,602,209 | |
Interpublic Group of Cos., Inc. | | | 65,987 | | | | 1,490,646 | |
Nexstar Media Group, Inc., Class A | | | 19,683 | | | | 1,987,983 | |
Omnicom Group, Inc. | | | 66,245 | | | | 5,428,778 | |
Sinclair Broadcast Group, Inc., Class A | | | 36,354 | | | | 1,949,665 | |
| | | | | | | | |
| | | | | | | 25,624,452 | |
| | | | | | | | |
Metals & Mining 0.1% | |
Steel Dynamics, Inc. | | | 32,178 | | | | 971,776 | |
| | | | | | | | |
|
Multi-Utilities 2.5% | |
Ameren Corp. | | | 46,773 | | | | 3,513,120 | |
CenterPoint Energy, Inc. | | | 160,439 | | | | 4,593,369 | |
CMS Energy Corp. | | | 23,705 | | | | 1,372,756 | |
Consolidated Edison, Inc. | | | 16,952 | | | | 1,486,351 | |
DTE Energy Co. | | | 40,017 | | | | 5,117,374 | |
Public Service Enterprise Group, Inc. | | | 25,662 | | | | 1,509,439 | |
Sempra Energy | | | 8,050 | | | | 1,106,392 | |
WEC Energy Group, Inc. | | | 44,976 | | | | 3,749,649 | |
| | | | | | | | |
| | | | | | | 22,448,450 | |
| | | | | | | | |
Multiline Retail 0.8% | |
Dollar General Corp. | | | 31,145 | | | | 4,209,558 | |
Dollar Tree, Inc. (a) | | | 31,691 | | | | 3,403,297 | |
| | | | | | | | |
| | | | | | | 7,612,855 | |
| | | | | | | | |
Oil, Gas & Consumable Fuels 2.8% | |
Cabot Oil & Gas Corp. | | | 187,091 | | | | 4,295,609 | |
Continental Resources, Inc. (a) | | | 91,778 | | | | 3,862,936 | |
Devon Energy Corp. | | | 181,606 | | | | 5,179,403 | |
EQT Corp. | | | 227,507 | | | | 3,596,886 | |
HollyFrontier Corp. | | | 102,459 | | | | 4,741,803 | |
Marathon Oil Corp. | | | 89,586 | | | | 1,273,017 | |
PBF Energy, Inc., Class A | | | 65,697 | | | | 2,056,316 | |
Williams Cos., Inc. | | | 12,280 | | | | 344,331 | |
| | | | | | | | |
| | | | | | | 25,350,301 | |
| | | | | | | | |
Paper & Forest Products 0.0%‡ | |
Domtar Corp. | | | 8,616 | | | | 383,670 | |
| | | | | | | | |
|
Pharmaceuticals 0.5% | |
Horizon Therapeutics PLC (a) | | | 84,926 | | | | 2,043,320 | |
Jazz Pharmaceuticals PLC (a) | | | 16,186 | | | | 2,307,476 | |
| | | | | | | | |
| | | | | | | 4,350,796 | |
| | | | | | | | |
Professional Services 2.1% | |
IHS Markit, Ltd. (a) | | | 20,415 | | | | 1,300,844 | |
ManpowerGroup, Inc. | | | 44,753 | | | | 4,323,140 | |
Nielsen Holdings PLC | | | 190,858 | | | | 4,313,391 | |
| | | | |
| 12 | | MainStay VP MacKay Mid Cap Core Portfolio | | The notes to the financial statements are an integral part of,
and should be read in conjunction with, the financial statements. |
| | | | | | | | |
| | |
| | | Shares | | | Value | |
| Common Stocks (continued) | |
Professional Services (continued) | |
Robert Half International, Inc. | | | 62,559 | | | $ | 3,566,488 | |
Verisk Analytics, Inc. | | | 38,113 | | | | 5,582,030 | |
| | | | | | | | |
| | | | | | | 19,085,893 | |
| | | | | | | | |
Semiconductors & Semiconductor Equipment 4.1% | |
Advanced Micro Devices, Inc. (a) | | | 1,538 | | | | 46,709 | |
Analog Devices, Inc. | | | 4,225 | | | | 476,876 | |
Cypress Semiconductor Corp. | | | 173,696 | | | | 3,862,999 | |
KLA-Tencor Corp. | | | 44,884 | | | | 5,305,289 | |
Lam Research Corp. | | | 36,778 | | | | 6,908,380 | |
Microchip Technology, Inc. (b) | | | 28,447 | | | | 2,466,355 | |
MKS Instruments, Inc. | | | 41,003 | | | | 3,193,724 | |
ON Semiconductor Corp. (a) | | | 233,725 | | | | 4,723,582 | |
Qorvo, Inc. (a) | | | 70,084 | | | | 4,668,295 | |
Skyworks Solutions, Inc. | | | 306 | | | | 23,645 | |
Teradyne, Inc. | | | 100,027 | | | | 4,792,293 | |
| | | | | | | | |
| | | | | | | 36,468,147 | |
| | | | | | | | |
Software 7.4% | |
Atlassian Corp. PLC, Class A (a) | | | 30,031 | | | | 3,929,256 | |
Autodesk, Inc. (a) | | | 2,334 | | | | 380,209 | |
Cadence Design Systems, Inc. (a) | | | 84,297 | | | | 5,969,071 | |
CDK Global, Inc. | | | 83,517 | | | | 4,129,081 | |
Citrix Systems, Inc. | | | 41,357 | | | | 4,058,776 | |
Dropbox, Inc., Class A (a) | | | 84,565 | | | | 2,118,353 | |
Fair Isaac Corp. (a) | | | 11,551 | | | | 3,627,245 | |
Fortinet, Inc. (a) | | | 61,076 | | | | 4,692,469 | |
LogMeIn, Inc. | | | 53,616 | | | | 3,950,427 | |
Manhattan Associates, Inc. (a) | | | 58,040 | | | | 4,023,913 | |
Nuance Communications, Inc. (a) | | | 231,674 | | | | 3,699,834 | |
Palo Alto Networks, Inc. (a) | | | 26,999 | | | | 5,501,316 | |
Paycom Software, Inc. (a) | | | 11,958 | | | | 2,711,118 | |
Pivotal Software, Inc., Class A (a) | | | 161,165 | | | | 1,701,902 | |
ServiceNow, Inc. (a) | | | 9,868 | | | | 2,709,457 | |
SS&C Technologies Holdings, Inc. | | | 29,190 | | | | 1,681,636 | |
Symantec Corp. | | | 196,195 | | | | 4,269,203 | |
Synopsys, Inc. (a) | | | 15,020 | | | | 1,932,924 | |
Teradata Corp. (a) | | | 111,497 | | | | 3,997,167 | |
Workday, Inc., Class A (a) | | | 8,037 | | | | 1,652,246 | |
| | | | | | | | |
| | | | | | | 66,735,603 | |
| | | | | | | | |
Specialty Retail 3.8% | |
Advance Auto Parts, Inc. | | | 22,283 | | | | 3,434,702 | |
AutoZone, Inc. (a) | | | 6,050 | | | | 6,651,794 | |
Best Buy Co., Inc. | | | 78,666 | | | | 5,485,380 | |
Dick’s Sporting Goods, Inc. | | | 105,951 | | | | 3,669,083 | |
Foot Locker, Inc. | | | 40,086 | | | | 1,680,405 | |
L Brands, Inc. | | | 83,710 | | | | 2,184,831 | |
Michaels Cos., Inc. (a) | | | 94,795 | | | | 824,717 | |
O’Reilly Automotive, Inc. (a) | | | 8,022 | | | | 2,962,685 | |
Ross Stores, Inc. | | | 2,854 | | | | 282,888 | |
| | | | | | | | |
| | |
| | | Shares | | | Value | |
Specialty Retail (continued) | |
Tractor Supply Co. | | | 3,690 | | | $ | 401,472 | |
Ulta Beauty, Inc. (a) | | | 6,878 | | | | 2,385,909 | |
Williams-Sonoma, Inc. (b) | | | 64,396 | | | | 4,185,740 | |
| | | | | | | | |
| | | | | | | 34,149,606 | |
| | | | | | | | |
Technology Hardware, Storage & Peripherals 0.9% | |
Dell Technologies, Inc., Class C (a) | | | 34,567 | | | | 1,756,004 | |
NCR Corp. (a) | | | 73,985 | | | | 2,300,934 | |
Xerox Corp. | | | 124,923 | | | | 4,423,523 | |
| | | | | | | | |
| | | | | | | 8,480,461 | |
| | | | | | | | |
Textiles, Apparel & Luxury Goods 0.9% | |
Kontoor Brands, Inc. (a) | | | 1,295 | | | | 36,286 | |
Ralph Lauren Corp. | | | 30,954 | | | | 3,516,065 | |
Skechers U.S.A., Inc., Class A (a) | | | 130,850 | | | | 4,120,466 | |
| | | | | | | | |
| | | | | | | 7,672,817 | |
| | | | | | | | |
Thrifts & Mortgage Finance 0.7% | |
LendingTree, Inc. (a) | | | 1,556 | | | | 653,567 | |
MGIC Investment Corp. (a) | | | 143,142 | | | | 1,880,886 | |
New York Community Bancorp, Inc. | | | 360,788 | | | | 3,600,664 | |
| | | | | | | | |
| | | | | | | 6,135,117 | |
| | | | | | | | |
Trading Companies & Distributors 0.5% | |
United Rentals, Inc. (a) | | | 29,877 | | | | 3,962,586 | |
W.W. Grainger, Inc. | | | 704 | | | | 188,834 | |
| | | | | | | | |
| | | | | | | 4,151,420 | |
| | | | | | | | |
Transportation Infrastructure 0.4% | |
Macquarie Infrastructure Corp. | | | 93,194 | | | | 3,778,085 | |
| | | | | | | | |
|
Water Utilities 0.0%‡ | |
American Water Works Co., Inc. | | | 827 | | | | 95,932 | |
| | | | | | | | |
|
Wireless Telecommunication Services 0.2% | |
Telephone & Data Systems, Inc. | | | 52,555 | | | | 1,597,672 | |
United States Cellular Corp. (a) | | | 5,893 | | | | 263,240 | |
| | | | | | | | |
| | | | | | | 1,860,912 | |
| | | | | | | | |
Total Common Stocks
(Cost $780,576,363) | | | | | | | 878,589,016 | |
| | | | | | | | |
|
| Exchange-Traded Funds 2.0% | |
SPDR S&P 500 ETF Trust | | | 8,178 | | | | 2,396,154 | |
SPDR S&P MidCap 400 ETF Trust | | | 43,565 | | | | 15,447,713 | |
| | | | | | | | |
Total Exchange-Traded Funds
(Cost $15,602,484) | | | | | | | 17,843,867 | |
| | | | | | | | |
| | | | | | |
The notes to the financial statements are an integral part of,
and should be read in conjunction with, the financial statements. | | | | | 13 | |
Portfolio of InvestmentsJune 30, 2019 (Unaudited) (continued)
| | | | | | | | |
| | |
| | | Shares | | | Value | |
| Short-Term Investments 0.7% | |
Affiliated Investment Company 0.2% | |
MainStay U.S. Government Liquidity Fund, 2.03% (c) | | | 2,039,697 | | | $ | 2,039,697 | |
| | | | | | | | |
|
Unaffiliated Investment Company 0.5% | |
State Street Navigator Securities Lending Government Money Market Portfolio, 2.33% (c)(d) | | | 4,590,078 | | | | 4,590,078 | |
| | | | | | | | |
TotalShort-Term Investments
(Cost $6,629,775) | | | | | | | 6,629,775 | |
| | | | | | | | |
Total Investments
(Cost $802,808,622) | | | 100.5 | % | | | 903,062,658 | |
Other Assets, Less Liabilities | | | (0.5 | ) | | | (4,915,695 | ) |
Net Assets | | | 100.0 | % | | $ | 898,146,963 | |
| † | Percentages indicated are based on Portfolio net assets. |
| ‡ | Less than one-tenth of a percent. |
| (a) | Non-income producing security. |
| (b) | All or a portion of this security was held on loan. As of June 30, 2019, the aggregate market value of securities on loan was $10,634,343; the total market value of collateral held by the Portfolio was $10,941,621. The market value of the collateral held included non-cash collateral in the form of U.S. Treasury securities with a value of $6,351,543 (See Note 2(H)). |
| (c) | Current yield as of June 30, 2019. |
| (d) | Represents security purchased with cash collateral received for securities on loan. |
The following abbreviations are used in the preceding pages:
ETF—Exchange-Traded Fund
SPDR—Standard & Poor’s Depositary Receipt
The following is a summary of the fair valuations according to the inputs used as of June 30, 2019, for valuing the Portfolio’s assets:
| | | | | | | | | | | | | | | | |
Description | | Quoted
Prices in
Active
Markets for
Identical
Assets
(Level 1) | | | Significant
Other
Observable
Inputs
(Level 2) | | | Significant
Unobservable
Inputs
(Level 3) | | | Total | |
| | | | |
Asset Valuation Inputs | | | | | | | | | | | | | | | | |
| Investments in Securities (a) | | | | | | | | | | | | | | | | |
| Common Stocks | | $ | 878,589,016 | | | $ | — | | | $ | — | | | $ | 878,589,016 | |
| Exchange-Traded Funds | | | 17,843,867 | | | | — | | | | — | | | | 17,843,867 | |
| Short-Term Investments | | | | | | | | | | | | | | | | |
Affiliated Investment Company | | | 2,039,697 | | | | — | | | | — | | | | 2,039,697 | |
Unaffiliated Investment Company | | | 4,590,078 | | | | — | | | | — | | | | 4,590,078 | |
| | | | | | | | | | | | | | | | |
| TotalShort-Term Investments | | | 6,629,775 | | | | — | | | | — | | | | 6,629,775 | |
| | | | | | | | | | | | | | | | |
| Total Investments in Securities | | $ | 903,062,658 | | | $ | — | | | $ | — | | | $ | 903,062,658 | |
| | | | | | | | | | | | | | | | |
| (a) | For a complete listing of investments and their industries, see the Portfolio of Investments. |
| | | | |
| 14 | | MainStay VP MacKay Mid Cap Core Portfolio | | The notes to the financial statements are an integral part of,
and should be read in conjunction with, the financial statements. |
Statement of Assets and Liabilitiesas of June 30, 2019 (Unaudited)
| | | | |
| Assets | | | | |
Investment in unaffiliated securities, at value
(identified cost $800,768,925) including securities on loan of $10,634,343 | | $ | 901,022,961 | |
Investment in affiliated investment company, at value (identified cost $2,039,697) | | | 2,039,697 | |
Receivables: | | | | |
Dividends | | | 1,150,511 | |
Portfolio shares sold | | | 408,332 | |
Securities lending | | | 4,407 | |
Other assets | | | 4,328 | |
| | | | |
Total assets | | | 904,630,236 | |
| | | | |
| |
| Liabilities | | | | |
Cash collateral received for securities on loan | | | 4,590,078 | |
Payables: | | | | |
Investment securities purchased | | | 721,922 | |
Manager (See Note 3) | | | 599,566 | |
Portfolio shares redeemed | | | 389,337 | |
NYLIFE Distributors (See Note 3) | | | 94,717 | |
Professional fees | | | 32,846 | |
Shareholder communication | | | 30,868 | |
Custodian | | | 15,285 | |
Trustees | | | 1,115 | |
Accrued expenses | | | 7,539 | |
| | | | |
Total liabilities | | | 6,483,273 | |
| | | | |
Net assets | | $ | 898,146,963 | |
| | | | |
| |
| Composition of Net Assets | | | | |
Shares of beneficial interest outstanding (par value of $.001 per share) unlimited number of shares authorized | | $ | 65,770 | |
Additional paid-in capital | | | 726,350,348 | |
| | | | |
| | | 726,416,118 | |
Total distributable earnings (loss) | | | 171,730,845 | |
| | | | |
Net assets | | $ | 898,146,963 | |
| | | | |
| | | | |
Initial Class | | | | |
Net assets applicable to outstanding shares | | $ | 425,343,734 | |
| | | | |
Shares of beneficial interest outstanding | | | 30,850,240 | |
| | | | |
Net asset value per share outstanding | | $ | 13.79 | |
| | | | |
Service Class | | | | |
Net assets applicable to outstanding shares | | $ | 472,803,229 | |
| | | | |
Shares of beneficial interest outstanding | | | 34,919,712 | |
| | | | |
Net asset value per share outstanding | | $ | 13.54 | |
| | | | |
| | | | | | |
The notes to the financial statements are an integral part of,
and should be read in conjunction with, the financial statements. | | | | | 15 | |
Statement of Operationsfor the six months ended June 30, 2019 (Unaudited)
| | | | |
| Investment Income (Loss) | | | | |
Income | | | | |
Dividends—unaffiliated (a) | | $ | 8,370,227 | |
Securities lending | | | 935,188 | |
Dividends—affiliated | | | 10,043 | |
| | | | |
Total income | | | 9,315,458 | |
| | | | |
Expenses | | | | |
Manager (See Note 3) | | | 3,776,293 | |
Distribution/Service—Service Class (See Note 3) | | | 563,565 | |
Professional fees | | | 50,134 | |
Shareholder communication | | | 38,500 | |
Custodian | | | 17,298 | |
Trustees | | | 11,294 | |
Miscellaneous | | | 17,816 | |
| | | | |
Total expenses before waiver/reimbursement | | | 4,474,900 | |
Expense waiver/reimbursement from Manager (See Note 3) | | | (90,615 | ) |
| | | | |
Net expenses | | | 4,384,285 | |
| | | | |
Net investment income (loss) | | | 4,931,173 | |
| | | | |
|
| Realized and Unrealized Gain (Loss) on Investments | |
Net realized gain (loss) on unaffiliated investments | | | 15,588,229 | |
Net change in unrealized appreciation (depreciation) on unaffiliated investments | | | 107,795,436 | |
| | | | |
Net realized and unrealized gain (loss) on investments | | | 123,383,665 | |
| | | | |
Net increase (decrease) in net assets resulting from operations | | $ | 128,314,838 | |
| | | | |
| (a) | Dividends recorded net of foreign withholding taxes in the amount of $248. |
| | | | |
| 16 | | MainStay VP MacKay Mid Cap Core Portfolio | | The notes to the financial statements are an integral part of,
and should be read in conjunction with, the financial statements. |
Statements of Changes in Net Assets
for the six months ended June 30, 2019 (Unaudited) and the year ended December 31, 2018
| | | | | | | | |
| | | 2019 | | | 2018 | |
| Increase (Decrease) in Net Assets | |
Operations: | | | | | | | | |
Net investment income (loss) | | $ | 4,931,173 | | | $ | 9,264,216 | |
Net realized gain (loss) on investments | | | 15,588,229 | | | | 48,167,494 | |
Net change in unrealized appreciation (depreciation) on investments | | | 107,795,436 | | | | (171,183,352 | ) |
| | | | |
Net increase (decrease) in net assets resulting from operations | | | 128,314,838 | | | | (113,751,642 | ) |
| | | | |
Distributions to shareholders: | | | | | | | | |
Initial Class | | | — | | | | (66,126,079 | ) |
Service Class | | | — | | | | (59,668,222 | ) |
| | | | |
Total distributions to shareholders | | | — | | | | (125,794,301 | ) |
| | | | |
Capital share transactions: | | | | | | | | |
Net proceeds from sale of shares | | | 48,261,634 | | | | 120,202,744 | |
Net asset value of shares issued to shareholders in reinvestment of dividends and distributions | | | — | | | | 125,794,301 | |
Cost of shares redeemed | | | (127,572,275 | ) | | | (137,924,416 | ) |
| | | | |
Increase (decrease) in net assets derived from capital share transactions | | | (79,310,641 | ) | | | 108,072,629 | |
| | | | |
Net increase (decrease) in net assets | | | 49,004,197 | | | | (131,473,314 | ) |
|
| Net Assets | |
Beginning of period | | | 849,142,766 | | | | 980,616,080 | |
| | | | |
End of period | | $ | 898,146,963 | | | $ | 849,142,766 | |
| | | | |
| | | | | | |
The notes to the financial statements are an integral part of,
and should be read in conjunction with, the financial statements. | | | | | 17 | |
Financial Highlightsselected per share data and ratios
| | | | | | | | | | | | | | | | | | | | | | | | | | | | | | | | | | | |
| | | |
| | | Six months
ended
June 30, | | | | Year ended December 31, |
| | | | | | | |
| Initial Class | | 2019* | | | | 2018 | | 2017 | | 2016 | | 2015 | | 2014 |
| | | | | | | |
Net asset value at beginning of period | | | $ | 11.94 | | | | | | | | | $ | 15.57 | | | | $ | 13.37 | | | | $ | 13.00 | | | | $ | 15.83 | | | | $ | 16.18 | |
| | | | | | | | | | | | | | | | | | | | | | | | | | | | | | | | | | | |
| | | | | | | |
Net investment income (loss) (a) | | | | 0.08 | | | | | | | | | | 0.16 | | | | | 0.12 | | | | | 0.13 | | | | | 0.13 | | | | | 0.10 | |
| | | | | | | |
Net realized and unrealized gain (loss) on investments | | | | 1.77 | | | | | | | | | | (1.68 | ) | | | | 2.42 | | | | | 1.28 | | | | | (0.73 | ) | | | | 2.07 | |
| | | | | | | | | | | | | | | | | | | | | | | | | | | | | | | | | | | |
| | | | | | | |
Total from investment operations | | | | 1.85 | | | | | | | | | | (1.52 | ) | | | | 2.54 | | | | | 1.41 | | | | | (0.60 | ) | | | | 2.17 | |
| | | | | | | | | | | | | | | | | | | | | | | | | | | | | | | | | | | |
| | | | | | | |
| Less dividends and distributions: | | | | | | | | | | | | | | | | | | | | | | | | | | | | | | | | | | | |
| | | | | | | |
From net investment income | | | | — | | | | | | | | | | (0.15 | ) | | | | (0.16 | ) | | | | (0.11 | ) | | | | (0.09 | ) | | | | (0.09 | ) |
| | | | | | | |
From net realized gain on investments | | | | — | | | | | | | | | | (1.96 | ) | | | | (0.18 | ) | | | | (0.93 | ) | | | | (2.14 | ) | | | | (2.43 | ) |
| | | | | | | | | | | | | | | | | | | | | | | | | | | | | | | | | | | |
| | | | | | | |
Total dividends and distributions | | | | — | | | | | | | | | | (2.11 | ) | | | | (0.34 | ) | | | | (1.04 | ) | | | | (2.23 | ) | | | | (2.52 | ) |
| | | | | | | | | | | | | | | | | | | | | | | | | | | | | | | | | | | |
| | | | | | | |
Net asset value at end of period | | | $ | 13.79 | | | | | | | | | $ | 11.94 | | | | $ | 15.57 | | | | $ | 13.37 | | | | $ | 13.00 | | | | $ | 15.83 | |
| | | | | | | | | | | | | | | | | | | | | | | | | | | | | | | | | | | |
| | | | | | | |
Total investment return (b) | | | | 15.49 | %(c) | | | | | | | | | (11.98 | %) | | | | 19.14 | % | | | | 11.17 | % | | | | (3.68 | %) | | | | 14.38 | % |
| | | | | | | |
| Ratios (to average net assets)/Supplemental Data: | | | | | | | | | | | | | | | | | | | | | | | | | | | | | | | | | | | |
| | | | | | | |
Net investment income (loss) | | | | 1.23 | %†† | | | | | | | | | 1.08 | % | | | | 0.87 | % | | | | 1.09 | % | | | | 0.88 | % | | | | 0.62 | % |
| | | | | | | |
Net expenses (d) | | | | 0.86 | %†† | | | | | | | | | 0.86 | % | | | | 0.86 | % | | | | 0.86 | % | | | | 0.86 | % | | | | 0.85 | % |
| | | | | | | |
Expenses (before waiver/reimbursement) (d) | | | | 0.88 | %†† | | | | | | | | | 0.88 | % | | | | 0.88 | % | | | | 0.89 | % | | | | 0.88 | % | | | | 0.88 | % |
| | | | | | | |
Portfolio turnover rate | | | | 67 | % | | | | | | | | | 181 | % | | | | 155 | % | | | | 164 | % | | | | 174 | % | | | | 172 | % |
| | | | | | | |
Net assets at end of period (in 000’s) | | | $ | 425,344 | | | | | | | | | $ | 453,343 | | | | $ | 503,364 | | | | $ | 558,783 | | | | $ | 506,368 | | | | $ | 440,409 | |
| (a) | Per share data based on average shares outstanding during the period. |
| (b) | Total return does not reflect any deduction of sales charges, mortality and expense charges, contract charges or administrative charges. For periods of less than one year, total return is not annualized. |
| (c) | Total investment return may reflect adjustments to conform to generally accepted accounting principles. |
| (d) | In addition to the fees and expenses which the Portfolio bears directly, it also indirectly bears a pro-rata share of the fees and expenses of the underlying funds in which it invests. Such indirect expenses are not included in the above expense ratios. |
| | | | | | | | | | | | | | | | | | | | | | | | | | | | | | | | | | | |
| | | |
| | | Six months
ended
June 30, | | | | Year ended December 31, |
| | | | | | | |
| Service Class | | 2019* | | | | 2018 | | 2017 | | 2016 | | 2015 | | 2014 |
| | | | | | | |
Net asset value at beginning of period | | | $ | 11.74 | | | | | | | | | $ | 15.35 | | | | $ | 13.18 | | | | $ | 12.83 | | | | $ | 15.64 | | | | $ | 16.03 | |
| | | | | | | | | | | | | | | | | | | | | | | | | | | | | | | | | | | |
| | | | | | | |
Net investment income (loss) (a) | | | | 0.06 | | | | | | | | | | 0.12 | | | | | 0.09 | | | | | 0.12 | | | | | 0.09 | | | | | 0.06 | |
| | | | | | | |
Net realized and unrealized gain (loss) on investments | | | | 1.74 | | | | | | | | | | (1.66 | ) | | | | 2.38 | | | | | 1.24 | | | | | (0.71 | ) | | | | 2.03 | |
| | | | | | | | | | | | | | | | | | | | | | | | | | | | | | | | | | | |
| | | | | | | |
Total from investment operations | | | | 1.80 | | | | | | | | | | (1.54 | ) | | | | 2.47 | | | | | 1.36 | | | | | (0.62 | ) | | | | 2.09 | |
| | | | | | | | | | | | | | | | | | | | | | | | | | | | | | | | | | | |
| | | | | | | |
| Less dividends and distributions: | | | | | | | | | | | | | | | | | | | | | | | | | | | | | | | | | | | |
| | | | | | | |
From net investment income | | | | — | | | | | | | | | | (0.11 | ) | | | | (0.12 | ) | | | | (0.08 | ) | | | | (0.05 | ) | | | | (0.05 | ) |
| | | | | | | |
From net realized gain on investments | | | | — | | | | | | | | | | (1.96 | ) | | | | (0.18 | ) | | | | (0.93 | ) | | | | (2.14 | ) | | | | (2.43 | ) |
| | | | | | | | | | | | | | | | | | | | | | | | | | | | | | | | | | | |
| | | | | | | |
Total dividends and distributions | | | | — | | | | | | | | | | (2.07 | ) | | | | (0.30 | ) | | | | (1.01 | ) | | | | (2.19 | ) | | | | (2.48 | ) |
| | | | | | | | | | | | | | | | | | | | | | | | | | | | | | | | | | | |
| | | | | | | |
Net asset value at end of period | | | $ | 13.54 | | | | | | | | | $ | 11.74 | | | | $ | 15.35 | | | | $ | 13.18 | | | | $ | 12.83 | | | | $ | 15.64 | |
| | | | | | | | | | | | | | | | | | | | | | | | | | | | | | | | | | | |
| | | | | | | |
Total investment return (b) | | | | 15.33 | %(c) | | | | | | | | | (12.20 | %) | | | | 18.85 | % | | | | 10.89 | % | | | | (3.92 | %) | | | | 14.10 | % |
| | | | | | | |
| Ratios (to average net assets)/Supplemental Data: | | | | | | | | | | | | | | | | | | | | | | | | | | | | | | | | | | | |
| | | | | | | |
Net investment income (loss) | | | | 0.99 | %†† | | | | | | | | | 0.83 | % | | | | 0.64 | % | | | | 0.83 | % | | | | 0.61 | % | | | | 0.37 | % |
| | | | | | | |
Net expenses (d) | | | | 1.11 | %†† | | | | | | | | | 1.11 | % | | | | 1.11 | % | | | | 1.11 | % | | | | 1.11 | % | | | | 1.10 | % |
| | | | | | | |
Expenses (before waiver/reimbursement) (d) | | | | 1.13 | %†† | | | | | | | | | 1.13 | % | | | | 1.13 | % | | | | 1.14 | % | | | | 1.13 | % | | | | 1.13 | % |
| | | | | | | |
Portfolio turnover rate | | | | 67 | % | | | | | | | | | 181 | % | | | | 155 | % | | | | 164 | % | | | | 174 | % | | | | 172 | % |
| | | | | | | |
Net assets at end of period (in 000’s) | | | $ | 472,803 | | | | | | | | | $ | 395,800 | | | | $ | 477,253 | | | | $ | 435,287 | | | | $ | 426,143 | | | | $ | 479,799 | |
| (a) | Per share data based on average shares outstanding during the period. |
| (b) | Total return does not reflect any deduction of sales charges, mortality and expense charges, contract charges or administrative charges. For periods of less than one year, total return is not annualized. |
| (c) | Total investment return may reflect adjustments to conform to generally accepted accounting principles. |
| (d) | In addition to the fees and expenses which the Portfolio bears directly, it also indirectly bears a pro-rata share of the fees and expenses of the underlying funds in which it invests. Such indirect expenses are not included in the above expense ratios. |
| | | | |
| 18 | | MainStay VP MacKay Mid Cap Core Portfolio | | The notes to the financial statements are an integral part of,
and should be read in conjunction with, the financial statements. |
Notes to Financial Statements(Unaudited)
Note 1–Organization and Business
MainStay VP Funds Trust (the “Fund”) was organized as a Delaware statutory trust on February 1, 2011. The Fund is registered under the Investment Company Act of 1940, as amended (the “1940 Act”), as an open-end management investment company. The Fund is comprised of thirty-one separate series (collectively referred to as the “Portfolios”). These financial statements and notes relate to the MainStay VP MacKay Mid Cap Core Portfolio (the “Portfolio”), a “diversified” portfolio, as that term is defined in the 1940 Act, as interpreted or modified by regulatory authorities having jurisdiction, from time to time.
Shares of the Portfolio are currently offered to certain separate accounts to fund variable annuity policies and variable universal life insurance policies issued by New York Life Insurance and Annuity Corporation (“NYLIAC”), awholly-owned subsidiary of New York Life Insurance Company (“New York Life”) and may also be offered to fund variable annuity policies and variable universal life insurance policies issued by other insurance companies. NYLIAC allocates shares of the Portfolios to, among others, certain NYLIAC separate accounts. Shares of the Portfolio are also offered to the MainStay VP Conservative Allocation Portfolio, MainStay VP Moderate Allocation Portfolio, MainStay VP Moderate Growth Allocation Portfolio and MainStay VP Growth Allocation Portfolio, which operate as “funds-of-funds.”
The Portfolio currently offers two classes of shares. Initial Class shares commenced operations on July 2, 2001. Service Class shares commenced operations on June 5, 2003. Shares of the Portfolio are offered and are redeemed at a price equal to their respective net asset value (“NAV”) per share. No sales or redemption charge is applicable to the purchase or redemption of the Portfolio’s shares. Under the terms of the Fund’s multiple class plan adopted pursuant to Rule 18f-3 under the 1940 Act, the classes differ in that, among other things, Service Class shares of the Portfolio pay a combined distribution and service fee of 0.25% of average daily net assets attributable to Service Class shares of the Portfolio to the Distributor (as defined in Note 3(B)) pursuant to a plan adopted in accordance with Rule 12b-1 under the 1940 Act. Contract owners of variable annuity contracts purchased after June 2, 2003, are permitted to invest only in the Service Class shares.
The Portfolio’s investment objective is to seeklong-term growth of capital.
Note 2–Significant Accounting Policies
The Portfolio is an investment company and accordingly follows the investment company accounting and reporting guidance of the Financial Accounting Standards Board (“FASB”) Accounting Standard CodificationTopic 946 Financial Services—Investment Companies. The Portfolio prepares its financial statements in accordance with generally accepted accounting principles (“GAAP”) in the United States of America and follows the significant accounting policies described below.
(A) Securities Valuation. Investments are usually valued as of the close of regular trading on the New York Stock Exchange (the “Exchange”) (usually 4:00 p.m. Eastern time) on each day the Portfolio is open for business (“valuation date”).
The Board of Trustees of the Fund (the “Board”) adopted procedures establishing methodologies for the valuation of the Portfolio’s securities
and other assets and delegated the responsibility for valuation determinations under those procedures to the Valuation Committee of the Fund (the “Valuation Committee”). The Board authorized the Valuation Committee to appoint a Valuation Subcommittee (the “Subcommittee”) to deal in the first instance with establishing the prices of securities for which market quotations are not readily available or the prices of which are not otherwise readily determinable under these procedures. The Subcommittee meets (in person, via electronic mail or via teleconference) on an as-needed basis. Subsequently, the Valuation Committee meets to ensure that actions taken by the Subcommittee were appropriate. The procedures state that, subject to the oversight of the Board and unless otherwise noted, the responsibility for theday-to-day valuation of portfolio assets (including fair value measurements for the Portfolio’s assets and liabilities) rests with New York Life Investment Management LLC (“New York Life Investments” or the “Manager”), aided to whatever extent necessary by the Subadvisor (as defined in Note 3(A)).
To assess the appropriateness of security valuations, the Manager, the Subadvisor or the Portfolio’s third-party service provider, who is subject to oversight by the Manager, regularly compares prior day prices, prices on comparable securities and the sale prices to the prior and current day prices and challenges prices with changes exceeding certain tolerance levels with third-party pricing services or broker sources. For those securities valued through either a standardized fair valuation methodology or a fair valuation measurement, the Subcommittee deals in the first instance with such valuation and the Valuation Committee reviews and affirms, if appropriate, the reasonableness of the valuation based on such methodologies and measurements on a regular basis after considering information that is reasonably available and deemed relevant by the Valuation Committee. Any action taken by the Subcommittee with respect to the valuation of a portfolio security or other asset is submitted for review and ratification (if appropriate) to the Valuation Committee and the Board at the next regularly scheduled meeting.
“Fair value” is defined as the price the Portfolio would reasonably expect to receive upon selling an asset or liability in an orderly transaction to an independent buyer in the principal or most advantageous market for the asset or liability. Fair value measurements are determined within a framework that establishes a three-tier hierarchy which maximizes the use of observable market data and minimizes the use of unobservable inputs to establish a classification of fair value measurements for disclosure purposes. “Inputs” refer broadly to the assumptions that market participants would use in pricing the asset or liability, including assumptions about risk, such as the risk inherent in a particular valuation technique used to measure fair value using a pricing model and/or the risk inherent in the inputs for the valuation technique. Inputs may be observable or unobservable. Observable inputs reflect the assumptions market participants would use in pricing the asset or liability based on market data obtained from sources independent of the Portfolio. Unobservable inputs reflect the Portfolio’s own assumptions about the assumptions market participants would use in pricing the asset or liability based on the information available. The inputs or methodology used for valuing assets or liabilities may not be an indication of the risks
Notes to Financial Statements(Unaudited) (continued)
associated with investing in those assets or liabilities. The three-tier hierarchy of inputs is summarized below.
| • | | Level 1—quoted prices in active markets for an identical asset or liability |
| • | | Level 2—other significant observable inputs (including quoted prices for a similar asset or liability in active markets, interest rates and yield curves, prepayment speeds, credit risk, etc.) |
| • | | Level 3—significant unobservable inputs (including the Portfolio’s own assumptions about the assumptions that market participants would use in measuring fair value of an asset or liability) |
The level of an asset or liability within the fair value hierarchy is based on the lowest level of an input, both individually and in the aggregate, that is significant to the fair value measurement. As of June 30, 2019, the aggregate value by input level of the Portfolio’s assets and liabilities is included at the end of the Portfolio’s Portfolio of Investments.
The Portfolio may use third-party vendor evaluations, whose prices may be derived from one or more of the following standard inputs, among others:
| | |
• Broker/dealer quotes | | • Benchmark securities |
• Two-sided markets | | • Reference data (corporate actions or material event notices) |
• Bids/offers | | • Monthly payment information |
• Industry and economic events | | • Reported trades |
An asset or liability for which market values cannot be measured using the methodologies described above is valued by methods deemed reasonable in good faith by the Valuation Committee, following the procedures established by the Board, to represent fair value. Under these procedures, the Portfolio generally uses a market-based approach which may use related or comparable assets or liabilities, recent transactions, market multiples, book values and other relevant information. The Portfolio may also use an income-based valuation approach in which the anticipated future cash flows of the asset or liability are discounted to calculate fair value. Discounts may also be applied due to the nature and/or duration of any restrictions on the disposition of the asset or liability. Fair value represents a good faith approximation of the value of a security. Fair value determinations involve the consideration of a number of subjective factors, an analysis of applicable facts and circumstances and the exercise of judgment. As a result, it is possible that the fair value for a security determined in good faith in accordance with the Portfolio’s valuation procedures may differ from valuations for the same security determined by other funds using their own valuation procedures. Although the Portfolio’s valuation procedures are designed to value a security at the price the Portfolio may reasonably expect to receive upon the security’s sale in an orderly transaction, there can be no assurance that any fair value determination thereunder would, in fact, approximate the amount that the Portfolio would actually realize upon the sale of the security or the price at which the security would trade if a reliable market price were readily available. During the six-month period ended June 30, 2019, there were no material changes to the fair value methodologies.
Securities which may be valued in this manner include, but are not limited to: (i) a security for which trading has been halted or suspended;
(ii) a debt security that has recently gone into default and for which there is not a current market quotation; (iii) a security of an issuer that has entered into a restructuring; (iv) a security that has been delisted from a national exchange; (v) a security for which the market price is not readily available from a third-party pricing source or, if so provided, does not, in the opinion of the Manager or the Subadvisor, reflect the security’s market value; (vi) a security subject to trading collars for which no or limited trading takes place; and (vii) a security whose principal market has been temporarily closed at a time when, under normal conditions, it would be open. Securities valued in this manner are generally categorized as Level 3 in the hierarchy. As of June 30, 2019, there were no securities held by the Portfolio that were fair valued in such a manner.
Equity securities, including exchange-traded funds (“ETFs”), are valued at the last quoted sales prices as of the close of regular trading on the relevant exchange on each valuation date. Securities that are not traded on the valuation date are valued at the mean of the last quoted bid and ask prices. Prices are normally taken from the principal market in which each security trades. These securities are generally categorized as Level 1 in the hierarchy.
Investments in mutual funds, including money market funds, are valued at their respective NAVs as of the close of the Exchange on the valuation date. These securities are generally categorized as Level 1 in the hierarchy.
The information above is not intended to reflect an exhaustive list of the methodologies that may be used to value portfolio investments. The valuation procedures permit the use of a variety of valuation methodologies in connection with valuing portfolio investments. The methodology used for a specific type of investment may vary based on the market data available or other considerations. The methodologies summarized above may not represent the specific means by which portfolio investments are valued on any particular business day.
(B) Income Taxes. The Portfolio’s policy is to comply with the requirements of the Internal Revenue Code of 1986, as amended (the “Internal Revenue Code”), applicable to regulated investment companies and to distribute all of its taxable income to the shareholders of the Portfolio within the allowable time limits. Therefore, no federal, state and local income tax provisions are required.
Management evaluates the Portfolio’s tax positions to determine if the tax positions taken meet the minimum recognition threshold in connection with accounting for uncertainties in income tax positions taken or expected to be taken for the purposes of measuring and recognizing tax liabilities in the financial statements. Recognition of tax benefits of an uncertain tax position is permitted only to the extent the position is “more likely than not” to be sustained assuming examination by taxing authorities. Management has analyzed the Portfolio’s tax positions taken on federal, state and local income tax returns for all open tax years (for up to three tax years) and has concluded that no provisions for federal, state and local income tax are required in the Portfolio’s financial statements. The Portfolio’s federal, state and local income tax and federal excise tax returns for tax years for which the applicable statutes of limitations have not expired are subject to examination by the Internal Revenue Service and state and local departments of revenue.
| | |
| 20 | | MainStay VP MacKay Mid Cap Core Portfolio |
(C) Dividends and Distributions to Shareholders. Dividends and distributions are recorded on the ex-dividend date. The Portfolio intends to declare and pay dividends from net investment income and distributions from net realized capital and currency gains, if any, at least annually. Unless the shareholder elects otherwise, all dividends and distributions are reinvested in the same class of shares of the Portfolio, at NAV. Dividends and distributions to shareholders are determined in accordance with federal income tax regulations and may differ from determinations using GAAP.
(D) Security Transactions and Investment Income. The Portfolio records security transactions on the trade date. Realized gains and losses on security transactions are determined using the identified cost method. Dividend income is recognized on the ex-dividend date; net of any foreign tax withheld at the source, and interest income is accrued as earned using the effective interest rate method.
Investment income and realized and unrealized gains and losses on investments of the Portfolio are allocated pro rata to the separate classes of shares based upon their relative net assets on the date the income is earned or realized and unrealized gains and losses are incurred.
(E) Expenses. Expenses of the Fund are allocated to the individual Portfolios in proportion to the net assets of the respective Portfolios when the expenses are incurred, except where direct allocations of expenses can be made. Expenses (other than fees incurred under the distribution and service plans, further discussed in Note 3(B), which are charged directly to the Service Class shares) are allocated to separate classes of shares pro rata based upon their relative net assets on the date the expenses are incurred. The expenses borne by the Portfolio, including those of related parties to the Portfolio, are shown in the Statement of Operations.
Additionally, the Portfolio may invest in ETFs and mutual funds, which are subject to management fees and other fees that may cause the costs of investing in ETFs and mutual funds to be greater than the costs of owning the underlying securities directly. These indirect expenses of ETFs and mutual funds are not included in the amounts shown as expenses in the Portfolio’s Statement of Operations or in the expense ratios included in the Financial Highlights.
(F) Use of Estimates. In preparing financial statements in conformity with GAAP, management makes estimates and assumptions that affect the reported amounts and disclosures in the financial statements. Actual results could differ from those estimates.
(G) Rights and Warrants. Rights are certificates that permit the holder to purchase a certain number of shares, or a fractional share, of a new stock from the issuer at a specific price. Warrants are instruments that entitle the holder to buy an equity security at a specific price for a specific period of time. These investments can provide a greater potential for profit or loss than an equivalent investment in the underlying security. Prices of these investments do not necessarily move in tandem with the prices of the underlying securities.
There is risk involved in the purchase of rights and warrants in that these investments are speculative investments. The Portfolio could also lose the entire value of its investment in warrants if such warrants are not exercised by the date of its expiration. The Portfolio is exposed to
risk until the sale or exercise of each right or warrant is completed. As of June 30, 2019, the Portfolio did not hold any rights or warrants.
(H) Securities Lending. In order to realize additional income, the Portfolio may engage in securities lending, subject to the limitations set forth in the 1940 Act and relevant guidance by the staff of the Securities and Exchange Commission (“SEC”). In the event the Portfolio does engage in securities lending, the Portfolio will lend through its custodian, State Street Bank and Trust Company (“State Street”), acting as securities lending agent on behalf of the Portfolio. State Street will manage the Portfolio’s collateral in accordance with the securities lending agency agreement between the Portfolio and State Street, and indemnify the Portfolio against counterparty risk. The loans will be collateralized by cash (which may be invested in a money market fund) and/ornon-cash collateral (which may include, U.S. Treasury securities and/or U.S. Government Agency securities issued or guaranteed by the United States government or its agencies or instrumentalities) at least equal at all times to the market value of the securities loaned. The Portfolio may bear the risk of delay in recovery of, or loss of rights in, the securities loaned should the borrower of the securities experience financial difficulty. The Portfolio may also record a realized gain or loss on securities deemed sold due to a borrower’s inability to return securities on loan. The Portfolio bears the risk of any loss on investment of cash collateral. The Portfolio will receive compensation for lending its securities in the form of fees or it will retain a portion of interest on the investment of any cash collateral. The Portfolio will also continue to receive interest and dividends on the securities loaned and any gain or loss in the market price of the securities loaned that may occur during the term of the loan will be for the account of the Portfolio. Income earned from securities lending activities, if any, is reflected in the Statement of Operations. As of June 30, 2019, the Portfolio had securities on loan with an aggregate market value of $10,634,343; the total market value of collateral held by the Portfolio was $10,941,621. The market value of the collateral held includednon-cash collateral in the form of U.S. Treasury securities with a value of $6,351,543 and cash collateral which was invested into the State Street Navigator Securities Lending Government Money Market Portfolio with a value of $4,590,078.
(I) Indemnifications. Under the Fund’s organizational documents, its officers and trustees are indemnified against certain liabilities that may arise out of performance of their duties to the Fund. Additionally, in the normal course of business, the Portfolio enters into contracts with third-party service providers that contain a variety of representations and warranties and which may provide general indemnifications. The Portfolio’s maximum exposure under these arrangements is unknown, as this would involve future claims that may be made against the Portfolio that have not yet occurred. Based on experience, management is of the view that the risk of loss in connection with these potential indemnification obligations is remote. However, there can be no assurance that material liabilities related to such obligations will not arise in the future, which could adversely impact the Portfolio.
Note 3–Fees and Related Party Transactions
(A) Manager and Subadvisor. New York Life Investments, a registered investment adviser and an indirect,wholly-owned subsidiary of New York Life, serves as the Portfolio’s Manager, pursuant to an Amended and Restated Management Agreement (“Management
Notes to Financial Statements(Unaudited) (continued)
Agreement”). The Manager provides offices, conducts clerical, recordkeeping and bookkeeping services, and keeps most of the financial and accounting records required to be maintained by the Portfolio. Except for the portion of salaries and expenses that are the responsibility of the Portfolio, the Manager pays the salaries and expenses of all personnel affiliated with the Portfolio and certain operational expenses of the Portfolio. The Portfolio reimburses New York Life Investments in an amount equal to a portion of the compensation of the Chief Compliance Officer attributable to the Portfolio. MacKay Shields LLC (“MacKay Shields” or the “Subadvisor”), a registered investment adviser and an indirect,wholly-owned subsidiary of New York Life, serves as Subadvisor to the Portfolio and is responsible for theday-to-day portfolio management of the Portfolio. Pursuant to the terms of an Amended and Restated Subadvisory Agreement (“Subadvisory Agreement”) between New York Life Investments and MacKay Shields, New York Life Investments pays for the services of the Subadvisor.
The Fund, on behalf of the Portfolio, pays New York Life Investments in its capacity as the Portfolio’s investment manager and administrator, pursuant to the Management Agreement, a monthly fee for the services performed and the facilities furnished at an annual percentage of the Portfolio’s average daily net assets as follows: 0.85% up to $1 billion; 0.80% from $1 billion to $2 billion; and 0.775% in excess of $2 billion. During the six-month period ended June 30, 2019, the effective management fee rate was 0.85% (exclusive of any applicable waivers/reimbursements).
New York Life Investments has contractually agreed to waive fees and/or reimburse expenses so that the total annual operating expenses (excluding taxes, interest, litigation, extraordinary expenses, brokerage and other transaction expenses relating to the purchase or sale of portfolio investments, and acquired (underlying) portfolio/fund fees and expenses) do not exceed 0.86% for the Initial Class shares and 1.11% for Service Class shares. This agreement will remain in effect until May 1, 2020 and shall renew automatically for one year terms unless
New York Life Investments provides written notice of termination prior to the start of the next term or upon approval of the Board.
During the six-month period ended June 30, 2019, New York Life Investments earned fees from the Portfolio in the amount of $3,776,293 and waived fees/reimbursed expenses in the amount of $90,615, and paid the Subadvisor in the amount of $1,842,839.
State Street providessub-administration andsub-accounting services to the Portfolio pursuant to an agreement with New York Life Investments. These services include calculating the daily NAVs of the Portfolio, maintaining the general ledger andsub-ledger accounts for the calculation of the Portfolio’s NAVs and assisting New York Life Investments in conducting various aspects of the Portfolio’s administrative operations. For providing these services to the Portfolio, State Street is compensated by New York Life Investments.
Pursuant to an agreement between the Fund and New York Life Investments, New York Life Investments is responsible for providing or procuring certain regulatory reporting services for the Portfolio. The Portfolio will reimburse New York Life Investments for the actual costs incurred by New York Life Investments in connection with providing or procuring these services for the Portfolio.
(B) Distribution and Service Fees. The Fund, on behalf of the Portfolio, has entered into a distribution agreement with NYLIFE Distributors LLC (the “Distributor”), an indirect,wholly-owned subsidiary of New York Life. The Portfolio has adopted a distribution plan (the “Plan”) in accordance with the provisions of Rule 12b-1 under the 1940 Act. Under the Plan, the Distributor has agreed to provide, through its affiliates or independent third parties, various distribution-related, shareholder and administrative support services to the Service Class shareholders. For its services, the Distributor is entitled to a combined distribution and service fee accrued daily and paid monthly at an annual rate of 0.25% of the average daily net assets attributable to the Service Class shares of the Portfolio.
(C) Investments in Affiliates (in 000’s). During the six-month period ended June 30, 2019, purchases and sales transactions, income earned from investments and shares held of investment companies managed by New York Life Investments or its affiliates were as follows:
| | | | | | | | | | | | | | | | | | | | | | | | | | | | | | | | | | | | |
Affiliated Investment Company | | Value,
Beginning of
Period | | | Purchases
at Cost | | | Proceeds
from Sales | | | Net
Realized
Gain/
(Loss)
on Sales | | | Change in
Unrealized
Appreciation/
(Depreciation) | | | Value, End
of Period | | | Dividend
Income | | | Other
Distributions | | | Shares End
of Period | |
MainStay U.S. Government Liquidity Fund | | $ | 2,713 | | | $ | 23,974 | | | $ | (24,647 | ) | | $ | — | | | $ | — | | | $ | 2,040 | | | $ | 10 | | | $ | — | | | | 2,040 | |
Note 4–Federal Income Tax
As of June 30, 2019, the cost and unrealized appreciation (depreciation) of the Portfolio’s investment portfolio, including applicable derivative contracts and other financial instruments, as determined on a federal income tax basis, were as follows:
| | | | | | | | | | | | | | | | |
| | | Federal
Tax
Cost | | | Gross
Unrealized
Appreciation | | | Gross
Unrealized
(Depreciation) | | | Net
Unrealized
Appreciation/
(Depreciation) | |
| | | | |
Investments in
Securities | | $ | 816,962,964 | | | $ | 117,888,932 | | | $ | (31,789,238 | ) | | $ | 86,099,694 | |
During the year ended December 31, 2018, the tax character of distributions paid as reflected in the Statements of Changes in Net Assets was as follows:
| | |
|
| 2018 |
Tax-Based
Distributions
from Ordinary
Income | | Tax-Based
Distributions
from Long-Term
Gains |
| |
| $45,839,145 | | $79,955,156 |
| | |
| 22 | | MainStay VP MacKay Mid Cap Core Portfolio |
Note 5–Custodian
State Street is the custodian of cash and securities held by the Portfolio. Custodial fees are charged to the Portfolio based on the Portfolio’s net assets and/or the market value of securities held by the Portfolio and the number of certain transactions incurred by the Portfolio.
Note 6–Line of Credit
The Portfolio and certain other funds managed by New York Life Investments maintain a line of credit with a syndicate of banks in order to secure a source of funds for temporary purposes to meet unanticipated or excessive redemption requests.
Effective July 30, 2019, under the credit agreement (the “Credit Agreement”), the aggregate commitment amount is $600,000,000 with an additional uncommitted amount of $100,000,000. The commitment fee is an annual rate of 0.15% of the average commitment amount payable quarterly, regardless of usage, to State Street, who serves as the agent to the syndicate. The commitment fee is allocated among the Portfolio and certain other funds managed by New York Life Investments based upon their respective net assets and other factors. Interest on any revolving credit loan is charged based upon the Federal Funds Rate or the one-month London Interbank Offered Rate (“LIBOR”), whichever is higher. The Credit Agreement expires on July 28, 2020, although the Portfolio, certain other funds managed by New York Life Investments and the syndicate of banks may renew the Credit Agreement for an additional year on the same or different terms. Prior to July 30, 2019, the aggregate commitment amount and the commitment fee were the same as those under the current Credit Agreement. During the six-month period ended June 30, 2019, there were no borrowings made or outstanding with respect to the Portfolio under the Credit Agreement.
Note 7–Interfund Lending Program
Pursuant to an exemptive order issued by the SEC, the Portfolio, along with certain other funds managed by New York Life Investments, may participate in an interfund lending program. The interfund lending program provides an alternative credit facility that permits the Portfolio and certain other funds managed by New York Life Investments to lend or borrow money for temporary purposes directly to or from one another subject to the conditions of the exemptive order. During the six-month period ended June 30, 2019, there were no interfund loans made or outstanding with respect to the Portfolio.
Note 8–Purchases and Sales of Securities (in 000’s)
During the six-month period ended June 30, 2019, purchases and sales of securities, other thanshort-term securities, were $599,535 and $673,371, respectively.
Note 9–Capital Share Transactions
Transactions in capital shares for the six-month period ended June 30, 2019 and the year ended December 31, 2018, were as follows:
| | | | | | | | |
Initial Class | | Shares | | | Amount | |
| | |
Six-month period ended June 30, 2019: | | | | | | | | |
Shares sold | | | 341,423 | | | $ | 4,611,111 | |
Shares redeemed | | | (7,452,918 | ) | | | (99,617,584 | ) |
| | | | |
Net increase (decrease) | | | (7,111,495 | ) | | $ | (95,006,473 | ) |
| | | | |
Year ended December 31, 2018: | | | | | | | | |
Shares sold | | | 4,580,915 | | | $ | 65,688,231 | |
Shares issued to shareholders in reinvestment of dividends and distributions | | | 4,635,445 | | | | 66,126,079 | |
Shares redeemed | | | (3,575,706 | ) | | | (55,816,319 | ) |
| | | | |
Net increase (decrease) | | | 5,640,654 | | | $ | 75,997,991 | |
| | | | |
| | |
| | | | | | | | |
Service Class | | Shares | | | Amount | |
| | |
Six-month period ended June 30, 2019: | | | | | | | | |
Shares sold | | | 3,311,865 | | | $ | 43,650,523 | |
Shares redeemed | | | (2,099,731 | ) | | | (27,954,691 | ) |
| | | | |
Net increase (decrease) | | | 1,212,134 | | | $ | 15,695,832 | |
| | | | |
Year ended December 31, 2018: | | | | | | | | |
Shares sold | | | 3,770,863 | | | $ | 54,514,513 | |
Shares issued to shareholders in reinvestment of dividends and distributions | | | 4,251,410 | | | | 59,668,222 | |
Shares redeemed | | | (5,413,515 | ) | | | (82,108,097 | ) |
| | | | |
Net increase (decrease) | | | 2,608,758 | | | $ | 32,074,638 | |
| | | | |
Note 10–Litigation
The Portfolio has been named as a defendant in the case entitledKirschner v. FitzSimons, No.12-2652 (S.D.N.Y.) (the “FitzSimonsaction”) as a result of its ownership of shares in the Tribune Company (“Tribune”) in 2007 when Tribune effected a leveraged buyout transaction (“LBO”) by which Tribune converted to a privately-held company. In its complaint, the plaintiff asserts claims against certain insiders, major shareholders, professional advisers, and others involved in the LBO. Separately, the complaint also seeks to obtain from former Tribune shareholders, including the Portfolio, any proceeds they received in connection with the LBO. The sole claim and cause of action brought against the Portfolio is for fraudulent conveyance pursuant to United States Bankruptcy Code Section 548(a)(1)(A).
In June 2011, certain Tribune creditors filed numerous additional actions asserting state law constructive fraudulent conveyance claims (the “SLCFC actions”) against specifically-named former Tribune shareholders and, in some cases, putative defendant classes comprised of former Tribune shareholders. One of the SLCFC actions, entitledDeutsche Bank Trust Co. Americas v. Blackrock Institutional Trust Co., No.11-9319 (S.D.N.Y.) (the “Deutsche Bank action”), named the Portfolio as a defendant.
TheFitzSimonsaction andDeutsche Bankaction have been consolidated with the majority of the other Tribune LBO related lawsuits in a multidistrict litigation proceeding entitledIn re Tribune Co. Fraudulent Conveyance Litig., No. 11-md-2296 (S.D.N.Y.) (the “MDL Proceeding”).
Notes to Financial Statements(Unaudited) (continued)
On September 23, 2013, the District Court granted the defendants’ motion to dismiss the SLCFC actions, including theDeutsche Bankaction, on the basis that the plaintiffs did not have standing to pursue their claims. On September 30, 2013, the plaintiffs in the SLCFC actions filed a notice of appeal to the United States Court of Appeals for the Second Circuit. On October 28, 2013, the defendants filed a joint notice of cross-appeal of that same order. On March 29, 2016, the United States Court of Appeals for the Second Circuit issued its opinion on the appeal of the SLCFC actions. The appeals court affirmed the district court’s dismissal of those lawsuits, but on different grounds than the district court. The appeals court held that while the plaintiffs have standing under the U.S. Bankruptcy Code, their claims were preempted by Section 546(e) of the Bankruptcy Code-the statutory safe harbor for settlement payments. On April 12, 2016 the Plaintiffs in the SLCFC actions filed a petition seeking rehearing en banc before the appeals court. On July 22, 2016, the appeals court denied the petition. On September 9, 2016, the plaintiffs filed a petition for writ of certiorari in the U.S. Supreme Court challenging the Second Circuit’s decision that the safe harbor of Section 546(e) applied to their claims. Certain shareholder defendants filed a joint brief in opposition to the petition for certiorari on October 24, 2016. The plaintiffs filed a reply in support of the petition on November 4, 2016. On April 3, 2018, Justice Kennedy and Justice Thomas issued a “Statement” related to the petition for certiorari suggesting that the Second Circuit and/or District Court may want to take steps to reexamine the application of the Section 546(e) safe harbor to the previously dismissed state law constructive fraudulent transfer claims based on the Supreme Court’s decision inMerit Management Group LP v. FTI Consulting, Inc. On April 10, 2018, the plaintiffs filed in the Second Circuit a motion for that court to recall its mandate, vacate its prior decision, and remand to the district court for further proceedings consistent withMerit Management. On April 20, 2018, the shareholder defendants filed a response to the plaintiffs’ motion to recall the mandate. On May 15, 2018, the Second Circuit issued an order recalling the mandate “in anticipation of further panel review.”
On August 2, 2013, the plaintiff in theFitzSimonsaction filed a Fifth Amended Complaint. On May 23, 2014, the defendants filed motions to dismiss theFitzSimonsaction, including a global motion to dismiss Count I, which is the claim brought against former Tribune shareholders, for intentional fraudulent conveyance under U.S. federal law.
On January 6, 2017, the United States District Court for the Southern District of New York granted the shareholder defendants’ motion to dismiss the intentional fraudulent conveyance claim in the FitzSimons action. In dismissing the intentional fraudulent conveyance claim, the Court denied the plaintiff’s request to amend the complaint. While the District Court’s dismissal of the intentional fraudulent conveyance claim was not immediately appealable, the Trustee asked the District Court to enter judgment immediately so that an appeal could be taken. On February 23, 2017, the Court issued an order stating that it intended to permit an interlocutory appeal of the dismissal order, but would wait to do so until it has resolved outstanding motions to dismiss filed by other defendants
On July 18, 2017, the plaintiff submitted a letter to the District Court seeking leave to amend its complaint to add a constructive fraudulent transfer claim. The shareholder defendants opposed that request.
On August 24, 2017, the Court denied the plaintiff’s request without prejudice to renewal of the request in the event of an intervening change in the law. On March 8, 2018, the plaintiff renewed the request for leave to file a motion to amend the complaint to assert a constructive fraudulent transfer claim based on the Supreme Court’s ruling inMerit Management. The shareholder defendants opposed that request. On June 18, 2018, the District Court ordered that the request would be stayed pending further action by the Second Circuit in the still-pending appeal, discussed above. On December 18, 2018, the plaintiff filed a letter with the District Court requesting that the stay be dissolved in order to permit briefing on the motion to amend the complaint and indicating the plaintiff’s intention to file another motion to amend the complaint to reinstate claims for intentional fraudulent transfer. The shareholder defendants opposed that request. On January 14, 2019, the court held a case management conference, during which the court held that it would not lift the stay prior to further action from the Second Circuit. The court held that it would allow the Trustee to file a motion to amend to try to reinstate its intentional fraudulent transfer claim. On January 23, 2019, the court ordered the parties still facing pending claims to participate in a mediation. On March 27, 2019, the court held a telephone conference and decided to allow the plaintiff to file a motion for leave to amend. On April 4, 2019, the plaintiff filed a motion to amend the Fifth Amended Complaint to assert a federal constructive fraudulent transfer claim against certain shareholder defendants. On April 10, 2019, the shareholder defendants filed a brief in opposition to the plaintiff’s motion to amend. On April 12, 2019, the plaintiff filed a reply brief. The court denied leave to amend the complaint on April 23, 2019. On June 13, 2019, the court entered judgment pursuant to Rule 54(b), which would permit an appeal of the court’s dismissal of the claim against the shareholder defendants.
The value of the proceeds received by the Portfolio in connection with the LBO and the Portfolio’s cost basis in shares of Tribune was as follows:
| | | | | | | | |
Portfolio | | Proceeds | | | Cost Basis | |
MainStay VP MacKay Mid Cap Core Portfolio | | $ | 808,180 | | | $ | 790,269 | |
At this stage of the proceedings, it would be difficult to assess with any reasonable certainty the probable outcome of the pending litigation or the effect, if any, on the Portfolio’s net asset value.
Note 11–Recent Accounting Pronouncement
To improve the effectiveness of fair value disclosure requirements, the Financial Accounting Standards Board recently issued Accounting Standard Update (ASU)2018-13, Fair Value Measurement Disclosure Framework—Changes to the Disclosure Requirements for Fair Value Measurement (ASU2018-13), which adds, removes, and modifies certain aspects relating to fair value disclosure. ASU2018-13 is effective for interim and annual reporting periods beginning after December 15, 2019; early adoption of the additions relating to ASU2018-13 is not required. Management has evaluated the implications of certain other provisions of the ASU and has determined to early adopt aspects related to the removal and modifications of certain fair value measurement disclosures under the ASU effective immediately. At this time, management is evaluating the implications of certain other provisions of the ASU related to new disclosure requirements and any impact on the financial statement disclosures has not yet been determined.
| | |
| 24 | | MainStay VP MacKay Mid Cap Core Portfolio |
Note 12–Subsequent Events
In connection with the preparation of the financial statements of the Portfolio as of and for the six-month period ended June 30, 2019, events and transactions subsequent to June 30, 2019, through the date the financial statements were issued have been evaluated by the Portfolio’s management for possible adjustment and/or disclosure. No subsequent events requiring financial statement adjustment or disclosure have been identified.
Proxy Voting Policies and Procedures and Proxy Voting Record
A description of the policies and procedures that New York Life Investments uses to vote proxies related to the Portfolio’s securities is available without charge, upon request, (i) by calling800-598-2019; (ii) by visiting New York Life Investments website at https://www.nylinvestments.com/mainstay/products-and-performance/mainstay-vp-funds-trust; or (iii) by visiting the SEC’s website at www.sec.gov.
The Portfolio is required to file with the SEC its proxy voting record for the12-month period ending June 30 on Form N-PX. The Portfolio’s most recent Form N-PX or proxy voting record is available free of charge upon request (i) by calling800-598-2019; (ii) by visiting New York Life Investments website at https://www.nylinvestments.com/mainstay/products-and-performance/mainstay-vp-funds-trust; or (iii) by visiting the SEC’s website atwww.sec.gov.
Shareholder Reports and Quarterly Portfolio Disclosure
The Portfolio is required to file its complete schedule of portfolio holdings with the SEC 60 days after each fiscal quarter onForm N-PORT. The Portfolio’s holdings report is available without charge upon request, (i) by calling800-598-2019; (ii) by visiting New York Life Investments website at https://www.nylinvestments.com/mainstay/products-and-performance/mainstay-vp-funds-trust; or (iii) on the SEC’s website at www.sec.gov.
| | |
| 26 | | MainStay VP MacKay Mid Cap Core Portfolio |
MainStay VP Portfolios
MainStay VP offers a wide range of Portfolios. The full array of MainStay VP offerings is listed here, with information about the manager, subadvisors, legal counsel, and independent registered public accounting firm.
Equity Portfolios
MainStay VP Eagle Small Cap Growth Portfolio
MainStay VP Emerging Markets Equity Portfolio
MainStay VP Epoch U.S. Equity Yield Portfolio
MainStay VP Fidelity Institutional AM® Utilities Portfolio†
MainStay VP Large Cap Growth Portfolio
MainStay VP MacKay Common Stock Portfolio
MainStay VP MacKay Growth Portfolio
MainStay VP MacKay International Equity Portfolio
MainStay VP MacKay Mid Cap Core Portfolio
MainStay VP MacKay S&P 500 Index Portfolio
MainStay VP MacKay Small Cap Core Portfolio
MainStay VP Mellon Natural Resources Portfolio
MainStay VP T. Rowe Price Equity Income Portfolio
Mixed Asset Portfolios
MainStay VP Balanced Portfolio
MainStay VP Income Builder Portfolio
MainStay VP Janus Henderson Balanced Portfolio
MainStay VP MacKay Convertible Portfolio
Income Portfolios
MainStay VP Bond Portfolio
MainStay VP Floating Rate Portfolio
MainStay VP Indexed Bond Portfolio
MainStay VP MacKay Government Portfolio
MainStay VP MacKay High Yield Corporate Bond Portfolio
MainStay VP MacKay Unconstrained Bond Portfolio
MainStay VP PIMCO Real Return Portfolio
Money Market
MainStay VP U.S. Government Money Market Portfolio
Alternative
MainStay VP Cushing Renaissance Advantage Portfolio
MainStay VP IQ Hedge Multi-Strategy Portfolio
Asset Allocation Portfolios
MainStay VP Conservative Allocation Portfolio
MainStay VP Growth Allocation Portfolio
MainStay VP Moderate Allocation Portfolio
MainStay VP Moderate Growth Allocation Portfolio
Manager
New York Life Investment Management LLC
New York, New York
Subadvisors
Candriam Belgium*
Brussels, Belgium
Cushing Asset Management, LP
Dallas, Texas
Eagle Asset Management, Inc.
St Petersburg, Florida
Epoch Investment Partners, Inc.
New York, New York
FIAM LLC
Smithfield, Rhode Island
IndexIQ Advisors LLC*
New York, New York
Janus Capital Management LLC
Denver, Colorado
MacKay Shields LLC*
New York, New York
Mellon Investments Corporation
Boston, Massachusetts
NYL Investors LLC*
New York, New York
Pacific Investment Management Company LLC
Newport Beach, California
T. Rowe Price Associates, Inc.
Baltimore, Maryland
Winslow Capital Management, LLC
Minneapolis, Minnesota
Distributor
NYLIFE Distributors LLC*
Jersey City, New Jersey
Custodian
State Street Bank and Trust Company
Boston, Massachusetts
Independent Registered Public Accounting Firm
PricewaterhouseCoopers LLP
New York, New York
Legal Counsel
Dechert LLP
Washington, District of Columbia
Some Portfolios may not be available in all products.
| † | Fidelity Institutional AM is a registered trade mark of FMR LLC. Used with permission. |
| * | An affiliate of New York Life Investment Management LLC |
Not part of the Semiannual Report
2019 Semiannual Report
This report is for the general information of New York Life Variable Annuities and NYLIAC Variable Universal Life Insurance Products policyowners. It must be preceded or accompanied by the appropriate product(s) and funds prospectuses if it is given to anyone who is not an owner of a New York Life variable annuity policy or a NYLIAC Variable Universal Life Insurance Product. This report does not offer for sale or solicit orders to purchase securities.
The performance data quoted in this report represents past performance. Past performance is no guarantee of future results. Due to market volatility and other factors, current performance may be lower or higher than the figures shown. The most recent month-end performance summary for your variable annuity or variable life policy is available by calling 800-598-2019 and is updated periodically on www.newyorklife.com.
The New York Life Variable Annuities and NYLIAC Variable Universal Life Insurance Products are issued by New York Life Insurance and Annuity Corporation (a Delaware Corporation) and distributed by NYLIFE Distributors LLC (Member FINRA/SIPC).
New York Life Insurance Company
New York Life Insurance and Annuity Corporation (NYLIAC) (A Delaware Corporation)
51 Madison Avenue, Room 551
New York, NY 10010
www.newyorklife.com
Printed on recycled paper
nylinvestments.com
NYLIFE Distributors LLC, 30 Hudson Street, Jersey City, NJ 07302
New York Life Investment Management LLC is the investment manager to the MainStay VP Funds Trust
©2019 by NYLIFE Distributors LLC. All rights reserved.
You may obtain copies of the Prospectus and the Statement of Additional Information free of charge, upon request, by callingtoll-free 800-598-2019 or writing to New York Life Insurance and Annuity Corporation, 51 Madison Avenue, New York, NY 10010.
| | | | |
| | | |
| Not FDIC Insured | | No Bank Guarantee | | May Lose Value |
| | | | |
| 1781635 | | | | MSVPMCC10-08/19 (NYLIAC) NI527 |
MainStay VP MacKay Small Cap Core Portfolio
Message from the President and Semiannual Report
Unaudited | June 30, 2019

Beginning on January 1, 2021, as permitted by regulations adopted by the Securities and Exchange Commission, paper copies of the MainStay VP Portfolio annual and semi-annual shareholder reports may no longer be sent by mail, unless you specifically request paper copies of the reports from the insurance company that offers your policy. Instead, the reports will be made available online, and you will be notified by mail each time a report is posted and provided with a website link to access the report. Instructions for requesting paper copies will be provided by your insurance company.
If you already elected to receive shareholder reports electronically, you will not be affected by this change and you need not take any action. At any time, you may elect to receive reports and other communications from the insurance company electronically by following the instructions provided by the insurance company.
You may elect to receive all future shareholder reports in paper form free of charge. You can inform the insurance company that you wish to receive paper copies of reports by following the instructions provided by the insurance company. Your election to receive reports in paper form will apply to all portfolio companies available under your contract.
| | | | | | | | |
| | | | | |
| Not FDIC/NCUA Insured | | Not a Deposit | | May Lose Value | | No Bank Guarantee | | Not Insured by Any Government Agency |

This page intentionally left blank
Message from the President
Most equity and fixed-income markets in the United States and around the world advanced in the face of conflicting political and macroeconomic forces during thesix-month period ended June 30, 2019.
The reporting period began on the heels of tumultuous December 2018, during which equities and equity-sensitive bonds spiked sharply lower on concerns regarding the pace of economic growth, a U.S. government shutdown and the potential impact of trade disputes between the United States and other nations, particularly China. Markets recovered quickly in early 2019 as trade tensions eased, the government reopened and the U.S. Federal Reserve Board (Fed) adopted a more patient tone regarding the future direction of interest rates. Markets moved broadly higher from January through April, supported by encouraging economic data and generally strong corporate earnings.
During the first four months of the reporting period, the improving economic environment encouraged investors to favor areas of the market viewed as offering greater return potential along with higher risks. Among U.S. stocks, cyclical, growth-oriented sectors tended to outperform more defensive, value-oriented sectors, whilelarge-cap stocks outperformed theirsmaller-cap counterparts. Within the S&P 500® Index, the information technology sector led the market’s advance, followed by communication services, consumer discretionary and consumer staples. Industrials, utilities, financials, materials, real estate and energy produced more modest gains. While some international equity markets outperformed or underperformed the U.S. market, on average international stocks mirrored the performance of their U.S. counterparts. Fixed-income securities gained ground as well, albeit along a more gradual trajectory. Among U.S. fixed-income instruments, corporate issues generally outperformed government bonds, with lower credit quality, higher yielding securities leading the sector’s advance. Long-term U.S. Treasury bond yields proved particularly weak, with
10-year yields dipping at times below3-month yields, reflecting investors’ continued concerns about domestic economic growth.
May 2019 saw a return of uncertainty and volatility. Trade discussions between the United States and China faltered, driving global equity prices lower. Government bond prices rose as investors sought safe havens. June brought yet anotherU-turn as equity prices climbed again after comments from the Fed raised hopes of an interest rate cut in response to weak economic data. Stock and bond prices rose, with U.S. equity markets ending the reporting period in record territory.
We are pleased to see renewed signs of strength in broad areas of the financial market. At the same time, we remained sharply focused on providing you, as a MainStay VP investor, with the experienced and disciplined fund management that we believe underpins an effective, long-term investment strategy. Whatever tomorrow’s investment environment brings, you can rely on our portfolio managers to pursue the objectives of their individual Portfolios as outlined in the prospectus with the energy and dedication you have come to expect.
The report that follows contains additional information on the market events, investment decisions and specific securities that shaped your VP Portfolio’s performance during the six months ended June 30, 2019. We encourage you to read the report carefully and use it to evaluate your Portfolio’s performance in light of your long-range financial plan.
Sincerely,

Kirk C. Lehneis
President
The opinions expressed are as of the date of this report and are subject to change. There is no guarantee that any forecast made will come to pass. This material does not constitute investment advice and is not intended as an endorsement of any specific investment. Past performance is no guarantee of future results.
Not part of the Semiannual Report
Table of Contents
Investors should refer to the Portfolio’s Summary Prospectus and/or Prospectus and consider the Portfolio’s investment objectives, strategies, risks, charges and expenses carefully before investing. The Summary Prospectus and/or Prospectus contain this and other information about the Portfolio. You may obtain copies of the Portfolio’s Summary Prospectus and/or the Prospectus and the Statement of Additional Information free of charge, upon request, by calling toll-free 800-598-2019, by writing to New York Life Insurance and Annuity Corporation, 51 Madison Avenue, Room 251, New York, New York 10010 or by sending an email to MainStayShareholdersServices@nylim.com. These documents are also available at nylinvestments.com/vpdocuments. Please read the Summary Prospectus and/or Prospectus carefully before investing. MainStay VP Funds Trust portfolios are separate account options which are purchased through a variable insurance or variable annuity contract.
Investment and Performance Comparison1(Unaudited)
Performance data quoted represents past performance. Past performance is no guarantee of future results. Because of market volatility and other factors, current performance may be lower or higher than the figures shown. Investment return and principal value will fluctuate, and as a result, when shares are redeemed, they may be worth more or less than their original cost. The performance table and graph do not reflect any deduction of sales charges, mortality and expense charges, contract charges or administrative charges. Please refer to the Performance Summary appropriate for your policy. For performance information current to the most recent month-end, please call800-598-2019 or visit www.newyorklife.com.
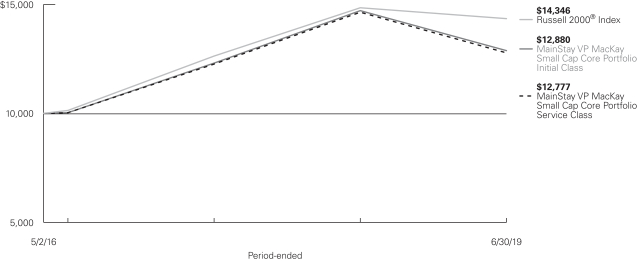
Average Annual Total Returns for the Period-Ended June 30, 2019
| | | | | | | | | | |
| Class | | Inception Date | | Six Months | | One Year | | Since
Inception | | Gross
Expense
Ratio2 |
| | | | | |
| Initial Class Shares | | 5/2/2016 | | 11.77% | | –12.44% | | 8.33% | | 0.83% |
| Service Class Shares | | 5/2/2016 | | 11.63 | | –12.66 | | 8.06 | | 1.08 |
| | | | | | | | | | | | |
| Benchmark Performance | | Six
Months | | | One Year | | | Since
Inception | |
| | | |
Russell 2000® Index3 | | | 16.98 | % | | | –3.31 | % | | | 12.10 | % |
Morningstar Small Blend Category Average4 | | | 15.74 | | | | –3.76 | | | | 9.60 | |
| 1. | Performance figures may reflect certain fee waivers and/or expense limitations, without which total returns may have been different. For information on current fee waivers and/or expense limitations (if any), please refer to the Notes to Financial Statements. |
| 2. | The gross expense ratios presented reflect the Portfolio’s “Total Annual Portfolio Operating Expenses” from the most recent Prospectus, as supplemented, and may differ from other expense ratios disclosed in this report. |
| 3. | The Russell 2000® Index is the Portfolio’s primary broad-based securities market index for comparison purposes. The Russell 2000® Index measures the performance of the small-cap segment of the U.S. equity universe. It is a subset of the Russell 3000® Index and includes approximately 2,000 of the |
| | smallest securities based on a combination of their market cap and current index membership. Results assume reinvestment of all dividends and capital gains. An investment cannot be made directly in an index. |
| 4. | The Morningstar Small Blend Category Average is representative of funds that favor U.S. firms at the smaller end of the market-capitalization range. Some aim to own an array of value and growth stocks while others employ a discipline that leads to holdings with valuations and growth rates close to the small-cap averages. Stocks in the bottom 10% of the capitalization of the U.S. equity market are defined as small cap. The blend style is assigned to funds where neither growth nor value characteristics predominate. Results are based on average total returns of similar funds with all dividends and capital gain distributions reinvested. |
Cost in Dollars of a $1,000 Investment in MainStay VP MacKay Small Cap Core Portfolio (Unaudited)
The example below is intended to describe the fees and expenses borne by shareholders during the six-month period from January 1, 2019, to June 30, 2019, and the impact of those costs on your investment.
Example
As a shareholder of the Portfolio you incur two types of costs: (1) transaction costs, including exchange fees and sales charges (loads) on purchases (as applicable), and (2) ongoing costs, including management fees, distribution and/or service (12b-1) fees, and other Portfolio expenses (as applicable). This example is intended to help you understand your ongoing costs (in dollars) of investing in the Portfolio and to compare these costs with the ongoing costs of investing in other mutual funds. The example is based on an investment of $1,000 made at the beginning of the six-month period and held for the entire period from January 1, 2019, to June 30, 2019. Shares are only sold in connection with variable life and annuity contracts and the example does not reflect any contract level or transactional fees or expenses. If these costs had been included, your costs would have been higher.
This example illustrates your Portfolio’s ongoing costs in two ways:
Actual Expenses
The second and third data columns in the table below provide information about actual account values and actual expenses. You may use the information in these columns, together with the amount you invested, to estimate the expenses that you paid during the six months ended June 30, 2019. Simply divide your account value by $1,000
(for example, an $8,600 account value divided by $1,000 = 8.6), then multiply the result by the number under the heading entitled “Expenses Paid During Period” to estimate the expenses you paid on your account during this period.
Hypothetical Example for Comparison Purposes
The fourth and fifth data columns in the table below provide information about hypothetical account values and hypothetical expenses based on the Portfolio’s actual expense ratio and an assumed rate of return of 5% per year before expenses, which is not the Portfolio’s actual return. The hypothetical account values and expenses may not be used to estimate the actual ending account balances or expenses you paid for thesix-month period shown. You may use this information to compare the ongoing costs of investing in the Portfolio with the ongoing costs of investing in other mutual funds. To do so, compare this 5% hypothetical example with the 5% hypothetical examples that appear in the shareholder reports of the other mutual funds.
Please note that the expenses shown in the table are meant to highlight your ongoing costs only and do not reflect any transactional costs, such as exchange fees or sales charges (loads). Therefore, the fourth and fifth data columns of the table are useful in comparing ongoing costs only and will not help you determine the relative total costs of owning different funds. In addition, if these transactional costs were included, your costs would have been higher.
| | | | | | | | | | | | | | | | | | | | | | |
| | | | | | | | | | | | | | | | | | |
| Share Class | | Beginning
Account
Value
1/1/19 | | | Ending Account
Value (Based
on Actual
Returns and
Expenses)
6/30/19 | | | Expenses
Paid
During
Period1 | | | Ending Account
Value (Based on
Hypothetical
5% Annualized
Return and
Actual Expenses)
6/30/19 | | | Expenses
Paid
During
Period1 | | | Net Expense
Ratio
During
Period2 |
| | | | | | |
| Initial Class Shares | | $ | 1,000.00 | | | $ | 1,117.70 | | | $ | 4.46 | | | $ | 1,020.58 | | | $ | 4.26 | | | 0.85% |
| | | | | | |
| Service Class Shares | | $ | 1,000.00 | | | $ | 1,116.30 | | | $ | 5.77 | | | $ | 1,019.34 | | | $ | 5.51 | | | 1.10% |
| 1. | Expenses are equal to the Portfolio’s annualized expense ratio of each class multiplied by the average account value over the period, divided by 365 and multiplied by 181 (to reflect the six-month period). The table above represents the actual expenses incurred during the six-month period. In addition to the fees and expenses which the Portfolio bears directly, it also indirectly bears a pro rata share of the fees and expenses of the underlying funds in which it invests. Such indirect expenses are not included in the above-reported expense figures. |
| 2. | Expenses are equal to the Portfolio’s annualized expense ratio to reflect the six-month period. |
| | |
| 6 | | MainStay VP MacKay Small Cap Core Portfolio |
Industry Composition as of June 30, 2019(Unaudited)
| | | | |
| |
| Banks | | | 7.7 | % |
| |
| Biotechnology | | | 7.5 | |
| |
| Equity Real Estate Investment Trusts | | | 5.2 | |
| |
| Software | | | 5.1 | |
| |
| Health Care Equipment & Supplies | | | 3.9 | |
| |
| Machinery | | | 3.6 | |
| |
| Oil, Gas & Consumable Fuels | | | 3.5 | |
| |
| Insurance | | | 3.1 | |
| |
| Thrifts & Mortgage Finance | | | 3.1 | |
| |
| Household Durables | | | 2.6 | |
| |
| Specialty Retail | | | 2.6 | |
| |
| Electronic Equipment, Instruments & Components | | | 2.4 | |
| |
| Pharmaceuticals | | | 2.4 | |
| |
| Professional Services | | | 2.1 | |
| |
| Electrical Equipment | | | 2.0 | |
| |
| Exchange-Traded Funds | | | 2.0 | |
| |
| IT Services | | | 2.0 | |
| |
| Commercial Services & Supplies | | | 1.9 | |
| |
| Life Sciences Tools & Services | | | 1.9 | |
| |
| Aerospace & Defense | | | 1.8 | |
| |
| Chemicals | | | 1.8 | |
| |
| Construction & Engineering | | | 1.8 | |
| |
| Health Care Technology | | | 1.8 | |
| |
| Hotels, Restaurants & Leisure | | | 1.8 | |
| |
| Semiconductors & Semiconductor Equipment | | | 1.8 | |
| |
| Trading Companies & Distributors | | | 1.7 | |
| |
| Media | | | 1.6 | |
| |
| Diversified Consumer Services | | | 1.3 | |
| |
| Energy Equipment & Services | | | 1.2 | |
| |
| Health Care Providers & Services | | | 1.2 | |
| |
| Water Utilities | | | 1.2 | |
| |
| Building Products | | | 1.1 | |
| |
| Textiles, Apparel & Luxury Goods | | | 1.1 | |
| |
| Beverages | | | 1.0 | |
| | | | |
| |
| Food Products | | | 1.0 | % |
| |
| Electric Utilities | | | 0.9 | |
| |
| Entertainment | | | 0.9 | |
| |
| Internet & Direct Marketing Retail | | | 0.9 | |
| |
| Metals & Mining | | | 0.9 | |
| |
| Interactive Media & Services | | | 0.8 | |
| |
| Tobacco | | | 0.8 | |
| |
| Food & Staples Retailing | | | 0.7 | |
| |
| Mortgage Real Estate Investment Trusts | | | 0.7 | |
| |
| Communications Equipment | | | 0.6 | |
| |
| Consumer Finance | | | 0.6 | |
| |
| Real Estate Management & Development | | | 0.6 | |
| |
| Diversified Telecommunication Services | | | 0.5 | |
| |
| Auto Components | | | 0.4 | |
| |
| Distributors | | | 0.4 | |
| |
| Airlines | | | 0.3 | |
| |
| Diversified Financial Services | | | 0.3 | |
| |
| Leisure Products | | | 0.3 | |
| |
| Technology Hardware, Storage & Peripherals | | | 0.3 | |
| |
| Capital Markets | | | 0.2 | |
| |
| Construction Materials | | | 0.2 | |
| |
| Multi-Utilities | | | 0.2 | |
| |
| Air Freight & Logistics | | | 0.1 | |
| |
| Containers & Packaging | | | 0.1 | |
| |
| Independent Power & Renewable Electricity Producers | | | 0.1 | |
| |
| Paper & Forest Products | | | 0.1 | |
| |
| Personal Products | | | 0.1 | |
| |
| Road & Rail | | | 0.1 | |
| |
| Gas Utilities | | | 0.0 | ‡ |
| |
| Short-Term Investments | | | 0.6 | |
| |
| Other Assets, Less Liabilities | | | –0.5 | |
| | | | |
| | | 100.0 | % |
| | | | |
See Portfolio of Investments beginning on page 9 for specific holdings within these categories. The Portfolio’s holdings are subject to change.
| ‡ | Less than one-tenth of a percent. |
Top Ten Holdings as of June 30, 2019(excludingshort-term investments) (Unaudited)
| 1. | iShares Russell 2000 ETF |
| 5. | Portland General Electric Co. |
| 10. | EastGroup Properties, Inc. |
Portfolio Management Discussion and Analysis(Unaudited)
Answers to the questions reflect the views of portfolio managers Migene Kim, CFA, and Mona Patni of MacKay Shields LLC, the Portfolio’s Subadvisor.
How did MainStay VP MacKay Small Cap Core Portfolio perform relative to its benchmark and peers during the six months ended June 30, 2019?
For the six months ended June 30, 2019, MainStay VP MacKay Small Cap Core Portfolio returned 11.77% for Initial Class shares and 11.63% for Service Class shares. Over the same period, both share classes underperformed the 16.98% return of the Russell 2000® Index, which is the Portfolio’s benchmark, and the 15.74% return of the Morningstar Small Blend Category Average.1
What factors affected the Portfolio’s relative performance during the reporting period?
Stock selection was the primary reason why the Portfolio underperformed relative to the Russell 2000® Index during the reporting period, whereas sector allocation effect was nearly neutral. The Portfolio’s performance directly reflected the performance of our stock selection model, particularly the weak effectiveness of the model’s valuation signals, which seek to evaluate companies across sales- and cash-based measures on a peer-relative basis. Valuation ranges across markets were compressed and value signals, which tend to prove most effective in an environment in which profits are accelerating, struggled amid a decelerating global growth outlook. Valuation signals proved more effective in June 2019, however, when value performance rebounded. Positive effects from the stock selection model’s other factors provided only partial mitigation. Momentum signals, which evaluate historical price trends, generated positive performance for the Portfolio during the reporting period, but proved volatile and inconsistent, hence difficult to capture. Sentiment signals, a gauge of institutional investor sentiment, were not effective during the first half of the reporting period but rebounded in the second half of the same period thanks to the Portfolio’s underweight positions.
Which sectors were the strongest positive contributors to the Portfolio’s relative performance, and which sectors were particularly weak?
During the reporting period, the strongest positive contributors to the Portfolio’s performance relative to the Russell 2000® Index were the health care and consumer staples sectors. (Contributions take weightings and total returns into account.) During the same period, the top detractors from benchmark-relative performance were the consumer discretionary, communication services and industrials sectors.
During the reporting period, which individual stocks made the strongest positive contributions to the Portfolio’s absolute performance and which stocks detracted the most?
The stocks that made the most substantial positive contributions to the Portfolio’s absolute performance during the reporting period included biotechnology company Array BioPharma, advertising software company The Trade Desk, and information technology infrastructure provider Vectrus. The stocks that detracted the most from the Portfolio’s absolute performance during the same period included printing company R.R. Donnelley & Sons, publishing company Houghton Mifflin Harcourt and biodiesel producer Renewable Energy Group.
Did the Portfolio make any significant purchases or sales during the reporting period?
The Portfolio’s largest initial purchase during the reporting period was in shares of insurance company Essent Group— purchased because of improved momentum measures seen in the Portfolio’s stock selection model. The Portfolio’s largest increase in position size was in public utility provider Portland General Electric due to improved sentiment and momentum measures within the model. Over the same period, the most substantial position that the Portfolio exited completely was in consumer finance company Green Dot, while the Portfolio’s most substantial decrease in position size was in medical diagnostics provider Haemonetics. Both sales were due to deterioration in momentum and sentiment measures within the stock selection model.
How did the Portfolio’s sector weightings change during the reporting period?
During the reporting period, the Portfolio’s largest sector-weighting increases relative to the Russell 2000® Index were in industrials and health care. Over the same period, the Portfolio’s most substantial sector-weighting decreases relative to the benchmark were in information technology and consumer discretionary.
How was the Portfolio positioned at the end of the reporting period?
As of June 30, 2019, the Portfolio’s largest overweight positions relative to the Russell 2000® Index included the health care and industrials sectors. As of the same date, the sectors that were most substantially underweight relative to the benchmark included information technology and financials.
| 1. | See page 5 for more information on benchmark and peer group returns. |
The opinions expressed are those of the portfolio managers as of the date of this report and are subject to change. There is no guarantee that any forecasts will come to pass. This material does not constitute investment advice and is not intended as an endorsement of any specific investment.
Not all MainStay VP Portfolios and/or share classes are available under all policies.
| | |
| 8 | | MainStay VP MacKay Small Cap Core Portfolio |
Portfolio of InvestmentsJune 30, 2019 (Unaudited)
| | | | | | | | |
| | | Shares | | |
Value | |
| Common Stocks 97.9%† | |
Aerospace & Defense 1.8% | |
Aerojet Rocketdyne Holdings, Inc. (a) | | | 62,500 | | | $ | 2,798,125 | |
Ducommun, Inc. (a) | | | 41,800 | | | | 1,883,926 | |
Moog, Inc., Class A | | | 27,100 | | | | 2,536,831 | |
Vectrus, Inc. (a) | | | 48,700 | | | | 1,975,272 | |
Wesco Aircraft Holdings, Inc. (a) | | | 146,900 | | | | 1,630,590 | |
| | | | | | | | |
| | | | | | | 10,824,744 | |
| | | | | | | | |
Air Freight & Logistics 0.1% | |
Radiant Logistics, Inc. (a) | | | 99,100 | | | | 608,474 | |
| | | | | | | | |
|
Airlines 0.3% | |
SkyWest, Inc. | | | 35,000 | | | | 2,123,450 | |
| | | | | | | | |
|
Auto Components 0.4% | |
Cooper Tire & Rubber Co. | | | 7,200 | | | | 227,160 | |
Dana, Inc. | | | 93,300 | | | | 1,860,402 | |
Tower International, Inc. | | | 26,800 | | | | 522,600 | |
| | | | | | | | |
| | | | | | | 2,610,162 | |
| | | | | | | | |
Banks 7.7% | |
1st Source Corp. | | | 4,500 | | | | 208,800 | |
Amalgamated Bank, Class A | | | 7,800 | | | | 136,110 | |
Amerant Bancorp, Inc. (a)(b) | | | 2,700 | | | | 53,217 | |
Bancorp, Inc. (a) | | | 209,300 | | | | 1,866,956 | |
Bank of Commerce Holdings | | | 18,100 | | | | 193,489 | |
BayCom Corp. (a) | | | 9,100 | | | | 199,290 | |
BCB Bancorp, Inc. | | | 33,600 | | | | 465,360 | |
Boston Private Financial Holdings, Inc. | | | 92,500 | | | | 1,116,475 | |
Bridge Bancorp, Inc. | | | 48,790 | | | | 1,437,354 | |
Cadence Bancorp | | | 122,400 | | | | 2,545,920 | |
CapStar Financial Holdings, Inc. | | | 1,500 | | | | 22,725 | |
Central Valley Community Bancorp | | | 6,400 | | | | 137,408 | |
Century Bancorp, Inc., Class A | | | 10,200 | | | | 896,580 | |
Civista Bancshares, Inc. | | | 33,800 | | | | 758,810 | |
ConnectOne Bancorp, Inc. | | | 32,300 | | | | 731,918 | |
Customers Bancorp, Inc. (a) | | | 93,600 | | | | 1,965,600 | |
Esquire Financial Holdings, Inc. (a) | | | 100 | | | | 2,515 | |
Farmers National Banc Corp. | | | 23,300 | | | | 345,539 | |
Financial Institutions, Inc. | | | 58,300 | | | | 1,699,445 | |
First BanCorp | | | 170,900 | | | | 1,886,736 | |
First Business Financial Services, Inc. | | | 16,100 | | | | 378,350 | |
First Choice Bancorp | | | 600 | | | | 13,644 | |
First Financial Corp. | | | 3,300 | | | | 132,528 | |
First Financial Northwest, Inc. | | | 24,900 | | | | 352,335 | |
First Foundation, Inc. | | | 141,600 | | | | 1,903,104 | |
First Internet Bancorp | | | 59,000 | | | | 1,270,860 | |
First Midwest Bancorp, Inc. | | | 117,300 | | | | 2,401,131 | |
First Northwest Bancorp | | | 2,800 | | | | 45,500 | |
First of Long Island Corp. | | | 21,900 | | | | 439,752 | |
Flushing Financial Corp. | | | 58,600 | | | | 1,300,920 | |
Franklin Financial Network, Inc. | | | 67,800 | | | | 1,888,908 | |
Fulton Financial Corp. | | | 6,400 | | | | 104,768 | |
| | | | | | | | |
| | | Shares | | |
Value | |
Banks (continued) | |
Great Southern Bancorp, Inc. | | | 19,500 | | | $ | 1,167,075 | |
Hancock Whitney Corp. | | | 1,100 | | | | 44,066 | |
Hanmi Financial Corp. | | | 81,800 | | | | 1,821,686 | |
Hope Bancorp, Inc. | | | 20,800 | | | | 286,624 | |
IberiaBank Corp. | | | 37,900 | | | | 2,874,715 | |
Investar Holding Corp. | | | 1,300 | | | | 31,005 | |
Lakeland Bancorp, Inc. | | | 29,600 | | | | 478,040 | |
LCNB Corp. | | | 11,700 | | | | 222,300 | |
Mercantile Bank Corp. | | | 6,100 | | | | 198,738 | |
Metropolitan Bank Holding Corp. (a) | | | 23,800 | | | | 1,047,200 | |
MidWestOne Financial Group, Inc. | | | 33,300 | | | | 931,068 | |
MutualFirst Financial, Inc. | | | 500 | | | | 17,020 | |
Northeast Bank | | | 12,800 | | | | 353,024 | |
OFG Bancorp | | | 34,900 | | | | 829,573 | |
Orrstown Financial Services, Inc. | | | 13,000 | | | | 285,870 | |
PCB Bancorp | | | 13,800 | | | | 235,152 | |
Peapack-Gladstone Financial Corp. | | | 56,500 | | | | 1,588,780 | |
Preferred Bank / Los Angeles CA | | | 24,400 | | | | 1,152,900 | |
RBB Bancorp | | | 58,500 | | | | 1,131,390 | |
Renasant Corp. | | | 3,200 | | | | 115,008 | |
Republic Bancorp, Inc., Class A | | | 18,800 | | | | 935,300 | |
SB One Bancorp | | | 4,800 | | | | 107,280 | |
Sierra Bancorp | | | 3,200 | | | | 86,784 | |
SmartFinancial, Inc. (a) | | | 13,500 | | | | 292,815 | |
Southern National Bancorp of Virginia, Inc. | | | 12,600 | | | | 192,906 | |
TriState Capital Holdings, Inc. (a) | | | 38,600 | | | | 823,724 | |
Unity Bancorp, Inc. | | | 3,700 | | | | 83,990 | |
WesBanco, Inc. | | | 62,500 | | | | 2,409,375 | |
West Bancorp., Inc. | | | 3,250 | | | | 68,965 | |
| | | | | | | | |
| | | | | | | 46,714,420 | |
| | | | | | | | |
Beverages 1.0% | |
Boston Beer Co., Inc., Class A (a) | | | 7,400 | | | | 2,795,424 | |
Coca-Cola Consolidated, Inc. | | | 7,300 | | | | 2,184,525 | |
Craft Brew Alliance, Inc. (a) | | | 45,500 | | | | 636,545 | |
Primo Water Corp. (a) | | | 26,400 | | | | 324,720 | |
| | | | | | | | |
| | | | | | | 5,941,214 | |
| | | | | | | | |
Biotechnology 7.5% | |
ACADIA Pharmaceuticals, Inc. (a) | | | 45,700 | | | | 1,221,561 | |
Acceleron Pharma, Inc. (a) | | | 28,002 | | | | 1,150,322 | |
Aimmune Therapeutics, Inc. (a) | | | 36,400 | | | | 757,848 | |
Amicus Therapeutics, Inc. (a) | | | 110,940 | | | | 1,384,531 | |
Anaptysbio, Inc. (a) | | | 13,000 | | | | 733,460 | |
Arena Pharmaceuticals, Inc. (a) | | | 21,383 | | | | 1,253,685 | |
Array BioPharma, Inc. (a) | | | 74,635 | | | | 3,457,840 | |
Arrowhead Pharmaceuticals, Inc. (a)(b) | | | 37,900 | | | | 1,004,350 | |
Atara Biotherapeutics, Inc. (a) | | | 28,100 | | | | 565,091 | |
Audentes Therapeutics, Inc. (a) | | | 21,000 | | | | 795,060 | |
Biohaven Pharmaceutical Holding Co., Ltd. (a) | | | 16,100 | | | | 705,019 | |
Blueprint Medicines Corp. (a) | | | 18,000 | | | | 1,697,940 | |
Clovis Oncology, Inc. (a) | | | 32,200 | | | | 478,814 | |
Editas Medicine, Inc. (a) | | | 31,900 | | | | 789,206 | |
| | | | | | |
The notes to the financial statements are an integral part of,
and should be read in conjunction with, the financial statements. | | | | | 9 | |
Portfolio of InvestmentsJune 30, 2019 (Unaudited) (continued)
| | | | | | | | |
| | | Shares | | |
Value | |
| Common Stocks (continued) | |
Biotechnology (continued) | |
Emergent BioSolutions, Inc. (a) | | | 22,392 | | | $ | 1,081,758 | |
Enanta Pharmaceuticals, Inc. (a) | | | 9,500 | | | | 801,610 | |
FibroGen, Inc. (a) | | | 31,219 | | | | 1,410,474 | |
Global Blood Therapeutics, Inc. (a) | | | 23,000 | | | | 1,209,800 | |
Halozyme Therapeutics, Inc. (a) | | | 96,500 | | | | 1,657,870 | |
Heron Therapeutics, Inc. (a) | | | 39,500 | | | | 734,305 | |
Immunomedics, Inc. (a)(b) | | | 72,200 | | | | 1,001,414 | |
Insmed, Inc. (a) | | | 34,790 | | | | 890,624 | |
Intercept Pharmaceuticals, Inc. (a)(b) | | | 11,600 | | | | 923,012 | |
Invitae Corp. (a) | | | 37,700 | | | | 885,950 | |
Iovance Biotherapeutics, Inc. (a) | | | 45,600 | | | | 1,118,112 | |
Ironwood Pharmaceuticals, Inc. (a) | | | 71,452 | | | | 781,685 | |
Ligand Pharmaceuticals, Inc. (a) | | | 8,627 | | | | 984,772 | |
Madrigal Pharmaceuticals, Inc. (a)(b) | | | 5,300 | | | | 555,493 | |
Mirati Therapeutics, Inc. (a) | | | 10,000 | | | | 1,030,000 | |
Momenta Pharmaceuticals, Inc. (a) | | | 50,169 | | | | 624,604 | |
Myriad Genetics, Inc. (a) | | | 31,810 | | | | 883,682 | |
OPKO Health, Inc. (a)(b) | | | 227,900 | | | | 556,076 | |
Portola Pharmaceuticals, Inc. (a)(b) | | | 32,542 | | | | 882,865 | |
Prothena Corp. PLC (a) | | | 67,307 | | | | 711,435 | |
PTC Therapeutics, Inc. (a) | | | 25,400 | | | | 1,143,000 | |
Radius Health, Inc. (a) | | | 33,833 | | | | 824,172 | |
REGENXBIO, Inc. (a) | | | 15,100 | | | | 775,687 | |
Repligen Corp. (a) | | | 20,676 | | | | 1,777,102 | |
Retrophin, Inc. (a) | | | 40,000 | | | | 803,600 | |
Sangamo Therapeutics, Inc. (a) | | | 59,800 | | | | 644,046 | |
Spark Therapeutics, Inc. (a) | | | 13,516 | | | | 1,383,768 | |
Spectrum Pharmaceuticals, Inc. (a) | | | 64,815 | | | | 558,057 | |
Ultragenyx Pharmaceutical, Inc. (a) | | | 25,144 | | | | 1,596,644 | |
Vanda Pharmaceuticals, Inc. (a) | | | 34,400 | | | | 484,696 | |
Xencor, Inc. (a) | | | 25,331 | | | | 1,036,798 | |
| | | | | | | | |
| | | | | | | 45,747,838 | |
| | | | | | | | |
Building Products 1.1% | |
Armstrong Flooring, Inc. (a) | | | 74,900 | | | | 737,765 | |
Builders FirstSource, Inc. (a) | | | 146,100 | | | | 2,463,246 | |
JELD-WEN Holding, Inc. (a) | | | 700 | | | | 14,861 | |
Patrick Industries, Inc. (a) | | | 25,700 | | | | 1,264,183 | |
Quanex Building Products Corp. | | | 103,300 | | | | 1,951,337 | |
| | | | | | | | |
| | | | | | | 6,431,392 | |
| | | | | | | | |
Capital Markets 0.2% | |
BrightSphere Investment Group PLC | | | 35,300 | | | | 402,773 | |
Donnelley Financial Solutions, Inc. (a) | | | 9,400 | | | | 125,396 | |
GAMCO Investors, Inc., Class A | | | 2,100 | | | | 40,257 | |
INTL FCStone, Inc. (a) | | | 17,700 | | | | 700,743 | |
Ladenburg Thalmann Financial Services, Inc. | | | 71,600 | | | | 245,588 | |
| | | | | | | | |
| | | | | | | 1,514,757 | |
| | | | | | | | |
Chemicals 1.8% | |
AdvanSix, Inc. (a) | | | 78,800 | | | | 1,925,084 | |
FutureFuel Corp. | | | 35,800 | | | | 418,502 | |
| | | | | | | | |
| | | Shares | | |
Value | |
Chemicals (continued) | |
Hawkins, Inc. | | | 23,000 | | | $ | 998,430 | |
Koppers Holdings, Inc. (a) | | | 32,200 | | | | 945,392 | |
OMNOVA Solutions, Inc. (a) | | | 67,400 | | | | 419,902 | |
Stepan Co. | | | 25,300 | | | | 2,325,323 | |
Tredegar Corp. | | | 114,000 | | | | 1,894,680 | |
Trinseo S.A. | | | 54,000 | | | | 2,286,360 | |
| | | | | | | | |
| | | | | | | 11,213,673 | |
| | | | | | | | |
Commercial Services & Supplies 1.9% | |
ABM Industries, Inc. | | | 63,800 | | | | 2,552,000 | |
CECO Environmental Corp. (a) | | | 11,800 | | | | 113,162 | |
Heritage-Crystal Clean, Inc. (a) | | | 3,700 | | | | 97,347 | |
Herman Miller, Inc. | | | 45,400 | | | | 2,029,380 | |
HNI Corp. | | | 6,100 | | | | 215,818 | |
Kimball International, Inc., Class B | | | 20,200 | | | | 352,086 | |
Knoll, Inc. | | | 13,100 | | | | 301,038 | |
LSC Communications, Inc. | | | 51,100 | | | | 187,537 | |
Quad/Graphics, Inc. | | | 400 | | | | 3,164 | |
R.R. Donnelley & Sons Co. | | | 293,700 | | | | 578,589 | |
Steelcase, Inc., Class A | | | 132,700 | | | | 2,269,170 | |
Tetra Tech, Inc. | | | 38,400 | | | | 3,016,320 | |
| | | | | | | | |
| | | | | | | 11,715,611 | |
| | | | | | | | |
Communications Equipment 0.6% | |
ADTRAN, Inc. | | | 2,600 | | | | 39,650 | |
CalAmp Corp. (a) | | | 9,400 | | | | 109,792 | |
Clearfield, Inc. (a) | | | 1,100 | | | | 14,575 | |
Comtech Telecommunications Corp. | | | 6,900 | | | | 193,959 | |
DASAN Zhone Solutions, Inc. (a) | | | 600 | | | | 7,794 | |
Digi International, Inc. (a) | | | 5,100 | | | | 64,668 | |
InterDigital, Inc. | | | 9,500 | | | | 611,800 | |
NetScout Systems, Inc. (a) | | | 67,900 | | | | 1,723,981 | |
Viavi Solutions, Inc. (a) | | | 67,800 | | | | 901,062 | |
| | | | | | | | |
| | | | | | | 3,667,281 | |
| | | | | | | | |
Construction & Engineering 1.8% | |
Comfort Systems USA, Inc. | | | 30,463 | | | | 1,553,308 | |
EMCOR Group, Inc. | | | 37,000 | | | | 3,259,700 | |
Great Lakes Dredge & Dock Corp. (a) | | | 178,000 | | | | 1,965,120 | |
MYR Group, Inc. (a) | | | 53,900 | | | | 2,013,165 | |
Sterling Construction Co., Inc. (a) | | | 139,900 | | | | 1,877,458 | |
| | | | | | | | |
| | | | | | | 10,668,751 | |
| | | | | | | | |
Construction Materials 0.2% | |
U.S. Concrete, Inc. (a) | | | 29,600 | | | | 1,470,824 | |
| | | | | | | | |
|
Consumer Finance 0.6% | |
Elevate Credit, Inc. (a) | | | 56,600 | | | | 233,192 | |
Enova International, Inc. (a) | | | 85,200 | | | | 1,963,860 | |
EZCORP, Inc., Class A (a) | | | 172,400 | | | | 1,632,628 | |
| | | | | | | | |
| | | | | | | 3,829,680 | |
| | | | | | | | |
| | | | |
| 10 | | MainStay VP MacKay Small Cap Core Portfolio | | The notes to the financial statements are an integral part of,
and should be read in conjunction with, the financial statements. |
| | | | | | | | |
| | | Shares | | |
Value | |
| Common Stocks (continued) | |
Containers & Packaging 0.1% | |
Myers Industries, Inc. | | | 29,800 | | | $ | 574,246 | |
UFP Technologies, Inc. (a) | | | 5,300 | | | | 220,533 | |
| | | | | | | | |
| | | | | | | 794,779 | |
| | | | | | | | |
Distributors 0.4% | |
Core-Mark Holding Co., Inc. | | | 59,300 | | | | 2,355,396 | |
Weyco Group, Inc. | | | 1,400 | | | | 37,394 | |
| | | | | | | | |
| | | | | | | 2,392,790 | |
| | | | | | | | |
Diversified Consumer Services 1.3% | |
American Public Education, Inc. (a) | | | 2,900 | | | | 85,782 | |
Career Education Corp. (a) | | | 101,600 | | | | 1,937,512 | |
Collectors Universe, Inc. | | | 15,600 | | | | 332,904 | |
Houghton Mifflin Harcourt Co. (a) | | | 136,600 | | | | 786,816 | |
K12, Inc. (a) | | | 70,100 | | | | 2,131,741 | |
Laureate Education, Inc., Class A (a) | | | 140,900 | | | | 2,213,539 | |
Select Interior Concepts, Inc., Class A (a) | | | 1,600 | | | | 18,640 | |
Strategic Education, Inc. | | | 1,900 | | | | 338,200 | |
| | | | | | | | |
| | | | | | | 7,845,134 | |
| | | | | | | | |
Diversified Financial Services 0.3% | |
Cannae Holdings, Inc. (a) | | | 49,600 | | | | 1,437,408 | |
FGL Holdings | | | 29,100 | | | | 244,440 | |
Marlin Business Services Corp. | | | 200 | | | | 4,986 | |
| | | | | | | | |
| | | | | | | 1,686,834 | |
| | | | | | | | |
Diversified Telecommunication Services 0.5% | |
ATN International, Inc. | | | 14,600 | | | | 842,858 | |
Bandwidth, Inc., Class A (a) | | | 18,100 | | | | 1,357,862 | |
IDT Corp., Class B (a) | | | 24,600 | | | | 232,962 | |
Iridium Communications, Inc. (a) | | | 36,100 | | | | 839,686 | |
| | | | | | | | |
| | | | | | | 3,273,368 | |
| | | | | | | | |
Electric Utilities 0.9% | |
Genie Energy, Ltd., Class B | | | 59,200 | | | | 630,480 | |
Portland General Electric Co. | | | 58,300 | | | | 3,158,111 | |
Spark Energy, Inc., Class A (b) | | | 141,000 | | | | 1,577,790 | |
| | | | | | | | |
| | | | | | | 5,366,381 | |
| | | | | | | | |
Electrical Equipment 2.0% | |
Allied Motion Technologies, Inc. | | | 4,000 | | | | 151,600 | |
American Superconductor Corp. (a)(b) | | | 73,200 | | | | 679,296 | |
Atkore International Group, Inc. (a) | | | 82,100 | | | | 2,123,927 | |
AZZ, Inc. | | | 12,100 | | | | 556,842 | |
Encore Wire Corp. | | | 37,600 | | | | 2,202,608 | |
EnerSys | | | 39,000 | | | | 2,671,500 | |
Generac Holdings, Inc. (a) | | | 43,800 | | | | 3,040,158 | |
Powell Industries, Inc. | | | 10,500 | | | | 399,000 | |
Preformed Line Products Co. | | | 2,800 | | | | 155,456 | |
| | | | | | | | |
| | | | | | | 11,980,387 | |
| | | | | | | | |
| | | | | | | | |
| | | Shares | | |
Value | |
Electronic Equipment, Instruments & Components 2.4% | |
Anixter International, Inc. (a) | | | 8,900 | | | $ | 531,419 | |
AVX Corp. | | | 12,700 | | | | 210,820 | |
Badger Meter, Inc. | | | 1,800 | | | | 107,442 | |
Belden, Inc. | | | 23,600 | | | | 1,405,852 | |
Benchmark Electronics, Inc. | | | 12,700 | | | | 319,024 | |
CTS Corp. | | | 900 | | | | 24,822 | |
ePlus, Inc. (a) | | | 4,000 | | | | 275,760 | |
Insight Enterprises, Inc. (a) | | | 36,100 | | | | 2,101,020 | |
Iteris, Inc. (a) | | | 8,600 | | | | 44,462 | |
Itron, Inc. (a) | | | 10,000 | | | | 625,700 | |
KEMET Corp. | | | 11,300 | | | | 212,553 | |
Kimball Electronics, Inc. (a) | | | 7,500 | | | | 121,800 | |
Knowles Corp. (a) | | | 22,500 | | | | 411,975 | |
Methode Electronics, Inc. | | | 10,600 | | | | 302,842 | |
Napco Security Technologies, Inc. (a) | | | 2,500 | | | | 74,200 | |
OSI Systems, Inc. (a) | | | 5,600 | | | | 630,728 | |
PC Connection, Inc. | | | 6,900 | | | | 241,362 | |
PCM, Inc. (a) | | | 1,200 | | | | 42,048 | |
Plexus Corp. (a) | | | 9,000 | | | | 525,330 | |
Rogers Corp. (a) | | | 5,500 | | | | 949,190 | |
Sanmina Corp. (a) | | | 69,074 | | | | 2,091,561 | |
ScanSource, Inc. (a) | | | 4,900 | | | | 159,544 | |
Tech Data Corp. (a) | | | 18,900 | | | | 1,976,940 | |
TTM Technologies, Inc. (a) | | | 27,100 | | | | 276,420 | |
Vishay Intertechnology, Inc. | | | 39,300 | | | | 649,236 | |
| | | | | | | | |
| | | | | | | 14,312,050 | |
| | | | | | | | |
Energy Equipment & Services 1.2% | |
C&J Energy Services, Inc. (a) | | | 67,400 | | | | 793,972 | |
Exterran Corp. (a) | | | 11,500 | | | | 163,530 | |
FTS International, Inc. (a) | | | 62,300 | | | | 347,634 | |
Keane Group, Inc. (a) | | | 132,000 | | | | 887,040 | |
Matrix Service Co. (a) | | | 91,200 | | | | 1,847,712 | |
ProPetro Holding Corp. (a) | | | 115,300 | | | | 2,386,710 | |
Select Energy Services, Inc., Class A (a) | | | 34,500 | | | | 400,545 | |
Superior Energy Services, Inc. (a) | | | 154,100 | | | | 200,330 | |
| | | | | | | | |
| | | | | | | 7,027,473 | |
| | | | | | | | |
Entertainment 0.9% | |
Glu Mobile, Inc. (a) | | | 277,900 | | | | 1,995,322 | |
Marcus Corp. | | | 58,400 | | | | 1,924,864 | |
Rosetta Stone, Inc. (a) | | | 61,500 | | | | 1,407,120 | |
| | | | | | | | |
| | | | | | | 5,327,306 | |
| | | | | | | | |
Equity Real Estate Investment Trusts 5.2% | |
American Assets Trust, Inc. | | | 46,200 | | | | 2,176,944 | |
Americold Realty Trust | | | 52,900 | | | | 1,715,018 | |
Ashford Hospitality Trust, Inc. | | | 254,800 | | | | 756,756 | |
Bluerock Residential Growth REIT, Inc. | | | 10,900 | | | | 128,075 | |
Braemar Hotels & Resorts, Inc. | | | 156,800 | | | | 1,552,320 | |
BRT Apartments Corp. | | | 1,000 | | | | 14,130 | |
CareTrust REIT, Inc. | | | 100,900 | | | | 2,399,402 | |
Clipper Realty, Inc. | | | 500 | | | | 5,590 | |
| | | | | | |
The notes to the financial statements are an integral part of,
and should be read in conjunction with, the financial statements. | | | | | 11 | |
Portfolio of InvestmentsJune 30, 2019 (Unaudited) (continued)
| | | | | | | | |
| | | Shares | | |
Value | |
| Common Stocks (continued) | |
Equity Real Estate Investment Trusts (continued) | |
Corepoint Lodging, Inc. | | | 54,000 | | | $ | 669,060 | |
EastGroup Properties, Inc. | | | 25,900 | | | | 3,003,882 | |
GEO Group, Inc. | | | 116,827 | | | | 2,454,535 | |
Innovative Industrial Properties, Inc. (b) | | | 5,200 | | | | 642,512 | |
Lexington Realty Trust | | | 253,100 | | | | 2,381,671 | |
New Senior Investment Group, Inc. | | | 300 | | | | 2,016 | |
NexPoint Residential Trust, Inc. | | | 12,000 | | | | 496,800 | |
Physicians Realty Trust | | | 24,500 | | | | 427,280 | |
Preferred Apartment Communities, Inc., Class A | | | 29,900 | | | | 447,005 | |
PS Business Parks, Inc. | | | 16,100 | | | | 2,713,333 | |
Rexford Industrial Realty, Inc. | | | 36,200 | | | | 1,461,394 | |
Ryman Hospitality Properties, Inc. | | | 34,367 | | | | 2,786,820 | |
Sunstone Hotel Investors, Inc. | | | 156,800 | | | | 2,149,728 | |
Terreno Realty Corp. | | | 20,900 | | | | 1,024,936 | |
Xenia Hotels & Resorts, Inc. | | | 116,700 | | | | 2,433,195 | |
| | | | | | | | |
| | | | | | | 31,842,402 | |
| | | | | | | | |
Food & Staples Retailing 0.7% | |
Natural Grocers by Vitamin Cottage, Inc. (a) | | | 121,300 | | | | 1,219,065 | |
Performance Food Group Co. (a) | | | 74,100 | | | | 2,966,223 | |
Village Super Market, Inc., Class A | | | 7,500 | | | | 198,825 | |
| | | | | | | | |
| | | | | | | 4,384,113 | |
| | | | | | | | |
Food Products 1.0% | |
Fresh Del Monte Produce, Inc. | | | 48,700 | | | | 1,312,465 | |
John B. Sanfilippo & Son, Inc. | | | 24,100 | | | | 1,920,529 | |
Sanderson Farms, Inc. | | | 18,800 | | | | 2,567,328 | |
Seneca Foods Corp., Class A (a) | | | 10,700 | | | | 297,781 | |
| | | | | | | | |
| | | | | | | 6,098,103 | |
| | | | | | | | |
Gas Utilities 0.0%‡ | |
Chesapeake Utilities Corp. | | | 1,300 | | | | 123,526 | |
| | | | | | | | |
|
Health Care Equipment & Supplies 3.9% | |
Accuray, Inc. (a) | | | 324,500 | | | | 1,255,815 | |
AngioDynamics, Inc. (a) | | | 400 | | | | 7,876 | |
Cardiovascular Systems, Inc. (a) | | | 49,000 | | | | 2,103,570 | |
Conformis, Inc. (a) | | | 46,900 | | | | 204,484 | |
CONMED Corp. | | | 28,600 | | | | 2,447,302 | |
Glaukos Corp. (a) | | | 6,800 | | | | 512,720 | |
Haemonetics Corp. (a) | | | 200 | | | | 24,068 | |
Integer Holdings Corp. (a) | | | 30,700 | | | | 2,576,344 | |
Lantheus Holdings, Inc. (a) | | | 75,300 | | | | 2,130,990 | |
Meridian Bioscience, Inc. | | | 37,500 | | | | 445,500 | |
NovoCure, Ltd. (a) | | | 25,100 | | | | 1,587,073 | |
NuVasive, Inc. (a) | | | 45,500 | | | | 2,663,570 | |
Orthofix Medical, Inc. (a) | | | 23,200 | | | | 1,226,816 | |
RTI Surgical Holdings, Inc. (a) | | | 108,500 | | | | 461,125 | |
SeaSpine Holdings Corp. (a) | | | 66,700 | | | | 883,775 | |
Surmodics, Inc. (a) | | | 1,700 | | | | 73,389 | |
Tandem Diabetes Care, Inc. (a) | | | 42,600 | | | | 2,748,552 | |
| | | | | | | | |
| | | Shares | | |
Value | |
Health Care Equipment & Supplies (continued) | |
Varex Imaging Corp. (a) | | | 69,600 | | | $ | 2,133,240 | |
Zynex, Inc. (b) | | | 54,800 | | | | 492,652 | |
| | | | | | | | |
| | | | | | | 23,978,861 | |
| | | | | | | | |
Health Care Providers & Services 1.2% | |
Amedisys, Inc. (a) | | | 5,200 | | | | 631,332 | |
AMN Healthcare Services, Inc. (a) | | | 9,200 | | | | 499,100 | |
Cross Country Healthcare, Inc. (a) | | | 6,100 | | | | 57,218 | |
Ensign Group, Inc. | | | 46,100 | | | | 2,624,012 | |
Genesis Healthcare, Inc. (a) | | | 2,900 | | | | 3,596 | |
HealthEquity, Inc. (a) | | | 12,800 | | | | 837,120 | |
Magellan Health, Inc. (a) | | | 20,700 | | | | 1,536,561 | |
RadNet, Inc. (a) | | | 15,900 | | | | 219,261 | |
Tenet Healthcare Corp. (a) | | | 13,000 | | | | 268,580 | |
Triple-S Management Corp., Class B (a) | | | 37,438 | | | | 892,896 | |
| | | | | | | | |
| | | | | | | 7,569,676 | |
| | | | | | | | |
Health Care Technology 1.8% | |
Computer Programs & Systems, Inc. | | | 36,900 | | | | 1,025,451 | |
HealthStream, Inc. (a) | | | 25,800 | | | | 667,188 | |
HMS Holdings Corp. (a) | | | 81,300 | | | | 2,633,307 | |
Inovalon Holdings, Inc., Class A (a)(b) | | | 102,400 | | | | 1,485,824 | |
NextGen Healthcare, Inc. (a) | | | 107,500 | | | | 2,139,250 | |
Omnicell, Inc. (a) | | | 32,300 | | | | 2,778,769 | |
| | | | | | | | |
| | | | | | | 10,729,789 | |
| | | | | | | | |
Hotels, Restaurants & Leisure 1.8% | |
BJ’s Restaurants, Inc. | | | 300 | | | | 13,182 | |
Bloomin’ Brands, Inc. | | | 73,177 | | | | 1,383,777 | |
Carrols Restaurant Group, Inc. (a) | | | 28,300 | | | | 255,549 | |
Century Casinos, Inc. (a) | | | 47,700 | | | | 462,690 | |
Cracker Barrel Old Country Store, Inc. (b) | | | 7,800 | | | | 1,331,694 | |
Dave & Buster’s Entertainment, Inc. | | | 7,200 | | | | 291,384 | |
Denny’s Corp. (a) | | | 16,600 | | | | 340,798 | |
Everi Holdings, Inc. (a) | | | 169,100 | | | | 2,017,363 | |
Fiesta Restaurant Group, Inc. (a) | | | 1,300 | | | | 17,082 | |
Habit Restaurants, Inc., Class A (a) | | | 92,700 | | | | 972,423 | |
J. Alexander’s Holdings, Inc. (a) | | | 39,500 | | | | 443,585 | |
Planet Fitness, Inc., Class A (a) | | | 500 | | | | 36,220 | |
Potbelly Corp. (a) | | | 47,900 | | | | 243,811 | |
SeaWorld Entertainment, Inc. (a) | | | 72,300 | | | | 2,241,300 | |
Speedway Motorsports, Inc. | | | 9,100 | | | | 168,805 | |
Texas Roadhouse, Inc. | | | 3,800 | | | | 203,946 | |
Wingstop, Inc. | | | 4,400 | | | | 416,900 | |
| | | | | | | | |
| | | | | | | 10,840,509 | |
| | | | | | | | |
Household Durables 2.6% | |
Bassett Furniture Industries, Inc. | | | 6,400 | | | | 97,600 | |
Beazer Homes USA, Inc. (a) | | | 82,400 | | | | 791,864 | |
Ethan Allen Interiors, Inc. | | | 92,000 | | | | 1,937,520 | |
Flexsteel Industries, Inc. | | | 23,600 | | | | 402,616 | |
KB Home | | | 93,000 | | | | 2,392,890 | |
La-Z-Boy, Inc. | | | 300 | | | | 9,198 | |
| | | | |
| 12 | | MainStay VP MacKay Small Cap Core Portfolio | | The notes to the financial statements are an integral part of,
and should be read in conjunction with, the financial statements. |
| | | | | | | | |
| | | Shares | | |
Value | |
| Common Stocks (continued) | |
Household Durables (continued) | |
M/I Homes, Inc. (a) | | | 58,000 | | | $ | 1,655,320 | |
MDC Holdings, Inc. | | | 68,800 | | | | 2,255,264 | |
Meritage Homes Corp. (a) | | | 44,400 | | | | 2,279,496 | |
Roku, Inc. (a) | | | 400 | | | | 36,232 | |
Skyline Champion Corp. (a) | | | 3,600 | | | | 98,568 | |
Taylor Morrison Home Corp. (a) | | | 118,700 | | | | 2,487,952 | |
TopBuild Corp. (a) | | | 18,000 | | | | 1,489,680 | |
| | | | | | | | |
| | | | | | | 15,934,200 | |
| | | | | | | | |
Independent Power & Renewable Electricity Producers 0.1% | |
Atlantic Power Corp. (a)(b) | | | 325,800 | | | | 788,436 | |
| | | | | | | | |
|
Insurance 3.1% | |
American Equity Investment Life Holding Co. | | | 30,300 | | | | 822,948 | |
Argo Group International Holdings, Ltd. | | | 33,200 | | | | 2,458,460 | |
Crawford & Co. | | | | | | | | |
Class A | | | 13,500 | | | | 142,155 | |
Class B | | | 18,800 | | | | 175,028 | |
eHealth, Inc. (a) | | | 28,800 | | | | 2,479,680 | |
Employers Holdings, Inc. | | | 50,600 | | | | 2,138,862 | |
Fednat Holding Co. | | | 42,000 | | | | 599,340 | |
Genworth Financial, Inc., Class A (a) | | | 645,300 | | | | 2,394,063 | |
Hallmark Financial Services, Inc. (a) | | | 33,700 | | | | 479,551 | |
HCI Group, Inc. | | | 5,300 | | | | 214,491 | |
Heritage Insurance Holdings, Inc. | | | 118,800 | | | | 1,830,708 | |
Kemper Corp. | | | 9,200 | | | | 793,868 | |
National General Holdings Corp. | | | 90,800 | | | | 2,082,952 | |
Selective Insurance Group, Inc. | | | 1,300 | | | | 97,357 | |
State Auto Financial Corp. | | | 10,400 | | | | 364,000 | |
Stewart Information Services Corp. | | | 20,800 | | | | 842,192 | |
Tiptree, Inc. | | | 16,800 | | | | 105,840 | |
Universal Insurance Holdings, Inc. | | | 31,700 | | | | 884,430 | |
| | | | | | | | |
| | | | | | | 18,905,925 | |
| | | | | | | | |
Interactive Media & Services 0.8% | |
DHI Group, Inc. (a) | | | 100,400 | | | | 358,428 | |
Liberty TripAdvisor Holdings, Inc., Class A (a) | | | 165,800 | | | | 2,055,920 | |
Meet Group, Inc. (a) | | | 138,900 | | | | 483,372 | |
QuinStreet, Inc. (a) | | | 30,700 | | | | 486,595 | |
Travelzoo (a) | | | 98,300 | | | | 1,517,752 | |
| | | | | | | | |
| | | | | | | 4,902,067 | |
| | | | | | | | |
Internet & Direct Marketing Retail 0.9% | |
1-800-Flowers.com, Inc., Class A (a) | | | 97,500 | | | | 1,840,800 | |
Groupon, Inc. (a) | | | 295,200 | | | | 1,056,816 | |
Lands’ End, Inc. (a)(b) | | | 144,100 | | | | 1,760,902 | |
Rubicon Project, Inc. (a) | | | 84,300 | | | | 536,148 | |
| | | | | | | | |
| | | | | | | 5,194,666 | |
| | | | | | | | |
IT Services 2.0% | |
Brightcove, Inc. (a) | | | 15,800 | | | | 163,214 | |
Carbonite, Inc. (a) | | | 4,700 | | | | 122,388 | |
Cardtronics PLC, Class A (a) | | | 52,800 | | | | 1,442,496 | |
| | | | | | | | |
| | | Shares | | |
Value | |
IT Services (continued) | |
Cass Information Systems, Inc. | | | 1,100 | | | $ | 53,328 | |
Conduent, Inc. (a) | | | 50,900 | | | | 488,131 | |
CSG Systems International, Inc. | | | 9,700 | | | | 473,651 | |
EVERTEC, Inc. | | | 17,800 | | | | 582,060 | |
Hackett Group, Inc. | | | 1,900 | | | | 31,901 | |
I3 Verticals, Inc., Class A (a) | | | 10,600 | | | | 312,170 | |
KBR, Inc. | | | 41,700 | | | | 1,039,998 | |
Limelight Networks, Inc. (a) | | | 8,800 | | | | 23,760 | |
Liveramp Holdings, Inc. (a) | | | 19,500 | | | | 945,360 | |
ManTech International Corp., Class A | | | 1,800 | | | | 118,530 | |
MAXIMUS, Inc. | | | 18,624 | | | | 1,350,985 | |
NIC, Inc. | | | 1,600 | | | | 25,664 | |
PaySign, Inc. (a) | | | 4,300 | | | | 57,491 | |
Perficient, Inc. (a) | | | 43,000 | | | | 1,475,760 | |
Perspecta, Inc. | | | 42,000 | | | | 983,220 | |
Presidio, Inc. | | | 121,500 | | | | 1,660,905 | |
Science Applications International Corp. | | | 1,700 | | | | 147,152 | |
Sykes Enterprises, Inc. (a) | | | 10,600 | | | | 291,076 | |
TTEC Holdings, Inc. | | | 4,000 | | | | 186,360 | |
Unisys Corp. (a)(b) | | | 14,400 | | | | 139,968 | |
| | | | | | | | |
| | | | | | | 12,115,568 | |
| | | | | | | | |
Leisure Products 0.3% | |
Clarus Corp. | | | 6,400 | | | | 92,416 | |
Malibu Boats, Inc., Class A (a) | | | 16,700 | | | | 648,795 | |
Mastercraft Boat Holdings, Inc. (a) | | | 42,800 | | | | 838,452 | |
| | | | | | | | |
| | | | | | | 1,579,663 | |
| | | | | | | | |
Life Sciences Tools & Services 1.9% | |
Fluidigm Corp. (a) | | | 158,600 | | | | 1,953,952 | |
Medpace Holdings, Inc. (a) | | | 36,600 | | | | 2,394,372 | |
NanoString Technologies, Inc. (a) | | | 73,700 | | | | 2,236,795 | |
NeoGenomics, Inc. (a) | | | 101,000 | | | | 2,215,940 | |
Syneos Health, Inc. (a) | | | 52,625 | | | | 2,688,611 | |
| | | | | | | | |
| | | | | | | 11,489,670 | |
| | | | | | | | |
Machinery 3.6% | |
Blue Bird Corp. (a) | | | 24,100 | | | | 474,529 | |
Commercial Vehicle Group, Inc. (a) | | | 229,900 | | | | 1,843,798 | |
EnPro Industries, Inc. | | | 33,300 | | | | 2,125,872 | |
Harsco Corp. (a) | | | 88,100 | | | | 2,417,464 | |
Hyster-Yale Materials Handling, Inc. | | | 300 | | | | 16,578 | |
L.B. Foster Co., Class A (a) | | | 71,700 | | | | 1,960,278 | |
Meritor, Inc. (a) | | | 97,600 | | | | 2,366,800 | |
Miller Industries, Inc. | | | 42,000 | | | | 1,291,500 | |
Mueller Industries, Inc. | | | 77,800 | | | | 2,277,206 | |
Navistar International Corp. (a) | | | 2,100 | | | | 72,345 | |
Park-Ohio Holdings Corp. | | | 31,100 | | | | 1,013,549 | |
TriMas Corp. (a) | | | 67,500 | | | | 2,090,475 | |
Wabash National Corp. | | | 127,900 | | | | 2,080,933 | |
Woodward, Inc. | | | 15,452 | | | | 1,748,548 | |
| | | | | | | | |
| | | | | | | 21,779,875 | |
| | | | | | | | |
| | | | | | |
The notes to the financial statements are an integral part of,
and should be read in conjunction with, the financial statements. | | | | | 13 | |
Portfolio of InvestmentsJune 30, 2019 (Unaudited) (continued)
| | | | | | | | |
| | | Shares | | |
Value | |
| Common Stocks (continued) | |
Media 1.6% | |
Central European Media Enterprises, Ltd., Class A (a) | | | 124,300 | | | $ | 541,948 | |
E.W. Scripps Co., Class A | | | 85,500 | | | | 1,307,295 | |
Entravision Communications Corp., Class A | | | 328,300 | | | | 1,024,296 | |
Fluent, Inc. (a) | | | 149,700 | | | | 805,386 | |
Lee Enterprises, Inc. (a) | | | 73,800 | | | | 165,312 | |
Marchex, Inc., Class B (a) | | | 48,500 | | | | 227,950 | |
Nexstar Media Group, Inc., Class A | | | 13,100 | | | | 1,323,100 | |
Sinclair Broadcast Group, Inc., Class A | | | 32,700 | | | | 1,753,701 | |
TEGNA, Inc. | | | 181,700 | | | | 2,752,755 | |
Tribune Publishing Co. | | | 13,500 | | | | 107,595 | |
| | | | | | | | |
| | | | | | | 10,009,338 | |
| | | | | | | | |
Metals & Mining 0.9% | |
Materion Corp. | | | 18,300 | | | | 1,240,923 | |
Schnitzer Steel Industries, Inc., Class A | | | 77,700 | | | | 2,033,409 | |
Warrior Met Coal, Inc. | | | 81,300 | | | | 2,123,556 | |
| | | | | | | | |
| | | | | | | 5,397,888 | |
| | | | | | | | |
Mortgage Real Estate Investment Trusts 0.7% | |
Arbor Realty Trust, Inc. (b) | | | 31,600 | | | | 382,992 | |
Cherry Hill Mortgage Investment Corp. | | | 102,500 | | | | 1,640,000 | |
Ellington Financial, Inc. | | | 15,100 | | | | 271,347 | |
PennyMac Mortgage Investment Trust | | | 94,100 | | | | 2,054,203 | |
| | | | | | | | |
| | | | | | | 4,348,542 | |
| | | | | | | | |
Multi-Utilities 0.2% | |
Black Hills Corp. | | | 12,400 | | | | 969,308 | |
| | | | | | | | |
|
Oil, Gas & Consumable Fuels 3.5% | |
Adams Resources & Energy, Inc. | | | 3,200 | | | | 109,696 | |
Arch Coal, Inc., Class A | | | 18,700 | | | | 1,761,727 | |
Bonanza Creek Energy, Inc. (a) | | | 11,900 | | | | 248,472 | |
Clean Energy Fuels Corp. (a) | | | 421,600 | | | | 1,125,672 | |
CONSOL Energy, Inc. (a) | | | 74,600 | | | | 1,985,106 | |
CVR Energy, Inc. | | | 44,800 | | | | 2,239,552 | |
Delek U.S. Holdings, Inc. | | | 68,500 | | | | 2,775,620 | |
Green Plains, Inc. | | | 47,800 | | | | 515,284 | |
Hallador Energy Co. | | | 80,200 | | | | 451,526 | |
Midstates Petroleum Co., Inc. (a) | | | 168,100 | | | | 990,109 | |
NACCO Industries, Inc., Class A | | | 8,300 | | | | 431,102 | |
Overseas Shipholding Group, Inc., Class A (a) | | | 286,400 | | | | 538,432 | |
Par Pacific Holdings, Inc. (a) | | | 15,300 | | | | 313,956 | |
Peabody Energy Corp. | | | 96,400 | | | | 2,323,240 | |
Renewable Energy Group, Inc. (a) | | | 48,000 | | | | 761,280 | |
REX American Resources Corp. (a) | | | 15,300 | | | | 1,115,370 | |
Sandridge Energy, Inc. (a) | | | 91,900 | | | | 635,948 | |
Teekay Tankers, Ltd., Class A (a) | | | 217,000 | | | | 277,760 | |
World Fuel Services Corp. | | | 70,400 | | | | 2,531,584 | |
| | | | | | | | |
| | | | | | | 21,131,436 | |
| | | | | | | | |
| | | | | | | | |
| | | Shares | | |
Value | |
Paper & Forest Products 0.1% | |
Verso Corp., Class A (a) | | | 22,300 | | | $ | 424,815 | |
| | | | | | | | |
|
Personal Products 0.1% | |
LifeVantage Corp. (a) | | | 23,400 | | | | 303,732 | |
Nature’s Sunshine Products, Inc. (a) | | | 900 | | | | 8,361 | |
| | | | | | | | |
| | | | | | | 312,093 | |
| | | | | | | | |
Pharmaceuticals 2.4% | |
Akorn, Inc. (a) | | | 4,500 | | | | 23,175 | |
Amphastar Pharmaceuticals, Inc. (a) | | | 95,400 | | | | 2,013,894 | |
ANI Pharmaceuticals, Inc. (a) | | | 25,400 | | | | 2,087,880 | |
Assertio Therapeutics, Inc. (a) | | | 74,500 | | | | 257,025 | |
BioDelivery Sciences International, Inc. (a) | | | 192,100 | | | | 893,265 | |
Chiasma, Inc. (a) | | | 34,500 | | | | 257,715 | |
Collegium Pharmaceutical, Inc. (a) | | | 102,600 | | | | 1,349,190 | |
Endo International PLC (a) | | | 65,000 | | | | 267,800 | |
Horizon Therapeutics PLC (a) | | | 73,100 | | | | 1,758,786 | |
Pacira BioSciences, Inc. (a) | | | 51,500 | | | | 2,239,735 | |
Phibro Animal Health Corp., Class A | | | 62,600 | | | | 1,988,802 | |
Siga Technologies, Inc. (a) | | | 219,900 | | | | 1,249,032 | |
| | | | | | | | |
| | | | | | | 14,386,299 | |
| | | | | | | | |
Professional Services 2.1% | |
Barrett Business Services, Inc. | | | 23,700 | | | | 1,957,620 | |
BG Staffing, Inc. | | | 52,900 | | | | 998,752 | |
Heidrick & Struggles International, Inc. | | | 59,800 | | | | 1,792,206 | |
Insperity, Inc. | | | 18,500 | | | | 2,259,590 | |
Kelly Services, Inc., Class A | | | 78,900 | | | | 2,066,391 | |
Kforce, Inc. | | | 52,300 | | | | 1,835,207 | |
TrueBlue, Inc. (a) | | | 76,708 | | | | 1,692,179 | |
| | | | | | | | |
| | | | | | | 12,601,945 | |
| | | | | | | | |
Real Estate Management & Development 0.6% | |
Altisource Portfolio Solutions S.A. (a) | | | 85,500 | | | | 1,680,930 | |
Marcus & Millichap, Inc. (a) | | | 30,200 | | | | 931,670 | |
RMR Group, Inc., Class A | | | 18,000 | | | | 845,640 | |
| | | | | | | | |
| | | | | | | 3,458,240 | |
| | | | | | | | |
Road & Rail 0.1% | |
Universal Logistics Holdings, Inc. | | | 16,000 | | | | 359,520 | |
YRC Worldwide, Inc. (a) | | | 33,700 | | | | 135,811 | |
| | | | | | | | |
| | | | | | | 495,331 | |
| | | | | | | | |
Semiconductors & Semiconductor Equipment 1.8% | |
Advanced Energy Industries, Inc. (a) | | | 11,368 | | | | 639,677 | |
Amkor Technology, Inc. (a) | | | 26,600 | | | | 198,436 | |
Cirrus Logic, Inc. (a) | | | 18,100 | | | | 790,970 | |
Diodes, Inc. (a) | | | 12,000 | | | | 436,440 | |
Enphase Energy, Inc. (a) | | | 43,100 | | | | 785,713 | |
FormFactor, Inc. (a) | | | 6,000 | | | | 94,020 | |
Ichor Holdings, Ltd. (a) | | | 10,800 | | | | 255,312 | |
Lattice Semiconductor Corp. (a) | | | 60,200 | | | | 878,318 | |
Nanometrics, Inc. (a) | | | 6,400 | | | | 222,144 | |
| | | | |
| 14 | | MainStay VP MacKay Small Cap Core Portfolio | | The notes to the financial statements are an integral part of,
and should be read in conjunction with, the financial statements. |
| | | | | | | | |
| | | Shares | | |
Value | |
| Common Stocks (continued) | |
Semiconductors & Semiconductor Equipment (continued) | |
PDF Solutions, Inc. (a) | | | 8,100 | | | $ | 106,272 | |
Photronics, Inc. (a) | | | 172,200 | | | | 1,412,040 | |
Rambus, Inc. (a) | | | 31,800 | | | | 382,872 | |
Rudolph Technologies, Inc. (a) | | | 3,400 | | | | 93,942 | |
Silicon Laboratories, Inc. (a) | | | 12,900 | | | | 1,333,860 | |
Synaptics, Inc. (a) | | | 49,920 | | | | 1,454,669 | |
Ultra Clean Holdings, Inc. (a) | | | 8,800 | | | | 122,496 | |
Xperi Corp. | | | 85,500 | | | | 1,760,445 | |
| | | | | | | | |
| | | | | | | 10,967,626 | |
| | | | | | | | |
Software 5.1% | |
ACI Worldwide, Inc. (a) | | | 32,200 | | | | 1,105,748 | |
Agilysys, Inc. (a) | | | 5,100 | | | | 109,497 | |
Alarm.com Holdings, Inc. (a) | | | 10,900 | | | | 583,150 | |
Alteryx, Inc., Class A (a)(b) | | | 9,900 | | | | 1,080,288 | |
American Software, Inc., Class A | | | 1,900 | | | | 24,985 | |
AppFolio, Inc., Class A (a) | | | 4,300 | | | | 439,761 | |
Avaya Holdings Corp. (a) | | | 82,000 | | | | 976,620 | |
Blackbaud, Inc. | | | 14,400 | | | | 1,202,400 | |
Blackline, Inc. (a) | | | 12,600 | | | | 674,226 | |
Bottomline Technologies, Inc. (a) | | | 1,800 | | | | 79,632 | |
Channeladvisor Corp. (a) | | | 2,100 | | | | 18,396 | |
CommVault Systems, Inc. (a) | | | 10,000 | | | | 496,200 | |
Cornerstone OnDemand, Inc. (a) | | | 23,500 | | | | 1,361,355 | |
Digital Turbine, Inc. (a) | | | 22,400 | | | | 112,000 | |
Domo, Inc., Class B (a) | | | 1,000 | | | | 27,320 | |
Ebix, Inc. (b) | | | 34,800 | | | | 1,747,656 | |
Egain Corp. (a) | | | 5,100 | | | | 41,514 | |
Envestnet, Inc. (a) | | | 13,500 | | | | 922,995 | |
Five9, Inc. (a) | | | 17,100 | | | | 877,059 | |
Intelligent Systems Corp. (a) | | | 1,100 | | | | 31,669 | |
j2 Global, Inc. | | | 30,400 | | | | 2,702,256 | |
LivePerson, Inc. (a) | | | 17,300 | | | | 485,092 | |
MicroStrategy, Inc., Class A (a) | | | 2,400 | | | | 343,944 | |
Monotype Imaging Holdings, Inc. | | | 11,300 | | | | 190,292 | |
OneSpan, Inc. (a) | | | 7,400 | | | | 104,858 | |
Paylocity Holding Corp. (a) | | | 15,100 | | | | 1,416,682 | |
Progress Software Corp. | | | 48,800 | | | | 2,128,656 | |
Q2 Holdings, Inc. (a) | | | 11,300 | | | | 862,868 | |
QAD, Inc., Class A | | | 400 | | | | 16,084 | |
Qualys, Inc. (a) | | | 9,900 | | | | 862,092 | |
Rapid7, Inc. (a) | | | 1,900 | | | | 109,896 | |
RingCentral, Inc., Class A (a) | | | 12,000 | | | | 1,379,040 | |
SPS Commerce, Inc. (a) | | | 19,400 | | | | 1,982,874 | |
Synchronoss Technologies, Inc. (a) | | | 8,500 | | | | 67,235 | |
Telaria, Inc. (a) | | | 204,000 | | | | 1,534,080 | |
TiVo Corp. | | | 35,400 | | | | 260,898 | |
Trade Desk, Inc., Class A (a) | | | 2,400 | | | | 546,672 | |
Upland Software, Inc. (a) | | | 6,600 | | | | 300,498 | |
Verint Systems, Inc. (a) | | | 19,300 | | | | 1,037,954 | |
| | | | | | | | |
| | | Shares | | |
Value | |
Software (continued) | |
Workiva, Inc. (a) | | | 13,400 | | | $ | 778,406 | |
Zix Corp. (a) | | | 174,700 | | | | 1,588,023 | |
Zscaler, Inc. (a) | | | 4,200 | | | | 321,888 | |
| | | | | | | | |
| | | | | | | 30,932,759 | |
| | | | | | | | |
Specialty Retail 2.6% | |
Asbury Automotive Group, Inc. (a) | | | 20,800 | | | | 1,754,272 | |
Barnes & Noble Education, Inc. (a) | | | 96,200 | | | | 323,232 | |
Barnes & Noble, Inc. | | | 22,400 | | | | 149,856 | |
Bed Bath & Beyond, Inc. (b) | | | 30,900 | | | | 359,058 | |
Genesco, Inc. (a) | | | 45,400 | | | | 1,919,966 | |
Group 1 Automotive, Inc. | | | 27,400 | | | | 2,243,786 | |
Hibbett Sports, Inc. (a) | | | 70,400 | | | | 1,281,280 | |
Lithia Motors, Inc., Class A | | | 14,500 | | | | 1,722,310 | |
Murphy USA, Inc. (a) | | | 29,700 | | | | 2,495,691 | |
Office Depot, Inc. | | | 458,200 | | | | 943,892 | |
Rent-A-Center, Inc. (a) | | | 83,400 | | | | 2,220,942 | |
RTW Retailwinds, Inc. (a) | | | 56,500 | | | | 96,050 | |
Sonic Automotive, Inc., Class A | | | 24,600 | | | | 574,410 | |
| | | | | | | | |
| | | | | | | 16,084,745 | |
| | | | | | | | |
Technology Hardware, Storage & Peripherals 0.3% | |
AstroNova, Inc. | | | 2,200 | | | | 56,848 | |
Avid Technology, Inc. (a) | | | 133,300 | | | | 1,215,696 | |
Diebold Nixdorf, Inc. (a) | | | 22,100 | | | | 202,436 | |
Stratasys, Ltd. (a) | | | 2,300 | | | | 67,551 | |
| | | | | | | | |
| | | | | | | 1,542,531 | |
| | | | | | | | |
Textiles, Apparel & Luxury Goods 1.1% | |
Deckers Outdoor Corp. (a) | | | 18,600 | | | | 3,273,042 | |
Delta Apparel, Inc. (a) | | | 6,600 | | | | 152,988 | |
Fossil Group, Inc. (a)(b) | | | 65,800 | | | | 756,700 | |
Rocky Brands, Inc. | | | 48,600 | | | | 1,325,808 | |
Vera Bradley, Inc. (a) | | | 109,100 | | | | 1,309,200 | |
| | | | | | | | |
| | | | | | | 6,817,738 | |
| | | | | | | | |
Thrifts & Mortgage Finance 3.1% | |
Bridgewater Bancshares, Inc. (a) | | | 22,200 | | | | 256,188 | |
Dime Community Bancshares, Inc. | | | 98,900 | | | | 1,878,111 | |
Essent Group, Ltd. (a) | | | 64,600 | | | | 3,035,554 | |
Flagstar Bancorp, Inc. | | | 62,600 | | | | 2,074,564 | |
FS Bancorp, Inc. | | | 13,800 | | | | 715,806 | |
LendingTree, Inc. (a) | | | 4,300 | | | | 1,806,129 | |
Luther Burbank Corp. | | | 71,000 | | | | 773,190 | |
Merchants Bancorp | | | 8,800 | | | | 149,864 | |
MGIC Investment Corp. (a) | | | 130,500 | | | | 1,714,770 | |
NMI Holdings, Inc., Class A (a) | | | 79,800 | | | | 2,265,522 | |
Radian Group, Inc. | | | 137,900 | | | | 3,151,015 | |
Riverview Bancorp, Inc. | | | 6,100 | | | | 52,094 | |
Sterling Bancorp, Inc. | | | 37,200 | | | | 370,884 | |
Territorial Bancorp, Inc. | | | 10,400 | | | | 321,360 | |
| | | | | | | | |
| | | | | | | 18,565,051 | |
| | | | | | | | |
| | | | | | |
The notes to the financial statements are an integral part of,
and should be read in conjunction with, the financial statements. | | | | | 15 | |
Portfolio of InvestmentsJune 30, 2019 (Unaudited) (continued)
| | | | | | | | |
| | | Shares | | |
Value | |
| Common Stocks (continued) | |
Tobacco 0.8% | |
Turning Point Brands, Inc. | | | 38,200 | | | $ | 1,871,036 | |
Universal Corp. | | | 36,400 | | | | 2,212,028 | |
Vector Group, Ltd. | | | 104,300 | | | | 1,016,925 | |
| | | | | | | | |
| | | | | | | 5,099,989 | |
| | | | | | | | |
Trading Companies & Distributors 1.7% | |
BMC Stock Holdings, Inc. (a) | | | 104,500 | | | | 2,215,400 | |
DXP Enterprises, Inc. (a) | | | 2,000 | | | | 75,780 | |
Foundation Building Materials, Inc. (a) | | | 111,200 | | | | 1,977,136 | |
General Finance Corp. (a) | | | 40,500 | | | | 338,985 | |
Herc Holdings, Inc. (a) | | | 47,100 | | | | 2,158,593 | |
Lawson Products, Inc. (a) | | | 7,600 | | | | 279,148 | |
Rush Enterprises, Inc. | | | | | | | | |
Class A | | | 6,000 | | | | 219,120 | |
Class B | | | 7,900 | | | | 291,589 | |
Titan Machinery, Inc. (a) | | | 99,900 | | | | 2,055,942 | |
Veritiv Corp. (a) | | | 26,000 | | | | 504,920 | |
Willis Lease Finance Corp. (a) | | | 4,600 | | | | 268,272 | |
| | | | | | | | |
| | | | | | | 10,384,885 | |
| | | | | | | | |
Water Utilities 1.2% | |
American States Water Co. | | | 34,200 | | | | 2,573,208 | |
Aquaventure Holdings, Ltd. (a) | | | 51,900 | | | | 1,036,443 | |
Artesian Resources Corp., Class A | | | 3,200 | | | | 118,944 | |
California Water Service Group | | | 19,600 | | | | 992,348 | |
Consolidated Water Co., Ltd. | | | 16,200 | | | | 231,012 | |
Global Water Resources, Inc. | | | 500 | | | | 5,220 | |
Middlesex Water Co. | | | 27,700 | | | | 1,641,225 | |
SJW Corp. | | | 7,400 | | | | 449,698 | |
| | | | | | | | |
| | | | | | | 7,048,098 | |
| | | | | | | | |
Total Common Stocks
(Cost $592,024,875) | | | | | | | 594,324,479 | |
| | | | | | | | |
|
| Convertible Preferred Stocks 0.0%‡ | |
Media 0.0%‡ | |
GCI Liberty, Inc.
7.00% | | | 1,040 | | | | 25,844 | |
| | | | | | | | |
Total Convertible Preferred Stocks
(Cost $19,365) | | | | | | | 25,844 | |
| | | | | | | | |
|
| Exchange-Traded Funds 2.0% | |
iShares Russell 2000 ETF (b) | | | 77,889 | | | | 12,111,740 | |
| | | | | | | | |
Total Exchange-Traded Funds
(Cost $11,905,175) | | | | | | | 12,111,740 | |
| | | | | | | | |
| | | | | | | | |
| | | Shares | | |
Value | |
| Short-Term Investments 0.6% | |
Affiliated Investment Company 0.0%‡ | |
MainStay U.S. Government Liquidity Fund, 2.03% (c) | | | 15,151 | | | $ | 15,151 | |
| | | | | | | | |
|
Unaffiliated Investment Company 0.6% | |
State Street Navigator Securities Lending Government Money Market Portfolio, 2.33% (c)(d) | | | 3,423,140 | | | | 3,423,140 | |
| | | | | | | | |
TotalShort-Term Investments
(Cost $3,438,291) | | | | | | | 3,438,291 | |
| | | | | | | | |
Total Investments
(Cost $607,387,706) | | | 100.5 | % | | | 609,900,354 | |
Other Assets, Less Liabilities | | | (0.5 | ) | | | (3,222,668 | ) |
Net Assets | | | 100.0 | % | | $ | 606,677,686 | |
| † | Percentages indicated are based on Portfolio net assets. |
| ‡ | Less than one-tenth of a percent. |
| (a) | Non-income producing security. |
| (b) | All or a portion of this security was held on loan. As of June 30, 2019, the aggregate market value of securities on loan was $20,738,556; the total market value of collateral held by the Portfolio was $21,764,114. The market value of the collateral held included non-cash collateral in the form of U.S. Treasury securities with a value of $18,340,974 (See Note 2(H)). |
| (c) | Current yield as of June 30, 2019. |
| (d) | Represents security purchased with cash collateral received for securities on loan. |
The following abbreviation is used in the preceding pages:
ETF—Exchange-Traded Fund
REIT—Real Estate Investment Trust
| | | | |
| 16 | | MainStay VP MacKay Small Cap Core Portfolio | | The notes to the financial statements are an integral part of,
and should be read in conjunction with, the financial statements. |
The following is a summary of the fair valuations according to the inputs used as of June 30, 2019, for valuing the Portfolio’s assets:
| | | | | | | | | | | | | | | | |
Description | | Quoted
Prices in
Active
Markets for
Identical
Assets
(Level 1) | | | Significant
Other
Observable
Inputs
(Level 2) | | | Significant
Unobservable
Inputs
(Level 3) | | | Total | |
| | | | |
Asset Valuation Inputs | | | | | | | | | | | | | | | | |
| Investments in Securities (a) | | | | | | | | | | | | | | | | |
| Common Stocks | | $ | 594,324,479 | | | $ | — | | | $ | — | | | $ | 594,324,479 | |
| Convertible Preferred Stocks | | | 25,844 | | | | — | | | | — | | | | 25,844 | |
| Exchange-Traded Funds | | | 12,111,740 | | | | — | | | | — | | | | 12,111,740 | |
| Short-Term Investments | | | | | | | | | | | | | | | | |
Affiliated Investment Company | | | 15,151 | | | | — | | | | — | | | | 15,151 | |
Unaffiliated Investment Company | | | 3,423,140 | | | | — | | | | — | | | | 3,423,140 | |
| | | | | | | | | | | | | | | | |
| TotalShort-Term Investments | | | 3,438,291 | | | | — | | | | — | | | | 3,438,291 | |
| | | | | | | | | | | | | | | | |
| Total Investments in Securities | | $ | 609,900,354 | | | $ | — | | | $ | — | | | $ | 609,900,354 | |
| | | | | | | | | | | | | | | | |
| (a) | For a complete listing of investments and their industries, see the Portfolio of Investments. |
| | | | | | |
The notes to the financial statements are an integral part of,
and should be read in conjunction with, the financial statements. | | | | | 17 | |
Statement of Assets and Liabilitiesas of June 30, 2019 (Unaudited)
| | | | |
| Assets | | | | |
Investment in unaffiliated securities, at value
(identified cost $607,372,555) including
securities on loan of $20,738,556 | | $ | 609,885,203 | |
Investment in affiliated investment company, at value (identified cost $15,151) | | | 15,151 | |
Receivables: | | | | |
Investment securities sold | | | 67,803,060 | |
Dividends | | | 589,482 | |
Portfolio shares sold | | | 127,467 | |
Securities lending | | | 12,605 | |
Other assets | | | 1,342 | |
| | | | |
Total assets | | | 678,434,310 | |
| | | | |
| |
| Liabilities | | | | |
Cash collateral received for securities on loan | | | 3,345,920 | |
Cash collateral due to securities lending agent | | | 77,220 | |
Payables: | | | | |
Investment securities purchased | | | 67,208,648 | |
Portfolio shares redeemed | | | 613,673 | |
Manager (See Note 3) | | | 372,934 | |
NYLIFE Distributors (See Note 3) | | | 64,813 | |
Professional fees | | | 29,791 | |
Custodian | | | 22,013 | |
Shareholder communication | | | 16,301 | |
Trustees | | | 556 | |
Accrued expenses | | | 4,755 | |
| | | | |
Total liabilities | | | 71,756,624 | |
| | | | |
Net assets | | $ | 606,677,686 | |
| | | | |
| |
| Composition of Net Assets | | | | |
Shares of beneficial interest outstanding (par value of $.001 per share) unlimited number of shares authorized | | $ | 55,500 | |
Additional paid-in capital | | | 584,221,847 | |
| | | | |
| | | 584,277,347 | |
Total distributable earnings (loss) | | | 22,400,339 | |
| | | | |
Net assets | | $ | 606,677,686 | |
| | | | |
| | | | |
Initial Class | | | | |
Net assets applicable to outstanding shares | | $ | 282,443,965 | |
| | | | |
Shares of beneficial interest outstanding | | | 25,730,583 | |
| | | | |
Net asset value per share outstanding | | $ | 10.98 | |
| | | | |
Service Class | | | | |
Net assets applicable to outstanding shares | | $ | 324,233,721 | |
| | | | |
Shares of beneficial interest outstanding | | | 29,769,147 | |
| | | | |
Net asset value per share outstanding | | $ | 10.89 | |
| | | | |
| | | | |
| 18 | | MainStay VP MacKay Small Cap Core Portfolio | | The notes to the financial statements are an integral part of,
and should be read in conjunction with, the financial statements. |
Statement of Operationsfor the six months ended June 30, 2019 (Unaudited)
| | | | |
| Investment Income (Loss) | | | | |
Income | | | | |
Dividends-unaffiliated (a) | | $ | 3,105,478 | |
Securities lending | | | 70,642 | |
Dividends-affiliated | | | 65,214 | |
Interest | | | 15 | |
| | | | |
Total income | | | 3,241,349 | |
| | | | |
Expenses | | | | |
Manager (See Note 3) | | | 1,655,770 | |
Distribution/Service—Service Class (See Note 3) | | | 259,500 | |
Professional fees | | | 34,157 | |
Shareholder communication | | | 18,663 | |
Custodian | | | 16,352 | |
Trustees | | | 3,637 | |
Miscellaneous | | | 6,523 | |
| | | | |
Total expenses before waiver/reimbursement | | | 1,994,602 | |
Expense waiver/reimbursement from Manager (See Note 3) | | | (28,003 | ) |
| | | | |
Net expenses | | | 1,966,599 | |
| | | | |
Net investment income (loss) | | | 1,274,750 | |
| | | | |
|
| Realized and Unrealized Gain (Loss) on Investments | |
Net realized gain (loss) on unaffiliated investments | | | (20,076,035 | ) |
Net change in unrealized appreciation (depreciation) on unaffiliated investments | | | 35,833,512 | |
| | | | |
Net realized and unrealized gain (loss) on investments | | | 15,757,477 | |
| | | | |
Net increase (decrease) in net assets resulting from operations | | $ | 17,032,227 | |
| | | | |
| (a) | Dividends recorded net of foreign withholding taxes in the amount of $1,450. |
| | | | | | |
The notes to the financial statements are an integral part of,
and should be read in conjunction with, the financial statements. | | | | | 19 | |
Statements of Changes in Net Assets
for the six months ended June 30, 2019 (Unaudited) and the year ended December 31, 2018
| | | | | | | | |
| | | 2019 | | | 2018 | |
| Increase (Decrease) in Net Assets | | | | | |
Operations: | | | | | | | | |
Net investment income (loss) | | $ | 1,274,750 | | | $ | 677,528 | |
Net realized gain (loss) on investments | | | (20,076,035 | ) | | | 39,774,022 | |
Net change in unrealized appreciation (depreciation) on investments | | | 35,833,512 | | | | (82,577,682 | ) |
| | | | |
Net increase (decrease) in net assets resulting from operations | | | 17,032,227 | | | | (42,126,132 | ) |
| | | | |
Distributions to shareholders: | | | | | | | | |
Initial Class | | | — | | | | (17,294,347 | ) |
Service Class | | | — | | | | (20,912,830 | ) |
| | | | |
Total distributions to shareholders | | | — | | | | (38,207,177 | ) |
| | | | |
Capital share transactions: | | | | | | | | |
Net proceeds from sale of shares | | | 18,114,034 | | | | 37,509,654 | |
Net asset value of shares issued in connection with the acquisition of MainStay VP Epoch U.S. Small Cap Portfolio | | | 419,053,712 | | | | — | |
Net asset value of shares issued to shareholders in reinvestment of distributions | | | — | | | | 38,207,177 | |
Cost of shares redeemed | | | (108,344,445 | ) | | | (91,697,172 | ) |
| | | | |
Increase (decrease) in net assets derived from capital share transactions | | | 328,823,301 | | | | (15,980,341 | ) |
| | | | |
Net increase (decrease) in net assets | | | 345,855,528 | | | | (96,313,650 | ) |
| | |
| Net Assets | | | | | | | | |
Beginning of period | | | 260,822,158 | | | | 357,135,808 | |
| | | | |
End of period | | $ | 606,677,686 | | | $ | 260,822,158 | |
| | | | |
| | | | |
| 20 | | MainStay VP MacKay Small Cap Core Portfolio | | The notes to the financial statements are an integral part of,
and should be read in conjunction with, the financial statements. |
Financial Highlightsselected per share data and ratios
| | | | | | | | | | | | | | | | | | | | |
| | | | |
| | | Six months
ended
June 30, | | | | | | Year ended December 31, | | | May 2,
2016**
through
December 31, | |
| | | | | |
| Initial Class | | 2019* | | | | | | 2018 | | | 2017 | | | 2016 | |
| | | | | |
Net asset value at beginning of period | | $ | 9.82 | | | | | | | $ | 13.16 | | | $ | 11.73 | | | $ | 10.00 | |
| | | | | | | | | | | | | | | | | | | | |
| | | | | |
Net investment income (loss) (a) | | | 0.04 | | | | | | | | 0.04 | | | | 0.01 | | | | 0.03 | |
| | | | | |
Net realized and unrealized gain (loss) on investments | | | 1.12 | | | | | | | | (1.71 | ) | | | 1.63 | | | | 1.88 | |
| | | | | | | | | | | | | | | | | | | | |
| | | | | |
Total from investment operations | | | 1.16 | | | | | | | | (1.67 | ) | | | 1.64 | | | | 1.91 | |
| | | | | | | | | | | | | | | | | | | | |
| | | | | |
| Less dividends and distributions: | | | | | | | | | | | | | | | | | | | | |
| | | | | |
From net investment income | | | — | | | | | | | | — | | | | — | | | | (0.02 | ) |
| | | | | |
From net realized gain on investments | | | — | | | | | | | | (1.67 | ) | | | (0.21 | ) | | | (0.16 | ) |
| | | | | | | | | | | | | | | | | | | | |
| | | | | |
Total dividends and distributions | | | — | | | | | | | | (1.67 | ) | | | (0.21 | ) | | | (0.18 | ) |
| | | | | | | | | | | | | | | | | | | | |
| | | | | |
Net asset value at end of period | | $ | 10.98 | | | | | | | $ | 9.82 | | | $ | 13.16 | | | $ | 11.73 | |
| | | | | | | | | | | | | | | | | | | | |
| | | | | |
Total investment return (b) | | | 11.81 | %(c) | | | | | | | (15.11 | %) | | | 13.93 | % | | | 19.14 | % |
| | | | | |
| Ratios (to average net assets)/Supplemental Data: | | | | | | | | | | | | | | | | | | | | |
| | | | | |
Net investment income (loss) | | | 0.78 | %†† | | | | | | | 0.33 | % | | | 0.10 | % | | | 0.39 | %†† |
| | | | | |
Net expenses (d) | | | 0.85 | %†† | | | | | | | 0.90 | % | | | 0.90 | % | | | 1.00 | %†† |
| | | | | |
Expenses (before waiver/reimbursement) (d) | | | 0.86 | %†† | | | | | | | 0.90 | % | | | 0.90 | % | | | 1.00 | %†† |
| | | | | |
Portfolio turnover rate | | | 188 | % | | | | | | | 161 | % | | | 159 | % | | | 180 | % |
| | | | | |
Net assets at end of period (in 000’s) | | $ | 282,444 | | | | | | | $ | 123,857 | | | $ | 180,840 | | | $ | 164,253 | |
| (a) | Per share data based on average shares outstanding during the period. |
| (b) | Total return does not reflect any deduction of sales charges, mortality and expense charges, contract charges or administrative charges. For periods of less than one year, total return is not annualized. |
| (c) | Total investment return may reflect adjustments to conform to generally accepted accounting principles. |
| (d) | In addition to the fees and expenses which the Portfolio bears directly, it also indirectly bears a pro-rata share of the fees and expenses of the underlying funds in which it invests. Such indirect expenses are not included in the above expense ratios. |
| | | | | | | | | | | | | | | | | | | | |
| | | | |
| | | Six months
ended
June 30, | | | | | | Year ended December 31, | | | May 2,
2016**
through
December 31, | |
| | | | | |
| Service Class | | 2019* | | | | | | 2018 | | | 2017 | | | 2016 | |
| | | | | |
Net asset value at beginning of period | | $ | 9.76 | | | | | | | $ | 13.11 | | | $ | 11.72 | | | $ | 10.00 | |
| | | | | | | | | | | | | | | | | | | | |
| | | | | |
Net investment income (loss) (a) | | | 0.03 | | | | | | | | 0.01 | | | | (0.02 | ) | | | 0.01 | |
| | | | | |
Net realized and unrealized gain (loss) on investments | | | 1.10 | | | | | | | | (1.69 | ) | | | 1.62 | | | | 1.88 | |
| | | | | | | | | | | | | | | | | | | | |
| | | | | |
Total from investment operations | | | 1.13 | | | | | | | | (1.68 | ) | | | 1.60 | | | | 1.89 | |
| | | | | | | | | | | | | | | | | | | | |
| | | | | |
| Less dividends and distributions: | | | | | | | | | | | | | | | | | | | | |
| | | | | |
From net investment income | | | — | | | | | | | | — | | | | — | | | | (0.01 | ) |
| | | | | |
From net realized gain on investments | | | — | | | | | | | | (1.67 | ) | | | (0.21 | ) | | | (0.16 | ) |
| | | | | | | | | | | | | | | | | | | | |
| | | | | |
Total dividends and distributions | | | — | | | | | | | | (1.67 | ) | | | (0.21 | ) | | | (0.17 | ) |
| | | | | | | | | | | | | | | | | | | | |
| | | | | |
Net asset value at end of period | | $ | 10.89 | | | | | | | $ | 9.76 | | | $ | 13.11 | | | $ | 11.72 | |
| | | | | | | | | | | | | | | | | | | | |
| | | | | |
Total investment return (b) | | | 11.58 | %(c) | | | | | | | (15.32 | %) | | | 13.64 | % | | | 18.95 | % |
| | | | | |
| Ratios (to average net assets)/Supplemental Data: | | | | | | | | | | | | | | | | | | | | |
| | | | | |
Net investment income (loss) | | | 0.50 | %†† | | | | | | | 0.09 | % | | | (0.15 | %) | | | 0.16 | %†† |
| | | | | |
Net expenses (d) | | | 1.10 | %†† | | | | | | | 1.15 | % | | | 1.15 | % | | | 1.25 | %†† |
| | | | | |
Expenses (before waiver/reimbursement) (d) | | | 1.11 | %†† | | | | | | | 1.15 | % | | | 1.15 | % | | | 1.25 | %†† |
| | | | | |
Portfolio turnover rate | | | 188 | % | | | | | | | 161 | % | | | 159 | % | | | 180 | % |
| | | | | |
Net assets at end of period (in 000’s) | | $ | 324,234 | | | | | | | $ | 136,965 | | | $ | 176,295 | | | $ | 175,015 | |
| (a) | Per share data based on average shares outstanding during the period. |
| (b) | Total return does not reflect any deduction of sales charges, mortality and expense charges, contract charges or administrative charges. For periods of less than one year, total return is not annualized. |
| (c) | Total investment return may reflect adjustments to conform to generally accepted accounting principles. |
| (d) | In addition to the fees and expenses which the Portfolio bears directly, it also indirectly bears a pro-rata share of the fees and expenses of the underlying funds in which it invests. Such indirect expenses are not included in the above expense ratios. |
| | | | | | |
The notes to the financial statements are an integral part of,
and should be read in conjunction with, the financial statements. | | | | | 21 | |
Notes to Financial Statements(Unaudited)
Note 1–Organization and Business
MainStay VP Funds Trust (the “Fund”) was organized as a Delaware statutory trust on February 1, 2011. The Fund is registered under the Investment Company Act of 1940, as amended (the “1940 Act”), as an open-end management investment company. The Fund is comprised of thirty-one separate series (collectively referred to as the “Portfolios”). These financial statements and notes relate to the MainStay VP MacKay Small Cap Core Portfolio (the “Portfolio”), a “diversified” portfolio, as that term is defined in the 1940 Act, as interpreted or modified by regulatory authorities having jurisdiction, from time to time.
Effective at the close of business on April 30, 2019, the Portfolio acquired the assets and liabilities of MainStay VP Epoch U.S. Small Cap Portfolio (the “Reorganization”), which was a separate series of the Fund (the “VP Epoch U.S. Small Cap Portfolio”). The Reorganization was approved by the Fund’s Board of Trustees (the “Board”) and shareholders pursuant to an Agreement and Plan of Reorganization (the “Reorganization Agreement”). See Note 10 for additional information.
Shares of the Portfolio are currently offered to certain separate accounts to fund variable annuity policies and variable universal life insurance policies issued by New York Life Insurance and Annuity Corporation (“NYLIAC”), awholly-owned subsidiary of New York Life Insurance Company (“New York Life”) and may also be offered to fund variable annuity policies and variable universal life insurance policies issued by other insurance companies. NYLIAC allocates shares of the Portfolios to, among others, certain NYLIAC separate accounts. Shares of the Portfolio are also offered to the MainStay VP Conservative Allocation Portfolio, MainStay VP Moderate Allocation Portfolio, MainStay VP Moderate Growth Allocation Portfolio and MainStay VP Growth Allocation Portfolio, which operate as “funds-of-funds.”
The Portfolio currently offers two classes of shares. Initial Class and Service Class shares commenced operations on May 2, 2016. Shares of the Portfolio are offered and are redeemed at a price equal to their respective net asset value (“NAV”) per share. No sales or redemption charge is applicable to the purchase or redemption of the Portfolio’s shares. Under the terms of the Fund’s multiple class plan adopted pursuant to Rule 18f-3 under the 1940 Act, the classes differ in that, pursuant to a plan adopted in accordance with Rule 12b-1 under the 1940 Act, Service Class shares of the Portfolio pay a combined distribution and service fee of 0.25% of average daily net assets to the Distributor (as defined below) of their shares.
The Portfolio’s investment objective is to seeklong-term growth of capital.
Note 2–Significant Accounting Policies
The Portfolio is an investment company and accordingly follows the investment company accounting and reporting guidance of the Financial Accounting Standards Board (“FASB”) Accounting Standard CodificationTopic 946 Financial Services—Investment Companies. The Portfolio prepares its financial statements in accordance with generally accepted accounting principles (“GAAP”) in the United States of America and follows the significant accounting policies described below.
(A) Securities Valuation. Investments are usually valued as of the close of regular trading on the New York Stock Exchange (the “Exchange”)
(usually 4:00 p.m. Eastern time) on each day the Portfolio is open for business (“valuation date”).
The Board of Trustees of the Fund (the “Board”) adopted procedures establishing methodologies for the valuation of the Portfolio’s securities and other assets and delegated the responsibility for valuation determinations under those procedures to the Valuation Committee of the Fund (the “Valuation Committee”). The Board authorized the Valuation Committee to appoint a Valuation Subcommittee (the “Subcommittee”) to deal in the first instance with establishing the prices of securities for which market quotations are not readily available or the prices of which are not otherwise readily determinable under these procedures. The Subcommittee meets (in person, via electronic mail or via teleconference) on an as-needed basis. Subsequently, the Valuation Committee meets to ensure that actions taken by the Subcommittee were appropriate. The procedures state that, subject to the oversight of the Board and unless otherwise noted, the responsibility for theday-to-day valuation of portfolio assets (including fair value measurements for the Portfolio’s assets and liabilities) rests with New York Life Investment Management LLC (“New York Life Investments” or the “Manager”), aided to whatever extent necessary by the Subadvisor (as defined in Note 3(A)).
To assess the appropriateness of security valuations, the Manager, the Subadvisor or the Portfolio’s third-party service provider, who is subject to oversight by the Manager, regularly compares prior day prices, prices on comparable securities and the sale prices to the prior and current day prices and challenges prices with changes exceeding certain tolerance levels with third-party pricing services or broker sources. For those securities valued through either a standardized fair valuation methodology or a fair valuation measurement, the Subcommittee deals in the first instance with such valuation and the Valuation Committee reviews and affirms, if appropriate, the reasonableness of the valuation based on such methodologies and measurements on a regular basis after considering information that is reasonably available and deemed relevant by the Valuation Committee. Any action taken by the Subcommittee with respect to the valuation of a portfolio security or other asset is submitted for review and ratification (if appropriate) to the Valuation Committee and the Board at the next regularly scheduled meeting.
“Fair value” is defined as the price the Portfolio would reasonably expect to receive upon selling an asset or liability in an orderly transaction to an independent buyer in the principal or most advantageous market for the asset or liability. Fair value measurements are determined within a framework that establishes a three-tier hierarchy which maximizes the use of observable market data and minimizes the use of unobservable inputs to establish a classification of fair value measurements for disclosure purposes. “Inputs” refer broadly to the assumptions that market participants would use in pricing the asset or liability, including assumptions about risk, such as the risk inherent in a particular valuation technique used to measure fair value using a pricing model and/or the risk inherent in the inputs for the valuation technique. Inputs may be observable or unobservable. Observable inputs reflect the assumptions market participants would use in pricing the asset or liability based on market data obtained from sources independent of the Portfolio. Unobservable inputs reflect the Portfolio’s own assumptions about the assumptions market participants would use in pricing the asset or liability based on the information available. The inputs or methodology used for valuing assets or liabilities may not be an indication of the risks
| | |
| 22 | | MainStay VP MacKay Small Cap Core Portfolio |
associated with investing in those assets or liabilities. The three-tier hierarchy of inputs is summarized below.
| • | | Level 1—quoted prices in active markets for an identical asset or liability |
| • | | Level 2—other significant observable inputs (including quoted prices for a similar asset or liability in active markets, interest rates and yield curves, prepayment speeds, credit risk, etc.) |
| • | | Level 3—significant unobservable inputs (including the Portfolio’s own assumptions about the assumptions that market participants would use in measuring fair value of an asset or liability) |
The level of an asset or liability within the fair value hierarchy is based on the lowest level of an input, both individually and in the aggregate, that is significant to the fair value measurement. As of June 30, 2019, the aggregate value by input level of the Portfolio’s assets and liabilities is included at the end of the Portfolio’s Portfolio of Investments.
The Portfolio may use third-party vendor evaluations, whose prices may be derived from one or more of the following standard inputs, among others:
| | |
• Broker/dealer quotes | | • Benchmark securities |
• Two-sided markets | | • Reference data (corporate actions or material event notices) |
• Bids/offers | | • Monthly payment information |
• Industry and economic events | | • Reported trades |
An asset or liability for which market values cannot be measured using the methodologies described above is valued by methods deemed reasonable in good faith by the Valuation Committee, following the procedures established by the Board, to represent fair value. Under these procedures, the Portfolio generally uses a market-based approach which may use related or comparable assets or liabilities, recent transactions, market multiples, book values and other relevant information. The Portfolio may also use an income-based valuation approach in which the anticipated future cash flows of the asset or liability are discounted to calculate fair value. Discounts may also be applied due to the nature and/or duration of any restrictions on the disposition of the asset or liability. Fair value represents a good faith approximation of the value of a security. Fair value determinations involve the consideration of a number of subjective factors, an analysis of applicable facts and circumstances and the exercise of judgment. As a result, it is possible that the fair value for a security determined in good faith in accordance with the Portfolio’s valuation procedures may differ from valuations for the same security determined by other funds using their own valuation procedures. Although the Portfolio’s valuation procedures are designed to value a security at the price the Portfolio may reasonably expect to receive upon the security’s sale in an orderly transaction, there can be no assurance that any fair value determination thereunder would, in fact, approximate the amount that the Portfolio would actually realize upon the sale of the security or the price at which the security would trade if a reliable market price were readily available. During the six-month period ended June 30, 2019, there were no material changes to the fair value methodologies.
Securities which may be valued in this manner include, but are not limited to: (i) a security for which trading has been halted or suspended; (ii) a debt security that has recently gone into default and for which there is not a current market quotation; (iii) a security of an issuer that has entered into a restructuring; (iv) a security that has been delisted from a national
exchange; (v) a security for which the market price is not readily available from a third-party pricing source or, if so provided, does not, in the opinion of the Manager or the Subadvisor, reflect the security’s market value; (vi) a security subject to trading collars for which no or limited trading takes place; and (vii) a security whose principal market has been temporarily closed at a time when, under normal conditions, it would be open. Securities valued in this manner are generally categorized as Level 3 in the hierarchy. As of June 30, 2019, there were no securities held by the Portfolio that were fair valued in such a manner.
Equity securities and Exchange-Traded Funds (“ETFs”) are valued at the last quoted sales prices as of the close of regular trading on the relevant exchange on each valuation date. Securities that are not traded on the valuation date are valued at the mean of the last quoted bid and ask prices. Prices are normally taken from the principal market in which each security trades. These securities are generally categorized as Level 1 in the hierarchy.
Investments in mutual funds, including money market funds, are valued at their respective NAVs as of the close of the Exchange on the valuation date. These securities are generally categorized as Level 1 in the hierarchy.
Temporary cash investments acquired in excess of 60 days to maturity at the time of purchase are valued using the latest bid prices or using valuations based on a matrix system (which considers such factors as security prices, yields, maturities and ratings), both as furnished by independent pricing services. Other temporary cash investments which mature in 60 days or less at the time of purchase (“Short-Term Investments”) are valued using the amortized cost method of valuation, unless the use of such method would be inappropriate. The amortized cost method involves valuing a security at its cost on the date of purchase and thereafter assuming a constant amortization to maturity of the difference between such cost and the value on maturity date. Amortized cost approximates the current fair value of a security. Securities valued using the amortized cost method are not valued using quoted prices in an active market and are generally categorized as Level 2 in the hierarchy.
The information above is not intended to reflect an exhaustive list of the methodologies that may be used to value portfolio investments. The valuation procedures permit the use of a variety of valuation methodologies in connection with valuing portfolio investments. The methodology used for a specific type of investment may vary based on the market data available or other considerations. The methodologies summarized above may not represent the specific means by which portfolio investments are valued on any particular business day.
(B) Income Taxes. The Portfolio’s policy is to comply with the requirements of the Internal Revenue Code of 1986, as amended (the “Internal Revenue Code”), applicable to regulated investment companies and to distribute all of its taxable income to the shareholders of the Portfolio within the allowable time limits. Therefore, no federal, state and local income tax provisions are required.
Management evaluates the Portfolio’s tax positions to determine if the tax positions taken meet the minimum recognition threshold in connection with accounting for uncertainties in income tax positions taken or expected to be taken for the purposes of measuring and recognizing tax liabilities in the financial statements. Recognition of tax benefits of
Notes to Financial Statements(Unaudited) (continued)
an uncertain tax position is permitted only to the extent the position is “more likely than not” to be sustained assuming examination by taxing authorities. Management has analyzed the Portfolio’s tax positions taken on federal, state and local income tax returns for all open tax years (for up to three tax years) and has concluded that no provisions for federal, state and local income tax are required in the Portfolio’s financial statements. The Portfolio’s federal, state and local income tax and federal excise tax returns for tax years for which the applicable statutes of limitations have not expired are subject to examination by the Internal Revenue Service and state and local departments of revenue.
(C) Dividends and Distributions to Shareholders. Dividends and distributions are recorded on the ex-dividend date. The Portfolio intends to declare and pay dividends from net investment income and distributions from net realized capital and currency gains, if any, at least annually. Unless the shareholder elects otherwise, all dividends and distributions are reinvested in the same class of shares of the Portfolio, at NAV. Dividends and distributions to shareholders are determined in accordance with federal income tax regulations and may differ from determinations using GAAP.
(D) Security Transactions and Investment Income. The Portfolio records security transactions on the trade date. Realized gains and losses on security transactions are determined using the identified cost method. Dividend income is recognized on the ex-dividend date; net of any foreign tax withheld at the source, and interest income is accrued as earned using the effective interest rate method.
Investment income and realized and unrealized gains and losses on investments of the Portfolio are allocated pro rata to the separate classes of shares based upon their relative net assets on the date the income is earned or realized and unrealized gains and losses are incurred.
(E) Expenses. Expenses of the Fund are allocated to the individual Portfolios in proportion to the net assets of the respective Portfolios when the expenses are incurred, except where direct allocations of expenses can be made. Expenses (other than fees incurred under the distribution and service plans, further discussed in Note 3(B), which are charged directly to the Service Class shares) are allocated to separate classes of shares pro rata based upon their relative net assets on the date the expenses are incurred. The expenses borne by the Portfolio, including those of related parties to the Portfolio, are shown in the Statement of Operations.
Additionally, the Portfolio may invest in ETFs and mutual funds, which are subject to management fees and other fees that may cause the costs of investing in ETFs and mutual funds to be greater than the costs of owning the underlying securities directly. These indirect expenses of ETFs and mutual funds are not included in the amounts shown as expenses in the Portfolio’s Statement of Operations or in the expense ratios included in the Financial Highlights.
(F) Use of Estimates. In preparing financial statements in conformity with GAAP, management makes estimates and assumptions that affect the reported amounts and disclosures in the financial statements. Actual results could differ from those estimates.
(G) Repurchase Agreements. The Portfolio may enter into repurchase agreements (i.e., buy a security from another party with the agreement that it be sold back in the future) to earn income. The
Portfolio may enter into repurchase agreements only with counterparties, usually financial institutions, that are deemed by the Manager or the Subadvisor to be creditworthy, pursuant to guidelines established by the Board. During the term of any repurchase agreement, the Manager or the Subadvisor will continue to monitor the creditworthiness of the counterparty. Under the 1940 Act, repurchase agreements are considered to be collateralized loans by the Portfolio to the counterparty secured by the securities transferred to the Portfolio.
Repurchase agreements are subject to counterparty risk, meaning the Portfolio could lose money by the counterparty’s failure to perform under the terms of the agreement. The Portfolio mitigates this risk by ensuring the repurchase agreement is collateralized by cash, U.S. government securities, fixed income securities and/or other securities. The collateral is held by the Portfolio’s custodian and valued daily on a mark to market basis to determine if the value, including accrued interest, exceeds the repurchase price. In the event of the counterparty’s default on the obligation to repurchase, the Portfolio has the right to liquidate the collateral and apply the proceeds in satisfaction of the obligation. Under certain circumstances, such as in the event of default or bankruptcy by the counterparty, realization and/or retention of the collateral may be limited or subject to delay, to legal proceedings and possible realized loss to the Portfolio. As of June 30, 2019, the Portfolio did not hold any repurchase agreements.
(H) Securities Lending. In order to realize additional income, the Portfolio may engage in securities lending, subject to the limitations set forth in the 1940 Act and relevant guidance by the staff of the Securities and Exchange Commission (“SEC”). In the event the Portfolio does engage in securities lending, the Portfolio will lend through its custodian, State Street Bank and Trust Company (“State Street”), acting as securities lending agent on behalf of the Portfolio. State Street will manage the Portfolio’s collateral in accordance with the securities lending agency agreement between the Portfolio and State Street, and indemnify the Portfolio against counterparty risk. The loans will be collateralized by cash (which may be invested in a money market fund) and/ornon-cash collateral (which may include, U.S. Treasury securities and/or U.S. Government Agency securities issued or guaranteed by the United States government or its agencies or instrumentalities) at least equal at all times to the market value of the securities loaned. The Portfolio may bear the risk of delay in recovery of, or loss of rights in, the securities loaned should the borrower of the securities experience financial difficulty. The Portfolio may also record a realized gain or loss on securities deemed sold due to a borrower’s inability to return securities on loan. The Portfolio bears the risk of any loss on investment of cash collateral. The Portfolio will receive compensation for lending its securities in the form of fees or it will retain a portion of interest on the investment of any cash collateral. The Portfolio will also continue to receive interest and dividends on the securities loaned and any gain or loss in the market price of the securities loaned that may occur during the term of the loan will be for the account of the Portfolio. Income earned from securities lending activities, if any, is reflected in the Statement of Operations. As of June 30, 2019, the Portfolio had securities on loan with an aggregate market value of $20,738,556; the total market value of collateral held by the Portfolio was $21,764,114. The market value of the collateral held includednon-cash collateral in the form of U.S. Treasury securities with a value of $18,340,974 and cash collateral which was invested into the State Street Navigator Securities Lending Government Money Market Portfolio with a value of $3,423,140.
| | |
| 24 | | MainStay VP MacKay Small Cap Core Portfolio |
(I) Indemnifications. Under the Fund’s organizational documents, its officers and trustees are indemnified against certain liabilities that may arise out of performance of their duties to the Fund. Additionally, in the normal course of business, the Portfolio enters into contracts with third-party service providers that contain a variety of representations and warranties and which may provide general indemnifications. The Portfolio’s maximum exposure under these arrangements is unknown, as this would involve future claims that may be made against the Portfolio that have not yet occurred. Based on experience, management is of the view that the risk of loss in connection with these potential indemnification obligations is remote. However, there can be no assurance that material liabilities related to such obligations will not arise in the future, which could adversely impact the Portfolio.
Note 3–Fees and Related Party Transactions
(A) Manager and Subadvisor. New York Life Investments, a registered investment adviser and an indirect,wholly-owned subsidiary of New York Life, serves as the Portfolio’s Manager pursuant to an Amended and Restated Management Agreement (“Management Agreement”). The Manager provides offices, conducts clerical, recordkeeping and bookkeeping services, and keeps most of the financial and accounting records required to be maintained by the Portfolio. Except for the portion of salaries and expenses that are the responsibility of the Portfolio, the Manager pays the salaries and expenses of all personnel affiliated with the Portfolio and certain operational expenses of the Portfolio. The Portfolio reimburses New York Life Investments in an amount equal to a portion of the compensation of the Chief Compliance Officer attributable to the Portfolio. MacKay Shields LLC (“MacKay Shields” or “Subadvisor”), a registered investment adviser and an indirect,wholly-owned subsidiary of New York Life, serves as Subadvisor to the Portfolio and is responsible for theday-to-day portfolio management of the Portfolio. Pursuant to the terms of an Amended and Restated Subadvisory Agreement (“Subadvisory Agreement”) between New York Life Investments and MacKay Shields, New York Life Investments pays for the services of the Subadvisor.
Effective May 1, 2019, the Fund, on behalf of the Portfolio, pays New York Life Investments in its capacity as the Portfolio’s investment manager and administrator, pursuant to the Management Agreement, a monthly fee for the services performed and the facilities furnished at an annual percentage of the Portfolio’s average daily net assets as follows: 0.80% up to $1 billion, 0.775% from $1 billion to $2 billion and 0.75% in excess of $2 billion. Prior to May 1, 2019, the Fund, on behalf of the Portfolio, paid New York Life Investments in its capacity as the portfolio’s investment manager and administrator, pursuant to the Management Agreement, a monthly fee for the services performed and the facilities furnished at an annual percentage of the Portfolio’s average daily net assets as follows: 0.85% up to $1 billion and 0.80% in excess of $1 billion.
Effective May 1, 2019, New York Life Investments has contractually agreed to waive fees and/or reimburse expenses so that the total annual
operating expenses (excluding taxes, interest, litigation, extraordinary expenses, brokerage and other transaction expenses relating to the purchase or sale of portfolio investments, and acquired (underlying) fund fees and expenses) of Initial Class shares do not exceed 0.80% of average daily net assets. New York Life Investments will apply an equivalent waiver or reimbursement to Service Class shares. This agreement will remain in effect until May 1, 2020, and shall renew automatically for one-year terms unless New York Life Investments provides written notice of termination prior to the start of the next term or upon approval of the Board. Prior to May 1, 2019, New York Life Investments had agreed to waive fees and/or reimburse expenses so that the total annual operating expenses (excluding taxes, interest, litigation, extraordinary expenses, brokerage and other transaction expenses relating to the purchase or sale of portfolio investments, and acquired (underlying) fund fees and expenses) did not exceed 1.00% for Initial Class and 1.25% for the Service Class shares. During the six-month period ended June 30, 2019, the effective management fee rate was 0.82%.
During the six-month period ended June 30, 2019, New York Life Investments earned fees from the Portfolio in the amount of $1,655,770, and paid the Subadvisor in the amount of $813,883.
State Street providessub-administration andsub-accounting services to the Portfolio pursuant to an agreement with New York Life Investments. These services include calculating the daily NAVs of the Portfolio, maintaining the general ledger andsub-ledger accounts for the calculation of the Portfolio’s NAVs and assisting New York Life Investments in conducting various aspects of the Portfolio’s administrative operations. For providing these services to the Portfolio, State Street is compensated by New York Life Investments.
Pursuant to an agreement between the Fund and New York Life Investments, New York Life Investments is responsible for providing or procuring certain regulatory reporting services for the Portfolio. The Portfolio will reimburse New York Life Investments for the actual costs incurred by New York Life Investments in connection with providing or procuring these services for the Portfolio.
(B) Distribution and Service Fees. The Fund, on behalf of the Portfolio, has entered into a distribution agreement with NYLIFE Distributors LLC (the “Distributor”), an indirect,wholly-owned subsidiary of New York Life. The Portfolio has adopted a distribution plan (the “Plan”) in accordance with the provisions of Rule 12b-1 under the 1940 Act. Under the Plan, the Distributor has agreed to provide, through its affiliates or independent third parties, various distribution-related, shareholder and administrative support services to the Service Class shareholders. For its services, the Distributor is entitled to a combined distribution and service fee accrued daily and paid monthly at an annual rate of 0.25% of the average daily net assets attributable to the Service Class shares of the Portfolio.
Notes to Financial Statements(Unaudited) (continued)
(C) Investments in Affiliates (in 000’s). During the six-month period ended June 30, 2019, purchases and sales transactions, income earned from investments and shares held of investment companies managed by New York Life Investments or its affiliates were as follows:
| | | | | | | | | | | | | | | | | | | | | | | | | | | | | | | | | | | | |
Affiliated Investment
Company | | Value,
Beginning of
Period | | | Purchases
at Cost | | | Proceeds
from
Sales | | | Net
Realized
Gain/ (Loss)
on Sales | | | Change in
Unrealized
Appreciation/
(Depreciation) | | | Value,
End of
Period | | | Dividend
Income | | | Other
Distributions | | | Shares
End of
Period | |
MainStay U.S. Government Liquidity Fund | | $ | 947 | | | $ | 38,480 | | | $ | (39,412 | ) | | $ | — | | | $ | — | | | $ | 15 | | | $ | 65 | | | $ | — | | | | 15 | |
Note 4–Federal Income Tax
As of June 30, 2019, the cost and unrealized appreciation (depreciation) of the Portfolio’s investment portfolio, including applicable derivative contracts and other financial instruments, as determined on a federal income tax basis, were as follows:
| | | | | | | | | | | | | | | | |
| | | Federal Tax
Cost | | | Gross
Unrealized
Appreciation | | | Gross
Unrealized
(Depreciation) | | | Net
Unrealized
Appreciation/
(Depreciation) | |
| | | | |
Investments in Securities | | $ | 611,114,431 | | | $ | 29,111,592 | | | $ | (30,325,669 | ) | | $ | (1,214,077 | ) |
During the year ended December 31, 2018, the tax character of distributions paid as reflected in the Statements of Changes in Net Assets was as follows:
| | | | | | |
|
| 2018 | |
Tax-Based
Distributions
from Ordinary
Income | | | Tax-Based
Distributions
from Long-Term
Gains | |
| |
| $ | 25,664,252 | | | $ | 12,542,925 | |
Note 5–Custodian
State Street is the custodian of cash and securities held by the Portfolio. Custodial fees are charged to the Portfolio based on the Portfolio’s net assets and/or the market value of securities held by the Portfolio and the number of certain transactions incurred by the Portfolio.
Note 6–Line of Credit
The Portfolio and certain other funds managed by New York Life Investments maintain a line of credit with a syndicate of banks in order to secure a source of funds for temporary purposes to meet unanticipated or excessive redemption requests.
Effective July 30, 2019, under the credit agreement (the “Credit Agreement”), the aggregate commitment amount is $600,000,000 with an additional uncommitted amount of $100,000,000. The commitment fee is an annual rate of 0.15% of the average commitment amount payable quarterly, regardless of usage, to State Street, who serves as the agent to the syndicate. The commitment fee is allocated among the Portfolio and certain other funds managed by New York Life Investments based upon their respective net assets and other factors. Interest on any revolving credit loan is charged based upon the Federal Funds Rate or the one-month London Interbank Offered Rate (“LIBOR”), whichever is higher. The Credit Agreement expires on July 28, 2020, although the
Portfolio, certain other funds managed by New York Life Investments and the syndicate of banks may renew the Credit Agreement for an additional year on the same or different terms. Prior to July 30, 2019, the aggregate commitment amount and the commitment fee were the same as those under the current Credit Agreement. During thesix-month period ended June 30, 2019, there were no borrowings made or outstanding with respect to the Portfolio under the Credit Agreement.
Note 7–Interfund Lending Program
Pursuant to an exemptive order issued by the SEC, the Portfolio, along with certain other funds managed by New York Life Investments, may participate in an interfund lending program. The interfund lending program provides an alternative credit facility that permits the Portfolio and certain other funds managed by New York Life Investments to lend or borrow money for temporary purposes directly to or from one another subject to the conditions of the exemptive order. During the six-month period ended June 30, 2019, there were no interfund loans made or outstanding with respect to the Portfolio.
Note 8–Purchases and Sales of Securities (in 000’s)
During the six-month period ended June 30, 2019, purchases and sales of securities, other thanshort-term securities, were $810,865 and $871,718, respectively.
Note 9–Capital Share Transactions
Transactions in capital shares for the six-month period ended June 30, 2019 and the year ended December 31, 2018, were as follows:
| | | | | | | | |
Initial Class | | Shares | | | Amount | |
| | |
Six-month period ended June 30, 2019: | | | | | | | | |
Shares sold | | | 795,809 | | | $ | 8,858,938 | |
Shares issued in connection with the acquisition of MainStay VP Epoch U.S. Small Cap Portfolio | | | 20,218,171 | | | | 228,363,711 | |
Shares redeemed | | | (7,891,149 | ) | | | (84,908,810 | ) |
| | | | |
Net increase (decrease) | | | 13,122,831 | | | $ | 152,313,839 | |
| | | | |
Year ended December 31, 2018: | | | | | | | | |
Shares sold | | | 1,361,385 | | | $ | 15,183,089 | |
Shares issued to shareholders in reinvestment of dividends and distributions | | | 1,419,572 | | | | 17,294,347 | |
Shares redeemed | | | (3,919,446 | ) | | | (54,438,077 | ) |
| | | | |
Net increase (decrease) | | | (1,138,489 | ) | | $ | (21,960,641 | ) |
| | | | |
| | |
| | | | | | | | |
| | |
| 26 | | MainStay VP MacKay Small Cap Core Portfolio |
| | | | | | | | |
Service Class | | Shares | | | Amount | |
Six-month period ended June 30, 2019: | | | | | | | | |
Shares sold | | | 869,543 | | | $ | 9,255,096 | |
Shares issued in connection with the acquisition of MainStay VP Epoch U.S. Small Cap Portfolio | | | 17,008,219 | | | | 190,690,001 | |
Shares redeemed | | | (2,142,680 | ) | | | (23,435,635 | ) |
| | | | |
Net increase (decrease) | | | 15,735,082 | | | $ | 176,509,462 | |
| | | | |
Year ended December 31, 2018: | | | | | | | | |
Shares sold | | | 1,737,457 | | | $ | 22,326,565 | |
Shares issued to shareholders in reinvestment of dividends and distributions | | | 1,726,885 | | | | 20,912,830 | |
Shares redeemed | | | (2,876,092 | ) | | | (37,259,095 | ) |
| | | | |
Net increase (decrease) | | | 588,250 | | | $ | 5,980,300 | |
| | | | |
Note 10–Fund Acquisitions
At a meeting held on December 10-12, 2018, the Board approved the Reorganization providing for the acquisition of the assets and liabilities of the VP Epoch U.S. Small Cap Portfolio in exchange for shares of the Portfolio, followed by the complete liquidation of the VP Epoch U.S. Small Cap Portfolio. The Reorganization was completed on April 30, 2019. The aggregate net assets of the Portfolio immediately before the acquisition were $285,816,327 and the combined net assets after the acquisition were $704,870,039.
The chart below shows a summary of net assets, shares outstanding, net asset value per share outstanding, net unrealized appreciation/(depreciation), undistributed net investment income and accumulated net realized gains/(losses), before and after the Reorganization:
| | | | | | | | | | | | |
| | |
| | | Before
Reorganization | | | After
Reorganization | |
| | | MainStay VP
Epoch U.S.
Small Cap
Portfolio | | | MainStay VP
MacKay
Small Cap
Core Portfolio | | | MainStay VP
MacKay Small
Cap Core
Portfolio | |
| | | |
Net Assets: | | | | | | | | | | | | |
Initial Class | | | 228,363,711 | | | | 131,840,813 | | | | 360,204,524 | |
Service Class | | | 190,690,001 | | | | 153,975,514 | | | | 344,665,515 | |
| | | |
Shares Outstanding: | | | | | | | | | | | | |
Initial Class | | | 22,566,613 | | | | 11,672,520 | | | | 31,890,691 | |
Service Class | | | 19,839,864 | | | | 13,733,544 | | | | 30,741,763 | |
| | | |
Net Asset Value Per Share Outstanding: | | | | | | | | | | | | |
Initial Class | | $ | 10.12 | | | $ | 11.29 | | | $ | 11.29 | |
Service Class | | $ | 9.61 | | | $ | 11.21 | | | $ | 11.21 | |
Net unrealized appreciation/(depreciation) | | | 10,860,166 | | | | 6,882,132 | | | | 17,742,298 | |
Undistributed net investment income/(loss) | | | 635,199 | | | | 1,196,562 | | | | 1,196,562 | |
| | | |
Accumulated net realized gain/(loss) | | | (6,560,471 | ) | | | 25,292,445 | | | | 25,292,445 | |
Assuming the acquisition of VP Epoch U.S. Small Cap Portfolio had been completed on January 1, 2019, the beginning of the annual reporting period of the Portfolio, the Portfolio’s pro forma results of operations for the six-month period ended June 30, 2019, are as follows:
| | | | |
Net investment income (loss) | | $ | 2,868,164 | |
Net realized and unrealized gain (loss) | | $ | 21,036,073 | |
Net change in net assets resulting from operations | | $ | 23,904,237 | |
Because the combined investment portfolios have been managed as a single integrated portfolio since the acquisition was completed, it is not practicable to separate the amounts of revenue and earnings of the VP Epoch U.S. Small Cap Portfolio that have been included in the Portfolio’s Statement of Operations since April 30, 2019.
For financial reporting purposes, assets received and shares issued by the Portfolio were recorded at fair value; however, the cost basis of the investments received from VP MacKay Small Cap Core Portfolio, in the amount of $380,223,029 was carried forward to align ongoing reporting of the Portfolio’s realized and unrealized gains and losses with amounts distributable to shareholders for tax purposes.
Note 11–Recent Accounting Pronouncement
To improve the effectiveness of fair value disclosure requirements, the Financial Accounting Standards Board recently issued Accounting Standard Update (ASU)2018-13, Fair Value Measurement Disclosure Framework—Changes to the Disclosure Requirements for Fair Value Measurement (ASU2018-13), which adds, removes, and modifies certain aspects relating to fair value disclosure. ASU2018-13 is effective for interim and annual reporting periods beginning after December 15, 2019; early adoption of the additions relating toASU 2018-13 is not required. Management has evaluated the implications of certain other provisions of the ASU and has determined to early adopt aspects related to the removal and modifications of certain fair value measurement disclosures under the ASU effective immediately. At this time, management is evaluating the implications of certain other provisions of the ASU related to new disclosure requirements and any impact on the financial statement disclosures has not yet been determined.
Note 12–Subsequent Events
In connection with the preparation of the financial statements of the Portfolio as of and for the six-month period ended June 30, 2019, events and transactions subsequent to June 30, 2019, through the date the financial statements were issued have been evaluated by the Portfolio’s management for possible adjustment and/or disclosure.
No subsequent events requiring financial statement adjustment or disclosure have been identified.
Proxy Voting Policies and Procedures and Proxy Voting Record
A description of the policies and procedures that New York Life Investments uses to vote proxies related to the Portfolio’s securities is available without charge, upon request, (i) by calling800-598-2019; (ii) by visiting New York Life Investments website at https://www.nylinvestments.com/mainstay/products-and-performance/mainstay-vp-funds-trust; or (iii) by visiting the SEC’s website atwww.sec.gov.
The Portfolio is required to file with the SEC its proxy voting record for the12-month period ending June 30 on Form N-PX. The Portfolio’s most recent Form N-PX or proxy voting record is available free of charge upon request (i) by calling800-598-2019; (ii) by visiting New York Life Investments website at https://www.nylinvestments.com/mainstay/products-and-performance/mainstay-vp-funds-trust; or (iii) by visiting the SEC’s website atwww.sec.gov.
Shareholder Reports and Quarterly Portfolio Disclosure
The Portfolio is required to file its complete schedule of portfolio holdings with the SEC 60 days after each fiscal quarter onForm N-PORT. The Portfolio’s holdings report is available without charge upon request, (i) by calling800-598-2019; (ii) by visiting New York Life Investments website at https://www.nylinvestments.com/mainstay/products-and-performance/mainstay-vp-funds-trust; or (iii) on the SEC’s website atwww.sec.gov.
| | |
| 28 | | MainStay VP MacKay Small Cap Core Portfolio |
MainStay VP Portfolios
MainStay VP offers a wide range of Portfolios. The full array of MainStay VP offerings is listed here, with information about the manager, subadvisors, legal counsel, and independent registered public accounting firm.
Equity Portfolios
MainStay VP Eagle Small Cap Growth Portfolio
MainStay VP Emerging Markets Equity Portfolio
MainStay VP Epoch U.S. Equity Yield Portfolio
MainStay VP Fidelity Institutional AM® Utilities Portfolio†
MainStay VP Large Cap Growth Portfolio
MainStay VP MacKay Common Stock Portfolio
MainStay VP MacKay Growth Portfolio
MainStay VP MacKay International Equity Portfolio
MainStay VP MacKay Mid Cap Core Portfolio
MainStay VP MacKay S&P 500 Index Portfolio
MainStay VP MacKay Small Cap Core Portfolio
MainStay VP Mellon Natural Resources Portfolio
MainStay VP T. Rowe Price Equity Income Portfolio
Mixed Asset Portfolios
MainStay VP Balanced Portfolio
MainStay VP Income Builder Portfolio
MainStay VP Janus Henderson Balanced Portfolio
MainStay VP MacKay Convertible Portfolio
Income Portfolios
MainStay VP Bond Portfolio
MainStay VP Floating Rate Portfolio
MainStay VP Indexed Bond Portfolio
MainStay VP MacKay Government Portfolio
MainStay VP MacKay High Yield Corporate Bond Portfolio
MainStay VP MacKay Unconstrained Bond Portfolio
MainStay VP PIMCO Real Return Portfolio
Money Market
MainStay VP U.S. Government Money Market Portfolio
Alternative
MainStay VP Cushing Renaissance Advantage Portfolio
MainStay VP IQ Hedge Multi-Strategy Portfolio
Asset Allocation Portfolios
MainStay VP Conservative Allocation Portfolio
MainStay VP Growth Allocation Portfolio
MainStay VP Moderate Allocation Portfolio
MainStay VP Moderate Growth Allocation Portfolio
Manager
New York Life Investment Management LLC
New York, New York
Subadvisors
Candriam Belgium*
Brussels, Belgium
Cushing Asset Management, LP
Dallas, Texas
Eagle Asset Management, Inc.
St Petersburg, Florida
Epoch Investment Partners, Inc.
New York, New York
FIAM LLC
Smithfield, Rhode Island
IndexIQ Advisors LLC*
New York, New York
Janus Capital Management LLC
Denver, Colorado
MacKay Shields LLC*
New York, New York
Mellon Investments Corporation
Boston, Massachusetts
NYL Investors LLC*
New York, New York
Pacific Investment Management Company LLC
Newport Beach, California
T. Rowe Price Associates, Inc.
Baltimore, Maryland
Winslow Capital Management, LLC
Minneapolis, Minnesota
Distributor
NYLIFE Distributors LLC*
Jersey City, New Jersey
Custodian
State Street Bank and Trust Company
Boston, Massachusetts
Independent Registered Public Accounting Firm
PricewaterhouseCoopers LLP
New York, New York
Legal Counsel
Dechert LLP
Washington, District of Columbia
Some Portfolios may not be available in all products.
| † | Fidelity Institutional AM is a registered trade mark of FMR LLC. Used with permission. |
| * | An affiliate of New York Life Investment Management LLC |
Not part of the Semiannual Report
2019 Semiannual Report
This report is for the general information of New York Life Variable Annuities and NYLIAC Variable Universal Life Insurance Products policyowners. It must be preceded or accompanied by the appropriate product(s) and funds prospectuses if it is given to anyone who is not an owner of a New York Life variable annuity policy or a NYLIAC Variable Universal Life Insurance Product. This report does not offer for sale or solicit orders to purchase securities.
The performance data quoted in this report represents past performance. Past performance is no guarantee of future results. Due to market volatility and other factors, current performance may be lower or higher than the figures shown. The most recent month-end performance summary for your variable annuity or variable life policy is available by calling 800-598-2019 and is updated periodically on www.newyorklife.com.
The New York Life Variable Annuities and NYLIAC Variable Universal Life Insurance Products are issued by New York Life Insurance and Annuity Corporation (a Delaware Corporation) and distributed by NYLIFE Distributors LLC (Member FINRA/SIPC).
New York Life Insurance Company
New York Life Insurance and Annuity Corporation (NYLIAC) (A Delaware Corporation)
51 Madison Avenue, Room 551
New York, NY 10010
www.newyorklife.com
Printed on recycled paper
nylinvestments.com
NYLIFE Distributors LLC, 30 Hudson Street, Jersey City, NJ 07302
New York Life Investment Management LLC is the investment manager to the MainStay VP Funds Trust
©2019 by NYLIFE Distributors LLC. All rights reserved.
You may obtain copies of the Prospectus and the Statement of Additional Information free of charge, upon request, by callingtoll-free 800-598-2019 or writing to New York Life Insurance and Annuity Corporation, 51 Madison Avenue, New York, NY 10010.
| | | | |
| | | |
| Not FDIC Insured | | No Bank Guarantee | | May Lose Value |
| | | | |
| 1781641 | | | | MSVPSCC10-08/19 (NYLIAC) NI530 |
MainStay VP T. Rowe Price Equity Income Portfolio
Message from the President and Semiannual Report
Unaudited | June 30, 2019

Beginning on January 1, 2021, as permitted by regulations adopted by the Securities and Exchange Commission, paper copies of the MainStay VP Portfolio annual and semi-annual shareholder reports may no longer be sent by mail, unless you specifically request paper copies of the reports from the insurance company that offers your policy. Instead, the reports will be made available online, and you will be notified by mail each time a report is posted and provided with a website link to access the report. Instructions for requesting paper copies will be provided by your insurance company.
If you already elected to receive shareholder reports electronically, you will not be affected by this change and you need not take any action. At any time, you may elect to receive reports and other communications from the insurance company electronically by following the instructions provided by the insurance company.
You may elect to receive all future shareholder reports in paper form free of charge. You can inform the insurance company that you wish to receive paper copies of reports by following the instructions provided by the insurance company. Your election to receive reports in paper form will apply to all portfolio companies available under your contract.
| | | | | | | | |
| | | | | |
| Not FDIC/NCUA Insured | | Not a Deposit | | May Lose Value | | No Bank Guarantee | | Not Insured by Any Government Agency |

This page intentionally left blank
Message from the President
Most equity and fixed-income markets in the United States and around the world advanced in the face of conflicting political and macroeconomic forces during thesix-month period ended June 30, 2019.
The reporting period began on the heels of tumultuous December 2018, during which equities and equity-sensitive bonds spiked sharply lower on concerns regarding the pace of economic growth, a U.S. government shutdown and the potential impact of trade disputes between the United States and other nations, particularly China. Markets recovered quickly in early 2019 as trade tensions eased, the government reopened and the U.S. Federal Reserve Board (Fed) adopted a more patient tone regarding the future direction of interest rates. Markets moved broadly higher from January through April, supported by encouraging economic data and generally strong corporate earnings.
During the first four months of the reporting period, the improving economic environment encouraged investors to favor areas of the market viewed as offering greater return potential along with higher risks. Among U.S. stocks, cyclical, growth-oriented sectors tended to outperform more defensive, value-oriented sectors, whilelarge-cap stocks outperformed theirsmaller-cap counterparts. Within the S&P 500® Index, the information technology sector led the market’s advance, followed by communication services, consumer discretionary and consumer staples. Industrials, utilities, financials, materials, real estate and energy produced more modest gains. While some international equity markets outperformed or underperformed the U.S. market, on average international stocks mirrored the performance of their U.S. counterparts. Fixed-income securities gained ground as well, albeit along a more gradual trajectory. Among U.S. fixed-income instruments, corporate issues generally outperformed government bonds, with lower credit quality, higher yielding securities leading the sector’s advance. Long-term U.S. Treasury bond yields proved particularly weak, with
10-year yields dipping at times below3-month yields, reflecting investors’ continued concerns about domestic economic growth.
May 2019 saw a return of uncertainty and volatility. Trade discussions between the United States and China faltered, driving global equity prices lower. Government bond prices rose as investors sought safe havens. June brought yet anotherU-turn as equity prices climbed again after comments from the Fed raised hopes of an interest rate cut in response to weak economic data. Stock and bond prices rose, with U.S. equity markets ending the reporting period in record territory.
We are pleased to see renewed signs of strength in broad areas of the financial market. At the same time, we remained sharply focused on providing you, as a MainStay VP investor, with the experienced and disciplined fund management that we believe underpins an effective, long-term investment strategy. Whatever tomorrow’s investment environment brings, you can rely on our portfolio managers to pursue the objectives of their individual Portfolios as outlined in the prospectus with the energy and dedication you have come to expect.
The report that follows contains additional information on the market events, investment decisions and specific securities that shaped your VP Portfolio’s performance during the six months ended June 30, 2019. We encourage you to read the report carefully and use it to evaluate your Portfolio’s performance in light of your long-range financial plan.
Sincerely,

Kirk C. Lehneis
President
The opinions expressed are as of the date of this report and are subject to change. There is no guarantee that any forecast made will come to pass. This material does not constitute investment advice and is not intended as an endorsement of any specific investment. Past performance is no guarantee of future results.
Not part of the Semiannual Report
Table of Contents
Investors should refer to the Portfolio’s Summary Prospectus and/or Prospectus and consider the Portfolio’s investment objectives, strategies, risks, charges and expenses carefully before investing. The Summary Prospectus and/or Prospectus contain this and other information about the Portfolio. You may obtain copies of the Portfolio’s Summary Prospectus and/or the Prospectus and the Statement of Additional Information free of charge, upon request, by calling toll-free 800-598-2019, by writing to New York Life Insurance and Annuity Corporation, 51 Madison Avenue, Room 251, New York, New York 10010 or by sending an email to MainStayShareholdersServices@nylim.com. These documents are also available at nylinvestments.com/vpdocuments. Please read the Summary Prospectus and/or Prospectus carefully before investing. MainStay VP Funds Trust portfolios are separate account options which are purchased through a variable insurance or variable annuity contract.
Investment and Performance Comparison1(Unaudited)
Performance data quoted represents past performance. Past performance is no guarantee of future results. Because of market volatility and other factors, current performance may be lower or higher than the figures shown. Investment return and principal value will fluctuate, and as a result, when shares are redeemed, they may be worth more or less than their original cost. The performance table and graph do not reflect any deduction of sales charges, mortality and expense charges, contract charges or administrative charges. Please refer to the Performance Summary appropriate for your policy. For performance information current to the most recent month-end, please call800-598-2019 or visit www.newyorklife.com.
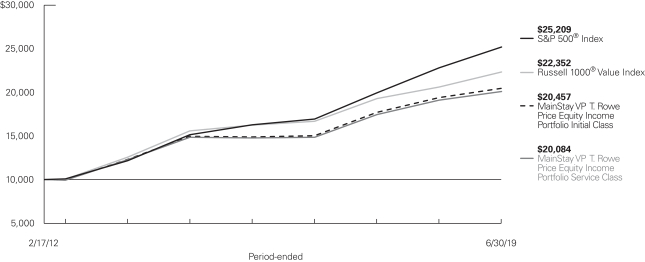
Average Annual Total Returns for the Period-Ended June 30, 2019
| | | | | | | | | | | | | | | | | | | | | | |
| Class | | Inception
Date | | Six Months | | | One Year | | | Five Years | | | Since
Inception | | | Gross
Expense
Ratio2 | |
| | | | | | |
| Initial Class Shares | | 2/17/2012 | | | 15.77 | % | | | 5.41 | % | | | 6.47 | % | | | 10.20 | % | | | 0.75 | % |
| Service Class Shares | | 2/17/2012 | | | 15.62 | | | | 5.15 | | | | 6.20 | | | | 9.92 | | | | 1.00 | |
| | | | | | | | | | | | | | | | |
| Benchmark Performance | | Six
Months | | | One
Year | | | Five
Years | | | Since
Inception | |
| | | | |
Russell 1000® Value Index3 | | | 16.24 | % | | | 8.46 | % | | | 7.46 | % | | | 11.54 | % |
S&P 500® Index4 | | | 18.54 | | | | 10.42 | | | | 10.71 | | | | 13.38 | |
Morningstar Large Value Category Average5 | | | 14.59 | | | | 5.79 | | | | 6.84 | | | | 10.19 | |
| 1. | Performance figures may reflect certain fee waivers and/or expense limitations, without which total returns may have been different. For information on current fee waivers and/or expense limitations (if any), please refer to the Notes to Financial Statements. |
| 2. | The gross expense ratios presented reflect the Portfolio’s “Total Annual Portfolio Operating Expenses” from the most recent Prospectus, as supplemented, and may differ from other expense ratios disclosed in this report. |
| 3. | The Russell 1000® Value Index is the Portfolio’s primary broad-based securities market index for comparison purposes. The Russell 1000® Value Index measures the performance of the large-cap value segment of the U.S. equity universe. It includes those Russell 1000® Index companies with lower price-to-book ratios and lower expected growth values. Results assume |
| | reinvestment of all dividends and capital gains. An investment cannot be made directly in an index. |
| 4. | The S&P 500® Index is the Portfolio’s secondary benchmark. “S&P 500®” is a trademark of the McGraw-Hill Companies, Inc. The S&P 500® Index is widely regarded as the standard index for measuringlarge-cap U.S. stock market performance. Results assume reinvestment of all dividends and capital gains. An investment cannot be made directly in an index. |
| 5. | The Morningstar Large Value Category Average is representative of funds that invest primarily in big U.S. companies that are less expensive or growing more slowly than other large-cap stocks. Results are based on average total returns of similar funds with all dividends and capital gain distributions reinvested. |
Cost in Dollars of a $1,000 Investment in MainStay VP T. Rowe Price Equity Income Portfolio (Unaudited)
The example below is intended to describe the fees and expenses borne by shareholders during the six-month period from January 1, 2019, to June 30, 2019, and the impact of those costs on your investment.
Example
As a shareholder of the Portfolio you incur two types of costs: (1) transaction costs, including exchange fees and sales charges (loads) on purchases (as applicable), and (2) ongoing costs, including management fees, distribution and/or service (12b-1) fees, and other Portfolio expenses (as applicable). This example is intended to help you understand your ongoing costs (in dollars) of investing in the Portfolio and to compare these costs with the ongoing costs of investing in other mutual funds. The example is based on an investment of $1,000 made at the beginning of the six-month period and held for the entire period from January 1, 2019, to June 30, 2019. Shares are only sold in connection with variable life and annuity contracts and the example does not reflect any contract level or transactional fees or expenses. If these costs had been included, your costs would have been higher.
This example illustrates your Portfolio’s ongoing costs in two ways:
Actual Expenses
The second and third data columns in the table below provide information about actual account values and actual expenses. You may use the information in these columns, together with the amount you invested, to estimate the expenses that you paid during the six months ended June 30, 2019. Simply divide your account value by $1,000
(for example, an $8,600 account value divided by $1,000 = 8.6), then multiply the result by the number under the heading entitled “Expenses Paid During Period” to estimate the expenses you paid on your account during this period.
Hypothetical Example for Comparison Purposes
The fourth and fifth data columns in the table below provide information about hypothetical account values and hypothetical expenses based on the Portfolio’s actual expense ratio and an assumed rate of return of 5% per year before expenses, which is not the Portfolio’s actual return. The hypothetical account values and expenses may not be used to estimate the actual ending account balances or expenses you paid for thesix-month period shown. You may use this information to compare the ongoing costs of investing in the Portfolio with the ongoing costs of investing in other mutual funds. To do so, compare this 5% hypothetical example with the 5% hypothetical examples that appear in the shareholder reports of the other mutual funds.
Please note that the expenses shown in the table are meant to highlight your ongoing costs only and do not reflect any transactional costs, such as exchange fees or sales charges (loads). Therefore, the fourth and fifth data columns of the table are useful in comparing ongoing costs only and will not help you determine the relative total costs of owning different funds. In addition, if these transactional costs were included, your costs would have been higher.
| | | | | | | | | | | | | | | | | | | | | | |
| | | | | | | | | | | | | | | | | | |
| Share Class | | Beginning
Account
Value
1/1/19 | | | Ending Account
Value (Based
on Actual
Returns and
Expenses)
6/30/19 | | | Expenses
Paid
During
Period1 | | | Ending Account
Value (Based
on Hypothetical
5% Annualized
Return and
Actual Expenses)
6/30/19 | | | Expenses
Paid
During
Period1 | | | Net Expense
Ratio
During
Period2 |
| | | | | | |
| Initial Class Shares | | $ | 1,000.00 | | | $ | 1,157.70 | | | $ | 4.01 | | | $ | 1,021.08 | | | $ | 3.76 | | | 0.75% |
| | | | | | |
| Service Class Shares | | $ | 1,000.00 | | | $ | 1,156.20 | | | $ | 5.35 | | | $ | 1,019.84 | | | $ | 5.01 | | | 1.00% |
| 1. | Expenses are equal to the Portfolio’s annualized expense ratio of each class multiplied by the average account value over the period, divided by 365 and multiplied by 181 (to reflect the six-month period). The table above represents the actual expenses incurred during the six-month period. In addition to the fees and expenses which the Portfolio bears directly, it also indirectly bears a pro rata share of the fees and expenses of the underlying funds in which it invests. Such indirect expenses are not included in the above-reported expense figures. |
| 2. | Expenses are equal to the Portfolio’s annualized expense ratio to reflect the six-month period. |
| | |
| 6 | | MainStay VP T. Rowe Price Equity Income Portfolio |
Industry Composition as of June 30, 2019(Unaudited)
| | | | |
| |
| Banks | | | 11.1 | % |
| |
| Oil, Gas & Consumable Fuels | | | 9.6 | |
| |
| Insurance | | | 7.4 | |
| |
| Pharmaceuticals | | | 6.4 | |
| |
| Electric Utilities | | | 4.9 | |
| |
| Capital Markets | | | 4.3 | |
| |
| Semiconductors & Semiconductor Equipment | | | 4.0 | |
| |
| Aerospace & Defense | | | 3.9 | |
| |
| Food Products | | | 3.4 | |
| |
| Chemicals | | | 3.2 | |
| |
| Diversified Telecommunication Services | | | 3.1 | |
| |
| Equity Real Estate Investment Trusts | | | 3.1 | |
| |
| Media | | | 3.0 | |
| |
| Health Care Equipment & Supplies | | | 2.9 | |
| |
| Health Care Providers & Services | | | 2.8 | |
| |
| Multi-Utilities | | | 2.7 | |
| |
| Software | | | 2.1 | |
| |
| Household Products | | | 1.7 | |
| |
| Communications Equipment | | | 1.5 | |
| |
| Airlines | | | 1.4 | |
| |
| Air Freight & Logistics | | | 1.3 | |
| |
| Building Products | | | 1.3 | |
| |
| Biotechnology | | | 1.2 | |
| |
| Industrial Conglomerates | | | 1.2 | |
| |
| Tobacco | | | 1.2 | |
| | | | |
| |
| Hotels, Restaurants & Leisure | | | 1.1 | % |
| |
| Food & Staples Retailing | | | 1.0 | |
| |
| Containers & Packaging | | | 0.9 | |
| |
| Professional Services | | | 0.8 | |
| |
| Electrical Equipment | | | 0.7 | |
| |
| Leisure Products | | | 0.6 | |
| |
| Machinery | | | 0.6 | |
| |
| Commercial Services & Supplies | | | 0.5 | |
| |
| Entertainment | | | 0.5 | |
| |
| IT Services | | | 0.5 | |
| |
| Multiline Retail | | | 0.4 | |
| |
| Specialty Retail | | | 0.4 | |
| |
| Beverages | | | 0.3 | |
| |
| Technology Hardware, Storage & Peripherals | | | 0.3 | |
| |
| Construction Materials | | | 0.2 | |
| |
| Electronic Equipment, Instruments & Components | | | 0.2 | |
| |
| Metals & Mining | | | 0.2 | |
| |
| Water Utilities | | | 0.2 | |
| |
| Diversified Financial Services | | | 0.1 | |
| |
| Personal Products | | | 0.1 | |
| |
| Auto Components | | | 0.0 | ‡ |
| |
| Short-Term Investments | | | 1.7 | |
| |
| Other Assets, Less Liabilities | | | –0.0 | ‡ |
| | | | |
| |
| | | 100.0 | % |
| | | | |
See Portfolio of Investments beginning on page 11 for specific holdings within these categories. The Portfolio’s holdings are subject to change.
| ‡ | Less than one-tenth of a percent. |
Top Ten Holdings or Issuers as of June 30, 2019(excludingshort-term investments) (Unaudited)
| 10. | Verizon Communications, Inc. |
Portfolio Management Discussion and Analysis(Unaudited)
Answers to the questions reflect the views of portfolio manager John D. Linehan, CFA, of T. Rowe Price Associates, Inc. (“T. Rowe”), the Portfolio’s Subadvisor.
How did MainStay VP T. Rowe Price Equity Income Portfolio perform relative to its benchmarks and peers during the six months ended June 30, 2019?
For the six months ended June 30, 2019, MainStay VP T. Rowe Price Equity Income Portfolio returned 15.77% for Initial Class shares and 15.62% for Service Class shares. Over the same period, both share classes underperformed the 16.24% return of the Russell 1000® Value Index, which is the Portfolio’s primary benchmark, and the 18.54% return of the S&P 500® Index, which is the Portfolio’s secondary benchmark. For the six months ended June 30, 2019, both share classes outperformed the 14.59% return of the Morningstar Large Value Category Average.1
What factors affected the Portfolio’s relative performance during the reporting period?
The Portfolio and the Russell 1000® Value Index both recorded double-digit gains during the reporting period. However, the Portfolio’s returns lagged the benchmark primarily as a result of sector allocation. An unfavorable underweight allocation to the information technology sector hampered relative returns. Stock selection, particularly in the information technology sector, had a slight positive impact on relative results.
Which sectors were the strongest positive contributors to the Portfolio’s relative performance, and which sectors were particularly weak?
Due primarily to favorable stock selections, the consumer staples sector made the strongest positive contribution to the Portfolio’s performance relative to the Russell 1000® Value Index, followed by information technology and energy. (Contributions take weightings and total returns into account.) Stock selection also determined the most significant detractors from the Portfolio’s relative performance, which included the health care, communications services and materials sectors.
During the reporting period, which individual stocks made the strongest positive contributions to the Portfolio’s absolute performance and which stocks detracted the most?
Semiconductor designer and manufacturer Qualcomm was one of the most substantial contributors to the Portfolio’s absolute performance during the reporting period. Shares surged in April 2019 after the company reached a multibillion-dollar settlement with Apple to resolve a legal battle surrounding royalties. Share price also benefited from the company’s strong balance sheet, hefty dividend yield, valuable assets and leading position as a supplier of 5G wireless components.
Food producer Tyson Foods was another strong contributor to the Portfolio’s absolute performance. Tyson reported strong
financial results from its beef, pork and prepared foods segments as it made strides in its transformation into a global, branded protein company. Performance also benefited from a decline in the pork supply due to African swine fever, which raised expectations for higher chicken prices.
Communications systems and equipment maker L3Harris Technologies, another strong contributor to the Portfolio’s absolute performance during the reporting period, generated solid sales growth in its core tactical radio business while benefiting from a lower corporate tax rate. Although we trimmed the Portfolio’s holdings after the share price rose, we continued to believe L3Harris Technologies was well positioned to capitalize on trends in U.S. military spending and were encouraged by potential synergies from the company’s recently completed merger.
Oil and gas exploration and production company Occidental Petroleum was among the most substantial detractors from the Portfolio’s relative performance during the reporting period. The stock traded lower as the firm pursued a debt-fueled takeover of Anadarko Petroleum. Although Occidental Petroleum offered a significant premium for the acquisition, we like the potential long-term synergies; in our opinion, the deal adds to the firm’s already-significant acreage in the Permian Basin. We also like the company’s rich dividend yield.
Health plan and services provider CVS Health suffered amid weakness in its pharmacy benefits management and long-term care businesses. Despite these challenges, we believe the company’s acquisition of Aetna could eventually yield longer-term benefits.
Shares in institutional asset management firm State Street declined due to disappointing growth in core servicing fees, driven by rising headcount and compensation costs. Revised guidance also pressured the stock; management indicated that an expected Federal Reserve interest rate hike would negatively impact the bank’s net interest income. Despite these challenges, we continued to like State Street for its attractive valuation, focus on managing expenses and attractive dividend yield.
The Portfolio’s holdings in Occidental Petroleum, CVS Health and State Street all generated negative absolute returns during the reporting period.
Did the Portfolio make any significant purchases or sales during the reporting period?
During the reporting period, the Portfolio initiated a position in shale driller Pioneer Natural Resources. The company had struggled amid poor operational performance and slowing capital productivity, allowing us to buy shares at compelling
| 1. | See page 5 for more information on benchmark and peer group returns. |
| | |
| 8 | | MainStay VP T. Rowe Price Equity Income Portfolio |
valuations. We like Pioneer Natural Resources’ strong asset base and believe the company could benefit from improved execution. We also believe Pioneer Natural Resources could receive takeover interest as larger oil companies look to build scale in North American shale developments.
The Portfolio also initiated a position in information technology services firm Cognizant Technology Solutions on weakness in the stock. Share prices dropped precipitously in April 2019 as the company experienced margin compression, driven by a slowdown in revenue growth within its financial services and health care segments. Longer term, we believe that Cognizant Technology Solutions remains well positioned to outgrow its industry peers. In our view, the company’s above-average dividend yield and the new CEO’s plan to rebuild the company reaffirm management’s focus on long-term value creation and improved accountability.
Merck, a global pharmaceutical company, benefited from strong sales growth and from outpacing competitors in the development of an immuno-oncology treatment for lung cancer. We sold part of the Portfolio’s position on strength during the reporting period. While we recognize the potential for heightened competition and stricter industrywide regulations, we continue to like Merck for its durable growth profile.
We also sold some of the Portfolio’s shares in global financial services company JPMorgan Chase on strength during the reporting period. We like the company’s market-leading core businesses and experienced management team, and, in our opinon, see value in the bank’s scale advantages, technology investments and product pipeline. However, the stock’s strong recent performance made valuations less attractive. Furthermore, we believe the market underappreciates the cyclicality of JPMorgan Chase’s earnings.
How did the Portfolio’s sector weightings change during the reporting period?
At the beginning of the reporting period, the Portfolio’s most substantially overweight positions relative to the Russell 1000® Value Index were industrials and financials. At the end of the same period, industrials and utilities were the most substantially overweight positions. The most substantial increases in relative weighting in the Portfolio during the reporting period were in consumer staples and energy.
The most substantially underweight positions relative to the benchmark at the beginning of the reporting period were consumer discretionary and real estate. At the end of the same period, consumer discretionary and real estate remained the most substantially underweight positions. During the reporting period, the most substantial decreases in relative weighting in the Portfolio occurred in communication services and materials.
The changes in the Portfolio’s sector weighting relative to the Russell 1000® Value Index in part reflect the reconstitution of the Index, which occurred in late June 2019, rather than solely investment decisions made within the Portfolio.
How was the Portfolio positioned at the end of the reporting period?
The Portfolio uses a diversified,bottom-up investment strategy with a long-term focus that has historically resulted in lower turnover relative to peers. Changes to our sector positioning result from our stock selection process.
As of June 30, 2019, the Portfolio held overweight positions relative to the Russell 1000® Value Index in the industrials, utilities and financials sectors.
We like several names in the industrials sector, where we invest in companies that reach many different end markets and have solid business models, an ability to generate strong cash flows or both.
The utilities sector contains several companies that deliver durable cash flows and higher dividend yields with relatively modest downside risk. We prefer to invest in a combination of regulated utilities and integrated utilities that offer stable cash flows from the regulated portion of their business and earnings growth potential from the deregulated portion.
We are relatively cautious on the financials sector, as we are concerned that lending margins will be compressed in a lower interest rate environment, and slowing global growth may heighten credit concerns. However, we continue to find the risk/reward profiles of select financial companies to be compelling, especially attractively valued names that we expect to be solid performers in most economic scenarios.
As of June 30, 2019, the Portfolio held underweighted positions in the consumer discretionary, real estate and health care sectors.
The consumer discretionary sector is composed of a diverse group of industries, including retailers, diversified consumer services, auto manufacturers, and hotel and restaurant operators. We are cautious on several industries within the sector that we believe are exposed to longer-term headwinds, such as the shift frombrick-and-mortar shopping toe-commerce.
The real estate sector currently plays a limited role in the Portfolio. Within the sector, we typically hold real estate investment trusts (REITs), which own and frequently operate many different types of income-producing real estate properties. We value the attractive dividend yields that REITs tend to provide.
We have a diversified view of the health care sector, considering the myriad challenges and opportunities health care companies
face, including potential drug pricing reform, single-payer health care proposals, mergers and acquisitions, and an aging U.S. population. Within the sector, our primary exposure is to the pharmaceuticals industry, where most fundamentally strong, dividend-paying companies are located.
The opinions expressed are those of the portfolio managers as of the date of this report and are subject to change. There is no guarantee that any forecasts will come to pass. This material does not constitute investment advice and is not intended as an endorsement of any specific investment.
Not all MainStay VP Portfolios and/or share classes are available under all policies.
| | |
| 10 | | MainStay VP T. Rowe Price Equity Income Portfolio |
Portfolio of InvestmentsJune 30, 2019 (Unaudited)
| | | | | | | | |
| | | Principal
Amount | | | Value | |
Long-Term Bonds 0.4%† Convertible Bonds 0.2% | |
Insurance 0.2% | |
AXA S.A.
7.25%, due 5/15/21 (a) | | $ | 1,495,000 | | | $ | 1,538,318 | |
| | | | | | | | |
Total Convertible Bonds
(Cost $1,495,246) | | | | | | | 1,538,318 | |
| | | | | | | | |
|
| Corporate Bonds 0.2% | |
Toys, Games & Hobbies 0.2% | |
Mattel, Inc.
6.75%, due 12/31/25 (a) | | | 1,426,000 | | | | 1,466,997 | |
| | | | | | | | |
Total Corporate Bonds
(Cost $1,387,174) | | | | | | | 1,466,997 | |
| | | | | | | | |
TotalLong-Term Bonds
(Cost $2,882,420) | | | | | | | 3,005,315 | |
| | | | | | | | |
| | |
| | | | | | | | |
| | |
| | | Shares | | | | |
| Common Stocks 95.3% | |
Aerospace & Defense 3.9% | |
Boeing Co. | | | 36,776 | | | | 13,386,832 | |
L3harris Technologies, Inc. | | | 69,966 | | | | 13,232,669 | |
Northrop Grumman Corp. | | | 2,100 | | | | 678,531 | |
United Technologies Corp. | | | 5,800 | | | | 755,160 | |
| | | | | | | | |
| | | | | | | 28,053,192 | |
| | | | | | | | |
Air Freight & Logistics 1.3% | |
United Parcel Service, Inc., Class B | | | 89,700 | | | | 9,263,319 | |
| | | | | | | | |
|
Airlines 1.4% | |
Alaska Air Group, Inc. | | | 84,556 | | | | 5,403,974 | |
Delta Air Lines, Inc. | | | 57,800 | | | | 3,280,150 | |
Southwest Airlines Co. | | | 35,100 | | | | 1,782,378 | |
| | | | | | | | |
| | | | | | | 10,466,502 | |
| | | | | | | | |
Auto Components 0.0%‡ | |
Adient PLC | | | 14,700 | | | | 356,769 | |
| | | | | | | | |
|
Banks 11.1% | |
Bank of America Corp. | | | 15,100 | | | | 437,900 | |
Citigroup, Inc. | | | 81,291 | | | | 5,692,809 | |
Fifth Third Bancorp | | | 351,800 | | | | 9,815,220 | |
JPMorgan Chase & Co. | | | 201,666 | | | | 22,546,259 | |
KeyCorp | | | 17,999 | | | | 319,482 | |
PNC Financial Services Group, Inc. | | | 56,833 | | | | 7,802,034 | |
U.S. Bancorp | | | 175,330 | | | | 9,187,292 | |
Wells Fargo & Co. | | | 529,857 | | | | 25,072,833 | |
| | | | | | | | |
| | | | | | | 80,873,829 | |
| | | | | | | | |
| | | | | | | | |
| | |
| | | Shares | | | Value | |
Beverages 0.3% | |
PepsiCo., Inc. | | | 15,469 | | | $ | 2,028,450 | |
| | | | | | | | |
|
Biotechnology 1.2% | |
Gilead Sciences, Inc. | | | 127,400 | | | | 8,607,144 | |
| | | | | | | | |
|
Building Products 1.3% | |
Johnson Controls International PLC | | | 221,532 | | | | 9,151,487 | |
| | | | | | | | |
|
Capital Markets 4.3% | |
Ameriprise Financial, Inc. | | | 7,600 | | | | 1,103,216 | |
Bank of New York Mellon Corp. | | | 51,200 | | | | 2,260,480 | |
Franklin Resources, Inc. | | | 153,205 | | | | 5,331,534 | |
Morgan Stanley | | | 279,900 | | | | 12,262,419 | |
Northern Trust Corp. | | | 23,800 | | | | 2,142,000 | |
State Street Corp. | | | 149,600 | | | | 8,386,576 | |
| | | | | | | | |
| | | | | | | 31,486,225 | |
| | | | | | | | |
Chemicals 3.2% | |
Akzo Nobel N.V. | | | 12,519 | | | | 1,176,410 | |
CF Industries Holdings, Inc. | | | 142,100 | | | | 6,637,491 | |
Corteva, Inc. (b) | | | 96,699 | | | | 2,859,389 | |
Dow, Inc. (b) | | | 91,266 | | | | 4,500,327 | |
DuPont de Nemours, Inc. | | | 96,699 | | | | 7,259,194 | |
PPG Industries, Inc. | | | 8,100 | | | | 945,351 | |
| | | | | | | | |
| | | | | | | 23,378,162 | |
| | | | | | | | |
Commercial Services & Supplies 0.5% | |
Stericycle, Inc. (b) | | | 81,500 | | | | 3,891,625 | |
| | | | | | | | |
|
Communications Equipment 1.5% | |
Cisco Systems, Inc. | | | 192,494 | | | | 10,535,197 | |
| | | | | | | | |
|
Construction Materials 0.2% | |
Vulcan Materials Co. | | | 11,000 | | | | 1,510,410 | |
| | | | | | | | |
|
Containers & Packaging 0.9% | |
International Paper Co. | | | 146,000 | | | | 6,324,720 | |
| | | | | | | | |
|
Diversified Financial Services 0.1% | |
AXA Equitable Holdings, Inc. | | | 49,656 | | | | 1,037,810 | |
| | | | | | | | |
|
Diversified Telecommunication Services 3.1% | |
AT&T, Inc. | | | 114,045 | | | | 3,821,648 | |
CenturyLink, Inc. | | | 81,600 | | | | 959,616 | |
Telefonica S.A. | | | 455,180 | | | | 3,737,483 | |
Verizon Communications, Inc. | | | 248,740 | | | | 14,210,516 | |
| | | | | | | | |
| | | | | | | 22,729,263 | |
| | | | | | | | |
Electric Utilities 4.0% | |
Duke Energy Corp. | | | 23,300 | | | | 2,055,992 | |
| | | | | | |
The notes to the financial statements are an integral part of,
and should be read in conjunction with, the financial statements. | | | | | 11 | |
Portfolio of InvestmentsJune 30, 2019 (Unaudited) (continued)
| | | | | | | | |
| | |
| | | Shares | | | Value | |
| Common Stocks (continued) | |
Electric Utilities (continued) | |
Edison International | | | 85,785 | | | $ | 5,782,767 | |
Evergy, Inc. | | | 64,159 | | | | 3,859,164 | |
PG&E Corp. (b) | | | 30,920 | | | | 708,686 | |
Southern Co. | | | 297,695 | | | | 16,456,580 | |
| | | | | | | | |
| | | | | | | 28,863,189 | |
| | | | | | | | |
Electrical Equipment 0.7% | |
Emerson Electric Co. | | | 58,207 | | | | 3,883,571 | |
nVent Electric PLC | | | 36,500 | | | | 904,835 | |
| | | | | | | | |
| | | | | | | 4,788,406 | |
| | | | | | | | |
Electronic Equipment, Instruments & Components 0.2% | |
TE Connectivity, Ltd. | | | 14,061 | | | | 1,346,763 | |
| | | | | | | | |
|
Entertainment 0.5% | |
Walt Disney Co. | | | 25,655 | | | | 3,582,464 | |
| | | | | | | | |
|
Equity Real Estate Investment Trusts 3.1% | |
Equity Residential | | | 89,339 | | | | 6,782,617 | |
Rayonier, Inc. | | | 139,465 | | | | 4,225,790 | |
SL Green Realty Corp. | | | 46,747 | | | | 3,757,056 | |
Weyerhaeuser Co. | | | 280,900 | | | | 7,398,906 | |
| | | | | | | | |
| | | | | | | 22,164,369 | |
| | | | | | | | |
Food & Staples Retailing 1.0% | |
Walmart, Inc. | | | 68,939 | | | | 7,617,070 | |
| | | | | | | | |
|
Food Products 3.4% | |
Bunge, Ltd. | | | 62,000 | | | | 3,454,020 | |
Conagra Brands, Inc. | | | 280,961 | | | | 7,451,086 | |
Kellogg Co. | | | 21,900 | | | | 1,173,183 | |
Tyson Foods, Inc., Class A | | | 154,714 | | | | 12,491,608 | |
| | | | | | | | |
| | | | | | | 24,569,897 | |
| | | | | | | | |
Health Care Equipment & Supplies 2.0% | |
Becton Dickinson & Co. | | | 10,057 | | | | 2,534,464 | |
Medtronic PLC | | | 103,879 | | | | 10,116,776 | |
Zimmer Biomet Holdings, Inc. | | | 17,600 | | | | 2,072,224 | |
| | | | | | | | |
| | | | | | | 14,723,464 | |
| | | | | | | | |
Health Care Providers & Services 2.8% | |
Anthem, Inc. | | | 40,272 | | | | 11,365,161 | |
CVS Health Corp. | | | 158,637 | | | | 8,644,130 | |
| | | | | | | | |
| | | | | | | 20,009,291 | |
| | | | | | | | |
Hotels, Restaurants & Leisure 1.1% | |
Las Vegas Sands Corp. | | | 114,978 | | | | 6,794,050 | |
MGM Resorts International | | | 40,400 | | | | 1,154,228 | |
| | | | | | | | |
| | | | | | | 7,948,278 | |
| | | | | | | | |
Household Products 1.7% | |
Kimberly-Clark Corp. | | | 90,828 | | | | 12,105,556 | |
| | | | | | | | |
| | | | | | | | |
| | |
| | | Shares | | | Value | |
Industrial Conglomerates 1.2% | |
General Electric Co. | | | 825,400 | | | $ | 8,666,700 | |
| | | | | | | | |
|
Insurance 7.2% | |
American International Group, Inc. | | | 226,409 | | | | 12,063,072 | |
Brighthouse Financial, Inc. (b) | | | 68,734 | | | | 2,521,850 | |
Chubb, Ltd. | | | 86,282 | | | | 12,708,476 | |
Loews Corp. | | | 136,691 | | | | 7,472,897 | |
Marsh & McLennan Cos., Inc. | | | 25,074 | | | | 2,501,131 | |
MetLife, Inc. | | | 212,252 | | | | 10,542,557 | |
Willis Towers Watson PLC | | | 24,133 | | | | 4,622,435 | |
| | | | | | | | |
| | | | | | | 52,432,418 | |
| | | | | | | | |
IT Services 0.5% | |
Cognizant Technology Solutions Corp., Class A | | | 59,730 | | | | 3,786,285 | |
| | | | | | | | |
|
Leisure Products 0.4% | |
Mattel, Inc. (b)(c) | | | 266,923 | | | | 2,992,207 | |
| | | | | | | | |
|
Machinery 0.6% | |
Flowserve Corp. | | | 7,735 | | | | 407,557 | |
Illinois Tool Works, Inc. | | | 4,184 | | | | 630,989 | |
PACCAR, Inc. | | | 29,500 | | | | 2,113,970 | |
Pentair PLC | | | 24,000 | | | | 892,800 | |
Snap-On, Inc. | | | 3,400 | | | | 563,176 | |
| | | | | | | | |
| | | | | | | 4,608,492 | |
| | | | | | | | |
Media 3.0% | |
Comcast Corp., Class A | | | 201,461 | | | | 8,517,771 | |
Fox Corp., Class B (b) | | | 198,598 | | | | 7,254,785 | |
News Corp., Class A | | | 442,915 | | | | 5,974,923 | |
| | | | | | | | |
| | | | | | | 21,747,479 | |
| | | | | | | | |
Metals & Mining 0.2% | |
Nucor Corp. | | | 26,300 | | | | 1,449,130 | |
| | | | | | | | |
|
Multi-Utilities 1.9% | |
NiSource, Inc. | | | 369,647 | | | | 10,645,833 | |
Sempra Energy | | | 23,229 | | | | 3,192,594 | |
| | | | | | | | |
| | | | | | | 13,838,427 | |
| | | | | | | | |
Multiline Retail 0.4% | |
Kohl’s Corp. | | | 68,000 | | | | 3,233,400 | |
| | | | | | | | |
|
Oil, Gas & Consumable Fuels 9.6% | |
Chevron Corp. | | | 53,341 | | | | 6,637,754 | |
Equitrans Midstream Corp. (b) | | | 55,776 | | | | 1,099,345 | |
Exxon Mobil Corp. | | | 200,356 | | | | 15,353,280 | |
Hess Corp. | | | 61,146 | | | | 3,887,051 | |
Occidental Petroleum Corp. | | | 169,100 | | | | 8,502,348 | |
Pioneer Natural Resources Co. | | | 28,900 | | | | 4,446,554 | |
Targa Resources Corp. | | | 42,500 | | | | 1,668,550 | |
| | | | |
| 12 | | MainStay VP T. Rowe Price Equity Income Portfolio | | The notes to the financial statements are an integral part of,
and should be read in conjunction with, the financial statements. |
| | | | | | | | |
| | |
| | | Shares | | | Value | |
| Common Stocks (continued) | |
Oil, Gas & Consumable Fuels (continued) | |
TC Energy Corp. | | | 257,099 | | | $ | 12,731,543 | |
Total S.A. | | | 276,218 | | | | 15,476,663 | |
| | | | | | | | |
| | | | | | | 69,803,088 | |
| | | | | | | | |
Personal Products 0.1% | |
Coty, Inc., Class A | | | 35,981 | | | | 482,145 | |
| | | | | | | | |
|
Pharmaceuticals 6.4% | |
Allergan PLC | | | 22,300 | | | | 3,733,689 | |
Bristol-Myers Squibb Co. | | | 120,500 | | | | 5,464,675 | |
GlaxoSmithKline PLC | | | 242,511 | | | | 4,855,560 | |
GlaxoSmithKline PLC, Sponsored ADR | | | 5,800 | | | | 232,116 | |
Johnson & Johnson | | | 102,722 | | | | 14,307,120 | |
Merck & Co., Inc. | | | 38,500 | | | | 3,228,225 | |
Pfizer, Inc. | | | 338,530 | | | | 14,665,120 | |
| | | | | | | | |
| | | | | | | 46,486,505 | |
| | | | | | | | |
Professional Services 0.8% | |
Nielsen Holdings PLC | | | 261,651 | | | | 5,913,313 | |
| | | | | | | | |
|
Semiconductors & Semiconductor Equipment 4.0% | |
Applied Materials, Inc. | | | 96,100 | | | | 4,315,851 | |
NXP Semiconductors N.V. | | | 16,900 | | | | 1,649,609 | |
QUALCOMM, Inc. | | | 221,894 | | | | 16,879,477 | |
Texas Instruments, Inc. | | | 51,600 | | | | 5,921,616 | |
| | | | | | | | |
| | | | | | | 28,766,553 | |
| | | | | | | | |
Software 2.1% | |
Microsoft Corp. | | | 112,014 | | | | 15,005,396 | |
| | | | | | | | |
|
Specialty Retail 0.4% | |
L Brands, Inc. | | | 104,900 | | | | 2,737,890 | |
| | | | | | | | |
|
Technology Hardware, Storage & Peripherals 0.3% | |
Hewlett Packard Enterprise Co. | | | 57,900 | | | | 865,605 | |
Western Digital Corp. | | | 28,800 | | | | 1,369,440 | |
| | | | | | | | |
| | | | | | | 2,235,045 | |
| | | | | | | | |
Tobacco 1.2% | |
Philip Morris International, Inc. | | | 115,604 | | | | 9,078,382 | |
| | | | | | | | |
|
Water Utilities 0.2% | |
Aqua America, Inc. (b) | | | 19,414 | | | | 1,106,210 | |
| | | | | | | | |
Total Common Stocks
(Cost $598,252,402) | | | | | | | 691,781,916 | |
| | | | | | | | |
|
| Convertible Preferred Stocks 2.6% | |
Electric Utilities 0.9% | |
Nextera Energy, Inc.
6.123% | | | 106,149 | | | | 6,892,255 | |
| | | | | | | | |
| | | | | | | | |
| | |
| | | Shares | | | Value | |
Health Care Equipment & Supplies 0.9% | |
Becton Dickinson & Co.
6.125% | | | 101,085 | | | $ | 6,258,172 | |
| | | | | | | | |
|
Multi-Utilities 0.8% | |
DTE Energy Co. (c)
6.50% | | | 12,134 | | | | 681,931 | |
Sempra Energy | | | | | | | | |
6.00% | | | 34,999 | | | | 3,902,038 | |
6.75% | | | 10,478 | | | | 1,163,268 | |
| | | | | | | | |
| | | | | | | 5,747,237 | |
| | | | | | | | |
Total Convertible Preferred Stocks
(Cost $15,496,065) | | | | | | | 18,897,664 | |
| | | | | | | | |
|
| Short-Term Investments 1.7% | |
Affiliated Investment Company 1.6% | |
MainStay U.S. Government Liquidity Fund, 2.03% (d) | | | 11,862,566 | | | | 11,862,566 | |
| | | | | | | | |
|
Unaffiliated Investment Company 0.1% | |
State Street Navigator Securities Lending Government Money Market Portfolio, 2.33% (d)(e) | | | 825,451 | | | | 825,451 | |
| | | | | | | | |
TotalShort-Term Investments
(Cost $12,688,017) | | | | | | | 12,688,017 | |
| | | | | | | | |
Total Investments
(Cost $629,318,904) | | | 100.0 | % | | | 726,372,912 | |
Other Assets, Less Liabilities | | | (0.0 | )‡ | | | (15,143 | ) |
Net Assets | | | 100.0 | % | | $ | 726,357,769 | |
| † | Percentages indicated are based on Portfolio net assets. |
| ‡ | Less than one-tenth of a percent. |
| (a) | May be sold to institutional investors only under Rule 144A or securities offered pursuant to Section 4(a)(2) of the Securities Act of 1933, as amended. |
| (b) | Non-income producing security. |
| (c) | All or a portion of this security was held on loan. As of June 30, 2019, the aggregate market value of securities on loan was $2,928,480; the total market value of collateral held by the Portfolio was $2,974,159. The market value of the collateral held included non-cash collateral in the form of U.S. Treasury securities with a value of $2,148,708 (See Note 2(K)). |
| (d) | Current yield as of June 30, 2019. |
| (e) | Represents security purchased with cash collateral received for securities on loan. |
| | | | | | |
The notes to the financial statements are an integral part of,
and should be read in conjunction with, the financial statements. | | | | | 13 | |
Portfolio of InvestmentsJune 30, 2019 (Unaudited) (continued)
As of June 30, 2019, the Portfolio held the following futures contracts1:
| | | | | | | | | | | | | | | | | | | | |
Type | | Number of
Contracts | | | Expiration
Date | | | Value at
Trade Date | | | Current
Notional
Amount | | | Unrealized Appreciation
(Depreciation)2 | |
Long Contracts | | | | | | | | | | | | | | | | | | | | |
| Standard & Poor’s 500 Index Mini | | | 10 | | | | September 2019 | | | $ | 1,479,878 | | | $ | 1,472,100 | | | $ | (7,778 | ) |
| | | | | | | | | | | | | | | | | | | | |
| 1. | As of June 30, 2019, cash in the amount of $64,000 was on deposit with a broker or futures commission merchant for futures transactions. |
| 2. | Represents the difference between the value of the contracts at the time they were opened and the value as of June 30, 2019. |
The following abbreviation is used in the preceding pages:
ADR—American Depositary Receipt
The following is a summary of the fair valuations according to the inputs used as of June 30, 2019, for valuing the Portfolio’s assets:
| | | | | | | | | | | | | | | | |
Description | | Quoted
Prices in
Active
Markets for
Identical
Assets
(Level 1) | | | Significant
Other
Observable
Inputs
(Level 2) | | | Significant
Unobservable
Inputs
(Level 3) | | | Total | |
| | | | |
Asset Valuation Inputs | | | | | | | | | | | | | | | | |
| Investments in Securities (a) | | | | | | | | | | | | | | | | |
| Long-Term Bonds | | | | | | | | | | | | | | | | |
Convertible Bonds | | $ | — | | | $ | 1,538,318 | | | $ | — | | | $ | 1,538,318 | |
Corporate Bonds | | | — | | | | 1,466,997 | | | | — | | | | 1,466,997 | |
| | | | | | | | | | | | | | | | |
| TotalLong-Term Bonds | | | — | | | | 3,005,315 | | | | — | | | | 3,005,315 | |
| | | | | | | | | | | | | | | | |
| Common Stocks | | | 691,781,916 | | | | — | | | | — | | | | 691,781,916 | |
| Convertible Preferred Stocks | | | 18,897,664 | | | | — | | | | — | | | | 18,897,664 | |
| Short-Term Investments | | | | | | | | | | | | | | | | |
Affiliated Investment Company | | | 11,862,566 | | | | — | | | | — | | | | 11,862,566 | |
Unaffiliated Investment Company | | | 825,451 | | | | — | | | | — | | | | 825,451 | |
| | | | | | | | | | | | | | | | |
| TotalShort-Term Investments | | | 12,688,017 | | | | — | | | | — | | | | 12,688,017 | |
| | | | | | | | | | | | | | | | |
| Total Investments in Securities | | $ | 723,367,597 | | | $ | 3,005,315 | | | $ | — | | | $ | 726,372,912 | |
| | | | | | | | | | | | | | | | |
| | | | |
Liability Valuation Inputs | | | | | | | | | | | | | | | | |
| Other Financial Instruments | | | | | | | | | | | | | | | | |
Futures Contracts (b) | | $ | (7,778 | ) | | $ | — | | | $ | — | | | $ | (7,778 | ) |
| | | | | | | | | | | | | | | | |
| (a) | For a complete listing of investments and their industries, see the Portfolio of Investments. |
| (b) | The value listed for these securities reflects unrealized appreciation (depreciation) as shown on the Portfolio of Investments. |
| | | | |
| 14 | | MainStay VP T. Rowe Price Equity Income Portfolio | | The notes to the financial statements are an integral part of,
and should be read in conjunction with, the financial statements. |
Statement of Assets and Liabilitiesas of June 30, 2019 (Unaudited)
| | | | |
| Assets | | | | |
Investment in unaffiliated securities, at value (identified cost $617,456,338) including securities on loan of $2,928,480 | | $ | 714,510,346 | |
Investment in affiliated investment company, at value (identified cost $11,862,566) | | | 11,862,566 | |
Cash denominated in foreign currencies (identified cost $82,805) | | | 83,849 | |
Cash collateral on deposit at broker for futures contracts | | | 64,000 | |
Cash | | | 6,500 | |
Receivables: | | | | |
Investment securities sold | | | 2,881,790 | |
Dividends and interest | | | 1,335,710 | |
Variation margin on futures contracts | | | 5,900 | |
Securities lending | | | 2,712 | |
Other assets | | | 3,578 | |
| | | | |
Total assets | | | 730,756,951 | |
| | | | |
| |
| Liabilities | | | | |
Cash collateral received for securities on loan | | | 825,451 | |
Payables: | | | | |
Investment securities purchased | | | 2,273,418 | |
Portfolio shares redeemed | | | 753,118 | |
Manager (See Note 3) | | | 422,376 | |
NYLIFE Distributors (See Note 3) | | | 54,700 | |
Professional fees | | | 33,454 | |
Shareholder communication | | | 14,358 | |
Custodian | | | 12,309 | |
Trustees | | | 870 | |
Accrued expenses | | | 9,128 | |
| | | | |
Total liabilities | | | 4,399,182 | |
| | | | |
Net assets | | $ | 726,357,769 | |
| | | | |
| |
| Composition of Net Assets | | | | |
Shares of beneficial interest outstanding (par value of $.001 per share) unlimited number of shares authorized | | $ | 55,221 | |
Additional paid-in capital | | | 532,415,874 | |
| | | | |
| | | 532,471,095 | |
Total distributable earnings (loss) | | | 193,886,674 | |
| | | | |
Net assets | | $ | 726,357,769 | |
| | | | |
| | | | |
Initial Class | | | | |
Net assets applicable to outstanding shares | | $ | 456,872,785 | |
| | | | |
Shares of beneficial interest outstanding | | | 34,661,342 | |
| | | | |
Net asset value per share outstanding | | $ | 13.18 | |
| | | | |
Service Class | | | | |
Net assets applicable to outstanding shares | | $ | 269,484,984 | |
| | | | |
Shares of beneficial interest outstanding | | | 20,560,027 | |
| | | | |
Net asset value per share outstanding | | $ | 13.11 | |
| | | | |
| | | | | | |
The notes to the financial statements are an integral part of,
and should be read in conjunction with, the financial statements. | | | | | 15 | |
Statement of Operationsfor the six months ended June 30, 2019 (Unaudited)
| | | | |
| Investment Income (Loss) | | | | |
Income | | | | |
Dividends-unaffiliated (a) | | $ | 11,317,005 | |
Interest | | | 128,483 | |
Dividends-affiliated | | | 109,852 | |
Securities lending | | | 23,692 | |
| | | | |
Total income | | | 11,579,032 | |
| | | | |
Expenses | | | | |
Manager (See Note 3) | | | 2,592,776 | |
Distribution/Service—Service Class (See Note 3) | | | 336,938 | |
Professional fees | | | 48,192 | |
Shareholder communication | | | 35,990 | |
Custodian | | | 14,287 | |
Trustees | | | 8,992 | |
Miscellaneous | | | 14,095 | |
| | | | |
Total expenses | | | 3,051,270 | |
| | | | |
Net investment income (loss) | | | 8,527,762 | |
| | | | |
|
| Realized and Unrealized Gain (Loss) on Investments, Futures Contracts and Foreign Currency Transactions | |
Net realized gain (loss) on: | | | | |
Unaffiliated investment transactions | | | 21,599,608 | |
Foreign currency transactions | | | 5,362 | |
| | | | |
Net realized gain (loss) on investments, futures transactions and foreign currency transactions | | | 21,604,970 | |
| | | | |
Net change in unrealized appreciation (depreciation) on: | | | | |
Unaffiliated investments | | | 75,471,909 | |
Futures contracts | | | (7,778 | ) |
Translation of other assets and liabilities in foreign currencies | | | (486 | ) |
| | | | |
Net change in unrealized appreciation (depreciation) on investments, futures contracts and foreign currency transactions | | | 75,463,645 | |
| | | | |
Net realized and unrealized gain (loss) on investments, futures transactions and foreign currency transactions | | | 97,068,615 | |
| | | | |
Net increase (decrease) in net assets resulting from operations | | $ | 105,596,377 | |
| | | | |
| (a) | Dividends recorded net of foreign withholding taxes in the amount of $132,787. |
| | | | |
| 16 | | MainStay VP T. Rowe Price Equity Income Portfolio | | The notes to the financial statements are an integral part of,
and should be read in conjunction with, the financial statements. |
Statements of Changes in Net Assets
for the six months ended June 30, 2019 (Unaudited) and the year ended December 31, 2018
| | | | | | | | |
| | | 2019 | | | 2018 | |
| Increase (Decrease) in Net Assets | |
Operations: | | | | | | | | |
Net investment income (loss) | | $ | 8,527,762 | | | $ | 15,351,903 | |
Net realized gain (loss) on investments, futures contracts and foreign currency transactions | | | 21,604,970 | | | | 54,152,450 | |
Net change in unrealized appreciation (depreciation) on investments, futures contracts and foreign currency transactions | | | 75,463,645 | | | | (136,025,617 | ) |
| | | | |
Net increase (decrease) in net assets resulting from operations | | | 105,596,377 | | | | (66,521,264 | ) |
| | | | |
Distributions to shareholders: | | | | | | | | |
Initial Class | | | — | | | | (49,365,312 | ) |
Service Class | | | — | | | | (33,082,583 | ) |
| | | | |
Total distributions to shareholders | | | — | | | | (82,447,895 | ) |
| | | | |
Capital share transactions: | | | | | | | | |
Net proceeds from sale of shares | | | 3,943,869 | | | | 64,560,431 | |
Net asset value of shares issued to shareholders in reinvestment of dividends and distributions | | | — | | | | 82,447,895 | |
Cost of shares redeemed | | | (72,012,808 | ) | | | (127,214,373 | ) |
| | | | |
Increase (decrease) in net assets derived from capital share transactions | | | (68,068,939 | ) | | | 19,793,953 | |
| | | | |
Net increase (decrease) in net assets | | | 37,527,438 | | | | (129,175,206 | ) |
|
| Net Assets | |
Beginning of period | | | 688,830,331 | | | | 818,005,537 | |
| | | | |
End of period | | $ | 726,357,769 | | | $ | 688,830,331 | |
| | | | |
| | | | | | |
The notes to the financial statements are an integral part of,
and should be read in conjunction with, the financial statements. | | | | | 17 | |
Financial Highlightsselected per share data and ratios
| | | | | | | | | | | | | | | | | | | | | | | | | | | | | | | | | | | |
| | | |
| | | Six months
ended
June 30, | | | | Year ended December 31, |
| | | | | | | |
| Initial Class | | 2019* | | | | 2018 | | 2017 | | 2016 | | 2015 | | 2014 |
| | | | | | | |
Net asset value at beginning of period | | | $ | 11.39 | | | | | | | | | $ | 14.10 | | | | $ | 12.99 | | | | $ | 11.97 | | | | $ | 13.90 | | | | $ | 13.77 | |
| | | | | | | | | | | | | | | | | | | | | | | | | | | | | | | | | | | |
| | | | | | | |
Net investment income (loss) (a) | | | | 0.15 | | | | | | | | | | 0.29 | | | | | 0.24 | | | | | 0.27 | | | | | 0.25 | | | | | 0.26 | |
| | | | | | | |
Net realized and unrealized gain (loss) on investments | | | | 1.64 | | | | | | | | | | (1.40 | ) | | | | 1.83 | | | | | 1.90 | | | | | (1.21 | ) | | | | 0.78 | |
| | | | | | | |
Net realized and unrealized gain (loss) on foreign currency transactions ‡ | | | | 0.00 | | | | | | | | | | (0.00 | ) | | | | 0.00 | | | | | (0.00 | ) | | | | (0.00 | ) | | | | (0.00 | ) |
| | | | | | | | | | | | | | | | | | | | | | | | | | | | | | | | | | | |
| | | | | | | |
Total from investment operations | | | | 1.79 | | | | | | | | | | (1.11 | ) | | | | 2.07 | | | | | 2.17 | | | | | (0.96 | ) | | | | 1.04 | |
| | | | | | | | | | | | | | | | | | | | | | | | | | | | | | | | | | | |
| | | | | | | |
| Less dividends and distributions: | | | | | | | | | | | | | | | | | | | | | | | | | | | | | | | | | | | |
| | | | | | | |
From net investment income | | | | — | | | | | | | | | | (0.29 | ) | | | | (0.30 | ) | | | | (0.25 | ) | | | | (0.24 | ) | | | | (0.21 | ) |
| | | | | | | |
From net realized gain on investments | | | | — | | | | | | | | | | (1.31 | ) | | | | (0.66 | ) | | | | (0.90 | ) | | | | (0.73 | ) | | | | (0.70 | ) |
| | | | | | | | | | | | | | | | | | | | | | | | | | | | | | | | | | | |
| | | | | | | |
Total dividends and distributions | | | | — | | | | | | | | | | (1.60 | ) | | | | (0.96 | ) | | | | (1.15 | ) | | | | (0.97 | ) | | | | (0.91 | ) |
| | | | | | | | | | | | | | | | | | | | | | | | | | | | | | | | | | | |
| | | | | | | |
Net asset value at end of period | | | $ | 13.18 | | | | | | | | | $ | 11.39 | | | | $ | 14.10 | | | | $ | 12.99 | | | | $ | 11.97 | | | | $ | 13.90 | |
| | | | | | | | | | | | | | | | | | | | | | | | | | | | | | | | | | | |
| | | | | | | |
Total investment return (b) | | | | 15.72 | %(c) | | | | | | | | | (9.38 | %) | | | | 16.20 | % | | | | 18.82 | % | | | | (6.78 | %) | | | | 7.74 | % |
| | | | | | | |
| Ratios (to average net assets)/Supplemental Data: | | | | | | | | | | | | | | | | | | | | | | | | | | | | | | | | | | | |
| | | | | | | |
Net investment income (loss) | | | | 2.45 | %†† | | | | | | | | | 2.11 | % | | | | 1.78 | % | | | | 2.18 | % | | | | 1.90 | % | | | | 1.89 | % |
| | | | | | | |
Net expenses (d) | | | | 0.75 | %†† | | | | | | | | | 0.77 | % | | | | 0.77 | % | | | | 0.78 | % | | | | 0.77 | % | | | | 0.78 | % |
| | | | | | | |
Expenses (before waiver/reimbursement) (d) | | | | 0.75 | %†† | | | | | | | | | 0.77 | % | | | | 0.77 | % | | | | 0.78 | % | | | | 0.77 | % | | | | 0.79 | % |
| | | | | | | |
Portfolio turnover rate | | | | 8 | % | | | | | | | | | 22 | % | | | | 24 | % | | | | 23 | % | | | | 42 | % | | | | 18 | % |
| | | | | | | |
Net assets at end of period (in 000’s) | | | $ | 456,873 | | | | | | | | | $ | 431,672 | | | | $ | 469,556 | | | | $ | 472,125 | | | | $ | 473,818 | | | | $ | 534,825 | |
| ‡ | Less than one cent per share. |
| (a) | Per share data based on average shares outstanding during the period. |
| (b) | Total return does not reflect any deduction of sales charges, mortality and expense charges, contract charges or administrative charges. For periods of less than one year, total return is not annualized. |
| (c) | Total investment return may reflect adjustments to conform to generally accepted accounting principles. |
| (d) | In addition to the fees and expenses which the Portfolio bears directly, it also indirectly bears a pro-rata share of the fees and expenses of the underlying funds in which it invests. Such indirect expenses are not included in the above expense ratios. |
| | | | |
| 18 | | MainStay VP T. Rowe Price Equity Income Portfolio | | The notes to the financial statements are an integral part of,
and should be read in conjunction with, the financial statements. |
Financial Highlightsselected per share data and ratios
| | | | | | | | | | | | | | | | | | | | | | | | | | | | | | | | | | | |
| | | |
| | | Six months
ended
June 30, | | | | Year ended December 31, |
| | | | | | | |
| Service Class | | 2019* | | | | 2018 | | 2017 | | 2016 | | 2015 | | 2014 |
| | | | | | | |
Net asset value at beginning of period | | | $ | 11.34 | | | | | | | | | $ | 14.04 | | | | $ | 12.94 | | | | $ | 11.93 | | | | $ | 13.85 | | | | $ | 13.73 | |
| | | | | | | | | | | | | | | | | | | | | | | | | | | | | | | | | | | |
| | | | | | | |
Net investment income (loss) (a) | | | | 0.14 | | | | | | | | | | 0.25 | | | | | 0.21 | | | | | 0.24 | | | | | 0.22 | | | | | 0.23 | |
| | | | | | | |
Net realized and unrealized gain (loss) on investments | | | | 1.63 | | | | | | | | | | (1.39 | ) | | | | 1.82 | | | | | 1.89 | | | | | (1.21 | ) | | | | 0.77 | |
| | | | | | | |
Net realized and unrealized gain (loss) on foreign currency transactions ‡ | | | | 0.00 | | | | | | | | | | (0.00 | ) | | | | 0.00 | | | | | (0.00 | ) | | | | (0.00 | ) | | | | (0.00 | ) |
| | | | | | | | | | | | | | | | | | | | | | | | | | | | | | | | | | | |
| | | | | | | |
Total from investment operations | | | | 1.77 | | | | | | | | | | (1.14 | ) | | | | 2.03 | | | | | 2.13 | | | | | (0.99 | ) | | | | 1.00 | |
| | | | | | | | | | | | | | | | | | | | | | | | | | | | | | | | | | | |
| | | | | | | |
| Less dividends and distributions: | | | | | | | | | | | | | | | | | | | | | | | | | | | | | | | | | | | |
| | | | | | | |
From net investment income | | | | — | | | | | | | | | | (0.25 | ) | | | | (0.27 | ) | | | | (0.22 | ) | | | | (0.20 | ) | | | | (0.18 | ) |
| | | | | | | |
From net realized gain on investments | | | | — | | | | | | | | | | (1.31 | ) | | | | (0.66 | ) | | | | (0.90 | ) | | | | (0.73 | ) | | | | (0.70 | ) |
| | | | | | | | | | | | | | | | | | | | | | | | | | | | | | | | | | | |
| | | | | | | |
Total dividends and distributions | | | | — | | | | | | | | | | (1.56 | ) | | | | (0.93 | ) | | | | (1.12 | ) | | | | (0.93 | ) | | | | (0.88 | ) |
| | | | | | | | | | | | | | | | | | | | | | | | | | | | | | | | | | | |
| | | | | | | |
Net asset value at end of period | | | $ | 13.11 | | | | | | | | | $ | 11.34 | | | | $ | 14.04 | | | | $ | 12.94 | | | | $ | 11.93 | | | | $ | 13.85 | |
| | | | | | | | | | | | | | | | | | | | | | | | | | | | | | | | | | | |
| | | | | | | |
Total investment return (b) | | | | 15.61 | %(c) | | | | | | | | | (9.61 | %) | | | | 15.91 | % | | | | 18.53 | % | | | | (7.01 | %) | | | | 7.47 | % |
| | | | | | | |
| Ratios (to average net assets)/Supplemental Data: | | | | | | | | | | | | | | | | | | | | | | | | | | | | | | | | | | | |
| | | | | | | |
Net investment income (loss) | | | | 2.20 | %†† | | | | | | | | | 1.84 | % | | | | 1.54 | % | | | | 1.93 | % | | | | 1.64 | % | | | | 1.64 | % |
| | | | | | | |
Net expenses (d) | | | | 1.00 | %†† | | | | | | | | | 1.02 | % | | | | 1.02 | % | | | | 1.03 | % | | | | 1.02 | % | | | | 1.03 | % |
| | | | | | | |
Expenses (before waiver/reimbursement) (d) | | | | 1.00 | %†† | | | | | | | | | 1.02 | % | | | | 1.02 | % | | | | 1.03 | % | | | | 1.02 | % | | | | 1.04 | % |
| | | | | | | |
Portfolio turnover rate | | | | 8 | % | | | | | | | | | 22 | % | | | | 24 | % | | | | 23 | % | | | | 42 | % | | | | 18 | % |
| | | | | | | |
Net assets at end of period (in 000’s) | | | $ | 269,485 | | | | | | | | | $ | 257,159 | | | | $ | 348,450 | | | | $ | 318,059 | | | | $ | 281,340 | | | | $ | 323,002 | |
| ‡ | Less than one cent per share. |
| (a) | Per share data based on average shares outstanding during the period. |
| (b) | Total return does not reflect any deduction of sales charges, mortality and expense charges, contract charges or administrative charges. For periods of less than one year, total return is not annualized. |
| (c) | Total investment return may reflect adjustments to conform to generally accepted accounting principles. |
| (d) | In addition to the fees and expenses which the Portfolio bears directly, it also indirectly bears a pro-rata share of the fees and expenses of the underlying funds in which it invests. Such indirect expenses are not included in the above expense ratios. |
| | | | | | |
The notes to the financial statements are an integral part of,
and should be read in conjunction with, the financial statements. | | | | | 19 | |
Notes to Financial Statements(Unaudited)
Note 1–Organization and Business
MainStay VP Funds Trust (the “Fund”) was organized as a Delaware statutory trust on February 1, 2011. The Fund is registered under the Investment Company Act of 1940, as amended (the “1940 Act”), as an open-end management investment company. The Fund is comprised of thirty-one separate series (collectively referred to as the “Portfolios”). These financial statements and notes relate to the MainStay VP T. Rowe Price Equity Income Portfolio (the “Portfolio”), a “diversified” portfolio, as that term is defined in the 1940 Act, as interpreted or modified by regulatory authorities having jurisdiction, from time to time.
Shares of the Portfolio are currently offered to certain separate accounts to fund variable annuity policies and variable universal life insurance policies issued by New York Life Insurance and Annuity Corporation (“NYLIAC”), awholly-owned subsidiary of New York Life Insurance Company (“New York Life”) and may also be offered to fund variable annuity policies and variable universal life insurance policies issued by other insurance companies. NYLIAC allocates shares of the Portfolios to, among others, certain NYLIAC separate accounts. Shares of the Portfolio are also offered to the MainStay VP Conservative Allocation Portfolio, MainStay VP Moderate Allocation Portfolio, MainStay VP Moderate Growth Allocation Portfolio and MainStay VP Growth Allocation Portfolio, which operate as “funds-of-funds.”
The Portfolio currently offers two classes of shares. Initial Class and Service Class shares commenced operations on February 17, 2012. Shares of the Portfolio are offered and are redeemed at a price equal to their respective net asset value (“NAV”) per share. No sales or redemption charge is applicable to the purchase or redemption of the Portfolio’s shares. Under the terms of the Fund’s multiple class plan adopted pursuant to Rule 18f-3 under the 1940 Act, the classes differ in that, among other things, Service Class shares of the Portfolio pay a combined distribution and service fee of 0.25% of average daily net assets attributable to Service Class shares of the Portfolio to the Distributor (as defined in Note 3(B)) pursuant to a plan adopted in accordance with Rule 12b-1 under the 1940 Act. Contract owners of variable annuity contracts purchased after June 2, 2003, are permitted to invest only in the Service Class shares.
The Portfolio’s investment objective is to seek a high level of dividend income andlong-term capital growth primarily through investments in stocks.
Note 2–Significant Accounting Policies
The Portfolio is an investment company and accordingly follows the investment company accounting and reporting guidance of the Financial Accounting Standards Board (“FASB”) Accounting Standard CodificationTopic 946 Financial Services—Investment Companies. The Portfolio prepares its financial statements in accordance with generally accepted accounting principles (“GAAP”) in the United States of America and follows the significant accounting policies described below.
(A) Securities Valuation. Investments are usually valued as of the close of regular trading on the New York Stock Exchange (the “Exchange”) (usually 4:00 p.m. Eastern time) on each day the Portfolio is open for business (“valuation date”).
The Board of Trustees of the Fund (the “Board”) adopted procedures establishing methodologies for the valuation of the Portfolio’s securities and other assets and delegated the responsibility for valuation determinations under those procedures to the Valuation Committee of the Fund (the “Valuation Committee”). The Board authorized the Valuation Committee to appoint a Valuation Subcommittee (the “Subcommittee”) to deal in the first instance with establishing the prices of securities for which market quotations are not readily available or the prices of which are not otherwise readily determinable under these procedures. The Subcommittee meets (in person, via electronic mail or via teleconference) on an as-needed basis. Subsequently, the Valuation Committee meets to ensure that actions taken by the Subcommittee were appropriate. The procedures state that, subject to the oversight of the Board and unless otherwise noted, the responsibility for theday-to-day valuation of portfolio assets (including fair value measurements for the Portfolio’s assets and liabilities) rests with New York Life Investment Management LLC (“New York Life Investments” or the “Manager”), aided to whatever extent necessary by the Subadvisor (as defined in Note 3(A)).
To assess the appropriateness of security valuations, the Manager, the Subadvisor or the Portfolio’s third-party service provider, who is subject to oversight by the Manager, regularly compares prior day prices, prices on comparable securities and the sale prices to the prior and current day prices and challenges prices with changes exceeding certain tolerance levels with third-party pricing services or broker sources. For those securities valued through either a standardized fair valuation methodology or a fair valuation measurement, the Subcommittee deals in the first instance with such valuation and the Valuation Committee reviews and affirms, if appropriate, the reasonableness of the valuation based on such methodologies and measurements on a regular basis after considering information that is reasonably available and deemed relevant by the Valuation Committee. Any action taken by the Subcommittee with respect to the valuation of a portfolio security or other asset is submitted for review and ratification (if appropriate) to the Valuation Committee and the Board at the next regularly scheduled meeting.
“Fair value” is defined as the price the Portfolio would reasonably expect to receive upon selling an asset or liability in an orderly transaction to an independent buyer in the principal or most advantageous market for the asset or liability. Fair value measurements are determined within a framework that establishes a three-tier hierarchy which maximizes the use of observable market data and minimizes the use of unobservable inputs to establish a classification of fair value measurements for disclosure purposes. “Inputs” refer broadly to the assumptions that market participants would use in pricing the asset or liability, including assumptions about risk, such as the risk inherent in a particular valuation technique used to measure fair value using a pricing model and/or the risk inherent in the inputs for the valuation technique. Inputs may be observable or unobservable. Observable inputs reflect the assumptions market participants would use in pricing the asset or liability based on market data obtained from sources independent of the Portfolio. Unobservable inputs reflect the Portfolio’s own assumptions about the assumptions market participants would use in pricing the asset or liability based on the information available. The inputs or methodology used for valuing assets or liabilities may not be an indication of the risks
| | |
| 20 | | MainStay VP T. Rowe Price Equity Income Portfolio |
associated with investing in those assets or liabilities. The three-tier hierarchy of inputs is summarized below.
| • | | Level 1—quoted prices in active markets for an identical asset or liability |
| • | | Level 2—other significant observable inputs (including quoted prices for a similar asset or liability in active markets, interest rates and yield curves, prepayment speeds, credit risk, etc.) |
| • | | Level 3—significant unobservable inputs (including the Portfolio’s own assumptions about the assumptions that market participants would use in measuring fair value of an asset or liability) |
The level of an asset or liability within the fair value hierarchy is based on the lowest level of an input, both individually and in the aggregate, that is significant to the fair value measurement. As of June 30, 2019, the aggregate value by input level of the Portfolio’s assets and liabilities is included at the end of the Portfolio’s Portfolio of Investments.
The Portfolio may use third-party vendor evaluations, whose prices may be derived from one or more of the following standard inputs, among others:
| | |
• Benchmark yields | | • Reported trades |
• Broker/dealer quotes | | • Issuer spreads |
• Two-sided markets | | • Benchmark securities |
• Bids/offers | | • Reference data (corporate actions or material event notices) |
• Industry and economic events | | • Comparable bonds |
• Monthly payment information | | |
An asset or liability for which market values cannot be measured using the methodologies described above is valued by methods deemed reasonable in good faith by the Valuation Committee, following the procedures established by the Board, to represent fair value. Under these procedures, the Portfolio generally uses a market-based approach which may use related or comparable assets or liabilities, recent transactions, market multiples, book values and other relevant information. The Portfolio may also use an income-based valuation approach in which the anticipated future cash flows of the asset or liability are discounted to calculate fair value. Discounts may also be applied due to the nature and/or duration of any restrictions on the disposition of the asset or liability. Fair value represents a good faith approximation of the value of a security. Fair value determinations involve the consideration of a number of subjective factors, an analysis of applicable facts and circumstances and the exercise of judgment. As a result, it is possible that the fair value for a security determined in good faith in accordance with the Portfolio’s valuation procedures may differ from valuations for the same security determined by other funds using their own valuation procedures. Although the Portfolio’s valuation procedures are designed to value a security at the price the Portfolio may reasonably expect to receive upon the security’s sale in an orderly transaction, there can be no assurance that any fair value determination thereunder would, in fact, approximate the amount that the Portfolio would actually realize upon the sale of the security or the price at which the security would trade if a reliable market price were readily available. During the six-month period ended June 30, 2019, there were no material changes to the fair value methodologies.
Securities which may be valued in this manner include, but are not limited to: (i) a security for which trading has been halted or suspended; (ii) a debt security that has recently gone into default and for which there is not a current market quotation; (iii) a security of an issuer that has entered into a restructuring; (iv) a security that has been delisted from a national exchange; (v) a security for which the market price is not readily available from a third-party pricing source or, if so provided, does not, in the opinion of the Manager or the Subadvisor, reflect the security’s market value; (vi) a security subject to trading collars for which no or limited trading takes place; and (vii) a security whose principal market has been temporarily closed at a time when, under normal conditions, it would be open. Securities valued in this manner are generally categorized as Level 3 in the hierarchy. As of June 30, 2019, there were no securities held by the Portfolio that were fair valued in such a manner.
Certain securities held by the Portfolio may principally trade in foreign markets. Events may occur between the time the foreign markets close and the time at which the Portfolio’s NAVs are calculated. These events may include, but are not limited to, situations relating to a single issuer in a market sector, significant fluctuations in U.S. or foreign markets, natural disasters, armed conflicts, governmental actions or other developments not tied directly to the securities markets. Should the Manager or the Subadvisor conclude that such events may have affected the accuracy of the last price of such securities reported on the local foreign market, the Subcommittee may, pursuant to procedures adopted by the Board, adjust the value of the local price to reflect the estimated impact on the price of such securities as a result of such events. In this instance, securities are generally categorized as Level 3 in the hierarchy. Additionally, certain foreign equity securities are also fair valued whenever the movement of a particular index exceeds certain thresholds. In such cases, the securities are fair valued by applying factors provided by a third-party vendor in accordance with valuation procedures adopted by the Board and are generally categorized as Level 2 in the hierarchy.
Equity securities are valued at the last quoted sales prices as of the close of regular trading on the relevant exchange on each valuation date. Securities that are not traded on the valuation date are valued at the mean of the last quoted bid and ask prices. Prices are normally taken from the principal market in which each security trades. These securities are generally categorized as Level 1 in the hierarchy.
Investments in mutual funds, including money market funds, are valued at their respective NAVs as of the close of the Exchange on the valuation date. These securities are generally categorized as Level 1 in the hierarchy.
Debt securities (other than convertible and municipal bonds) are valued at the evaluated bid prices (evaluated mean prices in the case of convertible and municipal bonds) supplied by a pricing agent or brokers selected by the Manager, in consultation with the Subadvisor. The evaluations are market-based measurements processed through a pricing application and represents the pricing agent’s good faith determination as to what a holder may receive in an orderly transaction under market conditions. The rules based logic utilizes valuation techniques that reflect participants’ assumptions and vary by asset class and per methodology, maximizing the use of relevant observable data including quoted prices for similar assets, benchmark yield curves and
Notes to Financial Statements(Unaudited) (continued)
market corroborated inputs. The evaluated bid or mean prices are deemed by the Manager, in consultation with the Subadvisor to be representative of market values, at the regular close of trading of the Exchange on each valuation date. Debt securities purchased on a delayed delivery basis are marked to market daily until settlement at the forward settlement date. Debt securities, including corporate bonds, U.S. government and federal agency bonds, municipal bonds, foreign bonds, convertible bonds, asset-backed securities and mortgage-backed securities are generally categorized as Level 2 in the hierarchy.
Temporary cash investments acquired in excess of 60 days to maturity at the time of purchase are valued using the latest bid prices or using valuations based on a matrix system (which considers such factors as security prices, yields, maturities and ratings), both as furnished by independent pricing services. Other temporary cash investments which mature in 60 days or less at the time of purchase (“Short-Term Investments”) are valued using the amortized cost method of valuation, unless the use of such method would be inappropriate. The amortized cost method involves valuing a security at its cost on the date of purchase and thereafter assuming a constant amortization to maturity of the difference between such cost and the value on maturity date. Amortized cost approximates the current fair value of a security. Securities valued using the amortized cost method are not valued using quoted prices in an active market and are generally categorized as Level 2 in the hierarchy.
The information above is not intended to reflect an exhaustive list of the methodologies that may be used to value portfolio investments. The valuation procedures permit the use of a variety of valuation methodologies in connection with valuing portfolio investments. The methodology used for a specific type of investment may vary based on the market data available or other considerations. The methodologies summarized above may not represent the specific means by which portfolio investments are valued on any particular business day.
(B) Income Taxes. The Portfolio’s policy is to comply with the requirements of the Internal Revenue Code of 1986, as amended (the “Internal Revenue Code”), applicable to regulated investment companies and to distribute all of its taxable income to the shareholders of the Portfolio within the allowable time limits. Therefore, no federal, state and local income tax provisions are required.
Management evaluates the Portfolio’s tax positions to determine if the tax positions taken meet the minimum recognition threshold in connection with accounting for uncertainties in income tax positions taken or expected to be taken for the purposes of measuring and recognizing tax liabilities in the financial statements. Recognition of tax benefits of an uncertain tax position is permitted only to the extent the position is “more likely than not” to be sustained assuming examination by taxing authorities. Management has analyzed the Portfolio’s tax positions taken on federal, state and local income tax returns for all open tax years (for up to three tax years) and has concluded that no provisions for federal, state and local income tax are required in the Portfolio’s financial statements. The Portfolio’s federal, state and local income tax and federal excise tax returns for tax years for which the applicable statutes of limitations have not expired are subject to examination by the Internal Revenue Service and state and local departments of revenue.
(C) Foreign Taxes. The Portfolio may be subject to foreign taxes on income and other transaction-based taxes imposed by certain countries
in which it invests. A portion of the taxes on gains on investments or currency purchases/repatriation may be reclaimable. The Portfolio will accrue such taxes and reclaims as applicable, based upon its current interpretation of tax rules and regulations that exist in the markets in which it invests.
The Portfolio may be subject to taxation on realized capital gains, repatriation proceeds and other transaction-based taxes imposed by certain countries in which it invests. The Portfolio will accrue such taxes as applicable based upon its current interpretation of tax rules and regulations that exist in the market in which it invests. Capital gains taxes relating to positions still held are reflected as a liability on the Statement of Assets and Liabilities, as well as an adjustment to the Portfolio’s net unrealized appreciation (depreciation). Taxes related to capital gains realized, if any, are reflected as part of net realized gain (loss) in the Statement of Operations. Changes in tax liabilities related to capital gains taxes on unrealized investment gains, if any, are reflected as part of the change in net unrealized appreciation (depreciation) on investments in the Statement of Operations. Transaction-based charges are generally assessed as a percentage of the transaction amount.
(D) Dividends and Distributions to Shareholders. Dividends and distributions are recorded on the ex-dividend date. The Portfolio intends to declare and pay dividends from net investment income and distributions from net realized capital and currency gains, if any, at least annually. Unless the shareholder elects otherwise, all dividends and distributions are reinvested in the same class of shares of the Portfolio, at NAV. Dividends and distributions to shareholders are determined in accordance with federal income tax regulations and may differ from determinations using GAAP.
(E) Security Transactions and Investment Income. The Portfolio records security transactions on the trade date. Realized gains and losses on security transactions are determined using the identified cost method. Dividend income is recognized on the ex-dividend date; net of any foreign tax withheld at the source, and interest income is accrued as earned using the effective interest rate method and includes any realized gains and losses from repayments of principal on mortgage-backed securities.
Investment income and realized and unrealized gains and losses on investments of the Portfolio are allocated pro rata to the separate classes of shares based upon their relative net assets on the date the income is earned or realized and unrealized gains and losses are incurred.
The Portfolio may place a debt security on non-accrual status and reduce related interest income by ceasing current accruals and writing off all or a portion of any interest receivables when the collection of all or a portion of such interest has become doubtful. A debt security is removed from non-accrual status when the issuer resumes interest payments or when collectability of interest is reasonably assured.
(F) Expenses. Expenses of the Fund are allocated to the individual Portfolios in proportion to the net assets of the respective Portfolios when the expenses are incurred, except where direct allocations of expenses can be made. Expenses (other than fees incurred under the distribution and service plans, further discussed in Note 3(B), which are charged directly to the Service Class shares) are allocated to separate classes of shares pro rata based upon their relative net assets on the
| | |
| 22 | | MainStay VP T. Rowe Price Equity Income Portfolio |
date the expenses are incurred. The expenses borne by the Portfolio, including those of related parties to the Portfolio, are shown in the Statement of Operations.
Additionally, the Portfolio may invest in mutual funds, which are subject to management fees and other fees that may cause the costs of investing in mutual funds to be greater than the costs of owning the underlying securities directly. These indirect expenses of mutual funds are not included in the amounts shown as expenses in the Portfolio’s Statement of Operations or in the expense ratios included in the Financial Highlights.
(G) Use of Estimates. In preparing financial statements in conformity with GAAP, management makes estimates and assumptions that affect the reported amounts and disclosures in the financial statements. Actual results could differ from those estimates.
(H) Repurchase Agreements. The Portfolio may enter into repurchase agreements (i.e., buy a security from another party with the agreement that it be sold back in the future) to earn income. The Portfolio may enter into repurchase agreements only with counterparties, usually financial institutions, that are deemed by the Manager or the Subadvisor to be creditworthy, pursuant to guidelines established by the Board. During the term of any repurchase agreement, the Manager or the Subadvisor will continue to monitor the creditworthiness of the counterparty. Under the 1940 Act, repurchase agreements are considered to be collateralized loans by the Portfolio to the counterparty secured by the securities transferred to the Portfolio.
Repurchase agreements are subject to counterparty risk, meaning the Portfolio could lose money by the counterparty’s failure to perform under the terms of the agreement. The Portfolio mitigates this risk by ensuring the repurchase agreement is collateralized by cash, U.S. government securities, fixed income securities and/or other securities. The collateral is held by the Portfolio’s custodian and valued daily on a mark to market basis to determine if the value, including accrued interest, exceeds the repurchase price. In the event of the counterparty’s default on the obligation to repurchase, the Portfolio has the right to liquidate the collateral and apply the proceeds in satisfaction of the obligation. Under certain circumstances, such as in the event of default or bankruptcy by the counterparty, realization and/or retention of the collateral may be limited or subject to delay, to legal proceedings and possible realized loss to the Portfolio. As of June 30, 2019, the Portfolio did not hold any repurchase agreements.
(I) Foreign Currency Transactions. The Portfolio’s books and records are maintained in U.S. dollars. Prices of securities denominated in foreign currency amounts are translated into U.S. dollars at the mean between the buying and selling rates last quoted by any major U.S. bank at the following dates:
| (i) | market value of investment securities, other assets and liabilities— at the valuation date; and |
| (ii) | purchases and sales of investment securities, income and expenses—at the date of such transactions. |
The assets and liabilities that are denominated in foreign currency amounts are presented at the exchange rates and market values at the close of the period. The realized and unrealized changes in net assets
arising from fluctuations in exchange rates and market prices of securities are not separately presented.
Net realized gain (loss) on foreign currency transactions represents net gains and losses on foreign currency forward contracts, net currency gains or losses realized as a result of differences between the amounts of securities sale proceeds or purchase cost, dividends, interest and withholding taxes as recorded on the Portfolio’s books, and the U.S. dollar equivalent amount actually received or paid. Net currency gains or losses from valuing such foreign currency denominated assets and liabilities, other than investments at valuation date exchange rates, are reflected in unrealized foreign exchange gains or losses.
(J) Futures Contracts. A futures contract is an agreement to purchase or sell a specified quantity of an underlying instrument at a specified future date and price, or to make or receive a cash payment based on the value of a financial instrument (e.g., foreign currency, interest rate, security or securities index). The Portfolio is subject to risks such as market price risk and/or interest rate risk in the normal course of investing in these transactions. Upon entering into a futures contract, the Portfolio is required to pledge to the broker or futures commission merchant an amount of cash and/or U.S. government securities equal to a certain percentage of the collateral amount, known as the “initial margin.” During the period the futures contract is open, changes in the value of the contract are recognized as unrealized appreciation or depreciation by marking to market such contract on a daily basis to reflect the market value of the contract at the end of each day’s trading. The Portfolio agrees to receive from or pay to the broker or futures commission merchant an amount of cash equal to the daily fluctuation in the value of the contract. Such receipts or payments are known as “variation margin.” When the futures contract is closed, the Portfolio records a realized gain or loss equal to the difference between the proceeds from (or cost of) the closing transaction and the Portfolio’s basis in the contract.
The use of futures contracts involves, to varying degrees, elements of market risk in excess of the amount recognized in the Statement of Assets and Liabilities. The contract or notional amounts and variation margin reflect the extent of the Portfolio’s involvement in open futures positions. There are several risks associated with the use of futures contracts as hedging techniques. There can be no assurance that a liquid market will exist at the time when the Portfolio seeks to close out a futures contract. If no liquid market exists, the Portfolio would remain obligated to meet margin requirements until the position is closed. Futures may involve a small initial investment relative to the risk assumed, which could result in losses greater than if they had not been used. Futures may be more volatile than direct investments in the instrument underlying the futures and may not correlate to the underlying instrument, causing a given hedge not to achieve its objectives. The Portfolio’s activities in futures contracts have minimal counterparty risk as they are conducted through regulated exchanges that guarantee the futures against default by the counterparty. In the event of a bankruptcy or insolvency of a futures commission merchant that holds margin on behalf of the Portfolio, the Portfolio may not be entitled to the return of the entire margin owed to the Portfolio, potentially resulting in a loss. The Portfolio’s investment in futures contracts and other derivatives may increase the volatility of the Portfolio’s NAVs and may result in a loss to the Portfolio. As of June 30, 2019, open futures contracts are shown in the Portfolio of Investments.
Notes to Financial Statements(Unaudited) (continued)
(K) Securities Lending. In order to realize additional income, the Portfolio may engage in securities lending, subject to the limitations set forth in the 1940 Act and relevant guidance by the staff of the Securities and Exchange Commission (“SEC”). In the event the Portfolio does engage in securities lending, the Portfolio will lend through its custodian, State Street Bank and Trust Company (“State Street”), acting as securities lending agent on behalf of the Portfolio. State Street will manage the Portfolio’s collateral in accordance with the securities lending agency agreement between the Portfolio and State Street, and indemnify the Portfolio against counterparty risk. The loans will be collateralized by cash (which may be invested in a money market fund) and/ornon-cash collateral (which may include, U.S. Treasury securities and/or U.S. Government Agency securities issued or guaranteed by the United States government or its agencies or instrumentalities) at least equal at all times to the market value of the securities loaned. The Portfolio may bear the risk of delay in recovery of, or loss of rights in, the securities loaned should the borrower of the securities experience financial difficulty. The Portfolio may also record a realized gain or loss on securities deemed sold due to a borrower’s inability to return securities on loan. The Portfolio bears the risk of any loss on investment of cash collateral. The Portfolio will receive compensation for lending its securities in the form of fees or it will retain a portion of interest on the investment of any cash collateral. The Portfolio will also continue to receive interest and dividends on the securities loaned and any gain or loss in the market price of the securities loaned that may occur during the term of the loan will be for the account of the Portfolio. Income earned from securities lending activities, if any, is reflected in the Statement of Operations. As of June 30, 2019, the Portfolio had securities on loan with an aggregate market value of $2,928,480; the total market value of collateral held by the Portfolio was $2,974,159. The market value of the collateral held includednon-cash collateral in the form of U.S. Treasury securities with a value of $2,148,708 and cash collateral which was invested into the State Street Navigator Securities Lending Government Money Market Portfolio with a value of $825,451.
(L) Foreign Securities Risk. The Portfolio invests in foreign securities, which carry certain risks that are in addition to the usual risks inherent in domestic securities. These risks include those resulting from currency fluctuations, future adverse political or economic developments and possible imposition of currency exchange blockages or other foreign governmental laws or restrictions. These risks are likely to be greater in emerging markets than in developed markets. The ability of issuers of securities held by the Portfolio to meet their obligations may be affected by, among other things, economic or political developments in a specific country, industry or region.
(M) Indemnifications. Under the Fund’s organizational documents, its officers and trustees are indemnified against certain liabilities that may arise out of performance of their duties to the Fund. Additionally, in the normal course of business, the Portfolio enters into contracts with third-party service providers that contain a variety of representations and warranties and which may provide general indemnifications. The Portfolio’s maximum exposure under these arrangements is unknown, as this would involve future claims that may be made against the Portfolio that have not yet occurred. Based on experience, management is of the view that the risk of loss in connection with these potential indemnification obligations is remote. However, there can be no assur-
ance that material liabilities related to such obligations will not arise in the future, which could adversely impact the Portfolio.
(N) Quantitative Disclosure of Derivative Holdings. The following tables show additional disclosures related to the Portfolio’s derivative and hedging activities, including how such activities are accounted for and their effect on the Portfolio’s financial positions, performance and cash flows. The Portfolio entered into futures contracts to help manage the duration and yield curve positioning of the portfolio while minimizing the exposure to wider bid/ask spreads in traditional bonds. These derivatives are not accounted for as hedging instruments.
Fair value of derivative instruments as of June 30, 2019:
Liability Derivatives
| | | | | | | | | | |
| | | Statement of
Assets and
Liabilities
Location | | Equity
Contracts
Risk | | | Total | |
| | | |
Futures Contracts | | Net Assets—Net unrealized depreciation on investments and futures contracts (a) | | $ | (7,778 | ) | | $ | (7,778 | ) |
| | | | | | |
Total Fair Value | | | | $ | (7,778 | ) | | $ | (7,778 | ) |
| | | | | | |
| (a) | Includes cumulative appreciation (depreciation) of futures contracts as reported in the Portfolio of Investments. Only current day’s variation margin is reported within the Statement of Assets and Liabilities. |
The effect of derivative instruments on the Statement of Operations for the period ended June 30, 2019:
Change in Unrealized Appreciation (Depreciation)
| | | | | | | | | | |
| | | Statement of
Operations
Location | | Equity
Contracts
Risk | | | Total | |
| | | |
Futures Contracts | | Net change in unrealized appreciation (depreciation) on futures contracts | | $ | (7,778 | ) | | $ | (7,778 | ) |
| | | | | | |
Total Change in Unrealized Appreciation (Depreciation) | | | | $ | (7,778 | ) | | $ | (7,778 | ) |
| | | | | | |
Average Notional Amount
| | | | | | | | |
| | | Equity
Contracts
Risk | | | Total | |
| | |
Futures Contracts Long (a) | | $ | 1,466,720 | | | $ | 1,466,720 | |
| | | | |
| (a) | Positions were open less than one month during the reporting period. |
Note 3–Fees and Related Party Transactions
(A) Manager and Subadvisor. New York Life Investments, a registered investment adviser and an indirect,wholly-owned subsidiary of New York Life, serves as the Portfolio’s Manager pursuant to an Amended and Restated Management Agreement (“Management
| | |
| 24 | | MainStay VP T. Rowe Price Equity Income Portfolio |
Agreement”). The Manager provides offices, conducts clerical, recordkeeping and bookkeeping services, and keeps most of the financial and accounting records required to be maintained by the Portfolio. Except for the portion of salaries and expenses that are the responsibility of the Portfolio, the Manager pays the salaries and expenses of all personnel affiliated with the Portfolio and certain operational expenses of the Portfolio. The Portfolio reimburses New York Life Investments in an amount equal to a portion of the compensation of the Chief Compliance Officer attributable to the Portfolio. T. Rowe Price Associates, Inc. (“T. Rowe” or “Subadvisor”), a registered investment adviser, serves as Subadvisor to the Portfolio and is responsible for theday-to-day portfolio management of the Portfolio. Pursuant to the terms of a Subadvisory Agreement (“Subadvisory Agreement”) between New York Life Investments and T. Rowe, New York Life Investments pays for the services of the Subadvisor.
The Fund, on behalf of the Portfolio, pays New York Life Investments in its capacity as the Portfolio’s investment manager and administrator, pursuant to the Management Agreement, a monthly fee for the services performed and facilities furnished at an annual percentage of the Portfolio’s average daily net assets as follows: 0.725% up to $500 million; 0.70% from $500 million to $1 billion; and 0.675% in excess of $1 billion.
Effective, May 1, 2019, New York Life Investments allowed its contractually expense limitation agreement to expire. Prior to that date New York Life Investments waived fees and/or reimburse expenses so that total annual operating expenses (excluding taxes, interest, litigation, extraordinary expenses, brokerage and other transaction expenses relating to the purchase or sale of portfolio investments, and acquired (underlying) portfolio/fund fees and expenses) did not exceed 0.85% for Initial Class shares and 1.10% for Service Class shares. During the six-month period ended June 30, 2019, the effective management fee rate was 0.72% (exclusive of any applicable waivers/reimbursements).
During the six-month period ended June 30, 2019, New York Life Investments earned fees from the Portfolio in the amount of $2,592,776, and paid the Subadvisor in the amount of $1,056,225.
State Street providessub-administration andsub-accounting services to the Portfolio pursuant to an agreement with New York Life Investments. These services include calculating the daily NAVs of the Portfolio, maintaining the general ledger andsub-ledger accounts for the calculation of the Portfolio’s NAVs and assisting New York Life Investments in conducting various aspects of the Portfolio’s administrative operations. For providing these services to the Portfolio, State Street is compensated by New York Life Investments.
Pursuant to an agreement between the Fund and New York Life Investments, New York Life Investments is responsible for providing or procuring certain regulatory reporting services for the Portfolio. The Portfolio will reimburse New York Life Investments for the actual costs incurred by New York Life Investments in connection with providing or procuring these services for the Portfolio.
(B) Distribution and Service Fees. The Fund, on behalf of the Portfolio, has entered into a distribution agreement with NYLIFE Distributors LLC (the “Distributor”), an indirect,wholly-owned subsidiary of New York Life. The Portfolio has adopted a distribution plan (the “Plan”) in accordance with the provisions of Rule 12b-1 under the 1940 Act. Under the Plan, the Distributor has agreed to provide, through its affiliates or independent third parties, various distribution-related, shareholder and administrative support services to the Service Class shareholders. For its services, the Distributor is entitled to a combined distribution and service fee accrued daily and paid monthly at an annual rate of 0.25% of the average daily net assets attributable to the Service Class shares of the Portfolio.
(C) Investments in Affiliates (in 000’s). During the six-month period ended June 30, 2019, purchases and sales transactions, income earned from investments and shares held of investment companies managed by New York Life Investments or its affiliates were as follows:
| | | | | | | | | | | | | | | | | | | | | | | | | | | | | | | | | | | | |
Affiliated Investment Company | | Value,
Beginning of
Period | | | Purchases
at Cost | | | Proceeds from
Sales | | | Net Realized
Gain/(Loss)
on Sales | | | Change in
Unrealized
Appreciation/
(Depreciation) | | | Value,
End of
Period | | | Dividend
Income | | | Other
Distributions | | | Shares
End of
Period | |
MainStay U.S. Government Liquidity Fund | | $ | 11,669 | | | $ | 59,235 | | | $ | (59,041 | ) | | $ | — | | | $ | — | | | $ | 11,863 | | | $ | 110 | | | $ | — | | | | 11,863 | |
Note 4–Federal Income Tax
As of June 30, 2019, the cost and unrealized appreciation (depreciation) of the Portfolio’s investment portfolio, including applicable derivative contracts and other financial instruments, as determined on a federal income tax basis, were as follows:
| | | | | | | | | | | | | | | | |
| | | Federal Tax
Cost | | | Gross
Unrealized
Appreciation | | | Gross
Unrealized
(Depreciation) | | | Net
Unrealized
Appreciation/
(Depreciation) | |
| | | | |
Investments in Securities | | $ | 633,148,922 | | | $ | 127,477,761 | | | $ | (34,253,771 | ) | | $ | 93,223,990 | |
During the year ended December 31, 2018, the tax character of distributions paid as reflected in the Statements of Changes in Net Assets was as follows:
| | |
|
| 2018 |
Tax-Based
Distributions
from Ordinary
Income | | Tax-Based
Distributions
from Long-Term
Gains |
| |
| $16,048,373 | | $66,399,522 |
Notes to Financial Statements(Unaudited) (continued)
Note 5–Custodian
State Street is the custodian of cash and securities held by the Portfolio. Custodial fees are charged to the Portfolio based on the Portfolio’s net assets and/or the market value of securities held by the Portfolio and the number of certain transactions incurred by the Portfolio.
Note 6–Line of Credit
The Portfolio and certain other funds managed by New York Life Investments maintain a line of credit with a syndicate of banks in order to secure a source of funds for temporary purposes to meet unanticipated or excessive redemption requests.
Effective July 30, 2019, under the credit agreement (the “Credit Agreement”), the aggregate commitment amount is $600,000,000 with an additional uncommitted amount of $100,000,000. The commitment fee is an annual rate of 0.15% of the average commitment amount payable quarterly, regardless of usage, to State Street, who serves as the agent to the syndicate. The commitment fee is allocated among the Portfolio and certain other funds managed by New York Life Investments based upon their respective net assets and other factors. Interest on any revolving credit loan is charged based upon the Federal Funds Rate or the one-month London Interbank Offered Rate (“LIBOR”), whichever is higher. The Credit Agreement expires on July 28, 2020, although the Portfolio, certain other funds managed by New York Life Investments and the syndicate of banks may renew the Credit Agreement for an additional year on the same or different terms. Prior to July 30, 2019, the aggregate commitment amount and the commitment fee were the same as those under the current Credit Agreement. During thesix-month period ended June 30, 2019, there were no borrowings made or outstanding with respect to the Portfolio under the Credit Agreement.
Note 7–Interfund Lending Program
Pursuant to an exemptive order issued by the SEC, the Portfolio, along with certain other funds managed by New York Life Investments, may participate in an interfund lending program. The interfund lending program provides an alternative credit facility that permits the Portfolio and certain other funds managed by New York Life Investments to lend or borrow money for temporary purposes directly to or from one another subject to the conditions of the exemptive order. During the six-month period ended June 30, 2019, there were no interfund loans made or outstanding with respect to the Portfolio.
Note 8–Purchases and Sales of Securities (in 000’s)
During the six-month period ended June 30, 2019, purchases and sales of securities, other thanshort-term securities, were $57,046 and $117,378, respectively.
Note 9–Capital Share Transactions
Transactions in capital shares for the six-month period ended June 30, 2019 and the year ended December 31, 2018, were as follows:
| | | | | | | | |
Initial Class | | Shares | | | Amount | |
| | |
Six-month period ended June 30, 2019: | | | | | | | | |
Shares sold | | | 205,867 | | | $ | 2,495,737 | |
Shares redeemed | | | (3,457,600 | ) | | | (43,794,648 | ) |
| | | | |
Net increase (decrease) | | | (3,251,733 | ) | | $ | (41,298,911 | ) |
| | | | |
Year ended December 31, 2018: | | | | | | | | |
Shares sold | | | 5,071,297 | | | $ | 59,910,665 | |
Shares issued to shareholders in reinvestment of dividends and distributions | | | 3,775,622 | | | | 49,365,312 | |
Shares redeemed | | | (4,243,760 | ) | | | (58,376,513 | ) |
| | | | |
Net increase (decrease) | | | 4,603,159 | | | $ | 50,899,464 | |
| | | | |
| | |
| | | | | | | | |
Service Class | | Shares | | | Amount | |
Six-month period ended June 30, 2019: | | | | | | | | |
Shares sold | | | 117,805 | | | $ | 1,448,132 | |
Shares redeemed | | | (2,242,700 | ) | | | (28,218,160 | ) |
| | | | |
Net increase (decrease) | | | (2,124,895 | ) | | $ | (26,770,028 | ) |
| | | | |
Year ended December 31, 2018: | | | | | | | | |
Shares sold | | | 343,965 | | | $ | 4,649,766 | |
Shares issued to shareholders in reinvestment of dividends and distributions | | | 2,539,833 | | | | 33,082,583 | |
Shares redeemed | | | (5,020,137 | ) | | | (68,837,860 | ) |
| | | | |
Net increase (decrease) | | | (2,136,339 | ) | | $ | (31,105,511 | ) |
| | | | |
Note 10–Recent Accounting Pronouncement
To improve the effectiveness of fair value disclosure requirements, the Financial Accounting Standards Board recently issued Accounting Standard Update (ASU)2018-13, Fair Value Measurement Disclosure Framework—Changes to the Disclosure Requirements for Fair Value Measurement (ASU2018-13), which adds, removes, and modifies certain aspects relating to fair value disclosure. ASU2018-13 is effective for interim and annual reporting periods beginning after December 15, 2019; early adoption of the additions relating toASU 2018-13 is not required. Management has evaluated the implications of certain other provisions of the ASU and has determined to early adopt aspects related to the removal and modifications of certain fair value measurement disclosures under the ASU effective immediately. At this time, management is evaluating the implications of certain other provisions of the ASU related to new disclosure requirements and any impact on the financial statement disclosures has not yet been determined.
Note 11–Subsequent Events
In connection with the preparation of the financial statements of the Portfolio as of and for the six-month period ended June 30, 2019, events and transactions subsequent to June 30, 2019, through the date the financial statements were issued have been evaluated by the Portfolio’s management for possible adjustment and/or disclosure. No subsequent events requiring financial statement adjustment or disclosure have been identified.
| | |
| 26 | | MainStay VP T. Rowe Price Equity Income Portfolio |
Proxy Voting Policies and Procedures and Proxy Voting Record
A description of the policies and procedures that New York Life Investments uses to vote proxies related to the Portfolio’s securities is available without charge, upon request (i) by calling800-598-2019; (ii) by visiting New York Life Investments website at https://www.nylinvestments.com/mainstay/products-and-performance/mainstay-vp-funds-trust; or (iii) by visiting the SEC’s website at www.sec.gov.
The Portfolio is required to file with the SEC its proxy voting record for the12-month period ending June 30 on Form N-PX. The Portfolio’s most recent Form N-PX or proxy voting record is available free of charge upon request (i) by calling800-598-2019; (ii) by visiting New York Life Investments website at https://www.nylinvestments.com/mainstay/products-and-performance/mainstay-vp-funds-trust; or (iii) by visiting the SEC’s website atwww.sec.gov.
Shareholder Reports and Quarterly Portfolio Disclosure
The Portfolio is required to file its complete schedule of portfolio holdings with the SEC 60 days after each fiscal quarter onForm N-PORT. The Portfolio’s holdings report is available without charge upon request (i) by calling800-598-2019; (ii) by visiting New York Life Investments website at https://www.nylinvestments.com/mainstay/products-and-performance/mainstay-vp-funds-trust; or (iii) on the SEC’s website at www.sec.gov.
MainStay VP Portfolios
MainStay VP offers a wide range of Portfolios. The full array of MainStay VP offerings is listed here, with information about the manager, subadvisors, legal counsel, and independent registered public accounting firm.
Equity Portfolios
MainStay VP Eagle Small Cap Growth Portfolio
MainStay VP Emerging Markets Equity Portfolio
MainStay VP Epoch U.S. Equity Yield Portfolio
MainStay VP Fidelity Institutional AM® Utilities Portfolio†
MainStay VP Large Cap Growth Portfolio
MainStay VP MacKay Common Stock Portfolio
MainStay VP MacKay Growth Portfolio
MainStay VP MacKay International Equity Portfolio
MainStay VP MacKay Mid Cap Core Portfolio
MainStay VP MacKay S&P 500 Index Portfolio
MainStay VP MacKay Small Cap Core Portfolio
MainStay VP Mellon Natural Resources Portfolio
MainStay VP T. Rowe Price Equity Income Portfolio
Mixed Asset Portfolios
MainStay VP Balanced Portfolio
MainStay VP Income Builder Portfolio
MainStay VP Janus Henderson Balanced Portfolio
MainStay VP MacKay Convertible Portfolio
Income Portfolios
MainStay VP Bond Portfolio
MainStay VP Floating Rate Portfolio
MainStay VP Indexed Bond Portfolio
MainStay VP MacKay Government Portfolio
MainStay VP MacKay High Yield Corporate Bond Portfolio
MainStay VP MacKay Unconstrained Bond Portfolio
MainStay VP PIMCO Real Return Portfolio
Money Market
MainStay VP U.S. Government Money Market Portfolio
Alternative
MainStay VP Cushing Renaissance Advantage Portfolio
MainStay VP IQ Hedge Multi-Strategy Portfolio
Asset Allocation Portfolios
MainStay VP Conservative Allocation Portfolio
MainStay VP Growth Allocation Portfolio
MainStay VP Moderate Allocation Portfolio
MainStay VP Moderate Growth Allocation Portfolio
Manager
New York Life Investment Management LLC
New York, New York
Subadvisors
Candriam Belgium*
Brussels, Belgium
Cushing Asset Management, LP
Dallas, Texas
Eagle Asset Management, Inc.
St Petersburg, Florida
Epoch Investment Partners, Inc.
New York, New York
FIAM LLC
Smithfield, Rhode Island
IndexIQ Advisors LLC*
New York, New York
Janus Capital Management LLC
Denver, Colorado
MacKay Shields LLC*
New York, New York
Mellon Investments Corporation
Boston, Massachusetts
NYL Investors LLC*
New York, New York
Pacific Investment Management Company LLC
Newport Beach, California
T. Rowe Price Associates, Inc.
Baltimore, Maryland
Winslow Capital Management, LLC
Minneapolis, Minnesota
Distributor
NYLIFE Distributors LLC*
Jersey City, New Jersey
Custodian
State Street Bank and Trust Company
Boston, Massachusetts
Independent Registered Public Accounting Firm
PricewaterhouseCoopers LLP
New York, New York
Legal Counsel
Dechert LLP
Washington, District of Columbia
Some Portfolios may not be available in all products.
| † | Fidelity Institutional AM is a registered trade mark of FMR LLC. Used with permission. |
| * | An affiliate of New York Life Investment Management LLC |
Not part of the Semiannual Report
2019 Semiannual Report
This report is for the general information of New York Life Variable Annuities and NYLIAC Variable Universal Life Insurance Products policyowners. It must be preceded or accompanied by the appropriate product(s) and funds prospectuses if it is given to anyone who is not an owner of a New York Life variable annuity policy or a NYLIAC Variable Universal Life Insurance Product. This report does not offer for sale or solicit orders to purchase securities.
The performance data quoted in this report represents past performance. Past performance is no guarantee of future results. Due to market volatility and other factors, current performance may be lower or higher than the figures shown. The most recent month-end performance summary for your variable annuity or variable life policy is available by calling 800-598-2019 and is updated periodically on www.newyorklife.com.
The New York Life Variable Annuities and NYLIAC Variable Universal Life Insurance Products are issued by New York Life Insurance and Annuity Corporation (a Delaware Corporation) and distributed by NYLIFE Distributors LLC (Member FINRA/SIPC).
New York Life Insurance Company
New York Life Insurance and Annuity Corporation (NYLIAC) (A Delaware Corporation)
51 Madison Avenue, Room 551
New York, NY 10010
www.newyorklife.com
Printed on recycled paper
nylinvestments.com
NYLIFE Distributors LLC, 30 Hudson Street, Jersey City, NJ 07302
New York Life Investment Management LLC is the investment manager to the MainStay VP Funds Trust
©2019 by NYLIFE Distributors LLC. All rights reserved.
You may obtain copies of the Prospectus and the Statement of Additional Information free of charge, upon request, by callingtoll-free 800-598-2019 or writing to New York Life Insurance and Annuity Corporation, 51 Madison Avenue, New York, NY 10010.
| | | | |
| | | |
| Not FDIC Insured | | No Bank Guarantee | | May Lose Value |
| | | | |
| 1781643 | | | | MSVPTRPE10-08/19 (NYLIAC) NI531 |
MainStay VP U.S. Government Money Market Portfolio
Message from the President and Semiannual Report
Unaudited | June 30, 2019

Beginning on January 1, 2021, as permitted by regulations adopted by the Securities and Exchange Commission, paper copies of the MainStay VP Portfolio annual and semi-annual shareholder reports may no longer be sent by mail, unless you specifically request paper copies of the reports from the insurance company that offers your policy. Instead, the reports will be made available online, and you will be notified by mail each time a report is posted and provided with a website link to access the report. Instructions for requesting paper copies will be provided by your insurance company.
If you already elected to receive shareholder reports electronically, you will not be affected by this change and you need not take any action. At any time, you may elect to receive reports and other communications from the insurance company electronically by following the instructions provided by the insurance company.
You may elect to receive all future shareholder reports in paper form free of charge. You can inform the insurance company that you wish to receive paper copies of reports by following the instructions provided by the insurance company. Your election to receive reports in paper form will apply to all portfolio companies available under your contract.
| | | | | | | | |
| | | | | |
| Not FDIC/NCUA Insured | | Not a Deposit | | May Lose Value | | No Bank Guarantee | | Not Insured by Any Government Agency |

This page intentionally left blank
Message from the President
Most equity and fixed-income markets in the United States and around the world advanced in the face of conflicting political and macroeconomic forces during thesix-month period ended June 30, 2019.
The reporting period began on the heels of tumultuous December 2018, during which equities and equity-sensitive bonds spiked sharply lower on concerns regarding the pace of economic growth, a U.S. government shutdown and the potential impact of trade disputes between the United States and other nations, particularly China. Markets recovered quickly in early 2019 as trade tensions eased, the government reopened and the U.S. Federal Reserve Board (Fed) adopted a more patient tone regarding the future direction of interest rates. Markets moved broadly higher from January through April, supported by encouraging economic data and generally strong corporate earnings.
During the first four months of the reporting period, the improving economic environment encouraged investors to favor areas of the market viewed as offering greater return potential along with higher risks. Among U.S. stocks, cyclical, growth-oriented sectors tended to outperform more defensive, value-oriented sectors, whilelarge-cap stocks outperformed theirsmaller-cap counterparts. Within the S&P 500® Index, the information technology sector led the market’s advance, followed by communication services, consumer discretionary and consumer staples. Industrials, utilities, financials, materials, real estate and energy produced more modest gains. While some international equity markets outperformed or underperformed the U.S. market, on average international stocks mirrored the performance of their U.S. counterparts. Fixed-income securities gained ground as well, albeit along a more gradual trajectory. Among U.S. fixed-income instruments, corporate issues generally outperformed government bonds, with lower credit quality, higher yielding securities leading the sector’s advance. Long-term U.S. Treasury bond yields proved particularly weak, with
10-year yields dipping at times below3-month yields, reflecting investors’ continued concerns about domestic economic growth.
May 2019 saw a return of uncertainty and volatility. Trade discussions between the United States and China faltered, driving global equity prices lower. Government bond prices rose as investors sought safe havens. June brought yet anotherU-turn as equity prices climbed again after comments from the Fed raised hopes of an interest rate cut in response to weak economic data. Stock and bond prices rose, with U.S. equity markets ending the reporting period in record territory.
We are pleased to see renewed signs of strength in broad areas of the financial market. At the same time, we remained sharply focused on providing you, as a MainStay VP investor, with the experienced and disciplined fund management that we believe underpins an effective, long-term investment strategy. Whatever tomorrow’s investment environment brings, you can rely on our portfolio managers to pursue the objectives of their individual Portfolios as outlined in the prospectus with the energy and dedication you have come to expect.
The report that follows contains additional information on the market events, investment decisions and specific securities that shaped your VP Portfolio’s performance during the six months ended June 30, 2019. We encourage you to read the report carefully and use it to evaluate your Portfolio’s performance in light of your long-range financial plan.
Sincerely,

Kirk C. Lehneis
President
The opinions expressed are as of the date of this report and are subject to change. There is no guarantee that any forecast made will come to pass. This material does not constitute investment advice and is not intended as an endorsement of any specific investment. Past performance is no guarantee of future results.
Not part of the Semiannual Report
Table of Contents
An investment in the Portfolio is not insured or guaranteed by the Federal Deposit Insurance Corporation or any other government agency. Although the Portfolio seeks to preserve the value of your investment at $1.00 per share, it cannot guarantee it will do so. You could lose money by investing in the Portfolio. The Portfolio’s sponsor has no legal obligation to provide financial support to the Portfolio, and you should not expect that the sponsor will provide financial support to the Portfolio at any time.
Investors should refer to the Portfolio’s Summary Prospectus and/or Prospectus and consider the Portfolio’s investment objectives, strategies, risks, charges and expenses carefully before investing. The Summary Prospectus and/or Prospectus contain this and other information about the Portfolio. You may obtain copies of the Portfolio’s Summary Prospectus and/or the Prospectus and the Statement of Additional Information free of charge, upon request, by calling toll-free 800-598-2019, by writing to New York Life Insurance and Annuity Corporation, 51 Madison Avenue, Room 251, New York, New York 10010 or by sending an email to MainStayShareholdersServices@nylim.com. These documents are also available at nylinvestments.com/vpdocuments. Please read the Summary Prospectus and/or Prospectus carefully before investing. MainStay VP Funds Trust portfolios are separate account options which are purchased through a variable insurance or variable annuity contract.
Investment and Performance Comparison1(Unaudited)
Performance data quoted represents past performance. Past performance is no guarantee of future results. Because of market volatility and other factors, current performance may be lower or higher than the figures shown. Investment return and principal value will fluctuate, and as a result, when shares are redeemed, they may be worth more or less than their original cost. The performance table and graph do not reflect any deduction for separate account or policy fees or charges imposed under the variable annuity policies and variable universal life insurance policies for which the Portfolio is an investment option. Please refer to the Performance Summary appropriate for your policy. For performance information current to the most recent month-end, please call800-598-2019 or visit www.newyorklife.com.
An investment in the Portfolio is not insured or guaranteed by the Federal Deposit Insurance Corporation or any other government agency. Although the Portfolio seeks to preserve the value of your investment at $1.00 per share, it is possible to lose money by investing in the Portfolio.
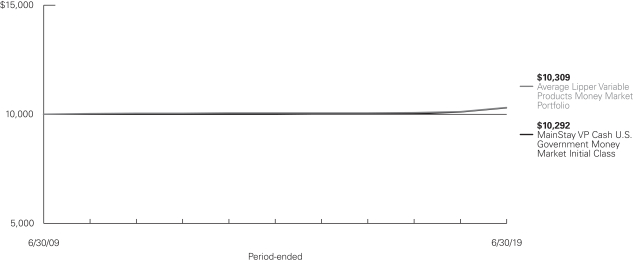
Average Annual Total Returns for the Period-Ended June 30, 2019
| | | | | | | | | | | | | | | | |
| Class | | Inception Date | | Six Months | | One Year | | Five Years | | Ten Years | | | Gross Expense Ratio2 | |
| | | | | | |
| Initial Class Shares | | 1/29/1993 | | 0.99% | | 1.82% | | 0.56% | | | 0.29 | % | | | 0.44 | % |
| |
| 7-Day Current = 1.92%; 7-Day Effective = 1.94%.3 | | | | | |
| | | | | | | | | | | | | | | | |
| Benchmark Performance | | Six Months | | | One
Year | | | Five
Years | | | Ten Years | |
| | | | |
Average Lipper Variable Products Money Market Portfolio4 | | | 1.03% | | | | 1.84 | % | | | 0.60 | % | | | 0.31 | % |
Morningstar Prime Money Market Category Average5 | | | 1.05 | | | | 1.96 | | | | 0.68 | | | | 0.36 | |
| 1. | Performance figures may reflect certain fee waivers and/or expense limitations, without which total returns may have been lower. For information on current fee waivers and/or expense limitations (if any), please refer to the Notes to Financial Statements. |
| 2. | The gross expense ratios presented reflect the Portfolio’s “Total Annual Portfolio Operating Expenses” from the most recent Prospectus, as supplemented, and may differ from other expense ratios disclosed in this report. |
| 3. | As of June 30, 2019, MainStay VP U.S. Government Money Market Portfolio had an effective 7-day current = 1.92%; 7-day effective = 1.94%. The current yield is more reflective of the Portfolio’s earnings than the total return. |
| 4. | The Average Lipper Variable Products Money Market Portfolio is an equally weighted performance average adjusted for capital gains distributions and |
| | income dividends of all of the money market portfolios in the Lipper Universe. Lipper Inc., a wholly-owned subsidiary of Reuters Group PLC, is an independent monitor of mutual fund performance. Lipper averages are not class specific. Lipper returns are unaudited. Results are based on average total returns of similar portfolios with all dividend and capital gain distributions reinvested. |
| 5. | The Morningstar Prime Money Market Category Average is representative of funds that invest in short-term money market securities in order to provide a level of current income that is consistent with the preservation of capital. Results are based on average total returns of similar funds with all dividends and capital gain distributions reinvested. |
Cost in Dollars of a $1,000 Investment in MainStay VP U.S. Government Money Market Portfolio (Unaudited)
The example below is intended to describe the fees and expenses borne by shareholders during the six-month period from January 1, 2019, to June 30, 2019, and the impact of those costs on your investment.
Example
As a shareholder of the Portfolio you incur two types of costs: (1) transaction costs, including exchange fees and sales charges (loads) on purchases (as applicable), and (2) ongoing costs, including management fees, distribution and/or service (12b-1) fees, and other Portfolio expenses (as applicable). This example is intended to help you understand your ongoing costs (in dollars) of investing in the Portfolio and to compare these costs with the ongoing costs of investing in other mutual funds. The example is based on an investment of $1,000 made at the beginning of the six-month period and held for the entire period from January 1, 2019, to June 30, 2019. Shares are only sold in connection with variable life and annuity contracts and the example does not reflect any contract level or transactional fees or expenses. If these costs had been included, your costs would have been higher.
This example illustrates your Portfolio’s ongoing costs in two ways:
Actual Expenses
The second and third data columns in the table below provide information about actual account values and actual expenses. You may use the information in these columns, together with the amount you invested, to estimate the expenses that you paid during the six months ended June 30, 2019. Simply divide your account value by $1,000
(for example, an $8,600 account value divided by $1,000 = 8.6), then multiply the result by the number under the heading entitled “Expenses Paid During Period” to estimate the expenses you paid on your account during this period.
Hypothetical Example for Comparison Purposes
The fourth and fifth data columns in the table below provide information about hypothetical account values and hypothetical expenses based on the Portfolio’s actual expense ratio and an assumed rate of return of 5% per year before expenses, which is not the Portfolio’s actual return. The hypothetical account values and expenses may not be used to estimate the actual ending account balances or expenses you paid for the six-month period shown. You may use this information to compare the ongoing costs of investing in the Portfolio with the ongoing costs of investing in other mutual funds. To do so, compare this 5% hypothetical example with the 5% hypothetical examples that appear in the shareholder reports of the other mutual funds.
Please note that the expenses shown in the table are meant to highlight your ongoing costs only and do not reflect any transactional costs, such as exchange fees or sales charges (loads). Therefore, the fourth and fifth data columns of the table are useful in comparing ongoing costs only and will not help you determine the relative total costs of owning different funds. In addition, if these transactional costs were included, your costs would have been higher.
| | | | | | | | | | | | | | | | | | | | | | |
| | | | | | | | | | | | | | | | | | |
| Share Class | | Beginning
Account
Value
1/1/19 | | | Ending Account
Value (Based
on Actual
Returns and
Expenses)
6/30/19 | | | Expenses
Paid
During
Period1 | | | Ending Account
Value (Based
on Hypothetical
5% Annualized
Return and
Actual Expenses)
6/30/19 | | | Expenses
Paid
During
Period1 | | | Net Expense
Ratio
During
Period2 |
| | | | | | |
| Initial Class Shares | | $ | 1,000.00 | | | $ | 1,009.90 | | | $ | 2.19 | | | $ | 1,022.61 | | | $ | 2.21 | | | 0.44% |
| 1. | Expenses are equal to the Portfolio’s annualized expense ratio of each class multiplied by the average account value over the period, divided by 365 and multiplied by 181 (to reflect the six-month period). The table above represents the actual expenses incurred during the six-month period. |
| 2. | Expenses are equal to the Portfolio’s annualized expense ratio to reflect the six-month period. |
| | |
| 6 | | MainStay VP U.S. Government Money Market Portfolio |
Portfolio Composition as of June 30, 2019(Unaudited)

See Portfolio of Investments beginning on page 9 for specific holdings within these categories. The Portfolio’s holdings are subject to change.
Portfolio Management Discussion and Analysis(Unaudited)
Questions answered by NYL Investors LLC, the Portfolio’s Subadvisor.
How did MainStay VP U.S. Government Money Market Portfolio perform relative to its peers during the six months ended June 30, 2019?
As of June 30, 2019, Initial Class shares of MainStay VP U.S. Government Money Market Portfolio provided a7-day current yield of 1.92% and a7-day effective yield of 1.94%. For the six months ended June 30, 2019, Initial Class shares of MainStay VP U.S. Government Money Market Portfolio returned .99%. The Portfolio underperformed the 1.03% return of the Average Lipper Variable Products Money Market Portfolio and the 1.05% return of the Morningstar Prime Money Market Category Average for the six months ended June 30, 2019.1
What was the Portfolio’s duration2 strategy during the reporting period?
The Portfolio lengthened its duration during the reporting period to the extent possible given its liquidity constraints. As of June 30, 2019, the Portfolio’s duration stood at 33 days.
What specific factors, risks or market forces prompted significant decisions for the Portfolio during the reporting period?
The reporting period saw persistent conflicts between the United States and some of its trading partners, heightening tensions with North Korea and Iran, and disappointing international economic performance. These circumstances threatened U.S. growth potential and pressured interest rates, affecting the Portfolio’s investment environment. In particular, the domestic yield curve3 shifted downward and, in March 2019, the curve inverted, with yields for long-term Treasury bonds falling below
yields for some shorter-term Treasury bills. As the likelihood of a U.S. Federal Reserve rate cut increased, in our opinion, we lengthened the Portfolio’s duration.
During the reporting period, which market segments were the strongest contributors to the Portfolio’s performance and which market segments were particularly weak?
Floating-rate agency bonds offered relatively high yields during the reporting period, while U.S. Treasury bills produced lower yields for the Portfolio. Returns also benefited from the Portfolio’s substantial, laddered allocation to1-year Treasury coupons throughout the same period.
Did the Portfolio make any significant purchases or sales during the reporting period?
The Portfolio purchased one Federal Home Loan Bank bond and two Federal Farm Credit Bank floating-rate notes during the reporting period. These securities contributed positively to the Portfolio’s yield. (Contributions take weightings and total returns into account.) Because the Portfolio typically holds securities until they mature, there were no significant sales during the reporting period.
How did the Portfolio’s asset class weightings change during the reporting period?
The Portfolio modestly decreased its holdings in the U.S. Treasury sector in favor of agency debt. The Portfolio also reduced its position in repurchase agreements due to a counterparty pulling back their offering.
| 1. | See footnote on page 5 for more information on benchmark and peer group returns. |
| 2. | Duration is a measure of the price sensitivity of a fixed-income investment to changes in interest rates. Duration is expressed as a number of days or years and is considered a more accurate sensitivity gauge than average maturity. |
| 3. | The yield curve is a line that plots the yields of various securities of similar quality—typically U.S. Treasury issues—across a range of maturities. The U.S. Treasury yield curve serves as a benchmark for other debt and is used in economic forecasting. |
The opinions expressed are those of the portfolio managers as of the date of this report and are subject to change. There is no guarantee that any forecasts will come to pass. This material does not constitute investment advice and is not intended as an endorsement of any specific investment.
Not all MainStay VP Portfolios and/or share classes are available under all policies.
| | |
| 8 | | MainStay VP U.S. Government Money Market Portfolio |
Portfolio of InvestmentsJune 30, 2019 (Unaudited)
| | | | | | | | |
| | | Principal
Amount | | | Amortized
Cost | |
| | | | | | | | |
| Short-Term Investments 93.4%† | |
Government Agency Debt 54.2% | |
Federal Agricultural Mortgage Corp. (a) | | | | | | | | |
2.233%, due 7/19/19 | | $ | 50,000,000 | | | $ | 49,944,750 | |
2.233%, due 7/22/19 | | | 10,000,000 | | | | 9,987,138 | |
Federal Farm Credit Banks (a) | | | | | | | | |
2.231%, due 7/10/19 | | | 6,500,000 | | | | 6,496,263 | |
2.233%, due 7/22/19 | | | 5,000,000 | | | | 4,993,583 | |
2.409% (1 Month LIBOR–0.02%), due 4/30/20 (b) | | | 15,000,000 | | | | 15,000,000 | |
2.502% (1 Month LIBOR + 0.01%), due 7/2/20 (b) | | | 10,000,000 | | | | 10,000,000 | |
Federal Home Loan Banks (a) | | | | | | | | |
2.233%, due 7/24/19 | | | 10,000,000 | | | | 9,984,922 | |
2.234%, due 7/31/19 | | | 26,400,000 | | | | 26,349,363 | |
2.247%, due 8/16/19 | | | 14,000,000 | | | | 13,958,229 | |
2.248%, due 8/28/19 | | | 35,345,000 | | | | 35,211,361 | |
2.42% (SOFR + 0.00), due 12/11/19 (b) | | | 13,000,000 | | | | 13,000,000 | |
Tennessee Valley Authority (a) | | | | | | | | |
2.231%, due 7/10/19 | | | 12,000,000 | | | | 11,991,204 | |
2.232%, due 7/17/19 | | | 20,000,000 | | | | 19,980,445 | |
| | | | | | | | |
Total Government Agency Debt
(Cost $226,897,258) | | | | | | | 226,897,258 | |
| | | | | | | | |
|
Treasury Debt 18.9% | |
United States Treasury Bills (a) | | | | | | | | |
1.967%, due 7/2/19 | | | 25,000,000 | | | | 24,998,407 | |
2.096%, due 7/23/19 | | | 14,390,000 | | | | 14,371,700 | |
United States Treasury Notes (a) | | | | | | | | |
1.00%, due 8/31/19 | | | 5,000,000 | | | | 4,986,319 | |
1.00%, due 10/15/19 | | | 5,000,000 | | | | 4,976,468 | |
1.00%, due 11/30/19 | | | 5,000,000 | | | | 4,964,442 | |
1.125%, due 12/31/19 | | | 5,000,000 | | | | 4,965,230 | |
1.375%, due 2/15/20 | | | 5,000,000 | | | | 4,964,087 | |
1.625%, due 7/31/19 | | | 5,000,000 | | | | 4,995,959 | |
1.75%, due 9/30/19 | | | 5,000,000 | | | | 4,988,475 | |
2.00%, due 1/31/20 | | | 5,000,000 | | | | 4,984,567 | |
| | | | | | | | |
Total Treasury Debt
(Cost $79,195,654) | | | | | | | 79,195,654 | |
| | | | | | | | |
|
Treasury Repurchase Agreements 20.3% | |
Bank of America N.A.
2.48%, dated 6/28/19
due 7/1/19
Proceeds at Maturity $25,005,167 (Collateralized by a United States Treasury Note with a rate of 2.50% and maturity date of 2/28/26, with a Principal Amount of $24,343,600 and a Market Value of $25,500,023) | | | 25,000,000 | | | | 25,000,000 | |
| | | | | | | | |
| | | Principal
Amount | | | Amortized
Cost | |
Treasury Repurchase Agreements (continued) | |
RBC Capital Markets
2.46%, dated 6/28/19
due 7/1/19
Proceeds at Maturity $34,794,131 (Collateralized by a United States Treasury Note with a rate of 1.25% and maturity of 3/31/21, with a Principal Amount of $35,724,000 and a Market Value of $35,490,101) | | $ | 34,787,000 | | | $ | 34,787,000 | |
Toronto Dominion Bank
2.50%, dated 6/28/19
due 3/1/19
Proceeds at Maturity $25,005,208 (Collateralized by a United States Treasury Note with a rate of 2.625% and maturity date of 6/15/21, with a Principal Amount of $25,059,900 and a Market Value of $25,500,087) | | | 25,000,000 | | | | 25,000,000 | |
| | | | | | | | |
Total Treasury Repurchase Agreements
(Cost $84,787,000) | | | | | | | 84,787,000 | |
| | | | | | | | |
TotalShort-Term Investments
(Cost $390,879,912) | | | | | | | 390,879,912 | |
| | | | | | | | |
Total Investments
(Cost $390,879,912) | | | 93.4 | % | | | 390,879,912 | |
Other Assets, Less Liabilities | | | 6.6 | | | | 27,756,804 | |
Net Assets | | | 100.0 | % | | $ | 418,636,716 | |
| † | Percentages indicated are based on Portfolio net assets. |
| (a) | Interest rate shown represents yield to maturity. |
| (b) | Floating rate—Rate shown was the rate in effect as of June 30, 2019. |
The following abbreviation is used in the preceding pages:
LIBOR—London Interbank Offered Rate
SOFR—Secured Overnight Financing Rate
| | | | | | |
The notes to the financial statements are an integral part of,
and should be read in conjunction with, the financial statements. | | | | | 9 | |
Portfolio of InvestmentsJune 30, 2019 (Unaudited) (continued)
The following is a summary of the fair valuations according to the inputs used as of June 30, 2019, for valuing the Portfolio’s assets:
| | | | | | | | | | | | | | | | |
Description | | Quoted
Prices in
Active
Markets for
Identical
Assets
(Level 1) | | | Significant
Other
Observable
Inputs
(Level 2) | | | Significant
Unobservable
Inputs (Level 3) | | | Total | |
| | | | |
Asset Valuation Inputs | | | | | | | | | | | | | | | | |
| Investments in Securities (a) | | | | | | | | | | | | | | | | |
| Short-Term Investments | | | | | | | | | | | | | | | | |
Government Agency Debt | | $ | — | | | $ | 226,897,258 | | | $ | — | | | $ | 226,897,258 | |
Treasury Debt | | | — | | | | 79,195,654 | | | | — | | | | 79,195,654 | |
Treasury Repurchase Agreements | | | — | | | | 84,787,000 | | | | — | | | | 84,787,000 | |
| | | | | | | | | | | | | | | | |
| Total Investments in Securities | | $ | — | | | $ | 390,879,912 | | | $ | — | | | $ | 390,879,912 | |
| | | | | | | | | | | | | | | | |
| (a) | For a complete listing of investments and their industries, see the Portfolio of Investments. |
| | | | |
| 10 | | MainStay VP U.S. Government Money Market Portfolio | | The notes to the financial statements are an integral part of,
and should be read in conjunction with, the financial statements. |
Statement of Assets and Liabilitiesas of June 30, 2019 (Unaudited)
| | | | |
| Assets | | | | |
Investment in securities, at value
(amortized cost $306,092,912) | | $ | 306,092,912 | |
Repurchase agreements, at value
(amortized cost $84,787,000) | | | 84,787,000 | |
Cash | | | 353 | |
Receivables: | | | | |
Investment securities sold | | | 38,000,000 | |
Interest | | | 487,506 | |
Portfolio shares sold | | | 240,582 | |
Other assets | | | 2,628 | |
| | | | |
Total assets | | | 429,610,981 | |
| | | | |
| |
| Liabilities | | | | |
Payables: | | | | |
Investment securities purchased | | | 10,000,000 | |
Portfolio shares redeemed | | | 768,924 | |
Manager (See Note 3) | | | 138,060 | |
Professional fees | | | 28,633 | |
Custodian | | | 20,293 | |
Shareholder communication | | | 14,432 | |
Trustees | | | 528 | |
Accrued expenses | | | 3,395 | |
| | | | |
Total liabilities | | | 10,974,265 | |
| | | | |
Net assets | | $ | 418,636,716 | |
| | | | |
| |
| Composition of Net Assets | | | | |
Shares of beneficial interest outstanding (par value of $.001 per share) unlimited number of shares authorized | | $ | 418,600 | |
Additional paid-in capital | | | 418,214,539 | |
| | | | |
| | | 418,633,139 | |
Total distributable earnings (loss) | | | 3,577 | |
| | | | |
Net assets applicable to outstanding shares | | $ | 418,636,716 | |
| | | | |
Shares of beneficial interest outstanding | | | 418,600,434 | |
| | | | |
Net asset value per share outstanding | | $ | 1.00 | |
| | | | |
| | | | | | |
The notes to the financial statements are an integral part of,
and should be read in conjunction with, the financial statements. | | | | | 11 | |
Statement of Operationsfor the six months ended June 30, 2019 (Unaudited)
| | | | |
| Investment Income (Loss) | | | | |
Income | | | | |
Interest | | $ | 5,501,677 | |
Other | | | 904 | |
| | | | |
Total income | | | 5,502,581 | |
| | | | |
Expenses | | | | |
Manager (See Note 3) | | | 906,954 | |
Professional fees | | | 36,214 | |
Custodian | | | 20,318 | |
Shareholder communication | | | 15,847 | |
Trustees | | | 5,625 | |
Miscellaneous | | | 6,759 | |
| | | | |
Total expenses | | | 991,717 | |
| | | | |
Net investment income (loss) | | | 4,510,864 | |
| | | | |
| |
| Realized Gain (Loss) on Investments | | | | |
Net realized gain (loss) on investments | | | 3,516 | |
| | | | |
Net increase (decrease) in net assets resulting from operations | | $ | 4,514,380 | |
| | | | |
| | | | |
| 12 | | MainStay VP U.S. Government Money Market Portfolio | | The notes to the financial statements are an integral part of,
and should be read in conjunction with, the financial statements. |
Statements of Changes in Net Assets
for the six months ended June 30, 2019 (Unaudited) and the year ended December 31, 2018
| | | | | | | | |
| | | 2019 | | | 2018 | |
| Increase (Decrease) in Net Assets | |
Operations: | | | | | | | | |
Net investment income (loss) | | $ | 4,510,864 | | | $ | 6,380,578 | |
Net realized gain (loss) on investments | | | 3,516 | | | | 126 | |
| | | | |
Net increase (decrease) in net assets resulting from operations | | | 4,514,380 | | | | 6,380,704 | |
| | | | |
Distributions to shareholders | | | (4,510,864 | ) | | | (6,380,657 | ) |
| | | | |
Capital share transactions: | | | | | | | | |
Net proceeds from sale of shares | | | 142,785,624 | | | | 410,480,548 | |
Net asset value of shares issued to shareholders in reinvestment of dividends | | | 4,510,323 | | | | 6,380,491 | |
Cost of shares redeemed | | | (241,152,679 | ) | | | (401,242,610 | ) |
| | | | |
Increase (decrease) in net assets derived from capital share transactions | | | (93,856,732 | ) | | | 15,618,429 | |
| | | | |
Net increase (decrease) in net assets | | | (93,853,216 | ) | | | 15,618,476 | |
| | |
| Net Assets | | | | | | | | |
Beginning of period | | | 512,489,932 | | | | 496,871,456 | |
| | | | |
End of period | | $ | 418,636,716 | | | $ | 512,489,932 | |
| | | | |
| | | | | | |
The notes to the financial statements are an integral part of,
and should be read in conjunction with, the financial statements. | | | | | 13 | |
Financial Highlightsselected per share data and ratios
| | | | | | | | | | | | | | | | | | | | | | | | | | | | | | | | | | | |
| | | |
| | | Six months
ended
June 30, | | | | Year ended December 31, |
| | | | | | | |
| | | 2019* | | | | 2018 | | 2017 | | 2016 | | 2015 | | 2014 |
| | | | | | | |
Net asset value at beginning of period | | | $ | 1.00 | | | | | | | | | $ | 1.00 | | | | $ | 1.00 | | | | $ | 1.00 | | | | $ | 1.00 | | | | $ | 1.00 | |
| | | | | | | | | | | | | | | | | | | | | | | | | | | | | | | | | | | |
| | | | | | | |
Net investment income (loss) | | | | 0.01 | | | | | | | | | | 0.01 | | | | | 0.00 | ‡ | | | | 0.00 | ‡ | | | | 0.00 | ‡ | | | | 0.00 | ‡ |
| | | | | | | |
Net realized gain (loss) on investments | | | | 0.00 | ‡ | | | | | | | | | 0.00 | ‡ | | | | 0.00 | ‡ | | | | (0.00 | )‡ | | | | 0.00 | ‡ | | | | (0.00 | )‡ |
| | | | | | | | | | | | | | | | | | | | | | | | | | | | | | | | | | | |
| | | | | | | |
Total from investment operations | | | | 0.01 | | | | | | | | | | 0.01 | | | | | 0.00 | ‡ | | | | 0.00 | ‡ | | | | 0.00 | ‡ | | | | 0.00 | ‡ |
| | | | | | | | | | | | | | | | | | | | | | | | | | | | | | | | | | | |
| | | | | | | |
| Less dividends: | | | | | | | | | | | | | | | | | | | | | | | | | | | | | | | | | | | |
| | | | | | | |
From net investment income | | | | (0.01 | ) | | | | | | | | | (0.01 | ) | | | | (0.00 | )‡ | | | | (0.00 | )‡ | | | | (0.00 | )‡ | | | | (0.00 | )‡ |
| | | | | | | | | | | | | | | | | | | | | | | | | | | | | | | | | | | |
| | | | | | | |
Net asset value at end of period | | | $ | 1.00 | | | | | | | | | $ | 1.00 | | | | $ | 1.00 | | | | $ | 1.00 | | | | $ | 1.00 | | | | $ | 1.00 | |
| | | | | | | | | | | | | | | | | | | | | | | | | | | | | | | | | | | |
| | | | | | | |
Total investment return (a) | | | | 0.99 | % | | | | | | | | | 1.38 | % | | | | 0.42 | % | | | | 0.02 | % | | | | 0.01 | % | | | | 0.01 | % |
| | | | | | | |
| Ratios (to average net assets)/Supplemental Data: | | | | | | | | | | | | | | | | | | | | | | | | | | | | | | | | | | | |
| | | | | | | |
Net investment income (loss) | | | | 1.99 | %†† | | | | | | | | | 1.37 | % | | | | 0.41 | % | | | | 0.02 | %(b) | | | | 0.01 | % | | | | 0.01 | % |
| | | | | | | |
Net expenses | | | | 0.44 | %†† | | | | | | | | | 0.44 | % | | | | 0.44 | % | | | | 0.39 | %(c) | | | | 0.15 | % | | | | 0.11 | % |
| | | | | | | |
Expenses (before waiver/reimbursement) | | | | 0.44 | %†† | | | | | | | | | 0.44 | % | | | | 0.44 | % | | | | 0.49 | % | | | | 0.48 | % | | | | 0.47 | % |
| | | | | | | |
Net assets at end of period (in 000’s) | | | $ | 418,637 | | | | | | | | | $ | 512,490 | | | | $ | 496,871 | | | | $ | 657,487 | | | | $ | 620,286 | | | | $ | 578,509 | |
| ‡ | Less than one cent per share. |
| (a) | Total return does not reflect any deduction of sales charges, mortality and expense charges, contract charges or administrative charges. For periods of less than one year, total return is not annualized. |
| (b) | Without the custody fee reimbursement, net investment income (loss) would have been 0.01%. |
| (c) | Without the custody fee reimbursement, net expenses would have been 0.40%. |
| | | | |
| 14 | | MainStay VP U.S. Government Money Market Portfolio | | The notes to the financial statements are an integral part of,
and should be read in conjunction with, the financial statements. |
Notes to Financial Statements(Unaudited)
Note 1–Organization and Business
MainStay VP Funds Trust (the “Fund”) was organized as a Delaware statutory trust on February 1, 2011. The Fund is registered under the Investment Company Act of 1940, as amended (the “1940 Act”), as an open-end management investment company. The Fund is comprised of thirty-one separate series (collectively referred to as the “Portfolios”). These financial statements and notes relate to the MainStay VP U.S. Government Money Market Portfolio (the “Portfolio”), a “diversified” portfolio, as that term is defined in the 1940 Act, as interpreted or modified by regulatory authorities having jurisdiction, from time to time.
Shares of the Portfolio are currently offered to certain separate accounts to fund variable annuity policies and variable universal life insurance policies issued by New York Life Insurance and Annuity Corporation (“NYLIAC”), awholly-owned subsidiary of New York Life Insurance Company (“New York Life”) and may also be offered to fund variable annuity policies and variable universal life insurance policies issued by other insurance companies. NYLIAC allocates shares of the Portfolios to, among others, certain NYLIAC separate accounts. Shares of the Portfolio are also offered to the MainStay VP Conservative Allocation Portfolio, MainStay VP Moderate Allocation Portfolio, MainStay VP Moderate Growth Allocation Portfolio and MainStay VP Growth Allocation Portfolio, which operate as “funds-of-funds.”
The Portfolio currently offers one class of shares. Initial Class shares commenced operations on January 29, 1993. Shares of the Portfolio are offered and are redeemed at a price equal to their net asset value (“NAV”) per share. No sales or redemption charge is applicable to the purchase or redemption of the Portfolio’s shares.
The Portfolio’s investment objective is to seek a high level of current income while preserving capital and maintaining liquidity.
Note 2–Significant Accounting Policies
The Portfolio is an investment company and accordingly follows the investment company accounting and reporting guidance of the Financial Accounting Standards Board (“FASB”) Accounting Standard CodificationTopic 946 Financial Services—Investment Companies. The Portfolio prepares its financial statements in accordance with generally accepted accounting principles (“GAAP”) in the United States of America and follows the significant accounting policies described below.
(A) Valuation of Shares. The Portfolio seeks to maintain a NAV of $1.00 per share, although there is no assurance that it will be able to do so. An investment in the Portfolio, is not insured or guaranteed by the Federal Deposit Insurance Corporation or any other government agency. The Portfolio’s sponsor has no legal obligation to provide financial support to the Portfolio, and you should not expect that the sponsor will provide financial support to the Portfolio at any time.
(B) Securities Valuation. Investments are usually valued as of the close of regular trading on the New York Stock Exchange (the “Exchange”) (generally 4:00 p.m. Eastern time) on each day the Portfolio is open for business (“valuation date”). Securities are valued using the amortized cost method of valuation, unless the use of such method would be inappropriate per the requirements of Rule 2a-7 under the 1940 Act. The amortized cost method involves valuing a security at its cost on the date of purchase and thereafter assuming a constant
amortization to maturity of the difference between such cost and the value on maturity date. Amortized cost approximates the current fair value of a security. Securities valued using the amortized cost method are not valued using quoted prices in an active market and are generally categorized as Level 2 in the hierarchy.
The Board of Trustees of the Fund (the “Board”) adopted procedures establishing methodologies for the valuation of the Portfolio’s securities and other assets and delegated the responsibility for valuation determinations under those procedures to the Valuation Committee of the Fund (the “Valuation Committee”). The Board authorized the Valuation Committee to appoint a Valuation Subcommittee (the “Subcommittee”) to deal in the first instance with establishing the prices of securities for which market quotations are not readily available or the prices of which are not otherwise readily determinable under these procedures. The Subcommittee meets (in person, via electronic mail or via teleconference) on an as-needed basis. Subsequently, the Valuation Committee meets to ensure that actions taken by the Subcommittee were appropriate. The procedures state that, subject to the oversight of the Board and unless otherwise noted, the responsibility for theday-to-day valuation of portfolio assets (including fair value measurements for the Portfolio’s assets and liabilities) rests with New York Life Investment Management LLC (“New York Life Investments” or the “Manager”), aided to whatever extent necessary by the Subadvisor (as defined in Note 3(A)).
To assess the appropriateness of security valuations, the Manager, the Subadvisor or the Portfolio’s third-party service provider, who is subject to oversight by the Manager, regularly compares prior day prices, prices on comparable securities and the sale prices to the prior and current day prices and challenges prices with changes exceeding certain tolerance levels with third-party pricing services or broker sources. For those securities valued through either a standardized fair valuation methodology or a fair valuation measurement, the Subcommittee deals in the first instance with such valuation and the Valuation Committee reviews and affirms, if appropriate, the reasonableness of the valuation based on such methodologies and measurements on a regular basis after considering information that is reasonably available and deemed relevant by the Valuation Committee. Any action taken by the Subcommittee with respect to the valuation of a portfolio security or other asset is submitted for review and ratification (if appropriate) to the Valuation Committee and the Board at the next regularly scheduled meeting.
“Fair value” is defined as the price the Portfolio would reasonably expect to receive upon selling an asset or liability in an orderly transaction to an independent buyer in the principal or most advantageous market for the asset or liability. Fair value measurements are determined within a framework that establishes a three-tier hierarchy which maximizes the use of observable market data and minimizes the use of unobservable inputs to establish a classification of fair value measurements for disclosure purposes. “Inputs” refer broadly to the assumptions that market participants would use in pricing the asset or liability, including assumptions about risk, such as the risk inherent in a particular valuation technique used to measure fair value using a pricing model and/or the risk inherent in the inputs for the valuation technique. Inputs may be observable or unobservable. Observable inputs reflect the assumptions market participants would use in pricing the asset or liability based on market data obtained from sources independent of the Portfolio.
Notes to Financial Statements(Unaudited) (continued)
Unobservable inputs reflect the Portfolio’s own assumptions about the assumptions market participants would use in pricing the asset or liability based on the information available. The inputs or methodology used for valuing assets or liabilities may not be an indication of the risks associated with investing in those assets or liabilities. The three-tier hierarchy of inputs is summarized below.
| • | | Level 1—quoted prices in active markets for an identical asset or liability |
| • | | Level 2—other significant observable inputs (including quoted prices for a similar asset or liability in active markets, interest rates and yield curves, prepayment speeds, credit risk, etc.) |
| • | | Level 3—significant unobservable inputs (including the Portfolio’s own assumptions about the assumptions that market participants would use in measuring fair value of an asset or liability) |
Securities valued at amortized cost are not obtained from a quoted price in an active market and are generally categorized as Level 2 in the hierarchy. The level of an asset or liability within the fair value hierarchy is based on the lowest level of an input, both individually and in the aggregate, that is significant to the fair value measurement. As of June 30, 2019, the aggregate value by input level of the Portfolio’s assets and liabilities is included at the end of the Portfolio of Investments.
The Portfolio may use third-party vendor evaluations, whose prices may be derived from one or more of the following standard inputs, among others:
| | |
• Benchmark yields | | • Reported trades |
• Broker/dealer quotes | | • Issuer spreads |
• Two-sided markets | | • Benchmark securities |
• Bids/offers | | • Reference data (corporate actions or material event notices) |
• Industry and economic events | | • Comparable bonds |
• Monthly payment information | | |
An asset or liability for which market values cannot be measured using the methodologies described above is valued by methods deemed reasonable in good faith by the Valuation Committee, following the procedures established by the Board, to represent fair value. Under these procedures, the Portfolio may utilize some of the following fair value techniques: multi-dimensional relational pricing models and option adjusted spread pricing. During the six-month period ended June 30, 2019, there were no material changes to the fair value methodologies.
The information above is not intended to reflect an exhaustive list of the methodologies that may be used to value portfolio investments. The valuation procedures permit the use of a variety of valuation methodologies in connection with valuing portfolio investments. The methodology used for a specific type of investment may vary based on the market data available or other considerations. The methodologies summarized above may not represent the specific means by which portfolio investments are valued on any particular business day.
(C) Income Taxes. The Portfolio’s policy is to comply with the requirements of the Internal Revenue Code of 1986, as amended (the “Internal Revenue Code”), applicable to regulated investment companies
and to distribute all of its taxable income to the shareholders of the Portfolio within the allowable time limits. Therefore, no federal, state and local income tax provisions are required.
Management evaluates the Portfolio’s tax positions to determine if the tax positions taken meet the minimum recognition threshold in connection with accounting for uncertainties in income tax positions taken or expected to be taken for the purposes of measuring and recognizing tax liabilities in the financial statements. Recognition of tax benefits of an uncertain tax position is permitted only to the extent the position is “more likely than not” to be sustained assuming examination by taxing authorities. Management has analyzed the Portfolio’s tax positions taken on federal, state and local income tax returns for all open tax years (for up to three tax years) and has concluded that no provisions for federal, state and local income tax are required in the Portfolio’s financial statements. The Portfolio’s federal, state and local income tax and federal excise tax returns for tax years for which the applicable statutes of limitations have not expired are subject to examination by the Internal Revenue Service and state and local departments of revenue.
(D) Dividends and Distributions to Shareholders. Dividends and distributions are recorded on the ex-dividend date. The Portfolio intends to declare dividends from net investment income, if any, daily and intends to pay them at least monthly and declares and pays distributions from net realized capital and currency gains, if any, at least annually. Unless the shareholder elects otherwise, all dividends and distributions are reinvested in the same class of shares of the Portfolio, at NAV. Dividends and distributions to shareholders are determined in accordance with federal income tax regulations and may differ from determinations using GAAP.
(E) Security Transactions and Investment Income. The Portfolio records security transactions on the trade date. Realized gains and losses on security transactions are determined using the identified cost method. Dividend income is recognized on the ex-dividend date; net of any foreign tax withheld at the source, and interest income is accrued as earned using the effective interest rate method.
(F) Expenses. Expenses of the Fund are allocated to the individual Portfolios in proportion to the net assets of the respective Portfolios when the expenses are incurred, except where direct allocations of expenses can be made. The expenses borne by the Portfolio, including those of related parties to the Portfolio, are shown in the Statement of Operations.
Additionally, the Portfolio may invest in shares of mutual funds, which are subject to management fees and other fees that may cause the costs of investing mutual funds to be greater than the costs of owning the underlying securities directly. These indirect expenses of mutual funds are not included in the amounts shown as expenses in the Portfolio’s Statement of Operations or in the expense ratios included in the Financial Highlights.
(G) Use of Estimates. In preparing financial statements in conformity with GAAP, management makes estimates and assumptions that affect the reported amounts and disclosures in the financial statements. Actual results could differ from those estimates.
(H) Repurchase Agreements. The Portfolio may enter into repurchase agreements (i.e., buy a security from another party with the
| | |
| 16 | | MainStay VP U.S. Government Money Market Portfolio |
agreement that it be sold back in the future) to earn income. The Portfolio may enter into repurchase agreements only with counterparties, usually financial institutions, that are deemed by the Manager or the Subadvisor to be creditworthy, pursuant to guidelines established by the Board. During the term of any repurchase agreement, the Manager or the Subadvisor will continue to monitor the creditworthiness of the counterparty. Under the 1940 Act, repurchase agreements are considered to be collateralized loans by the Portfolio to the counterparty secured by the securities transferred to the Portfolio.
Repurchase agreements are subject to counterparty risk, meaning the Portfolio could lose money by the counterparty’s failure to perform under the terms of the agreement. The Portfolio mitigates this risk by ensuring the repurchase agreement is collateralized by cash, U.S. government securities, fixed income securities and/or other securities. The collateral is held by the Portfolio’s custodian and valued daily on a mark to market basis to determine if the value, including accrued interest, exceeds the repurchase price. In the event of the counterparty’s default on the obligation to repurchase, the Portfolio has the right to liquidate the collateral and apply the proceeds in satisfaction of the obligation. Under certain circumstances, such as in the event of default or bankruptcy by the counterparty, realization and/or retention of the collateral may be limited or subject to delay, to legal proceedings and possible realized loss to the Portfolio. As of June 30, 2019, repurchase agreements are shown in the Portfolio of Investments.
(I) Indemnifications. Under the Fund’s organizational documents, its officers and trustees are indemnified against certain liabilities that may arise out of performance of their duties to the Fund. Additionally, in the normal course of business, the Portfolio enters into contracts with third-party service providers that contain a variety of representations and warranties and which may provide general indemnifications. The Portfolio’s maximum exposure under these arrangements is unknown, as this would involve future claims that may be made against the Portfolio that have not yet occurred. Based on experience, management is of the view that the risk of loss in connection with these potential indemnification obligations is remote. However, there can be no assurance that material liabilities related to such obligations will not arise in the future, which could adversely impact the Portfolio.
Note 3–Fees and Related Party Transactions
(A) Manager and Subadvisor. New York Life Investments, a registered investment adviser and an indirect,wholly-owned subsidiary of New York Life, serves as the Portfolio’s Manager, pursuant to an Amended and Restated Management Agreement (“Management Agreement”). The Manager provides offices, conducts clerical, recordkeeping and bookkeeping services and keeps most of the financial and accounting records required to be maintained by the Portfolio. Except for the portion of salaries and expenses that are the responsibility of the Portfolio, the Manager pays the salaries and expenses of all personnel affiliated with the Portfolio and certain operational expenses of the Portfolio. The Portfolio reimburses New York Life Investments in an amount equal to a portion of the compensation of the Chief Compliance Officer attributable to the Portfolio. NYL Investors LLC (“NYL Investors” or the “Subadvisor”), a registered investment adviser and a direct,wholly-owned subsidiary of New York Life, serves as Subadvisor to the Portfolio and is responsible for theday-to-day portfolio management of the Portfolio. Pursuant to the terms of a Subadvisory Agreement
(“Subadvisory Agreement”) between New York Life Investments and NYL Investors, New York Life Investments pays for the services of the Subadvisor.
The Fund, on behalf of the Portfolio, pays New York Life Investments in its capacity as the Portfolio’s investment manager and administrator, pursuant to the Management Agreement, a monthly fee for the services performed and the facilities furnished at an annual percentage of the average daily net assets. The Fund, on behalf of the Portfolio, pays New York Life Investments at the rate of 0.40% up to $500 million; 0.35% from $500 million to $1 billion; and 0.30% in excess of $1 billion. During the six-month period ended June 30, 2019, the effective management fee rate was 0.40%.
New York Life Investments may voluntarily waive fees or reimburse expenses of the Portfolio’s to the extent it deems appropriate to enhance the Portfolio’s yield during periods when expenses may have a significant impact on yield because of low interest rates. This expense limitation policy is voluntary and may be revised or terminated by the Manager at any time.
During the six-month period ended June 30, 2019, New York Life Investments earned fees from the Portfolio in the amount of $906,954, and paid the Subadvisor in the amount of $453,489.
State Street Bank and Trust Company (“State Street”) providessub-administration andsub-accounting services to the Portfolio pursuant to an agreement with New York Life Investments. These services include calculating the daily NAV of the Portfolio, maintaining the general ledger andsub-ledger accounts for the calculation of the Portfolio’s NAV, and assisting New York Life Investments in conducting various aspects of the Portfolio’s administrative operations. For providing these services to the Portfolio, State Street is compensated by New York Life Investments.
Pursuant to an agreement between the Fund and New York Life Investments, New York Life Investments is responsible for providing or procuring certain regulatory reporting services for the Portfolio. The Portfolio will reimburse New York Life Investments for the actual costs incurred by New York Life Investments in connection with providing or procuring these services for the Portfolio.
Note 4–Federal Income Tax
The amortized cost also represents the aggregate cost for federal income tax purposes.
As of December 31, 2018, for federal income tax purposes, capital loss carryforwards of $337 were available as shown in the table below, to the extent provided by the regulations to offset future realized gains of the Portfolio through the years indicated. To the extent that these capital loss carryforwards are used to offset future capital gains, it is probable that the capital gains so offset will not be distributed to shareholders. No capital gain distributions shall be made until any capital loss carryforwards have been fully utilized.
| | | | |
Capital Loss
Available Through | | Short-Term
Capital Loss
Amounts (000’s) | | Long-Term
Capital Loss
Amounts (000’s) |
| | |
| Unlimited | | $—(a) | | $— |
| (a) | Amount is less than $1,000. |
Notes to Financial Statements(Unaudited) (continued)
The Portfolio utilized $126 of capital loss carryforwards during the year ended December 31, 2018.
During the year ended December 31, 2018, the tax character of distributions paid as reflected in the Statements of Changes in Net Assets was as follows:
| | |
|
| 2018 |
Tax-Based
Distributions
from Ordinary
Income | | Tax-Based
Distributions
from Long-Term
Gains |
| |
| $6,380,657 | | $— |
Note 5–Custodian
State Street is the custodian of cash and securities held by the Portfolio. Custodial fees are charged to the Portfolio based on the Portfolio’s net assets and/or the market value of securities held by the Portfolio and the number of certain transactions incurred by the Portfolio.
Note 6–Capital Share Transactions
Transactions in capital shares for the six-month period ended June 30, 2019 and the year ended December 31, 2018, were as follows:
| | | | |
Initial Class (at $1 per share) | | Shares | |
| |
Six-month period ended June 30, 2019: | | | | |
Shares sold | | | 142,773,569 | |
Shares issued to shareholders in reinvestment of distributions | | | 4,509,983 | |
Shares redeemed | | | (241,132,956 | ) |
| | | | |
Net increase (decrease) | | | (93,849,404 | ) |
| | | | |
Year ended December 31, 2018: | | | | |
Shares sold | | | 410,448,751 | |
Shares issued to shareholders in reinvestment of dividends and distributions | | | 6,380,000 | |
Shares redeemed | | | (401,211,594 | ) |
| | | | |
Net increase (decrease) | | | 15,617,157 | |
| | | | |
Note 7–Recent Accounting Pronouncement
To improve the effectiveness of fair value disclosure requirements, the Financial Accounting Standards Board recently issued Accounting Standard Update (ASU)2018-13, Fair Value Measurement Disclosure Framework—Changes to the Disclosure Requirements for Fair Value Measurement (ASU2018-13), which adds, removes, and modifies certain aspects relating to fair value disclosure. ASU2018-13 is effective for interim and annual reporting periods beginning after December 15, 2019; early adoption of the additions relating to ASU2018-13 is not required. Management has evaluated the implications of certain other provisions of the ASU and has determined to early adopt aspects related to the removal and modifications of certain fair value measurement disclosures under the ASU effective immediately. At this time, management is evaluating the implications of certain other provisions of the ASU related to new disclosure requirements and any impact on the financial statement disclosures has not yet been determined.
Note 8–Subsequent Events
In connection with the preparation of the financial statements of the Portfolio as of and for the six-month period ended June 30, 2019, events and transactions subsequent to June 30, 2019, through the date the financial statements were issued have been evaluated by the Portfolio’s management for possible adjustment and/or disclosure. No subsequent events requiring financial statement adjustment or disclosure have been identified.
| | |
| 18 | | MainStay VP U.S. Government Money Market Portfolio |
Proxy Voting Policies and Procedures and Proxy Voting Record
A description of the policies and procedures that New York Life Investments uses to vote proxies related to the Portfolio’s securities is available without charge, upon request, (i) by calling800-598-2019; (ii) by visiting New York Life Investments website at https://www.nylinvestments.com/mainstay/products-and-performance/mainstay-vp-funds-trust; or (iii) by visiting the SEC’s website at www.sec.gov.
The Portfolio is required to file with the SEC its proxy voting record for the12-month period ending June 30 on Form N-PX. The Portfolio’s most recent Form N-PX or proxy voting record is available free of charge upon request (i) by calling800-598-2019; (ii) by visiting New York Life Investments website at https://www.nylinvestments.com/mainstay/products-and-performance/mainstay-vp-funds-trust; or (iii) by visiting the SEC’s website atwww.sec.gov.
Shareholder Reports and Quarterly Portfolio Disclosure
The Portfolio is required to file a Form N-MFP every month disclosing its portfolio holdings. The Portfolio’s Form N-MFP is available without charge on the SEC’s website atwww.sec.govor by calling New York Life Investments at800-624-6782.
MainStay VP Portfolios
MainStay VP offers a wide range of Portfolios. The full array of MainStay VP offerings is listed here, with information about the manager, subadvisors, legal counsel, and independent registered public accounting firm.
Equity Portfolios
MainStay VP Eagle Small Cap Growth Portfolio
MainStay VP Emerging Markets Equity Portfolio
MainStay VP Epoch U.S. Equity Yield Portfolio
MainStay VP Fidelity Institutional AM® Utilities Portfolio†
MainStay VP Large Cap Growth Portfolio
MainStay VP MacKay Common Stock Portfolio
MainStay VP MacKay Growth Portfolio
MainStay VP MacKay International Equity Portfolio
MainStay VP MacKay Mid Cap Core Portfolio
MainStay VP MacKay S&P 500 Index Portfolio
MainStay VP MacKay Small Cap Core Portfolio
MainStay VP Mellon Natural Resources Portfolio
MainStay VP T. Rowe Price Equity Income Portfolio
Mixed Asset Portfolios
MainStay VP Balanced Portfolio
MainStay VP Income Builder Portfolio
MainStay VP Janus Henderson Balanced Portfolio
MainStay VP MacKay Convertible Portfolio
Income Portfolios
MainStay VP Bond Portfolio
MainStay VP Floating Rate Portfolio
MainStay VP Indexed Bond Portfolio
MainStay VP MacKay Government Portfolio
MainStay VP MacKay High Yield Corporate Bond Portfolio
MainStay VP MacKay Unconstrained Bond Portfolio
MainStay VP PIMCO Real Return Portfolio
Money Market
MainStay VP U.S. Government Money Market Portfolio
Alternative
MainStay VP Cushing Renaissance Advantage Portfolio
MainStay VP IQ Hedge Multi-Strategy Portfolio
Asset Allocation Portfolios
MainStay VP Conservative Allocation Portfolio
MainStay VP Growth Allocation Portfolio
MainStay VP Moderate Allocation Portfolio
MainStay VP Moderate Growth Allocation Portfolio
Manager
New York Life Investment Management LLC
New York, New York
Subadvisors
Candriam Belgium*
Brussels, Belgium
Cushing Asset Management, LP
Dallas, Texas
Eagle Asset Management, Inc.
St Petersburg, Florida
Epoch Investment Partners, Inc.
New York, New York
FIAM LLC
Smithfield, Rhode Island
IndexIQ Advisors LLC*
New York, New York
Janus Capital Management LLC
Denver, Colorado
MacKay Shields LLC*
New York, New York
Mellon Investments Corporation
Boston, Massachusetts
NYL Investors LLC*
New York, New York
Pacific Investment Management Company LLC
Newport Beach, California
T. Rowe Price Associates, Inc.
Baltimore, Maryland
Winslow Capital Management, LLC
Minneapolis, Minnesota
Distributor
NYLIFE Distributors LLC*
Jersey City, New Jersey
Custodian
State Street Bank and Trust Company
Boston, Massachusetts
Independent Registered Public Accounting Firm
PricewaterhouseCoopers LLP
New York, New York
Legal Counsel
Dechert LLP
Washington, District of Columbia
Some Portfolios may not be available in all products.
| † | Fidelity Institutional AM is a registered trade mark of FMR LLC. Used with permission. |
| * | An affiliate of New York Life Investment Management LLC |
Not part of the Semiannual Report
2019 Semiannual Report
This report is for the general information of New York Life Variable Annuities and NYLIAC Variable Universal Life Insurance Products policyowners. It must be preceded or accompanied by the appropriate product(s) and funds prospectuses if it is given to anyone who is not an owner of a New York Life variable annuity policy or a NYLIAC Variable Universal Life Insurance Product. This report does not offer for sale or solicit orders to purchase securities.
The performance data quoted in this report represents past performance. Past performance is no guarantee of future results. Due to market volatility and other factors, current performance may be lower or higher than the figures shown. The most recent month-end performance summary for your variable annuity or variable life policy is available by calling 800-598-2019 and is updated periodically on www.newyorklife.com.
The New York Life Variable Annuities and NYLIAC Variable Universal Life Insurance Products are issued by New York Life Insurance and Annuity Corporation (a Delaware Corporation) and distributed by NYLIFE Distributors LLC (Member FINRA/SIPC).
New York Life Insurance Company
New York Life Insurance and Annuity Corporation (NYLIAC) (A Delaware Corporation)
51 Madison Avenue, Room 551
New York, NY 10010
www.newyorklife.com
Printed on recycled paper
nylinvestments.com
NYLIFE Distributors LLC, 30 Hudson Street, Jersey City, NJ 07302
New York Life Investment Management LLC is the investment manager to the MainStay VP Funds Trust
©2019 by NYLIFE Distributors LLC. All rights reserved.
You may obtain copies of the Prospectus and the Statement of Additional Information free of charge, upon request, by callingtoll-free 800-598-2019 or writing to New York Life Insurance and Annuity Corporation, 51 Madison Avenue, New York, NY 10010.
| | | | |
| | | |
| Not FDIC Insured | | No Bank Guarantee | | May Lose Value |
| | | | |
| 1781646 | | | | MSVPUSGMM10-08/19 (NYLIAC) NI510 |
MainStay VP Mellon Natural Resources Portfolio
(Formerly known as MainStay VP VanEck Global Hard Assets Portfolio)
Message from the President and Semiannual Report
Unaudited | June 30, 2019

Beginning on January 1, 2021, as permitted by regulations adopted by the Securities and Exchange Commission, paper copies of the MainStay VP Portfolio annual and semi-annual shareholder reports may no longer be sent by mail, unless you specifically request paper copies of the reports from the insurance company that offers your policy. Instead, the reports will be made available online, and you will be notified by mail each time a report is posted and provided with a website link to access the report. Instructions for requesting paper copies will be provided by your insurance company.
If you already elected to receive shareholder reports electronically, you will not be affected by this change and you need not take any action. At any time, you may elect to receive reports and other communications from the insurance company electronically by following the instructions provided by the insurance company.
You may elect to receive all future shareholder reports in paper form free of charge. You can inform the insurance company that you wish to receive paper copies of reports by following the instructions provided by the insurance company. Your election to receive reports in paper form will apply to all portfolio companies available under your contract.
| | | | | | | | |
| | | | | |
| Not FDIC/NCUA Insured | | Not a Deposit | | May Lose Value | | No Bank Guarantee | | Not Insured by Any Government Agency |

This page intentionally left blank
Message from the President
Most equity and fixed-income markets in the United States and around the world advanced in the face of conflicting political and macroeconomic forces during thesix-month period ended June 30, 2019.
The reporting period began on the heels of tumultuous December 2018, during which equities and equity-sensitive bonds spiked sharply lower on concerns regarding the pace of economic growth, a U.S. government shutdown and the potential impact of trade disputes between the United States and other nations, particularly China. Markets recovered quickly in early 2019 as trade tensions eased, the government reopened and the U.S. Federal Reserve Board (Fed) adopted a more patient tone regarding the future direction of interest rates. Markets moved broadly higher from January through April, supported by encouraging economic data and generally strong corporate earnings.
During the first four months of the reporting period, the improving economic environment encouraged investors to favor areas of the market viewed as offering greater return potential along with higher risks. Among U.S. stocks, cyclical, growth-oriented sectors tended to outperform more defensive, value-oriented sectors, whilelarge-cap stocks outperformed theirsmaller-cap counterparts. Within the S&P 500® Index, the information technology sector led the market’s advance, followed by communication services, consumer discretionary and consumer staples. Industrials, utilities, financials, materials, real estate and energy produced more modest gains. While some international equity markets outperformed or underperformed the U.S. market, on average international stocks mirrored the performance of their U.S. counterparts. Fixed-income securities gained ground as well, albeit along a more gradual trajectory. Among U.S. fixed-income instruments, corporate issues generally outperformed government bonds, with lower credit quality, higher yielding securities leading the sector’s advance. Long-term U.S. Treasury bond yields proved particularly weak, with
10-year yields dipping at times below3-month yields, reflecting investors’ continued concerns about domestic economic growth.
May 2019 saw a return of uncertainty and volatility. Trade discussions between the United States and China faltered, driving global equity prices lower. Government bond prices rose as investors sought safe havens. June brought yet anotherU-turn as equity prices climbed again after comments from the Fed raised hopes of an interest rate cut in response to weak economic data. Stock and bond prices rose, with U.S. equity markets ending the reporting period in record territory.
We are pleased to see renewed signs of strength in broad areas of the financial market. At the same time, we remained sharply focused on providing you, as a MainStay VP investor, with the experienced and disciplined fund management that we believe underpins an effective, long-term investment strategy. Whatever tomorrow’s investment environment brings, you can rely on our portfolio managers to pursue the objectives of their individual Portfolios as outlined in the prospectus with the energy and dedication you have come to expect.
The report that follows contains additional information on the market events, investment decisions and specific securities that shaped your VP Portfolio’s performance during the six months ended June 30, 2019. We encourage you to read the report carefully and use it to evaluate your Portfolio’s performance in light of your long-range financial plan.
Sincerely,

Kirk C. Lehneis
President
The opinions expressed are as of the date of this report and are subject to change. There is no guarantee that any forecast made will come to pass. This material does not constitute investment advice and is not intended as an endorsement of any specific investment. Past performance is no guarantee of future results.
Not part of the Semiannual Report
Table of Contents
Investors should refer to the Portfolio’s Summary Prospectus and/or Prospectus and consider the Portfolio’s investment objectives, strategies, risks, charges and expenses carefully before investing. The Summary Prospectus and/or Prospectus contain this and other information about the Portfolio. You may obtain copies of the Portfolio’s Summary Prospectus and/or the Prospectus and the Statement of Additional Information free of charge, upon request, by calling toll-free 800-598-2019, by writing to New York Life Insurance and Annuity Corporation, 51 Madison Avenue, Room 251, New York, New York 10010 or by sending an email to MainStayShareholdersServices@nylim.com. These documents are also available at nylinvestments.com/vpdocuments. Please read the Summary Prospectus and/or Prospectus carefully before investing. MainStay VP Funds Trust portfolios are separate account options which are purchased through a variable insurance or variable annuity contract.
Investment and Performance Comparison1(Unaudited)
Performance data quoted represents past performance. Past performance is no guarantee of future results. Because of market volatility and other factors, current performance may be lower or higher than the figures shown. Investment return and principal value will fluctuate, and as a result, when shares are redeemed, they may be worth more or less than their original cost. The performance table and graph do not reflect any deduction of sales charges, mortality and expense charges, contract charges or administrative charges. Please refer to the Performance Summary appropriate for your policy. For performance information current to the most recent month-end, please call800-598-2019 or visit www.newyorklife.com.
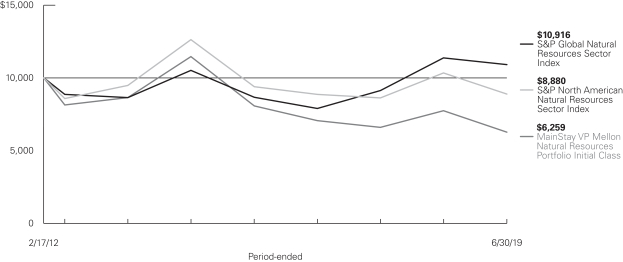
Average Annual Total Returns for the Period-Ended June 30, 2019
| | | | | | | | | | | | | | | | | | |
| Class | | Inception Date | | Six Months | | One Year | | Five Years | | | Since Inception2 | | | Gross
Expense
Ratio3 | |
| | | | | | |
| Initial Class Shares | | 2/17/2012 | | 12.32% | | –19.13% | | | –11.39 | % | | | –6.16 | % | | | 0.85 | % |
| | | | | | | | | | | | | | | | |
| Benchmark Performance | | Six Months | | | One Year | | | Five
Years | | | Since Inception | |
| | | | |
S&P Global Natural Resources Sector Index4 | | | 13.84 | % | | | –4.02 | % | | | 0.74 | % | | | 1.20 | % |
S&P North American Natural Resources Sector Index5 | | | 14.58 | | | | –14.10 | | | | –6.80 | | | | –1.60 | |
Morningstar Natural Resources Category Average6 | | | 11.97 | | | | –7.94 | | | | –2.33 | | | | –1.57 | |
| 1. | Performance figures may reflect certain fee waivers and/or expense limitations, without which total returns may have been different. For information on current fee waivers and/or expense limitations (if any), please refer to the Notes to Financial Statements. |
| 2. | The Portfolio replaced its subadvisor, changed its investment objective and modified its principal investment strategies as of November 30, 2018. Therefore, the performance information shown in this report prior to November 30, 2018 reflects the Portfolio’s prior subadvisor, investment objective and principal investment strategies. |
| 3. | The gross expense ratios presented reflect the Portfolio’s “Total Annual Portfolio Operating Expenses” from the most recent Prospectus, as supplemented, and may differ from other expense ratios disclosed in this report. |
| 4. | The Portfolio has selected the S&P Global Natural Resources Sector Index as its primary benchmark. The S&P Global Natural Resources Sector Index includes 90 of the largest publicly-traded companies in natural resources and commodities businesses that meet specific investability requirements, offering investors diversified and investable equity exposure across 3 primary commodity-related sectors: agribusiness, energy, and metals & mining. Results assume reinvestment of all dividends and capital gains. An investment cannot be made directly in an index. |
| 5. | The S&P North American Natural Resources Sector Index is the Portfolio’s secondary benchmark. The S&P North American Natural Resources Sector Index represents U.S. traded securities that are classified under the GICS® energy and materials sector excluding the chemicals industry and steel sub-industry. The natural resource sector includes mining, energy, paper and forest products, and plantation-owning companies. Results assume reinvestment of all dividends and capital gains. An investment cannot be made directly in an index. widely regarded as the standard index for measuringlarge-cap U.S. stock market performance. Results assume reinvestment of all dividends and capital gains. An investment cannot be made directly in an index. |
| 6. | The Morningstar Natural Resources Category Average is representative of funds that invest primarily on commodity-based industries such as energy, chemicals, minerals, and forest products in the United States or outside of the United States. Some funds invest across this spectrum to offer broad natural-resources exposure. Others concentrate heavily or even exclusively in specific industries. Funds that concentrate primarily in energy-related industries are part of the equity energy category. Results are based on average total returns of similar funds with all dividends and capital gain distributions reinvested. |
Cost in Dollars of a $1,000 Investment in MainStay VP Mellon Natural Resources Portfolio (Unaudited)
The example below is intended to describe the fees and expenses borne by shareholders during the six-month period from January 1, 2019, to June 30, 2019, and the impact of those costs on your investment.
Example
As a shareholder of the Portfolio you incur two types of costs: (1) transaction costs, including exchange fees and sales charges (loads) on purchases (as applicable), and (2) ongoing costs, including management fees, distribution and/or service (12b-1) fees, and other Portfolio expenses (as applicable). This example is intended to help you understand your ongoing costs (in dollars) of investing in the Portfolio and to compare these costs with the ongoing costs of investing in other mutual funds. The example is based on an investment of $1,000 made at the beginning of the six-month period and held for the entire period from January 1, 2019, to June 30, 2019. Shares are only sold in connection with variable life and annuity contracts and the example does not reflect any contract level or transactional fees or expenses. If these costs had been included, your costs would have been higher.
This example illustrates your Portfolio’s ongoing costs in two ways:
Actual Expenses
The second and third data columns in the table below provide information about actual account values and actual expenses. You may use the information in these columns, together with the amount you invested, to estimate the expenses that you paid during the six months ended June 30, 2019. Simply divide your account value by $1,000
(for example, an $8,600 account value divided by $1,000 = 8.6), then multiply the result by the number under the heading entitled “Expenses Paid During Period” to estimate the expenses you paid on your account during this period.
Hypothetical Example for Comparison Purposes
The fourth and fifth data columns in the table below provide information about hypothetical account values and hypothetical expenses based on the Portfolio’s actual expense ratio and an assumed rate of return of 5% per year before expenses, which is not the Portfolio’s actual return. The hypothetical account values and expenses may not be used to estimate the actual ending account balances or expenses you paid for thesix-month period shown. You may use this information to compare the ongoing costs of investing in the Portfolio with the ongoing costs of investing in other mutual funds. To do so, compare this 5% hypothetical example with the 5% hypothetical examples that appear in the shareholder reports of the other mutual funds.
Please note that the expenses shown in the table are meant to highlight your ongoing costs only and do not reflect any transactional costs, such as exchange fees or sales charges (loads). Therefore, the fourth and fifth data columns of the table are useful in comparing ongoing costs only and will not help you determine the relative total costs of owning different funds. In addition, if these transactional costs were included, your costs would have been higher.
| | | | | | | | | | | | | | | | | | | | | | |
| | | | | | | | | | | | | | | | | | |
| Share Class | | Beginning
Account
Value
1/1/19 | | | Ending Account
Value (Based
on Actual
Returns and
Expenses)
6/30/19 | | | Expenses
Paid
During
Period1 | | | Ending Account
Value (Based
on Hypothetical
5% Annualized
Return and
Actual Expenses)
6/30/19 | | | Expenses
Paid
During
Period1 | | | Net Expense
Ratio
During
Period2 |
| | | | | | |
| Initial Class Shares | | $ | 1,000.00 | | | $ | 1,123.20 | | | $ | 4.90 | | | $ | 1,020.18 | | | $ | 4.66 | | | 0.93% |
| 1. | Expenses are equal to the Portfolio’s annualized expense ratio of each class multiplied by the average account value over the period, divided by 365 and multiplied by 181 (to reflect the six-month period). The table above represents the actual expenses incurred during the six-month period. In addition to the fees and expenses which the Portfolio bears directly, it also indirectly bears a pro rata share of the fees and expenses of the underlying funds in which it invests. Such indirect expenses are not included in the above-reported expense figures. |
| 2. | Expenses are equal to the Portfolio’s annualized expense ratio to reflect the six-month period. |
| | |
| 6 | | MainStay VP Mellon Natural Resources Portfolio |
Country Composition as of June 30, 2019(Unaudited)
| | | | |
| |
| United States | | | 47.6 | % |
| |
| Canada | | | 13.3 | |
| |
| France | | | 8.6 | |
| |
| United Kingdom | | | 4.8 | |
| |
| South Africa | | | 4.5 | |
| |
| Australia | | | 4.1 | |
| |
| Norway | | | 2.9 | |
| |
| Austria | | | 2.7 | |
| | | | |
| |
| Russia | | | 2.3 | % |
| |
| Brazil | | | 2.2 | |
| |
| Denmark | | | 2.1 | |
| |
| Portugal | | | 1.9 | |
| |
| China | | | 1.5 | |
| |
| Republic of Korea | | | 0.7 | |
| |
| Other Assets, Less Liabilities | | | 0.8 | |
| | | | |
| | | 100.0 | % |
| | | | |
See Portfolio of Investments beginning on page 10 for specific holdings within these categories. The Portfolio’s holdings are subject to change.
Top Ten Holdings as of June 30, 2019(excludingshort-term investment) (Unaudited)
| 4. | Archer-Daniels-Midland Co. |
| 8. | CF Industries Holdings, Inc. |
| 10. | Newmont Goldcorp Corp. |
Portfolio Management Discussion and Analysis(Unaudited)
Answers to the questions reflect the views of portfolio manager Robin Wehbe, CFA, of Mellon Investments Corporation, the Portfolio’s Subadvisor.
How did MainStay VP Mellon Natural Resources Portfolio perform relative to its benchmarks and peers during the six months ended June 30, 2019?
For the six months ended June 30, 2019, MainStay VP Mellon Natural Resources Portfolio returned 12.32% for Initial Class shares. Over the same period, Initial Class shares of the Portfolio underperformed the 13.84% return of the S&P Global Natural Resources Sector Index, which is the Portfolio’s primary benchmark, and the 14.58% return of the S&P North American Natural Resources Sector Index, which is the Portfolio’s secondary benchmark. For the six months ended June 30, 2019, Initial Class shares of the Portfolio outperformed the 11.97% return of the Morningstar Natural Resources Category Average.1
What factors affected the Portfolio’s relative performance during the reporting period?
A company-specific incident that negatively affected one holding, along with volatility in equity and commodity markets, made the first half of the reporting period a challenging time for the Portfolio relative to the S&P Global Natural Resources Sector Index. In January 2019, Brazilian iron ore mining company Vale, one of the Portfolio’s largest holdings, experienced a major catastrophe with large loss of life at one of their facilities. Shares in the company plunged as investors tried to assess the financial and reputational impacts of the event. Although the Portfolio exited its position in the weeks that followed and redeployed the assets, performance relative to the S&P Global Natural Resources Sector Index suffered. Relative performance was also weakened early in the reporting period by the Portfolio’s underweight exposure to large integrated oil and gas companies.
The second half of the reporting period proved more favorable for several of the Portfolio’s positions relative to the S&P Global Natural Resources Sector Index. Overweight exposure to surging U.S. energy stocks bolstered relative returns. Gold stocks climbed as well, another area in which the Portfolio held overweight exposure. Defensive holdings in packaging company Ball and new holdings in waste solutions companies Casella Waste and Covanta further enhanced relative returns as the United States struggled with China’s refusal to accept most of its waste exports. The Portfolio also saw strong performance from next gen energy investments in renewable utility Nextera Energy and solar equipment maker First Solar, as this market segment continued to benefit from secular growth tailwinds.
Which market segments were the strongest positive contributors to the Portfolio’s relative performance, and which market segments were particularly weak?
The Portfolio achieved its strongest returns relative to the S&P Global Natural Resources Index from strong individual stock
selections in the forest product & other segment, underweight exposure to steel and overweight exposure to next gen energy holdings. The most significant detractors from relative performance included the integrated energy and the refining & chemicals segments, where individual stock selections detracted; and metals & mining, where the negative impact of underweight exposure more than offset the positive impact of good stock selections.
During the reporting period, which individual stocks made the strongest positive contributions to the Portfolio’s absolute performance and which stocks detracted the most?
The top contributors to the Portfolio’s absolute performance included mine operator Newcrest Mining, metal packaging company Ball and energy exploration & production company Hess. (Contributions take weightings and total returns into account.) Newcrest Mining benefited from rising gold prices as the company demonstrated strong cost discipline with solid production results. Ball shares climbed as recent cost pressures showed signs of easing amid healthy global volume growth. Hess reported better-than-expected earnings on increased oil vs. natural gas production.
As mentioned earlier, the Portfolio’s holdings in iron ore production & exploration company Vale lost ground in the wake of a fatal accident in Brazil. Other significant detractors from absolute performance included lithium producer Livent, which announced a sharp cut to full-year guidance in the face of persistent business headwinds; and oil and natural gas producer Concho Resources, which posted lower-than-expected earnings due to unanticipated capital expenditures.
Did the Portfolio make any significant purchases or sales during the reporting period?
The Portfolio established a new position in shares of integrated oil & gas company BP, reflecting our view that the company’s large portfolio of energy producing properties provides advantages of scale and increased return potential in a rapidly maturing sector. The Portfolio also initiated a significant position in diversified mining company Anglo American, which, in our view, possesses several attractive business characteristics, including the potential for an effective operational and financial turnaround, organic copper growth and the winding down of South African operations.
Significant sales included Vale, described earlier, and diversified mining company Rio Tinto, which in our opinion suffered from unfavorable iron ore supply and demand dynamics.
| 1. | See page 5 for more information on benchmark and peer group returns. |
| | |
| 8 | | MainStay VP Mellon Natural Resources Portfolio |
How did the Portfolio’s subsector and subindustry weightings change during the reporting period?
Relative to the S&P Global Natural Resources Sector Index, the Portfolio further increased its overweight exposure to next gen energy and agriculture and added to its underweighted integrated energy position. Conversely, the Portfolio reduced its already underweight holdings in the metals & mining and forest products & other segments, while trimming its overweight position in refining & chemicals.
How was the Portfolio positioned at the end of the reporting period?
As of June 30, 2019, the Portfolio held its largest overweight exposures relative to the S&P Global Natural Resources Sector Index in the next gen energy, U.S./onshore upstream and agriculture segments. As of the same date, the Portfolio maintained its most significantly underweight exposures in forest products & other, metals & mining and steel.
The opinions expressed are those of the portfolio managers as of the date of this report and are subject to change. There is no guarantee that any forecasts will come to pass. This material does not constitute investment advice and is not intended as an endorsement of any specific investment.
Not all MainStay VP Portfolios and/or share classes are available under all policies.
Portfolio of InvestmentsJune 30, 2019 (Unaudited)
| | | | | | | | |
| | |
| | | Shares | | | Value | |
| Common Stocks 98.2%† | |
Australia 4.1% | |
Newcrest Mining, Ltd. (Metals & Mining) | | | 481,639 | | | $ | 10,803,402 | |
| | | | | | | | |
|
Austria 2.7% | |
OMV A.G. (Oil, Gas & Consumable Fuels) | | | 145,312 | | | | 7,080,290 | |
| | | | | | | | |
|
Brazil 2.2% | |
Petroleo Brasileiro S.A., Sponsored ADR (Oil, Gas & Consumable Fuels) | | | 404,549 | | | | 5,744,596 | |
| | | | | | | | |
|
Canada 13.3% | |
Barrick Gold Corp. (Metals & Mining) | | | 623,155 | | | | 9,827,154 | |
Lundin Mining Corp. (Metals & Mining) | | | 814,214 | | | | 4,482,825 | |
Nutrien, Ltd. (Chemicals) | | | 174,792 | | | | 9,344,380 | |
Nutrien, Ltd. (Chemicals) | | | 130,092 | | | | 6,958,837 | |
Teck Resources, Ltd., Class B (Metals & Mining) | | | 173,738 | | | | 4,006,398 | |
| | | | | | | | |
| | | | | | | 34,619,594 | |
| | | | | | | | |
China 1.5% | |
CNOOC, Ltd. (Oil, Gas & Consumable Fuels) | | | 2,235,000 | | | | 3,822,420 | |
| | | | | | | | |
|
Denmark 2.1% | |
Vestas Wind Systems A/S (Electrical Equipment) | | | 62,462 | | | | 5,395,360 | |
| | | | | | | | |
|
France 8.6% | |
Air Liquide S.A. (Chemicals) | | | 37,865 | | | | 5,298,078 | |
TOTAL S.A. (Oil, Gas & Consumable Fuels) | | | 306,080 | | | | 17,149,849 | |
| | | | | | | | |
| | | | | | | 22,447,927 | |
| | | | | | | | |
Norway 2.9% | |
Yara International ASA (Chemicals) | | | 155,794 | | | | 7,557,345 | |
| | | | | | | | |
|
Portugal 1.9% | |
Galp Energia SGPS S.A. (Oil, Gas & Consumable Fuels) | | | 319,611 | | | | 4,915,387 | |
| | | | | | | | |
|
Republic of Korea 0.7% | |
S-Oil Corp. (Oil, Gas & Consumable Fuels) | | | 25,695 | | | | 1,862,618 | |
| | | | | | | | |
|
Russia 2.3% | |
Gazprom PJSC, Sponsored ADR (Oil, Gas & Consumable Fuels) | | | 811,002 | | | | 5,941,401 | |
| | | | | | | | |
|
South Africa 4.5% | |
Anglo American PLC (Metals & Mining) | | | 411,493 | | | | 11,729,202 | |
| | | | | | | | |
|
United Kingdom 4.8% | |
BP PLC (Oil, Gas & Consumable Fuels) | | | 1,806,230 | | | | 12,583,899 | |
| | | | | | | | |
| | | | | | | | |
| | |
| | | Shares | | | Value | |
United States 46.6% | |
Archer-Daniels-Midland Co. (Food Products) | | | 295,058 | | | $ | 12,038,366 | |
Ball Corp. (Containers & Packaging) | | | 137,554 | | | | 9,627,404 | |
Casella Waste Systems, Inc., Class A (Commercial Services & Supplies) (a) | | | 110,566 | | | | 4,381,731 | |
CF Industries Holdings, Inc. (Chemicals) | | | 208,515 | | | | 9,739,736 | |
Compass Minerals International, Inc. (Metals & Mining) | | | 61,330 | | | | 3,370,083 | |
Concho Resources, Inc. (Oil, Gas & Consumable Fuels) | | | 43,645 | | | | 4,503,291 | |
Covanta Holding Corp. (Commercial Services & Supplies) | | | 221,735 | | | | 3,971,274 | |
Diamondback Energy, Inc. (Oil, Gas & Consumable Fuels) | | | 38,708 | | | | 4,218,011 | |
EOG Resources, Inc. (Oil, Gas & Consumable Fuels) | | | 75,218 | | | | 7,007,309 | |
First Solar, Inc. (Semiconductors & Semiconductor Equipment) (a) | | | 85,921 | | | | 5,643,291 | |
FMC Corp. (Chemicals) | | | 64,055 | | | | 5,313,362 | |
Freeport-McMoRan, Inc. (Metals & Mining) | | | 625,389 | | | | 7,260,766 | |
Hess Corp. (Oil, Gas & Consumable Fuels) | | | 113,525 | | | | 7,216,784 | |
Marathon Petroleum Corp. (Oil, Gas & Consumable Fuels) | | | 95,277 | | | | 5,324,079 | |
Newmont Goldcorp Corp. (Metals & Mining) | | | 213,274 | | | | 8,204,651 | |
NextEra Energy, Inc. (Electric Utilities) | | | 27,523 | | | | 5,638,362 | |
Occidental Petroleum Corp. (Oil, Gas & Consumable Fuels) | | | 84,352 | | | | 4,241,219 | |
PBF Energy, Inc., Class A (Oil, Gas & Consumable Fuels) | | | 111,069 | | | | 3,476,460 | |
Pioneer Natural Resources Co. (Oil, Gas & Consumable Fuels) | | | 22,718 | | | | 3,495,391 | |
Valero Energy Corp. (Oil, Gas & Consumable Fuels) | | | 78,357 | | | | 6,708,143 | |
| | | | | | | | |
| | | | | | | 121,379,713 | |
| | | | | | | | |
Total Common Stocks
(Cost $240,811,277) | | | | | | | 255,883,154 | |
| | | | | | | | |
|
| Short-Term Investment 1.0% | |
Affiliated Investment Company 1.0% | |
United States 1.0% | |
MainStay U.S. Government Liquidity Fund, 2.03% (b) | | | 2,561,211 | | | | 2,561,211 | |
| | | | | | | | |
TotalShort-Term Investment
(Cost $2,561,211) | | | | | | | 2,561,211 | |
| | | | | | | | |
Total Investments
(Cost $243,372,488) | | | 99.2 | % | | | 258,444,365 | |
Other Assets, Less Liabilities | | | 0.8 | | | | 2,034,560 | |
Net Assets | | | 100.0 | % | | $ | 260,478,925 | |
| | | | |
| 10 | | MainStay VP Mellon Natural Resources Portfolio | | The notes to the financial statements are an integral part of,
and should be read in conjunction with, the financial statements. |
| † | Percentages indicated are based on Portfolio net assets. |
| (a) | Non-income producing security. |
| (b) | Current yield as of June 30, 2019. |
The following abbreviation is used in the preceding pages:
ADR—American Depositary Receipt
The following is a summary of the fair valuations according to the inputs used as of June 30, 2019, for valuing the Portfolio’s assets:
| | | | | | | | | | | | | | | | |
Description | | Quoted
Prices in
Active
Markets for
Identical
Assets
(Level 1) | | | Significant
Other
Observable
Inputs
(Level 2) | | | Significant
Unobservable
Inputs
(Level 3) | | | Total | |
| | | | |
Asset Valuation Inputs | | | | | | | | | | | | | | | | |
| Investments in Securities (a) | | | | | | | | | | | | | | | | |
| Common Stocks | | $ | 255,883,154 | | | $ | — | | | $ | — | | | $ | 255,883,154 | |
| Short-Term Investment | | | | | | | | | | | | | | | | |
Affiliated Investment Company | | | 2,561,211 | | | | — | | | | — | | | | 2,561,211 | |
| | | | | | | | | | | | | | | | |
| Total Investments in Securities | | $ | 258,444,365 | | | $ | — | | | $ | — | | | $ | 258,444,365 | |
| | | | | | | | | | | | | | | | |
| (a) | For a complete listing of investments and their industries, see the Portfolio of Investments. |
The table below sets forth the diversification of the Portfolio’s investments by industry.
Industry Diversification (Unaudited)
| | | | | | | | |
| | | Value | | | Percent † | |
Chemicals | | $ | 44,211,738 | | | | 17.0 | % |
Commercial Services & Supplies | | | 8,353,005 | | | | 3.2 | |
Containers & Packaging | | | 9,627,404 | | | | 3.7 | |
Electric Utilities | | | 5,638,362 | | | | 2.1 | |
Electrical Equipment | | | 5,395,360 | | | | 2.1 | |
Food Products | | | 12,038,366 | | | | 4.6 | |
Metals & Mining | | | 59,684,481 | | | | 22.9 | |
Oil, Gas & Consumable Fuels | | | 105,291,147 | | | | 40.4 | |
Semiconductors & Semiconductor Equipment | | | 5,643,291 | | | | 2.2 | |
| | | | | | | | |
| | | 255,883,154 | | | | 98.2 | |
Short-Term Investment | | | 2,561,211 | | | | 1.0 | |
Other Assets, Less Liabilities | | | 2,034,560 | | | | 0.8 | |
| | | | | | | | |
Net Assets | | $ | 260,478,925 | | | | 100.0 | % |
| | | | | | | | |
| † | Percentages indicated are based on Portfolio net assets. |
| | | | | | |
The notes to the financial statements are an integral part of,
and should be read in conjunction with, the financial statements. | | | | | 11 | |
Statement of Assets and Liabilitiesas of June 30, 2019 (Unaudited)
| | | | |
| Assets | | | | |
Investment in securities, at value (identified cost $240,811,277) | | $ | 255,883,154 | |
Investment in affiliated investment company, at value (identified cost $2,561,211) | | | 2,561,211 | |
Cash denominated in foreign currencies (identified cost $85,351) | | | 84,103 | |
Cash | | | 5,682 | |
Receivables: | | | | |
Investment securities sold | | | 1,746,769 | |
Dividends | | | 480,098 | |
Portfolio shares sold | | | 29,205 | |
Other assets | | | 85,914 | |
| | | | |
Total assets | | | 260,876,136 | |
| | | | |
| |
| Liabilities | | | | |
Payables: | | | | |
Portfolio shares redeemed | | | 189,347 | |
Manager (See Note 3) | | | 162,624 | |
Professional fees | | | 27,173 | |
Custodian | | | 8,603 | |
Trustees | | | 430 | |
Accrued expenses | | | 9,034 | |
| | | | |
Total liabilities | | | 397,211 | |
| | | | |
Net assets | | $ | 260,478,925 | |
| | | | |
| |
| Composition of Net Assets | | | | |
Shares of beneficial interest outstanding (par value of $.001 per share) unlimited number of shares authorized | | $ | 42,669 | |
Additional paid-in capital | | | 469,733,579 | |
| | | | |
| | | 469,776,248 | |
Total distributable earnings (loss) | | | (209,297,323 | ) |
| | | | |
Net assets | | $ | 260,478,925 | |
| | | | |
| | | | |
Initial Class | | | | |
Net assets applicable to outstanding shares | | $ | 260,478,925 | |
| | | | |
Shares of beneficial interest outstanding | | | 42,668,962 | |
| | | | |
Net asset value per share outstanding | | $ | 6.10 | |
| | | | |
| | | | |
| 12 | | MainStay VP Mellon Natural Resources Portfolio | | The notes to the financial statements are an integral part of,
and should be read in conjunction with, the financial statements. |
Statement of Operationsfor the six months ended June 30, 2019 (Unaudited)
| | | | |
| Investment Income (Loss) | | | | |
Income | | | | |
Dividends-unaffiliated (a) | | $ | 3,651,965 | |
Non-cash dividends | | | 868,809 | |
Dividends-affiliated | | | 43,150 | |
Securities lending | | | 27,866 | |
| | | | |
Total income | | | 4,591,790 | |
| | | | |
Expenses | | | | |
Manager (See Note 3) | | | 1,011,334 | |
Shareholder communication | | | 122,187 | |
Professional fees | | | 33,232 | |
Custodian | | | 10,780 | |
Trustees | | | 3,330 | |
Miscellaneous | | | 10,203 | |
| | | | |
Total expenses | | | 1,191,066 | |
| | | | |
Net investment income (loss) | | | 3,400,724 | |
| | | | |
|
| Realized and Unrealized Gain (Loss) on Investments and Foreign Currency Transactions | |
Net realized gain (loss) on: | | | | |
Unaffiliated investment transactions | | | (9,564,990 | ) |
Foreign currency transactions | | | (1,738 | ) |
| | | | |
Net realized gain (loss) on investments and foreign currency transactions | | | (9,566,728 | ) |
| | | | |
Net change in unrealized appreciation (depreciation) on: | | | | |
Unaffiliated investments | | | 35,736,887 | |
Translation of other assets and liabilities in foreign currencies | | | 691 | |
| | | | |
Net change in unrealized appreciation (depreciation) on investments and foreign currency transactions | | | 35,737,578 | |
| | | | |
Net realized and unrealized gain (loss) on investments and foreign currency transactions | | | 26,170,850 | |
| | | | |
Net increase (decrease) in net assets resulting from operations | | $ | 29,571,574 | |
| | | | |
| (a) | Dividends recorded net of foreign withholding taxes in the amount of $271,901. |
| | | | | | |
The notes to the financial statements are an integral part of,
and should be read in conjunction with, the financial statements. | | | | | 13 | |
Statements of Changes in Net Assets
for the six months ended June 30, 2019 (Unaudited) and the year ended December 31, 2018
| | | | | | | | |
| | | 2019 | | | 2018 | |
| Increase (Decrease) in Net Assets | |
Operations: | | | | | | | | |
Net investment income (loss) | | $ | 3,400,724 | | | $ | 1,936,539 | |
Net realized gain (loss) on investments and foreign currency transactions | | | (9,566,728 | ) | | | (40,630,459 | ) |
Net change in unrealized appreciation (depreciation) on investments and foreign currency transactions | | | 35,737,578 | | | | (57,913,149 | ) |
| | | | |
Net increase (decrease) in net assets resulting from operations | | | 29,571,574 | | | | (96,607,069 | ) |
| | | | |
Capital share transactions: | | | | | | | | |
Net proceeds from sale of shares | | | 12,958,422 | | | | 24,434,729 | |
Cost of shares redeemed | | | (22,118,417 | ) | | | (67,013,329 | ) |
| | | | |
Increase (decrease) in net assets derived from capital share transactions | | | (9,159,995 | ) | | | (42,578,600 | ) |
| | | | |
Net increase (decrease) in net assets | | | 20,411,579 | | | | (139,185,669 | ) |
| | |
| Net Assets | | | | | | | | |
Beginning of period | | | 240,067,346 | | | | 379,253,015 | |
| | | | |
End of period | | $ | 260,478,925 | | | $ | 240,067,346 | |
| | | | | | | | |
| | | | |
| 14 | | MainStay VP Mellon Natural Resources Portfolio | | The notes to the financial statements are an integral part of,
and should be read in conjunction with, the financial statements. |
Financial Highlightsselected per share data and ratios
| | | | | | | | | | | | | | | | | | | | | | | | | | | | | | | | | | | |
| | | |
| | | Six months
ended
June 30, | | | | Year ended December 31, |
| | | | | | | |
| Initial Class | | 2019* | | | | 2018 | | 2017 | | 2016 | | 2015 | | 2014 |
| | | | | | | |
Net asset value at beginning of period | | | $ | 5.43 | | | | | | | | | $ | 7.61 | | | | $ | 7.67 | | | | $ | 5.38 | | | | $ | 8.06 | | | | $ | 9.97 | |
| | | | | | | | | | | | | | | | | | | | | | | | | | | | | | | | | | | |
| | | | | | | |
Net investment income (loss) | | | | 0.08 | | | | | | | | | | 0.04 | | | | | (0.01 | ) | | | | (0.01 | ) | | | | 0.04 | | | | | 0.04 | |
| | | | | | | |
Net realized and unrealized gain (loss) on investments | | | | 0.59 | | | | | | | | | | (2.22 | ) | | | | (0.05 | ) | | | | 2.34 | | | | | (2.69 | ) | | | | (1.91 | ) |
| | | | | | | |
Net realized and unrealized gain (loss) on foreign currency transactions | | | | 0.00 | ‡ | | | | | | | | | 0.00 | ‡ | | | | (0.00 | )‡ | | | | (0.00 | )‡ | | | | 0.00 | ‡ | | | | (0.00 | )‡ |
| | | | | | | | | | | | | | | | | | | | | | | | | | | | | | | | | | | |
| | | | | | | |
Total from investment operations | | | | 0.67 | | | | | | | | | | (2.18 | ) | | | | (0.06 | ) | | | | 2.33 | | | | | (2.65 | ) | | | | (1.87 | ) |
| | | | | | | | | | | | | | | | | | | | | | | | | | | | | | | | | | | |
| | | | | | | |
| Less dividends: | | | | | | | | | | | | | | | | | | | | | | | | | | | | | | | | | | | |
| | | | | | | |
From net investment income | | | | — | | | | | | | | | | — | | | | | — | | | | | (0.04 | ) | | | | (0.03 | ) | | | | (0.04 | ) |
| | | | | | | | | | | | | | | | | | | | | | | | | | | | | | | | | | | |
| | | | | | | |
Net asset value at end of period | | | $ | 6.10 | | | | | | | | | $ | 5.43 | | | | $ | 7.61 | | | | $ | 7.67 | | | | $ | 5.38 | | | | $ | 8.06 | |
| | | | | | | | | | | | | | | | | | | | | | | | | | | | | | | | | | | |
| | | | | | | |
Total investment return (a) | | | | 12.34 | %(b) | | | | | | | | | (28.65 | %)(b) | | | | (0.78 | %)(b) | | | | 43.33 | % | | | | (32.96 | %) | | | | (18.81 | %) |
| | | | | | | |
| Ratios (to average net assets)/Supplemental Data: | | | | | | | | | | | | | | | | | | | | | | | | | | | | | | | | | | | |
| | | | | | | |
Net investment income (loss) | | | | 2.66 | %†† | | | | | | | | | 0.59 | % | | | | (0.10 | %) | | | | (0.12 | %)(c) | | | | 0.57 | % | | | | 0.38 | % |
| | | | | | | |
Net expenses (d) | | | | 0.93 | %†† | | | | | | | | | 0.94 | % | | | | 0.94 | % | | | | 0.93 | % (e) | | | | 0.93 | % | | | | 0.93 | % |
| | | | | | | |
Portfolio turnover rate | | | | 53 | % | | | | | | | | | 78 | % | | | | 17 | % | | | | 40 | % | | | | 21 | % | | | | 33 | % |
| | | | | | | |
Net assets at end of period (in 000’s) | | | $ | 260,479 | | | | | | | | | $ | 240,067 | | | | $ | 379,253 | | | | $ | 432,891 | | | | $ | 332,823 | | | | $ | 466,515 | |
| ‡ | Less than one cent per share. |
| (a) | Total return does not reflect any deduction of sales charges, mortality and expense charges, contract charges or administrative charges. For periods of less than one year, total return is not annualized. |
| (b) | Total investment return may reflect adjustments to conform to generally accepted accounting principles. |
| (c) | Without the custody fee reimbursement, net investment income (loss) would have been (0.13)%. |
| (d) | In addition to the fees and expenses which the Portfolio bears directly, it also indirectly bears a pro-rata share of the fees and expenses of the underlying funds in which it invests. Such indirect expenses are not included in the above expense ratios. |
| (e) | Without the custody fee reimbursement, net expenses would have been 0.94%. |
| | | | | | |
The notes to the financial statements are an integral part of,
and should be read in conjunction with, the financial statements. | | | | | 15 | |
Notes to Financial Statements(Unaudited)
Note 1–Organization and Business
MainStay VP Funds Trust (the “Fund”) was organized as a Delaware statutory trust on February 1, 2011. The Fund is registered under the Investment Company Act of 1940, as amended (the “1940 Act”), as an open-end management investment company. The Fund is comprised of thirty-one separate series (collectively referred to as the “Portfolios”). These financial statements and notes relate to the MainStay VP Mellon Natural Resources Portfolio (formerly known as MainStay VP VanEck Global Hard Assets Portfolio) (the “Portfolio”), a “non-diversified” portfolio, as that term is defined in the 1940 Act, as interpreted or modified by regulatory authorities having jurisdiction, from time to time. Since the Portfolio has historically operated as a “diversified” portfolio, it will not operate as “non-diversified” without first obtaining shareholder approval.
Shares of the Portfolio are currently offered to certain separate accounts to fund variable annuity policies and variable universal life insurance policies issued by New York Life Insurance and Annuity Corporation (“NYLIAC”), awholly-owned subsidiary of New York Life Insurance Company (“New York Life”) and may also be offered to fund variable annuity policies and variable universal life insurance policies issued by other insurance companies. NYLIAC allocates shares of the Portfolios to, among others, certain NYLIAC separate accounts. Shares of the Portfolio are also offered to the MainStay VP Conservative Allocation Portfolio, MainStay VP Moderate Allocation Portfolio, MainStay VP Moderate Growth Allocation Portfolio and MainStay VP Growth Allocation Portfolio, which operate as “funds-of-funds.”
The Portfolio currently offers one class of shares. Initial Class shares commenced operations on February 17, 2012. Shares of the Portfolio are offered and are redeemed at a price equal to their net asset value (“NAV”) per share. No sales or redemption charge is applicable to the purchase or redemption of the Portfolio’s shares.
The Portfolio’s investment objective is to seeklong-term capital appreciation.
Note 2–Significant Accounting Policies
The Portfolio is an investment company and accordingly follows the investment company accounting and reporting guidance of the Financial Accounting Standards Board (“FASB”) Accounting Standard CodificationTopic 946 Financial Services—Investment Companies. The Portfolio prepares its financial statements in accordance with generally accepted accounting principles (“GAAP”) in the United States of America and follows the significant accounting policies described below.
(A) Securities Valuation. Investments are usually valued as of the close of regular trading on the New York Stock Exchange (the “Exchange”) (usually 4:00 p.m. Eastern time) on each day the Portfolio is open for business (“valuation date”).
The Board of Trustees of the Fund (the “Board”) adopted procedures establishing methodologies for the valuation of the Portfolio’s securities and other assets and delegated the responsibility for valuation determinations under those procedures to the Valuation Committee of the Fund (the “Valuation Committee”). The Board authorized the Valuation Committee to appoint a Valuation Subcommittee (the “Subcommittee”) to deal in the first instance with establishing the prices of securities for which market quotations are not readily available or the prices of which are not otherwise readily determinable under these procedures. The
Subcommittee meets (in person, via electronic mail or via teleconference) on an as-needed basis. Subsequently, the Valuation Committee meets to ensure that actions taken by the Subcommittee were appropriate. The procedures state that, subject to the oversight of the Board and unless otherwise noted, the responsibility for theday-to-day valuation of portfolio assets (including fair value measurements for the Portfolio’s assets and liabilities) rests with New York Life Investment Management LLC (“New York Life Investments” or the “Manager”), aided to whatever extent necessary by the Subadvisor (as defined in Note 3(A)).
To assess the appropriateness of security valuations, the Manager, the Subadvisor or the Portfolio’s third-party service provider, who is subject to oversight by the Manager, regularly compares prior day prices, prices on comparable securities and the sale prices to the prior and current day prices and challenges prices with changes exceeding certain tolerance levels with third-party pricing services or broker sources. For those securities valued through either a standardized fair valuation methodology or a fair valuation measurement, the Subcommittee deals in the first instance with such valuation and the Valuation Committee reviews and affirms, if appropriate, the reasonableness of the valuation based on such methodologies and measurements on a regular basis after considering information that is reasonably available and deemed relevant by the Valuation Committee. Any action taken by the Subcommittee with respect to the valuation of a portfolio security or other asset is submitted for review and ratification (if appropriate) to the Valuation Committee and the Board at the next regularly scheduled meeting.
“Fair value” is defined as the price the Portfolio would reasonably expect to receive upon selling an asset or liability in an orderly transaction to an independent buyer in the principal or most advantageous market for the asset or liability. Fair value measurements are determined within a framework that establishes a three-tier hierarchy which maximizes the use of observable market data and minimizes the use of unobservable inputs to establish a classification of fair value measurements for disclosure purposes. “Inputs” refer broadly to the assumptions that market participants would use in pricing the asset or liability, including assumptions about risk, such as the risk inherent in a particular valuation technique used to measure fair value using a pricing model and/or the risk inherent in the inputs for the valuation technique. Inputs may be observable or unobservable. Observable inputs reflect the assumptions market participants would use in pricing the asset or liability based on market data obtained from sources independent of the Portfolio. Unobservable inputs reflect the Portfolio’s own assumptions about the assumptions market participants would use in pricing the asset or liability based on the information available. The inputs or methodology used for valuing assets or liabilities may not be an indication of the risks associated with investing in those assets or liabilities. The three-tier hierarchy of inputs is summarized below.
| • | | Level 1—quoted prices in active markets for an identical asset or liability |
| • | | Level 2—other significant observable inputs (including quoted prices for a similar asset or liability in active markets, interest rates and yield curves, prepayment speeds, credit risk, etc.) |
| • | | Level 3—significant unobservable inputs (including the Portfolio’s own assumptions about the assumptions that market participants would use in measuring fair value of an asset or liability) |
| | |
| 16 | | MainStay VP Mellon Natural Resources Portfolio |
The level of an asset or liability within the fair value hierarchy is based on the lowest level of an input, both individually and in the aggregate, that is significant to the fair value measurement. As of June 30, 2019, the aggregate value by input level of the Portfolio’s assets and liabilities is included at the end of the Portfolio’s Portfolio of Investments.
The Portfolio may use third-party vendor evaluations, whose prices may be derived from one or more of the following standard inputs, among others:
| | |
• Broker/dealer quotes | | • Benchmark securities |
• Two-sided markets | | • Reference data (corporate actions or material event notices) |
• Bids/offers | | • Monthly payment information |
• Industry and economic events | | • Reported trades |
An asset or liability for which market values cannot be measured using the methodologies described above is valued by methods deemed reasonable in good faith by the Valuation Committee, following the procedures established by the Board, to represent fair value. Under these procedures, the Portfolio generally uses a market-based approach which may use related or comparable assets or liabilities, recent transactions, market multiples, book values and other relevant information. The Portfolio may also use an income-based valuation approach in which the anticipated future cash flows of the asset or liability are discounted to calculate fair value. Discounts may also be applied due to the nature and/or duration of any restrictions on the disposition of the asset or liability. Fair value represents a good faith approximation of the value of a security. Fair value determinations involve the consideration of a number of subjective factors, an analysis of applicable facts and circumstances and the exercise of judgment. As a result, it is possible that the fair value for a security determined in good faith in accordance with the Portfolio’s valuation procedures may differ from valuations for the same security determined by other funds using their own valuation procedures. Although the Portfolio’s valuation procedures are designed to value a security at the price the Portfolio may reasonably expect to receive upon the security’s sale in an orderly transaction, there can be no assurance that any fair value determination thereunder would, in fact, approximate the amount that the Portfolio would actually realize upon the sale of the security or the price at which the security would trade if a reliable market price were readily available. During the six-month period ended June 30, 2019, there were no material changes to the fair value methodologies.
Securities which may be valued in this manner include, but are not limited to: (i) a security for which trading has been halted or suspended; (ii) a debt security that has recently gone into default and for which there is not a current market quotation; (iii) a security of an issuer that has entered into a restructuring; (iv) a security that has been delisted from a national exchange; (v) a security for which the market price is not readily available from a third-party pricing source or, if so provided, does not, in the opinion of the Manager or the Subadvisor, reflect the security’s market value; (vi) a security subject to trading collars for which no or limited trading takes place; and (vii) a security whose principal market has been temporarily closed at a time when, under normal conditions, it would be open. Securities valued in this manner are generally categorized as Level 3 in the hierarchy. As of June 30,
2019, there were no securities held by the Portfolio that were fair valued in such a manner.
Certain securities held by the Portfolio may principally trade in foreign markets. Events may occur between the time the foreign markets close and the time at which the Portfolio’s NAVs are calculated. These events may include, but are not limited to, situations relating to a single issuer in a market sector, significant fluctuations in U.S. or foreign markets, natural disasters, armed conflicts, governmental actions or other developments not tied directly to the securities markets. Should the Manager or the Subadvisor conclude that such events may have affected the accuracy of the last price of such securities reported on the local foreign market, the Subcommittee may, pursuant to procedures adopted by the Board, adjust the value of the local price to reflect the estimated impact on the price of such securities as a result of such events. In this instance, securities are generally categorized as Level 3 in the hierarchy. Additionally, certain foreign equity securities are also fair valued whenever the movement of a particular index exceeds certain thresholds. In such cases, the securities are fair valued by applying factors provided by a third-party vendor in accordance with valuation procedures adopted by the Board and are generally categorized as Level 2 in the hierarchy. As of June 30, 2019, no foreign equity securities held by the Portfolio were fair valued in such a manner.
Equity securities are valued at the last quoted sales prices as of the close of regular trading on the relevant exchange on each valuation date. Securities that are not traded on the valuation date are valued at the mean of the last quoted bid and ask prices. Prices are normally taken from the principal market in which each security trades. These securities are generally categorized as Level 1 in the hierarchy.
Investments in mutual funds, including money market funds, are valued at their respective NAVs as of the close of the Exchange on the valuation date. These securities are generally categorized as Level 1 in the hierarchy.
Temporary cash investments acquired in excess of 60 days to maturity at the time of purchase are valued using the latest bid prices or using valuations based on a matrix system (which considers such factors as security prices, yields, maturities and ratings), both as furnished by independent pricing services. Other temporary cash investments which mature in 60 days or less at the time of purchase (“Short-Term Investments”) are valued using the amortized cost method of valuation, unless the use of such method would be inappropriate. The amortized cost method involves valuing a security at its cost on the date of purchase and thereafter assuming a constant amortization to maturity of the difference between such cost and the value on maturity date. Amortized cost approximates the current fair value of a security. Securities valued using the amortized cost method are not valued using quoted prices in an active market and are generally categorized as Level 2 in the hierarchy.
The information above is not intended to reflect an exhaustive list of the methodologies that may be used to value portfolio investments. The valuation procedures permit the use of a variety of valuation methodologies in connection with valuing portfolio investments. The methodology used for a specific type of investment may vary based on the market data available or other considerations. The methodologies summarized above may not represent the specific means by which portfolio investments are valued on any particular business day.
Notes to Financial Statements(Unaudited) (continued)
(B) Income Taxes. The Portfolio’s policy is to comply with the requirements of the Internal Revenue Code of 1986, as amended (the “Internal Revenue Code”), applicable to regulated investment companies and to distribute all of its taxable income to the shareholders of the Portfolio within the allowable time limits. Therefore, no federal, state and local income tax provisions are required.
Management evaluates the Portfolio’s tax positions to determine if the tax positions taken meet the minimum recognition threshold in connection with accounting for uncertainties in income tax positions taken or expected to be taken for the purposes of measuring and recognizing tax liabilities in the financial statements. Recognition of tax benefits of an uncertain tax position is permitted only to the extent the position is “more likely than not” to be sustained assuming examination by taxing authorities. Management has analyzed the Portfolio’s tax positions taken on federal, state and local income tax returns for all open tax years (for up to three tax years) and has concluded that no provisions for federal, state and local income tax are required in the Portfolio’s financial statements. The Portfolio’s federal, state and local income tax and federal excise tax returns for tax years for which the applicable statutes of limitations have not expired are subject to examination by the Internal Revenue Service and state and local departments of revenue.
(C) Foreign Taxes. The Portfolio may be subject to foreign taxes on income and other transaction-based taxes imposed by certain countries in which it invests. A portion of the taxes on gains on investments or currency purchases/repatriation may be reclaimable. The Portfolio will accrue such taxes and reclaims as applicable, based upon its current interpretation of tax rules and regulations that exist in the markets in which it invests.
The Portfolio may be subject to taxation on realized capital gains, repatriation proceeds and other transaction-based taxes imposed by certain countries in which it invests. The Portfolio will accrue such taxes as applicable based upon its current interpretation of tax rules and regulations that exist in the market in which it invests. Capital gains taxes relating to positions still held are reflected as a liability on the Statement of Assets and Liabilities, as well as an adjustment to the Portfolio’s net unrealized appreciation (depreciation). Taxes related to capital gains realized, if any, are reflected as part of net realized gain (loss) in the Statement of Operations. Changes in tax liabilities related to capital gains taxes on unrealized investment gains, if any, are reflected as part of the change in net unrealized appreciation (depreciation) on investments in the Statement of Operations. Transaction-based charges are generally assessed as a percentage of the transaction amount.
(D) Dividends and Distributions to Shareholders. Dividends and distributions are recorded on the ex-dividend date. The Portfolio intends to declare and pay dividends from net investment income and distributions from net realized capital and currency gains, if any, at least annually. Unless the shareholder elects otherwise, all dividends and distributions are reinvested in the same class of shares of the Portfolio, at NAV. Dividends and distributions to shareholders are determined in accordance with federal income tax regulations and may differ from determinations using GAAP.
(E) Security Transactions and Investment Income. The Portfolio records security transactions on the trade date. Realized gains and losses on security transactions are determined using the identified cost method. Dividend income is recognized on the ex-dividend date;
net of any foreign tax withheld at the source, and interest income is accrued as earned using the effective interest rate method. Discounts and premiums on securities purchased for the Portfolio are accreted and amortized, respectively, on the effective interest rate method over the life of the respective securities.
(F) Expenses. Expenses of the Fund are allocated to the individual Portfolios in proportion to the net assets of the respective Portfolios when the expenses are incurred, except where direct allocations of expenses can be made. The expenses borne by the Portfolio, including those of related parties to the Portfolio, are shown in the Statement of Operations.
Additionally, the Portfolio may invest in mutual funds, which are subject to management fees and other fees that may cause the costs of investing in mutual funds to be greater than the costs of owning the underlying securities directly. These indirect expenses of mutual funds are not included in the amounts shown as expenses in the Portfolio’s Statement of Operations or in the expense ratios included in the Financial Highlights.
(G) Use of Estimates. In preparing financial statements in conformity with GAAP, management makes estimates and assumptions that affect the reported amounts and disclosures in the financial statements. Actual results could differ from those estimates.
(H) Repurchase Agreements. The Portfolio may enter into repurchase agreements (i.e., buy a security from another party with the agreement that it be sold back in the future) to earn income. The Portfolio may enter into repurchase agreements only with counterparties, usually financial institutions, that are deemed by the Manager or the Subadvisor to be creditworthy, pursuant to guidelines established by the Board. During the term of any repurchase agreement, the Manager or the Subadvisor will continue to monitor the creditworthiness of the counterparty. Under the 1940 Act, repurchase agreements are considered to be collateralized loans by the Portfolio to the counterparty secured by the securities transferred to the Portfolio.
Repurchase agreements are subject to counterparty risk, meaning the Portfolio could lose money by the counterparty’s failure to perform under the terms of the agreement. The Portfolio mitigates this risk by ensuring the repurchase agreement is collateralized by cash, U.S. government securities, fixed income securities and/or other securities. The collateral is held by the Portfolio’s custodian and valued daily on a mark to market basis to determine if the value, including accrued interest, exceeds the repurchase price. In the event of the counterparty’s default on the obligation to repurchase, the Portfolio has the right to liquidate the collateral and apply the proceeds in satisfaction of the obligation. Under certain circumstances, such as in the event of default or bankruptcy by the counterparty, realization and/or retention of the collateral may be limited or subject to delay, to legal proceedings and possible realized loss to the Portfolio. As of June 30, 2019, the Portfolio did not hold any repurchase agreements.
(I) Foreign Currency Transactions. The Portfolio’s books and records are maintained in U.S. dollars. Prices of securities denominated in foreign currency amounts are translated into U.S. dollars at the mean
| | |
| 18 | | MainStay VP Mellon Natural Resources Portfolio |
between the buying and selling rates last quoted by any major U.S. bank at the following dates:
| (i) | market value of investment securities, other assets and liabilities— at the valuation date; and |
| (ii) | purchases and sales of investment securities, income and expenses—at the date of such transactions. |
The assets and liabilities that are denominated in foreign currency amounts are presented at the exchange rates and market values at the close of the period. The realized and unrealized changes in net assets arising from fluctuations in exchange rates and market prices of securities are not separately presented.
Net realized gain (loss) on foreign currency transactions represents net gains and losses on foreign currency forward contracts, net currency gains or losses realized as a result of differences between the amounts of securities sale proceeds or purchase cost, dividends, interest and withholding taxes as recorded on the Portfolio’s books, and the U.S. dollar equivalent amount actually received or paid. Net currency gains or losses from valuing such foreign currency denominated assets and liabilities, other than investments at valuation date exchange rates, are reflected in unrealized foreign exchange gains or losses.
(J) Securities Lending. In order to realize additional income, the Portfolio may engage in securities lending, subject to the limitations set forth in the 1940 Act and relevant guidance by the staff of the Securities and Exchange Commission (“SEC”). In the event the Portfolio does engage in securities lending, the Portfolio will lend through its custodian, State Street Bank and Trust Company (“State Street”), acting as securities lending agent on behalf of the Portfolio. State Street will manage the Portfolio’s collateral in accordance with the securities lending agency agreement between the Portfolio and State Street, and indemnify the Portfolio against counterparty risk. The loans will be collateralized by cash (which may be invested in a money market fund) and/ornon-cash collateral (which may include, U.S. Treasury securities and/or U.S. Government Agency securities issued or guaranteed by the United States government or its agencies or instrumentalities) at least equal at all times to the market value of the securities loaned. The Portfolio may bear the risk of delay in recovery of, or loss of rights in, the securities loaned should the borrower of the securities experience financial difficulty. The Portfolio may also record a realized gain or loss on securities deemed sold due to a borrower’s inability to return securities on loan. The Portfolio bears the risk of any loss on investment of cash collateral. The Portfolio will receive compensation for lending its securities in the form of fees or it will retain a portion of interest on the investment of any cash collateral. The Portfolio will also continue to receive interest and dividends on the securities loaned and any gain or loss in the market price of the securities loaned that may occur during the term of the loan will be for the account of the Portfolio. Income earned from securities lending activities, if any, is reflected in the Statement of Operations. As of June 30, 2019, the Portfolio did not have any portfolio securities on loan.
(K) Foreign Securities Risk. The Portfolio may invest in foreign securities, which carry certain risks that are in addition to the usual risks inherent in domestic securities. These risks include those resulting from currency fluctuations, future adverse political or economic developments and possible imposition of currency exchange blockages or other foreign
governmental laws or restrictions. These risks are likely to be greater in emerging markets than in developed markets. The ability of issuers of debt securities held by the Portfolio to meet their obligations may be affected by, among other things, economic or political developments in a specific country, industry or region.
(L) Indemnifications. Under the Fund’s organizational documents, its officers and trustees are indemnified against certain liabilities that may arise out of performance of their duties to the Fund. Additionally, in the normal course of business, the Portfolio enters into contracts with third-party service providers that contain a variety of representations and warranties and which may provide general indemnifications. The Portfolio’s maximum exposure under these arrangements is unknown, as this would involve future claims that may be made against the Portfolio that have not yet occurred. Based on experience, management is of the view that the risk of loss in connection with these potential indemnification obligations is remote. However, there can be no assurance that material liabilities related to such obligations will not arise in the future, which could adversely impact the Portfolio.
Note 3–Fees and Related Party Transactions
(A) Manager and Subadvisor. New York Life Investments, a registered investment adviser and an indirect,wholly-owned subsidiary of New York Life, serves as the Portfolio’s Manager, pursuant to an Amended and Restated Management Agreement (“Management Agreement”). The Manager provides offices, conducts clerical, recordkeeping and bookkeeping services, and keeps most of the financial and accounting records required to be maintained by the Portfolio. Except for the portion of salaries and expenses that are the responsibility of the Portfolio, the Manager pays the salaries and expenses of all personnel affiliated with the Portfolio and certain operational expenses of the Portfolio. The Portfolio reimburses New York Life Investments in an amount equal to a portion of the compensation of the Chief Compliance Officer attributable to the Portfolio. Mellon Investments Corporation (“Mellon” or the “Subadvisor”), a registered investment adviser, serves as Subadvisor to the Portfolio and is responsible for theday-to-day portfolio management of the Portfolio. Pursuant to the terms of a Subadvisory Agreement (“Subadvisory Agreement”) between New York Life Investments and Mellon, New York Life Investments pays for the services of the Subadvisor.
The Fund, on behalf of the Portfolio, pays New York Life Investments in its capacity as the Portfolio’s investment manager and administrator, pursuant to the Management Agreement, a monthly fee for the services performed and the facilities furnished at an annual rate of the Portfolio’s average daily net assets as follows: 0.79% up to $1 billion; and 0.78% in excess of $1 billion. During the six-month period ended June 30, 2019, the effective management fee rate was 0.79%.
During the six-month period ended June 30, 2019, New York Life Investments earned fees from the Portfolio in the amount of $1,011,334, and paid the Subadvisor in the amount of $485,251.
State Street providessub-administration andsub-accounting services to the Portfolio pursuant to an agreement with New York Life Investments. These services include calculating the daily NAV of the Portfolio, maintaining the general ledger andsub-ledger accounts for the calculation of the Portfolio’s NAV and assisting New York Life Investments in
Notes to Financial Statements(Unaudited) (continued)
conducting various aspects of the Portfolio’s administrative operations. For providing these services to the Portfolio, State Street is compensated by New York Life Investments.
Pursuant to an agreement between the Fund and New York Life Investments, New York Life Investments is responsible for providing or
procuring certain regulatory reporting services for the Portfolio. The Portfolio will reimburse New York Life Investments for the actual costs incurred by New York Life Investments in connection with providing or procuring these services for the Portfolio.
(B) Investments in Affiliates (in 000’s). During the six-month period ended June 30, 2019, purchases and sales transactions, income earned from investments and shares held of investment companies managed by New York Life Investments or its affiliates were as follows:
| | | | | | | | | | | | | | | | | | | | | | | | | | | | | | | | | | | | |
Affiliated Investment Company | | Value,
Beginning of
Period | | | Purchases
at Cost | | | Proceeds
from Sales | | | Net Realized
Gain/(Loss)
on Sales | | | Change in
Unrealized
Appreciation/
(Depreciation) | | | Value,
End of
Period | | | Dividend
Income | | | Other
Distributions | | | Shares
End of
Period | |
MainStay U.S. Government Liquidity Fund | | $ | 4,510 | | | $ | 59,184 | | | $ | (61,133 | ) | | $ | — | | | $ | — | | | $ | 2,561 | | | $ | 43 | | | $ | — | | | | 2,561 | |
Note 4–Federal Income Tax
As of June 30, 2019, the cost and unrealized appreciation (depreciation) of the Portfolio’s investment portfolio, including applicable derivative contracts and other financial instruments, as determined on a federal income tax basis, were as follows:
| | | | | | | | | | | | | | | | |
| | | Federal Tax
Cost | | | Gross
Unrealized
Appreciation | | | Gross
Unrealized
(Depreciation) | | | Net
Unrealized
Appreciation/
(Depreciation) | |
Investments in Securities | | $ | 243,812,368 | | | $ | 22,643,152 | | | $ | (8,011,155 | ) | | $ | 14,631,997 | |
As of December 31, 2018, for federal income tax purposes, capital loss carryforwards of $219,560,720, as shown in the table below, were available to the extent provided by the regulations to offset future realized gains of the Portfolio through the years indicated. Accordingly, no capital gains distributions are expected to be paid to shareholders until net gains have been realized in excess of such amounts.
| | | | |
Capital Loss
Available Through | | Short-Term
Capital Loss
Amounts (000’s) | | Long-Term
Capital Loss
Amounts (000’s) |
| | |
| Unlimited | | $17,883 | | $201,677 |
Note 5–Custodian
State Street is the custodian of cash and securities held by the Portfolio. Custodial fees are charged to the Portfolio based on the Portfolio’s net assets and/or the market value of securities held by the Portfolio and the number of certain transactions incurred by the Portfolio.
Note 6–Line of Credit
The Portfolio and certain other funds managed by New York Life Investments maintain a line of credit with a syndicate of banks in order to secure a source of funds for temporary purposes to meet unanticipated or excessive redemption requests.
Effective July 30, 2019, under the credit agreement (the “Credit Agreement”), the aggregate commitment amount is $600,000,000 with an additional uncommitted amount of $100,000,000. The commitment fee is an annual rate of 0.15% of the average commitment amount payable quarterly, regardless of usage, to State Street, who serves as
the agent to the syndicate. The commitment fee is allocated among the Portfolio and certain other funds managed by New York Life Investments based upon their respective net assets and other factors. Interest on any revolving credit loan is charged based upon the Federal Funds Rate or the one-month London Interbank Offered Rate (“LIBOR”), whichever is higher. The Credit Agreement expires on July 28, 2020, although the Portfolio, certain other funds managed by New York Life Investments and the syndicate of banks may renew the Credit Agreement for an additional year on the same or different terms. Prior to July 30, 2019, the aggregate commitment amount and the commitment fee were the same as those under the current Credit Agreement. During the six-month period ended June 30, 2019, there were no borrowings made or outstanding with respect to the Portfolio under the Credit Agreement.
Note 7–Interfund Lending Program
Pursuant to an exemptive order issued by the SEC, the Portfolio, along with certain other funds managed by New York Life Investments, may participate in an interfund lending program. The interfund lending program provides an alternative credit facility that permits the Portfolio and certain other funds managed by New York Life Investments to lend or borrow money for temporary purposes directly to or from one another subject to the conditions of the exemptive order. During the six-month period ended June 30, 2019, there were no interfund loans made or outstanding with respect to the Portfolio.
Note 8–Purchases and Sales of Securities (in 000’s)
During the six-month period ended June 30, 2019, purchases and sales of securities, other thanshort-term securities, were $132,823 and $137,546, respectively.
| | |
| 20 | | MainStay VP Mellon Natural Resources Portfolio |
Note 9–Capital Share Transactions
Transactions in capital shares for the six-month period ended June 30, 2019 and the year ended December 31, 2018, were as follows:
| | | | | | | | |
Initial Class | | Shares | | | Amount | |
| | |
Six-month period ended June 30, 2019: | | | | | | | | |
Shares sold | | | 2,249,797 | | | $ | 12,958,422 | |
Shares redeemed | | | (3,751,489 | ) | | | (22,118,417 | ) |
| | | | |
Net increase (decrease) | | | (1,501,692 | ) | | $ | (9,159,995 | ) |
| | | | |
Year ended December 31, 2018: | | | | | | | | |
Shares sold | | | 3,598,827 | | | $ | 24,434,729 | |
Shares redeemed | | | (9,232,382 | ) | | | (67,013,329 | ) |
| | | | |
Net increase (decrease) | | | (5,633,555 | ) | | $ | (42,578,600 | ) |
| | | | |
Note 10–Recent Accounting Pronouncement
To improve the effectiveness of fair value disclosure requirements, the Financial Accounting Standards Board recently issued Accounting Standard Update (ASU)2018-13, Fair Value Measurement Disclosure Framework—Changes to the Disclosure Requirements for Fair Value Measurement (ASU2018-13), which adds, removes, and modifies certain aspects relating to fair value disclosure. ASU2018-13 is effective for interim and annual reporting periods beginning after December 15, 2019; early adoption of the additions relating toASU 2018-13 is not required. Management has evaluated the implications of certain other provisions of the ASU and has determined to early adopt aspects related to the removal and modifications of certain fair value measurement disclosures under the ASU effective immediately. At this time, management is evaluating the implications of certain other provisions of the ASU related to new disclosure requirements and any impact on the financial statement disclosures has not yet been determined.
Note 11–Subsequent Events
In connection with the preparation of the financial statements of the Portfolio as of and for the six-month period ended June 30, 2019, events and transactions subsequent to June 30, 2019, through the date the financial statements were issued have been evaluated by the Portfolio’s management for possible adjustment and/or disclosure. No subsequent events requiring financial statement adjustment or disclosure have been identified.
Proxy Voting Policies and Procedures and Proxy Voting Record
A description of the policies and procedures that New York Life Investments uses to vote proxies related to the Portfolio’s securities is available without charge, upon request (i) by calling800-598-2019; (ii) by visiting New York Life Investments website at https://www.nylinvestments.com/mainstay/products-and-performance/mainstay-vp-funds-trust; or (iii) by visiting the SEC’s website at www.sec.gov.
The Portfolio is required to file with the SEC its proxy voting record for the12-month period ending June 30 on Form N-PX. The Portfolio’s most recent Form N-PX or proxy voting record is available free of charge upon request (i) by calling800-598-2019; (ii) by visiting New York Life Investments website at https://www.nylinvestments.com/mainstay/products-and-performance/mainstay-vp-funds-trust; or (iii) by visiting the SEC’s website atwww.sec.gov.
Shareholder Reports and Quarterly Portfolio Disclosure
The Portfolio is required to file its complete schedule of portfolio holdings with the SEC 60 days after each fiscal quarter onForm N-PORT. The Portfolio’s holdings report is available without charge upon request (i) by calling800-598-2019; (ii) by visiting New York Life Investments website at https://www.nylinvestments.com/mainstay/products-and-performance/mainstay-vp-funds-trust; or (iii) on the SEC’s website at www.sec.gov.
| | |
| 22 | | MainStay VP Mellon Natural Resources Portfolio |
MainStay VP Portfolios
MainStay VP offers a wide range of Portfolios. The full array of MainStay VP offerings is listed here, with information about the manager, subadvisors, legal counsel, and independent registered public accounting firm.
Equity Portfolios
MainStay VP Eagle Small Cap Growth Portfolio
MainStay VP Emerging Markets Equity Portfolio
MainStay VP Epoch U.S. Equity Yield Portfolio
MainStay VP Fidelity Institutional AM® Utilities Portfolio†
MainStay VP Large Cap Growth Portfolio
MainStay VP MacKay Common Stock Portfolio
MainStay VP MacKay Growth Portfolio
MainStay VP MacKay International Equity Portfolio
MainStay VP MacKay Mid Cap Core Portfolio
MainStay VP MacKay S&P 500 Index Portfolio
MainStay VP MacKay Small Cap Core Portfolio
MainStay VP Mellon Natural Resources Portfolio
MainStay VP T. Rowe Price Equity Income Portfolio
Mixed Asset Portfolios
MainStay VP Balanced Portfolio
MainStay VP Income Builder Portfolio
MainStay VP Janus Henderson Balanced Portfolio
MainStay VP MacKay Convertible Portfolio
Income Portfolios
MainStay VP Bond Portfolio
MainStay VP Floating Rate Portfolio
MainStay VP Indexed Bond Portfolio
MainStay VP MacKay Government Portfolio
MainStay VP MacKay High Yield Corporate Bond Portfolio
MainStay VP MacKay Unconstrained Bond Portfolio
MainStay VP PIMCO Real Return Portfolio
Money Market
MainStay VP U.S. Government Money Market Portfolio
Alternative
MainStay VP Cushing Renaissance Advantage Portfolio
MainStay VP IQ Hedge Multi-Strategy Portfolio
Asset Allocation Portfolios
MainStay VP Conservative Allocation Portfolio
MainStay VP Growth Allocation Portfolio
MainStay VP Moderate Allocation Portfolio
MainStay VP Moderate Growth Allocation Portfolio
Manager
New York Life Investment Management LLC
New York, New York
Subadvisors
Candriam Belgium*
Brussels, Belgium
Cushing Asset Management, LP
Dallas, Texas
Eagle Asset Management, Inc.
St Petersburg, Florida
Epoch Investment Partners, Inc.
New York, New York
FIAM LLC
Smithfield, Rhode Island
IndexIQ Advisors LLC*
New York, New York
Janus Capital Management LLC
Denver, Colorado
MacKay Shields LLC*
New York, New York
Mellon Investments Corporation
Boston, Massachusetts
NYL Investors LLC*
New York, New York
Pacific Investment Management Company LLC
Newport Beach, California
T. Rowe Price Associates, Inc.
Baltimore, Maryland
Winslow Capital Management, LLC
Minneapolis, Minnesota
Distributor
NYLIFE Distributors LLC*
Jersey City, New Jersey
Custodian
State Street Bank and Trust Company
Boston, Massachusetts
Independent Registered Public Accounting Firm
PricewaterhouseCoopers LLP
New York, New York
Legal Counsel
Dechert LLP
Washington, District of Columbia
Some Portfolios may not be available in all products.
| † | Fidelity Institutional AM is a registered trade mark of FMR LLC. Used with permission. |
| * | An affiliate of New York Life Investment Management LLC |
Not part of the Semiannual Report
2019 Semiannual Report
This report is for the general information of New York Life Variable Annuities and NYLIAC Variable Universal Life Insurance Products policyowners. It must be preceded or accompanied by the appropriate product(s) and funds prospectuses if it is given to anyone who is not an owner of a New York Life variable annuity policy or a NYLIAC Variable Universal Life Insurance Product. This report does not offer for sale or solicit orders to purchase securities.
The performance data quoted in this report represents past performance. Past performance is no guarantee of future results. Due to market volatility and other factors, current performance may be lower or higher than the figures shown. The most recent month-end performance summary for your variable annuity or variable life policy is available by calling 800-598-2019 and is updated periodically on www.newyorklife.com.
The New York Life Variable Annuities and NYLIAC Variable Universal Life Insurance Products are issued by New York Life Insurance and Annuity Corporation (a Delaware Corporation) and distributed by NYLIFE Distributors LLC (Member FINRA/SIPC).
New York Life Insurance Company
New York Life Insurance and Annuity Corporation (NYLIAC) (A Delaware Corporation)
51 Madison Avenue, Room 551
New York, NY 10010
www.newyorklife.com
Printed on recycled paper
nylinvestments.com
NYLIFE Distributors LLC, 30 Hudson Street, Jersey City, NJ 07302
New York Life Investment Management LLC is the investment manager to the MainStay VP Funds Trust
©2019 by NYLIFE Distributors LLC. All rights reserved.
You may obtain copies of the Prospectus and the Statement of Additional Information free of charge, upon request, by callingtoll-free 800-598-2019 or writing to New York Life Insurance and Annuity Corporation, 51 Madison Avenue, New York, NY 10010.
| | | | |
| | | |
| Not FDIC Insured | | No Bank Guarantee | | May Lose Value |
| | | | |
| 1781648 | | | | MSVPVEG10-08/19 (NYLIAC) NI533 |
MainStay VP Allocation Portfolios
Message from the President and Semiannual Report
Unaudited | June 30, 2019

MainStay VP Conservative Allocation Portfolio
MainStay VP Moderate Allocation Portfolio
MainStay VP Moderate Growth Allocation Portfolio
MainStay VP Growth Allocation Portfolio
Beginning on January 1, 2021, as permitted by regulations adopted by the Securities and Exchange Commission, paper copies of the MainStay VP Portfolio annual and semi-annual shareholder reports may no longer be sent by mail, unless you specifically request paper copies of the reports from the insurance company that offers your policy. Instead, the reports will be made available online, and you will be notified by mail each time a report is posted and provided with a website link to access the report. Instructions for requesting paper copies will be provided by your insurance company.
If you already elected to receive shareholder reports electronically, you will not be affected by this change and you need not take any action. At any time, you may elect to receive reports and other communications from the insurance company electronically by following the instructions provided by the insurance company.
You may elect to receive all future shareholder reports in paper form free of charge. You can inform the insurance company that you wish to receive paper copies of reports by following the instructions provided by the insurance company. Your election to receive reports in paper form will apply to all portfolio companies available under your contract.
| | | | | | | | |
| | | | | |
| Not FDIC/NCUA Insured | | Not a Deposit | | May Lose Value | | No Bank Guarantee | | Not Insured by Any Government Agency |

This page intentionally left blank
Message from the President
Most equity and fixed-income markets in the United States and around the world advanced in the face of conflicting political and macroeconomic forces during thesix-month period ended June 30, 2019.
The reporting period began on the heels of tumultuous December 2018, during which equities and equity-sensitive bonds spiked sharply lower on concerns regarding the pace of economic growth, a U.S. government shutdown and the potential impact of trade disputes between the United States and other nations, particularly China. Markets recovered quickly in early 2019 as trade tensions eased, the government reopened and the U.S. Federal Reserve Board (Fed) adopted a more patient tone regarding the future direction of interest rates. Markets moved broadly higher from January through April, supported by encouraging economic data and generally strong corporate earnings.
During the first four months of the reporting period, the improving economic environment encouraged investors to favor areas of the market viewed as offering greater return potential along with higher risks. Among U.S. stocks, cyclical, growth-oriented sectors tended to outperform more defensive, value-oriented sectors, whilelarge-cap stocks outperformed theirsmaller-cap counterparts. Within the S&P 500® Index, the information technology sector led the market’s advance, followed by communication services, consumer discretionary and consumer staples. Industrials, utilities, financials, materials, real estate and energy produced more modest gains. While some international equity markets outperformed or underperformed the U.S. market, on average international stocks mirrored the performance of their U.S. counterparts. Fixed-income securities gained ground as well, albeit along a more gradual trajectory. Among U.S. fixed-income instruments, corporate issues generally outperformed government bonds, with lower credit quality, higher yielding securities leading the sector’s advance. Long-term U.S. Treasury bond yields proved particularly weak, with
10-year yields dipping at times below3-month yields, reflecting investors’ continued concerns about domestic economic growth.
May 2019 saw a return of uncertainty and volatility. Trade discussions between the United States and China faltered, driving global equity prices lower. Government bond prices rose as investors sought safe havens. June brought yet anotherU-turn as equity prices climbed again after comments from the Fed raised hopes of an interest rate cut in response to weak economic data. Stock and bond prices rose, with U.S. equity markets ending the reporting period in record territory.
We are pleased to see renewed signs of strength in broad areas of the financial market. At the same time, we remained sharply focused on providing you, as a MainStay VP investor, with the experienced and disciplined fund management that we believe underpins an effective, long-term investment strategy. Whatever tomorrow’s investment environment brings, you can rely on our portfolio managers to pursue the objectives of their individual Portfolios as outlined in the prospectus with the energy and dedication you have come to expect.
The report that follows contains additional information on the market events, investment decisions and specific securities that shaped your VP Portfolio’s performance during the six months ended June 30, 2019. We encourage you to read the report carefully and use it to evaluate your Portfolio’s performance in light of your long-range financial plan.
Sincerely,

Kirk C. Lehneis
President
The opinions expressed are as of the date of this report and are subject to change. There is no guarantee that any forecast made will come to pass. This material does not constitute investment advice and is not intended as an endorsement of any specific investment. Past performance is no guarantee of future results.
Not part of the Semiannual Report
Table of Contents
Investors should refer to the Portfolio’s Summary Prospectus and/or Prospectus and consider the Portfolio’s investment objectives, strategies, risks, charges and expenses carefully before investing. The Summary Prospectus and/or Prospectus contain this and other information about the Portfolio. You may obtain copies of the Portfolio’s Summary Prospectus and/or the Prospectus and the Statement of Additional Information free of charge, upon request, by calling toll-free 800-598-2019, by writing to New York Life Insurance and Annuity Corporation, 51 Madison Avenue, Room 251, New York, New York 10010 or by sending an email to MainStayShareholdersServices@nylim.com. These documents are also available at nylinvestments.com/vpdocuments. Please read the Summary Prospectus and/or Prospectus carefully before investing. MainStay VP Funds Trust portfolios are separate account options which are purchased through a variable insurance or variable annuity contract.
MainStay VP Conservative Allocation Portfolio
Investment and Performance Comparison1(Unaudited)
Performance data quoted represents past performance. Past performance is no guarantee of future results. Because of market volatility and other factors, current performance may be lower or higher than the figures shown. Investment return and principal value will fluctuate, and as a result, when shares are redeemed, they may be worth more or less than their original cost. The performance table and graph do not reflect any deduction of sales charges, mortality and expense charges, contract charges, or administrative charges. Please refer to the Performance Summary appropriate for your policy. For performance information current to the most recent month-end, please call800-598-2019 or visit www.newyorklife.com.
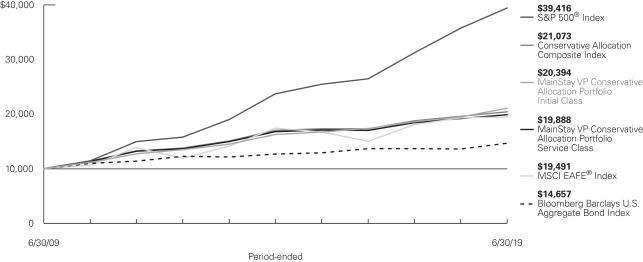
Average Annual Total Returns for the Period-Ended June 30, 2019
| | | | | | | | | | | | | | | | | | | | | | |
| Class | | Inception
Date | | Six Months | | | One Year | | | Five Years | | | Ten Years | | | Gross
Expense
Ratio2 | |
| | | | | | |
| Initial Class Shares | | 2/13/2006 | | | 10.03 | % | | | 4.12 | % | | | 3.71 | % | | | 7.39 | % | | | 0.68 | % |
| Service Class Shares | | 2/13/2006 | | | 9.90 | | | | 3.86 | | | | 3.46 | | | | 7.12 | | | | 0.93 | |
| | | | | | | | | | | | | | | | |
| Benchmark Performance | | Six Months | | | One
Year | | | Five
Years | | | Ten
Years | |
| | | | |
S&P 500® Index3 | | | 18.54 | % | | | 10.42 | % | | | 10.71 | % | | | 14.70 | % |
MSCI EAFE® Index4 | | | 14.03 | | | | 1.08 | | | | 2.25 | | | | 6.90 | |
Bloomberg Barclays U.S. Aggregate Bond Index5 | | | 6.11 | | | | 7.87 | | | | 2.95 | | | | 3.90 | |
Conservative Allocation Composite Index6 | | | 10.70 | | | | 8.36 | | | | 5.36 | | | | 7.74 | |
Morningstar Allocation—30% to 50% Equity Category Average7 | | | 9.82 | | | | 5.12 | | | | 3.61 | | | | 7.08 | |
| 1. | Performance figures may reflect certain fee waivers and/or expense limitations, without which total returns may have been different. For information on current fee waivers and/or expense limitations (if any), please refer to the Notes to Financial Statements. |
| 2. | The gross expense ratios presented reflect the Portfolio’s “Total Annual Portfolio Operating Expenses” from the most recent Prospectus, as supplemented, and may differ from other expense ratios disclosed in this report. |
| 3. | The S&P 500® Index is the Portfolio’s primary broad-based securities market index for comparison purposes. “S&P 500®” is a trademark of The McGraw-Hill Companies, Inc. The S&P 500® Index is widely regarded as the standard index for measuringlarge-cap U.S. stock market performance. Results assume reinvestment of all dividends and capital gains. An investment cannot be made directly in an index. |
| 4. | The MSCI EAFE® Index is the Portfolio’s secondary benchmark. The MSCI EAFE® Index consists of international stocks representing the developed world outside of North America. Results assume reinvestment of all dividends and capital gains. An investment cannot be made directly in an index. |
| 5. | The Portfolio has selected the Bloomberg Barclays U.S. Aggregate Bond Index as an additional benchmark. The Bloomberg Barclays U.S. Aggregate |
| | Bond Index is a broad-based benchmark that measures performance of the investment-grade, U.S. dollar-denominated, fixed-rate taxable bond market, including Treasurys, government-related and corporate securities, mortgage-backed securities (agency fixed-rate and hybrid adjustable-rate mortgage pass-throughs), asset-backed securities and commercial mortgage-backed securities. Results assume reinvestment of all dividends and capital gains. An investment cannot be made directly in an index. |
| 6. | The Portfolio has selected the Conservative Allocation Composite Index as an additional benchmark. The Conservative Allocation Composite Index consists of the S&P 500® Index, the MSCI EAFE® Index and the Bloomberg Barclays U.S. Aggregate Bond Index weighted 30%, 10% and 60%, respectively. Results assume reinvestment of all dividends and capital gains. An investment cannot be made directly in an index. |
| 7. | The Morningstar Allocation—30% to 50% Equity Category Average is representative of funds that seek to provide both income and capital appreciation by investing in multiple asset classes, including stocks, bonds, and cash. These funds are dominated by domestic holdings and have equity exposures between 30% and 50%. Results are based on average total returns of similar funds with all dividends and capital gain distributions reinvested. |
Cost in Dollars of a $1,000 Investment in MainStay VP Conservative Allocation Portfolio (Unaudited)
The example below is intended to describe the fees and expenses borne by shareholders during the six-month period from January 1, 2019, to June 30, 2019, and the impact of those costs on your investment.
Example
As a shareholder of the Portfolio you incur two types of costs: (1) transaction costs, including exchange fees and sales charges (loads) on purchases (as applicable), and (2) ongoing costs, including management fees, distribution and/or service (12b-1) fees, and other Portfolio expenses (as applicable). This example is intended to help you understand your ongoing costs (in dollars) of investing in the Portfolio and to compare these costs with the ongoing costs of investing in other mutual funds. The example is based on an investment of $1,000 made at the beginning of the six-month period and held for the entire period from January 1, 2019, to June 30, 2019. Shares are only sold in connection with variable life and annuity contracts and the example does not reflect any contract level or transactional fees or expenses. If these costs had been included, your costs would have been higher.
This example illustrates your Portfolio’s ongoing costs in two ways:
Actual Expenses
The second and third data columns in the table below provide information about actual account values and actual expenses. You may use the information in these columns, together with the amount you invested, to estimate the expenses that you paid during the six months ended June 30, 2019. Simply divide your account value by $1,000
(for example, an $8,600 account value divided by $1,000 = 8.6), then multiply the result by the number under the heading entitled “Expenses Paid During Period” to estimate the expenses you paid on your account during this period.
Hypothetical Example for Comparison Purposes
The fourth and fifth data columns in the table below provide information about hypothetical account values and hypothetical expenses based on the Portfolio’s actual expense ratio and an assumed rate of return of 5% per year before expenses, which is not the Portfolio’s actual return. The hypothetical account values and expenses may not be used to estimate the actual ending account balances or expenses you paid for thesix-month period shown. You may use this information to compare the ongoing costs of investing in the Portfolio with the ongoing costs of investing in other mutual funds. To do so, compare this 5% hypothetical example with the 5% hypothetical examples that appear in the shareholder reports of the other mutual funds.
Please note that the expenses shown in the table are meant to highlight your ongoing costs only and do not reflect any transactional costs, such as exchange fees or sales charges (loads). Therefore, the fourth and fifth data columns of the table are useful in comparing ongoing costs only and will not help you determine the relative total costs of owning different funds. In addition, if these transactional costs were included, your costs would have been higher.
| | | | | | | | | | | | | | | | | | | | | | |
| | | | | | | | | | | | | | | | | | |
| Share Class | | Beginning
Account
Value
1/1/19 | | | Ending Account
Value (Based
on Actual
Returns and
Expenses)
6/30/19 | | | Expenses
Paid
During
Period1 | | | Ending Account
Value (Based
on Hypothetical
5% Annualized
Return and
Actual Expenses)
6/30/19 | | | Expenses
Paid
During
Period1 | | | Net Expense
Ratio
During
Period2 |
| | | | | | |
| Initial Class Shares | | $ | 1,000.00 | | | $ | 1,100.30 | | | $ | 0.16 | | | $ | 1,024.65 | | | $ | 0.15 | | | 0.03% |
| | | | | | |
| Service Class Shares | | $ | 1,000.00 | | | $ | 1,099.00 | | | $ | 1.46 | | | $ | 1,023.41 | | | $ | 1.40 | | | 0.28% |
| 1. | Expenses are equal to the Portfolio’s annualized expense ratio of each class multiplied by the average account value over the period, divided by 365 and multiplied by 181 (to reflect the six-month period). The table above represents the actual expenses incurred during the six-month period. In addition to the fees and expenses which the Portfolio bears directly, it also indirectly bears a pro rata share of the fees and expenses of the Underlying Portfolios/Funds in which it invests. Such indirect expenses are not included in the above-reported expense figures. |
| 2. | Expenses are equal to the Portfolio’s annualized expense ratio to reflect the six-month period. |
| | |
| 6 | | MainStay VP Conservative Allocation Portfolio |
Investment Objectives of Underlying Portfolios/Funds as of June 30, 2019(Unaudited)
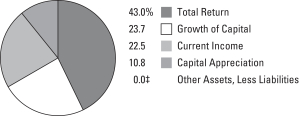
See Portfolio of Investments beginning on page 11 for specific holdings within these categories. The Portfolio’s holdings are subject to change.
| ‡ | Less than one-tenth of a percent. |
Portfolio Management Discussion and Analysis(Unaudited)
Answers to the questions reflect the views of portfolio managers Jae S. Yoon, CFA, Jonathan Swaney, Poul Kristensen, CFA, and Amit Soni, CFA, of New York Life Investments,1 the Portfolio’s Manager.
How did MainStay VP Conservative Allocation Portfolio perform relative to its benchmarks and peers during the six months ended June 30, 2019?
For the six months ended June 30, 2019, MainStay VP Conservative Allocation Portfolio returned 10.03% for Initial Class shares and 9.90% for Service Class shares. Over the same period, both share classes underperformed the 18.54% return of the S&P 500® Index, which is the Portfolio’s primary benchmark, and the 14.03% return of the MSCI EAFE® Index, which is a secondary benchmark of the Portfolio. For the six months ended June 30, 2019, both share classes outperformed the 6.11% return of the Bloomberg Barclays U.S. Aggregate Bond Indexand underperformed the 10.70% return of the Conservative Allocation Composite Index,which are additional benchmarks of the Portfolio. Over the same period, both share classes outperformed the 9.82% return of the Morningstar Allocation—30% to 50% Equity Category Average.2
What factors affected the Portfolio’s relative performance during the reporting period?
The Portfolio is a “fund of funds,” meaning that it seeks to achieve its investment objective by investing primarily in mutual funds and exchange-traded funds (“ETFs”) managed by New York Life Investments or its affiliates (the “Underlying Portfolios/Funds”). The Underlying Portfolios/Funds may invest in U.S. equities, international equities, and fixed-income instruments, making comparisons to any single index generally less suitable than a weighted combination of indices, which is a more useful yardstick by which to measure performance. The most influential factor affecting relative performance for the Portfolio versus the performance of a weighted combination of indices is the net performance of the Underlying Portfolios/Funds themselves relative to their respective benchmarks. This reporting period again proved to be challenging for the Underlying Portfolios/Funds, some of which detracted materially from active returns. Prominent examples of Underlying Portfolios/Funds that struggled to meet their objectives included the MainStay MacKay VP Small Cap Core Portfolio, the MainStay MacKay US Equity Opportunities Fund, the IQ Chaikin US Small Cap ETF and the IQ ARB Global Resources ETF.
Asset class policy provided a modest lift to relative performance through successful management of the Portfolio’s overall stock/ bond blend. The Portfolio increased its equity exposure based on perceived market weakness during the fourth quarter of 2018 and maintained the increased exposure well into 2019 as stock prices recovered, although positioning returned to nearly
neutral by mid spring and remained near that level through the end of the reporting period. Within equities, a preference for large company stocks over those of smaller firms was well rewarded. However, returns were undermined by the Portfolio’s tilt toward value-oriented over growth-oriented securities, a position reflecting our belief that value-oriented stocks would benefit disproportionately from policy stimulus, while growth would be restrained by new regulations. Equity performance also suffered from the Portfolio’s emphasis on emerging markets over developed international markets, which we implemented in the expectation that the developing world would benefit broadly from Chinese government economic intervention. Among the Portfolio’s fixed-income holdings, performance benefited from exposure to convertible bonds, but the Portfolio’s position in cash and short maturity municipal bonds failed to match the returns available on longer duration3 instruments.
How did you allocate the Portfolio’s assets during the reporting period and why?
The Portfolio’s management considers a variety of factors in allocating the assets, including the portfolio-level characteristics of the Underlying Portfolios/Funds (such as capitalization, style biases, sector exposures, credit quality and duration) and the attributes of the individual holdings within those funds (valuation metrics, earnings data and technical indicators). Generally, we seek to invest in funds that correspond well to our desired asset class exposures, which is to say that they occupy attractively valued segments of the market and appear positioned to benefit from the current economic environment.
In late 2018, just before the reporting period began, we took advantage of declining stock prices to increase the Portfolio’s exposure to equities in the belief that economic fundamentals remained sound despite concerns around trade negotiations, monetary policy and slowing external growth. Conditions were improving as we entered the reporting period. Stocks climbed steadily through the first four months of 2019, supported by increasing signs of progress in trade negotiations, signals from the U.S. Federal Reserve Board of a pause in interest-rate hikes and sweeping Chinese government actions across fiscal, monetary and regulatory fronts to bolster economic activity. As equity markets rose, we gradually trimmed the Portfolio’s equity exposure until, by late April 2019, it was again close to neutral. Markets dropped in May 2019 on renewed trade friction and mounting concerns within manufacturing areas of the industrial sector before rebounding in June 2019 on signs of potential
| 1. | “New York Life Investments” is a service mark used by New York Life Investment Management Holdings LLC and its subsidiary New York Life Investment Management LLC. |
| 2. | See page 5 for more information on benchmark and peer group returns. |
| 3. | Duration is a measure of the price sensitivity of a fixed-income investment to changes in interest rates. Duration is expressed as a number of years and is considered a more accurate sensitivity gauge than average maturity. |
| | |
| 8 | | MainStay VP Conservative Allocation Portfolio |
monetary policy support and possible progress in trade negotiations. The Portfolio’s positioning maintained relative stability throughout the reporting period.
We believed that, in light of aggressive government actions, Chinese economic reacceleration was likely to continue, and that the impact would be felt as a tailwind for most emerging markets. In response, we allocated a relatively large percentage of the Portfolio’s assets to stocks of developing nations over those of the developed world. However, the Chinese economy remained more sluggish than we anticipated during the reporting period. Second, the Portfolio allocated assets disproportionately across the capitalization spectrum and by industry. Whereas we had previously positioned the Portfolio to favor small companies over larger multinationals that we believed were less likely to benefit from tax reform and industry deregulation, we later reversed that position. As the reporting period progressed, we saw comparatively weak earnings trends within thesmall-cap universe, with a disconcerting number of firms producing negative earnings. We also anticipated thatsmall-cap companies might prove more vulnerable to rising interest rates than large companies that have locked in lower rates by issuing long maturity bonds. Third, in 2018 we introduced a value bias to the Portfolio, driven primarily by concerns regarding potential developments in litigation, regulation and competition in the information technology, energy and financials sectors. During the reporting period, that bias detracted from performance as growth companies continued to lead the market higher.
In the fixed-income portion of the Portfolio, we shifted overall credit exposure from being slightly underweight to being effectively neutral as spreads4 widened in late 2018, and valuations appeared more reasonable. Within speculative-grade credit, the Portfolio avoided floating-rate bonds due to concerns about excessive leverage and poor underwriting. At the same time, we kept the Portfolio’s duration slightly short in the expectation that the yield curve5 would steepen should events bear out our opinion that growth remained entrenched and the next recession was still some distance off. The Portfolio’s positioning on credit mildly enhanced returns, but those benefits were undercut by the negative effects of the Portfolio’s duration position.
How did the Portfolio’s allocations change over the course of the reporting period?
We lowered the Portfolio’s equity exposure during the reporting period in part by reducing its positions in the IQ Chaikin U.S. Large Cap ETF and the IQ 50 Percent Hedged FTSE International
ETF. The Portfolio kept some of the proceeds in cash rather than investing in fixed-income securities, given our duration strategy.
Within equities, we made the Portfolio’s value bias a little less pronounced by allocating more assets to the MainStay VP Large Cap Growth Portfolio and the MainStay VP MacKay Growth Equity Portfolio. We also lowered the Portfolio’s exposure to the MainStay Cushing Renaissance Advantage Fund and the MainStay Cushing MLP Premier Fund as energy assets failed to respond to rising crude oil prices to the degree we anticipated.
During the reporting period, the MainStay VP Epoch U.S. Small Cap Portfolio merged into the MainStay VP MacKay Small Cap Core Portfolio; the Portfolio maintained its position through the merger. In another merger, MainStay Epoch Global Choice Fund merged into the MainStay Epoch Capital Growth Fund. In that instance, the Portfolio exited its position prior to the merger date. A new Underlying Fund was added during the reporting period: the IQ International 500 ETF. The Portfolio’s exposure to this Underlying Fund remained quite small as of June 30, 2019 but was expected to grow.
In the fixed-income portion of the Portfolio, we reduced the position in the MainStay VP Indexed Bond Portfolio and redirected the proceeds to the MainStay VP Bond Portfolio and the MainStay Short Duration High Yield Fund, slightly increasing the Portfolio’s exposure to credit and shortening average maturity.
Which Underlying Equity Portfolios/Funds had the highest total returns during the reporting period, and which Underlying Equity Portfolios/Funds had the lowest total returns?
Of the Underlying Equity Portfolios/Funds held for the full reporting period, the highest total returns came from the MainStay VP Large Cap Growth Portfolio, the MainStay Epoch U.S. All Cap Fund, and the MainStay VP Eagle Small Cap Growth Portfolio. At the other end of the spectrum, the IQ Global Resources ETF, the IQ 500 International ETF, and the MainStay MacKay International Opportunities Fund produced the lowest total returns.
Which Underlying Equity Portfolios/Funds made the strongest positive contributions to the Portfolio’s overall performance, and which Underlying Equity Portfolios/Funds were the greatest detractors?
Among the Underlying Equity Portfolios/Funds making the most significant contributions to the Portfolio’s equity returns were
| 4. | The terms “spread” and “yield spread” may refer to the difference in yield between a security or type of security and comparable U.S. Treasury issues. The terms may also refer to the difference in yield between two specific securities or types of securities at a given time. |
| 5. | The yield curve is a line that plots the yields of various securities of similar quality—typically U.S. Treasury issues—across a range of maturities. The U.S. Treasury yield curve serves as a benchmark for other debt and is used in economic forecasting |
the MainStay VP Emerging Markets Equity Portfolio, the IQ Chaikin US Large Cap ETF and the MainStay VP T. Rowe Price Equity Income Portfolio. (Contributions take weightings and total returns into account.) Detractors from the Portfolio’s equity performance included the MainStay Epoch U.S. Equity Yield Fund, the MainStay VP International Equity Portfolio, and the IQ 500 International ETF, though all generated positive returns.
What factors and risks affected the Portfolio’s Underlying Fixed-Income Portfolio/Fund investments during the reporting period?
Within credit markets, spreads recovered from the stress of late 2018, compressing through late February 2019 and then holding generally steady through the end of the reporting period as softening economic conditions were balanced by rising expectations of policy support. Several factors affected investments in the high-grade market, including surprisingly soft inflation readings, a decline in unit labor costs, weak global manufacturing data and expectations of increasingly relaxed monetary policy from many of the world’s central banks. As a result, yields fell across the curve leading to an inversion in some segments.
During the reporting period, which fixed-income market segments were the strongest positive contributors to the Portfolio’s performance and which segments were particularly weak?
The equity sensitivity of convertible bonds made this segment the strongest positive contributor to the Portfolio’s performance.
Most other segments also fared well, with high-yielding and longer-duration bonds performing best. High-quality, short-maturity instruments trailed the pack, but still posted positive results.
Which Underlying Fixed-Income Portfolios/Funds made the strongest positive contributions to the Portfolio’s performance, and which Underlying Fixed-Income Portfolios/Funds were the greatest detractors?
During the reporting period, MainStay VP Indexed Bond Portfolio, the MainStay VP Floating Rate Portfolio and the MainStay VP Bond Portfolio made the strongest positive contributions to the performance of the fixed-income portion of the Portfolio. Over the same period, the Portfolio’s cash position, the MainStay Total Return Bond Fund and the MainStay MacKay Short Term Municipal Fund were the most significant detractors from the performance of the fixed-income portion of the Portfolio, though all provided positive returns.
The opinions expressed are those of the portfolio managers as of the date of this report and are subject to change. There is no guarantee that any forecasts will come to pass. This material does not constitute investment advice and is not intended as an endorsement of any specific investment.
Not all MainStay VP Portfolios and/or share classes are available under all policies.
| | |
| 10 | | MainStay VP Conservative Allocation Portfolio |
Portfolio of InvestmentsJune 30, 2019 (Unaudited)
| | | | | | | | |
| | |
| | | Shares | | | Value | |
| Affiliated Investment Companies 96.6%† | |
Equity Funds 39.2% | |
IQ 50 Percent Hedged FTSE International ETF (a) | | | 677,198 | | | $ | 13,787,751 | |
IQ Chaikin U.S. Large Cap ETF | | | 536,484 | | | | 13,192,142 | |
IQ Chaikin U.S. Small Cap ETF | | | 423,825 | | | | 10,536,289 | |
IQ Global Resources ETF | | | 233,695 | | | | 6,379,873 | |
MainStay Cushing MLP Premier Fund Class I | | | 4,980 | | | | 55,322 | |
MainStay Epoch Capital Growth Fund Class I (a)(b) | | | 607,395 | | | | 7,768,585 | |
MainStay Epoch International Choice Fund Class I | | | 403,091 | | | | 14,249,274 | |
MainStay Epoch U.S. All Cap Fund Class R6 | | | 513,821 | | | | 14,592,529 | |
MainStay Epoch U.S. Equity Yield Fund Class R6 | | | 47,817 | | | | 795,195 | |
MainStay MacKay International Opportunities Fund Class I | | | 1,096,958 | | | | 8,523,365 | |
MainStay MacKay U.S. Equity Opportunities Fund Class I | | | 1,448,105 | | | | 12,207,524 | |
MainStay MAP Equity Fund Class I | | | 497,546 | | | | 20,767,569 | |
MainStay VP Cushing Renaissance Advantage Portfolio Initial Class | | | 21,325 | | | | 184,677 | |
MainStay VP Eagle Small Cap Growth Portfolio Initial Class | | | 696,653 | | | | 10,159,805 | |
MainStay VP Emerging Markets Equity Portfolio Initial Class (a) | | | 2,837,515 | | | | 25,440,979 | |
MainStay VP Epoch U.S. Equity Yield Portfolio Initial Class | | | 989,186 | | | | 15,867,797 | |
MainStay VP Large Cap Growth Portfolio Initial Class | | | 614,988 | | | | 16,372,124 | |
MainStay VP MacKay Common Stock Portfolio Initial Class | | | 327,736 | | | | 9,523,089 | |
MainStay VP MacKay Growth Portfolio Initial Class | | | 488,593 | | | | 15,866,701 | |
MainStay VP MacKay International Equity Portfolio Initial Class | | | 163,905 | | | | 2,767,782 | |
MainStay VP MacKay Mid Cap Core Portfolio Initial Class (a) | | | 1,626,287 | | | | 22,422,162 | |
MainStay VP MacKay S&P 500 Index Portfolio Initial Class | | | 55,409 | | | | 3,157,435 | |
MainStay VP MacKay Small Cap Core Portfolio Initial Class (a) | | | 2,104,825 | | | | 23,110,166 | |
MainStay VP T. Rowe Price Equity Income Portfolio Initial Class (a) | | | 1,735,319 | | | | 22,873,357 | |
| | | | | | | | |
Total Equity Funds
(Cost $279,179,191) | | | | | | | 290,601,492 | |
| | | | | | | | |
|
Fixed Income Funds 57.4% | |
IQ Enhanced Core Plus Bond U.S. ETF (a) | | | 1,310,475 | | | | 25,547,710 | |
IQ S&P High Yield Low Volatility Bond ETF (a) | | | 352,522 | | | | 8,854,718 | |
| | | | | | | | |
| | |
| | | Shares | | | Value | |
Fixed Income Funds (continued) | |
MainStay MacKay High Yield Municipal Bond Fund Class I | | | 939,780 | | | $ | 12,104,362 | |
MainStay MacKay Short Duration High Yield Fund Class I | | | 3,452,524 | | | | 34,110,937 | |
MainStay MacKay Short Term Municipal Fund Class I | | | 1,238,173 | | | | 11,911,228 | |
MainStay MacKay Total Return Bond Fund Class R6 | | | 2 | | | | 17 | |
MainStay VP Bond Portfolio Initial Class (a) | | | 2,647,584 | | | | 38,704,581 | |
MainStay VP Floating Rate Portfolio Initial Class (a) | | | 4,928,922 | | | | 43,819,649 | |
MainStay VP Indexed Bond Portfolio Initial Class (a) | | | 20,161,557 | | | | 209,494,041 | |
MainStay VP MacKay Convertible Portfolio Initial Class | | | 564,498 | | | | 8,014,819 | |
MainStay VP MacKay High Yield Corporate Bond Portfolio Initial Class | | | 1,312,711 | | | | 13,309,771 | |
MainStay VP MacKay Unconstrained Bond Portfolio Initial Class (a) | | | 1,297,840 | | | | 12,774,140 | |
MainStay VP PIMCO Real Return Portfolio Initial Class (a) | | | 867,420 | | | | 7,572,781 | |
| | | | | | | | |
Total Fixed Income Funds
(Cost $412,201,544) | | | | | | | 426,218,754 | |
| | | | | | | | |
Total Affiliated Investment Companies
(Cost $691,380,735) | | | | | | | 716,820,246 | |
| | | | | | | | |
|
| Short-Term Investment 3.4% | |
Affiliated Investment Company 3.4% | |
MainStay U.S. Government Liquidity Fund, 2.03% (c) | | | 25,102,171 | | | | 25,102,171 | |
| | | | | | | | |
TotalShort-Term Investment
(Cost $25,102,171) | | | | | | | 25,102,171 | |
| | | | | | | | |
Total Investments
(Cost $716,482,906) | | | 100.0 | % | | | 741,922,417 | |
Other Assets, Less Liabilities | | | 0.0 | ‡ | | | 143,346 | |
Net Assets | | | 100.0 | % | | $ | 742,065,763 | |
| † | Percentages indicated are based on Portfolio net assets. |
| ‡ | Less than one-tenth of a percent. |
| (a) | As of June 30, 2019, the Portfolio’s ownership exceeds 5% of the outstanding shares of the Underlying Portfolio’s/Fund’s share class. |
| (b) | Non-income producing Underlying Portfolio/Fund. |
| (c) | Current yield as of June 30, 2019. |
The following abbreviations are used in the preceding pages:
ETF—Exchange-Traded Fund
FTSE—Financial Times Stock Exchange
MLP—Master limited partnership
| | | | | | |
The notes to the financial statements are an integral part of,
and should be read in conjunction with, the financial statements. | | | | | 11 | |
Portfolio of InvestmentsJune 30, 2019 (Unaudited) (continued)
The following is a summary of the fair valuations according to the inputs used as of June 30, 2019, for valuing the Portfolio’s assets:
| | | | | | | | | | | | | | | | |
Description | | Quoted
Prices in
Active
Markets for
Identical
Assets
(Level 1) | | | Significant
Other
Observable
Inputs
(Level 2) | | | Significant
Unobservable
Inputs
(Level 3) | | | Total | |
| | | | |
Asset Valuation Inputs | | | | | | | | | | | | | | | | |
| Investments (a) | | | | | | | | | | | | | | | | |
| Affiliated Investment Companies | | | | | | | | | | | | | | | | |
Equity Funds | | $ | 290,601,492 | | | $ | — | | | $ | — | | | $ | 290,601,492 | |
Fixed Income Funds | | | 426,218,754 | | | | — | | | | — | | | | 426,218,754 | |
Short-Term Investment | | | 25,102,171 | | | | — | | | | — | | | | 25,102,171 | |
| | | | | | | | | | | | | | | | |
| Total Investments in Securities | | $ | 741,922,417 | | | $ | — | | | $ | — | | | $ | 741,922,417 | |
| | | | | | | | | | | | | | | | |
| (a) | For a complete listing of investments, see the Portfolio of Investments. |
| | | | |
| 12 | | MainStay VP Conservative Allocation Portfolio | | The notes to the financial statements are an integral part of,
and should be read in conjunction with, the financial statements. |
Statement of Assets and Liabilitiesas of June 30, 2019 (Unaudited)
| | | | |
| Assets | | | | |
Investment in affiliated investment companies, at value (identified cost $716,482,906) | | $ | 741,922,417 | |
Cash | | | 371 | |
Receivables: | | | | |
Investment securities sold | | | 739,975 | |
Dividends and Interest | | | 506,721 | |
Portfolio shares sold | | | 43,919 | |
Other assets | | | 3,695 | |
| | | | |
Total assets | | | 743,217,098 | |
| | | | |
| |
| Liabilities | | | | |
Payables: | | | | |
Investment securities purchased | | | 504,224 | |
Portfolio shares redeemed | | | 431,278 | |
NYLIFE Distributors (See Note 3) | | | 148,380 | |
Shareholder communication | | | 32,032 | |
Professional fees | | | 22,668 | |
Custodian | | | 5,376 | |
Trustees | | | 1,013 | |
Accrued expenses | | | 6,364 | |
| | | | |
Total liabilities | | | 1,151,335 | |
| | | | |
Net assets | | $ | 742,065,763 | |
| | | | |
| |
| Composition of Net Assets | | | | |
Shares of beneficial interest outstanding (par value of $.001 per share) unlimited number of shares authorized | | $ | 63,349 | |
Additional paid-in capital | | | 708,636,407 | |
| | | | |
| | | 708,699,756 | |
Total distributable earnings (loss) | | | 33,366,007 | |
| | | | |
Net assets | | $ | 742,065,763 | |
| | | | |
| | | | |
Initial Class | | | | |
Net assets applicable to outstanding shares | | $ | 14,804,002 | |
| | | | |
Shares of beneficial interest outstanding | | | 1,249,082 | |
| | | | |
Net asset value per share outstanding | | $ | 11.85 | |
| | | | |
Service Class | | | | |
Net assets applicable to outstanding shares | | $ | 727,261,761 | |
| | | | |
Shares of beneficial interest outstanding | | | 62,099,694 | |
| | | | |
Net asset value per share outstanding | | $ | 11.71 | |
| | | | |
| | | | | | |
The notes to the financial statements are an integral part of,
and should be read in conjunction with, the financial statements. | | | | | 13 | |
Statement of Operationsfor the six months ended June 30, 2019 (Unaudited)
| | | | |
| Investment Income (Loss) | | | | |
Income | | | | |
Dividend distributions from affiliated investment companies | | $ | 3,858,892 | |
Interest | | | 469 | |
| | | | |
Total income | | | 3,859,361 | |
| | | | |
Expenses | | | | |
Distribution/Service—Service Class (See Note 3) | | | 908,808 | |
Professional fees | | | 37,152 | |
Shareholder communication | | | 32,018 | |
Trustees | | | 9,426 | |
Custodian | | | 6,808 | |
Miscellaneous | | | 11,286 | |
| | | | |
Total expenses | | | 1,005,498 | |
| | | | |
Net investment income (loss) | | | 2,853,863 | |
| | | | |
|
| Realized and Unrealized Gain (Loss) on Investments | |
Net realized gain (loss) on: | | | | |
Affiliated investment company transactions | | | (3,118,986 | ) |
Realized capital gain distributions from affiliated investment companies | | | 1,708,496 | |
| | | | |
Net realized gain (loss) on investments from affiliated and unaffiliated investment companies | | | (1,410,490 | ) |
| | | | |
Net change in unrealized appreciation (depreciation) on investments in affiliated investment companies | | | 68,948,332 | |
| | | | |
Net realized and unrealized gain (loss) on investments | | | 67,537,842 | |
| | | | |
Net increase (decrease) in net assets resulting from operations | | $ | 70,391,705 | |
| | | | |
| | | | |
| 14 | | MainStay VP Conservative Allocation Portfolio | | The notes to the financial statements are an integral part of,
and should be read in conjunction with, the financial statements. |
Statements of Changes in Net Assets
for the six months ended June 30, 2019 (Unaudited) and the year ended December 31, 2018
| | | | | | | | |
| | | 2019 | | | 2018 | |
| Increase (Decrease) in Net Assets | |
Operations: | | | | | | | | |
Net investment income (loss) | | $ | 2,853,863 | | | $ | 14,146,346 | |
Net realized gain (loss) on investments and investments from affiliated investment companies | | | (1,410,490 | ) | | | 21,482,892 | |
Net change in unrealized appreciation (depreciation) on investments in affiliated investment companies | | | 68,948,332 | | | | (89,340,441 | ) |
| | | | |
Net increase (decrease) in net assets resulting from operations | | | 70,391,705 | | | | (53,711,203 | ) |
| | | | |
Distributions to shareholders: | | | | | | | | |
Initial Class | | | — | | | | (386,602 | ) |
Service Class | | | — | | | | (16,968,097 | ) |
| | | | |
Total distributions to shareholders | | | — | | | | (17,354,699 | ) |
| | | | |
Capital share transactions: | | | | | | | | |
Net proceeds from sale of shares | | | 22,128,322 | | | | 71,202,231 | |
Net asset value of shares issued to shareholders in reinvestment of dividends and distributions | | | — | | | | 17,354,699 | |
Cost of shares redeemed | | | (79,790,691 | ) | | | (170,508,772 | ) |
| | | | |
Increase (decrease) in net assets derived from capital share transactions | | | (57,662,369 | ) | | | (81,951,842 | ) |
| | | | |
Net increase (decrease) in net assets | | | 12,729,336 | | | | (153,017,744 | ) |
|
| Net Assets | |
Beginning of period | | | 729,336,427 | | | | 882,354,171 | |
| | | | |
End of period | | $ | 742,065,763 | | | $ | 729,336,427 | |
| | | | |
| | | | | | |
The notes to the financial statements are an integral part of,
and should be read in conjunction with, the financial statements. | | | | | 15 | |
Financial Highlightsselected per share data and ratios
| | | | | | | | | | | | | | | | | | | | | | | | |
| | |
| | | Six months
ended
June 30, | | | Year ended December 31, | |
| | | | | | |
| Initial Class | | 2019* | | | 2018 | | | 2017 | | | 2016 | | | 2015 | | | 2014 | |
| | | | | | |
Net asset value at beginning of period | | $ | 10.77 | | | $ | 11.80 | | | $ | 10.87 | | | $ | 10.71 | | | $ | 11.85 | | | $ | 12.47 | |
| | | | | | | | | | | | | | | | | | | | | | | | |
| | | | | | |
Net investment income (loss) (a) | | | 0.06 | | | | 0.23 | | | | 0.22 | | | | 0.22 | | | | 0.24 | | | | 0.25 | |
| | | | | | |
Net realized and unrealized gain (loss) on investments | | | 1.02 | | | | (0.98 | ) | | | 0.95 | | | | 0.46 | | | | (0.41 | ) | | | 0.28 | |
| | | | | | | | | | | | | | | | | | | | | | | | |
| | | | | | |
Total from investment operations | | | 1.08 | | | | (0.75 | ) | | | 1.17 | | | | 0.68 | | | | (0.17 | ) | | | 0.53 | |
| | | | | | | | | | | | | | | | | | | | | | | | |
| | | | | | |
| Less dividends and distributions: | | | | | | | | | | | | | | | | | | | | | | | | |
| | | | | | |
From net investment income | | | — | | | | (0.28 | ) | | | (0.24 | ) | | | (0.29 | ) | | | (0.28 | ) | | | (0.32 | ) |
| | | | | | |
From net realized gain on investments | | | — | | | | — | | | | — | | | | (0.23 | ) | | | (0.69 | ) | | | (0.83 | ) |
| | | | | | | | | | | | | | | | | | | | | | | | |
| | | | | | |
Total dividends and distributions | | | — | | | | (0.28 | ) | | | (0.24 | ) | | | (0.52 | ) | | | (0.97 | ) | | | (1.15 | ) |
| | | | | | | | | | | | | | | | | | | | | | | | |
| | | | | | |
Net asset value at end of period | | $ | 11.85 | | | $ | 10.77 | | | $ | 11.80 | | | $ | 10.87 | | | $ | 10.71 | | | $ | 11.85 | |
| | | | | | | | | | | | | | | | | | | | | | | | |
| | | | | | |
Total investment return (b) | | | 10.03 | % | | | (6.47 | %) | | | 10.80 | % | | | 6.36 | % | | | (1.41 | %) | | | 4.29 | % |
| | | | | | |
| Ratios (to average net assets)/Supplemental Data: | | | | | | | | | | | | | | | | | | | | | | | | |
| | | | | | |
Net investment income (loss) | | | 1.02 | %†† | | | 2.02 | % | | | 1.89 | % | | | 2.02 | % | | | 2.01 | % | | | 1.99 | % |
| | | | | | |
Net expenses (c) | | | 0.03 | %†† | | | 0.03 | % | | | 0.02 | % | | | 0.03 | % | | | 0.03 | % | | | 0.03 | % |
| | | | | | |
Portfolio turnover rate | | | 16 | % | | | 58 | % | | | 44 | % | | | 44 | % | | | 40 | % | | | 47 | % |
| | | | | | |
Net assets at end of period (in 000’s) | | $ | 14,804 | | | $ | 14,616 | | | $ | 16,481 | | | $ | 16,599 | | | $ | 16,171 | | | $ | 15,669 | |
| (a) | Per share data based on average shares outstanding during the period. |
| (b) | Total return does not reflect any deduction of sales charges, mortality and expense charges, contract charges or administrative charges. For periods of less than one year, total return is not annualized. |
| (c) | In addition to the fees and expenses which the Portfolio bears directly, it also indirectly bears a pro-rata share of the fees and expenses of the underlying funds in which it invests. Such indirect expenses are not included in the above expense ratios. |
| | | | | | | | | | | | | | | | | | | | | | | | |
| | |
| | | Six months
ended
June 30, | | | Year ended December 31, | |
| | | | | | |
| Service Class | | 2019* | | | 2018 | | | 2017 | | | 2016 | | | 2015 | | | 2014 | |
| | | | | | |
Net asset value at beginning of period | | $ | 10.66 | | | $ | 11.67 | | | $ | 10.75 | | | $ | 10.60 | | | $ | 11.73 | | | $ | 12.37 | |
| | | | | | | | | | | | | | | | | | | | | | | | |
| | | | | | |
Net investment income (loss) (a) | | | 0.04 | | | | 0.20 | | | | 0.19 | | | | 0.19 | | | | 0.21 | | | | 0.22 | |
| | | | | | |
Net realized and unrealized gain (loss) on investments | | | 1.01 | | | | (0.96 | ) | | | 0.94 | | | | 0.45 | | | | (0.40 | ) | | | 0.26 | |
| | | | | | | | | | | | | | | | | | | | | | | | |
| | | | | | |
Total from investment operations | | | 1.05 | | | | (0.76 | ) | | | 1.13 | | | | 0.64 | | | | (0.19 | ) | | | 0.48 | |
| | | | | | | | | | | | | | | | | | | | | | | | |
| | | | | | |
| Less dividends and distributions: | | | | | | | | | | | | | | | | | | | | | | | | |
| | | | | | |
From net investment income | | | — | | | | (0.25 | ) | | | (0.21 | ) | | | (0.26 | ) | | | (0.25 | ) | | | (0.29 | ) |
| | | | | | |
From net realized gain on investments | | | — | | | | — | | | | — | | | | (0.23 | ) | | | (0.69 | ) | | | (0.83 | ) |
| | | | | | | | | | | | | | | | | | | | | | | | |
| | | | | | |
Total dividends and distributions | | | — | | | | (0.25 | ) | | | (0.21 | ) | | | (0.49 | ) | | | (0.94 | ) | | | (1.12 | ) |
| | | | | | | | | | | | | | | | | | | | | | | | |
| | | | | | |
Net asset value at end of period | | $ | 11.71 | | | $ | 10.66 | | | $ | 11.67 | | | $ | 10.75 | | | $ | 10.60 | | | $ | 11.73 | |
| | | | | | | | | | | | | | | | | | | | | | | | |
| | | | | | |
Total investment return (b) | | | 9.85 | %(c) | | | (6.68 | %) | | | 10.52 | % | | | 6.10 | % | | | (1.65 | %) | | | 4.03 | % |
| | | | | |
| Ratios (to average net assets)/Supplemental Data: | | | | | | | | | | | | | | | | | | | | | |
| | | | | | |
Net investment income (loss) | | | 0.76 | %†† | | | 1.70 | % | | | 1.66 | % | | | 1.74 | % | | | 1.84 | % | | | 1.78 | % |
| | | | | | |
Net expenses (d) | | | 0.28 | %†† | | | 0.28 | % | | | 0.27 | % | | | 0.28 | % | | | 0.28 | % | | | 0.28 | % |
| | | | | | |
Portfolio turnover rate | | | 16 | % | | | 58 | % | | | 44 | % | | | 44 | % | | | 40 | % | | | 47 | % |
| | | | | | |
Net assets at end of period (in 000’s) | | $ | 727,262 | | | $ | 714,720 | | | $ | 865,873 | | | $ | 850,124 | | | $ | 900,093 | | | $ | 896,381 | |
| (a) | Per share data based on average shares outstanding during the period. |
| (b) | Total return does not reflect any deduction of sales charges, mortality and expense charges, contract charges or administrative charges. For periods of less than one year, total return is not annualized. |
| (c) | Total investment return may reflect adjustments to conform to generally accepted accounting principles. |
| (d) | In addition to the fees and expenses which the Portfolio bears directly, it also indirectly bears a pro-rata share of the fees and expenses of the underlying funds in which it invests. Such indirect expenses are not included in the above expense ratios. |
| | | | |
| 16 | | MainStay VP Conservative Allocation Portfolio | | The notes to the financial statements are an integral part of,
and should be read in conjunction with, the financial statements. |
MainStay VP Moderate Allocation Portfolio
Investment and Performance Comparison1(Unaudited)
Performance data quoted represents past performance. Past performance is no guarantee of future results. Because of market volatility and other factors, current performance may be lower or higher than the figures shown. Investment return and principal value will fluctuate, and as a result, when shares are redeemed, they may be worth more or less than their original cost. The performance table and graph do not reflect any deduction of sales charges, mortality and expense charges, contract charges or administrative charges. Please refer to the Performance Summary appropriate for your policy. For performance information current to the most recent month-end, please call800-598-2019 or visit www.newyorklife.com.
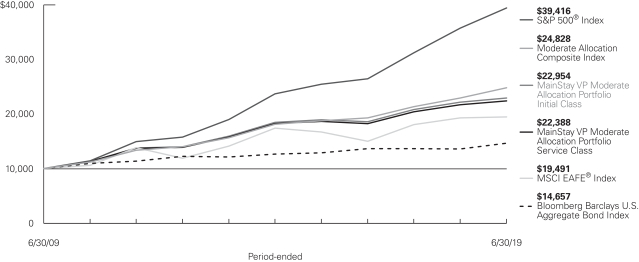
Average Annual Total Returns for the Period-Ended June 30, 2019
| | | | | | | | | | | | | | | | | | | | | | |
| Class | | Inception
Date | | Six Months | | | One Year | | | Five Years | | | Ten Years | | | Gross
Expense
Ratio2 | |
| | | | | | |
| Initial Class Shares | | 2/13/2006 | | | 12.01 | % | | | 3.50 | % | | | 4.41 | % | | | 8.66 | % | | | 0.78 | % |
| Service Class Shares | | 2/13/2006 | | | 11.87 | | | | 3.24 | | | | 4.15 | | | | 8.39 | | | | 1.03 | |
| | | | | | | | | | | | | | | | |
| Benchmark Performance | | Six
Months | | | One
Year | | | Five
Years | | | Ten
Years | |
| | | | |
S&P 500® Index3 | | | 18.54 | % | | | 10.42 | % | | | 10.71 | % | | | 14.70 | % |
MSCI EAFE® Index4 | | | 14.03 | | | | 1.08 | | | | 2.25 | | | | 6.90 | |
Bloomberg Barclays U.S. Aggregate Bond Index5 | | | 6.11 | | | | 7.87 | | | | 2.95 | | | | 3.90 | |
Moderate Allocation Composite Index6 | | | 12.96 | | | | 8.40 | | | | 6.49 | | | | 9.52 | |
Morningstar Allocation—50% to 70% Equity Category Average7 | | | 12.21 | | | | 5.73 | | | | 5.04 | | | | 8.93 | |
| 1. | Performance figures may reflect certain fee waivers and/or expense limitations, without which total returns may have been different. For information on current fee waivers and/or expense limitations (if any), please refer to the Notes to Financial Statements. |
| 2. | The gross expense ratios presented reflect the Portfolio’s “Total Annual Portfolio Operating Expenses” from the most recent Prospectus, as supplemented, and may differ from other expense ratios disclosed in this report. |
| 3. | The S&P 500® Index is the Portfolio’s primary broad-based securities market index for comparison purposes. “S&P 500®” is a trademark of The McGraw-Hill Companies, Inc. The S&P 500® Index is widely regarded as the standard index for measuringlarge-cap U.S. stock market performance. Results assume reinvestment of all dividends and capital gains. An investment cannot be made directly in an index. |
| 4. | The MSCI EAFE® Index is the Portfolio’s secondary benchmark. The MSCI EAFE® Index consists of international stocks representing the developed world outside of North America. Results assume reinvestment of all dividends and capital gains. An investment cannot be made directly in an index. |
| 5. | The Portfolio has selected the Bloomberg Barclays U.S. Aggregate Bond Index as an additional benchmark. The Bloomberg Barclays U.S. Aggregate |
| | Bond Index is a broad-based benchmark that measures performance of the investment-grade, U.S. dollar-denominated, fixed-rate taxable bond market, including Treasurys, government-related and corporate securities, mortgage-backed securities (agency fixed-rate and hybrid adjustable-rate mortgage pass-throughs), asset-backed securities and commercial mortgage-backed securities. Results assume reinvestment of all dividends and capital gains. An investment cannot be made directly in an index. |
| 6. | The Portfolio has selected the Moderate Allocation Composite Index as an additional benchmark. The Moderate Allocation Composite Index consists of the S&P 500® Index, the MSCI EAFE® Index and the Bloomberg Barclays U.S. Aggregate Bond Index weighted 45%, 15% and 40%, respectively. Results assume reinvestment of all dividends and capital gains. An investment cannot be made directly in an index. |
| 7. | The Morningstar Allocation—50% to 70% Equity Category Average is representative of funds that seek to provide both income and capital appreciation by investing in multiple asset classes, including stocks, bonds, and cash. These funds are dominated by domestic holdings and have equity exposures between 50% and 70%. Results are based on average total returns of similar funds with all dividends and capital gain distributions reinvested. |
Cost in Dollars of a $1,000 Investment in MainStay VP Moderate Allocation Portfolio (Unaudited)
The example below is intended to describe the fees and expenses borne by shareholders during the six-month period from January 1, 2019, to June 30, 2019, and the impact of those costs on your investment.
Example
As a shareholder of the Portfolio you incur two types of costs: (1) transaction costs, including exchange fees and sales charges (loads) on purchases (as applicable), and (2) ongoing costs, including management fees, distribution and/or service (12b-1) fees, and other Portfolio expenses (as applicable). This example is intended to help you understand your ongoing costs (in dollars) of investing in the Portfolio and to compare these costs with the ongoing costs of investing in other mutual funds. The example is based on an investment of $1,000 made at the beginning of the six-month period and held for the entire period from January 1, 2019, to June 30, 2019. Shares are only sold in connection with variable life and annuity contracts and the example does not reflect any contract level or transactional fees or expenses. If these costs had been included, your costs would have been higher.
This example illustrates your Portfolio’s ongoing costs in two ways:
Actual Expenses
The second and third data columns in the table below provide information about actual account values and actual expenses. You may use the information in these columns, together with the amount you invested, to estimate the expenses that you paid during the six months ended June 30, 2019. Simply divide your account value by $1,000
(for example, an $8,600 account value divided by $1,000 = 8.6), then multiply the result by the number under the heading entitled “Expenses Paid During Period” to estimate the expenses you paid on your account during this period.
Hypothetical Example for Comparison Purposes
The fourth and fifth data columns in the table below provide information about hypothetical account values and hypothetical expenses based on the Portfolio’s actual expense ratio and an assumed rate of return of 5% per year before expenses, which is not the Portfolio’s actual return. The hypothetical account values and expenses may not be used to estimate the actual ending account balances or expenses you paid for thesix-month period shown. You may use this information to compare the ongoing costs of investing in the Portfolio with the ongoing costs of investing in other mutual funds. To do so, compare this 5% hypothetical example with the 5% hypothetical examples that appear in the shareholder reports of the other mutual funds.
Please note that the expenses shown in the table are meant to highlight your ongoing costs only and do not reflect any transactional costs, such as exchange fees or sales charges (loads). Therefore, the fourth and fifth data columns of the table are useful in comparing ongoing costs only and will not help you determine the relative total costs of owning different funds. In addition, if these transactional costs were included, your costs would have been higher.
| | | | | | | | | | | | | | | | | | | | | | |
| | | | | | | | | | | | | | | | | | |
| Share Class | | Beginning
Account
Value
1/1/19 | | | Ending Account
Value (Based
on Actual
Returns and
Expenses)
6/30/19 | | | Expenses
Paid
During
Period1 | | | Ending Account
Value (Based
on Hypothetical
5% Annualized
Return and
Actual Expenses)
6/30/19 | | | Expenses
Paid
During
Period1 | | | Net Expense
Ratio
During
Period2 |
| | | | | | |
| Initial Class Shares | | $ | 1,000.00 | | | $ | 1,120.10 | | | $ | 0.11 | | | $ | 1,024.70 | | | $ | 0.10 | | | 0.02% |
| | | | | | |
| Service Class Shares | | $ | 1,000.00 | | | $ | 1,118.70 | | | $ | 1.42 | | | $ | 1,023.46 | | | $ | 1.35 | | | 0.27% |
| 1. | Expenses are equal to the Portfolio’s annualized expense ratio of each class multiplied by the average account value over the period, divided by 365 and multiplied by 181 (to reflect the six-month period). The table above represents the actual expenses incurred during the six-month period. In addition to the fees and expenses which the Portfolio bears directly, it also indirectly bears a pro rata share of the fees and expenses of the Underlying Portfolios/Funds in which it invests. Such indirect expenses are not included in the above-reported expense figures. |
| 2. | Expenses are equal to the Portfolio’s annualized expense ratio to reflect the six-month period. |
| | |
| 18 | | MainStay VP Moderate Allocation Portfolio |
Investment Objectives of Underlying Portfolios/Funds as of June 30, 2019(Unaudited)

See Portfolio of Investments beginning on page 23 for specific holdings within these categories. The Portfolio’s holdings are subject to change.
Portfolio Management Discussion and Analysis(Unaudited)
Answers to the questions reflect the views of portfolio managers Jae S. Yoon, CFA, Jonathan Swaney, Poul Kristensen, CFA, and Amit Soni, CFA, of New York Life Investments,1 the Portfolio’s Manager.
How did MainStay VP Moderate Allocation Portfolio perform relative to its benchmarks and peers during the six months ended June 30, 2019?
For the six months ended June 30, 2019, MainStay VP Moderate Allocation Portfolio returned 12.01% for Initial Class shares and 11.87% for Service Class shares. Over the same period, both share classes underperformed the 18.54% return of the S&P 500® Index, which is the Portfolio’s primary benchmark, and the 14.03% return of the MSCI EAFE® Index,which is a secondary benchmark of the Portfolio. For the six months ended June 30, 2019, both share classes outperformed the 6.11% return of the Bloomberg Barclays U.S. Aggregate Bond Indexand underperformed the 12.96% return of the Moderate Allocation Composite Index,which are additional benchmarks of the Portfolio. Over the same period, both share classes underperformed the 12.21% return of the Morningstar Allocation—50% to 70% Equity Category Average.2
What factors affected the Portfolio’s relative performance during the reporting period?
The Portfolio is a “fund of funds,” meaning that it seeks to achieve its investment objective by investing primarily in mutual funds and exchange-traded funds (“ETFs”) managed by New York Life Investments or its affiliates (the “Underlying Portfolios/Funds”). The Underlying Portfolios/Funds may invest in U.S. equities, international equities, and fixed-income instruments, making comparisons to any single index generally less suitable than a weighted combination of indices, which is a more useful yardstick by which to measure performance. The most influential factor affecting relative performance for the Portfolio versus the performance of a weighted combination of indices is the net performance of the Underlying Portfolios/Funds themselves relative to their respective benchmarks. This reporting period again proved to be challenging for the Underlying Portfolios/Funds, some of which detracted materially from active returns. Prominent examples of Underlying Portfolios/Funds that struggled to meet their objectives included the MainStay MacKay VP Small Cap Core Portfolio, the MainStay MacKay US Equity Opportunities Fund, the IQ Chaikin US Small Cap ETF and the IQ ARB Global Resources ETF.
Asset class policy provided a modest lift to relative performance through successful management of the Portfolio’s overall stock/ bond blend. The Portfolio increased its equity exposure based on perceived market weakness during the fourth quarter of 2018 and maintained the increased exposure well into 2019 as stock prices recovered, although positioning returned to nearly
neutral by mid spring and remained near that level through the end of the reporting period. Within equities, a preference for large company stocks over those of smaller firms was well rewarded. However, returns were undermined by the Portfolio’s tilt toward value-oriented over growth-oriented securities, a position reflecting our belief that value-oriented stocks would benefit disproportionately from policy stimulus, while growth would be restrained by new regulations. Equity performance also suffered from the Portfolio’s emphasis on emerging markets over developed international markets, which we implemented in the expectation that the developing world would benefit broadly from Chinese government economic intervention. Among the Portfolio’s fixed-income holdings, performance benefited from exposure to convertible bonds, but the Portfolio’s position in cash and short maturity municipal bonds failed to match the returns available on longer duration3 instruments.
How did you allocate the Portfolio’s assets during the reporting period and why?
The Portfolio’s management considers a variety of factors in allocating the assets, including the portfolio-level characteristics of the Underlying Portfolios/Funds (such as capitalization, style biases, sector exposures, credit quality and duration) and the attributes of the individual holdings within those funds (valuation metrics, earnings data and technical indicators). Generally, we seek to invest in funds that correspond well to our desired asset class exposures, which is to say that they occupy attractively valued segments of the market and appear positioned to benefit from the current economic environment.
In late 2018, just before the reporting period began, we took advantage of declining stock prices to increase the Portfolio’s exposure to equities in the belief that economic fundamentals remained sound despite concerns around trade negotiations, monetary policy and slowing external growth. Conditions were improving as we entered the reporting period. Stocks climbed steadily through the first four months of 2019, supported by increasing signs of progress in trade negotiations, signals from the U.S. Federal Reserve Board of a pause in interest-rate hikes and sweeping Chinese government actions across fiscal, monetary and regulatory fronts to bolster economic activity. As equity markets rose, we gradually trimmed the Portfolio’s equity exposure until, by the late April, it was again close to neutral. Markets dropped in May 2019 on renewed trade friction and mounting concerns within manufacturing areas of the industrial sector before rebounding in June 2019 on signs of potential
| 1. | “New York Life Investments” is a service mark used by New York Life Investment Management Holdings LLC and its subsidiary New York Life Investment Management LLC. |
| 2. | See page 17 for more information on benchmark and peer group returns. |
| 3. | Duration is a measure of the price sensitivity of a fixed-income investment to changes in interest rates. Duration is expressed as a number of years and is considered a more accurate sensitivity gauge than average maturity. |
| | |
| 20 | | MainStay VP Moderate Allocation Portfolio |
monetary policy support and possible progress in trade negotiations. The Portfolio’s positioning maintained relative stability throughout the reporting period.
We believed that, in light of aggressive government actions, Chinese economic reacceleration was likely to continue, and that the impact would be felt as a tailwind for most emerging markets. In response, we allocated a relatively large percentage of the Portfolio’s assets to stocks of developing nations over those of the developed world. However, the Chinese economy remained more sluggish than we anticipated during the reporting period. Second, the Portfolio allocated assets disproportionately across the capitalization spectrum and by industry. Whereas we had previously positioned the Portfolio to favor small companies over larger multinationals that we believed were less likely to benefit from tax reform and industry deregulation, we later reversed that position. As the reporting period progressed, we saw comparatively weak earnings trends within thesmall-cap universe, with a disconcerting number of firms producing negative earnings. We also anticipated thatsmall-cap companies might prove more vulnerable to rising interest rates than large companies that have locked in lower rates by issuing long maturity bonds. Third, in 2018 we introduced a value bias to the Portfolio, driven primarily by concerns regarding potential developments in litigation, regulation and competition in the information technology, energy and financials sectors. During the reporting period, that bias detracted from performance as growth companies continued to lead the market higher.
In the fixed-income portion of the Portfolio, we shifted overall credit exposure from being slightly underweight to being effectively neutral as spreads4 widened in late 2018, and valuations appeared more reasonable. Within speculative-grade credit, the Portfolio avoided floating-rate bonds due to concerns about excessive leverage and poor underwriting. At the same time, we kept the Portfolio’s duration slightly short in the expectation that the yield curve5 would steepen should events bear out our opinion that growth remained entrenched and the next recession was still some distance off. The Portfolio’s positioning on credit mildly enhanced returns, but those benefits were undercut by the negative effects of the Portfolio’s duration position.
How did the Portfolio’s allocations change over the course of the reporting period?
We lowered the Portfolio’s equity exposure during the reporting period in part by reducing its positions in the IQ Chaikin U.S. Large Cap ETF and the IQ 50 Percent Hedged FTSE International
ETF. The Portfolio kept some of the proceeds in cash rather than investing in fixed-income securities, given our duration strategy.
Within equities, we made the Portfolio’s value bias a little less pronounced by allocating more assets to the MainStay VP Large Cap Growth Portfolio and the MainStay VP MacKay Growth Equity Portfolio. We also lowered the Portfolio’s exposure to the MainStay Cushing Renaissance Advantage Fund and the MainStay Cushing MLP Premier Fund as energy assets failed to respond to rising crude oil prices to the degree we anticipated.
During the reporting period, the MainStay VP Epoch U.S. Small Cap Portfolio merged into the MainStay VP MacKay Small Cap Core Portfolio; the Portfolio maintained its position through the merger. In another merger, MainStay Epoch Global Choice Fund merged into the MainStay Epoch Capital Growth Fund. In that instance, the Portfolio exited its position prior to the merger date. A new Underlying Fund was also added during the reporting period: the IQ International 500 ETF. The Portfolio’s exposure to this Underlying Fund remained quite small as of June 30, 2019 but was expected to grow.
In the fixed-income portion of the Portfolio, we reduced the position in the MainStay VP Indexed Bond Portfolio and redirected the proceeds to the MainStay VP Bond Portfolio and the MainStay Short Duration High Yield Fund, thereby slightly increasing the Portfolio’s exposure to credit and shortening average maturity.
Which Underlying Equity Portfolios/Funds had the highest total returns during the reporting period, and which Underlying Equity Portfolios/Funds had the lowest total returns?
Of the Underlying Equity Portfolios/Funds held for the full reporting period, the highest total returns came from the MainStay VP Large Cap Growth Portfolio, the MainStay Epoch U.S. All Cap Fund, and the MainStay VP Eagle Small Cap Growth Portfolio. At the other end of the spectrum, the IQ Global Resources ETF, the IQ 500 International ETF, and the MainStay MacKay International Opportunities Fund produced the lowest total returns.
Which Underlying Equity Portfolios/Funds made the strongest positive contributions to the Portfolio’s overall performance, and which Underlying Equity Portfolios/Funds were the greatest detractors?
Among the Underlying Equity Portfolios/Funds making the most significant contributions to the Portfolio’s equity returns were the MainStay VP Large Cap Growth Portfolio, the MainStay VP T.
| 4. | The terms “spread” and “yield spread” may refer to the difference in yield between a security or type of security and comparable U.S. Treasury issues. The terms may also refer to the difference in yield between two specific securities or types of securities at a given time. |
| 5. | The yield curve is a line that plots the yields of various securities of similar quality—typically U.S. Treasury issues—across a range of maturities. The U.S. Treasury yield curve serves as a benchmark for other debt and is used in economic forecasting. |
Rowe Price Equity Income Portfolio, and the MainStay Epoch U.S. Call Cap Fund. (Contributions take weightings and total returns into account.) Detractors from the Portfolio’s equity performance included the MainStay Epoch U.S. Equity Yield Fund, the MainStay VP International Equity Portfolio, and the MainStay VP S&P 500 Fund, though all generated positive returns.
What factors and risks affected the Portfolio’s Underlying Fixed-Income Portfolio/Fund investments during the reporting period?
Within credit markets, spreads recovered from the stress of late 2018, compressing through late February 2019 and then holding generally steady through the end of the reporting period as softening economic conditions were balanced by rising expectations of policy support. Several factors affected investments in the high-grade market, including surprisingly soft inflation readings, a decline in unit labor costs, weak global manufacturing data and expectations of increasingly relaxed monetary policy from many of the world’s central banks. As a result, yields fell across the curve leading to an inversion in some segments.
During the reporting period, which fixed-income market segments were the strongest positive contributors to the Portfolio’s performance and which segments were particularly weak?
The equity sensitivity of convertible bonds made this segment the strongest positive contributor to the Portfolio’s performance.
Most other segments also fared well, with high-yielding and longer-duration bonds performing best. High-quality, short-maturity instruments trailed the pack, but still posted positive results.
Which Underlying Fixed-Income Portfolios/Funds made the strongest positive contributions to the Portfolio’s performance, and which Underlying Fixed-Income Portfolios/Funds were the greatest detractors?
During the reporting period, the MainStay VP Indexed Bond Portfolio, the MainStay VP Bond Portfolio and the MainStay VP Convertibles Portfolio made the strongest positive contributions to the performance of the fixed-income portion of the Portfolio. Over the same period, the Portfolio’s cash position, the MainStay Total Return Bond Fund and the MainStay MacKay Short Term Municipal Fund were the most significant detractors from the performance of the fixed-income portion of the Portfolio, though all provided positive returns.
The opinions expressed are those of the portfolio managers as of the date of this report and are subject to change. There is no guarantee that any forecasts will come to pass. This material does not constitute investment advice and is not intended as an endorsement of any specific investment.
Not all MainStay VP Portfolios and/or share classes are available under all policies.
| | |
| 22 | | MainStay VP Moderate Allocation Portfolio |
Portfolio of InvestmentsJune 30, 2019 (Unaudited)
| | | | | | | | |
| | |
| | | Shares | | | Value | |
| Affiliated Investment Companies 96.5%† | |
Equity Funds 59.2% | |
IQ 50 Percent Hedged FTSE International ETF (a) | | | 1,319,677 | | | $ | 26,868,624 | |
IQ 500 International ETF | | | 96,618 | | | | 2,591,797 | |
IQ Chaikin U.S. Large Cap ETF (a) | | | 1,533,944 | | | | 37,719,683 | |
IQ Chaikin U.S. Small Cap ETF (a) | | | 568,325 | | | | 14,128,559 | |
IQ Global Resources ETF (a) | | | 582,594 | | | | 15,904,816 | |
MainStay Cushing MLP Premier Fund Class I | | | 260,124 | | | | 2,889,981 | |
MainStay Epoch Capital Growth Fund Class I (a)(b) | | | 904,094 | | | | 11,563,364 | |
MainStay Epoch International Choice Fund Class I (a) | | | 1,167,890 | | | | 41,284,896 | |
MainStay Epoch U.S. All Cap Fund Class R6 (a) | | | 1,556,119 | | | | 44,193,789 | |
MainStay Epoch U.S. Equity Yield Fund Class R6 | | | 184,498 | | | | 3,068,201 | |
MainStay MacKay International Opportunities Fund Class I (a) | | | 3,591,346 | | | | 27,904,756 | |
MainStay MacKay U.S. Equity Opportunities Fund Class I (a) | | | 4,649,041 | | | | 39,191,418 | |
MainStay MAP Equity Fund Class I (a) | | | 1,288,143 | | | | 53,767,106 | |
MainStay VP Cushing Renaissance Advantage Portfolio Initial Class (a) | | | 1,089,956 | | | | 9,439,031 | |
MainStay VP Eagle Small Cap Growth Portfolio Initial Class (a) | | | 1,032,752 | | | | 15,061,379 | |
MainStay VP Emerging Markets Equity Portfolio Initial Class (a) | | | 6,248,276 | | | | 56,021,652 | |
MainStay VP Epoch U.S. Equity Yield Portfolio Initial Class (a) | | | 2,623,459 | | | | 42,083,606 | |
MainStay VP Large Cap Growth Portfolio Initial Class (a) | | | 1,752,279 | | | | 46,648,914 | |
MainStay VP MacKay Common Stock Portfolio Initial Class (a) | | | 993,093 | | | | 28,856,530 | |
MainStay VP MacKay Growth Portfolio Initial Class (a) | | | 1,423,662 | | | | 46,232,339 | |
MainStay VP MacKay International Equity Portfolio Initial Class | | | 297,370 | | | | 5,021,540 | |
MainStay VP MacKay Mid Cap Core Portfolio Initial Class (a) | | | 2,466,577 | | | | 34,007,507 | |
MainStay VP MacKay S&P 500 Index Portfolio Initial Class | | | 66,971 | | | | 3,816,303 | |
MainStay VP MacKay Small Cap Core Portfolio Initial Class (a) | | | 2,595,150 | | | | 28,493,752 | |
MainStay VP T. Rowe Price Equity Income Portfolio Initial Class (a) | | | 4,404,875 | | | | 58,060,974 | |
| | | | | | | | |
Total Equity Funds
(Cost $668,611,204) | | | | | | | 694,820,517 | |
| | | | | | | | |
| | | | | | | | |
| | |
| | | Shares | | | Value | |
Fixed Income Funds 37.3% | |
IQ Enhanced Core Bond U.S. ETF (a) | | | 2,206,899 | | | $ | 42,317,288 | |
IQ Enhanced Core Plus Bond U.S. ETF | | | 325,555 | | | | 6,346,695 | |
IQ S&P High Yield Low Volatility Bond ETF (a) | | | 177,040 | | | | 4,446,926 | |
MainStay MacKay High Yield Municipal Bond Fund Class I | | | 1,454,776 | | | | 18,737,518 | |
MainStay MacKay Short Duration High Yield Fund Class I (a) | | | 5,411,995 | | | | 53,470,506 | |
MainStay MacKay Short Term Municipal Fund Class I (a) | | | 2,149,187 | | | | 20,675,176 | |
MainStay MacKay Total Return Bond Fund Class R6 | | | 112,594 | | | | 1,205,877 | |
MainStay VP Bond Portfolio Initial Class (a) | | | 5,495,022 | | | | 80,330,809 | |
MainStay VP Floating Rate Portfolio Initial Class (a) | | | 4,448,285 | | | | 39,546,629 | |
MainStay VP Indexed Bond Portfolio Initial Class (a) | | | 11,055,500 | | | | 114,875,120 | |
MainStay VP MacKay Convertible Portfolio Initial Class (a) | | | 1,090,437 | | | | 15,482,165 | |
MainStay VP MacKay High Yield Corporate Bond Portfolio Initial Class | | | 590,421 | | | | 5,986,362 | |
MainStay VP MacKay Unconstrained Bond Portfolio Initial Class (a) | | | 2,555,317 | | | | 25,150,999 | |
MainStay VP PIMCO Real Return Portfolio Initial Class (a) | | | 1,159,322 | | | | 10,121,160 | |
| | | | | | | | |
Total Fixed Income Funds
(Cost $427,963,672) | | | | | | | 438,693,230 | |
| | | | | | | | |
Total Affiliated Investment Companies
(Cost $1,096,574,876) | | | | | | | 1,133,513,747 | |
| | | | | | | | |
|
| Short-Term Investment 3.4% | |
Affiliated Investment Company 3.4% | |
MainStay U.S. Government Liquidity Fund, 2.03% (c) | | | 39,811,485 | | | | 39,811,485 | |
| | | | | | | | |
TotalShort-Term Investment
(Cost $39,811,485) | | | | | | | 39,811,485 | |
| | | | | | | | |
Total Investments
(Cost $1,136,386,361) | | | 99.9 | % | | | 1,173,325,232 | |
Other Assets, Less Liabilities | | | 0.1 | | | | 965,844 | |
Net Assets | | | 100.0 | % | | $ | 1,174,291,076 | |
| † | Percentages indicated are based on Portfolio net assets. |
| (a) | As of June 30, 2019, the Portfolio’s ownership exceeds 5% of the outstanding shares of the Underlying Portfolio’s/Fund’s share class. |
| (b) | Non-income producing Underlying Portfolio/Fund. |
| (c) | Current yield as of June 30, 2019. |
The following abbreviations are used in the preceding pages:
ETF—Exchange-Traded Fund
FTSE—Financial Times Stock Exchange
MLP—Master limited partnership
| | | | | | |
The notes to the financial statements are an integral part of,
and should be read in conjunction with, the financial statements. | | | | | 23 | |
Portfolio of InvestmentsJune 30, 2019 (Unaudited) (continued)
The following is a summary of the fair valuations according to the inputs used as of June 30, 2019, for valuing the Portfolio’s assets:
| | | | | | | | | | | | | | | | |
Description | | Quoted
Prices in
Active
Markets for
Identical
Assets
(Level 1) | | | Significant
Other
Observable
Inputs
(Level 2) | | | Significant
Unobservable
Inputs
(Level 3) | | | Total | |
| | | | |
Asset Valuation Inputs | | | | | | | | | | | | | | | | |
| Investments (a) | | | | | | | | | | | | | | | | |
| Affiliated Investment Companies | | | | | | | | | | | | | | | | |
Equity Funds | | $ | 694,820,517 | | | $ | — | | | $ | — | | | $ | 694,820,517 | |
Fixed Income Funds | | | 438,693,230 | | | | — | | | | — | | | | 438,693,230 | |
Short-Term Investment | | | 39,811,485 | | | | — | | | | — | | | | 39,811,485 | |
| | | | | | | | | | | | | | | | |
| Total Investments in Securities | | $ | 1,173,325,232 | | | $ | — | | | $ | — | | | $ | 1,173,325,232 | |
| | | | | | | | | | | | | | | | |
| (a) | For a complete listing of investments, see the Portfolio of Investments. |
| | | | |
| 24 | | MainStay VP Moderate Allocation Portfolio | | The notes to the financial statements are an integral part of,
and should be read in conjunction with, the financial statements. |
Statement of Assets and Liabilitiesas of June 30, 2019 (Unaudited)
| | | | |
| Assets | |
Investment in affiliated investment companies, at value (identified cost $1,136,386,361) | | $ | 1,173,325,232 | |
Cash | | | 19,379 | |
Receivables: | | | | |
Investment securities sold | | | 1,335,980 | |
Dividends and Interest | | | 756,471 | |
Portfolio shares sold | | | 243,042 | |
Other assets | | | 5,812 | |
| | | | |
Total assets | | | 1,175,685,916 | |
| | | | |
|
| Liabilities | |
Payables: | | | | |
Investment securities purchased | | | 754,011 | |
Portfolio shares redeemed | | | 317,162 | |
NYLIFE Distributors (See Note 3) | | | 230,607 | |
Shareholder communication | | | 49,763 | |
Professional fees | | | 27,731 | |
Custodian | | | 4,653 | |
Trustees | | | 1,580 | |
Accrued expenses | | | 9,333 | |
| | | | |
Total liabilities | | | 1,394,840 | |
| | | | |
Net assets | | $ | 1,174,291,076 | |
| | | | |
|
| Composition of Net Assets | |
Shares of beneficial interest outstanding (par value of $.001 per share) unlimited number of shares authorized | | $ | 102,528 | |
Additional paid-in capital | | | 1,111,417,733 | |
| | | | |
| | | 1,111,520,261 | |
Total distributable earnings (loss) | | | 62,770,815 | |
| | | | |
Net assets | | $ | 1,174,291,076 | |
| | | | |
| | | | |
Initial Class | | | | |
Net assets applicable to outstanding shares | | $ | 43,984,466 | |
| | | | |
Shares of beneficial interest outstanding | | | 3,802,886 | |
| | | | |
Net asset value per share outstanding | | $ | 11.57 | |
| | | | |
Service Class | | | | |
Net assets applicable to outstanding shares | | $ | 1,130,306,610 | |
| | | | |
Shares of beneficial interest outstanding | | | 98,725,550 | |
| | | | |
Net asset value per share outstanding | | $ | 11.45 | |
| | | | |
| | | | | | |
The notes to the financial statements are an integral part of,
and should be read in conjunction with, the financial statements. | | | | | 25 | |
Statement of Operationsfor the six months ended June 30, 2019 (Unaudited)
| | | | |
| Investment Income (Loss) | |
Income | |
Dividend distributions from affiliated investment companies | | $ | 5,805,434 | |
Interest | | | 891 | |
| | | | |
Total income | | | 5,806,325 | |
| | | | |
Expenses | | | | |
Distribution/Service—Service Class (See Note 3) | | | 1,419,462 | |
Shareholder communication | | | 50,414 | |
Professional fees | | | 50,135 | |
Trustees | | | 15,004 | |
Custodian | | | 5,907 | |
Miscellaneous | | | 16,947 | |
| | | | |
Total expenses | | | 1,557,869 | |
| | | | |
Net investment income (loss) | | | 4,248,456 | |
| | | | |
|
| Realized and Unrealized Gain (Loss) on Investments | |
Net realized gain (loss) on: | | | | |
Affiliated investment company transactions | | | (11,119,139 | ) |
Realized capital gain distributions from affiliated investment companies | | | 2,985,420 | |
| | | | |
Net realized gain (loss) on investments from affiliated and unaffiliated investment companies | | | (8,133,719 | ) |
| | | | |
Net change in unrealized appreciation (depreciation) on investments in affiliated investment companies | | | 136,566,759 | |
| | | | |
Net realized and unrealized gain (loss) on investments | | | 128,433,040 | |
| | | | |
Net increase (decrease) in net assets resulting from operations | | $ | 132,681,496 | |
| | | | |
| | | | |
| 26 | | MainStay VP Moderate Allocation Portfolio | | The notes to the financial statements are an integral part of,
and should be read in conjunction with, the financial statements. |
Statements of Changes in Net Assets
for the six months ended June 30, 2019 (Unaudited) and the year ended December 31, 2018
| | | | | | | | |
| | | 2019 | | | 2018 | |
| Increase (Decrease) in Net Assets | |
Operations: | | | | | | | | |
Net investment income (loss) | | $ | 4,248,456 | | | $ | 22,527,564 | |
Net realized gain (loss) on investments and investments from affiliated investment companies | | | (8,133,719 | ) | | | 53,481,816 | |
Net change in unrealized appreciation (depreciation) on investments in affiliated investment companies | | | 136,566,759 | | | | (185,630,627 | ) |
| | | | |
Net increase (decrease) in net assets resulting from operations | | | 132,681,496 | | | | (109,621,247 | ) |
| | | | |
Distributions to shareholders: | | | | | | | | |
Initial Class | | | — | | | | (2,565,757 | ) |
Service Class | | | — | | | | (62,823,221 | ) |
| | | | |
Total distributions to shareholders | | | — | | | | (65,388,978 | ) |
| | | | |
Capital share transactions: | | | | | | | | |
Net proceeds from sale of shares | | | 19,648,732 | | | | 106,545,338 | |
Net asset value of shares issued to shareholders in reinvestment of dividends and distributions | | | — | | | | 65,388,978 | |
Cost of shares redeemed | | | (124,435,754 | ) | | | (188,840,859 | ) |
| | | | |
Increase (decrease) in net assets derived from capital share transactions | | | (104,787,022 | ) | | | (16,906,543 | ) |
| | | | |
Net increase (decrease) in net assets | | | 27,894,474 | | | | (191,916,768 | ) |
| | |
| Net Assets | | | | | | | | |
Beginning of period | | | 1,146,396,602 | | | | 1,338,313,370 | |
| | | | |
End of period | | $ | 1,174,291,076 | | | $ | 1,146,396,602 | |
| | | | |
| | | | | | |
The notes to the financial statements are an integral part of,
and should be read in conjunction with, the financial statements. | | | | | 27 | |
Financial Highlightsselected per share data and ratios
| | | | | | | | | | | | | | | | | | | | | | | | |
| | |
| | | Six months
ended
June 30, | | | Year ended December 31, | |
| | | | | | |
| Initial Class | | 2019* | | | 2018 | | | 2017 | | | 2016 | | | 2015 | | | 2014 | |
| | | | | | |
Net asset value at beginning of period | | $ | 10.33 | | | $ | 11.89 | | | $ | 10.57 | | | $ | 10.59 | | | $ | 12.03 | | | $ | 12.61 | |
| | | | | | | | | | | | | | | | | | | | | | | | |
| | | | | | |
Net investment income (loss) (a) | | | 0.05 | | | | 0.23 | | | | 0.20 | | | | 0.19 | | | | 0.20 | | | | 0.23 | |
| | | | | | |
Net realized and unrealized gain (loss) on investments | | | 1.19 | | | | (1.16 | ) | | | 1.36 | | | | 0.48 | | | | (0.39 | ) | | | 0.33 | |
| | | | | | | | | | | | | | | | | | | | | | | | |
| | | | | | |
Total from investment operations | | | 1.24 | | | | (0.93 | ) | | | 1.56 | | | | 0.67 | | | | (0.19 | ) | | | 0.56 | |
| | | | | | | | | | | | | | | | | | | | | | | | |
| | | | | | |
| Less dividends and distributions: | | | | | | | | | | | | | | | | | | | | | | | | |
| | | | | | |
From net investment income | | | — | | | | (0.27 | ) | | | (0.19 | ) | | | (0.24 | ) | | | (0.30 | ) | | | (0.29 | ) |
| | | | | | |
From net realized gain on investments | | | — | | | | (0.36 | ) | | | (0.05 | ) | | | (0.45 | ) | | | (0.95 | ) | | | (0.85 | ) |
| | | | | | | | | | | | | | | | | | | | | | | | |
| | | | | | |
Total dividends and distributions | | | — | | | | (0.63 | ) | | | (0.24 | ) | | | (0.69 | ) | | | (1.25 | ) | | | (1.14 | ) |
| | | | | | | | | | | | | | | | | | | | | | | | |
| | | | | | |
Net asset value at end of period | | $ | 11.57 | | | $ | 10.33 | | | $ | 11.89 | | | $ | 10.57 | | | $ | 10.59 | | | $ | 12.03 | |
| | | | | | | | | | | | | | | | | | | | | | | | |
| | | | | | |
Total investment return (b) | | | 12.00 | %(c) | | | (8.40 | %) | | | 14.97 | % | | | 6.41 | % | | | (1.61 | %) | | | 4.62 | % |
| | | | | | |
| Ratios (to average net assets)/Supplemental Data: | | | | | | | | | | | | | | | | | | | | | | | | |
| | | | | | |
Net investment income (loss) | | | 0.96 | %†† | | | 1.99 | % | | | 1.79 | % | | | 1.76 | % | | | 1.69 | % | | | 1.80 | % |
| | | | | | |
Net expenses (d) | | | 0.02 | %†† | | | 0.02 | % | | | 0.02 | % | | | 0.03 | % | | | 0.02 | % | | | 0.03 | % |
| | | | | | |
Portfolio turnover rate | | | 15 | % | | | 52 | % | | | 33 | % | | | 40 | % | | | 36 | % | | | 46 | % |
| | | | | | |
Net assets at end of period (in 000’s) | | $ | 43,984 | | | $ | 43,161 | | | $ | 49,419 | | | $ | 43,873 | | | $ | 41,551 | | | $ | 41,706 | |
| (a) | Per share data based on average shares outstanding during the period. |
| (b) | Total return does not reflect any deduction of sales charges, mortality and expense charges, contract charges or administrative charges. For periods of less than one year, total return is not annualized. |
| (c) | Total investment return may reflect adjustments to conform to generally accepted accounting principles. |
| (d) | In addition to the fees and expenses which the Portfolio bears directly, it also indirectly bears a pro-rata share of the fees and expenses of the underlying funds in which it invests. Such indirect expenses are not included in the above expense ratios. |
| | | | | | | | | | | | | | | | | | | | | | | | |
| | |
| | | Six months
ended
June 30, | | | Year ended December 31, | |
| | | | | | |
| Service Class | | 2019* | | | 2018 | | | 2017 | | | 2016 | | | 2015 | | | 2014 | |
| | | | | | |
Net asset value at beginning of period | | $ | 10.23 | | | $ | 11.79 | | | $ | 10.48 | | | $ | 10.51 | | | $ | 11.95 | | | $ | 12.53 | |
| | | | | | | | | | | | | | | | | | | | | | | | |
| | | | | | |
Net investment income (loss) (a) | | | 0.04 | | | | 0.20 | | | | 0.17 | | | | 0.16 | | | | 0.17 | | | | 0.19 | |
| | | | | | |
Net realized and unrealized gain (loss) on investments | | | 1.18 | | | | (1.16 | ) | | | 1.36 | | | | 0.47 | | | | (0.39 | ) | | | 0.34 | |
| | | | | | | | | | | | | | | | | | | | | | | | |
| | | | | | |
Total from investment operations | | | 1.22 | | | | (0.96 | ) | | | 1.53 | | | | 0.63 | | | | (0.22 | ) | | | 0.53 | |
| | | | | | | | | | | | | | | | | | | | | | | | |
| | | | | | |
| Less dividends and distributions: | | | | | | | | | | | | | | | | | | | | | | | | |
| | | | | | |
From net investment income | | | — | | | | (0.24 | ) | | | (0.17 | ) | | | (0.21 | ) | | | (0.27 | ) | | | (0.26 | ) |
| | | | | | |
From net realized gain on investments | | | — | | | | (0.36 | ) | | | (0.05 | ) | | | (0.45 | ) | | | (0.95 | ) | | | (0.85 | ) |
| | | | | | | | | | | | | | | | | | | | | | | | |
| | | | | | |
Total dividends and distributions | | | — | | | | (0.60 | ) | | | (0.22 | ) | | | (0.66 | ) | | | (1.22 | ) | | | (1.11 | ) |
| | | | | | | | | | | | | | | | | | | | | | | | |
| | | | | | |
Net asset value at end of period | | $ | 11.45 | | | $ | 10.23 | | | $ | 11.79 | | | $ | 10.48 | | | $ | 10.51 | | | $ | 11.95 | |
| | | | | | | | | | | | | | | | | | | | | | | | |
| | | | | | |
Total investment return (b) | | | 11.93 | %(c) | | | (8.63 | %) | | | 14.68 | % | | | 6.14 | % | | | (1.86 | %) | | | 4.35 | % |
| | | | | | |
| Ratios (to average net assets)/Supplemental Data: | | | | | | | | | | | | | | | | | | | | | | | | |
| | | | | | |
Net investment income (loss) | | | 0.71 | %†† | | | 1.73 | % | | | 1.53 | % | | | 1.52 | % | | | 1.44 | % | | | 1.51 | % |
| | | | | | |
Net expenses (d) | | | 0.27 | %†† | | | 0.27 | % | | | 0.27 | % | | | 0.28 | % | | | 0.27 | % | | | 0.28 | % |
| | | | | | |
Portfolio turnover rate | | | 15 | % | | | 52 | % | | | 33 | % | | | 40 | % | | | 36 | % | | | 46 | % |
| | | | | | |
Net assets at end of period (in 000’s) | | $ | 1,130,307 | | | $ | 1,103,235 | | | $ | 1,288,895 | | | $ | 1,171,213 | | | $ | 1,137,619 | | | $ | 1,154,403 | |
| (a) | Per share data based on average shares outstanding during the period. |
| (b) | Total return does not reflect any deduction of sales charges, mortality and expense charges, contract charges or administrative charges. For periods of less than one year, total return is not annualized. |
| (c) | Total investment return may reflect adjustments to conform to generally accepted accounting principles. |
| (d) | In addition to the fees and expenses which the Portfolio bears directly, it also indirectly bears a pro-rata share of the fees and expenses of the underlying funds in which it invests. Such indirect expenses are not included in the above expense ratios. |
| | | | |
| 28 | | MainStay VP Moderate Allocation Portfolio | | The notes to the financial statements are an integral part of,
and should be read in conjunction with, the financial statements. |
MainStay VP Moderate Growth Allocation Portfolio
Investment and Performance Comparison1(Unaudited)
Performance data quoted represents past performance. Past performance is no guarantee of future results. Because of market volatility and other factors, current performance may be lower or higher than the figures shown. Investment return and principal value will fluctuate, and as a result, when shares are redeemed, they may be worth more or less than their original cost. The performance table and graph do not reflect any deduction of sales charges mortality and expense charges, contract charges, or administrative charges. Please refer to the Performance Summary appropriate for your policy. For performance information current to the most recent month-end, please call800-598-2019 or visit www.newyorklife.com.
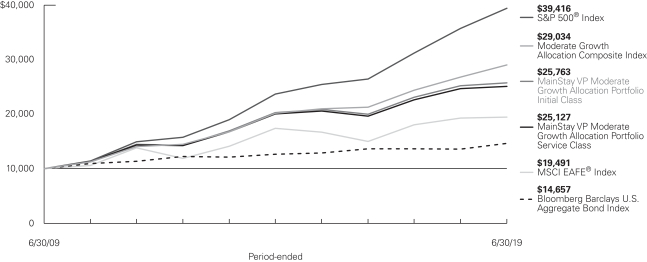
Average Annual Total Returns for the Period-Ended June 30, 2019
| | | | | | | | | | | | | | | | | | | | | | |
| Class | | Inception
Date | | Six Months | | | One Year | | | Five Years | | | Ten Years | | | Gross
Expense
Ratio2 | |
| | | | | | |
| Initial Class Shares | | 2/13/2006 | | | 13.86 | % | | | 2.07 | % | | | 4.90 | % | | | 9.93 | % | | | 0.87 | % |
| Service Class Shares | | 2/13/2006 | | | 13.71 | | | | 1.81 | | | | 4.64 | | | | 9.65 | | | | 1.12 | |
| | | | | | | | | | | | | | | | |
| Benchmark Performance | | Six
Months | | | One
Year | | | Five
Years | | | Ten
Years | |
| | | | |
S&P 500® Index3 | | | 18.54 | % | | | 10.42 | % | | | 10.71 | % | | | 14.70 | % |
MSCI EAFE® Index4 | | | 14.03 | | | | 1.08 | | | | 2.25 | | | | 6.90 | |
Bloomberg Barclays U.S. Aggregate Bond Index5 | | | 6.11 | | | | 7.87 | | | | 2.95 | | | | 3.90 | |
Moderate Growth Allocation Composite Index6 | | | 15.20 | | | | 8.30 | | | | 7.57 | | | | 11.25 | |
Morningstar Allocation—70% to 85% Equity Category Average7 | | | 13.59 | | | | 4.23 | | | | 5.20 | | | | 9.74 | |
| 1. | Performance figures may reflect certain fee waivers and/or expense limitations, without which total returns may have been different. For information on current fee waivers and/or expense limitations (if any), please refer to the Notes to Financial Statements. |
| 2. | The gross expense ratios presented reflect the Portfolio’s “Total Annual Portfolio Operating Expenses” from the most recent Prospectus, as supplemented, and may differ from other expense ratios disclosed in this report. |
| 3. | The S&P 500® Index is the Portfolio’s primary broad-based securities market index for comparison purposes. “S&P 500®” is a trademark of The McGraw-Hill Companies, Inc. The S&P 500® Index is widely regarded as the standard index for measuringlarge-cap U.S. stock market performance. Results assume reinvestment of all dividends and capital gains. An investment cannot be made directly in an index. |
| 4. | The MSCI EAFE® Index is the Portfolio’s secondary benchmark. The MSCI EAFE® Index consists of international stocks representing the developed world outside of North America. Results assume reinvestment of all dividends and capital gains. An investment cannot be made directly in an index. |
| 5. | The Portfolio has selected the Bloomberg Barclays U.S. Aggregate Bond Index as an additional benchmark. The Bloomberg Barclays U.S. Aggregate |
| | Bond Index is a broad-based benchmark that measures performance of theinvestment-grade, U.S. dollar-denominated, fixed-rate taxable bond market, including Treasurys, government-related and corporate securities, mortgage-backed securities (agency fixed-rate and hybrid adjustable-rate mortgage pass-throughs), asset-backed securities and commercial mortgage-backed securities. Results assume reinvestment of all dividends and capital gains. An investment cannot be made directly in an index. |
| 6. | The Portfolio has selected the Moderate Growth Allocation Composite Index as an additional benchmark. The Moderate Growth Allocation Composite Index consists of the S&P 500® Index, the MSCI EAFE® Index and the Bloomberg Barclays U.S. Aggregate Bond Index weighted 60%, 20% and 20%, respectively. Results assume reinvestment of all dividends and capital gains. An investment cannot be made directly in an index. |
| 7. | The Morningstar Allocation—70% to 85% Equity Category Average is representative of funds that seek to provide both income and capital appreciation by investing in multiple asset classes, including stocks, bonds, and cash. These funds are dominated by domestic holdings and have equity exposures between 70% and 85%. Results are based on average total returns of similar funds with all dividends and capital gain distributions reinvested. |
Cost in Dollars of a $1,000 Investment in MainStay VP Moderate Growth Allocation Portfolio (Unaudited)
The example below is intended to describe the fees and expenses borne by shareholders during the six-month period from January 1, 2019, to June 30, 2019, and the impact of those costs on your investment.
Example
As a shareholder of the Portfolio you incur two types of costs: (1) transaction costs, including exchange fees and sales charges (loads) on purchases (as applicable), and (2) ongoing costs, including management fees, distribution and/or service (12b-1) fees, and other Portfolio expenses (as applicable). This example is intended to help you understand your ongoing costs (in dollars) of investing in the Portfolio and to compare these costs with the ongoing costs of investing in other mutual funds. The example is based on an investment of $1,000 made at the beginning of the six-month period and held for the entire period from January 1, 2019, to June 30, 2019. Shares are only sold in connection with variable life and annuity contracts and the example does not reflect any contract level or transactional fees or expenses. If these costs had been included, your costs would have been higher.
This example illustrates your Portfolio’s ongoing costs in two ways:
Actual Expenses
The second and third data columns in the table below provide information about actual account values and actual expenses. You may use the information in these columns, together with the amount you invested, to estimate the expenses that you paid during the six months ended June 30, 2019. Simply divide your account value by $1,000
(for example, an $8,600 account value divided by $1,000 = 8.6), then multiply the result by the number under the heading entitled “Expenses Paid During Period” to estimate the expenses you paid on your account during this period.
Hypothetical Example for Comparison Purposes
The fourth and fifth data columns in the table below provide information about hypothetical account values and hypothetical expenses based on the Portfolio’s actual expense ratio and an assumed rate of return of 5% per year before expenses, which is not the Portfolio’s actual return. The hypothetical account values and expenses may not be used to estimate the actual ending account balances or expenses you paid for thesix-month period shown. You may use this information to compare the ongoing costs of investing in the Portfolio with the ongoing costs of investing in other mutual funds. To do so, compare this 5% hypothetical example with the 5% hypothetical examples that appear in the shareholder reports of the other mutual funds.
Please note that the expenses shown in the table are meant to highlight your ongoing costs only and do not reflect any transactional costs, such as exchange fees or sales charges (loads). Therefore, the fourth and fifth data columns of the table are useful in comparing ongoing costs only and will not help you determine the relative total costs of owning different funds. In addition, if these transactional costs were included, your costs would have been higher.
| | | | | | | | | | | | | | | | | | | | | | |
| | | | | | | | | | | | | | | | | | |
| Share Class | | Beginning
Account
Value
1/1/19 | | | Ending Account
Value (Based
on Actual
Returns and
Expenses)
6/30/19 | | | Expenses
Paid
During
Period1 | | | Ending Account
Value (Based
on Hypothetical
5% Annualized
Return and
Actual Expenses)
6/30/19 | | | Expenses
Paid
During
Period1 | | | Net Expense
Ratio
During
Period2 |
| | | | | | |
| Initial Class Shares | | $ | 1,000.00 | | | $ | 1,138.60 | | | $ | 0.11 | | | $ | 1,024.70 | | | $ | 0.10 | | | 0.02% |
| | | | | | |
| Service Class Shares | | $ | 1,000.00 | | | $ | 1,137.10 | | | $ | 1.43 | | | $ | 1,023.46 | | | $ | 1.35 | | | 0.27% |
| 1. | Expenses are equal to the Portfolio’s annualized expense ratio of each class multiplied by the average account value over the period, divided by 365 and multiplied by 181 (to reflect the six-month period). The table above represents the actual expenses incurred during the six-month period. In addition to the fees and expenses which the Portfolio bears directly, it also indirectly bears a pro rata share of the fees and expenses of the Underlying Portfolios/Funds in which it invests. Such indirect expenses are not included in the above-reported expense figures. |
| 2. | Expenses are equal to the Portfolio’s annualized expense ratio to reflect the six-month period. |
| | |
| 30 | | MainStay VP Moderate Growth Allocation Portfolio |
Investment Objectives of Underlying Portfolios/Funds as of June 30, 2019(Unaudited)
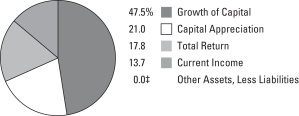
See Portfolio of Investments beginning on page 35 for specific holdings within these categories. The Portfolio’s holdings are subject to change.
| ‡ | Less than one-tenth of a percent. |
Portfolio Management Discussion and Analysis(Unaudited)
Answers to the questions reflect the views of portfolio managers Jae S. Yoon, CFA, Jonathan Swaney, Poul Kristensen, CFA, and Amit Soni, CFA, of New York Life Investments,1 the Portfolio’s Manager.
How did MainStay VP Moderate Growth Allocation Portfolio perform relative to its benchmarks and peers during the six months ended June 30, 2019?
For the six months ended June 30, 2019, MainStay VP Moderate Growth Allocation Portfolio returned 13.86% for Initial Class shares and 13.71% for Service Class shares. Over the same period, both share classes underperformed the 18.54% return of the S&P 500® Index, which is the Portfolio’s primary benchmark, and the 14.03% return of the MSCI EAFE® Index, which is a secondary benchmark of the Portfolio. For the six months ended June 30, 2019, both share classes outperformed the 6.11% return of the Bloomberg Barclays U.S. Aggregate Bond Index and underperformed the 15.20% return of the Moderate Growth Allocation Composite Index, which are additional benchmarks of the Portfolio. Over the same period, both share classes outperformed the 13.59% return of the Morningstar Allocation—70% to 85% Equity Category Average.2
What factors affected the Portfolio’s relative performance during the reporting period?
The Portfolio is a “fund of funds,” meaning that it seeks to achieve its investment objective by investing primarily in mutual funds and exchange-traded funds (“ETFs”) managed by New York Life Investments or its affiliates (the “Underlying Portfolios/Funds”). The Underlying Portfolios/Funds may invest in U.S. equities, international equities, and fixed-income instruments, making comparisons to any single index generally less suitable than a weighted combination of indices, which is a more useful yardstick by which to measure performance. The most influential factor affecting relative performance for the Portfolio versus the performance of a weighted combination of indices is the net performance of the Underlying Portfolios/Funds themselves relative to their respective benchmarks. This reporting period again proved to be challenging for the Underlying Portfolios/Funds, some of which detracted materially from active returns. Prominent examples of Underlying Portfolios/Funds that struggled to meet their objectives included the MainStay MacKay VP Small Cap Core Portfolio, the MainStay MacKay US Equity Opportunities Fund, the IQ Chaikin US Small Cap ETF and the IQ ARB Global Resources ETF.
Asset class policy provided a modest lift to relative performance through successful management of the Portfolio’s overall stock/ bond blend. The Portfolio increased its equity exposure based on perceived market weakness during the fourth quarter of 2018 and maintained the increased exposure well into 2019 as stock prices recovered, although positioning returned to nearly
neutral by mid spring and remained near that level through the end of the reporting period. Within equities, a preference for large company stocks over those of smaller firms was well rewarded. However, returns were undermined by the Portfolio’s tilt toward value-oriented over growth-oriented securities, a position reflecting our belief that value-oriented stocks would benefit disproportionately from policy stimulus, while growth would be restrained by new regulations. Equity performance also suffered from the Portfolio’s emphasis on emerging markets over developed international markets, which we implemented in the expectation that the developing world would benefit broadly from Chinese government economic intervention. Among the Portfolio’s fixed-income holdings, performance benefited from exposure to convertible bonds, but the Portfolio’s position in cash and short maturity municipal bonds failed to match the returns available on longer duration3 instruments.
How did you allocate the Portfolio’s assets during the reporting period and why?
The Portfolio’s management considers a variety of factors in allocating the assets, including the portfolio-level characteristics of the Underlying Portfolios/Funds (such as capitalization, style biases, sector exposures, credit quality and duration) and the attributes of the individual holdings within those funds (valuation metrics, earnings data and technical indicators). Generally, we seek to invest in funds that correspond well to our desired asset class exposures, which is to say that they occupy attractively valued segments of the market and appear positioned to benefit from the current economic environment.
In late 2018, just before the reporting period began, we took advantage of declining stock prices to increase the Portfolio’s exposure to equities in the belief that economic fundamentals remained sound despite concerns around trade negotiations, monetary policy and slowing external growth. Conditions were improving as we entered the reporting period. Stocks climbed steadily through the first four months of 2019, supported by increasing signs of progress in trade negotiations, signals from the U.S. Federal Reserve Board of a pause in interest-rate hikes and sweeping Chinese government actions across fiscal, monetary and regulatory fronts to bolster economic activity. As equity markets rose, we gradually trimmed the Portfolio’s equity exposure until, by late April 2019, it was again close to neutral. Markets dropped in May 2019 on renewed trade friction and mounting concerns within manufacturing areas of the industrial sector before rebounding in June 2019 on signs of potential
| 1. | “New York Life Investments” is a service mark used by New York Life Investment Management Holdings LLC and its subsidiary New York Life Investment Management LLC. |
| 2. | See page 29 for more information on benchmark and peer group returns. |
| 3. | Duration is a measure of the price sensitivity of a fixed-income investment to changes in interest rates. Duration is expressed as a number of years and is considered a more accurate sensitivity gauge than average maturity. |
| | |
| 32 | | MainStay VP Moderate Growth Allocation Portfolio |
monetary policy support and possible progress in trade negotiations. The Portfolio’s positioning maintained relative stability throughout the reporting period.
We believed that, in light of aggressive government actions, Chinese economic reacceleration was likely to continue, and that the impact would be felt as a tailwind for most emerging markets. In response, we allocated a relatively large percentage of the Portfolio’s assets to stocks of developing nations over those of the developed world. However, the Chinese economy remained more sluggish than we anticipated during the reporting period. Second, the Portfolio allocated assets disproportionately across the capitalization spectrum and by industry. Whereas we had previously positioned the Portfolio to favor small companies over larger multinationals that we believed were less likely to benefit from tax reform and industry deregulation, we later reversed that position. As the reporting period progressed, we saw comparatively weak earnings trends within thesmall-cap universe, with a disconcerting number of firms producing negative earnings. We also anticipated thatsmall-cap companies might prove more vulnerable to rising interest rates than large companies that have locked in lower rates by issuing long maturity bonds. Third, in 2018 we introduced a value bias to the Portfolio, driven primarily by concerns regarding potential developments in litigation, regulation and competition in the information technology, energy and financials sectors. During the reporting period, that bias detracted from performance as growth companies continued to lead the market higher.
In the fixed-income portion of the Portfolio, we shifted overall credit exposure from being slightly underweight to being effectively neutral as spreads4 widened in late 2018, and valuations appeared more reasonable. Within speculative-grade credit, the Portfolio avoided floating-rate bonds due to concerns about excessive leverage and poor underwriting. At the same time, we kept the Portfolio’s duration slightly short in the expectation that the yield curve5 would steepen should events bear out our opinion that growth remained entrenched and the next recession was still some distance off. The Portfolio’s positioning on credit mildly enhanced returns, but those benefits were undercut by the negative effects of the Portfolio’s duration position.
How did the Portfolio’s allocations change over the course of the reporting period?
We lowered the Portfolio’s equity exposure during the reporting period in part by reducing its positions in the IQ Chaikin US Large Cap ETF and the IQ 50% Hedged FTSE International ETF. The Portfolio kept some of the proceeds in cash rather than investing in fixed-income securities, given our duration strategy.
Within equities, we made the Portfolio’s value bias a little less pronounced by allocating more assets to the MainStay VP Large Cap Growth Portfolio and the MainStay VP MacKay Growth Equity Portfolio. We also lowered the Portfolio’s exposure to the MainStay Cushing Renaissance Advantage Fund and the MainStay Cushing MLP Premier Fund as energy assets failed to respond to rising crude oil prices to the degree we anticipated.
During the reporting period, the MainStay VP Epoch U.S. Small Cap Portfolio merged into the MainStay VP MacKay Small Cap Core Portfolio; the Portfolio maintained its position through the merger. In another merger, MainStay Epoch Global Choice Fund merged into the MainStay Epoch Capital Growth Fund. In that instance, the Portfolio exited its position prior to the merger date. A new Underlying Fund was added during the reporting period: the IQ International 500 ETF. The Portfolio’s exposure to this Underlying Fund remained quite small as of June 30, 2019 but was expected to grow.
In the fixed-income portion of the Portfolio, we reduced the position in the MainStay VP Indexed Bond Portfolio and MainStay VP Bond Portfolio, and redirected the proceeds to the MainStay Short Duration High Yield Fund, thereby slightly increasing the Portfolio’s exposure to credit and shortening average maturity.
Which Underlying Equity Portfolios/Funds had the highest total returns during the reporting period, and which Underlying Equity Portfolios/Funds had the lowest total returns?
Of the Underlying Equity Portfolios/Funds held for the full reporting period, the highest total returns came from the MainStay VP Large Cap Growth Portfolio, the MainStay Epoch U.S. All Cap Fund, and the MainStay VP Eagle Small Cap Growth Portfolio. At the other end of the spectrum, the IQ Global Resources ETF, the IQ 500 International ETF, and the MainStay MacKay International Opportunities Fund produced the lowest total returns.
Which Underlying Equity Portfolios/Funds made the strongest positive contributions to the Portfolio’s overall performance, and which Underlying Equity Portfolios/Funds were the greatest detractors?
Among the Underlying Equity Portfolios/Funds making the most significant contributions to the Portfolio’s equity returns were the MainStay Epoch All Cap Fund, the MainStay VP T. Rowe Price Equity Income Portfolio and the MainStay VP Mid Cap Core Portfolio. (Contributions take weightings and total returns into account.) Detractors from the Portfolio’s equity performance included the MainStay Epoch U.S. Equity Yield Fund, the
| 4. | The terms “spread” and “yield spread” may refer to the difference in yield between a security or type of security and comparable U.S. Treasury issues. The terms may also refer to the difference in yield between two specific securities or types of securities at a given time. |
| 5. | The yield curve is a line that plots the yields of various securities of similar quality—typically U.S. Treasury issues—across a range of maturities. The U.S. Treasury yield curve serves as a benchmark for other debt and is used in economic forecasting. |
MainStay VP S&P 500 Fund and the IQ 500 International ETF, though all generated positive returns.
What factors and risks affected the Portfolio’s Underlying Fixed-Income Portfolio/Fund investments during the reporting period?
Within credit markets, spreads recovered from the stress of late 2018, compressing through late February 2019 and then holding generally steady through the end of the reporting period as softening economic conditions were balanced by rising expectations of policy support. Several factors affected investments in the high-grade market, including surprisingly soft inflation readings, a decline in unit labor costs, weak global manufacturing data and expectations of increasingly relaxed monetary policy from many of the world’s central banks. As a result, yields fell across the curve leading to an inversion in some segments.
During the reporting period, which fixed-income market segments were the strongest positive contributors to the Portfolio’s performance and which segments were particularly weak?
The equity sensitivity of convertible bonds made this segment the strongest positive contributor to the Portfolio’s performance.
Most other segments also fared well, with high-yielding and longer-duration bonds performing best. High-quality, short-maturity instruments trailed the pack, but still posted positive results.
Which Underlying Fixed-Income Portfolios/Funds made the strongest positive contributions to the Portfolio’s performance, and which Underlying Fixed-Income Portfolios/Funds were the greatest detractors?
During the reporting period, the MainStay VP Convertibles Portfolio, the MainStay Short Duration High Yield Fund and the MainStay VP Floating Rate Portfolio made the strongest positive contributions to the performance of the fixed-income portion of the Portfolio. Over the same period, the Portfolio’s cash position, the MainStay Total Return Bond Fund and the IQ S&P High Yield Low Volatility Bond ETF were the most significant detractors from the performance of the fixed-income portion of the Portfolio, though all provided positive returns.
The opinions expressed are those of the portfolio managers as of the date of this report and are subject to change. There is no guarantee that any forecasts will come to pass. This material does not constitute investment advice and is not intended as an endorsement of any specific investment.
Not all MainStay VP Portfolios and/or share classes are available under all policies.
| | |
| 34 | | MainStay VP Moderate Growth Allocation Portfolio |
Portfolio of InvestmentsJune 30, 2019 (Unaudited)
| | | | | | | | |
| | |
| | | Shares | | | Value | |
| Affiliated Investment Companies 96.8%† | |
Equity Funds 79.3% | |
IQ 50 Percent Hedged FTSE International ETF (a) | | | 2,496,314 | | | $ | 50,824,953 | |
IQ 500 International ETF (a) | | | 546,882 | | | | 14,670,219 | |
IQ Chaikin U.S. Large Cap ETF (a) | | | 3,019,997 | | | | 74,261,726 | |
IQ Chaikin U.S. Small Cap ETF (a) | | | 1,373,462 | | | | 34,144,265 | |
IQ Global Resources ETF (a) | | | 1,383,597 | | | | 37,772,198 | |
MainStay Cushing MLP Premier Fund Class I | | | 443,037 | | | | 4,922,144 | |
MainStay Epoch Capital Growth Fund Class I (a)(b) | | | 1,604,405 | | | | 20,520,340 | |
MainStay Epoch International Choice Fund Class I (a) | | | 2,696,137 | | | | 95,308,454 | |
MainStay Epoch U.S. All Cap Fund Class R6 (a) | | | 4,100,791 | | | | 116,462,474 | |
MainStay Epoch U.S. Equity Yield Fund Class R6 | | | 290,344 | | | | 4,828,427 | |
MainStay MacKay International Opportunities Fund Class I (a) | | | 8,975,338 | | | | 69,738,379 | |
MainStay MacKay U.S. Equity Opportunities Fund Class I (a) | | | 9,419,284 | | | | 79,404,566 | |
MainStay MAP Equity Fund Class I (a) | | | 2,340,264 | | | | 97,682,617 | |
MainStay VP Cushing Renaissance Advantage Portfolio Initial Class (a) | | | 1,883,609 | | | | 16,312,071 | |
MainStay VP Eagle Small Cap Growth Portfolio Initial Class (a) | | | 4,040,804 | | | | 58,929,987 | |
MainStay VP Emerging Markets Equity Portfolio Initial Class (a) | | | 13,325,884 | | | | 119,479,035 | |
MainStay VP Epoch U.S. Equity Yield Portfolio Initial Class (a) | | | 6,733,910 | | | | 108,020,441 | |
MainStay VP Large Cap Growth Portfolio Initial Class (a) | | | 3,347,019 | | | | 89,103,844 | |
MainStay VP MacKay Common Stock Portfolio Initial Class (a) | | | 1,657,293 | | | | 48,156,334 | |
MainStay VP MacKay Growth Portfolio Initial Class (a) | | | 2,776,493 | | | | 90,164,530 | |
MainStay VP MacKay International Equity Portfolio Initial Class (a) | | | 1,257,364 | | | | 21,232,508 | |
MainStay VP MacKay Mid Cap Core Portfolio Initial Class (a) | | | 7,819,080 | | | | 107,804,233 | |
MainStay VP MacKay S&P 500 Index Portfolio Initial Class | | | 84,807 | | | | 4,832,650 | |
MainStay VP MacKay Small Cap Core Portfolio Initial Class (a) | | | 8,124,306 | | | | 89,201,753 | |
MainStay VP T. Rowe Price Equity Income Portfolio Initial Class (a) | | | 10,876,605 | | | | 143,365,303 | |
| | | | | | | | |
Total Equity Funds
(Cost $1,562,673,637) | | | | | | | 1,597,143,451 | |
| | | | | | | | |
| | | | | | | | |
| | |
| | | Shares | | | Value | |
Fixed Income Funds 17.5% | |
IQ Enhanced Core Plus Bond U.S. ETF (a) | | | 903,267 | | | $ | 17,609,190 | |
IQ S&P High Yield Low Volatility Bond ETF | | | 79,522 | | | | 1,997,450 | |
MainStay MacKay High Yield Municipal Bond Fund Class I | | | 2,411,455 | | | | 31,059,538 | |
MainStay MacKay Short Duration High Yield Fund Class I (a) | | | 9,420,908 | | | | 93,078,567 | |
MainStay MacKay Short Term Municipal Fund Class I (a) | | | 4,232,082 | | | | 40,712,625 | |
MainStay MacKay Total Return Bond Fund Class R6 | | | 32,272 | | | | 345,638 | |
MainStay VP Bond Portfolio Initial Class (a) | | | 1,290,510 | | | | 18,865,751 | |
MainStay VP Floating Rate Portfolio Initial Class (a) | | | 7,377,807 | | | | 65,590,993 | |
MainStay VP MacKay Convertible Portfolio Initial Class (a) | | | 1,837,007 | | | | 26,082,067 | |
MainStay VP MacKay High Yield Corporate Bond Portfolio Initial Class | | | 231,478 | | | | 2,346,993 | |
MainStay VP MacKay Unconstrained Bond Portfolio Initial Class (a) | | | 3,858,768 | | | | 37,980,368 | |
MainStay VP PIMCO Real Return Portfolio Initial Class (a) | | | 2,019,091 | | | | 17,627,146 | |
| | | | | | | | |
Total Fixed Income Funds
(Cost $347,941,390) | | | | | | | 353,296,326 | |
| | | | | | | | |
Total Affiliated Investment Companies
(Cost $1,910,615,027) | | | | | | | 1,950,439,777 | |
| | | | | | | | |
|
| Short-Term Investment 3.2% | |
Affiliated Investment Company 3.2% | |
MainStay U.S. Government Liquidity Fund, 2.03% (c) | | | 65,031,090 | | | | 65,031,090 | |
| | | | | | | | |
TotalShort-Term Investment
(Cost $65,031,090) | | | | | | | 65,031,090 | |
| | | | | | | | |
Total Investments
(Cost $1,975,646,117) | | | 100.0 | % | | | 2,015,470,867 | |
Other Assets, Less Liabilities | | | (0.0 | )‡ | | | (488,700 | ) |
Net Assets | | | 100.0 | % | | $ | 2,014,982,167 | |
| † | Percentages indicated are based on Portfolio net assets. |
| ‡ | Less than one-tenth of a percent. |
| (a) | As of June 30, 2019, the Portfolio’s ownership exceeds 5% of the outstanding shares of the Underlying Portfolio’s/Fund’s share class. |
| (b) | Non-income producing Underlying Portfolio/Fund. |
| (c) | Current yield as of June 30, 2019. |
The following abbreviations are used in the preceding pages:
ETF—Exchange-Traded Fund
FTSE��Financial Times Stock Exchange
MLP—Master limited partnership
| | | | | | |
The notes to the financial statements are an integral part of,
and should be read in conjunction with, the financial statements. | | | | | 35 | |
Portfolio of InvestmentsJune 30, 2019 (Unaudited) (continued)
The following is a summary of the fair valuations according to the inputs used as of June 30, 2019, for valuing the Portfolio’s assets:
| | | | | | | | | | | | | | | | |
Description | | Quoted
Prices in
Active
Markets for
Identical
Assets
(Level 1) | | | Significant
Other
Observable
Inputs
(Level 2) | | | Significant
Unobservable
Inputs
(Level 3) | | | Total | |
| | | | |
Asset Valuation Inputs | | | | | | | | | | | | | | | | |
| Investments (a) | | | | | | | | | | | | | | | | |
| Affiliated Investment Companies | | | | | | | | | | | | | | | | |
Equity Funds | | $ | 1,597,143,451 | | | $ | — | | | $ | — | | | $ | 1,597,143,451 | |
Fixed Income Funds | | | 353,296,326 | | | | — | | | | — | | | | 353,296,326 | |
Short-Term Investment | | | 65,031,090 | | | | — | | | | — | | | | 65,031,090 | |
| | | | | | | | | | | | | | | | |
| Total Investments in Securities | | $ | 2,015,470,867 | | | $ | — | | | $ | — | | | $ | 2,015,470,867 | |
| | | | | | | | | | | | | | | | |
| (a) | For a complete listing of investments, see the Portfolio of Investments. |
| | | | |
| 36 | | MainStay VP Moderate Growth Allocation Portfolio | | The notes to the financial statements are an integral part of,
and should be read in conjunction with, the financial statements. |
Statement of Assets and Liabilitiesas of June 30, 2019 (Unaudited)
| | | | |
| Assets | |
Investment in affiliated investment companies, at value (identified cost $1,975,646,117) | | $ | 2,015,470,867 | |
Cash | | | 33,005 | |
Receivables: | | | | |
Investment securities sold | | | 1,634,265 | |
Dividends and Interest | | | 1,227,762 | |
Portfolio shares sold | | | 107,258 | |
Other assets | | | 9,808 | |
| | | | |
Total assets | | | 2,018,482,965 | |
| | | | |
|
| Liabilities | |
Payables: | | | | |
Portfolio shares redeemed | | | 1,734,501 | |
Investment securities purchased | | | 1,228,827 | |
NYLIFE Distributors (See Note 3) | | | 390,703 | |
Shareholder communication | | | 89,908 | |
Professional fees | | | 34,046 | |
Custodian | | | 4,919 | |
Trustees | | | 2,681 | |
Accrued expenses | | | 15,213 | |
| | | | |
Total liabilities | | | 3,500,798 | |
| | | | |
Net assets | | $ | 2,014,982,167 | |
| | | | |
| |
| Composition of Net Assets | | | | |
Shares of beneficial interest outstanding (par value of $.001 per share) unlimited number of shares authorized | | $ | 169,232 | |
Additional paid-in capital | | | 1,864,059,066 | |
| | | | |
| | | 1,864,228,298 | |
Total distributable earnings (loss) | | | 150,753,869 | |
| | | | |
Net assets | | $ | 2,014,982,167 | |
| | | | |
| | | | |
Initial Class | | | | |
Net assets applicable to outstanding shares | | $ | 89,493,795 | |
| | | | |
Shares of beneficial interest outstanding | | | 7,433,233 | |
| | | | |
Net asset value per share outstanding | | $ | 12.04 | |
| | | | |
Service Class | | | | |
Net assets applicable to outstanding shares | | $ | 1,925,488,372 | |
| | | | |
Shares of beneficial interest outstanding | | | 161,799,242 | |
| | | | |
Net asset value per share outstanding | | $ | 11.90 | |
| | | | |
| | | | | | |
The notes to the financial statements are an integral part of,
and should be read in conjunction with, the financial statements. | | | | | 37 | |
Statement of Operationsfor the six months ended June 30, 2019 (Unaudited)
| | | | |
| Investment Income (Loss) | |
Income | | | | |
Dividend distributions from affiliated investment companies | | $ | 9,632,924 | |
Interest | | | 1,387 | |
| | | | |
Total income | | | 9,634,311 | |
| | | | |
Expenses | | | | |
Distribution/Service—Service Class (See Note 3) | | | 2,414,118 | |
Shareholder communication | | | 88,162 | |
Professional fees | | | 72,336 | |
Trustees | | | 25,799 | |
Custodian | | | 6,347 | |
Miscellaneous | | | 27,805 | |
| | | | |
Total expenses | | | 2,634,567 | |
| | | | |
Net investment income (loss) | | | 6,999,744 | |
| | | | |
|
| Realized and Unrealized Gain (Loss) on Investments | |
Net realized gain (loss) on: | | | | |
Affiliated investment company transactions | | | (28,139,740 | ) |
Realized capital gain distributions from affiliated investment companies | | | 9,669,017 | |
| | | | |
Net realized gain (loss) on investments from affiliated and unaffiliated investment companies | | | (18,470,723 | ) |
| | | | |
Net change in unrealized appreciation (depreciation) on investments in affiliated investment companies | | | 270,988,417 | |
| | | | |
Net realized and unrealized gain (loss) on investments | | | 252,517,694 | |
| | | | |
Net increase (decrease) in net assets resulting from operations | | $ | 259,517,438 | |
| | | | |
| | | | |
| 38 | | MainStay VP Moderate Growth Allocation Portfolio | | The notes to the financial statements are an integral part of,
and should be read in conjunction with, the financial statements. |
Statements of Changes in Net Assets
for the six months ended June 30, 2019 (Unaudited) and the year ended December 31, 2018
| | | | | | | | |
| | | 2019 | | | 2018 | |
| Increase (Decrease) in Net Assets | |
Operations: | | | | | | | | |
Net investment income (loss) | | $ | 6,999,744 | | | $ | 32,478,085 | |
Net realized gain (loss) on investments and investments from affiliated investment companies | | | (18,470,723 | ) | | | 154,490,784 | |
Net change in unrealized appreciation (depreciation) on investments in affiliated investment companies | | | 270,988,417 | | | | (425,456,108 | ) |
| | | | |
Net increase (decrease) in net assets resulting from operations | | | 259,517,438 | | | | (238,487,239 | ) |
| | | | |
Distributions to shareholders: | | | | | | | | |
Initial Class | | | — | | | | (5,592,425 | ) |
Service Class | | | — | | | | (128,359,468 | ) |
| | | | |
Total distributions to shareholders | | | — | | | | (133,951,893 | ) |
| | | | |
Capital share transactions: | | | | | | | | |
Net proceeds from sale of shares | | | 13,819,235 | | | | 115,635,373 | |
Net asset value of shares issued to shareholders in reinvestment of dividends and distributions | | | — | | | | 133,951,893 | |
Cost of shares redeemed | | | (188,461,447 | ) | | | (301,081,497 | ) |
| | | | |
Increase (decrease) in net assets derived from capital share transactions | | | (174,642,212 | ) | | | (51,494,231 | ) |
| | | | |
Net increase (decrease) in net assets | | | 84,875,226 | | | | (423,933,363 | ) |
|
| Net Assets | |
Beginning of period | | | 1,930,106,941 | | | | 2,354,040,304 | |
| | | | |
End of period | | $ | 2,014,982,167 | | | $ | 1,930,106,941 | |
| | | | |
| | | | | | |
The notes to the financial statements are an integral part of,
and should be read in conjunction with, the financial statements. | | | | | 39 | |
Financial Highlightsselected per share data and ratios
| | | | | | | | | | | | | | | | | | | | | | | | |
| | |
| | | Six months
ended
June 30, | | | Year ended December 31, | |
| | | | | | |
| Initial Class | | 2019* | | | 2018 | | | 2017 | | | 2016 | | | 2015 | | | 2014 | |
| | | | | | |
Net asset value at beginning of period | | $ | 10.57 | | | $ | 12.61 | | | $ | 11.00 | | | $ | 11.08 | | | $ | 12.78 | | | $ | 13.36 | |
| | | | | | | | | | | | | | | | | | | | | | | | |
| | | | | | |
Net investment income (loss) (a) | | | 0.05 | | | | 0.21 | | | | 0.17 | | | | 0.18 | | | | 0.17 | | | | 0.20 | |
| | | | | | |
Net realized and unrealized gain (loss) on investments | | | 1.42 | | | | (1.47 | ) | | | 1.86 | | | | 0.64 | | | | (0.49 | ) | | | 0.39 | |
| | | | | | | | | | | | | | | | | | | | | | | | |
| | | | | | |
Total from investment operations | | | 1.47 | | | | (1.26 | ) | | | 2.03 | | | | 0.82 | | | | (0.32 | ) | | | 0.59 | |
| | | | | | | | | | | | | | | | | | | | | | | | |
| | | | | | |
| Less dividends and distributions: | | | | | | | | | | | | | | | | | | | | | | | | |
| | | | | | |
From net investment income | | | — | | | | (0.24 | ) | | | (0.18 | ) | | | (0.24 | ) | | | (0.30 | ) | | | (0.25 | ) |
| | | | | | |
From net realized gain on investments | | | — | | | | (0.54 | ) | | | (0.24 | ) | | | (0.66 | ) | | | (1.08 | ) | | | (0.92 | ) |
| | | | | | | | | | | | | | | | | | | | | | | | |
| | | | | | |
Total dividends and distributions | | | — | | | | (0.78 | ) | | | (0.42 | ) | | | (0.90 | ) | | | (1.38 | ) | | | (1.17 | ) |
| | | | | | | | | | | | | | | | | | | | | | | | |
| | | | | | |
Net asset value at end of period | | $ | 12.04 | | | $ | 10.57 | | | $ | 12.61 | | | $ | 11.00 | | | $ | 11.08 | | | $ | 12.78 | |
| | | | | | | | | | | | | | | | | | | | | | | | |
| | | | | | |
Total investment return (b) | | | 13.91 | %(c) | | | (10.73 | %) | | | 18.62 | % | | | 7.56 | % | | | (2.35 | %) | | | 4.59 | % |
| | | | | | |
| Ratios (to average net assets)/Supplemental Data: | | | | | | | | | | | | | | | | | | | | | | | | |
| | | | | | |
Net investment income (loss) | | | 0.94 | %†† | | | 1.71 | % | | | 1.43 | % | | | 1.60 | % | | | 1.38 | % | | | 1.51 | % |
| | | | | | |
Net expenses (d) | | | 0.02 | %†† | | | 0.02 | % | | | 0.02 | % | | | 0.03 | % | | | 0.02 | % | | | 0.03 | % |
| | | | | | |
Portfolio turnover rate | | | 16 | % | | | 44 | % | | | 31 | % | | | 33 | % | | | 34 | % | | | 44 | % |
| | | | | | |
Net assets at end of period (in 000’s) | | $ | 89,494 | | | $ | 80,133 | | | $ | 90,089 | | | $ | 76,025 | | | $ | 68,000 | | | $ | 66,849 | |
| (a) | Per share data based on average shares outstanding during the period. |
| (b) | Total return does not reflect any deduction of sales charges, mortality and expense charges, contract charges or administrative charges. For periods of less than one year, total return is not annualized. |
| (c) | Total investment return may reflect adjustments to conform to generally accepted accounting principles. |
| (d) | In addition to the fees and expenses which the Portfolio bears directly, it also indirectly bears a pro-rata share of the fees and expenses of the underlying funds in which it invests. Such indirect expenses are not included in the above expense ratios. |
| | | | | | | | | | | | | | | | | | | | | | | | |
| | |
| | | Six months
ended
June 30, | | | Year ended December 31, | |
| | | | | | |
| Service Class | | 2019* | | | 2018 | | | 2017 | | | 2016 | | | 2015 | | | 2014 | |
| | | | | | |
Net asset value at beginning of period | | $ | 10.47 | | | $ | 12.49 | | | $ | 10.90 | | | $ | 10.99 | | | $ | 12.68 | | | $ | 13.28 | |
| | | | | | | | | | | | | | | | | | | | | | | | |
| | | | | | |
Net investment income (loss) (a) | | | 0.04 | | | | 0.17 | | | | 0.14 | | | | 0.14 | | | | 0.14 | | | | 0.17 | |
| | | | | | |
Net realized and unrealized gain (loss) on investments | | | 1.39 | | | | (1.44 | ) | | | 1.84 | | | | 0.64 | | | | (0.47 | ) | | | 0.38 | |
| | | | | | | | | | | | | | | | | | | | | | | | |
| | | | | | |
Total from investment operations | | | 1.43 | | | | (1.27 | ) | | | 1.98 | | | | 0.78 | | | | (0.33 | ) | | | 0.55 | |
| | | | | | | | | | | | | | | | | | | | | | | | |
| | | | | | |
| Less dividends and distributions: | | | | | | | | | | | | | | | | | | | | | | | | |
| | | | | | |
From net investment income | | | — | | | | (0.21 | ) | | | (0.15 | ) | | | (0.21 | ) | | | (0.28 | ) | | | (0.23 | ) |
| | | | | | |
From net realized gain on investments | | | — | | | | (0.54 | ) | | | (0.24 | ) | | | (0.66 | ) | | | (1.08 | ) | | | (0.92 | ) |
| | | | | | | | | | | | | | | | | | | | | | | | |
| | | | | | |
Total dividends and distributions | | | — | | | | (0.75 | ) | | | (0.39 | ) | | | (0.87 | ) | | | (1.36 | ) | | | (1.15 | ) |
| | | | | | | | | | | | | | | | | | | | | | | | |
| | | | | | |
Net asset value at end of period | | $ | 11.90 | | | $ | 10.47 | | | $ | 12.49 | | | $ | 10.90 | | | $ | 10.99 | | | $ | 12.68 | |
| | | | | | | | | | | | | | | | | | | | | | | | |
| | | | | | |
Total investment return (b) | | | 13.66 | %(c) | | | (10.95 | %) | | | 18.32 | % | | | 7.30 | % | | | (2.59 | %) | | | 4.33 | % |
| | | | | |
| Ratios (to average net assets)/Supplemental Data: | | | | | | | | | | | | | | | | | | | | | |
| | | | | | |
Net investment income (loss) | | | 0.68 | %†† | | | 1.42 | % | | | 1.17 | % | | | 1.32 | % | | | 1.13 | % | | | 1.28 | % |
| | | | | | |
Net expenses (d) | | | 0.27 | %†† | | | 0.27 | % | | | 0.27 | % | | | 0.28 | % | | | 0.27 | % | | | 0.28 | % |
| | | | | | |
Portfolio turnover rate | | | 16 | % | | | 44 | % | | | 31 | % | | | 33 | % | | | 34 | % | | | 44 | % |
| | | | | | |
Net assets at end of period (in 000’s) | | $ | 1,925,488 | | | $ | 1,849,974 | | | $ | 2,263,952 | | | $ | 1,990,699 | | | $ | 1,869,969 | | | $ | 1,855,721 | |
| (a) | Per share data based on average shares outstanding during the period. |
| (b) | Total return does not reflect any deduction of sales charges, mortality and expense charges, contract charges or administrative charges. For periods of less than one year, total return is not annualized. |
| (c) | Total investment return may reflect adjustments to conform to generally accepted accounting principles. |
| (d) | In addition to the fees and expenses which the Portfolio bears directly, it also indirectly bears a pro-rata share of the fees and expenses of the underlying funds in which it invests. Such indirect expenses are not included in the above expense ratios. |
| | | | |
| 40 | | MainStay VP Moderate Growth Allocation Portfolio | | The notes to the financial statements are an integral part of,
and should be read in conjunction with, the financial statements. |
MainStay VP Growth Allocation Portfolio
Investment and Performance Comparison1(Unaudited)
Performance data quoted represents past performance. Past performance is no guarantee of future results. Because of market volatility and other factors, current performance may be lower or higher than the figures shown. Investment return and principal value will fluctuate, and as a result, when shares are redeemed, they may be worth more or less than their original cost. The performance table and graph do not reflect any deduction of sales charges, mortality and expense charges, contract charges or administrative charges. Please refer to the Performance Summary appropriate for your policy. For performance information current to the most recent month-end, please call800-598-2019 or visit www.newyorklife.com.
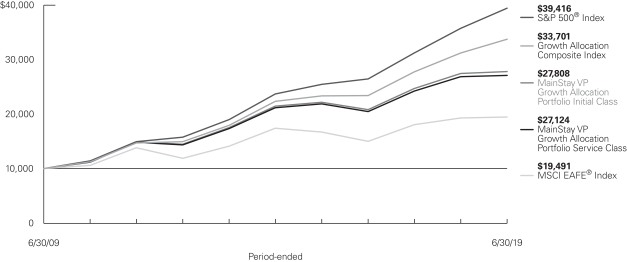
Average Annual Total Returns for the Period-Ended June 30, 2019
| | | | | | | | | | | | | | | | | | | | | | |
| Class | | Inception
Date | | Six Months | | | One Year | | | Five Years | | | Ten Years | | | Gross
Expense
Ratio2 | |
| | | | | | |
| Initial Class Shares | | 2/13/2006 | | | 15.61 | % | | | 1.25 | % | | | 5.31 | % | | | 10.77 | % | | | 0.90 | % |
| Service Class Shares | | 2/13/2006 | | | 15.47 | | | | 1.00 | | | | 5.05 | | | | 10.49 | | | | 1.15 | |
| | | | | | | | | | | | | | | | |
| Benchmark Performance | | Six
Months | | | One
Year | | | Five
Years | | | Ten
Years | |
| | | | |
S&P 500® Index3 | | | 18.54 | % | | | 10.42 | % | | | 10.71 | % | | | 14.70 | % |
MSCI EAFE® Index4 | | | 14.03 | | | | 1.08 | | | | 2.25 | | | | 6.90 | |
Growth Allocation Composite Index5 | | | 17.40 | | | | 8.07 | | | | 8.59 | | | | 12.92 | |
Morningstar Allocation—85%+ Equity Category Average6 | | | 15.80 | | | | 3.79 | | | | 5.79 | | | | 10.95 | |
| 1. | Performance figures may reflect certain fee waivers and/or expense limitations, without which total returns may have been different. For information on current fee waivers and/or expense limitations (if any), please refer to the Notes to Financial Statements. |
| 2. | The gross expense ratios presented reflect the Portfolio’s “Total Annual Portfolio Operating Expenses” from the most recent Prospectus , as supplemented, and may differ from other expense ratios disclosed in this report. |
| 3. | The S&P 500® Index is the Portfolio’s primary broad-based securities market index for comparison purposes. “S&P 500®” is a trademark of The McGraw-Hill Companies, Inc. The S&P 500® Index is widely regarded as the standard index for measuringlarge-cap U.S. stock market performance. Results assume reinvestment of all dividends and capital gains. An investment cannot be made directly in an index. |
| 4. | The MSCI EAFE® Index is the Portfolio’s secondary benchmark. The MSCI EAFE® Index consists of international stocks representing the developed world outside of North America. Results assume reinvestment of all |
| | dividends and capital gains. An investment cannot be made directly in an index. |
| 5. | The Portfolio has selected the Growth Allocation Composite Index as an additional benchmark. The Growth Allocation Composite Index consists of the S&P 500® Index and the MSCI EAFE® Index weighted 75% and 25%, respectively. Results assume reinvestment of all dividends and capital gains. An investment cannot be made directly in an index. |
| 6. | The Morningstar Allocation—85%+ Equity Category Average is representative of funds that seek to provide both income and capital appreciation by investing in multiple asset classes, including stocks, bonds, and cash. These funds are dominated by domestic holdings and have equity exposures of over 85%. These funds typically allocate at least 10% to equities of foreign companies and do not exclusively allocate between cash and equities. Results are based on average total returns of similar funds with all dividends and capital gain distributions reinvested. |
Cost in Dollars of a $1,000 Investment in MainStay VP Growth Allocation Portfolio (Unaudited)
The example below is intended to describe the fees and expenses borne by shareholders during the six-month period from January 1, 2019, to June 30, 2019, and the impact of those costs on your investment.
Example
As a shareholder of the Portfolio you incur two types of costs: (1) transaction costs, including exchange fees and sales charges (loads) on purchases (as applicable), and (2) ongoing costs, including management fees, distribution and/or service (12b-1) fees, and other Portfolio expenses (as applicable). This example is intended to help you understand your ongoing costs (in dollars) of investing in the Portfolio and to compare these costs with the ongoing costs of investing in other mutual funds. The example is based on an investment of $1,000 made at the beginning of the six-month period and held for the entire period from January 1, 2019, to June 30, 2019. Shares are only sold in connection with variable life and annuity contracts and the example does not reflect any contract level or transactional fees or expenses. If these costs had been included, your costs would have been higher.
This example illustrates your Portfolio’s ongoing costs in two ways:
Actual Expenses
The second and third data columns in the table below provide information about actual account values and actual expenses. You may use the information in these columns, together with the amount you invested, to estimate the expenses that you paid during the six months ended June 30, 2019. Simply divide your account value by $1,000
(for example, an $8,600 account value divided by $1,000 = 8.6), then multiply the result by the number under the heading entitled “Expenses Paid During Period” to estimate the expenses you paid on your account during this period.
Hypothetical Example for Comparison Purposes
The fourth and fifth data columns in the table below provide information about hypothetical account values and hypothetical expenses based on the Portfolio’s actual expense ratio and an assumed rate of return of 5% per year before expenses, which is not the Portfolio’s actual return. The hypothetical account values and expenses may not be used to estimate the actual ending account balances or expenses you paid for thesix-month period shown. You may use this information to compare the ongoing costs of investing in the Portfolio with the ongoing costs of investing in other mutual funds. To do so, compare this 5% hypothetical example with the 5% hypothetical examples that appear in the shareholder reports of the other mutual funds.
Please note that the expenses shown in the table are meant to highlight your ongoing costs only and do not reflect any transactional costs, such as exchange fees or sales charges (loads). Therefore, the fourth and fifth data columns of the table are useful in comparing ongoing costs only and will not help you determine the relative total costs of owning different funds. In addition, if these transactional costs were included, your costs would have been higher.
| | | | | | | | | | | | | | | | | | | | | | |
| | | | | | | | | | | | | | | | | | |
| Share Class | | Beginning
Account
Value
1/1/19 | | | Ending Account
Value (Based
on Actual
Returns and
Expenses)
6/30/19 | | | Expenses
Paid
During
Period1 | | | Ending Account
Value (Based
on Hypothetical
5% Annualized
Return and
Actual Expenses)
6/30/19 | | | Expenses
Paid
During
Period1 | | | Net Expense
Ratio
During
Period2 |
| | | | | | |
| Initial Class Shares | | $ | 1,000.00 | | | $ | 1,156.10 | | | $ | 0.11 | | | $ | 1,024.70 | | | $ | 0.10 | | | 0.02% |
| | | | | | |
| Service Class Shares | | $ | 1,000.00 | | | $ | 1,154.70 | | | $ | 1.44 | | | $ | 1,023.46 | | | $ | 1.35 | | | 0.27% |
| 1. | Expenses are equal to the Portfolio’s annualized expense ratio of each class multiplied by the average account value over the period, divided by 365 and multiplied by 181 (to reflect the six-month period). The table above represents the actual expenses incurred during the six-month period. In addition to the fees and expenses which the Portfolio bears directly, it also indirectly bears a pro rata share of the fees and expenses of the Underlying Portfolios/Funds in which it invests. Such indirect expenses are not included in the above-reported expense figures. |
| 2. | Expenses are equal to the Portfolio’s annualized expense ratio to reflect the six-month period. |
| | |
| 42 | | MainStay VP Growth Allocation Portfolio |
Investment Objectives of Underlying Portfolios/Funds as of June 30, 2019(Unaudited)
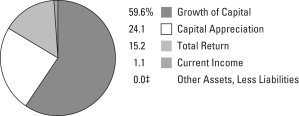
See Portfolio of Investments beginning on page 46 for specific holdings within these categories. The Portfolio’s holdings are subject to change.
| ‡ | Less than one-tenth of a percent. |
Portfolio Management Discussion and Analysis(Unaudited)
Answers to the questions reflect the views of portfolio managers Jae S. Yoon, CFA, Jonathan Swaney, Poul Kristensen, CFA, and Amit Soni, CFA, of New York Life Investments,1 the Portfolio’s Manager.
How did MainStay VP Growth Allocation Portfolio perform relative to its benchmarks and peers during the six months ended June 30, 2019?
For the six months ended June 30, 2019, MainStay VP Growth Allocation Portfolio returned 15.61% for Initial Class shares and 15.47% for Service Class shares. Over the same period, both share classes underperformed the 18.54% return of the S&P 500® Index, which is the Portfolio’s primary benchmark, but outperformed the 14.03% return of the MSCI EAFE® Index, which is a secondary benchmark of the Portfolio. For the six months ended June 30, 2019, both share classes underperformed the 17.40% return of the Growth Allocation Composite Index, which is an additional benchmark of the Portfolio. Over the same period, both share classes underperformed the 15.80% return of the Morningstar Allocation—85%+ Equity Category Average.2
What factors affected the Portfolio’s relative performance during the reporting period?
The Portfolio is a “fund of funds,” meaning that it seeks to achieve its investment objective by investing primarily in mutual funds and exchange-traded funds (“ETFs”) managed by New York Life Investments or its affiliates (the “Underlying Portfolios/Funds”). The Underlying Portfolios/Funds may invest in U.S. equities, international equities, and fixed-income instruments, making comparisons to any single index generally less suitable than a weighted combination of indices, which is a more useful yardstick by which to measure performance. The most influential factor affecting relative performance for the Portfolio versus the performance of a weighted combination of indices is the net performance of the Underlying Portfolios/Funds themselves relative to their respective benchmarks. This reporting period again proved to be challenging for the Underlying Portfolios/Funds, some of which detracted materially from active returns. Prominent examples of Underlying Portfolios/Funds that struggled to meet their objectives included the MainStay MacKay VP Small Cap Core Portfolio, the MainStay MacKay US Equity Opportunities Fund, the IQ Chaikin US Small Cap ETF and the IQ ARB Global Resources ETF.
Asset class policy provided a modest drag to the Portfolio’s relative performance. While a preference for large company stocks over those of smaller firms was well rewarded, returns were undermined by the Portfolio’s tilt toward value-oriented over growth-oriented securities. This position reflecting our belief that value-oriented stocks would benefit disproportionately from policy stimulus, while growth would be restrained by new regulations. Performance also suffered from the Portfolio’s emphasis on emerging markets over developed
international markets, which we implemented in the expectation that the developing world would benefit broadly from Chinese government economic intervention.
How did you allocate the Portfolio’s assets during the reporting period and why?
The Portfolio’s management considers a variety of factors in allocating the assets, including the portfolio-level characteristics of the Underlying Portfolios/Funds (such as capitalization, style biases and sector exposures) and the attributes of the individual holdings within those funds (valuation metrics, earnings data and technical indicators). Generally, we seek to invest in funds that correspond well to our desired asset class exposures, which is to say that they occupy attractively valued segments of the market and appear positioned to benefit from the current economic environment.
We believed that, in light of aggressive government actions, Chinese economic reacceleration was likely to continue, and that the impact would be felt as a tailwind for most emerging markets. In response, we allocated a relatively large percentage of the Portfolio’s assets to stocks of developing nations over those of the developed world. However, during the reporting period the Chinese economy remained more sluggish than we anticipated. Second, the Portfolio allocated assets disproportionately across the capitalization spectrum and by industry. Whereas we had previously positioned the Portfolio to favor small companies over larger multinationals that we believed were less likely to benefit from tax reform and industry deregulation, we later reversed that position. As the reporting period progressed, we saw comparatively weak earnings trends within thesmall-cap universe, with a disconcerting number of firms producing negative earnings. We also anticipated thatsmall-cap companies might prove more vulnerable to rising interest rates than large companies that have locked in lower rates by issuing long maturity bonds. Third, in 2018 we introduced a value bias to the Portfolio, driven primarily by concerns regarding potential developments in litigation, regulation and competition in the information technology, energy and financials sectors. During the reporting period, that bias detracted from performance as growth companies continued to lead the market higher.
How did the Portfolio’s allocations change over the course of the reporting period?
We made the Portfolio’s bias toward value-oriented equities a little less pronounced by increasing allocations to the MainStay VP Large Cap Growth Portfolio and the MainStay VP MacKay Growth Equity Portfolio. We also lowered exposure to the
| 1. | “New York Life Investments” is a service mark used by New York Life Investment Management Holdings LLC and its subsidiary New York Life Investment Management LLC. |
| 2. | See page 41 for more information on benchmark and peer group returns. |
| | |
| 44 | | MainStay VP Growth Allocation Portfolio |
MainStay Cushing Renaissance Advantage Fund and the MainStay Cushing MLP Premier Fund as energy assets failed to respond to rising crude oil prices to the degree we anticipated.
During the reporting period, the MainStay VP Epoch U.S. Small Cap Portfolio merged into the MainStay VP MacKay Small Cap Core Portfolio; the Portfolio maintained its position through the merger. In another merger, MainStay Epoch Global Choice Fund merged into the MainStay Epoch Capital Growth Fund. In that instance, the Portfolio exited its position prior to the merger date. A new Underlying Fund was also added during the reporting period: the IQ International 500 ETF.
Which Underlying Equity Portfolios/Funds had the highest total returns during the reporting period, and which Underlying Equity Portfolios/Funds had the lowest total returns?
Of the Underlying Equity Portfolios/Funds held for the full reporting period, the highest total returns came from the MainStay VP Large Cap Growth Portfolio, the MainStay Epoch
U.S. All Cap Fund and the MainStay VP Eagle Small Cap Growth Portfolio. At the other end of the spectrum, the IQ Global Resources ETF, the IQ 500 International ETF and the MainStay MacKay International Opportunities Fund produced the lowest total returns.
Which Underlying Equity Portfolios/Funds made the strongest positive contributions to the Portfolio’s overall performance, and which Underlying Equity Portfolios/Funds were the greatest detractors?
Among the Underlying Equity Portfolios/Funds making the most significant contributions to the Portfolio’s equity returns were the MainStay Epoch U.S. All Cap Fund, the MainStay VP T. Rowe Price Equity Income Portfolio and the MainStay VP Large Cap Growth Portfolio. (Contributions take weightings and total returns into account.) Detractors from the Portfolio’s equity performance included the MainStay Epoch U.S. Equity Yield Fund, the MainStay VP S&P 500 Fund and the IQ 500 International ETF, though all generated positive returns.
The opinions expressed are those of the portfolio managers as of the date of this report and are subject to change. There is no guarantee that any forecasts will come to pass. This material does not constitute investment advice and is not intended as an endorsement of any specific investment.
Not all MainStay VP Portfolios and/or share classes are available under all policies.
Portfolio of InvestmentsJune 30, 2019 (Unaudited)
| | | | | | | | |
| | |
| | | Shares | | | Value | |
| Affiliated Investment Companies 98.9%† | |
Equity Funds 98.9% | |
IQ 50 Percent Hedged FTSE International ETF (a) | | | 1,425,717 | | | $ | 29,027,598 | |
IQ 500 International ETF (a) | | | 1,108,972 | | | | 29,748,396 | |
IQ Chaikin U.S. Large Cap ETF (a) | | | 2,387,617 | | | | 58,711,502 | |
IQ Chaikin U.S. Small Cap ETF (a) | | | 1,099,384 | | | | 27,330,686 | |
IQ Global Resources ETF (a) | | | 768,228 | | | | 20,972,624 | |
MainStay Cushing MLP Premier Fund Class I | | | 238,722 | | | | 2,652,202 | |
MainStay Epoch Capital Growth Fund Class I (a)(b) | | | 796,609 | | | | 10,188,634 | |
MainStay Epoch International Choice Fund Class I (a) | | | 1,724,000 | | | | 60,943,391 | |
MainStay Epoch U.S. All Cap Fund Class R6 (a) | | | 2,738,613 | | | | 77,776,602 | |
MainStay Epoch U.S. Equity Yield Fund Class R6 | | | 14,829 | | | | 246,601 | |
MainStay MacKay International Opportunities Fund Class I (a) | | | 5,579,135 | | | | 43,349,882 | |
MainStay MacKay U.S. Equity Opportunities Fund Class I (a) | | | 6,282,917 | | | | 52,964,993 | |
MainStay MAP Equity Fund Class I (a) | | | 1,822,703 | | | | 76,079,617 | |
MainStay VP Cushing Renaissance Advantage Portfolio Initial Class (a) | | | 1,020,699 | | | | 8,839,263 | |
MainStay VP Eagle Small Cap Growth Portfolio Initial Class (a) | | | 2,294,690 | | | | 33,465,144 | |
MainStay VP Emerging Markets Equity Portfolio Initial Class (a) | | | 8,577,927 | | | | 76,909,157 | |
MainStay VP Epoch U.S. Equity Yield Portfolio Initial Class (a) | | | 4,254,161 | | | | 68,242,130 | |
MainStay VP Large Cap Growth Portfolio Initial Class (a) | | | 2,680,606 | | | | 71,362,694 | |
MainStay VP MacKay Common Stock Portfolio Initial Class (a) | | | 1,402,466 | | | | 40,751,762 | |
MainStay VP MacKay Growth Portfolio Initial Class (a) | | | 2,192,005 | | | | 71,183,693 | |
MainStay VP MacKay International Equity Portfolio Initial Class (a) | | | 1,019,239 | | | | 17,211,402 | |
MainStay VP MacKay Mid Cap Core Portfolio Initial Class (a) | | | 4,101,836 | | | | 56,553,362 | |
MainStay VP MacKay S&P 500 Index Portfolio Initial Class | | | 25,348 | | | | 1,444,428 | |
MainStay VP MacKay Small Cap Core Portfolio Initial Class (a) | | | 5,385,646 | | | | 59,132,314 | |
MainStay VP T. Rowe Price Equity Income Portfolio Initial Class (a) | | | 6,976,290 | | | | 91,954,973 | |
| | | | | | | | |
Total Affiliated Investment Companies
(Cost $1,056,019,000) | | | | | | | 1,087,043,050 | |
| | | | | | | | |
| | | | | | | | |
| | |
| | | Shares | | | Value | |
| Short-Term Investment 1.1% | |
Affiliated Investment Company 1.1% | |
MainStay U.S. Government Liquidity Fund, 2.03% (c) | | | 11,917,204 | | | $ | 11,917,204 | |
| | | | | | | | |
TotalShort-Term Investment
(Cost $11,917,204) | | | | | | | 11,917,204 | |
| | | | | | | | |
Total Investments
(Cost $1,067,936,204) | | | 100.0 | % | | | 1,098,960,254 | |
Other Assets, Less Liabilities | | | (0.0 | )‡ | | | (400,648 | ) |
Net Assets | | | 100.0 | % | | $ | 1,098,559,606 | |
| † | Percentages indicated are based on Portfolio net assets. |
| ‡ | Less than one-tenth of a percent. |
| (a) | As of June 30, 2019, the Portfolio’s ownership exceeds 5% of the outstanding shares of the Underlying Portfolio’s/Fund’s share class. |
| (b) | Non-income producing Underlying Portfolio/Fund. |
| (c) | Current yield as of June 30, 2019. |
The following abbreviations are used in the preceding pages:
ETF—Exchange-Traded Fund
FTSE—Financial Times Stock Exchange
MLP—Master limited partnership
| | | | |
| 46 | | MainStay VP Growth Allocation Portfolio | | The notes to the financial statements are an integral part of,
and should be read in conjunction with, the financial statements. |
The following is a summary of the fair valuations according to the inputs used as of June 30, 2019, for valuing the Portfolio’s assets:
| | | | | | | | | | | | | | | | |
Description | | Quoted
Prices in
Active
Markets for
Identical
Assets
(Level 1) | | | Significant
Other
Observable
Inputs
(Level 2) | | | Significant
Unobservable
Inputs
(Level 3) | | | Total | |
| | | | |
Asset Valuation Inputs | | | | | | | | | | | | | | | | |
| Investments (a) | | | | | | | | | | | | | | | | |
| Affiliated Investment Companies | | | | | | | | | | | | | | | | |
Equity Funds | | $ | 1,087,043,050 | | | $ | — | | | $ | — | | | $ | 1,087,043,050 | |
Short-Term Investment | | | 11,917,204 | | | | — | | | | — | | | | 11,917,204 | |
| | | | | | | | | | | | | | | | |
| Total Investments in Securities | | $ | 1,098,960,254 | | | $ | — | | | $ | — | | | $ | 1,098,960,254 | |
| | | | | | | | | | | | | | | | |
| (a) | For a complete listing of investments, see the Portfolio of Investments. |
| | | | | | |
The notes to the financial statements are an integral part of,
and should be read in conjunction with, the financial statements. | | | | | 47 | |
Statement of Assets and Liabilitiesas of June 30, 2019 (Unaudited)
| | | | |
| Assets | |
Investment in affiliated investment companies, at value (identified cost $1,067,936,204) | | $ | 1,098,960,254 | |
Cash | | | 17,784 | |
Receivables: | | | | |
Investment securities sold | | | 435,229 | |
Portfolio shares sold | | | 84,546 | |
Dividends and Interest | | | 5,020 | |
Other assets | | | 5,078 | |
| | | | |
Total assets | | | 1,099,507,911 | |
| | | | |
|
| Liabilities | |
Payables: | | | | |
Portfolio shares redeemed | | | 643,077 | |
NYLIFE Distributors (See Note 3) | | | 205,756 | |
Shareholder communication | | | 43,631 | |
Professional fees | | | 26,413 | |
Investment securities purchased | | | 19,469 | |
Trustees | | | 1,349 | |
Custodian | | | 281 | |
Accrued expenses | | | 8,329 | |
| | | | |
Total liabilities | | | 948,305 | |
| | | | |
Net assets | | $ | 1,098,559,606 | |
| | | | |
| |
| Composition of Net Assets | | | | |
Shares of beneficial interest outstanding (par value of $.001 per share) unlimited number of shares authorized | | $ | 91,509 | |
Additional paid-in capital | | | 1,013,155,675 | |
| | | | |
| | | 1,013,247,184 | |
Total distributable earnings (loss) | | | 85,312,422 | |
| | | | |
Net assets | | $ | 1,098,559,606 | |
| | | | |
| | | | |
Initial Class | | | | |
Net assets applicable to outstanding shares | | $ | 77,290,563 | |
| | | | |
Shares of beneficial interest outstanding | | | 6,370,064 | |
| | | | |
Net asset value per share outstanding | | $ | 12.13 | |
| | | | |
Service Class | | | | |
Net assets applicable to outstanding shares | | $ | 1,021,269,043 | |
| | | | |
Shares of beneficial interest outstanding | | | 85,139,269 | |
| | | | |
Net asset value per share outstanding | | $ | 12.00 | |
| | | | |
| | | | |
| 48 | | MainStay VP Growth Allocation Portfolio | | The notes to the financial statements are an integral part of,
and should be read in conjunction with, the financial statements. |
Statement of Operationsfor the six months ended June 30, 2019 (Unaudited)
| | | | |
| Investment Income (Loss) | |
Income | | | | |
Dividend distributions from affiliated investment companies | | $ | 2,809,751 | |
Interest | | | 86 | |
| | | | |
Total income | | | 2,809,837 | |
| | | | |
Expenses | | | | |
Distribution/Service—Service Class (See Note 3) | | | 1,251,855 | |
Professional fees | | | 47,177 | |
Shareholder communication | | | 44,808 | |
Trustees | | | 13,481 | |
Custodian | | | 8,186 | |
Miscellaneous | | | 15,166 | |
| | | | |
Total expenses | | | 1,380,673 | |
| | | | |
Net investment income (loss) | | | 1,429,164 | |
| | | | |
|
| Realized and Unrealized Gain (Loss) on Investments | |
Net realized gain (loss) on: | | | | |
Affiliated investment company transactions | | | (10,749,922 | ) |
Realized capital gain distributions from affiliated investment companies | | | 4,922,193 | |
| | | | |
Net realized gain (loss) on investments from affiliated and unaffiliated investment companies | | | (5,827,729 | ) |
| | | | |
Net change in unrealized appreciation (depreciation) on investments in affiliated investment companies | | | 157,251,939 | |
| | | | |
Net realized and unrealized gain (loss) on investments | | | 151,424,210 | |
| | | | |
Net increase (decrease) in net assets resulting from operations | | $ | 152,853,374 | |
| | | | |
| | | | | | |
The notes to the financial statements are an integral part of,
and should be read in conjunction with, the financial statements. | | | | | 49 | |
Statements of Changes in Net Assets
for the six months ended June 30, 2019 (Unaudited) and the year ended December 31, 2018
| | | | | | | | |
| | | 2019 | | | 2018 | |
| Increase (Decrease) in Net Assets | |
Operations: | | | | | | | | |
Net investment income (loss) | | $ | 1,429,164 | | | $ | 13,492,831 | |
Net realized gain (loss) on investments and investments from affiliated investment companies | | | (5,827,729 | ) | | | 85,552,189 | |
Net change in unrealized appreciation (depreciation) on investments in affiliated investment companies | | | 157,251,939 | | | | (244,019,650 | ) |
| | | | |
Net increase (decrease) in net assets resulting from operations | | | 152,853,374 | | | | (144,974,630 | ) |
| | | | |
Distributions to shareholders: | | | | | | | | |
Initial Class | | | — | | | | (3,974,409 | ) |
Service Class | | | — | | | | (53,585,629 | ) |
| | | | |
Total distributions to shareholders | | | — | | | | (57,560,038 | ) |
| | | | |
Capital share transactions: | | | | | | | | |
Net proceeds from sale of shares | | | 12,862,016 | | | | 106,056,712 | |
Net asset value of shares issued to shareholders in reinvestment of dividends and distributions | | | — | | | | 57,560,038 | |
Cost of shares redeemed | | | (62,712,080 | ) | | | (116,309,346 | ) |
| | | | |
Increase (decrease) in net assets derived from capital share transactions | | | (49,850,064 | ) | | | 47,307,404 | |
| | | | |
Net increase (decrease) in net assets | | | 103,003,310 | | | | (155,227,264 | ) |
|
| Net Assets | |
Beginning of period | | | 995,556,296 | | | | 1,150,783,560 | |
| | | | |
End of period | | $ | 1,098,559,606 | | | $ | 995,556,296 | |
| | | | |
| | | | |
| 50 | | MainStay VP Growth Allocation Portfolio | | The notes to the financial statements are an integral part of,
and should be read in conjunction with, the financial statements. |
Financial Highlightsselected per share data and ratios
| | | | | | | | | | | | | | | | | | | | | | | | |
| | |
| | | Six months
ended
June 30, | | | Year ended December 31, | |
| | | | | | |
| Initial Class | | 2019* | | | 2018 | | | 2017 | | | 2016 | | | 2015 | | | 2014 | |
| | | | | | |
Net asset value at beginning of period | | $ | 10.50 | | | $ | 12.65 | | | $ | 10.60 | | | $ | 10.63 | | | $ | 12.12 | | | $ | 12.51 | |
| | | | | | | | | | | | | | | | | | | | | | | | |
| | | | | | |
Net investment income (loss) (a) | | | 0.03 | | | | 0.18 | | | | 0.12 | | | | 0.12 | | | | 0.10 | | | | 0.18 | |
| | | | | | |
Net realized and unrealized gain (loss) on investments | | | 1.60 | | | | (1.67 | ) | | | 2.26 | | | | 0.68 | | | | (0.49 | ) | | | 0.40 | |
| | | | | | | | | | | | | | | | | | | | | | | | |
| | | | | | |
Total from investment operations | | | 1.63 | | | | (1.49 | ) | | | 2.38 | | | | 0.80 | | | | (0.39 | ) | | | 0.58 | |
| | | | | | | | | | | | | | | | | | | | | | | | |
| | | | | | |
| Less dividends and distributions: | | | | | | | | | | | | | | | | | | | | | | | | |
| | | | | | |
From net investment income | | | — | | | | (0.19 | ) | | | (0.12 | ) | | | (0.17 | ) | | | (0.22 | ) | | | (0.17 | ) |
| | | | | | |
From net realized gain on investments | | | — | | | | (0.47 | ) | | | (0.21 | ) | | | (0.66 | ) | | | (0.88 | ) | | | (0.80 | ) |
| | | | | | | | | | | | | | | | | | | | | | | | |
| | | | | | |
Total dividends and distributions | | | — | | | | (0.66 | ) | | | (0.33 | ) | | | (0.83 | ) | | | (1.10 | ) | | | (0.97 | ) |
| | | | | | | | | | | | | | | | | | | | | | | | |
| | | | | | |
Net asset value at end of period | | $ | 12.13 | | | $ | 10.50 | | | $ | 12.65 | | | $ | 10.60 | | | $ | 10.63 | | | $ | 12.12 | |
| | | | | | | | | | | | | | | | | | | | | | | | |
| | | | | | |
Total investment return (b) | | | 15.52 | %(c) | | | (12.78 | %) | | | 22.67 | % | | | 7.59 | % | | | (3.13 | %) | | | 4.88 | % |
| | | | | | |
| Ratios (to average net assets)/Supplemental Data: | | | | | | | | | | | | | | | | | | | | | | | | |
| | | | | | |
Net investment income (loss) | | | 0.51 | %†† | | | 1.42 | % | | | 1.05 | % | | | 1.19 | % | | | 0.85 | % | | | 1.43 | % |
| | | | | | |
Net expenses (d) | | | 0.02 | %†† | | | 0.02 | % | | | 0.02 | % | | | 0.03 | % | | | 0.03 | % | | | 0.03 | % |
| | | | | | |
Portfolio turnover rate | | | 14 | % | | | 28 | % | | | 26 | % | | | 21 | % | | | 29 | % | | | 27 | % |
| | | | | | |
Net assets at end of period (in 000’s) | | $ | 77,291 | | | $ | 66,326 | | | $ | 76,504 | | | $ | 60,070 | | | $ | 51,447 | | | $ | 48,088 | |
| (a) | Per share data based on average shares outstanding during the period. |
| (b) | Total return does not reflect any deduction of sales charges, mortality and expense charges, contract charges or administrative charges. For periods of less than one year, total return is not annualized. |
| (c) | Total investment return may reflect adjustments to conform to generally accepted accounting principles. |
| (d) | In addition to the fees and expenses which the Portfolio bears directly, it also indirectly bears a pro-rata share of the fees and expenses of the underlying funds in which it invests. Such indirect expenses are not included in the above expense ratios. |
| | | | | | | | | | | | | | | | | | | | | | | | |
| | |
| | | Six months
ended
June 30, | | | Year ended December 31, | |
| | | | | | |
| Service Class | | 2019* | | | 2018 | | | 2017 | | | 2016 | | | 2015 | | | 2014 | |
| | | | | | |
Net asset value at beginning of period | | $ | 10.39 | | | $ | 12.53 | | | $ | 10.51 | | | $ | 10.55 | | | $ | 12.05 | | | $ | 12.45 | |
| | | | | | | | | | | | | | | | | | | | | | | | |
| | | | | | |
Net investment income (loss) (a) | | | 0.01 | | | | 0.14 | | | | 0.09 | | | | 0.10 | | | | 0.08 | | | | 0.13 | |
| | | | | | |
Net realized and unrealized gain (loss) on investments | | | 1.60 | | | | (1.65 | ) | | | 2.24 | | | | 0.66 | | | | (0.50 | ) | | | 0.42 | |
| | | | | | | | | | | | | | | | | | | | | | | | |
| | | | | | |
Total from investment operations | | | 1.61 | | | | (1.51 | ) | | | 2.33 | | | | 0.76 | | | | (0.42 | ) | | | 0.55 | |
| | | | | | | | | | | | | | | | | | | | | | | | |
| | | | | | |
| Less dividends and distributions: | | | | | | | | | | | | | | | | | | | | | | | | |
| | | | | | |
From net investment income | | | — | | | | (0.16 | ) | | | (0.10 | ) | | | (0.14 | ) | | | (0.20 | ) | | | (0.15 | ) |
| | | | | | |
From net realized gain on investments | | | — | | | | (0.47 | ) | | | (0.21 | ) | | | (0.66 | ) | | | (0.88 | ) | | | (0.80 | ) |
| | | | | | | | | | | | | | | | | | | | | | | | |
| | | | | | |
Total dividends and distributions | | | — | | | | (0.63 | ) | | | (0.31 | ) | | | (0.80 | ) | | | (1.08 | ) | | | (0.95 | ) |
| | | | | | | | | | | | | | | | | | | | | | | | |
| | | | | | |
Net asset value at end of period | | $ | 12.00 | | | $ | 10.39 | | | $ | 12.53 | | | $ | 10.51 | | | $ | 10.55 | | | $ | 12.05 | |
| | | | | | | | | | | | | | | | | | | | | | | | |
| | | | | | |
Total investment return (b) | | | 15.50 | %(c) | | | (12.99 | %) | | | 22.36 | % | | | 7.32 | % | | | (3.37 | %) | | | 4.62 | % |
| | | | | | |
| Ratios (to average net assets)/Supplemental Data: | | | | | | | | | | | | | | | | | | | | | | | | |
| | | | | | |
Net investment income (loss) | | | 0.25 | %†† | | | 1.16 | % | | | 0.81 | % | | | 0.95 | % | | | 0.65 | % | | | 1.03 | % |
| | | | | | |
Net expenses (d) | | | 0.27 | %†† | | | 0.27 | % | | | 0.27 | % | | | 0.28 | % | | | 0.28 | % | | | 0.28 | % |
| | | | | | |
Portfolio turnover rate | | | 14 | % | | | 28 | % | | | 26 | % | | | 21 | % | | | 29 | % | | | 27 | % |
| | | | | | |
Net assets at end of period (in 000’s) | | $ | 1,021,269 | | | $ | 929,230 | | | $ | 1,074,280 | | | $ | 829,780 | | | $ | 684,824 | | | $ | 550,573 | |
| (a) | Per share data based on average shares outstanding during the period. |
| (b) | Total return does not reflect any deduction of sales charges, mortality and expense charges, contract charges or administrative charges. For periods of less than one year, total return is not annualized. |
| (c) | Total investment return may reflect adjustments to conform to generally accepted accounting principles. |
| (d) | In addition to the fees and expenses which the Portfolio bears directly, it also indirectly bears a pro-rata share of the fees and expenses of the underlying funds in which it invests. Such indirect expenses are not included in the above expense ratios. |
| | | | | | |
The notes to the financial statements are an integral part of,
and should be read in conjunction with, the financial statements. | | | | | 51 | |
Notes to Financial Statements(Unaudited)
Note 1–Organization and Business
MainStay VP Funds Trust (the “Fund”) was organized as a Delaware statutory trust on February 1, 2011. The Fund is registered under the Investment Company Act of 1940, as amended (the “1940 Act”), as an open-end management investment company. The Fund is comprised of thirty-one separate series (collectively referred to as the “Portfolios” and each individually referred to as a “Portfolio”). These financial statements and notes relate to the MainStay VP Conservative Allocation Portfolio, MainStay VP Moderate Allocation Portfolio, MainStay VP Moderate Growth Allocation Portfolio and MainStay VP Growth Allocation Portfolio (collectively referred to as the “Allocation Portfolios” and each individually referred to as an “Allocation Portfolio”). Each is a “diversified” portfolio, as that term is defined in the 1940 Act, as interpreted or modified by regulatory authorities having jurisdiction, from time to time.
Shares of the Allocation Portfolios are currently offered to certain separate accounts to fund variable annuity policies and variable universal life insurance policies issued by New York Life Insurance and Annuity Corporation (“NYLIAC”), awholly-owned subsidiary of New York Life Insurance Company (“New York Life”). NYLIAC allocates shares of the Allocation Portfolios to, among others, certain NYLIAC separate accounts. The Separate Accounts are used to fund flexible premium deferred variable annuity contracts and variable life insurance policies.
Each Allocation Portfolio currently offers two classes of shares. Initial Class and Service Class shares commenced operations on February 13, 2006. Shares of the Allocation Portfolios are offered and are redeemed at a price equal to their respective net asset value (“NAVs”) per share. No sales or redemption charge is applicable to the purchase or redemption of the Allocation Portfolios’ shares. Under the terms of the Fund’s multiple class plan adopted pursuant to Rule 18f-3 under the 1940 Act, the classes differ in that, among other things, Service Class shares of the Allocation Portfolios pay a combined distribution and service fee of 0.25% of average daily net assets attributable to Service Class shares of the respective Allocation Portfolios to the Distributor (as defined in Note 3(B)), pursuant to a plan adopted in accordance with Rule 12b-1 under the 1940 Act. Contract owners of variable annuity contracts purchased after June 2, 2003, are permitted to invest only in the Service Class shares.
The investment objective for each Allocation Portfolio is as follows:
TheMainStay VP Conservative Allocation Portfolio seeks current income and, secondarily,long-term growth of capital.
TheMainStay VP Moderate Allocation Portfolio seekslong-term growth of capital and, secondarily, current income.
TheMainStay VP Moderate Growth Allocation Portfolio seekslong-term growth of capital and, secondarily, current income.
TheMainStay VP Growth Allocation Portfolio seekslong-term growth of capital.
Each Allocation Portfolio is a“fund-of-funds,” meaning that each seeks to achieve their investment objectives by investing primarily in mutual funds and exchange-traded funds (“ETFs”) managed by New York Life Investment Management LLC (“New York Life Investments” or “Manager”) or its affiliates (the “Underlying Portfolios/Funds”).
Note 2–Significant Accounting Policies
The Allocation Portfolios are investment companies and accordingly follow the investment company accounting and reporting guidance of the Financial Accounting Standards Board (“FASB”) Accounting Standard CodificationTopic 946 Financial Services—Investment Companies. The Allocation Portfolios prepare their financial statements in accordance with generally accepted accounting principles (“GAAP”) in the United States of America and follow the significant accounting policies described below.
(A) Securities Valuation. Investments are usually valued as of the close of regular trading on the New York Stock Exchange (the “Exchange”) (usually 4:00 p.m. Eastern time) on each day the Allocation Portfolios are open for business (“valuation date”).
The Board of Trustees of the Fund (the “Board”) adopted procedures establishing methodologies for the valuation of each Allocation Portfolio’s securities and other assets and delegated the responsibility for valuation determinations under those procedures to the Valuation Committee of the Fund (the “Valuation Committee”). The Board authorized the Valuation Committee to appoint a Valuation Subcommittee (the “Subcommittee”) to deal in the first instance with establishing the prices of securities for which market quotations are not readily available or the prices of which are not otherwise readily determinable under these procedures. The Subcommittee meets (in person, via electronic mail or via teleconference) on an as-needed basis. Subsequently, the Valuation Committee meets to ensure that actions taken by the Subcommittee were appropriate. The procedures state that, subject to the oversight of the Board and unless otherwise noted, the responsibility for theday-to-day valuation of portfolio assets (including fair value measurements for the Allocation Portfolios’ assets and liabilities) rests with New York Life Investments.
To assess the appropriateness of security valuations, the Manager or the Allocation Portfolios’ third-party service provider, who is subject to oversight by the Manager, regularly compares prior day prices, prices on comparable securities, and the sale prices to the prior and current day prices and challenges prices with changes exceeding certain tolerance levels with third-party pricing services or broker sources. For those securities valued through either a standardized fair valuation methodology or a fair valuation measurement, the Subcommittee deals in the first instance with such valuation and the Valuation Committee reviews and affirms, if appropriate, the reasonableness of the valuation based on such methodologies and measurements on a regular basis after considering information that is reasonably available and deemed relevant by the Valuation Committee. Any action taken by the Subcommittee with respect to the valuation of a portfolio security or other asset is submitted for review and ratification (if appropriate) to the Valuation Committee and the Board at the next regularly scheduled meeting.
“Fair value” is defined as the price an Allocation Portfolio would reasonably expect to receive upon selling an asset or liability in an orderly transaction to an independent buyer in the principal or most advantageous market for the asset or liability. Fair value measurements are determined within a framework that establishes a three-tier hierarchy which maximizes the use of observable market data and minimizes the use of unobservable inputs to establish a classification of fair value measurements for disclosure purposes. “Inputs” refer broadly to the
| | |
| 52 | | MainStay VP Allocation Portfolios |
assumptions that market participants would use in pricing the asset or liability, including assumptions about risk, such as the risk inherent in a particular valuation technique used to measure fair value using a pricing model and/or the risk inherent in the inputs for the valuation technique. Inputs may be observable or unobservable. Observable inputs reflect the assumptions market participants would use in pricing the asset or liability based on market data obtained from sources independent of the Allocation Portfolios. Unobservable inputs reflect each Allocation Portfolio’s own assumptions about the assumptions market participants would use in pricing the asset or liability based on the information available. The inputs or methodology used for valuing assets or liabilities may not be an indication of the risks associated with investing in those assets or liabilities. The three-tier hierarchy of inputs is summarized below.
| • | | Level 1—quoted prices in active markets for an identical asset or liability |
| • | | Level 2—other significant observable inputs (including quoted prices for a similar asset or liability in active markets, interest rates and yield curves, prepayment speeds, credit risk, etc.) |
| • | | Level 3—significant unobservable inputs (including each Allocation Portfolio’s own assumptions about the assumptions that market participants would use in measuring fair value of an asset or liability) |
The level of an asset or liability within the fair value hierarchy is based on the lowest level of an input, both individually and in the aggregate, that is significant to the fair value measurement. As of June 30, 2019, the aggregate value by input level of each Allocation Portfolio’s assets and liabilities is included at the end of each Allocation Portfolio’s Portfolio of Investments.
Investments in Underlying Portfolios/Funds are valued at their respective NAVs at the close of business each day, except for investment in ETFs. These securities are generally categorized as Level 1 in the hierarchy.
Securities held by the Underlying Portfolios/Funds are valued using policies consistent with those used by the Underlying Portfolios/Funds. Equity securities, including shares of ETFs, are generally valued at the last quoted sales price as of the close of regular trading on the relevant exchange on each valuation date.
The information above is not intended to reflect an exhaustive list of the methodologies that may be used to value portfolio investments. The valuation procedures permit the use of a variety of valuation methodologies in connection with valuing portfolio investments. The methodology used for a specific type of investment may vary based on the market data available or other considerations. The methodologies summarized above may not represent the specific means by which portfolio investments are valued on any particular business day.
(B) Income Taxes. The Allocation Portfolios’ policy is to comply with the requirements of the Internal Revenue Code of 1986, as amended (the “Internal Revenue Code”), applicable to regulated investment companies and to distribute all of its taxable income to the shareholders of each Allocation Portfolio within the allowable time limits. Therefore, no federal, state and local income tax provisions are required.
Management evaluates each Allocation Portfolio’s tax positions to determine if the tax positions taken meet the minimum recognition threshold in connection with accounting for uncertainties in income tax
positions taken or expected to be taken for the purposes of measuring and recognizing tax liabilities in the financial statements. Recognition of tax benefits of an uncertain tax position is permitted only to the extent the position is “more likely than not” to be sustained assuming examination by taxing authorities. Management has analyzed the Allocation Portfolios’ tax positions taken on federal, state and local income tax returns for all open tax years (for up to three tax years) and has concluded that no provisions for federal, state and local income tax are required in the Allocation Portfolios’ financial statements. The Allocation Portfolios’ federal, state and local income tax and federal excise tax returns for tax years for which the applicable statutes of limitations have not expired are subject to examination by the Internal Revenue Service and state and local departments of revenue.
(C) Dividends and Distributions to Shareholders. Dividends and distributions are recorded on the ex-dividend date. The Allocation Portfolios intend to declare and pay dividends from net investment income and distributions from net realized capital gains, if any, at least annually. Unless the shareholder elects otherwise, all dividends and distributions are reinvested in the same class of shares of the respective Allocation Portfolio, at NAV. Dividends and distributions to shareholders are determined in accordance with federal income tax regulations and may differ from determinations using GAAP.
(D) Security Transactions and Investment Income. The Allocation Portfolios record security transactions on the trade date. Realized gains and losses on security transactions are determined using the identified cost method. Dividends and distributions received by the Allocation Portfolios from the Underlying Portfolios/Funds are recorded on the ex-dividend date.
Investment income and realized and unrealized gains and losses on investments of the Allocation Portfolios are allocated pro rata to the separate classes of shares based upon their relative net assets on the date the income is earned or realized and unrealized gains and losses are incurred.
(E) Expenses. Expenses of the Fund are allocated to the individual Portfolios in proportion to the net assets of the respective Portfolios when the expenses are incurred, except where direct allocations of expenses can be made. Expenses (other than fees incurred under the distribution and service plans, further discussed in Note 3(B), which are charged directly to the Service Class shares) are allocated to separate classes of shares pro rata based upon their relative net assets on the date the expenses are incurred. The expenses borne by the Allocation Portfolios, including those of related parties to the Allocation Portfolios, are shown in the Statement of Operations.
Additionally, the Allocation Portfolios may invest in shares of ETFs and mutual funds, which are subject to management fees and other fees that may cause the costs of investing in ETFs and mutual funds to be greater than the costs of owning the underlying securities directly. These indirect expenses of ETFs and mutual funds are not included in the amounts shown as expenses in each Allocation Portfolio’s Statement of Operations or in the expense ratios included in the financial highlights. In addition, the Allocation Portfolios bear a pro rata share of the fees and expenses of the Underlying Portfolios/Funds in which they invest. Because the Underlying Portfolios/Funds have varied expense and fee levels and the Allocation Portfolios may own different proportions of the Underlying Portfolios/Funds at different times, the
Notes to Financial Statements(Unaudited) (continued)
amount of fees and expenses incurred indirectly by each Allocation Portfolio may vary.
(F) Use of Estimates. In preparing financial statements in conformity with GAAP, management makes estimates and assumptions that affect the reported amounts and disclosures in the financial statements. Actual results could differ from those estimates.
(G) Repurchase Agreements. The Allocation Portfolios may enter into repurchase agreements (i.e., buy a security from another party with the agreement that it be sold back in the future) to earn income. The Allocation Portfolios may enter into repurchase agreements only with counterparties, usually financial institutions, that are deemed by the Manager to be creditworthy, pursuant to guidelines established by the Board. During the term of any repurchase agreement, the Manager will continue to monitor the creditworthiness of the counterparty. Under the 1940 Act, repurchase agreements are considered to be collateralized loans by the Allocation Portfolio to the counterparty secured by the securities transferred to the respective Allocation Portfolio.
Repurchase agreements are subject to counterparty risk, meaning an Allocation Portfolio could lose money by the counterparty’s failure to perform under the terms of the agreement. The Allocation Portfolios mitigate this risk by ensuring the repurchase agreement is collateralized by cash, U.S. government securities, fixed income securities and/or other securities. The collateral is held by the Allocation Portfolios’ custodian and valued daily on a mark to market basis to determine if the value, including accrued interest, exceeds the repurchase price. In the event of the counterparty’s default on the obligation to repurchase, the Allocation Portfolios have the right to liquidate the collateral and apply the proceeds in satisfaction of the obligation. Under certain circumstances, such as in the event of default or bankruptcy by the counterparty, realization and/or retention of the collateral may be limited or subject to delay, to legal proceedings and possible realized loss to the respective Allocation Portfolio. As of June 30, 2019, the Portfolios did not hold any repurchase agreements.
(H) Indemnifications. Under the Fund’s organizational documents, its officers and trustees are indemnified against certain liabilities that may arise out of performance of their duties to the Fund. Additionally, in the normal course of business, the Allocation Portfolios enter into contracts with third-party service providers that contain a variety of representations and warranties and which may provide general indemnifications. The Allocation Portfolios’ maximum exposure under these arrangements is unknown, as this would involve future claims that may be made against the Allocation Portfolios that have not yet occurred. Based on experience, management is of the view that the risk of loss in connection with these potential indemnification obligations is remote. However, there can be no assurance that material liabilities related to such obligations will not arise in the future, which could adversely impact the Allocation Portfolios.
Note 3–Fees and Related Party Transactions
(A) Manager. New York Life Investments, a registered investment adviser and an indirect,wholly-owned subsidiary of New York Life, serves as the Allocation Portfolios’ Manager pursuant to an Amended and Restated Management Agreement (“Management Agreement”) and is responsible for theday-to-day portfolio management of the Allocation
Portfolios. The Manager provides offices, conducts clerical, recordkeeping and bookkeeping services, and keeps most of the financial and accounting records required to be maintained by the Allocation Portfolios. Except for the portion of salaries and expenses that are the responsibility of the Allocation Portfolios, the Manager pays the salaries and expenses of all personnel affiliated with the Allocation Portfolios and certain operational expenses of the Allocation Portfolios. The Allocation Portfolios reimburse New York Life Investments in an amount equal to a portion of the compensation of the Chief Compliance Officer attributable to the Allocation Portfolios.
The Allocation Portfolios do not pay any fees to the Manager in return for the services performed under the Management Agreement. The Allocation Portfolios do, however, indirectly pay a proportionate share of the management fees paid to the managers of the Underlying Portfolios/Funds in which the Allocation Portfolios invest.
State Street Bank and Trust Company (“State Street”) providessub-administration andsub-accounting services to the Allocation Portfolios pursuant to an agreement with New York Life Investments. These services include calculating the daily NAVs of the Allocation Portfolios, maintaining the general ledger andsub-ledger accounts for the calculation of the Allocation Portfolios’ respective NAVs, and assisting New York Life Investments in conducting various aspects of the Allocation Portfolios’ administrative operations. For providing these services to the Allocation Portfolios, State Street is compensated by New York Life Investments.
Pursuant to an agreement between the Fund and New York Life Investments, New York Life Investments is responsible for providing or procuring certain regulatory reporting services for the Allocation Portfolios. The Allocation Portfolios will reimburse New York Life Investments for the actual costs incurred by New York Life Investments in connection with providing or procuring these services for the Allocation Portfolios.
(B) Distribution and Service Fees. The Fund, on behalf of the Allocation Portfolios, has entered into a distribution agreement with NYLIFE Distributors LLC (the “Distributor”), an indirect,wholly-owned subsidiary of New York Life. The Allocation Portfolios have adopted a distribution plan (the “Plan”) in accordance with the provisions of Rule 12b-1 under the 1940 Act. Under the Plan, the Distributor has agreed to provide, through its affiliates or independent third parties, various distribution-related, shareholder and administrative support services to the Service Class shareholders. For its services, the Distributor is entitled to a combined distribution and service fee accrued daily and paid monthly at an annual rate of 0.25% of the average daily net assets attributable to the Service Class shares of each Allocation Portfolio.
| | |
| 54 | | MainStay VP Allocation Portfolios |
(C) Investments in Affiliates (in 000’s). During the six-month period ended June 30, 2019, purchases and sales transactions, income earned from investments and shares held of investment companies managed by New York Life Investments or its affiliates were as follows:
MainStay VP Conservative Allocation Portfolio
| | | | | | | | | | | | | | | | | | | | | | | | | | | | | | | | | | | | |
Affiliated Investment Companies | | Value,
Beginning of
Period | | | Purchases at
Cost | | | Proceeds
from Sales | | | Net
Realized
Gain/(Loss)
on Sales | | | Change in
Unrealized
Appreciation/
(Depreciation) | | | Value,
End of
Period | | | Dividend
Income | | | Other
Distributions | | | Shares
End of
Period | |
| | | | | | | | | |
IQ 50 Percent Hedged FTSE International ETF | | $ | 25,399 | | | $ | 72 | | | $ | (14,367 | ) | | $ | (1,481 | ) | | $ | 4,165 | | | $ | 13,788 | | | $ | 353 | | | $ | — | | | | 677 | |
IQ 500 International ETF | | | 1,531 | | | | 5,613 | | | | (7,270 | ) | | | 125 | | | | 1 | | | | — | | | | 71 | | | | — | | | | — | |
IQ Chaikin U.S. Large Cap ETF | | | 30,169 | | | | 11,498 | | | | (32,269 | ) | | | (352 | ) | | | 4,146 | | | | 13,192 | | | | 147 | | | | — | | | | 536 | |
IQ Chaikin U.S. Small Cap ETF | | | 10,379 | | | | 149 | | | | (1,192 | ) | | | (120 | ) | | | 1,320 | | | | 10,536 | | | | 95 | | | | — | | | | 424 | |
IQ Enhanced Core Plus Bond U.S. ETF | | | 21,369 | | | | 4,774 | | | | (1,264 | ) | | | (84 | ) | | | 753 | | | | 25,548 | | | | 241 | | | | — | | | | 1,310 | |
IQ Global Resources ETF | | | 6,396 | | | | 27 | | | | (555 | ) | | | 22 | | | | 490 | | | | 6,380 | | | | — | | | | — | | | | 234 | |
IQ S&P High Yield Low Volatility Bond ETF | | | 8,548 | | | | 21 | | | | (380 | ) | | | (15 | ) | | | 681 | | | | 8,855 | | | | 181 | | | | — | | | | 353 | |
MainStay Cushing MLP Premier Fund Class I | | | 4,813 | | | | 114 | | | | (5,664 | ) | | | 194 | | | | 598 | | | | 55 | | | | 114 | | | | — | | | | 5 | |
MainStay Epoch Capital Growth Fund Class I | | | 6,923 | | | | 134 | | | | (626 | ) | | | 110 | | | | 1,227 | | | | 7,768 | | | | — | | | | — | | | | 607 | |
MainStay Epoch Global Choice Fund Class I | | | 8,314 | | | | — | | | | (8,753 | ) | | | (755 | ) | | | 1,194 | | | | — | | | | — | | | | — | | | | — | |
MainStay Epoch International Choice Fund Class I | | | 16,403 | | | | 59 | | | | (4,446 | ) | | | 116 | | | | 2,117 | | | | 14,249 | | | | — | | | | — | | | | 403 | |
MainStay Epoch U.S. All Cap Fund Class R6 | | | 11,653 | | | | 2,041 | | | | (1,704 | ) | | | 100 | | | | 2,503 | | | | 14,593 | | | | — | | | | — | | | | 514 | |
MainStay Epoch U.S. Equity Yield Fund Class R6 | | | 860 | | | | 9 | | | | (172 | ) | | | (8 | ) | | | 106 | | | | 795 | | | | 10 | | | | — | | | | 48 | |
MainStay MacKay High Yield Municipal Bond Fund Class I | | | 11,989 | | | | 289 | | | | (654 | ) | | | 13 | | | | 467 | | | | 12,104 | | | | 230 | | | | — | | | | 940 | |
MainStay MacKay International Opportunities Fund Class I | | | 13,950 | | | | 76 | | | | (6,776 | ) | | | (1,658 | ) | | | 2,931 | | | | 8,523 | | | | — | | | | — | | | | 1,097 | |
MainStay MacKay Short Duration High Yield Fund Class I | | | 15,786 | | | | 18,592 | | | | (988 | ) | | | 0 | (a) | | | 721 | | | | 34,111 | | | | 577 | | | | — | | | | 3,453 | |
MainStay MacKay Short Term Municipal Fund Class I | | | 9,836 | | | | 2,251 | | | | (256 | ) | | | 1 | | | | 79 | | | | 11,911 | | | | 96 | | | | — | | | | 1,238 | |
MainStay MacKay Total Return Bond Fund Class R6 | | | 0 | (a) | | | 0 | (a) | | | (0 | )(a) | | | 0 | (a) | | | 0 | (a) | | | 0 | (a) | | | 0 | (a) | | | — | | | | — | |
MainStay MacKay U.S. Equity Opportunities Fund Class I | | | 11,991 | | | | 153 | | | | (1,522 | ) | | | (67 | ) | | | 1,652 | | | | 12,207 | | | | — | | | | — | | | | 1,448 | |
MainStay MAP Equity Fund Class I | | | 12,621 | | | | 8,049 | | | | (2,527 | ) | | | 188 | | | | 2,437 | | | | 20,768 | | | | — | | | | — | | | | 498 | |
MainStay U.S. Government Liquidity Fund | | | — | | | | 85,667 | | | | (60,565 | ) | | | — | | | | — | | | | 25,102 | | | | 244 | | | | — | | | | 25,102 | |
MainStay VP Bond Portfolio Initial Class | | | 16,614 | | | | 22,347 | | | | (2,115 | ) | | | 25 | | | | 1,834 | | | | 38,705 | | | | — | | | | — | | | | 2,648 | |
MainStay VP Cushing Renaissance Advantage Portfolio Initial Class | | | 13,919 | | | | 190 | | | | (15,995 | ) | | | (841 | ) | | | 2,912 | | | | 185 | | | | — | | | | — | | | | 21 | |
MainStay VP Eagle Small Cap Growth Portfolio Initial Class | | | 9,899 | | | | 155 | | | | (1,768 | ) | | | 356 | | | | 1,518 | | | | 10,160 | | | | — | | | | — | | | | 697 | |
MainStay VP Emerging Markets Equity Portfolio Initial Class | | | 34,558 | | | | 309 | | | | (13,128 | ) | | | 305 | | | | 3,397 | | | | 25,441 | | | | — | | | | — | | | | 2,838 | |
MainStay VP Epoch U.S. Equity Yield Portfolio Initial Class | | | 13,529 | | | | 1,675 | | | | (1,377 | ) | | | 94 | | | | 1,947 | | | | 15,868 | | | | — | | | | — | | | | 989 | |
MainStay VP Epoch U.S. Small Cap Portfolio Initial Class(b) | | | 13,871 | | | | 1,949 | | | | (17,791 | ) | | | 92 | | | | 1,879 | | | | — | | | | 122 | | | | 1,708 | | | | — | |
Notes to Financial Statements(Unaudited) (continued)
MainStay VP Conservative Allocation Portfolio (continued)
| | | | | | | | | | | | | | | | | | | | | | | | | | | | | | | | | | | | |
Affiliated Investment Companies | | Value,
Beginning of
Period | | | Purchases at
Cost | | | Proceeds
from Sales | | | Net
Realized
Gain/(Loss)
on Sales | | | Change in
Unrealized
Appreciation/
(Depreciation) | | | Value,
End of
Period | | | Dividend
Income | | | Other
Distributions | | | Shares
End of
Period | |
MainStay VP Floating Rate Portfolio Initial Class | | $ | 36,304 | | | $ | 7,671 | | | $ | (1,169 | ) | | $ | (24 | ) | | $ | 1,038 | | | $ | 43,820 | | | $ | 1,022 | | | $ | — | | | | 4,929 | |
MainStay VP Indexed Bond Portfolio Initial Class | | | 237,874 | | | | 2,092 | | | | (43,304 | ) | | | (85 | ) | | | 12,917 | | | | 209,494 | | | | — | | | | — | | | | 20,162 | |
MainStay VP Large Cap Growth Portfolio Initial Class | | | 7,988 | | | | 7,814 | | | | (1,623 | ) | | | 410 | | | | 1,783 | | | | 16,372 | | | | — | | | | — | | | | 615 | |
MainStay VP MacKay Common Stock Portfolio Initial Class | | | 4,184 | | | | 5,092 | | | | (582 | ) | | | (56 | ) | | | 885 | | | | 9,523 | | | | — | | | | — | | | | 328 | |
MainStay VP MacKay Convertible Portfolio Initial Class | | | 7,269 | | | | 60 | | | | (412 | ) | | | 31 | | | | 1,067 | | | �� | 8,015 | | | | 60 | | | | — | | | | 564 | |
MainStay VP MacKay Growth Portfolio Initial Class | | | 7,209 | | | | 8,451 | | | | (1,405 | ) | | | 313 | | | | 1,299 | | | | 15,867 | | | | — | | | | — | | | | 489 | |
MainStay VP MacKay High Yield Corporate Bond Portfolio Initial Class | | | 12,850 | | | | 17 | | | | (675 | ) | | | 58 | | | | 1,060 | | | | 13,310 | | | | — | | | | — | | | | 1,313 | |
MainStay VP MacKay International Equity Portfolio Initial Class | | | 73 | | | | 2,636 | | | | (193 | ) | | | 15 | | | | 237 | | | | 2,768 | | | | — | | | | — | | | | 164 | |
MainStay VP MacKay Mid Cap Core Portfolio Initial Class | | | 21,931 | | | | 134 | | | | (2,932 | ) | | | 78 | | | | 3,211 | | | | 22,422 | | | | — | | | | — | | | | 1,626 | |
MainStay VP MacKay S&P 500 Index Portfolio Initial Class | | | 3,054 | | | | — | | | | (430 | ) | | | (9 | ) | | | 542 | | | | 3,157 | | | | — | | | | — | | | | 55 | |
MainStay VP MacKay Small Cap Core Portfolio Initial Class | | | 11,841 | | | | 16,508 | | | | (4,681 | ) | | | (206 | ) | | | (352 | ) | | | 23,110 | | | | — | | | | — | | | | 2,105 | |
MainStay VP MacKay Unconstrained Bond Portfolio Initial Class | | | 14,943 | | | | 305 | | | | (2,852 | ) | | | 14 | | | | 364 | | | | 12,774 | | | | 296 | | | | — | | | | 1,298 | |
MainStay VP PIMCO Real Return Portfolio Initial Class | | | 7,434 | | | | 9 | | | | (352 | ) | | | (20 | ) | | | 502 | | | | 7,573 | | | | — | | | | — | | | | 867 | |
MainStay VP T. Rowe Price Equity Income Portfolio Initial Class | | | 21,730 | | | | 561 | | | | (2,740 | ) | | | 2 | | | | 3,320 | | | | 22,873 | | | | — | | | | — | | | | 1,735 | |
| | | | | | | | |
| | $ | 726,004 | | | $ | 217,563 | | | $ | (267,474 | ) | | $ | (3,119 | ) | | $ | 68,948 | | | $ | 741,922 | | | $ | 3,859 | | | $ | 1,708 | | | | | |
| | | | | | | | |
MainStay VP Moderate Allocation Portfolio
| | | | | | | | | | | | | | | | | | | | | | | | | | | | | | | | | | | | |
Affiliated Investment Companies | | Value,
Beginning of
Period | | | Purchases at
Cost | | | Proceeds
from Sales | | | Net
Realized
Gain/(Loss)
on Sales | | | Change in
Unrealized
Appreciation/
(Depreciation) | | | Value,
End of
Period | | | Dividend
Income | | | Other
Distributions | | | Shares
End of
Period | |
| | | | | | | | | |
IQ 50 Percent Hedged FTSE International ETF | | $ | 40,178 | | | $ | 43 | | | $ | (17,944 | ) | | $ | (1,594 | ) | | $ | 6,186 | | | $ | 26,869 | | | $ | 672 | | | $ | — | | | | 1,320 | |
IQ 500 International ETF | | | 1,435 | | | | 12,487 | | | | (11,580 | ) | | | 229 | | | | 21 | | | | 2,592 | | | | 168 | | | | — | | | | 97 | |
IQ Chaikin U.S. Large Cap ETF | | | 49,445 | | | | 33,231 | | | | (51,635 | ) | | | (1,003 | ) | | | 7,682 | | | | 37,720 | | | | 379 | | | | — | | | | 1,534 | |
IQ Chaikin U.S. Small Cap ETF | | | 14,029 | | | | — | | | | (1,517 | ) | | | (138 | ) | | | 1,755 | | | | 14,129 | | | | 129 | | | | — | | | | 568 | |
IQ Enhanced Core Bond U.S. ETF | | | 19,262 | | | | 24,231 | | | | (2,247 | ) | | | 56 | | | | 1,015 | | | | 42,317 | | | | 357 | | | | — | | | | 2,207 | |
IQ Enhanced Core Plus Bond U.S. ETF | | | 6,785 | | | | — | | | | (632 | ) | | | (8 | ) | | | 202 | | | | 6,347 | | | | 72 | | | | — | | | | 326 | |
IQ Global Resources ETF | | | 15,369 | | | | 23 | | | | (738 | ) | | | 36 | | | | 1,215 | | | | 15,905 | | | | — | | | | — | | | | 583 | |
IQ S&P High Yield Low Volatility Bond ETF | | | 4,366 | | | | — | | | | (256 | ) | | | (11 | ) | | | 348 | | | | 4,447 | | | | 92 | | | | — | | | | 177 | |
MainStay Cushing MLP Premier Fund Class I | | | 7,483 | | | | 240 | | | | (5,923 | ) | | | (749 | ) | | | 1,839 | | | | 2,890 | | | | 238 | | | | — | | | | 260 | |
MainStay Epoch Capital Growth Fund Class I | | | 10,195 | | | | 28 | | | | (599 | ) | | | 98 | | | | 1,841 | | | | 11,563 | | | | — | | | | — | | | | 904 | |
| | |
| 56 | | MainStay VP Allocation Portfolios |
MainStay VP Moderate Allocation Portfolio (continued)
| | | | | | | | | | | | | | | | | | | | | | | | | | | | | | | | | | | | |
Affiliated Investment Companies | | Value,
Beginning of
Period | | | Purchases at
Cost | | | Proceeds
from Sales | | | Net
Realized
Gain/(Loss)
on Sales | | | Change in
Unrealized
Appreciation/
(Depreciation) | | | Value,
End of
Period | | | Dividend
Income | | | Other
Distributions | | | Shares
End of
Period | |
MainStay Epoch Global Choice Fund Class I | | $ | 14,811 | | | $ | — | | | $ | (15,620 | ) | | $ | (1,693 | ) | | $ | 2,502 | | | $ | — | | | $ | — | | | $ | — | | | | — | |
MainStay Epoch International Choice Fund Class I | | | 45,385 | | | | 58 | | | | (10,411 | ) | | | (543 | ) | | | 6,796 | | | | 41,285 | | | | — | | | | — | | | | 1,168 | |
MainStay Epoch U.S. All Cap Fund Class R6 | | | 41,173 | | | | 134 | | | | (5,479 | ) | | | (136 | ) | | | 8,502 | | | | 44,194 | | | | — | | | | — | | | | 1,556 | |
MainStay Epoch U.S. Equity Yield Fund Class R6 | | | 2,770 | | | | 38 | | | | (101 | ) | | | 7 | | | | 354 | | | | 3,068 | | | | 38 | | | | — | | | | 184 | |
MainStay MacKay High Yield Municipal Bond Fund Class I | | | 19,083 | | | | 614 | | | | (1,722 | ) | | | 38 | | | | 724 | | | | 18,737 | | | | 363 | | | | — | | | | 1,455 | |
MainStay MacKay International Opportunities Fund Class I | | | 42,403 | | | | 50 | | | | (18,551 | ) | | | (2,438 | ) | | | 6,441 | | | | 27,905 | | | | — | | | | — | | | | 3,591 | |
MainStay MacKay Short Duration High Yield Fund Class I | | | 24,633 | | | | 30,268 | | | | (2,557 | ) | | | (59 | ) | | | 1,186 | | | | 53,471 | | | | 909 | | | | — | | | | 5,412 | |
MainStay MacKay Short Term Municipal Fund Class I | | | 15,039 | | | | 6,330 | | | | (822 | ) | | | 4 | | | | 124 | | | | 20,675 | | | | 152 | | | | — | | | | 2,149 | |
MainStay MacKay Total Return Bond Fund Class R6 | | | 1,198 | | | | 18 | | | | (68 | ) | | | (1 | ) | | | 59 | | | | 1,206 | | | | 18 | | | | — | | | | 113 | |
MainStay MacKay U.S. Equity Opportunities Fund Class I | | | 38,297 | | | | 111 | | | | (4,340 | ) | | | (191 | ) | | | 5,314 | | | | 39,191 | | | | — | | | | — | | | | 4,649 | |
MainStay MAP Equity Fund Class I | | | 42,699 | | | | 9,464 | | | | (6,110 | ) | | | (862 | ) | | | 8,576 | | | | 53,767 | | | | — | | | | — | | | | 1,288 | |
MainStay U.S. Government Liquidity Fund | | | 12,668 | | | | 115,272 | | | | (88,129 | ) | | | — | | | | — | | | | 39,811 | | | | 395 | | | | — | | | | 39,811 | |
MainStay VP Bond Portfolio Initial Class | | | 82,880 | | | | 89 | | | | (7,869 | ) | | | (143 | ) | | | 5,374 | | | | 80,331 | | | | — | | | | — | | | | 5,495 | |
MainStay VP Cushing Renaissance Advantage Portfolio Initial Class | | | 21,424 | | | | 35 | | | | (14,827 | ) | | | (2,271 | ) | | | 5,078 | | | | 9,439 | | | | — | | | | — | | | | 1,090 | |
MainStay VP Eagle Small Cap Growth Portfolio Initial Class | | | 14,078 | | | | — | | | | (1,685 | ) | | | 46 | | | | 2,622 | | | | 15,061 | | | | — | | | | — | | | | 1,033 | |
MainStay VP Emerging Markets Equity Portfolio Initial Class | | | 66,782 | | | | 362 | | | | (18,624 | ) | | | 3,048 | | | | 4,454 | | | | 56,022 | | | | — | | | | — | | | | 6,248 | |
MainStay VP Epoch U.S. Equity Yield Portfolio Initial Class | | | 40,445 | | | | 109 | | | | (4,188 | ) | | | 322 | | | | 5,396 | | | | 42,084 | | | | — | | | | — | | | | 2,623 | |
MainStay VP Epoch U.S. Small Cap Portfolio Initial Class(b) | | | 28,248 | | | | 3,198 | | | | (35,707 | ) | | | (326 | ) | | | 4,587 | | | | — | | | | 212 | | | | 2,985 | | | | — | |
MainStay VP Floating Rate Portfolio Initial Class | | | 30,736 | | | | 9,756 | | | | (1,798 | ) | | | (17 | ) | | | 870 | | | | 39,547 | | | | 904 | | | | — | | | | 4,448 | |
MainStay VP Indexed Bond Portfolio Initial Class | | | 123,717 | | | | 118 | | | | (15,809 | ) | | | 240 | | | | 6,609 | | | | 114,875 | | | | — | | | | — | | | | 11,056 | |
MainStay VP Large Cap Growth Portfolio Initial Class | | | 29,530 | | | | 15,102 | | | | (6,434 | ) | | | 1,468 | | | | 6,983 | | | | 46,649 | | | | — | | | | — | | | | 1,752 | |
MainStay VP MacKay Common Stock Portfolio Initial Class | | | 19,290 | | | | 8,338 | | | | (1,922 | ) | | | 4 | | | | 3,147 | | | | 28,857 | | | | — | | | | — | | | | 993 | |
MainStay VP MacKay Convertible Portfolio Initial Class | | | 13,940 | | | | 115 | | | | (673 | ) | | | 46 | | | | 2,054 | | | | 15,482 | | | | 115 | | | | — | | | | 1,090 | |
MainStay VP MacKay Growth Portfolio Initial Class | | | 26,406 | | | | 18,584 | | | | (4,381 | ) | | | 969 | | | | 4,654 | | | | 46,232 | | | | — | | | | — | | | | 1,424 | |
MainStay VP MacKay High Yield Corporate Bond Portfolio Initial Class | | | 5,828 | | | | 16 | | | | (362 | ) | | | 19 | | | | 485 | | | | 5,986 | | | | — | | | | — | | | | 590 | |
Notes to Financial Statements(Unaudited) (continued)
MainStay VP Moderate Allocation Portfolio (continued)
| | | | | | | | | | | | | | | | | | | | | | | | | | | | | | | | | | | | |
Affiliated Investment Companies | | Value,
Beginning of
Period | | | Purchases at
Cost | | | Proceeds
from Sales | | | Net
Realized
Gain/(Loss)
on Sales | | | Change in
Unrealized
Appreciation/
(Depreciation) | | | Value,
End of
Period | | | Dividend
Income | | | Other
Distributions | | | Shares
End of
Period | |
MainStay VP MacKay International Equity Portfolio Initial Class | | $ | 4,593 | | | $ | 33 | | | $ | (185 | ) | | $ | 30 | | | $ | 550 | | | $ | 5,021 | | | $ | — | | | $ | — | | | | 297 | |
MainStay VP MacKay Mid Cap Core Portfolio Initial Class | | | 49,625 | | | | — | | | | (22,474 | ) | | | (3,699 | ) | | | 10,555 | | | | 34,007 | | | | — | | | | — | | | | 2,467 | |
MainStay VP MacKay S&P 500 Index Portfolio Initial Class | | | 3,458 | | | | — | | | | (272 | ) | | | 5 | | | | 625 | | | | 3,816 | | | | — | | | | — | | | | 67 | |
MainStay VP MacKay Small Cap Core Portfolio Initial Class | | | 15,762 | | | | 28,758 | | | | (14,009 | ) | | | (639 | ) | | | (1,378 | ) | | | 28,494 | | | | — | | | | — | | | | 2,595 | |
MainStay VP MacKay Unconstrained Bond Portfolio Initial Class | | | 30,403 | | | | 592 | | | | (6,613 | ) | | | (370 | ) | | | 1,139 | | | | 25,151 | | | | 592 | | | | — | | | | 2,555 | |
MainStay VP PIMCO Real Return Portfolio Initial Class | | | 10,030 | | | | 164 | | | | (735 | ) | | | (31 | ) | | | 693 | | | | 10,121 | | | | — | | | | — | | | | 1,159 | |
MainStay VP T. Rowe Price Equity Income Portfolio Initial Class | | | 56,005 | | | | 131 | | | | (6,601 | ) | | | (862 | ) | | | 9,388 | | | | 58,061 | | | | — | | | | — | | | | 4,405 | |
| | | | | | | | |
| | $ | 1,141,886 | | | $ | 318,140 | | | $ | (412,149 | ) | | $ | (11,119 | ) | | $ | 136,567 | | | $ | 1,173,325 | | | $ | 5,805 | | | $ | 2,985 | | | | | |
| | | | | | | | |
MainStay VP Moderate Growth Allocation Portfolio
| | | | | | | | | | | | | | | | | | | | | | | | | | | | | | | | | | | | |
Affiliated Investment Companies | | Value,
Beginning of
Period | | | Purchases at
Cost | | | Proceeds
from Sales | | | Net
Realized
Gain/(Loss)
on Sales | | | Change in
Unrealized
Appreciation/
(Depreciation) | | | Value,
End of
Period | | | Dividend
Income | | | Other
Distributions | | | Shares
End of
Period | |
| | | | | | | | | |
IQ 50 Percent Hedged FTSE International ETF | | $ | 65,286 | | | $ | 264 | | | $ | (22,455 | ) | | $ | (1,730 | ) | | $ | 9,460 | | | $ | 50,825 | | | $ | 1,265 | | | $ | — | | | | 2,496 | |
IQ 500 International ETF | | | 11,649 | | | | 21,986 | | | | (20,200 | ) | | | 1,024 | | | | 211 | | | | 14,670 | | | | 489 | | | | — | | | | 547 | |
IQ Chaikin U.S. Large Cap ETF | | | 84,880 | | | | 64,144 | | | | (86,530 | ) | | | (2,108 | ) | | | 13,876 | | | | 74,262 | | | | 721 | | | | — | | | | 3,020 | |
IQ Chaikin U.S. Small Cap ETF | | | 33,168 | | | | — | | | | (2,858 | ) | | | (32 | ) | | | 3,866 | | | | 34,144 | | | | 310 | | | | — | | | | 1,373 | |
IQ Enhanced Core Plus Bond U.S. ETF | | | 18,942 | | | | — | | | | (1,880 | ) | | | 18 | | | | 529 | | | | 17,609 | | | | 207 | | | | — | | | | 903 | |
IQ Global Resources ETF | | | 35,691 | | | | 67 | | | | (896 | ) | | | 37 | | | | 2,873 | | | | 37,772 | | | | — | | | | — | | | | 1,384 | |
IQ S&P High Yield Low Volatility Bond ETF | | | 1,940 | | | | 97 | | | | (185 | ) | | | (12 | ) | | | 158 | | | | 1,998 | | | | 39 | | | | — | | | | 80 | |
MainStay Cushing MLP Premier Fund Class I | | | 12,812 | | | | 409 | | | | (10,149 | ) | | | (2,211 | ) | | | 4,061 | | | | 4,922 | | | | 409 | | | | — | | | | 443 | |
MainStay Epoch Capital Growth Fund Class I | | | 17,773 | | | | 40 | | | | (680 | ) | | | 107 | | | | 3,280 | | | | 20,520 | | | | — | | | | — | | | | 1,604 | |
MainStay Epoch Global Choice Fund Class I | | | 19,455 | | | | — | | | | (20,521 | ) | | | (2,082 | ) | | | 3,148 | | | | — | | | | — | | | | — | | | | — | |
MainStay Epoch International Choice Fund Class I | | | 99,019 | | | | — | | | | (17,787 | ) | | | (339 | ) | | | 14,415 | | | | 95,308 | | | | — | | | | — | | | | 2,696 | |
MainStay Epoch U.S. All Cap Fund Class R6 | | | 108,406 | | | | 19 | | | | (14,063 | ) | | | (906 | ) | | | 23,006 | | | | 116,462 | | | | — | | | | — | | | | 4,101 | |
MainStay Epoch U.S. Equity Yield Fund Class R6 | | | 4,356 | | | | 60 | | | | (157 | ) | | | 8 | | | | 561 | | | | 4,828 | | | | 60 | | | | — | | | | 290 | |
MainStay MacKay High Yield Municipal Bond Fund Class I | | | 29,120 | | | | 3,993 | | | | (3,319 | ) | | | 64 | | | | 1,202 | | | | 31,060 | | | | 598 | | | | — | | | | 2,411 | |
MainStay MacKay International Opportunities Fund Class I | | | 103,590 | | | | 56 | | | | (43,982 | ) | | | (4,572 | ) | | | 14,646 | | | | 69,738 | | | | — | | | | — | | | | 8,975 | |
MainStay MacKay Short Duration High Yield Fund Class I | | | 36,828 | | | | 60,185 | | | | (5,727 | ) | | | (44 | ) | | | 1,837 | | | | 93,079 | | | | 1,537 | | | | — | | | | 9,421 | |
| | |
| 58 | | MainStay VP Allocation Portfolios |
MainStay VP Moderate Growth Allocation Portfolio (continued)
| | | | | | | | | | | | | | | | | | | | | | | | | | | | | | | | | | | | |
Affiliated Investment Companies | | Value,
Beginning of
Period | | | Purchases at
Cost | | | Proceeds
from Sales | | | Net
Realized
Gain/(Loss)
on Sales | | | Change in
Unrealized
Appreciation/
(Depreciation) | | | Value,
End of
Period | | | Dividend
Income | | | Other
Distributions | | | Shares
End of
Period | |
MainStay MacKay Short Term Municipal Fund Class I | | $ | 22,933 | | | $ | 19,778 | | | $ | (2,216 | ) | | $ | 11 | | | $ | 207 | | | $ | 40,713 | | | $ | 257 | | | $ | — | | | | 4,232 | |
MainStay MacKay Total Return Bond Fund Class R6 | | | 512 | | | | 6 | | | | (191 | ) | | | (3 | ) | | | 22 | | | | 346 | | | | 6 | | | | — | | | | 32 | |
MainStay MacKay U.S. Equity Opportunities Fund Class I | | | 75,294 | | | | 104 | | | | (6,227 | ) | | | (38 | ) | | | 10,272 | | | | 79,405 | | | | — | | | | — | | | | 9,419 | |
MainStay MAP Equity Fund Class I | | | 82,298 | | | | 9,798 | | | | (9,260 | ) | | | (826 | ) | | | 15,673 | | | | 97,683 | | | | — | | | | — | | | | 2,340 | |
MainStay U.S. Government Liquidity Fund | | | 23,397 | | | | 174,082 | | | | (132,448 | ) | | | — | | | | — | | | | 65,031 | | | | 621 | | | | — | | | | 65,031 | |
MainStay VP Bond Portfolio Initial Class | | | 26,863 | | | | 197 | | | | (9,443 | ) | | | (126 | ) | | | 1,375 | | | | 18,866 | | | | — | | | | — | | | | 1,291 | |
MainStay VP Cushing Renaissance Advantage Portfolio Initial Class | | | 35,858 | | | | — | | | | (24,128 | ) | | | (4,049 | ) | | | 8,631 | | | | 16,312 | | | | — | | | | — | | | | 1,884 | |
MainStay VP Eagle Small Cap Growth Portfolio Initial Class | | | 56,466 | | | | — | | | | (8,264 | ) | | | 134 | | | | 10,594 | | | | 58,930 | | | | — | | | | — | | | | 4,041 | |
MainStay VP Emerging Markets Equity Portfolio Initial Class | | | 136,060 | | | | 1,275 | | | | (33,268 | ) | | | 4,829 | | | | 10,583 | | | | 119,479 | | | | — | | | | — | | | | 13,326 | |
MainStay VP Epoch U.S. Equity Yield Portfolio Initial Class | | | 103,137 | | | | 124 | | | | (9,876 | ) | | | 766 | | | | 13,869 | | | | 108,020 | | | | — | | | | — | | | | 6,734 | |
MainStay VP Epoch U.S. Small Cap Portfolio Initial Class(b) | | | 86,198 | | | | 10,357 | | | | (111,169 | ) | | | (3,844 | ) | | | 18,458 | | | | — | | | | 688 | | | | 9,669 | | | | — | |
MainStay VP Floating Rate Portfolio Initial Class | | | 39,126 | | | | 28,899 | | | | (3,504 | ) | | | (75 | ) | | | 1,145 | | | | 65,591 | | | | 1,345 | | | | — | | | | 7,378 | |
MainStay VP Large Cap Growth Portfolio Initial Class | | | 44,250 | | | | 40,605 | | | | (9,975 | ) | | | 2,508 | | | | 11,716 | | | | 89,104 | | | | — | | | | — | | | | 3,347 | |
MainStay VP MacKay Common Stock Portfolio Initial Class | | | 44,667 | | | | 288 | | | | (3,493 | ) | | | (541 | ) | | | 7,235 | | | | 48,156 | | | | — | | | | — | | | | 1,657 | |
MainStay VP MacKay Convertible Portfolio Initial Class | | | 23,875 | | | | 193 | | | | (1,546 | ) | | | 81 | | | | 3,479 | | | | 26,082 | | | | 193 | | | | — | | | | 1,837 | |
MainStay VP MacKay Growth Portfolio Initial Class | | | 45,550 | | | | 42,029 | | | | (7,447 | ) | | | 1,644 | | | | 8,389 | | | | 90,165 | | | | — | | | | — | | | | 2,776 | |
MainStay VP MacKay High Yield Corporate Bond Portfolio Initial Class | | | 2,247 | | | | 118 | | | | (207 | ) | | | (4 | ) | | | 193 | | | | 2,347 | | | | — | | | | — | | | | 231 | |
MainStay VP MacKay International Equity Portfolio Initial Class | | | 19,667 | | | | 53 | | | | (960 | ) | | | 156 | | | | 2,317 | | | | 21,233 | | | | — | | | | — | | | | 1,257 | |
MainStay VP MacKay Mid Cap Core Portfolio Initial Class | | | 128,581 | | | | — | | | | (39,400 | ) | | | (8,583 | ) | | | 27,206 | | | | 107,804 | | | | — | | | | — | | | | 7,819 | |
MainStay VP MacKay S&P 500 Index Portfolio Initial Class | | | 4,316 | | | | — | | | | (271 | ) | | | 4 | | | | 784 | | | | 4,833 | | | | — | | | | — | | | | 85 | |
MainStay VP MacKay Small Cap Core Portfolio Initial Class | | | 39,126 | | | | 94,558 | | | | (35,394 | ) | | | (5,792 | ) | | | (3,296 | ) | | | 89,202 | | | | — | | | | — | | | | 8,124 | |
MainStay VP MacKay Unconstrained Bond Portfolio Initial Class | | | 52,841 | | | | 888 | | | | (16,989 | ) | | | (325 | ) | | | 1,565 | | | | 37,980 | | | | 888 | | | | — | | | | 3,859 | |
MainStay VP PIMCO Real Return Portfolio Initial Class | | | 17,901 | | | | 344 | | | | (1,776 | ) | | | (63 | ) | | | 1,221 | | | | 17,627 | | | | — | | | | — | | | | 2,019 | |
MainStay VP T. Rowe Price Equity Income Portfolio Initial Class | | | 136,004 | | | | 530 | | | | (14,164 | ) | | | (1,226 | ) | | | 22,221 | | | | 143,365 | | | | — | | | | — | | | | 10,877 | |
| | | | | | | | |
| | $ | 1,930,082 | | | $ | 575,546 | | | $ | (733,005 | ) | | $ | (28,140 | ) | | $ | 270,988 | | | $ | 2,015,471 | | | $ | 9,633 | | | $ | 9,669 | | | | | |
| | | | | | | | |
Notes to Financial Statements(Unaudited) (continued)
MainStay VP Growth Allocation Portfolio
| | | | | | | | | | | | | | | | | | | | | | | | | | | | | | | | | | | | |
Affiliated Investment Companies | | Value,
Beginning of
Period | | | Purchases at
Cost | | | Proceeds
from Sales | | | Net
Realized
Gain/(Loss)
on Sales | | | Change in
Unrealized
Appreciation/
(Depreciation) | | | Value,
End of
Period | | | Dividend
Income | | | Other
Distributions | | | Shares
End of
Period | |
| | | | | | | | | |
IQ 50 Percent Hedged FTSE International ETF | | $ | 37,974 | | | $ | — | | | $ | (13,052 | ) | | $ | (1,044 | ) | | $ | 5,150 | | | $ | 29,028 | | | $ | 712 | | | $ | — | | | | 1,426 | |
IQ 500 International ETF | | | 50 | | | | 35,020 | | | | (6,016 | ) | | | 203 | | | | 491 | | | | 29,748 | | | | 699 | | | | — | | | | 1,109 | |
IQ Chaikin U.S. Large Cap ETF | | | 34,408 | | | | 24,021 | | | | (5,627 | ) | | | (387 | ) | | | 6,296 | | | | 58,711 | | | | 575 | | | | — | | | | 2,388 | |
IQ Chaikin U.S. Small Cap ETF | | | 28,911 | | | | 238 | | | | (5,236 | ) | | | 59 | | | | 3,359 | | | | 27,331 | | | | 248 | | | | — | | | | 1,099 | |
IQ Global Resources ETF | | | 20,457 | | | | 124 | | | | (1,267 | ) | | | 60 | | | | 1,599 | | | | 20,973 | | | | — | | | | — | | | | 768 | |
MainStay Cushing MLP Premier Fund Class I | | | 6,710 | | | | 216 | | | | (5,239 | ) | | | (148 | ) | | | 1,113 | | | | 2,652 | | | | 217 | | | | — | | | | 239 | |
MainStay Epoch Capital Growth Fund Class I | | | 8,619 | | | | 444 | | | | (535 | ) | | | 89 | | | | 1,572 | | | | 10,189 | | | | — | | | | — | | | | 797 | |
MainStay Epoch Global Choice Fund Class I | | | 13,172 | | | | — | | | | (13,895 | ) | | | (1,414 | ) | | | 2,137 | | | | — | | | | — | | | | — | | | | — | |
MainStay Epoch International Choice Fund Class I | | | 60,487 | | | | 224 | | | | (8,568 | ) | | | (375 | ) | | | 9,175 | | | | 60,943 | | | | — | | | | — | | | | 1,724 | |
MainStay Epoch U.S. All Cap Fund Class R6 | | | 68,629 | | | | 364 | | | | (5,513 | ) | | | (287 | ) | | | 14,584 | | | | 77,777 | | | | — | | | | — | | | | 2,739 | |
MainStay Epoch U.S. Equity Yield Fund Class R6 | | | 561 | | | | 4 | | | | (383 | ) | | | 13 | | | | 52 | | | | 247 | | | | 4 | | | | — | | | | 15 | |
MainStay MacKay International Opportunities Fund Class I | | | 59,629 | | | | 46 | | | | (22,205 | ) | | | (2,217 | ) | | | 8,097 | | | | 43,350 | | | | — | | | | — | | | | 5,579 | |
MainStay MacKay U.S. Equity Opportunities Fund Class I | | | 49,595 | | | | 200 | | | | (3,589 | ) | | | (69 | ) | | | 6,828 | | | | 52,965 | | | | — | | | | — | | | | 6,283 | |
MainStay MAP Equity Fund Class I | | | 58,443 | | | | 10,169 | | | | (3,414 | ) | | | (372 | ) | | | 11,254 | | | | 76,080 | | | | — | | | | — | | | | 1,823 | |
MainStay U.S. Government Liquidity Fund | | | 3,010 | | | | 14,731 | | | | (5,824 | ) | | | — | | | | — | | | | 11,917 | | | | 5 | | | | — | | | | 11,917 | |
MainStay VP Cushing Renaissance Advantage Portfolio Initial Class | | | 18,574 | | | | — | | | | (12,098 | ) | | | (935 | ) | | | 3,298 | | | | 8,839 | | | | — | | | | — | | | | 1,021 | |
MainStay VP Eagle Small Cap Growth Portfolio Initial Class | | | 28,490 | | | | 2,536 | | | | (3,359 | ) | | | 197 | | | | 5,601 | | | | 33,465 | | | | — | | | | — | | | | 2,295 | |
MainStay VP Emerging Markets Equity Portfolio Initial Class | | | 79,111 | | | | 858 | | | | (12,370 | ) | | | 1,727 | | | | 7,583 | | | | 76,909 | | | | — | | | | — | | | | 8,578 | |
MainStay VP Epoch U.S. Equity Yield Portfolio Initial Class | | | 62,098 | | | | 966 | | | | (3,758 | ) | | | 289 | | | | 8,647 | | | | 68,242 | | | | — | | | | — | | | | 4,254 | |
MainStay VP Epoch U.S. Small Cap Portfolio Initial Class(b) | | | 44,338 | | | | 5,382 | | | | (57,402 | ) | | | (811 | ) | | | 8,493 | | | | — | | | | 350 | | | | 4,922 | | | | — | |
MainStay VP Large Cap Growth Portfolio Initial Class | | | 36,462 | | | | 28,406 | | | | (4,586 | ) | | | 1,161 | | | | 9,920 | | | | 71,363 | | | | — | | | | — | | | | 2,681 | |
MainStay VP MacKay Common Stock Portfolio Initial Class | | | 29,983 | | | | 7,024 | | | | (997 | ) | | | (137 | ) | | | 4,879 | | | | 40,752 | | | | — | | | | — | | | | 1,402 | |
MainStay VP MacKay Growth Portfolio Initial Class | | | 37,469 | | | | 29,016 | | | | (3,077 | ) | | | 605 | | | | 7,171 | | | | 71,184 | | | | — | | | | — | | | | 2,192 | |
MainStay VP MacKay International Equity Portfolio Initial Class | | | 13,002 | | | | 2,811 | | | | (348 | ) | | | 63 | | | | 1,683 | | | | 17,211 | | | | — | | | | — | | | | 1,019 | |
MainStay VP MacKay Mid Cap Core Portfolio Initial Class | | | 70,849 | | | | 67 | | | | (24,633 | ) | | | (4,657 | ) | | | 14,927 | | | | 56,553 | | | | — | | | | — | | | | 4,102 | |
MainStay VP MacKay S&P 500 Index Portfolio Initial Class | | | 1,739 | | | | — | | | | (592 | ) | | | 3 | | | | 294 | | | | 1,444 | | | | — | | | | — | | | | 25 | |
MainStay VP MacKay Small Cap Core Portfolio Initial Class | | | 36,904 | | | | 49,106 | | | | (24,051 | ) | | | (1,254 | ) | | | (1,573 | ) | | | 59,132 | | | | — | | | | — | | | | 5,386 | |
MainStay VP T. Rowe Price Equity Income Portfolio Initial Class | | | 87,355 | | | | 560 | | | | (9,470 | ) | | | (1,112 | ) | | | 14,622 | | | | 91,955 | | | | — | | | | — | | | | 6,976 | |
| | | | | | | | |
| | $ | 997,029 | | | $ | 212,533 | | | $ | (257,104 | ) | | $ | (10,750 | ) | | $ | 157,252 | | | $ | 1,098,960 | | | $ | 2,810 | | | $ | 4,922 | | | | | |
| | | | | | | | |
| (b) | Reorganized into the MainStay VP MacKay Small Cap Core Portfolio Initial Class on May 1, 2019. |
| | |
| 60 | | MainStay VP Allocation Portfolios |
Note 4–Federal Income Tax
As of June 30, 2019, the cost and unrealized appreciation (depreciation) of each Allocation Portfolio’s investment portfolio, including applicable derivative contracts and other financial instruments, as determined on a federal income tax basis, were as follows:
MainStay VP Conservative Allocation Portfolio
| | | | | | | | | | | | | | | | |
| | | Federal Tax
Cost | | | Gross
Unrealized
Appreciation | | | Gross
Unrealized
(Depreciation) | | | Net
Unrealized
Appreciation/
(Depreciation) | |
Investments in Affiliates | | $ | 724,844,617 | | | $ | 31,960,457 | | | $ | (14,882,657 | ) | | $ | 17,077,800 | |
MainStay VP Moderate Allocation Portfolio
| | | | | | | | | | | | | | | | |
| | | Federal Tax
Cost | | | Gross
Unrealized
Appreciation | | | Gross
Unrealized
(Depreciation) | | | Net
Unrealized
Appreciation/
(Depreciation) | |
Investments in Affiliates | | $ | 1,144,893,693 | | | $ | 49,876,008 | | | $ | (21,444,469 | ) | | $ | 28,431,539 | |
MainStay VP Moderate Growth Allocation Portfolio
| | | | | | | | | | | | | | | | |
| | | Federal Tax
Cost | | | Gross
Unrealized
Appreciation | | | Gross
Unrealized
(Depreciation) | | | Net
Unrealized
Appreciation/
(Depreciation) | |
Investments in Affiliates | | $ | 1,992,184,263 | | | $ | 73,134,349 | | | $ | (49,847,745 | ) | | $ | 23,286,604 | |
MainStay VP Growth Allocation Portfolio
| | | | | | | | | | | | | | | | |
| | | Federal Tax
Cost | | | Gross
Unrealized
Appreciation | | | Gross
Unrealized
(Depreciation) | | | Net
Unrealized
Appreciation/
(Depreciation) | |
Investments in Affiliates | | $ | 1,076,885,206 | | | $ | 47,273,858 | | | $ | (25,198,810 | ) | | $ | 22,075,048 | |
During the year ended December 31, 2018, the tax character of distributions paid as reflected in the Statements of Changes in Net Assets was as follows:
| | | | | | | | | | | | |
| |
| | | 2018 | |
| | | Tax Based
Distributions
from Ordinary
Income | | | Tax Based
Distributions
from Long-Term
Capital Gains | | | Total | |
| | | |
MainStay VP Conservative Allocation Portfolio | | $ | 17,354,699 | | | $ | — | | | $ | 17,354,699 | |
MainStay VP Moderate Allocation Portfolio | | | 27,682,114 | | | | 37,706,864 | | | | 65,388,978 | |
MainStay VP Moderate Growth Allocation Portfolio | | | 39,055,607 | | | | 94,896,286 | | | | 133,951,893 | |
MainStay VP Growth Allocation Portfolio | | | 15,121,610 | | | | 42,438,428 | | | | 57,560,038 | |
Note 5–Custodian
State Street is the custodian of cash and securities held by the Allocation Portfolios. Custodial fees are charged to each Allocation Portfolio based on the Allocation Portfolios’ net assets and/or the market value of securities held by each Allocation Portfolio and the number of certain transactions incurred by each Allocation Portfolio.
Note 6–Line of Credit
The Allocation Portfolios and certain other funds managed by New York Life Investments maintain a line of credit with a syndicate of banks in order to secure a source of funds for temporary purposes to meet unanticipated or excessive redemption requests.
Effective July 30, 2019, under a credit agreement (the “Credit Agreement”), the aggregate commitment amount is $600,000,000 with an additional uncommitted amount of $100,000,000. The commitment fee is an annual rate of 0.15% of the average commitment amount payable quarterly, regardless of usage, to State Street, who serves as the agent to the syndicate. The commitment fee is allocated among the Allocation Portfolios and certain other funds managed by New York Life Investments based upon their respective net assets and other factors. Interest on any revolving credit loan is charged based upon the Federal Funds Rate or the one-month London Interbank Offered Rate (“LIBOR”), whichever is higher. The Credit Agreement expires on July 28, 2020, although the Allocation Portfolios, certain other funds managed by New York Life Investments and the syndicate of banks may renew the Credit Agreement for an additional year on the same or different terms. Prior to July 30, 2019, the aggregate commitment amount and the commitment fee were the same as those under the current Credit Agreement. During the six-month period ended June 30, 2019, there were no borrowings made or outstanding with respect to the Allocation Portfolios under the Credit Agreement.
Note 7–Interfund Lending Program
Pursuant to an exemptive order issued by the SEC, the Allocation Portfolios, along with certain other funds managed by New York Life Investments, may participate in an interfund lending program. The interfund lending program provides an alternative credit facility that permits the Allocation Portfolios and certain other funds managed by New York Life Investments to lend or borrow money for temporary purposes directly to or from one another, subject to the conditions of the exemptive order. During the six-month period ended June 30, 2019, there were no interfund loans made or outstanding with respect to the Allocation Portfolios.
Note 8–Purchases and Sales of Securities (in 000’s)
During the six-month period ended June 30, 2019, purchases and sales of securities were as follows:
| | | | | | | | |
| | | Purchases | | | Sales | |
| | |
MainStay VP Conservative Allocation Portfolio | | $ | 115,643 | | | $ | 190,656 | |
MainStay VP Moderate Allocation Portfolio | | | 174,109 | | | | 295,261 | |
MainStay VP Moderate Growth Allocation Portfolio | | | 306,906 | | | | 506,001 | |
MainStay VP Growth Allocation Portfolio | | | 149,512 | | | | 202,990 | |
Notes to Financial Statements(Unaudited) (continued)
Note 9–Capital Share Transactions
Transactions in capital shares for the six-month period ended June 30, 2019 and the year ended December 31, 2018, were as follows:
MainStay VP Conservative Allocation Portfolio
| | | | | | | | |
Initial Class | | Shares | | | Amount | |
| | |
Six-month period ended June 30, 2019: | | | | | | | | |
Shares sold | | | 46,497 | | | $ | 536,090 | |
Shares redeemed | | | (154,361 | ) | | | (1,783,820 | ) |
| | | | |
Net increase (decrease) | | | (107,864 | ) | | $ | (1,247,730 | ) |
| | | | |
Year ended December 31, 2018: | | | | | | | | |
Shares sold | | | 285,884 | | | $ | 3,358,327 | |
Shares issued to shareholders in reinvestment of dividends and distributions | | | 33,705 | | | | 386,602 | |
Shares redeemed | | | (359,681 | ) | | | (4,177,005 | ) |
| | | | |
Net increase (decrease) | | | (40,092 | ) | | $ | (432,076 | ) |
| | | | |
| | |
| | | | | | | | |
Service Class | | Shares | | | Amount | |
Six-month period ended June 30, 2019: | | | | | | | | |
Shares sold | | | 1,898,919 | | | $ | 21,592,232 | |
Shares redeemed | | | (6,867,839 | ) | | | (78,006,871 | ) |
| | | | |
Net increase (decrease) | | | (4,968,920 | ) | | $ | (56,414,639 | ) |
| | | | |
Year ended December 31, 2018: | | | | | | | | |
Shares sold | | | 5,887,722 | | | $ | 67,843,904 | |
Shares issued to shareholders in reinvestment of dividends and distributions | | | 1,494,347 | | | | 16,968,097 | |
Shares redeemed | | | (14,514,524 | ) | | | (166,331,767 | ) |
| | | | |
Net increase (decrease) | | | (7,132,455 | ) | | $ | (81,519,766 | ) |
| | | | |
|
| MainStay VP Moderate Allocation Portfolio | |
Initial Class | | Shares | | | Amount | |
| | |
Six-month period ended June 30, 2019: | | | | | | | | |
Shares sold | | | 110,905 | | | $ | 1,259,005 | |
Shares redeemed | | | (488,031 | ) | | | (5,437,257 | ) |
| | | | |
Net increase (decrease) | | | (377,126 | ) | | $ | (4,178,252 | ) |
| | | | |
Year ended December 31, 2018: | | | | | | | | |
Shares sold | | | 334,163 | | | $ | 3,860,363 | |
Shares issued to shareholders in reinvestment of dividends and distributions | | | 226,121 | | | | 2,565,757 | |
Shares redeemed | | | (535,054 | ) | | | (6,073,725 | ) |
| | | | |
Net increase (decrease) | | | 25,230 | | | $ | 352,395 | |
| | | | |
| | |
| | | | | | | | |
| | | | | | | | |
Service Class | | Shares | | | Amount | |
Six-month period ended June 30, 2019: | | | | | | | | |
Shares sold | | | 1,663,501 | | | $ | 18,389,727 | |
Shares redeemed | | | (10,741,503 | ) | | | (118,998,497 | ) |
| | | | |
Net increase (decrease) | | | (9,078,002 | ) | | $ | (100,608,770 | ) |
| | | | |
Year ended December 31, 2018: | | | | | | | | |
Shares sold | | | 8,832,130 | | | $ | 102,684,975 | |
Shares issued to shareholders in reinvestment of dividends and distributions | | | 5,582,969 | | | | 62,823,221 | |
Shares redeemed | | | (15,893,652 | ) | | | (182,767,134 | ) |
| | | | |
Net increase (decrease) | | | (1,478,553 | ) | | $ | (17,258,938 | ) |
| | | | |
|
| MainStay VP Moderate Growth Allocation Portfolio | |
Initial Class | | Shares | | | Amount | |
| | |
Six-month period ended June 30, 2019: | | | | | | | | |
Shares sold | | | 143,387 | | | $ | 1,647,899 | |
Shares redeemed | | | (288,042 | ) | | | (3,365,773 | ) |
| | | | |
Net increase (decrease) | | | (144,655 | ) | | $ | (1,717,874 | ) |
| | | | |
Year ended December 31, 2018: | | | | | | | | |
Shares sold | | | 385,781 | | | $ | 4,797,520 | |
Shares issued to shareholders in reinvestment of dividends and distributions | | | 464,525 | | | | 5,592,425 | |
Shares redeemed | | | (414,496 | ) | | | (5,104,513 | ) |
| | | | |
Net increase (decrease) | | | 435,810 | | | $ | 5,285,432 | |
| | | | |
| | |
| | | | | | | | |
Service Class | | Shares | | | Amount | |
Six-month period ended June 30, 2019: | | | | | | | | |
Shares sold | | | 1,073,812 | | | $ | 12,171,336 | |
Shares redeemed | | | (16,047,891 | ) | | | (185,095,674 | ) |
| | | | |
Net increase (decrease) | | | (14,974,079 | ) | | $ | (172,924,338 | ) |
| | | | |
Year ended December 31, 2018: | | | | | | | | |
Shares sold | | | 8,966,431 | | | $ | 110,837,853 | |
Shares issued to shareholders in reinvestment of dividends and distributions | | | 10,766,818 | | | | 128,359,468 | |
Shares redeemed | | | (24,201,137 | ) | | | (295,976,984 | ) |
| | | | |
Net increase (decrease) | | | (4,467,888 | ) | | $ | (56,779,663 | ) |
| | | | |
|
| MainStay VP Growth Allocation Portfolio | |
Initial Class | | Shares | | | Amount | |
| | |
Six-month period ended June 30, 2019: | | | | | | | | |
Shares sold | | | 291,566 | | | $ | 3,380,635 | |
Shares redeemed | | | (241,306 | ) | | | (2,801,224 | ) |
| | | | |
Net increase (decrease) | | | 50,260 | | | $ | 579,411 | |
| | | | |
Year ended December 31, 2018: | | | | | | | | |
Shares sold | | | 489,356 | | | $ | 6,097,660 | |
Shares issued to shareholders in reinvestment of dividends and distributions | | | 324,680 | | | | 3,974,409 | |
Shares redeemed | | | (540,356 | ) | | | (6,683,629 | ) |
| | | | |
Net increase (decrease) | | | 273,680 | | | $ | 3,388,440 | |
| | | | |
| | |
| | | | | | | | |
| | |
| 62 | | MainStay VP Allocation Portfolios |
| | | | | | | | |
Service Class | | Shares | | | Amount | |
Six-month period ended June 30, 2019: | | | | | | | | |
Shares sold | | | 834,217 | | | $ | 9,481,381 | |
Shares redeemed | | | (5,143,711 | ) | | | (59,910,856 | ) |
| | | | |
Net increase (decrease) | | | (4,309,494 | ) | | $ | (50,429,475 | ) |
| | | | |
Year ended December 31, 2018: | | | | | | | | |
Shares sold | | | 8,146,507 | | | $ | 99,959,052 | |
Shares issued to shareholders in reinvestment of dividends and distributions | | | 4,420,094 | | | | 53,585,629 | |
Shares redeemed | | | (8,821,760 | ) | | | (109,625,717 | ) |
| | | | |
Net increase (decrease) | | | 3,744,841 | | | $ | 43,918,964 | |
| | | | |
Note 10–Recent Accounting Pronouncement
To improve the effectiveness of fair value disclosure requirements, the Financial Accounting Standards Board recently issued Accounting Standard Update (ASU)2018-13, Fair Value Measurement Disclosure Framework—Changes to the Disclosure Requirements for Fair Value Measurement (ASU2018-13), which adds, removes, and modifies certain aspects relating to fair value disclosure. ASU2018-13 is
effective for interim and annual reporting periods beginning after December 15, 2019; early adoption of the additions relating to ASU2018-13 is not required. Management has evaluated the implications of certain other provisions of the ASU and has determined to early adopt aspects related to the removal and modifications of certain fair value measurement disclosures under the ASU effective immediately. At this time, management is evaluating the implications of certain other provisions of the ASU related to new disclosure requirements and any impact on the financial statement disclosures has not yet been determined.
Note 11–Subsequent Events
In connection with the preparation of the financial statements of the Allocation Portfolios as of and for the six-month period ended June 30, 2019, events and transactions subsequent to June 30, 2019, through the date the financial statements were issued have been evaluated by the Allocation Portfolios’ management for possible adjustment and/or disclosure. No subsequent events requiring financial statement adjustment or disclosure have been identified.
Proxy Voting Policies and Procedures and Proxy Voting Record
A description of the policies and procedures that New York Life Investments uses to vote proxies related to the Portfolio’s securities is available without charge, upon request (i) by calling800-598-2019; (ii) by visiting New York Life Investments website at https://www.nylinvestments.com/mainstay/products-and-performance/mainstay-vp-funds-trust; or (iii) by visiting the SEC’s website at www.sec.gov.
Each Portfolio is required to file with the SEC its proxy voting record for the12-month period ending June 30 on Form N-PX. The Portfolio’s most recent Form N-PX or proxy voting record is available free of charge upon request (i) by calling800-598-2019; (ii) by visiting New York Life Investments website at https://www.nylinvestments.com/mainstay/products-and-performance/mainstay-vp-funds-trust; or (iii) by visiting the SEC’s website atwww.sec.gov.
Shareholder Reports and Quarterly Portfolio Disclosure
Each Portfolio is required to file its complete schedule of portfolio holdings with the SEC 60 days after each fiscal quarter onForm N-PORT. Each Portfolio’s holdings report is available without charge upon request (i) by calling800-598-2019; (ii) by visiting New York Life Investments website at https://www.nylinvestments.com/mainstay/products-and-performance/mainstay-vp-funds-trust; or (iii) on the SEC’s website at www.sec.gov.
| | |
| 64 | | MainStay VP Allocation Portfolios |
MainStay VP Portfolios
MainStay VP offers a wide range of Portfolios. The full array of MainStay VP offerings is listed here, with information about the manager, subadvisors, legal counsel, and independent registered public accounting firm.
Equity Portfolios
MainStay VP Eagle Small Cap Growth Portfolio
MainStay VP Emerging Markets Equity Portfolio
MainStay VP Epoch U.S. Equity Yield Portfolio
MainStay VP Fidelity Institutional AM® Utilities Portfolio†
MainStay VP Large Cap Growth Portfolio
MainStay VP MacKay Common Stock Portfolio
MainStay VP MacKay Growth Portfolio
MainStay VP MacKay International Equity Portfolio
MainStay VP MacKay Mid Cap Core Portfolio
MainStay VP MacKay S&P 500 Index Portfolio
MainStay VP MacKay Small Cap Core Portfolio
MainStay VP Mellon Natural Resources Portfolio
MainStay VP T. Rowe Price Equity Income Portfolio
Mixed Asset Portfolios
MainStay VP Balanced Portfolio
MainStay VP Income Builder Portfolio
MainStay VP Janus Henderson Balanced Portfolio
MainStay VP MacKay Convertible Portfolio
Income Portfolios
MainStay VP Bond Portfolio
MainStay VP Floating Rate Portfolio
MainStay VP Indexed Bond Portfolio
MainStay VP MacKay Government Portfolio
MainStay VP MacKay High Yield Corporate Bond Portfolio
MainStay VP MacKay Unconstrained Bond Portfolio
MainStay VP PIMCO Real Return Portfolio
Money Market
MainStay VP U.S. Government Money Market Portfolio
Alternative
MainStay VP Cushing Renaissance Advantage Portfolio
MainStay VP IQ Hedge Multi-Strategy Portfolio
Asset Allocation Portfolios
MainStay VP Conservative Allocation Portfolio
MainStay VP Growth Allocation Portfolio
MainStay VP Moderate Allocation Portfolio
MainStay VP Moderate Growth Allocation Portfolio
Manager
New York Life Investment Management LLC
New York, New York
Subadvisors
Candriam Belgium*
Brussels, Belgium
Cushing Asset Management, LP
Dallas, Texas
Eagle Asset Management, Inc.
St Petersburg, Florida
Epoch Investment Partners, Inc.
New York, New York
FIAM LLC
Smithfield, Rhode Island
IndexIQ Advisors LLC*
New York, New York
Janus Capital Management LLC
Denver, Colorado
MacKay Shields LLC*
New York, New York
Mellon Investments Corporation
Boston, Massachusetts
NYL Investors LLC*
New York, New York
Pacific Investment Management Company LLC
Newport Beach, California
T. Rowe Price Associates, Inc.
Baltimore, Maryland
Winslow Capital Management, LLC
Minneapolis, Minnesota
Distributor
NYLIFE Distributors LLC*
Jersey City, New Jersey
Custodian
State Street Bank and Trust Company
Boston, Massachusetts
Independent Registered Public Accounting Firm
PricewaterhouseCoopers LLP
New York, New York
Legal Counsel
Dechert LLP
Washington, District of Columbia
Some Portfolios may not be available in all products.
| † | Fidelity Institutional AM is a registered trade mark of FMR LLC. Used with permission. |
| * | An affiliate of New York Life Investment Management LLC |
Not part of the Semiannual Report
2019 Semiannual Report
This report is for the general information of New York Life Variable Annuities and NYLIAC Variable Universal Life Insurance Products policyowners. It must be preceded or accompanied by the appropriate product(s) and funds prospectuses if it is given to anyone who is not an owner of a New York Life variable annuity policy or a NYLIAC Variable Universal Life Insurance Product. This report does not offer for sale or solicit orders to purchase securities.
The performance data quoted in this report represents past performance. Past performance is no guarantee of future results. Due to market volatility and other factors, current performance may be lower or higher than the figures shown. The most recent month-end performance summary for your variable annuity or variable life policy is available by calling 800-598-2019 and is updated periodically on www.newyorklife.com.
The New York Life Variable Annuities and NYLIAC Variable Universal Life Insurance Products are issued by New York Life Insurance and Annuity Corporation (a Delaware Corporation) and distributed by NYLIFE Distributors LLC (Member FINRA/SIPC).
New York Life Insurance Company
New York Life Insurance and Annuity Corporation (NYLIAC) (A Delaware Corporation)
51 Madison Avenue, Room 551
New York, NY 10010
www.newyorklife.com
Printed on recycled paper
nylinvestments.com
NYLIFE Distributors LLC, 30 Hudson Street, Jersey City, NJ 07302
New York Life Investment Management LLC is the investment manager to the MainStay VP Funds Trust
©2019 by NYLIFE Distributors LLC. All rights reserved.
You may obtain copies of the Prospectus and the Statement of Additional Information free of charge, upon request, by callingtoll-free 800-598-2019 or writing to New York Life Insurance and Annuity Corporation, 51 Madison Avenue, New York, NY 10010.
| | | | |
| | | |
| Not FDIC Insured | | No Bank Guarantee | | May Lose Value |
| | | | |
| 1781600 | | | | MSVPAA10-08/19 (NYLIAC) NI507 |
MainStay VP Bond Portfolio
Message from the President and Semiannual Report
Unaudited | June 30, 2019

Beginning on January 1, 2021, as permitted by regulations adopted by the Securities and Exchange Commission, paper copies of the MainStay VP Portfolio annual and semi-annual shareholder reports may no longer be sent by mail, unless you specifically request paper copies of the reports from the insurance company that offers your policy. Instead, the reports will be made available online, and you will be notified by mail each time a report is posted and provided with a website link to access the report. Instructions for requesting paper copies will be provided by your insurance company.
If you already elected to receive shareholder reports electronically, you will not be affected by this change and you need not take any action. At any time, you may elect to receive reports and other communications from the insurance company electronically by following the instructions provided by the insurance company.
You may elect to receive all future shareholder reports in paper form free of charge. You can inform the insurance company that you wish to receive paper copies of reports by following the instructions provided by the insurance company. Your election to receive reports in paper form will apply to all portfolio companies available under your contract.
| | | | | | | | |
| | | | | |
| Not FDIC/NCUA Insured | | Not a Deposit | | May Lose Value | | No Bank Guarantee | | Not Insured by Any Government Agency |

This page intentionally left blank
Message from the President
Most equity and fixed-income markets in the United States and around the world advanced in the face of conflicting political and macroeconomic forces during thesix-month period ended June 30, 2019.
The reporting period began on the heels of tumultuous December 2018, during which equities and equity-sensitive bonds spiked sharply lower on concerns regarding the pace of economic growth, a U.S. government shutdown and the potential impact of trade disputes between the United States and other nations, particularly China. Markets recovered quickly in early 2019 as trade tensions eased, the government reopened and the U.S. Federal Reserve Board (Fed) adopted a more patient tone regarding the future direction of interest rates. Markets moved broadly higher from January through April, supported by encouraging economic data and generally strong corporate earnings.
During the first four months of the reporting period, the improving economic environment encouraged investors to favor areas of the market viewed as offering greater return potential along with higher risks. Among U.S. stocks, cyclical, growth-oriented sectors tended to outperform more defensive, value-oriented sectors, whilelarge-cap stocks outperformed theirsmaller-cap counterparts. Within the S&P 500® Index, the information technology sector led the market’s advance, followed by communication services, consumer discretionary and consumer staples. Industrials, utilities, financials, materials, real estate and energy produced more modest gains. While some international equity markets outperformed or underperformed the U.S. market, on average international stocks mirrored the performance of their U.S. counterparts. Fixed-income securities gained ground as well, albeit along a more gradual trajectory. Among U.S. fixed-income instruments, corporate issues generally outperformed government bonds, with lower credit quality, higher yielding securities leading the sector’s advance. Long-term U.S. Treasury bond yields proved particularly weak, with
10-year yields dipping at times below3-month yields, reflecting investors’ continued concerns about domestic economic growth.
May 2019 saw a return of uncertainty and volatility. Trade discussions between the United States and China faltered, driving global equity prices lower. Government bond prices rose as investors sought safe havens. June brought yet anotherU-turn as equity prices climbed again after comments from the Fed raised hopes of an interest rate cut in response to weak economic data. Stock and bond prices rose, with U.S. equity markets ending the reporting period in record territory.
We are pleased to see renewed signs of strength in broad areas of the financial market. At the same time, we remained sharply focused on providing you, as a MainStay VP investor, with the experienced and disciplined fund management that we believe underpins an effective, long-term investment strategy. Whatever tomorrow’s investment environment brings, you can rely on our portfolio managers to pursue the objectives of their individual Portfolios as outlined in the prospectus with the energy and dedication you have come to expect.
The report that follows contains additional information on the market events, investment decisions and specific securities that shaped your VP Portfolio’s performance during the six months ended June 30, 2019. We encourage you to read the report carefully and use it to evaluate your Portfolio’s performance in light of your long-range financial plan.
Sincerely,

Kirk C. Lehneis
President
The opinions expressed are as of the date of this report and are subject to change. There is no guarantee that any forecast made will come to pass. This material does not constitute investment advice and is not intended as an endorsement of any specific investment. Past performance is no guarantee of future results.
Not part of the Semiannual Report
Table of Contents
Investors should refer to the Portfolio’s Summary Prospectus and/or Prospectus and consider the Portfolio’s investment objectives, strategies, risks, charges and expenses carefully before investing. The Summary Prospectus and/or Prospectus contain this and other information about the Portfolio. You may obtain copies of the Portfolio’s Summary Prospectus and/or the Prospectus and the Statement of Additional Information free of charge, upon request, by calling toll-free 800-598-2019, by writing to New York Life Insurance and Annuity Corporation, 51 Madison Avenue, Room 251, New York, New York 10010 or by sending an email to MainStayShareholdersServices@nylim.com. These documents are also available at nylinvestments.com/vpdocuments. Please read the Summary Prospectus and/or Prospectus carefully before investing. MainStay VP Funds Trust portfolios are separate account options which are purchased through a variable insurance or variable annuity contract.
Investment and Performance Comparison1(Unaudited)
Performance data quoted represents past performance. Past performance is no guarantee of future results. Because of market volatility and other factors, current performance may be lower or higher than the figures shown. Investment return and principal value will fluctuate, and as a result, when shares are redeemed, they may be worth more or less than their original cost. The performance table and graph do not reflect any deduction of sales charges, mortality and expense charges, contract charges or administrative charges. Please refer to the Performance Summary appropriate for your policy. For performance information current to the most recent month-end, please call800-598-2019 or visit www.newyorklife.com.
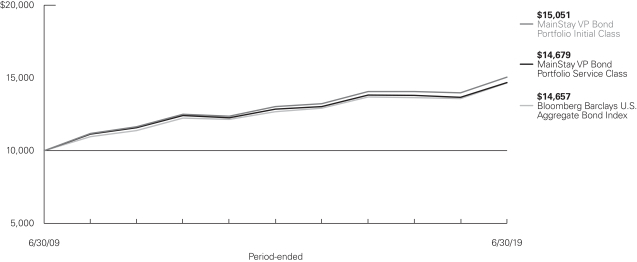
Average Annual Total Returns for the Period-Ended June 30, 2019
| | | | | | | | | | | | | | | | | | | | | | | | |
| Class | | Inception
Date | | | Six Months | | | One Year | | | Five Years | | | Ten Years | | | Gross
Expense
Ratio2 | |
| | | | | | |
Initial Class Shares | | | 1/23/1984 | | | | 6.58 | % | | | 7.76 | % | | | 2.94 | % | | | 4.17 | % | | | 0.53 | % |
Service Class Shares | | | 6/4/2003 | | | | 6.45 | | | | 7.49 | | | | 2.69 | | | | 3.91 | | | | 0.78 | |
| | | | | | | | | | | | | | | | |
| Benchmark Performance | | Six
Months | | | One
Year | | | Five
Years | | | Ten
Years | |
| | | | |
Bloomberg Barclays U.S. Aggregate Bond Index3 | | | 6.11 | % | | | 7.87 | % | | | 2.95 | % | | | 3.90 | % |
Morningstar Intermediate-Term Bond Category Average4 | | | 5.77 | | | | 7.24 | | | | 2.55 | | | | 3.86 | |
| 1. | Performance figures may reflect certain fee waivers and/or expense limitations, without which total returns may have been different. For information on current fee waivers and/or expense limitations (if any), please refer to the Notes to Financial Statements. |
| 2. | The gross expense ratios presented reflect the Portfolio’s “Total Annual Portfolio Operating Expenses” from the most recent Prospectus, as supplemented, and may differ from other expense ratios disclosed in this report. |
| 3. | The Bloomberg Barclays U.S. Aggregate Bond Index is the Portfolio’s primary broad-based securities market index for comparison purposes. The Bloomberg Barclays U.S. Aggregate Bond Index is a broad-based benchmark that measures performance of the investment-grade, U.S. dollar |
| | denominated, fixed-rate taxable bond market, including Treasurys, government-related and corporate securities, mortgage-backed securities (agency fixed-rate and hybrid adjustable-rate mortgage pass-throughs), asset-backed securities and commercial mortgage-backed securities. Results assume reinvestment of all dividends and capital gains. An investment cannot be made directly in an index. |
| 4. | The Morningstar Intermediate-Term Bond Category Average is representative of funds that invest primarily in corporate and other investment-grade U.S. fixed-income issues and typically have durations of 3.5 to 6.0 years. Results are based on average total returns of similar funds with all dividends and capital gain distributions reinvested. |
Cost in Dollars of a $1,000 Investment in MainStay VP Bond Portfolio (Unaudited)
The example below is intended to describe the fees and expenses borne by shareholders during the six-month period from January 1, 2019, to June 30, 2019, and the impact of those costs on your investment.
Example
As a shareholder of the Portfolio you incur two types of costs: (1) transaction costs, including exchange fees and sales charges (loads) on purchases (as applicable), and (2) ongoing costs, including management fees, distribution and/or service (12b-1) fees, and other Portfolio expenses (as applicable). This example is intended to help you understand your ongoing costs (in dollars) of investing in the Portfolio and to compare these costs with the ongoing costs of investing in other mutual funds. The example is based on an investment of $1,000 made at the beginning of the six-month period and held for the entire period from January 1, 2019, to June 30, 2019. Shares are only sold in connection with variable life and annuity contracts and the example does not reflect any contract level or transactional fees or expenses. If these costs had been included, your costs would have been higher.
This example illustrates your Portfolio’s ongoing costs in two ways:
Actual Expenses
The second and third data columns in the table below provide information about actual account values and actual expenses. You may use the information in these columns, together with the amount you invested, to estimate the expenses that you paid during the six months ended June 30, 2019. Simply divide your account value by $1,000
(for example, an $8,600 account value divided by $1,000 = 8.6), then multiply the result by the number under the heading entitled “Expenses Paid During Period” to estimate the expenses you paid on your account during this period.
Hypothetical Example for Comparison Purposes
The fourth and fifth data columns in the table below provide information about hypothetical account values and hypothetical expenses based on the Portfolio’s actual expense ratio and an assumed rate of return of 5% per year before expenses, which is not the Portfolio’s actual return. The hypothetical account values and expenses may not be used to estimate the actual ending account balances or expenses you paid for thesix-month period shown. You may use this information to compare the ongoing costs of investing in the Portfolio with the ongoing costs of investing in other mutual funds. To do so, compare this 5% hypothetical example with the 5% hypothetical examples that appear in the shareholder reports of the other mutual funds.
Please note that the expenses shown in the table are meant to highlight your ongoing costs only and do not reflect any transactional costs, such as exchange fees or sales charges (loads). Therefore, the fourth and fifth data columns of the table are useful in comparing ongoing costs only and will not help you determine the relative total costs of owning different funds. In addition, if these transactional costs were included, your costs would have been higher.
| | | | | | | | | | | | | | | | | | | | | | |
| | | | | | | | | | | | | | | | | | |
| Share Class | | Beginning
Account
Value
1/1/19 | | | Ending Account
Value (Based
on Actual
Returns and
Expenses)
6/30/19 | | | Expenses
Paid
During
Period1 | | | Ending Account
Value (Based
on Hypothetical
5% Annualized
Return and
Actual Expenses)
6/30/19 | | | Expenses
Paid
During
Period1 | | | Net Expense
Ratio
During
Period2 |
| | | | | | |
| Initial Class Shares | | $ | 1,000.00 | | | $ | 1,065.80 | | | $ | 2.77 | | | $ | 1,022.12 | | | $ | 2.71 | | | 0.54% |
| | | | | | |
| Service Class Shares | | $ | 1,000.00 | | | $ | 1,064.50 | | | $ | 4.04 | | | $ | 1,020.88 | | | $ | 3.96 | | | 0.79% |
| 1. | Expenses are equal to the Portfolio’s annualized expense ratio of each class multiplied by the average account value over the period, divided by 365 and multiplied by 181 (to reflect the six-month period). The table above represents the actual expenses incurred during the six-month period. In addition to the fees and expenses which the Portfolio bears directly, it also indirectly bears a pro rata share of the fees and expenses of the underlying funds in which it invests. Such indirect expenses are not included in the above-reported expense figures. |
| 2. | Expenses are equal to the Portfolio’s annualized expense ratio to reflect the six-month period. |
| | |
| 6 | | MainStay VP Bond Portfolio |
Portfolio Composition as of June 30, 2019(Unaudited)
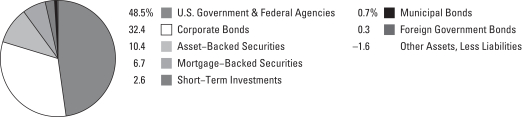
See Portfolio of Investments beginning on page 10 for specific holdings within these categories. The Portfolio’s holdings are subject to change.
Top Ten Issuers Held as of June 30, 2019(excludingshort-term investments) (Unaudited)
| 1. | United States Treasury Notes, 1.75%–2.875%,
due 10/31/20–5/15/29 |
| 2. | Federal National Mortgage Association (Mortgage Pass-Through Securities), 2.50%–7.50%, due 4/1/20–6/1/49 |
| 3. | Federal Home Loan Mortgage Corporation (Mortgage Pass-Through Securities), 3.50%–6.50%, due 7/1/21–5/1/49 |
| 4. | United States Treasury Bonds, 3.00%–4.25%,
due 5/15/39–2/15/49 |
| 5. | Government National Mortgage Association (Mortgage Pass-Through Securities), 3.50%–4.50%, due 6/15/39–3/20/49 |
| 6. | Federal Home Loan Mortgage Corporation, 1.25%–6.25%, due 8/15/19–7/15/32 |
| 7. | Federal Home Loan Bank, 2.30%–3.25%,
due 1/26/21–11/16/28 |
| 8. | Seasoned Credit Risk Transfer Trust, 3.50%–4.00%, due 8/25/57–8/25/58 |
| 9. | Federal Home Loan Mortgage Corporation Multifamily Structured Pass Through Certificates, 3.35%–3.563%, due 1/25/28–5/25/29 |
| 10. | International Bank for Reconstruction & Development,
2.00%–2.88%, due 10/30/20–5/15/24 |
Portfolio Management Discussion and Analysis (Unaudited)
Answers to the questions reflect the views of Kenneth Sommer and AJ Rzad, CFA of NYL Investors LLC, the Portfolio’s Subadvisor.
How did MainStay VP Bond Portfolio perform relative to its benchmark and peers during the six months ended June 30, 2019?
For the six months ended June 30, 2019, MainStay VP Bond Portfolio returned 6.58% for Initial Class shares and 6.45% for Service Class shares. Over the same period, both share classes outperformed the 6.11% return of the Bloomberg Barclays U.S. Aggregate Bond Index, which is the Portfolio’s broad-based securities-market index, and the 5.77% return of the Morningstar Intermediate-Term Bond Category Average.1
What factors affected the Portfolio’s performance relative to its primary benchmark during the reporting period?
Relative to the Bloomberg Barclays U.S. Aggregate Bond Index, the Portfolio held overweight positions in the corporate, asset-backed securities and commercial mortgage-backed securities sectors throughout the reporting period. The corporate sector was the best performing sector during the reporting period. Within the corporate sector, the Portfolio’s allocations to financials and industrials were most accretive to returns. Within thenon-corporate sector, the Portfolio’s positioning in foreign agencies, specifically longer-duration2 securities, also enhanced relative performance. Within the asset-backed sector, the Portfolio’s allocation to collateralized loan obligations had a positive impact on relative performance. During the first half of the reporting period, the Portfolio’s overweight position in U.S. government agencies was accretive to relative performance as well. During the second half of the reporting period, the Portfolio’s overweight allocation to fixed-rate asset-backed securities detracted from relative performance.
What was the Portfolio’s duration strategy during the reporting period?
The Portfolio maintained a duration close to that of the Bloomberg Barclays U.S. Aggregate Bond Index during the reporting period. There were several occasions during which the duration of the Portfolio was shorter than that of the benchmark. This strategy had a slightly negative impact on the Portfolio’s performance. As of June 30, 2019, the Portfolio had a duration of 5.52 years, compared to a duration of 5.53 years for the Bloomberg Barclays U.S. Aggregate Bond Index.
What specific factors, risks or market forces prompted significant decisions for the Portfolio during the reporting period?
The Portfolio maintained overweight positions relative to the Bloomberg Barclays U.S. Aggregate Bond Index in corporate bonds, commercial mortgage-backed securities and asset-backed securities. During the reporting period, we reduced the Portfolio’s exposure to the corporate sector as yields declined and valuations became less attractive despite lingering concerns around global growth and unresolved trade-related tensions with China. Specifically, we reduced exposure across financials, health care and wirelines as these sectors constituted the largest risk positions in the Portfolio.
During the first half of the reporting period, we increased the Portfolio’s allocation to U.S. government agencies. Spreads3 on longer-duration U.S. government agency securities moved wider as market volatility increased towards the end of 2018. This created an attractive opportunity to increase the Portfolio’s overweight exposure to the U.S. government agencies sector.
During the second half of the reporting period, the Portfolio initiated an underweight position in agency mortgage-backed pass-through securities. This move reflected our concerns over elevated prepayment risks and negative supply technicals as rates continued to break into lower ranges. A portion of the underweight position in the mortgage-backed securities sector was offset by the Portfolio’s increased allocation to commercial mortgage-backed securities, which we believe offer an enhanced convexity4 profile due to the call protection in the underlying loans. Throughout the reporting period we maintained the Portfolio’s overweight allocation to asset-backed securities and commercial mortgage-backed securities, which we continued to favor due to the sector’s favorable yield dynamics and high credit quality.
During the reporting period, which market segments were the strongest positive contributors to the Portfolio’s absolute performance and which market segments were particularly weak?
During the reporting period, the Portfolio’s overweight exposure to the corporate sector provided the strongest positive contribution to absolute performance. (Contributions take weightings and total returns into account.) Within the corporate sector, positions in the financial, industrial and utilities subsectors, including overweight holdings in Electricite De France, Bank of America, AT&T and Anheuser-Busch InBev, produced particularly strong returns. The Portfolio’s positioning in the
| 1. | See page 5 for more information on benchmark and peer group returns. |
| 2. | Duration is a measure of the price sensitivity of a fixed-income investment to changes in interest rates. Duration is expressed as a number of years and is considered a more accurate sensitivity gauge than average maturity. |
| 3. | The terms “spread” and “yield spread” may refer to the difference in yield between a security or type of security and comparable U.S. Treasury issues. The terms may also refer to the difference in yield between two specific securities or types of securities at a given time. |
| 4. | Convexity is a mathematical measure of the sensitivity of an interest-bearing bond to changes in interest rates. |
| | |
| 8 | | MainStay VP Bond Portfolio |
Treasury and mortgage-backed securities sectors also enhanced absolute performance during the reporting period.
The asset-backed securities sector made the weakest contribution to the Portfolio’s absolute performance during the same period. Within the asset-backed securities sector, positioning in the floating-rate subcomponent proved particularly disappointing. The Portfolio’s allocation to commercial mortgage-backed securities also provided a relatively weak contribution to absolute performance.
Did the Portfolio make any significant purchases or sales during the reporting period?
During the reporting period, the Portfolio generally sought to purchase corporate bonds during periods of market weakness. As the market stabilized, the Portfolio sold corporate bonds to reduce its overweight exposure relative to the Bloomberg Barclays U.S. Aggregate Bond Index.
How did the Portfolio’s sector weightings change during the reporting period?
The Portfolio held overweight allocations in commercial mortgage-backed securities and asset-backed securities sectors throughout the reporting period. However, in the second half of the reporting period, we moderately reduced the
Portfolio’s allocation to commercial mortgage-backed securities and remained focused on asset-backed securities due to compelling relative value opportunities in collateralized loan obligations and student loans. Throughout the reporting period, we increased the Portfolio’s exposure to the Treasury sector in concert with reductions to corporate sector exposure.
How was the Portfolio positioned at the end of the reporting period?
As of June 30, 2019, the Portfolio held overweight exposure to corporate bonds relative to the Bloomberg Barclays U.S. Aggregate Bond Index. Within the corporate sector, the Portfolio was overweight in financials, industrials and utilities. As of the same date, the Portfolio also held overweight positions in asset-backed securities, commercial mortgage-backed securities and U.S. government agencies, with its largest overweight allocation among these sectors in asset-backed securities.
As of June 30, 2019, the Portfolio held underweight positions in the sovereign and foreign local government sectors. The Portfolio also held underweight exposure to the mortgage-backed securities sector, specifically among30-year 3.0% and 3.5% GNMA coupons. As of the same date, the Portfolio maintained a duration that was approximately equal to the duration of the Bloomberg Barclays U.S. Aggregate Bond Index.
The opinions expressed are those of the portfolio managers as of the date of this report and are subject to change. There is no guarantee that any forecasts will come to pass. This material does not constitute investment advice and is not intended as an endorsement of any specific investment.
Not all MainStay VP Portfolios and/or share classes are available under all policies.
Portfolio of InvestmentsJune 30, 2019 (Unaudited)
| | | | | | | | |
| | | Principal
Amount | | | Value | |
Long-Term Bonds 99.0%† Asset-Backed Securities 10.4% | |
Auto Floor Plan Asset-Backed Securities 0.1% | |
NextGear Floorplan Master Owner Trust
Series 2017-2A, Class A2
2.56%, due 10/17/22 (a) | | $ | 600,000 | | | $ | 601,296 | |
| | | | | | | | |
|
Automobile 1.5% | |
Ally Auto Receivables Trust
Series 2018-3, Class A3
3.00%, due 1/17/23 | | | 1,283,000 | | | | 1,295,070 | |
Avis Budget Rental Car Funding AESOP LLC
Series 2019-1A, Class A
3.45%, due 3/20/23 (a) | | | 400,000 | | | | 409,672 | |
GM Financial Automobile Leasing Trust
Series 2018-2, Class A3
3.06%, due 6/21/21 | | | 1,273,000 | | | | 1,280,152 | |
Mercedes Benz Auto Lease Trust
Series 2019-A, Class A3
3.10%, due 11/15/21 | | | 900,000 | | | | 909,657 | |
OSCAR US Funding Trust
Series 2018-2A, Class A3
3.39%, due 9/12/22 (a) | | | 1,300,000 | | | | 1,320,223 | |
Toyota Auto Loan Extended Note Trust
Series 2019-1A, Class A
2.56%, due 11/25/31 (a) | | | 4,250,000 | | | | 4,299,805 | |
Volkswagen Auto Loan Enhanced Trust
Series 2018-1, Class A3
3.02%, due 11/21/22 | | | 825,000 | | | | 836,654 | |
| | | | | | | | |
| | | | | | | 10,351,233 | |
| | | | | | | | |
Home Equity 0.1% | |
Chase Funding Trust
Series 2002-2, Class 1A5
6.333%, due 4/25/32 (b) | | | 104,609 | | | | 106,547 | |
Morgan Stanley Mortgage Loan Trust
Series 2006-17XS, Class A3A
5.651%, due 10/25/46 (b) | | | 987,860 | | | | 470,452 | |
| | | | | | | | |
| | | | | | | 576,999 | |
| | | | | | | | |
Other Asset-Backed Securities 8.7% | |
Apidos CLO
Series 2015-21A, Class A1R
3.531% (3 Month LIBOR + 0.93%), due 7/18/27 (a)(c) | | | 2,200,000 | | | | 2,200,141 | |
Apidos CLO XXV
Series 2016-25A, Class A1R
3.762% (3 Month LIBOR + 1.17%), due 10/20/31 (a)(c) | | | 1,300,000 | | | | 1,297,916 | |
Bain Capital Credit CLO
Series 2016-2A, Class A
4.017% (3 Month LIBOR + 1.42%), due 1/15/29 (a)(c) | | | 3,475,000 | | | | 3,475,358 | |
| | | | | | | | |
| | | Principal
Amount | | | Value | |
Other Asset-Backed Securities (continued) | | | | | |
Benefit Street Partners CLO IV, Ltd.
Series 2014-IVA, Class A1
3.842% (3 Month LIBOR + 1.25%), due 1/20/29 (a)(c) | | $ | 1,600,000 | | | $ | 1,600,360 | |
Capital Automotive REIT
Series 2017-1A, Class A1
3.87%, due 4/15/47 (a) | | | 2,152,333 | | | | 2,190,353 | |
Cedar Funding IV CLO, Ltd.
Series 2014-4A, Class AR
3.822% (3 Month LIBOR + 1.23%), due 7/23/30 (a)(c) | | | 2,600,000 | | | | 2,598,144 | |
Cedar Funding Ltd.
Series 2017-8A, Class A1
3.838% (3 Month LIBOR + 1.25%), due 10/17/30 (a)(c) | | | 1,250,000 | | | | 1,249,980 | |
DB Master Finance LLC
Series 2019-1A, Class A2I
3.787%, due 5/20/49 (a) | | | 2,625,000 | | | | 2,680,965 | |
Dryden Senior Loan Fund
Series 2018-71A, Class A
3.843% (3 Month LIBOR + 1.15%), due 1/15/29 (a)(c) | | | 650,000 | | | | 650,007 | |
Elara HGV Timeshare Issuer LLC
Series 2017-A, Class A
2.69%, due 3/25/30 (a) | | | 599,052 | | | | 600,170 | |
FOCUS Brands Funding LLC
Series 2017-1A, Class A2I
3.857%, due 4/30/47 (a) | | | 490,000 | | | | 503,656 | |
Galaxy XXII CLO, Ltd.
Series 2016-22A, Class A1R
3.779% (3 Month LIBOR + 1.00%), due 7/16/28 (a)(c) | | | 1,500,000 | | | | 1,499,979 | |
Hilton Grand Vacations Trust (a) | | | | | | | | |
Series 2013-A, Class A
2.28%, due 1/25/26 | | | 389,115 | | | | 388,855 | |
Series 2018-AA, Class A
3.54%, due 2/25/32 | | | 1,663,736 | | | | 1,713,715 | |
HPS Loan Management, Ltd.
Series 2011-A17, Class A
3.825% (3 Month LIBOR + 1.26%), due 5/6/30 (a)(c) | | | 3,000,000 | | | | 3,000,093 | |
JPMorgan Mortgage Acquisition Corp.
Series 2007-CH2, Class AF3
4.686%, due 10/25/30 (b) | | | 643,359 | | | | 463,859 | |
Magnetite XVIII, Ltd.
Series 2016-18A, Class AR
3.598% (3 Month LIBOR + 1.08%), due 11/15/28 (a)(c) | | | 1,900,000 | | | | 1,897,230 | |
MVW Owner Trust (a) | | | | | | | | |
Series 2014-1A, Class A
2.25%, due 9/22/31 | | | 274,107 | | | | 273,366 | |
| | | | |
| 10 | | MainStay VP Bond Portfolio | | The notes to the financial statements are an integral part of,
and should be read in conjunction with, the financial statements. |
| | | | | | | | |
| | | Principal
Amount | | | Value | |
| Asset-Backed Securities (continued) | |
Other Asset-Backed Securities (continued) | | | | | |
MVW Owner Trust (a) (continued) | | | | | | | | |
Series 2019-1A, Class A
2.89%, due 11/20/36 | | $ | 1,250,000 | | | $ | 1,266,470 | |
Navient Private Education Refi Loan Trust
Series 2019-CA, Class A2
3.13%, due 2/15/68 (a) | | | 1,600,000 | | | | 1,634,057 | |
Palmer Square CLO, Ltd.
Series 2015-1A, Class A1R2
3.742% (3 Month LIBOR + 1.22%), due 5/21/29 (a)(c) | | | 2,200,000 | | | | 2,199,987 | |
Regatta VI Funding, Ltd.
Series 2016-1A, Class AR
3.672% (3 Month LIBOR + 1.08%), due 7/20/28 (a)(c) | | | 1,800,000 | | | | 1,798,834 | |
Sierra Receivables Funding Co. LLC (a) | | | | | | | | |
Series 2019-1A, Class A
3.20%, due 1/20/36 | | | 695,317 | | | | 712,400 | |
Series 2018-2A, Class A
3.50%, due 6/20/35 | | | 781,227 | | | | 796,236 | |
Series 2018-3A, Class A
3.69%, due 9/20/35 | | | 407,864 | | | | 422,137 | |
SMB Private Education Loan Trust
Series 2019-B, Class A2A
2.84%, due 6/15/37 (a) | | | 3,000,000 | | | | 3,023,369 | |
SoFi Professional Loan Program LLC (a) | | | | | | | | |
Series 2018-D, Class A1FX
3.12%, due 2/25/48 | | | 594,677 | | | | 599,565 | |
Series 2019-A, Class A1FX
3.18%, due 6/15/48 | | | 1,315,576 | | | | 1,328,051 | |
Sound Point CLO XVI, Ltd.
Series 2017-2A, Class A
3.86% (3 Month LIBOR + 1.28%), due 7/25/30 (a)(c) | | | 1,500,000 | | | | 1,498,512 | |
Taco Bell Funding, LLC
Series 2018-1A, Class A2I
4.318%, due 11/25/48 (a) | | | 1,990,000 | | | | 2,064,207 | |
THL Credit Wind River CLO, Ltd. (a)(c) | | | | | | | | |
Series 2017-4A, Class A
3.67% (3 Month LIBOR + 1.15%), due 11/20/30 | | | 2,243,000 | | | | 2,235,829 | |
Series 2012-1A, Class AR
4.047% (3 Month LIBOR + 1.45%), due 1/15/26 | | | 2,493,867 | | | | 2,494,301 | |
TIAA CLO III, Ltd.
Series 2017-2A, Class A
3.751% (3 Month LIBOR + 1.15%), due 1/16/31 (a)(c) | | | 2,400,000 | | | | 2,384,203 | |
TICP CLO XIII, Ltd.
Series 2019 13A, Class A
3.665% (3 Month LIBOR + 1.30%), due 7/15/32 (a)(c) | | | 1,500,000 | | | | 1,499,967 | |
| | | | | | | | |
| | | Principal
Amount | | | Value | |
Other Asset-Backed Securities (continued) | | | | | |
Treman Park CLO, Ltd.
Series 2015-1A, Class ARR
3.662% (3 Month LIBOR + 1.07%), due 10/20/28 (a)(c) | | $ | 1,245,000 | | | $ | 1,245,002 | |
Voya CLO, Ltd.
Series 2019-1A, Class A
3.813% (3 Month LIBOR + 1.17%), due 4/15/29 (a)(c) | | | 1,250,000 | | | | 1,250,037 | |
VSE VOI Mortgage LLC
Series 2016-A, Class A
2.54%, due 7/20/33 (a) | | | 1,612,140 | | | | 1,611,615 | |
Westcott Park CLO, Ltd.
Series 2016 1A, Class AR
3.684% (3 Month LIBOR + 1.21%), due 7/20/28 (a)(c) | | | 1,850,000 | | | | 1,850,096 | |
| | | | | | | | |
| | | | | | | 60,199,022 | |
| | | | | | | | |
Total Asset-Backed Securities
(Cost $71,962,209) | | | | | | | 71,728,550 | |
| | | | | | | | |
|
| Corporate Bonds 32.4% | |
Aerospace & Defense 0.3% | |
Boeing Co.
3.10%, due 5/1/26 | | | 1,925,000 | | | | 1,981,070 | |
| | | | | | | | |
|
Auto Manufacturers 0.7% | |
Ford Motor Credit Co. LLC
5.875%, due 8/2/21 | | | 3,000,000 | | | | 3,163,377 | |
General Motors Co.
5.15%, due 4/1/38 | | | 1,500,000 | | | | 1,478,537 | |
| | | | | | | | |
| | | | | | | 4,641,914 | |
| | | | | | | | |
Banks 6.7% | |
Banco del Estado de Chile
2.668%, due 1/8/21 (a) | | | 3,150,000 | | | | 3,150,032 | |
Bank of America Corp. | | | | | | | | |
4.33%, due 3/15/50 (d) | | | 3,000,000 | | | | 3,344,540 | |
4.45%, due 3/3/26 | | | 1,570,000 | | | | 1,693,469 | |
BB&T Corp.
3.75%, due 12/6/23 | | | 2,300,000 | | | | 2,427,457 | |
Citigroup, Inc. | | | | | | | | |
4.60%, due 3/9/26 | | | 1,500,000 | | | | 1,622,940 | |
5.30%, due 5/6/44 | | | 1,501,000 | | | | 1,786,076 | |
Credit Suisse Group A.G.
3.869%, due 1/12/29 (a)(d) | | | 500,000 | | | | 515,452 | |
Credit Suisse Group Funding Guernsey, Ltd.
3.80%, due 9/15/22 | | | 1,990,000 | | | | 2,063,036 | |
Fifth Third Bancorp
4.30%, due 1/16/24 | | | 3,875,000 | | | | 4,138,137 | |
Goldman Sachs Group, Inc. | | | | | | | | |
2.905%, due 7/24/23 (d) | | | 500,000 | | | | 504,835 | |
5.15%, due 5/22/45 | | | 975,000 | | | | 1,115,944 | |
| | | | | | |
The notes to the financial statements are an integral part of,
and should be read in conjunction with, the financial statements. | | | | | 11 | |
Portfolio of InvestmentsJune 30, 2019 (Unaudited) (continued)
| | | | | | | | |
| | | Principal
Amount | | | Value | |
| Corporate Bonds (continued) | |
Banks (continued) | | | | | |
HSBC Bank PLC
4.75%, due 1/19/21 (a) | | $ | 1,500,000 | | | $ | 1,555,319 | |
HSBC Holdings PLC
3.973%, due 5/22/30 (d) | | | 1,625,000 | | | | 1,697,404 | |
JPMorgan Chase & Co. | | | | | | | | |
3.702%, due 5/6/30 (d) | | | 1,500,000 | | | | 1,581,555 | |
5.40%, due 1/6/42 | | | 1,925,000 | | | | 2,450,100 | |
Lloyds Bank PLC
6.50%, due 9/14/20 (a) | | | 8,150,000 | | | | 8,505,942 | |
Lloyds Banking Group PLC
4.344%, due 1/9/48 | | | 1,250,000 | | | | 1,218,306 | |
Morgan Stanley | | | | | | | | |
4.10%, due 5/22/23 | | | 2,032,000 | | | | 2,139,014 | |
4.35%, due 9/8/26 | | | 1,556,000 | | | | 1,668,540 | |
SunTrust Bank
3.115% (3 Month LIBOR + 0.59%), due 5/17/22 (c) | | | 3,400,000 | | | | 3,405,289 | |
| | | | | | | | |
| | | | | | | 46,583,387 | |
| | | | | | | | |
Beverages 0.6% | |
Anheuser-Busch InBev Worldwide, Inc.
4.75%, due 1/23/29 | | | 3,750,000 | | | | 4,257,023 | |
| | | | | | | | |
|
Biotechnology 0.3% | |
Amgen, Inc.
4.563%, due 6/15/48 | | | 1,750,000 | | | | 1,896,852 | |
| | | | | | | | |
|
Building Materials 1.0% | |
Fortune Brands Home & Security, Inc.
4.00%, due 6/15/25 | | | 3,775,000 | | | | 3,972,010 | |
Masco Corp.
4.50%, due 5/15/47 | | | 3,000,000 | | | | 2,839,723 | |
| | | | | | | | |
| | | | | | | 6,811,733 | |
| | | | | | | | |
Chemicals 1.0% | |
Dow Chemical Co.
3.15%, due 5/15/24 (a) | | | 975,000 | | | | 994,396 | |
NewMarket Corp.
4.10%, due 12/15/22 | | | 5,536,000 | | | | 5,740,737 | |
| | | | | | | | |
| | | | | | | 6,735,133 | |
| | | | | | | | |
Diversified Financial Services 0.5% | |
GE Capital International Funding Co.
4.418%, due 11/15/35 | | | 3,410,000 | | | | 3,375,070 | |
| | | | | | | | |
|
Electric 4.2% | |
Appalachian Power Co.
6.375%, due 4/1/36 | | | 1,750,000 | | | | 2,217,230 | |
Arizona Public Service Co.
5.50%, due 9/1/35 | | | 1,275,000 | | | | 1,521,799 | |
| | | | | | | | |
| | | Principal
Amount | | | Value | |
Electric (continued) | |
Dayton Power & Light Co.
3.95%, due 6/15/49 (a) | | $ | 1,025,000 | | | $ | 1,053,200 | |
Electricite de France S.A. (a) | | | | | | | | |
2.35%, due 10/13/20 | | | 2,000,000 | | | | 2,001,102 | |
5.00%, due 9/21/48 | | | 3,420,000 | | | | 3,894,525 | |
Entergy Corp.
4.00%, due 7/15/22 | | | 3,700,000 | | | | 3,849,203 | |
Entergy Mississippi, Inc.
3.85%, due 6/1/49 | | | 2,500,000 | | | | 2,613,363 | |
Evergy, Inc.
4.85%, due 6/1/21 | | | 385,000 | | | | 398,754 | |
Exelon Corp.
3.497%, due 6/1/22 | | | 2,750,000 | | | | 2,817,327 | |
FirstEnergy Transmission LLC
4.35%, due 1/15/25 (a) | | | 3,455,000 | | | | 3,708,189 | |
NextEra Energy Capital Holdings, Inc.
3.25%, due 4/1/26 | | | 1,800,000 | | | | 1,850,375 | |
Ohio Edison Co.
6.875%, due 7/15/36 | | | 2,500,000 | | | | 3,353,141 | |
| | | | | | | | |
| | | | | | | 29,278,208 | |
| | | | | | | | |
Food 1.2% | |
Conagra Brands, Inc.
4.85%, due 11/1/28 | | | 2,300,000 | | | | 2,550,991 | |
Ingredion, Inc.
4.625%, due 11/1/20 | | | 1,475,000 | | | | 1,515,091 | |
Kraft Heinz Foods Co.
3.00%, due 6/1/26 | | | 1,170,000 | | | | 1,138,512 | |
Kroger Co.
7.70%, due 6/1/29 | | | 1,000,000 | | | | 1,289,824 | |
Tyson Foods, Inc.
4.00%, due 3/1/26 | | | 1,550,000 | | | | 1,648,558 | |
| | | | | | | | |
| | | | | | | 8,142,976 | |
| | | | | | | | |
Forest Products & Paper 0.3% | |
Fibria Overseas Finance, Ltd.
4.00%, due 1/14/25 | | | 1,850,000 | | | | 1,863,875 | |
| | | | | | | | |
|
Gas 0.2% | |
NiSource, Inc.
5.65%, due 2/1/45 | | | 1,125,000 | | | | 1,366,550 | |
| | | | | | | | |
|
Health Care—Products 0.4% | |
Becton Dickinson & Co.
2.894%, due 6/6/22 | | | 2,500,000 | | | | 2,533,964 | |
| | | | | | | | |
|
Iron & Steel 0.8% | |
Carpenter Technology Corp.
4.45%, due 3/1/23 | | | 1,825,000 | | | | 1,852,290 | |
Reliance Steel & Aluminum Co.
4.50%, due 4/15/23 | | | 3,550,000 | | | | 3,727,385 | |
| | | | | | | | |
| | | | | | | 5,579,675 | |
| | | | | | | | |
| | | | |
| 12 | | MainStay VP Bond Portfolio | | The notes to the financial statements are an integral part of,
and should be read in conjunction with, the financial statements. |
| | | | | | | | |
| | | Principal
Amount | | | Value | |
| Corporate Bonds (continued) | |
Media 1.2% | |
Charter Communications Operating LLC / Charter Communications Operating Capital
4.50%, due 2/1/24 | | $ | 1,750,000 | | | $ | 1,865,069 | |
Comcast Corp.
4.60%, due 10/15/38 | | | 3,000,000 | | | | 3,435,141 | |
Fox Corp. (a) | | | | | | | | |
4.709%, due 1/25/29 | | | 1,200,000 | | | | 1,342,497 | |
5.576%, due 1/25/49 | | | 1,250,000 | | | | 1,529,446 | |
| | | | | | | | |
| | | | | | | 8,172,153 | |
| | | | | | | | |
Miscellaneous—Manufacturing 0.2% | |
Parker-Hannifin Corp.
3.25%, due 6/14/29 | | | 1,300,000 | | | | 1,348,351 | |
| | | | | | | | |
|
Multi-National 1.4% | |
International Bank for Reconstruction & Development | | | | | | | | |
2.00%, due 10/30/20 | | | 3,000,000 | | | | 3,000,003 | |
2.60%, due 6/28/24 | | | 1,000,000 | | | | 998,743 | |
2.70%, due 5/16/22 | | | 2,700,000 | | | | 2,737,000 | |
2.88%, due 5/15/24 | | | 3,050,000 | | | | 3,122,155 | |
| | | | | | | | |
| | | | | | | 9,857,901 | |
| | | | | | | | |
Oil & Gas 2.0% | |
Anadarko Petroleum Corp.
4.85%, due 3/15/21 | | | 2,369,000 | | | | 2,452,331 | |
Cenovus Energy, Inc.
4.25%, due 4/15/27 (e) | | | 2,000,000 | | | | 2,071,747 | |
Helmerich & Payne, Inc.
4.65%, due 3/15/25 | | | 2,900,000 | | | | 3,070,152 | |
Nabors Industries, Inc.
5.00%, due 9/15/20 | | | 985,000 | | | | 987,463 | |
Occidental Petroleum Corp.
4.20%, due 3/15/48 | | | 1,710,000 | | | | 1,728,233 | |
Petroleos Mexicanos | | | | | | | | |
3.50%, due 1/30/23 | | | 1,575,000 | | | | 1,494,517 | |
4.875%, due 1/24/22 | | | 1,450,000 | | | | 1,446,375 | |
5.35%, due 2/12/28 | | | 1,100,000 | | | | 1,001,110 | |
| | | | | | | | |
| | | | | | | 14,251,928 | |
| | | | | | | | |
Oil & Gas Services 0.7% | |
Schlumberger Holdings Corp.
3.75%, due 5/1/24 (a) | | | 4,725,000 | | | | 4,923,352 | |
| | | | | | | | |
|
Packaging & Containers 0.3% | |
WRKCo., Inc.
3.75%, due 3/15/25 | | | 1,825,000 | | | | 1,893,437 | |
| | | | | | | | |
| | | | | | | | |
| | | Principal
Amount | | | Value | |
Pharmaceuticals 0.6% | |
Bayer U.S. Finance II LLC
3.875%, due 12/15/23 (a) | | $ | 2,475,000 | | | $ | 2,570,045 | |
Bristol-Myers Squibb Co.
4.25%, due 10/26/49 (a) | | | 1,675,000 | | | | 1,851,545 | |
| | | | | | | | |
| | | | | | | 4,421,590 | |
| | | | | | | | |
Pipelines 2.4% | |
Energy Transfer Operating, L.P.
6.05%, due 6/1/41 | | | 1,300,000 | | | | 1,455,565 | |
Energy Transfer Partners, L.P. / Regency Energy Finance Corp.
5.875%, due 3/1/22 | | | 4,800,000 | | | | 5,148,989 | |
Enterprise Products Operating LLC
5.10%, due 2/15/45 | | | 2,600,000 | | | | 2,971,968 | |
Kinder Morgan Energy Partners, L.P.
6.375%, due 3/1/41 | | | 400,000 | | | | 483,258 | |
Kinder Morgan, Inc.
5.00%, due 2/15/21 (a) | | | 4,500,000 | | | | 4,667,222 | |
Texas Eastern Transmission, L.P.
2.80%, due 10/15/22 (a) | | | 2,350,000 | | | | 2,346,908 | |
| | | | | | | | |
| | | | | | | 17,073,910 | |
| | | | | | | | |
Real Estate Investment Trusts 2.5% | |
American Campus Communities Operating Partnership, L.P.
3.30%, due 7/15/26 | | | 3,000,000 | | | | 3,030,317 | |
HCP, Inc.
3.25%, due 7/15/26 | | | 2,050,000 | | | | 2,066,029 | |
Highwoods Realty, L.P.
3.625%, due 1/15/23 | | | 5,000,000 | | | | 5,108,348 | |
Host Hotels & Resorts, L.P.
6.00%, due 10/1/21 | | | 1,700,000 | | | | 1,803,171 | |
VEREIT Operating Partnership, L.P.
4.875%, due 6/1/26 | | | 4,872,000 | | | | 5,268,500 | |
| | | | | | | | |
| | | | | | | 17,276,365 | |
| | | | | | | | |
Retail 0.5% | |
CVS Health Corp.
5.05%, due 3/25/48 | | | 3,420,000 | | | | 3,642,708 | |
| | | | | | | | |
|
Software 0.6% | |
Fidelity National Information Services, Inc.
2.25%, due 8/15/21 | | | 1,150,000 | | | | 1,147,643 | |
Fiserv, Inc. | | | | | | | | |
3.20%, due 7/1/26 | | | 1,425,000 | | | | 1,454,469 | |
4.75%, due 6/15/21 | | | 1,355,000 | | | | 1,415,079 | |
| | | | | | | | |
| | | | | | | 4,017,191 | |
| | | | | | | | |
Telecommunications 1.4% | |
AT&T, Inc. | | | | | | | | |
4.50%, due 5/15/35 | | | 1,500,000 | | | | 1,570,210 | |
4.85%, due 3/1/39 | | | 2,000,000 | | | | 2,146,461 | |
| | | | | | |
The notes to the financial statements are an integral part of,
and should be read in conjunction with, the financial statements. | | | | | 13 | |
Portfolio of InvestmentsJune 30, 2019 (Unaudited) (continued)
| | | | | | | | |
| | | Principal
Amount | | | Value | |
| Corporate Bonds (continued) | |
Telecommunications (continued) | |
Orange S.A.
5.375%, due 1/13/42 | | $ | 895,000 | | | $ | 1,082,390 | |
Telefonica Emisiones SAU
5.213%, due 3/8/47 | | | 1,500,000 | | | | 1,653,705 | |
Verizon Communications, Inc.
4.50%, due 8/10/33 | | | 3,150,000 | | | | 3,548,686 | |
| | | | | | | | |
| | | | | | | 10,001,452 | |
| | | | | | | | |
Transportation 0.4% | |
Norfolk Southern Corp.
5.64%, due 5/17/29 | | | 1,400,000 | | | | 1,696,842 | |
Union Pacific Corp.
4.30%, due 3/1/49 | | | 750,000 | | | | 835,883 | |
| | | | | | | | |
| | | | | | | 2,532,725 | |
| | | | | | | | |
Total Corporate Bonds
(Cost $212,383,803) | | | | | | | 224,460,493 | |
| | | | | | | | |
|
| Foreign Government Bonds 0.3% | |
Mexico 0.3% | |
United Mexican States
3.75%, due 1/11/28 | | | 1,850,000 | | | | 1,884,687 | |
| | | | | | | | |
|
Poland 0.0%‡ | |
Republic of Poland Government International Bond
5.00%, due 3/23/22 | | | 350,000 | | | | 375,813 | |
| | | | | | | | |
Total Foreign Government Bonds
(Cost $2,191,512) | | | | | | | 2,260,500 | |
| | | | | | | | |
|
| Mortgage-Backed Securities 6.7% | |
Agency (Collateralized Mortgage Obligations) 1.7% | |
Federal Home Loan Mortgage Corporation
Series 2019-1, Class A1
3.50%, due 5/25/29 | | | 4,179,298 | | | | 4,346,847 | |
Federal Home Loan Mortgage Corporation Multifamily Structured Pass Through Certificates | | | | | | | | |
Series K089, Class A2
3.563%, due 1/25/29 | | | 2,800,000 | | | | 3,042,877 | |
Series K073, Class A2
3.35%, due 1/25/28 | | | 4,250,000 | | | | 4,533,869 | |
| | | | | | | | |
| | | | | | | 11,923,593 | |
| | | | | | | | |
Commercial Mortgage Loans
(Collateralized Mortgage Obligations) 2.8% | |
BX Commercial Mortgage Trust
Series 2019-IMC, Class A
3.44% (3 Month LIBOR + 1.00%), due 4/15/34 (a)(c) | | | 800,000 | | | | 801,004 | |
| | | | | | | | |
| | | Principal
Amount | | | Value | |
Commercial Mortgage Loans
(Collateralized Mortgage Obligations) (continued) | |
COMM Mortgage Trust | | | | | | | | |
Series 2016-COR1, Class A4
3.091%, due 10/10/49 | | $ | 3,000,000 | | | $ | 3,081,520 | |
Series 2015-LC19, Class A4
3.183%, due 2/10/48 | | | 1,400,000 | | | | 1,451,887 | |
CSAIL Commercial MortgageTrust 2018-CX11, Class A4
3.766%, due 4/15/51 | | | 2,000,000 | | | | 2,143,449 | |
Federal Home Loan Mortgage Corporation Multifamily Structured Pass Through Certificates | | | | | | | | |
Series K090, Class A2
3.422%, due 2/25/29 | | | 2,700,000 | | | | 2,905,173 | |
Series K091, Class A2
3.505%, due 3/25/29 | | | 910,000 | | | | 986,468 | |
GRACE Mortgage Trust
Series 2014-GRCE, Class A
3.369%, due 6/10/28 (a) | | | 1,700,000 | | | | 1,732,103 | |
GS Mortgage Securities Trust
Series 2015-GC32, Class AS
4.018%, due 7/10/48 (f) | | | 3,000,000 | | | | 3,211,713 | |
Morgan Stanley Bank of America Merrill Lynch Trust
Series 2015-C21, Class AS
3.652%, due 3/15/48 | | | 1,000,000 | | | | 1,043,154 | |
Wells Fargo Commercial Mortgage Trust
Series 2016-NXS6, Class A2
2.399%, due 11/15/49 | | | 1,900,000 | | | | 1,902,858 | |
| | | | | | | | |
| | | | | | | 19,259,329 | |
| | | | | | | | |
Whole Loan (Collateralized Mortgage Obligations) 2.2% | |
JPMorgan Mortgage Trust (a)(f) | | | | | | | | |
Series 2014-2, Class 1A1
3.00%, due 6/25/29 | | | 1,753,103 | | | | 1,774,504 | |
Series 2015-6, Class A5
3.50%, due 10/25/45 | | | 1,212,146 | | | | 1,230,678 | |
Seasoned Credit Risk Transfer Trust | | | | | | | | |
Series 2018-3, Class MA
3.50%, due 8/25/57 | | | 6,289,307 | | | | 6,513,249 | |
Series 2019-2, Class MA
3.50%, due 8/25/58 | | | 3,127,373 | | | | 3,247,352 | |
Series 2019-2, Class M55D
4.00%, due 8/25/58 | | | 2,543,561 | | | | 2,643,416 | |
| | | | | | | | |
| | | | | | | 15,409,199 | |
| | | | | | | | |
Total Mortgage-Backed Securities
(Cost $45,752,726) | | | | | | | 46,592,121 | |
| | | | | | | | |
| | | | |
| 14 | | MainStay VP Bond Portfolio | | The notes to the financial statements are an integral part of,
and should be read in conjunction with, the financial statements. |
| | | | | | | | |
| | | Principal
Amount | | | Value | |
| Municipal Bonds 0.7% | |
Texas 0.7% | |
San Antonio Water System, Revenue Bonds
5.502%, due 5/15/29 | | $ | 2,000,000 | | | $ | 2,375,420 | |
Texas Transportation Commission State Highway Fund, Revenue Bonds
5.178%, due 4/1/30 | | | 2,150,000 | | | | 2,599,329 | |
| | | | | | | | |
Total Municipal Bonds
(Cost $4,683,301) | | | | | | | 4,974,749 | |
| | | | | | | | |
|
| U.S. Government & Federal Agencies 48.5% | |
Federal Home Loan Bank 3.7% | | | | | | | | |
2.30%, due 1/26/21 | | | 2,500,000 | | | | 2,500,561 | |
2.50%, due 12/10/27 | | | 3,000,000 | | | | 3,059,063 | |
2.51%, due 12/29/22 | | | 2,100,000 | | | | 2,102,346 | |
2.65%, due 5/23/22 | | | 1,300,000 | | | | 1,300,375 | |
3.00%, due 3/10/28 | | | 1,900,000 | | | | 2,007,401 | |
3.125%, due 9/12/25 | | | 3,100,000 | | | | 3,297,501 | |
3.25%, due 6/9/28 | | | 4,000,000 | | | | 4,321,054 | |
3.25%, due 11/16/28 | | | 6,500,000 | | | | 7,063,600 | |
| | | | | | | | |
| | | | | | | 25,651,901 | |
| | | | | | | | |
Federal Home Loan Mortgage Corporation 3.1% | |
1.25%, due 8/15/19 | | | 2,000,000 | | | | 1,997,600 | |
2.55%, due 6/6/22 | | | 2,000,000 | | | | 2,000,747 | |
2.55%, due 6/20/22 | | | 1,425,000 | | | | 1,425,254 | |
2.70%, due 9/27/21 | | | 2,000,000 | | | | 2,002,448 | |
2.70%, due 4/5/22 | | | 2,000,000 | | | | 2,000,120 | |
2.70%, due 4/8/22 | | | 2,000,000 | | | | 2,003,144 | |
2.75%, due 6/17/24 | | | 1,700,000 | | | | 1,700,324 | |
2.753%, due 1/30/23 | | | 2,100,000 | | | | 2,101,127 | |
2.89%, due 4/16/24 | | | 2,000,000 | | | | 2,003,334 | |
2.90%, due 5/9/24 | | | 2,300,000 | | | | 2,301,462 | |
6.25%, due 7/15/32 | | | 1,600,000 | | | | 2,297,190 | |
| | | | | | | | |
| | | | | | | 21,832,750 | |
| | | | | | | | |
Federal Home Loan Mortgage Corporation
(Mortgage Pass-Through Securities) 6.5% | |
3.50%, due 2/1/44 | | | 1,841,091 | | | | 1,912,508 | |
3.50%, due 1/1/45 | | | 1,251,438 | | | | 1,303,968 | |
3.50%, due 9/1/45 | | | 3,201,434 | | | | 3,303,994 | |
3.50%, due 3/1/46 | | | 733,915 | | | | 757,308 | |
3.50%, due 4/1/46 | | | 749,193 | | | | 772,967 | |
3.50%, due 9/1/46 | | | 248,131 | | | | 255,696 | |
3.50%, due 12/1/46 | | | 381,316 | | | | 392,824 | |
3.50%, due 11/1/47 | | | 911,288 | | | | 938,659 | |
3.50%, due 3/1/48 | | | 572,733 | | | | 588,983 | |
3.50%, due 5/1/48 | | | 6,118,999 | | | | 6,282,578 | |
3.50%, due 6/1/49 | | | 6,250,000 | | | | 6,413,896 | |
4.00%, due 7/1/23 | | | 112,362 | | | | 117,070 | |
4.00%, due 8/1/25 | | | 56,695 | | | | 58,998 | |
4.00%, due 11/1/41 | | | 1,074 | | | | 1,128 | |
| | | | | | | | |
| | | Principal
Amount | | | Value | |
Federal Home Loan Mortgage Corporation
(Mortgage Pass-Through Securities) (continued) | |
4.00%, due 1/1/42 | | $ | 347 | | | $ | 365 | |
4.00%, due 4/1/42 | | | 37,080 | | | | 38,944 | |
4.00%, due 5/1/44 | | | 52,693 | | | | 55,176 | |
4.00%, due 7/1/45 | | | 3,538 | | | | 3,690 | |
4.00%, due 8/1/45 | | | 2,570 | | | | 2,680 | |
4.00%, due 10/1/45 | | | 1,726 | | | | 1,800 | |
4.00%, due 11/1/45 | | | 672 | | | | 699 | |
4.00%, due 6/1/47 | | | 16,434 | | | | 17,158 | |
4.00%, due 5/1/48 | | | 6,685 | | | | 6,956 | |
4.00%, due 12/1/48 | | | 7,374,331 | | | | 7,655,503 | |
4.00%, due 5/1/49 | | | 6,832,785 | | | | 7,106,197 | |
4.50%, due 4/1/22 | | | 11,937 | | | | 12,189 | |
4.50%, due 4/1/23 | | | 6,038 | | | | 6,232 | |
4.50%, due 11/1/39 | | | 856,274 | | | | 920,059 | |
4.50%, due 8/1/40 | | | 129,376 | | | | 139,046 | |
4.50%, due 9/1/40 | | | 723,314 | | | | 774,969 | |
4.50%, due 11/1/40 | | | 341,618 | | | | 361,522 | |
4.50%, due 7/1/41 | | | 194,202 | | | | 208,719 | |
4.50%, due 2/1/47 | | | 274,347 | | | | 289,051 | |
4.50%, due 10/1/47 | | | 305,762 | | | | 323,319 | |
4.50%, due 4/1/48 | | | 257,079 | | | | 270,381 | |
4.50%, due 5/1/48 | | | 176,134 | | | | 185,145 | |
4.50%, due 8/1/48 | | | 362,327 | | | | 380,693 | |
4.50%, due 9/1/48 | | | 549,979 | | | | 576,182 | |
5.00%, due 3/1/25 | | | 73,296 | | | | 75,464 | |
5.00%, due 8/1/35 | | | 47,589 | | | | 52,067 | |
5.00%, due 4/1/37 | | | 537,110 | | | | 587,660 | |
5.00%, due 8/1/37 | | | 133,254 | | | | 145,059 | |
5.00%, due 3/1/40 | | | 254,611 | | | | 276,734 | |
5.50%, due 9/1/21 | | | 17,137 | | | | 17,291 | |
5.50%, due 9/1/22 | | | 29,850 | | | | 30,328 | |
5.50%, due 9/1/37 | | | 300,179 | | | | 333,488 | |
5.50%, due 8/1/38 | | | 130,959 | | | | 142,572 | |
5.50%, due 12/1/38 | | | 135,848 | | | | 150,379 | |
6.00%, due 7/1/21 | | | 39,253 | | | | 39,824 | |
6.00%, due 8/1/36 | | | 57,919 | | | | 65,578 | |
6.00%, due 9/1/37 | | | 131,052 | | | | 147,966 | |
6.00%, due 5/1/40 | | | 336,587 | | | | 381,898 | |
6.50%, due 11/1/35 | | | 20,796 | | | | 23,200 | |
6.50%, due 8/1/37 | | | 26,791 | | | | 31,670 | |
| | | | | | | | |
| | | | | | | 44,938,430 | |
| | | | | | | | |
Federal National Mortgage Association 1.1% | |
1.25%, due 7/26/19 | | | 2,500,000 | | | | 2,498,320 | |
1.875%, due 9/24/26 | | | 900,000 | | | | 890,827 | |
6.25%, due 5/15/29 | | | 3,000,000 | | | | 4,049,443 | |
| | | | | | | | |
| | | | | | | 7,438,590 | |
| | | | | | | | |
| | | | | | |
The notes to the financial statements are an integral part of,
and should be read in conjunction with, the financial statements. | | | | | 15 | |
Portfolio of InvestmentsJune 30, 2019 (Unaudited) (continued)
| | | | | | | | |
| | | Principal
Amount | | | Value | |
| U.S. Government & Federal Agencies (continued) | |
Federal National Mortgage Association
(Mortgage Pass-Through Securities) 10.4% | |
2.50%, due 5/1/43 | | $ | 552,890 | | | $ | 551,208 | |
2.91%, due 4/1/26 | | | 6,450,000 | | | | 6,609,157 | |
3.00%, due 9/1/42 | | | 1,985,791 | | | | 2,020,003 | |
3.00%, due 9/1/43 | | | 1,401,319 | | | | 1,425,466 | |
3.00%, due 12/1/43 | | | 1,400,024 | | | | 1,421,763 | |
3.00%, due 11/1/46 | | | 12,356,069 | | | | 12,515,554 | |
3.00%, due 2/1/47 | | | 2,557,733 | | | | 2,589,881 | |
3.00%, due 7/1/47 | | | 1,366,565 | | | | 1,383,823 | |
3.00%, due 7/1/48 | | | 1,615,850 | | | | 1,636,821 | |
3.50%, due 11/1/40 | | | 223,726 | | | | 230,685 | |
3.50%, due 10/1/43 | | | 1,071,540 | | | | 1,112,472 | |
3.50%, due 11/1/43 | | | 693,773 | | | | 720,240 | |
3.50%, due 1/1/44 | | | 1,059,982 | | | | 1,100,389 | |
3.50%, due 5/1/45 | | | 1,446,282 | | | | 1,507,738 | |
3.50%, due 8/1/45 | | | 2,071,149 | | | | 2,136,170 | |
3.50%, due 9/1/45 | | | 475,290 | | | | 490,211 | |
3.50%, due 3/1/46 | | | 585,791 | | | | 604,086 | |
3.50%, due 9/1/46 | | | 1,226,656 | | | | 1,276,427 | |
3.50%, due 1/1/47 | | | 1,078,829 | | | | 1,110,695 | |
3.50%, due 10/1/47 | | | 4,586,127 | | | | 4,722,927 | |
3.50%, due 12/1/47 | | | 627,118 | | | | 646,015 | |
3.50%, due 1/1/48 | | | 1,092,632 | | | | 1,125,165 | |
4.00%, due 4/1/20 | | | 202 | | | | 209 | |
4.00%, due 10/1/20 | | | 18 | | | | 19 | |
4.00%, due 3/1/22 | | | 32,878 | | | | 34,128 | |
4.00%, due 12/1/25 | | | 390,711 | | | | 406,394 | |
4.00%, due 12/1/39 | | | 94,757 | | | | 99,894 | |
4.00%, due 7/1/40 | | | 498,675 | | | | 525,723 | |
4.00%, due 5/1/42 | | | 1,289,129 | | | | 1,359,591 | |
4.00%, due 11/1/45 | | | 355,942 | | | | 372,295 | |
4.00%, due 12/1/45 | | | 349,786 | | | | 365,856 | |
4.00%, due 5/1/46 | | | 418,987 | | | | 438,234 | |
4.00%, due 6/1/46 | | | 2,952,028 | | | | 3,091,586 | |
4.00%, due 9/1/46 | | | 315,514 | | | | 329,914 | |
4.00%, due 4/1/47 | | | 9,559 | | | | 9,982 | |
4.00%, due 5/1/47 | | | 16,599 | | | | 17,329 | |
4.00%, due 6/1/47 | | | 3,187 | | | | 3,327 | |
4.00%, due 9/1/47 | | | 7,513 | | | | 7,820 | |
4.00%, due 10/1/47 | | | 5,381 | | | | 5,601 | |
4.00%, due 11/1/47 | | | 5,617 | | | | 5,847 | |
4.00%, due 1/1/48 | | | 9,026 | | | | 9,376 | |
4.00%, due 6/1/49 | | | 6,300,000 | | | | 6,573,066 | |
4.50%, due 5/1/24 | | | 183,991 | | | | 189,858 | |
4.50%, due 11/1/35 | | | 173,679 | | | | 186,275 | |
4.50%, due 4/1/41 | | | 475,805 | | | | 511,042 | |
4.50%, due 5/1/41 | | | 682,543 | | | | 733,084 | |
4.50%, due 7/1/41 | | | 563,350 | | | | 605,071 | |
4.50%, due 9/1/41 | | | 220,421 | | | | 236,745 | |
4.50%, due 3/1/44 | | | 263,463 | | | | 280,555 | |
| | | | | | | | |
| | | Principal
Amount | | | Value | |
Federal National Mortgage Association
(Mortgage Pass-Through Securities) (continued) | |
4.50%, due 8/1/44 | | $ | 1,289,751 | | | $ | 1,381,993 | |
4.50%, due 11/1/44 | | | 308,404 | | | | 327,986 | |
4.50%, due 3/1/46 | | | 175,862 | | | | 186,205 | |
4.50%, due 12/1/46 | | | 297,290 | | | | 313,274 | |
4.50%, due 2/1/47 | | | 170,004 | | | | 178,973 | |
4.50%, due 7/1/47 | | | 342,358 | | | | 360,457 | |
4.50%, due 2/1/48 | | | 253,501 | | | | 266,561 | |
4.50%, due 4/1/48 | | | 156,108 | | | | 163,419 | |
4.50%, due 8/1/48 | | | 177,683 | | | | 185,628 | |
4.50%, due 10/1/48 | | | 180,219 | | | | 188,268 | |
4.50%, due 11/1/48 | | | 371,474 | | | | 388,065 | |
4.50%, due 12/1/48 | | | 278,569 | | | | 292,324 | |
5.00%, due 12/1/23 | | | 134,242 | | | | 138,173 | |
5.00%, due 3/1/34 | | | 366,711 | | | | 390,176 | |
5.00%, due 4/1/34 | | | 249,866 | | | | 273,751 | |
5.00%, due 4/1/35 | | | 89,800 | | | | 98,158 | |
5.00%, due 2/1/36 | | | 153,269 | | | | 167,594 | |
5.00%, due 5/1/37 | | | 247 | | | | 267 | |
5.00%, due 6/1/37 | | | 178,342 | | | | 194,187 | |
5.00%, due 5/1/38 | | | 239,780 | | | | 260,345 | |
5.00%, due 1/1/39 | | | 100,352 | | | | 108,776 | |
5.00%, due 3/1/44 | | | 136,904 | | | | 148,469 | |
5.00%, due 9/1/48 | | | 321,146 | | | | 344,247 | |
5.50%, due 1/1/21 | | | 767 | | | | 775 | |
5.50%, due 12/1/21 | | | 2,823 | | | | 2,883 | |
5.50%, due 1/1/22 | | | 12,171 | | | | 12,378 | |
5.50%, due 2/1/22 | | | 765 | | | | 779 | |
5.50%, due 4/1/34 | | | 98,372 | | | | 108,458 | |
5.50%, due 8/1/37 | | | 83,333 | | | | 92,560 | |
5.50%, due 3/1/38 | | | 183,956 | | | | 201,397 | |
5.50%, due 6/1/38 | | | 187,272 | | | | 207,894 | |
5.50%, due 1/1/39 | | | 429,913 | | | | 477,457 | |
5.50%, due 11/1/39 | | | 79,395 | | | | 86,213 | |
5.50%, due 6/1/40 | | | 59,972 | | | | 66,491 | |
6.00%, due 3/1/36 | | | 24,693 | | | | 27,976 | |
6.00%, due 10/1/38 | | | 291,949 | | | | 328,644 | |
6.00%, due 12/1/38 | | | 275,017 | | | | 311,901 | |
6.00%, due 4/1/40 | | | 139,500 | | | | 158,201 | |
6.50%, due 10/1/36 | | | 33,618 | | | | 38,496 | |
6.50%, due 8/1/37 | | | 8,404 | | | | 9,403 | |
7.00%, due 9/1/37 | | | 51,358 | | | | 60,465 | |
7.00%, due 10/1/37 | | | 621 | | | | 735 | |
7.00%, due 11/1/37 | | | 6,778 | | | | 7,797 | |
7.50%, due 7/1/28 | | | 14,969 | | | | 16,332 | |
| | | | | | | | |
| | | | | | | 71,910,248 | |
| | | | | | | | |
Government National Mortgage Association
(Mortgage Pass-Through Securities) 3.8% | |
3.50%, due 6/20/42 | | | 875,966 | | | | 914,532 | |
3.50%, due 8/20/43 | | | 1,197,292 | | | | 1,247,681 | |
| | | | |
| 16 | | MainStay VP Bond Portfolio | | The notes to the financial statements are an integral part of,
and should be read in conjunction with, the financial statements. |
| | | | | | | | |
| | | Principal
Amount | | | Value | |
| U.S. Government & Federal Agencies (continued) | |
Government National Mortgage Association
(Mortgage Pass-Through Securities) (continued) | |
3.50%, due 11/20/43 | | $ | 1,157,773 | | | $ | 1,206,026 | |
3.50%, due 4/20/45 | | | 889,817 | | | | 922,935 | |
3.50%, due 12/20/45 | | | 1,413,094 | | | | 1,470,689 | |
3.50%, due 2/20/46 | | | 674,421 | | | | 697,967 | |
3.50%, due 10/20/46 | | | 970,334 | | | | 1,004,214 | |
3.50%, due 11/20/46 | | | 1,133,403 | | | | 1,172,977 | |
3.50%, due 1/20/47 | | | 978,936 | | | | 1,013,017 | |
3.50%, due 5/20/47 | | | 1,523,969 | | | | 1,576,401 | |
3.50%, due 6/20/47 | | | 522,301 | | | | 540,217 | |
3.50%, due 7/20/47 | | | 804,496 | | | | 831,928 | |
3.50%, due 8/20/47 | | | 479,218 | | | | 495,511 | |
3.50%, due 9/20/47 | | | 766,110 | | | | 792,069 | |
3.50%, due 1/20/49 | | | 384,750 | | | | 397,637 | |
4.00%, due 1/20/42 | | | 1,049,297 | | | | 1,111,287 | |
4.00%, due 2/20/42 | | | 408,398 | | | | 432,546 | |
4.00%, due 8/20/43 | | | 1,321,042 | | | | 1,389,281 | |
4.00%, due 10/20/43 | | | 403,133 | | | | 425,417 | |
4.00%, due 3/15/44 | | | 54,691 | | | | 58,087 | |
4.00%, due 6/20/44 | | | 385,701 | | | | 406,687 | |
4.00%, due 7/15/44 | | | 387,210 | | | | 411,259 | |
4.00%, due 8/20/44 | | | 343,029 | | | | 360,337 | |
4.00%, due 9/20/44 | | | 351,085 | | | | 370,205 | |
4.00%, due 12/20/44 | | | 237,525 | | | | 250,468 | |
4.00%, due 1/20/45 | | | 184,929 | | | | 194,988 | |
4.00%, due 4/20/45 | | | 242,792 | | | | 256,005 | |
4.00%, due 7/15/45 | | | 247,769 | | | | 263,150 | |
4.00%, due 9/20/45 | | | 123,136 | | | | 129,465 | |
4.00%, due 2/20/46 | | | 229,462 | | | | 241,088 | |
4.00%, due 12/20/46 | | | 353,218 | | | | 369,719 | |
4.00%, due 1/20/47 | | | 309,628 | | | | 323,250 | |
4.00%, due 2/20/47 | | | 311,733 | | | | 325,392 | |
4.00%, due 3/20/47 | | | 717,575 | | | | 750,510 | |
4.00%, due 4/20/47 | | | 207,999 | | | | 217,291 | |
4.00%, due 5/20/47 | | | 431,714 | | | | 450,380 | |
4.00%, due 7/20/47 | | | 393,839 | | | | 410,938 | |
4.00%, due 12/20/47 | | | 420,789 | | | | 438,379 | |
4.00%, due 6/20/48 | | | 552,379 | | | | 573,446 | |
4.00%, due 8/20/48 | | | 632,356 | | | | 655,939 | |
4.00%, due 3/20/49 | | | 297,483 | | | | 308,560 | |
4.50%, due 6/15/39 | | | 975,666 | | | | 1,051,144 | |
4.50%, due 6/15/40 | | | 273,912 | | | | 295,301 | |
| | | | | | | | |
| | | | | | | 26,754,320 | |
| | | | | | | | |
Tennessee Valley Authority 0.4% | | | | | | | | |
5.25%, due 9/15/39 | | | 2,000,000 | | | | 2,665,341 | |
| | | | | | | | |
| | |
United States Treasury Bonds 3.9% | | | | | | | | |
3.00%, due 2/15/49 | | | 20,950,000 | | | | 23,008,992 | |
4.25%, due 5/15/39 | | | 2,925,000 | | | | 3,826,494 | |
| | | | | | | | |
| | | | | | | 26,835,486 | |
| | | | | | | | |
| | | | | | | | |
| | | Principal
Amount | | | Value | |
United States Treasury Notes 15.6% | | | | | | | | |
1.75%, due 6/15/22 | | $ | 21,400,000 | | | $ | 21,430,094 | |
2.00%, due 5/31/24 | | | 20,875,000 | | | | 21,120,444 | |
2.125%, due 5/31/21 | | | 15,300,000 | | | | 15,403,992 | |
2.125%, due 5/31/26 | | | 2,350,000 | | | | 2,389,289 | |
2.25%, due 11/15/25 | | | 8,875,000 | | | | 9,088,901 | |
2.375%, due 5/15/29 (e) | | | 600,000 | | | | 620,039 | |
2.50%, due 1/31/21 | | | 1,500,000 | | | | 1,515,703 | |
2.50%, due 2/15/22 | | | 17,000,000 | | | | 17,334,024 | |
2.875%, due 10/31/20 | | | 18,785,000 | | | | 19,029,352 | |
| | | | | | | | |
| | | | | | | 107,931,838 | |
| | | | | | | | |
Total U.S. Government & Federal Agencies
(Cost $331,418,399) | | | | | | | 335,958,904 | |
| | | | | | | | |
TotalLong-Term Bonds
(Cost $668,391,950) | | | | | | | 685,975,317 | |
| | | | | | | | |
|
| Short-Term Investments 2.6% | |
Repurchase Agreement 0.7% | |
RBC Capital Markets
2.46%, dated 6/28/19
due 7/1/19
Proceeds at Maturity $5,205,067 (Collateralized by United States Treasury Note with a rate of 1.25% and a maturity date of 3/31/21, with a Principal Amount of $5,344,200 and a Market Value of $5,309,209) | | | 5,204,000 | | | | 5,204,000 | |
| | | | | | | | |
Total Repurchase Agreement
(Cost $5,204,000) | | | | | | | 5,204,000 | |
| | | | | | | | |
|
U.S. Government & Federal Agencies 1.5% | |
Federal Home Loan Bank Discount Notes
2.028%, due 7/1/19 (g)(h) | | | 8,100,000 | | | | 8,100,000 | |
United States Treasury Bills
2.242%, due 9/5/19 | | | 2,200,000 | | | | 2,191,560 | |
| | | | | | | | |
Total U.S. Government & Federal Agencies
(Cost $10,291,129) | | | | | | | 10,291,560 | |
| | | | | | | | |
| | | | | | |
The notes to the financial statements are an integral part of,
and should be read in conjunction with, the financial statements. | | | | | 17 | |
Portfolio of InvestmentsJune 30, 2019 (Unaudited) (continued)
| | | | | | | | |
| | |
Shares | | | Value | |
Short-Term Investments (continued) | |
Unaffiliated Investment Company 0.4% | |
State Street Navigator Securities Lending Government Money Market Portfolio, 2.33% (h)(i) | | $ | 2,743,200 | | | $ | 2,743,200 | |
| | | | | | | | |
Total Unaffiliated Investment Company
(Cost $2,743,200) | | | | | | | 2,743,200 | |
| | | | | | | | |
TotalShort-Term Investments
(Cost $18,238,329) | | | | | | | 18,238,760 | |
| | | | | | | | |
Total Investments
(Cost $686,630,279) | | | 101.6 | % | | | 704,214,077 | |
Other Assets, Less Liabilities | | | (1.6 | ) | | | (11,216,368 | ) |
Net Assets | | | 100.0 | % | | $ | 692,997,709 | |
| † | Percentages indicated are based on Portfolio net assets. |
| ‡ | Less than one-tenth of a percent. |
| (a) | May be sold to institutional investors only under Rule 144A or securities offered pursuant to Section 4(a)(2) of the Securities Act of 1933, as amended. |
| (b) | Step coupon—Rate shown was the rate in effect as of June 30, 2019. |
| (c) | Floating rate—Rate shown was the rate in effect as of June 30, 2019. |
| (d) | Fixed to floating rate—Rate shown was the rate in effect as of June 30, 2019. |
| (e) | All or a portion of this security was held on loan. As of June 30, 2019, the aggregate market value of securities on loan was $2,690,119 and the Portfolio received cash collateral with a value of $2,743,200 (See Note 2(J)). |
| (f) | Coupon rate may change based on changes of the underlying collateral or prepayments of principal. The coupon rate shown represents the rate at period end. |
| (g) | Interest rate shown represents yield to maturity. |
| (h) | Current yield as of June 30, 2019. |
| (i) | Represents security purchased with cash collateral received for securities on loan. |
As of June 30, 2019, the Portfolio held the following futures contracts1:
| | | | | | | | | | | | | | | | | | | | |
Type | | Number of
Contracts | | | Expiration
Date | | | Value at
Trade Date | | | Current
Notional
Amount | | | Unrealized
Appreciation (Depreciation)2 | |
Long Contracts | | | | | | | | | | | | | | | | | | | | |
| 2-Year United States Treasury Note | | | 152 | | | | September 2019 | | | $ | 32,526,730 | | | $ | 32,707,313 | | | $ | 180,583 | |
| 5-Year United States Treasury Note | | | 236 | | | | September 2019 | | | | 27,525,738 | | | | 27,884,875 | | | | 359,137 | |
| 10-Year United States Treasury Note | | | 23 | | | | September 2019 | | | | 2,930,025 | | | | 2,943,281 | | | | 13,256 | |
| United States Treasury Ultra Bond | | | 93 | | | | September 2019 | | | | 15,932,236 | | | | 16,513,312 | | | | 581,076 | |
| | | | | | | | | | | | | | | | | | | | |
| Total Long Contracts | | | | | | | | | | | | | | | | | | | 1,134,052 | |
| | | | | | | | | | | | | | | | | | | | |
Short Contracts | | | | | | | | | | | | | | | | | | | | |
| 10-Year United States Treasury Ultra Note | | | (94 | ) | | | September 2019 | | | | (12,750,620 | ) | | | (12,983,750 | ) | | | (233,130 | ) |
| | | | | | | | | | | | | | | | | | | | |
| Total Short Contracts | | | | | | | | | | | | | | | | | | | (233,130 | ) |
| | | | | | | | | | | | | | | | | | | | |
| Net Unrealized Appreciation | | | | | | | | | | | | | | | | | | $ | 900,922 | |
| | | | | | | | | | | | | | | | | | | | |
| 1. | As of June 30, 2019, cash in the amount of $483,620 was on deposit with a broker or futures commission merchant for futures transactions. |
| 2. | Represents the difference between the value of the contracts at the time they were opened and the value as of June 30, 2019. |
The following abbreviations are used in the preceding pages:
LIBOR—London Interbank Offered Rate
REIT—Real Estate Investment Trust
| | | | |
| 18 | | MainStay VP Bond Portfolio | | The notes to the financial statements are an integral part of,
and should be read in conjunction with, the financial statements. |
The following is a summary of the fair valuations according to the inputs used as of June 30, 2019, for valuing the Portfolio’s assets and liabilities:
| | | | | | | | | | | | | | | | |
Description | | Quoted
Prices in
Active
Markets for
Identical
Assets
(Level 1) | | | Significant
Other
Observable
Inputs
(Level 2) | | | Significant
Unobservable
Inputs
(Level 3) | | | Total | |
| | | | |
Asset Valuation Inputs | | | | | | | | | | | | | | | | |
| Investments in Securities (a) | | | | | | | | | | | | | | | | |
| Long-Term Bonds | | | | | | | | | | | | | | | | |
Asset-Backed Securities | | $ | — | | | $ | 71,728,550 | | | $ | — | | | $ | 71,728,550 | |
Corporate Bonds | | | — | | | | 224,460,493 | | | | — | | | | 224,460,493 | |
Foreign Government Bonds | | | — | | | | 2,260,500 | | | | — | | | | 2,260,500 | |
Mortgage-Backed Securities | | | — | | | | 46,592,121 | | | | — | | | | 46,592,121 | |
Municipal Bonds | | | — | | | | 4,974,749 | | | | — | | | | 4,974,749 | |
U.S. Government & Federal Agencies | | | — | | | | 335,958,904 | | | | — | | | | 335,958,904 | |
| | | | | | | | | | | | | | | | |
| TotalLong-Term Bonds | | | — | | | | 685,975,317 | | | | — | | | | 685,975,317 | |
| | | | | | | | | | | | | | | | |
| Short-Term Investments | | | | | | | | | | | | | | | | |
Repurchase Agreements | | | — | | | | 5,204,000 | | | | — | | | | 5,204,000 | |
U.S. Government & Federal Agencies | | | — | | | | 10,291,560 | | | | — | | | | 10,291,560 | |
Unaffiliated Investment Company | | | 2,743,200 | | | | — | | | | — | | | | 2,743,200 | |
| | | | | | | | | | | | | | | | |
| TotalShort-Term Investments | | | 2,743,200 | | | | 15,495,560 | | | | — | | | | 18,238,760 | |
| | | | | | | | | | | | | | | | |
| Total Investments in Securities | | | 2,743,200 | | | | 701,470,877 | | | | — | | | | 704,214,077 | |
| | | | | | | | | | | | | | | | |
| Other Financial Instruments | | | | | | | | | | | | | | | | |
Futures Contracts (b) | | | 1,134,052 | | | | — | | | | — | | | | 1,134,052 | |
| | | | | | | | | | | | | | | | |
| Total Investments in Securities and Other Financial Instruments | | $ | 3,877,252 | | | $ | 701,470,877 | | | $ | — | | | $ | 705,348,129 | |
| | | | | | | | | | | | | | | | |
| | | | |
Liability Valuation Inputs | | | | | | | | | | | | | | | | |
| Other Financial Instruments | | | | | | | | | | | | | | | | |
Futures Contracts (b) | | $ | (233,130 | ) | | $ | — | | | $ | — | | | $ | (233,130 | ) |
| | | | | | | | | | | | | | | | |
| (a) | For a complete listing of investments and their industries, see the Portfolio of Investments. |
| (b) | The value listed for these securities reflects unrealized appreciation (depreciation) as shown on the Portfolio of Investments. |
| | | | | | |
The notes to the financial statements are an integral part of,
and should be read in conjunction with, the financial statements. | | | | | 19 | |
Statement of Assets and Liabilitiesas of June 30, 2019 (Unaudited)
| | | | |
| Assets | | | | |
Investment in unaffiliated securities, at value
(identified cost $686,630,279) including securities on loan of $2,690,119 | | $ | 704,214,077 | |
Cash | | | 10,300,104 | |
Cash collateral on deposit at broker for futures contracts | | | 483,620 | |
Receivables: | | | | |
Investment securities sold | | | 32,328,464 | |
Interest | | | 4,368,126 | |
Portfolio shares sold | | | 428,483 | |
Securities lending | | | 899 | |
Other assets | | | 3,190 | |
| | | | |
Total assets | | | 752,126,963 | |
| | | | |
| |
| Liabilities | | | | |
Cash collateral received for securities on loan | | | 2,743,200 | |
Payables: | | | | |
Investment securities purchased | | | 55,631,402 | |
Portfolio shares redeemed | | | 286,589 | |
Manager (See Note 3) | | | 276,953 | |
NYLIFE Distributors (See Note 3) | | | 75,346 | |
Professional fees | | | 41,983 | |
Shareholder communication | | | 33,920 | |
Custodian | | | 28,624 | |
Variation margin on futures contracts | | | 4,916 | |
Trustees | | | 783 | |
Accrued expenses | | | 5,538 | |
| | | | |
Total liabilities | | | 59,129,254 | |
| | | | |
Net assets | | $ | 692,997,709 | |
| | | | |
| |
| Composition of Net Assets | | | | |
Shares of beneficial interest outstanding (par value of $.001 per share) unlimited number of shares authorized | | $ | 47,691 | |
Additional paid-in capital | | | 652,023,685 | |
| | | | |
| | | 652,071,376 | |
Total distributable earnings (loss) | | | 40,926,333 | |
| | | | |
Net assets | | $ | 692,997,709 | |
| | | | |
| | | | |
Initial Class | | | | |
Net assets applicable to outstanding shares | | $ | 321,291,150 | |
| | | | |
Shares of beneficial interest outstanding | | | 21,977,525 | |
| | | | |
Net asset value per share outstanding | | $ | 14.62 | |
| | | | |
Service Class | | | | |
Net assets applicable to outstanding shares | | $ | 371,706,559 | |
| | | | |
Shares of beneficial interest outstanding | | | 25,713,194 | |
| | | | |
Net asset value per share outstanding | | $ | 14.46 | |
| | | | |
| | | | |
| 20 | | MainStay VP Bond Portfolio | | The notes to the financial statements are an integral part of,
and should be read in conjunction with, the financial statements. |
Statement of Operationsfor the six months ended June 30, 2019 (Unaudited)
| | | | |
| Investment Income (Loss) | | | | |
Income | | | | |
Interest | | $ | 10,994,969 | |
Securities lending | | | 10,738 | |
Other | | | 1,670 | |
| | | | |
Total income | | | 11,007,377 | |
| | | | |
Expenses | | | | |
Manager (See Note 3) | | | 1,605,007 | |
Distribution/Service—Service Class (See Note 3) | | | 426,429 | |
Professional fees | | | 53,857 | |
Shareholder communication | | | 37,520 | |
Custodian | | | 30,100 | |
Trustees | | | 7,825 | |
Miscellaneous | | | 13,535 | |
| | | | |
Total expenses | | | 2,174,273 | |
| | | | |
Net investment income (loss) | | | 8,833,104 | |
| | | | |
|
| Realized and Unrealized Gain (Loss) on Investments and Futures Contracts | |
Net realized gain (loss) on: | | | | |
Investment transactions | | | 3,866,029 | |
Futures transactions | | | 1,938,963 | |
| | | | |
Net realized gain (loss) on investments and futures transactions | | | 5,804,992 | |
| | | | |
Net change in unrealized appreciation (depreciation) on: | | | | |
Investments | | | 26,966,702 | |
Futures contracts | | | 72,644 | |
| | | | |
Net change in unrealized appreciation (depreciation) on investments and futures contracts | | | 27,039,346 | |
| | | | |
Net realized and unrealized gain (loss) on investments and futures transactions | | | 32,844,338 | |
| | | | |
Net increase (decrease) in net assets resulting from operations | | $ | 41,677,442 | |
| | | | |
| | | | | | |
The notes to the financial statements are an integral part of,
and should be read in conjunction with, the financial statements. | | | | | 21 | |
Statements of Changes in Net Assets
for the six months ended June 30, 2019 (Unaudited) and the year ended December 31, 2018
| | | | | | | | |
| | | 2019 | | | 2018 | |
| Increase (Decrease) in Net Assets | |
Operations: | | | | | | | | |
Net investment income (loss) | | $ | 8,833,104 | | | $ | 19,418,890 | |
Net realized gain (loss) on investments and futures contracts | | | 5,804,992 | | | | (11,288,640 | ) |
Net change in unrealized appreciation (depreciation) on investments and futures contracts | | | 27,039,346 | | | | (19,877,029 | ) |
| | | | |
Net increase (decrease) in net assets resulting from operations | | | 41,677,442 | | | | (11,746,779 | ) |
| | | | |
Distributions to shareholders: | | | | | | | | |
Initial Class | | | — | | | | (10,651,264 | ) |
Service Class | | | — | | | | (9,223,661 | ) |
| | | | |
Total distributions to shareholders | | | — | | | | (19,874,925 | ) |
| | | | |
Capital share transactions: | | | | | | | | |
Net proceeds from sale of shares | | | 79,629,206 | | | | 145,886,552 | |
Net asset value of shares issued to shareholders in reinvestment of dividends and distributions | | | — | | | | 19,874,925 | |
Cost of shares redeemed | | | (59,090,643 | ) | | | (353,955,003 | ) |
| | | | |
Increase (decrease) in net assets derived from capital share transactions | | | 20,538,563 | | | | (188,193,526 | ) |
| | | | |
Net increase (decrease) in net assets | | | 62,216,005 | | | | (219,815,230 | ) |
| | |
| Net Assets | | | | | | | | |
Beginning of period | | | 630,781,704 | | | | 850,596,934 | |
| | | | |
End of period | | $ | 692,997,709 | | | $ | 630,781,704 | |
| | | | |
| | | | |
| 22 | | MainStay VP Bond Portfolio | | The notes to the financial statements are an integral part of,
and should be read in conjunction with, the financial statements. |
Financial Highlightsselected per share data and ratios
| | | | | | | | | | | | | | | | | | | | | | | | | | | | | | | | | | | |
| | | |
| | | Six months
ended June 30, | | | | Year ended December 31, |
| | | | | | | |
| Initial Class | | 2019* | | | | 2018 | | 2017 | | 2016 | | 2015 | | 2014 |
| | | | | | | |
Net asset value at beginning of period | | | $ | 13.72 | | | | | | | | | $ | 14.31 | | | | $ | 14.26 | | | | $ | 14.19 | | | | $ | 14.52 | | | | $ | 14.00 | |
| | | | | | | | | | | | | | | | | | | | | | | | | | | | | | | | | | | |
| | | | | | | |
Net investment income (loss) (a) | | | | 0.20 | | | | | | | | | | 0.38 | | | | | 0.32 | | | | | 0.32 | | | | | 0.31 | | | | | 0.33 | |
| | | | | | | |
Net realized and unrealized gain (loss) on investments | | | | 0.70 | | | | | | | | | | (0.53 | ) | | | | 0.23 | | | | | 0.20 | | | | | (0.27 | ) | | | | 0.49 | |
| | | | | | | | | | | | | | | | | | | | | | | | | | | | | | | | | | | |
| | | | | | | |
Total from investment operations | | | | 0.90 | | | | | | | | | | (0.15 | ) | | | | 0.55 | | | | | 0.52 | | | | | 0.04 | | | | | 0.82 | |
| | | | | | | | | | | | | | | | | | | | | | | | | | | | | | | | | | | |
| | | | | | | |
| Less dividends and distributions: | | | | | | | | | | | | | | | | | | | | | | | | | | | | | | | | | | | |
| | | | | | | |
From net investment income | | | | — | | | | | | | | | | (0.40 | ) | | | | (0.37 | ) | | | | (0.39 | ) | | | | (0.36 | ) | | | | (0.30 | ) |
| | | | | | | |
From net realized gain on investments | | | | — | | | | | | | | | | (0.04 | ) | | | | (0.13 | ) | | | | (0.06 | ) | | | | (0.01 | ) | | | | — | |
| | | | | | | | | | | | | | | | | | | | | | | | | | | | | | | | | | | |
| | | | | | | |
Total dividends and distributions | | | | — | | | | | | | | | | (0.44 | ) | | | | (0.50 | ) | | | | (0.45 | ) | | | | (0.37 | ) | | | | (0.30 | ) |
| | | | | | | | | | | | | | | | | | | | | | | | | | | | | | | | | | | |
| | | | | | | |
Net asset value at end of period | | | $ | 14.62 | | | | | | | | | $ | 13.72 | | | | $ | 14.31 | | | | $ | 14.26 | | | | $ | 14.19 | | | | $ | 14.52 | |
| | | | | | | | | | | | | | | | | | | | | | | | | | | | | | | | | | | |
| | | | | | | |
Total investment return (b) | | | | 6.56 | %(c) | | | | | | | | | (1.00 | %) | | | | 3.85 | % | | | | 3.53 | % | | | | 0.22 | % | | | | 5.82 | % |
| | | | | | | |
| Ratios (to average net assets)/Supplemental Data: | | | | | | | | | | | | | | | | | | | | | | | | | | | | | | | | | | | |
| | | | | | | |
Net investment income (loss) | | | | 2.85 | %†† | | | | | | | | | 2.76 | % | | | | 2.23 | % | | | | 2.16 | %(d) | | | | 2.14 | % | | | | 2.29 | % |
| | | | | | | |
Net expenses | | | | 0.54 | %†† | | | | | | | | | 0.53 | % | | | | 0.52 | % | | | | 0.51 | %(e) | | | | 0.52 | % | | | | 0.53 | % |
| | | | | | | |
Expenses (before waiver/reimbursement) | | | | 0.54 | %†† | | | | | | | | | 0.53 | % | | | | 0.52 | % | | | | 0.53 | % | | | | 0.52 | % | | | | 0.53 | % |
| | | | | | | |
Portfolio turnover rate (f) | | | | 119 | % | | | | | | | | | 148 | % | | | | 209 | % | | | | 258 | % | | | | 326 | % | | | | 262 | % |
| | | | | | | |
Net assets at end of period (in 000’s) | | | $ | 321,291 | | | | | | | | | $ | 307,682 | | | | $ | 517,067 | | | | $ | 538,979 | | | | $ | 707,265 | | | | $ | 733,113 | |
| (a) | Per share data based on average shares outstanding during the period. |
| (b) | Total return does not reflect any deduction of sales charges, mortality and expense charges, contract charges or administrative charges. For periods of less than one year, total return is not annualized. |
| (c) | Total investment return may reflect adjustments to conform to generally accepted accounting principles. |
| (d) | Without the custody fee reimbursement, net investment income (loss) would have been 2.14%. |
| (e) | Without the custody fee reimbursement, net expenses would have been 0.53%. |
| (f) | The portfolio turnover rates not including mortgage dollar rolls were 104%, 133%, 190%, 223%, 191% and 116% for the six months ended June 30, 2019 and for the years ended December 31, 2018, 2017, 2016, 2015 and 2014, respectively. |
| | | | | | |
The notes to the financial statements are an integral part of,
and should be read in conjunction with, the financial statements. | | | | | 23 | |
Financial Highlightsselected per share data and ratios
| | | | | | | | | | | | | | | | | | | | | | | | | | | | | | | | | | | |
| | | |
| | | Six months
ended
June 30, | | | | Year ended December 31, |
| | | | | | | |
| Service Class | | 2019* | | | | 2018 | | 2017 | | 2016 | | 2015 | | 2014 |
| | | | | | | |
Net asset value at beginning of period | | | $ | 13.58 | | | | | | | | | $ | 14.16 | | | | $ | 14.12 | | | | $ | 14.06 | | | | $ | 14.39 | | | | $ | 13.87 | |
| | | | | | | | | | | | | | | | | | | | | | | | | | | | | | | | | | | |
| | | | | | | |
Net investment income (loss) (a) | | | | 0.18 | | | | | | | | | | 0.35 | | | | | 0.28 | | | | | 0.28 | | | | | 0.27 | | | | | 0.29 | |
| | | | | | | |
Net realized and unrealized gain (loss) on investments | | | | 0.70 | | | | | | | | | | (0.53 | ) | | | | 0.22 | | | | | 0.19 | | | | | (0.27 | ) | | | | 0.48 | |
| | | | | | | | | | | | | | | | | | | | | | | | | | | | | | | | | | | |
| | | | | | | |
Total from investment operations | | | | 0.88 | | | | | | | | | | (0.18 | ) | | | | 0.50 | | | | | 0.47 | | | | | (0.00 | )‡ | | | | 0.77 | |
| | | | | | | | | | | | | | | | | | | | | | | | | | | | | | | | | | | |
| | | | | | | |
| Less dividends and distributions: | | | | | | | | | | | | | | | | | | | | | | | | | | | | | | | | | | | |
| | | | | | | |
From net investment income | | | | — | | | | | | | | | | (0.36 | ) | | | | (0.33 | ) | | | | (0.35 | ) | | | | (0.32 | ) | | | | (0.25 | ) |
| | | | | | | |
From net realized gain on investments | | | | — | | | | | | | | | | (0.04 | ) | | | | (0.13 | ) | | | | (0.06 | ) | | | | (0.01 | ) | | | | — | |
| | | | | | | | | | | | | | | | | | | | | | | | | | | | | | | | | | | |
| | | | | | | |
Total dividends and distributions | | | | — | | | | | | | | | | (0.40 | ) | | | | (0.46 | ) | | | | (0.41 | ) | | | | (0.33 | ) | | | | (0.25 | ) |
| | | | | | | | | | | | | | | | | | | | | | | | | | | | | | | | | | | |
| | | | | | | |
Net asset value at end of period | | | $ | 14.46 | | | | | | | | | $ | 13.58 | | | | $ | 14.16 | | | | $ | 14.12 | | | | $ | 14.06 | | | | $ | 14.39 | |
| | | | | | | | | | | | | | | | | | | | | | | | | | | | | | | | | | | |
| | | | | | | |
Total investment return (b) | | | | 6.48 | %(c) | | | | | | | | | (1.25 | %) | | | | 3.59 | % | | | | 3.27 | % | | | | (0.03 | %) | | | | 5.56 | % |
| | | | | | | |
| Ratios (to average net assets)/Supplemental Data: | | | | | | | | | | | | | | | | | | | | | | | | | | | | | | | | | | | |
| | | | | | | |
Net investment income (loss) | | | | 2.60 | %†† | | | | | | | | | 2.53 | % | | | | 1.98 | % | | | | 1.90 | %(d) | | | | 1.89 | % | | | | 2.04 | % |
| | | | | | | |
Net expenses | | | | 0.79 | %†† | | | | | | | | | 0.78 | % | | | | 0.77 | % | | | | 0.76 | %(e) | | | | 0.77 | % | | | | 0.78 | % |
| | | | | | | |
Expenses (before waiver/reimbursement) | | | | 0.79 | %†† | | | | | | | | | 0.78 | % | | | | 0.77 | % | | | | 0.78 | % | | | | 0.77 | % | | | | 0.78 | % |
| | | | | | | |
Portfolio turnover rate (f) | | | | 119 | % | | | | | | | | | 148 | % | | | | 209 | % | | | | 258 | % | | | | 326 | % | | | | 262 | % |
| | | | | | | |
Net assets at end of period (in 000’s) | | | $ | 371,707 | | | | | | | | | $ | 323,100 | | | | $ | 333,530 | | | | $ | 351,848 | | | | $ | 339,529 | | | | $ | 358,663 | |
| ‡ | Less than one cent per share. |
| (a) | Per share data based on average shares outstanding during the period. |
| (b) | Total return does not reflect any deduction of sales charges, mortality and expense charges, contract charges or administrative charges. For periods of less than one year, total return is not annualized. |
| (c) | Total investment return may reflect adjustments to conform to generally accepted accounting principles. |
| (d) | Without the custody fee reimbursement, net investment income (loss) would have been 1.88%. |
| (e) | Without the custody fee reimbursement, net expenses would have been 0.78%. |
| (f) | The portfolio turnover rates not including mortgage dollar rolls were 104%, 133%, 190%, 223%, 191% and 116% for the six months ended June 30, 2019 and for the years ended December 31, 2018, 2017, 2016, 2015 and 2014, respectively. |
| | | | |
| 24 | | MainStay VP Bond Portfolio | | The notes to the financial statements are an integral part of,
and should be read in conjunction with, the financial statements. |
Notes to Financial Statements (Unaudited)
Note 1–Organization and Business
MainStay VP Funds Trust (the “Fund”) was organized as a Delaware statutory trust on February 1, 2011. The Fund is registered under the Investment Company Act of 1940, as amended (the “1940 Act”), as an open-end management investment company. The Fund is comprised of thirty-one separate series (collectively referred to as the “Portfolios”). These financial statements and notes relate to the MainStay VP Bond Portfolio (the “Portfolio”), a “diversified” portfolio, as that term is defined in the 1940 Act, as interpreted or modified by regulatory authorities having jurisdiction, from time to time.
Shares of the Portfolio are currently offered to certain separate accounts to fund variable annuity policies and variable universal life insurance policies issued by New York Life Insurance and Annuity Corporation (“NYLIAC”), awholly-owned subsidiary of New York Life Insurance Company (“New York Life”) and may also be offered to fund variable annuity policies and variable universal life insurance policies issued by other insurance companies. NYLIAC allocates shares of the Portfolios to, among others, certain NYLIAC separate accounts. Shares of the Portfolio are also offered to the MainStay VP Conservative Allocation Portfolio, MainStay VP Moderate Allocation Portfolio, MainStay VP Moderate Growth Allocation Portfolio and MainStay VP Growth Allocation Portfolio, which operate as “funds-of-funds.”
The Portfolio currently offers two classes of shares. Initial Class shares commenced operations on January 23, 1984. Service Class shares commenced operations on June 4, 2003. Shares of the Portfolio are offered and are redeemed at a price equal to their respective net asset value (“NAV”) per share. No sales or redemption charge is applicable to the purchase or redemption of the Portfolio’s shares. Under the terms of the Fund’s multiple class plan, adopted pursuant to Rule 18f-3 under the 1940 Act, the classes differ in that, among other things, Service Class shares of the Portfolio pay a combined distribution and service fee of 0.25% of average daily net assets attributable to Service Class shares of the Portfolio to the Distributor (as defined in Note 3(B)) pursuant to a plan adopted in accordance with Rule 12b-1 under the 1940 Act. Contract owners of variable annuity contracts purchased after June 2, 2003, are permitted to invest only in the Service Class shares.
The Portfolio’s investment objective is to seek total return.
Note 2–Significant Accounting Policies
The Portfolio is an investment company and accordingly follows the investment company accounting and reporting guidance of the Financial Accounting Standards Board (“FASB”) Accounting Standard CodificationTopic 946 Financial Services—Investment Companies. The Portfolio prepares its financial statements in accordance with generally accepted accounting principles (“GAAP”) in the United States of America and follows the significant accounting policies described below.
(A) Securities Valuation. Investments are usually valued as of the close of regular trading on the New York Stock Exchange (the “Exchange”) (usually 4:00 p.m. Eastern time) on each day the Portfolio is open for business (“valuation date”).
The Board of Trustees of the Fund (the “Board”) adopted procedures establishing methodologies for the valuation of the Portfolio’s securities and other assets and delegated the responsibility for valuation determi-
nations under those procedures to the Valuation Committee of the Fund (the “Valuation Committee”). The Board authorized the Valuation Committee to appoint a Valuation Subcommittee (the “Subcommittee”) to deal in the first instance with establishing the prices of securities for which market quotations are not readily available or the prices of which are not otherwise readily determinable under these procedures. The Subcommittee meets (in person, via electronic mail or via teleconference) on an as-needed basis. Subsequently, the Valuation Committee meets to ensure that actions taken by the Subcommittee were appropriate. The procedures state that, subject to the oversight of the Board and unless otherwise noted, the responsibility for theday-to-day valuation of portfolio assets (including fair value measurements for the Portfolio’s assets and liabilities) rests with New York Life Investment Management LLC (“New York Life Investments” or the “Manager”), aided to whatever extent necessary by the Subadvisor (as defined in Note 3(A)).
To assess the appropriateness of security valuations, the Manager, the Subadvisor or the Portfolio’s third-party service provider, who is subject to oversight by the Manager, regularly compares prior day prices, prices on comparable securities and the sale prices to the prior and current day prices and challenges prices with changes exceeding certain tolerance levels with third-party pricing services or broker sources. For those securities valued through either a standardized fair valuation methodology or a fair valuation measurement, the Subcommittee deals in the first instance with such valuation and the Valuation Committee reviews and affirms, if appropriate, the reasonableness of the valuation based on such methodologies and measurements on a regular basis after considering information that is reasonably available and deemed relevant by the Valuation Committee. Any action taken by the Subcommittee with respect to the valuation of a portfolio security or other asset is submitted for review and ratification (if appropriate) to the Valuation Committee and the Board at the next regularly scheduled meeting.
“Fair value” is defined as the price the Portfolio would reasonably expect to receive upon selling an asset or liability in an orderly transaction to an independent buyer in the principal or most advantageous market for the asset or liability. Fair value measurements are determined within a framework that establishes a three-tier hierarchy which maximizes the use of observable market data and minimizes the use of unobservable inputs to establish a classification of fair value measurements for disclosure purposes. “Inputs” refer broadly to the assumptions that market participants would use in pricing the asset or liability, including assumptions about risk, such as the risk inherent in a particular valuation technique used to measure fair value using a pricing model and/or the risk inherent in the inputs for the valuation technique. Inputs may be observable or unobservable. Observable inputs reflect the assumptions market participants would use in pricing the asset or liability based on market data obtained from sources independent of the Portfolio. Unobservable inputs reflect the Portfolio’s own assumptions about the assumptions market participants would use in pricing the asset or liability based on the information available. The inputs or methodology used for valuing assets or liabilities may not be an indication of the risks associated with investing in those assets or liabilities. The three-tier hierarchy of inputs is summarized below.
| • | | Level 1—quoted prices in active markets for an identical asset or liability |
Notes to Financial Statements(Unaudited) (continued)
| • | | Level 2—other significant observable inputs (including quoted prices for a similar asset or liability in active markets, interest rates and yield curves, prepayment speeds, credit risk, etc.) |
| • | | Level 3—significant unobservable inputs (including the Portfolio’s own assumptions about the assumptions that market participants would use in measuring fair value of an asset or liability) |
The level of an asset or liability within the fair value hierarchy is based on the lowest level of an input, both individually and in the aggregate, that is significant to the fair value measurement. As of June 30, 2019, the aggregate value by input level of the Portfolio’s assets and liabilities is included at the end of the Portfolio’s Portfolio of Investments.
The Portfolio may use third-party vendor evaluations, whose prices may be derived from one or more of the following standard inputs, among others:
| | |
• Benchmark yields | | • Reported trades |
• Broker/dealer quotes | | • Issuer spreads |
• Two-sided markets | | • Benchmark securities |
• Bids/offers | | • Reference data (corporate actions or material event notices) |
• Industry and economic events | | • Comparable bonds |
• Monthly payment information | | |
An asset or liability for which market values cannot be measured using the methodologies described above is valued by methods deemed reasonable in good faith by the Valuation Committee, following the procedures established by the Board, to represent fair value. Under these procedures, the Portfolio generally uses a market-based approach which may use related or comparable assets or liabilities, recent transactions, market multiples, book values and other relevant information. The Portfolio may also use an income-based valuation approach in which the anticipated future cash flows of the asset or liability are discounted to calculate fair value. Discounts may also be applied due to the nature and/or duration of any restrictions on the disposition of the asset or liability. Fair value represents a good faith approximation of the value of a security. Fair value determinations involve the consideration of a number of subjective factors, an analysis of applicable facts and circumstances and the exercise of judgment. As a result, it is possible that the fair value for a security determined in good faith in accordance with the Portfolio’s valuation procedures may differ from valuations for the same security determined by other funds using their own valuation procedures. Although the Portfolio’s valuation procedures are designed to value a security at the price the Portfolio may reasonably expect to receive upon the security’s sale in an orderly transaction, there can be no assurance that any fair value determination thereunder would, in fact, approximate the amount that the Portfolio would actually realize upon the sale of the security or the price at which the security would trade if a reliable market price were readily available. During the six-month period ended June 30, 2019, there were no material changes to the fair value methodologies.
Securities which may be valued in this manner include, but are not limited to: (i) a security for which trading has been halted or suspended; (ii) a debt security that has recently gone into default and for which there is not a current market quotation; (iii) a security of an issuer that
has entered into a restructuring; (iv) a security that has been delisted from a national exchange; (v) a security for which the market price is not readily available from a third-party pricing source or, if so provided, does not, in the opinion of the Manager or the Subadvisor, reflect the security’s market value; (vi) a security subject to trading collars for which no or limited trading takes place; and (vii) a security whose principal market has been temporarily closed at a time when, under normal conditions, it would be open. Securities valued in this manner are generally categorized as Level 3 in the hierarchy. As of June 30, 2019, there were no securities held by the Portfolio that were fair valued in such a manner.
Futures contracts are valued at the last posted settlement price on the market where such futures are primarily traded. These securities are generally categorized as Level 1 in the hierarchy.
Debt securities (other than convertible and municipal bonds) are valued at the evaluated bid prices (evaluated mean prices in the case of convertible and municipal bonds) supplied by a pricing agent or brokers selected by the Manager, in consultation with the Subadvisor. The evaluations are market-based measurements processed through a pricing application and represents the pricing agent’s good faith determination as to what a holder may receive in an orderly transaction under market conditions. The rules based logic utilizes valuation techniques that reflect participants’ assumptions and vary by asset class and per methodology, maximizing the use of relevant observable data including quoted prices for similar assets, benchmark yield curves and market corroborated inputs. The evaluated bid or mean prices are deemed by the Manager, in consultation with the Subadvisor, to be representative of market values at the regular close of trading of the Exchange on each valuation date. Debt securities purchased on a delayed delivery basis are marked to market daily until settlement at the forward settlement date. Debt securities, including corporate bonds, U.S. government and federal agency bonds, municipal bonds, foreign bonds, convertible bonds, asset-backed securities and mortgage-backed securities are generally categorized as Level 2 in the hierarchy.
Temporary cash investments acquired in excess of 60 days to maturity at the time of purchase are valued using the latest bid prices or using valuations based on a matrix system (which considers such factors as security prices, yields, maturities and ratings), both as furnished by independent pricing services. Other temporary cash investments which mature in 60 days or less at the time of purchase (“Short-Term Investments”) are valued using the amortized cost method of valuation, unless the use of such method would be inappropriate. The amortized cost method involves valuing a security at its cost on the date of purchase and thereafter assuming a constant amortization to maturity of the difference between such cost and the value on maturity date. Amortized cost approximates the current fair value of a security. Securities valued using the amortized cost method are not valued using quoted prices in an active market and are generally categorized as Level 2 in the hierarchy.
The information above is not intended to reflect an exhaustive list of the methodologies that may be used to value portfolio investments. The valuation procedures permit the use of a variety of valuation methodologies in connection with valuing portfolio investments. The methodology used for a specific type of investment may vary based on the market data available or other considerations. The methodologies
| | |
| 26 | | MainStay VP Bond Portfolio |
summarized above may not represent the specific means by which portfolio investments are valued on any particular business day.
(B) Income Taxes. The Portfolio’s policy is to comply with the requirements of the Internal Revenue Code of 1986, as amended (the “Internal Revenue Code”), applicable to regulated investment companies and to distribute all of its taxable income to the shareholders of the Portfolio within the allowable time limits. Therefore, no federal, state and local income tax provisions are required.
Management evaluates the Portfolio’s tax positions to determine if the tax positions taken meet the minimum recognition threshold in connection with accounting for uncertainties in income tax positions taken or expected to be taken for the purposes of measuring and recognizing tax liabilities in the financial statements. Recognition of tax benefits of an uncertain tax position is permitted only to the extent the position is “more likely than not” to be sustained assuming examination by taxing authorities. Management has analyzed the Portfolio’s tax positions taken on federal, state and local income tax returns for all open tax years (for up to three tax years) and has concluded that no provisions for federal, state and local income tax are required in the Portfolio’s financial statements. The Portfolio’s federal, state and local income tax and federal excise tax returns for tax years for which the applicable statutes of limitations have not expired are subject to examination by the Internal Revenue Service and state and local departments of revenue.
(C) Dividends and Distributions to Shareholders. Dividends and distributions are recorded on the ex-dividend date. The Portfolio intends to declare and pay dividends from net investment income and distributions from net realized capital and currency gains, if any, at least annually. Unless the shareholder elects otherwise, all dividends and distributions are reinvested in the same class of shares of the Portfolio, at NAV. Dividends and distributions to shareholders are determined in accordance with federal income tax regulations and may differ from determinations using GAAP.
(D) Security Transactions and Investment Income. The Portfolio records security transactions on the trade date. Realized gains and losses on security transactions are determined using the identified cost method. Dividend income is recognized on the ex-dividend date; net of any foreign tax withheld at the source, and interest income is accrued as earned using the effective interest rate method and includes any realized gains and losses from repayments of principal on mortgage-backed securities. Discounts and premiums on securities purchased for the Portfolio are accreted and amortized, respectively, on the effective interest rate method over the life of the respective securities.
Investment income and realized and unrealized gains and losses on investments of the Portfolio are allocated pro rata to the separate classes of shares based upon their relative net assets on the date the income is earned or realized and unrealized gains and losses are incurred.
The Portfolio may place a debt security on non-accrual status and reduce related interest income by ceasing current accruals and writing off all or a portion of any interest receivables when the collection of all or a portion of such interest has become doubtful. A debt security is removed from non-accrual status when the issuer resumes interest payments or when collectability of interest is reasonably assured.
(E) Expenses. Expenses of the Fund are allocated to the individual Portfolios in proportion to the net assets of the respective Portfolios when the expenses are incurred, except where direct allocations of expenses can be made. Expenses (other than fees incurred under the distribution and service plans, further discussed in Note 3(B), which are charged directly to the Service Class shares) are allocated to separate classes of shares pro rata based upon their relative net assets on the date the expenses are incurred. The expenses borne by the Portfolio, including those of related parties to the Portfolio, are shown in the Statement of Operations.
(F) Use of Estimates. In preparing financial statements in conformity with GAAP, management makes estimates and assumptions that affect the reported amounts and disclosures in the financial statements. Actual results could differ from those estimates.
(G) Repurchase Agreements. The Portfolio may enter into repurchase agreements (i.e., buy a security from another party with the agreement that it be sold back in the future) to earn income. The Portfolio may enter into repurchase agreements only with counterparties, usually financial institutions, that are deemed by the Manager or the Subadvisor to be creditworthy, pursuant to guidelines established by the Board. During the term of any repurchase agreement, the Manager or the Subadvisor will continue to monitor the creditworthiness of the counterparty. Under the 1940 Act, repurchase agreements are considered to be collateralized loans by the Portfolio to the counterparty secured by the securities transferred to the Portfolio.
Repurchase agreements are subject to counterparty risk, meaning the Portfolio could lose money by the counterparty’s failure to perform under the terms of the agreement. The Portfolio mitigates this risk by ensuring the repurchase agreement is collateralized by cash, U.S. government securities, fixed income securities and/or other securities. The collateral is held by the Portfolio’s custodian and valued daily on a mark to market basis to determine if the value, including accrued interest, exceeds the repurchase price. In the event of the counterparty’s default on the obligation to repurchase, the Portfolio has the right to liquidate the collateral and apply the proceeds in satisfaction of the obligation. Under certain circumstances, such as in the event of default or bankruptcy by the counterparty, realization and/or retention of the collateral may be limited or subject to delay, to legal proceedings and possible realized loss to the Portfolio. As of June 30, 2019, repurchase agreements are shown in the Portfolio of Investments.
(H) Futures Contracts. A futures contract is an agreement to purchase or sell a specified quantity of an underlying instrument at a specified future date and price, or to make or receive a cash payment based on the value of a financial instrument (e.g., foreign currency, interest rate, security, or securities index). The Portfolio is subject to risks such as market price risk and/or interest rate risk in the normal course of investing in these transactions. Upon entering into a futures contract, the Portfolio is required to pledge to the broker or futures commission merchant an amount of cash and/or U.S. government securities equal to a certain percentage of the collateral amount, known as the “initial margin.” During the period the futures contract is open, changes in the value of the contract are recognized as unrealized appreciation or depreciation by marking to market such contract on a daily basis to reflect the market value of the contract at the end of each day’s trading. The Portfolio agrees to receive from or pay to the broker
Notes to Financial Statements(Unaudited) (continued)
or futures commission merchant an amount of cash equal to the daily fluctuation in the value of the contract. Such receipts or payments are known as “variation margin.” When the futures contract is closed, the Portfolio records a realized gain or loss equal to the difference between the proceeds from (or cost of) the closing transaction and the Portfolio’s basis in the contract.
The use of futures contracts involves, to varying degrees, elements of market risk in excess of the amount recognized in the Statement of Assets and Liabilities. The contract or notional amounts and variation margin reflect the extent of the Portfolio’s involvement in open futures positions. There are several risks associated with the use of futures contracts as hedging techniques. There can be no assurance that a liquid market will exist at the time when the Portfolio seeks to close out a futures contract. If no liquid market exists, the Portfolio would remain obligated to meet margin requirements until the position is closed. Futures may involve a small initial investment relative to the risk assumed, which could result in losses greater than if they had not been used. Futures may be more volatile than direct investments in the instrument underlying the futures, and may not correlate to the underlying instrument, causing a given hedge not to achieve its objectives. The Portfolio’s activities in futures contracts have minimal counterparty risk as they are conducted through regulated exchanges that guarantee the futures against default by the counterparty. In the event of a bankruptcy or insolvency of a futures commission merchant that holds margin on behalf of the Portfolio, the Portfolio may not be entitled to the return of the entire margin owed to the Portfolio, potentially resulting in a loss. The Portfolio’s investment in futures contracts and other derivatives may increase the volatility of the Portfolio’s NAVs and may result in a loss to the Portfolio. As of June 30, 2019, open futures contracts are shown in the Portfolio of Investments.
(I) Dollar Rolls. The Portfolio may enter into dollar roll transactions in which it sells mortgage-backed securities (“MBS”) from its portfolio to a counterparty from whom it simultaneously agrees to buy a similar security on a delayed delivery basis. The Portfolio generally transfers MBS where the MBS are “to be announced,” therefore, the Portfolio accounts for these transactions as purchases and sales.
When accounted for as purchase and sales, the securities sold in connection with the dollar rolls are removed from the portfolio and a realized gain or loss is recognized. The securities the Portfolio has agreed to acquire are included at market value in the Portfolio of Investments and liabilities for such purchase commitments are included as payables for investments purchased. During the roll period, the Portfolio foregoes principal and interest paid on the securities. The Portfolio is compensated by the difference between the current sales price and the forward price for the future as well as by the earnings on the cash proceeds of the initial sale. Dollar rolls may be renewed without physical delivery of the securities subject to the contract. The Portfolio maintains liquid assets from its portfolio having a value not less than the repurchase price, including accrued interest. Dollar roll transactions involve certain risks, including the risk that the securities returned to the Portfolio at the end of the roll period, while substantially similar, could be inferior to what was initially sold to the counterparty.
The Portfolio accounts for a dollar roll transaction as a purchase and sale whereby the difference in the sales price and purchase price of the security sold is recorded as a realized gain (loss).
(J) Securities Lending. In order to realize additional income, the Portfolio may engage in securities lending, subject to the limitations set forth in the 1940 Act and relevant guidance by the staff of the Securities and Exchange Commission (“SEC”). In the event the Portfolio does engage in securities lending, the Portfolio will lend through its custodian, State Street Bank and Trust Company (“State Street”), acting as securities lending agent on behalf of the Portfolio. State Street will manage the Portfolio’s collateral in accordance with the securities lending agency agreement between the Portfolio and State Street, and indemnify the Portfolio against counterparty risk. The loans will be collateralized by cash (which may be invested in a money market fund) and/ornon-cash collateral (which may include, U.S. Treasury securities and/or U.S. Government Agency securities issued or guaranteed by the United States government or its agencies or instrumentalities) at least equal at all times to the market value of the securities loaned. The Portfolio may bear the risk of delay in recovery of, or loss of rights in, the securities loaned should the borrower of the securities experience financial difficulty. The Portfolio may also record a realized gain or loss on securities deemed sold due to a borrower’s inability to return securities on loan. The Portfolio bears the risk of any loss on investment of cash collateral. The Portfolio will receive compensation for lending its securities in the form of fees or it will retain a portion of interest on the investment of any cash collateral. The Portfolio will also continue to receive interest and dividends on the securities loaned and any gain or loss in the market price of the securities loaned that may occur during the term of the loan will be for the account of the Portfolio. Income earned from securities lending activities, if any, is reflected in the Statement of Operations. As of June 30, 2019, the Portfolio had securities on loan with an aggregate market value of $2,690,119 and received cash collateral which was invested into the State Street Navigator Securities Lending Government Money Market Portfolio with a value of $2,743,200.
(K) Securities Risk. The ability of issuers of debt securities held by the Portfolio to meet their obligations may be affected by, among other things, economic or political developments in a specific country, industry or region. Debt securities are also subject to the risks associated with changes in interest rates.
Investments in the Portfolio are not guaranteed, even though some of the Portfolio’s underlying investments are guaranteed by the U.S. government or its agencies or instrumentalities. The principal risk of mortgage-related and asset-backed securities is that the underlying debt may be prepaid ahead of schedule, if interest rates fall, thereby reducing the value of the Portfolio’s investment. If interest rates rise, less of the debt may be prepaid and the Portfolio may lose money because the Portfolio may be unable to invest in higher yielding assets. The Portfolio is subject to interest-rate risk and can lose principal value when interest rates rise. Bonds are also subject to credit risk, in which the bond issuer may fail to pay interest and principal in a timely manner.
The Portfolio may invest in foreign debt securities, which carry certain risks that are in addition to the usual risks inherent in domestic debt securities. These risks include those resulting from currency fluctuations, future adverse political or economic developments and possible imposition of currency exchange blockages or other foreign governmental laws or restrictions. These risks are likely to be greater in emerging markets than in developed markets. The ability of issuers of
| | |
| 28 | | MainStay VP Bond Portfolio |
debt securities held by the Portfolio to meet their obligations may be affected by, among other things, economic or political developments in a specific country, industry or region.
(L) Indemnifications. Under the Fund’s organizational documents, its officers and trustees are indemnified against certain liabilities that may arise out of performance of their duties to the Fund. Additionally, in the normal course of business, the Portfolio enters into contracts with third-party service providers that contain a variety of representations and warranties and which may provide general indemnifications. The Portfolio’s maximum exposure under these arrangements is unknown, as this would involve future claims that may be made against the Portfolio that have not yet occurred. Based on experience, management is of the view that the risk of loss in connection with these potential indemnification obligations is remote. However, there can be no assurance that material liabilities related to such obligations will not arise in the future, which could adversely impact the Portfolio.
(M) Quantitative Disclosure of Derivative Holdings. The following tables show additional disclosures related to the Portfolio’s derivative and hedging activities, including how such activities are accounted for and their effect on the Portfolio’s financial positions, performance and cash flows. The Portfolio entered into futures contracts in order to hedge against anticipated changes in interest rates that might otherwise have an adverse effect upon the value of the Portfolio’s securities as well as help manage the duration and yield curve positioning of the portfolio. These derivatives are not accounted for as hedging instruments.
Fair value of derivative instruments as of June 30, 2019:
Asset Derivatives
| | | | | | | | | | |
| | | Statement of
Assets and
Liabilities
Location | | Interest
Rate
Contracts
Risk | | | Total | |
| | | |
Futures Contracts | | Net Assets—
Net unrealized appreciation on investments and futures contracts (a) | | $ | 1,134,052 | | | $ | 1,134,052 | |
| | | | | | |
Total Fair Value | | | | $ | 1,134,052 | | | $ | 1,134,052 | |
| | | | | | |
Liability Derivatives
| | | | | | | | | | |
| | | Statement of
Assets and
Liabilities
Location | | Interest
Rate
Contracts
Risk | | | Total | |
| | | |
Futures Contracts | | Net Assets—
Net unrealized depreciation on investments and futures contracts (a) | | $ | (233,130 | ) | | $ | (233,130 | ) |
| | | | | | |
Total Fair Value | | | | $ | (233,130 | ) | | $ | (233,130 | ) |
| | | | | | |
| (a) | Includes cumulative appreciation (depreciation) of futures contracts as reported in the Portfolio of Investments. Only current day’s variation margin is reported within the Statement of Assets and Liabilities. |
The effect of derivative instruments on the Statement of Operations for the period ended June 30, 2019:
Realized Gain (Loss)
| | | | | | | | | | |
| | | Statement of
Operations
Location | | Interest
Rate
Contracts
Risk | | | Total | |
| | | |
Futures Contracts | | Net realized gain (loss) on futures transactions | | $ | 1,938,963 | | | $ | 1,938,963 | |
| | | | | | |
Total Realized Gain (Loss) | | | | $ | 1,938,963 | | | $ | 1,938,963 | |
| | | | | | |
Change in Unrealized Appreciation (Depreciation)
| | | | | | | | | | |
| | | Statement of
Operations
Location | | Interest
Rate
Contracts
Risk | | | Total | |
| | | |
Futures Contracts | | Net change in unrealized appreciation (depreciation) on futures contracts | | $ | 72,644 | | | $ | 72,644 | |
| | | | | | |
Total Change in Unrealized Appreciation (Depreciation) | | | | $ | 72,644 | | | $ | 72,644 | |
| | | | | | |
Average Notional Amount
| | | | | | | | |
| | | Interest
Rate
Contracts
Risk | | | Total | |
| | |
Futures Contracts Long | | $ | 68,197,858 | | | $ | 68,197,858 | |
Futures Contracts Short | | $ | (10,615,859 | ) | | $ | (10,615,859 | ) |
| | | | |
Note 3–Fees and Related Party Transactions
(A) Manager and Subadvisor. New York Life Investments, a registered investment adviser and an indirect,wholly-owned subsidiary of New York Life, serves as the Portfolio’s Manager, pursuant to an Amended and Restated Management Agreement (“Management Agreement”). The Manager provides offices, conducts clerical, recordkeeping and bookkeeping services and keeps most of the financial and accounting records required to be maintained by the Portfolio. Except for the portion of salaries and expenses that are the responsibility of the Portfolio, the Manager pays the salaries and expenses of all personnel affiliated with the Portfolio and certain operational expenses of the Portfolio. The Portfolio reimburses New York Life Investments in an amount equal to a portion of the compensation of the Chief Compliance Officer attributable to the Portfolio. NYL Investors LLC (“NYL Investors” or the “Subadvisor”), a registered investment adviser and a direct,wholly-owned subsidiary of New York Life, serves as Subadvisor to the Portfolio and is responsible for theday-to-day portfolio management of the Portfolio. Pursuant to the terms of a Subadvisory Agreement (“Subadvisory Agreement”) between New York Life Investments and NYL Investors, New York Life Investments pays for the services of the Subadvisor.
Notes to Financial Statements(Unaudited) (continued)
The Fund, on behalf of the Portfolio, pays New York Life Investments in its capacity as the Portfolio’s investment manager and administrator, pursuant to the Management Agreement, a monthly fee for the services performed and the facilities furnished at an annual rate of the Portfolio’s average daily net assets as follows: 0.50% up to $500 million; 0.475% from $500 million to $1 billion; 0.45% from $1 billion to $3 billion; and 0.44% in excess of $3 billion. During the six-month period ended June 30, 2019, the effective management fee rate was 0.49%.
During the six-month period ended June 30, 2019, New York Life Investments earned fees from the Portfolio in the amount of $1,605,007, and paid the Subadvisor in the amount of $802,504.
State Street providessub-administration andsub-accounting services to the Portfolio pursuant to an agreement with New York Life Investments. These services include calculating the daily NAVs of the Portfolio, maintaining the general ledger andsub-ledger accounts for the calculation of the Portfolio’s NAVs and assisting New York Life Investments in conducting various aspects of the Portfolio’s administrative operations. For providing these services to the Portfolio, State Street is compensated by New York Life Investments.
Pursuant to an agreement between the Fund and New York Life Investments, New York Life Investments is responsible for providing or procuring certain regulatory reporting services for the Portfolio. The Portfolio will reimburse New York Life Investments for the actual costs incurred by New York Life Investments in connection with providing or procuring these services for the Portfolio.
(B) Distribution and Service Fees. The Fund, on behalf of the Portfolio, has entered into a distribution agreement with NYLIFE Distributors LLC (the “Distributor”), an indirect,wholly-owned subsidiary of New York Life. The Portfolio has adopted a distribution plan (the “Plan”) in accordance with the provisions of Rule 12b-1 under the 1940 Act. Under the Plan, the Distributor has agreed to provide, through its affiliates or independent third parties, various distribution-related, shareholder and administrative support services to the Service Class shareholders. For its services, the Distributor is entitled to a combined distribution and service fee accrued daily and paid monthly at an annual rate of 0.25% of the average daily net assets attributable to the Service Class shares of the Portfolio.
Note 4–Federal Income Tax
As of June 30, 2019, the cost and unrealized appreciation (depreciation) of the Portfolio’s investment portfolio, including applicable derivative contracts and other financial instruments, as determined on a federal income tax basis, were as follows:
| | | | | | | | | | | | | | | | |
| | | Federal Tax
Cost | | | Gross
Unrealized
Appreciation | | | Gross
Unrealized
(Depreciation) | | | Net
Unrealized
Appreciation/
(Depreciation) | |
Investments in Securities | | $ | 687,448,616 | | | $ | 19,149,813 | | | $ | (2,384,352 | ) | | $ | 16,765,461 | |
During the year ended December 31, 2018, the tax character of distributions paid as reflected in the Statements of Changes in Net Assets was as follows:
| | | | | | |
|
| 2018 | |
Tax-Based
Distributions
from Ordinary
Income | | | Tax-Based
Distributions
from Long-Term
Gains | |
| |
| $ | 17,997,689 | | | $ | 1,877,236 | |
Note 5–Custodian
State Street is the custodian of cash and securities held by the Portfolio. Custodial fees are charged to the Portfolio based on the Portfolio’s net assets and/or the market value of securities held by the Portfolio and the number of certain transactions incurred by the Portfolio.
Note 6–Line of Credit
The Portfolio and certain other funds managed by New York Life Investments maintain a line of credit with a syndicate of banks in order to secure a source of funds for temporary purposes to meet unanticipated or excessive redemption requests.
Effective July 30, 2019, under the credit agreement (the “Credit Agreement”), the aggregate commitment amount is $600,000,000 with an additional uncommitted amount of $100,000,000. The commitment fee is an annual rate of 0.15% of the average commitment amount payable quarterly, regardless of usage, to State Street, who serves as the agent to the syndicate. The commitment fee is allocated among the Portfolio and certain other funds managed by New York Life Investments based upon their respective net assets and other factors. Interest on any revolving credit loan is charged based upon the Federal Funds Rate or the one-month London Interbank Offered Rate (“LIBOR”), whichever is higher. The Credit Agreement expires on July 28, 2020, although the Portfolio, certain other funds managed by New York Life Investments and the syndicate of banks may renew the Credit Agreement for an additional year on the same or different terms. Prior to July 30, 2019, the aggregate commitment amount and the commitment fee were the same as those under the current Credit Agreement. During the six-month period ended June 30, 2019, there were no borrowings made or outstanding with respect to the Portfolio under the Credit Agreement.
Note 7–Interfund Lending Program
Pursuant to an exemptive order issued by the SEC, the Portfolio, along with certain other funds managed by New York Life Investments, may participate in an interfund lending program. The interfund lending program provides an alternative credit facility that permits the Portfolio and certain other funds managed by New York Life Investments to lend or borrow money for temporary purposes directly to or from one another subject to the conditions of the exemptive order. During the six-month period ended June 30, 2019, there were no interfund loans made or outstanding with respect to the Portfolio.
| | |
| 30 | | MainStay VP Bond Portfolio |
Note 8–Purchases and Sales of Securities (in 000’s)
During the six-month period ended June 30, 2019, purchases and sales of U.S. government securities were $675,288 and $597,611, respectively. Purchases and sales of securities, other than U.S. government securities andshort-term securities, were $130,847 and $174,024, respectively.
Note 9–Capital Share Transactions
Transactions in capital shares for the six-month period ended June 30, 2019 and the year ended December 31, 2018, were as follows:
| | | | | | | | |
Initial Class | | Shares | | | Amount | |
| | |
Six-month period ended June 30, 2019: | | | | | | | | |
Shares sold | | | 2,012,099 | | | $ | 28,301,748 | |
Shares redeemed | | | (2,467,523 | ) | | | (34,622,819 | ) |
| | | | |
Net increase (decrease) | | | (455,424 | ) | | $ | (6,321,071 | ) |
| | | | |
Year ended December 31, 2018: | | | | | | | | |
Shares sold | | | 6,688,591 | | | $ | 92,811,203 | |
Shares issued to shareholders in reinvestment of dividends and distributions | | | 789,830 | | | | 10,651,264 | |
Shares redeemed | | | (21,190,244 | ) | | | (294,654,464 | ) |
| | | | |
Net increase (decrease) | | | (13,711,823 | ) | | $ | (191,191,997 | ) |
| | | | |
| | |
| | | | | | | | |
Service Class | | Shares | | | Amount | |
Six-month period ended June 30, 2019: | | | | | | | | |
Shares sold | | | 3,676,350 | | | $ | 51,327,458 | |
Shares redeemed | | | (1,756,647 | ) | | | (24,467,824 | ) |
| | | | |
Net increase (decrease) | | | 1,919,703 | | | $ | 26,859,634 | |
| | | | |
Year ended December 31, 2018: | | | | | | | | |
Shares sold | | | 3,867,467 | | | $ | 53,075,349 | |
Shares issued to shareholders in reinvestment of dividends and distributions | | | 690,418 | | | | 9,223,661 | |
Shares redeemed | | | (4,311,268 | ) | | | (59,300,539 | ) |
| | | | |
Net increase (decrease) | | | 246,617 | | | $ | 2,998,471 | |
| | | | |
Note 10–Recent Accounting Pronouncement
To improve the effectiveness of fair value disclosure requiwrements, the Financial Accounting Standards Board recently issued Accounting Standard Update (ASU)2018-13, Fair Value Measurement Disclosure Framework—Changes to the Disclosure Requirements for Fair Value Measurement (ASU2018-13), which adds, removes, and modifies certain aspects relating to fair value disclosure. ASU2018-13 is effective for interim and annual reporting periods beginning after December 15, 2019; early adoption of the additions relating toASU 2018-13 is not required. Management has evaluated the implications of certain other provisions of the ASU and has determined to early adopt aspects related to the removal and modifications of certain fair value measurement disclosures under the ASU effective immediately. At this time, management is evaluating the implications of certain other provisions of the ASU related to new disclosure requirements and any impact on the financial statement disclosures has not yet been determined.
Note 11–Subsequent Events
In connection with the preparation of the financial statements of the Portfolio as of and for the six-month period ended June 30, 2019, events and transactions subsequent to June 30, 2019, through the date the financial statements were issued have been evaluated by the Portfolio’s management for possible adjustment and/or disclosure. No subsequent events requiring financial statement adjustment or disclosure have been identified.
Proxy Voting Policies and Procedures and Proxy Voting Record
A description of the policies and procedures that New York Life Investments uses to vote proxies related to the Portfolio’s securities is available without charge, upon request (i) by calling800-598-2019; (ii) by visiting New York Life Investments website at https://www.nylinvestments.com/mainstay/products-and-performance/mainstay-vp-funds-trust; or (iii) by visiting the SEC’s website at www.sec.gov.
The Portfolio is required to file with the SEC its proxy voting record for the12-month period ending June 30 on Form N-PX. The Portfolio’s most recent Form N-PX or proxy voting record is available free of charge upon request (i) by calling800-598-2019; (ii) by visiting New York Life Investments website at https://www.nylinvestments.com/mainstay/products-and-performance/mainstay-vp-funds-trust; or (iii) by visiting the SEC’s website atwww.sec.gov.
Shareholder Reports and Quarterly Portfolio Disclosure
The Portfolio is required to file its complete schedule of portfolio holdings with the SEC 60 days after each fiscal quarter onForm N-PORT. The Portfolio’s holdings report is available without charge upon request (i) by calling800-598-2019; (ii) by visiting New York Life Investments website at https://www.nylinvestments.com/mainstay/products-and-performance/mainstay-vp-funds-trust; or (iii) on the SEC’s website at www.sec.gov.
| | |
| 32 | | MainStay VP Bond Portfolio |
MainStay VP Portfolios
MainStay VP offers a wide range of Portfolios. The full array of MainStay VP offerings is listed here, with information about the manager, subadvisors, legal counsel, and independent registered public accounting firm.
Equity Portfolios
MainStay VP Eagle Small Cap Growth Portfolio
MainStay VP Emerging Markets Equity Portfolio
MainStay VP Epoch U.S. Equity Yield Portfolio
MainStay VP Fidelity Institutional AM® Utilities Portfolio†
MainStay VP Large Cap Growth Portfolio
MainStay VP MacKay Common Stock Portfolio
MainStay VP MacKay Growth Portfolio
MainStay VP MacKay International Equity Portfolio
MainStay VP MacKay Mid Cap Core Portfolio
MainStay VP MacKay S&P 500 Index Portfolio
MainStay VP MacKay Small Cap Core Portfolio
MainStay VP Mellon Natural Resources Portfolio
MainStay VP T. Rowe Price Equity Income Portfolio
Mixed Asset Portfolios
MainStay VP Balanced Portfolio
MainStay VP Income Builder Portfolio
MainStay VP Janus Henderson Balanced Portfolio
MainStay VP MacKay Convertible Portfolio
Income Portfolios
MainStay VP Bond Portfolio
MainStay VP Floating Rate Portfolio
MainStay VP Indexed Bond Portfolio
MainStay VP MacKay Government Portfolio
MainStay VP MacKay High Yield Corporate Bond Portfolio
MainStay VP MacKay Unconstrained Bond Portfolio
MainStay VP PIMCO Real Return Portfolio
Money Market
MainStay VP U.S. Government Money Market Portfolio
Alternative
MainStay VP Cushing Renaissance Advantage Portfolio
MainStay VP IQ Hedge Multi-Strategy Portfolio
Asset Allocation Portfolios
MainStay VP Conservative Allocation Portfolio
MainStay VP Growth Allocation Portfolio
MainStay VP Moderate Allocation Portfolio
MainStay VP Moderate Growth Allocation Portfolio
Manager
New York Life Investment Management LLC
New York, New York
Subadvisors
Candriam Belgium*
Brussels, Belgium
Cushing Asset Management, LP
Dallas, Texas
Eagle Asset Management, Inc.
St Petersburg, Florida
Epoch Investment Partners, Inc.
New York, New York
FIAM LLC
Smithfield, Rhode Island
IndexIQ Advisors LLC*
New York, New York
Janus Capital Management LLC
Denver, Colorado
MacKay Shields LLC*
New York, New York
Mellon Investments Corporation
Boston, Massachusetts
NYL Investors LLC*
New York, New York
Pacific Investment Management Company LLC
Newport Beach, California
T. Rowe Price Associates, Inc.
Baltimore, Maryland
Winslow Capital Management, LLC
Minneapolis, Minnesota
Distributor
NYLIFE Distributors LLC*
Jersey City, New Jersey
Custodian
State Street Bank and Trust Company
Boston, Massachusetts
Independent Registered Public Accounting Firm
PricewaterhouseCoopers LLP
New York, New York
Legal Counsel
Dechert LLP
Washington, District of Columbia
Some Portfolios may not be available in all products.
| † | Fidelity Institutional AM is a registered trade mark of FMR LLC. Used with permission. |
| * | An affiliate of New York Life Investment Management LLC |
Not part of the Semiannual Report
2019 Semiannual Report
This report is for the general information of New York Life Variable Annuities and NYLIAC Variable Universal Life Insurance Products policyowners. It must be preceded or accompanied by the appropriate product(s) and funds prospectuses if it is given to anyone who is not an owner of a New York Life variable annuity policy or a NYLIAC Variable Universal Life Insurance Product. This report does not offer for sale or solicit orders to purchase securities.
The performance data quoted in this report represents past performance. Past performance is no guarantee of future results. Due to market volatility and other factors, current performance may be lower or higher than the figures shown. The most recent month-end performance summary for your variable annuity or variable life policy is available by calling 800-598-2019 and is updated periodically on www.newyorklife.com.
The New York Life Variable Annuities and NYLIAC Variable Universal Life Insurance Products are issued by New York Life Insurance and Annuity Corporation (a Delaware Corporation) and distributed by NYLIFE Distributors LLC (Member FINRA/SIPC).
New York Life Insurance Company
New York Life Insurance and Annuity Corporation (NYLIAC) (A Delaware Corporation)
51 Madison Avenue, Room 551
New York, NY 10010
www.newyorklife.com
Printed on recycled paper
nylinvestments.com
NYLIFE Distributors LLC, 30 Hudson Street, Jersey City, NJ 07302
New York Life Investment Management LLC is the investment manager to the MainStay VP Funds Trust
©2019 by NYLIFE Distributors LLC. All rights reserved.
You may obtain copies of the Prospectus and the Statement of Additional Information free of charge, upon request, by callingtoll-free 800-598-2019 or writing to New York Life Insurance and Annuity Corporation, 51 Madison Avenue, New York, NY 10010.
| | | | |
| | | |
| Not FDIC Insured | | No Bank Guarantee | | May Lose Value |
| | | | |
| 1781605 | | | | MSVPB10-08/19 (NYLIAC) NI509 |
MainStay VP Emerging Markets Equity Portfolio
Message from the President and Semiannual Report
Unaudited | June 30, 2019

Beginning on January 1, 2021, as permitted by regulations adopted by the Securities and Exchange Commission, paper copies of the MainStay VP Portfolio annual and semi-annual shareholder reports may no longer be sent by mail, unless you specifically request paper copies of the reports from the insurance company that offers your policy. Instead, the reports will be made available online, and you will be notified by mail each time a report is posted and provided with a website link to access the report. Instructions for requesting paper copies will be provided by your insurance company.
If you already elected to receive shareholder reports electronically, you will not be affected by this change and you need not take any action. At any time, you may elect to receive reports and other communications from the insurance company electronically by following the instructions provided by the insurance company.
You may elect to receive all future shareholder reports in paper form free of charge. You can inform the insurance company that you wish to receive paper copies of reports by following the instructions provided by the insurance company. Your election to receive reports in paper form will apply to all portfolio companies available under your contract.
| | | | | | | | |
| | | | | |
| Not FDIC/NCUA Insured | | Not a Deposit | | May Lose Value | | No Bank Guarantee | | Not Insured by Any Government Agency |

This page intentionally left blank
Message from the President
Most equity and fixed-income markets in the United States and around the world advanced in the face of conflicting political and macroeconomic forces during thesix-month period ended June 30, 2019.
The reporting period began on the heels of tumultuous December 2018, during which equities and equity-sensitive bonds spiked sharply lower on concerns regarding the pace of economic growth, a U.S. government shutdown and the potential impact of trade disputes between the United States and other nations, particularly China. Markets recovered quickly in early 2019 as trade tensions eased, the government reopened and the U.S. Federal Reserve Board (Fed) adopted a more patient tone regarding the future direction of interest rates. Markets moved broadly higher from January through April, supported by encouraging economic data and generally strong corporate earnings.
During the first four months of the reporting period, the improving economic environment encouraged investors to favor areas of the market viewed as offering greater return potential along with higher risks. Among U.S. stocks, cyclical, growth-oriented sectors tended to outperform more defensive, value-oriented sectors, whilelarge-cap stocks outperformed theirsmaller-cap counterparts. Within the S&P 500® Index, the information technology sector led the market’s advance, followed by communication services, consumer discretionary and consumer staples. Industrials, utilities, financials, materials, real estate and energy produced more modest gains. While some international equity markets outperformed or underperformed the U.S. market, on average international stocks mirrored the performance of their U.S. counterparts. Fixed-income securities gained ground as well, albeit along a more gradual trajectory. Among U.S. fixed-income instruments, corporate issues generally outperformed government bonds, with lower credit quality, higher yielding securities leading the sector’s advance. Long-term U.S. Treasury bond yields proved particularly weak, with
10-year yields dipping at times below3-month yields, reflecting investors’ continued concerns about domestic economic growth.
May 2019 saw a return of uncertainty and volatility. Trade discussions between the United States and China faltered, driving global equity prices lower. Government bond prices rose as investors sought safe havens. June brought yet anotherU-turn as equity prices climbed again after comments from the Fed raised hopes of an interest rate cut in response to weak economic data. Stock and bond prices rose, with U.S. equity markets ending the reporting period in record territory.
We are pleased to see renewed signs of strength in broad areas of the financial market. At the same time, we remained sharply focused on providing you, as a MainStay VP investor, with the experienced and disciplined fund management that we believe underpins an effective, long-term investment strategy. Whatever tomorrow’s investment environment brings, you can rely on our portfolio managers to pursue the objectives of their individual Portfolios as outlined in the prospectus with the energy and dedication you have come to expect.
The report that follows contains additional information on the market events, investment decisions and specific securities that shaped your VP Portfolio’s performance during the six months ended June 30, 2019. We encourage you to read the report carefully and use it to evaluate your Portfolio’s performance in light of your long-range financial plan.
Sincerely,

Kirk C. Lehneis
President
The opinions expressed are as of the date of this report and are subject to change. There is no guarantee that any forecast made will come to pass. This material does not constitute investment advice and is not intended as an endorsement of any specific investment. Past performance is no guarantee of future results.
Not part of the Semiannual Report
Table of Contents
Investors should refer to the Portfolio’s Summary Prospectus and/or Prospectus and consider the Portfolio’s investment objectives, strategies, risks, charges and expenses carefully before investing. The Summary Prospectus and/or Prospectus contain this and other information about the Portfolio. You may obtain copies of the Portfolio’s Summary Prospectus and/or the Prospectus and the Statement of Additional Information free of charge, upon request, by calling toll-free 800-598-2019, by writing to New York Life Insurance and Annuity Corporation, 51 Madison Avenue, Room 251, New York, New York 10010 or by sending an email to MainStayShareholdersServices@nylim.com. These documents are also available at nylinvestments.com/vpdocuments. Please read the Summary Prospectus and/or Prospectus carefully before investing. MainStay VP Funds Trust portfolios are separate account options which are purchased through a variable insurance or variable annuity contract.
Investment and Performance Comparison1(Unaudited)
Performance data quoted represents past performance. Past performance is no guarantee of future results. Because of market volatility and other factors, current performance may be lower or higher than the figures shown. Investment return and principal value will fluctuate, and as a result, when shares are redeemed, they may be worth more or less than their original cost. The performance table and graph do not reflect any deduction of sales charges, mortality and expense charges, contract charges or administrative charges. Please refer to the Performance Summary appropriate for your policy. For performance information current to the most recent month-end, please call800-598-2019 or visit www.newyorklife.com.
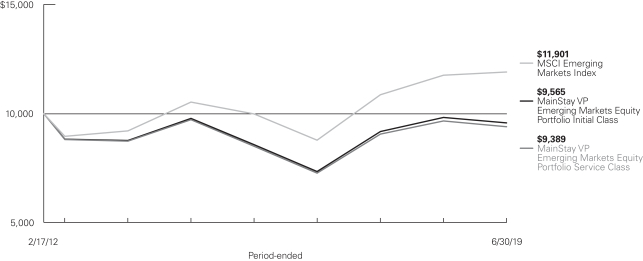
Average Annual Total Returns for the Period-Ended June 30, 2019
| | | | | | | | | | | | | | | | | | |
| Class | | Inception Date | | Six Months | | One Year | | Five Years | | | Since Inception | | | Gross
Expense
Ratio2 | |
| | | | | | |
| Initial Class Shares | | 2/17/2012 | | 12.17% | | –2.60% | | | –0.44 | % | | | –0.60 | % | | | 1.15 | % |
| | | | | | |
| Service Class Shares | | 2/17/2012 | | 12.03 | | –2.84 | | | –0.69 | | | | –0.85 | | | | 1.40 | |
| | | | | | | | | | | | | | | | |
| Benchmark Performance | | Six Months | | | One
Year | | | Five
Years | | | Since Inception | |
| | | | |
MSCI Emerging Markets Index3 | | | 10.58 | % | | | 1.21 | % | | | 2.49 | % | | | 2.39 | % |
Morningstar Diversified Emerging Markets Category Average4 | | | 12.06 | | | | 1.16 | | | | 1.71 | | | | 2.16 | |
| 1. | Performance figures may reflect certain fee waivers and/or expense limitations, without which total returns may have been different. For information on current fee waivers and/or expense limitations (if any), please refer to the Notes to Financial Statements. |
| 2. | The gross expense ratios presented reflect the Portfolio’s “Total Annual Portfolio Operating Expenses” from the most recent Prospectus, as supplemented, and may differ from other expense ratios disclosed in this report. |
| 3. | The MSCI Emerging Markets Index is the Portfolio’s primary broad-based securities market index for comparison purposes. The MSCI Emerging Markets Index is a free float-adjusted market-capitalization index that is |
| | designed to measure equity market performance in the global emerging markets. Results assume reinvestment of all dividends and capital gains. An investment cannot be made directly in an index. |
| 4. | The Morningstar Diversified Emerging Markets Category Average is representative of funds that tend to divide their assets among 20 or more nations, although they tend to focus on the emerging markets of Asia and Latin America rather than on those of the Middle East, Africa, or Europe. These funds invest predominantly in emerging market equities, but some funds also invest in both equities and fixed income investments from emerging markets. Results are based on average total returns of similar funds with all dividends and capital gain distributions reinvested. |
Cost in Dollars of a $1,000 Investment in MainStay VP Emerging Markets Equity Portfolio (Unaudited)
The example below is intended to describe the fees and expenses borne by shareholders during the six-month period from January 1, 2019, to June 30, 2019, and the impact of those costs on your investment.
Example
As a shareholder of the Portfolio you incur two types of costs: (1) transaction costs, including exchange fees and sales charges (loads) on purchases (as applicable), and (2) ongoing costs, including management fees, distribution and/or service (12b-1) fees, and other Portfolio expenses (as applicable). This example is intended to help you understand your ongoing costs (in dollars) of investing in the Portfolio and to compare these costs with the ongoing costs of investing in other mutual funds. The example is based on an investment of $1,000 made at the beginning of the six-month period and held for the entire period from January 1, 2019, to June 30, 2019. Shares are only sold in connection with variable life and annuity contracts and the example does not reflect any contract level or transactional fees or expenses. If these costs had been included, your costs would have been higher.
This example illustrates your Portfolio’s ongoing costs in two ways:
Actual Expenses
The second and third data columns in the table below provide information about actual account values and actual expenses. You may use the information in these columns, together with the amount you invested, to estimate the expenses that you paid during the six months ended June 30, 2019. Simply divide your account value by $1,000
(for example, an $8,600 account value divided by $1,000 = 8.6), then multiply the result by the number under the heading entitled “Expenses Paid During Period” to estimate the expenses you paid on your account during this period.
Hypothetical Example for Comparison Purposes
The fourth and fifth data columns in the table below provide information about hypothetical account values and hypothetical expenses based on the Portfolio’s actual expense ratio and an assumed rate of return of 5% per year before expenses, which is not the Portfolio’s actual return. The hypothetical account values and expenses may not be used to estimate the actual ending account balances or expenses you paid for thesix-month period shown. You may use this information to compare the ongoing costs of investing in the Portfolio with the ongoing costs of investing in other mutual funds. To do so, compare this 5% hypothetical example with the 5% hypothetical examples that appear in the shareholder reports of the other mutual funds.
Please note that the expenses shown in the table are meant to highlight your ongoing costs only and do not reflect any transactional costs, such as exchange fees or sales charges (loads). Therefore, the fourth and fifth data columns of the table are useful in comparing ongoing costs only and will not help you determine the relative total costs of owning different funds. In addition, if these transactional costs were included, your costs would have been higher.
| | | | | | | | | | | | | | | | | | | | | | |
| | | | | | | | | | | | | | | | | | |
| Share Class | | Beginning
Account
Value
1/1/19 | | | Ending Account
Value (Based
on Actual
Returns and
Expenses)
6/30/19 | | | Expenses
Paid
During
Period1 | | | Ending Account
Value (Based
on Hypothetical
5% Annualized
Return and
Actual Expenses)
6/30/19 | | | Expenses
Paid
During
Period1 | | | Net Expense
Ratio
During
Period2 |
| | | | | | |
| Initial Class Shares | | $ | 1,000.00 | | | $ | 1,121.70 | | | $ | 6.05 | | | $ | 1,019.09 | | | $ | 5.76 | | | 1.15% |
| | | | | | |
| Service Class Shares | | $ | 1,000.00 | | | $ | 1,120.30 | | | $ | 7.36 | | | $ | 1,017.85 | | | $ | 7.00 | | | 1.40% |
| 1. | Expenses are equal to the Portfolio’s annualized expense ratio of each class multiplied by the average account value over the period, divided by 365 and multiplied by 181 (to reflect the six-month period). The table above represents the actual expenses incurred during the six-month period. In addition to the fees and expenses which the Portfolio bears directly, it also indirectly bears a pro rata share of the fees and expenses of the underlying funds in which it invests. Such indirect expenses are not included in the above-reported expense figures. |
| 2. | Expenses are equal to the Portfolio’s annualized expense ratio to reflect the six-month period. |
| | |
| 6 | | MainStay VP Emerging Markets Equity Portfolio |
Country Composition as of June 30, 2019(Unaudited)
| | | | |
| |
| China | | | 30.2 | % |
| |
| Republic of Korea | | | 12.6 | |
| |
| Taiwan | | | 10.2 | |
| |
| India | | | 9.9 | |
| |
| Brazil | | | 9.3 | |
| |
| South Africa | | | 5.9 | |
| |
| Russia | | | 4.9 | |
| |
| Thailand | | | 3.3 | |
| |
| Mexico | | | 2.5 | |
| |
| Philippines | | | 1.7 | |
| |
| Indonesia | | | 1.6 | |
| |
| Poland | | | 1.4 | |
| |
| United States | | | 1.4 | |
| |
| Malaysia | | | 0.8 | |
| | | | |
| |
| Argentina | | | 0.7 | % |
| |
| Hong Kong | | | 0.7 | |
| |
| Peru | | | 0.7 | |
| |
| Hungary | | | 0.6 | |
| |
| Turkey | | | 0.5 | |
| |
| United Arab Emirates | | | 0.4 | |
| |
| Egypt | | | 0.3 | |
| |
| Greece | | | 0.2 | |
| |
| Chile | | | 0.1 | |
| |
| Colombia | | | 0.1 | |
| |
| Romania | | | 0.0 | ‡ |
| |
| Other Assets, Less Liabilities | | | 0.0 | ‡ |
| | | | |
| | | 100.0 | % |
| | | | |
See Portfolio of Investments beginning on page 11 for specific holdings within these categories. The Portfolio’s holdings are subject to change.
| ‡ | Less than one-tenth of a percent. |
Top Ten Holdings as of June 30, 2019(excluding short-term investments) (Unaudited)
| 2. | Alibaba Group Holding, Ltd., Sponsored ADR |
| 3. | Taiwan Semiconductor Manufacturing Co., Ltd. |
| 4. | Samsung Electronics Co., Ltd. |
| 6. | Ping An Insurance Group Co. of China, Ltd., Class H |
| 7. | China Construction Bank Corp., Class H |
| 8. | China Merchants Bank Co., Ltd., Class H |
| 9. | Petroleo Brasileiro S.A. |
| 10. | Reliance Industries, Ltd. |
Portfolio Management Discussion and Analysis(Unaudited)
Answers to the questions reflect the views of portfolio managers Ping Wang, PhD, and Rui Tang, CFA, of MacKay Shields LLC (“MacKay Shields”), a Subadvisor of the Portfolio, and Jan Boudewijns, Philip Screve and Mohamed Lamine Saidi of Candriam Belgium (“Candriam”), a Subadvisor of the Portfolio.
How did MainStay VP Emerging Markets Equity Portfolio perform relative to its benchmark and peers during the six months ended June 30, 2019?
For the six months ended June 30, 2019, MainStay VP Emerging Markets Equity Portfolio returned 12.17% for Initial Class shares and 12.03% for Service Class shares. Over the same period, both share classes outperformed the 10.58% return of the MSCI Emerging Markets Index, which is the Portfolio’s benchmark. For the six months ended June 30, 2019, Initial Class shares outperformed, and Service Class shares underperformed, the 12.06% return of the Morningstar Diversified Emerging Markets Category Average.1
What factors affected the Portfolio’s relative performance during the reporting period?
Candriam
The portion of the Portfolio subadvised by Candriam outperformed the MSCI Emerging Markets Index during the reporting period largely due to its investment process, which focuses on thebottom-up selection of reasonably priced stocks of quality companies delivering strong and sustainable profitability. During the reporting period, our investment process resulted in a structural tilt toward quality and growth stocks in the Portfolio.
A strong recovery in emerging-markets equities at the start of 2019 underpinned the Candriam portion of the Portfolio’s positive performance. Several political and economic developments drove the sector’s recovery, including a more constructive evolution of U.S.-China trade negotiations, aU-turn by the U.S. Federal Reserve Board to a more benign monetary and balance-sheet policy, and monetary and fiscal support by the Chinese government to halt China’s slowing growth trend.
In this supportive environment, the Candriam portion of the Portfolio initially added to its China equities exposure, with a focus on localA-shares, while also increasing exposure to promising growth-sensitive stocks such as the Latin Americane-commerce giant MercadoLibre in Argentina, mining company Southern Copper in Peru and communication equipment manufacturer Accton Technology in Taiwan.
As trade tensions between the United States and China started to rise again from May 2019 onwards, the Candriam portion of the Portfolio again reduced exposure to Chinese equities, focusing the reduction on more exposedA-shares and on companies directly impacted by rising trade and technology tensions, not only in China but also in Korea and Taiwan. The Candriam portion of the Portfolio reinvested those proceeds in equities based in areas less exposed to trade tensions, such as India, Russia, Thailand and Brazil, the latter of which benefited
from strong investor interest in growing prospects for pension reform.
Throughout the reporting period, the Candriam portion of the Portfolio maintained a balanced and diversified approach in terms of both allocation and stock selection. Our initialrisk-on actions in early 2019 bolstered the Candriam portion of the Portfolio’s performance relative to the MSCI Emerging Markets Index, while subsequent profit-taking and risk-reduction steps taken from May onward helped maintain its comparatively strong gains.
MacKay Shields
The portion of the Portfolio subadvised by MacKay Shields underperformed the MSCI Emerging Markets Index during the reporting period, primarily as a result of weak stock selection. Our stock selection process is driven by the systematic assessment of eligible securities across valuation, momentum and market sentiment measures using the investment team’s systematic stock selection model. This process is the main determiner of positioning in the MacKay Shields portion of the Portfolio.
During the reporting period, many investors tended to react primarily to macroeconomic and political developments, such as the evolving trade tensions between the United States and China. In this environment, individual company fundamentals often failed to drive stock performance. As a result, our valuation signals, which seek to evaluate companies across sales- and cash-based measures on a peer-relative basis, failed to enhance relative returns. Our momentum and sentiment composite supported the relative performance of the portion of the Portfolio subadvised by MacKay Shields, but not strongly enough to offset the underperformance of our valuation signals.
Which sectors were the strongest positive contributors to the Portfolio’s relative performance, and which sectors were particularly weak?
Candriam
In the portion of the Portfolio subadvised by Candriam, the financials, communication services and real estate sectors made the strongest positive sector contributions to performance relative to the MSCI Emerging Markets Index during the reporting period. (Contributions take weightings and total returns into account.) During the same period, utilities, consumer staples and information technology made the weakest sector contributions to the relative performance of the Candriam portion of the Portfolio.
| 1. | See page 5 for more information on benchmark and peer group returns. |
| | |
| 8 | | MainStay VP Emerging Markets Equity Portfolio |
MacKay Shields
In the portion of the Portfolio subadvised by MacKay Shields, the sectors that made the most substantial positive contributions to the Portfolio’s performance relative to the MSCI Emerging Markets Index during the reporting period included consumer discretionary, energy and health care. During the same period, the sectors that detracted the most from the relative performance of the MacKay Shields portion of the Portfolio were communication services, financials and industrials.
During the reporting period, which individual stocks made the strongest positive contributions to the Portfolio’s absolute performance and which stocks detracted the most?
Candriam
In the Candriam portion of the Portfolio, the strongest contributions to absolute performance came from three China-based holdings: bank China Merchants Bank, insurer Ping An Insurance and information technology ande-commerce company Alibaba Group. All three performed particularly well during the first half of the reporting period as the hope for a U.S.-China trade deal increased. In our opinion, China Merchants Bank has the best retail banking franchise in China in terms of service quality, a factor that bolstered returns during the reporting period and which we expect to be an advantage going forward if China’s central bank relaxes deposit-rate guidelines as expected. Ping An Insurance benefited from its increasing use of technology in core functions, such as product pricing, investment and risk control, positioning the company to better deal with ongoing Chinese insurance industry reforms, in our view. Despite sluggish domestice-commerce growth, Alibaba maintained a reputation for innovation and leadership in areas ranging from offline commerce and food delivery to cloud computing and digital media.
During the reporting period, the most substantial detractors from absolute performance in the Candriam portion of the Portfolio included Chinesee-commerce platform Pinduoduo, South Korean cosmetics manufacturer Cosmax and Chinese automobile maker Geely Automobile. Each of these stocks provided negative total returns during the reporting period. Pinduoduo faced intensified competition from majore-commerce platforms such as Alibaba amid an industry slowdown.
Cosmax missed earnings expectations on disappointing sales in China and announced the need for a further increase in capital spending. Despite promising new models and market share gains, Geely suffered from a depressed Chinese car market following subsidy cuts in 2018.
MacKay Shields
The stocks that made the most substantial contributions to the absolute performance of the MacKay Shields portion of the Portfolio during the reporting period were South African media company Naspers, Chinese Internet & direct marketing retailer Alibaba and South Korean consumer electronics manufacturer Samsung. Over the same period, the stocks that detracted the most from the absolute performance of the MacKay Shields portion of the Portfolio were South African entertainment company Multichoice, Indian thrifts & mortgage finance company Dewan Housing Finance and Indian energy & infrastructure provider Reliance Infrastructure.
Did the Portfolio make any significant purchases or sales during the reporting period?
Candriam
Significant purchases in the Candriam portion of the Portfolio during the reporting period included shares of Russian retailer X5 Retail and South African gold producer AngloGold Ashanti. The Candriam portion of the Portfolio added the position in X5 Retail because we believed that recent increases in operational efficiency positioned the company to benefit from favorable trends, such as food inflation. We believed that AngloGold Ashanti represented an attractive defensive stock sensitive to the price of gold in a time of rising geopolitical tensions and rallying gold prices.
During the reporting period, significant sales in the Candriam portion of the Portfolio included Brazilian bank Itaú Unibanco and the Chinese bank China Construction Bank. The Candriam portion of the Portfolio reduced its position in Itaú Unibanco in favor of other Brazil financial stocks, such as Banco do Brasil and reinsurance group IRB. The Candriam portion of the Portfolio reduced its position in China Construction Bank in preference for China Merchants Bank, which we believed had a stronger franchise.
MacKay Shields
The most substantial position initiated in the MacKay Shields portion of the Portfolio during the reporting period was in Mexican beverage retailer Fomento Económico Mexicano, while the largest increased purchase was in Brazilian bank Banco Bradesco. During the same period, the most substantial position that the MacKay Shields portion of the Portfolio exited entirely was in Mexican retailer Walmart de México, while the largest decreased position size was in Brazilian metals & mining company Vale.
How did the Portfolio’s sector weightings change during the reporting period?
Candriam
During the reporting period, the Candriam portion of the Portfolio saw its most substantial weighting increase relative to the MSCI Emerging Markets Index in the consumer discretionary sector. This increase was followed by relative sector-weighting increases in real estate and consumer staples. During the same period, the Candriam portion of the Portfolio saw a large decrease in its sector weightings relative to the benchmark in industrials, followed by sector-weighting decreases in materials and information technology.
MacKay Shields
In the MacKay Shields portion of the Portfolio, the most substantial increases in sector weightings relative to the MSCI Emerging Markets Index during the reporting period were in financials and communications services. Over the same period, the MacKay Shields portion of the Portfolio saw its most substantial decreases in sector weightings relative to the benchmark in materials and utilities.
How was the Portfolio positioned at the end of the reporting period?
Candriam
As of June 30, 2019, the sectors that were most substantially overweight relative to the MSCI Emerging Markets Index in the Candriam portion of the Portfolio were health care, financials and real estate. As of the same date, the sectors that were most substantially underweight in the Candriam portion of the Portfolio were utilities and materials.
MacKay Shields
As of June 30, 2019, the sectors in the MacKay Shields portion of the Portfolio that were most substantially overweight relative to the MSCI Emerging Markets Index were information technology and industrials. As of the same date, the sectors in the MacKay Shields portion of the Portfolio that were most substantially underweight relative to the Index were consumer staples and materials.
The opinions expressed are those of the portfolio managers as of the date of this report and are subject to change. There is no guarantee that any forecasts will come to pass. This material does not constitute investment advice and is not intended as an endorsement of any specific investment.
Not all MainStay VP Portfolios and/or share classes are available under all policies.
| | |
| 10 | | MainStay VP Emerging Markets Equity Portfolio |
Portfolio of InvestmentsJune 30, 2019 (Unaudited)
| | | | | | | | |
| | |
| | | Shares | | | Value | |
| Common Stocks 94.5%† | |
Argentina 0.7% | |
Grupo Financiero Galicia S.A., ADR (Banks) | | | 33,000 | | | $ | 1,171,500 | |
MercadoLibre, Inc. (Internet & Direct Marketing Retail) (a) | | | 3,500 | | | | 2,141,195 | |
| | | | | | | | |
| | | | | | | 3,312,695 | |
| | | | | | | | |
Brazil 6.2% | |
B3 S.A.—Brasil Bolsa Balcao (Capital Markets) | | | 24,000 | | | | 234,128 | |
Banco Bradesco S.A. (Banks) | | | 113,200 | | | | 986,091 | |
Banco do Brasil S.A. (Banks) | | | 344,500 | | | | 4,839,212 | |
Banco Santander Brasil S.A. (Banks) | | | 64,500 | | | | 763,596 | |
BRF S.A. (Food Products) (a) | | | 90,000 | | | | 691,884 | |
Camil Alimentos S.A. (Food Products) | | | 66,300 | | | | 123,969 | |
Centrais Eletricas Brasileiras S.A. (Electric Utilities) | | | 41,000 | | | | 376,372 | |
Cia de Locacao das Americas (Road & Rail) | | | 51,400 | | | | 654,288 | |
Cia Energetica de Minas Gerais (Electric Utilities) | | | 171,800 | | | | 837,536 | |
Cielo S.A. (IT Services) | | | 567,800 | | | | 993,663 | |
Construtora Tenda S.A. (Household Durables) | | | 115,800 | | | | 720,744 | |
Cosan S.A. (Oil, Gas & Consumable Fuels) | | | 75,700 | | | | 909,792 | |
Cyrela Brazil Realty S.A. Empreendimentos e Participacoes (Household Durables) | | | 300,000 | | | | 1,625,021 | |
IRB Brasil Resseguros S.A. (Insurance) | | | 78,500 | | | | 2,013,633 | |
JBS S.A. (Food Products) | | | 160,300 | | | | 885,836 | |
Localiza Rent a Car S.A. (Road & Rail) | | | 150,000 | | | | 1,600,802 | |
Magazine Luiza S.A. (Multiline Retail) | | | 26,000 | | | | 1,429,477 | |
Minerva S.A. (Food Products) (a) | | | 164,900 | | | | 341,399 | |
Movida Participacoes S.A. (Road & Rail) | | | 45,900 | | | | 178,104 | |
Notre Dame Intermedica Participacoes S.A. (Health Care Providers & Services) | | | 180,000 | | | | 1,890,024 | |
Petroleo Brasileiro S.A. (Oil, Gas & Consumable Fuels) | | | 9,700 | | | | 75,833 | |
Qualicorp Consultoria e Corretora de Seguros S.A. (Health Care Providers & Services) | | | 124,400 | | | | 744,142 | |
Rumo S.A. (Road & Rail) (a) | | | 260,000 | | | | 1,403,612 | |
SLC Agricola S.A. (Food Products) | | | 108,700 | | | | 500,196 | |
Sul America S.A. (Insurance) | | | 72,900 | | | | 712,303 | |
Tupy S.A. (Auto Components) | | | 33,000 | | | | 179,526 | |
Vale S.A. (Metals & Mining) | | | 218,775 | | | | 2,952,361 | |
Valid Solucoes e Servicos de Seguranca em Meios de Pagamento e Identificacao S.A. (Commercial Services & Supplies) | | | 42,600 | | | | 171,733 | |
Wiz Solucoes e Corretagem de Seguros S.A. (Insurance) | | | 84,300 | | | | 239,951 | |
| | | | | | | | |
| | | | | | | 29,075,228 | |
| | | | | | | | |
Chile 0.1% | |
Enel Americas S.A. (Electric Utilities) | | | 4,099,247 | | | | 722,968 | |
| | | | | | | | |
| | | | | | | | |
| | |
| | | Shares | | | Value | |
China 30.2% | |
Agricultural Bank of China, Ltd., Class H (Banks) | | | 438,000 | | | $ | 183,348 | |
Aier Eye Hospital Group Co., Ltd., Class A (Health Care Providers & Services) | | | 335,177 | | | | 1,511,354 | |
Alibaba Group Holding, Ltd., Sponsored ADR (Internet & Direct Marketing Retail) (a) | | | 113,573 | | | | 19,244,945 | |
Anhui Conch Cement Co., Ltd., Class H (Construction Materials) | | | 655,500 | | | | 4,107,521 | |
ANTA Sports Products, Ltd. (Textiles, Apparel & Luxury Goods) | | | 285,000 | | | | 1,957,352 | |
Autohome, Inc., ADR (Interactive Media & Services) (a)(b) | | | 1,000 | | | | 85,620 | |
BAIC Motor Corp., Ltd., Class H (Automobiles) (c) | | | 1,524,000 | | | | 955,951 | |
Baidu, Inc., Sponsored ADR (Interactive Media & Services) (a) | | | 7,600 | | | | 891,936 | |
Bank of China, Ltd., Class H (Banks) | | | 5,357,000 | | | | 2,263,029 | |
Bank of Communications Co., Ltd., Class H (Banks) | | | 1,455,000 | | | | 1,104,516 | |
Baozun, Inc., ADR (Internet & Direct Marketing Retail) (a)(b) | | | 26,000 | | | | 1,296,360 | |
Beijing Enterprises Holdings, Ltd. (Gas Utilities) | | | 195,500 | | | | 993,555 | |
Beijing Enterprises Water Group, Ltd. (Water Utilities) (a) | | | 2,900,000 | | | | 1,722,544 | |
BYD Electronic International Co., Ltd. (Communications Equipment) (b) | | | 428,500 | | | | 612,166 | |
China Aoyuan Group, Ltd. (Real Estate Management & Development) | | | 400,000 | | | | 562,234 | |
China CITIC Bank Corp., Ltd., Class H (Banks) | | | 1,527,000 | | | | 869,868 | |
China Communications Services Corp., Ltd., Class H (Construction & Engineering) | | | 1,138,000 | | | | 882,814 | |
China Construction Bank Corp., Class H (Banks) | | | 9,392,100 | | | | 8,091,559 | |
China Everbright Bank Co., Ltd., Class H (Banks) | | | 692,000 | | | | 317,135 | |
China Evergrande Group (Real Estate Management & Development) (b) | | | 406,000 | | | | 1,138,216 | |
China Galaxy Securities Co., Ltd., Class H (Capital Markets) | | | 1,296,000 | | | | 768,140 | |
China Lumena New Materials Corp. (Chemicals) (a)(d)(e)(f) | | | 260,000 | | | | 0 | |
China Merchants Bank Co., Ltd., Class H (Banks) | | | 1,260,000 | | | | 6,282,499 | |
China Mobile, Ltd. (Wireless Telecommunication Services) | | | 539,000 | | | | 4,909,283 | |
China Overseas Land & Investment, Ltd. (Real Estate Management & Development) | | | 700,000 | | | | 2,580,744 | |
China Pacific Insurance Group Co., Ltd., Class H (Insurance) | | | 217,200 | | | | 849,426 | |
China Petroleum & Chemical Corp., Class H (Oil, Gas & Consumable Fuels) | | | 1,634,000 | | | | 1,110,711 | |
| | | | | | |
The notes to the financial statements are an integral part of,
and should be read in conjunction with, the financial statements. | | | | | 11 | |
Portfolio of InvestmentsJune 30, 2019 (Unaudited) (continued)
| | | | | | | | |
| | |
| | | Shares | | | Value | |
| Common Stocks (continued) | |
China (continued) | |
China State Construction International Holdings, Ltd. (Construction & Engineering) | | | 600,000 | | | $ | 615,999 | |
China Telecom Corp., Ltd., Class H (Diversified Telecommunication Services) | | | 2,324,000 | | | | 1,169,185 | |
China Vanke Co., Ltd., Class H (Real Estate Management & Development) | | | 19,500 | | | | 73,140 | |
CITIC Securities Co., Ltd., Class H (Capital Markets) | | | 550,000 | | | | 1,146,229 | |
CITIC, Ltd. (Industrial Conglomerates) | | | 881,000 | | | | 1,269,898 | |
CNOOC, Ltd. (Oil, Gas & Consumable Fuels) | | | 1,277,000 | | | | 2,183,996 | |
COFCO Meat Holdings, Ltd. (Food Products) (a) | | | 747,000 | | | | 248,627 | |
COSCO Shipping Energy Transportation Co., Ltd., Class H (Marine) | | | 330,000 | | | | 195,169 | |
COSCO SHIPPING Ports, Ltd. (Transportation Infrastructure) | | | 300,000 | | | | 296,094 | |
Country Garden Holdings Co., Ltd. (Real Estate Management & Development) | | | 308,000 | | | | 468,405 | |
Country Garden Services Holdings Co., Ltd. (Commercial Services & Supplies) | | | 900,183 | | | | 2,081,148 | |
Ctrip.com International, Ltd., ADR (Internet & Direct Marketing Retail) (a) | | | 2,600 | | | | 95,966 | |
Fosun International, Ltd. (Industrial Conglomerates) | | | 749,000 | | | | 995,253 | |
Future Land Development Holdings, Ltd. (Real Estate Management & Development) | | | 1,800,000 | | | | 2,368,755 | |
Geely Automobile Holdings, Ltd. (Automobiles) | | | 280,000 | | | | 478,871 | |
Great Wall Motor Co., Ltd., Class H (Automobiles) (b) | | | 951,500 | | | | 680,887 | |
Guangzhou R&F Properties Co., Ltd., Class H (Real Estate Management & Development) (b) | | | 192,400 | | | | 369,938 | |
Guotai Junan Securities Co., Ltd., Class H (Capital Markets) (c) | | | 157,000 | | | | 279,765 | |
Haitong Securities Co., Ltd., Class H (Capital Markets) | | | 944,800 | | | | 1,059,494 | |
Hundsun Technologies, Inc., Class A (Software) | | | 19,944 | | | | 197,892 | |
Industrial & Commercial Bank of China, Ltd., Class H (Banks) | | | 3,299,000 | | | | 2,407,197 | |
JD.com, Inc., ADR (Internet & Direct Marketing Retail) (a) | | | 49,094 | | | | 1,487,057 | |
Jumei International Holding, Ltd., ADR (Internet & Direct Marketing Retail) (a) | | | 73,900 | | | | 181,794 | |
Kunlun Energy Co., Ltd. (Gas Utilities) | | | 1,300,000 | | | | 1,133,300 | |
Kweichow Moutai Co., Ltd., Class A (Beverages) | | | 5,885 | | | | 843,126 | |
Lenovo Group, Ltd. (Technology Hardware, Storage & Peripherals) | | | 1,768,000 | | | | 1,369,279 | |
| | | | | | | | |
| | |
| | | Shares | | | Value | |
China (continued) | |
Longfor Group Holdings, Ltd. (Real Estate Management & Development) | | | 308,500 | | | $ | 1,163,041 | |
Longi Green Energy Technology Co., Ltd., Class A (Semiconductors & Semiconductor Equipment) | | | 240,422 | | | | 808,956 | |
Luxshare Precision Industry Co., Ltd., Class A (Electronic Equipment, Instruments & Components) | | | 159,951 | | | | 577,317 | |
Luye Pharma Group, Ltd. (Pharmaceuticals) (b)(c) | | | 1,185,500 | | | | 858,959 | |
Momo, Inc., Sponsored ADR (Interactive Media & Services) | | | 23,000 | | | | 823,400 | |
Nari Technology Co., Ltd., Class A (Electrical Equipment) | | | 229,963 | | | | 624,101 | |
NetEase, Inc., ADR (Entertainment) | | | 4,900 | | | | 1,253,273 | |
Noah Holdings, Ltd., ADR (Capital Markets) (a) | | | 11,000 | | | | 468,050 | |
PetroChina Co., Ltd., Class H (Oil, Gas & Consumable Fuels) | | | 1,000,000 | | | | 551,737 | |
PICC Property & Casualty Co., Ltd., Class H (Insurance) | | | 1,092,000 | | | | 1,178,432 | |
Pinduoduo, Inc., ADR (Internet & Direct Marketing Retail) (a)(b) | | | 28,000 | | | | 577,640 | |
Ping An Insurance Group Co. of China, Ltd., Class H (Insurance) | | | 905,000 | | | | 10,866,905 | |
Sany Heavy Industry Co., Ltd., Class A (Machinery) | | | 639,906 | | | | 1,218,638 | |
Shenzhen International Holdings, Ltd. (Transportation Infrastructure) | | | 400,000 | | | | 793,681 | |
Sihuan Pharmaceutical Holdings Group, Ltd. (Pharmaceuticals) | | | 3,901,000 | | | | 878,907 | |
Silergy Corp. (Semiconductors & Semiconductor Equipment) | | | 50,000 | | | | 978,767 | |
Sinopec Engineering Group Co., Ltd., Class H (Construction & Engineering) | | | 326,500 | | | | 276,691 | |
Sinotruk Hong Kong, Ltd. (Machinery) | | | 485,000 | | | | 839,408 | |
Springland International Holdings, Ltd. (Food & Staples Retailing) | | | 447,000 | | | | 87,550 | |
Sunac China Holdings, Ltd. (Real Estate Management & Development) | | | 291,000 | | | | 1,430,470 | |
TAL Education Group, ADR (Diversified Consumer Services) (a) | | | 57,000 | | | | 2,171,700 | |
Tencent Holdings, Ltd. (Interactive Media & Services) | | | 496,600 | | | | 22,415,244 | |
Tianneng Power International, Ltd. (Auto Components) | | | 192,000 | | | | 154,599 | |
Weichai Power Co., Ltd., Class H (Machinery) | | | 603,000 | | | | 1,018,933 | |
Weiqiao Textile Co., Ltd., Class H (Textiles, Apparel & Luxury Goods) | | | 254,500 | | | | 80,797 | |
Wuxi Biologics Cayman, Inc. (Life Sciences Tools & Services) (a)(c) | | | 60,000 | | | | 538,807 | |
| | | | |
| 12 | | MainStay VP Emerging Markets Equity Portfolio | | The notes to the financial statements are an integral part of,
and should be read in conjunction with, the financial statements. |
| | | | | | | | |
| | |
| | | Shares | | | Value | |
| Common Stocks (continued) | |
China (continued) | |
Yum China Holdings, Inc. (Hotels, Restaurants & Leisure) | | | 3,900 | | | $ | 180,180 | |
| | | | | | | | |
| | | | | | | 141,805,473 | |
| | | | | | | | |
Colombia 0.1% | |
Ecopetrol S.A. (Oil, Gas & Consumable Fuels) | | | 203,330 | | | | 184,759 | |
Grupo Argos S.A. (Construction Materials) | | | 29,445 | | | | 158,518 | |
Interconexion Electrica S.A. E.S.P. (Electric Utilities) | | | 27,843 | | | | 154,746 | |
| | | | | | | | |
| | | | | | | 498,023 | |
| | | | | | | | |
Egypt 0.3% | |
Commercial International Bank Egypt S.A.E., GDR (Banks) | | | 310,000 | | | | 1,317,500 | |
| | | | | | | | |
|
Greece 0.2% | |
FF Group (Textiles, Apparel & Luxury Goods) (a)(e)(f) | | | 19,000 | | | | 51,852 | |
Motor Oil Hellas Corinth Refineries S.A. (Oil, Gas & Consumable Fuels) | | | 31,577 | | | | 807,889 | |
| | | | | | | | |
| | | | | | | 859,741 | |
| | | | | | | | |
Hong Kong 0.7% | |
China Metal Recycling Holdings, Ltd. (Metals & Mining) (d)(e)(f) | | | 75,000 | | | | 0 | |
CSPC Pharmaceutical Group, Ltd. (Pharmaceuticals) | | | 600,000 | | | | 967,779 | |
Kingboard Laminates Holdings, Ltd. (Electronic Equipment, Instruments & Components) | | | 356,500 | | | | 326,759 | |
SSY Group, Ltd. (Pharmaceuticals) | | | 1,450,000 | | | | 1,310,470 | |
Xinyi Glass Holdings, Ltd. (Auto Components) | | | 900,000 | | | | 944,737 | |
| | | | | | | | |
| | | | | | | 3,549,745 | |
| | | | | | | | |
Hungary 0.6% | |
MOL Hungarian Oil & Gas PLC (Oil, Gas & Consumable Fuels) | | | 150,000 | | | | 1,664,151 | |
OTP Bank Nyrt. (Banks) | | | 23,817 | | | | 947,286 | |
| | | | | | | | |
| | | | | | | 2,611,437 | |
| | | | | | | | |
India 9.9% | |
Adani Ports & Special Economic Zone, Ltd. (Transportation Infrastructure) | | | 220,000 | | | | 1,307,363 | |
Aurobindo Pharma, Ltd. (Pharmaceuticals) | | | 12,273 | | | | 108,102 | |
Axis Bank, Ltd. (Banks) (a) | | | 284,619 | | | | 3,338,818 | |
Bajaj Finance, Ltd. (Consumer Finance) | | | 94,893 | | | | 5,066,230 | |
Coal India, Ltd. (Oil, Gas & Consumable Fuels) | | | 57,149 | | | | 209,670 | |
DCM Shriram, Ltd. (Chemicals) | | | 10,921 | | | | 88,876 | |
Dewan Housing Finance Corp., Ltd. (Thrifts & Mortgage Finance) | | | 268,091 | | | | 282,354 | |
Divi’s Laboratories, Ltd. (Life Sciences Tools & Services) | | | 27,970 | | | | 647,106 | |
| | | | | | | | |
| | |
| | | Shares | | | Value | |
India (continued) | |
GAIL India, Ltd. (Gas Utilities) | | | 150,996 | | | $ | 682,164 | |
Graphite India, Ltd. (Electrical Equipment) | | | 13,923 | | | | 67,661 | |
HCL Technologies, Ltd. (IT Services) | | | 56,131 | | | | 866,634 | |
Hindustan Petroleum Corp., Ltd. (Oil, Gas & Consumable Fuels) | | | 153,973 | | | | 644,756 | |
Hindustan Unilever, Ltd. (Household Products) | | | 26,508 | | | | 686,975 | |
Housing Development Finance Corp., Ltd. (Thrifts & Mortgage Finance) | | | 140,352 | | | | 4,461,822 | |
ICICI Bank, Ltd. (Banks) | | | 11,666 | | | | 73,804 | |
India Cements, Ltd. (Construction Materials) | | | 194,408 | | | | 280,512 | |
Indiabulls Housing Finance, Ltd. (Thrifts & Mortgage Finance) | | | 63,816 | | | | 561,172 | |
Indian Oil Corp., Ltd. (Oil, Gas & Consumable Fuels) | | | 89,260 | | | | 201,402 | |
Infosys, Ltd. (IT Services) | | | 391,930 | | | | 4,154,506 | |
InterGlobe Aviation, Ltd. (Airlines) (c) | | | 4,272 | | | | 96,363 | |
ITC, Ltd. (Tobacco) | | | 162,415 | | | | 644,225 | |
Larsen & Toubro, Ltd. (Construction & Engineering) | | | 20,934 | | | | 473,056 | |
LIC Housing Finance, Ltd. (Thrifts & Mortgage Finance) | | | 45,248 | | | | 366,428 | |
Oil & Natural Gas Corp., Ltd. (Oil, Gas & Consumable Fuels) | | | 333,395 | | | | 811,421 | |
Petronet LNG, Ltd. (Oil, Gas & Consumable Fuels) | | | 800,000 | | | | 2,850,458 | |
Power Grid Corp. of India, Ltd. (Electric Utilities) | | | 272,379 | | | | 812,471 | |
PVR, Ltd. (Entertainment) | | | 55,000 | | | | 1,332,223 | |
REC, Ltd. (Diversified Financial Services) | | | 274,813 | | | | 657,298 | |
Reliance Capital, Ltd. (Diversified Financial Services) | | | 87,845 | | | | 83,992 | |
Reliance Industries, Ltd. (Oil, Gas & Consumable Fuels) | | | 306,104 | | | | 5,560,891 | |
Shree Cement, Ltd. (Construction Materials) | | | 7,500 | | | | 2,357,756 | |
Sonata Software, Ltd. (IT Services) | | | 18,198 | | | | 92,008 | |
State Bank of India (Banks) (a) | | | 84,723 | | | | 445,294 | |
Tata Consultancy Services, Ltd. (IT Services) | | | 53,004 | | | | 1,710,810 | |
Tata Steel, Ltd. (Metals & Mining) | | | 16,222 | | | | 118,632 | |
Tech Mahindra, Ltd. (IT Services) | | | 121,931 | | | | 1,249,648 | |
Titan Co., Ltd. (Textiles, Apparel & Luxury Goods) | | | 73,000 | | | | 1,407,969 | |
UPL, Ltd. (Chemicals) | | | 51,659 | | | | 704,228 | |
Vedanta, Ltd. (Metals & Mining) | | | 60,456 | | | | 152,656 | |
Wipro, Ltd. (IT Services) | | | 176,194 | | | | 716,875 | |
Zensar Technologies, Ltd. (Software) | | | 25,900 | | | | 96,636 | |
| | | | | | | | |
| | | | | | | 46,471,265 | |
| | | | | | | | |
Indonesia 1.6% | |
Bank Rakyat Indonesia Persero Tbk PT (Banks) | | | 13,500,000 | | | | 4,166,342 | |
PT Bank Negara Indonesia Persero Tbk (Banks) | | | 716,400 | | | | 466,528 | |
| | | | | | |
The notes to the financial statements are an integral part of,
and should be read in conjunction with, the financial statements. | | | | | 13 | |
Portfolio of InvestmentsJune 30, 2019 (Unaudited) (continued)
| | | | | | | | |
| | |
| | | Shares | | | Value | |
| Common Stocks (continued) | |
Indonesia (continued) | |
PT Bank Rakyat Indonesia Persero Tbk (Banks) | | | 4,380,300 | | | $ | 1,351,839 | |
PT Bank Tabungan Negara Persero Tbk (Banks) | | | 552,400 | | | | 96,189 | |
PT Gudang Garam Tbk (Tobacco) | | | 119,600 | | | | 650,805 | |
PT Indah Kiat Pulp & Paper Corp. Tbk (Paper & Forest Products) | | | 391,100 | | | | 259,534 | |
PT Indofood Sukses Makmur Tbk (Food Products) | | | 1,039,400 | | | | 516,849 | |
Telekomunikasi Indonesia Persero Tbk PT (Diversified Telecommunication Services) | | | 300,000 | | | | 87,914 | |
| | | | | | | | |
| | | | | | | 7,596,000 | |
| | | | | | | | |
Malaysia 0.8% | |
AMMB Holdings BHD (Banks) | | | 803,900 | | | | 822,867 | |
Bernaz Auto BHD (Specialty Retail) | | | 364,100 | | | | 234,363 | |
Dialog Group BHD (Energy Equipment & Services) | | | 1,800,000 | | | | 1,419,964 | |
Hibiscus Petroleum BHD (Oil, Gas & Consumable Fuels) (a) | | | 1,588,400 | | | | 411,274 | |
IOI Properties Group BHD (Real Estate Management & Development) | | | 347,400 | | | | 116,010 | |
Malaysian Pacific Industries BHD (Semiconductors & Semiconductor Equipment) | | | 41,300 | | | | 92,144 | |
MISC BHD (Marine) | | | 104,800 | | | | 181,324 | |
PPB Group BHD (Food Products) | | | 16,900 | | | | 76,474 | |
VS Industry BHD (Electronic Equipment, Instruments & Components) | | | 1,277,800 | | | | 340,128 | |
| | | | | | | | |
| | | | | | | 3,694,548 | |
| | | | | | | | |
Mexico 2.5% | |
Aleatica, S.A.B. de C.V. (Transportation Infrastructure) | | | 95,000 | | | | 87,508 | |
America Movil S.A.B. de C.V.,
Series L (Wireless Telecommunication Services) | | | 2,525,800 | | | | 1,841,013 | |
Banco Santander Mexico, S.A., Institucion de Banca Multiple, Grupo Financiero Santander (Banks) | | | 649,600 | | | | 996,716 | |
Credito Real S.A.B. de C.V. (Consumer Finance) | | | 75,400 | | | | 91,570 | |
Fibra Uno Administracion S.A. de C.V. (Equity Real Estate Investment Trusts) | | | 790,200 | | | | 1,048,179 | |
Fomento Economico Mexicano S.A.B. de C.V. (Beverages) | | | 168,400 | | | | 1,629,274 | |
Grupo Aeroportuario del Sureste S.A.B. de C.V., Class B (Transportation Infrastructure) | | | 90,000 | | | | 1,460,538 | |
Grupo Financiero Banorte S.A.B. de C.V., Class O (Banks) | | | 600,000 | | | | 3,484,885 | |
| | | | | | | | |
| | |
| | | Shares | | | Value | |
Mexico (continued) | |
Wal-Mart de Mexico S.A.B. de C.V. (Food & Staples Retailing) | | | 350,000 | | | $ | 955,337 | |
| | | | | | | | |
| | | | | | | 11,595,020 | |
| | | | | | | | |
Peru 0.7% | |
Credicorp, Ltd. (Banks) | | | 8,200 | | | | 1,877,062 | |
Southern Copper Corp. (Metals & Mining) | | | 40,000 | | | | 1,554,000 | |
| | | | | | | | |
| | | | | | | 3,431,062 | |
| | | | | | | | |
Philippines 1.7% | |
Alliance Global Group, Inc. (Industrial Conglomerates) | | | 1,671,600 | | | | 503,747 | |
Ayala Land, Inc. (Real Estate Management & Development) | | | 3,300,000 | | | | 3,271,982 | |
Globe Telecom, Inc. (Wireless Telecommunication Services) | | | 21,996 | | | | 971,113 | |
International Container Terminal Services, Inc. (Transportation Infrastructure) | | | 191,630 | | | | 547,568 | |
Jollibee Foods Corp. (Hotels, Restaurants & Leisure) | | | 230,000 | | | | 1,265,034 | |
PLDT, Inc. (Wireless Telecommunication Services) | | | 9,795 | | | | 246,619 | |
Universal Robina Corp. (Food Products) | | | 330,000 | | | | 1,069,191 | |
| | | | | | | | |
| | | | | | | 7,875,254 | |
| | | | | | | | |
Poland 1.4% | |
Asseco Poland S.A. (Software) | | | 39,350 | | | | 561,744 | |
CD Projekt S.A. (Entertainment) | | | 34,500 | | | | 1,989,434 | |
Ciech S.A. (Chemicals) | | | 7,674 | | | | 85,811 | |
Dino Polska S.A. (Food & Staples Retailing) (a)(c) | | | 62,000 | | | | 2,173,691 | |
Enea S.A. (Electric Utilities) (a) | | | 77,434 | | | | 193,603 | |
Grupa Lotos S.A. (Oil, Gas & Consumable Fuels) | | | 27,677 | | | | 627,869 | |
PLAY Communications S.A. (Wireless Telecommunication Services) (c) | | | 72,413 | | | | 627,224 | |
Tauron Polska Energia S.A. (Electric Utilities) (a) | | | 311,101 | | | | 142,817 | |
| | | | | | | | |
| | | | | | | 6,402,193 | |
| | | | | | | | |
Republic of Korea 11.6% | |
BNK Financial Group, Inc. (Banks) | | | 12,304 | | | | 79,814 | |
Celltrion, Inc. (Biotechnology) (a) | | | 2,476 | | | | 440,669 | |
Cheil Worldwide, Inc. (Media) | | | 4,082 | | | | 103,937 | |
CJ CheilJedang Corp. (Food Products) | | | 393 | | | | 101,088 | |
Cosmax, Inc. (Personal Products) | | | 2,000 | | | | 188,802 | |
Daelim Industrial Co., Ltd. (Construction & Engineering) | | | 9,931 | | | | 989,101 | |
DGB Financial Group, Inc. (Banks) | | | 49,204 | | | | 347,302 | |
Dongwon Industries Co., Ltd. (Food Products) | | | 1,386 | | | | 300,091 | |
Doosan Bobcat, Inc. (Machinery) (a) | | | 2,816 | | | | 88,774 | |
Eugene Corp. (Construction Materials) | | | 31,699 | | | | 162,798 | |
| | | | |
| 14 | | MainStay VP Emerging Markets Equity Portfolio | | The notes to the financial statements are an integral part of,
and should be read in conjunction with, the financial statements. |
| | | | | | | | |
| | |
| | | Shares | | | Value | |
| Common Stocks (continued) | |
Republic of Korea (continued) | |
Fila Korea, Ltd. (Textiles, Apparel & Luxury Goods) | | | 14,767 | | | $ | 980,928 | |
GS Engineering & Construction Corp. (Construction & Engineering) | | | 27,163 | | | | 949,229 | |
Hana Financial Group, Inc. (Banks) | | | 32,720 | | | | 1,059,826 | |
Hanwha Corp. (Industrial Conglomerates) | | | 27,638 | | | | 639,098 | |
Hotel Shilla Co., Ltd. (Specialty Retail) | | | 12,000 | | | | 1,008,098 | |
Hyundai Glovis Co., Ltd. (Air Freight & Logistics) | | | 3,578 | | | | 498,903 | |
Hyundai Heavy Industries Holdings Co., Ltd. (Machinery) | | | 3,802 | | | | 1,066,858 | |
Hyundai Marine & Fire Insurance Co., Ltd. (Insurance) | | | 2,968 | | | | 73,130 | |
Hyundai Mobis Co., Ltd. (Auto Components) (a) | | | 1,445 | | | | 294,719 | |
Hyundai Motor Co. (Automobiles) | | | 4,057 | | | | 491,907 | |
Industrial Bank of Korea (Banks) | | | 65,523 | | | | 797,296 | |
Kakao Corp. (Interactive Media & Services) | | | 21,237 | | | | 2,418,625 | |
KB Financial Group, Inc. (Banks) | | | 18,836 | | | | 747,959 | |
KGInicis Co., Ltd. (IT Services) | | | 16,280 | | | | 212,198 | |
Kia Motors Corp. (Automobiles) | | | 34,857 | | | | 1,328,288 | |
Koh Young Technology, Inc. (Semiconductors & Semiconductor Equipment) | | | 15,000 | | | | 1,079,548 | |
Korea Investment Holdings Co., Ltd. (Capital Markets) | | | 43,945 | | | | 3,071,374 | |
KT Corp. (Diversified Telecommunication Services) | | | 6,720 | | | | 164,995 | |
KT&G Corp. (Tobacco) | | | 5,431 | | | | 463,304 | |
Kumho Petrochemical Co., Ltd. (Chemicals) | | | 3,421 | | | | 288,577 | |
LG Chem, Ltd. (Chemicals) | | | 6,000 | | | | 1,842,117 | |
LG Electronics, Inc. (Household Durables) | | | 4,938 | | | | 339,136 | |
LG Household & Health Care, Ltd. (Personal Products) | | | 1,436 | | | | 1,632,934 | |
LG Uplus Corp. (Diversified Telecommunication Services) | | | 33,120 | | | | 415,918 | |
NAVER Corp. (Interactive Media & Services) | | | 5,459 | | | | 538,974 | |
NCSoft Corp. (Entertainment) | | | 4,179 | | | | 1,726,395 | |
Nice Information Service Co., Ltd. (Professional Services) | | | 12,779 | | | | 187,593 | |
Orange Life Insurance, Ltd. (Insurance) (c) | | | 10,635 | | | | 291,515 | |
Osstem Implant Co., Ltd. (Health Care Equipment & Supplies) (a) | | | 32,020 | | | | 2,077,078 | |
Partron Co., Ltd. (Electronic Equipment, Instruments & Components) | | | 47,333 | | | | 727,632 | |
POSCO (Metals & Mining) | | | 3,652 | | | | 773,320 | |
Samsung Electronics Co., Ltd. (Technology Hardware, Storage & Peripherals) | | | 392,056 | | | | 15,958,630 | |
Samsung Engineering Co., Ltd. (Construction & Engineering) (a) | | | 80,000 | | | | 1,188,239 | |
| | | | | | | | |
| | |
| | | Shares | | | Value | |
Republic of Korea (continued) | |
Shinhan Financial Group Co., Ltd. (Banks) | | | 27,897 | | | $ | 1,084,809 | |
Shinsegae, Inc. (Multiline Retail) | | | 1,339 | | | | 349,057 | |
SK Hynix, Inc. (Semiconductors & Semiconductor Equipment) | | | 40,126 | | | | 2,415,240 | |
SK Materials Co., Ltd. (Chemicals) | | | 4,500 | | | | 577,188 | |
SK Telecom Co., Ltd. (Wireless Telecommunication Services) | | | 3,739 | | | | 838,696 | |
Woori Financial Group, Inc. (Banks) | | | 74,528 | | | | 906,871 | |
| | | | | | | | |
| | | | | | | 54,308,578 | |
| | | | | | | | |
Romania 0.0%‡ | |
NEPI Rockcastle PLC (Real Estate) | | | 16,106 | | | | 147,978 | |
| | | | | | | | |
|
Russia 4.9% | |
Gazprom PAO, Sponsored ADR (Oil, Gas & Consumable Fuels) | | | 340,660 | | | | 2,493,631 | |
LUKOIL PJSC, Sponsored ADR (Oil, Gas & Consumable Fuels) | | | 18,935 | | | | 1,590,919 | |
MMC Norilsk Nickel PJSC, ADR (Metals & Mining) | | | 65,232 | | | | 1,469,025 | |
Mobile TeleSystems PJSC, Sponsored ADR (Wireless Telecommunication Services) | | | 40,600 | | | | 377,986 | |
Polymetal International PLC (Metals & Mining) | | | 120,000 | | | | 1,519,063 | |
Polyus PJSC (Metals & Mining) (a) | | | 2,500 | | | | 230,109 | |
Qiwi PLC, Sponsored ADR (IT Services) | | | 25,000 | | | | 489,250 | |
Rosneft Oil Co. PJSC, GDR (Oil, Gas & Consumable Fuels) | | | 63,426 | | | | 415,440 | |
Sberbank of Russia PJSC, Sponsored ADR (Banks) | | | 158,021 | | | | 2,414,561 | |
Severstal PJSC, Registered, GDR (Metals & Mining) | | | 60,563 | | | | 1,020,486 | |
Surgutneftegas PJSC, Sponsored ADR (Oil, Gas & Consumable Fuels) | | | 185,474 | | | | 760,443 | |
Tatneft PJSC (Oil, Gas & Consumable Fuels) | | | 130,000 | | | | 1,596,110 | |
Tatneft PJSC, Sponsored ADR (Oil, Gas & Consumable Fuels) | | | 11,331 | | | | 831,129 | |
TCS Group Holding PLC (Banks) | | | 130,000 | | | | 2,548,000 | |
VTB Bank PJSC, GDR (Banks) | | | 135,111 | | | | 169,970 | |
X5 Retail Group N.V., GDR (Food & Staples Retailing) | | | 65,000 | | | | 2,228,850 | |
Yandex N.V., Class A (Interactive Media & Services) (a) | | | 77,000 | | | | 2,926,000 | |
| | | | | | | | |
| | | | | | | 23,080,972 | |
| | | | | | | | |
South Africa 5.9% | |
Absa Group, Ltd. (Banks) | | | 86,019 | | | | 1,074,856 | |
African Rainbow Minerals, Ltd. (Metals & Mining) | | | 54,377 | | | | 703,291 | |
AngloGold Ashanti, Ltd. (Metals & Mining) | | | 125,000 | | | | 2,254,260 | |
Ascendis Health, Ltd. (Pharmaceuticals) (a) | | | 285,724 | | | | 95,343 | |
Assore, Ltd. (Metals & Mining) | | | 11,546 | | | | 300,663 | |
Astral Foods, Ltd. (Food Products) | | | 16,139 | | | | 177,615 | |
Bidvest Group, Ltd. (Industrial Conglomerates) | | | 89,000 | | | | 1,196,461 | |
| | | | | | |
The notes to the financial statements are an integral part of,
and should be read in conjunction with, the financial statements. | | | | | 15 | |
Portfolio of InvestmentsJune 30, 2019 (Unaudited) (continued)
| | | | | | | | |
| | |
| | | Shares | | | Value | |
| Common Stocks (continued) | |
South Africa (continued) | |
Capitec Bank Holdings, Ltd. (Banks) | | | 30,000 | | | $ | 2,766,219 | |
EOH Holdings, Ltd. (IT Services) (a) | | | 65,724 | | | | 91,318 | |
Exxaro Resources, Ltd. (Oil, Gas & Consumable Fuels) | | | 85,251 | | | | 1,040,988 | |
Harmony Gold Mining Co., Ltd. (Metals & Mining) (a) | | | 48,988 | | | | 110,393 | |
Investec, Ltd. (Capital Markets) | | | 23,569 | | | | 153,713 | |
Kumba Iron Ore, Ltd. (Metals & Mining) | | | 3,321 | | | | 117,745 | |
Liberty Holdings, Ltd. (Insurance) | | | 39,667 | | | | 297,566 | |
MTN Group, Ltd. (Wireless Telecommunication Services) | | | 65,935 | | | | 499,720 | |
Naspers, Ltd. (Internet & Direct Marketing Retail) | | | 51,050 | | | | 12,393,788 | |
Nedbank Group, Ltd. (Banks) | | | 15,013 | | | | 269,882 | |
Old Mutual, Ltd. (Insurance) | | | 200,586 | | | | 301,911 | |
Sibanye Gold, Ltd. (Metals & Mining) (a) | | | 165,243 | | | | 196,626 | |
Standard Bank Group, Ltd. (Banks) | | | 214,311 | | | | 2,992,442 | |
Telkom S.A. SOC, Ltd. (Diversified Telecommunication Services) (b) | | | 140,752 | | | | 921,259 | |
| | | | | | | | |
| | | | | | | 27,956,059 | |
| | | | | | | | |
Taiwan 10.2% | |
Accton Technology Corp. (Communications Equipment) | | | 440,000 | | | | 1,862,876 | |
Airtac International Group (Machinery) | | | 80,000 | | | | 896,344 | |
Arcadyan Technology Corp. (Communications Equipment) | | | 193,000 | | | | 552,414 | |
Asia Cement Corp. (Construction Materials) | | | 677,000 | | | | 1,036,441 | |
ASPEED Technology, Inc. (Semiconductors & Semiconductor Equipment) | | | 40,000 | | | | 762,408 | |
Center Laboratories, Inc. (Pharmaceuticals) | | | 267,000 | | | | 665,362 | |
Chailease Holding Co., Ltd. (Diversified Financial Services) | | | 932,400 | | | | 3,857,545 | |
CTBC Financial Holding Co., Ltd. (Banks) | | | 313,000 | | | | 215,153 | |
Delta Electronics, Inc. (Electronic Equipment, Instruments & Components) | | | 248,000 | | | | 1,257,586 | |
E.Sun Financial Holding Co., Ltd. (Banks) | | | 1,900,533 | | | | 1,590,942 | |
Feng TAY Enterprise Co., Ltd. (Textiles, Apparel & Luxury Goods) | | | 86,000 | | | | 670,069 | |
Formosa Taffeta Co., Ltd. (Textiles, Apparel & Luxury Goods) | | | 445,000 | | | | 560,199 | |
Giant Manufacturing Co., Ltd. (Leisure Products) | | | 220,000 | | | | 1,721,213 | |
GlobalWafers Co., Ltd. (Semiconductors & Semiconductor Equipment) | | | 64,000 | | | | 648,046 | |
Hon Hai Precision Industry Co., Ltd. (Electronic Equipment, Instruments & Components) | | | 375,892 | | | | 936,720 | |
King Yuan Electronics Co., Ltd. (Semiconductors & Semiconductor Equipment) | | | 640,000 | | | | 552,230 | |
| | | | | | | | |
| | |
| | | Shares | | | Value | |
Taiwan (continued) | |
Makalot Industrial Co., Ltd. (Textiles, Apparel & Luxury Goods) | | | 193,000 | | | $ | 1,304,914 | |
MediaTek, Inc. (Semiconductors & Semiconductor Equipment) | | | 9,000 | | | | 90,987 | |
Novatek Microelectronics Corp. (Semiconductors & Semiconductor Equipment) | | | 132,000 | | | | 735,234 | |
Pou Chen Corp. (Textiles, Apparel & Luxury Goods) | | | 599,000 | | | | 742,494 | |
Radiant Opto-Electronics Corp. (Semiconductors & Semiconductor Equipment) | | | 170,000 | | | | 569,230 | |
Realtek Semiconductor Corp. (Semiconductors & Semiconductor Equipment) | | | 98,000 | | | | 720,971 | |
Ruentex Industries, Ltd. (Textiles, Apparel & Luxury Goods) | | | 369,600 | | | | 898,430 | |
Shanghai Commercial & Savings Bank, Ltd. (Banks) | | | 378,000 | | | | 683,965 | |
Sino-American Silicon Products, Inc. (Semiconductors & Semiconductor Equipment) (a) | | | 218,000 | | | | 572,733 | |
Taiwan Cement Corp. (Construction Materials) | | | 643,500 | | | | 954,078 | |
Taiwan Semiconductor Manufacturing Co., Ltd. (Semiconductors & Semiconductor Equipment) | | | 2,090,000 | | | | 16,082,358 | |
Taiwan Surface Mounting Technology Co., Ltd. (Semiconductors & Semiconductor Equipment) | | | 324,000 | | | | 608,162 | |
TCI Co., Ltd. (Personal Products) | | | 25,000 | | | | 343,695 | |
Uni-President Enterprises Corp. (Food Products) | | | 742,000 | | | | 1,975,673 | |
Unimicron Technology Corp. (Electronic Equipment, Instruments & Components) | | | 522,000 | | | | 592,427 | |
United Integrated Services Co., Ltd. (Construction & Engineering) | | | 138,000 | | | | 675,349 | |
Walsin Technology Corp. (Electronic Equipment, Instruments & Components) | | | 131,000 | | | | 691,705 | |
Yuanta Financial Holding Co., Ltd. (Capital Markets) | | | 1,936,000 | | | | 1,162,491 | |
Zhen Ding Technology Holding, Ltd. (Electronic Equipment, Instruments & Components) | | | 195,000 | | | | 624,060 | |
| | | | | | | | |
| | | | | | | 47,814,504 | |
| | | | | | | | |
Thailand 3.3% | |
Advanced Info Service PCL, NVDR (Wireless Telecommunication Services) | | | 300,000 | | | | 2,132,551 | |
BTS Group Holdings PCL, NVDR (Road & Rail) | | | 207,500 | | | | 81,193 | |
Charoen Pokphand Foods PCL, NVDR (Food Products) | | | 1,127,600 | | | | 1,038,712 | |
CP ALL PCL, NVDR (Food & Staples Retailing) | | | 1,150,000 | | | | 3,224,912 | |
| | | | |
| 16 | | MainStay VP Emerging Markets Equity Portfolio | | The notes to the financial statements are an integral part of,
and should be read in conjunction with, the financial statements. |
| | | | | | | | |
| | |
| | | Shares | | | Value | |
| Common Stocks (continued) | |
Thailand (continued) | |
Energy Absolute PCL, NVDR (Independent Power & Renewable Electricity Producers) | | | 1,500,000 | | | $ | 2,726,828 | |
Major Cineplex Group PCL, NVDR (Entertainment) | | | 249,300 | | | | 237,777 | |
PTT Exploration & Production PCL, NVDR (Oil, Gas & Consumable Fuels) | | | 270,600 | | | | 1,191,196 | |
PTT Global Chemical PCL, NVDR (Chemicals) | | | 542,700 | | | | 1,132,561 | |
PTT PCL, NVDR (Oil, Gas & Consumable Fuels) | | | 351,600 | | | | 558,914 | |
Sri Trang Agro-Industry PCL, NVDR (Auto Components) | | | 304,800 | | | | 126,224 | |
Srisawad Corp. PCL, NVDR (Consumer Finance) | | | 1,400,000 | | | | 2,567,865 | |
Thai Union Group PCL, NVDR (Food Products) | | | 452,600 | | | | 270,077 | |
Thanachart Capital PCL, NVDR (Banks) | | | 99,600 | | | | 180,249 | |
| | | | | | | | |
| | | | | | | 15,469,059 | |
| | | | | | | | |
Turkey 0.5% | |
Haci Omer Sabanci Holding A/S (Diversified Financial Services) | | | 78,279 | | | | 116,124 | |
Turkcell Iletisim Hizmetleri A/S (Wireless Telecommunication Services) | | | 147,700 | | | | 326,493 | |
Turkiye Garanti Bankasi A/S (Banks) (a) | | | 582,087 | | | | 914,773 | |
Turkiye Halk Bankasi A/S (Banks) | | | 585,377 | | | | 580,272 | |
Turkiye Sise ve Cam Fabrikalari A/S (Industrial Conglomerates) | | | 410,270 | | | | 367,723 | |
| | | | | | | | |
| | | | | | | 2,305,385 | |
| | | | | | | | |
United Arab Emirates 0.4% | |
NMC Health PLC (Health Care Providers & Services) (b) | | | 64,000 | | | | 1,953,080 | |
| | | | | | | | |
Total Common Stocks
(Cost $412,118,786) | | | | | | | 443,853,767 | |
| | | | | | | | |
|
| Exchange-Traded Funds 0.3% | |
United States 0.3% | |
iShares MSCI Emerging Markets ETF (Capital Markets) | | | 4,118 | | | | 176,704 | |
iShares MSCI Qatar ETF (Capital Markets) | | | 79,534 | | | | 1,422,863 | |
| | | | | | | | |
Total Exchange-Traded Funds
(Cost $1,671,039) | | | | | | | 1,599,567 | |
| | | | | | | | |
|
| Preferred Stocks 4.1% | |
Brazil 3.1% | |
Banco Bradesco S.A. 2.61% (Banks) | | | 219,200 | | | | 2,154,353 | |
Banco do Estado do Rio Grande do Sul S.A. 8.55% Class B (Banks) | | | 23,600 | | | | 145,965 | |
Centrais Eletricas Brasileiras S.A. 3.69% Class B (Electric Utilities) | | | 91,500 | | | | 857,824 | |
| | | | | | | | |
| | |
| | | Shares | | | Value | |
Brazil (continued) | |
Cia Energetica de Minas Gerais 3.89% (Electric Utilities) | | | 103,700 | | | $ | 401,033 | |
Cia Paranaense de Energia 2.91% Class B (Electric Utilities) | | | 24,800 | | | | 313,879 | |
Itau Unibanco Holding S.A. 3.91% (Banks) | | | 401,095 | | | | 3,787,472 | |
Petroleo Brasileiro S.A. 3.49% (Oil, Gas & Consumable Fuels) | | | 842,300 | | | | 6,012,434 | |
Telefonica Brasil S.A. 10.37% (Diversified Telecommunication Services) | | | 48,000 | | | | 623,883 | |
| | | | | | | | |
| | | | | | | 14,296,843 | |
| | | | | | | | |
Colombia 0.0%‡ | |
Grupo Aval Acciones y Valores S.A. 4.00% (Banks) | | | 249,046 | | | | 99,587 | |
| | | | | | | | |
|
Republic of Korea 1.0% | |
Hyundai Motor Co. 3.50% (Automobiles) | | | 9,261 | | | | 692,179 | |
Hyundai Motor Co. 3.80% (Automobiles) | | | 12,004 | | | | 822,341 | |
LG Household & Health Care, Ltd. 1.19% (Personal Products) | | | 411 | | | | 286,898 | |
Samsung Electronics Co., Ltd. 2.76% (Technology Hardware, Storage & Peripherals) | | | 38,000 | | | | 1,258,823 | |
Samsung Electronics Co., Ltd. 2.77% (Technology Hardware, Storage & Peripherals) | | | 47,527 | | | | 1,574,423 | |
| | | | | | | | |
| | | | | | | 4,634,664 | |
| | | | | | | | |
Total Preferred Stocks
(Cost $17,124,790) | | | | | | | 19,031,094 | |
| | | | | | | | |
|
| Short-Term Investments 1.1% | |
Affiliated Investment Company 0.4% | |
MainStay U.S. Government Liquidity Fund, 2.03% (g) | | | 1,818,442 | | | | 1,818,442 | |
| | | | | | | | |
|
Unaffiliated Investment Company 0.7% | |
State Street Navigator Securities Lending Government Money Market Portfolio, 2.33% (g)(h) | | | 3,388,200 | | | | 3,388,200 | |
| | | | | | | | |
TotalShort-Term Investments
(Cost $5,206,642) | | | | | | | 5,206,642 | |
| | | | | | | | |
Total Investments
(Cost $436,121,257) | | | 100.0 | % | | | 469,691,070 | |
Other Assets, Less Liabilities | | | (0.0 | )‡ | | | (231,764 | ) |
Net Assets | | | 100.0 | % | | $ | 469,459,306 | |
| † | Percentages indicated are based on Portfolio net assets. |
| ‡ | Less than one-tenth of a percent. |
| | | | | | |
The notes to the financial statements are an integral part of,
and should be read in conjunction with, the financial statements. | | | | | 17 | |
Portfolio of InvestmentsJune 30, 2019 (Unaudited) (continued)
| (a) | Non-income producing security. |
| (b) | All or a portion of this security was held on loan. As of June 30, 2019, the aggregate market value of securities on loan was $6,126,426; the total market value of collateral held by the Portfolio was $6,578,123. The market value of the collateral held included non-cash collateral in the form of U.S. Treasury securities with a value of $3,189,923 (See Note 2(M)). |
| (c) | May be sold to institutional investors only under Rule 144A or securities offered pursuant to Section 4(a)(2) of the Securities Act of 1933, as amended. |
| (d) | Security in which significant unobservable inputs (Level 3) were used in determining fair value. |
| (e) | Fair valued security—Represents fair value as measured in good faith under procedures approved by the Board of Trustees. As of June 30, 2019, the total market value of fair valued securities was $51,852, which represented less than one-tenth of a percent of the Portfolio’s net assets. |
| (f) | Illiquid security—As of June 30, 2019, the total market value of these securities deemed illiquid under procedures approved by the Board of Trustees was $51,852, which represented less than one-tenth of a percent of the Portfolio’s net assets. |
| (g) | Current yield as of June 30, 2019. |
| (h) | Represents security purchased with cash collateral received for securities on loan. |
The following abbreviations are used in the preceding pages:
ADR—American Depositary Receipt
ETF—Exchange-Traded Fund
GDR—Global Depositary Receipt
NVDR—Non-Voting Depositary Receipt
PCL—Provision for Credit Losses
The following is a summary of the fair valuations according to the inputs used as of June 30, 2019, for valuing the Portfolio’s assets and liabilities:
| | | | | | | | | | | | | | | | |
Description | | Quoted
Prices in
Active
Markets for
Identical
Assets
(Level 1) | | | Significant
Other
Observable
Inputs
(Level 2) | | | Significant
Unobservable
Inputs
(Level 3) | | | Total | |
| | | | |
Asset Valuation Inputs | | | | | | | | | | | | | | | | |
| Investments in Securities (a) | | | | | | | | | | | | | | | | |
| Common Stocks (b) | | $ | 443,801,915 | | | $ | 51,852 | | | $ | 0 | | | $ | 443,853,767 | |
| Exchange-Traded Funds | | | 1,599,567 | | | | — | | | | — | | | | 1,599,567 | |
| Preferred Stocks | | | 19,031,094 | | | | — | | | | — | | | | 19,031,094 | |
| Short-Term Investments | | | | | | | | | | | | | | | | |
Affiliated Investment Company | | | 1,818,442 | | | | — | | | | — | | | | 1,818,442 | |
Unaffiliated Investment Company | | | 3,388,200 | | | | — | | | | — | | | | 3,388,200 | |
| | | | | | | | | | | | | | | | |
| TotalShort-Term Investments | | | 5,206,642 | | | | — | | | | — | | | | 5,206,642 | |
| | | | | | | | | | | | | | | | |
| Total Investments in Securities | | $ | 469,639,218 | | | $ | 51,852 | | | $ | 0 | | | $ | 469,691,070 | |
| | | | | | | | | | | | | | | | |
| (a) | For a complete listing of investments and their industries, see the Portfolio of Investments. |
| (b) | The Level 3 securities valued at $0 and $0 are held in China and Hong Kong, respectively, within the Common Stocks section of the Portfolio of Investments. |
| | | | |
| 18 | | MainStay VP Emerging Markets Equity Portfolio | | The notes to the financial statements are an integral part of,
and should be read in conjunction with, the financial statements. |
The table below sets forth the diversification of the Portfolio’s investments by industry.
Industry Diversification (Unaudited)
| | | | | | | | |
| | | Value | | | Percent † | |
Air Freight & Logistics | | $ | 498,903 | | | | 0.1 | % |
Airlines | | | 96,363 | | | | 0.0 | ‡ |
Auto Components | | | 1,699,805 | | | | 0.4 | |
Automobiles | | | 5,450,424 | | | | 1.2 | |
Banks | | | 76,277,218 | | | | 16.2 | |
Beverages | | | 2,472,400 | | | | 0.5 | |
Biotechnology | | | 440,669 | | | | 0.1 | |
Capital Markets | | | 9,942,951 | | | | 2.1 | |
Chemicals | | | 4,719,358 | | | | 1.0 | |
Commercial Services & Supplies | | | 2,252,881 | | | | 0.5 | |
Communications Equipment | | | 3,027,456 | | | | 0.6 | |
Construction & Engineering | | | 6,050,478 | | | | 1.3 | |
Construction Materials | | | 9,057,624 | | | | 1.9 | |
Consumer Finance | | | 7,725,665 | | | | 1.6 | |
Diversified Consumer Services | | | 2,171,700 | | | | 0.5 | |
Diversified Financial Services | | | 4,714,959 | | | | 1.0 | |
Diversified Telecommunication Services | | | 3,383,154 | | | | 0.7 | |
Electric Utilities | | | 4,813,249 | | | | 1.0 | |
Electrical Equipment | | | 691,762 | | | | 0.1 | |
Electronic Equipment, Instruments & Components | | | 6,074,334 | | | | 1.3 | |
Energy Equipment & Services | | | 1,419,964 | | | | 0.3 | |
Entertainment | | | 6,539,102 | | | | 1.4 | |
Equity Real Estate Investment Trusts | | | 1,048,179 | | | | 0.2 | |
Food & Staples Retailing | | | 8,670,340 | | | | 1.8 | |
Food Products | | | 8,317,681 | | | | 1.8 | |
Gas Utilities | | | 2,809,019 | | | | 0.6 | |
Health Care Equipment & Supplies | | | 2,077,078 | | | | 0.4 | |
Health Care Providers & Services | | | 6,098,600 | | | | 1.3 | |
Hotels, Restaurants & Leisure | | | 1,445,214 | | | | 0.3 | |
Household Durables | | | 2,684,901 | | | | 0.6 | |
Household Products | | | 686,975 | | | | 0.1 | |
Independent Power & Renewable Electricity Producers | | | 2,726,828 | | | | 0.6 | |
Industrial Conglomerates | | | 4,972,180 | | | | 1.1 | |
Insurance | | | 16,824,772 | | | | 3.6 | |
Interactive Media & Services | | | 30,099,799 | | | | 6.4 | |
| | | | | | | | |
| | | Value | | | Percent † | |
Internet & Direct Marketing Retail | | $ | 37,418,745 | | | | 8.0 | % |
IT Services | | | 10,576,910 | | | | 2.3 | |
Leisure Products | | | 1,721,213 | | | | 0.4 | |
Life Sciences Tools & Services | | | 1,185,913 | | | | 0.3 | |
Machinery | | | 5,128,955 | | | | 1.1 | |
Marine | | | 376,493 | | | | 0.1 | |
Media | | | 103,937 | | | | 0.0 | ‡ |
Metals & Mining | | | 13,472,630 | | | | 2.9 | |
Multiline Retail | | | 1,778,534 | | | | 0.4 | |
Oil, Gas & Consumable Fuels | | | 35,297,813 | | | | 7.5 | |
Paper & Forest Products | | | 259,534 | | | | 0.1 | |
Personal Products | | | 2,452,329 | | | | 0.5 | |
Pharmaceuticals | | | 4,884,922 | | | | 1.0 | |
Professional Services | | | 187,593 | | | | 0.0 | ‡ |
Real Estate | | | 147,978 | | | | 0.0 | ‡ |
Real Estate Management & Development | | | 13,542,935 | | | | 2.9 | |
Road & Rail | | | 3,917,999 | | | | 0.8 | |
Semiconductors & Semiconductor Equipment | | | 26,717,014 | | | | 5.7 | |
Software | | | 856,272 | | | | 0.2 | |
Specialty Retail | | | 1,242,461 | | | | 0.3 | |
Technology Hardware, Storage & Peripherals | | | 20,161,155 | | | | 4.3 | |
Textiles, Apparel & Luxury Goods | | | 8,655,004 | | | | 1.8 | |
Thrifts & Mortgage Finance | | | 5,671,776 | | | | 1.2 | |
Tobacco | | | 1,758,334 | | | | 0.4 | |
Transportation Infrastructure | | | 4,492,752 | | | | 1.0 | |
Water Utilities | | | 1,722,544 | | | | 0.4 | |
Wireless Telecommunication Services | | | 12,770,698 | | | | 2.7 | |
| | | | | | | | |
| | | 464,484,428 | | | | 98.9 | |
Short-Term Investment | | | 5,206,642 | | | | 1.1 | |
Other Assets, Less Liabilities | | | (231,764 | ) | | | (0.0 | )‡ |
| | | | | | | | |
Net Assets | | $ | 469,459,306 | | | | 100.0 | % |
| | | | | | | | |
| † | Percentages indicated are based on Portfolio net assets. |
| ‡ | Less than one-tenth of a percent. |
The following is a reconciliation of investments in which significant unobservable inputs (Level 3) were used in determining value:
| | | | | | | | | | | | | | | | | | | | | | | | | | | | | | | | | | | | | | | | |
Investments in Securities | | Balance
as of
December 31,
2018 | | | Accrued
Discounts
(Premiums) | | | Realized
Gain
(Loss) | | | Change in
Unrealized
Appreciation
(Depreciation) | | | Purchases | | | Sales | | | Transfers
in to
Level 3 | | | Transfers
out of
Level 3 | | | Balance
as of
June 30,
2019 | | | Change in
Unrealized
Appreciation
(Depreciation)
from
Investments
Still Held as of
June 30,
2019 (a) | |
| Common Stocks | | | | | | | | | | | | | | | | | | | | | | | | | | | | | | | | | | | | | | | | |
China | | $ | 0 | | | $ | — | | | $ | — | | | $ | — | | | $ | — | | | $ | — | | | $ | — | | | $ | — | | | $ | 0 | | | $ | — | |
Hong Kong | | | 0 | | | | — | | | | — | | | | — | | | | — | | | | — | | | | — | | | | — | | | | 0 | | | | — | |
| | | | | | | | | | | | | | | | | | | | | | | | | | | | | | | | | | | | | | | | |
| Total | | $ | 0 | | | $ | — | | | $ | — | | | $ | — | | | $ | — | | | $ | — | | | $ | — | | | $ | — | | | $ | 0 | | | $ | — | |
| | | | | | | | | | | | | | | | | | | | | | | | | | | | | | | | | | | | | | | | |
| (a) | Included in “Net change in unrealized appreciation (depreciation) on investments” in the Statement of Operations. |
| | | | | | |
The notes to the financial statements are an integral part of,
and should be read in conjunction with, the financial statements. | | | | | 19 | |
Statement of Assets and Liabilitiesas of June 30, 2019 (Unaudited)
| | | | |
| Assets | | | | |
Investment in unaffiliated securities, at value
(identified cost $434,302,815) including securities on loan of $6,126,426 | | $ | 467,872,628 | |
Investment in affiliated investment company, at value
(identified cost $1,818,442) | | | 1,818,442 | |
Cash denominated in foreign currencies
(identified cost $1,631,855) | | | 1,636,892 | |
Receivables: | | | | |
Investment securities sold | | | 3,964,879 | |
Dividends | | | 2,035,965 | |
Portfolio shares sold | | | 9,730 | |
Securities lending | | | 9,264 | |
Other assets | | | 2,561 | |
| | | | |
Total assets | | | 477,350,361 | |
| | | | |
| |
| Liabilities | | | | |
Due to custodian | | | 1,923,515 | |
Cash collateral received for securities on loan | | | 3,388,200 | |
Payables: | | | | |
Investment securities purchased | | | 938,773 | |
Portfolio shares redeemed | | | 560,542 | |
Manager (See Note 3) | | | 396,540 | |
Foreign capital gains tax (See Note 2(C)) | | | 296,472 | |
Custodian | | | 276,532 | |
Professional fees | | | 40,096 | |
Shareholder communication | | | 33,955 | |
NYLIFE Distributors (See Note 3) | | | 26,512 | |
Trustees | | | 537 | |
Accrued expenses | | | 9,381 | |
| | | | |
Total liabilities | | | 7,891,055 | |
| | | | |
Net assets | | $ | 469,459,306 | |
| | | | |
| |
| Composition of Net Assets | | | | |
Shares of beneficial interest outstanding (par value of $.001 per share) unlimited number of shares authorized | | $ | 52,396 | |
Additional paid-in capital | | | 484,983,718 | |
| | | | |
| | | 485,036,114 | |
Total distributable earnings (loss) | | | (15,576,808 | ) |
| | | | |
Net assets | | $ | 469,459,306 | |
| | | | |
| | | | |
Initial Class | | | | |
Net assets applicable to outstanding shares | | $ | 337,351,646 | |
| | | | |
Shares of beneficial interest outstanding | | | 37,624,727 | |
| | | | |
Net asset value per share outstanding | | $ | 8.97 | |
| | | | |
Service Class | | | | |
Net assets applicable to outstanding shares | | $ | 132,107,660 | |
| | | | |
Shares of beneficial interest outstanding | | | 14,770,855 | |
| | | | |
Net asset value per share outstanding | | $ | 8.94 | |
| | | | |
| | | | |
| 20 | | MainStay VP Emerging Markets Equity Portfolio | | The notes to the financial statements are an integral part of,
and should be read in conjunction with, the financial statements. |
Statement of Operationsfor the six months ended June 30, 2019 (Unaudited)
| | | | |
| Investment Income (Loss) | | | | |
Income | | | | |
Dividends-unaffiliated (a) | | $ | 6,736,989 | |
Securities lending | | | 53,890 | |
Dividends-affiliated | | | 12,674 | |
Interest | | | 5,064 | |
Other | | | 4,009 | |
| | | | |
Total income | | | 6,812,626 | |
| | | | |
Expenses | | | | |
Manager (See Note 3) | | | 2,572,148 | |
Custodian | | | 268,005 | |
Distribution/Service—Service Class (See Note 3) | | | 167,351 | |
Professional fees | | | 62,412 | |
Shareholder communication | | | 32,255 | |
Trustees | | | 6,482 | |
Interest expense | | | 159 | |
Miscellaneous | | | 16,304 | |
| | | | |
Total expenses | | | 3,125,116 | |
| | | | |
Net investment income (loss) | | | 3,687,510 | |
| | | | |
|
| Realized and Unrealized Gain (Loss) on Investments and Foreign Currency Transactions | |
Net realized gain (loss) on: | | | | |
Unaffiliated investment transactions (b) | | | (1,533,928 | ) |
Foreign currency forward transactions | | | 32,032 | |
Foreign currency transactions | | | (455,112 | ) |
| | | | |
Net realized gain (loss) on investments and foreign currency transactions | | | (1,957,008 | ) |
| | | | |
Net change in unrealized appreciation (depreciation) on: | | | | |
Unaffiliated investments (c) | | | 56,259,259 | |
Translation of other assets and liabilities in foreign currencies | | | (10,187 | ) |
| | | | |
Net change in unrealized appreciation (depreciation) on investments and foreign currency transactions | | | 56,249,072 | |
| | | | |
Net realized and unrealized gain (loss) on investments and foreign currency transactions | | | 54,292,064 | |
| | | | |
Net increase (decrease) in net assets resulting from operations | | $ | 57,979,574 | |
| | | | |
| (a) | Dividends recorded net of foreign withholding taxes in the amount of $888,288. |
| (b) | Realized gain (loss) on security transactions recorded net of foreign capital gains tax in the amount of $19,494. |
| (c) | Net change in unrealized appreciation (depreciation) on investments recorded net of foreign capital gains tax in the amount of $(227,718). |
| | | | | | |
The notes to the financial statements are an integral part of,
and should be read in conjunction with, the financial statements. | | | | | 21 | |
Statements of Changes in Net Assets
for the six months ended June 30, 2019 (Unaudited) and the year ended December 31, 2018
| | | | | | | | |
| | | 2019 | | | 2018 | |
| Increase (Decrease) in Net Assets | | | | | |
Operations: | | | | | | | | |
Net investment income (loss) | | $ | 3,687,510 | | | $ | 7,359,299 | |
Net realized gain (loss) on investments and foreign currency transactions | | | (1,957,008 | ) | | | 7,779,638 | |
Net change in unrealized appreciation (depreciation) on investments and foreign currency transactions | | | 56,249,072 | | | | (142,424,318 | ) |
| | | | |
Net increase (decrease) in net assets resulting from operations | | | 57,979,574 | | | | (127,285,381 | ) |
| | | | |
Distributions to shareholders: | | | | | | | | |
Initial Class | | | — | | | | (6,159,288 | ) |
Service Class | | | — | | | | (1,891,460 | ) |
| | | | |
Total distributions to shareholders | | | — | | | | (8,050,748 | ) |
| | | | |
Capital share transactions: | | | | | | | | |
Net proceeds from sale of shares | | | 4,447,136 | | | | 90,103,733 | |
Net asset value of shares issued to shareholders in reinvestment of dividends and distributions | | | — | | | | 8,050,748 | |
Cost of shares redeemed | | | (96,299,640 | ) | | | (165,937,159 | ) |
| | | | |
Increase (decrease) in net assets derived from capital share transactions | | | (91,852,504 | ) | | | (67,782,678 | ) |
| | | | |
Net increase (decrease) in net assets | | | (33,872,930 | ) | | | (203,118,807 | ) |
| | |
| Net Assets | | | | | | | | |
Beginning of period | | | 503,332,236 | | | | 706,451,043 | |
| | | | |
End of period | | $ | 469,459,306 | | | $ | 503,332,236 | |
| | | | |
| | | | |
| 22 | | MainStay VP Emerging Markets Equity Portfolio | | The notes to the financial statements are an integral part of,
and should be read in conjunction with, the financial statements. |
Financial Highlightsselected per share data and ratios
| | | | | | | | | | | | | | | | | | | | | | | | | | | | |
| | | |
| | | Six months
ended
June 30, | | | | | | Year ended December 31, | |
| | | | | | | |
| Initial Class | | 2019* | | | | | | 2018 | | | 2017 | | | 2016 | | | 2015 | | | 2014 | |
| | | | | | | |
Net asset value at beginning of period | | $ | 7.99 | | | | | | | $ | 10.22 | | | $ | 7.22 | | | $ | 6.83 | | | $ | 8.27 | | | $ | 9.50 | |
| | | | | | | | | | | | | | | | | | | | | | | | | | | | |
| | | | | | | |
Net investment income (loss) (a) | | | 0.06 | | | | | | | | 0.12 | | | | 0.09 | | | | 0.06 | | | | 0.06 | | | | 0.14 | (b) |
| | | | | | | |
Net realized and unrealized gain (loss) on investments | | | 0.93 | | | | | | | | (2.19 | ) | | | 3.03 | | | | 0.37 | | | | (1.38 | ) | | | (1.26 | ) |
| | | | | | | |
Net realized and unrealized gain (loss) on foreign currency transactions | | | (0.01 | ) | | | | | | | (0.02 | ) | | | (0.01 | ) | | | (0.01 | ) | | | (0.02 | ) | | | (0.01 | ) |
| | | | | | | | | | | | | | | | | | | | | | | | | | | | |
| | | | | | | |
Total from investment operations | | | 0.98 | | | | | | | | (2.09 | ) | | | 3.11 | | | | 0.42 | | | | (1.34 | ) | | | (1.13 | ) |
| | | | | | | | | | | | | | | | | | | | | | | | | | | | |
| | | | | | | |
| Less dividends: | | | | | | | | | | | | | | | | | | | | | | | | | | | | |
| | | | | | | |
From net investment income | | | — | | | | | | | | (0.14 | ) | | | (0.11 | ) | | | (0.03 | ) | | | (0.10 | ) | | | (0.10 | ) |
| | | | | | | | | | | | | | | | | | | | | | | | | | | | |
| | | | | | | |
Net asset value at end of period | | $ | 8.97 | | | | | | | $ | 7.99 | | | $ | 10.22 | | | $ | 7.22 | | | $ | 6.83 | | | $ | 8.27 | |
| | | | | | | | | | | | | | | | | | | | | | | | | | | | |
| | | | | | | |
Total investment return (c) | | | 12.27 | %(d) | | | | | | | (20.55 | %) | | | 43.12 | % | | | 6.23 | % | | | (16.20 | %) | | | (11.97 | %) |
| | | | | | | |
| Ratios (to average net assets)/Supplemental Data: | | | | | | | | | | | | | | | | | | | | | | | | | | | | |
| | | | | | | |
Net investment income (loss) | | | 1.49 | %†† | | | | | | | 1.27 | % | | | 0.94 | % | | | 0.91 | %(e) | | | 0.77 | % | | | 1.52 | % (b) |
| | | | | | | |
Net expenses (f)(g) | | | 1.15 | %†† | | | | | | | 1.16 | % | | | 1.24 | % | | | 1.29 | % | | | 1.40 | % | | | 1.37 | % |
| | | | | | | |
Portfolio turnover rate | | | 54 | % | | | | | | | 135 | % | | | 149 | % | | | 123 | % | | | 207 | % | | | 65 | % |
| | | | | | | |
Net assets at end of period (in 000’s) | | $ | 337,352 | | | | | | | $ | 371,834 | | | $ | 497,861 | | | $ | 257,593 | | | $ | 204,138 | | | $ | 165,049 | |
| (a) | Per share data based on average shares outstanding during the period. |
| (b) | Included in net investment income per share and the ratio of net investment income to average net assets are $0.03 per share and 0.32%, respectively, resulting from a special one-time dividend from BR Properties S.A. that paid 5.50 Brazilian Real per share. |
| (c) | Total return does not reflect any deduction of sales charges, mortality and expense charges, contract charges or administrative charges. For periods of less than one year, total return is not annualized. |
| (d) | Total investment return may reflect adjustments to conform to generally accepted accounting principles. |
| (e) | Without the custody fee reimbursement, net investment income (loss) would have been 0.83%. |
| (f) | In addition to the fees and expenses which the Portfolio bears directly, it also indirectly bears a pro-rata share of the fees and expenses of the underlying funds in which it invests. Such indirect expenses are not included in the above expense ratios. |
| (g) | The expense ratios presented below exclude short sales expense: |
| | | | | | | | | | |
Period Ended | | Net Expenses
(excluding short
sale expenses) | | Short Sale
Expenses |
| June 30, 2019 | | | | 1.15 | %†† | | | | — | |
| December 31, 2018 | | | | 1.16 | % | | | | — | |
| December 31, 2017 | | | | 1.24 | % | | | | 0.00 | %(h) |
| December 31, 2016 | | | | 1.29 | %(i) | | | | 0.00 | %(h) |
| December 31, 2015 | | | | 1.40 | % | | | | 0.00 | %(h) |
| December 31, 2014 | | | | 1.37 | % | | | | — | |
| (i) | Without the custody fee reimbursement, net expenses would have been 1.37%. |
| | | | | | |
The notes to the financial statements are an integral part of,
and should be read in conjunction with, the financial statements. | | | | | 23 | |
Financial Highlightsselected per share data and ratios
| | | | | | | | | | | | | | | | | | | | | | | | | | | | |
| | | |
| | | Six months
ended
June 30, | | | | | | Year ended December 31, | |
| | | | | | | |
| Service Class | | 2019* | | | | | | 2018 | | | 2017 | | | 2016 | | | 2015 | | | 2014 | |
| | | | | | | |
Net asset value at beginning of period | | $ | 7.98 | | | | | | | $ | 10.20 | | | $ | 7.21 | | | $ | 6.82 | | | $ | 8.25 | | | $ | 9.47 | |
| | | | | | | | | | | | | | | | | | | | | | | | | | | | |
| | | | | | | |
Net investment income (loss) (a) | | | 0.05 | | | | | | | | 0.10 | | | | 0.07 | | | | 0.05 | | | | 0.04 | | | | 0.12 | (b) |
| | | | | | | |
Net realized and unrealized gain (loss) on investments | | | 0.92 | | | | | | | | (2.19 | ) | | | 3.02 | | | | 0.36 | | | | (1.37 | ) | | | (1.25 | ) |
| | | | | | | |
Net realized and unrealized gain (loss) on foreign currency transactions | | | (0.01 | ) | | | | | | | (0.02 | ) | | | (0.01 | ) | | | (0.01 | ) | | | (0.02 | ) | | | (0.01 | ) |
| | | | | | | | | | | | | | | | | | | | | | | | | | | | |
| | | | | | | |
Total from investment operations | | | 0.96 | | | | | | | | (2.11 | ) | | | 3.08 | | | | 0.40 | | | | (1.35 | ) | | | (1.14 | ) |
| | | | | | | | | | | | | | | | | | | | | | | | | | | | |
| | | | | | | |
| Less dividends: | | | | | | | | | | | | | | | | | | | | | | | | | | | | |
| | | | | | | |
From net investment income | | | — | | | | | | | | (0.11 | ) | | | (0.09 | ) | | | (0.01 | ) | | | (0.08 | ) | | | (0.08 | ) |
| | | | | | | | | | | | | | | | | | | | | | | | | | | | |
| | | | | | | |
Net asset value at end of period | | $ | 8.94 | | | | | | | $ | 7.98 | | | $ | 10.20 | | | $ | 7.21 | | | $ | 6.82 | | | $ | 8.25 | |
| | | | | | | | | | | | | | | | | | | | | | | | | | | | |
| | | | | | | |
Total investment return (c) | | | 12.03 | % | | | | | | | (20.74 | %) | | | 42.77 | % | | | 5.96 | % | | | (16.42 | %) | | | (12.19 | %) |
| | | | | | | |
| Ratios (to average net assets)/Supplemental Data: | | | | | | | | | | | | | | | | | | | | | | | | | | | | |
| | | | | | | |
Net investment income (loss) | | | 1.26 | %†† | | | | | | | 1.07 | % | | | 0.73 | % | | | 0.69 | %(d) | | | 0.52 | % | | | 1.29 | % (b) |
| | | | | | | |
Net expenses (e) (f) | | | 1.40 | %†† | | | | | | | 1.41 | % | | | 1.49 | % | | | 1.55 | % | | | 1.65 | % | | | 1.62 | % |
| | | | | | | |
Portfolio turnover rate | | | 54 | % | | | | | | | 135 | % | | | 149 | % | | | 123 | % | | | 207 | % | | | 65 | % |
| | | | | | | |
Net assets at end of period (in 000’s) | | $ | 132,108 | | | | | | | $ | 131,498 | | | $ | 208,590 | | | $ | 155,777 | | | $ | 163,884 | | | $ | 205,319 | |
| (a) | Per share data based on average shares outstanding during the period. |
| (b) | Included in net investment income per share and the ratio of net investment income to average net assets are $0.03 per share and 0.32%, respectively, resulting from a special one-time dividend from BR Properties S.A. that paid 5.50 Brazilian Real per share. |
| (c) | Total return does not reflect any deduction of sales charges, mortality and expense charges, contract charges or administrative charges. For periods of less than one year, total return is not annualized. |
| (d) | Without the custody fee reimbursement, net investment income (loss) would have been 0.62%. |
| (e) | In addition to the fees and expenses which the Portfolio bears directly, it also indirectly bears a pro-rata share of the fees and expenses of the underlying funds in which it invests. Such indirect expenses are not included in the above expense ratios. |
| (f) | The expense ratios presented below exclude short sales expense: |
| | | | | | | | | | |
Period Ended | | Net Expenses
(excluding short
sale expenses) | | Short Sale
Expenses |
| June 30, 2019 | | | | 1.40 | %†† | | | | — | |
| December 31, 2018 | | | | 1.41 | % | | | | — | |
| December 31, 2017 | | | | 1.49 | % | | | | 0.00 | %(g) |
| December 31, 2016 | | | | 1.55 | %(h) | | | | 0.00 | %(g) |
| December 31, 2015 | | | | 1.65 | % | | | | 0.00 | %(g) |
| December 31, 2014 | | | | 1.62 | % | | | | — | |
| (h) | Without the custody fee reimbursement, net expenses would have been 1.62%. |
| | | | |
| 24 | | MainStay VP Emerging Markets Equity Portfolio | | The notes to the financial statements are an integral part of,
and should be read in conjunction with, the financial statements. |
Notes to Financial Statements(Unaudited)
Note 1–Organization and Business
MainStay VP Funds Trust (the “Fund”) was organized as a Delaware statutory trust on February 1, 2011. The Fund is registered under the Investment Company Act of 1940, as amended (the “1940 Act”), as an open-end management investment company. The Fund is comprised of thirty-one separate series (collectively referred to as the “Portfolios”). These financial statements and notes relate to the MainStay VP Emerging Markets Equity Portfolio (the “Portfolio”), a “diversified” portfolio, as that term is defined in the 1940 Act, as interpreted or modified by regulatory authorities having jurisdiction, from time to time.
Shares of the Portfolio are currently offered to certain separate accounts to fund variable annuity policies and variable universal life insurance policies issued by New York Life Insurance and Annuity Corporation (“NYLIAC”), awholly-owned subsidiary of New York Life Insurance Company (“New York Life”) and may also be offered to fund variable annuity policies and variable universal life insurance policies issued by other insurance companies. NYLIAC allocates shares of the Portfolios, to among others, certain NYLIAC separate accounts. Shares of the Portfolio are also offered to the MainStay VP Conservative Allocation Portfolio, MainStay VP Moderate Allocation Portfolio, MainStay VP Moderate Growth Allocation Portfolio and MainStay VP Growth Allocation Portfolio, which operate as “funds-of-funds.”
The Portfolio currently offers two classes of shares. Initial Class and Service Class shares commenced operations on February 17, 2012. Shares of the Portfolio are offered and are redeemed at a price equal to their respective net asset value (“NAV”) per share. No sales or redemption charge is applicable to the purchase or redemption of the Portfolio’s shares. Under the terms of the Fund’s multiple class plan adopted pursuant to Rule 18f-3 under the 1940 Act, the classes differ in that, among other things, Service Class shares of the Portfolio pay a combined distribution and service fee of 0.25% of average daily net assets attributable to Service Class shares of the Portfolio to the Distributor (as defined in Note 3(B)) pursuant to a plan adopted in accordance with Rule 12b-1 under the 1940 Act. Contract owners of variable annuity contracts purchased after June 2, 2003 are permitted to invest only in the Service Class shares.
The Portfolio’s investment objective is to seeklong-term capital appreciation.
Note 2–Significant Accounting Policies
The Portfolio is an investment company and accordingly follows the investment company accounting and reporting guidance of the Financial Accounting Standards Board (“FASB”) Accounting Standard CodificationTopic 946 Financial Services—Investment Companies. The Portfolio prepares its financial statements in accordance with generally accepted accounting principles (“GAAP”) in the United States of America and follows the significant accounting policies described below.
(A) Securities Valuation. Investments are usually valued as of the close of regular trading on the New York Stock Exchange (the “Exchange”) (usually 4:00 p.m. Eastern time) on each day the Portfolio is open for business (“valuation date”).
The Board of Trustees of the Fund (the “Board”) adopted procedures establishing methodologies for the valuation of the Portfolio’s securities
and other assets and delegated the responsibility for valuation determinations under those procedures to the Valuation Committee of the Fund (the “Valuation Committee”). The Board authorized the Valuation Committee to appoint a Valuation Subcommittee (the “Subcommittee”) to deal in the first instance with establishing the prices of securities for which market quotations are not readily available or the prices of which are not otherwise readily determinable under these procedures. The Subcommittee meets (in person, via electronic mail or via teleconference) on an as-needed basis. Subsequently, the Valuation Committee meets to ensure that actions taken by the Subcommittee were appropriate. The procedures state that, subject to the oversight of the Board and unless otherwise noted, the responsibility for theday-to-day valuation of portfolio assets (including fair value measurements for the Portfolio’s assets and liabilities) rests with New York Life Investment Management LLC (“New York Life Investments” or the “Manager”), aided to whatever extent necessary by the Subadvisors (as defined in Note 3(A)).
To assess the appropriateness of security valuations, the Manager, the Subadvisors or the Portfolio’s third-party service provider, who is subject to oversight by the Manager, regularly compares prior day prices, prices on comparable securities and the sale prices to the prior and current day prices and challenges prices with changes exceeding certain tolerance levels with third-party pricing services or broker sources. For those securities valued through either a standardized fair valuation methodology or a fair valuation measurement, the Subcommittee deals in the first instance with such valuation and the Valuation Committee reviews and affirms, if appropriate, the reasonableness of the valuation based on such methodologies and measurements on a regular basis after considering information that is reasonably available and deemed relevant by the Valuation Committee. Any action taken by the Subcommittee with respect to the valuation of a portfolio security or other asset is submitted for review and ratification (if appropriate) to the Valuation Committee and the Board at the next regularly scheduled meeting.
“Fair value” is defined as the price the Portfolio would reasonably expect to receive upon selling an asset or liability in an orderly transaction to an independent buyer in the principal or most advantageous market for the asset or liability. Fair value measurements are determined within a framework that establishes a three-tier hierarchy which maximizes the use of observable market data and minimizes the use of unobservable inputs to establish a classification of fair value measurements for disclosure purposes. “Inputs” refer broadly to the assumptions that market participants would use in pricing the asset or liability, including assumptions about risk, such as the risk inherent in a particular valuation technique used to measure fair value using a pricing model and/or the risk inherent in the inputs for the valuation technique. Inputs may be observable or unobservable. Observable inputs reflect the assumptions market participants would use in pricing the asset or liability based on market data obtained from sources independent of the Portfolio. Unobservable inputs reflect the Portfolio’s own assumptions about the assumptions market participants would use in pricing the asset or liability based on the information available. The inputs or methodology used for valuing assets or liabilities may not be an indication of the risks
Notes to Financial Statements(Unaudited) (continued)
associated with investing in those assets or liabilities. The three-tier hierarchy of inputs is summarized below.
| • | | Level 1—quoted prices in active markets for an identical asset or liability |
| • | | Level 2—other significant observable inputs (including quoted prices for a similar asset or liability in active markets, interest rates and yield curves, prepayment speeds, credit risk, etc.) |
| • | | Level 3—significant unobservable inputs (including the Portfolio’s own assumptions about the assumptions that market participants would use in measuring fair value of an asset or liability) |
The level of an asset or liability within the fair value hierarchy is based on the lowest level of an input, both individually and in the aggregate, that is significant to the fair value measurement. As of June 30, 2019, the aggregate value by input level of the Portfolio’s assets and liabilities is included at the end of the Portfolio’s Portfolio of Investments.
The Portfolio may use third-party vendor evaluations, whose prices may be derived from one or more of the following standard inputs, among others:
| | |
• Broker/dealer quotes | | • Benchmark securities |
• Two-sided markets | | • Reference data (corporate actions or material event notices) |
• Bids/offers | | • Monthly payment information |
• Industry and economic events | | • Reported trades |
An asset or liability for which market values cannot be measured using the methodologies described above is valued by methods deemed reasonable in good faith by the Valuation Committee, following the procedures established by the Board, to represent fair value. Under these procedures, the Portfolio generally uses a market-based approach which may use related or comparable assets or liabilities, recent transactions, market multiples, book values and other relevant information. The Portfolio may also use an income-based valuation approach in which the anticipated future cash flows of the asset or liability are discounted to calculate fair value. Discounts may also be applied due to the nature and/or duration of any restrictions on the disposition of the asset or liability. Fair value represents a good faith approximation of the value of a security. Fair value determinations involve the consideration of a number of subjective factors, an analysis of applicable facts and circumstances and the exercise of judgment. As a result, it is possible that the fair value for a security determined in good faith in accordance with the Portfolio’s valuation procedures may differ from valuations for the same security determined by other funds using their own valuation procedures. Although the Portfolio’s valuation procedures are designed to value a security at the price the Portfolio may reasonably expect to receive upon the security’s sale in an orderly transaction, there can be no assurance that any fair value determination thereunder would, in fact, approximate the amount that the Portfolio would actually realize upon the sale of the security or the price at which the security would trade if a reliable market price were readily available. During the six-month period ended June 30, 2019, there were no material changes to the fair value methodologies.
Securities which may be valued in this manner include, but are not limited to: (i) a security for which trading has been halted or suspended;
(ii) a debt security that has recently gone into default and for which there is not a current market quotation; (iii) a security of an issuer that has entered into a restructuring; (iv) a security that has been delisted from a national exchange; (v) a security for which the market price is not readily available from a third-party pricing source or, if so provided, does not, in the opinion of the Manager or the Subadvisors, reflect the security’s market value; (vi) a security subject to trading collars for which no or limited trading takes place; and (vii) a security whose principal market has been temporarily closed at a time when, under normal conditions, it would be open. Securities valued in this manner are generally categorized as Level 3 in the hierarchy. As of June 30, 2019, securities that were fair valued in such a manner are shown in the Portfolio of Investments.
Certain securities held by the Portfolio may principally trade in foreign markets. Events may occur between the time the foreign markets close and the time at which the Portfolio’s NAVs are calculated. These events may include, but are not limited to, situations relating to a single issuer in a market sector, significant fluctuations in U.S. or foreign markets, natural disasters, armed conflicts, governmental actions or other developments not tied directly to the securities markets. Should the Manager or the Subadvisors conclude that such events may have affected the accuracy of the last price of such securities reported on the local foreign market, the Subcommittee may, pursuant to procedures adopted by the Board, adjust the value of the local price to reflect the estimated impact on the price of such securities as a result of such events. In this instance, securities are generally categorized as Level 3 in the hierarchy. Additionally, certain foreign equity securities are also fair valued whenever the movement of a particular index exceeds certain thresholds. In such cases, the securities are fair valued by applying factors provided by a third-party vendor in accordance with valuation procedures adopted by the Board and are generally categorized as Level 2 in the hierarchy. As of June 30, 2019, no foreign equity securities held by the Portfolio were fair valued in such a manner.
Equity securities, including exchange-traded funds (“ETFs”), are valued at the last quoted sales prices as of the close of regular trading on the relevant exchange on each valuation date. Securities that are not traded on the valuation date are valued at the mean of the last quoted bid and ask prices. Prices are normally taken from the principal market in which each security trades. These securities are generally categorized as Level 1 in the hierarchy.
Investments in mutual funds, including money market funds, are valued at their respective NAVs as of the close of the Exchange on the valuation date. These securities are generally categorized as Level 1 in the hierarchy.
Temporary cash investments acquired in excess of 60 days to maturity at the time of purchase are valued using the latest bid prices or using valuations based on a matrix system (which considers such factors as security prices, yields, maturities and ratings), both as furnished by independent pricing services. Other temporary cash investments which mature in 60 days or less at the time of purchase (“Short-Term Investments”) are valued using the amortized cost method of valuation, unless the use of such method would be inappropriate. The amortized cost method involves valuing a security at its cost on the date of purchase and thereafter assuming a constant amortization to maturity of the difference between such cost and the value on maturity date.
| | |
| 26 | | MainStay VP Emerging Markets Equity Portfolio |
Amortized cost approximates the current fair value of a security. Securities valued using the amortized cost method are not valued using quoted prices in an active market and are generally categorized as Level 2 in the hierarchy.
The information above is not intended to reflect an exhaustive list of the methodologies that may be used to value portfolio investments. The valuation procedures permit the use of a variety of valuation methodologies in connection with valuing portfolio investments. The methodology used for a specific type of investment may vary based on the market data available or other considerations. The methodologies summarized above may not represent the specific means by which portfolio investments are valued on any particular business day.
A portfolio security or other asset may be determined to be illiquid under procedures approved by the Board. Illiquidity of a security might prevent the sale of such security at a time when the Manager or the Subadvisors might wish to sell, and these securities could have the effect of decreasing the overall level of the Portfolio’s liquidity. Further, the lack of an established secondary market may make it more difficult to value illiquid securities, requiring the Portfolio to rely on judgments that may be somewhat subjective in measuring value, which could vary materially from the amount that the Portfolio could realize upon disposition. Difficulty in selling illiquid securities may result in a loss or may be costly to the Portfolio. Under the supervision of the Board, the Manager or the Subadvisors determine the liquidity of the Portfolio’s investments; in doing so, the Manager or the Subadvisors may consider various factors, including (i) the frequency of trades and quotations; (ii) the number of dealers and prospective purchasers; (iii) dealer undertakings to make a market; and (iv) the nature of the security and the market in which it trades (e.g., the time needed to dispose of the security, the method of soliciting offers and the mechanics of transfer). Illiquid securities are often valued in accordance with methods deemed by the Board in good faith to be reasonable and appropriate to accurately reflect their fair value. The liquidity of the Portfolio’s investments, as shown in the Portfolio of Investments, was determined as of June 30, 2019 and can change at any time in response to, among other relevant factors, market conditions or events or developments with respect to an individual issuer or instrument. As of June 30, 2019, securities deemed to be illiquid under procedures approved by the Board are shown in the Portfolio of Investments.
(B) Income Taxes. The Portfolio’s policy is to comply with the requirements of the Internal Revenue Code of 1986, as amended (the “Internal Revenue Code”), applicable to regulated investment companies and to distribute all of its taxable income to the shareholders of the Portfolio within the allowable time limits. Therefore, no federal, state and local income tax provisions are required.
Management evaluates the Portfolio’s tax positions to determine if the tax positions taken meet the minimum recognition threshold in connection with accounting for uncertainties in income tax positions taken or expected to be taken for the purposes of measuring and recognizing tax liabilities in the financial statements. Recognition of tax benefits of an uncertain tax position is permitted only to the extent the position is “more likely than not” to be sustained assuming examination by taxing authorities. Management has analyzed the Portfolio’s tax positions taken on federal, state and local income tax returns for all open tax years (for up to three tax years) and has concluded that no provisions for federal,
state and local income tax are required in the Portfolio’s financial statements. The Portfolio’s federal, state and local income tax and federal excise tax returns for tax years for which the applicable statutes of limitations have not expired are subject to examination by the Internal Revenue Service and state and local departments of revenue. The Portfolio’s federal, state and local income and federal excise tax returns for tax years for which the applicable statutes of limitations have not expired are subject to examination by the Internal Revenue Service and local departments of revenue.
(C) Foreign Taxes. The Portfolio may be subject to foreign taxes on income and other transaction-based taxes imposed by certain countries in which it invests. A portion of the taxes on gains on investments or currency purchases/repatriation may be reclaimable. The Portfolio will accrue such taxes and reclaims as applicable, based upon its current interpretation of tax rules and regulations that exist in the markets in which it invests.
The Portfolio may be subject to taxation on realized capital gains, repatriation proceeds and other transaction-based taxes imposed by certain countries in which it invests. The Portfolio will accrue such taxes as applicable based upon its current interpretation of tax rules and regulations that exist in the market in which it invests. Capital gains taxes relating to positions still held are reflected as a liability on the Statement of Assets and Liabilities, as well as an adjustment to the Portfolio’s net unrealized appreciation (depreciation). Taxes related to capital gains realized, if any, are reflected as part of net realized gain (loss) in the Statement of Operations. Changes in tax liabilities related to capital gains taxes on unrealized investment gains, if any, are reflected as part of the change in net unrealized appreciation (depreciation) on investments in the Statement of Operations. Transaction-based charges are generally assessed as a percentage of the transaction amount.
(D) Dividends and Distributions to Shareholders. Dividends and distributions are recorded on the ex-dividend date. The Portfolio intends to declare and pay dividends from net investment income and distributions from net realized capital and currency gains, if any, at least annually. Unless the shareholder elects otherwise, all dividends and distributions are reinvested in the same class of shares of the Portfolio, at NAV. Dividends and distributions to shareholders are determined in accordance with federal income tax regulations and may differ from determinations using GAAP.
(E) Security Transactions and Investment Income. The Portfolio records security transactions on the trade date. Realized gains and losses on security transactions are determined using the identified cost method. Dividend income is recognized on the ex-dividend date; net of any foreign tax withheld at the source, and interest income is accrued as earned using the effective interest rate method.
Investment income and realized and unrealized gains and losses on investments of the Portfolio are allocated pro rata to the separate classes of shares based upon their relative net assets on the date the income is earned or realized and unrealized gains and losses are incurred.
(F) Expenses. Expenses of the Fund are allocated to the individual Portfolios in proportion to the net assets of the respective Portfolios when the expenses are incurred, except where direct allocations of expenses can be made. Expenses (other than fees incurred under the
Notes to Financial Statements(Unaudited) (continued)
distribution and service plans, further discussed in Note 3(B), which are charged directly to the Service Class shares) are allocated to separate classes of shares pro rata based upon their relative net assets on the date the expenses are incurred. The expenses borne by the Portfolio, including those of related parties to the Portfolio, are shown in the Statement of Operations.
Additionally, the Portfolio may invest in ETFs and mutual funds, which are subject to management fees and other fees that may cause the costs of investing in ETFs and mutual funds to be greater than the costs of owning the underlying securities directly. These indirect expenses of ETFs and mutual funds are not included in the amounts shown as expenses in the Portfolio’s Statement of Operations or in the expense ratios included in the Financial Highlights.
(G) Use of Estimates. In preparing financial statements in conformity with GAAP, management makes estimates and assumptions that affect the reported amounts and disclosures in the financial statements. Actual results could differ from those estimates.
(H) Repurchase Agreements. The Portfolio may enter into repurchase agreements (i.e., buy a security from another party with the agreement that it be sold back in the future) to earn income. The Portfolio may enter into repurchase agreements only with counterparties, usually financial institutions, that are deemed by the Manager or the Subadvisors to be creditworthy, pursuant to guidelines established by the Board. During the term of any repurchase agreement, the Manager or the Subadvisors will continue to monitor the creditworthiness of the counterparty. Under the 1940 Act, repurchase agreements are considered to be collateralized loans by the Portfolio to the counterparty secured by the securities transferred to the Portfolio.
Repurchase agreements are subject to counterparty risk, meaning the Portfolio could lose money by the counterparty’s failure to perform under the terms of the agreement. The Portfolio mitigates this risk by ensuring the repurchase agreement is collateralized by cash, U.S. government securities, fixed income securities and/or other securities. The collateral is held by the Portfolio’s custodian and valued daily on a mark to market basis to determine if the value, including accrued interest, exceeds the repurchase price. In the event of the counterparty’s default on the obligation to repurchase, the Portfolio has the right to liquidate the collateral and apply the proceeds in satisfaction of the obligation. Under certain circumstances, such as in the event of default or bankruptcy by the counterparty, realization and/or retention of the collateral may be limited or subject to delay, to legal proceedings and possible realized loss to the Portfolio. As of June 30, 2019, the Portfolio did not hold any repurchase agreements.
(I) Futures Contracts. A futures contract is an agreement to purchase or sell a specified quantity of an underlying instrument at a specified future date and price, or to make or receive a cash payment based on the value of a financial instrument (e.g., foreign currency, interest rate, security, or securities index). The Portfolio is subject to risks such as market price risk and/or interest rate risk in the normal course of investing in these transactions. Upon entering into a futures contract, the Portfolio is required to pledge to the broker or futures commission merchant an amount of cash and/or U.S. government securities equal to a certain percentage of the collateral amount, known as the “initial margin.” During the period the futures contract is open, changes in the
value of the contract are recognized as unrealized appreciation or depreciation by marking to market such contract on a daily basis to reflect the market value of the contract at the end of each day’s trading. The Portfolio agrees to receive from or pay to the broker or futures commission merchant an amount of cash equal to the daily fluctuation in the value of the contract. Such receipts or payments are known as “variation margin.” When the futures contract is closed, the Portfolio records a realized gain or loss equal to the difference between the proceeds from (or cost of) the closing transaction and the Portfolio’s basis in the contract.
The use of futures contracts involves, to varying degrees, elements of market risk in excess of the amount recognized in the Statement of Assets and Liabilities. The contract or notional amounts and variation margin reflect the extent of the Portfolio’s involvement in open futures positions. There are several risks associated with the use of futures contracts as hedging techniques. There can be no assurance that a liquid market will exist at the time when the Portfolio seeks to close out a futures contract. If no liquid market exists, the Portfolio would remain obligated to meet margin requirements until the position is closed. Futures may involve a small initial investment relative to the risk assumed, which could result in losses greater than if they had not been used. Futures may be more volatile than direct investments in the instrument underlying the futures, and may not correlate to the underlying instrument, causing a given hedge not to achieve its objectives. The Portfolio’s activities in futures contracts have minimal counterparty risk as they are conducted through regulated exchanges that guarantee the futures against default by the counterparty. In the event of a bankruptcy or insolvency of a futures commission merchant that holds margin on behalf of the Portfolio, the Portfolio may not be entitled to the return of the entire margin owed to the Portfolio, potentially resulting in a loss. The Portfolio’s investment in futures contracts and other derivatives may increase the volatility of the Portfolio’s NAVs and may result in a loss to the Portfolio. As of June 30, 2019, the Portfolio did not hold any futures contracts.
(J) Securities Sold Short. The Portfolio may engage in sales of securities it does not own (“short sales”) as part of its investment strategies. When the Portfolio enters into a short sale, it must segregate or maintain with a broker the cash proceeds from the security sold short or other securities as collateral for its obligation to deliver the security upon conclusion of the sale. During the period a short position is open, depending on the nature and type of security, a short position is reflected as a liability and is marked to market in accordance with the valuation methodologies previously detailed (See Note 2(A)). Liabilities for securities sold short are closed out by purchasing the applicable securities for delivery to the counterparty broker. A gain, limited to the price at which the Portfolio sold the security short, or a loss, unlimited as to dollar amount, will be recognized upon termination of a short sale if the market price on the date the short position is closed out is less or greater, respectively, than the proceeds originally received. Any such gain or loss may be offset, completely or in part, by the change in the value of the hedged investments. Interest on short positions held is accrued daily, while dividends declared on short positions existing on the record date are recorded on the ex-dividend date as a dividend expense in the Statement of Operations. Broker fees and other expenses related to securities sold short are disclosed in the Statement of Operations. Short sales involve risk of loss in excess of the related
| | |
| 28 | | MainStay VP Emerging Markets Equity Portfolio |
amounts reflected in the Statement of Assets and Liabilities. During the six-month period ended June 30, 2019, the Portfolio did not engage in short sales as part of its investment strategies.
(K) Foreign Currency Transactions. The Portfolio’s books and records are maintained in U.S. dollars. Prices of securities denominated in foreign currency amounts are translated into U.S. dollars at the mean between the buying and selling rates last quoted by any major U.S. bank at the following dates:
| (i) | market value of investment securities, other assets and liabilities— at the valuation date; and |
| (ii) | purchases and sales of investment securities, income and expenses—at the date of such transactions. |
The assets and liabilities that are denominated in foreign currency amounts are presented at the exchange rates and market values at the close of the period. The realized and unrealized changes in net assets arising from fluctuations in exchange rates and market prices of securities are not separately presented.
Net realized gain (loss) on foreign currency transactions represents net gains and losses on foreign currency forward contracts, net currency gains or losses realized as a result of differences between the amounts of securities sale proceeds or purchase cost, dividends, interest and withholding taxes as recorded on the Portfolio’s books, and the U.S. dollar equivalent amount actually received or paid. Net currency gains or losses from valuing such foreign currency denominated assets and liabilities, other than investments at valuation date exchange rates, are reflected in unrealized foreign exchange gains or losses.
(L) Rights and Warrants. Rights are certificates that permit the holder to purchase a certain number of shares, or a fractional share, of a new stock from the issuer at a specific price. Warrants are instruments that entitle the holder to buy an equity security at a specific price for a specific period of time. These investments can provide a greater potential for profit or loss than an equivalent investment in the underlying security. Prices of these investments do not necessarily move in tandem with the prices of the underlying securities.
There is risk involved in the purchase of rights and warrants in that these investments are speculative investments. The Portfolio could also lose the entire value of its investment in warrants if such warrants are not exercised by the date of its expiration. The Portfolio is exposed to risk until the sale or exercise of each right or warrant is completed. As of June 30, 2019, the Portfolio did not hold any rights or warrants.
(M) Securities Lending. In order to realize additional income, the Portfolio may engage in securities lending, subject to the limitations set forth in the 1940 Act and relevant guidance by the staff of the Securities and Exchange Commission (“SEC”). In the event the Portfolio does engage in securities lending, the Portfolio will lend through its custodian, State Street Bank and Trust Company (“State Street”), acting as securities lending agent on behalf of the Portfolio. State Street will manage the Portfolio’s collateral in accordance with the securities lending agency agreement between the Portfolio and State Street, and indemnify the Portfolio against counterparty risk. The loans will be collateralized by cash (which may be invested in a money market fund) and/ornon-cash collateral (which may include, U.S. Treasury securities and/or U.S. Government Agency securities issued or guaranteed by the
United States government or its agencies or instrumentalities) at least equal at all times to the market value of the securities loaned. The Portfolio may bear the risk of delay in recovery of, or loss of rights in, the securities loaned should the borrower of the securities experience financial difficulty. The Portfolio may also record a realized gain or loss on securities deemed sold due to a borrower’s inability to return securities on loan. The Portfolio bears the risk of any loss on investment of cash collateral. The Portfolio will receive compensation for lending its securities in the form of fees or it will retain a portion of interest on the investment of any cash collateral. The Portfolio will also continue to receive interest and dividends on the securities loaned and any gain or loss in the market price of the securities loaned that may occur during the term of the loan will be for the account of the Portfolio. Income earned from securities lending activities, if any, is reflected in the Statement of Operations. As of June 30, 2019, the Portfolio had securities on loan with an aggregate market value of $6,126,426; the total market value of collateral held by the Portfolio was $6,578,123. The market value of the collateral held includednon-cash collateral in the form of U.S. Treasury securities with a value of $3,189,923 and cash collateral which was invested into the State Street Navigator Securities Lending Government Money Market Portfolio with a value of $3,388,200.
(N) Foreign Securities Risk. The Portfolio invests in foreign securities, which carry certain risks that are in addition to the usual risks inherent in domestic securities. These risks include those resulting from currency fluctuations, future adverse political or economic developments and possible imposition of currency exchange blockages or other foreign governmental laws or restrictions. These risks are likely to be greater in emerging markets than in developed markets. The ability of issuers of securities held by the Portfolio to meet their obligations may be affected by economic or political developments in a specific country, industry or region.
For example, the Portfolio has significant investments in the Asia-Pacific region. The development and stability of the Asia-Pacific region can be adversely affected by, among other regional and global developments, trade barriers, exchange controls and other measures imposed or negotiated by the countries with which they trade. Some Asia-Pacific countries can be characterized as emerging markets or newly industrialized and may experience more volatile economic cycles and less liquid markets than developed countries.
(O) Counterparty Credit Risk. In order to better define its contractual rights and to secure rights that will help the Portfolio mitigate its counterparty risk, the Portfolio may enter into an International Swaps and Derivatives Association, Inc. Master Agreement (“ISDA Master Agreement”) or similar agreement with its counterparties. An ISDA Master Agreement is a bilateral agreement between the Portfolio and a counterparty that governs certain OTC derivatives and typically contains collateral posting terms and netting provisions. Under an ISDA Master Agreement, the Portfolio may, under certain circumstances, offset with the counterparty certain derivative financial instruments’ payables and/or receivables with collateral held and/or posted and create one single net payment. The provisions of the ISDA Master Agreement typically permit a single net payment in the event of default including the bankruptcy or insolvency of the counterparty. Bankruptcy or insolvency laws of a particular jurisdiction may restrict or prohibit the right of offset in
Notes to Financial Statements(Unaudited) (continued)
bankruptcy, insolvency or other events. In addition, certain ISDA Master Agreements may contain provisions for early termination of OTC derivative transactions in the event the net assets of the Portfolio decline below specific levels or if the Portfolio fails to meet the terms of its ISDA Master Agreements. The result would cause the Portfolio to accelerate payment of any net liability owed to the counterparty.
For financial reporting purposes, the Portfolio does not offset derivative assets and derivative liabilities that are subject to netting arrangements, if any, in the Statement of Assets and Liabilities.
(P) Indemnifications. Under the Fund’s organizational documents, its officers and trustees are indemnified against certain liabilities that may arise out of performance of their duties to the Fund. Additionally, in the normal course of business, the Portfolio enters into contracts with third-party service providers that contain a variety of representations and warranties and which may provide general indemnifications. The Portfolio’s maximum exposure under these arrangements is unknown, as this would involve future claims that may be made against the Portfolio that have not yet occurred. Based on experience, management is of the view that the risk of loss in connection with these potential indemnification obligations is remote. However, there can be no assurance that material liabilities related to such obligations will not arise in the future, which could adversely impact the Portfolio.
(Q) Quantitative Disclosure of Derivative Holdings. The following tables show additional disclosures related to the Portfolio’s derivative and hedging activities, including how such activities are accounted for and their effect on the Portfolio’s financial positions, performance and cash flows. Foreign currency forward contracts were used to hedge against the risk of loss due to changing currency exchange rates. These derivatives are not accounted for as hedging instruments.
The effect of derivative instruments on the Statement of Operations for the period ended June 30, 2019:
Realized Gain (Loss)
| | | | | | | | | | |
| | | Statement of
Operations
Location | | Foreign
Exchange
Contracts
Risk | | | Total | |
| | | |
Forward Contracts | | Net realized gain (loss) on foreign currency forward transactions | | $ | 32,032 | | | $ | 32,032 | |
| | | | | | |
Total Realized Gain (Loss) | | | | $ | 32,032 | | | $ | 32,032 | |
| | | | | | | | | | |
Average Notional Amount
| | | | | | | | |
| | | Foreign
Exchange
Contracts
Risk | | | Total | |
| | |
Forward Contracts Long (a) | | $ | 270,933 | | | $ | 270,933 | |
Forward Contracts Short (b) | | $ | (544,496 | ) | | $ | (544,496 | ) |
| | | | |
| (a) | Positions were open one month during the reporting period. |
| (b) | Positions were open two months during the reporting period. |
Note 3–Fees and Related Party Transactions
(A) Manager and Subadvisors. New York Life Investments, a registered investment adviser and an indirect,wholly-owned subsidiary of New York Life, serves as the Portfolio’s Manager, pursuant to an Amended and Restated Management Agreement (“Management Agreement”). The Manager provides offices, conducts clerical, recordkeeping and bookkeeping services, and keeps most of the financial and accounting records required to be maintained by the Portfolio. Except for the portion of salaries and expenses that are the responsibility of the Portfolio, the Manager pays the salaries and expenses of all personnel affiliated with the Portfolio and certain operational expenses of the Portfolio. The Portfolio reimburses New York Life Investments in an amount equal to a portion of the compensation of the Chief Compliance Officer attributable to the Portfolio. MacKay Shields LLC (“MacKay Shields” or “Subadvisor”), a registered investment adviser and an indirect,wholly-owned subsidiary of New York Life, serves as a Subadvisor to the Portfolio, pursuant to the terms of an Amended and Restated Subadvisory Agreement (“Subadvisory Agreement”) between New York Life Investments and MacKay Shields. Candriam Belgium (“Candriam Belgium” or “Subadvisor,” and, together with MacKay Shields, the “Subadvisors”), a registered investment adviser and a direct,wholly-owned subsidiary of New York Life, serves as a Subadvisor to the Portfolio, pursuant to the terms of an Amended and Restated Subadvisory Agreement between New York Life Investments and Candriam Belgium. Each Subadvisor is responsible for managing a portion of the Portfolio’s assets, as designated by the Manager from time to time. New York Life Investments pays for the services of the Subadvisors.
The Fund, on behalf of the Portfolio, pays New York Life Investments in its capacity as the Portfolio’s investment manager and administrator, pursuant to the Management Agreement, a monthly fee for the services performed and the facilities furnished at an annual rate of Portfolio’s average daily net assets as follows: 1.00% up to $1 billion and 0.975% in excess of $1 billion. During the six-month period ended June 30, 2019, the effective management fee rate was 1.00%.
During the six-month period ended June 30, 2019, New York Life Investments earned fees from the Portfolio in the amount of $2,572,148, and paid MacKay Shields LLC and Candriam Belgium in the amounts of $613,689 and $672,167, respectively.
State Street providessub-administration andsub-accounting services to the Portfolio pursuant to an agreement with New York Life Investments. These services include calculating the daily NAVs of the Portfolio, maintaining the general ledger andsub-ledger accounts for the calculation of the Portfolio’s NAVs and assisting New York Life Investments in conducting various aspects of the Portfolio’s administrative operations. For providing these services to the Portfolio, State Street is compensated by New York Life Investments.
Pursuant to an agreement between the Fund and New York Life Investments, New York Life Investments is responsible for providing or procuring certain regulatory reporting services for the Portfolio. The Portfolio will reimburse New York Life Investments for the actual costs
incurred by New York Life Investments in connection with providing or procuring these services for the Portfolio.
| | |
| 30 | | MainStay VP Emerging Markets Equity Portfolio |
(B) Distribution and Service Fees. The Fund, on behalf of the Portfolio, has entered into a distribution agreement with NYLIFE Distributors LLC (the “Distributor”), an indirect,wholly-owned subsidiary of New York Life. The Portfolio has adopted a distribution plan (the “Plan”) in accordance with the provisions of Rule 12b-1 under the 1940 Act. Under the Plan, the Distributor has agreed to provide, through its affili-
ates or independent third parties, various distribution-related, shareholder and administrative support services to the Service Class shareholders. For its services, the Distributor is entitled to a combined distribution and service fee accrued daily and paid monthly at an annual rate of 0.25% of the average daily net assets attributable to the Service Class shares of the Portfolio.
(C) Investments in Affiliates (in 000’s). During the six-month period ended June 30, 2019, purchases and sales transactions, income earned from investments and shares held of investment companies managed by New York Life Investments or its affiliates were as follows:
| | | | | | | | | | | | | | | | | | | | | | | | | | | | | | | | | | | | |
Affiliated Investment
Company | | Value,
Beginning
of Period | | | Purchases at
Cost | | | Proceeds
from
Sales | | | Net
Realized
Gain/
(Loss)
on Sales | | | Change in
Unrealized
Appreciation/
(Depreciation) | | | Value,
End of
Period | | | Dividend
Income | | | Other
Distributions | | | Shares
End of
Period | |
MainStay U.S. Government Liquidity Fund | | $ | 1,319 | | | $ | 17,274 | | | $ | (16,775 | ) | | $ | — | | | $ | — | | | $ | 1,818 | | | $ | 13 | | | $ | — | | | | 1,818 | |
Note 4–Federal Income Tax
As of June 30, 2019, the cost and unrealized appreciation (depreciation) of the Portfolio’s investment portfolio, including applicable derivative contracts and other financial instruments, as determined on a federal income tax basis, were as follows:
| | | | | | | | | | | | | | | | |
| | | Federal Tax
Cost | | | Gross
Unrealized
Appreciation | | | Gross
Unrealized
(Depreciation) | | | Net
Unrealized
Appreciation/
(Depreciation) | |
| | | | |
Investments in Securities | | $ | 440,863,796 | | | $ | 48,445,620 | | | $ | (19,618,346 | ) | | $ | 28,827,274 | |
As of December 31, 2018, for federal income tax purposes, capital loss carryforwards of $50,977,859, as shown in the table below, were available to the extent provided by the regulations to offset future realized gains of the Portfolio through the years indicated. Accordingly, no capital gains distributions are expected to be paid to shareholders until net gains have been realized in excess of such amounts.
| | | | |
Capital Loss
Available Through | | Short-Term
Capital Loss
Amounts (000’s) | | Long-Term
Capital Loss
Amounts (000’s) |
| | |
| Unlimited | | $50,978 | | $— |
During the year ended December 31, 2018, the tax character of distributions paid as reflected in the Statements of Changes in Net Assets was as follows:
| | |
|
| 2018 |
Tax-Based
Distributions
from Ordinary
Income | | Tax-Based
Distributions
from Long-Term
Gains |
| |
| $8,050,748 | | $— |
Note 5–Custodian
State Street is the custodian of cash and securities held by the Portfolio. Custodial fees are charged to the Portfolio based on the Portfolio’s net
assets and/or the market value of securities held by the Portfolio and the number of certain transactions incurred by the Portfolio.
Note 6–Line of Credit
The Portfolio and certain other funds managed by New York Life Investments maintain a line of credit with a syndicate of banks in order to secure a source of funds for temporary purposes to meet unanticipated or excessive redemption requests.
Effective July 30, 2019, under the credit agreement (the “Credit Agreement”), the aggregate commitment amount is $600,000,000 with an additional uncommitted amount of $100,000,000. The commitment fee is an annual rate of 0.15% of the average commitment amount payable quarterly, regardless of usage, to State Street, who serves as the agent to the syndicate. The commitment fee is allocated among the Portfolio and certain other funds managed by New York Life Investments based upon their respective net assets and other factors. Interest on any revolving credit loan is charged based upon the Federal Funds Rate or the one-month London Interbank Offered Rate (“LIBOR”), whichever is higher. The Credit Agreement expires on July 28, 2020, although the Portfolio, certain other funds managed by New York Life Investments and the syndicate of banks may renew the Credit Agreement for an additional year on the same or different terms. Prior to July 30, 2019, the aggregate commitment amount and the commitment fee were the same as those under the current Credit Agreement. During the six-month period ended June 30, 2019, there were no borrowings made or outstanding with respect to the Portfolio under the Credit Agreement.
Note 7–Interfund Lending Program
Pursuant to an exemptive order issued by the SEC, the Portfolio, along with certain other funds managed by New York Life Investments, may participate in an interfund lending program. The interfund lending program provides an alternative credit facility that permits the Portfolio and certain other funds managed by New York Life Investments to lend or borrow money for temporary purposes directly to or from one another subject to the conditions of the exemptive order. During the six-month period ended June 30, 2019, there were no interfund loans made or outstanding with respect to the Portfolio.
Notes to Financial Statements(Unaudited) (continued)
Note 8–Purchases and Sales of Securities (in 000’s)
During the six-month period ended June 30, 2019, purchases and sales of securities, other thanshort-term securities, were $274,118 and $362,187, respectively.
Note 9–Capital Share Transactions
Transactions in capital shares for the six-month period ended June 30, 2019 and the year ended December 31, 2018, were as follows:
| | | | | | | | |
Initial Class | | Shares | | | Amount | |
| | |
Six-month period ended June 30, 2019: | | | | | | | | |
Shares sold | | | 410,696 | | | $ | 3,447,770 | |
Shares redeemed | | | (9,305,178 | ) | | | (80,536,311 | ) |
| | | | |
Net increase (decrease) | | | (8,894,482 | ) | | $ | (77,088,541 | ) |
| | | | |
Year ended December 31, 2018: | | | | | | | | |
Shares sold | | | 8,761,163 | | | $ | 79,889,183 | |
Shares issued to shareholders in reinvestment of dividends and distributions | | | 722,470 | | | | 6,159,288 | |
Shares redeemed | | | (11,668,289 | ) | | | (114,852,370 | ) |
| | | | |
Net increase (decrease) | | | (2,184,656 | ) | | $ | (28,803,899 | ) |
| | | | |
| | |
| | | | | | | | |
Service Class | | Shares | | | Amount | |
| | |
Six-month period ended June 30, 2019: | | | | | | | | |
Shares sold | | | 115,815 | | | $ | 999,366 | |
Shares redeemed | | | (1,817,156 | ) | | | (15,763,329 | ) |
| | | | |
Net increase (decrease) | | | (1,701,341 | ) | | $ | (14,763,963 | ) |
| | | | |
Year ended December 31, 2018: | | | | | | | | |
Shares sold | | | 1,116,001 | | | $ | 10,214,550 | |
Shares issued to shareholders in reinvestment of dividends and distributions | | | 222,010 | | | | 1,891,460 | |
Shares redeemed | | | (5,311,676 | ) | | | (51,084,789 | ) |
| | | | |
Net increase (decrease) | | | (3,973,665 | ) | | $ | (38,978,779 | ) |
| | | | |
Note 10–Recent Accounting Pronouncement
To improve the effectiveness of fair value disclosure requirements, the Financial Accounting Standards Board recently issued Accounting Standard Update (ASU)2018-13, Fair Value Measurement Disclosure Framework—Changes to the Disclosure Requirements for Fair Value Measurement (ASU2018-13), which adds, removes, and modifies certain aspects relating to fair value disclosure. ASU2018-13 is effective for interim and annual reporting periods beginning after December 15, 2019; early adoption of the additions relating toASU 2018-13 is not required. Management has evaluated the implications of certain other provisions of the ASU and has determined to early adopt aspects related to the removal and modifications of certain fair value measurement disclosures under the ASU effective immediately. At this time, management is evaluating the implications of certain other provisions of the ASU related to new disclosure requirements and any impact on the financial statement disclosures has not yet been determined.
Note 11–Subsequent Events
In connection with the preparation of the financial statements of the Portfolio as of and for the six-month period ended June 30, 2019, events and transactions subsequent to June 30, 2019, through the date the financial statements were issued have been evaluated by the Portfolio’s management for possible adjustment and/or disclosure. No subsequent events requiring financial statement adjustment or disclosure have been identified.
| | |
| 32 | | MainStay VP Emerging Markets Equity Portfolio |
Proxy Voting Policies and Procedures and Proxy Voting Record
A description of the policies and procedures that New York Life Investments uses to vote proxies related to the Portfolio’s securities is available without charge, upon request (i) by calling800-598-2019; (ii) by visiting New York Life Investments website at https://www.nylinvestments.com/mainstay/products-and-performance/mainstay-vp-funds-trust; or (iii) by visiting the SEC’s website at www.sec.gov.
The Portfolio is required to file with the SEC its proxy voting record for the12-month period ending June 30 on Form N-PX. The Portfolio’s most recent Form N-PX or proxy voting record is available free of charge upon request (i) by calling800-598-2019; (ii) by visiting New York Life Investments website at https://www.nylinvestments.com/mainstay/products-and-performance/mainstay-vp-funds-trust; or (iii) by visiting the SEC’s website atwww.sec.gov.
Shareholder Reports and Quarterly Portfolio Disclosure
The Portfolio is required to file its complete schedule of portfolio holdings with the SEC 60 days after each fiscal quarter on FormN-PORT. The Portfolio’s holdings report is available without charge upon request (i) by calling800-598-2019; (ii) by visiting New York Life Investments website at https://www.nylinvestments.com/mainstay/products-and-performance/mainstay-vp-funds-trust; or (iii) on the SEC’s website at www.sec.gov.
MainStay VP Portfolios
MainStay VP offers a wide range of Portfolios. The full array of MainStay VP offerings is listed here, with information about the manager, subadvisors, legal counsel, and independent registered public accounting firm.
Equity Portfolios
MainStay VP Eagle Small Cap Growth Portfolio
MainStay VP Emerging Markets Equity Portfolio
MainStay VP Epoch U.S. Equity Yield Portfolio
MainStay VP Fidelity Institutional AM® Utilities Portfolio†
MainStay VP Large Cap Growth Portfolio
MainStay VP MacKay Common Stock Portfolio
MainStay VP MacKay Growth Portfolio
MainStay VP MacKay International Equity Portfolio
MainStay VP MacKay Mid Cap Core Portfolio
MainStay VP MacKay S&P 500 Index Portfolio
MainStay VP MacKay Small Cap Core Portfolio
MainStay VP Mellon Natural Resources Portfolio
MainStay VP T. Rowe Price Equity Income Portfolio
Mixed Asset Portfolios
MainStay VP Balanced Portfolio
MainStay VP Income Builder Portfolio
MainStay VP Janus Henderson Balanced Portfolio
MainStay VP MacKay Convertible Portfolio
Income Portfolios
MainStay VP Bond Portfolio
MainStay VP Floating Rate Portfolio
MainStay VP Indexed Bond Portfolio
MainStay VP MacKay Government Portfolio
MainStay VP MacKay High Yield Corporate Bond Portfolio
MainStay VP MacKay Unconstrained Bond Portfolio
MainStay VP PIMCO Real Return Portfolio
Money Market
MainStay VP U.S. Government Money Market Portfolio
Alternative
MainStay VP Cushing Renaissance Advantage Portfolio
MainStay VP IQ Hedge Multi-Strategy Portfolio
Asset Allocation Portfolios
MainStay VP Conservative Allocation Portfolio
MainStay VP Growth Allocation Portfolio
MainStay VP Moderate Allocation Portfolio
MainStay VP Moderate Growth Allocation Portfolio
Manager
New York Life Investment Management LLC
New York, New York
Subadvisors
Candriam Belgium*
Brussels, Belgium
Cushing Asset Management, LP
Dallas, Texas
Eagle Asset Management, Inc.
St Petersburg, Florida
Epoch Investment Partners, Inc.
New York, New York
FIAM LLC
Smithfield, Rhode Island
IndexIQ Advisors LLC*
New York, New York
Janus Capital Management LLC
Denver, Colorado
MacKay Shields LLC*
New York, New York
Mellon Investments Corporation
Boston, Massachusetts
NYL Investors LLC*
New York, New York
Pacific Investment Management Company LLC
Newport Beach, California
T. Rowe Price Associates, Inc.
Baltimore, Maryland
Winslow Capital Management, LLC
Minneapolis, Minnesota
Distributor
NYLIFE Distributors LLC*
Jersey City, New Jersey
Custodian
State Street Bank and Trust Company
Boston, Massachusetts
Independent Registered Public Accounting Firm
PricewaterhouseCoopers LLP
New York, New York
Legal Counsel
Dechert LLP
Washington, District of Columbia
Some Portfolios may not be available in all products.
| † | Fidelity Institutional AM is a registered trade mark of FMR LLC. Used with permission. |
| * | An affiliate of New York Life Investment Management LLC |
Not part of the Semiannual Report
2019 Semiannual Report
This report is for the general information of New York Life Variable Annuities and NYLIAC Variable Universal Life Insurance Products policyowners. It must be preceded or accompanied by the appropriate product(s) and funds prospectuses if it is given to anyone who is not an owner of a New York Life variable annuity policy or a NYLIAC Variable Universal Life Insurance Product. This report does not offer for sale or solicit orders to purchase securities.
The performance data quoted in this report represents past performance. Past performance is no guarantee of future results. Due to market volatility and other factors, current performance may be lower or higher than the figures shown. The most recent month-end performance summary for your variable annuity or variable life policy is available by calling 800-598-2019 and is updated periodically on www.newyorklife.com.
The New York Life Variable Annuities and NYLIAC Variable Universal Life Insurance Products are issued by New York Life Insurance and Annuity Corporation (a Delaware Corporation) and distributed by NYLIFE Distributors LLC (Member FINRA/SIPC).
New York Life Insurance Company
New York Life Insurance and Annuity Corporation (NYLIAC) (A Delaware Corporation)
51 Madison Avenue, Room 551
New York, NY 10010
www.newyorklife.com
Printed on recycled paper
nylinvestments.com
NYLIFE Distributors LLC, 30 Hudson Street, Jersey City, NJ 07302
New York Life Investment Management LLC is the investment manager to the MainStay VP Funds Trust
©2019 by NYLIFE Distributors LLC. All rights reserved.
You may obtain copies of the Prospectus and the Statement of Additional Information free of charge, upon request, by callingtoll-free 800-598-2019 or writing to New York Life Insurance and Annuity Corporation, 51 Madison Avenue, New York, NY 10010.
| | | | |
| | | |
| Not FDIC Insured | | No Bank Guarantee | | May Lose Value |
| | | | |
| 1781615 | | | | MSVPEME10-08/19 (NYLIAC) NI516 |
MainStay VP Floating Rate Portfolio
Message from the President and Semiannual Report
Unaudited | June 30, 2019

Beginning on January 1, 2021, as permitted by regulations adopted by the Securities and Exchange Commission, paper copies of the MainStay VP Portfolio annual and semi-annual shareholder reports may no longer be sent by mail, unless you specifically request paper copies of the reports from the insurance company that offers your policy. Instead, the reports will be made available online, and you will be notified by mail each time a report is posted and provided with a website link to access the report. Instructions for requesting paper copies will be provided by your insurance company.
If you already elected to receive shareholder reports electronically, you will not be affected by this change and you need not take any action. At any time, you may elect to receive reports and other communications from the insurance company electronically by following the instructions provided by the insurance company.
You may elect to receive all future shareholder reports in paper form free of charge. You can inform the insurance company that you wish to receive paper copies of reports by following the instructions provided by the insurance company. Your election to receive reports in paper form will apply to all portfolio companies available under your contract.
| | | | | | | | |
| | | | | |
| Not FDIC/NCUA Insured | | Not a Deposit | | May Lose Value | | No Bank Guarantee | | Not Insured by Any Government Agency |

This page intentionally left blank
Message from the President
Most equity and fixed-income markets in the United States and around the world advanced in the face of conflicting political and macroeconomic forces during thesix-month period ended June 30, 2019.
The reporting period began on the heels of tumultuous December 2018, during which equities and equity-sensitive bonds spiked sharply lower on concerns regarding the pace of economic growth, a U.S. government shutdown and the potential impact of trade disputes between the United States and other nations, particularly China. Markets recovered quickly in early 2019 as trade tensions eased, the government reopened and the U.S. Federal Reserve Board (Fed) adopted a more patient tone regarding the future direction of interest rates. Markets moved broadly higher from January through April, supported by encouraging economic data and generally strong corporate earnings.
During the first four months of the reporting period, the improving economic environment encouraged investors to favor areas of the market viewed as offering greater return potential along with higher risks. Among U.S. stocks, cyclical, growth-oriented sectors tended to outperform more defensive, value-oriented sectors, whilelarge-cap stocks outperformed theirsmaller-cap counterparts. Within the S&P 500® Index, the information technology sector led the market’s advance, followed by communication services, consumer discretionary and consumer staples. Industrials, utilities, financials, materials, real estate and energy produced more modest gains. While some international equity markets outperformed or underperformed the U.S. market, on average international stocks mirrored the performance of their U.S. counterparts. Fixed-income securities gained ground as well, albeit along a more gradual trajectory. Among U.S. fixed-income instruments, corporate issues generally outperformed government bonds, with lower credit quality, higher yielding securities leading the sector’s advance. Long-term U.S. Treasury bond yields proved particularly weak, with
10-year yields dipping at times below3-month yields, reflecting investors’ continued concerns about domestic economic growth.
May 2019 saw a return of uncertainty and volatility. Trade discussions between the United States and China faltered, driving global equity prices lower. Government bond prices rose as investors sought safe havens. June brought yet anotherU-turn as equity prices climbed again after comments from the Fed raised hopes of an interest rate cut in response to weak economic data. Stock and bond prices rose, with U.S. equity markets ending the reporting period in record territory.
We are pleased to see renewed signs of strength in broad areas of the financial market. At the same time, we remained sharply focused on providing you, as a MainStay VP investor, with the experienced and disciplined fund management that we believe underpins an effective, long-term investment strategy. Whatever tomorrow’s investment environment brings, you can rely on our portfolio managers to pursue the objectives of their individual Portfolios as outlined in the prospectus with the energy and dedication you have come to expect.
The report that follows contains additional information on the market events, investment decisions and specific securities that shaped your VP Portfolio’s performance during the six months ended June 30, 2019. We encourage you to read the report carefully and use it to evaluate your Portfolio’s performance in light of your long-range financial plan.
Sincerely,

Kirk C. Lehneis
President
The opinions expressed are as of the date of this report and are subject to change. There is no guarantee that any forecast made will come to pass. This material does not constitute investment advice and is not intended as an endorsement of any specific investment. Past performance is no guarantee of future results.
Not part of the Semiannual Report
Table of Contents
Investors should refer to the Portfolio’s Summary Prospectus and/or Prospectus and consider the Portfolio’s investment objectives, strategies, risks, charges and expenses carefully before investing. The Summary Prospectus and/or Prospectus contain this and other information about the Portfolio. You may obtain copies of the Portfolio’s Summary Prospectus and/or the Prospectus and the Statement of Additional Information free of charge, upon request, by calling toll-free 800-598-2019, by writing to New York Life Insurance and Annuity Corporation, 51 Madison Avenue, Room 251, New York, New York 10010 or by sending an email to MainStayShareholdersServices@nylim.com. These documents are also available at nylinvestments.com/vpdocuments. Please read the Summary Prospectus and/or Prospectus carefully before investing. MainStay VP Funds Trust portfolios are separate account options which are purchased through a variable insurance or variable annuity contract.
Investment and Performance Comparison1(Unaudited)
Performance data quoted represents past performance. Past performance is no guarantee of future results. Because of market volatility and other factors, current performance may be lower or higher than the figures shown. Investment return and principal value will fluctuate, and as a result, when shares are redeemed, they may be worth more or less than their original cost. The performance table and graph do not reflect any deduction of sales charges, mortality and expense charges, contract charges or administrative charges. Please refer to the Performance Summary appropriate for your policy. For performance information current to the most recent month-end, please call800-598-2019 or visit www.newyorklife.com.
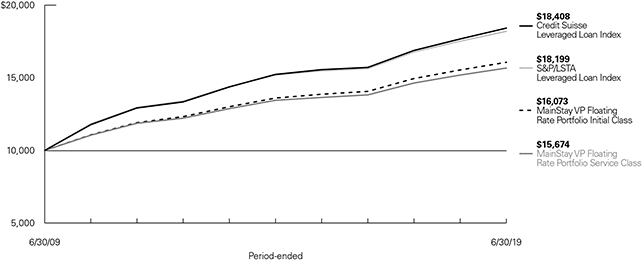
Average Annual Total Returns for the Period-Ended June 30, 2019
| | | | | | | | | | | | | | | | | | |
| Class | | Inception
Date | | Six Months | | One Year | | Five Years | | | Ten Years | | | Gross
Expense
Ratio2 | |
| | | | | | |
| Initial Class Shares | | 5/2/2005 | | 5.43% | | 3.45% | | | 3.39 | % | | | 4.86 | % | | | 0.65 | % |
| Service Class Shares | | 5/2/2005 | | 5.30 | | 3.19 | | | 3.13 | | | | 4.60 | | | | 0.90 | |
| | | | | | | | | | | | | | | | |
| Benchmark Performance | | Six Months | | | One
Year | | | Five
Years | | | Ten
Years | |
| | | | |
S&P/LSTA Leveraged Loan Index3 | | | 5.74 | % | | | 3.97 | % | | | 3.68 | % | | | 6.17 | % |
Credit Suisse Leveraged Loan Index4 | | | 5.42 | | | | 4.15 | | | | 3.85 | | | | 6.29 | |
Morningstar Bank Loan Category Average5 | | | 5.05 | | | | 3.18 | | | | 2.89 | | | | 5.21 | |
| 1. | Performance figures may reflect certain fee waivers and/or expense limitations, without which total returns may have been different. For information on current fee waivers and/or expense limitations (if any), please refer to the Notes to Financial Statements. |
| 2. | The gross expense ratios presented reflect the Portfolio’s “Total Annual Portfolio Operating Expenses” from the most recent Prospectus, as supplemented, and may differ from other expense ratios disclosed in this report. |
| 3. | The S&P/LSTA Leveraged Loan Index is the Portfolio’s primary broad-based securities market index for comparison purposes. The S&P/LSTA Leveraged Loan Index is a broad-based index designed to reflect the performance of U.S. dollar facilities in the leveraged loan market. Results assume reinvestment of all dividends and capital gains. An investment cannot be made directly in an index. |
| 4. | The Credit Suisse Leveraged Loan Index is the Portfolio’s secondary benchmark. The Credit Suisse Leveraged Loan Index represents tradable,senior-secured, U.S. dollar denominated non-investment-grade loans. Results assume reinvestment of all dividends and capital gains. An investment cannot be made directly in an index. |
| 5. | The Morningstar Bank Loan Category Average is representative of funds that invest in floating-rate bank loans instead of bonds. In exchange for their credit risk, these loans offer high interest payments that typically float above a common short-term benchmark. Results are based on average total returns of similar funds with all dividends and capital gain distributions reinvested. |
Cost in Dollars of a $1,000 Investment in MainStay VP Floating Rate Portfolio (Unaudited)
The example below is intended to describe the fees and expenses borne by shareholders during thesix-month period from January 1, 2019, to June 30, 2019, and the impact of those costs on your investment.
Example
As a shareholder of the Portfolio you incur two types of costs: (1) transaction costs, including exchange fees and sales charges (loads) on purchases (as applicable), and (2) ongoing costs, including management fees, distribution and/or service(12b-1) fees, and other Portfolio expenses (as applicable). This example is intended to help you understand your ongoing costs (in dollars) of investing in the Portfolio and to compare these costs with the ongoing costs of investing in other mutual funds. The example is based on an investment of $1,000 made at the beginning of thesix-month period and held for the entire period from January 1, 2019, to June 30, 2019. Shares are only sold in connection with variable life and annuity contracts and the example does not reflect any contract level or transactional fees or expenses. If these costs had been included, your costs would have been higher.
This example illustrates your Portfolio’s ongoing costs in two ways:
Actual Expenses
The second and third data columns in the table below provide information about actual account values and actual expenses. You may use the information in these columns, together with the amount you invested, to estimate the expenses that you paid during the six months ended June 30, 2019. Simply divide your account value by $1,000
(for example, an $8,600 account value divided by $1,000 = 8.6), then multiply the result by the number under the heading entitled “Expenses Paid During Period” to estimate the expenses you paid on your account during this period.
Hypothetical Example for Comparison Purposes
The fourth and fifth data columns in the table below provide information about hypothetical account values and hypothetical expenses based on the Portfolio’s actual expense ratio and an assumed rate of return of 5% per year before expenses, which is not the Portfolio’s actual return. The hypothetical account values and expenses may not be used to estimate the actual ending account balances or expenses you paid for thesix-month period shown. You may use this information to compare the ongoing costs of investing in the Portfolio with the ongoing costs of investing in other mutual funds. To do so, compare this 5% hypothetical example with the 5% hypothetical examples that appear in the shareholder reports of the other mutual funds.
Please note that the expenses shown in the table are meant to highlight your ongoing costs only and do not reflect any transactional costs, such as exchange fees or sales charges (loads). Therefore, the fourth and fifth data columns of the table are useful in comparing ongoing costs only and will not help you determine the relative total costs of owning different funds. In addition, if these transactional costs were included, your costs would have been higher.
| | | | | | | | | | | | | | | | | | | | | | |
| | | | | | | | | | | | | | | | | | |
| Share Class | | Beginning
Account
Value
1/1/19 | | | Ending Account
Value (Based
on Actual
Returns and
Expenses)
6/30/19 | | | Expenses
Paid
During
Period1 | | | Ending Account
Value (Based
on Hypothetical
5% Annualized
Return and
Actual Expenses)
6/30/19 | | | Expenses
Paid
During
Period1 | | | Net Expense
Ratio
During
Period2 |
| | | | | | |
| Initial Class Shares | | $ | 1,000.00 | | | $ | 1,054.30 | | | $ | 3.26 | | | $ | 1,021.62 | | | $ | 3.21 | | | 0.64% |
| | | | | | |
| Service Class Shares | | $ | 1,000.00 | | | $ | 1,053.00 | | | $ | 4.53 | | | $ | 1,020.38 | | | $ | 4.46 | | | 0.89% |
| 1. | Expenses are equal to the Portfolio’s annualized expense ratio of each class multiplied by the average account value over the period, divided by 365 and multiplied by 181 (to reflect thesix-month period). The table above represents the actual expenses incurred during thesix-month period. In addition to the fees and expenses which the Portfolio bears directly, it also indirectly bears a pro rata share of the fees and expenses of the underlying funds in which it invests. Such indirect expenses are not included in the above-reported expense figures. |
| 2. | Expenses are equal to the Portfolio’s annualized expense ratio to reflect thesix-month period. |
| | |
| 6 | | MainStay VP Floating Rate Portfolio |
Industry Composition as of June 30, 2019 (Unaudited)
| | | | |
| |
| Electronics | | | 13.6 | % |
| |
| Healthcare, Education & Childcare | | | 8.7 | |
| |
| Hotels, Motels, Inns & Gaming | | | 6.2 | |
| |
| Diversified/Conglomerate Service | | | 5.5 | |
| |
| Telecommunications | | | 4.1 | |
| |
| Broadcasting & Entertainment | | | 3.7 | |
| |
| Diversified/Conglomerate Manufacturing | | | 3.7 | |
| |
| Chemicals, Plastics & Rubber | | | 3.6 | |
| |
| Utilities | | | 3.6 | |
| |
| Beverage, Food & Tobacco | | | 3.4 | |
| |
| Insurance | | | 3.4 | |
| |
| Leisure, Amusement, Motion Pictures & Entertainment | | | 3.4 | |
| |
| Containers, Packaging & Glass | | | 3.3 | |
| |
| Buildings & Real Estate | | | 3.1 | |
| |
| Retail Store | | | 3.0 | |
| |
| Banking | | | 2.5 | |
| |
| Personal, Food & Miscellaneous Services | | | 2.4 | |
| |
| Automobile | | | 2.0 | |
| |
| Oil & Gas | | | 2.0 | |
| |
| Machinery(Non-Agriculture,Non-Construct &Non-Electronic) | | | 1.5 | |
| |
| Mining, Steel, Iron &Non-Precious Metals | | | 1.5 | |
| |
| Finance | | | 1.4 | |
| |
| Printing & Publishing | | | 1.4 | |
| |
Personal & Nondurable Consumer Products (Manufacturing Only) | | | 1.3 | |
| |
| Aerospace & Defense | | | 0.7 | |
| |
| Electric | | | 0.7 | |
| |
| Commercial Services | | | 0.6 | |
| |
| Ecological | | | 0.6 | |
| |
Home and Office Furnishings, Housewares & Durable Consumer Products | | | 0.5 | |
| |
| Radio and TV Broadcasting | | | 0.5 | |
| |
| Auto Manufacturers | | | 0.4 | |
| | | | |
| |
| Affiliated Investment Company | | | 0.3 | % |
| |
| Manufacturing | | | 0.3 | |
| |
| Metals & Mining | | | 0.3 | |
| |
| Auto Parts & Equipment | | | 0.2 | |
| |
| Chemicals | | | 0.2 | |
| |
| Communications Equipment | | | 0.2 | |
| |
| Environmental Controls | | | 0.2 | |
| |
| Media | | | 0.2 | |
| |
| Packaging & Containers | | | 0.2 | |
| |
| Personal Transportation | | | 0.2 | |
| |
| Pharmaceuticals | | | 0.2 | |
| |
| Trucking & Leasing | | | 0.2 | |
| |
| Building Materials | | | 0.1 | |
| |
| Distribution & Wholesale | | | 0.1 | |
| |
| Energy Equipment & Services | | | 0.1 | |
| |
| Miscellaneous—Manufacturing | | | 0.1 | |
| |
| Pipelines | | | 0.1 | |
| |
| Real Estate | | | 0.1 | |
| |
| Food | | | 0.0 | ‡ |
| |
| Health Care—Services | | | 0.0 | ‡ |
| |
| Hotels, Restaurants & Leisure | | | 0.0 | ‡ |
| |
| Household Products & Wares | | | 0.0 | ‡ |
| |
| Housewares | | | 0.0 | ‡ |
| |
| Independent Power & Renewable Electricity Producers | | | 0.0 | ‡ |
| |
| Machinery–Diversified | | | 0.0 | ‡ |
| |
| Oil & Gas Services | | | 0.0 | ‡ |
| |
| Oil, Gas & Consumable Fuels | | | 0.0 | ‡ |
| |
| Retail | | | 0.0 | ‡ |
| |
| Short-Term Investments | | | 7.1 | |
| |
| Other Assets, Less Liabilities | | | –2.7 | |
| | | | |
| |
| | | 100.0 | % |
| | | | |
See Portfolio of Investments beginning on page 10 for specific holdings within these categories. The Portfolio’s holdings are subject to change.
| ‡ | Less thanone-tenth of a percent. |
Top Ten Holdings or Issuers Held as of June 30, 2019(excluding short-term investments) (Unaudited)
| 1. | Asurion LLC, 5.402%–8.902%, due 8/4/22–8/4/25 |
| 2. | Allied Universal Holdco LLC, TBD–6.652%, due 7/28/22–6/26/26 |
| 3. | McAfee LLC, 6.152%–10.902%, due 9/30/24–9/29/25 |
| 4. | Scientific Games International, Inc., 5.15%–5.23%, due 8/14/24 |
| 5. | Epicor Software Corp., 5.66%, due 6/1/22 |
| 6. | Sprint Communications, Inc., 4.938%–5.438%, due 2/2/24 |
| 7. | Valeant Pharmaceuticals International, Inc., 5.412%, due 6/2/25 |
| 8. | Berry Global, Inc., TBD due 5/15/26 |
| 9. | Almonde, Inc., 5.902%–9.652%, due 6/13/24–6/13/25 |
| 10. | First Data Corp., 4.404%, due 4/26/24 |
Portfolio Management Discussion and Analysis(Unaudited)
Answers to the questions reflect the views of portfolio managers Robert H. Dial, Mark A. Campellone and Arthur S. Torrey of NYL Investors LLC, the Portfolio’s Subadvisor.
How did MainStay VP Floating Rate Portfolio perform relative to its benchmarks and peers during the six months ended June 30, 2019?
For the six months ended June 30, 2019, MainStay VP Floating Rate Portfolio returned 5.43% for Initial Class shares and 5.30% for Service Class shares. Over the same period, both share classes underperformed the 5.74% return of the S&P/LSTA Leveraged Loan Index, which is the Portfolio’s primary benchmark. The Initial Class shares outperformed, and the Service Class shares underperformed the 5.42% return of the Credit Suisse Leveraged Loan Index, which is the Portfolio’s secondary benchmark. Both share classes outperformed the 5.05% return of the Morningstar Bank Loan Category Average.1
What factors affected the Portfolio’s performance relative to its primary benchmark during the reporting period?
During the first six months of 2019, the floating-rate loan market recorded one of its best starts to a year since coming out of the credit crisis in 2008. With most sectors reporting positive performance, all of the Portfolio’s overweight positions contributed positively to performance. (Contributions take weightings and total returns into account.) Performance also benefited from the Portfolio’s overweight exposure to higher credit-quality securities than the S&P/LSTA Leveraged Loan Index during a reporting period in which higher credit-quality issues generally outperformed lower credit-quality issues. Performance relative to the benchmark suffered from the Portfolio’s underweight sector positions and from certain individual holdings that traded lower during the first six months.
What was the Portfolio’s duration2 strategy during the reporting period? Please include the Portfolio’s duration at the end of the reporting period.
Floating-rate loans are, by their nature, a low duration asset. Loans earn a stated spread3 over a floating reference rate, which is LIBOR.4 Issuers can generally borrow under a 30- to
90-day range with LIBOR. As of June 30, 2019, the Portfolio’s weighted-average time to LIBOR reset was 38 days.
What specific factors, risks or market forces prompted significant decisions for the Portfolio during the reporting period?
As 2019 began, the Portfolio was positioned to benefit from prevailing market conditions and the recovery in risk assets—the markets favored higher credit quality over lower credit quality and favored longer duration assets as interest rates fell. Compared to its benchmark, the Portfolio held overweight exposure to credits rated BB and B, which outperformed lower-rated CCC credits.5 As the reporting period progressed, the Portfolio also, on the margin, increased its exposure to high-yield bonds, which outperformed loans as interest rates declined.
During the reporting period, which market segments were the strongest positive contributors to the Portfolio’s absolute performance and which market segments were particularly weak?
From a sector perspective, the top contributors to the Portfolio’s absolute performance were holdings in the gaming, containers & packaging and building materials sectors. The Portfolio’s exposure to non-benchmark positions in high-yield bonds and restructured equities also contributed positively to absolute performance. The sectors making the weakest contributions to absolute performance were ones in which the Portfolio held underweight exposure, including telecommunications, health-care, energy and broadcasting
How did the Portfolio’s sector weightings change during the reporting period?
The Portfolio did not make any material changes to its sector weightings during the reporting period.
| 1. | See page 5 for more information on benchmark and peer group returns. |
| 2. | Duration is a measure of the price sensitivity of a fixed-income investment to changes in interest rates. Duration is expressed as a number of years and is considered a more accurate sensitivity gauge than average maturity. |
| 3. | The terms “spread” and “yield spread” may refer to the difference in yield between a security or type of security and comparable U.S. Treasury issues. The terms may also refer to the difference in yield between two specific securities or types of securities at a given time. |
| 4. | The London Interbank Offered Rate (LIBOR) is a composite of interest rates at which banks borrow from one another in the London market, and it is a widely used benchmark for short-term interest rates. |
| 5. | An obligation rated ‘BB’ by Standard & Poor’s (“S&P”) is deemed by S&P to be less vulnerable to nonpayment than other speculative issues. In the opinion of S&P, however, the obligor faces major ongoing uncertainties or exposure to adverse business, financial or economic conditions which could lead to the obligor’s inadequate capacity to meet its financial commitment on the obligation. An obligation rated ‘B’ by S&P is deemed by S&P to be more vulnerable to nonpayment than obligations rated ‘BB’, but in the opinion of S&P, the obligor currently has the capacity to meet its financial commitment on the obligation. It is the opinion of S&P that adverse business, financial, or economic conditions will likely impair the obligor’s capacity or willingness to meet its financial commitment on the obligation. An obligation rated ‘CCC’ by S&P is deemed by S&P to be currently vulnerable to nonpayment and is dependent upon favorable business, financial and economic conditions for the obligor to meet its financial commitment on the obligation. It is the opinion of S&P that in the event of adverse business, financial or economic conditions, the obligor is not likely to have the capacity to meet its financial commitment on the obligation. When applied to Portfolio holdings, ratings are based solely on the creditworthiness of the bonds in the portfolio and are not meant to represent the security or safety of the Portfolio. |
| | |
| 8 | | MainStay VP Floating Rate Portfolio |
How was the Portfolio positioned at the end of the reporting period?
As of June 30, 2019, the Portfolio held underweight exposure relative to the S&P/LSTA Leveraged Loan Index in credits rated BBB, CCC and below, as well as credits for which a rating has not been assigned or is no longer assigned (NR).6 As of the same date, the Portfolio held overweight exposure relative to the Index in credits rated BB and B, and in cash or cash equivalents, which are not constituents of the benchmark.
As of June 30, 2019, the Portfolio’s top five industry exposures were in electronics (underweight relative to the S&P/LSTA Leveraged Loan Index), business equipment/services (neutral weight), health care (underweight), hotels & casinos (overweight), and building materials (overweight).
| 6. | An obligation rated ‘BBB’ by S&P is deemed by S&P to exhibit adequate protection parameters. In the opinion of S&P, however, adverse economic conditions or changing circumstances are more likely to lead to a weakened capacity of the obligor to meet its financial commitment on the obligation. When applied to Portfolio holdings, ratings are based solely on the creditworthiness of the bonds in the portfolio and are not meant to represent the security or safety of the Portfolio. |
The opinions expressed are those of the portfolio managers as of the date of this report and are subject to change. There is no guarantee that any forecasts will come to pass. This material does not constitute investment advice and is not intended as an endorsement of any specific investment.
Not all MainStay VP Portfolios and/or share classes are available under all policies.
Portfolio of InvestmentsJune 30, 2019 (Unaudited)
| | | | | | | | |
| | | Principal
Amount | | | Value | |
Long-Term Bonds 94.8%† Corporate Bonds 3.7% | |
Auto Parts & Equipment 0.2% | |
Cooper-Standard Automotive, Inc.
5.625%, due 11/15/26 (a) | | $ | 400,000 | | | $ | 355,000 | |
Delphi Technologies PLC
5.00%, due 10/1/25 (a) | | | 800,000 | | | | 714,000 | |
Goodyear Tire & Rubber Co.
4.875%, due 3/15/27 (b) | | | 750,000 | | | | 712,500 | |
| | | | | | | | |
| | | | | | | 1,781,500 | |
| | | | | | | | |
Building Materials 0.1% | |
Jeld-Wen, Inc. (a) | | | | | | | | |
4.625%, due 12/15/25 | | | 250,000 | | | | 245,313 | |
4.875%, due 12/15/27 | | | 330,000 | | | | 319,275 | |
| | | | | | | | |
| | | | | | | 564,588 | |
| | | | | | | | |
Chemicals 0.2% | |
Element Solutions, Inc.
5.875%, due 12/1/25 (a) | | | 1,200,000 | | | | 1,249,500 | |
Starfruit Finco B.V. / Starfruit U.S. Holdco LLC
8.00%, due 10/1/26 (a)(b) | | | 500,000 | | | | 513,750 | |
| | | | | | | | |
| | | | | | | 1,763,250 | |
| | | | | | | | |
Chemicals, Plastics & Rubber 0.2% | |
Alpha 3 B.V. / Alpha U.S. Bidco, Inc.
6.25%, due 2/1/25 (a) | | | 400,000 | | | | 394,000 | |
Versum Materials, Inc.
5.50%, due 9/30/24 (a) | | | 1,050,000 | | | | 1,124,812 | |
| | | | | | | | |
| | | | | | | 1,518,812 | |
| | | | | | | | |
Commercial Services 0.6% | |
Herc Holdings, Inc.
5.50%, due 7/15/27 (a) | | | 850,000 | | | | 855,312 | |
Hertz Corp.
5.875%, due 10/15/20 | | | 3,700,000 | | | | 3,704,625 | |
Refinitiv U.S. Holdings, Inc.
8.25%, due 11/15/26 (a) | | | 500,000 | | | | 514,250 | |
| | | | | | | | |
| | | | | | | 5,074,187 | |
| | | | | | | | |
Communications Equipment 0.2% | |
CommScope Finance LLC
5.50%, due 3/1/24 (a) | | | 1,500,000 | | | | 1,539,375 | |
| | | | | | | | |
|
Distribution & Wholesale 0.1% | |
IAA, Inc.
5.50%, due 6/15/27 (a) | | | 500,000 | | | | 520,000 | |
KAR Auction Services, Inc.
5.125%, due 6/1/25 (a) | | | 350,000 | | | | 356,125 | |
| | | | | | | | |
| | | | | | | 876,125 | |
| | | | | | | | |
Electric 0.7% | |
Clearway Energy Operating LLC
5.75%, due 10/15/25 (a) | | | 1,630,000 | | | | 1,654,450 | |
| | | | | | | | |
| | | Principal
Amount | | | Value | |
Electric (continued) | |
NRG Energy, Inc.
7.25%, due 5/15/26 | | $ | 1,300,000 | | | $ | 1,431,625 | |
Vistra Energy Corp.
8.125%, due 1/30/26 (a) | | | 1,250,000 | | | | 1,346,875 | |
Vistra Operations Co. LLC
5.00%, due 7/31/27 (a) | | | 1,500,000 | | | | 1,554,375 | |
| | | | | | | | |
| | | | | | | 5,987,325 | |
| | | | | | | | |
Environmental Controls 0.2% | |
Advanced Disposal Services, Inc.
5.625%, due 11/15/24 (a) | | | 800,000 | | | | 837,000 | |
GFL Environmental, Inc.
8.50%, due 5/1/27 (a) | | | 380,000 | | | | 408,975 | |
| | | | | | | | |
| | | | | | | 1,245,975 | |
| | | | | | | | |
Food 0.0%‡ | |
Post Holdings, Inc.
5.50%, due 12/15/29 (a) | | | 240,000 | | | | 240,600 | |
| | | | | | | | |
|
Health Care—Services 0.0%‡ | |
MPH Acquisition Holdings LLC
7.125%, due 6/1/24 (a) | | | 170,000 | | | | 159,409 | |
| | | | | | | | |
|
Household Products & Wares 0.0%‡ | |
Prestige Brands, Inc.
6.375%, due 3/1/24 (a)(b) | | | 300,000 | | | | 313,875 | |
| | | | | | | | |
|
Housewares 0.0%‡ | |
Scotts Miracle-Gro Co.
5.25%, due 12/15/26 | | | 200,000 | | | | 203,000 | |
| | | | | | | | |
|
Insurance 0.2% | |
Acrisure, LLC / Acrisure Finance, Inc.
7.00%, due 11/15/25 (a) | | | 970,000 | | | | 875,425 | |
GTCR AP Finance, Inc.
8.00%, due 5/15/27 (a) | | | 900,000 | | | | 904,500 | |
| | | | | | | | |
| | | | | | | 1,779,925 | |
| | | | | | | | |
Machinery—Diversified 0.0%‡ | |
RBS Global, Inc. / Rexnord LLC
4.875%, due 12/15/25 (a) | | | 300,000 | | | | 303,750 | |
| | | | | | | | |
|
Media 0.1% | |
E.W. Scripps Co.
5.125%, due 5/15/25 (a) | | | 500,000 | | | | 480,000 | |
iHeartCommunications, Inc. | | | | | | | | |
6.375%, due 5/1/26 | | | 105,206 | | | | 111,650 | |
8.375%, due 5/1/27 | | | 190,685 | | | | 199,746 | |
| | | | | | | | |
| | | | | | | 791,396 | |
| | | | | | | | |
| | | | |
| 10 | | MainStay VP Floating Rate Portfolio | | The notes to the financial statements are an integral part of,
and should be read in conjunction with, the financial statements. |
| | | | | | | | |
| | | Principal
Amount | | | Value | |
| Corporate Bonds (continued) | |
Miscellaneous—Manufacturing 0.1% | |
Koppers, Inc.
6.00%, due 2/15/25 (a) | | $ | 500,000 | | | $ | 468,750 | |
| | | | | | | | |
|
Oil & Gas 0.0%‡ | |
EP Energy LLC / Everest Acquistion Finance, Inc.
8.00%, due 2/15/25 (a) | | | 200,000 | | | | 43,500 | |
| | | | | | | | |
|
Oil & Gas Services 0.0%‡ | |
USA Compression Partners, L.P. / USA Compression Finance Corp.
6.875%, due 4/1/26 | | | 360,000 | | | | 380,664 | |
| | | | | | | | |
|
Packaging & Containers 0.2% | |
ARD Finance S.A.
7.125% (7.875% PIK), due 9/15/23 (c) | | | 670,000 | | | | 685,075 | |
Ardagh Packaging Finance PLC / Ardagh Holdings USA, Inc.
7.25%, due 5/15/24 (a) | | | 600,000 | | | | 632,250 | |
Plastipak Holdings, Inc.
6.25%, due 10/15/25 (a)(b) | | | 220,000 | | | | 199,100 | |
| | | | | | | | |
| | | | | | | 1,516,425 | |
| | | | | | | | |
Pharmaceuticals 0.2% | |
Bausch Health Cos., Inc. (a) | | | | | | | | |
5.50%, due 11/1/25 | | | 300,000 | | | | 312,750 | |
6.50%, due 3/15/22 | | | 1,000,000 | | | | 1,036,250 | |
| | | | | | | | |
| | | | | | | 1,349,000 | |
| | | | | | | | |
Pipelines 0.1% | |
Energy Transfer Operating, L.P.
4.25%, due 3/15/23 | | | 600,000 | | | | 626,350 | |
| | | | | | | | |
|
Real Estate 0.1% | |
Realogy Group LLC / RealogyCo-Issuer Corp.
4.875%, due 6/1/23 (a)(b) | | | 900,000 | | | | 810,000 | |
| | | | | | | | |
|
Retail 0.0%‡ | |
PetSmart, Inc.
5.875%, due 6/1/25 (a) | | | 200,000 | | | | 194,000 | |
| | | | | | | | |
|
Trucking & Leasing 0.2% | |
DAE Funding LLC
5.25%, due 11/15/21 (a) | | | 1,700,000 | | | | 1,765,875 | |
| | | | | | | | |
Total Corporate Bonds
(Cost $31,015,080) | | | | | | | 31,297,656 | |
| | | | | | | | |
| | | | | | | | |
| | | Principal
Amount | | | Value | |
| Floating Rate Loans 80.7% (d) | |
Aerospace & Defense 0.7% | | | | | | | | |
Dynasty Acquisition Co., Inc.
2019 Term Loan B1
6.33% (3 Month LIBOR + 4.00%), due 4/6/26 | | $ | 578,089 | | | $ | 580,076 | |
Science Applications International Corp.
2018 Term Loan B
4.152% (1 Month LIBOR + 1.75%), due 10/31/25 | | | 895,500 | | | | 889,104 | |
TransDigm, Inc. | | | | | | | | |
2018 Term Loan F
4.83% (3 Month LIBOR + 2.50%), due 6/9/23 | | | 3,659,467 | | | | 3,589,710 | |
2018 Term Loan E
4.83% (3 Month LIBOR + 2.50%), due 5/30/25 | | | 987,500 | | | | 964,399 | |
| | | | | | | | |
| | | | | | | 6,023,289 | |
| | | | | | | | |
Automobile 2.0% | |
American Axle and Manufacturing, Inc. | | | | | | | | |
Term Loan B
4.66%, due 4/6/24 | | | 1,596,562 | | | | 1,559,442 | |
Term Loan B
4.84% (1 Month LIBOR + 2.25%), due 4/6/24 | | | 810,055 | | | | 791,222 | |
AP Exhaust Acquisition LLC
1st Lien Term Loan
7.528% (3 Month LIBOR + 5.00%), due 5/10/24 (e) | | | 722,223 | | | | 613,889 | |
Belron Finance U.S. LLC | | | | | | | | |
2018 Term Loan B
5.035% (3 Month LIBOR + 2.50%), due 11/13/25 | | | 995,000 | | | | 993,756 | |
Term Loan B
5.065% (3 Month LIBOR + 2.50%), due 11/7/24 | | | 985,000 | | | | 983,153 | |
Chassix, Inc. (e) | | | | | | | | |
2017 1st Lien Term Loan
8.06% (3 Month LIBOR + 5.50%), due 11/15/23 | | | 724,167 | | | | 722,356 | |
2017 1st Lien Term Loan
8.06% (6 Month LIBOR + 5.50%), due 11/15/23 | | | 753,333 | | | | 751,450 | |
KAR Auction Services, Inc.
Term Loan B5
4.875% (3 Month LIBOR + 2.50%), due 3/9/23 | | | 601,479 | | | | 599,787 | |
L&W, Inc.
2018 Term Loan B
6.402% (1 Month LIBOR + 4.00%), due 5/22/25 (e) | | | 1,789,481 | | | | 1,744,744 | |
| | | | | | |
The notes to the financial statements are an integral part of,
and should be read in conjunction with, the financial statements. | | | | | 11 | |
Portfolio of InvestmentsJune 30, 2019 (Unaudited) (continued)
| | | | | | | | |
| | | Principal
Amount | | | Value | |
| Floating Rate Loans (continued) | |
Automobile (continued) | |
Mavis Tire Express Services Corp.
2018 1st Lien Term Loan
5.652% (1 Month LIBOR + 3.25%), due 3/20/25 | | $ | 1,409,675 | | | $ | 1,378,839 | |
Tenneco, Inc.
2018 Term Loan B
5.402% (1 Month LIBOR + 3.00%), due 10/1/25 | | | 1,840,750 | | | | 1,693,490 | |
Tower Automotive Holdings USA LLC
2017 Term Loan B
5.188% (1 Month LIBOR + 2.75%), due 3/7/24 | | | 1,963,606 | | | | 1,914,516 | |
Truck Hero, Inc.
1st Lien Term Loan
6.152% (1 Month LIBOR + 3.75%), due 4/21/24 | | | 2,237,667 | | | | 2,092,218 | |
Wand NewCo 3, Inc.
2019 1st Lien Term Loan
5.919% (1 Month LIBOR + 3.50%), due 2/5/26 | | | 1,200,000 | | | | 1,199,626 | |
| | | | | | | | |
| | | | | | | 17,038,488 | |
| | | | | | | | |
Banking 2.5% | |
Advisor Group, Inc.
2018 Term Loan
6.152% (1 Month LIBOR + 3.75%), due 8/15/25 | | | 1,985,000 | | | | 1,981,899 | |
Apollo Commercial Real Estate Finance, Inc. Term Loan B
5.144% (1 Month LIBOR + 2.75%), due 5/15/26 | | | 1,500,000 | | | | 1,486,875 | |
Broadstreet Partners, Inc.
2018 Term Loan B
5.652% (3 Month LIBOR + 3.25%), due 11/8/23 | | | 1,473,552 | | | | 1,466,184 | |
Brookfield Property REIT, Inc.
1st Lien Term Loan B
4.902% (1 Month LIBOR + 2.50%), due 8/27/25 | | | 4,466,250 | | | | 4,355,835 | |
Capital Automotive L.P.
2017 2nd Lien Term Loan
8.41% (1 Month LIBOR + 6.00%), due 3/24/25 | | | 2,829,416 | | | | 2,829,416 | |
Edelman Financial Center LLC
2018 1st Lien Term Loan
5.644% (1 Month LIBOR + 3.25%), due 7/21/25 | | | 1,691,500 | | | | 1,686,744 | |
Forest City Enterprises, L.P.
Term Loan B
6.402% (1 Month LIBOR + 4.00%), due 12/7/25 | | | 2,589,494 | | | | 2,589,494 | |
| | | | | | | | |
| | | Principal
Amount | | | Value | |
Banking (continued) | |
Greenhill & Co., Inc.
Term Loan B
5.661% (1 Month LIBOR + 3.25%), due 4/12/24 | | $ | 1,500,000 | | | $ | 1,492,500 | |
Jane Street Group LLC
2018 Term Loan B
5.402% (1 Month LIBOR + 3.00%), due 8/25/22 | | | 1,880,414 | | | | 1,867,095 | |
Russell Investments U.S. Inst’l Holdco, Inc. Term Loan B
5.652% (1 Month LIBOR + 3.25%), due 6/1/23 | | | 977,330 | | | | 967,353 | |
Trans Union LLC
2018 Term Loan B4
4.402% (1 Month LIBOR + 2.00%), due 6/19/25 | | | 445,500 | | | | 444,201 | |
| | | | | | | | |
| | | | | | | 21,167,596 | |
| | | | | | | | |
Beverage, Food & Tobacco 2.7% | |
8th Avenue Food & Provisions, Inc.
2018 1st Lien Term Loan
6.169% (1 Month LIBOR + 3.75%), due 10/1/25 | | | 1,592,000 | | | | 1,589,346 | |
Acosta Holdco, Inc.
2015 Term Loan
5.652% (1 Month LIBOR + 3.25%), due 9/26/21 | | | 2,147,645 | | | | 776,732 | |
Advantage Sales & Marketing, Inc. | | | | | | | | |
2014 1st Lien Term Loan
5.58% (3 Month LIBOR + 3.25%), due 7/23/21 | | | 1,807,396 | | | | 1,642,923 | |
Term Loan B2
5.58% (3 Month LIBOR + 3.25%), due 7/25/21 | | | 980,000 | | | | 890,820 | |
2014 2nd Lien Term Loan
8.83% (3 Month LIBOR + 6.50%), due 7/25/22 | | | 625,000 | | | | 491,406 | |
Albertsons LLC | | | | | | | | |
USD 2017 Term Loan B5
5.311% (3 Month LIBOR + 3.00%), due 12/21/22 | | | 1,986,070 | | | | 1,986,070 | |
2017 Term Loan B6
5.402% (1 Month LIBOR + 3.00%), due 6/22/23 | | | 2,180,958 | | | | 2,178,231 | |
American Seafoods Group LLC | | | | | | | | |
2017 1st Lien Term Loan
5.16% (1 Month LIBOR + 2.75%), due 8/21/23 | | | 18,551 | | | | 18,481 | |
2017 1st Lien Term Loan
5.18% (1 Month LIBOR + 2.75%), due 8/21/23 | | | 1,210,440 | | | | 1,205,901 | |
| | | | |
| 12 | | MainStay VP Floating Rate Portfolio | | The notes to the financial statements are an integral part of,
and should be read in conjunction with, the financial statements. |
| | | | | | | | |
| | | Principal
Amount | | | Value | |
| Floating Rate Loans (continued) | |
Beverage, Food & Tobacco (continued) | |
Arctic Glacier U.S.A., Inc.
2018 Term Loan B
5.902% (1 Month LIBOR + 3.50%), due 3/20/24 | | $ | 1,686,852 | | | $ | 1,680,526 | |
ASP MSG Acquisition Co., Inc.
2017 Term Loan B
6.402% (1 Month LIBOR + 4.00%), due 8/16/23 | | | 1,612,391 | | | | 1,578,800 | |
CH Guenther & Son, Inc.
2018 Term Loan B
5.152% (1 Month LIBOR + 2.75%), due 3/31/25 | | | 1,732,500 | | | | 1,716,258 | |
Chobani LLC
2017 Term Loan B
5.902% (1 Month LIBOR + 3.50%), due 10/10/23 | | | 977,490 | | | | 960,995 | |
Hearthside Food Solutions LLC
2018 Term Loan B
6.09% (1 Month LIBOR + 3.687%), due 5/23/25 | | | 1,285,759 | | | | 1,251,607 | |
Post Holdings, Inc.
2017 Series A Incremental Term Loan
4.404% (1 Month LIBOR + 2.00%), due 5/24/24 | | | 595,227 | | | | 591,932 | |
U.S. Foods, Inc.
2016 Term Loan B
4.402% (1 Month LIBOR + 2.00%), due 6/27/23 | | | 2,421,269 | | | | 2,403,543 | |
United Natural Foods, Inc.
Term Loan B
6.652% (1 Month LIBOR + 4.25%), due 10/22/25 | | | 2,985,000 | | | | 2,489,989 | |
| | | | | | | | |
| | | | | | | 23,453,560 | |
| | | | | | | | |
Broadcasting & Entertainment 3.1% | |
CBS Radio, Inc.
2017 Term Loan B
5.152% (1 Month LIBOR + 2.75%), due 11/18/24 | | | 1,020,515 | | | | 1,019,239 | |
Charter Communications Operating LLC
2017 Term Loan B
4.33% (3 Month LIBOR + 2.00%), due 4/30/25 | | | 4,925,000 | | | | 4,916,105 | |
Global Eagle Entertainment, Inc.
1st Lien Term Loan
10.349% (6 Month LIBOR + 7.50%), due 1/6/23 | | | 843,750 | | | | 801,563 | |
Gray Television, Inc.
2018 Term Loan C
4.931% (1 Month LIBOR + 2.50%), due 1/2/26 | | | 2,935,250 | | | | 2,928,437 | |
| | | | | | | | |
| | | Principal
Amount | | | Value | |
Broadcasting & Entertainment (continued) | |
iHeartCommunications, Inc.
Exit Term Loan
6.579% (3 Month LIBOR + 4.00%), due 5/1/26 | | $ | 460,274 | | | $ | 460,754 | |
Nielsen Finance LLC
Term Loan B4
4.412% (1 Month LIBOR + 2.00%), due 10/4/23 | | | 1,217,257 | | | | 1,204,432 | |
Tribune Media Co. | | | | | | | | |
Term Loan
5.402% (1 Month LIBOR + 3.00%), due 12/27/20 | | | 208,885 | | | | 208,689 | |
Term Loan C
5.402% (1 Month LIBOR + 3.00%), due 1/27/24 | | | 3,360,742 | | | | 3,354,861 | |
Unitymedia Finance LLC
Term Loan B
4.644% (1 Month LIBOR + 2.25%), due 9/30/25 | | | 1,500,000 | | | | 1,494,937 | |
Univision Communications, Inc.
Term Loan C5
5.152% (1 Month LIBOR + 2.75%), due 3/15/24 | | | 4,119,592 | | | | 3,918,762 | |
Virgin Media Bristol LLC
Term Loan K
4.894% (1 Month LIBOR + 2.50%), due 1/15/26 | | | 4,047,619 | | | | 4,031,315 | |
WideOpenWest Finance LLC
2017 Term Loan B
5.654% (1 Month LIBOR + 3.25%), due 8/18/23 | | | 1,950,263 | | | | 1,903,131 | |
| | | | | | | | |
| | | | | | | 26,242,225 | |
| | | | | | | | |
Buildings & Real Estate 3.1% | |
American Bath Group LLC
2018 Term Loan B
6.58% (3 Month LIBOR + 4.25%), due 9/30/23 | | | 1,992,437 | | | | 1,972,513 | |
Core & Main L.P.
2017 Term Loan B
5.52% (3 Month LIBOR + 3.00%), due 8/1/24 | | | 3,095,594 | | | | 3,085,276 | |
DTZ U.S. Borrower LLC
2018 Add On Term Loan B
5.652% (1 Month LIBOR + 3.25%), due 8/21/25 | | | 2,977,500 | | | | 2,964,101 | |
Jeld-Wen, Inc.
2017 1st Lien Term Loan
4.33% (3 Month LIBOR + 2.00%), due 12/14/24 | | | 769,531 | | | | 766,165 | |
| | | | | | |
The notes to the financial statements are an integral part of,
and should be read in conjunction with, the financial statements. | | | | | 13 | |
Portfolio of InvestmentsJune 30, 2019 (Unaudited) (continued)
| | | | | | | | |
| | | Principal
Amount | | | Value | |
| Floating Rate Loans (continued) | |
Buildings & Real Estate (continued) | |
NCI Building Systems, Inc.
2018 Term Loan
6.354% (3 Month LIBOR + 3.75%), due 4/12/25 | | $ | 2,575,489 | | | $ | 2,504,663 | |
Priso Acquisition Corp.
2017 Term Loan B
5.402% (1 Month LIBOR + 3.00%), due 5/8/22 (f) | | | 1,047,374 | | | | 994,133 | |
Realogy Group LLC
2018 Term Loan B
4.633% (1 Month LIBOR + 2.25%), due 2/8/25 | | | 2,856,402 | | | | 2,704,061 | |
Reece, Ltd.
2018 Term Loan B
4.33% (3 Month LIBOR + 2.00%), due 7/2/25 | | | 371,250 | | | | 368,466 | |
SIWF Holdings, Inc. | | | | | | | | |
1st Lien Term Loan
6.654% (1 Month LIBOR + 4.25%), due 6/15/25 | | | 1,281,859 | | | | 1,262,631 | |
2nd Lien Term Loan
10.904% (1 Month LIBOR + 8.50%), due 6/15/26 | | | 120,000 | | | | 114,000 | |
SMG Holdings, Inc.
2017 1st Lien Term Loan
5.402% (1 Month LIBOR + 3.00%), due 1/23/25 | | | 1,481,250 | | | | 1,468,751 | |
SRS Distribution, Inc.
2018 1st Lien Term Loan
5.652% (1 Month LIBOR + 3.25%), due 5/23/25 | | | 2,083,006 | | | | 1,991,550 | |
VC GB Holdings, Inc.
2017 1st Lien Term Loan
5.402% (1 Month LIBOR + 3.00%), due 2/28/24 | | | 2,396,805 | | | | 2,342,877 | |
Wilsonart LLC
2017 Term Loan B
5.58% (3 Month LIBOR + 3.25%), due 12/19/23 | | | 3,994,536 | | | | 3,895,671 | |
| | | | | | | | |
| | | | | | | 26,434,858 | |
| | | | | | | | |
Chemicals, Plastics & Rubber 2.3% | |
Allnex USA, Inc.
Term Loan B3
5.771% (3 Month LIBOR + 3.25%), due 9/13/23 | | | 952,773 | | | | 931,931 | |
Cabot Microelectronics Corp.
Term Loan B
4.688% (1 Month LIBOR + 2.25%), due 11/14/25 | | | 810,993 | | | | 809,979 | |
| | | | | | | | |
| | | Principal
Amount | | | Value | |
Chemicals, Plastics & Rubber (continued) | |
Emerald Performance Materials LLC | | | | | | | | |
New 1st Lien Term Loan
5.902% (1 Month LIBOR + 3.50%), due 8/1/21 | | $ | 1,662,542 | | | $ | 1,655,614 | |
New 2nd Lien Term Loan
10.152% (1 Month LIBOR + 7.75%), due 8/1/22 | | | 700,000 | | | | 685,417 | |
Encapsys LLC
1st Lien Term Loan
5.902% (1 Month LIBOR + 3.50%), due 11/7/24 | | | 1,469,293 | | | | 1,461,334 | |
Flex Acquisition Co., Inc.
1st Lien Term Loan
5.44% (1 Month LIBOR + 3.00%), due 12/29/23 | | | 962,832 | | | | 912,971 | |
Flint Group U.S. LLC
1st Lien Term Loan B2
5.581% (3 Month LIBOR + 3.00%), due 9/7/21 | | | 1,771,008 | | | | 1,465,509 | |
Ineos U.S. Finance LLC
2017 Term Loan B
4.402% (1 Month LIBOR + 2.00%), due 3/31/24 | | | 1,471,266 | | | | 1,450,831 | |
Minerals Technologies, Inc. | | | | | | | | |
2017 Term Loan B
4.60% (1 Month LIBOR + 2.25%), due 2/14/24 | | | 128,891 | | | | 128,569 | |
2017 Term Loan B
4.65% (1 Month LIBOR + 2.25%), due 2/14/24 | | | 32,223 | | | | 32,142 | |
2017 Term Loan B
4.66% (1 Month LIBOR + 2.25%), due 2/14/24 | | | 555,198 | | | | 553,810 | |
2017 Term Loan B
4.68% (3 Month LIBOR + 2.25%), due 2/14/24 | | | 25,778 | | | | 25,714 | |
PQ Corp.
2018 Term Loan B
5.083% (3 Month LIBOR + 2.50%), due 2/8/25 | | | 1,500,000 | | | | 1,491,093 | |
TricorBraun Holdings, Inc. | | | | | | | | |
2016 1st Lien Term Loan
6.14% (3 Month LIBOR + 3.75%), due 11/30/23 | | | 121,896 | | | | 119,661 | |
2016 1st Lien Term Loan
6.15% (3 Month LIBOR + 3.75%), due 11/30/23 | | | 1,366,659 | | | | 1,341,604 | |
Tronox Finance LLC | | | | | | | | |
Term Loan B
5.33%, due 9/23/24 | | | 1,042,988 | | | | 1,031,254 | |
| | | | |
| 14 | | MainStay VP Floating Rate Portfolio | | The notes to the financial statements are an integral part of,
and should be read in conjunction with, the financial statements. |
| | | | | | | | |
| | | Principal
Amount | | | Value | |
| Floating Rate Loans (continued) | |
Chemicals, Plastics & Rubber (continued) | |
Tronox Finance LLC (continued) | | | | | | | | |
Term Loan B
5.40% (1 Month LIBOR + 3.00%), due 9/23/24 | | $ | 1,630,886 | | | $ | 1,612,538 | |
Univar, Inc.
2019 USD Term Loan B
4.902% (1 Month LIBOR + 2.50%), due 7/1/24 | | | 816,794 | | | | 814,956 | |
Venator Materials Corp.
Term Loan B
5.524% (3 Month LIBOR + 3.00%), due 8/8/24 | | | 1,965,000 | | | | 1,935,525 | |
Zep, Inc.
2017 1st Lien Term Loan
6.33% (3 Month LIBOR + 4.00%), due 8/12/24 (f) | | | 1,473,750 | | | | 1,182,684 | |
| | | | | | | | |
| | | | | | | 19,643,136 | |
| | | | | | | | |
Containers, Packaging & Glass 3.3% | |
Anchor Glass Container Corp. | | | | | | | | |
2017 1st Lien Term Loan
5.15% (1 Month LIBOR + 2.75%), due 12/7/23 | | | 114,058 | | | | 102,709 | |
2017 1st Lien Term Loan
5.17% (1 Month LIBOR + 2.75%), due 12/7/23 | | | 2,023,794 | | | | 1,822,427 | |
Berlin Packaging LLC | | | | | | | | |
2018 1st Lien Term Loan
5.33% (1 Month LIBOR + 3.00%), due 11/7/25 | | | 15,579 | | | | 15,112 | |
2018 1st Lien Term Loan
5.41%, due 11/7/25 | | | 115,574 | | | | 112,106 | |
2018 1st Lien Term Loan
5.44% (3 Month LIBOR + 3.00%), due 11/7/25 | | | 614,852 | | | | 596,406 | |
Berry Global, Inc.
USD Term Loan U
TBD, due 5/15/26 | | | 5,250,000 | | | | 5,213,014 | |
BWAY Holding Co.
2017 Term Loan B
5.854% (3 Month LIBOR + 3.25%), due 4/3/24 | | | 3,920,000 | | | | 3,780,350 | |
Charter NEX U.S. Holdings, Inc. | | | | | | | | |
2017 Term Loan B
5.402% (1 Month LIBOR + 3.00%), due 5/16/24 | | | 2,940,000 | | | | 2,882,426 | |
Incremental Term Loan
5.902% (1 Month LIBOR + 3.50%), due 5/16/24 | | | 875,000 | | | | 871,281 | |
| | | | | | | | |
| | | Principal
Amount | | | Value | |
Containers, Packaging & Glass (continued) | |
Consolidated Container Co. LLC | | | | | | | | |
2019 Incremental Term Loan
TBD, due 5/22/24 | | $ | 1,000,000 | | | $ | 995,000 | |
2017 1st Lien Term Loan
5.152% (1 Month LIBOR + 2.75%), due 5/22/24 | | | 1,965,075 | | | | 1,932,529 | |
Fort Dearborn Co. | | | | | | | | |
2016 1st Lien Term Loan
6.43%, due 10/19/23 | | | 73,219 | | | | 70,290 | |
2016 1st Lien Term Loan
6.60% (3 Month LIBOR + 4.00%), due 10/19/23 | | | 2,364,282 | | | | 2,269,711 | |
2016 2nd Lien Term Loan
11.102% (3 Month LIBOR + 8.50%), due 10/19/24 | | | 1,000,000 | | | | 940,000 | |
Klockner-Pentaplast of America, Inc.
2017 Term Loan B2
6.652% (1 Month LIBOR + 4.25%), due 6/30/22 | | | 2,456,250 | | | | 2,165,595 | |
Reynolds Group Holdings, Inc.
2017 Term Loan
5.152% (1 Month LIBOR + 2.75%), due 2/5/23 | | | 2,206,758 | | | | 2,188,453 | |
Tank Holding Corp. | | | | | | | | |
2019 Term Loan B
6.40% (12 Month LIBOR + 4.00%), due 3/26/26 | | | 500,000 | | | | 499,688 | |
2019 Term Loan B
6.79% (3 Month LIBOR + 4.00%), due 3/26/26 | | | 750,000 | | | | 749,531 | |
Trident TPI Holdings, Inc.
2017 USD Term Loan B1
5.652% (1 Month LIBOR + 3.25%), due 10/17/24 | | | 735,467 | | | | 694,097 | |
| | | | | | | | |
| | | | | | | 27,900,725 | |
| | | | | | | | |
Diversified/Conglomerate Manufacturing 3.1% | |
Allied Universal Holdco LLC | | | | | | | | |
2019 Term Loan
TBD, due 6/26/26 | | | 225,225 | | | | 224,099 | |
2019 Term Loan B
TBD, due 6/26/26 | | | 2,274,775 | | | | 2,268,139 | |
2015 Term Loan
6.152% (1 Month LIBOR + 3.75%), due 7/28/22 | | | 3,743,358 | | | | 3,736,807 | |
Incremental Term Loan
6.652% (1 Month LIBOR + 4.25%), due 7/28/22 | | | 1,990,000 | | | | 1,985,646 | |
Filtration Group Corp.
2018 1st Lien Term Loan
5.402% (1 Month LIBOR + 3.00%), due 3/29/25 | | | 1,876,250 | | | | 1,870,554 | |
| | | | | | |
The notes to the financial statements are an integral part of,
and should be read in conjunction with, the financial statements. | | | | | 15 | |
Portfolio of InvestmentsJune 30, 2019 (Unaudited) (continued)
| | | | | | | | |
| | | Principal
Amount | | | Value | |
| Floating Rate Loans (continued) | |
Diversified/Conglomerate Manufacturing (continued) | |
Gardner Denver, Inc.
2017 Term Loan B
5.152% (1 Month LIBOR + 2.75%), due 7/30/24 | | $ | 1,386,817 | | | $ | 1,387,919 | |
GYP Holdings III Corp.
2018 Term Loan B
5.152% (1 Month LIBOR + 2.75%), due 6/1/25 | | | 462,000 | | | | 449,295 | |
Hyster-Yale Group, Inc.
Term Loan B
5.652% (1 Month LIBOR + 3.25%), due 5/30/23 | | | 450,000 | | | | 442,125 | |
Iron Mountain, Inc.
2018 Term Loan B
4.152% (1 Month LIBOR + 1.75%), due 1/2/26 | | | 1,851,563 | | | | 1,796,016 | |
LTI Holdings, Inc.
2018 Add On 1st Lien Term Loan
5.902% (1 Month LIBOR + 3.50%), due 9/6/25 | | | 1,592,987 | | | | 1,502,386 | |
Pre-Paid Legal Services, Inc.
2018 1st Lien Term Loan
5.652% (1 Month LIBOR + 3.25%), due 5/1/25 | | | 2,552,775 | | | | 2,546,393 | |
Quikrete Holdings, Inc.
2016 1st Lien Term Loan
5.152% (1 Month LIBOR + 2.75%), due 11/15/23 | | | 3,336,792 | | | | 3,275,269 | |
Red Ventures LLC
2018 Term Loan B
5.402% (1 Month LIBOR + 3.00%), due 11/8/24 | | | 4,056,844 | | | | 4,041,631 | |
TRC Cos., Inc.
Term Loan
5.902% (1 Month LIBOR + 3.50%), due 6/21/24 | | | 884,250 | | | | 882,039 | |
| | | | | | | | |
| | | | | | | 26,408,318 | |
| | | | | | | | |
Diversified/Conglomerate Service 5.5% | |
Applied Systems, Inc. | | | | | | | | |
2017 1st Lien Term Loan
5.33% (3 Month LIBOR + 3.00%), due 9/19/24 | | | 2,947,500 | | | | 2,920,790 | |
2017 2nd Lien Term Loan
9.33% (3 Month LIBOR + 7.00%), due 9/19/25 | | | 460,000 | | | | 464,485 | |
Blackhawk Network Holdings, Inc.
2018 1st Lien Term Loan
5.402% (1 Month LIBOR + 3.00%), due 6/15/25 | | | 990,000 | | | | 981,337 | |
| | | | | | | | |
| | | Principal
Amount | | | Value | |
Diversified/Conglomerate Service (continued) | |
BrightView Landscapes LLC | | | | | | | | |
2018 1st Lien Term Loan B
4.94% (1 Month LIBOR + 2.50%), due 8/15/25 | | $ | 963,359 | | | $ | 960,951 | |
2018 1st Lien Term Loan B
4.94% (1 Month LIBOR + 2.50%), due 8/15/25 | | | 1,156,122 | | | | 1,153,232 | |
Carbonite, Inc.
Term Loan B
6.152% (1 Month LIBOR + 3.75%), due 3/26/26 | | | 900,000 | | | | 900,750 | |
Change Healthcare Holdings, Inc.
2017 Term Loan B
5.152% (1 Month LIBOR + 2.75%), due 3/1/24 | | | 2,051,786 | | | | 2,033,547 | |
Cypress Intermediate Holdings III, Inc.
2017 1st Lien Term Loan
5.16% (1 Month LIBOR + 2.75%), due 4/26/24 | | | 1,960,000 | | | | 1,932,560 | |
Element Materials Technology Group US Holdings, Inc.
2017 USD Term Loan B
6.151% (3 Month LIBOR + 3.50%), due 6/28/24 | | | 987,469 | | | | 982,531 | |
First Data Corp.
2024 USD Term Loan
4.404% (1 Month LIBOR + 2.00%), due 4/26/24 | | | 5,000,000 | | | | 4,994,440 | |
Greeneden U.S. Holdings II LLC
2018 USD Term Loan B
5.652% (3 Month LIBOR + 3.25%), due 12/1/23 | | | 1,459,294 | | | | 1,440,444 | |
Information Resources, Inc.
2018 1st Lien Term Loan
7.022% (3 Month LIBOR + 4.50%), due 12/1/25 | | | 3,233,750 | | | | 3,220,275 | |
J.D. Power and Associates
2018 1st Lien Term Loan
6.152% (1 Month LIBOR + 3.75%), due 9/7/23 | | | 2,843,218 | | | | 2,829,002 | |
Kronos, Inc.
2017 Term Loan B
5.579% (3 Month LIBOR + 3.00%), due 11/1/23 | | | 4,037,959 | | | | 4,026,181 | |
Mitchell International, Inc.
2017 1st Lien Term Loan
5.652% (1 Month LIBOR + 3.25%), due 11/29/24 | | | 1,481,250 | | | | 1,409,965 | |
MKS Instruments, Inc.
2017 Term Loan B3
4.402% (1 Month LIBOR + 2.00%), due 5/1/23 | | | 791,500 | | | | 790,841 | |
| | | | |
| 16 | | MainStay VP Floating Rate Portfolio | | The notes to the financial statements are an integral part of,
and should be read in conjunction with, the financial statements. |
| | | | | | | | |
| | | Principal
Amount | | | Value | |
| Floating Rate Loans (continued) | |
Diversified/Conglomerate Service (continued) | |
Monitronics International, Inc.
Term Loan B2
10.00% (PRIME + 4.50%), due 9/30/22 (g) | | $ | 1,139,045 | | | $ | 1,082,093 | |
MX Holdings U.S., Inc.
2018 USD Term Loan B1C
5.402% (1 Month LIBOR + 3.00%), due 7/31/25 | | | 3,229,068 | | | | 3,216,959 | |
Prime Security Services Borrower LLC
2016 1st Lien Term Loan
5.152% (1 Month LIBOR + 2.75%), due 5/2/22 | | | 3,704,642 | | | | 3,677,698 | |
Sophia L.P.
2017 Term Loan B
5.58% (3 Month LIBOR + 3.25%), due 9/30/22 | | | 1,844,252 | | | | 1,839,066 | |
TruGreen, Ltd. Partnership
2019 Term Loan
6.161% (1 Month LIBOR + 3.75%), due 3/19/26 | | | 1,755,326 | | | | 1,757,520 | |
Verint Systems, Inc.
2018 Term Loan B
4.44% (1 Month LIBOR + 2.00%), due 6/28/24 | | | 2,450,000 | | | | 2,446,937 | |
Verscend Holding Corp.
2018 Term Loan B
6.902% (1 Month LIBOR + 4.50%), due 8/27/25 | | | 992,500 | | | | 991,880 | |
WEX, Inc.
Term Loan B3
4.652% (1 Month LIBOR + 2.25%), due 5/15/26 | | | 970,069 | | | | 966,026 | |
| | | | | | | | |
| | | | | | | 47,019,510 | |
| | | | | | | | |
Ecological 0.4% | |
Advanced Disposal Services, Inc.
Term Loan B3
4.635% (1 Week LIBOR + 2.25%), due 11/10/23 | | | 3,581,765 | | | | 3,574,802 | |
| | | | | | | | |
|
Electronics 12.8% | |
Almonde, Inc. | | | | | | | | |
1st Lien Term Loan
5.902% (1 Month LIBOR + 3.50%), due 6/13/24 | | | 3,734,185 | | | | 3,634,830 | |
2nd Lien Term Loan
9.652% (1 Month LIBOR + 7.25%), due 6/13/25 | | | 1,400,000 | | | | 1,385,300 | |
| | | | | | | | |
| | | Principal
Amount | | | Value | |
Electronics (continued) | |
ASG Technologies Group, Inc.
2018 Term Loan
5.902% (1 Month LIBOR + 3.50%), due 7/31/24 | | $ | 1,506,558 | | | $ | 1,482,076 | |
Banff Merger Sub Inc.
2018 USD Term Loan B
6.58% (3 Month LIBOR + 4.25%), due 10/2/25 | | | 4,943,160 | | | | 4,681,326 | |
Barracuda Networks, Inc.
1st Lien Term Loan
5.774% (3 Month LIBOR + 3.25%), due 2/12/25 | | | 1,983,741 | | | | 1,980,642 | |
Camelot UK Holdco, Ltd.
2017 Repriced Term Loan
5.652% (1 Month LIBOR + 3.25%), due 10/3/23 | | | 819,020 | | | | 820,043 | |
Cologix, Inc.
2017 1st Lien Term Loan
5.403% (1 Month LIBOR + 3.00%), due 3/20/24 | | | 1,945,126 | | | | 1,858,407 | |
Colorado Buyer, Inc. | | | | | | | | |
Term Loan B
5.42% (1 Month LIBOR + 3.00%), due 5/1/24 | | | 980,000 | | | | 908,337 | |
2nd Lien Term Loan
9.67% (1 Month LIBOR + 7.25%), due 5/1/25 | | | 800,000 | | | | 692,000 | |
CommScope, Inc.
2019 Term Loan B
5.652% (1 Month LIBOR + 3.25%), due 4/6/26 | | | 4,812,500 | | | | 4,800,469 | |
Compuware Corp.
2018 Term Loan B
6.402% (1 Month LIBOR + 4.00%), due 8/22/25 | | | 698,999 | | | | 698,417 | |
Cortes NP Acquisition Corp.
2017 Term Loan B
6.33% (3 Month LIBOR + 4.00%), due 11/30/23 | | | 1,079,783 | | | | 1,023,769 | |
Dell International LLC
2017 Term Loan B
4.41% (1 Month LIBOR + 2.00%), due 9/7/23 | | | 4,421,386 | | | | 4,395,596 | |
Diebold, Inc.
2017 Term Loan B
5.188% (1 Month LIBOR + 2.75%), due 11/6/23 | | | 1,206,603 | | | | 1,122,141 | |
DigiCert, Inc.
2017 Term Loan B1
6.402% (1 Month LIBOR + 4.00%), due 10/31/24 | | | 2,481,250 | | | | 2,470,084 | |
| | | | | | |
The notes to the financial statements are an integral part of,
and should be read in conjunction with, the financial statements. | | | | | 17 | |
Portfolio of InvestmentsJune 30, 2019 (Unaudited) (continued)
| | | | | | | | |
| | | Principal
Amount | | | Value | |
| Floating Rate Loans (continued) | |
Electronics (continued) | |
Dynatrace LLC
2018 1st Lien Term Loan
5.402% (1 Month LIBOR + 3.00%), due 8/22/25 | | $ | 733,125 | | | $ | 730,742 | |
EIG Investors Corp.
2018 1st Lien Term Loan
6.271% (3 Month LIBOR + 3.75%), due 2/9/23 | | | 4,022,049 | | | | 3,987,692 | |
Epicor Software Corp.
1st Lien Term Loan
5.66% (1 Month LIBOR + 3.25%), due 6/1/22 | | | 6,146,626 | | | | 6,099,247 | |
Exact Merger Sub LLC
1st Lien Term Loan
6.58% (3 Month LIBOR + 4.25%), due 9/27/24 | | | 2,219,953 | | | | 2,211,628 | |
Financial & Risk US Holdings, Inc.
2018 USD Term Loan
6.152% (1 Month LIBOR + 3.75%), due 10/1/25 | | | 4,479,994 | | | | 4,340,796 | |
Flexential Intermediate Corp.
2017 1st Lien Term Loan
5.83% (3 Month LIBOR + 3.50%), due 8/1/24 | | | 1,179,000 | | | | 1,076,820 | |
Flexera Software LLC
2018 1st Lien Term Loan
5.91% (1 Month LIBOR + 3.50%), due 2/26/25 | | | 2,439,324 | | | | 2,428,145 | |
GTCR Valor Cos., Inc.
2017 Term Loan B1
5.08% (3 Month LIBOR + 2.75%), due 6/16/23 | | | 1,765,621 | | | | 1,750,908 | |
Hyland Software, Inc. | | | | | | | | |
2018 Term Loan 3
5.652% (1 Month LIBOR + 3.25%), due 7/1/24 | | | 4,648,923 | | | | 4,622,191 | |
2017 2nd Lien Term Loan
9.402% (1 Month LIBOR + 7.00%), due 7/7/25 | | | 208,333 | | | | 208,854 | |
Infor (U.S.), Inc.
Term Loan B6
5.08% (3 Month LIBOR + 2.75%), due 2/1/22 | | | 2,689,199 | | | | 2,677,434 | |
Informatica Corp.
2018 Term Loan
5.652% (1 Month LIBOR + 3.25%), due 8/5/22 | | | 1,469,663 | | | | 1,470,030 | |
MA FinanceCo. LLC
Term Loan B3
4.902% (1 Month LIBOR + 2.50%), due 6/21/24 | | | 352,345 | | | | 344,857 | |
| | | | | | | | |
| | | Principal
Amount | | | Value | |
Electronics (continued) | |
McAfee LLC | | | | | | | | |
2018 USD Term Loan B
6.152% (1 Month LIBOR + 3.75%), due 9/30/24 | | $ | 5,643,385 | | | $ | 5,631,038 | |
2017 2nd Lien Term Loan
10.902% (1 Month LIBOR + 8.50%), due 9/29/25 | | | 1,312,500 | | | | 1,325,625 | |
MH Sub I LLC
2017 1st Lien Term Loan
6.152% (1 Month LIBOR + 3.75%), due 9/13/24 | | | 4,094,981 | | | | 4,020,760 | |
Project Alpha Intermediate Holding, Inc. | | | | | | | | |
2017 Term Loan B
6.37% (6 Month LIBOR + 3.50%), due 4/26/24 | | | 1,960,000 | | | | 1,912,225 | |
2019 Incremental Term Loan B
6.78% (3 Month LIBOR + 4.25%), due 4/26/24 | | | 600,000 | | | | 595,500 | |
Project Leopard Holdings, Inc. | | | | | | | | |
2019 Term Loan
6.45% (1 Month LIBOR + 4.25%), due 7/7/23 | | | 497,500 | | | | 495,945 | |
2018 Term Loan
6.70% (6 Month LIBOR + 4.50%), due 7/7/23 | | | 604,516 | | | | 603,005 | |
Rocket Software, Inc.
2018 Term Loan
6.652% (1 Month LIBOR + 4.25%), due 11/28/25 | | | 897,750 | | | | 876,990 | |
RP Crown Parent LLC
2016 Term Loan B
5.152% (1 Month LIBOR + 2.75%), due 10/12/23 | | | 2,340,000 | | | | 2,324,399 | |
Seattle Spinco, Inc.
Term Loan B3
4.902% (1 Month LIBOR + 2.50%), due 6/21/24 | | | 2,379,469 | | | | 2,328,906 | |
Sirius Computer Solutions, Inc.
2016 Term Loan
6.652% (1 Month LIBOR + 4.25%), due 10/30/22 (f) | | | 585,244 | | | | 587,439 | |
Solera LLC
Term Loan B
5.152% (1 Month LIBOR + 2.75%), due 3/3/23 | | | 2,685,654 | | | | 2,667,375 | |
SonicWALL, Inc.
1st Lien Term Loan
6.02% (3 Month LIBOR + 3.50%), due 5/16/25 | | | 398,000 | | | | 370,637 | |
| | | | |
| 18 | | MainStay VP Floating Rate Portfolio | | The notes to the financial statements are an integral part of,
and should be read in conjunction with, the financial statements. |
| | | | | | | | |
| | | Principal
Amount | | | Value | |
| Floating Rate Loans (continued) | |
Electronics (continued) | |
SS&C Technologies, Inc. | | | | | | | | |
2018 Term Loan B3
4.652% (1 Month LIBOR + 2.25%), due 4/16/25 | | $ | 2,883,923 | | | $ | 2,870,706 | |
2018 Term Loan B5
4.652% (1 Month LIBOR + 2.25%), due 4/16/25 | | | 1,984,808 | | | | 1,975,987 | |
Tempo Acquisition LLC
Term Loan
5.402% (1 Month LIBOR + 3.00%), due 5/1/24 | | | 4,427,455 | | | | 4,405,318 | |
Tibco Software, Inc.
Repriced Term Loan B
5.91% (1 Month LIBOR + 3.50%), due 12/4/20 | | | 2,606,119 | | | | 2,603,948 | |
Ultimate Software Group, Inc.
Term Loan B
6.08% (3 Month LIBOR + 3.75%), due 5/4/26 | | | 1,750,000 | | | | 1,751,750 | |
Veritas Bermuda, Ltd. | | | | | | | | |
Repriced Term Loan B
6.83% (1 Month LIBOR + 4.50%), due 1/27/23 | | | 367,428 | | | | 332,522 | |
Repriced Term Loan B
6.90% (1 Month LIBOR + 4.50%), due 1/27/23 | | | 1,851,120 | | | | 1,675,264 | |
Vertafore, Inc.
2018 1st Lien Term Loan
5.652% (1 Month LIBOR + 3.25%), due 7/2/25 | | | 398,000 | | | | 381,867 | |
Web.com Group, Inc. | | | | | | | | |
2018 Term Loan B
6.161% (1 Month LIBOR + 3.75%), due 10/10/25 | | | 1,453,881 | | | | 1,435,708 | |
2018 2nd Lien Term Loan
10.161% (1 Month LIBOR + 7.75%), due 10/9/26 | | | 969,724 | | | | 951,137 | |
Western Digital Corp.
2018 Term Loan B4
4.152% (1 Month LIBOR + 1.75%), due 4/29/23 | | | 1,777,978 | | | | 1,737,085 | |
Xerox Business Services LLC
Term Loan B
4.902% (1 Month LIBOR + 2.50%), due 12/7/23 | | | 1,464,875 | | | | 1,429,718 | |
Zebra Technologies Corp.
2018 Term Loan B
4.181% (1 Month LIBOR + 1.75%), due 10/27/21 | | | 735,120 | | | | 735,732 | |
| | | | | | | | |
| | | | | | | 109,929,367 | |
| | | | | | | | |
| | | | | | | | |
| | | Principal
Amount | | | Value | |
Finance 1.4% | |
Alliant Holdings I, Inc.
2018 Term Loan B
5.404% (1 Month LIBOR + 3.00%), due 5/9/25 | | $ | 1,797,220 | | | $ | 1,743,865 | |
Brand Energy & Infrastructure Services, Inc.
2017 Term Loan
6.788% (2 Month LIBOR + 4.25%), due 6/21/24 | | | 3,204,584 | | | | 3,102,838 | |
Deerfield Dakota Holding, LLC
2018 Term Loan B
5.652% (1 Month LIBOR + 3.25%), due 2/13/25 | | | 3,908,854 | | | | 3,789,146 | |
iStar, Inc. | | | | | | | | |
2016 Term Loan B
5.13% (1 Month LIBOR + 2.75%), due 6/28/23 | | | 416,651 | | | | 415,609 | |
2016 Term Loan B
5.17% (1 Month LIBOR + 2.75%), due 6/28/23 | | | 408,318 | | | | 407,297 | |
Transplace Holdings, Inc.
1st Lien Term Loan
6.154% (1 Month LIBOR + 3.75%), due 10/7/24 | | | 1,182,038 | | | | 1,176,127 | |
USS Ultimate Holdings, Inc. | | | | | | | | |
1st Lien Term Loan
5.95% (6 Month LIBOR + 3.75%), due 8/25/24 | | | 1,568,000 | | | | 1,562,512 | |
1st Lien Term Loan
6.08% (3 Month LIBOR + 3.75%), due 8/25/24 | | | 4,000 | | | | 3,986 | |
| | | | | | | | |
| | | | | | | 12,201,380 | |
| | | | | | | | |
Healthcare, Education & Childcare 7.3% | |
Acadia Healthcare Company, Inc.
2018 Term Loan B4
4.902% (1 Month LIBOR + 2.50%), due 2/16/23 | | | 739,819 | | | | 735,565 | |
Agiliti Health, Inc.
Term Loan
5.50% (1 Month LIBOR + 3.00%), due 1/4/26 | | | 900,000 | | | | 898,875 | |
AHP Health Partners, Inc.
2018 Term Loan
6.902% (1 Month LIBOR + 4.50%), due 6/30/25 | | | 1,320,000 | | | | 1,317,250 | |
Akorn, Inc.
Term Loan B
9.438% (1 Month LIBOR + 7.00%), due 4/16/21 | | | 172,516 | | | | 161,302 | |
Alliance Healthcare Services, Inc.
2017 Term Loan B
6.902% (1 Month LIBOR + 4.50%), due 10/24/23 (e) | | | 866,250 | | | | 827,269 | |
| | | | | | |
The notes to the financial statements are an integral part of,
and should be read in conjunction with, the financial statements. | | | | | 19 | |
Portfolio of InvestmentsJune 30, 2019 (Unaudited) (continued)
| | | | | | | | |
| | | Principal
Amount | | | Value | |
| Floating Rate Loans (continued) | |
Healthcare, Education & Childcare (continued) | |
Alvogen Pharma US, Inc.
2018 Term Loan B
7.15% (1 Month LIBOR + 4.75%), due 4/2/22 | | $ | 2,845,256 | | | $ | 2,606,966 | |
Amneal Pharmaceuticals LLC
2018 Term Loan B
5.938% (1 Month LIBOR + 3.50%), due 5/4/25 | | | 2,226,980 | | | | 2,209,349 | |
Athenahealth, Inc.
2019 Term Loan B
7.045% (3 Month LIBOR + 4.50%), due 2/11/26 | | | 997,500 | | | | 995,006 | |
Avantor, Inc.
2017 1st Lien Term Loan
5.402% (1 Month LIBOR + 3.00%), due 11/21/24 | | | 819,771 | | | | 820,283 | |
Carestream Dental Equipment, Inc.
2017 1st Lien Term Loan
5.652% (1 Month LIBOR + 3.25%), due 9/1/24 | | | 982,500 | | | | 964,488 | |
Carestream Health, Inc. (f) | | | | | | | | |
1st Lien Term Loan
8.152% (1 Month LIBOR + 5.75%), due 2/28/21 | | | 2,348,325 | | | | 2,266,133 | |
2nd Lien Term Loan
11.902% (1 Month LIBOR + 9.50%), due 6/7/21 (e) | | | 1,347,599 | | | | 1,273,481 | |
Concentra, Inc.
2018 1st Lien Term Loan
5.21% (3 Month LIBOR + 2.75%), due 6/1/22 | | | 3,323,907 | | | | 3,319,752 | |
DaVita, Inc.
Term Loan B
5.135% (1 Week LIBOR + 2.75%), due 6/24/21 | | | 2,744,593 | | | | 2,740,306 | |
Envision Healthcare Corp.
2018 1st Lien Term Loan
6.152% (1 Month LIBOR + 3.75%), due 10/10/25 | | | 1,865,625 | | | | 1,614,543 | |
Equian LLC
Add on Term Loan B
5.652% (1 Month LIBOR + 3.25%), due 5/20/24 | | | 3,296,546 | | | | 3,292,425 | |
ExamWorks Group, Inc.
2017 Term Loan
5.652% (1 Month LIBOR + 3.25%), due 7/27/23 | | | 2,936,855 | | | | 2,933,184 | |
Explorer Holdings, Inc.
2016 Term Loan B
6.08% (3 Month LIBOR + 3.75%), due 5/2/23 | | | 1,028,788 | | | | 1,024,501 | |
| | | | | | | | |
| | | Principal
Amount | | | Value | |
Healthcare, Education & Childcare (continued) | |
Gentiva Health Services, Inc.
2018 1st Lien Term Loan
6.188% (1 Month LIBOR + 3.75%), due 7/2/25 | | $ | 1,293,394 | | | $ | 1,293,394 | |
HCA, Inc.
2018 Term Loan B10
4.33% (3 Month LIBOR + 2.00%), due 3/13/25 | | | 2,493,687 | | | | 2,494,727 | |
Jaguar Holding Co. II
2018 Term Loan
4.902% (1 Month LIBOR + 2.50%), due 8/18/22 | | | 4,673,594 | | | | 4,644,384 | |
Kinetic Concepts, Inc.
2017 Term Loan B
5.58% (3 Month LIBOR + 3.25%), due 2/2/24 | | | 3,920,000 | | | | 3,920,000 | |
Ortho-Clinical Diagnostics S.A.
2018 Term Loan B
5.68% (1 Month LIBOR + 3.25%), due 6/30/25 | | | 2,947,518 | | | | 2,830,847 | |
Parexel International Corp.
Term Loan B
5.152% (1 Month LIBOR + 2.75%), due 9/27/24 | | | 1,634,629 | | | | 1,563,624 | |
RegionalCare Hospital Partners Holdings, Inc.
2018 Term Loan B
6.904% (1 Month LIBOR + 4.50%), due 11/17/25 | | | 2,157,080 | | | | 2,144,138 | |
RPI Finance Trust
Term Loan B6
4.402% (1 Month LIBOR + 2.00%), due 3/27/23 | | | 3,870,228 | | | | 3,872,303 | |
Select Medical Corp.
2017 Term Loan B
4.85% (3 Month LIBOR + 2.50%), due 3/6/25 | | | 3,135,875 | | | | 3,124,115 | |
Sound Inpatient Physicians
2018 1st Lien Term Loan
5.152% (1 Month LIBOR + 2.75%), due 6/27/25 | | | 495,000 | | | | 494,072 | |
Team Health Holdings, Inc.
1st Lien Term Loan
5.152% (1 Month LIBOR + 2.75%), due 2/6/24 | | | 3,902,613 | | | | 3,414,787 | |
U.S. Anesthesia Partners, Inc.
2017 Term Loan
5.402% (1 Month LIBOR + 3.00%), due 6/23/24 | | | 2,848,946 | | | | 2,797,309 | |
| | | | | | | | |
| | | | | | | 62,594,378 | |
| | | | | | | | |
| | | | |
| 20 | | MainStay VP Floating Rate Portfolio | | The notes to the financial statements are an integral part of,
and should be read in conjunction with, the financial statements. |
| | | | | | | | |
| | | Principal
Amount | | | Value | |
| Floating Rate Loans (continued) | |
Home and Office Furnishings, Housewares & Durable Consumer Products 0.5% | |
Comfort Holding LLC
1st Lien Term Loan
7.152% (1 Month LIBOR + 4.75%), due 2/5/24 | | $ | 1,173,000 | | | $ | 1,170,801 | |
Resideo Funding, Inc.
Term Loan B
4.33% (3 Month LIBOR + 2.00%), due 10/24/25 | | | 895,500 | | | | 894,007 | |
Serta Simmons Bedding LLC | | | | | | | | |
1st Lien Term Loan
5.89% (1 Month LIBOR + 3.50%), due 11/8/23 | | | 762,257 | | | | 485,939 | |
1st Lien Term Loan
5.91% (1 Month LIBOR + 3.50%), due 11/8/23 | | | 2,696,134 | | | | 1,718,785 | |
| | | | | | | | |
| | | | | | | 4,269,532 | |
| | | | | | | | |
Hotels, Motels, Inns & Gaming 5.1% | |
Affinity Gaming LLC
Initial Term Loan
5.652% (1 Month LIBOR + 3.25%), due 7/1/23 | | | 2,489,737 | | | | 2,390,147 | |
AP Gaming I LLC
2018 Incremental Term Loan
5.902% (1 Month LIBOR + 3.50%), due 2/15/24 | | | 1,862,913 | | | | 1,860,003 | |
Caesars Entertainment Operating Co.
Exit Term Loan
4.402% (1 Month LIBOR + 2.00%), due 10/6/24 | | | 1,641,667 | | | | 1,629,765 | |
Caesars Resort Collection LLC
2017 1st Lien Term Loan B
5.152% (1 Month LIBOR + 2.75%), due 12/22/24 | | | 3,940,000 | | | | 3,863,312 | |
Churchill Downs, Inc.
2017 Term Loan B
4.41% (1 Month LIBOR + 2.00%), due 12/27/24 | | | 1,977,443 | | | | 1,974,972 | |
CityCenter Holdings LLC
2017 Term Loan B
4.652% (1 Month LIBOR + 2.25%), due 4/18/24 | | | 2,842,000 | | | | 2,830,834 | |
Everi Payments, Inc.
Term Loan B
5.402% (1 Month LIBOR + 3.00%), due 5/9/24 | | | 3,174,085 | | | | 3,168,793 | |
Golden Entertainment, Inc.
2017 1st Lien Term Loan
5.41% (1 Month LIBOR + 3.00%), due 10/21/24 | | | 1,000,000 | | | | 995,000 | |
| | | | | | | | |
| | | Principal
Amount | | | Value | |
Hotels, Motels, Inns & Gaming (continued) | |
Hilton Worldwide Finance LLC
2019 Term Loan B2
4.154% (1 Month LIBOR + 1.75%), due 6/22/26 | | $ | 2,235,804 | | | $ | 2,235,804 | |
MGM Growth Properties Operating Partnership, L.P.
2016 Term Loan B
4.402% (1 Month LIBOR + 2.00%), due 4/25/23 | | | 2,995,104 | | | | 2,975,315 | |
PCI Gaming Authority
Term Loan
5.402% (1 Month LIBOR + 3.00%), due 5/29/26 | | | 750,000 | | | | 750,469 | |
Penn National Gaming, Inc.
2018 1st Lien Term Loan B
4.652% (1 Month LIBOR + 2.25%), due 10/15/25 | | | 331,667 | | | | 330,174 | |
Scientific Games International, Inc. | | | | | | | | |
2018 Term Loan B5
5.15% (2 Month LIBOR + 2.75%), due 8/14/24 | | | 1,237,782 | | | | 1,218,332 | |
2018 Term Loan B5
5.23% (2 Month LIBOR + 2.75%), due 8/14/24 | | | 5,140,484 | | | | 5,059,707 | |
Station Casinos LLC
2016 Term Loan B
4.91% (1 Month LIBOR + 2.50%), due 6/8/23 | | | 3,142,849 | | | | 3,124,187 | |
UFC Holdings LLC
2019 Term Loan
5.66% (1 Month LIBOR + 3.25%), due 4/29/26 | | | 3,591,944 | | | | 3,585,529 | |
Wyndham Destinations, Inc.
2018 1st Lien Term Loan
4.652% (1 Month LIBOR + 2.25%), due 5/30/25 | | | 992,500 | | | | 988,778 | |
Wyndham Hotels & Resorts, Inc.
Term Loan B
4.152% (1 Month LIBOR + 1.75%), due 5/30/25 | | | 1,488,750 | | | | 1,484,330 | |
Wynn Resorts, Ltd.
Term Loan B
4.69% (1 Month LIBOR + 2.25%), due 10/30/24 | | | 3,491,250 | | | | 3,458,519 | |
| | | | | | | | |
| | | | | | | 43,923,970 | |
| | | | | | | | |
Insurance 3.2% | |
Acrisure LLC
2017 Term Loan B
6.772% (3 Month LIBOR + 4.25%), due 11/22/23 | | | 997,462 | | | | 991,228 | |
| | | | | | |
The notes to the financial statements are an integral part of,
and should be read in conjunction with, the financial statements. | | | | | 21 | |
Portfolio of InvestmentsJune 30, 2019 (Unaudited) (continued)
| | | | | | | | |
| | | Principal
Amount | | | Value | |
| Floating Rate Loans (continued) | |
Insurance (continued) | |
AmWINS Group, Inc. | | | | | | | | |
2017 Term Loan B
5.15% (1 Month LIBOR + 2.75%), due 1/25/24 | | $ | 1,879,637 | | | $ | 1,862,929 | |
2017 Term Loan B
5.17% (1 Month LIBOR + 2.75%), due 1/25/24 | | | 557,863 | | | | 552,904 | |
AssuredPartners, Inc.
2017 1st Lien Add-On Term Loan
5.902% (1 Month LIBOR + 3.50%), due 10/22/24 | | | 2,243,131 | | | | 2,217,896 | |
Asurion LLC | | | | | | | | |
2017 Term Loan B4
5.402% (1 Month LIBOR + 3.00%), due 8/4/22 | | | 3,689,249 | | | | 3,679,104 | |
2018 Term Loan B6
5.402% (1 Month LIBOR + 3.00%), due 11/3/23 | | | 2,651,777 | | | | 2,645,147 | |
2018 Term Loan B7
5.402% (1 Month LIBOR + 3.00%), due 11/3/24 | | | 464,062 | | | | 462,902 | |
2017 2nd Lien Term Loan
8.902% (1 Month LIBOR + 6.50%), due 8/4/25 | | | 1,466,667 | | | | 1,485,612 | |
Hub International, Ltd.
2018 Term Loan B
5.586% (3 Month LIBOR + 3.00%), due 4/25/25 | | | 2,445,882 | | | | 2,382,825 | |
IAA Spinco, Inc.
Term Loan B
TBD, due 5/22/26 | | | 2,500,000 | | | | 2,506,250 | |
MPH Acquisition Holdings LLC
2016 Term Loan B
5.08% (3 Month LIBOR + 2.75%), due 6/7/23 | | | 1,842,940 | | | | 1,759,239 | |
NFP Corp.
Term Loan B
5.402% (1 Month LIBOR + 3.00%), due 1/8/24 | | | 1,467,400 | | | | 1,423,640 | |
Sedgwick Claims Management Services, Inc.
2018 Term Loan B
5.652% (1 Month LIBOR + 3.25%), due 12/31/25 | | | 2,985,000 | | | | 2,941,718 | |
USI, Inc.
2017 Repriced Term Loan
5.33% (3 Month LIBOR + 3.00%), due 5/16/24 | | | 2,947,500 | | | | 2,870,865 | |
| | | | | | | | |
| | | | | | | 27,782,259 | |
| | | | | | | | |
| | | | | | | | |
| | | Principal
Amount | | | Value | |
Leisure, Amusement, Motion Pictures & Entertainment 2.5% | |
Alterra Mountain Co.
Term Loan B1
5.402% (1 Month LIBOR + 3.00%), due 7/31/24 | | $ | 3,477,311 | | | $ | 3,457,751 | |
Boyd Gaming Corp.
Term Loan B3
4.622% (1 Week LIBOR + 2.25%), due 9/15/23 | | | 2,016,093 | | | | 2,004,249 | |
Creative Artists Agency LLC
2018 Term Loan B
5.404% (3 Month LIBOR + 3.00%), due 2/15/24 | | | 1,912,059 | | | | 1,904,411 | |
Fitness International LLC | | | | | | | | |
2018 Term Loan A
5.152% (1 Month LIBOR + 2.75%), due 4/18/23 | | | 1,274,706 | | | | 1,264,349 | |
2018 Term Loan B
5.652% (1 Month LIBOR + 3.25%), due 4/18/25 | | | 532,324 | | | | 527,999 | |
Life Time Fitness, Inc.
2017 Term Loan B
5.272% (3 Month LIBOR + 2.75%), due 6/10/22 | | | 2,798,958 | | | | 2,785,464 | |
Lions Gate Capital Holdings LLC
2018 Term Loan B
4.652% (1 Month LIBOR + 2.25%), due 3/24/25 | | | 662,625 | | | | 658,069 | |
Marriott Ownership Resorts, Inc.
2018 Term Loan B
4.652% (1 Month LIBOR + 2.25%), due 8/29/25 | | | 2,686,500 | | | | 2,684,262 | |
TKC Holdings, Inc.
2017 1st Lien Term Loan
6.16% (1 Month LIBOR + 3.75%), due 2/1/23 | | | 2,037,589 | | | | 1,990,046 | |
Travel Leaders Group LLC
2018 Term Loan B
6.383% (1 Month LIBOR + 4.00%), due 1/25/24 | | | 1,683,000 | | | | 1,683,000 | |
William Morris Endeavor Entertainment LLC
2018 1st Lien Term Loan
5.16% (1 Month LIBOR + 2.75%), due 5/18/25 | | | 2,688,730 | | | | 2,594,625 | |
| | | | | | | | |
| | | | | | | 21,554,225 | |
| | | | | | | | |
Machinery (Non-Agriculture, Non-Construct & Non-Electronic) 1.3% | |
Altra Industrial Motion Corp.
2018 Term Loan B
4.402% (1 Month LIBOR + 2.00%), due 10/1/25 | | | 3,368,002 | | | | 3,302,747 | |
| | | | |
| 22 | | MainStay VP Floating Rate Portfolio | | The notes to the financial statements are an integral part of,
and should be read in conjunction with, the financial statements. |
| | | | | | | | |
| | | Principal
Amount | | | Value | |
| Floating Rate Loans (continued) | |
Machinery (Non-Agriculture, Non-Construct & Non-Electronic) (continued) | |
Columbus McKinnon Corp.
2018 Term Loan B
4.83% (3 Month LIBOR + 2.50%), due 1/31/24 | | $ | 1,032,309 | | | $ | 1,029,729 | |
CPM Holdings, Inc. | | | | | | | | |
2018 1st Lien Term Loan
6.152% (1 Month LIBOR + 3.75%), due 11/15/25 | | | 1,492,500 | | | | 1,472,600 | |
2018 2nd Lien Term Loan
10.652% (1 Month LIBOR + 8.25%), due 11/15/26 (e) | | | 1,000,000 | | | | 980,000 | |
Rexnord LLC
2017 Term Loan B
4.402% (1 Month LIBOR + 2.00%), due 8/21/24 | | | 1,192,155 | | | | 1,190,293 | |
Terex Corp.
2019 Term Loan B1
5.095% (2 Month LIBOR + 2.75%), due 1/31/24 | | | 748,125 | | | | 747,377 | |
Welbilt, Inc.
2018 Term Loan B
4.902% (1 Month LIBOR + 2.50%), due 10/23/25 | | | 2,284,178 | | | | 2,249,916 | |
| | | | | | | | |
| | | | | | | 10,972,662 | |
| | | | | | | | |
Manufacturing 0.3% | |
EWT Holdings III Corp.
2017 Repriced Term Loan
5.402% (1 Month LIBOR + 3.00%), due 12/20/24 | | | 2,241,133 | | | | 2,229,927 | |
| | | | | | | | |
|
Mining, Steel, Iron & Non-Precious Metals 1.5% | |
American Rock Salt Co. LLC
2018 1st Lien Term Loan
6.152% (1 Month LIBOR + 3.75%), due 3/21/25 | | | 1,647,117 | | | | 1,645,058 | |
Covia Holdings Corp.
Term Loan
6.598% (3 Month LIBOR + 3.75%), due 6/1/25 | | | 1,414,286 | | | | 1,137,322 | |
Gates Global LLC
2017 USD Repriced Term Loan B
5.152% (1 Month LIBOR + 2.75%), due 4/1/24 | | | 2,418,979 | | | | 2,402,515 | |
GrafTech Finance, Inc.
2018 Term Loan B
5.902% (1 Month LIBOR + 3.50%), due 2/12/25 | | | 2,758,333 | | | | 2,704,891 | |
| | | | | | | | |
| | | Principal
Amount | | | Value | |
Mining, Steel, Iron & Non-Precious Metals (continued) | |
HFOTCO LLC
2018 Term Loan B
5.16% (1 Month LIBOR + 2.75%), due 6/26/25 | | $ | 792,000 | | | $ | 788,040 | |
Keane Group Holdings LLC
2018 1st Lien Term Loan
6.188% (1 Month LIBOR + 3.75%), due 5/25/25 | | | 990,000 | | | | 980,100 | |
MRC Global (US) Inc.
2018 1st Lien Term Loan B
5.402% (1 Month LIBOR + 3.00%), due 9/20/24 | | | 1,477,500 | | | | 1,470,112 | |
U.S. Silica Co.
2018 Term Loan B
6.438% (1 Month LIBOR + 4.00%), due 5/1/25 | | | 1,481,250 | | | | 1,385,763 | |
| | | | | | | | |
| | | | | | | 12,513,801 | |
| | | | | | | | |
Oil & Gas 1.8% | |
Apergy Corp.
2018 1st Lien Term Loan
4.938% (1 Month LIBOR + 2.50%), due 5/9/25 | | | 462,651 | | | | 460,723 | |
Edgewater Generation LLC
Term Loan
6.152% (1 Month LIBOR + 3.75%), due 12/13/25 | | | 3,987,494 | | | | 3,976,528 | |
GIP III Stetson I, L.P.
2018 Term Loan B
6.633% (1 Month LIBOR + 4.25%), due 7/18/25 | | | 1,705,139 | | | | 1,700,450 | |
HGIM Corp.
2018 Exit Term Loan
8.743% (3 Month LIBOR + 6.00%), due 7/2/23 | | | 110,172 | | | | 104,847 | |
Lucid Energy Group II LLC
2018 1st Lien Term Loan
5.402% (1 Month LIBOR + 3.00%), due 2/17/25 | | | 1,382,500 | | | | 1,316,831 | |
McDermott Technology Americas, Inc.
2018 1st Lien Term Loan
7.402% (1 Month LIBOR + 5.00%), due 5/9/25 | | | 1,476,263 | | | | 1,450,121 | |
Medallion Midland Acquisition LLC
1st Lien Term Loan
5.652% (1 Month LIBOR + 3.25%), due 10/30/24 | | | 591,000 | | | | 573,454 | |
PES Holdings LLC | | | | | | | | |
2018 Term Loan C
6.99% (PIK + 3.00%), due 12/31/22 (c) | | | 1,046,797 | | | | 690,886 | |
2018 Term Loan A
8.58% (3 Month LIBOR + 6.25%), due 12/31/22 (e) | | | 733,559 | | | | 704,217 | |
| | | | | | |
The notes to the financial statements are an integral part of,
and should be read in conjunction with, the financial statements. | | | | | 23 | |
Portfolio of InvestmentsJune 30, 2019 (Unaudited) (continued)
| | | | | | | | |
| | | Principal
Amount | | | Value | |
| Floating Rate Loans (continued) | |
Oil & Gas (continued) | |
Prairie ECI Acquiror L.P.
Term Loan B
7.08% (3 Month LIBOR + 4.75%), due 3/11/26 | | $ | 1,246,875 | | | $ | 1,246,875 | |
Seadrill Partners Finco LLC
Term Loan B
8.33% (3 Month LIBOR + 6.00%), due 2/21/21 (f) | | | 1,883,018 | | | | 1,341,650 | |
Summit Midstream Partners Holdings LLC
Term Loan B
8.402% (1 Month LIBOR + 6.00%), due 5/13/22 | | | 632,792 | | | | 622,246 | |
Traverse Midstream Partners LLC
2017 Term Loan
6.59% (3 Month LIBOR + 4.00%), due 9/27/24 | | | 1,323,333 | | | | 1,305,138 | |
| | | | | | | | |
| | | | | | | 15,493,966 | |
| | | | | | | | |
Personal & Nondurable Consumer Products (Manufacturing Only) 1.1% | |
American Builders & Contractors Supply Co., Inc.
2018 Term Loan B
4.402% (1 Month LIBOR + 2.00%), due 10/31/23 | | | 2,104,069 | | | | 2,071,851 | |
Prestige Brands, Inc.
Term Loan B4
4.402% (1 Month LIBOR + 2.00%), due 1/26/24 | | | 542,879 | | | | 539,487 | |
Revlon Consumer Products Corp.
2016 Term Loan B
6.022% (3 Month LIBOR + 3.50%), due 9/7/23 | | | 2,512,292 | | | | 2,096,716 | |
SRAM LLC | | | | | | | | |
2018 Term Loan B
5.10% (2 Month LIBOR + 2.75%), due 3/15/24 | | | 1,371,092 | | | | 1,367,664 | |
2018 Term Loan B
5.23% (2 Month LIBOR + 2.75%), due 3/15/24 | | | 1,319,768 | | | | 1,316,469 | |
2018 Term Loan B
7.25% (PRIME + 1.75%), due 3/15/24 | | | 95,317 | | | | 95,078 | |
Varsity Brands, Inc.
2017 Term Loan B
5.902% (1 Month LIBOR + 3.50%), due 12/15/24 | | | 1,970,020 | | | | 1,927,664 | |
| | | | | | | | |
| | | | | | | 9,414,929 | |
| | | | | | | | |
Personal Transportation 0.2% | |
Uber Technologies
2018 Incremental Term Loan
5.904% (1 Month LIBOR + 3.50%), due 7/13/23 | | | 2,083,451 | | | | 2,079,544 | |
| | | | | | | | |
| | | | | | | | |
| | | Principal
Amount | | | Value | |
Personal, Food & Miscellaneous Services 1.7% | |
Aramark Services, Inc.
2018 Term Loan B3
4.08% (3 Month LIBOR + 1.75%), due 3/11/25 | | $ | 3,932,663 | | | $ | 3,917,097 | |
Golden Nugget, Inc. | | | | | | | | |
2017 Incremental Term Loan
5.14% (1 Month LIBOR + 2.75%), due 10/4/23 | | | 1,327,744 | | | | 1,315,712 | |
2017 Incremental Term Loan
5.15% (1 Month LIBOR + 2.75%), due 10/4/23 | | | 1,656,188 | | | | 1,641,180 | |
IRB Holding Corp.
1st Lien Term Loan
5.644% (1 Month LIBOR + 3.25%), due 2/5/25 | | | 2,478,725 | | | | 2,448,256 | |
KFC Holding Co.
2018 Term Loan B
4.132% (1 Month LIBOR + 1.75%), due 4/3/25 | | | 2,918,211 | | | | 2,907,722 | |
Weight Watchers International, Inc.
2017 Term Loan B
7.35% (3 Month LIBOR + 4.75%), due 11/29/24 | | | 2,650,135 | | | | 2,599,340 | |
| | | | | | | | |
| | | | | | | 14,829,307 | |
| | | | | | | | |
Printing & Publishing 1.1% | |
Getty Images, Inc.
2019 1st Lien Term Loan
6.938% (1 Month LIBOR + 4.50%), due 2/19/26 | | | 3,527,727 | | | | 3,507,884 | |
McGraw-Hill Global Education Holdings LLC
2016 Term Loan B
6.402% (1 Month LIBOR + 4.00%), due 5/4/22 | | | 2,164,080 | | | | 2,060,836 | |
Prometric Holdings, Inc.
1st Lien Term Loan
5.41% (1 Month LIBOR + 3.00%), due 1/29/25 | | | 1,508,451 | | | | 1,493,366 | |
Severin Acquisition, LLC
2018 Term Loan B
5.815% (3 Month LIBOR + 3.25%), due 8/1/25 | | | 1,990,000 | | | | 1,963,259 | |
Shutterfly, Inc.
Term Loan B2
4.91% (1 Month LIBOR + 2.50%), due 8/17/24 | | | 673,941 | | | | 673,380 | |
| | | | | | | | |
| | | | | | | 9,698,725 | |
| | | | | | | | |
Radio and TV Broadcasting 0.5% | |
Nexstar Broadcasting, Inc.
2019 Term Loan B4
TBD, due 6/20/26 | | | 4,375,000 | | | | 4,358,594 | |
| | | | | | | | |
| | | | |
| 24 | | MainStay VP Floating Rate Portfolio | | The notes to the financial statements are an integral part of,
and should be read in conjunction with, the financial statements. |
| | | | | | | | |
| | | Principal
Amount | | | Value | |
| Floating Rate Loans (continued) | |
Retail Store 2.9% | |
Alphabet Holding Co., Inc.
2017 1st Lien Term Loan
5.902% (1 Month LIBOR + 3.50%), due 9/26/24 | | $ | 2,063,250 | | | $ | 1,944,613 | |
Bass Pro Group LLC
Term Loan B
7.402% (1 Month LIBOR + 5.00%), due 9/25/24 | | | 2,947,500 | | | | 2,810,259 | |
Belk, Inc.
Term Loan
7.285% (3 Month LIBOR + 4.75%), due 12/12/22 | | | 1,419,279 | | | | 1,141,252 | |
BJ’s Wholesale Club, Inc.
2017 1st Lien Term Loan
5.161% (1 Month LIBOR + 2.75%), due 2/3/24 | | | 3,370,193 | | | | 3,370,614 | |
CNT Holdings III Corp.
2017 Term Loan
5.45% (6 Month LIBOR + 3.25%), due 1/22/23 | | | 1,247,728 | | | | 1,232,521 | |
EG Finco, Ltd.
2018 USD Term Loan
6.33% (3 Month LIBOR + 4.00%), due 2/7/25 | | | 1,481,257 | | | | 1,454,409 | |
Harbor Freight Tools USA, Inc.
2018 Term Loan B
4.902% (1 Month LIBOR + 2.50%), due 8/18/23 | | | 1,420,712 | | | | 1,381,347 | |
Leslie’s Poolmart, Inc.
2016 Term Loan
5.981% (2 Month LIBOR + 3.50%), due 8/16/23 | | | 1,828,671 | | | | 1,730,380 | |
Michaels Stores, Inc. | | | | | | | | |
2018 Term Loan B
4.90% (1 Month LIBOR + 2.50%), due 1/30/23 | | | 790,602 | | | | 762,140 | |
2018 Term Loan B
4.90% (1 Month LIBOR + 2.50%), due 1/30/23 | | | 2,209,902 | | | | 2,130,346 | |
Party City Holdings, Inc.
2018 Term Loan B
4.91% (1 Month LIBOR + 2.50%), due 8/19/22 | | | 1,992,395 | | | | 1,978,282 | |
Petco Animal Supplies, Inc.
2017 Term Loan B
5.833% (3 Month LIBOR + 3.25%), due 1/26/23 | | | 2,580,000 | | | | 1,999,500 | |
PetSmart, Inc.
Term Loan B2
6.67% (1 Month LIBOR + 4.00%), due 3/11/22 | | | 1,898,904 | | | | 1,840,038 | |
| | | | | | | | |
| | | Principal
Amount | | | Value | |
Retail Store (continued) | |
Sally Holdings LLC
Term Loan B2
4.50%, due 7/5/24 (e) | | $ | 1,166,667 | | �� | $ | 1,102,500 | |
| | | | | | | | |
| | | | | | | 24,878,201 | |
| | | | | | | | |
Telecommunications 3.2% | |
Avaya, Inc.
2018 Term Loan B
6.651% (1 Month LIBOR + 4.25%), due 12/15/24 | | | 1,477,500 | | | | 1,411,751 | |
CenturyLink, Inc.
2017 Term Loan B
5.152% (1 Month LIBOR + 2.75%), due 1/31/25 | | | 2,967,468 | | | | 2,894,207 | |
CSC Holdings LLC | | | | | | | | |
2018 Term Loan B
4.894% (1 Month LIBOR + 2.50%), due 1/25/26 | | | 3,712,500 | | | | 3,665,166 | |
2019 Term Loan B
5.394% (1 Month LIBOR + 3.00%), due 4/15/27 | | | 1,000,000 | | | | 985,000 | |
Frontier Communications Corp.
2017 Term Loan B1
6.16% (1 Month LIBOR + 3.75%), due 6/15/24 | | | 1,470,000 | | | | 1,440,600 | |
Microchip Technology, Inc.
2018 Term Loan B
4.41% (1 Month LIBOR + 2.00%), due 5/29/25 | | | 1,149,783 | | | | 1,142,597 | |
Rackspace Hosting, Inc.
2017 Incremental 1st Lien Term Loan
5.576% (3 Month LIBOR + 3.00%), due 11/3/23 | | | 884,211 | | | | 813,474 | |
Radiate Holdco LLC
1st Lien Term Loan
5.402% (1 Month LIBOR + 3.00%), due 2/1/24 | | | 3,612,760 | | | | 3,525,953 | |
SBA Senior Finance II LLC
2018 Term Loan B
4.41% (1 Month LIBOR + 2.00%), due 4/11/25 | | | 1,817,300 | | | | 1,792,029 | |
Sprint Communications, Inc. | | | | | | | | |
1st Lien Term Loan B
4.938% (1 Month LIBOR + 2.50%), due 2/2/24 | | | 1,955,000 | | | | 1,923,231 | |
2018 Term Loan B
5.438% (1 Month LIBOR + 3.00%), due 2/2/24 | | | 3,980,000 | | | | 3,938,540 | |
Syniverse Holdings, Inc. | | | | | | | | |
2018 1st Lien Term Loan
7.401% (1 Month LIBOR + 5.00%), due 3/9/23 | | | 1,666,406 | | | | 1,537,260 | |
| | | | | | |
The notes to the financial statements are an integral part of,
and should be read in conjunction with, the financial statements. | | | | | 25 | |
Portfolio of InvestmentsJune 30, 2019 (Unaudited) (continued)
| | | | | | | | |
| | | Principal
Amount | | | Value | |
| Floating Rate Loans (continued) | |
Telecommunications (continued) | |
Syniverse Holdings, Inc. (continued) | |
2018 2nd Lien Term Loan
11.401% (1 Month LIBOR + 9.00%), due 3/11/24 | | $ | 500,000 | | | $ | 370,000 | |
West Corp.
2017 Term Loan
6.522% (3 Month LIBOR + 4.00%), due 10/10/24 | | | 1,737,310 | | | | 1,617,146 | |
| | | | | | | | |
| | | | | | | 27,056,954 | |
| | | | | | | | |
Utilities 3.6% | |
Astoria Energy LLC
Term Loan B
6.41% (1 Month LIBOR + 4.00%), due 12/24/21 | | | 2,296,506 | | | | 2,292,200 | |
Brookfield WEC Holdings, Inc.
2018 1st Lien Term Loan
5.902% (1 Month LIBOR + 3.50%), due 8/1/25 | | | 2,987,500 | | | | 2,983,766 | |
Calpine Corp. | | | | | | | | |
Term Loan B5
4.83% (3 Month LIBOR + 2.50%), due 1/15/24 | | | 1,693,708 | | | | 1,683,758 | |
Term Loan B9
5.08% (3 Month LIBOR + 2.75%), due 4/5/26 | | | 3,150,000 | | | | 3,142,125 | |
Compass Power Generation LLC
2018 Term Loan B
5.902% (1 Month LIBOR + 3.50%), due 12/20/24 | | | 673,056 | | | | 673,477 | |
EIF Channelview Cogeneration LLC
2018 Term Loan B
6.66% (1 Month LIBOR + 4.25%), due 5/3/25 | | | 1,362,776 | | | | 1,366,183 | |
ExGen Renewables IV LLC
Term Loan B
5.53% (3 Month LIBOR + 3.00%), due 11/28/24 | | | 938,999 | | | | 892,636 | |
Granite Acquisition, Inc. | | | | | | | | |
Term Loan C
5.83% (3 Month LIBOR + 3.50%), due 12/19/21 | | | 195,342 | | | | 195,098 | |
Term Loan B
6.092% (3 Month LIBOR + 3.50%), due 12/19/21 | | | 2,920,862 | | | | 2,917,211 | |
2nd Lien Term Loan B
9.58% (3 Month LIBOR + 7.25%), due 12/19/22 | | | 696,328 | | | | 695,457 | |
| | | | | | | | |
| | | Principal
Amount | | | Value | |
Utilities (continued) | |
Helix Gen Funding LLC
Term Loan B
6.152% (1 Month LIBOR + 3.75%), due 6/2/24 | | $ | 3,853,252 | | | $ | 3,619,649 | |
Oregon Clean Energy LLC
Term Loan
6.152% (1 Month LIBOR + 3.75%), due 3/1/26 | | | 2,743,125 | | | | 2,743,125 | |
PG&E Corp.
DIP Term Loan
4.69% (1 Month LIBOR + 2.25%), due 12/31/20 | | | 2,812,500 | | | | 2,808,984 | |
Southeast PowerGen LLC
Term Loan B
5.91% (1 Month LIBOR + 3.50%), due 12/2/21 | | | 433,088 | | | | 415,764 | |
TEX Operations Co. LLC
Exit Term Loan B
4.402% (1 Month LIBOR + 2.00%), due 8/4/23 | | | 2,167,571 | | | | 2,163,169 | |
Vistra Energy Corp. | | | | | | | | |
1st Lien Term Loan B3
4.33% (3 Month LIBOR + 2.00%), due 12/31/25 | | | 59,756 | | | | 59,644 | �� |
1st Lien Term Loan B3
4.39% (1 Month LIBOR + 2.00%), due 12/31/25 | | | 748,049 | | | | 746,646 | |
1st Lien Term Loan B3
4.40% (1 Month LIBOR + 2.00%), due 12/31/25 | | | 1,047,195 | | | | 1,045,232 | |
| | | | | | | | |
| | | | | | | 30,444,124 | |
| | | | | | | | |
Total Floating Rate Loans
(Cost $706,440,009) | | | | | | | 691,132,352 | |
| | | | | | | | |
|
| Foreign Floating Rate Loans 10.4% (d) | |
Aerospace & Defense 0.0%‡ | | | | | | | | |
1199169 B.C. Unlimited Liability Co.
2019 Term Loan B2
6.33% (3 Month LIBOR + 4.00%), due 4/6/26 | | | 310,800 | | | | 311,869 | |
| | | | | | | | |
|
Auto Manufacturers 0.4% | |
Panther BF Aggregator 2, L.P.
Term Loan B
5.902% (1 Month LIBOR + 3.50%), due 4/30/26 | | | 3,750,000 | | | | 3,713,438 | |
| | | | | | | | |
| | | | |
| 26 | | MainStay VP Floating Rate Portfolio | | The notes to the financial statements are an integral part of,
and should be read in conjunction with, the financial statements. |
| | | | | | | | |
| | | Principal
Amount | | | Value | |
| Foreign Floating Rate Loans (continued) | |
Beverage, Food & Tobacco 0.7% | |
JBS USA Lux S.A.
2019 Term Loan B
4.902% (1 Month LIBOR + 2.50%), due 5/1/26 | | $ | 3,653,843 | | | $ | 3,644,200 | |
Refresco Group B.V.
USD Term Loan B3
TBD, due 3/28/25 | | | 2,000,000 | | | | 1,990,000 | |
| | | | | | | | |
| | | | | | | 5,634,200 | |
| | | | | | | | |
Broadcasting & Entertainment 0.6% | |
Altice France S.A.
2018 Term Loan B13
6.394% (1 Month LIBOR + 4.00%), due 8/14/26 | | | 1,243,750 | | | | 1,216,932 | |
Numericable Group S.A. | | | | | | | | |
Term Loan B11
5.152% (1 Month LIBOR + 2.75%), due 7/31/25 | | | 2,935,088 | | | | 2,790,778 | |
Term Loan B12
6.082% (1 Month LIBOR + 3.687%), due 1/31/26 | | | 984,975 | | | | 954,195 | |
| | | | | | | | |
| | | | | | | 4,961,905 | |
| | | | | | | | |
Chemicals, Plastics & Rubber 1.1% | |
Allnex (Luxembourg) & Cy S.C.A.
2016 Term Loan B2
5.771% (3 Month LIBOR + 3.25%), due 9/13/23 | | | 1,264,593 | | | | 1,236,930 | |
Alpha 3 B.V.
2017 Term Loan B1
5.33% (3 Month LIBOR + 3.00%), due 1/31/24 | | | 1,754,827 | | | | 1,714,247 | |
Diamond (BC) B.V.
Term Loan
5.583% (3 Month LIBOR + 3.00%), due 9/6/24 | | | 1,641,667 | | | | 1,440,562 | |
Flint Group GmbH Term Loan C
5.581% (3 Month LIBOR + 3.00%), due 9/7/21 | | | 292,768 | | | | 242,266 | |
Oxea Holding Drei GmbH
2017 Term Loan B2
6.125% (3 Month LIBOR + 3.50%), due 10/14/24 | | | 2,287,500 | | | | 2,280,352 | |
Starfruit Finco B.V.
2018 Term Loan B
5.669% (1 Month LIBOR + 3.25%), due 10/1/25 | | | 2,244,375 | | | | 2,205,565 | |
| | | | | | | | |
| | | | | | | 9,119,922 | |
| | | | | | | | |
| | | | | | | | |
| | | Principal
Amount | | | Value | |
Diversified/Conglomerate Manufacturing 0.6% | |
AI Ladder (Luxembourg) Subco S.A R.L.
2018 Term Loan
6.83% (3 Month LIBOR + 4.50%), due 7/9/25 | | $ | 814,568 | | | $ | 790,131 | |
Bright Bidco B.V. | | | | | | | | |
2018 Term Loan B
5.83% (3 Month LIBOR + 3.50%), due 6/30/24 | | | 1,321,836 | | | | 925,286 | |
2018 Term Loan B
5.90% (3 Month LIBOR + 3.50%), due 6/30/24 | | | 638,197 | | | | 446,738 | |
Garda World Security Corp. | | | | | | | | |
2017 Term Loan
6.02% (3 Month LIBOR + 3.50%), due 5/24/24 | | | 3,158,047 | | | | 3,130,414 | |
2017 Term Loan
8.00% (PRIME + 2.50%), due 5/24/24 | | | 8,077 | | | | 8,006 | |
| | | | | | | | |
| | | | | | | 5,300,575 | |
| | | | | | | | |
Ecological 0.2% | |
GFL Environmental, Inc.
2018 Term Loan B
5.402% (1 Month LIBOR + 3.00%), due 5/30/25 | | | 1,584,439 | | | | 1,556,315 | |
| | | | | | | | |
|
Electronics 0.8% | |
Avast Software B.V.
2018 Term Loan B
4.58% (3 Month LIBOR + 2.25%), due 9/30/23 | | | 744,082 | | | | 742,128 | |
ION Trading Technologies S.A R.L.
USD Incremental Term Loan B
6.651% (3 Month LIBOR + 4.00%), due 11/21/24 | | | 1,975,912 | | | | 1,916,634 | |
Oberthur Technologies S.A.
2016 Term Loan B1
6.08% (3 Month LIBOR + 3.75%), due 1/10/24 | | | 1,100,869 | | | | 1,051,330 | |
SS&C Technologies Holdings Europe S.A R.L.
2018 Term Loan B4
4.652% (1 Month LIBOR + 2.25%), due 4/16/25 | | | 1,977,767 | | | | 1,968,703 | |
Trader Corp.
2017 Term Loan B
5.402% (1 Month LIBOR + 3.00%), due 9/28/23 | | | 1,283,127 | | | | 1,276,711 | |
| | | | | | | | |
| | | | | | | 6,955,506 | |
| | | | | | | | |
| | | | | | |
The notes to the financial statements are an integral part of,
and should be read in conjunction with, the financial statements. | | | | | 27 | |
Portfolio of InvestmentsJune 30, 2019 (Unaudited) (continued)
| | | | | | | | |
| | | Principal
Amount | | | Value | |
| Foreign Floating Rate Loans (continued) | |
Healthcare, Education & Childcare 1.4% | |
Auris Luxembourg III S.A.R.L.
2019 Term Loan B2
6.152% (1 Month LIBOR + 3.75%), due 2/27/26 | | $ | 1,683,281 | | | $ | 1,684,860 | |
Endo Luxembourg Finance Co. I S.A R.L.
2017 Term Loan B
6.688% (1 Month LIBOR + 4.25%), due 4/29/24 | | | 3,798,737 | | | | 3,554,194 | |
Mallinckrodt International Finance S.A.
Term Loan B
5.08% (3 Month LIBOR + 2.75%), due 9/24/24 | | | 1,053,167 | | | | 944,889 | |
Valeant Pharmaceuticals International, Inc.
2018 Term Loan B
5.412% (1 Month LIBOR + 3.00%), due 6/2/25 | | | 5,856,160 | | | | 5,850,930 | |
| | | | | | | | |
| | | | | | | 12,034,873 | |
| | | | | | | | |
Hotels, Motels, Inns & Gaming 1.1% | |
Four Seasons Hotels, Ltd.
New 1st Lien Term Loan
4.402% (1 Month LIBOR + 2.00%), due 11/30/23 | | | 2,472,233 | | | | 2,466,438 | |
Gateway Casinos & Entertainment, Ltd.
2018 Term Loan B
5.33% (3 Month LIBOR + 3.00%), due 3/13/25 | | | 1,588,975 | | | | 1,590,298 | |
GVC Holdings PLC
2018 Term Loan
4.652% (1 Month LIBOR + 2.25%), due 3/29/24 | | | 1,486,212 | | | | 1,480,019 | |
Stars Group Holdings B.V.
2018 Incremental Term Loan
5.83% (3 Month LIBOR + 3.50%), due 7/10/25 | | | 4,059,045 | | | | 4,056,509 | |
| | | | | | | | |
| | | | | | | 9,593,264 | |
| | | | | | | | |
Leisure, Amusement, Motion Pictures & Entertainment 0.9% | |
Bombardier Recreational Products, Inc. | | | | | | | | |
2019 Incremental Term Loan B2
TBD, due 5/23/25 | | | 1,666,667 | | | | 1,646,875 | |
2016 Term Loan B
4.40% (1 Month LIBOR + 2.00%), due 5/23/25 | | | 1,694,943 | | | | 1,668,107 | |
Delta 2 (LUX) S.A.R.L.
2018 USD Term Loan
4.902% (1 Month LIBOR + 2.50%), due 2/1/24 | | | 3,568,089 | | | | 3,475,915 | |
| | | | | | | | |
| | | Principal
Amount | | | Value | |
Leisure, Amusement, Motion Pictures & Entertainment (continued) | |
DHX Media, Ltd.
Term Loan B
6.152% (1 Month LIBOR + 3.75%), due 12/29/23 | | $ | 808,136 | | | $ | 785,912 | |
| | | | | | | | |
| | | | | | | 7,576,809 | |
| | | | | | | | |
Machinery (Non-Agriculture, Non-Construct & Non-Electronic) 0.2% | |
Titan Acquisition, Ltd.
2018 Term Loan B
5.402% (1 Month LIBOR + 3.00%), due 3/28/25 | | | 1,851,563 | | | | 1,764,076 | |
| | | | | | | | |
|
Oil & Gas 0.2% | |
MEG Energy Corp.
2017 Term Loan B
5.91% (1 Month LIBOR + 3.50%), due 12/31/23 | | | 133,125 | | | | 132,792 | |
NorthRiver Midstream Finance L.P.
2018 Term Loan B
5.85% (3 Month LIBOR + 3.25%), due 10/1/25 | | | 1,191,000 | | | | 1,188,661 | |
| | | | | | | | |
| | | | | | | 1,321,453 | |
| | | | | | | | |
Personal & Nondurable Consumer Products (Manufacturing Only) 0.2% | |
Array Canada, Inc.
Term Loan B
7.33% (3 Month LIBOR + 5.00%), due 2/10/23 | | | 370,583 | | | | 352,981 | |
KIK Custom Products, Inc.
2015 Term Loan B
6.402% (1 Month LIBOR + 4.00%), due 5/15/23 | | | 1,350,000 | | | | 1,271,362 | |
| | | | | | | | |
| | | | | | | 1,624,343 | |
| | | | | | | | |
Personal, Food & Miscellaneous Services 0.7% | |
1011778 B.C. Unlimited Liability Co.
Term Loan B3
4.652% (1 Month LIBOR + 2.25%), due 2/16/24 | | | 3,484,302 | | | | 3,458,170 | |
Jacobs Douwe Egberts International B.V.
2018 USD Term Loan B
4.50% (1 Month LIBOR + 2.00%), due 11/1/25 | | | 2,629,751 | | | | 2,623,176 | |
| | | | | | | | |
| | | | | | | 6,081,346 | |
| | | | | | | | |
Printing & Publishing 0.3% | |
Springer Science & Business Media Deutschland GmbH
Term Loan B13
5.902% (1 Month LIBOR + 3.50%), due 8/15/22 | | | 2,908,936 | | | | 2,908,936 | |
| | | | | | | | |
| | | | |
| 28 | | MainStay VP Floating Rate Portfolio | | The notes to the financial statements are an integral part of,
and should be read in conjunction with, the financial statements. |
| | | | | | | | |
| | | Principal
Amount | | | Value | |
| Foreign Floating Rate Loans (continued) | |
Retail Store 0.1% | |
EG Group, Ltd.
2018 USD Term Loan B
6.33% (3 Month LIBOR + 4.00%), due 2/7/25 | | $ | 1,185,000 | | | $ | 1,163,522 | |
| | | | | | | | |
|
Telecommunications 0.9% | |
Digicel International Finance, Ltd.
2017 Term Loan B
5.78% (3 Month LIBOR + 3.25%), due 5/28/24 | | | 515,814 | | | | 445,663 | |
Intelsat Jackson Holdings S.A.
2017 Term Loan B3
6.154% (1 Month LIBOR + 3.75%), due 11/27/23 | | | 4,139,180 | | | | 4,088,732 | |
Telesat Canada Term Loan B4
4.83% (3 Month LIBOR + 2.50%), due 11/17/23 | | | 3,280,747 | | | | 3,241,106 | |
| | | | | | | | |
| | | | | | | 7,775,501 | |
| | | | | | | | |
Total Foreign Floating Rate Loans
(Cost $91,434,160) | | | | | | | 89,397,853 | |
| | | | | | | | |
TotalLong-Term Bonds
(Cost $828,889,249) | | | | | | | 811,827,861 | |
| | | | | | | | |
| | |
| | | | | | | | |
| | |
Shares | | | | |
| Affiliated Investment Company 0.3% | |
Fixed Income Fund 0.3% | |
MainStay MacKay High Yield Corporate Bond Fund Class I | | | 492,059 | | | | 2,770,294 | |
| | | | | | | | |
Total Affiliated Investment Company
(Cost $2,792,371) | | | | | | | 2,770,294 | |
| | | | | | | | |
|
| Common Stocks 0.5% | |
Communications Equipment 0.0%‡ | |
Energy Future Holdings Corp. (e)(f)(h)(i) | | | 94,456 | | | | 0 | |
Millennium Corporate Trust (e)(f)(h)(i) | | | 1,243 | | | | 0 | |
Millennium Lender Trust (e)(f)(h)(i) | | | 1,324 | | | | 0 | |
| | | | | | | | |
| | | | | | | 0 | |
| | | | | | | | |
Energy Equipment & Services 0.1% | |
Pacific Drilling S.A. (i) | | | 49,911 | | | | 628,879 | |
Transocean, Ltd. (i) | | | 52,291 | | | | 335,185 | |
| | | | | | | | |
| | | | | | | 964,064 | |
| | | | | | | | |
Hotels, Restaurants & Leisure 0.0%‡ | |
Caesars Entertainment Corp. (i) | | | 19,323 | | | | 228,398 | |
| | | | | | | | |
| | | | | | | | |
| | |
Shares | | | Value | |
Media 0.1% | |
Clear Channel Outdoor Holdings, Inc. (i) | | | 43,745 | | | $ | 206,477 | |
iHeartMedia, Inc. Class A (e)(f)(h)(i) | | | 18,603 | | | | 292,997 | |
| | | | | | | | |
| | | | | | | 499,474 | |
| | | | | | | | |
Metals & Mining 0.3% | |
AFGlobal Corp. (e)(f)(h)(i) | | | 45,694 | | | | 2,483,926 | |
| | | | | | | | |
|
Oil & Gas 0.0%‡ | |
HGIM Corp. (e)(f)(h)(i) | | | 527 | | | | 7,905 | |
Templar Energy Corp., Class B (e)(f)(h)(i) | | | 36,393 | | | | 0 | |
Templar Energy LLC, Class A (e)(f)(h)(i) | | | 36,029 | | | | 0 | |
| | | | | | | | |
| | | | | | | 7,905 | |
| | | | | | | | |
Oil, Gas & Consumable Fuels 0.0%‡ | |
Ascent Resources (e)(f)(h)(i) | | | 122,031 | | | | 320,331 | |
Philadelphia Energy Solutions, Inc., Class A (e)(f)(h)(i) | | | 52,608 | | | | 16,440 | |
| | | | | | | | |
| | | | | | | 336,771 | |
| | | | | | | | |
Total Common Stocks
(Cost $5,063,551) | | | | | | | 4,520,538 | |
| | | | | | | | |
|
| Preferred Stocks 0.0% | |
Oil & Gas 0.0% | |
Templar Energy Corp.
(8.00% PIK) (c)(e)(f)(h)(i) | | | 54,340 | | | | 0 | |
| | | | | | | | |
Total Preferred Stocks
(Cost $227,580) | | | | | | | 0 | |
| | | | | | | | |
| | |
| | | | | | | | |
| | | Number of
Rights | | | | |
| Rights 0.0%‡ | |
Independent Power & Renewable Electricity Producers 0.0%‡ | |
Vistra Energy Corp. (e)(h)(i) | | | 57,684 | | | | 56,530 | |
| | | | | | | | |
Total Rights
(Cost $47,301) | | | | | | | 56,530 | |
| | | | | | | | |
| | |
| | | | | | | | |
| | | Number of
Warrants | | | | |
| Warrants 0.0%‡ | |
Oil & Gas 0.0%‡ | |
HGIM Corp. Expires 7/2/43 (e)(f)(h)(i) | | | 2,358 | | | | 35,370 | |
| | | | | | | | |
|
Oil, Gas & Consumable Fuels 0.0%‡ | |
Ascent Resources (e)(f)(h)(i) | | | | | | | | |
1st Lien Warrants
Expires 3/30/23 | | | 11,684 | | | | 934 | |
2nd Lien Tranche A
Expires 3/30/23 | | | 15,022 | | | | 1,878 | |
| | | | | | |
The notes to the financial statements are an integral part of,
and should be read in conjunction with, the financial statements. | | | | | 29 | |
Portfolio of InvestmentsJune 30, 2019 (Unaudited) (continued)
| | | | | | | | |
| | | Number of
Warrants | | | Value | |
| Warrants (continued) | |
Oil, Gas & Consumable Fuels (continued) | |
Ascent Resources (continued) | | | | | | | | |
2nd Lien Tranche B
Expires 3/30/23 | | | 31,000 | | | $ | 930 | |
| | | | | | | | |
| | | | | | | 3,742 | |
| | | | | | | | |
Total Warrants
(Cost $100,718) | | | | | | | 39,112 | |
| | | | | | | | |
| | |
| | | | | | | | |
| | | Principal
Amount | | | | |
| Short-Term Investments 7.1% | |
Repurchase Agreement 0.5% | |
Fixed Income Clearing Corp.
0.50%, dated 6/28/19
due 7/1/19
Proceeds at Maturity $3,882,991 (Collateralized by a United States Treasury Note with a rate of 2.25% and a maturity date of 3/31/21, with a Principal Amount of $3,910,000 and a Market Value of $3,961,440) | | $ | 3,882,830 | | | | 3,882,830 | |
| | | | | | | | |
Total Repurchase Agreement
(Cost $3,882,830) | | | | | | | 3,882,830 | |
| | | | | | | | |
|
U.S. Government & Federal Agencies 6.4% (j) | |
2.12%, due 7/23/19 | | | 7,841,000 | | | | 7,830,997 | |
2.17%, due 7/9/19 | | | 6,350,000 | | | | 6,346,984 | |
2.171%, due 7/9/19 | | | 1,450,000 | | | | 1,449,311 | |
2.182%, due 8/6/19 | | | 35,675,000 | | | | 35,598,477 | |
2.339%, due 7/2/19 | | | 3,454,000 | | | | 3,453,779 | |
| | | | | | | | |
Total U.S. Government & Federal Agencies
(Cost $54,679,548) | | | | | | | 54,679,548 | |
| | | | | | | | |
|
Unaffiliated Investment Company 0.2% | |
State Street Navigator Securities Lending Government Money Market Portfolio, 2.33% (k)(l) | | | 1,881,488 | | | | 1,881,488 | |
| | | | | | | | |
Total Unaffiliated Investment Company
(Cost $1,881,488) | | | | | | | 1,881,488 | |
| | | | | | | | |
TotalShort-Term Investments
(Cost $60,443,866) | | | | | | | 60,443,866 | |
| | | | | | | | |
Total Investments
(Cost $897,564,636) | | | 102.7 | % | | | 879,658,201 | |
Other Assets, Less Liabilities | | | (2.7 | ) | | | (22,935,911 | ) |
Net Assets | | | 100.0 | % | | $ | 856,722,290 | |
| † | Percentages indicated are based on Portfolio net assets. |
| ‡ | Less than one-tenth of a percent. |
| (a) | May be sold to institutional investors only under Rule 144A or securities offered pursuant to Section 4(a)(2) of the Securities Act of 1933, as amended. |
| (b) | All or a portion of this security was held on loan. As of June 30, 2019, the aggregate market value of securities on loan was $2,556,251; the total market value of collateral held by the Portfolio was $2,629,087. The market value of the collateral held included non-cash collateral in the form of U.S. Treasury securities with a value of $747,599 (See Note 2(J)). |
| (c) | PIK ("Payment-in-Kind")—issuer may pay interest or dividends with additional securities and/or in cash. |
| (d) | Floating rate—Rate shown was the rate in effect as of June 30, 2019. |
| (e) | Security in which significant unobservable inputs (Level 3) were used in determining fair value. |
| (f) | Illiquid security—As of June 30, 2019, the total market value of these securities deemed illiquid under procedures approved by the Board of Trustees was $10,806,231, which represented 1.3% of the Portfolio’s net assets. |
| (h) | Fair valued security—Represents fair value as measured in good faith under procedures approved by the Board of Trustees. As of June 30, 2019, the total market value of fair valued securities was $3,217,241, which represented 0.4% of the Portfolio’s net assets. |
| (i) | Non-income producing security. |
| (j) | Interest rate shown represents yield to maturity. |
| (k) | Current yield as of June 30, 2019. |
| (l) | Represents security purchased with cash collateral received for securities on loan. |
The following abbreviations are used in the preceding pages:
LIBOR—London Interbank Offered Rate
TBD—To Be Determined
| | | | |
| 30 | | MainStay VP Floating Rate Portfolio | | The notes to the financial statements are an integral part of,
and should be read in conjunction with, the financial statements. |
The following is a summary of the fair valuations according to the inputs used as of June 30, 2019, for valuing the Portfolio’s assets:
| | | | | | | | | | | | | | | | |
Description | | Quoted
Prices in
Active
Markets for
Identical
Assets
(Level 1) | | | Significant
Other
Observable
Inputs
(Level 2) | | | Significant
Unobservable
Inputs
(Level 3) | | | Total | |
| | | | |
Asset Valuation Inputs | | | | | | | | | | | | | | | | |
| Investments in Securities (a) | | | | | | | | | | | | | | | | |
| Long-Term Bonds | | | | | | | | | | | | | | | | |
Corporate Bonds | | $ | — | | | $ | 31,297,656 | | | $ | — | | | $ | 31,297,656 | |
Floating Rate Loans (b) | | | — | | | | 682,412,446 | | | | 8,719,906 | | | | 691,132,352 | |
Foreign Floating Rate Loans | | | — | | | | 89,397,853 | | | | — | | | | 89,397,853 | |
| | | | | | | | | | | | | | | | |
| TotalLong-Term Bonds | | | — | | | | 803,107,955 | | | | 8,719,906 | | | | 811,827,861 | |
| | | | | | | | | | | | | | | | |
| Affiliated Investment Company | | | | | | | | | | | | | | | | |
Fixed Income Funds | | | 2,770,294 | | | | — | | | | — | | | | 2,770,294 | |
| Common Stocks (c) | | | 1,398,939 | | | | — | | | | 3,121,599 | | | | 4,520,538 | |
| Preferred Stocks (d) | | | — | | | | — | | | | 0 | | | | 0 | |
| Rights (e) | | | — | | | | — | | | | 56,530 | | | | 56,530 | |
| Warrants (f) | | | — | | | | — | | | | 39,112 | | | | 39,112 | |
| Short-Term Investments | | | | | | | | | | | | | | | | |
Repurchase Agreements | | | — | | | | 3,882,830 | | | | — | | | | 3,882,830 | |
U.S. Government & Federal Agencies | | | — | | | | 54,679,548 | | | | — | | | | 54,679,548 | |
Unaffiliated Investment Company | | | 1,881,488 | | | | — | | | | — | | | | 1,881,488 | |
| | | | | | | | | | | | | | | | |
| TotalShort-Term Investments | | | 1,881,488 | | | | 58,562,378 | | | | — | | | | 60,443,866 | |
| | | | | | | | | | | | | | | | |
| Total Investments in Securities | | $ | 6,050,721 | | | $ | 861,670,333 | | | $ | 11,937,147 | | | $ | 879,658,201 | |
| | | | | | | | | | | | | | | | |
| (a) | For a complete listing of investments and their industries, see the Portfolio of Investments. |
| (b) | The Level 3 securities valued at $8,719,906 are held within the Floating Rate Loans section of the Portfolio of Investments were valued by a pricing service without adjustment. |
| (c) | The Level 3 securities valued at $0, $292,997, $2,483,926, $7,905 and $336,771 are held in Communications Equipment, Media, Metals & Mining, Oil & Gas and Oil, Gas & Consumable Fuels, respectively, within the Common Stocks section of the Portfolio of Investments. |
| (d) | The Level 3 security valued at $0 is held in Oil & Gas within the Preferred Stocks section of the Portfolio of Investments. |
| (e) | The Level 3 security valued at $56,530 is held in Independent Power & Renewable Electricity Producers within the Rights section of the Portfolio of Investments. |
| (f) | The Level 3 securities valued at $35.370 and $3,742 are held in Oil & Gas and Oil, Gas & Consumable Fuels, respectively within the Warrants section of the Portfolio of Investments. |
| | | | | | |
The notes to the financial statements are an integral part of,
and should be read in conjunction with, the financial statements. | | | | | 31 | |
Portfolio of InvestmentsJune 30, 2019 (Unaudited) (continued)
The following is a reconciliation of investments in which significant unobservable inputs (Level 3) were used in determining value:
| | | | | | | | | | | | | | | | | | | | | | | | | | | | | | | | | | | | | | | | |
Investments in Securities | | Balance
as of
December 31,
2018 | | | Accrued
Discounts
(Premiums) | | | Realized
Gain
(Loss) | | | Change in
Unrealized
Appreciation
(Depreciation) | | | Purchases | | | Sales (a) | | | Transfers
in to
Level 3 | | | Transfers
out of
Level 3 | | | Balance
as of
June 30,
2019 | | | Change in
Unrealized
Appreciation
(Depreciation)
from
Investments
Held at
June 30,
2019 (b) | |
| Long-Term Bonds | | | | | | | | | | | | | | | | | | | | | | | | | | | | | | | | | | | | | | | | |
Floating Rate Loans | | $ | 48,225,782 | | | $ | 8,282 | | | $ | 9,928 | | | $ | 154,807 | | | $ | (856,360 | ) | | $ | (12,928,334 | ) | | $ | 3,570,906 | | | $ | (29,465,105 | ) | | $ | 8,719,906 | | | $ | 154,807 | |
Foreign Floating Rate Loans | | | 7,547,427 | | | | — | | | | — | | | | — | | | | — | | | | — | | | | — | | | | (7,547,427 | ) | | | — | | | | — | |
| Common Stocks | | | 3,235,335 | | | | — | | | | — | | | | (448,590 | ) | | | 334,854 | | | | — | | | | — | | | | — | | | | 3,121,599 | | | | (448,590 | ) |
| Preferred Stocks | | | 66,963 | | | | — | | | | — | | | | (66,963 | ) | | | — | | | | — | | | | — | | | | — | | | | — | | | | — | |
| Rights | | | 54,223 | | | | — | | | | — | | | | 2,307 | | | | — | | | | — | | | | — | | | | — | | | | 56,530 | | | | 2,307 | |
| Warrants | | | 101,766 | | | | — | | | | — | | | | (62,654 | ) | | | — | | | | — | | | | — | | | | — | | | | 39,112 | | | | (62,654 | ) |
| | | | | | | | | | | | | | | | | | | | | | | | | | | | | | | | | | | | | | | | |
| Total | | $ | 59,231,496 | | | $ | 8,282 | | | $ | 9,928 | | | $ | (421,093 | ) | | $ | (521,506 | ) | | $ | (12,928,334 | ) | | $ | 3,570,906 | | | $ | (37,012,532 | ) | | $ | 11,937,147 | | | $ | (354,130 | ) |
| | | | | | | | | | | | | | | | | | | | | | | | | | | | | | | | | | | | | | | | |
| (a) | Sales include principal reductions. |
| (b) | Included in “Net change in unrealized appreciation (depreciation) on investments” in the Statement of Operations |
As of June 30, 2019, securities with a market value of $3,570,906 transferred from Level 2 to Level 3 as the fair value obtained from an independent pricing service, utilized significant unobservable inputs. As of December 31, 2018, the fair value obtained for these securities, as determined by an independent pricing service, utilized significant other observable inputs.
As of June 30, 2019, securities with a market value of $37,012,532 transferred from Level 3 to Level 2 as the fair value obtained from an independent pricing service, utilized significant other observable inputs. As of December 31, 2018, the fair value obtained for these securities, as determined by an independent pricing service, utilized significant unobservable inputs.
| | | | |
| 32 | | MainStay VP Floating Rate Portfolio | | The notes to the financial statements are an integral part of,
and should be read in conjunction with, the financial statements. |
Statement of Assets and Liabilitiesas of June 30, 2019 (Unaudited)
| | | | |
| Assets | | | | |
Investment in unaffiliated securities, at value
(identified cost $894,772,265) including securities on loan of $2,556,251 | | $ | 876,887,907 | |
Investment in affiliated investment company, at value (identified cost $2,792,371) | | | 2,770,294 | |
Receivables: | | | | |
Dividends and interest | | | 3,644,161 | |
Investment securities sold | | | 2,745,827 | |
Portfolio shares sold | | | 243,851 | |
Securities lending | | | 3,529 | |
Other assets | | | 4,032 | |
| | | | |
Total assets | | | 886,299,601 | |
| | | | |
| |
| Liabilities | | | | |
Cash collateral received for securities on loan | | | 1,881,488 | |
Unrealized depreciation on unfunded commitments (See Note 5) | | | 5,132 | |
Payables: | | | | |
Investment securities purchased | | | 26,796,717 | |
Manager (See Note 3) | | | 420,623 | |
Portfolio shares redeemed | | | 223,279 | |
NYLIFE Distributors (See Note 3) | | | 124,254 | |
Professional fees | | | 55,861 | |
Shareholder communication | | | 44,339 | |
Custodian | | | 16,831 | |
Trustees | | | 1,056 | |
Accrued expenses | | | 7,731 | |
| | | | |
Total liabilities | | | 29,577,311 | |
| | | | |
Net assets | | $ | 856,722,290 | |
| | | | |
| |
| Composition of Net Assets | | | | |
Shares of beneficial interest outstanding (par value of $.001 per share) unlimited number of shares authorized | | $ | 96,321 | |
Additional paid-in capital | | | 894,297,537 | |
| | | | |
| | | 894,393,858 | |
Total distributable earnings (loss) | | | (37,671,568 | ) |
| | | | |
Net assets | | $ | 856,722,290 | |
| | | | |
| | | | |
Initial Class | | | | |
Net assets applicable to outstanding shares | | $ | 252,516,901 | |
| | | | |
Shares of beneficial interest outstanding | | | 28,406,243 | |
| | | | |
Net asset value per share outstanding | | $ | 8.89 | |
| | | | |
Service Class | | | | |
Net assets applicable to outstanding shares | | $ | 604,205,389 | |
| | | | |
Shares of beneficial interest outstanding | | | 67,914,944 | |
| | | | |
Net asset value per share outstanding | | $ | 8.90 | |
| | | | |
| | | | | | |
The notes to the financial statements are an integral part of,
and should be read in conjunction with, the financial statements. | | | | | 33 | |
Statement of Operationsfor the six months ended June 30, 2019 (Unaudited)
| | | | |
| Investment Income (Loss) | |
Income | | | | |
Interest | | $ | 24,138,417 | |
Dividends-affiliated | | | 81,780 | |
Securities lending | | | 14,229 | |
Dividends-unaffiliated | | | 2,220 | |
| | | | |
Total income | | | 24,236,646 | |
| | | | |
Expenses | | | | |
Manager (See Note 3) | | | 2,507,379 | |
Distribution/Service—Service Class (See Note 3) | | | 764,736 | |
Professional fees | | | 70,096 | |
Shareholder communication | | | 45,706 | |
Custodian | | | 18,295 | |
Trustees | | | 10,210 | |
Miscellaneous | | | 31,327 | |
| | | | |
Total expenses | | | 3,447,749 | |
| | | | |
Net investment income (loss) | | | 20,788,897 | |
| | | | |
|
| Realized and Unrealized Gain (Loss) on Investments and Unfunded Commitments | |
Net realized gain (loss) on unaffiliated investments | | | (1,217,947 | ) |
| | | | |
Net change in unrealized appreciation (depreciation) on: | | | | |
Unaffiliated investments | | | 22,137,550 | |
Affiliated investments | | | 142,698 | |
Unfunded commitments | | | 1,547 | |
| | | | |
Net change in unrealized appreciation (depreciation) on investments and unfunded commitments | | | 22,281,795 | |
| | | | |
Net realized and unrealized gain (loss) on investments and unfunded commitments and unfunded commitments | | | 21,063,848 | |
| | | | |
Net increase (decrease) in net assets resulting from operations | | $ | 41,852,745 | |
| | | | |
| | | | |
| 34 | | MainStay VP Floating Rate Portfolio | | The notes to the financial statements are an integral part of,
and should be read in conjunction with, the financial statements. |
Statements of Changes in Net Assets
for the six months ended June 30, 2019 (Unaudited) and the year ended December 31, 2018
| | | | | | | | |
| | | 2019 | | | 2018 | |
| Increase (Decrease) in Net Assets | |
Operations: | | | | | | | | |
Net investment income (loss) | | $ | 20,788,897 | | | $ | 37,131,108 | |
Net realized gain (loss) on investments and unfunded commitments | | | (1,217,947 | ) | | | (2,392,134 | ) |
Net change in unrealized appreciation (depreciation) on investments and unfunded commitments | | | 22,281,795 | | | | (36,711,595 | ) |
| | | | |
Net increase (decrease) in net assets resulting from operations | | | 41,852,745 | | | | (1,972,621 | ) |
| | | | |
Distributions to shareholders: | | | | | | | | |
Initial Class | | | (5,757,017 | ) | | | (10,493,538 | ) |
Service Class | | | (15,017,574 | ) | | | (26,650,153 | ) |
| | | | |
Total distributions to shareholders | | | (20,774,591 | ) | | | (37,143,691 | ) |
| | | | |
Capital share transactions: | | | | | | | | |
Net proceeds from sale of shares | | | 114,744,285 | | | | 172,373,554 | |
Net asset value of shares issued to shareholders in reinvestment of dividends | | | 20,769,865 | | | | 37,143,691 | |
Cost of shares redeemed | | | (98,646,741 | ) | | | (212,274,463 | ) |
| | | | |
Increase (decrease) in net assets derived from capital share transactions | | | 36,867,409 | | | | (2,757,218 | ) |
| | | | |
Net increase (decrease) in net assets | | | 57,945,563 | | | | (41,873,530 | ) |
| | |
| Net Assets | | | | | | | | |
Beginning of period | | | 798,776,727 | | | | 840,650,257 | |
| | | | |
End of period | | $ | 856,722,290 | | | $ | 798,776,727 | |
| | | | |
| | | | | | |
The notes to the financial statements are an integral part of,
and should be read in conjunction with, the financial statements. | | | | | 35 | |
Financial Highlightsselected per share data and ratios
| | | | | | | | | | | | | | | | | | | | | | | | |
| | |
| | | Six months
ended
June 30, | | | Year ended December 31, | |
| | | | | | |
| Initial Class | | 2019* | | | 2018 | | | 2017 | | | 2016 | | | 2015 | | | 2014 | |
| | | | | | |
Net asset value at beginning of period | | $ | 8.66 | | | $ | 9.08 | | | $ | 9.11 | | | $ | 8.74 | | | $ | 9.05 | | | $ | 9.33 | |
| | | | | | | | | | | | | | | | | | | | | | | | |
| | | | | | |
Net investment income (loss) (a) | | | 0.23 | | | | 0.43 | | | | 0.39 | | | | 0.35 | | | | 0.35 | | | | 0.36 | |
| | | | | | |
Net realized and unrealized gain (loss) on investments | | | 0.23 | | | | (0.42 | ) | | | (0.03 | ) | | | 0.37 | | | | (0.31 | ) | | | (0.28 | ) |
| | | | | | | | | | | | | | | | | | | | | | | | |
| | | | | | |
Total from investment operations | | | 0.46 | | | | 0.01 | | | | 0.36 | | | | 0.72 | | | | 0.04 | | | | 0.08 | |
| | | | | | | | | | | | | | | | | | | | | | | | |
| | | | | | |
| Less dividends: | | | | | | | | | | | | | | | | | | | | | | | | |
| | | | | | |
From net investment income | | | (0.23 | ) | | | (0.43 | ) | | | (0.39 | ) | | | (0.35 | ) | | | (0.35 | ) | | | (0.36 | ) |
| | | | | | | | | | | | | | | | | | | | | | | | |
| | | | | | |
Net asset value at end of period | | $ | 8.89 | | | $ | 8.66 | | | $ | 9.08 | | | $ | 9.11 | | | $ | 8.74 | | | $ | 9.05 | |
| | | | | | | | | | | | | | | | | | | | | | | | |
| | | | | | |
Total investment return (b) | | | 5.43 | % | | | (0.00 | %)‡,(c) | | | 3.98 | % | | | 8.45 | % | | | 0.39 | % | | | 0.86 | % |
| | | | | | |
| Ratios (to average net assets)/Supplemental Data: | | | | | | | | | | | | | | | | | | | | | | | | |
| | | | | | |
Net investment income (loss) | | | 5.16 | %†† | | | 4.75 | % | | | 4.21 | % | | | 3.94 | %(d) | | | 3.88 | % | | | 3.89 | % |
| | | | | | |
Net expenses (e) | | | 0.64 | %†† | | | 0.65 | % | | | 0.64 | % | | | 0.64 | %(f) | | | 0.64 | % | | | 0.64 | % |
| | | | | | |
Portfolio turnover rate | | | 12 | % | | | 29 | % | | | 52 | % | | | 36 | % | | | 35 | % | | | 48 | % |
| | | | | | |
Net assets at end of period (in 000’s) | | $ | 252,517 | | | $ | 187,285 | | | $ | 259,054 | | | $ | 287,373 | | | $ | 226,083 | | | $ | 205,057 | |
| ‡ | Less than one-tenth percent. |
| (a) | Per share data based on average shares outstanding during the period. |
| (b) | Total return does not reflect any deduction of sales charges, mortality and expense charges, contract charges or administrative charges. For periods of less than one year, total return is not annualized. |
| (c) | Total investment return may reflect adjustments to conform to generally accepted accounting principles. |
| (d) | Without the custody fee reimbursement, net investment income (loss) would have been 3.93%. |
| (e) | In addition to the fees and expenses which the Portfolio bears directly, it also indirectly bears a pro-rata share of the fees and expenses of the underlying funds in which it invests. Such indirect expenses are not included in the above expense ratios. |
| (f) | Without the custody fee reimbursement, net expenses would have been 0.65%. |
| | | | | | | | | | | | | | | | | | | | | | | | |
| | |
| | | Six months
ended
June 30, | | | Year ended December 31, | |
| | | | | | |
| Service Class | | 2019* | | | 2018 | | | 2017 | | | 2016 | | | 2015 | | | 2014 | |
| | | | | | |
Net asset value at beginning of period | | $ | 8.67 | | | $ | 9.09 | | | $ | 9.12 | | | $ | 8.75 | | | $ | 9.06 | | | $ | 9.34 | |
| | | | | | | | | | | | | | | | | | | | | | | | |
| | | | | | |
Net investment income (loss) (a) | | | 0.22 | | | | 0.41 | | | | 0.36 | | | | 0.33 | | | | 0.33 | | | | 0.34 | |
| | | | | | |
Net realized and unrealized gain (loss) on investments | | | 0.23 | | | | (0.42 | ) | | | (0.03 | ) | | | 0.37 | | | | (0.31 | ) | | | (0.28 | ) |
| | | | | | | | | | | | | | | | | | | | | | | | |
| | | | | | |
Total from investment operations | | | 0.45 | | | | (0.01 | ) | | | 0.33 | | | | 0.70 | | | | 0.02 | | | | 0.06 | |
| | | | | | | | | | | | | | | | | | | | | | | | |
| | | | | | |
| Less dividends: | | | | | | | | | | | | | | | | | | | | | | | | |
| | | | | | |
From net investment income | | | (0.22 | ) | | | (0.41 | ) | | | (0.36 | ) | | | (0.33 | ) | | | (0.33 | ) | | | (0.34 | ) |
| | | | | | | | | | | | | | | | | | | | | | | | |
| | | | | | |
Net asset value at end of period | | $ | 8.90 | | | $ | 8.67 | | | $ | 9.09 | | | $ | 9.12 | | | $ | 8.75 | | | $ | 9.06 | |
| | | | | | | | | | | | | | | | | | | | | | | | |
| | | | | | |
Total investment return (b) | | | 5.30 | % | | | (0.25 | %)(c) | | | 3.71 | % | | | 8.18 | % | | | 0.14 | % | | | 0.61 | % |
| | | | | | |
| Ratios (to average net assets)/Supplemental Data: | | | | | | | | | | | | | | | | | | | | | | | | |
| | | | | | |
Net investment income (loss) | | | 4.91 | %†† | | | 4.52 | % | | | 3.96 | % | | | 3.68 | %(d) | | | 3.63 | % | | | 3.65 | % |
| | | | | | |
Net expenses (e) | | | 0.89 | %†† | | | 0.90 | % | | | 0.89 | % | | | 0.89 | %(f) | | | 0.89 | % | | | 0.89 | % |
| | | | | | |
Portfolio turnover rate | | | 12 | % | | | 29 | % | | | 52 | % | | | 36 | % | | | 35 | % | | | 48 | % |
| | | | | | |
Net assets at end of period (in 000’s) | | $ | 604,205 | | | $ | 611,492 | | | $ | 581,596 | | | $ | 582,341 | | | $ | 565,278 | | | $ | 581,456 | |
| (a) | Per share data based on average shares outstanding during the period. |
| (b) | Total return does not reflect any deduction of sales charges, mortality and expense charges, contract charges or administrative charges. For periods of less than one year, total return is not annualized. |
| (c) | Total investment return may reflect adjustments to conform to generally accepted accounting principles. |
| (d) | Without the custody fee reimbursement, net investment income (loss) would have been 3.67%. |
| (e) | In addition to the fees and expenses which the Portfolio bears directly, it also indirectly bears a pro-rata share of the fees and expenses of the underlying funds in which it invests. Such indirect expenses are not included in the above expense ratios. |
| (f) | Without the custody fee reimbursement, net expenses would have been 0.90%. |
| | | | |
| 36 | | MainStay VP Floating Rate Portfolio | | The notes to the financial statements are an integral part of,
and should be read in conjunction with, the financial statements. |
Notes to Financial Statements(Unaudited)
Note 1–Organization and Business
MainStay VP Funds Trust (the “Fund”) was organized as a Delaware statutory trust on February 1, 2011. The Fund is registered under the Investment Company Act of 1940, as amended (the “1940 Act”), as an open-end management investment company. The Fund is comprised of thirty-one separate series (collectively referred to as the “Portfolios”). These financial statements and notes relate to the MainStay VP Floating Rate Portfolio (the “Portfolio”), a “non-diversified” portfolio, as that term is defined in the 1940 Act, as interpreted or modified by regulatory authorities having jurisdiction, from time to time. Since the Portfolio has historically operated as a “diversified” portfolio, it will not operate as “non-diversified” without first obtaining shareholder approval.
Shares of the Portfolio are currently offered to certain separate accounts to fund variable annuity policies and variable universal life insurance policies issued by New York Life Insurance and Annuity Corporation (“NYLIAC”), awholly-owned subsidiary of New York Life Insurance Company (“New York Life”) and may also be offered to fund variable annuity policies and variable universal life insurance policies issued by other insurance companies. NYLIAC allocates shares of the Portfolios to, among others, certain NYLIAC separate accounts. Shares of the Portfolio are also offered to the MainStay VP Conservative Allocation Portfolio, MainStay VP Moderate Allocation Portfolio, MainStay VP Moderate Growth Allocation Portfolio and MainStay VP Growth Allocation Portfolio, which operate as “funds-of-funds.”
The Portfolio currently offers two classes of shares. Initial Class and Service Class shares commenced operations on May 2, 2005. Shares of the Portfolio are sold and are redeemed at a price equal to their respective net asset value (“NAV”) per share. No sales or redemption charge is applicable to the purchase or redemption of the Portfolio’s shares. Under the terms of the Fund’s multiple class plan adopted pursuant to Rule 18f-3 under the 1940 Act, the classes differ in that, among other things, Service Class shares of the Portfolio pay a combined distribution and service fee of 0.25% of average daily net assets attributable to Service Class shares of the Portfolio to the Distributor (as defined in Note 3(B)) pursuant to a plan adopted in accordance with Rule 12b-1 under the 1940 Act. Contract owners of variable annuity contracts purchased after June 2, 2003, are permitted to invest only in the Service Class shares.
The Portfolio’s investment objective is to seek high current income.
Note 2–Significant Accounting Policies
The Portfolio is an investment company and accordingly follows the investment company accounting and reporting guidance of the Financial Accounting Standards Board (“FASB”) Accounting Standard CodificationTopic 946 Financial Services—Investment Companies. The Portfolio prepares its financial statements in accordance with generally accepted accounting principles (“GAAP”) in the United States of America and follows the significant accounting policies described below.
(A) Securities Valuation. Investments are usually valued as of the close of regular trading on the New York Stock Exchange (the “Exchange”) (usually 4:00 p.m. Eastern time) on each day the Portfolio is open for business (“valuation date”).
The Board of Trustees of the Fund (the “Board”) adopted procedures establishing methodologies for the valuation of the Portfolio’s securities and other assets and delegated the responsibility for valuation determinations under those procedures to the Valuation Committee of the Fund (the “Valuation Committee”). The Board authorized the Valuation Committee to appoint a Valuation Subcommittee (the “Subcommittee”) to deal in the first instance with establishing the prices of securities for which market quotations are not readily available or the prices of which are not otherwise readily determinable under these procedures. The Subcommittee meets (in person, via electronic mail or via teleconference) on an as-needed basis. Subsequently, the Valuation Committee meets to ensure that actions taken by the Subcommittee were appropriate. The procedures state that, subject to the oversight of the Board and unless otherwise noted, the responsibility for theday-to-day valuation of portfolio assets (including fair value measurements for the Portfolio’s assets and liabilities) rests with New York Life Investment Management LLC (“New York Life Investments” or the “Manager”), aided to whatever extent necessary by the Subadvisor (as defined in Note 3(A)).
To assess the appropriateness of security valuations, the Manager, the Subadvisor or the Portfolio’s third-party service provider, who is subject to oversight by the Manager, regularly compares prior day prices, prices on comparable securities and the sale prices to the prior and current day prices and challenges prices with changes exceeding certain tolerance levels with third-party pricing services or broker sources. For those securities valued through either a standardized fair valuation methodology or a fair valuation measurement, the Subcommittee deals in the first instance with such valuation and the Valuation Committee reviews and affirms, if appropriate, the reasonableness of the valuation based on such methodologies and measurements on a regular basis after considering information that is reasonably available and deemed relevant by the Valuation Committee. Any action taken by the Subcommittee with respect to the valuation of a portfolio security or other asset is submitted for review and ratification (if appropriate) to the Valuation Committee and the Board at the next regularly scheduled meeting.
“Fair value” is defined as the price the Portfolio would reasonably expect to receive upon selling an asset or liability in an orderly transaction to an independent buyer in the principal or most advantageous market for the asset or liability. Fair value measurements are determined within a framework that establishes a three-tier hierarchy which maximizes the use of observable market data and minimizes the use of unobservable inputs to establish a classification of fair value measurements for disclosure purposes. “Inputs” refer broadly to the assumptions that market participants would use in pricing the asset or liability, including assumptions about risk, such as the risk inherent in a particular valuation technique used to measure fair value using a pricing model and/or the risk inherent in the inputs for the valuation technique. Inputs may be observable or unobservable. Observable inputs reflect the assumptions market participants would use in pricing the asset or liability based on market data obtained from sources independent of the Portfolio. Unobservable inputs reflect the Portfolio’s own assumptions about the assumptions market participants would use in pricing the asset or liability based on the information available. The inputs or methodology used for valuing assets or liabilities may not be an indication of the risks
Notes to Financial Statements(Unaudited) (continued)
associated with investing in those assets or liabilities. The three-tier hierarchy of inputs is summarized below.
| • | | Level 1—quoted prices in active markets for an identical asset or liability |
| • | | Level 2—other significant observable inputs (including quoted prices for a similar asset or liability in active markets, interest rates and yield curves, prepayment speeds, credit risk, etc.) |
| • | | Level 3—significant unobservable inputs (including the Portfolio’s own assumptions about the assumptions that market participants would use in measuring fair value of an asset or liability) |
The level of an asset or liability within the fair value hierarchy is based on the lowest level of an input, both individually and in the aggregate, that is significant to the fair value measurement. As of June 30, 2019, the aggregate value by input level of the Portfolio’s assets and liabilities is included at the end of the Portfolio’s Portfolio of Investments.
The Portfolio may use third-party vendor evaluations, whose prices may be derived from one or more of the following standard inputs, among others:
| | |
• Benchmark yields | | • Reported trades |
• Broker/dealer quotes | | • Issuer spreads |
• Two-sided markets | | • Benchmark securities |
• Bids/offers | | • Reference data (corporate actions or material event notices) |
• Industry and economic events | | • Comparable bonds |
• Monthly payment information | | |
An asset or liability for which market values cannot be measured using the methodologies described above is valued by methods deemed reasonable in good faith by the Valuation Committee, following the procedures established by the Board, to represent fair value. Under these procedures, the Portfolio generally uses a market-based approach which may use related or comparable assets or liabilities, recent transactions, market multiples, book values and other relevant information. The Portfolio may also use an income-based valuation approach in which the anticipated future cash flows of the asset or liability are discounted to calculate fair value. Discounts may also be applied due to the nature and/or duration of any restrictions on the disposition of the asset or liability. Fair value represents a good faith approximation of the value of a security. Fair value determinations involve the consideration of a number of subjective factors, an analysis of applicable facts and circumstances and the exercise of judgment. As a result, it is possible that the fair value for a security determined in good faith in accordance with the Portfolio’s valuation procedures may differ from valuations for the same security determined by other funds using their own valuation procedures. Although the Portfolio’s valuation procedures are designed to value a security at the price the Portfolio may reasonably expect to receive upon the security’s sale in an orderly transaction, there can be no assurance that any fair value determination thereunder would, in fact, approximate the amount that the Portfolio would actually realize upon the sale of the security or the price at which the security would trade if a reliable market price were readily available. During thesix-month period ended June 30, 2019, there were no material changes to the fair value methodologies.
Securities which may be valued in this manner include, but are not limited to: (i) a security for which trading has been halted or suspended; (ii) a debt security that has recently gone into default and for which there is not a current market quotation; (iii) a security of an issuer that has entered into a restructuring; (iv) a security that has been delisted from a national exchange; (v) a security for which the market price is not readily available from a third-party pricing source or, if so provided, does not, in the opinion of the Manager or the Subadvisor, reflect the security’s market value; (vi) a security subject to trading collars for which no or limited trading takes place; and (vii) a security whose principal market has been temporarily closed at a time when, under normal conditions, it would be open. Securities valued in this manner are generally categorized as Level 3 in the hierarchy. As of June 30, 2019, securities that were fair valued in such a manner are shown in the Portfolio of Investments.
Equity securities, rights and warrants are valued at the last quoted sales prices as of the close of regular trading on the relevant exchange on each valuation date. Securities that are not traded on the valuation date are valued at the mean of the last quoted bid and ask prices. Prices are normally taken from the principal market in which each security trades. These securities are generally categorized as Level 1 in the hierarchy.
Investments in mutual funds, including money market funds, are valued at their respective NAVs as of the close of the Exchange on the valuation date. These securities are generally categorized as Level 1 in the hierarchy.
Debt securities (other than convertible and municipal bonds) are valued at the evaluated bid prices (evaluated mean prices in the case of convertible and municipal bonds) supplied by a pricing agent or brokers selected by the Manager, in consultation with the Subadvisor. The evaluations are market-based measurements processed through a pricing application and represents the pricing agent’s good faith determination as to what a holder may receive in an orderly transaction under market conditions. The rules based logic utilizes valuation techniques that reflect participants’ assumptions and vary by asset class and per methodology, maximizing the use of relevant observable data including quoted prices for similar assets, benchmark yield curves and market corroborated inputs. The evaluated bid or mean prices are deemed by the Manager, in consultation with the Subadvisor, to be representative of market values at the regular close of trading of the Exchange on each valuation date. Debt securities purchased on a delayed delivery basis are marked to market daily until settlement at the forward settlement date. Debt securities, including corporate bonds, U.S. government and federal agency bonds, municipal bonds, foreign bonds, convertible bonds, asset-backed securities and mortgage-backed securities are generally categorized as Level 2 in the hierarchy.
Loan assignments, participations and commitments are valued at the average of bid quotations obtained from the engaged independent pricing service and are generally categorized as Level 2 in the hierarchy. Certain loan assignments, participations and commitments may be valued by utilizing significant unobservable inputs obtained from the pricing service and are generally categorized as Level 3 in the hierarchy. As of June 30, 2019, securities that were fair valued in such a manner are shown in the Portfolio of Investments.
| | |
| 38 | | MainStay VP Floating Rate Portfolio |
Temporary cash investments acquired in excess of 60 days to maturity at the time of purchase are valued using the latest bid prices or using valuations based on a matrix system (which considers such factors as security prices, yields, maturities and ratings), both as furnished by independent pricing services. Other temporary cash investments which mature in 60 days or less at the time of purchase (“Short-Term Investments”) are valued using the amortized cost method of valuation, unless the use of such method would be inappropriate. The amortized cost method involves valuing a security at its cost on the date of purchase and thereafter assuming a constant amortization to maturity of the difference between such cost and the value on maturity date. Amortized cost approximates the current fair value of a security. Securities valued using the amortized cost method are not valued using quoted prices in an active market and are generally categorized as Level 2 in the hierarchy.
The information above is not intended to reflect an exhaustive list of the methodologies that may be used to value portfolio investments. The valuation procedures permit the use of a variety of valuation methodologies in connection with valuing portfolio investments. The methodology used for a specific type of investment may vary based on the market data available or other considerations. The methodologies summarized above may not represent the specific means by which portfolio investments are valued on any particular business day.
A portfolio security or other asset may be determined to be illiquid under procedures approved by the Board. Illiquidity of a security might prevent the sale of such security at a time when the Manager or the Subadvisor might wish to sell, and these securities could have the effect of decreasing the overall level of the Portfolio’s liquidity. Further, the lack of an established secondary market may make it more difficult to value illiquid securities, requiring the Portfolio to rely on judgments that may be somewhat subjective in measuring value, which could vary materially from the amount that the Portfolio could realize upon disposition. Difficulty in selling illiquid securities may result in a loss or may be costly to the Portfolio. Under the supervision of the Board, the Manager or the Subadvisor determine the liquidity of the Portfolio’s investments; in doing so, the Manager or the Subadvisor may consider various factors, including (i) the frequency of trades and quotations; (ii) the number of dealers and prospective purchasers; (iii) dealer undertakings to make a market; and (iv) the nature of the security and the market in which it trades (e.g., the time needed to dispose of the security, the method of soliciting offers and the mechanics of transfer). Illiquid securities are often valued in accordance with methods deemed by the Board in good faith to be reasonable and appropriate to accurately reflect their fair value. The liquidity of the Portfolio’s investments, as shown in the Portfolio of Investments, was determined as of June 30, 2019 and can change at any time in response to, among other relevant factors, market conditions or events or developments with respect to an individual issuer or instrument. As of June 30, 2019, securities deemed to be illiquid under procedures approved by the Board are shown in the Portfolio of Investments.
(B) Income Taxes. The Portfolio’s policy is to comply with the requirements of the Internal Revenue Code of 1986, as amended (the “Internal Revenue Code”), applicable to regulated investment companies and to distribute all of its taxable income to the shareholders of the
Portfolio within the allowable time limits. Therefore, no federal, state and local income tax provisions are required.
Management evaluates the Portfolio’s tax positions to determine if the tax positions taken meet the minimum recognition threshold in connection with accounting for uncertainties in income tax positions taken or expected to be taken for the purposes of measuring and recognizing tax liabilities in the financial statements. Recognition of tax benefits of an uncertain tax position is permitted only to the extent the position is “more likely than not” to be sustained assuming examination by taxing authorities. Management has analyzed the Portfolio’s tax positions taken on federal, state and local income tax returns for all open tax years (for up to three tax years) and has concluded that no provisions for federal, state and local income tax are required in the Portfolio’s financial statements. The Portfolio’s federal, state and local income tax and federal excise tax returns for tax years for which the applicable statutes of limitations have not expired are subject to examination by the Internal Revenue Service and state and local departments of revenue.
(C) Dividends and Distributions to Shareholders. Dividends and distributions are recorded on the ex-dividend date. The Portfolio intends to declare dividends from net investment income, if any, daily and intends to pay them at least monthly and distributions from net realized capital and currency gains, if any, at least annually. Unless the shareholder elects otherwise, all dividends and distributions are reinvested in the same class of shares of the Portfolio, at NAV. Dividends and distributions to shareholders are determined in accordance with federal income tax regulations and may differ from determinations using GAAP.
(D) Security Transactions and Investment Income. The Portfolio records security transactions on the trade date. Realized gains and losses on security transactions are determined using the identified cost method. Dividend income is recognized on the ex-dividend date; net of any foreign tax withheld at the source, and interest income is accrued as earned using the effective interest rate method. Discounts and premiums on securities purchased for the Portfolio are accreted and amortized, respectively, on the effective interest rate method over the life of the respective securities.
Investment income and realized and unrealized gains and losses on investments of the Portfolio are allocated pro rata to the separate classes of shares based upon their relative net assets on the date the income is earned or realized and unrealized gains and losses are incurred.
The Portfolio may place a debt security on non-accrual status and reduce related interest income by ceasing current accruals and writing off all or a portion of any interest receivables when the collection of all or a portion of such interest has become doubtful. A debt security is removed from non-accrual status when the issuer resumes interest payments or when collectability of interest is reasonably assured.
(E) Expenses. Expenses of the Fund are allocated to the individual Portfolios in proportion to the net assets of the respective Portfolios when the expenses are incurred, except where direct allocations of expenses can be made. Expenses (other than fees incurred under the distribution and service plans, further discussed in Note 3(B), which are charged directly to the Service Class shares) are allocated to separate classes of shares pro rata based upon their relative net assets on the
Notes to Financial Statements(Unaudited) (continued)
date the expenses are incurred. The expenses borne by the Portfolio, including those of related parties to the Portfolio, are shown in the Statement of Operations.
Additionally, the Portfolio may invest in exchange-traded funds (“ETFs”) and mutual funds, which are subject to management fees and other fees that may cause the costs of investing in ETFs and mutual funds to be greater than the costs of owning the underlying securities directly. These indirect expenses of ETFs and mutual funds are not included in the amounts shown as expenses in the Portfolio’s Statement of Operations or in the expense ratios included in the Financial Highlights.
(F) Use of Estimates. In preparing financial statements in conformity with GAAP, management makes estimates and assumptions that affect the reported amounts and disclosures in the financial statements. Actual results could differ from those estimates.
(G) Repurchase Agreements. The Portfolio may enter into repurchase agreements (i.e., buy a security from another party with the agreement that it be sold back in the future) to earn income. The Portfolio may enter into repurchase agreements only with counterparties, usually financial institutions, that are deemed by the Manager or the Subadvisor to be creditworthy, pursuant to guidelines established by the Board. During the term of any repurchase agreement, the Manager or the Subadvisor will continue to monitor the creditworthiness of the counterparty. Under the 1940 Act, repurchase agreements are considered to be collateralized loans by the Portfolio to the counterparty secured by the securities transferred to the Portfolio.
Repurchase agreements are subject to counterparty risk, meaning the Portfolio could lose money by the counterparty’s failure to perform under the terms of the agreement. The Portfolio mitigates this risk by ensuring the repurchase agreement is collateralized by cash, U.S. government securities, fixed income securities and/or other securities. The collateral is held by the Portfolio’s custodian and valued daily on a mark to market basis to determine if the value, including accrued interest, exceeds the repurchase price. In the event of the counterparty’s default on the obligation to repurchase, the Portfolio has the right to liquidate the collateral and apply the proceeds in satisfaction of the obligation. Under certain circumstances, such as in the event of default or bankruptcy by the counterparty, realization and/or retention of the collateral may be limited or subject to delay, to legal proceedings and possible realized loss to the Portfolio. As of June 30, 2019, repurchase agreements are shown in the Portfolio of Investments.
(H) Rights and Warrants. Rights are certificates that permit the holder to purchase a certain number of shares, or a fractional share, of a new stock from the issuer at a specific price. Warrants are instruments that entitle the holder to buy an equity security at a specific price for a specific period of time. These investments can provide a greater potential for profit or loss than an equivalent investment in the underlying security. Prices of these investments do not necessarily move in tandem with the prices of the underlying securities.
There is risk involved in the purchase of rights and warrants in that these investments are speculative investments. The Portfolio could also lose the entire value of its investment in warrants if such warrants are not exercised by the date of its expiration. The Portfolio is exposed to risk until the sale or exercise of each right or warrant is completed. As
of June 30, 2019, rights and warrants are shown in the Portfolio of Investments.
(I) Loan Assignments, Participations and Commitments. The Portfolio primarily invests in loan assignments and participations (“loans”). Commitments are agreements to make money available to a borrower in a specified amount, at a specified rate and within a specified time. The Portfolio records an investment when the borrower withdraws money on a commitment or when a funded loan is purchased (trade date) and records interest as earned. These loans pay interest at rates that are periodically reset by reference to a base lending rate plus a spread. These base lending rates are generally the prime rate offered by a designated U.S. bank or the London Interbank Offered Rate (“LIBOR”).
The loans in which the Portfolio invests are generally readily marketable, but may be subject to some restrictions on resale. For example, the Portfolio may be contractually obligated to receive approval from the agent bank and/or borrower prior to the sale of these investments. If the Portfolio purchases an assignment from a lender, the Portfolio will generally have direct contractual rights against the borrower in favor of the lender. If the Portfolio purchases a participation interest either from a lender or a participant, the Portfolio typically will have established a direct contractual relationship with the seller of the participation interest, but not with the borrower. Consequently, the Portfolio is subject to the credit risk of the lender or participant who sold the participation interest to the Portfolio, in addition to the usual credit risk of the borrower. In the event that the borrower, selling participant or intermediate participants become insolvent or enter into bankruptcy, the Portfolio may incur certain costs and delays in realizing payment, or may suffer a loss of principal and/or interest.
Unfunded commitments represent the remaining obligation of the Portfolio to the borrower. At any point in time, up to the maturity date of the issue, the borrower may demand the unfunded portion. Unfunded amounts, if any, are marked to market and any unrealized gains or losses are recorded in the Statement of Assets and Liabilities. As of June 30, 2019, the Portfolio held unfunded commitments. (See Note 5)
(J) Securities Lending. In order to realize additional income, the Portfolio may engage in securities lending, subject to the limitations set forth in the 1940 Act and relevant guidance by the staff of the Securities and Exchange Commission (“SEC”). In the event the Portfolio does engage in securities lending, the Portfolio will lend through its custodian, State Street Bank and Trust Company (“State Street”), acting as securities lending agent on behalf of the Portfolio. State Street will manage the Portfolio’s collateral in accordance with the securities lending agency agreement between the Portfolio and State Street, and indemnify the Portfolio against counterparty risk. The loans will be collateralized by cash (which may be invested in a money market fund) and/ornon-cash collateral (which may include, U.S. Treasury securities and/or U.S. Government Agency securities issued or guaranteed by the United States government or its agencies or instrumentalities) at least equal at all times to the market value of the securities loaned. The Portfolio may bear the risk of delay in recovery of, or loss of rights in, the securities loaned should the borrower of the securities experience financial difficulty. The Portfolio may also record a realized gain or loss on securities deemed sold due to a borrower’s inability to return securities on loan. The Portfolio bears the risk of any loss on investment of
| | |
| 40 | | MainStay VP Floating Rate Portfolio |
cash collateral. The Portfolio will receive compensation for lending its securities in the form of fees or it will retain a portion of interest on the investment of any cash collateral. The Portfolio will also continue to receive interest and dividends on the securities loaned and any gain or loss in the market price of the securities loaned that may occur during the term of the loan will be for the account of the Portfolio. Income earned from securities lending activities, if any, is reflected in the Statement of Operations. As of June 30, 2019, the Portfolio had securities on loan with an aggregate market value of $2,556,251; the total market value of collateral held by the Portfolio was $2,629,087. The market value of the collateral held includednon-cash collateral in the form of U.S. Treasury securities with a value of $747,599 and cash collateral which was invested into the State Street Navigator Securities Lending Government Money Market Portfolio with a value of $1,881,488.
(K) Debt Securities and Loan Risk. The ability of issuers of debt securities held by the Portfolio to meet their obligations may be affected by, among other things, economic or political developments in a specific country, industry or region.
The Portfolio’s principal investments include floating rate loans which are usually rated below investment grade and are generally considered speculative because they present a greater risk of loss, including default, than higher rated debt securities. These investments pay investors a higher interest rate than investment grade debt securities because of the increased risk of loss. Although certain floating rate loans are collateralized, there is no guarantee that the value of the collateral will be sufficient to repay the loan. In a recession or serious credit event, the value of these investments could decline significantly. As a result, the Portfolio’s NAVs could decrease and you could lose money.
In addition, floating rate loans generally are subject to extended settlement periods that may be longer than seven days. As a result, the Portfolio may be adversely affected by selling other investments at an unfavorable time and/or under unfavorable conditions or engaging in borrowing transactions, such as borrowing against its credit facility, to raise cash to meet redemption obligations or pursue other investment opportunities. In certain circumstances, floating rate loans may not be deemed to be securities. As a result, the Portfolio may not have the protection of the anti-fraud provisions of the federal securities laws. In such cases, the Portfolio generally must rely on the contractual provisions in the loan agreement and common-law fraud protections under applicable state law.
The ability of issuers of debt securities held by the Portfolio to meet their obligations may be affected by, among other things, economic or political developments in a specific country, industry or region. Debt securities are also subject to the risks associated with changes in interest rates.
(L) Foreign Securities Risk. The Portfolio may invest in foreign securities, which carry certain risks that are in addition to the usual risks inherent in domestic securities. These risks include those resulting from currency fluctuations, future adverse political or economic developments and possible imposition of currency exchange blockages or other foreign governmental laws or restrictions. These risks are likely to be greater in emerging markets than in developed markets. The ability of issuers of debt securities held by the Portfolio to meet their obligations may be
affected by, among other things, economic or political developments in a specific country, industry or region.
(M) Indemnifications. Under the Fund’s organizational documents, its officers and trustees are indemnified against certain liabilities that may arise out of performance of their duties to the Fund. Additionally, in the normal course of business, the Portfolio enters into contracts with third-party service providers that contain a variety of representations and warranties and which may provide general indemnifications. The Portfolio’s maximum exposure under these arrangements is unknown, as this would involve future claims that may be made against the Portfolio that have not yet occurred. Based on experience, management is of the view that the risk of loss in connection with these potential indemnification obligations is remote. However, there can be no assurance that material liabilities related to such obligations will not arise in the future, which could adversely impact the Portfolio.
Note 3–Fees and Related Party Transactions
(A) Manager and Subadvisor. New York Life Investments, a registered investment adviser and an indirect,wholly-owned subsidiary of New York Life, serves as the Portfolio’s Manager, pursuant to an Amended and Restated Management Agreement (“Management Agreement”). The Manager provides offices, conducts clerical, recordkeeping and bookkeeping services and keeps most of the financial and accounting records required to be maintained by the Portfolio. Except for the portion of salaries and expenses that are the responsibility of the Portfolio, the Manager pays the salaries and expenses of all personnel affiliated with the Portfolio and certain operational expenses of the Portfolio. The Portfolio reimburses New York Life Investments in an amount equal to a portion of the compensation of the Chief Compliance Officer attributable to the Portfolio. NYL Investors LLC (“NYL Investors” or the “Subadvisor”), a registered investment adviser and a direct,wholly-owned subsidiary of New York Life, serves as Subadvisor to the Portfolio and is responsible for theday-to-day portfolio management of the Portfolio. Pursuant to the terms of a Subadvisory Agreement (“Subadvisory Agreement”) between New York Life Investments and NYL Investors, New York Life Investments pays for the services of the Subadvisor.
The Fund, on behalf of the Portfolio, pays New York Life Investments in its capacity as the Portfolio’s investment manager and administrator, pursuant to the Management Agreement, a monthly fee for the services performed and the facilities furnished at an annual rate of average daily net assets as follows: 0.60% up to $1 billion; 0.575% from $1 billion to $3 billion; and 0.565% in excess of $3 billion. During the six-month period ended June 30, 2019, the effective management fee rate was 0.60%.
During the six-month period ended June 30, 2019, New York Life Investments earned fees from the Portfolio in the amount of $2,507,379, and paid the Subadvisor in the amount of $1,252,801.
State Street providessub-administration andsub-accounting services to the Portfolio pursuant to an agreement with New York Life Investments. These services include calculating the daily NAVs of the Portfolio, maintaining the general ledger andsub-ledger accounts for the calculation of the Portfolio’s NAVs and assisting New York Life Investments in conducting various aspects of the Portfolio’s administrative operations.
Notes to Financial Statements(Unaudited) (continued)
For providing these services to the Portfolio, State Street is compensated by New York Life Investments.
Pursuant to an agreement between the Fund and New York Life Investments, New York Life Investments is responsible for providing or procuring certain regulatory reporting services for the Portfolio. The Portfolio will reimburse New York Life Investments for the actual costs incurred by New York Life Investments in connection with providing or procuring these services for the Portfolio.
(B) Distribution and Service Fees. The Fund, on behalf of the Portfolio, has entered into a distribution agreement with NYLIFE
Distributors LLC (the “Distributor”), an indirect,wholly-owned subsidiary of New York Life. The Portfolio has adopted a distribution plan (the “Plan”) in accordance with the provisions of Rule 12b-1 under the 1940 Act. Under the Plan, the Distributor has agreed to provide, through its affiliates or independent third parties, various distribution-related, shareholder and administrative support services to the Service Class shareholders. For its services, the Distributor is entitled to a combined distribution and service fee accrued daily and paid monthly at an annual rate of 0.25% of the average daily net assets attributable to the Service Class shares of the Portfolio.
(C) Investments in Affiliates (in 000’s). During the six-month period ended June 30, 2019, purchases and sales transactions, income earned from investments and shares held of investment companies managed by New York Life Investments or its affiliates were as follows:
| | | | | | | | | | | | | | | | | | | | | | | | | | | | | | | | | | | | |
Affiliated Investment Company | | Value,
Beginning of
Period | | | Purchases
at Cost | | | Proceeds
from
Sales | | | Net
Realized
Gain/(Loss)
on Sales | | | Change in
Unrealized
Appreciation/
(Depreciation) | | | Value,
End of
Period | | | Dividend
Income | | | Other
Distributions | | | Shares
End of
Period | |
MainStay MacKay High Yield Corporate Bond Fund Class I | | $ | 2,628 | | | $ | — | | | $ | — | | | $ | — | | | $ | 142 | | | $ | 2,770 | | | $ | 82 | | | $ | — | | | | 492 | |
Note 4–Federal Income Tax
As of June 30, 2019, the cost and unrealized appreciation (depreciation) of the Portfolio’s investment portfolio, including applicable derivative contracts and other financial instruments, as determined on a federal income tax basis, were as follows:
| | | | | | | | | | | | | | | | |
| | | Federal Tax
Cost | | | Gross
Unrealized
Appreciation | | | Gross
Unrealized
(Depreciation) | | | Net
Unrealized
Appreciation/
(Depreciation) | |
| | | | |
Investments in Securities | | $ | 897,597,187 | | | $ | 2,538,321 | | | $ | (20,477,307 | ) | | $ | (17,938,986 | ) |
As of December 31, 2018, for federal income tax purposes, capital loss carryforwards of $19,154,910, as shown in the table below, were available to the extent provided by the regulations to offset future realized gains of the Portfolio through the years indicated. Accordingly, no capital gains distributions are expected to be paid to shareholders until net gains have been realized in excess of such amounts.
| | | | |
Capital Loss
Available Through | | Short-Term
Capital Loss
Amounts (000’s) | | Long-Term
Capital Loss
Amounts (000’s) |
| | |
| Unlimited | | $66 | | $19,089 |
During the year ended December 31, 2018, the tax character of distributions paid as reflected in the Statements of Changes in Net Assets was as follows:
| | |
|
| 2018 |
Tax-Based
Distributions
from Ordinary
Income | | Tax-Based
Distributions
from Long-Term
Gains |
| |
| $37,143,691 | | $ — |
Note 5–Commitments and Contingencies
As of June 30, 2019, the Portfolio held unfunded commitments pursuant to the following loan agreements:
| | | | | | | | |
Borrower | | Unfunded
Commitments | | | Unrealized
Appreciation/
(Depreciation) | |
Mavis Tire Express Services Corp. Delayed Draw Term Loan 5.652%, due 3/20/25 | | $ | 181,043 | | | $ | (3,960 | ) |
Pacific Gas & Electric Co.
Delayed Draw Term Loan 4.826%, due 12/31/20 | | | 937,500 | | | | (1,172 | ) |
Total | | | | | | $ | (5,132 | ) |
Commitments are available until maturity date.
Note 6–Custodian
State Street is the custodian of cash and securities held by the Portfolio. Custodial fees are charged to the Portfolio based on the Portfolio’s net assets and/or the market value of securities held by the Portfolio and the number of certain transactions incurred by the Portfolio.
Note 7–Line of Credit
The Portfolio and certain other funds managed by New York Life Investments maintain a line of credit with a syndicate of banks in order to secure a source of funds for temporary purposes to meet unanticipated or excessive redemption requests.
Effective July 30, 2019, under the credit agreement (the “Credit Agreement”), the aggregate commitment amount is $600,000,000 with an additional uncommitted amount of $100,000,000. The commitment fee is an annual rate of 0.15% of the average commitment amount payable quarterly, regardless of usage, to State Street, who serves as the agent to the syndicate. The commitment fee is allocated among the Portfolio and certain other funds managed by New York Life Investments
| | |
| 42 | | MainStay VP Floating Rate Portfolio |
based upon their respective net assets and other factors. Interest on any revolving credit loan is charged based upon the Federal Funds Rate or the one-month London Interbank Offered Rate (“LIBOR”), whichever is higher. The Credit Agreement expires on July 28, 2020, although the Portfolio, certain other funds managed by New York Life Investments and the syndicate of banks may renew the Credit Agreement for an additional year on the same or different terms. Prior to July 30, 2019, the aggregate commitment amount and the commitment fee were the same as those under the current Credit Agreement. During thesix-month period ended June 30, 2019, there were no borrowings made or outstanding with respect to the Portfolio under the Credit Agreement.
Note 8–Interfund Lending Program
Pursuant to an exemptive order issued by the SEC, the Portfolio, along with certain other funds managed by New York Life Investments, may participate in an interfund lending program. The interfund lending program provides an alternative credit facility that permits the Portfolio and certain other funds managed by New York Life Investments to lend or borrow money for temporary purposes directly to or from one another subject to the conditions of the exemptive order. During the six-month period ended June 30, 2019, there were no interfund loans made or outstanding with respect to the Portfolio.
Note 9–Purchases and Sales of Securities (in 000’s)
During the six-month period ended June 30, 2019, purchases and sales of securities, other thanshort-term securities, were $161,524 and $95,750, respectively.
Note 10–Capital Share Transactions
Transactions in capital shares for the six-month period ended June 30, 2019 and the year ended December 31, 2018, were as follows:
| | | | | | | | |
Initial Class | | Shares | | | Amount | |
| | |
Six-month period ended June 30, 2019: | | | | | | | | |
Shares sold | | | 7,286,156 | | | $ | 64,844,787 | |
Shares issued to shareholders in reinvestment of dividends and distributions | | | 646,598 | | | | 5,757,223 | |
Shares redeemed | | | (1,154,182 | ) | | | (10,284,168 | ) |
| | | | |
Net increase (decrease) | | | 6,778,572 | | | $ | 60,317,842 | |
| | | | |
Year ended December 31, 2018: | | | | | | | | |
Shares sold | | | 1,195,603 | | | $ | 10,838,825 | |
Shares issued to shareholders in reinvestment of dividends and distributions | | | 1,167,257 | | | | 10,493,538 | |
Shares redeemed | | | (9,251,777 | ) | | | (83,588,619 | ) |
| | | | |
Net increase (decrease) | | | (6,888,917 | ) | | $ | (62,256,256 | ) |
| | | | |
| | |
| | | | | | | | |
| | | | | | | | |
Service Class | | Shares | | | Amount | |
Six-month period ended June 30, 2019: | | | | | | | | |
Shares sold | | | 5,594,169 | | | $ | 49,899,498 | |
Shares issued to shareholders in reinvestment of dividends and distributions | | | 1,685,049 | | | | 15,012,642 | |
Shares redeemed | | | (9,921,820 | ) | | | (88,362,573 | ) |
| | | | |
Net increase (decrease) | | | (2,642,602 | ) | | $ | (23,450,433 | ) |
| | | | |
Year ended December 31, 2018: | | | | | | | | |
Shares sold | | | 17,862,616 | | | $ | 161,534,729 | |
Shares issued to shareholders in reinvestment of dividends and distributions | | | 2,977,486 | | | | 26,650,153 | |
Shares redeemed | | | (14,253,759 | ) | | | (128,685,844 | ) |
| | | | |
Net increase (decrease) | | | 6,586,343 | | | $ | 59,499,038 | |
| | | | |
Note 11–Recent Accounting Pronouncement
To improve the effectiveness of fair value disclosure requirements, the Financial Accounting Standards Board recently issued Accounting Standard Update (ASU)2018-13, Fair Value Measurement Disclosure Framework—Changes to the Disclosure Requirements for Fair Value Measurement (ASU2018-13), which adds, removes, and modifies certain aspects relating to fair value disclosure. ASU2018-13 is effective for interim and annual reporting periods beginning after December 15, 2019; early adoption of the additions relating to ASU2018-13 is not required. Management has evaluated the implications of certain other provisions of the ASU and has determined to early adopt aspects related to the removal and modifications of certain fair value measurement disclosures under the ASU effective immediately. At this time, management is evaluating the implications of certain other provisions of the ASU related to new disclosure requirements and any impact on the financial statement disclosures has not yet been determined.
Note 12–Subsequent Events
In connection with the preparation of the financial statements of the Portfolio as of and for the six-month period ended June 30, 2019, events and transactions subsequent to June 30, 2019, through the date the financial statements were issued have been evaluated by the Portfolio’s management for possible adjustment and/or disclosure. No subsequent events requiring financial statement adjustment or disclosure have been identified.
Proxy Voting Policies and Procedures and Proxy Voting Record
A description of the policies and procedures that New York Life Investments uses to vote proxies related to the Portfolio’s securities is available without charge, upon request (i) by calling800-598-2019; (ii) by visiting New York Life Investments website at https://www.nylinvestments.com/mainstay/products-and-performance/mainstay-vp-funds-trust; or (iii) by visiting the SEC’s website at www.sec.gov.
The Portfolio is required to file with the SEC its proxy voting record for the12-month period ending June 30 on Form N-PX. The Portfolio’s most recent Form N-PX or proxy voting record is available free of charge upon request (i) by calling800-598-2019; (ii) by visiting New York Life Investments website at https://www.nylinvestments.com/mainstay/products-and-performance/mainstay-vp-funds-trust; or (iii) by visiting the SEC’s website atwww.sec.gov.
Shareholder Reports and Quarterly Portfolio Disclosure
The Portfolio is required to file its complete schedule of portfolio holdings with the SEC 60 days after each fiscal quarter onForm N-PORT. The Portfolio’s holdings report is available without charge upon request (i) by calling800-598-2019; (ii) by visiting New York Life Investments website at https://www.nylinvestments.com/mainstay/products-and-performance/mainstay-vp-funds-trust; or (iii) on the SEC’s website at www.sec.gov.
| | |
| 44 | | MainStay VP Floating Rate Portfolio |
MainStay VP Portfolios
MainStay VP offers a wide range of Portfolios. The full array of MainStay VP offerings is listed here, with information about the manager, subadvisors, legal counsel, and independent registered public accounting firm.
Equity Portfolios
MainStay VP Eagle Small Cap Growth Portfolio
MainStay VP Emerging Markets Equity Portfolio
MainStay VP Epoch U.S. Equity Yield Portfolio
MainStay VP Fidelity Institutional AM® Utilities Portfolio†
MainStay VP Large Cap Growth Portfolio
MainStay VP MacKay Common Stock Portfolio
MainStay VP MacKay Growth Portfolio
MainStay VP MacKay International Equity Portfolio
MainStay VP MacKay Mid Cap Core Portfolio
MainStay VP MacKay S&P 500 Index Portfolio
MainStay VP MacKay Small Cap Core Portfolio
MainStay VP Mellon Natural Resources Portfolio
MainStay VP T. Rowe Price Equity Income Portfolio
Mixed Asset Portfolios
MainStay VP Balanced Portfolio
MainStay VP Income Builder Portfolio
MainStay VP Janus Henderson Balanced Portfolio
MainStay VP MacKay Convertible Portfolio
Income Portfolios
MainStay VP Bond Portfolio
MainStay VP Floating Rate Portfolio
MainStay VP Indexed Bond Portfolio
MainStay VP MacKay Government Portfolio
MainStay VP MacKay High Yield Corporate Bond Portfolio
MainStay VP MacKay Unconstrained Bond Portfolio
MainStay VP PIMCO Real Return Portfolio
Money Market
MainStay VP U.S. Government Money Market Portfolio
Alternative
MainStay VP Cushing Renaissance Advantage Portfolio
MainStay VP IQ Hedge Multi-Strategy Portfolio
Asset Allocation Portfolios
MainStay VP Conservative Allocation Portfolio
MainStay VP Growth Allocation Portfolio
MainStay VP Moderate Allocation Portfolio
MainStay VP Moderate Growth Allocation Portfolio
Manager
New York Life Investment Management LLC
New York, New York
Subadvisors
Candriam Belgium*
Brussels, Belgium
Cushing Asset Management, LP
Dallas, Texas
Eagle Asset Management, Inc.
St Petersburg, Florida
Epoch Investment Partners, Inc.
New York, New York
FIAM LLC
Smithfield, Rhode Island
IndexIQ Advisors LLC*
New York, New York
Janus Capital Management LLC
Denver, Colorado
MacKay Shields LLC*
New York, New York
Mellon Investments Corporation
Boston, Massachusetts
NYL Investors LLC*
New York, New York
Pacific Investment Management Company LLC
Newport Beach, California
T. Rowe Price Associates, Inc.
Baltimore, Maryland
Winslow Capital Management, LLC
Minneapolis, Minnesota
Distributor
NYLIFE Distributors LLC*
Jersey City, New Jersey
Custodian
State Street Bank and Trust Company
Boston, Massachusetts
Independent Registered Public Accounting Firm
PricewaterhouseCoopers LLP
New York, New York
Legal Counsel
Dechert LLP
Washington, District of Columbia
Some Portfolios may not be available in all products.
| † | Fidelity Institutional AM is a registered trade mark of FMR LLC. Used with permission. |
| * | An affiliate of New York Life Investment Management LLC |
Not part of the Semiannual Report
2019 Semiannual Report
This report is for the general information of New York Life Variable Annuities and NYLIAC Variable Universal Life Insurance Products policyowners. It must be preceded or accompanied by the appropriate product(s) and funds prospectuses if it is given to anyone who is not an owner of a New York Life variable annuity policy or a NYLIAC Variable Universal Life Insurance Product. This report does not offer for sale or solicit orders to purchase securities.
The performance data quoted in this report represents past performance. Past performance is no guarantee of future results. Due to market volatility and other factors, current performance may be lower or higher than the figures shown. The most recent month-end performance summary for your variable annuity or variable life policy is available by calling 800-598-2019 and is updated periodically on www.newyorklife.com.
The New York Life Variable Annuities and NYLIAC Variable Universal Life Insurance Products are issued by New York Life Insurance and Annuity Corporation (a Delaware Corporation) and distributed by NYLIFE Distributors LLC (Member FINRA/SIPC).
New York Life Insurance Company
New York Life Insurance and Annuity Corporation (NYLIAC) (A Delaware Corporation)
51 Madison Avenue, Room 551
New York, NY 10010
www.newyorklife.com
Printed on recycled paper
nylinvestments.com
NYLIFE Distributors LLC, 30 Hudson Street, Jersey City, NJ 07302
New York Life Investment Management LLC is the investment manager to the MainStay VP Funds Trust
©2019 by NYLIFE Distributors LLC. All rights reserved.
You may obtain copies of the Prospectus and the Statement of Additional Information free of charge, upon request, by callingtoll-free 800-598-2019 or writing to New York Life Insurance and Annuity Corporation, 51 Madison Avenue, New York, NY 10010.
| | | | |
| | | |
| Not FDIC Insured | | No Bank Guarantee | | May Lose Value |
| | | | |
| 1781620 | | | | MSVPFR10-08/19 (NYLIAC) NI518 |
MainStay VP MacKay Government Portfolio
Message from the President and Semiannual Report
Unaudited | June 30, 2019

Beginning on January 1, 2021, as permitted by regulations adopted by the Securities and Exchange Commission, paper copies of the MainStay VP Portfolio annual and semi-annual shareholder reports may no longer be sent by mail, unless you specifically request paper copies of the reports from the insurance company that offers your policy. Instead, the reports will be made available online, and you will be notified by mail each time a report is posted and provided with a website link to access the report. Instructions for requesting paper copies will be provided by your insurance company.
If you already elected to receive shareholder reports electronically, you will not be affected by this change and you need not take any action. At any time, you may elect to receive reports and other communications from the insurance company electronically by following the instructions provided by the insurance company.
You may elect to receive all future shareholder reports in paper form free of charge. You can inform the insurance company that you wish to receive paper copies of reports by following the instructions provided by the insurance company. Your election to receive reports in paper form will apply to all portfolio companies available under your contract.
| | | | | | | | |
| | | | | |
| Not FDIC/NCUA Insured | | Not a Deposit | | May Lose Value | | No Bank Guarantee | | Not Insured by Any Government Agency |

This page intentionally left blank
Message from the President
Most equity and fixed-income markets in the United States and around the world advanced in the face of conflicting political and macroeconomic forces during thesix-month period ended June 30, 2019.
The reporting period began on the heels of tumultuous December 2018, during which equities and equity-sensitive bonds spiked sharply lower on concerns regarding the pace of economic growth, a U.S. government shutdown and the potential impact of trade disputes between the United States and other nations, particularly China. Markets recovered quickly in early 2019 as trade tensions eased, the government reopened and the U.S. Federal Reserve Board (Fed) adopted a more patient tone regarding the future direction of interest rates. Markets moved broadly higher from January through April, supported by encouraging economic data and generally strong corporate earnings.
During the first four months of the reporting period, the improving economic environment encouraged investors to favor areas of the market viewed as offering greater return potential along with higher risks. Among U.S. stocks, cyclical, growth-oriented sectors tended to outperform more defensive, value-oriented sectors, whilelarge-cap stocks outperformed theirsmaller-cap counterparts. Within the S&P 500® Index, the information technology sector led the market’s advance, followed by communication services, consumer discretionary and consumer staples. Industrials, utilities, financials, materials, real estate and energy produced more modest gains. While some international equity markets outperformed or underperformed the U.S. market, on average international stocks mirrored the performance of their U.S. counterparts. Fixed-income securities gained ground as well, albeit along a more gradual trajectory. Among U.S. fixed-income instruments, corporate issues generally outperformed government bonds, with lower credit quality, higher yielding securities leading the sector’s advance. Long-term U.S. Treasury bond yields proved particularly weak, with
10-year yields dipping at times below3-month yields, reflecting investors’ continued concerns about domestic economic growth.
May 2019 saw a return of uncertainty and volatility. Trade discussions between the United States and China faltered, driving global equity prices lower. Government bond prices rose as investors sought safe havens. June brought yet anotherU-turn as equity prices climbed again after comments from the Fed raised hopes of an interest rate cut in response to weak economic data. Stock and bond prices rose, with U.S. equity markets ending the reporting period in record territory.
We are pleased to see renewed signs of strength in broad areas of the financial market. At the same time, we remained sharply focused on providing you, as a MainStay VP investor, with the experienced and disciplined fund management that we believe underpins an effective, long-term investment strategy. Whatever tomorrow’s investment environment brings, you can rely on our portfolio managers to pursue the objectives of their individual Portfolios as outlined in the prospectus with the energy and dedication you have come to expect.
The report that follows contains additional information on the market events, investment decisions and specific securities that shaped your VP Portfolio’s performance during the six months ended June 30, 2019. We encourage you to read the report carefully and use it to evaluate your Portfolio’s performance in light of your long-range financial plan.
Sincerely,

Kirk C. Lehneis
President
The opinions expressed are as of the date of this report and are subject to change. There is no guarantee that any forecast made will come to pass. This material does not constitute investment advice and is not intended as an endorsement of any specific investment. Past performance is no guarantee of future results.
Not part of the Semiannual Report
Table of Contents
Investors should refer to the Portfolio’s Summary Prospectus and/or Prospectus and consider the Portfolio’s investment objectives, strategies, risks, charges and expenses carefully before investing. The Summary Prospectus and/or Prospectus contain this and other information about the Portfolio. You may obtain copies of the Portfolio’s Summary Prospectus and/or the Prospectus and the Statement of Additional Information free of charge, upon request, by calling toll-free 800-598-2019, by writing to New York Life Insurance and Annuity Corporation, 51 Madison Avenue, Room 251, New York, New York 10010 or by sending an email to MainStayShareholdersServices@nylim.com. These documents are also available at nylinvestments.com/vpdocuments. Please read the Summary Prospectus and/or Prospectus carefully before investing. MainStay VP Funds Trust portfolios are separate account options which are purchased through a variable insurance or variable annuity contract.
Investment and Performance Comparison1(Unaudited)
Performance data quoted represents past performance. Past performance is no guarantee of future results. Because of market volatility and other factors, current performance may be lower or higher than the figures shown. Investment return and principal value will fluctuate, and as a result, when shares are redeemed, they may be worth more or less than their original cost. The performance table and graph do not reflect any deduction of sales charges, mortality and expense charges, contract charges or administrative charges. Please refer to the Performance Summary appropriate for your policy. For performance information current to the most recent month-end, please call800-598-2019 or visit www.newyorklife.com.
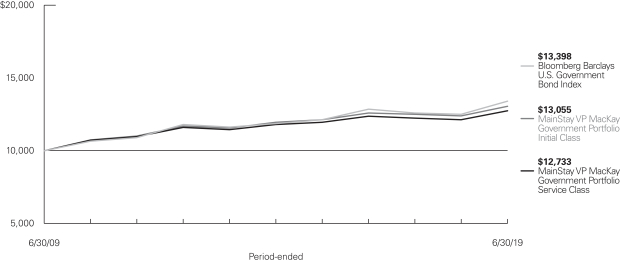
Average Annual Total Returns for the Period-Ended June 30, 2019
| | | | | | | | | | | | | | | | | | | | | | |
| Class | | Inception
Date | | Six Months | | | One Year | | | Five Years | | | Ten Years | | | Gross
Expense
Ratio2 | |
| | | | | | |
| Initial Class Shares | | 1/29/1993 | | | 3.95 | % | | | 5.30 | % | | | 1.79 | % | | | 2.70 | % | | | 0.57 | % |
| Service Class Shares | | 6/4/2003 | | | 3.82 | | | | 5.04 | | | | 1.53 | | | | 2.45 | | | | 0.82 | |
| | | | | | | | | | | | | | | | |
| Benchmark Performance | | Six
Months | | | One
Year | | | Five
Years | | | Ten
Years | |
| | | | |
Bloomberg Barclays U.S. Government Bond Index3 | | | 5.15 | % | | | 7.21 | % | | | 2.48 | % | | | 2.97 | % |
Morningstar Intermediate Government Category Average4 | | | 4.35 | | | | 6.08 | | | | 1.96 | | | | 2.79 | |
| 1. | Performance figures may reflect certain fee waivers and/or expense limitations, without which total returns may have been different. For information on current fee waivers and/or expense limitations (if any), please refer to the Notes to Financial Statements. |
| 2. | The gross expense ratios presented reflect the Portfolio’s “Total Annual Portfolio Operating Expenses” from the most recent Prospectus, as supplemented, and may differ from other expense ratios disclosed in this report. |
| 3. | The Bloomberg Barclays U.S. Government Bond Index is the Portfolio’s primary broad-based securities market index for comparison purposes. The Bloomberg Barclays U.S. Government Bond Index consists of publicly issued |
| | debt of the U.S. Treasury and government agencies. Results assume the reinvestment of all income and capital gains. An investment cannot be made directly in an index. |
| 4. | The Morningstar Intermediate Government Category Average is representative of funds that have at least 90% of their bond holdings in bonds backed by U.S. government or by U.S. government-linked agencies. These funds have durations between 3.5 and 6 years and/or average effective maturities between 4 and 10 years. Results are based on average total returns of similar funds with all dividends and capital gain distributions reinvested. |
Cost in Dollars of a $1,000 Investment in MainStay VP MacKay Government Portfolio (Unaudited)
The example below is intended to describe the fees and expenses borne by shareholders during the six-month period from January 1, 2019, to June 30, 2019, and the impact of those costs on your investment.
Example
As a shareholder of the Portfolio you incur two types of costs: (1) transaction costs, including exchange fees and sales charges (loads) on purchases (as applicable), and (2) ongoing costs, including management fees, distribution and/or service (12b-1) fees, and other Portfolio expenses (as applicable). This example is intended to help you understand your ongoing costs (in dollars) of investing in the Portfolio and to compare these costs with the ongoing costs of investing in other mutual funds. The example is based on an investment of $1,000 made at the beginning of the six-month period and held for the entire period from January 1, 2019, to June 30, 2019. Shares are only sold in connection with variable life and annuity contracts and the example does not reflect any contract level or transactional fees or expenses. If these costs had been included, your costs would have been higher.
This example illustrates your Portfolio’s ongoing costs in two ways:
Actual Expenses
The second and third data columns in the table below provide information about actual account values and actual expenses. You may use the information in these columns, together with the amount you invested, to estimate the expenses that you paid during the six months ended June 30, 2019. Simply divide your account value by $1,000
(for example, an $8,600 account value divided by $1,000 = 8.6), then multiply the result by the number under the heading entitled “Expenses Paid During Period” to estimate the expenses you paid on your account during this period.
Hypothetical Example for Comparison Purposes
The fourth and fifth data columns in the table below provide information about hypothetical account values and hypothetical expenses based on the Portfolio’s actual expense ratio and an assumed rate of return of 5% per year before expenses, which is not the Portfolio’s actual return. The hypothetical account values and expenses may not be used to estimate the actual ending account balances or expenses you paid for thesix-month period shown. You may use this information to compare the ongoing costs of investing in the Portfolio with the ongoing costs of investing in other mutual funds. To do so, compare this 5% hypothetical example with the 5% hypothetical examples that appear in the shareholder reports of the other mutual funds.
Please note that the expenses shown in the table are meant to highlight your ongoing costs only and do not reflect any transactional costs, such as exchange fees or sales charges (loads). Therefore, the fourth and fifth data columns of the table are useful in comparing ongoing costs only and will not help you determine the relative total costs of owning different funds. In addition, if these transactional costs were included, your costs would have been higher.
| | | | | | | | | | | | | | | | | | | | | | |
| | | | | | | | | | | | | | | | | | |
| Share Class | | Beginning
Account
Value
1/1/19 | | | Ending Account
Value (Based
on Actual
Returns and
Expenses)
6/30/19 | | | Expenses
Paid
During
Period1 | | | Ending Account
Value (Based
on Hypothetical
5% Annualized
Return and
Actual Expenses)
6/30/19 | | | Expenses
Paid
During
Period1 | | | Net Expense
Ratio
During
Period2 |
| | | | | | |
| Initial Class Shares | | $ | 1,000.00 | | | $ | 1,039.50 | | | $ | 2.88 | | | $ | 1,021.97 | | | $ | 2.86 | | | 0.57% |
| | | | | | |
| Service Class Shares | | $ | 1,000.00 | | | $ | 1,038.20 | | | $ | 4.14 | | | $ | 1,020.73 | | | $ | 4.11 | | | 0.82% |
| 1. | Expenses are equal to the Portfolio’s annualized expense ratio of each class multiplied by the average account value over the period, divided by 365 and multiplied by 181 (to reflect the six-month period). The table above represents the actual expenses incurred during the six-month period. In addition to the fees and expenses which the Portfolio bears directly, it also indirectly bears a pro rata share of the fees and expenses of the underlying funds in which it invests. Such indirect expenses are not included in the above-reported expense figures. |
| 2. | Expenses are equal to the Portfolio’s annualized expense ratio to reflect the six-month period. |
| | |
| 6 | | MainStay VP MacKay Government Portfolio |
Portfolio Composition as of June 30, 2019(Unaudited)
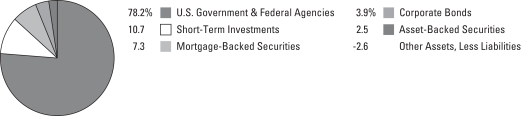
See Portfolio of Investments beginning on page 10 for specific holdings within these categories. The Portfolio’s holdings are subject to change.
Top Ten Holdings as of June 30, 2019 (excluding short-term investments) (Unaudited)
| 1. | United States Treasury Notes, 2.375%, due 4/30/20 |
| 2. | United States Treasury Notes, 2.625%, due 7/31/20 |
| 3. | United States Treasury Notes, 2.25%, due 4/30/24 |
| 4. | United States Treasury Notes, 3.00%, due 10/31/25 |
| 5. | United States Treasury Notes, 2.875%, due 10/31/20 |
| 6. | Federal National Mortgage Association (Mortgage Pass-Through Securities), 4.50%, due 4/1/41 |
| 7. | United States Treasury Notes, 2.75%, due 4/30/23 |
| 8. | Tennessee Valley Authority, 4.65%, due 6/15/35 |
| 9. | Federal National Mortgage Association (Mortgage Pass-Through Securities), 5.50%, due 7/1/41 |
| 10. | Federal National Mortgage Association (Mortgage Pass-Through Securities), 4.00%, due 8/1/38 |
Portfolio Management Discussion and Analysis(Unaudited)
Answers to the questions reflect the views of portfolio managers Dan Roberts, PhD, Steven H. Rich, Stephen R. Cianci, CFA, and Neil Moriarty, III, of MacKay Shields LLC, the Portfolio’s Subadvisor.
How did MainStay VP MacKay Government Portfolio perform relative to its benchmark and peers during the six months ended June 30, 2019?
For the six months ended June 30, 2019, MainStay VP MacKay Government Portfolio returned 3.95% for Initial Class shares and 3.82% for Service Class shares. Over the same period, both share classes underperformed the 5.15% return of the Bloomberg Barclays U.S. Government Bond Index, which is the Portfolio’s benchmark, and the 4.35% return of the Morningstar Intermediate Government Category Average.1
What factors affected the Portfolio’s relative performance during the reporting period?
Four principal factors determined the Portfolio’s performance relative to the Bloomberg Barclays U.S. Government Bond Index during the reporting period: duration,2 yield-curve3 posture, sector weighting and issue selection. Issue selection and yield advantage were the Portfolio’s principal performance tailwinds during the reporting period, while duration posture proved a headwind.
During the reporting period, U.S. Treasury yields fell across the yield curve. Yields fell most steeply in shorter maturities of 1 to 5 years because bond market participants, noting the inconsistency between tepid U.S. economic growth prospects and the prevailing 2.5% federal funds rate set by the Federal Reserve (Fed), anticipated a Fed rate cut over the medium term. More modest declines in longer-maturity yields reflected restrained inflation and aggregate demand failing to pressure resource capacity. Against this backdrop, the Portfolio’s shorter duration made it less sensitive to changes in U.S. Treasury yields than the benchmark and longer-duration peers. The Portfolio’s relatively short duration posture disadvantaged it for most of the reporting period and was the primary source of the Portfolio’s underperformance.
Regarding the Portfolio’s yield-curve posture, the steepening of the yield curve aligned better with comparable-duration peers whose cash flows were more concentrated in the short end of the yield curve. In contrast, a portion of the Portfolio’s cash flows were distributed in the intermediate- and longer-duration segments of the curve.
Regarding sector weightings, agency mortgage pass-throughs were the largest class of securities in the Portfolio. The Portfolio’s commitment to agency mortgage pass-throughs imparted a yield advantage over lower-yielding U.S. Treasury securities and agency debentures. This benefit was partially offset by the underperformance of agency mortgage-backed securities rela-
tive to comparable-duration U.S. Treasury securities as mortgage rates fell alongside Treasury yields. The Portfolio’s diversity of assets, with sizeable exposures to both U.S. Treasury securities and mortgage-backed securities, worked to the Portfolio’s benefit as interest-rate volatility weighed on mortgage returns, but had limited impact on returns from U.S. Treasury holdings.
Regarding issue selection, the Portfolio’s willingness to emphasize30-year loan terms over shorter(15- and20-year) loan terms, produced mixed results. The30-year loan terms tend to outperform because they are more sensitive to a flatter U.S. Treasury yield curve (due to their wider cashflow windows as the long loan term expands the window over which borrowers may prepay). That said, the Portfolio’s distribution of agency mortgage pass-through securities across the coupon stack favored higher coupons, which often had durations equivalent to the shorter U.S. Treasury securities associated with the reporting period’s sharpest yield declines.
The Portfolio also favored seasoned loans (i.e., loans originated in prior years) andlow-balance loans. Mortgage pass-through securities backed by loans with these characteristics often have more stable cash-flow profiles. As lower mortgage rates prompted borrowers to refinance, the return impact of prepayments was more extreme than in recent prior reporting periods. This dynamic led the market to recalibrate the worth of cash-flow stability, undermining the advantages of seasoning and loan balance. On the positive side, the Portfolio’s holdings in this market segment appreciated in price faster than comparable-duration U.S. Treasury securities. The Portfolio also benefited from the stability of its collateralized mortgage obligations, which are structured to dampen cash-flow variability.
What was the Portfolio’s duration strategy during the reporting period?
As U.S. Treasury yields and mortgage rates fell during the reporting period, the Portfolio’s duration contracted from 3.9 to 3.5 years while the duration of the Bloomberg Barclays U.S. Government Bond Index lengthened from 6.0 years to 6.3 years. The Portfolio declined to lengthen its duration because, with Treasury yields compressed in a narrow range between the 1.75% yield of thetwo-year maturity and the 2.5% yield of the30-year maturity, thetrade-off to pick up additional yield by extending out the curve was not compelling. In our view, moving out the curve would present the risk of negative price return should Treasury yields rise, and this effect could readily erode yield advantage.
| 1. | See page 5 for more information on benchmark and peer group returns. |
| 2. | Duration is a measure of the price sensitivity of a fixed-income investment to changes in interest rates. Duration is expressed as a number of years and is considered a more accurate sensitivity gauge than average maturity. |
| 3. | The yield curve is a line that plots the yields of various securities of similar quality—typically U.S. Treasury issues—across a range of maturities. The U.S. Treasury yield curve serves as a benchmark for other debt and is used in economic forecasting. |
| | |
| 8 | | MainStay VP MacKay Government Portfolio |
Which sectors were the strongest contributors to the Portfolio’s performance and which sectors were particularly weak?
As described earlier, the Portfolio’s holdings among agency mortgage pass-throughs contributed positively to performance, imparting a yield advantage over lower-yielding U.S. Treasury securities and agency debentures. (Contributions take weightings and total returns into account.) This benefit was partially offset by the underperformance of agency mortgage-backed securities relative to comparable-duration U.S. Treasury securities as mortgage rates fell alongside Treasury yields. The Portfolio’s diversity of assets, with sizeable exposures to both U.S. Treasury securities and mortgage-backed securities, worked to the Portfolio’s benefit as interest-rate volatility weighed on mortgage returns, but had limited impact on Treasury returns.
What were some of the Portfolio’s largest purchases and sales during the reporting period?
The Portfolio exited its positions in pass-through mortgage-backed securities issued by Ginnie Mae during the reporting period, shifting those assets into collateralized mortgage obligations, for incremental yield pickup.
How did the Portfolio’s sector weightings change during the reporting period?
During the period, the Portfolio’s exposure to agency mortgage-backed securities fell by 4% and the Portfolio’s exposure to U.S. Treasury securities rose by an equivalent amount. This sector rotation improved the Portfolio’s convexity.4
How was the Portfolio positioned at the end of the reporting period?
As of June 30, 2019, the Portfolio held underweight exposure to U.S. Treasury securities, roughly equal weight exposure to agency debentures and overweight exposure to agency mortgage pass-throughs relative to the Bloomberg Barclays U.S. Government Bond Index. As of the same date, the Portfolio also held modestly overweight positions in asset-backed securities, commercial mortgage-backed securities and corporate bonds, withnon-government exposure totaling roughly 8% of Portfolio assets. The Portfolio ended the reporting period with 7% of its assets in agency discount notes.
| 4. | Convexity is a mathematical measure of the sensitivity of an interest-bearing bond to changes in interest rates. |
The opinions expressed are those of the portfolio managers as of the date of this report and are subject to change. There is no guarantee that any forecasts will come to pass. This material does not constitute investment advice and is not intended as an endorsement of any specific investment.
Not all MainStay VP Portfolios and/or share classes are available under all policies.
Portfolio of InvestmentsJune 30, 2019 (Unaudited)
| | | | | | | | |
| | | Principal
Amount | | | Value | |
Long-Term Bonds 91.9%† Asset-Backed Securities 2.5% | |
Other Asset-Backed Securities 2.2% | |
PSNH Funding LLC
Series 2018-1, Class A1
3.094%, due 2/1/26 | | $ | 434,873 | | | $ | 443,077 | |
Small Business Administration Participation Certificates | | | | | | | | |
Series 2012-20L, Class 1
1.93%, due 12/1/32 | | | 526,458 | | | | 521,799 | |
Series 2014-20H, Class 1
2.88%, due 8/1/34 | | | 621,924 | | | | 636,795 | |
Series 2015-20G, Class 1
2.88%, due 7/1/35 | | | 1,521,012 | | | | 1,566,761 | |
Series 2014-20I, Class 1
2.92%, due 9/1/34 | | | 645,687 | | | | 662,959 | |
Series 2014-20C, Class 1
3.21%, due 3/1/34 | | | 1,131,666 | | | | 1,178,787 | |
| | | | | | | | |
| | | | | | | 5,010,178 | |
| | | | | | | | |
Utilities 0.3% | |
Atlantic City Electric Transition Funding LLC
Series 2002-1, Class A4
5.55%, due 10/20/23 | | | 677,767 | | | | 705,152 | |
| | | | | | | | |
Total Asset-Backed Securities
(Cost $5,608,124) | | | | | | | 5,715,330 | |
| | | | | | | | |
|
| Corporate Bonds 3.9% | |
Agriculture 0.5% | |
Altria Group, Inc.
2.85%, due 8/9/22 | | | 1,170,000 | | | | 1,182,359 | |
| | | | | | | | |
|
Electric 1.8% | |
Consolidated Edison Co. of New York, Inc.
2.749% (3 Month LIBOR + 0.40%), due 6/25/21 (a) | | | 1,550,000 | | | | 1,553,880 | |
Duke Energy Florida Project Finance LLC
2.538%, due 9/1/31 | | | 1,900,000 | | | | 1,895,825 | |
PECO Energy Co.
1.70%, due 9/15/21 (b) | | | 670,000 | | | | 663,592 | |
| | | | | | | | |
| | | | | | | 4,113,297 | |
| | | | | | | | |
Pipelines 0.5% | |
Plains All American Pipeline, L.P. / PAA Finance Corp.
5.00%, due 2/1/21 | | | 1,200,000 | | | | 1,236,039 | |
| | | | | | | | |
|
Real Estate Investment Trusts 1.1% | |
Host Hotels & Resorts, L.P.
3.75%, due 10/15/23 | | | 2,350,000 | | | | 2,407,390 | |
| | | | | | | | |
Total Corporate Bonds
(Cost $8,839,330) | | | | | | | 8,939,085 | |
| | | | | | | | |
| | | | | | | | |
| | | Principal
Amount | | | Value | |
| Mortgage-Backed Securities 7.3% | |
Agency (Collateralized Mortgage Obligations) 5.5% | |
Federal Home Loan Mortgage Corporation | | | | | | | | |
REMIC Series 4691, Class HA
2.50%, due 6/15/40 | | $ | 617,661 | | | $ | 614,961 | |
Series 2019-1, Class A1
3.50%, due 5/25/29 | | | 484,600 | | | | 504,027 | |
REMIC Series 4818, Class BD
3.50%, due 3/15/45 | | | 632,790 | | | | 655,984 | |
REMIC Series 4884, Class BA
3.50%, due 6/15/48 | | | 549,967 | | | | 572,243 | |
REMIC Series 4888, Class BA
3.50%, due 9/15/48 | | | 440,429 | | | | 458,524 | |
REMIC Series 4877, Class AT
3.50%, due 11/15/48 | | | 566,907 | | | | 594,825 | |
REMIC Series 4877, Class BE
3.50%, due 11/15/48 | | | 829,807 | | | | 869,926 | |
Federal National Mortgage Association | | | | | | | | |
Series 2019-25, Class PA
3.00%, due 5/25/48 | | | 527,310 | | | | 538,578 | |
Series 2019-13, Class PE
3.00%, due 3/25/49 | | | 664,912 | | | | 680,105 | |
Government National Mortgage Association | | | | | | | | |
Series 2014-91, Class MA
3.00%, due 1/16/40 | | | 621,206 | | | | 637,159 | |
Series 2018-127, Class PB
3.00%, due 9/20/47 | | | 1,387,668 | | | | 1,416,260 | |
Series 2019-29, Class CB
3.00%, due 10/20/48 | | | 499,083 | | | | 508,765 | |
Series 2019-52, Class JL
3.00%, due 11/20/48 | | | 529,578 | | | | 541,002 | |
Series 2019-59, Class KA
3.00%, due 12/20/48 | | | 917,863 | | | | 940,197 | |
Series 2019-43, Class PL
3.00%, due 4/20/49 | | | 501,453 | | | | 511,190 | |
Series 2019-74, Class AT
3.00%, due 6/20/49 | | | 748,000 | | | | 765,909 | |
Series 2013-149, Class BA
3.25%, due 8/16/41 | | | 1,718,506 | | | | 1,779,337 | |
| | | | | | | | |
| | | | | | | 12,588,992 | |
| | | | | | | | |
Commercial Mortgage Loans
(Collateralized Mortgage Obligations) 1.4% | |
BXP Trust
Series 2017-GM, Class A
3.379%, due 6/13/39 (c) | | | 1,750,000 | | | | 1,832,527 | |
Four Times Square Trust
Series 2006-4TS, Class A
5.401%, due 12/13/28 (c) | | | 498,262 | | | | 516,490 | |
Wells Fargo Commercial Mortgage Trust
Series 2018-1745, Class A
3.874%, due 6/15/36 (c)(d) | | | 900,000 | | | | 964,191 | |
| | | | | | | | |
| | | | | | | 3,313,208 | |
| | | | | | | | |
| | | | |
| 10 | | MainStay VP MacKay Government Portfolio | | The notes to the financial statements are an integral part of,
and should be read in conjunction with, the financial statements. |
| | | | | | | | |
| | | Principal
Amount | | | Value | |
| Mortgage-Backed Securities (continued) | |
Residential Mortgage (Collateralized Mortgage Obligation) 0.1% | |
Citigroup Mortgage Loan Trust, Inc.
Series 2006-AR6, Class 1A1
4.397%, due 8/25/36 (d) | | $ | 143,554 | | | $ | 135,006 | |
| | | | | | | | |
|
Whole Loan Collateral (Collateralized Mortgage Obligation) 0.3% | |
Chase Home Lending Mortgage Trust
Series 2019-ATR1, Class A4
4.00%, due 4/25/49 (c)(e) | | | 696,099 | | | | 708,217 | |
| | | | | | | | |
Total Mortgage-Backed Securities
(Cost $16,421,081) | | | | | | | 16,745,423 | |
| | | | | | | | |
|
| U.S. Government & Federal Agencies 78.2% | |
Fannie Mae Strip (Collateralized Mortgage Obligations) 0.0% (f)‡ | |
Series 360, Class 2, IO
5.00%, due 8/25/35 | | | 91,813 | | | | 16,620 | |
Series 361, Class 2
6.00%, due 10/25/35 | | | 19,541 | | | | 4,730 | |
| | | | | | | | |
| | | | | | | 21,350 | |
| | | | | | | | |
Federal Home Loan Mortgage Corporation
(Mortgage Pass-Through Securities) 11.1% | |
2.50%, due 8/1/46 | | | 1,676,644 | | | | 1,665,838 | |
3.00%, due 2/1/46 | | | 3,375,177 | | | | 3,426,677 | |
3.00%, due 4/1/47 | | | 3,430,732 | | | | 3,476,402 | |
3.00%, due 12/1/47 | | | 958,117 | | | | 968,192 | |
3.50%, due 8/1/38 | | | 933,439 | | | | 961,315 | |
3.50%, due 1/1/43 | | | 751,164 | | | | 785,110 | |
3.50%, due 1/1/44 | | | 432,019 | | | | 448,738 | |
3.50%, due 11/1/46 | | | 826,970 | | | | 853,031 | |
3.50%, due 2/1/48 | | | 949,953 | | | | 978,693 | |
4.00%, due 12/1/41 | | | 335,117 | | | | 356,220 | |
4.00%, due 7/1/44 | | | 401,073 | | | | 422,944 | |
4.00%, due 2/1/45 | | | 1,367,373 | | | | 1,456,359 | |
4.00%, due 3/1/45 | | | 372,632 | | | | 392,861 | |
4.00%, due 1/1/46 | | | 277,528 | | | | 293,665 | |
4.00%, due 12/1/46 | | | 1,332,936 | | | | 1,395,451 | |
4.00%, due 2/1/48 | | | 828,289 | | | | 863,627 | |
4.00%, due 10/1/48 | | | 516,923 | | | | 548,548 | |
4.00%, due 3/1/49 | | | 1,513,918 | | | | 1,571,266 | |
4.50%, due 3/1/41 | | | 397,219 | | | | 425,920 | |
4.50%, due 8/1/44 | | | 248,228 | | | | 269,900 | |
4.50%, due 12/1/44 | | | 1,091,979 | | | | 1,171,900 | |
4.50%, due 7/1/45 | | | 713,818 | | | | 766,046 | |
4.50%, due 4/1/46 | | | 112,150 | | | | 120,440 | |
4.50%, due 8/1/47 | | | 238,741 | | | | 257,661 | |
5.00%, due 11/1/41 | | | 1,350,859 | | | | 1,470,812 | |
6.50%, due 4/1/37 | | | 38,768 | | | | 44,333 | |
| | | | | | | | |
| | | | | | | 25,391,949 | |
| | | | | | | | |
| | | | | | | | |
| | | Principal
Amount | | | Value | |
Federal National Mortgage Association
(Mortgage Pass-Through Securities) 25.7% | |
2.50%, due 12/1/37 | | $ | 1,915,421 | | | $ | 1,919,066 | |
2.50%, due 1/1/57 | | | 895,969 | | | | 881,589 | |
3.00%, due 10/1/32 | | | 783,910 | | | | 798,344 | |
3.00%, due 9/1/46 | | | 2,390,355 | | | | 2,392,380 | |
3.00%, due 10/1/46 | | | 2,095,314 | | | | 2,097,099 | |
3.00%, due 10/1/48 | | | 1,682,275 | | | | 1,700,330 | |
3.00%, due 2/1/57 | | | 837,253 | | | | 844,439 | |
3.00%, due 6/1/57 | | | 952,663 | | | | 960,821 | |
3.50%, due 3/1/37 | | | 497,485 | | | | 517,195 | |
3.50%, due 2/1/43 | | | 1,807,630 | | | | 1,884,338 | |
3.50%, due 5/1/43 | | | 649,401 | | | | 673,899 | |
3.50%, due 7/1/43 | | | 614,563 | | | | 640,299 | |
3.50%, due 11/1/44 | | | 1,017,744 | | | | 1,056,346 | |
3.50%, due 3/1/45 | | | 1,065,470 | | | | 1,109,512 | |
3.50%, due 8/1/46 | | | 911,577 | | | | 946,478 | |
3.50%, due 10/1/47 | | | 901,960 | | | | 928,587 | |
3.50%, due 2/1/48 | | | 535,150 | | | | 550,621 | |
4.00%, due 8/1/38 | | | 3,639,189 | | | | 3,828,578 | |
4.00%, due 11/1/43 | | | 1,798,615 | | | | 1,925,231 | |
4.00%, due 12/1/43 | | | 1,186,873 | | | | 1,262,100 | |
4.00%, due 1/1/46 | | | 1,100,069 | | | | 1,159,228 | |
4.00%, due 9/1/47 | | | 819,145 | | | | 853,541 | |
4.00%, due 8/1/48 | | | 1,270,354 | | | | 1,320,338 | |
4.00%, due 9/1/48 | | | 2,185,646 | | | | 2,286,258 | |
4.00%, due 4/1/49 | | | 665,288 | | | | 688,990 | |
4.50%, due 2/1/41 | | | 2,992,439 | | | | 3,234,954 | |
4.50%, due 4/1/41 | | | 7,096,518 | | | | 7,716,750 | |
4.50%, due 8/1/42 | | | 1,335,491 | | | | 1,433,279 | |
4.50%, due 12/1/43 | | | 351,226 | | | | 376,420 | |
4.50%, due 8/1/44 | | | 1,558,203 | | | | 1,672,297 | |
5.00%, due 9/1/41 | | | 2,562,254 | | | | 2,782,189 | |
5.00%, due 10/1/41 | | | 2,244,815 | | | | 2,453,510 | |
5.50%, due 7/1/41 | | | 3,958,537 | | | | 4,395,588 | |
6.00%, due 4/1/37 | | | 12,663 | | | | 13,521 | |
6.00%, due 7/1/39 | | | 920,953 | | | | 1,044,359 | |
6.50%, due 10/1/39 | | | 164,404 | | | | 187,872 | |
6.50%, due 8/1/47 | | | 14,861 | | | | 15,910 | |
| | | | | | | | |
| | | | | | | 58,552,256 | |
| | | | | | | | |
Overseas Private Investment Corporation 0.6% | |
5.142%, due 12/15/23 | | | 1,287,036 | | | | 1,381,507 | |
| | | | | | | | |
|
Tennessee Valley Authority 2.3% | |
4.65%, due 6/15/35 | | | 4,395,000 | | | | 5,308,887 | |
| | | | | | | | |
|
United States Treasury Bonds 1.7% | |
3.75%, due 11/15/43 | | | 1,740,000 | | | | 2,141,967 | |
4.375%, due 11/15/39 | | | 1,200,000 | | | | 1,595,531 | |
| | | | | | | | |
| | | | | | | 3,737,498 | |
| | | | | | | | |
| | | | | | |
The notes to the financial statements are an integral part of,
and should be read in conjunction with, the financial statements. | | | | | 11 | |
Portfolio of InvestmentsJune 30, 2019 (Unaudited) (continued)
| | | | | | | | |
| | | Principal
Amount | | | Value | |
United States Treasury Notes 36.8% | | | | | | | | |
1.625%, due 8/15/22 | | $ | 2,170,000 | | | $ | 2,163,388 | |
1.625%, due 5/15/26 | | | 380,000 | | | | 374,003 | |
1.75%, due 9/30/22 | | | 3,070,000 | | | | 3,072,159 | |
1.75%, due 5/15/23 | | | 500,000 | | | | 500,273 | |
2.00%, due 8/31/21 | | | 3,295,000 | | | | 3,312,505 | |
2.25%, due 4/30/24 | | | 10,100,000 | | | | 10,329,223 | |
2.375%, due 4/30/20 | | | 18,700,000 | | | | 18,754,785 | |
2.375%, due 8/15/24 | | | 2,375,000 | | | | 2,444,580 | |
2.375%, due 5/15/29 (b) | | | 2,670,000 | | | | 2,759,174 | |
2.625%, due 7/31/20 | | | 12,150,000 | | | | 12,239,227 | |
2.625%, due 1/31/26 | | | 1,700,000 | | | | 1,780,816 | |
2.75%, due 4/30/23 | | | 7,105,000 | | | | 7,371,437 | |
2.75%, due 7/31/23 | | | 845,000 | | | | 878,470 | |
2.75%, due 8/31/23 | | | 1,325,000 | | | | 1,378,518 | |
2.875%, due 10/31/20 | | | 8,030,000 | | | | 8,134,453 | |
3.00%, due 10/31/25 | | | 7,805,000 | | | | 8,343,118 | |
| | | | | | | | |
| | | | | | | 83,836,129 | |
| | | | | | | | |
Total U.S. Government & Federal Agencies
(Cost $172,785,984) | | | | | | | 178,229,576 | |
| | | | | | | | |
TotalLong-Term Bonds
(Cost $203,654,519) | | | | | | | 209,629,414 | |
| | | | | | | | |
| | |
| | | | | | | | |
| | |
Shares | | | | |
| Short-Term Investments 10.7% | |
Affiliated Investment Company 2.8% | |
MainStay U.S. Government Liquidity Fund, 2.03% (g) | | | 6,479,855 | | | | 6,479,855 | |
| | | | | | | | |
Total Affiliated Investment Company
(Cost $6,479,855) | | | | | | | 6,479,855 | |
| | | | | | | | |
|
Unaffiliated Investment Company 1.3% | |
State Street Navigator Securities Lending Government Money Market Portfolio, 2.33% (g)(h) | | | 2,839,765 | | | | 2,839,765 | |
| | | | | | | | |
Total Unaffiliated Investment Company
(Cost $2,839,765) | | | | | | | 2,839,765 | |
| | | | | | | | |
| | | | | | | | |
| | | Principal
Amount | | | Value | |
| U.S. Government & Federal Agencies 6.6% (i) | |
Federal Home Loan Bank, Discount Notes | |
2.099%, due 11/12/19 | | $ | 4,500,000 | | | $ | 4,464,825 | |
2.103%, due 8/14/19 | | | 6,000,000 | | | | 5,983,793 | |
2.127%, due 9/25/19 | | | 4,500,000 | | | | 4,476,780 | |
| | | | | | | | |
Total U.S. Government & Federal Agencies
(Cost $14,923,893) | | | | | | | 14,925,398 | |
| | | | | | | | |
TotalShort-Term Investments
(Cost $24,243,513) | | | | | | | 24,245,018 | |
| | | | | | | | |
Total Investments
(Cost $227,898,032) | | | 102.6 | % | | | 233,874,432 | |
Other Assets, Less Liabilities | | | (2.6 | ) | | | (5,890,673 | ) |
Net Assets | | | 100.0 | % | | $ | 227,983,759 | |
| † | Percentages indicated are based on Portfolio net assets. |
| ‡ | Less than one-tenth of a percent. |
| (a) | Floating rate—Rate shown was the rate in effect as of June 30, 2019. |
| (b) | All or a portion of this security was held on loan. As of June 30, 2019, the aggregate market value of securities on loan was $2,783,382 and the Portfolio received cash collateral with a value of $2,839,765 (See Note 2(J)). |
| (c) | May be sold to institutional investors only under Rule 144A or securities offered pursuant to Section 4(a)(2) of the Securities Act of 1933, as amended. |
| (d) | Collateral strip rate—A bond whose interest was based on the weighted net interest rate of the collateral. The coupon rate adjusts periodically based on a predetermined schedule. Rate shown was the rate in effect as of June 30, 2019. |
| (e) | Coupon rate may change based on changes of the underlying collateral or prepayments of principal. The coupon rate shown represents the rate at period end. |
| (f) | Collateralized Mortgage Obligation Interest Only Strip—Pays a fixed or variable rate of interest based on mortgage loans or mortgage pass-through securities. The principal amount of the underlying pool represents the notional amount on which the current interest was calculated. The value of these stripped securities may be particularly sensitive to changes in prevailing interest rates and are typically more sensitive to changes in prepayment rates than traditional mortgage-backed securities. |
| (g) | Current yield as of June 30, 2019. |
| (h) | Represents security purchased with cash collateral received for securities on loan. |
| (i) | Interest rate shown represents yield to maturity. |
The following abbreviations are used in the preceding pages:
IO—Interest Only
LIBOR—London Interbank Offered Rate
REMIC—Real Estate Mortgage Investment Conduit
| | | | |
| 12 | | MainStay VP MacKay Government Portfolio | | The notes to the financial statements are an integral part of,
and should be read in conjunction with, the financial statements. |
The following is a summary of the fair valuations according to the inputs used as of June 30, 2019, for valuing the Portfolio’s assets:
| | | | | | | | | | | | | | | | |
Description | | Quoted Prices in Active
Markets for
Identical
Assets
(Level 1) | | | Significant Other
Observable
Inputs (Level 2) | | | Significant
Unobservable
Inputs
(Level 3) | | | Total | |
| | | | |
Asset Valuation Inputs | | | | | | | | | | | | | | | | |
| Investments in Securities (a) | | | | | | | | | | | | | | | | |
| Long-Term Bonds | | | | | | | | | | | | | | | | |
Asset-Backed Securities | | $ | — | | | $ | 5,715,330 | | | $ | — | | | $ | 5,715,330 | |
Corporate Bonds | | | — | | | | 8,939,085 | | | | — | | | | 8,939,085 | |
Mortgage-Backed Securities | | | — | | | | 16,745,423 | | | | — | | | | 16,745,423 | |
U.S. Government & Federal Agencies | | | — | | | | 178,229,576 | | | | — | | | | 178,229,576 | |
| | | | | | | | | | | | | | | | |
| TotalLong-Term Bonds | | | — | | | | 209,629,414 | | | | — | | | | 209,629,414 | |
| | | | | | | | | | | | | | | | |
| Short-Term Investments | | | | | | | | | | | | | | | | |
Affiliated Investment Company | | | 6,479,855 | | | | — | | | | — | | | | 6,479,855 | |
Unaffiliated Investment Company | | | 2,839,765 | | | | — | | | | — | | | | 2,839,765 | |
U.S. Government & Federal Agencies | | | — | | | | 14,925,398 | | | | — | | | | 14,925,398 | |
| | | | | | | | | | | | | | | | |
| TotalShort-Term Investments | | | 9,319,620 | | | | 14,925,398 | | | | — | | | | 24,245,018 | |
| | | | | | | | | | | | | | | | |
| Total Investments in Securities | | $ | 9,319,620 | | | $ | 224,554,812 | | | $ | — | | | $ | 233,874,432 | |
| | | | | | | | | | | | | | | | |
| (a) | For a complete listing of investments and their industries, see the Portfolio of Investments. |
The following is a reconciliation of investments in which significant unobservable inputs (Level 3) were used in determining value:
| | | | | | | | | | | | | | | | | | | | | | | | | | | | | | | | | | | | | | | | |
Investments in Securities | | Balance as of December 31,
2018 | | | Accrued
Discounts
(Premiums) | | | Realized
Gain
(Loss) | | | Change in
Unrealized
Appreciation
(Depreciation) | | | Purchases | | | Sales (a) | | | Transfers
into
Level 3 | | | Transfers
out of
Level 3 | | | Balance
as of
June 30,
2019 | | | Change in
Unrealized
Appreciation
(Depreciation)
from
Investments
Still Held at
June 30,
2019 (b) | |
| Long-Term Bonds | | | | | | | | | | | | | | | | | | | | | | | | | | | | | | | | | | | | | | | | |
Mortgage-Backed Securities | | | | | | | | | | | | | | | | | | | | | | | | | | | | | | | | | | | | | | | | |
Residential Mortgages (Collateralized Mortgage Obligations) | | $ | 727,931 | | | $ | 429 | | | $ | (60,825 | ) | | $ | 27,389 | | | $ | — | | | $ | (694,924 | ) | | $ | — | | | $ | — | | | $ | — | | | $ | — | |
| | | | | | | | | | | | | | | | | | | | | | | | | | | | | | | | | | | | | | | | |
| (a) | Sales include principal reductions. |
| (b) | Included in “Net change in unrealized appreciation (depreciation) on investments” in the Statement of Operations. |
| | | | | | |
The notes to the financial statements are an integral part of,
and should be read in conjunction with, the financial statements. | | | | | 13 | |
Statement of Assets and Liabilitiesas of June 30, 2019 (Unaudited)
| | | | |
| Assets | |
Investment in unaffiliated securities, at value
(identified cost $221,418,177) including
securities on loan of $2,783,382 | | $ | 227,394,577 | |
Investment in affiliated investment company, at value (identified cost $6,479,855) | | | 6,479,855 | |
Receivables: | | | | |
Dividends and interest | | | 970,216 | |
Investment securities sold | | | 564,894 | |
Portfolio shares sold | | | 189,235 | |
Securities lending | | | 2,088 | |
Other assets | | | 1,086 | |
| | | | |
Total assets | | | 235,601,951 | |
| | | | |
|
| Liabilities | |
Due to custodian | | | 4,467,120 | |
Cash collateral received for securities on loan | | | 2,839,765 | |
Payables: | | | | |
Portfolio shares redeemed | | | 121,742 | |
Manager (See Note 3) | | | 92,797 | |
NYLIFE Distributors (See Note 3) | | | 35,669 | |
Professional fees | | | 30,918 | |
Shareholder communication | | | 14,238 | |
Custodian | | | 12,804 | |
Trustees | | | 250 | |
Accrued expenses | | | 2,889 | |
| | | | |
Total liabilities | | | 7,618,192 | |
| | | | |
Net assets | | $ | 227,983,759 | |
| | | | |
|
| Composition of Net Assets | |
Shares of beneficial interest outstanding (par value of $.001 per share) unlimited number of shares authorized | | $ | 21,061 | |
Additional paid-in capital | | | 220,892,455 | |
| | | | |
| | | 220,913,516 | |
Total distributable earnings (loss) | | | 7,070,243 | |
| | | | |
Net assets | | $ | 227,983,759 | |
| | | | |
| | | | |
Initial Class | | | | |
Net assets applicable to outstanding shares | | $ | 52,098,940 | |
| | | | |
Shares of beneficial interest outstanding | | | 4,778,889 | |
| | | | |
Net asset value per share outstanding | | $ | 10.90 | |
| | | | |
Service Class | | | | |
Net assets applicable to outstanding shares | | $ | 175,884,819 | |
| | | | |
Shares of beneficial interest outstanding | | | 16,282,304 | |
| | | | |
Net asset value per share outstanding | | $ | 10.80 | |
| | | | |
| | | | |
| 14 | | MainStay VP MacKay Government Portfolio | | The notes to the financial statements are an integral part of,
and should be read in conjunction with, the financial statements. |
Statement of Operationsfor the six months ended June 30, 2019 (Unaudited)
| | | | |
| Investment Income (Loss) | |
Income | | | | |
Interest | | $ | 3,268,614 | |
Dividends-affiliated | | | 48,872 | |
Securities lending | | | 3,907 | |
| | | | |
Total income | | | 3,321,393 | |
| | | | |
Expenses | | | | |
Manager (See Note 3) | | | 536,889 | |
Distribution/Service—Service Class (See Note 3) | | | 204,028 | |
Professional fees | | | 34,442 | |
Shareholder communication | | | 16,065 | |
Custodian | | | 14,763 | |
Trustees | | | 2,528 | |
Miscellaneous | | | 5,126 | |
| | | | |
Total expenses | | | 813,841 | |
| | | | |
Net investment income (loss) | | | 2,507,552 | |
| | | | |
|
| Realized and Unrealized Gain (Loss) on Investments | |
Net realized gain (loss) on unaffiliated investments | | | 374,015 | |
Net change in unrealized appreciation (depreciation) on unaffiliated investments | | | 5,373,355 | |
| | | | |
Net realized and unrealized gain (loss) on investments | | | 5,747,370 | |
| | | | |
Net increase (decrease) in net assets resulting from operations | | $ | 8,254,922 | |
| | | | |
| | | | | | |
The notes to the financial statements are an integral part of,
and should be read in conjunction with, the financial statements. | | | | | 15 | |
Statements of Changes in Net Assets
for the six months ended June 30, 2019 (Unaudited) and the year ended December 31, 2018
| | | | | | | | |
| | | 2019 | | | 2018 | |
| Increase (Decrease) in Net Assets | |
Operations: | | | | | | | | |
Net investment income (loss) | | $ | 2,507,552 | | | $ | 4,516,993 | |
Net realized gain (loss) on investments and futures contracts | | | 374,015 | | | | (3,282,025 | ) |
Net change in unrealized appreciation (depreciation) on investments and futures contracts | | | 5,373,355 | | | | (1,778,737 | ) |
| | | | |
Net increase (decrease) in net assets resulting from operations | | | 8,254,922 | | | | (543,769 | ) |
| | | | |
Distributions to shareholders: | | | | | | | | |
Initial Class | | | — | | | | (1,328,914 | ) |
Service Class | | | — | | | | (3,504,349 | ) |
| | | | |
Total distributions to shareholders | | | — | | | | (4,833,263 | ) |
| | | | |
Capital share transactions: | | | | | | | | |
Net proceeds from sale of shares | | | 34,511,309 | | | | 51,139,306 | |
Net asset value of shares issued to shareholders in reinvestment of dividends and distributions | | | — | | | | 4,833,263 | |
Cost of shares redeemed | | | (26,910,427 | ) | | | (50,505,924 | ) |
| | | | |
Increase (decrease) in net assets derived from capital share transactions | | | 7,600,882 | | | | 5,466,645 | |
| | | | |
Net increase (decrease) in net assets | | | 15,855,804 | | | | 89,613 | |
|
| Net Assets | |
Beginning of period | | | 212,127,955 | | | | 212,038,342 | |
| | | | |
End of period | | $ | 227,983,759 | | | $ | 212,127,955 | |
| | | | | | | | |
| | | | |
| 16 | | MainStay VP MacKay Government Portfolio | | The notes to the financial statements are an integral part of,
and should be read in conjunction with, the financial statements. |
Financial Highlightsselected per share data and ratios
| | | | | | | | | | | | | | | | | | | | | | | | |
| | |
| | | Six months
ended
June 30, | | | Year ended December 31, | |
| | | | | | |
| Initial Class | | 2019* | | | 2018 | | | 2017 | | | 2016 | | | 2015 | | | 2014 | |
| | | | | | |
Net asset value at beginning of period | | $ | 10.49 | | | $ | 10.78 | | | $ | 10.85 | | | $ | 10.99 | | | $ | 11.25 | | | $ | 11.13 | |
| | | | | | | | | | | | | | | | | | | | | | | | |
| | | | | | |
Net investment income (loss) (a) | | | 0.13 | | | | 0.26 | | | | 0.25 | | | | 0.24 | | | | 0.29 | | | | 0.31 | |
| | | | | | |
Net realized and unrealized gain (loss) on investments | | | 0.28 | | | | (0.27 | ) | | | (0.02 | ) | | | (0.11 | ) | | | (0.23 | ) | | | 0.21 | |
| | | | | | | | | | | | | | | | | | | | | | | | |
| | | | | | |
Total from investment operations | | | 0.41 | | | | (0.01 | ) | | | 0.23 | | | | 0.13 | | | | 0.06 | | | | 0.52 | |
| | | | | | | | | | | | | | | | | | | | | | | | |
| | | | | | |
| Less dividends and distributions: | | | | | | | | | | | | | | | | | | | | | | | | |
| | | | | | |
From net investment income | | | — | | | | (0.28 | ) | | | (0.30 | ) | | | (0.27 | ) | | | (0.32 | ) | | | (0.36 | ) |
| | | | | | |
From net realized gain on investments | | | — | | | | — | | | | — | | | | — | | | | — | | | | (0.04 | ) |
| | | | | | | | | | | | | | | | | | | | | | | | |
| | | | | | |
Total dividends and distributions | | | — | | | | (0.28 | ) | | | (0.30 | ) | | | (0.27 | ) | | | (0.32 | ) | | | (0.40 | ) |
| | | | | | | | | | | | | | | | | | | | | | | | |
| | | | | | |
Net asset value at end of period | | $ | 10.90 | | | $ | 10.49 | | | $ | 10.78 | | | $ | 10.85 | | | $ | 10.99 | | | $ | 11.25 | |
| | | | | | | | | | | | | | | | | | | | | | | | |
| | | | | | |
Total investment return (b) | | | 3.91 | %(c) | | | (0.06 | %) | | | 2.11 | % | | | 1.07 | % | | | 0.53 | % | | | 4.61 | % |
| | | | | | |
| Ratios (to average net assets)/Supplemental Data: | | | | | | | | | | | | | | | | | | | | | | | | |
| | | | | | |
Net investment income (loss) | | | 2.53 | %†† | | | 2.44 | % | | | 2.29 | % | | | 2.14 | %(d) | | | 2.54 | % | | | 2.70 | % |
| | | | | | |
Net expenses (e) | | | 0.57 | %†† | | | 0.57 | % | | | 0.56 | % | | | 0.55 | %(f) | | | 0.55 | % | | | 0.55 | % |
| | | | | | |
Expenses (before waiver/reimbursement) (e) | | | 0.57 | %†† | | | 0.57 | % | | | 0.56 | % | | | 0.56 | % | | | 0.55 | % | | | 0.55 | % |
| | | | | | |
Portfolio turnover rate | | | 18 | % | | | 92 | % (g) | | | 17 | %(g) | | | 64 | %(g) | | | 12 | %(g) | | | 7 | % |
| | | | | | |
Net assets at end of period (in 000’s) | | $ | 52,099 | | | $ | 52,552 | | | $ | 56,561 | | | $ | 64,930 | | | $ | 72,924 | | | $ | 83,172 | |
| (a) | Per share data based on average shares outstanding during the period. |
| (b) | Total return does not reflect any deduction of sales charges, mortality and expense charges, contract charges or administrative charges. For periods of less than one year, total return is not annualized. |
| (c) | Total investment return may reflect adjustments to conform to generally accepted accounting principles. |
| (d) | Without the custody fee reimbursement, net investment income (loss) would have been 2.13%. |
| (e) | In addition to the fees and expenses which the Portfolio bears directly, it also indirectly bears a pro-rata share of the fees and expenses of the underlying funds in which it invests. Such indirect expenses are not included in the above expense ratios. |
| (f) | Without the custody fee reimbursement, net expenses would have been 0.56%. |
| (g) | The portfolio turnover rates not including mortgage dollar rolls were 80%, 5%, 19% and 11% for the years ended December 31, 2018, 2017, 2016 and 2015, respectively. |
| | | | | | | | | | | | | | | | | | | | | | | | |
| | |
| | | Six months
ended
June 30, | | | Year ended December 31, | |
| | | | | | |
| Service Class | | 2019* | | | 2018 | | | 2017 | | | 2016 | | | 2015 | | | 2014 | |
| | | | | | |
Net asset value at beginning of period | | $ | 10.41 | | | $ | 10.69 | | | $ | 10.76 | | | $ | 10.90 | | | $ | 11.16 | | | $ | 11.04 | |
| | | | | | | | | | | | | | | | | | | | | | | | |
| | | | | | |
Net investment income (loss) (a) | | | 0.12 | | | | 0.23 | | | | 0.22 | | | | 0.21 | | | | 0.26 | | | | 0.27 | |
| | | | | | |
Net realized and unrealized gain (loss) on investments | | | 0.27 | | | | (0.26 | ) | | | (0.03 | ) | | | (0.11 | ) | | | (0.23 | ) | | | 0.21 | |
| | | | | | | | | | | | | | | | | | | | | | | | |
| | | | | | |
Total from investment operations | | | 0.39 | | | | (0.03 | ) | | | 0.19 | | | | 0.10 | | | | 0.03 | | | | 0.48 | |
| | | | | | | | | | | | | | | | | | | | | | | | |
| | | | | | |
| Less dividends and distributions: | | | | | | | | | | | | | | | | | | | | | | | | |
| | | | | | |
From net investment income | | | — | | | | (0.25 | ) | | | (0.26 | ) | | | (0.24 | ) | | | (0.29 | ) | | | (0.32 | ) |
| | | | | | |
From net realized gain on investments | | | — | | | | — | | | | — | | | | — | | | | — | | | | (0.04 | ) |
| | | | | | | | | | | | | | | | | | | | | | | | |
| | | | | | |
Total dividends and distributions | | | — | | | | (0.25 | ) | | | (0.26 | ) | | | (0.24 | ) | | | (0.29 | ) | | | (0.36 | ) |
| | | | | | | | | | | | | | | | | | | | | | | | |
| | | | | | |
Net asset value at end of period | | $ | 10.80 | | | $ | 10.41 | | | $ | 10.69 | | | $ | 10.76 | | | $ | 10.90 | | | $ | 11.16 | |
| | | | | | | | | | | | | | | | | | | | | | | | |
| | | | | | |
Total investment return (b) | | | 3.75 | %(c) | | | (0.31 | %) | | | 1.86 | % | | | 0.82 | % | | | 0.28 | % | | | 4.35 | % |
| | | | | | |
| Ratios (to average net assets)/Supplemental Data: | | | | | | | | | | | | | | | | | | | | | | | | |
| | | | | | |
Net investment income (loss) | | | 2.27 | %†† | | | 2.19 | % | | | 2.04 | % | | | 1.89 | %(d) | | | 2.29 | % | | | 2.45 | % |
| | | | | | |
Net expenses (e) | | | 0.82 | %†† | | | 0.82 | % | | | 0.81 | % | | | 0.80 | %(f) | | | 0.80 | % | | | 0.80 | % |
| | | | | | |
Expenses (before waiver/reimbursement) (e) | | | 0.82 | %†† | | | 0.82 | % | | | 0.81 | % | | | 0.81 | % | | | 0.80 | % | | | 0.80 | % |
| | | | | | |
Portfolio turnover rate | | | 18 | % | | | 92 | % (g) | | | 17 | %(g) | | | 64 | %(g) | | | 12 | %(g) | | | 7 | % |
| | | | | | |
Net assets at end of period (in 000’s) | | $ | 175,885 | | | $ | 159,575 | | | $ | 155,477 | | | $ | 186,207 | | | $ | 178,259 | | | $ | 185,243 | |
| (a) | Per share data based on average shares outstanding during the period. |
| (b) | Total return does not reflect any deduction of sales charges, mortality and expense charges, contract charges or administrative charges. For periods of less than one year, total return is not annualized. |
| (c) | Total investment return may reflect adjustments to conform to generally accepted accounting principles. |
| (d) | Without the custody fee reimbursement, net investment income (loss) would have been 1.88%. |
| (e) | In addition to the fees and expenses which the Portfolio bears directly, it also indirectly bears a pro-rata share of the fees and expenses of the underlying funds in which it invests. Such indirect expenses are not included in the above expense ratios. |
| (f) | Without the custody fee reimbursement, net expenses would have been 0.81%. |
| (g) | The portfolio turnover rates not including mortgage dollar rolls were 80%, 5%, 19% and 11% for the years ended December 31, 2018, 2017, 2016 and 2015, respectively. |
| | | | | | |
The notes to the financial statements are an integral part of,
and should be read in conjunction with, the financial statements. | | | | | 17 | |
Notes to Financial Statements(Unaudited)
Note 1–Organization and Business
MainStay VP Funds Trust (the “Fund”) was organized as a Delaware statutory trust on February 1, 2011. The Fund is registered under the Investment Company Act of 1940, as amended (the “1940 Act”), as an open-end management investment company. The Fund is comprised of thirty-one separate series (collectively referred to as the “Portfolios”). These financial statements and notes relate to the MainStay VP MacKay Government Portfolio (the “Portfolio”), a “diversified” portfolio, as that term is defined in the 1940 Act, as interpreted or modified by regulatory authorities having jurisdiction, from time to time.
Shares of the Portfolio are currently offered to certain separate accounts to fund variable annuity policies and variable universal life insurance policies issued by New York Life Insurance and Annuity Corporation (“NYLIAC”), awholly-owned subsidiary of New York Life Insurance Company (“New York Life”) and may also be offered to fund variable annuity policies and variable universal life insurance policies issued by other insurance companies. NYLIAC allocates shares of the Portfolios to, among others, certain NYLIAC separate accounts. Shares of the Portfolio are also offered to the MainStay VP Conservative Allocation Portfolio, MainStay VP Moderate Allocation Portfolio, MainStay VP Moderate Growth Allocation Portfolio and MainStay VP Growth Allocation Portfolio, which operate as “funds-of-funds.”
The Portfolio currently offers two classes of shares. Initial Class shares commenced operations on January 29, 1993. Service Class shares commenced operations on June 4, 2003. Shares of the Portfolio are offered and are redeemed at a price equal to their respective net asset value (“NAV”) per share. No sales or redemption charge is applicable to the purchase or redemption of the Portfolio’s shares. Under the terms of the Fund’s multiple class plan adopted pursuant to Rule 18f-3 under the 1940 Act, the classes differ in that, among other things, Service Class shares of the Portfolio pay a combined distribution and service fee of 0.25% of average daily net assets attributable to Service Class shares of the Portfolio to the Distributor (as defined in Note 3 (B)) pursuant to a plan adopted in accordance with Rule 12b-1 under the 1940 Act. Contract owners of variable annuity contracts purchased after June 2, 2003, are permitted to invest only in the Service Class shares.
The Portfolio’s investment objective is to seek current income.
Note 2–Significant Accounting Policies
The Portfolio is an investment company and accordingly follows the investment company accounting and reporting guidance of the Financial Accounting Standards Board (“FASB”) Accounting Standard CodificationTopic 946 Financial Services—Investment Companies. The Portfolio prepares its financial statements in accordance with generally accepted accounting principles (“GAAP”) in the United States of America and follows the significant accounting policies described below.
(A) Securities Valuation. Investments are usually valued as of the close of regular trading on the New York Stock Exchange (the “Exchange”) (usually 4:00 p.m. Eastern time) on each day the Portfolio is open for business (“valuation date”).
The Board of Trustees of the Fund (the “Board”) adopted procedures establishing methodologies for the valuation of the Portfolio’s securities and other assets and delegated the responsibility for valuation determi-
nations under those procedures to the Valuation Committee of the Fund (the “Valuation Committee”). The Board authorized the Valuation Committee to appoint a Valuation Subcommittee (the “Subcommittee”) to deal in the first instance with establishing the prices of securities for which market quotations are not readily available or the prices of which are not otherwise readily determinable under these procedures. The Subcommittee meets (in person, via electronic mail or via teleconference) on an as-needed basis. Subsequently, the Valuation Committee meets to ensure that actions taken by the Subcommittee were appropriate. The procedures state that, subject to the oversight of the Board and unless otherwise noted, the responsibility for theday-to-day valuation of portfolio assets (including fair value measurements for the Portfolio’s assets and liabilities) rests with New York Life Investment Management LLC (“New York Life Investments” or the “Manager”), aided to whatever extent necessary by the Subadvisor (as defined in Note 3(A)).
To assess the appropriateness of security valuations, the Manager, the Subadvisor or the Portfolio’s third-party service provider, who is subject to oversight by the Manager, regularly compares prior day prices, prices on comparable securities and the sale prices to the prior and current day prices and challenges prices with changes exceeding certain tolerance levels with third-party pricing services or broker sources. For those securities valued through either a standardized fair valuation methodology or a fair valuation measurement, the Subcommittee deals in the first instance with such valuation and the Valuation Committee reviews and affirms, if appropriate, the reasonableness of the valuation based on such methodologies and measurements on a regular basis after considering information that is reasonably available and deemed relevant by the Valuation Committee. Any action taken by the Subcommittee with respect to the valuation of a portfolio security or other asset is submitted for review and ratification (if appropriate) to the Valuation Committee and the Board at the next regularly scheduled meeting.
“Fair value” is defined as the price the Portfolio would reasonably expect to receive upon selling an asset or liability in an orderly transaction to an independent buyer in the principal or most advantageous market for the asset or liability. Fair value measurements are determined within a framework that establishes a three-tier hierarchy which maximizes the use of observable market data and minimizes the use of unobservable inputs to establish a classification of fair value measurements for disclosure purposes. “Inputs” refer broadly to the assumptions that market participants would use in pricing the asset or liability, including assumptions about risk, such as the risk inherent in a particular valuation technique used to measure fair value using a pricing model and/or the risk inherent in the inputs for the valuation technique. Inputs may be observable or unobservable. Observable inputs reflect the assumptions market participants would use in pricing the asset or liability based on market data obtained from sources independent of the Portfolio. Unobservable inputs reflect the Portfolio’s own assumptions about the assumptions market participants would use in pricing the asset or liability based on the information available. The inputs or methodology used for valuing assets or liabilities may not be an indication of the risks associated with investing in those assets or liabilities. The three-tier hierarchy of inputs is summarized below.
| • | | Level 1—quoted prices in active markets for an identical asset or liability |
| | |
| 18 | | MainStay VP MacKay Government Portfolio |
| • | | Level 2—other significant observable inputs (including quoted prices for a similar asset or liability in active markets, interest rates and yield curves, prepayment speeds, credit risk, etc.) |
| • | | Level 3—significant unobservable inputs (including the Portfolio’s own assumptions about the assumptions that market participants would use in measuring fair value of an asset or liability) |
The level of an asset or liability within the fair value hierarchy is based on the lowest level of an input, both individually and in the aggregate, that is significant to the fair value measurement. As of June 30, 2019, the aggregate value by input level of the Portfolio’s assets and liabilities is included at the end of the Portfolio’s Portfolio of Investments.
The Portfolio may use third-party vendor evaluations, whose prices may be derived from one or more of the following standard inputs, among others:
| | |
• Benchmark yields | | • Reported trades |
• Broker/dealer quotes | | • Issuer spreads |
• Two-sided markets | | • Benchmark securities |
• Bids/offers | | • Reference data (corporate actions or material event notices) |
• Industry and economic events | | • Comparable bonds |
• Monthly payment information | | |
An asset or liability for which market values cannot be measured using the methodologies described above is valued by methods deemed reasonable in good faith by the Valuation Committee, following the procedures established by the Board, to represent fair value. Under these procedures, the Portfolio generally uses a market-based approach which may use related or comparable assets or liabilities, recent transactions, market multiples, book values and other relevant information. The Portfolio may also use an income-based valuation approach in which the anticipated future cash flows of the asset or liability are discounted to calculate fair value. Discounts may also be applied due to the nature and/or duration of any restrictions on the disposition of the asset or liability. Fair value represents a good faith approximation of the value of a security. Fair value determinations involve the consideration of a number of subjective factors, an analysis of applicable facts and circumstances and the exercise of judgment. As a result, it is possible that the fair value for a security determined in good faith in accordance with the Portfolio’s valuation procedures may differ from valuations for the same security determined by other funds using their own valuation procedures. Although the Portfolio’s valuation procedures are designed to value a security at the price the Portfolio may reasonably expect to receive upon the security’s sale in an orderly transaction, there can be no assurance that any fair value determination thereunder would, in fact, approximate the amount that the Portfolio would actually realize upon the sale of the security or the price at which the security would trade if a reliable market price were readily available. During the six-month period ended June 30, 2019, there were no material changes to the fair value methodologies.
Securities which may be valued in this manner include, but are not limited to: (i) a security for which trading has been halted or suspended; (ii) a debt security that has recently gone into default and for which there is not a current market quotation; (iii) a security of an issuer that has entered into a restructuring; (iv) a security that has been delisted
from a national exchange; (v) a security for which the market price is not readily available from a third-party pricing source or, if so provided, does not, in the opinion of the Manager or the Subadvisor, reflect the security’s market value; (vi) a security subject to trading collars for which no or limited trading takes place; and (vii) a security whose principal market has been temporarily closed at a time when, under normal conditions, it would be open. Securities valued in this manner are generally categorized as Level 3 in the hierarchy. As of June 30, 2019, there were no securities held by the Portfolio that were fair valued in such a manner.
Futures contracts are valued at the last posted settlement price on the market where such futures are primarily traded. Investments in mutual funds, including money market funds, are valued at their respective NAVs as of the close of the Exchange on the valuation date. These securities are generally categorized as Level 1 in the hierarchy.
Debt securities (other than convertible and municipal bonds) are valued at the evaluated bid prices (evaluated mean prices in the case of convertible and municipal bonds) supplied by a pricing agent or brokers selected by the Manager, in consultation with the Subadvisor. The evaluations are market-based measurements processed through a pricing application and represents the pricing agent’s good faith determination as to what a holder may receive in an orderly transaction under market conditions. The rules based logic utilizes valuation techniques that reflect participants’ assumptions and vary by asset class and per methodology, maximizing the use of relevant observable data including quoted prices for similar assets, benchmark yield curves and market corroborated inputs. The evaluated bid or mean prices are deemed by the Manager, in consultation with the Subadvisor, to be representative of market values at the regular close of trading of the Exchange on each valuation date. Debt securities purchased on a delayed delivery basis are marked to market daily until settlement at the forward settlement date. Debt securities, including corporate bonds, U.S. government and federal agency bonds, municipal bonds, foreign bonds, convertible bonds, asset-backed securities and mortgage-backed securities are generally categorized as Level 2 in the hierarchy.
Temporary cash investments acquired in excess of 60 days to maturity at the time of purchase are valued using the latest bid prices or using valuations based on a matrix system (which considers such factors as security prices, yields, maturities and ratings), both as furnished by independent pricing services. Other temporary cash investments which mature in 60 days or less at the time of purchase (“Short-Term Investments”) are valued using the amortized cost method of valuation, unless the use of such method would be inappropriate. The amortized cost method involves valuing a security at its cost on the date of purchase and thereafter assuming a constant amortization to maturity of the difference between such cost and the value on maturity date. Amortized cost approximates the current fair value of a security. Securities valued using the amortized cost method are not valued using quoted prices in an active market and are generally categorized as Level 2 in the hierarchy.
The information above is not intended to reflect an exhaustive list of the methodologies that may be used to value portfolio investments. The valuation procedures permit the use of a variety of valuation methodologies in connection with valuing portfolio investments. The methodology used for a specific type of investment may vary based on the
Notes to Financial Statements(Unaudited) (continued)
market data available or other considerations. The methodologies summarized above may not represent the specific means by which portfolio investments are valued on any particular business day.
(B) Income Taxes. The Portfolio’s policy is to comply with the requirements of the Internal Revenue Code of 1986, as amended (the “Internal Revenue Code”), applicable to regulated investment companies and to distribute all of its taxable income to the shareholders of the Portfolio within the allowable time limits. Therefore, no federal, state and local income tax provisions are required.
Management evaluates the Portfolio’s tax positions to determine if the tax positions taken meet the minimum recognition threshold in connection with accounting for uncertainties in income tax positions taken or expected to be taken for the purposes of measuring and recognizing tax liabilities in the financial statements. Recognition of tax benefits of an uncertain tax position is permitted only to the extent the position is “more likely than not” to be sustained assuming examination by taxing authorities. Management has analyzed the Portfolio’s tax positions taken on federal, state and local income tax returns for all open tax years (for up to three tax years) and has concluded that no provisions for federal, state and local income tax are required in the Portfolio’s financial statements. The Portfolio’s federal, state and local income tax and federal excise tax returns for tax years for which the applicable statutes of limitations have not expired are subject to examination by the Internal Revenue Service and state and local departments of revenue.
(C) Dividends and Distributions to Shareholders. Dividends and distributions are recorded on the ex-dividend date. The Portfolio intends to declare and pay dividends from net investment income and distributions from net realized capital and currency gains, if any, at least annually. Unless the shareholder elects otherwise, all dividends and distributions are reinvested in the same class of shares of the Portfolio, at NAV. Dividends and distributions to shareholders are determined in accordance with federal income tax regulations and may differ from determinations using GAAP.
(D) Security Transactions and Investment Income. The Portfolio records security transactions on the trade date. Realized gains and losses on security transactions are determined using the identified cost method. Interest income is accrued as earned using the effective interest rate method and includes any realized gains and losses from repayments of principal on mortgage-backed securities. Discounts and premiums on securities purchased for the Portfolio are accreted and amortized, respectively, on the effective interest rate method over the life of the respective securities.
Investment income and realized and unrealized gains and losses on investments of the Portfolio are allocated pro rata to the separate classes of shares based upon their relative net assets on the date the income is earned or realized and unrealized gains and losses are incurred.
The Portfolio may place a debt security on non-accrual status and reduce related interest income by ceasing current accruals and writing off all or a portion of any interest receivables when the collection of all or a portion of such interest has become doubtful. A debt security is removed from non-accrual status when the issuer resumes interest payments or when collectability of interest is reasonably assured.
(E) Expenses. Expenses of the Fund are allocated to the individual Portfolios in proportion to the net assets of the respective Portfolios when the expenses are incurred, except where direct allocations of expenses can be made. Expenses (other than fees incurred under the distribution and service plans, further discussed in Note 3(B), which are charged directly to the Service Class shares) are allocated to separate classes of shares pro rata based upon their relative net assets on the date the expenses are incurred. The expenses borne by the Portfolio, including those of related parties to the Portfolio, are shown in the Statement of Operations.
Additionally, the Portfolio may invest in mutual funds, which are subject to management fees and other fees that may cause the costs of investing in mutual funds to be greater than the costs of owning the underlying securities directly. These indirect expenses of mutual funds are not included in the amounts shown as expenses in the Portfolio’s Statement of Operations or in the expense ratios included in the Financial Highlights.
(F) Use of Estimates. In preparing financial statements in conformity with GAAP, management makes estimates and assumptions that affect the reported amounts and disclosures in the financial statements. Actual results could differ from those estimates.
(G) Repurchase Agreements. The Portfolio may enter into repurchase agreements (i.e., buy a security from another party with the agreement that it be sold back in the future) to earn income. The Portfolio may enter into repurchase agreements only with counterparties, usually financial institutions, that are deemed by the Manager or the Subadvisor to be creditworthy, pursuant to guidelines established by the Board. During the term of any repurchase agreement, the Manager or the Subadvisor will continue to monitor the creditworthiness of the counterparty. Under the 1940 Act, repurchase agreements are considered to be collateralized loans by the Portfolio to the counterparty secured by the securities transferred to the Portfolio.
Repurchase agreements are subject to counterparty risk, meaning the Portfolio could lose money by the counterparty’s failure to perform under the terms of the agreement. The Portfolio mitigates this risk by ensuring the repurchase agreement is collateralized by cash, U.S. government securities, fixed income securities and/or other securities. The collateral is held by the Portfolio’s custodian and valued daily on a mark to market basis to determine if the value, including accrued interest, exceeds the repurchase price. In the event of the counterparty’s default on the obligation to repurchase, the Portfolio has the right to liquidate the collateral and apply the proceeds in satisfaction of the obligation. Under certain circumstances, such as in the event of default or bankruptcy by the counterparty, realization and/or retention of the collateral may be limited or subject to delay, to legal proceedings and possible realized loss to the Portfolio. As of June 30, 2019, the Portfolio did not hold any repurchase agreements.
(H) Futures Contracts. A futures contract is an agreement to purchase or sell a specified quantity of an underlying instrument at a specified future date and price, or to make or receive a cash payment based on the value of a financial instrument (e.g., foreign currency, interest rate, security, or securities index). The Portfolio is subject to risks such as market price risk and/or interest rate risk in the normal course of investing in these transactions. Upon entering into a futures
| | |
| 20 | | MainStay VP MacKay Government Portfolio |
contract, the Portfolio is required to pledge to the broker or futures commission merchant an amount of cash and/or U.S. government securities equal to a certain percentage of the collateral amount, known as the “initial margin.” During the period the futures contract is open, changes in the value of the contract are recognized as unrealized appreciation or depreciation by marking to market such contract on a daily basis to reflect the market value of the contract at the end of each day’s trading. The Portfolio agrees to receive from or pay to the broker or futures commission merchant an amount of cash equal to the daily fluctuation in the value of the contract. Such receipts or payments are known as “variation margin.” When the futures contract is closed, the Portfolio records a realized gain or loss equal to the difference between the proceeds from (or cost of) the closing transaction and the Portfolio’s basis in the contract.
The use of futures contracts involves, to varying degrees, elements of market risk in excess of the amount recognized in the Statement of Assets and Liabilities. The contract or notional amounts and variation margin reflect the extent of the Portfolio’s involvement in open futures positions. There are several risks associated with the use of futures contracts as hedging techniques. There can be no assurance that a liquid market will exist at the time when the Portfolio seeks to close out a futures contract. If no liquid market exists, the Portfolio would remain obligated to meet margin requirements until the position is closed. Futures may involve a small initial investment relative to the risk assumed, which could result in losses greater than if they had not been used. Futures may be more volatile than direct investments in the instrument underlying the futures and may not correlate to the underlying instrument, causing a given hedge not to achieve its objectives. The Portfolio’s activities in futures contracts have minimal counterparty risk as they are conducted through regulated exchanges that guarantee the futures against default by the counterparty. In the event of a bankruptcy or insolvency of a futures commission merchant that holds margin on behalf of the Portfolio, the Portfolio may not be entitled to the return of the entire margin owed to the Portfolio, potentially resulting in a loss. The Portfolio’s investment in futures contracts and other derivatives may increase the volatility of the Portfolio’s NAVs and may result in a loss to the Portfolio. As of June 30, 2019, the Portfolio did not hold any futures contracts.
(I) Dollar Rolls. The Portfolio may enter into dollar roll transactions in which it sells mortgage-backed securities (“MBS”) from its portfolio to a counterparty from whom it simultaneously agrees to buy a similar security on a delayed delivery basis. The Portfolio generally transfers MBS where the MBS are “to be announced,” therefore, the Portfolio accounts for these transactions as purchases and sales.
When accounted for as purchase and sales, the securities sold in connection with the dollar rolls are removed from the portfolio and a realized gain or loss is recognized. The securities the Portfolio has agreed to acquire are included at market value in the Portfolio of Investments and liabilities for such purchase commitments are included as payables for investments purchased. During the roll period, the Portfolio foregoes principal and interest paid on the securities. The Portfolio is compensated by the difference between the current sales price and the forward price for the future as well as by the earnings on the cash proceeds of the initial sale. Dollar rolls may be renewed without physical delivery of the securities subject to the contract. The
Portfolio maintains liquid assets from its portfolio having a value not less than the repurchase price, including accrued interest. Dollar roll transactions involve certain risks, including the risk that the securities returned to the Portfolio at the end of the roll period, while substantially similar, could be inferior to what was initially sold to the counterparty.
The Portfolio accounts for a dollar roll transaction as a purchase and sale whereby the difference in the sales price and purchase price of the security sold is recorded as a realized gain (loss).
(J) Securities Lending. In order to realize additional income, the Portfolio may engage in securities lending, subject to the limitations set forth in the 1940 Act and relevant guidance by the staff of the Securities and Exchange Commission (“SEC”). In the event the Portfolio does engage in securities lending, the Portfolio will lend through its custodian, State Street Bank and Trust Company (“State Street”), acting as securities lending agent on behalf of the Portfolio. State Street will manage the Portfolio’s collateral in accordance with the securities lending agency agreement between the Portfolio and State Street, and indemnify the Portfolio against counterparty risk. The loans will be collateralized by cash (which may be invested in a money market fund) and/ornon-cash collateral (which may include, U.S. Treasury securities and/or U.S. Government Agency securities issued or guaranteed by the United States government or its agencies or instrumentalities) at least equal at all times to the market value of the securities loaned. The Portfolio may bear the risk of delay in recovery of, or loss of rights in, the securities loaned should the borrower of the securities experience financial difficulty. The Portfolio may also record a realized gain or loss on securities deemed sold due to a borrower’s inability to return securities on loan. The Portfolio bears the risk of any loss on investment of cash collateral. The Portfolio will receive compensation for lending its securities in the form of fees or it will retain a portion of interest on the investment of any cash collateral. The Portfolio will also continue to receive interest and dividends on the securities loaned and any gain or loss in the market price of the securities loaned that may occur during the term of the loan will be for the account of the Portfolio. Income earned from securities lending activities, if any, is reflected in the Statement of Operations. As of June 30, 2019, the Portfolio had securities on loan with an aggregate market value of $2,783,382 and received cash collateral which was invested into the State Street Navigator Securities Lending Government Money Market Portfolio with a value of $2,839,765.
(K) Government Risk. Investments in the Portfolio are not guaranteed, even though some of the Portfolio’s underlying investments are guaranteed by the U.S. government or its agencies or instrumentalities. The principal risk of mortgage-related and asset-backed securities is that the underlying debt may be prepaid ahead of schedule, if interest rates fall, thereby reducing the value of the Portfolio’s investment. If interest rates rise, less of the debt may be prepaid and the Portfolio may lose money because the Portfolio may be unable to invest in higher yielding assets. The Portfolio is subject to interest-rate risk and can lose principal value when interest rates rise. Bonds are also subject to credit risk, in which the bond issuer may fail to pay interest and principal in a timely manner.
(L) Indemnifications. Under the Fund’s organizational documents, its officers and trustees are indemnified against certain liabilities that
may arise out of performance of their duties to the Fund. Additionally, in
Notes to Financial Statements(Unaudited) (continued)
the normal course of business, the Portfolio enters into contracts with third-party service providers that contain a variety of representations and warranties and which may provide general indemnifications. The Portfolio’s maximum exposure under these arrangements is unknown, as this would involve future claims that may be made against the Portfolio that have not yet occurred. Based on experience, management is of the view that the risk of loss in connection with these potential indemnification obligations is remote. However, there can be no assurance that material liabilities related to such obligations will not arise in the future, which could adversely impact the Portfolio.
Note 3–Fees and Related Party Transactions
(A) Manager and Subadvisor. New York Life Investments, a registered investment adviser and an indirect,wholly-owned subsidiary of New York Life, serves as the Portfolio’s Manager pursuant to an Amended and Restated Management Agreement (“Management Agreement”). The Manager provides offices, conducts clerical, recordkeeping and bookkeeping services, and keeps most of the financial and accounting records required to be maintained by the Portfolio. Except for the portion of salaries and expenses that are the responsibility of the Portfolio, the Manager pays the salaries and expenses of all personnel affiliated with the Portfolio and certain operational expenses of the Portfolio. The Portfolio reimburses New York Life Investments in an amount equal to a portion of the compensation of the Chief Compliance Officer attributable to the Portfolio. MacKay Shields LLC (“MacKay Shields” or “Subadvisor”), a registered investment adviser and an indirect,wholly-owned subsidiary of New York Life, serves as Subadvisor to the Portfolio and is responsible for theday-to-day portfolio management of the Portfolio. Pursuant to the terms of an Amended and Restated Subadvisory Agreement (“Subadvisory Agreement”) between New York Life Investments and MacKay Shields, New York Life Investments pays for the services of the Subadvisor.
The Fund, on behalf of the Portfolio, pays New York Life Investments in its capacity as the Portfolio’s investment manager and administrator, pursuant to the Management Agreement, a monthly fee for the services performed and facilities furnished at an annual rate of the Portfolio’s
average daily net assets as follows: 0.50% up to $500 million; 0.475% from $500 million to $1 billion; and 0.45% in excess of $1 billion. During the six-month period ended June 30, 2019, the effective management fee rate was 0.50%.
During the six-month period ended June 30, 2019, New York Life Investments earned fees from the Portfolio in the amount of $536,889, and paid the Subadvisor in the amount of $268,445.
State Street providessub-administration andsub-accounting services to the Portfolio pursuant to an agreement with New York Life Investments. These services include calculating the daily NAVs of the Portfolio, maintaining the general ledger andsub-ledger accounts for the calculation of the Portfolio’s NAVs and assisting New York Life Investments in conducting various aspects of the Portfolio’s administrative operations. For providing these services to the Portfolio, State Street is compensated by New York Life Investments.
Pursuant to an agreement between the Fund and New York Life Investments, New York Life Investments is responsible for providing or procuring certain regulatory reporting services for the Portfolio. The Portfolio will reimburse New York Life Investments for the actual costs incurred by New York Life Investments in connection with providing or procuring these services for the Portfolio.
(B) Distribution and Service Fees. The Fund, on behalf of the Portfolio, has entered into a distribution agreement with NYLIFE Distributors LLC (the “Distributor”), an indirect,wholly-owned subsidiary of New York Life. The Portfolio has adopted a distribution plan (the “Plan”) in accordance with the provisions of Rule 12b-1 under the 1940 Act. Under the Plan, the Distributor has agreed to provide, through its affiliates or independent third parties, various distribution-related, shareholder and administrative support services to the Service Class shareholders. For its services, the Distributor is entitled to a combined distribution and service fee accrued daily and paid monthly at an annual rate of 0.25% of the average daily net assets attributable to the Service Class shares of the Portfolio.
(C) Investments in Affiliates (in 000’s). During the six-month period ended June 30, 2019, purchases and sales transactions, income earned from investments and shares held of investment companies managed by New York Life Investments or its affiliates were as follows:
| | | | | | | | | | | | | | | | | | | | | | | | | | | | | | | | | | | | |
Affiliated Investment Company | | Value,
Beginning of
Period | | | Purchases
at Cost | | | Proceeds from
Sales | | | Net
Realized
Gain/
(Loss)
on Sales | | | Change in
Unrealized
Appreciation/
(Depreciation) | | | Value,
End of
Period | | | Dividend
Income | | | Other
Distributions | | | Shares
End of
Period | |
MainStay U.S. Government Liquidity Fund | | $ | 5,194 | | | $ | 59,878 | | | $ | (58,592 | ) | | $ | — | | | $ | — | | | $ | 6,480 | | | $ | 49 | | | $ | — | | | | 6,480 | |
| | |
| 22 | | MainStay VP MacKay Government Portfolio |
Note 4–Federal Income Tax
As of June 30, 2019, the cost and unrealized appreciation (depreciation) of the Portfolio’s investment portfolio, including applicable derivative contracts and other financial instruments, as determined on a federal income tax basis, were as follows:
| | | | | | | | | | | | | | | | |
| | | Federal Tax
Cost | | | Gross
Unrealized
Appreciation | | | Gross
Unrealized
(Depreciation) | | | Net
Unrealized
Appreciation/
(Depreciation) | |
Investments in Securities | | $ | 227,909,434 | | | $ | 6,222,148 | | | $ | (257,150 | ) | | $ | 5,964,998 | |
As of December 31, 2018, for federal income tax purposes, capital loss carryforwards of $6,316,708 were available as shown in the table below, to the extent provided by the regulations to offset future realized gains of the Portfolio through the years indicated. To the extent that these capital loss carryforwards are used to offset future capital gains, it is probable that the capital gains so offset will not be distributed to shareholders. No capital gain distributions shall be made until any capital loss carryforwards have been fully utilized.
| | | | |
Capital Loss
Available Through | | Short-Term
Capital Loss
Amounts (000’s) | | Long-Term
Capital Loss
Amounts (000’s) |
| | |
| Unlimited | | $1,624 | | $4,693 |
During the year ended December 31, 2018, the tax character of distributions paid as reflected in the Statements of Changes in Net Assets was as follows:
| | | | | | |
|
| 2018 | |
Tax-Based
Distributions
from Ordinary
Income | | | Tax-Based
Distributions
from Long-Term
Gains | |
| |
| $ | 4,833,263 | | | $ | — | |
Note 5–Custodian
State Street is the custodian of cash and securities held by the Portfolio. Custodial fees are charged to the Portfolio based on the Portfolio’s net assets and/or the market value of securities held by the Portfolio and the number of certain transactions incurred by the Portfolio.
Note 6–Line of Credit
The Portfolio and certain other funds managed by New York Life Investments maintain a line of credit with a syndicate of banks in order to secure a source of funds for temporary purposes to meet unanticipated or excessive redemption requests.
Effective July 30, 2019, under the credit agreement (the “Credit Agreement”), the aggregate commitment amount is $600,000,000 with an additional uncommitted amount of $100,000,000. The commitment fee is an annual rate of 0.15% of the average commitment amount payable quarterly, regardless of usage, to State Street, who serves as the agent to the syndicate. The commitment fee is allocated among the Portfolio and certain other funds managed by New York Life Investments based upon their respective net assets and other factors. Interest on any
revolving credit loan is charged based upon the Federal Funds Rate or the one-month London Interbank Offered Rate (“LIBOR”), whichever is higher. The Credit Agreement expires on July 28, 2020, although the Portfolio, certain other funds managed by New York Life Investments and the syndicate of banks may renew the Credit Agreement for an additional year on the same or different terms. Prior to July 30, 2019, the aggregate commitment amount and the commitment fee were the same as those under the current Credit Agreement. During the six-month period ended June 30, 2019, there were no borrowings made or outstanding with respect to the Portfolio under the Credit Agreement.
Note 7–Interfund Lending Program
Pursuant to an exemptive order issued by the SEC, the Portfolio, along with certain other funds managed by New York Life Investments, may participate in an interfund lending program. The interfund lending program provides an alternative credit facility that permits the Portfolio and certain other funds managed by New York Life Investments to lend or borrow money for temporary purposes directly to or from one another subject to the conditions of the exemptive order. During the six-month period ended June 30, 2019, there were no interfund loans made or outstanding with respect to the Portfolio.
Note 8–Purchases and Sales of Securities (in 000’s)
During the six-month period ended June 30, 2019, purchases and sales of U.S. government securities were $42,693 and $34,465, respectively. Purchases and sales of securities, other than U.S. government securities andshort-term securities, were $1,332 and $3,550, respectively.
Note 9–Capital Share Transactions
Transactions in capital shares for the six-month period ended June 30, 2019 and the year ended December 31, 2018, were as follows:
| | | | | | | | |
Initial Class | | Shares | | | Amount | |
| | |
Six-month period ended June 30, 2019: | | | | | | | | |
Shares sold | | | 131,725 | | | $ | 1,401,791 | |
Shares redeemed | | | (363,535 | ) | | | (3,867,415 | ) |
| | | | |
Net increase (decrease) | | | (231,810 | ) | | $ | (2,465,624 | ) |
| | | | |
Year ended December 31, 2018: | | | | | | | | |
Shares sold | | | 489,359 | | | $ | 5,134,054 | |
Shares issued to shareholders in reinvestment of dividends and distributions | | | 129,327 | | | | 1,328,914 | |
Shares redeemed | | | (855,191 | ) | | | (9,044,015 | ) |
| | | | |
Net increase (decrease) | | | (236,505 | ) | | $ | (2,581,047 | ) |
| | | | |
| | |
| | | | | | | | |
Service Class | | Shares | | | Amount | |
Six-month period ended June 30, 2019: | | | | | | | | |
Shares sold | | | 3,138,023 | | | $ | 33,109,518 | |
Shares redeemed | | | (2,192,084 | ) | | | (23,043,012 | ) |
| | | | |
Net increase (decrease) | | | 945,939 | | | $ | 10,066,506 | |
| | | | |
Year ended December 31, 2018: | | | | | | | | |
Shares sold | | | 4,424,274 | | | $ | 46,005,252 | |
Shares issued to shareholders in reinvestment of dividends and distributions | | | 343,551 | | | | 3,504,349 | |
Shares redeemed | | | (3,972,245 | ) | | | (41,461,909 | ) |
| | | | |
Net increase (decrease) | | | 795,580 | | | $ | 8,047,692 | |
| | | | |
Notes to Financial Statements(Unaudited) (continued)
Note 10–Recent Accounting Pronouncements
To improve the effectiveness of fair value disclosure requirements, the Financial Accounting Standards Board recently issued Accounting Standard Update (ASU)2018-13, Fair Value Measurement Disclosure Framework—Changes to the Disclosure Requirements for Fair Value Measurement (ASU2018-13), which adds, removes, and modifies certain aspects relating to fair value disclosure. ASU2018-13 is effective for interim and annual reporting periods beginning after December 15, 2019; early adoption of the additions relating to ASU2018-13 is not required. Management has evaluated the implications of certain other provisions of the ASU and has determined to early adopt aspects related to the removal and modifications of certain fair value measurement disclosures under the ASU effective immediately. At this
time, management is evaluating the implications of certain other provisions of the ASU related to new disclosure requirements and any impact on the financial statement disclosures has not yet been determined.
Note 11–Subsequent Events
In connection with the preparation of the financial statements of the Portfolio as of and for the six-month period ended June 30, 2019, events and transactions subsequent to June 30, 2019, through the date the financial statements were issued have been evaluated by the Portfolio’s management for possible adjustment and/or disclosure. No subsequent events requiring financial statement adjustment or disclosure have been identified.
| | |
| 24 | | MainStay VP MacKay Government Portfolio |
Proxy Voting Policies and Procedures and Proxy Voting Record
A description of the policies and procedures that New York Life Investments uses to vote proxies related to the Portfolio’s securities is available without charge, upon request (i) by calling800-598-2019; (ii) by visiting New York Life Investments website at https://www.nylinvestments.com/mainstay/products-and-performance/mainstay-vp-funds-trust; or (iii) by visiting the SEC’s website at www.sec.gov.
The Portfolio is required to file with the SEC its proxy voting record for the12-month period ending June 30 on Form N-PX. The Portfolio’s most recent Form N-PX or proxy voting record is available free of charge upon request (i) by calling800-598-2019; (ii) by visiting New York Life Investments website at https://www.nylinvestments.com/mainstay/products-and-performance/mainstay-vp-funds-trust; or (iii) by visiting the SEC’s website atwww.sec.gov.
Shareholder Reports and Quarterly Portfolio Disclosure
The Portfolio is required to file its complete schedule of portfolio holdings with the SEC 60 days after each fiscal quarter onForm N-PORT. The Portfolio’s holdings report is available without charge upon request (i) by calling800-598-2019; (ii) by visiting New York Life Investments website at https://www.nylinvestments.com/mainstay/products-and-performance/mainstay-vp-funds-trust; or (iii) on the SEC’s website at www.sec.gov.
MainStay VP Portfolios
MainStay VP offers a wide range of Portfolios. The full array of MainStay VP offerings is listed here, with information about the manager, subadvisors, legal counsel, and independent registered public accounting firm.
Equity Portfolios
MainStay VP Eagle Small Cap Growth Portfolio
MainStay VP Emerging Markets Equity Portfolio
MainStay VP Epoch U.S. Equity Yield Portfolio
MainStay VP Fidelity Institutional AM® Utilities Portfolio†
MainStay VP Large Cap Growth Portfolio
MainStay VP MacKay Common Stock Portfolio
MainStay VP MacKay Growth Portfolio
MainStay VP MacKay International Equity Portfolio
MainStay VP MacKay Mid Cap Core Portfolio
MainStay VP MacKay S&P 500 Index Portfolio
MainStay VP MacKay Small Cap Core Portfolio
MainStay VP Mellon Natural Resources Portfolio
MainStay VP T. Rowe Price Equity Income Portfolio
Mixed Asset Portfolios
MainStay VP Balanced Portfolio
MainStay VP Income Builder Portfolio
MainStay VP Janus Henderson Balanced Portfolio
MainStay VP MacKay Convertible Portfolio
Income Portfolios
MainStay VP Bond Portfolio
MainStay VP Floating Rate Portfolio
MainStay VP Indexed Bond Portfolio
MainStay VP MacKay Government Portfolio
MainStay VP MacKay High Yield Corporate Bond Portfolio
MainStay VP MacKay Unconstrained Bond Portfolio
MainStay VP PIMCO Real Return Portfolio
Money Market
MainStay VP U.S. Government Money Market Portfolio
Alternative
MainStay VP Cushing Renaissance Advantage Portfolio
MainStay VP IQ Hedge Multi-Strategy Portfolio
Asset Allocation Portfolios
MainStay VP Conservative Allocation Portfolio
MainStay VP Growth Allocation Portfolio
MainStay VP Moderate Allocation Portfolio
MainStay VP Moderate Growth Allocation Portfolio
Manager
New York Life Investment Management LLC
New York, New York
Subadvisors
Candriam Belgium*
Brussels, Belgium
Cushing Asset Management, LP
Dallas, Texas
Eagle Asset Management, Inc.
St Petersburg, Florida
Epoch Investment Partners, Inc.
New York, New York
FIAM LLC
Smithfield, Rhode Island
IndexIQ Advisors LLC*
New York, New York
Janus Capital Management LLC
Denver, Colorado
MacKay Shields LLC*
New York, New York
Mellon Investments Corporation
Boston, Massachusetts
NYL Investors LLC*
New York, New York
Pacific Investment Management Company LLC
Newport Beach, California
T. Rowe Price Associates, Inc.
Baltimore, Maryland
Winslow Capital Management, LLC
Minneapolis, Minnesota
Distributor
NYLIFE Distributors LLC*
Jersey City, New Jersey
Custodian
State Street Bank and Trust Company
Boston, Massachusetts
Independent Registered Public Accounting Firm
PricewaterhouseCoopers LLP
New York, New York
Legal Counsel
Dechert LLP
Washington, District of Columbia
Some Portfolios may not be available in all products.
| † | Fidelity Institutional AM is a registered trade mark of FMR LLC. Used with permission. |
| * | An affiliate of New York Life Investment Management LLC |
Not part of the Semiannual Report
2019 Semiannual Report
This report is for the general information of New York Life Variable Annuities and NYLIAC Variable Universal Life Insurance Products policyowners. It must be preceded or accompanied by the appropriate product(s) and funds prospectuses if it is given to anyone who is not an owner of a New York Life variable annuity policy or a NYLIAC Variable Universal Life Insurance Product. This report does not offer for sale or solicit orders to purchase securities.
The performance data quoted in this report represents past performance. Past performance is no guarantee of future results. Due to market volatility and other factors, current performance may be lower or higher than the figures shown. The most recent month-end performance summary for your variable annuity or variable life policy is available by calling 800-598-2019 and is updated periodically on www.newyorklife.com.
The New York Life Variable Annuities and NYLIAC Variable Universal Life Insurance Products are issued by New York Life Insurance and Annuity Corporation (a Delaware Corporation) and distributed by NYLIFE Distributors LLC (Member FINRA/SIPC).
New York Life Insurance Company
New York Life Insurance and Annuity Corporation (NYLIAC) (A Delaware Corporation)
51 Madison Avenue, Room 551
New York, NY 10010
www.newyorklife.com
Printed on recycled paper
nylinvestments.com
NYLIFE Distributors LLC, 30 Hudson Street, Jersey City, NJ 07302
New York Life Investment Management LLC is the investment manager to the MainStay VP Funds Trust
©2019 by NYLIFE Distributors LLC. All rights reserved.
You may obtain copies of the Prospectus and the Statement of Additional Information free of charge, upon request, by callingtoll-free 800-598-2019 or writing to New York Life Insurance and Annuity Corporation, 51 Madison Avenue, New York, NY 10010.
| | | | |
| | | |
| Not FDIC Insured | | No Bank Guarantee | | May Lose Value |
| | | | |
| 1781622 | | | | MSVPG10-08/19 (NYLIAC) NI519 |
MainStay VP MacKay High Yield Corporate Bond Portfolio
Message from the President and Semiannual Report
Unaudited | June 30, 2019

Beginning on January 1, 2021, as permitted by regulations adopted by the Securities and Exchange Commission, paper copies of the MainStay VP Portfolio annual and semi-annual shareholder reports may no longer be sent by mail, unless you specifically request paper copies of the reports from the insurance company that offers your policy. Instead, the reports will be made available online, and you will be notified by mail each time a report is posted and provided with a website link to access the report. Instructions for requesting paper copies will be provided by your insurance company.
If you already elected to receive shareholder reports electronically, you will not be affected by this change and you need not take any action. At any time, you may elect to receive reports and other communications from the insurance company electronically by following the instructions provided by the insurance company.
You may elect to receive all future shareholder reports in paper form free of charge. You can inform the insurance company that you wish to receive paper copies of reports by following the instructions provided by the insurance company. Your election to receive reports in paper form will apply to all portfolio companies available under your contract.
| | | | | | | | |
| | | | | |
| Not FDIC/NCUA Insured | | Not a Deposit | | May Lose Value | | No Bank Guarantee | | Not Insured by Any Government Agency |

This page intentionally left blank
Message from the President
Most equity and fixed-income markets in the United States and around the world advanced in the face of conflicting political and macroeconomic forces during thesix-month period ended June 30, 2019.
The reporting period began on the heels of tumultuous December 2018, during which equities and equity-sensitive bonds spiked sharply lower on concerns regarding the pace of economic growth, a U.S. government shutdown and the potential impact of trade disputes between the United States and other nations, particularly China. Markets recovered quickly in early 2019 as trade tensions eased, the government reopened and the U.S. Federal Reserve Board (Fed) adopted a more patient tone regarding the future direction of interest rates. Markets moved broadly higher from January through April, supported by encouraging economic data and generally strong corporate earnings.
During the first four months of the reporting period, the improving economic environment encouraged investors to favor areas of the market viewed as offering greater return potential along with higher risks. Among U.S. stocks, cyclical, growth-oriented sectors tended to outperform more defensive, value-oriented sectors, whilelarge-cap stocks outperformed theirsmaller-cap counterparts. Within the S&P 500® Index, the information technology sector led the market’s advance, followed by communication services, consumer discretionary and consumer staples. Industrials, utilities, financials, materials, real estate and energy produced more modest gains. While some international equity markets outperformed or underperformed the U.S. market, on average international stocks mirrored the performance of their U.S. counterparts. Fixed-income securities gained ground as well, albeit along a more gradual trajectory. Among U.S. fixed-income instruments, corporate issues generally outperformed government bonds, with lower credit quality, higher yielding securities leading the sector’s advance. Long-term U.S. Treasury bond yields proved particularly weak, with
10-year yields dipping at times below3-month yields, reflecting investors’ continued concerns about domestic economic growth.
May 2019 saw a return of uncertainty and volatility. Trade discussions between the United States and China faltered, driving global equity prices lower. Government bond prices rose as investors sought safe havens. June brought yet anotherU-turn as equity prices climbed again after comments from the Fed raised hopes of an interest rate cut in response to weak economic data. Stock and bond prices rose, with U.S. equity markets ending the reporting period in record territory.
We are pleased to see renewed signs of strength in broad areas of the financial market. At the same time, we remained sharply focused on providing you, as a MainStay VP investor, with the experienced and disciplined fund management that we believe underpins an effective, long-term investment strategy. Whatever tomorrow’s investment environment brings, you can rely on our portfolio managers to pursue the objectives of their individual Portfolios as outlined in the prospectus with the energy and dedication you have come to expect.
The report that follows contains additional information on the market events, investment decisions and specific securities that shaped your VP Portfolio’s performance during the six months ended June 30, 2019. We encourage you to read the report carefully and use it to evaluate your Portfolio’s performance in light of your long-range financial plan.
Sincerely,

Kirk C. Lehneis
President
The opinions expressed are as of the date of this report and are subject to change. There is no guarantee that any forecast made will come to pass. This material does not constitute investment advice and is not intended as an endorsement of any specific investment. Past performance is no guarantee of future results.
Not part of the Semiannual Report
Table of Contents
Investors should refer to the Portfolio’s Summary Prospectus and/or Prospectus and consider the Portfolio’s investment objectives, strategies, risks, charges and expenses carefully before investing. The Summary Prospectus and/or Prospectus contain this and other information about the Portfolio. You may obtain copies of the Portfolio’s Summary Prospectus and/or the Prospectus and the Statement of Additional Information free of charge, upon request, by calling toll-free 800-598-2019, by writing to New York Life Insurance and Annuity Corporation, 51 Madison Avenue, Room 251, New York, New York 10010 or by sending an email to MainStayShareholdersServices@nylim.com. These documents are also available at nylinvestments.com/vpdocuments. Please read the Summary Prospectus and/or Prospectus carefully before investing. MainStay VP Funds Trust portfolios are separate account options which are purchased through a variable insurance or variable annuity contract.
Investment and Performance Comparison1(Unaudited)
Performance data quoted represents past performance. Past performance is no guarantee of future results. Because of market volatility and other factors, current performance may be lower or higher than the figures shown. Investment return and principal value will fluctuate, and as a result, when shares are redeemed, they may be worth more or less than their original cost. The performance table and graph do not reflect any deduction of sales charges, mortality and expense charges, contract charges or administrative charges. Please refer to the Performance Summary appropriate for your policy. For performance information current to the most recent month-end, please call800-598-2019 or visit www.newyorklife.com.
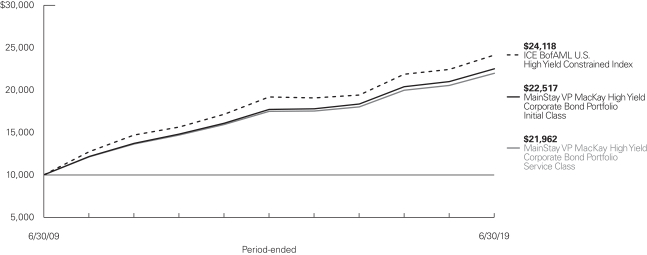
Average Annual Total Returns for the Period-Ended June 30, 2019
| | | | | | | | | | | | | | | | | | | | | | |
| Class | | Inception
Date | | Six Months | | | One Year | | | Five Years | | | Ten Years | | | Gross
Expense
Ratio2 | |
| | | | | | |
| Initial Class Shares | | 5/1/1995 | | | 8.81 | % | | | 7.29 | % | | | 4.91 | % | | | 8.46 | % | | | 0.58 | % |
| Service Class Shares | | 6/4/2003 | | | 8.68 | | | | 7.02 | | | | 4.65 | | | | 8.19 | | | | 0.83 | |
| | | | | | | | | | | | | | | | |
| Benchmark Performance | | Six Months | | | One Year | | | Five
Years | | | Ten
Years | |
| | | | |
ICE BofAML U.S. High Yield Constrained Index3 | | | 10.16 | % | | | 7.58 | % | | | 4.70 | % | | | 9.20 | % |
Morningstar High Yield Bond Category Average4 | | | 8.79 | | | | 6.19 | | | | 3.47 | | | | 7.95 | |
| 1. | Performance figures may reflect certain fee waivers and/or expense limitations, without which total returns may have been different. For information on current fee waivers and/or expense limitations (if any), please refer to the Notes to Financial Statements. |
| 2. | The gross expense ratios presented reflect the Portfolio’s “Total Annual Portfolio Operating Expenses” from the most recent Prospectus, as supplemented, and may differ from other expense ratios disclosed in this report. |
| 3. | The ICE BofAML U.S. High Yield Constrained Index is the Portfolio’s primary broad-based securities market index for comparison purposes. The ICE BofA Merrill Lynch U.S. High Yield Constrained Index is a market value-weighted index of all domestic and Yankee high-yield bonds, including deferred |
| | interest bonds and payment-in-kind securities. Issuers included in the Index have maturities of one year or more and have a credit rating lower than BBB-/Baa3, but are not in default. No single issuer may constitute greater than 2% of the Index. Results assume reinvestment of all dividends and capital gains. An investment cannot be made directly in an index. |
| 4. | The Morningstar High Yield Bond Category Average is representative of funds that concentrate on lower-quality bonds, which are riskier than those of higher quality companies. These funds primarily invest in U.S. high-income debt securities where at least 65% or more of bond assets are not rated or are rated by a major agency such as Standard & Poor’s or Moody’s at the level of BB and below. Results are based on average total returns of similar funds with all dividends and capital gain distributions reinvested. |
Cost in Dollars of a $1,000 Investment in MainStay VP MacKay High Yield Corporate Bond Portfolio (Unaudited)
The example below is intended to describe the fees and expenses borne by shareholders during the six-month period from January 1, 2019, to June 30, 2019, and the impact of those costs on your investment.
Example
As a shareholder of the Portfolio you incur two types of costs: (1) transaction costs, including exchange fees and sales charges (loads) on purchases (as applicable), and (2) ongoing costs, including management fees, distribution and/or service (12b-1) fees, and other Portfolio expenses (as applicable). This example is intended to help you understand your ongoing costs (in dollars) of investing in the Portfolio and to compare these costs with the ongoing costs of investing in other mutual funds. The example is based on an investment of $1,000 made at the beginning of the six-month period and held for the entire period from January 1, 2019, to June 30, 2019. Shares are only sold in connection with variable life and annuity contracts and the example does not reflect any contract level or transactional fees or expenses. If these costs had been included, your costs would have been higher.
This example illustrates your Portfolio’s ongoing costs in two ways:
Actual Expenses
The second and third data columns in the table below provide information about actual account values and actual expenses. You may use the information in these columns, together with the amount you invested, to estimate the expenses that you paid during the six months ended June 30, 2019. Simply divide your account value by $1,000
(for example, an $8,600 account value divided by $1,000 = 8.6), then multiply the result by the number under the heading entitled “Expenses Paid During Period” to estimate the expenses you paid on your account during this period.
Hypothetical Example for Comparison Purposes
The fourth and fifth data columns in the table below provide information about hypothetical account values and hypothetical expenses based on the Portfolio’s actual expense ratio and an assumed rate of return of 5% per year before expenses, which is not the Portfolio’s actual return. The hypothetical account values and expenses may not be used to estimate the actual ending account balances or expenses you paid for the six-month period shown. You may use this information to compare the ongoing costs of investing in the Portfolio with the ongoing costs of investing in other mutual funds. To do so, compare this 5% hypothetical example with the 5% hypothetical examples that appear in the shareholder reports of the other mutual funds.
Please note that the expenses shown in the table are meant to highlight your ongoing costs only and do not reflect any transactional costs, such as exchange fees or sales charges (loads). Therefore, the fourth and fifth data columns of the table are useful in comparing ongoing costs only and will not help you determine the relative total costs of owning different funds. In addition, if these transactional costs were included, your costs would have been higher.
| | | | | | | | | | | | | | | | | | | | | | |
| | | | | | | | | | | | | | | | | | |
| Share Class | | Beginning
Account
Value
1/1/19 | | | Ending Account
Value (Based
on Actual
Returns and
Expenses)
6/30/19 | | | Expenses
Paid
During
Period1 | | | Ending Account
Value (Based
on Hypothetical
5% Annualized
Return and
Actual Expenses)
6/30/19 | | | Expenses
Paid
During
Period1 | | | Net Expense
Ratio
During
Period2 |
| | | | | | |
| Initial Class Shares | | $ | 1,000.00 | | | $ | 1,088.10 | | | $ | 3.00 | | | $ | 1,021.92 | | | $ | 2.91 | | | 0.58% |
| | | | | | |
| Service Class Shares | | $ | 1,000.00 | | | $ | 1,086.80 | | | $ | 4.29 | | | $ | 1,020.68 | | | $ | 4.16 | | | 0.83% |
| 1. | Expenses are equal to the Portfolio’s annualized expense ratio of each class multiplied by the average account value over the period, divided by 365 and multiplied by 181 (to reflect the six-month period). The table above represents the actual expenses incurred during the six-month period. In addition to the fees and expenses which the Portfolio bears directly, it also indirectly bears a pro rata share of the fees and expenses of the underlying funds in which it invests. Such indirect expenses are not included in the above-reported expense figures. |
| 2. | Expenses are equal to the Portfolio’s annualized expense ratio to reflect the six-month period. |
| | |
| 6 | | MainStay VP MacKay High Yield Corporate Bond Portfolio |
Portfolio Composition as of June 30, 2019(Unaudited)
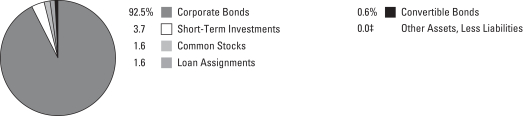
See Portfolio of Investments beginning on page 10 for specific holdings within these categories. The Portfolio’s holdings are subject to change.
| ‡ | Less than one-tenth of a percent. |
Top Ten Holdings or Issuers Held as of June 30, 2019(excludingshort-term investments) (Unaudited)
| 1. | T-Mobile USA, Inc., 4.50%–6.50%, due 1/15/24–2/1/28 |
| 2. | Equinix, Inc., 5.375%–5.875%, due 1/1/22–5/15/27 |
| 3. | HCA, Inc., 5.00%–8.36%, due 2/15/22–11/6/33 |
| 4. | CCO Holdings LLC / CCO Holdings Capital Corp., 5.00%–5.875%, due 2/15/23–6/1/29 |
| 6. | Netflix, Inc., 4.875%–5.875%, due 2/15/22–11/15/29 |
| 7. | Carlson Travel, Inc., 6.75%–9.50%, due 12/15/23–12/15/24 |
| 8. | MSCI, Inc., 4.75%–5.75%, due 11/15/24–5/15/27 |
| 9. | Sprint Capital Corp., 6.875%, due 11/15/28 |
| 10. | MGM Growth Properties Operating Partnership, L.P. / MGP Finance Co-Issuer, Inc., 4.50%–5.75%, due 5/1/24–2/1/27 |
Portfolio Management Discussion and Analysis(Unaudited)
Answers to the questions reflect the views of portfolio manager Andrew Susser of MacKay Shields LLC, the Portfolio’s Subadvisor.
How did MainStay VP MacKay High Yield Corporate Bond Portfolio perform relative to its benchmarks and peers during the six months ended June 30, 2019?
For the six months ended June 30, 2019, MainStay VP MacKay High Yield Corporate Bond Portfolio returned 8.81% for Initial Class shares and 8.68% for Service Class shares. Over the same period, both share classes underperformed the 10.16% return of the ICE BofAML U.S. High Yield Constrained Index, which is the Portfolio’s primary benchmark. For the six months ended June 30, 2019, the Portfolio’s Initial Class shares outperformed, and its Service Class shares underperformed, the 8.79% return of the Morningstar High Yield Bond Category Average.1
What factors affected the Portfolio’s performance relative to its primary benchmark during the reporting period?
During the reporting period, the Portfolio underperformed the ICE BofAML U.S. High Yield Constrained Index largely due to the relatively weak performance of holdings in the consumer discretionary sector, particularly bonds issued by automotive and industrial battery maker Exide Technologies. Holdings in the retailing industry group, specifically specialty retail, also detracted from the Portfolio’s relative performance, as did credit selection in the financials sector. Conversely, relative performance benefited from the Portfolio’s credit selection in the energy sector, particularly in the oil & gas exploration & production industry.
What was the Portfolio’s duration2 strategy during the reporting period?
The Portfolio is not managed to a duration strategy. Rather, the Portfolio’s duration positioning is the result of ourbottom-up investment process. As of June 30, 2019, the duration of the Portfolio was 3.0 years, compared to a duration of 3.4 years for the ICE BofAML U.S. High Yield Constrained Index.
What specific factors, risks or market forces prompted significant decisions for the Portfolio during the reporting period?
Spreads3 compressed rather dramatically during the reporting period; however, there were no significant changes to the Portfolio as a result. The market’s recovery during the reporting period afforded the Portfolio an opportunity to exit some positions, including bonds issued by Tenet Healthcare and Avis Budget Group, at more attractive prices. The Portfolio also took
advantage of the improved new issue market to purchase a bond floated by aerospace contractor TransDigm.
During the reporting period, which market segments were the strongest positive contributors to the Portfolio’s absolute performance and which market segments were particularly weak?
During the reporting period, the energy sector generated the Portfolio’s strongest absolute performance, led by positive security selection in the oil & gas exploration & production industry. Other market segments making notably strong contributions to the Portfolio’s absolute performance included utilities, where electric utility GenOn Energy performed particularly well, and health care, where security selection bolstered returns. (Contributions take weightings and total returns into account.)
Detractors from the Portfolio’s absolute performance included the consumer discretionary sector, where holdings in automotive and industrial battery maker Exide Technologies contributed negatively to performance. The Portfolio’s focus on higher quality securities in the cable & satellite industry also detracted from absolute performance.
Did the Portfolio make any significant purchases or sales during the reporting period?
During the reporting period, the Portfolio bought a new issue from aerospace contractor TransDigm, which we found attractive in light of the financial flexibility afforded by the company’s $23 billion equity market capitalization and its diverse aerospace assets. The Portfolio also purchased notes issued by Mattel, one of the largest toy manufacturers in the world with iconic brands such as Barbie, Hot Wheels and Fisher Price that we believe provide sufficient asset coverage.
During the same period, the Portfolio sold bonds from Tenet Healthcare as the price of the securities rose in the first quarter of 2019 on positive financial results. The Portfolio also sold bonds issued by Avis Budget Group as they increased in price after the company reported better-than-expected earnings due to an improved pricing environment and reduced costs.
How did the Portfolio’s sector/industry weightings change during the reporting period?
There were no material changes to the Portfolio’s sector/industry weightings during the reporting period. The Portfolio’s positions in industrials, automotive and consumer goods
| 1. | See page 5 for more information on benchmark and peer group returns. |
| 2. | Duration is a measure of the price sensitivity of a fixed-income investment to changes in interest rates. Duration is expressed as a number of years and is considered a more accurate sensitivity gauge than average maturity. |
| 3. | The terms “spread” and “yield spread” may refer to the difference in yield between a security or type of security and comparable U.S. Treasury issues. The terms may also refer to the difference in yield between two specific securities or types of securities at a given time. |
| | |
| 8 | | MainStay VP MacKay High Yield Corporate Bond Portfolio |
saw moderate increases, while positions in health care, banking and technology were reduced.
How was the Portfolio positioned at the end of the reporting period?
As of June 30, 2019, the Portfolio remained defensively positioned with underweight exposure to issuers rated CCC4 and below. In terms of sector/industry weightings, as of the same date, the Portfolio held overweight exposure to industrials, automotive and consumer goods, and underweight exposure to health care/pharmaceuticals, information technology and financials/banks.
| 4. | An obligation rated ‘CCC’ by S&P is deemed by S&P to be currently vulnerable to nonpayment and is dependent upon favorable business, financial and economic conditions for the obligor to meet its financial commitment on the obligation. It is the opinion of S&P that in the event of adverse business, financial or economic conditions, the obligor is not likely to have the capacity to meet its financial commitment on the obligation. When applied to Portfolio holdings, ratings are based solely on the creditworthiness of the bonds in the portfolio and are not meant to represent the security or safety of the Portfolio. |
The opinions expressed are those of the portfolio managers as of the date of this report and are subject to change. There is no guarantee that any forecasts will come to pass. This material does not constitute investment advice and is not intended as an endorsement of any specific investment.
Not all MainStay VP Portfolios and/or share classes are available under all policies.
Portfolio of InvestmentsJune 30, 2019 (Unaudited)
| | | | | | | | |
| | | Principal
Amount | | | Value | |
Long-Term Bonds 94.7%† Convertible Bonds 0.6% | |
Auto Parts & Equipment 0.3% | |
Exide Technologies
7.25% (7.25% PIK), due 4/30/27 (a)(b)(c)(d)(e) | | $ | 20,533,523 | | | $ | 8,439,277 | |
| | | | | | | | |
|
Internet 0.0%‡ | |
At Home Corp. (b)(c)(d)(f)(g)(h) | | | | | | | | |
0.525%, due 12/28/18 | | | 2,000,000 | | | | 26,000 | |
4.75%, due 3/15/06 | | | 10,210,000 | | | | 132,730 | |
| | | | | | | | |
| | | | | | | 158,730 | |
| | | | | | | | |
Real Estate Investment Trusts 0.3% | |
VEREIT, Inc.
3.75%, due 12/15/20 | | | 10,135,000 | | | | 10,216,749 | |
| | | | | | | | |
Total Convertible Bonds
(Cost $19,449,500) | | | | | | | 18,814,756 | |
| | | | | | | | |
|
| Corporate Bonds 92.5% | |
Advertising 1.3% | |
Lamar Media Corp. | | | | | | | | |
5.375%, due 1/15/24 | | | 5,447,000 | | | | 5,603,601 | |
5.75%, due 2/1/26 | | | 8,465,000 | | | | 8,898,831 | |
Outfront Media Capital LLC / Outfront Media Capital Corp. | | | | | | | | |
5.00%, due 8/15/27 (a) | | | 8,000,000 | | | | 8,189,600 | |
5.25%, due 2/15/22 | | | 3,495,000 | | | | 3,541,833 | |
5.625%, due 2/15/24 | | | 12,030,000 | | | | 12,375,863 | |
| | | | | | | | |
| | | | | | | 38,609,728 | |
| | | | | | | | |
Aerospace & Defense 1.3% | |
TransDigm UK Holdings PLC
6.875%, due 5/15/26 | | | 5,637,000 | | | | 5,703,939 | |
TransDigm, Inc. | | | | | | | | |
6.00%, due 7/15/22 | | | 2,760,000 | | | | 2,787,600 | |
6.25%, due 3/15/26 (a) | | | 19,950,000 | | | | 20,997,375 | |
6.50%, due 7/15/24 | | | 3,050,000 | | | | 3,084,313 | |
Triumph Group, Inc.
7.75%, due 8/15/25 | | | 6,430,000 | | | | 6,221,025 | |
| | | | | | | | |
| | | | | | | 38,794,252 | |
| | | | | | | | |
Auto Manufacturers 1.5% | |
BCD Acquisition, Inc.
9.625%, due 9/15/23 (a) | | | 6,410,000 | | | | 6,722,488 | |
Ford Holdings LLC
9.30%, due 3/1/30 | | | 6,970,000 | | | | 9,016,742 | |
J.B. Poindexter & Company, Inc.
7.125%, due 4/15/26 (a) | | | 8,055,000 | | | | 8,216,100 | |
McLaren Finance PLC
5.75%, due 8/1/22 (a) | | | 8,170,000 | | | | 7,854,801 | |
| | | | | | | | |
| | | Principal
Amount | | | Value | |
Auto Manufacturers (continued) | |
Navistar International Corp.
6.625%, due 11/1/25 (a) | | $ | 5,832,000 | | | $ | 6,109,020 | |
Wabash National Corp.
5.50%, due 10/1/25 (a) | | | 7,282,000 | | | | 6,899,695 | |
| | | | | | | | |
| | | | | | | 44,818,846 | |
| | | | | | | | |
Auto Parts & Equipment 3.4% | |
Adient Global Holdings, Ltd.
4.875%, due 8/15/26 (a) | | | 6,000,000 | | | | 4,770,000 | |
Adient U.S. LLC
7.00%, due 5/15/26 (a) | | | 4,000,000 | | | | 4,110,000 | |
American Axle & Manufacturing, Inc. | | | | | | | | |
6.25%, due 4/1/25 | | | 3,500,000 | | | | 3,482,500 | |
6.25%, due 3/15/26 | | | 3,715,000 | | | | 3,668,562 | |
6.50%, due 4/1/27 (i) | | | 3,315,000 | | | | 3,306,713 | |
Dana Financing Luxembourg S.A.R.L.
5.75%, due 4/15/25 (a) | | | 4,265,000 | | | | 4,376,956 | |
Exide International Holdings, L.P.
10.75% (6.25% Cash and 4.50% PIK), due 10/31/21 (b)(c)(d)(e) | | | 9,481,532 | | | | 9,206,568 | |
Exide Technologies
11.00% (3.00% Cash and 8.00% PIK), due 10/31/24 (a)(b)(c)(d)(e) | | | 23,703,830 | | | | 20,124,552 | |
11.00% (3.00% Cash and 8.00% PIK), due 10/31/24 (a)(b)(c)(d)(e) | | | 9,847,744 | | | | 7,671,393 | |
IHO Verwaltungs GmbH (a)(e) | | | | | | | | |
4.75% (4.75% Cash or 5.50% PIK), due 9/15/26 | | | 7,143,000 | | | | 6,955,496 | |
6.00% (6.00% Cash or 6.75% PIK), due 5/15/27 | | | 5,631,000 | | | | 5,659,155 | |
6.375% (6.375% Cash or 7.125% PIK), due 5/15/29 | | | 7,585,000 | | | | 7,585,000 | |
Meritor, Inc.
6.25%, due 2/15/24 | | | 2,000,000 | | | | 2,057,500 | |
Nexteer Automotive Group, Ltd.
5.875%, due 11/15/21 (a) | | | 6,640,000 | | | | 6,755,848 | |
Tenneco, Inc.
5.00%, due 7/15/26 | | | 6,982,000 | | | | 5,620,510 | |
Titan International, Inc.
6.50%, due 11/30/23 | | | 4,320,000 | | | | 3,747,600 | |
| | | | | | | | |
| | | | | | | 99,098,353 | |
| | | | | | | | |
Building Materials 1.1% | |
BMC East LLC
5.50%, due 10/1/24 (a) | | | 2,897,000 | | | | 2,936,834 | |
James Hardie International Finance DAC (a) | | | | | | | | |
4.75%, due 1/15/25 | | | 3,300,000 | | | | 3,366,000 | |
5.00%, due 1/15/28 | | | 6,430,000 | | | | 6,397,850 | |
Summit Materials LLC / Summit Materials Finance Corp. | | | | | | | | |
5.125%, due 6/1/25 (a) | | | 3,270,000 | | | | 3,278,175 | |
6.125%, due 7/15/23 | | | 12,080,000 | | | | 12,231,000 | |
6.50%, due 3/15/27 (a) | | | 5,135,000 | | | | 5,340,400 | |
| | | | | | | | |
| | | | | | | 33,550,259 | |
| | | | | | | | |
| | | | |
| 10 | | MainStay VP MacKay High Yield Corporate Bond Portfolio | | The notes to the financial statements are an integral part of,
and should be read in conjunction with, the financial statements. |
| | | | | | | | |
| | | Principal
Amount | | | Value | |
| Corporate Bonds (continued) | |
Chemicals 1.6% | |
Blue Cube Spinco LLC | | | | | | | | |
9.75%, due 10/15/23 | | $ | 12,370,000 | | | $ | 13,668,850 | |
10.00%, due 10/15/25 | | | 7,575,000 | | | | 8,569,219 | |
Kissner Holdings, L.P. / Kissner Milling Co., Ltd. / BSC Holding, Inc. / Kissner USA
8.375%, due 12/1/22 (a) | | | 6,635,000 | | | | 6,900,400 | |
Neon Holdings, Inc.
10.125%, due 4/1/26 (a) | | | 3,000,000 | | | | 2,955,000 | |
NOVA Chemicals Corp.
4.875%, due 6/1/24 (a) | | | 2,635,000 | | | | 2,727,225 | |
Olin Corp.
5.50%, due 8/15/22 | | | 3,261,000 | | | | 3,415,897 | |
PolyOne Corp.
5.25%, due 3/15/23 | | | 8,976,000 | | | | 9,469,680 | |
| | | | | | | | |
| | | | | | | 47,706,271 | |
| | | | | | | | |
Coal 0.1% | |
Natural Resource Partners LP / NRP Finance Corp.
9.125%, due 6/30/25 (a) | | | 2,800,000 | | | | 2,884,000 | |
| | | | | | | | |
|
Commercial Services 4.8% | |
Ashtead Capital, Inc. (a) | | | | | | | | |
4.375%, due 8/15/27 | | | 2,500,000 | | | | 2,503,125 | |
5.25%, due 8/1/26 | | | 1,500,000 | | | | 1,563,750 | |
5.625%, due 10/1/24 | | | 5,645,000 | | | | 5,842,575 | |
Cimpress N.V.
7.00%, due 6/15/26 (a) | | | 6,692,000 | | | | 6,825,773 | |
Flexi-Van Leasing, Inc.
10.00%, due 2/15/23 (a) | | | 8,085,000 | | | | 7,498,837 | |
Gartner, Inc.
5.125%, due 4/1/25 (a) | | | 14,007,000 | | | | 14,399,196 | |
Graham Holdings Co.
5.75%, due 6/1/26 (a) | | | 10,288,000 | | | | 10,879,560 | |
Harsco Corp.
5.75%, due 7/31/27 (a) | | | 4,970,000 | | | | 5,175,559 | |
Herc Holdings, Inc.
5.50%, due 7/15/27 (a) | | | 2,760,000 | | | | 2,777,250 | |
IHS Markit, Ltd. (a) | | | | | | | | |
4.75%, due 2/15/25 | | | 4,580,000 | | | | 4,912,508 | |
5.00%, due 11/1/22 | | | 20,705,000 | | | | 21,936,947 | |
Jaguar Holding Co. II / Pharmaceutical Product Development LLC
6.375%, due 8/1/23 (a) | | | 4,615,000 | | | | 4,776,525 | |
Matthews International Corp.
5.25%, due 12/1/25 (a) | | | 3,865,000 | | | | 3,802,194 | |
Nielsen Co. Luxembourg S.A.R.L. (a) | | | | | | | | |
5.00%, due 2/1/25 | | | 5,835,000 | | | | 5,732,888 | |
5.50%, due 10/1/21 | | | 1,340,000 | | | | 1,345,025 | |
| | | | | | | | |
| | | Principal
Amount | | | Value | |
Commercial Services (continued) | |
Nielsen Finance LLC / Nielsen Finance Co. | | | | | | | | |
4.50%, due 10/1/20 | | $ | 2,000,000 | | | $ | 2,004,750 | |
5.00%, due 4/15/22 (a) | | | 20,569,000 | | | | 20,517,577 | |
Ritchie Bros. Auctioneers, Inc.
5.375%, due 1/15/25 (a) | | | 2,800,000 | | | | 2,901,500 | |
Service Corp. International
5.125%, due 6/1/29 | | | 701,000 | | | | 737,803 | |
United Rentals North America, Inc. | | | | | | | | |
4.875%, due 1/15/28 | | | 4,560,000 | | | | 4,651,200 | |
5.25%, due 1/15/30 | | | 5,152,000 | | | | 5,293,680 | |
5.50%, due 5/15/27 | | | 2,239,000 | | | | 2,356,548 | |
6.50%, due 12/15/26 | | | 3,420,000 | | | | 3,702,150 | |
| | | | | | | | |
| | | | | | | 142,136,920 | |
| | | | | | | | |
Computers 0.2% | |
NCR Corp.
6.375%, due 12/15/23 | | | 6,300,000 | | | | 6,496,875 | |
| | | | | | | | |
|
Consumer Services 0.2% | |
Allied Universal Holdco. LLC
9.75%, due 7/15/27 (a) | | | 4,830,000 | | | | 4,811,888 | |
| | | | | | | | |
|
Cosmetics & Personal Care 0.5% | |
Edgewell Personal Care Co. | | | | | | | | |
4.70%, due 5/19/21 | | | 6,235,000 | | | | 6,344,113 | |
4.70%, due 5/24/22 | | | 8,070,000 | | | | 8,150,700 | |
| | | | | | | | |
| | | | | | | 14,494,813 | |
| | | | | | | | |
Distribution & Wholesale 0.1% | |
H&E Equipment Services, Inc.
5.625%, due 9/1/25 | | | 2,750,000 | | | | 2,828,375 | |
| | | | | | | | |
|
Diversified Financial Services 2.5% | |
AerCap Ireland Capital DAC / AerCap Global Aviation Trust | | | | | | | | |
4.625%, due 10/30/20 | | | 1,740,000 | | | | 1,784,206 | |
5.00%, due 10/1/21 | | | 3,415,000 | | | | 3,581,777 | |
Credit Acceptance Corp. | | | | | | | | |
6.125%, due 2/15/21 | | | 3,700,000 | | | | 3,700,000 | |
6.625%, due 3/15/26 (a) | | | 6,990,000 | | | | 7,348,238 | |
7.375%, due 3/15/23 | | | 6,530,000 | | | | 6,783,038 | |
Jefferies Finance LLC / JFINCo-Issuer Corp. (a) | | | | | | | | |
6.25%, due 6/3/26 | | | 5,000,000 | | | | 5,043,750 | |
7.25%, due 8/15/24 | | | 3,955,000 | | | | 3,884,482 | |
Ladder Capital Finance Holdings LLLP / Ladder Capital Finance Corp. (a) | | | | | | | | |
5.25%, due 3/15/22 | | | 6,685,000 | | | | 6,818,700 | |
5.875%, due 8/1/21 | | | 8,560,000 | | | | 8,688,400 | |
| | | | | | |
The notes to the financial statements are an integral part of,
and should be read in conjunction with, the financial statements. | | | | | 11 | |
Portfolio of InvestmentsJune 30, 2019 (Unaudited) (continued)
| | | | | | | | |
| | | Principal
Amount | | | Value | |
| Corporate Bonds (continued) | |
Diversified Financial Services (continued) | |
LPL Holdings, Inc.
5.75%, due 9/15/25 (a) | | $ | 8,510,000 | | | $ | 8,712,112 | |
Ocwen Loan Servicing LLC
8.375%, due 11/15/22 (a) | | | 3,210,000 | | | | 2,680,350 | |
Oxford Finance LLC / Oxford FinanceCo-Issuer II, Inc.
6.375%, due 12/15/22 (a) | | | 5,480,000 | | | | 5,630,700 | |
VFH Parent LLC / Orchestra Co-Issuer, Inc.
6.75%, due 6/15/22 (a) | | | 6,980,000 | | | | 7,232,467 | |
Werner FinCo, L.P. / Werner FinCo, Inc.
8.75%, due 7/15/25 (a) | | | 3,380,000 | | | | 2,864,550 | |
| | | | | | | | |
| | | | | | | 74,752,770 | |
| | | | | | | | |
Electric 1.5% | |
AES Corp.
5.50%, due 4/15/25 | | | 2,000,000 | | | | 2,077,500 | |
Calpine Corp. (a) | | | | | | | | |
5.875%, due 1/15/24 | | | 6,485,000 | | | | 6,630,912 | |
6.00%, due 1/15/22 | | | 8,255,000 | | | | 8,296,275 | |
GenOn Energy, Inc. / NRG Americas, Inc.
9.044% (1 Month LIBOR + 6.5%), due 12/1/23 (j) | | | 10,266,086 | | | | 10,176,258 | |
Keystone Power Pass-Through Holders LLC / Conemaugh Power
Pass-Through Holders
13.00% (13.00% PIK), due 6/1/24 (a)(b)(e) | | | 2,706,312 | | | | 2,760,438 | |
NRG Energy, Inc.
6.625%, due 1/15/27 | | | 7,000,000 | | | | 7,603,750 | |
Talen Energy Supply LLC
6.625%, due 1/15/28 (a) | | | 2,000,000 | | | | 1,987,500 | |
Vistra Operations Co. LLC
5.00%, due 7/31/27 (a) | | | 3,300,000 | | | | 3,419,625 | |
| | | | | | | | |
| | | | | | | 42,952,258 | |
| | | | | | | | |
Electrical Components & Equipment 0.4% | |
Energizer Holdings, Inc.
7.75%, due 1/15/27 (a) | | | 4,555,000 | | | | 4,930,013 | |
WESCO Distribution, Inc.
5.375%, due 12/15/21 | | | 7,160,000 | | | | 7,213,700 | |
| | | | | | | | |
| | | | | | | 12,143,713 | |
| | | | | | | | |
Electrical Equipment 0.2% | |
Resideo Funding, Inc.
6.125%, due 11/1/26 (a) | | | 6,569,000 | | | | 6,831,760 | |
| | | | | | | | |
|
Electronics 0.2% | |
Itron, Inc.
5.00%, due 1/15/26 (a) | | | 6,365,000 | | | | 6,508,213 | |
| | | | | | | | |
| | | | | | | | |
| | | Principal
Amount | | | Value | |
Engineering & Construction 0.4% | |
Weekley Homes LLC / Weekley Finance Corp. | | | | | | | | |
6.00%, due 2/1/23 | | $ | 7,219,000 | | | $ | 7,128,762 | |
6.625%, due 8/15/25 | | | 4,095,000 | | | | 4,043,813 | |
| | | | | | | | |
| | | | | | | 11,172,575 | |
| | | | | | | | |
Entertainment 1.8% | |
Boyne USA, Inc.
7.25%, due 5/1/25 (a) | | | 3,950,000 | | | | 4,275,875 | |
Churchill Downs, Inc. (a) | | | | | | | | |
4.75%, due 1/15/28 | | | 4,565,000 | | | | 4,586,684 | |
5.50%, due 4/1/27 | | | 7,890,000 | | | | 8,259,844 | |
International Game Technology PLC
6.25%, due 1/15/27 (a) | | | 7,105,000 | | | | 7,771,094 | |
Jacobs Entertainment, Inc.
7.875%, due 2/1/24 (a) | | | 2,193,000 | | | | 2,341,027 | |
Merlin Entertainments PLC
5.75%, due 6/15/26 (a) | | | 9,050,000 | | | | 9,525,125 | |
Rivers Pittsburgh Borrower, L.P. / Rivers Pittsburgh Finance Corp.
6.125%, due 8/15/21 (a) | | | 7,923,000 | | | | 8,041,845 | |
Twin River Worldwide Holdings, Inc.
6.75%, due 6/1/27 (a) | | | 7,850,000 | | | | 8,183,625 | |
| | | | | | | | |
| | | | | | | 52,985,119 | |
| | | | | | | | |
Food 1.9% | |
B&G Foods, Inc. | | | | | | | | |
4.625%, due 6/1/21 | | | 2,190,000 | | | | 2,192,738 | |
5.25%, due 4/1/25 | | | 5,767,000 | | | | 5,824,670 | |
C&S Group Enterprises LLC
5.375%, due 7/15/22 (a) | | | 17,633,000 | | | | 17,633,000 | |
KeHE Distributors LLC / KeHE Finance Corp.
7.625%, due 8/15/21 (a) | | | 4,175,000 | | | | 4,143,687 | |
Land O’Lakes Capital Trust I
7.45%, due 3/15/28 (a) | | | 5,130,000 | | | | 5,681,475 | |
Land O’Lakes, Inc.
6.00%, due 11/15/22 (a) | | | 7,880,000 | | | | 8,239,504 | |
Post Holdings, Inc.
5.50%, due 12/15/29 (a) | | | 2,795,000 | | | | 2,801,987 | |
Simmons Foods, Inc.
7.75%, due 1/15/24 (a) | | | 1,400,000 | | | | 1,508,500 | |
TreeHouse Foods, Inc.
6.00%, due 2/15/24 (a) | | | 9,045,000 | | | | 9,406,800 | |
| | | | | | | | |
| | | | | | | 57,432,361 | |
| | | | | | | | |
Forest Products & Paper 1.2% | |
Mercer International, Inc. | | | | | | | | |
5.50%, due 1/15/26 | | | 1,250,000 | | | | 1,243,750 | |
6.50%, due 2/1/24 | | | 6,005,000 | | | | 6,215,175 | |
7.375%, due 1/15/25 (a) | | | 4,000,000 | | | | 4,250,000 | |
7.75%, due 12/1/22 | | | 104,000 | | | | 107,900 | |
| | | | |
| 12 | | MainStay VP MacKay High Yield Corporate Bond Portfolio | | The notes to the financial statements are an integral part of,
and should be read in conjunction with, the financial statements. |
| | | | | | | | |
| | | Principal
Amount | | | Value | |
| Corporate Bonds (continued) | |
Forest Products & Paper (continued) | |
Schweitzer-Mauduit International, Inc.
6.875%, due 10/1/26 (a) | | $ | 5,900,000 | | | $ | 6,032,750 | |
Smurfit Kappa Treasury Funding DAC
7.50%, due 11/20/25 | | | 15,843,000 | | | | 18,417,487 | |
| | | | | | | | |
| | | | | | | 36,267,062 | |
| | | | | | | | |
Gas 1.0% | |
AmeriGas Partners, L.P. / AmeriGas Finance Corp. | | | | | | | | |
5.50%, due 5/20/25 | | | 2,050,000 | | | | 2,157,625 | |
5.625%, due 5/20/24 | | | 7,385,000 | | | | 7,865,025 | |
5.75%, due 5/20/27 | | | 5,930,000 | | | | 6,226,500 | |
5.875%, due 8/20/26 | | | 8,995,000 | | | | 9,534,700 | |
Rockpoint Gas Storage Canada, Ltd.
7.00%, due 3/31/23 (a) | | | 5,100,000 | | | | 5,170,125 | |
| | | | | | | | |
| | | | | | | 30,953,975 | |
| | | | | | | | |
Health Care—Products 0.5% | |
Hill-Rom Holdings, Inc.
5.75%, due 9/1/23 (a) | | | 4,705,000 | | | | 4,862,853 | |
Hologic, Inc. (a) | | | | | | | | |
4.375%, due 10/15/25 | | | 4,080,000 | | | | 4,136,100 | |
4.625%, due 2/1/28 | | | 3,000,000 | | | | 3,045,000 | |
Teleflex, Inc.
4.625%, due 11/15/27 | | | 2,275,000 | | | | 2,340,406 | |
| | | | | | | | |
| | | | | | | 14,384,359 | |
| | | | | | | | |
Health Care—Services 4.5% | |
Acadia Healthcare Co., Inc. | | | | | | | | |
5.625%, due 2/15/23 | | | 7,812,000 | | | | 7,938,945 | |
6.50%, due 3/1/24 | | | 2,500,000 | | | | 2,606,250 | |
AHP Health Partners, Inc.
9.75%, due 7/15/26 (a) | | | 3,210,000 | | | | 3,458,775 | |
Catalent Pharma Solutions, Inc. (a) | | | | | | | | |
4.875%, due 1/15/26 | | | 4,890,000 | | | | 4,957,238 | |
5.00%, due 7/15/27 | | | 220,000 | | | | 223,850 | |
Centene Corp. | | | | | | | | |
4.75%, due 1/15/25 | | | 4,605,000 | | | | 4,753,327 | |
5.375%, due 6/1/26 (a) | | | 3,885,000 | | | | 4,084,106 | |
5.625%, due 2/15/21 | | | 5,305,000 | | | | 5,404,469 | |
6.125%, due 2/15/24 | | | 6,315,000 | | | | 6,614,962 | �� |
Charles River Laboratories International, Inc.
5.50%, due 4/1/26 (a) | | | 6,680,000 | | | | 7,029,364 | |
Eagle Holding Co. II LLC
7.625% (7.625% Cash or 8.375% PIK), due 5/15/22 (a)(e) | | | 3,000,000 | | | | 3,015,000 | |
Encompass Health Corp.
5.75%, due 11/1/24 | | | 6,398,000 | | | | 6,515,083 | |
| | | | | | | | |
| | | Principal
Amount | | | Value | |
Health Care—Services (continued) | |
HCA, Inc. | | | | | | | | |
5.00%, due 3/15/24 | | $ | 1,536,000 | | | $ | 1,673,377 | |
5.25%, due 4/15/25 | | | 4,220,000 | | | | 4,675,581 | |
5.25%, due 6/15/26 | | | 1,675,000 | | | | 1,854,574 | |
5.375%, due 2/1/25 | | | 2,320,000 | | | | 2,504,150 | |
5.625%, due 9/1/28 | | | 1,060,000 | | | | 1,147,450 | |
5.875%, due 3/15/22 | | | 5,130,000 | | | | 5,606,877 | |
5.875%, due 5/1/23 | | | 4,800,000 | | | | 5,219,424 | |
5.875%, due 2/15/26 | | | 9,015,000 | | | | 9,961,575 | |
7.50%, due 2/15/22 | | | 1,570,000 | | | | 1,730,925 | |
7.50%, due 11/6/33 | | | 6,000,000 | | | | 6,900,000 | |
7.58%, due 9/15/25 | | | 1,770,000 | | | | 2,035,500 | |
7.69%, due 6/15/25 | | | 9,195,000 | | | | 10,804,125 | |
8.36%, due 4/15/24 | | | 1,020,000 | | | | 1,178,100 | |
RegionalCare Hospital Partners Holdings, Inc. / LifePoint Health, Inc.
9.75%, due 12/1/26 (a) | | | 9,555,000 | | | | 10,008,862 | |
Tenet Healthcare Corp.
8.125%, due 4/1/22 | | | 3,380,000 | | | | 3,544,775 | |
WellCare Health Plans, Inc. | | | | | | | | |
5.25%, due 4/1/25 | | | 4,455,000 | | | | 4,644,338 | |
5.375%, due 8/15/26 (a) | | | 2,380,000 | | | | 2,522,800 | |
| | | | | | | | |
| | | | | | | 132,613,802 | |
| | | | | | | | |
Home Builders 2.2% | |
Ashton Woods USA LLC / Ashton Woods Finance Co. (a) | | | | | | | | |
6.75%, due 8/1/25 | | | 2,237,000 | | | | 2,158,705 | |
9.875%, due 4/1/27 | | | 3,230,000 | | | | 3,403,612 | |
Brookfield Residential Properties, Inc. (a) | | | | | | | | |
6.375%, due 5/15/25 | | | 3,520,000 | | | | 3,555,200 | |
6.50%, due 12/15/20 | | | 12,995,000 | | | | 13,011,244 | |
Brookfield Residential Properties, Inc. / Brookfield Residential U.S. Corp.
6.125%, due 7/1/22 (a) | | | 4,100,000 | | | | 4,171,750 | |
Century Communities, Inc. | | | | | | | | |
5.875%, due 7/15/25 | | | 3,100,000 | | | | 3,115,500 | |
6.75%, due 6/1/27 (a) | | | 6,775,000 | | | | 6,868,156 | |
M/I Homes, Inc.
5.625%, due 8/1/25 | | | 1,600,000 | | | | 1,624,000 | |
Mattamy Group Corp.
6.50%, due 10/1/25 (a) | | | 3,225,000 | | | | 3,398,344 | |
New Home Co., Inc.
7.25%, due 4/1/22 | | | 5,400,000 | | | | 5,089,500 | |
Shea Homes, L.P. / Shea Homes Funding Corp. (a) | | | | | | | | |
5.875%, due 4/1/23 | | | 2,445,000 | | | | 2,493,900 | |
6.125%, due 4/1/25 | | | 11,175,000 | | | | 11,281,051 | |
Williams Scotsman International, Inc.
7.875%, due 12/15/22 (a) | | | 4,935,000 | | | | 5,181,750 | |
| | | | | | | | |
| | | | | | | 65,352,712 | |
| | | | | | | | |
| | | | | | |
The notes to the financial statements are an integral part of,
and should be read in conjunction with, the financial statements. | | | | | 13 | |
Portfolio of InvestmentsJune 30, 2019 (Unaudited) (continued)
| | | | | | | | |
| | | Principal
Amount | | | Value | |
| Corporate Bonds (continued) | |
Household Products & Wares 0.8% | |
Prestige Brands, Inc.
6.375%, due 3/1/24 (a)(i) | | $ | 12,915,000 | | | $ | 13,512,319 | |
Spectrum Brands, Inc. | | | | | | | | |
5.75%, due 7/15/25 | | | 5,540,000 | | | | 5,754,675 | |
6.625%, due 11/15/22 | | | 3,295,000 | | | | 3,374,080 | |
| | | | | | | | |
| | | | | | | 22,641,074 | |
| | | | | | | | |
Insurance 1.3% | |
American Equity Investment Life Holding Co.
5.00%, due 6/15/27 | | | 8,145,000 | | | | 8,354,322 | |
Fairfax Financial Holdings, Ltd.
8.30%, due 4/15/26 | | | 4,645,000 | | | | 5,655,126 | |
Fidelity & Guaranty Life Holdings, Inc.
5.50%, due 5/1/25 (a) | | | 5,000,000 | | | | 5,187,500 | |
HUB International, Ltd.
7.00%, due 5/1/26 (a) | | | 3,000,000 | | | | 3,041,250 | |
MGIC Investment Corp.
5.75%, due 8/15/23 | | | 9,545,000 | | | | 10,356,325 | |
USI, Inc.
6.875%, due 5/1/25 (a) | | | 5,815,000 | | | | 5,756,850 | |
| | | | | | | | |
| | | | | | | 38,351,373 | |
| | | | | | | | |
Internet 1.9% | |
Cogent Communications Group, Inc.
5.375%, due 3/1/22 (a) | | | 2,870,000 | | | | 2,970,450 | |
Netflix, Inc. | | | | | | | | |
4.875%, due 4/15/28 | | | 1,692,000 | | | | 1,744,875 | |
5.375%, due 11/15/29 (a) | | | 2,500,000 | | | | 2,655,475 | |
5.50%, due 2/15/22 | | | 7,455,000 | | | | 7,837,069 | |
5.75%, due 3/1/24 | | | 10,899,000 | | | | 11,798,167 | |
5.875%, due 2/15/25 | | | 3,320,000 | | | | 3,660,300 | |
5.875%, due 11/15/28 | | | 8,800,000 | | | | 9,742,656 | |
Symantec Corp.
5.00%, due 4/15/25 (a) | | | 1,214,000 | | | | 1,244,536 | |
VeriSign, Inc. | | | | | | | | |
4.75%, due 7/15/27 | | | 4,900,000 | | | | 5,102,125 | |
5.25%, due 4/1/25 | | | 9,025,000 | | | | 9,634,188 | |
| | | | | | | | |
| | | | | | | 56,389,841 | |
| | | | | | | | |
Investment Companies 1.0% | |
Compass Group Diversified Holdings LLC
8.00%, due 5/1/26 (a) | | | 2,560,000 | | | | 2,668,800 | |
FS Energy & Power Fund
7.50%, due 8/15/23 (a) | | | 17,875,000 | | | | 18,143,125 | |
Icahn Enterprises, L.P. / Icahn Enterprises Finance Corp.
6.25%, due 5/15/26 (a) | | | 7,290,000 | | | | 7,390,237 | |
| | | | | | | | |
| | | | | | | 28,202,162 | |
| | | | | | | | |
| | | | | | | | |
| | | Principal
Amount | | | Value | |
Iron & Steel 1.3% | |
Allegheny Ludlum LLC
6.95%, due 12/15/25 | | $ | 7,400,000 | | | $ | 7,682,125 | |
Allegheny Technologies, Inc.
7.875%, due 8/15/23 | | | 2,428,000 | | | | 2,601,723 | |
Big River Steel LLC / BRS Finance Corp.
7.25%, due 9/1/25 (a) | | | 19,084,000 | | | | 20,048,696 | |
Mineral Resources, Ltd.
8.125%, due 5/1/27 (a) | | | 8,630,000 | | | | 8,985,988 | |
| | | | | | | | |
| | | | | | | 39,318,532 | |
| | | | | | | | |
Leisure Time 1.6% | |
Brunswick Corp.
4.625%, due 5/15/21 (a) | | | 2,475,000 | | | | 2,479,532 | |
Carlson Travel, Inc. (a) | | | | | | | | |
6.75%, due 12/15/23 (i) | | | 21,868,000 | | | | 22,141,350 | |
9.50%, due 12/15/24 | | | 15,253,000 | | | | 15,214,867 | |
Vista Outdoor, Inc.
5.875%, due 10/1/23 | | | 8,369,000 | | | | 8,163,290 | |
| | | | | | | | |
| | | | | | | 47,999,039 | |
| | | | | | | | |
Lodging 2.4% | |
Boyd Gaming Corp. | | | | | | | | |
6.00%, due 8/15/26 | | | 9,000,000 | | | | 9,461,250 | |
6.375%, due 4/1/26 | | | 1,935,000 | | | | 2,046,998 | |
Choice Hotels International, Inc.
5.75%, due 7/1/22 | | | 8,283,000 | | | | 8,904,391 | |
Hilton Domestic Operating Co., Inc. | | | | | | | | |
4.875%, due 1/15/30 (a) | | | 8,000,000 | | | | 8,240,000 | |
5.125%, due 5/1/26 | | | 10,940,000 | | | | 11,418,625 | |
Jack Ohio Finance LLC / Jack Ohio Finance 1 Corp.
6.75%, due 11/15/21 (a) | | | 6,500,000 | | | | 6,676,800 | |
Marriott Ownership Resorts, Inc. / ILG LLC
6.50%, due 9/15/26 | | | 7,481,000 | | | | 8,023,372 | |
MGM Resorts International | | | | | | | | |
5.50%, due 4/15/27 | | | 6,405,000 | | | | 6,717,244 | |
5.75%, due 6/15/25 | | | 7,680,000 | | | | 8,354,304 | |
| | | | | | | | |
| | | | | | | 69,842,984 | |
| | | | | | | | |
Machinery—Diversified 0.9% | |
Briggs & Stratton Corp.
6.875%, due 12/15/20 | | | 5,030,000 | | | | 5,231,200 | |
Colfax Corp. (a) | | | | | | | | |
6.00%, due 2/15/24 | | | 4,540,000 | | | | 4,801,050 | |
6.375%, due 2/15/26 | | | 4,600,000 | | | | 4,933,500 | |
Stevens Holding Co., Inc.
6.125%, due 10/1/26 (a) | | | 4,200,000 | | | | 4,425,750 | |
Tennant Co.
5.625%, due 5/1/25 | | | 6,770,000 | | | | 6,990,025 | |
| | | | | | | | |
| | | | | | | 26,381,525 | |
| | | | | | | | |
| | | | |
| 14 | | MainStay VP MacKay High Yield Corporate Bond Portfolio | | The notes to the financial statements are an integral part of,
and should be read in conjunction with, the financial statements. |
| | | | | | | | |
| | | Principal
Amount | | | Value | |
| Corporate Bonds (continued) | |
Media 7.3% | |
Altice Financing S.A.
7.50%, due 5/15/26 (a) | | $ | 4,965,000 | | | $ | 4,990,322 | |
Altice France S.A. (a) | | | | | | | | |
6.25%, due 5/15/24 | | | 1,459,000 | | | | 1,502,770 | |
7.375%, due 5/1/26 | | | 7,000,000 | | | | 7,175,000 | |
Block Communications, Inc.
6.875%, due 2/15/25 (a) | | | 12,680,000 | | | | 13,218,900 | |
CCO Holdings LLC / CCO Holdings Capital Corp. | | | | | | | | |
5.00%, due 2/1/28 (a) | | | 8,550,000 | | | | 8,731,260 | |
5.125%, due 2/15/23 | | | 5,130,000 | | | | 5,211,054 | |
5.125%, due 5/1/27 (a) | | | 12,000,000 | | | | 12,424,320 | |
5.375%, due 5/1/25 (a) | | | 1,961,000 | | | | 2,027,184 | |
5.375%, due 6/1/29 (a) | | | 4,780,000 | | | | 4,935,350 | |
5.75%, due 1/15/24 | | | 4,118,000 | | | | 4,210,140 | |
5.75%, due 2/15/26 (a) | | | 5,090,000 | | | | 5,338,138 | |
5.875%, due 4/1/24 (a) | | | 8,005,000 | | | | 8,365,225 | |
5.875%, due 5/1/27 (a) | | | 2,850,000 | | | | 3,006,750 | |
CSC Holdings LLC (a) | | | | | | | | |
5.375%, due 7/15/23 | | | 6,840,000 | | | | 7,028,100 | |
6.50%, due 2/1/29 | | | 2,660,000 | | | | 2,902,725 | |
DISH DBS Corp. | | | | | | | | |
5.00%, due 3/15/23 | | | 1,600,000 | | | | 1,546,000 | |
5.875%, due 7/15/22 | | | 7,655,000 | | | | 7,769,825 | |
5.875%, due 11/15/24 | | | 9,150,000 | | | | 8,658,187 | |
6.75%, due 6/1/21 | | | 5,500,000 | | | | 5,768,125 | |
7.75%, due 7/1/26 | | | 6,045,000 | | | | 5,863,650 | |
Meredith Corp.
6.875%, due 2/1/26 | | | 14,550,000 | | | | 15,439,441 | |
Midcontinent Communications / Midcontinent Finance Corp.
6.875%, due 8/15/23 (a) | | | 5,505,000 | | | | 5,711,438 | |
Quebecor Media, Inc.
5.75%, due 1/15/23 | | | 15,647,000 | | | | 16,742,290 | |
Sirius XM Radio, Inc.
4.625%, due 7/15/24 (a) | | | 1,615,000 | | | | 1,652,597 | |
Sterling Entertainment Enterprises LLC
10.25%, due 1/15/25 (b)(c)(d)(g) | | | 7,000,000 | | | | 7,367,500 | |
Videotron, Ltd. | | | | | | | | |
5.00%, due 7/15/22 | | | 4,865,000 | | | | 5,096,088 | |
5.125%, due 4/15/27 (a) | | | 5,890,000 | | | | 6,147,687 | |
5.375%, due 6/15/24 (a) | | | 11,450,000 | | | | 12,251,500 | |
Virgin Media Secured Finance PLC
5.25%, due 1/15/21 | | | 22,552,000 | | | | 23,516,098 | |
| | | | | | | | |
| | | | | | | 214,597,664 | |
| | | | | | | | |
Metal Fabricate & Hardware 1.9% | |
Grinding Media, Inc. / Moly-Cop AltaSteel, Ltd.
7.375%, due 12/15/23 (a) | | | 20,235,000 | | | | 19,375,012 | |
| | | | | | | | |
| | | Principal
Amount | | | Value | |
Metal Fabricate & Hardware (continued) | |
Novelis Corp. (a) | | | | | | | | |
5.875%, due 9/30/26 | | $ | 20,200,000 | | | $ | 20,452,500 | |
6.25%, due 8/15/24 | | | 8,760,000 | | | | 9,184,510 | |
Optimas OE Solutions Holding LLC / Optimas OE Solutions, Inc.
8.625%, due 6/1/21 (a) | | | 3,250,000 | | | | 2,990,000 | |
Park-Ohio Industries, Inc.
6.625%, due 4/15/27 | | | 5,325,000 | | | | 5,325,000 | |
| | | | | | | | |
| | | | | | | 57,327,022 | |
| | | | | | | | |
Mining 1.9% | |
Alcoa Nederland Holding B.V. (a) | | | | | | | | |
6.75%, due 9/30/24 | | | 2,765,000 | | | | 2,920,531 | |
7.00%, due 9/30/26 | | | 5,745,000 | | | | 6,147,150 | |
Constellium N.V. (a) | | | | | | | | |
5.875%, due 2/15/26 | | | 3,350,000 | | | | 3,442,125 | |
6.625%, due 3/1/25 | | | 1,650,000 | | | | 1,716,000 | |
First Quantum Minerals, Ltd. (a) | | | | | | | | |
7.25%, due 4/1/23 | | | 7,480,000 | | | | 7,283,650 | |
7.50%, due 4/1/25 | | | 2,600,000 | | | | 2,476,500 | |
Freeport McMoRan, Inc.
6.875%, due 2/15/23 | | | 19,835,000 | | | | 20,876,338 | |
Hecla Mining Co.
6.875%, due 5/1/21 | | | 8,516,000 | | | | 8,128,505 | |
Joseph T. Ryerson & Son, Inc.
11.00%, due 5/15/22 (a) | | | 2,450,000 | | | | 2,590,875 | |
| | | | | | | | |
| | | | | | | 55,581,674 | |
| | | | | | | | |
Miscellaneous—Manufacturing 0.9% | |
Amsted Industries, Inc. (a) | | | | | | | | |
5.375%, due 9/15/24 | | | 900,000 | | | | 921,375 | |
5.625%, due 7/1/27 | | | 7,240,000 | | | | 7,547,700 | |
EnPro Industries, Inc.
5.75%, due 10/15/26 | | | 2,160,000 | | | | 2,208,600 | |
FXI Holdings, Inc.
7.875%, due 11/1/24 (a) | | | 1,750,000 | | | | 1,631,875 | |
Gates Global LLC / Gates Global Co.
6.00%, due 7/15/22 (a) | | | 5,355,000 | | | | 5,358,347 | |
Koppers, Inc.
6.00%, due 2/15/25 (a) | | | 8,265,000 | | | | 7,748,437 | |
| | | | | | | | |
| | | | | | | 25,416,334 | |
| | | | | | | | |
Oil & Gas 6.8% | |
Ascent Resources Utica Holdings LLC / ARU Finance Corp. (a) | | | | | | | | |
7.00%, due 11/1/26 | | | 4,500,000 | | | | 4,106,250 | |
10.00%, due 4/1/22 | | | 4,206,000 | | | | 4,452,682 | |
California Resources Corp. | | | | | | | | |
5.00%, due 1/15/20 | | | 6,330,000 | | | | 6,045,150 | |
8.00%, due 12/15/22 (a) | | | 16,905,000 | | | | 12,742,144 | |
Callon Petroleum Co.
6.125%, due 10/1/24 | | | 8,080,000 | | | | 8,160,800 | |
| | | | | | |
The notes to the financial statements are an integral part of,
and should be read in conjunction with, the financial statements. | | | | | 15 | |
Portfolio of InvestmentsJune 30, 2019 (Unaudited) (continued)
| | | | | | | | |
| | | Principal
Amount | | | Value | |
| Corporate Bonds (continued) | |
Oil & Gas (continued) | |
Calumet Specialty Products Partners, L.P. / Calumet Finance Corp.
7.625%, due 1/15/22 | | $ | 2,815,000 | | | $ | 2,723,513 | |
CNX Resources Corp.
5.875%, due 4/15/22 | | | 4,493,000 | | | | 4,358,210 | |
Comstock Resources, Inc.
9.75%, due 8/15/26 | | | 20,370,000 | | | | 15,633,975 | |
Continental Resources, Inc.
5.00%, due 9/15/22 | | | 4,799,000 | | | | 4,838,380 | |
Energy Ventures Gom LLC / EnVen Finance Corp.
11.00%, due 2/15/23 (a) | | | 4,020,000 | | | | 4,401,900 | |
Gulfport Energy Corp. | | | | | | | | |
6.00%, due 10/15/24 | | | 13,395,000 | | | | 10,347,637 | |
6.375%, due 5/15/25 | | | 8,000,000 | | | | 6,190,000 | |
6.375%, due 1/15/26 | | | 3,070,000 | | | | 2,325,525 | |
Hess Infrastructure Partners L.P. / Hess Infrastructure Partners Finance Corp.
5.625%, due 2/15/26 (a) | | | 3,300,000 | | | | 3,394,875 | |
Indigo Natural Resources LLC
6.875%, due 2/15/26 (a) | | | 4,505,000 | | | | 4,043,237 | |
Matador Resources Co.
5.875%, due 9/15/26 | | | 7,410,000 | | | | 7,484,100 | |
Moss Creek Resources Holdings, Inc.
7.50%, due 1/15/26 (a) | | | 4,065,000 | | | | 3,465,413 | |
Murphy Oil Corp.
6.875%, due 8/15/24 | | | 3,315,000 | | | | 3,480,750 | |
Murphy Oil USA, Inc. | | | | | | | | |
5.625%, due 5/1/27 | | | 2,994,000 | | | | 3,113,760 | |
6.00%, due 8/15/23 | | | 7,150,000 | | | | 7,346,625 | |
Oasis Petroleum, Inc.
6.875%, due 3/15/22 | | | 1,401,000 | | | | 1,397,498 | |
Parkland Fuel Corp.
5.875%, due 7/15/27 (a) | | | 2,780,000 | | | | 2,824,341 | |
Parsley Energy LLC / Parsley Finance Corp. (a) | | | | | | | | |
5.25%, due 8/15/25 | | | 3,210,000 | | | | 3,258,150 | |
5.625%, due 10/15/27 | | | 3,000,000 | | | | 3,135,000 | |
PDC Energy, Inc.
6.125%, due 9/15/24 | | | 7,883,000 | | | | 7,883,000 | |
PetroQuest Energy, Inc.
10.00% (10.00% PIK), due 2/15/24 (c)(d)(e) | | | 5,740,774 | | | | 4,362,988 | |
QEP Resources, Inc.
5.625%, due 3/1/26 | | | 3,000,000 | | | | 2,820,000 | |
Range Resources Corp. | | | | | | | | |
5.75%, due 6/1/21 | | | 6,610,000 | | | | 6,676,100 | |
5.875%, due 7/1/22 | | | 7,720,000 | | | | 7,642,800 | |
Rex Energy Corp. (Escrow Claim)
8.00%, due 10/1/20 (b)(g)(h) | | | 40,580,000 | | | | 557,975 | |
| | | | | | | | |
| | | Principal
Amount | | | Value | |
Oil & Gas (continued) | |
Southwestern Energy Co.
7.50%, due 4/1/26 | | $ | 7,525,000 | | | $ | 7,129,034 | |
SRC Energy, Inc.
6.25%, due 12/1/25 | | | 8,490,000 | | | | 7,725,900 | |
Sunoco, L.P. / Sunoco Finance Corp.
6.00%, due 4/15/27 (a) | | | 4,000,000 | | | | 4,200,000 | |
Talos Production LLC / Talos Production Finance, Inc.
11.00%, due 4/3/22 | | | 8,123,857 | | | | 8,580,824 | |
Transocean Pontus, Ltd.
6.125%, due 8/1/25 (a) | | | 1,890,000 | | | | 1,946,700 | |
Transocean Poseidon, Ltd.
6.875%, due 2/1/27 (a) | | | 1,500,000 | | | | 1,585,313 | |
Transocean Sentry, Ltd.
5.375%, due 5/15/23 (a) | | | 3,000,000 | | | | 3,003,750 | |
Ultra Resources, Inc.
6.875%, due 4/15/22 (a) | | | 9,675,000 | | | | 1,161,000 | |
Whiting Petroleum Corp.
6.625%, due 1/15/26 (i) | | | 4,000,000 | | | | 3,857,500 | |
WPX Energy, Inc.
6.00%, due 1/15/22 | | | 2,184,000 | | | | 2,276,820 | |
| | | | | | | | |
| | | | | | | 200,679,619 | |
| | | | | | | | |
Oil & Gas Services 0.5% | |
Forum Energy Technologies, Inc.
6.25%, due 10/1/21 | | | 13,290,000 | | | | 12,027,450 | |
Nine Energy Service, Inc.
8.75%, due 11/1/23 (a) | | | 1,787,000 | | | | 1,742,325 | |
| | | | | | | | |
| | | | | | | 13,769,775 | |
| | | | | | | | |
Pharmaceuticals 0.5% | |
Bausch Health Americas, Inc.
9.25%, due 4/1/26 (a) | | | 1,435,000 | | | | 1,605,478 | |
Endo Dac / Endo Finance LLC / Endo Finco, Inc. (a) | | | | | | | | |
6.00%, due 7/15/23 | | | 3,034,000 | | | | 2,184,480 | |
6.00%, due 2/1/25 | | | 6,060,000 | | | | 4,060,200 | |
Par Pharmaceutical, Inc.
7.50%, due 4/1/27 (a) | | | 5,210,000 | | | | 5,118,825 | |
Vizient, Inc.
6.25%, due 5/15/27 (a) | | | 2,325,000 | | | | 2,455,898 | |
| | | | | | | | |
| | | | | | | 15,424,881 | |
| | | | | | | | |
Pipelines 4.6% | |
Andeavor Logistics, L.P. / Tesoro Logistics Finance Corp. | | | | | | | | |
6.25%, due 10/15/22 | | | 524,000 | | | | 537,100 | |
6.375%, due 5/1/24 | | | 2,440,000 | | | | 2,555,900 | |
ANR Pipeline Co. | | | | | | | | |
7.375%, due 2/15/24 | | | 395,000 | | | | 455,015 | |
9.625%, due 11/1/21 | | | 5,950,000 | | | | 6,867,837 | |
| | | | |
| 16 | | MainStay VP MacKay High Yield Corporate Bond Portfolio | | The notes to the financial statements are an integral part of,
and should be read in conjunction with, the financial statements. |
| | | | | | | | |
| | | Principal
Amount | | | Value | |
| Corporate Bonds (continued) | |
Pipelines (continued) | |
Antero Midstream Partners, L.P. / Antero Midstream Finance Corp. | | | | | | | | |
5.375%, due 9/15/24 | | $ | 3,810,000 | | | $ | 3,786,188 | |
5.75%, due 1/15/28 (a) | | | 3,425,000 | | | | 3,390,750 | |
Cheniere Corpus Christi Holdings LLC
5.875%, due 3/31/25 | | | 4,000,000 | | | | 4,455,000 | |
Cheniere Energy Partners, L.P. | | | | | | | | |
5.25%, due 10/1/25 | | | 4,630,000 | | | | 4,786,263 | |
5.625%, due 10/1/26 (a) | | | 4,600,000 | | | | 4,853,000 | |
CNX Midstream Partners, L.P. / CNX Midstream Finance Corp.
6.50%, due 3/15/26 (a) | | | 6,022,000 | | | | 5,720,900 | |
Delek Logistics Partners, L.P. / Delek Logistics Finance Corp.
6.75%, due 5/15/25 | | | 2,575,000 | | | | 2,549,250 | |
Genesis Energy, L.P. / Genesis Energy Finance Corp.
6.75%, due 8/1/22 | | | 11,065,000 | | | | 11,161,819 | |
Holly Energy Partners, L.P. / Holly Energy Finance Corp.
6.00%, due 8/1/24 (a) | | | 6,340,000 | | | | 6,593,600 | |
MPLX, L.P. | | | | | | | | |
4.875%, due 12/1/24 | | | 5,790,000 | | | | 6,298,556 | |
4.875%, due 6/1/25 | | | 9,383,000 | | | | 10,197,649 | |
NGPL PipeCo LLC (a) | | | | | | | | |
4.375%, due 8/15/22 | | | 2,500,000 | | | | 2,575,000 | |
4.875%, due 8/15/27 | | | 5,280,000 | | | | 5,590,200 | |
Northwest Pipeline LLC
7.125%, due 12/1/25 | | | 2,195,000 | | | | 2,658,172 | |
NuStar Logistics, L.P.
6.75%, due 2/1/21 | | | 6,125,000 | | | | 6,400,625 | |
Plains All American Pipeline, L.P.
6.125%, due 11/15/22 (k)(l) | | | 7,265,000 | | | | 6,919,912 | |
Ruby Pipeline LLC
6.00%, due 4/1/22 (a) | | | 1,808,182 | | | | 1,845,701 | |
Sabine Pass Liquefaction LLC
5.875%, due 6/30/26 | | | 5,985,000 | | | | 6,839,270 | |
SemGroup Corp. | | | | | | | | |
6.375%, due 3/15/25 | | | 3,001,000 | | | | 2,910,970 | |
7.25%, due 3/15/26 | | | 885,000 | | | | 862,875 | |
SemGroup Corp. / Rose Rock Finance Corp.
5.625%, due 7/15/22 | | | 1,359,000 | | | | 1,339,648 | |
Tallgrass Energy Partners, L.P. / Tallgrass Energy Finance Corp.
5.50%, due 9/15/24 (a) | | | 9,560,000 | | | | 9,870,700 | |
Targa Resources Partners, L.P. / Targa Resources Partners Finance Corp.
5.875%, due 4/15/26 | | | 5,915,000 | | | | 6,269,900 | |
| | | | | | | | |
| | | Principal
Amount | | | Value | |
Pipelines (continued) | |
TransMontaigne Partners, L.P. / TLP Finance Corp.
6.125%, due 2/15/26 | | $ | 6,055,000 | | | $ | 5,827,937 | |
| | | | | | | | |
| | | | | | | 134,119,737 | |
| | | | | | | | |
Real Estate 1.4% | |
CBRE Services, Inc.
5.25%, due 3/15/25 | | | 2,295,000 | | | | 2,533,405 | |
Howard Hughes Corp.
5.375%, due 3/15/25 (a) | | | 9,580,000 | | | | 9,898,056 | |
Kennedy-Wilson, Inc.
5.875%, due 4/1/24 | | | 7,505,000 | | | | 7,655,100 | |
Newmark Group, Inc.
6.125%, due 11/15/23 | | | 8,105,000 | | | | 8,576,033 | |
Realogy Group LLC / Realogy
Co-Issuer Corp. (a) | | | | | | | | |
4.875%, due 6/1/23 (i) | | | 5,181,000 | | | | 4,662,900 | |
9.375%, due 4/1/27 | | | 7,599,000 | | | | 6,658,624 | |
| | | | | | | | |
| | | | | | | 39,984,118 | |
| | | | | | | | |
Real Estate Investment Trusts 4.4% | |
Crown Castle International Corp.
5.25%, due 1/15/23 | | | 24,840,000 | | | | 27,010,323 | |
CTR Partnership, L.P. / CareTrust Capital Corp.
5.25%, due 6/1/25 | | | 3,500,000 | | | | 3,631,250 | |
Equinix, Inc. | | | | | | | | |
5.375%, due 1/1/22 | | | 5,715,000 | | | | 5,865,019 | |
5.375%, due 4/1/23 | | | 10,555,000 | | | | 10,766,100 | |
5.375%, due 5/15/27 | | | 16,710,000 | | | | 17,912,618 | |
5.75%, due 1/1/25 | | | 8,740,000 | | | | 9,098,340 | |
5.875%, due 1/15/26 | | | 14,253,000 | | | | 15,090,364 | |
MGM Growth Properties Operating Partnership, L.P. / MGP FinanceCo-Issuer, Inc. | | | | | | | | |
4.50%, due 9/1/26 | | | 2,000,000 | | | | 2,052,500 | |
5.625%, due 5/1/24 | | | 19,120,000 | | | | 20,601,800 | |
5.75%, due 2/1/27 (a) | | | 6,655,000 | | | | 7,170,762 | |
MPT Operating Partnership, L.P. / MPT Finance Corp.
5.00%, due 10/15/27 | | | 6,070,000 | | | | 6,252,100 | |
Starwood Property Trust, Inc.
5.00%, due 12/15/21 | | | 2,962,000 | | | | 3,043,455 | |
| | | | | | | | |
| | | | | | | 128,494,631 | |
| | | | | | | | |
Retail 3.5% | |
Asbury Automotive Group, Inc.
6.00%, due 12/15/24 | | | 16,060,000 | | | | 16,622,100 | |
Beacon Roofing Supply, Inc.
4.875%, due 11/1/25 (a) | | | 9,070,000 | | | | 8,979,300 | |
Cumberland Farms, Inc.
6.75%, due 5/1/25 (a) | | | 6,962,000 | | | | 7,379,720 | |
| | | | | | |
The notes to the financial statements are an integral part of,
and should be read in conjunction with, the financial statements. | | | | | 17 | |
Portfolio of InvestmentsJune 30, 2019 (Unaudited) (continued)
| | | | | | | | |
| | | Principal
Amount | | | Value | |
| Corporate Bonds (continued) | | | | | | | | |
Retail (continued) | | | | | | | | |
DriveTime Automotive Group, Inc. / Bridgecrest Acceptance Corp.
8.00%, due 6/1/21 (a) | | $ | 10,520,000 | | | $ | 10,651,500 | |
Group 1 Automotive, Inc. | | | | | | | | |
5.00%, due 6/1/22 | | | 6,735,000 | | | | 6,819,188 | |
5.25%, due 12/15/23 (a) | | | 3,595,000 | | | | 3,680,381 | |
KFC Holding Co. / Pizza Hut Holdings LLC / Taco Bell of America LLC (a) | | | | | | | | |
4.75%, due 6/1/27 | | | 5,275,000 | | | | 5,406,875 | |
5.00%, due 6/1/24 | | | 10,600,000 | | | | 10,957,750 | |
5.25%, due 6/1/26 | | | 7,500,000 | | | | 7,865,550 | |
KGA Escrow, LLC
7.50%, due 8/15/23 (a) | | | 3,460,000 | | | | 3,589,750 | |
L Brands, Inc. | | | | | | | | |
5.625%, due 2/15/22 | | | 2,908,000 | | | | 3,039,180 | |
6.694%, due 1/15/27 | | | 4,399,000 | | | | 4,311,020 | |
Penske Automotive Group, Inc.
5.75%, due 10/1/22 | | | 6,670,000 | | | | 6,761,713 | |
Rite Aid Corp.
6.125%, due 4/1/23 (a) | | | 10,050,000 | | | | 8,479,687 | |
| | | | | | | | |
| | | | | | | 104,543,714 | |
| | | | | | | | |
Semiconductors 0.3% | |
Micron Technology, Inc.
5.50%, due 2/1/25 | | | 7,643,000 | | | | 7,862,736 | |
| | | | | | | | |
|
Software 4.0% | |
ACI Worldwide, Inc.
5.75%, due 8/15/26 (a) | | | 4,405,000 | | | | 4,593,534 | |
Ascend Learning LLC
6.875%, due 8/1/25 (a) | | | 8,215,000 | | | | 8,358,762 | |
CDK Global, Inc. | | | | | | | | |
5.25%, due 5/15/29 (a) | | | 3,920,000 | | | | 4,062,100 | |
5.875%, due 6/15/26 | | | 10,900,000 | | | | 11,526,750 | |
Donnelley Financial Solutions, Inc.
8.25%, due 10/15/24 | | | 5,365,000 | | | | 5,552,775 | |
Fair Isaac Corp.
5.25%, due 5/15/26 (a) | | | 3,590,000 | | | | 3,769,500 | |
First Data Corp.
5.00%, due 1/15/24 (a) | | | 2,045,000 | | | | 2,095,103 | |
IQVIA, Inc.
5.00%, due 10/15/26 (a) | | | 9,792,000 | | | | 10,110,240 | |
MSCI, Inc. (a) | | | | | | | | |
4.75%, due 8/1/26 | | | 3,570,000 | | | | 3,703,875 | |
5.25%, due 11/15/24 | | | 7,312,000 | | | | 7,549,640 | |
5.375%, due 5/15/27 | | | 5,730,000 | | | | 6,131,100 | |
5.75%, due 8/15/25 | | | 15,590,000 | | | | 16,369,500 | |
Open Text Corp.
5.875%, due 6/1/26 (a) | | | 5,085,000 | | | | 5,378,913 | |
PTC, Inc.
6.00%, due 5/15/24 | | | 14,350,000 | | | | 15,031,625 | |
| | | | | | | | |
| | | Principal
Amount | | | Value | |
Software (continued) | |
RP Crown Parent LLC
7.375%, due 10/15/24 (a) | | $ | 7,110,000 | | | $ | 7,412,175 | |
SS&C Technologies, Inc.
5.50%, due 9/30/27 (a) | | | 5,750,000 | | | | 5,965,625 | |
| | | | | | | | |
| | | | | | | 117,611,217 | |
| | | | | | | | |
Telecommunications 7.5% | |
Anixter, Inc.
5.125%, due 10/1/21 | | | 2,425,000 | | | | 2,512,906 | |
CenturyLink, Inc.
5.80%, due 3/15/22 | | | 9,925,000 | | | | 10,346,813 | |
Cogent Communications Group, Inc.
5.625%, due 4/15/21 (a) | | | 11,910,000 | | | | 12,073,762 | |
CommScope, Inc.
8.25%, due 3/1/27 (a) | | | 8,924,000 | | | | 9,101,141 | |
Frontier Communications Corp. | | | | | | | | |
10.50%, due 9/15/22 | | | 9,050,000 | | | | 6,131,375 | |
11.00%, due 9/15/25 | | | 10,700,000 | | | | 6,634,000 | |
Hughes Satellite Systems Corp. | | | | | | | | |
5.25%, due 8/1/26 | | | 7,035,000 | | | | 7,228,463 | |
6.625%, due 8/1/26 | | | 6,460,000 | | | | 6,791,075 | |
7.625%, due 6/15/21 | | | 10,195,000 | | | | 10,908,650 | |
Inmarsat Finance PLC
4.875%, due 5/15/22 (a) | | | 6,750,000 | | | | 6,792,188 | |
Level 3 Financing, Inc. | | | | | | | | |
5.375%, due 5/1/25 | | | 6,300,000 | | | | 6,504,750 | |
5.625%, due 2/1/23 | | | 4,000,000 | | | | 4,049,840 | |
Level 3 Parent LLC
5.75%, due 12/1/22 | | | 1,920,000 | | | | 1,936,800 | |
QualityTech, L.P. / QTS Finance Corp.
4.75%, due 11/15/25 (a) | | | 6,650,000 | | | | 6,583,500 | |
Sprint Capital Corp.
6.875%, due 11/15/28 | | | 29,930,000 | | | | 30,762,054 | |
Sprint Communications, Inc.
7.00%, due 3/1/20 (a) | | | 12,085,000 | | | | 12,387,125 | |
Sprint Corp.
7.875%, due 9/15/23 | | | 12,930,000 | | | | 14,045,212 | |
T-Mobile USA, Inc. | | | | | | | | |
4.50%, due 2/1/26 | | | 3,345,000 | | | | 3,424,444 | |
4.75%, due 2/1/28 | | | 9,585,000 | | | | 9,861,527 | |
5.125%, due 4/15/25 | | | 7,520,000 | | | | 7,826,666 | |
5.375%, due 4/15/27 | | | 9,500,000 | | | | 10,165,000 | |
6.00%, due 4/15/24 | | | 6,840,000 | | | | 7,130,700 | |
6.375%, due 3/1/25 | | | 9,700,000 | | | | 10,073,450 | |
6.50%, due 1/15/24 | | | 7,505,000 | | | | 7,767,675 | |
6.50%, due 1/15/26 | | | 10,150,000 | | | | 10,972,759 | |
| | | | | | | | |
| | | | | | | 222,011,875 | |
| | | | | | | | |
Textiles 0.4% | |
Eagle Intermediate Global Holding B.V. / Ruyi U.S. Finance LLC
7.50%, due 5/1/25 (a) | | | 12,445,000 | | | | 11,822,750 | |
| | | | | | | | |
| | | | |
| 18 | | MainStay VP MacKay High Yield Corporate Bond Portfolio | | The notes to the financial statements are an integral part of,
and should be read in conjunction with, the financial statements. |
| | | | | | | | |
| | | Principal
Amount | | | Value | |
| Corporate Bonds (continued) | |
Toys, Games & Hobbies 0.6% | |
Mattel, Inc.
6.75%, due 12/31/25 (a) | | $ | 16,965,000 | | | $ | 17,452,744 | |
| | | | | | | | |
|
Transportation 0.1% | |
Teekay Corp.
9.25%, due 11/15/22 (a) | | | 1,500,000 | | | | 1,518,750 | |
| | | | | | | | |
|
Trucking & Leasing 0.3% | |
Fortress Transportation & Infrastructure Investors LLC
6.75%, due 3/15/22 (a) | | | 8,000,000 | | | | 8,310,000 | |
| | | | | | | | |
Total Corporate Bonds
(Cost $2,684,660,010) | | | | | | | 2,726,237,030 | |
| | | | | | | | |
|
| Loan Assignments 1.6% | |
Auto Parts & Equipment 0.1% | |
Dealer Tire LLC (j)
2018 Term Loan B
7.83% (3 Month LIBOR + 5.50%), due 12/12/25 | | | 1,388,607 | | | | 1,385,135 | |
2018 Term Loan B
7.902% (1 Month LIBOR + 5.50%), due 12/12/25 | | | 1,469,231 | | | | 1,465,558 | |
| | | | | | | | |
| | | | | | | 2,850,693 | |
| | | | | | | | |
Banks 0.3% | |
Jane Street Group LLC
2018 Term Loan B
5.402% (1 Month LIBOR + 3.00%), due 8/25/22 (j) | | | 10,244,844 | | | | 10,172,280 | |
| | | | | | | | |
|
Media 0.1% | |
Charter Communications Operating LLC
2017 Term Loan B
4.33% (3 Month LIBOR + 2.00%), due 4/30/25 (j) | | | 2,462,500 | | | | 2,458,053 | |
| | | | | | | | |
|
Mining 0.1% | |
Aleris International, Inc.
2018 Term Loan
7.152% (1 Month LIBOR + 4.75%), due 2/27/23 (j) | | | 2,970,000 | | | | 2,970,000 | |
| | | | | | | | |
|
Oil & Gas 0.2% | |
PetroQuest Energy, Inc.
Term Loan Note
10.013%, due 3/2/20 (d) | | | 4,893,078 | | | | 4,893,078 | |
| | | | | | | | |
|
Retail Stores 0.7% | |
Bass Pro Group LLC Term Loan B
7.402% (1 Month LIBOR + 5.00%), due 9/25/24 (j) | | | 20,025,149 | | | | 19,092,738 | |
| | | | | | | | |
| | | | | | | | |
| | | Principal
Amount | | | Value | |
Software 0.0%‡ | |
RP Crown Parent LLC
2016 Term Loan B
5.152% (1 Month LIBOR + 2.75%), due 10/12/23 (j) | | $ | 396,947 | | | $ | 394,300 | |
| | | | | | | | |
|
Transportation 0.1% | |
Commercial Barge Line Co.
2015 1st Lien Term Loan
11.152% (1 Month LIBOR + 8.75%), due 11/12/20 (j) | | | 5,610,219 | | | | 3,843,000 | |
| | | | | | | | |
Total Loan Assignments
(Cost $47,891,851) | | | | | | | 46,674,142 | |
| | | | | | | | |
TotalLong-Term Bonds
(Cost $2,752,001,361) | | | | | | | 2,791,725,928 | |
| | | | | | | | |
| | |
| | | | | | | | |
| | |
Shares | | | | |
| Common Stocks 1.6% | |
Auto Parts & Equipment 0.1% | |
American Tire Distributors, Inc. (b)(d)(m) | | | 44,740 | | | | 1,364,570 | |
Exide Technologies (b)(c)(d)(g)(m) | | | 2,173,379 | | | | 2,738,458 | |
| | | | | | | | |
| | | | | | | 4,103,028 | |
| | | | | | | | |
Electric Utilities 0.1% | |
Keycon Power Holdings LLC (b)(m) | | | 11,280 | | | | 3,271,200 | |
| | | | | | | | |
|
Independent Power & Renewable Electricity Producers 0.8% | |
GenOn Energy, Inc. (d)(m) | | | 115,826 | | | | 21,022,419 | |
PetroQuest Energy, Inc. (b)(c)(d)(m) | | | 668,661 | | | | 936,125 | |
| | | | | | | | |
| | | | | | | 21,958,544 | |
| | | | | | | | |
Media 0.0%‡ | |
ION Media Networks, Inc. (b)(c)(d)(g) | | | 725 | | | | 489,100 | |
| | | | | | | | |
|
Metals & Mining 0.1% | |
Neenah Enterprises, Inc. (b)(c)(d)(m) | | | 230,859 | | | | 3,169,694 | |
| | | | | | | | |
|
Oil, Gas & Consumable Fuels 0.5% | |
Talos Energy, Inc. (m) | | | 637,880 | | | | 15,341,014 | |
Titan Energy LLC (m) | | | 25,911 | | | | 724 | |
| | | | | | | | |
| | | | | | | 15,341,738 | |
| | | | | | | | |
Software 0.0%‡ | |
ASG Corp. (b)(c)(d)(m) | | | 3,368 | | | | 0 | |
| | | | | | | | |
Total Common Stocks
(Cost $62,822,541) | | | | | | | 48,333,304 | |
| | | | | | | | |
|
| Short-Term Investments 3.7% | |
Unaffiliated Investment Companies 3.7% | |
State Street Institutional U.S. Government Money Market Fund, Premier Class, 2.31% (n) | | | 81,021,164 | | | | 81,021,164 | |
| | | | | | |
The notes to the financial statements are an integral part of,
and should be read in conjunction with, the financial statements. | | | | | 19 | |
Portfolio of InvestmentsJune 30, 2019 (Unaudited) (continued)
| | | | | | | | |
| | |
Shares | | | Value | |
| Short-Term Investments (continued) | |
Unaffiliated Investment Companies (continued) | |
State Street Navigator Securities Lending Government Money Market Portfolio, 2.33% (n)(o) | | | 24,871,673 | | | $ | 24,871,673 | |
| | | | | | | | |
TotalShort-Term Investments
(Cost $105,892,837) | | | | | | | 105,892,837 | |
| | | | | | | | |
Total Investments
(Cost $2,920,716,739) | | | 100.0 | % | | | 2,945,952,069 | |
Other Assets, Less Liabilities | | | 0.0 | ‡ | | | 1,072,543 | |
Net Assets | | | 100.0 | % | | $ | 2,947,024,612 | |
| † | Percentages indicated are based on Portfolio net assets. |
| ‡ | Less than one-tenth of a percent. |
| (a) | May be sold to institutional investors only under Rule 144A or securities offered pursuant to Section 4(a)(2) of the Securities Act of 1933, as amended. |
| (b) | Illiquid security—As of June 30, 2019, the total market value of these securities deemed illiquid under procedures approved by the Board of Trustees was $68,255,580, which represented 2.3% of the Portfolio’s net assets. |
| (c) | Security in which significant unobservable inputs (Level 3) were used in determining fair value. |
| (d) | Fair valued security—Represents fair value as measured in good faith under procedures approved by the Board of Trustees. As of June 30, |
| | 2019, the total market value of fair valued securities was $91,944,452, which represented 3.1% of the Portfolio’s net assets. |
| (e) | PIK ("Payment-in-Kind")—issuer may pay interest or dividends with additional securities and/or in cash. |
| (g) | Restricted security (See Note 5). |
| (h) | Issue in non-accrual status. |
| (i) | All or a portion of this security was held on loan. As of June 30, 2019, the aggregate market value of securities on loan was $24,321,241 and the Portfolio received cash collateral with a value of $24,871,673 (See Note 2(H)). |
| (j) | Floating rate—Rate shown was the rate in effect as of June 30, 2019. |
| (k) | Fixed to floating rate—Rate shown was the rate in effect as of June 30, 2019. |
| (l) | Securities are perpetual and, thus, do not have a predetermined maturity date. The date shown, if applicable, reflects the next call date. |
| (m) | Non-income producing security. |
| (n) | Current yield as of June 30, 2019. |
| (o) | Represents security purchased with cash collateral received for securities on loan. |
The following abbreviation is used in the preceding pages:
LIBOR—London Interbank Offered Rate
The following is a summary of the fair valuations according to the inputs used as of June 30, 2019, for valuing the Portfolio’s assets:
| | | | | | | | | | | | | | | | |
Description | | Quoted
Prices in Active
Markets for
Identical Assets (Level 1) | | | Significant Other
Observable Inputs (Level 2) | | | Significant
Unobservable Inputs (Level 3) | | | Total | |
| | | | |
Asset Valuation Inputs | | | | | | | | | | | | | | | | |
| Investments in Securities (a) | | | | | | | | | | | | | | | | |
| Long-Term Bonds | | | | | | | | | | | | | | | | |
Convertible Bonds (b) | | $ | — | | | $ | 10,216,749 | | | $ | 8,598,007 | | | $ | 18,814,756 | |
Corporate Bonds (c) | | | — | | | | 2,677,504,029 | | | | 48,733,001 | | | | 2,726,237,030 | |
Loan Assignments | | | — | | | | 46,674,142 | | | | — | | | | 46,674,142 | |
| | | | | | | | | | | | | | | | |
| TotalLong-Term Bonds | | | — | | | | 2,734,394,920 | | | | 57,331,008 | | | | 2,791,725,928 | |
| | | | | | | | | | | | | | | | |
| Common Stocks (d) | | | 18,612,938 | | | | 22,386,989 | | | | 7,333,377 | | | | 48,333,304 | |
| Short-Term Investments | | | | | | | | | | | | | | | | |
Unaffiliated Investment Companies | | | 105,892,837 | | | | — | | | | — | | | | 105,892,837 | |
| | | | | | | | | | | | | | | | |
| Total Investments in Securities | | $ | 124,505,775 | | | $ | 2,756,781,909 | | | $ | 64,664,385 | | | $ | 2,945,952,069 | |
| | | | | | | | | | | | | | | | |
| (a) | For a complete listing of investments and their industries, see the Portfolio of Investments. |
| (b) | The Level 3 securities valued at $8,439,277 and $158,730 are held in Auto Parts & Equipment and Internet, respectively, within the Convertible Bonds section of the Portfolio of Investments. |
| (c) | The Level 3 securities valued at $37,002,513, $7,367,500, and $4,362,988 are held in Auto Parts & Equipment, Media, and Oil & Gas, respectively, within the Corporate Bonds section of the Portfolio of Investments. |
| (d) | The Level 3 securities valued at $2,738,458, $936,125, $489,100, $3,169,694 and $0 are held in Auto Parts & Equipment, Independent Power & Renewable Electricity Producers, Media, Metals & Mining and Software, respectively, within the Common Stocks section of the Portfolio of Investments. |
| | | | |
| 20 | | MainStay VP MacKay High Yield Corporate Bond Portfolio | | The notes to the financial statements are an integral part of,
and should be read in conjunction with, the financial statements. |
The following is a reconciliation of investments in which significant unobservable inputs (Level 3) were used in determining value:
| | | | | | | | | | | | | | | | | | | | | | | | | | | | | | | | | | | | | | | | |
Investments in Securities | | Balance as of
December 31,
2018 | | | Accrued Discounts
(Premiums) | | | Realized
Gain (Loss) | | | Change in
Unrealized
Appreciation
(Depreciation) | | | Purchases | | | Sales | | | Transfers
in to Level 3 | | | Transfers
out of
Level 3 | | | Balance as of June 30,
2019 | | | Change in
Unrealized
Appreciation
(Depreciation) from
Investments Still Held at
June 30, 2019 (a) | |
| Long-Term Bonds | | | | | | | | | | | | | | | | | | | | | | | | | | | | | | | | | | | | | | | | |
Convertible Bonds | | | | | | | | | | | | | | | | | | | | | | | | | | | | | | | | | | | | | | | | |
Auto Parts & Equipment | | $ | 15,211,523 | | | $ | 173,904 | | | $ | (20,435,825 | ) | | $ | 14,190,659 | | | $ | 9,704,586 | (b) | | $ | (10,405,570 | ) | | $ | — | | | $ | — | | | $ | 8,439,277 | | | $ | 14,190,659 | |
Internet | | | — | | | | — | | | | — | | | | 158,730 | | | | — | | | | — | | | | — | | | | — | | | | 158,730 | | | | 158,730 | |
Corporate Bonds | | | | | | | | | | | | | | | | | | | | | | | | | | | | | | | | | | | | | | | | |
Auto Parts & Equipment | | | 28,559,359 | | | | 331,907 | | | | (3,532,148 | ) | | | 1,975,422 | | | | 37,463,917 | (b) | | | (27,795,944 | ) | | | — | | | | — | | | | 37,002,513 | | | | 1,975,422 | |
Electric | | | 21,385,875 | | | | — | | | | 338 | | | | (2,955,073 | ) | | | — | | | | (18,431,140 | ) | | | — | | | | — | | | | — | | | | — | |
Media | | | 7,367,500 | | | | 5,767 | | | | — | | | | (5,767 | ) | | | — | | | | — | | | | — | | | | — | | | | 7,367,500 | | | | (5,767 | ) |
Oil & Gas | | | — | | | | (648,206 | ) | | | — | | | | (7,633,271 | ) | | | 12,644,465 | (b) | | | — | | | | — | | | | — | | | | 4,362,988 | | | | (7,633,271 | ) |
Loan Assignments | | | | | | | | | | | | | | | | | | | | | | | | | | | | | | | | | | | | | | | | |
Banks | | | 7,095,644 | | | | — | | | | — | | | | — | | | | — | | | | — | | | | — | | | | (7,095,644 | ) | | | — | | | | — | |
| Common Stocks | | | | | | | | | | | | | | | | | | | | | | | | | | | | | | | | | | | | | | | | |
Auto Parts & Equipment | | | 2,194,197 | | | | — | | | | — | | | | (716,923 | ) | | | 2,002,973 | | | | — | | | | — | | | | (741,789 | ) | | | 2,738,458 | | | | (716,923 | ) |
Independent Power & Renewable Electricity
Producers | | | — | | | | — | | | | | | | | (2,526,581 | ) | | | 3,462,706 | | | | — | | | | — | | | | — | | | | 936,125 | | | | (2,526,581 | ) |
Media | | | 448,985 | | | | — | | | | — | | | | 40,115 | | | | — | | | | — | | | | — | | | | — | | | | 489,100 | | | | 40,115 | |
Metals & Mining | | | 3,169,694 | | | | — | | | | — | | | | — | | | | — | | | | — | | | | — | | | | — | | | | 3,169,694 | | | | — | |
Software | | | — | | | | — | | | | — | | | | — | | | | — | | | | — | | | | — | | | | — | | | | — | | | | — | |
| | | | | | | | | | | | | | | | | | | | | | | | | | | | | | | | | | | | | | | | |
| Total | | $ | 85,432,777 | | | $ | (136,628 | ) | | $ | (23,967,635 | ) | | $ | 2,527,311 | | | $ | 65,278,647 | | | $ | (56,632,654 | ) | | $ | — | | | $ | (7,837,433 | ) | | $ | 64,664,385 | | | $ | 5,482,384 | |
| | | | | | | | | | | | | | | | | | | | | | | | | | | | | | | | | | | | | | | | |
| (a) | Included in "Net change in unrealized appreciation (depreciation) on investments" in the Statement of Operations. |
| (b) | Purchases include PIK securities. |
As of June 30, 2019, securities with a market value of $7,837,433 transferred from Level 3 to Level 2. The transfer occurred as a result of utilizing significant observable inputs. As of December 31, 2018, the fair value obtained for these securities, utilized significant unobservable inputs.
| | | | | | |
The notes to the financial statements are an integral part of,
and should be read in conjunction with, the financial statements. | | | | | 21 | |
Statement of Assets and Liabilitiesas of June 30, 2019 (Unaudited)
| | | | |
| Assets | |
Investment in unaffiliated securities, at value
(identified cost $2,920,716,739) including securities
on loan of $24,321,241 | | $ | 2,945,952,069 | |
Due from custodian | | | 143,150 | |
Cash | | | 21,145 | |
Receivables: | | | | |
Interest | | | 43,698,116 | |
Investment securities sold | | | 41,147,460 | |
Portfolio shares sold | | | 1,110,154 | |
Securities lending | | | 20,526 | |
Other assets | | | 13,908 | |
| | | | |
Total assets | | | 3,032,106,528 | |
| | | | |
|
| Liabilities | |
Cash collateral received for securities on loan | | | 24,871,673 | |
Payables: | | | | |
Investment securities purchased | | | 56,962,456 | |
Manager (See Note 3) | | | 1,339,736 | |
Portfolio shares redeemed | | | 1,146,064 | |
NYLIFE Distributors (See Note 3) | | | 502,384 | |
Shareholder communication | | | 131,269 | |
Professional fees | | | 83,576 | |
Custodian | | | 17,013 | |
Trustees | | | 3,896 | |
Accrued expenses | | | 23,849 | |
| | | | |
Total liabilities | | | 85,081,916 | |
| | | | |
Net assets | | $ | 2,947,024,612 | |
| | | | |
|
| Composition of Net Assets | |
Shares of beneficial interest outstanding (par value of $.001 per share) unlimited number of shares authorized | | $ | 294,461 | |
Additional paid-in capital | | | 2,763,309,107 | |
| | | | |
| | | 2,763,603,568 | |
Total distributable earnings (loss) | | | 183,421,044 | |
| | | | |
Net assets | | $ | 2,947,024,612 | |
| | | | |
| | | | |
Initial Class | | | | |
Net assets applicable to outstanding shares | | $ | 484,173,581 | |
| | | | |
Shares of beneficial interest outstanding | | | 47,751,421 | |
| | | | |
Net asset value per share outstanding | | $ | 10.14 | |
| | | | |
Service Class | | | | |
Net assets applicable to outstanding shares | | $ | 2,462,851,031 | |
| | | | |
Shares of beneficial interest outstanding | | | 246,710,035 | |
| | | | |
Net asset value per share outstanding | | $ | 9.98 | |
| | | | |
| | | | |
| 22 | | MainStay VP MacKay High Yield Corporate Bond Portfolio | | The notes to the financial statements are an integral part of,
and should be read in conjunction with, the financial statements. |
Statement of Operationsfor the six months ended June 30, 2019 (Unaudited)
| | | | |
| Investment Income (Loss) | |
Income | | | | |
Interest (a) | | $ | 89,452,701 | |
Dividends | | | 64,500 | |
Securities lending | | | 54,210 | |
| | | | |
Total income | | | 89,571,411 | |
| | | | |
Expenses | | | | |
Manager (See Note 3) | | | 7,967,794 | |
Distribution/Service—Service Class (See Note 3) | | | 2,983,062 | |
Shareholder communication | | | 147,132 | |
Professional fees | | | 133,465 | |
Trustees | | | 35,454 | |
Custodian | | | 20,347 | |
Miscellaneous | | | 55,395 | |
| | | | |
Total expenses | | | 11,342,649 | |
| | | | |
Net investment income (loss) | | | 78,228,762 | |
| | | | |
|
| Realized and Unrealized Gain (Loss) on Investments | |
Net realized gain (loss) on investments | | | (21,920,639 | ) |
Net change in unrealized appreciation (depreciation) on investments | | | 181,519,439 | |
| | | | |
Net realized and unrealized gain (loss) on investments | | | 159,598,800 | |
| | | | |
Net increase (decrease) in net assets resulting from operations | | $ | 237,827,562 | |
| | | | |
| (a) | Interest recorded net of foreign withholding taxes in the amount of $13,245. |
| | | | | | |
The notes to the financial statements are an integral part of,
and should be read in conjunction with, the financial statements. | | | | | 23 | |
Statements of Changes in Net Assets
for the six months ended June 30, 2019 (Unaudited) and the year ended December 31, 2018
| | | | | | | | |
| | | 2019 | | | 2018 | |
| Increase (Decrease) in Net Assets | |
Operations: | | | | | | | | |
Net investment income (loss) | | $ | 78,228,762 | | | $ | 159,287,040 | |
Net realized gain (loss) on investments | | | (21,920,639 | ) | | | 16,336,818 | |
Net change in unrealized appreciation (depreciation) on investments | | | 181,519,439 | | | | (221,852,321 | ) |
| | | | |
Net increase (decrease) in net assets resulting from operations | | | 237,827,562 | | | | (46,228,463 | ) |
| | | | |
Distributions to shareholders: | | | | | | | | |
Initial Class | | | — | | | | (28,718,735 | ) |
Service Class | | | — | | | | (140,488,793 | ) |
| | | | |
Total distributions to shareholders | | | — | | | | (169,207,528 | ) |
| | | | |
Capital share transactions: | | | | | | | | |
Net proceeds from sale of shares | | | 129,430,566 | | | | 202,195,336 | |
Net asset value of shares issued to shareholders in reinvestment of dividends and distributions | | | — | | | | 169,207,528 | |
Cost of shares redeemed | | | (176,505,881 | ) | | | (502,639,813 | ) |
| | | | |
Increase (decrease) in net assets derived from capital share transactions | | | (47,075,315 | ) | | | (131,236,949 | ) |
| | | | |
Net increase (decrease) in net assets | | | 190,752,247 | | | | (346,672,940 | ) |
|
| Net Assets | |
Beginning of period | | | 2,756,272,365 | | | | 3,102,945,305 | |
| | | | |
End of period | | $ | 2,947,024,612 | | | $ | 2,756,272,365 | |
| | | | |
| | | | |
| 24 | | MainStay VP MacKay High Yield Corporate Bond Portfolio | | The notes to the financial statements are an integral part of,
and should be read in conjunction with, the financial statements. |
Financial Highlightsselected per share data and ratios
| | | | | | | | | | | | | | | | | | | | | | | | | | | | |
| | | |
| | | Six months
ended
June 30, | | | | | | Year ended December 31, | |
| | | | | | | |
| Initial Class | | 2019* | | | | | | 2018 | | | 2017 | | | 2016 | | | 2015 | | | 2014 | |
| | | | | | | |
Net asset value at beginning of period | | $ | 9.32 | | | | | | | $ | 10.05 | | | $ | 9.99 | | | $ | 9.10 | | | $ | 9.84 | | | $ | 10.26 | |
| | | | | | | | | | | | | | | | | | | | | | | | | | | | |
| | | | | | | |
Net investment income (loss) (a) | | | 0.28 | | | | | | | | 0.55 | | | | 0.58 | | | | 0.62 | | | | 0.59 | | | | 0.61 | |
| | | | | | | |
Net realized and unrealized gain (loss) on investments | | | 0.54 | | | | | | | | (0.68 | ) | | | 0.10 | | | | 0.85 | | | | (0.73 | ) | | | (0.42 | ) |
| | | | | | | | | | | | | | | | | | | | | | | | | | | | |
| | | | | | | |
Total from investment operations | | | 0.82 | | | | | | | | (0.13 | ) | | | 0.68 | | | | 1.47 | | | | (0.14 | ) | | | 0.19 | |
| | | | | | | | | | | | | | | | | | | | | | | | | | | | |
| | | | | | | |
| Less dividends: | | | | | | | | | | | | | | | | | | | | | | | | | | | | |
| | | | | | | |
From net investment income | | | — | | | | | | | | (0.60 | ) | | | (0.62 | ) | | | (0.58 | ) | | | (0.60 | ) | | | (0.61 | ) |
| | | | | | | | | | | | | | | | | | | | | | | | | | | | |
| | | | | | | |
Net asset value at end of period | | $ | 10.14 | | | | | | | $ | 9.32 | | | $ | 10.05 | | | $ | 9.99 | | | $ | 9.10 | | | $ | 9.84 | |
| | | | | | | | | | | | | | | | | | | | | | | | | | | | |
| | | | | | | |
Total investment return (b) | | | 8.80 | %(c) | | | | | | | (1.46 | %) | | | 6.86 | % | | | 16.23 | % | | | (1.57 | %) | | | 1.78 | % |
| | | | | | | |
| Ratios (to average net assets)/Supplemental Data: | | | | | | | | | | | | | | | | | | | | | | | | | | | | |
| | | | | | | |
Net investment income (loss) | | | 5.68 | %†† | | | | | | | 5.58 | % | | | 5.69 | % | | | 6.41 | % | | | 5.99 | % | | | 5.85 | % |
| | | | | | | |
Net expenses (d) | | | 0.58 | %†† | | | | | | | 0.58 | % | | | 0.58 | % | | | 0.59 | % | | | 0.58 | % | | | 0.59 | % |
| | | | | | | |
Portfolio turnover rate | | | 15 | % | | | | | | | 28 | % | | | 40 | % | | | 39 | % | | | 37 | % | | | 42 | % |
| | | | | | | |
Net assets at end of period (in 000’s) | | $ | 484,174 | | | | | | | $ | 458,129 | | | $ | 574,162 | | | $ | 665,881 | | | $ | 642,186 | | | $ | 641,024 | |
| (a) | Per share data based on average shares outstanding during the period. |
| (b) | Total return does not reflect any deduction of sales charges, mortality and expense charges, contract charges or administrative charges. For periods of less than one year, total return is not annualized. |
| (c) | Total investment return may reflect adjustments to conform to generally accepted accounting principles. |
| (d) | In addition to the fees and expenses which the Portfolio bears directly, it also indirectly bears a pro-rata share of the fees and expenses of the underlying funds in which it invests. Such indirect expenses are not included in the above expense ratios. |
| | | | | | | | | | | | | | | | | | | | | | | | | | | | |
| | | |
| | | Six months
ended June 30,
| | | | | | Year ended December 31, | |
| | | | | | | |
| Service Class | | 2019* | | | | | | 2018 | | | 2017 | | | 2016 | | | 2015 | | | 2014 | |
| | | | | | | |
Net asset value at beginning of period | | $ | 9.19 | | | | | | | $ | 9.91 | | | $ | 9.86 | | | $ | 8.99 | | | $ | 9.73 | | | $ | 10.16 | |
| | | | | | | | | | | | | | | | | | | | | | | | | | | | |
| | | | | | | |
Net investment income (loss) (a) | | | 0.26 | | | | | | | | 0.52 | | | | 0.55 | | | | 0.59 | | | | 0.56 | | | | 0.58 | |
| | | | | | | |
Net realized and unrealized gain (loss) on investments | | | 0.53 | | | | | | | | (0.66 | ) | | | 0.10 | | | | 0.83 | | | | (0.72 | ) | | | (0.42 | ) |
| | | | | | | | | | | | | | | | | | | | | | | | | | | | |
| | | | | | | |
Total from investment operations | | | 0.79 | | | | | | | | (0.14 | ) | | | 0.65 | | | | 1.42 | | | | (0.16 | ) | | | 0.16 | |
| | | | | | | | | | | | | | | | | | | | | | | | | | | | |
| | | | | | | |
| Less dividends: | | | | | | | | | | | | | | | | | | | | | | | | | | | | |
| | | | | | | |
From net investment income | | | — | | | | | | | | (0.58 | ) | | | (0.60 | ) | | | (0.55 | ) | | | (0.58 | ) | | | (0.59 | ) |
| | | | | | | | | | | | | | | | | | | | | | | | | | | | |
| | | | | | | |
Net asset value at end of period | | $ | 9.98 | | | | | | | $ | 9.19 | | | $ | 9.91 | | | $ | 9.86 | | | $ | 8.99 | | | $ | 9.73 | |
| | | | | | | | | | | | | | | | | | | | | | | | | | | | |
| | | | | | | |
Total investment return (b) | | | 8.60 | %(c) | | | | | | | (1.71 | %) | | | 6.59 | % | | | 15.94 | % | | | (1.82 | %) | | | 1.53 | % |
| | | | | | | |
| Ratios (to average net assets)/Supplemental Data: | | | | | | | | | | | | | | | | | | | | | | | | | | | | |
| | | | | | | |
Net investment income (loss) | | | 5.43 | %†† | | | | | | | 5.33 | % | | | 5.43 | % | | | 6.15 | % | | | 5.74 | % | | | 5.60 | % |
| | | | | | | |
Net expenses (d) | | | 0.83 | %†† | | | | | | | 0.83 | % | | | 0.83 | % | | | 0.84 | % | | | 0.83 | % | | | 0.84 | % |
| | | | | | | |
Portfolio turnover rate | | | 15 | % | | | | | | | 28 | % | | | 40 | % | | | 39 | % | | | 37 | % | | | 42 | % |
| | | | | | | |
Net assets at end of period (in 000’s) | | $ | 2,462,851 | | | | | | | $ | 2,298,144 | | | $ | 2,528,783 | | | $ | 2,315,441 | | | $ | 2,035,855 | | | $ | 2,147,611 | |
| (a) | Per share data based on average shares outstanding during the period. |
| (b) | Total return does not reflect any deduction of sales charges, mortality and expense charges, contract charges or administrative charges. For periods of less than one year, total return is not annualized. |
| (c) | Total investment return may reflect adjustments to conform to generally accepted accounting principles. |
| (d) | In addition to the fees and expenses which the Portfolio bears directly, it also indirectly bears a pro-rata share of the fees and expenses of the underlying funds in which it invests. Such indirect expenses are not included in the above expense ratios. |
| | | | | | |
The notes to the financial statements are an integral part of,
and should be read in conjunction with, the financial statements. | | | | | 25 | |
Notes to Financial Statements(Unaudited)
Note 1–Organization and Business
MainStay VP Funds Trust (the “Fund”) was organized as a Delaware statutory trust on February 1, 2011. The Fund is registered under the Investment Company Act of 1940, as amended (the “1940 Act”), as an open-end management investment company. The Fund is comprised of thirty-one separate series (collectively referred to as the “Portfolios”). These financial statements and notes relate to the MainStay VP MacKay High Yield Corporate Bond Portfolio (the “Portfolio”), a “diversified” portfolio, as that term is defined in the 1940 Act, as interpreted or modified by regulatory authorities having jurisdiction, from time to time.
Shares of the Portfolio are currently offered to certain separate accounts to fund variable annuity policies and variable universal life insurance policies issued by New York Life Insurance and Annuity Corporation (“NYLIAC”), awholly-owned subsidiary of New York Life Insurance Company (“New York Life”) and may also be offered to fund variable annuity policies and variable universal life insurance policies issued by other insurance companies. NYLIAC allocates shares of the Portfolios to, among others, certain NYLIAC separate accounts. Shares of the Portfolio are also offered to the MainStay VP Conservative Allocation Portfolio, MainStay VP Moderate Allocation Portfolio, MainStay VP Moderate Growth Allocation Portfolio and MainStay VP Growth Allocation Portfolio, which operate as “funds-of-funds.”
The Portfolio currently offers two classes of shares. Initial Class shares commenced operations on May 1, 1995. Service Class shares commenced operations on June 4, 2003. Shares of the Portfolio are offered and are redeemed at a price equal to their respective net asset value (“NAV”) per share. No sales or redemption charge is applicable to the purchase or redemption of the Portfolio’s shares. Under the terms of the Fund’s multiple class plan, adopted pursuant to Rule 18f-3 under the 1940 Act, the classes differ in that, among other things, Service Class shares of the Portfolio pay a combined distribution and service fee of 0.25% of average daily net assets attributable to Service Class shares of the Portfolio to the Distributor (as defined in Note 3(B)) pursuant to a plan adopted in accordance with Rule 12b-1 under the 1940 Act. Contract owners of variable annuity contracts purchased after June 2, 2003, are permitted to invest only in the Service Class shares.
The Portfolio’s investment objective is to seek maximum current income through investment in a diversified portfolio of high-yield debt securities. Capital appreciation is a secondary objective.
Note 2–Significant Accounting Policies
The Portfolio is an investment company and accordingly follows the investment company accounting and reporting guidance of the Financial Accounting Standards Board (“FASB”) Accounting Standard CodificationTopic 946 Financial Services—Investment Companies. The Portfolio prepares its financial statements in accordance with generally accepted accounting principles (“GAAP”) in the United States of America and follows the significant accounting policies described below.
(A) Securities Valuation. Investments are usually valued as of the close of regular trading on the New York Stock Exchange (the “Exchange”) (usually 4:00 p.m. Eastern time) on each day the Portfolio is open for business (“valuation date”).
The Board of Trustees of the Fund (the “Board”) adopted procedures establishing methodologies for the valuation of the Portfolio’s securities
and other assets and delegated the responsibility for valuation determinations under those procedures to the Valuation Committee of the Fund (the “Valuation Committee”). The Board authorized the Valuation Committee to appoint a Valuation Subcommittee (the “Subcommittee”) to deal in the first instance with establishing the prices of securities for which market quotations are not readily available or the prices of which are not otherwise readily determinable under these procedures. The Subcommittee meets (in person, via electronic mail or via teleconference) on an as-needed basis. Subsequently, the Valuation Committee meets to ensure that actions taken by the Subcommittee were appropriate. The procedures state that, subject to the oversight of the Board and unless otherwise noted, the responsibility for theday-to-day valuation of portfolio assets (including fair value measurements for the Portfolio’s assets and liabilities) rests with New York Life Investment Management LLC (“New York Life Investments” or the “Manager”), aided to whatever extent necessary by the Subadvisor (as defined in Note 3(A)).
To assess the appropriateness of security valuations, the Manager, the Subadvisor or the Portfolio’s third-party service provider, who is subject to oversight by the Manager, regularly compares prior day prices, prices on comparable securities and the sale prices to the prior and current day prices and challenges prices with changes exceeding certain tolerance levels with third-party pricing services or broker sources. For those securities valued through either a standardized fair valuation methodology or a fair valuation measurement, the Subcommittee deals in the first instance with such valuation and the Valuation Committee reviews and affirms, if appropriate, the reasonableness of the valuation based on such methodologies and measurements on a regular basis after considering information that is reasonably available and deemed relevant by the Valuation Committee. Any action taken by the Subcommittee with respect to the valuation of a portfolio security or other asset is submitted for review and ratification (if appropriate) to the Valuation Committee and the Board at the next regularly scheduled meeting.
“Fair value” is defined as the price the Portfolio would reasonably expect to receive upon selling an asset or liability in an orderly transaction to an independent buyer in the principal or most advantageous market for the asset or liability. Fair value measurements are determined within a framework that establishes a three-tier hierarchy which maximizes the use of observable market data and minimizes the use of unobservable inputs to establish a classification of fair value measurements for disclosure purposes. “Inputs” refer broadly to the assumptions that market participants would use in pricing the asset or liability, including assumptions about risk, such as the risk inherent in a particular valuation technique used to measure fair value using a pricing model and/or the risk inherent in the inputs for the valuation technique. Inputs may be observable or unobservable. Observable inputs reflect the assumptions market participants would use in pricing the asset or liability based on market data obtained from sources independent of the Portfolio. Unobservable inputs reflect the Portfolio’s own assumptions about the assumptions market participants would use in pricing the asset or liability based on the information available. The inputs or methodology used for valuing assets or liabilities may not be an indication of the risks associated with investing in those assets or liabilities. The three-tier hierarchy of inputs is summarized below.
| • | | Level 1—quoted prices in active markets for an identical asset or liability |
| | |
| 26 | | MainStay VP MacKay High Yield Corporate Bond Portfolio |
| • | | Level 2—other significant observable inputs (including quoted prices for a similar asset or liability in active markets, interest rates and yield curves, prepayment speeds, credit risk, etc.) |
| • | | Level 3—significant unobservable inputs (including the Portfolio’s own assumptions about the assumptions that market participants would use in measuring fair value of an asset or liability) |
The level of an asset or liability within the fair value hierarchy is based on the lowest level of an input, both individually and in the aggregate, that is significant to the fair value measurement. As of June 30, 2019, the aggregate value by input level of the Portfolio’s assets and liabilities is included at the end of the Portfolio’s Portfolio of Investments.
The Portfolio may use third-party vendor evaluations, whose prices may be derived from one or more of the following standard inputs, among others:
| | |
• Benchmark yields | | • Reported trades |
• Broker/dealer quotes | | • Issuer spreads |
• Two-sided markets | | • Benchmark securities |
• Bids/offers | | • Reference data (corporate actions or material event notices) |
• Industry and economic events | | • Comparable bonds |
• Monthly payment information | | |
An asset or liability for which market values cannot be measured using the methodologies described above is valued by methods deemed reasonable in good faith by the Valuation Committee, following the procedures established by the Board, to represent fair value. Under these procedures, the Portfolio generally uses a market-based approach which may use related or comparable assets or liabilities, recent transactions, market multiples, book values and other relevant information. The Portfolio may also use an income-based valuation approach in which the anticipated future cash flows of the asset or liability are discounted to calculate fair value. Discounts may also be applied due to the nature and/or duration of any restrictions on the disposition of the asset or liability. Fair value represents a good faith approximation of the value of a security. Fair value determinations involve the consideration of a number of subjective factors, an analysis of applicable facts and circumstances and the exercise of judgment. As a result, it is possible that the fair value for a security determined in good faith in accordance with the Portfolio’s valuation procedures may differ from valuations for the same security determined by other funds using their own valuation procedures. Although the Portfolio’s valuation procedures are designed to value a security at the price the Portfolio may reasonably expect to receive upon the security’s sale in an orderly transaction, there can be no assurance that any fair value determination thereunder would, in fact, approximate the amount that the Portfolio would actually realize upon the sale of the security or the price at which the security would trade if a reliable market price were readily available. During the six-month period ended June 30, 2019, there were no material changes to the fair value methodologies.
Securities which may be valued in this manner include, but are not limited to: (i) a security for which trading has been halted or suspended; (ii) a debt security that has recently gone into default and for which there is not a current market quotation; (iii) a security of an issuer that has entered into a restructuring; (iv) a security that has been delisted
from a national exchange; (v) a security for which the market price is not readily available from a third-party pricing source or, if so provided, does not, in the opinion of the Manager or the Subadvisor, reflect the security’s market value; (vi) a security subject to trading collars for which no or limited trading takes place; and (vii) a security whose principal market has been temporarily closed at a time when, under normal conditions, it would be open. Securities valued in this manner are generally categorized as Level 3 in the hierarchy. As of June 30, 2019, securities that were fair valued in such a manner are shown in the Portfolio of Investments.
Equity securities are valued at the last quoted sales prices as of the close of regular trading on the relevant exchange on each valuation date. Securities that are not traded on the valuation date are valued at the mean of the last quoted bid and ask prices. Prices are normally taken from the principal market in which each security trades. These securities are generally categorized as Level 1 in the hierarchy.
Investments in mutual funds, including money market funds, are valued at their respective NAVs as of the close of the Exchange on the valuation date. These securities are generally categorized as Level 1 in the hierarchy.
Debt securities (other than convertible and municipal bonds) are valued at the evaluated bid prices (evaluated mean prices in the case of convertible and municipal bonds) supplied by a pricing agent or brokers selected by the Manager, in consultation with the Subadvisor. The evaluations are market-based measurements processed through a pricing application and represents the pricing agent’s good faith determination as to what a holder may receive in an orderly transaction under market conditions. The rules based logic utilizes valuation techniques that reflect participants’ assumptions and vary by asset class and per methodology, maximizing the use of relevant observable data including quoted prices for similar assets, benchmark yield curves and market corroborated inputs. The evaluated bid or mean prices are deemed by the Manager, in consultation with the Subadvisor, to be representative of market values at the regular close of trading of the Exchange on each valuation date. Debt securities purchased on a delayed delivery basis are marked to market daily until settlement at the forward settlement date. Debt securities, including corporate bonds, U.S. government and federal agency bonds, municipal bonds, foreign bonds, convertible bonds, asset-backed securities and mortgage-backed securities are generally categorized as Level 2 in the hierarchy.
Loan assignments, participations and commitments are valued at the average of bid quotations obtained from the engaged independent pricing service and are generally categorized as Level 2 in the hierarchy. Certain loan assignments, participations and commitments may be valued by utilizing significant unobservable inputs obtained from the pricing service and are generally categorized as Level 3 in the hierarchy. As of June 30, 2019, there were no securities held by the Portfolio that were fair valued in such a manner.
Temporary cash investments acquired in excess of 60 days to maturity at the time of purchase are valued using the latest bid prices or using valuations based on a matrix system (which considers such factors as security prices, yields, maturities and ratings), both as furnished by independent pricing services. Other temporary cash investments which mature in 60 days or less at the time of purchase (“Short-Term
Notes to Financial Statements(Unaudited) (continued)
Investments”) are valued using the amortized cost method of valuation, unless the use of such method would be inappropriate. The amortized cost method involves valuing a security at its cost on the date of purchase and thereafter assuming a constant amortization to maturity of the difference between such cost and the value on maturity date. Amortized cost approximates the current fair value of a security. Securities valued using the amortized cost method are not valued using quoted prices in an active market and are generally categorized as Level 2 in the hierarchy.
The information above is not intended to reflect an exhaustive list of the methodologies that may be used to value portfolio investments. The
valuation procedures permit the use of a variety of valuation methodologies in connection with valuing portfolio investments. The methodology used for a specific type of investment may vary based on the market data available or other considerations. The methodologies summarized above may not represent the specific means by which portfolio investments are valued on any particular business day.
The valuation techniques and significant amounts of unobservable inputs used in the fair valuation measurement of the Portfolio’s Level 3 securities are outlined in the table below. A significant increase or decrease in any of those inputs in isolation would result in a significantly higher or lower fair value measurement at period end.
| | | | | | | | | | | | |
Asset Class | | Fair Value
at 6/30/19* | | | Valuation
Technique | | Unobservable
Inputs | | Inputs/Range | |
| | | | |
Convertible Bonds | | $ | 8,439,277 | | | Income Approach | | Spread Adjustment | | | 12.00 | % |
| | | | |
| | | 158,730 | | | Market Approach | | Discount Rate | | | 2.00 | % |
| | | | |
Corporate Bonds | | | 37,002,513 | | | Income Approach | | Spread Adjustment | | | 1.43%–5.78% | |
| | | | |
| | | 4,362,988 | | | Market Approach | | Asset Coverage at $50 Crude, $2.80 Natural Gas | | | $0.99 | |
| | | | |
| | | | | | | | PIK Discount Spread | | | 3.00 | % |
| | | | |
Common Stocks | | | 2,738,458 | | | Market Approach | | Estimated Enterprise Value | | | $1,002.6m–$1,130.3m | |
| | | | |
| | | | | | | | Estimated Volatility | | | 20.00 | % |
| | | | |
| | | 936,125 | | | Market Approach | | Asset Coverage at $50 Crude, $2.80 Natural Gas, Implied Equity Value | | | $19.00M | |
| | | | |
| | | | | | | | PIK Discount Spread | | | 3.00 | % |
| | | | |
| | | 489,100 | | | Income Approach | | Free Cash Flow Yield | | | 15.00 | % |
| | | | |
| | | 3,169,694 | | | Market Approach | | EBITDA Multiple | | | 5.75x | |
| | | | |
| | | | | | | | Discount Rate | | | 10.00 | % |
| | | | | | | | | | | | |
| | $ | 57,296,885 | | | | | | | | | |
| | | | | | | | | | | | |
| * | The table above does not include a Level 3 investment that was valued by a broker without adjustment. As of June 30, 2019, the value of this investment was $7,367,500. The input for this investment was not readily available or cannot be reasonably estimated. |
A portfolio security or other asset may be determined to be illiquid under procedures approved by the Board. Illiquidity of a security might prevent the sale of such security at a time when the Manager or the Subadvisor might wish to sell, and these securities could have the effect of decreasing the overall level of the Portfolio’s liquidity. Further, the lack of an established secondary market may make it more difficult to value illiquid securities, requiring the Portfolio to rely on judgments that may be somewhat subjective in measuring value, which could vary materially from the amount that the Portfolio could realize upon disposition. Difficulty in selling illiquid securities may result in a loss or may be costly to the Portfolio. Under the supervision of the Board, the Manager or the Subadvisor determine the liquidity of the Portfolio’s investments; in doing so, the Manager or the Subadvisor may consider various factors, including (i) the frequency of trades and quotations; (ii) the number of dealers and prospective purchasers; (iii) dealer undertakings to make a market; and (iv) the nature of the security and the market in which it trades (e.g., the time needed to dispose of the security, the method of soliciting offers and the mechanics of transfer). Illiquid securities are often valued in accordance with methods deemed by the Board in good faith to be reasonable and appropriate to accurately reflect their fair value. The liquidity of the Portfolio’s investments, as shown in the Portfolio of Investments, was determined as of June 30, 2019 and can change at any time in response to, among other relevant factors, market conditions or events or developments with respect to an individual issuer or instrument. As of June 30, 2019, securities deemed to be
illiquid under procedures approved by the Board are shown in the Portfolio of Investments.
(B) Income Taxes. The Portfolio’s policy is to comply with the requirements of the Internal Revenue Code of 1986, as amended (the “Internal Revenue Code”), applicable to regulated investment companies and to distribute all of its taxable income to the shareholders of the Portfolio within the allowable time limits. Therefore, no federal, state and local income tax provisions are required.
Management evaluates the Portfolio’s tax positions to determine if the tax positions taken meet the minimum recognition threshold in connection with accounting for uncertainties in income tax positions taken or expected to be taken for the purposes of measuring and recognizing tax liabilities in the financial statements. Recognition of tax benefits of an uncertain tax position is permitted only to the extent the position is “more likely than not” to be sustained assuming examination by taxing authorities. Management has analyzed the Portfolio’s tax positions taken on federal, state and local income tax returns for all open tax years (for up to three tax years) and has concluded that no provisions for federal, state and local income tax are required in the Portfolio’s financial statements. The Portfolio’s federal, state and local income tax and federal excise tax returns for tax years for which the applicable statutes of limitations have not expired are subject to examination by the Internal Revenue Service and state and local departments of revenue.
| | |
| 28 | | MainStay VP MacKay High Yield Corporate Bond Portfolio |
(C) Dividends and Distributions to Shareholders. Dividends and distributions are recorded on the ex-dividend date. The Portfolio intends to declare and pay dividends from net investment income and distributions from net realized capital and currency gains, if any, at least annually. Unless the shareholder elects otherwise, all dividends and distributions are reinvested in the same class of shares of the Portfolio, at NAV. Dividends and distributions to shareholders are determined in accordance with federal income tax regulations and may differ from determinations using GAAP.
(D) Security Transactions and Investment Income. The Portfolio records security transactions on the trade date. Realized gains and losses on security transactions are determined using the identified cost method. Dividend income is recognized on the ex-dividend date; net of any foreign tax withheld at the source, and interest income is accrued as earned using the effective interest rate method. Discounts and premiums on securities purchased for the Portfolio are accreted and amortized, respectively, on the effective interest rate method over the life of the respective securities. Income frompayment-in-kind securities is accreted daily based on the effective interest method.
Investment income and realized and unrealized gains and losses on investments of the Portfolio are allocated pro rata to the separate classes of shares based upon their relative net assets on the date the income is earned or realized and unrealized gains and losses are incurred.
The Portfolio may place a debt security on non-accrual status and reduce related interest income by ceasing current accruals and writing off all or a portion of any interest receivables when the collection of all or a portion of such interest has become doubtful. A debt security is removed from non-accrual status when the issuer resumes interest payments or when collectability of interest is reasonably assured.
(E) Expenses. Expenses of the Fund are allocated to the individual Portfolios in proportion to the net assets of the respective Portfolios when the expenses are incurred, except where direct allocations of expenses can be made. Expenses (other than fees incurred under the distribution and service plans, further discussed in Note 3(B), which are charged directly to the Service Class shares) are allocated to separate
classes of shares pro rata based upon their relative net assets on the date the expenses are incurred. The expenses borne by the Portfolio, including those of related parties to the Portfolio, are shown in the Statement of Operations.
Additionally, the Portfolio may invest in mutual funds, which are subject to management fees and other fees that may cause the costs of investing in mutual funds to be greater than the costs of owning the underlying securities directly. These indirect expenses of mutual funds are not included in the amounts shown as expenses in the Portfolio’s Statement of Operations or in the expense ratios included in the Financial Highlights.
(F) Use of Estimates. In preparing financial statements in conformity with GAAP, management makes estimates and assumptions that affect the reported amounts and disclosures in the financial statements. Actual results could differ from those estimates.
(G) Loan Assignments, Participations and Commitments. The Portfolio may invest in loan assignments and participations (“loans”). Commitments are agreements to make money
available to a borrower in a specified amount, at a specified rate and within a specified time. The Portfolio records an investment when the borrower withdraws money on a commitment or when a funded loan is purchased (trade date) and records interest as earned. These loans pay interest at rates that are periodically reset by reference to a base lending rate plus a spread. These base lending rates are generally the prime rate offered by a designated U.S. bank or the London Interbank Offered Rate (“LIBOR”).
The loans in which the Portfolio may invest are generally readily marketable, but may be subject to some restrictions on resale. For example, the Portfolio may be contractually obligated to receive approval from the agent bank and/or borrower prior to the sale of these investments. If the Portfolio purchases an assignment from a lender, the Portfolio will generally have direct contractual rights against the borrower in favor of the lender. If the Portfolio purchases a participation interest either from a lender or a participant, the Portfolio typically will have established a direct contractual relationship with the seller of the participation interest, but not with the borrower. Consequently, the Portfolio is subject to the credit risk of the lender or participant who sold the participation interest to the Portfolio, in addition to the usual credit risk of the borrower. In the event that the borrower, selling participant or intermediate participants become insolvent or enter into bankruptcy, the Portfolio may incur certain costs and delays in realizing payment, or may suffer a loss of principal and/or interest.
Unfunded commitments represent the remaining obligation of the Portfolio to the borrower. At any point in time, up to the maturity date of the issue, the borrower may demand the unfunded portion. Unfunded amounts, if any, are marked to market and any unrealized gains or losses are recorded in the Statement of Assets and Liabilities. As of June 30, 2019, the Portfolio did not hold any unfunded commitments.
(H) Securities Lending. In order to realize additional income, the Portfolio may engage in securities lending, subject to the limitations set forth in the 1940 Act and relevant guidance by the staff of the Securities and Exchange Commission (“SEC”). In the event the Portfolio does engage in securities lending, the Portfolio will lend through its custodian, State Street Bank and Trust Company (“State Street”), acting as securities lending agent on behalf of the Portfolio. State Street will manage the Portfolio’s collateral in accordance with the securities lending agency agreement between the Portfolio and State Street, and indemnify the Portfolio against counterparty risk. The loans will be collateralized by cash (which may be invested in a money market fund) and/ornon-cash collateral (which may include, U.S. Treasury securities and/or U.S. Government Agency securities issued or guaranteed by the United States government or its agencies or instrumentalities) at least equal at all times to the market value of the securities loaned. The Portfolio may bear the risk of delay in recovery of, or loss of rights in, the securities loaned should the borrower of the securities experience financial difficulty. The Portfolio may also record a realized gain or loss on securities deemed sold due to a borrower’s inability to return securities on loan. The Portfolio bears the risk of any loss on investment of cash collateral. The Portfolio will receive compensation for lending its securities in the form of fees or it will retain a portion of interest on the investment of any cash collateral. The Portfolio will also continue to receive interest and dividends on the securities loaned and any gain or loss in the market price of the securities loaned that may occur during
Notes to Financial Statements(Unaudited) (continued)
the term of the loan will be for the account of the Portfolio. Income earned from securities lending activities, if any, is reflected in the Statement of Operations. As of June 30, 2019, the Portfolio had securities on loan with an aggregate market value of $24,321,241 and received cash collateral which was invested into the State Street Navigator Securities Lending Government Money Market Portfolio with a value of $24,871,673.
(I) Debt Securities and Loan Risk. The Portfolio primarily invests in high-yield debt securities (commonly referred to as “junk bonds”), which are considered speculative because they present a greater risk of loss, including default, than higher rated debt securities. These securities pay investors a premium—a higher interest rate or yield than investment grade debt securities—because of the increased risk of loss. These securities can also be subject to greater price volatility. In times of unusual or adverse market, economic or political conditions, these securities may experience higher than normal default rates.
The loans in which the Portfolio invests are usually rated below investment grade, or if unrated, determined by the Subadvisor to be of comparable quality (commonly referred to as “junk bonds”) and are generally considered speculative because they present a greater risk of loss, including default, than higher quality debt securities. Moreover, such securities may, under certain circumstances, be particularly susceptible to liquidity and valuation risks. Although certain loans are collateralized, there is no guarantee that the value of the collateral will be sufficient or available to satisfy the borrower’s obligation. In times of unusual or adverse market, economic or political conditions, loans may experience higher than normal default rates. In the event of a recession or serious credit event, among other eventualities, the value of the Portfolio’s investments in loans are more likely to decline. The secondary market for loans is limited and, thus, the Portfolio’s ability to sell or realize the full value of its investment in these loans to reinvest sale proceeds or to meet redemption obligations may be impaired. In addition, loans generally are subject to extended settlement periods that may be longer than seven days. As a result, the Portfolio may be adversely affected by selling other investments at an unfavorable time and/or under unfavorable conditions or engaging in borrowing transactions, such as borrowing against its credit facility, to raise cash to meet redemption obligations or pursue other investment opportunities.
In certain circumstances, loans may not be deemed to be securities. As a result, the Portfolio may not have the protection of the anti-fraud provisions of the federal securities laws. In such cases, the Portfolio generally must rely on the contractual provisions in the loan agreement and common-law fraud protections under applicable state law.
(J) Indemnifications. Under the Fund’s organizational documents, its officers and trustees are indemnified against certain liabilities that may arise out of performance of their duties to the Fund. Additionally, in the normal course of business, the Portfolio enters into contracts with third-party service providers that contain a variety of representations and warranties and which may provide general indemnifications. The Portfolio’s maximum exposure under these arrangements is unknown, as this would involve future claims that may be made against the Portfolio that have not yet occurred. Based on experience, management is of the view that the risk of loss in connection with these potential indemnification obligations is remote. However, there can be no assur-
ance that material liabilities related to such obligations will not arise in the future, which could adversely impact the Portfolio.
Note 3–Fees and Related Party Transactions
(A) Manager and Subadvisor. New York Life Investments, a registered investment adviser and an indirect,wholly-owned subsidiary of New York Life, serves as the Portfolio’s Manager pursuant to an Amended and Restated Management Agreement (“Management Agreement”). The Manager provides offices, conducts clerical, recordkeeping and bookkeeping services, and keeps most of the financial and accounting records required to be maintained by the Portfolio. Except for the portion of salaries and expenses that are the responsibility of the Portfolio, the Manager pays the salaries and expenses of all personnel affiliated with the Portfolio and certain operational expenses of the Portfolio. The Portfolio reimburses New York Life Investments in an amount equal to a portion of the compensation of the Chief Compliance Officer attributable to the Portfolio. MacKay Shields LLC (“MacKay Shields” or “Subadvisor”), a registered investment adviser and an indirect,wholly-owned subsidiary of New York Life, serves as Subadvisor to the Portfolio and is responsible for theday-to-day portfolio management of the Portfolio. Pursuant to the terms of an Amended and Restated Subadvisory Agreement (“Subadvisory Agreement”) between New York Life Investments and MacKay Shields, New York Life Investments pays for the services of the Subadvisor.
The Fund, on behalf of the Portfolio, pays New York Life Investments in its capacity as the Portfolio’s investment manager and administrator, pursuant to the Management Agreement, a monthly fee for the services performed and the facilities furnished at an annual rate of the average daily net assets as follows: 0.57% up to $1 billion; 0.55% from $1 billion up to $5 billion; and 0.525% in excess of $5 billion. During the six-month period ended June 30, 2019, the effective management fee rate was 0.56%.
During the six-month period ended June 30, 2019, New York Life Investments earned fees from the Portfolio in the amount of $7,967,794, and paid the Subadvisor in the amount of $3,983,897.
State Street providessub-administration andsub-accounting services to the Portfolio pursuant to an agreement with New York Life Investments. These services include calculating the daily NAVs of the Portfolio, maintaining the general ledger andsub-ledger accounts for the calculation of the Portfolio’s NAVs and assisting New York Life Investments in conducting various aspects of the Portfolio’s administrative operations. For providing these services to the Portfolio, State Street is compensated by New York Life Investments.
Pursuant to an agreement between the Fund and New York Life Investments, New York Life Investments is responsible for providing or procuring certain regulatory reporting services for the Portfolio. The Portfolio will reimburse New York Life Investments for the actual costs incurred by New York Life Investments in connection with providing or procuring these services for the Portfolio.
(B) Distribution and Service Fees. The Fund, on behalf of the Portfolio, has entered into a distribution agreement with NYLIFE Distributors LLC (the “Distributor”), an indirect,wholly-owned subsidiary of New York Life. The Portfolio has adopted a distribution plan (the “Plan”) in accordance with the provisions of Rule 12b-1 under the 1940 Act.
| | |
| 30 | | MainStay VP MacKay High Yield Corporate Bond Portfolio |
Under the Plan, the Distributor has agreed to provide, through its affiliates or independent third parties, various distribution-related, shareholder and administrative support services to the Service Class shareholders. For its services, the Distributor is entitled to a combined distribution and service fee accrued daily and paid monthly at an annual rate of 0.25% of the average daily net assets attributable to the Service Class shares of the Portfolio.
Note 4–Federal Income Tax
As of June 30, 2019, the cost and unrealized appreciation (depreciation) of the Portfolio’s investment portfolio, including applicable derivative contracts and other financial instruments, as determined on a federal income tax basis, were as follows:
| | | | | | | | | | | | | | | | |
| | | Federal Tax Cost | | | Gross
Unrealized
Appreciation | | | Gross
Unrealized
(Depreciation) | | | Net
Unrealized
Appreciation/
(Depreciation) | |
Investments in Securities | | $ | 2,920,814,993 | | | $ | 99,144,679 | | | $ | (74,007,603 | ) | | $ | 25,137,076 | |
As of December 31, 2018, for federal income tax purposes, capital loss carryforwards of $56,672,069, as shown in the table below, were available to the extent provided by the regulations to offset future realized gains of the Portfolio through the years indicated. Accordingly, no
capital gains distributions are expected to be paid to shareholders until net gains have been realized in excess of such amounts.
| | | | |
Capital Loss
Available Through | | Short-Term
Capital Loss
Amounts (000’s) | | Long-Term
Capital Loss
Amounts (000’s) |
| | |
| Unlimited | | $10,194 | | $46,478 |
During the year ended December 31, 2018, the tax character of distributions paid as reflected in the Statements of Changes in Net Assets was as follows:
| | | | |
|
| 2018 | |
Tax-Based
Distributions
from Ordinary
Income | | Tax-Based
Distributions
from Long-Term
Gains | |
| |
| $169,207,528 | | $ | — | |
Note 5–Restricted Securities
Restricted securities, are securities which have been purchased through a private offering and cannot be resold to the general public without prior registration under the Securities Act of 1933, as amended. Disposal of these securities may involve time-consuming negotiations and expenses, and it may be difficult to obtain a prompt sale at an acceptable price.
As of June 30, 2019, the Portfolio held the following restricted securities:
| | | | | | | | | | | | | | | | | | | | |
Security | | Date(s) of
Acquisition | | | Principal
Amount/
Shares | | | Cost | | | 6/30/19
Value | | | Percent
of Net
Assets | |
At Home Corp.
Convertible Bonds
0.525%, due 12/28/18 | | | 8/31/01 | | | $ | 2,000,000 | | | $ | — | | | $ | 26,000 | | | | 0.0 | %‡ |
4.75%, due 3/15/06 | | | 8/27/01 | | | $ | 10,210,000 | | | | — | | | | 132,730 | | | | 0.0 | ‡ |
Exide Technologies
Common Stock | | | 4/30/15–5/24/17 | | | | 2,173,379 | | | | 18,585,631 | | | | 2,738,458 | | | | 0.1 | |
ION Media Networks, Inc.
Common Stock | | | 3/12/10-12/20/10 | | | | 725 | | | | — | | | | 489,100 | | | | 0.0 | ‡ |
Rex Energy Corp. (Escrow Claim)
Corporate Bond
8.00%, due 10/1/20 | | | 10/3/18 | | | $ | 40,580,000 | | | | — | | | | 557,975 | | | | 0.0 | ‡ |
Sterling Entertainment Enterprises LLC
Corporate Bond
10.25%, due 1/15/25 | | | 12/28/17 | | | $ | 7,000,000 | | | | 6,911,591 | | | | 7,367,500 | | | | 0.2 | |
Total | | | — | | | | — | | | $ | 25,497,222 | | | $ | 11,311,763 | | | | 0.3 | % |
| ‡ | Less than one-tenth of a percent. |
Note 6–Custodian
State Street is the custodian of cash and securities held by the Portfolio. Custodial fees are charged to the Portfolio based on the Portfolio’s net assets and/or the market value of securities held by the Portfolio and the number of certain transactions incurred by the Portfolio.
Note 7–Line of Credit
The Portfolio and certain other funds managed by New York Life Investments maintain a line of credit with a syndicate of banks in order to secure a source of funds for temporary purposes to meet unanticipated or excessive redemption requests.
Effective July 30, 2019, under the credit agreement (the “Credit Agreement”), the aggregate commitment amount is $600,000,000 with
Notes to Financial Statements(Unaudited) (continued)
an additional uncommitted amount of $100,000,000. The commitment fee is an annual rate of 0.15% of the average commitment amount payable quarterly, regardless of usage, to State Street, who serves as the agent to the syndicate. The commitment fee is allocated among the Portfolio and certain other funds managed by New York Life Investments based upon their respective net assets and other factors. Interest on any revolving credit loan is charged based upon the Federal Funds Rate or the one-month London Interbank Offered Rate (“LIBOR”), whichever is higher. The Credit Agreement expires on July 28, 2020, although the Portfolio, certain other funds managed by New York Life Investments and the syndicate of banks may renew the Credit Agreement for an additional year on the same or different terms. Prior to July 30, 2019, the aggregate commitment amount and the commitment fee were the same as those under the current Credit Agreement. During the six-month period ended June 30, 2019, there were no borrowings made or outstanding with respect to the Portfolio under the Credit Agreement.
Note 8–Interfund Lending Program
Pursuant to an exemptive order issued by the SEC, the Portfolio, along with certain other funds managed by New York Life Investments, may participate in an interfund lending program. The interfund lending program provides an alternative credit facility that permits the Portfolio and certain other funds managed by New York Life Investments to lend or borrow money for temporary purposes directly to or from one another subject to the conditions of the exemptive order. During the six-month period ended June 30, 2019, there were no interfund loans made or outstanding with respect to the Portfolio.
Note 9–Purchases and Sales of Securities (in 000’s)
During the six-month period ended June 30, 2019, purchases and sales of securities, other thanshort-term securities, were $456,399 and $407,058, respectively.
Note 10–Capital Share Transactions
Transactions in capital shares for the six-month period ended June 30, 2019 and the year ended December 31, 2018, were as follows:
| | | | | | | | |
Initial Class | | Shares | | | Amount | |
| | |
Six-month period ended June 30, 2019: | | | | | | | | |
Shares sold | | | 1,927,253 | | | $ | 18,987,255 | |
Shares redeemed | | | (3,340,881 | ) | | | (32,930,079 | ) |
| | | | |
Net increase (decrease) | | | (1,413,628 | ) | | $ | (13,942,824 | ) |
| | | | |
Year ended December 31, 2018: | | | | | | | | |
Shares sold | | | 2,307,070 | | | $ | 22,998,759 | |
Shares issued to shareholders in reinvestment of dividends and distributions | | | 2,979,088 | | | | 28,718,735 | |
Shares redeemed | | | (13,270,838 | ) | | | (132,356,065 | ) |
| | | | |
Net increase (decrease) | | | (7,984,680 | ) | | $ | (80,638,571 | ) |
| | | | |
| | |
| | | | | | | | |
| | | | | | | | |
Service Class | | Shares | | | Amount | |
Six-month period ended June 30, 2019: | | | | | | | | |
Shares sold | | | 11,352,280 | | | $ | 110,443,311 | |
Shares redeemed | | | (14,831,321 | ) | | | (143,575,802 | ) |
| | | | |
Net increase (decrease) | | | (3,479,041 | ) | | $ | (33,132,491 | ) |
| | | | |
Year ended December 31, 2018: | | | | | | | | |
Shares sold | | | 18,221,708 | | | $ | 179,196,577 | |
Shares issued to shareholders in reinvestment of dividends and distributions | | | 14,774,767 | | | | 140,488,793 | |
Shares redeemed | | | (37,932,514 | ) | | | (370,283,748 | ) |
| | | | |
Net increase (decrease) | | | (4,936,039 | ) | | $ | (50,598,378 | ) |
| | | | |
Note 11–Recent Accounting Pronouncement
To improve the effectiveness of fair value disclosure requirements, the Financial Accounting Standards Board recently issued Accounting Standard Update (ASU)2018-13, Fair Value Measurement Disclosure Framework—Changes to the Disclosure Requirements for Fair Value Measurement (ASU2018-13), which adds, removes, and modifies certain aspects relating to fair value disclosure. ASU2018-13 is effective for interim and annual reporting periods beginning after December 15, 2019; early adoption of the additions relating toASU 2018-13 is not required. Management has evaluated the implications of certain other provisions of the ASU and has determined to early adopt aspects related to the removal and modifications of certain fair value measurement disclosures under the ASU effective immediately. At this time, management is evaluating the implications of certain other provisions of the ASU related to new disclosure requirements and any impact on the financial statement disclosures has not yet been determined.
Note 12–Subsequent Events
In connection with the preparation of the financial statements of the Portfolio as of and for the six-month period ended June 30, 2019, events and transactions subsequent to June 30, 2019, through the date the financial statements were issued have been evaluated by the Portfolio’s management for possible adjustment and/or disclosure. No subsequent events requiring financial statement adjustment or disclosure have been identified.
| | |
| 32 | | MainStay VP MacKay High Yield Corporate Bond Portfolio |
Proxy Voting Policies and Procedures and Proxy Voting Record
A description of the policies and procedures that New York Life Investments uses to vote proxies related to the Portfolio’s securities is available without charge, upon request (i) by calling800-598-2019; (ii) by visiting New York Life Investments website at https://www.nylinvestments.com/mainstay/products-and-performance/mainstay-vp-funds-trust; or (iii) by visiting the SEC’s website at www.sec.gov.
The Portfolio is required to file with the SEC its proxy voting record for the12-month period ending June 30 on Form N-PX. The Portfolio’s most recent Form N-PX or proxy voting record is available free of charge upon request (i) by calling800-598-2019; (ii) by visiting New York Life Investments website at https://www.nylinvestments.com/mainstay/products-and-performance/mainstay-vp-funds-trust; or (iii) by visiting the SEC’s website atwww.sec.gov.
Shareholder Reports and Quarterly Portfolio Disclosure
The Portfolio is required to file its complete schedule of portfolio holdings with the SEC 60 days after each fiscal quarter onForm N-PORT. The Portfolio’s holdings report is available without charge upon request (i) by calling800-598-2019; (ii) by visiting New York Life Investments website at https://www.nylinvestments.com/mainstay/products-and-performance/mainstay-vp-funds-trust; or (iii) on the SEC’s website at www.sec.gov.
MainStay VP Portfolios
MainStay VP offers a wide range of Portfolios. The full array of MainStay VP offerings is listed here, with information about the manager, subadvisors, legal counsel, and independent registered public accounting firm.
Equity Portfolios
MainStay VP Eagle Small Cap Growth Portfolio
MainStay VP Emerging Markets Equity Portfolio
MainStay VP Epoch U.S. Equity Yield Portfolio
MainStay VP Fidelity Institutional AM® Utilities Portfolio†
MainStay VP Large Cap Growth Portfolio
MainStay VP MacKay Common Stock Portfolio
MainStay VP MacKay Growth Portfolio
MainStay VP MacKay International Equity Portfolio
MainStay VP MacKay Mid Cap Core Portfolio
MainStay VP MacKay S&P 500 Index Portfolio
MainStay VP MacKay Small Cap Core Portfolio
MainStay VP Mellon Natural Resources Portfolio
MainStay VP T. Rowe Price Equity Income Portfolio
Mixed Asset Portfolios
MainStay VP Balanced Portfolio
MainStay VP Income Builder Portfolio
MainStay VP Janus Henderson Balanced Portfolio
MainStay VP MacKay Convertible Portfolio
Income Portfolios
MainStay VP Bond Portfolio
MainStay VP Floating Rate Portfolio
MainStay VP Indexed Bond Portfolio
MainStay VP MacKay Government Portfolio
MainStay VP MacKay High Yield Corporate Bond Portfolio
MainStay VP MacKay Unconstrained Bond Portfolio
MainStay VP PIMCO Real Return Portfolio
Money Market
MainStay VP U.S. Government Money Market Portfolio
Alternative
MainStay VP Cushing Renaissance Advantage Portfolio
MainStay VP IQ Hedge Multi-Strategy Portfolio
Asset Allocation Portfolios
MainStay VP Conservative Allocation Portfolio
MainStay VP Growth Allocation Portfolio
MainStay VP Moderate Allocation Portfolio
MainStay VP Moderate Growth Allocation Portfolio
Manager
New York Life Investment Management LLC
New York, New York
Subadvisors
Candriam Belgium*
Brussels, Belgium
Cushing Asset Management, LP
Dallas, Texas
Eagle Asset Management, Inc.
St Petersburg, Florida
Epoch Investment Partners, Inc.
New York, New York
FIAM LLC
Smithfield, Rhode Island
IndexIQ Advisors LLC*
New York, New York
Janus Capital Management LLC
Denver, Colorado
MacKay Shields LLC*
New York, New York
Mellon Investments Corporation
Boston, Massachusetts
NYL Investors LLC*
New York, New York
Pacific Investment Management Company LLC
Newport Beach, California
T. Rowe Price Associates, Inc.
Baltimore, Maryland
Winslow Capital Management, LLC
Minneapolis, Minnesota
Distributor
NYLIFE Distributors LLC*
Jersey City, New Jersey
Custodian
State Street Bank and Trust Company
Boston, Massachusetts
Independent Registered Public Accounting Firm
PricewaterhouseCoopers LLP
New York, New York
Legal Counsel
Dechert LLP
Washington, District of Columbia
Some Portfolios may not be available in all products.
| † | Fidelity Institutional AM is a registered trade mark of FMR LLC. Used with permission. |
| * | An affiliate of New York Life Investment Management LLC |
Not part of the Semiannual Report
2019 Semiannual Report
This report is for the general information of New York Life Variable Annuities and NYLIAC Variable Universal Life Insurance Products policyowners. It must be preceded or accompanied by the appropriate product(s) and funds prospectuses if it is given to anyone who is not an owner of a New York Life variable annuity policy or a NYLIAC Variable Universal Life Insurance Product. This report does not offer for sale or solicit orders to purchase securities.
The performance data quoted in this report represents past performance. Past performance is no guarantee of future results. Due to market volatility and other factors, current performance may be lower or higher than the figures shown. The most recent month-end performance summary for your variable annuity or variable life policy is available by calling 800-598-2019 and is updated periodically on www.newyorklife.com.
The New York Life Variable Annuities and NYLIAC Variable Universal Life Insurance Products are issued by New York Life Insurance and Annuity Corporation (a Delaware Corporation) and distributed by NYLIFE Distributors LLC (Member FINRA/SIPC).
New York Life Insurance Company
New York Life Insurance and Annuity Corporation (NYLIAC) (A Delaware Corporation)
51 Madison Avenue, Room 551
New York, NY 10010
www.newyorklife.com
Printed on recycled paper
nylinvestments.com
NYLIFE Distributors LLC, 30 Hudson Street, Jersey City, NJ 07302
New York Life Investment Management LLC is the investment manager to the MainStay VP Funds Trust
©2019 by NYLIFE Distributors LLC. All rights reserved.
You may obtain copies of the Prospectus and the Statement of Additional Information free of charge, upon request, by callingtoll-free 800-598-2019 or writing to New York Life Insurance and Annuity Corporation, 51 Madison Avenue, New York, NY 10010.
| | | | |
| | | |
| Not FDIC Insured | | No Bank Guarantee | | May Lose Value |
| | | | |
| 1781623 | | | | MSVPHYCB10-08/19 (NYLIAC) NI520 |
MainStay VP Income Builder Portfolio
Message from the President and Semiannual Report
Unaudited | June 30, 2019

Beginning on January 1, 2021, as permitted by regulations adopted by the Securities and Exchange Commission, paper copies of the MainStay VP Portfolio annual and semi-annual shareholder reports may no longer be sent by mail, unless you specifically request paper copies of the reports from the insurance company that offers your policy. Instead, the reports will be made available online, and you will be notified by mail each time a report is posted and provided with a website link to access the report. Instructions for requesting paper copies will be provided by your insurance company.
If you already elected to receive shareholder reports electronically, you will not be affected by this change and you need not take any action. At any time, you may elect to receive reports and other communications from the insurance company electronically by following the instructions provided by the insurance company.
You may elect to receive all future shareholder reports in paper form free of charge. You can inform the insurance company that you wish to receive paper copies of reports by following the instructions provided by the insurance company. Your election to receive reports in paper form will apply to all portfolio companies available under your contract.
| | | | | | | | |
| | | | | |
| Not FDIC/NCUA Insured | | Not a Deposit | | May Lose Value | | No Bank Guarantee | | Not Insured by Any Government Agency |

This page intentionally left blank
Message from the President
Most equity and fixed-income markets in the United States and around the world advanced in the face of conflicting political and macroeconomic forces during thesix-month period ended June 30, 2019.
The reporting period began on the heels of tumultuous December 2018, during which equities and equity-sensitive bonds spiked sharply lower on concerns regarding the pace of economic growth, a U.S. government shutdown and the potential impact of trade disputes between the United States and other nations, particularly China. Markets recovered quickly in early 2019 as trade tensions eased, the government reopened and the U.S. Federal Reserve Board (Fed) adopted a more patient tone regarding the future direction of interest rates. Markets moved broadly higher from January through April, supported by encouraging economic data and generally strong corporate earnings.
During the first four months of the reporting period, the improving economic environment encouraged investors to favor areas of the market viewed as offering greater return potential along with higher risks. Among U.S. stocks, cyclical, growth-oriented sectors tended to outperform more defensive, value-oriented sectors, whilelarge-cap stocks outperformed theirsmaller-cap counterparts. Within the S&P 500® Index, the information technology sector led the market’s advance, followed by communication services, consumer discretionary and consumer staples. Industrials, utilities, financials, materials, real estate and energy produced more modest gains. While some international equity markets outperformed or underperformed the U.S. market, on average international stocks mirrored the performance of their U.S. counterparts. Fixed-income securities gained ground as well, albeit along a more gradual trajectory. Among U.S. fixed-income instruments, corporate issues generally outperformed government bonds, with lower credit quality, higher yielding securities leading the sector’s advance. Long-term U.S. Treasury bond yields proved particularly weak, with
10-year yields dipping at times below3-month yields, reflecting investors’ continued concerns about domestic economic growth.
May 2019 saw a return of uncertainty and volatility. Trade discussions between the United States and China faltered, driving global equity prices lower. Government bond prices rose as investors sought safe havens. June brought yet anotherU-turn as equity prices climbed again after comments from the Fed raised hopes of an interest rate cut in response to weak economic data. Stock and bond prices rose, with U.S. equity markets ending the reporting period in record territory.
We are pleased to see renewed signs of strength in broad areas of the financial market. At the same time, we remained sharply focused on providing you, as a MainStay VP investor, with the experienced and disciplined fund management that we believe underpins an effective, long-term investment strategy. Whatever tomorrow’s investment environment brings, you can rely on our portfolio managers to pursue the objectives of their individual Portfolios as outlined in the prospectus with the energy and dedication you have come to expect.
The report that follows contains additional information on the market events, investment decisions and specific securities that shaped your VP Portfolio’s performance during the six months ended June 30, 2019. We encourage you to read the report carefully and use it to evaluate your Portfolio’s performance in light of your long-range financial plan.
Sincerely,

Kirk C. Lehneis
President
The opinions expressed are as of the date of this report and are subject to change. There is no guarantee that any forecast made will come to pass. This material does not constitute investment advice and is not intended as an endorsement of any specific investment. Past performance is no guarantee of future results.
Not part of the Semiannual Report
Table of Contents
Investors should refer to the Portfolio’s Summary Prospectus and/or Prospectus and consider the Portfolio’s investment objectives, strategies, risks, charges and expenses carefully before investing. The Summary Prospectus and/or Prospectus contain this and other information about the Portfolio. You may obtain copies of the Portfolio’s Summary Prospectus and/or the Prospectus and the Statement of Additional Information free of charge, upon request, by calling toll-free 800-598-2019, by writing to New York Life Insurance and Annuity Corporation, 51 Madison Avenue, Room 251, New York, New York 10010 or by sending an email to MainStayShareholdersServices@nylim.com. These documents are also available at nylinvestments.com/vpdocuments. Please read the Summary Prospectus and/or Prospectus carefully before investing. MainStay VP Funds Trust portfolios are separate account options which are purchased through a variable insurance or variable annuity contract.
Investment and Performance Comparison1(Unaudited)
Performance data quoted represents past performance. Past performance is no guarantee of future results. Because of market volatility and other factors, current performance may be lower or higher than the figures shown. Investment return and principal value will fluctuate, and as a result, when shares are redeemed, they may be worth more or less than their original cost. The performance table and graph do not reflect any deduction of sales charges, mortality and expense charges, contract charges or administrative charges. Please refer to the Performance Summary appropriate for your policy. For performance information current to the most recent month-end, please call800-598-2019 or visit www.newyorklife.com.
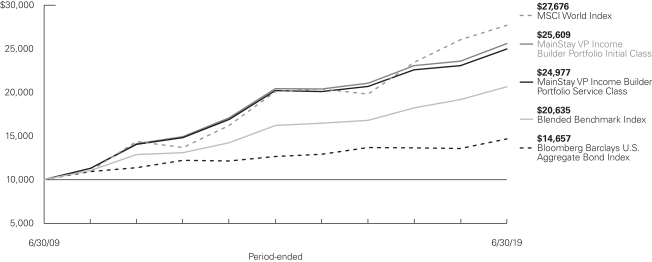
Average Annual Total Returns for the Period-Ended June 30, 2019
| | | | | | | | | | | | | | | | | | | | |
| Class | | Inception
Date | | | Six Months | | One Year | | Five Years | | | Ten Years | | | Gross
Expense
Ratio2 | |
| | | | | | |
| Initial Class Shares | | | 1/29/1993 | | | 11.23% | | 8.50% | | | 4.60 | % | | | 9.86 | % | | | 0.62 | % |
| Service Class Shares | | | 6/4/2003 | | | 11.09 | | 8.23 | | | 4.34 | | | | 9.59 | | | | 0.87 | |
| | | | | | | | | | | | | | | | |
| Benchmark Performance | | Six Months | | | One Year | | | Five Years | | | Ten Years | |
| | | | |
MSCI World Index3 | | | 16.98 | % | | | 6.33 | % | | | 6.60 | % | | | 10.72 | % |
| Bloomberg Barclays U.S. Aggregate Bond Index4 | | | 6.11 | | | | 7.87 | | | | 2.95 | | | | 3.90 | |
Blended Benchmark Index5 | | | 11.62 | | | | 7.50 | | | | 4.95 | | | | 7.51 | |
Morningstar World Allocation Category Average6 | | | 10.40 | | | | 3.05 | | | | 2.72 | | | | 7.13 | |
| 1. | Performance figures may reflect certain fee waivers and/or expense limitations, without which total returns may have been different. For information on current fee waivers and/or expense limitations (if any), please refer to the Notes to Financial Statements. |
| 2. | The gross expense ratios presented reflect the Portfolio’s “Total Annual Portfolio Operating Expenses” from the most recent Prospectus, as supplemented, and may differ from other expense ratios disclosed in this report. |
| 3. | The MSCI World Index is the Portfolio’s primary broad-based securities market index for comparison purposes. The MSCI World Index is a free float-adjustedmarket-capitalization-weighted index that is designed to measure the equity market performance of developed markets. Results assume reinvestment of all dividends and capital gains. An investment cannot be made directly in an index. |
| 4. | The Portfolio has selected the Bloomberg Barclays U.S. Aggregate Bond Index as a secondary benchmark. The Bloomberg Barclays U.S. Aggregate Bond Index is a broad-based benchmark that measures performance of the investment-grade, U.S. dollar denominated, fixed-rate taxable bond market, including Treasurys, government-related and corporate securities, |
| | mortgage-backed securities (agency fixed-rate and hybrid adjustable-rate mortgage pass-throughs), asset-backed securities and commercial mortgage-backed securities. Results assume reinvestment of all dividends and capital gains. An investment cannot be made directly in an index. |
| 5. | The Portfolio has selected the Blended Benchmark Index as an additional benchmark. The Blended Benchmark Index consists of the MSCI World Index and the Bloomberg Barclays U.S. Aggregate Bond Index, each weighted 50%. Results assume reinvestment of all dividends and capital gains. An investment cannot be made directly in an index. |
| 6. | The Morningstar World Allocation Category Average is representative of funds that seek to provide both capital appreciation and income by investing in three major areas: stocks, bonds, and cash. While these funds do explore the whole world, most of them focus on the U.S., Canada, Japan, and the larger markets in Europe. It is rare for such funds to invest more than 10% of their assets in emerging markets. These funds typically have at least 10% of assets in bonds, less than 70% of assets in stocks, and at least 40% of assets in non-U.S. stocks or bonds. Results are based on average total returns of similar funds with all dividends and capital gain distributions reinvested. |
Cost in Dollars of a $1,000 Investment in MainStay VP Income Builder Portfolio (Unaudited)
The example below is intended to describe the fees and expenses borne by shareholders during the six-month period from January 1, 2019, to June 30, 2019, and the impact of those costs on your investment.
Example
As a shareholder of the Portfolio you incur two types of costs: (1) transaction costs, including exchange fees and sales charges (loads) on purchases (as applicable), and (2) ongoing costs, including management fees, distribution and/or service (12b-1) fees, and other Portfolio expenses (as applicable). This example is intended to help you understand your ongoing costs (in dollars) of investing in the Portfolio and to compare these costs with the ongoing costs of investing in other mutual funds. The example is based on an investment of $1,000 made at the beginning of the six-month period and held for the entire period from January 1, 2019, to June 30, 2019. Shares are only sold in connection with variable life and annuity contracts and the example does not reflect any contract level or transactional fees or expenses. If these costs had been included, your costs would have been higher.
This example illustrates your Portfolio’s ongoing costs in two ways:
Actual Expenses
The second and third data columns in the table below provide information about actual account values and actual expenses. You may use the information in these columns, together with the amount you invested, to estimate the expenses that you paid during the six months ended June 30, 2019. Simply divide your account value by $1,000
(for example, an $8,600 account value divided by $1,000 = 8.6), then multiply the result by the number under the heading entitled “Expenses Paid During Period” to estimate the expenses you paid on your account during this period.
Hypothetical Example for Comparison Purposes
The fourth and fifth data columns in the table below provide information about hypothetical account values and hypothetical expenses based on the Portfolio’s actual expense ratio and an assumed rate of return of 5% per year before expenses, which is not the Portfolio’s actual return. The hypothetical account values and expenses may not be used to estimate the actual ending account balances or expenses you paid for thesix-month period shown. You may use this information to compare the ongoing costs of investing in the Portfolio with the ongoing costs of investing in other mutual funds. To do so, compare this 5% hypothetical example with the 5% hypothetical examples that appear in the shareholder reports of the other mutual funds.
Please note that the expenses shown in the table are meant to highlight your ongoing costs only and do not reflect any transactional costs, such as exchange fees or sales charges (loads). Therefore, the fourth and fifth data columns of the table are useful in comparing ongoing costs only and will not help you determine the relative total costs of owning different funds. In addition, if these transactional costs were included, your costs would have been higher.
| | | | | | | | | | | | | | | | | | | | | | |
| | | | | | | | | | | | | | | | | | |
| Share Class | | Beginning
Account
Value
1/1/19 | | | Ending Account
Value (Based
on Actual
Returns and
Expenses)
6/30/19 | | | Expenses
Paid
During
Period1 | | | Ending Account
Value (Based on Hypothetical
5% Annualized
Return and
Actual Expenses)
6/30/19 | | | Expenses
Paid
During
Period1 | | | Net Expense
Ratio
During
Period2 |
| | | | | | |
| Initial Class Shares | | $ | 1,000.00 | | | $ | 1,112.30 | | | $ | 3.30 | | | $ | 1,021.67 | | | $ | 3.16 | | | 0.63% |
| | | | | | |
| Service Class Shares | | $ | 1,000.00 | | | $ | 1,110.90 | | | $ | 4.61 | | | $ | 1,020.43 | | | $ | 4.41 | | | 0.88% |
| 1. | Expenses are equal to the Portfolio’s annualized expense ratio of each class multiplied by the average account value over the period, divided by 365 and multiplied by 181 (to reflect the six-month period). The table above represents the actual expenses incurred during the six-month period. In addition to the fees and expenses which the Portfolio bears directly, it also indirectly bears a pro rata share of the fees and expenses of the underlying funds in which it invests. Such indirect expenses are not included in the above-reported expense figures. |
| 2. | Expenses are equal to the Portfolio’s annualized expense ratio to reflect the six-month period. |
| | |
| 6 | | MainStay VP Income Builder Portfolio |
Portfolio Composition as of June 30, 2019(Unaudited)
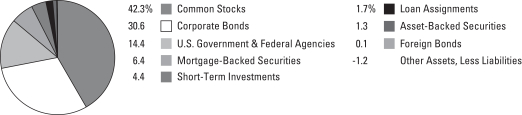
See Portfolio of Investments beginning on page 11 for specific holdings within these categories. The Portfolio’s holdings are subject to change.
Top Ten Holdings or Issuers Held as of June 30, 2019(excludingshort-term investments) (Unaudited)
| 1. | Federal National Mortgage Association (Mortgage Pass-Through Securities), 2.50%–6.00%, due 9/1/33–4/1/49 |
| 2. | Federal Home Loan Mortgage Corporation (Mortgage Pass-Through Securities), 3.00%–5.00%, due 12/1/44–3/1/49 |
| 3. | United States Treasury Bonds, 3.00%–5.00%, due 5/15/37–2/15/49 |
| 4. | Government National Mortgage Association, 2.50%–3.25%, due 1/16/40–6/20/49 |
| 5. | Bank of America Corp., 2.738%–6.30%, due 1/23/22–4/23/40 |
| 6. | Morgan Stanley, 3.125%–7.25%, due 11/1/22–4/1/32 |
| 7. | Federal Home Loan Mortgage Corporation, 2.50%–3.50%, due 5/25/29–11/15/48 |
| 9. | United States Treasury Inflation—Indexed Notes, 0.75%–0.875%, due 7/15/28–1/15/29 |
| 10. | Verizon Communications, Inc. |
Portfolio Management Discussion and Analysis(Unaudited)
Questions answered by portfolio managers Jae S. Yoon and Jonathan Swaney of New York Life Investment Management LLC, the Portfolio’s Manager; Dan Roberts, PhD, Stephen R. Cianci, CFA, and Neil Moriarty, III, of MacKay Shields LLC (“MacKay Shields”), the Subadvisor for the fixed-income portion of the Portfolio; and William W. Priest, CFA, Michael A. Welhoelter, CFA, John Tobin, PhD, CFA, and Kera Van Valen, CFA, of Epoch Investment Partners, Inc. (“Epoch”), the Subadvisor for the equity portion of the Portfolio.
How did MainStay VP Income Builder Portfolio perform relative to its benchmarks and peers during the six months ended June 30, 2019?
For the six months ended June 30, 2019, MainStay VP Income Builder Portfolio returned 11.23% for Initial Class shares and 11.09% for Service Class shares. Over the same period, both share classes underperformed the 16.98% return of the MSCI World Index, which is the Portfolio’s primary benchmark; outperformed the 6.11% return of the Bloomberg Barclays U.S. Aggregate Bond Index, which is the Portfolio’s secondary benchmark; and underperformed the 11.62% return of the Blended Benchmark Index, which is an additional benchmark of the Portfolio. For the six months ended June 30, 2019, both share classes outperformed the 10.40% return of the Morningstar World Allocation Category Average.1
During the reporting period, how was the Portfolio’s performance materially affected by investments in derivatives?
During the reporting period, the fixed-income portion of the Portfolio used equity futures to increase the Portfolio’s equity beta2 and Treasury futures, which both enhanced the Portfolio’s performance. During the same period, the equity portion of the Portfolio did not invest in derivatives.
What factors affected the relative performance of the equity portion of the Portfolio during the reporting period?
The equity portion of the Portfolio delivered positive returns during the reporting period but underperformed the MSCI World Index, largely because many of the industries and sectors that exhibit the shareholder yield characteristics that the Portfolio favors lagged the broader market. Specifically, underweight exposure to information technology, the best performing sector in the benchmark during the reporting period, detracted from relative returns, as did the Portfolio’s individual stock selections within the sector. Stock selection in communication services and consumer staples further detracted from relative results, largely due to the Portfolio’s overweight exposure to the telecommunications and tobacco industries, respectively.
Which market segments were the strongest positive contributors to relative performance in the equity portion of the Portfolio, and which market segments detracted the most?
During the reporting period, the sectors that made the strongest positive contributions to the performance of the equity portion of the Portfolio relative to the MSCI World Index included financials and consumer discretionary. (Contributions take weightings and total returns into account.) Among financials, stock selection largely drove the Portfolio’s relatively strong returns. Among consumer discretionary holdings, stock selection also bolstered returns compared to the benchmark, but underweight exposure to the sector detracted slightly from relative returns. Underweight exposure to the health care sector also contributed positively to the relative performance of the equity portion of the Portfolio.
The weakest-contributing sectors in the equity portion of the Portfolio during the reporting period included information technology, communication services and consumer staples. Information technology was the best performing sector in the benchmark during the reporting period. The relative performance of the equity portion of the Portfolio suffered from underweight exposure to the sector as well as weak stock selection. Within the communication services and consumer staples sectors, stock selection further detracted from relative performance due to a preponderance of holdings in the telecommunications and tobacco industries.
During the reporting period, which individual stocks made the strongest positive contributions to absolute performance in the equity portion of the Portfolio and which stocks detracted the most?
The top three positive contributors to the absolute performance of the equity portion of the Portfolio included Paris-based insurer AXA, German insurance company Allianz and U.S. Internet and communications hardware maker Cisco Systems. Shares of AXA and Allianz traded higher with the rest of the insurance industry as insurers benefited from the surge in equity markets and the steepening of government bond yield curves,3 conditions that boosted investment income and improved investment yield. Cisco Systems shares gained ground based on the inclusion of subscription services in its refreshed product lineup.
| 1. | See page 5 for more information on benchmark and peer group returns. |
| 2. | Beta is a measure of volatility in relation to the market as a whole. A beta higher than 1 indicates that a security or portfolio will tend to exhibit higher volatility than the market. A beta lower than 1 indicates that a security or portfolio will tend to exhibit lower volatility than the market. |
| 3. | The yield curve is a line that plots the yields of various securities of similar quality—typically U.S. Treasury issues—across a range of maturities. The U.S. Treasury yield curve serves as a benchmark for other debt and is used in economic forecasting. |
| | |
| 8 | | MainStay VP Income Builder Portfolio |
The weakest contributors to the absolute performance of the equity portion of the Portfolio included global tobacco manufacturer Imperial Brands, British-based telecommunications provider Vodafone and U.S.-domiciled pharmaceutical company AbbVie. Imperial Brands, along with its tobacco peers, faced concerns from investors regarding growth prospects in the United States. Shares of Vodafone were pressured during the reporting period due to a change in the company’s capital allocation priorities, which prompted the Portfolio to exit its position. Shares of AbbVie traded lower due to weaker-than-expected sales of key drug Humira as well as the company’s announced acquisition of Allergan.
Did the equity portion of the Portfolio make any significant purchases or sales during the reporting period?
During the reporting period, the equity portion of the Portfolio initiated new positions in several stocks, including merchandise retailer Target and software systems provider International Business Machines (IBM). Target has a track record of generating robust and sustainable cash flows and consistently returning a substantial portion of these cash flows to shareholders via an attractive and growing dividend, regular share repurchases and debt reduction, in our view. IBM’s strategic imperatives, which include cloud computing, big data, security and more, should, in our opinion, help cash flow grow, and the company has regularly paid a well-covered, growing dividend.
Positions that the equity portion of the Portfolio closed during the reporting period includedU.K-based utility company SSE and Spanish regulated utility Red Eléctrica. Both sales were used as sources of cash to fund the purchase of new shareholder yield opportunities.
How did sector weightings in the equity portion of the Portfolio change during the reporting period?
During the reporting period, the most substantial sector weighting increases in the equity portion of the Portfolio were in industrials and energy. Over the same period, the most substantial sector weighting reductions in the equity portion of the Portfolio were in communication services and utilities. Sector allocations in the equity portion of the Portfolio are a result of ourbottom-up fundamental investment process and reflect the companies and securities that we confidently believe can collect and distribute sustainable, growing shareholder yield. Relative
performance of sectors during the reporting period may impact changes in sector weightings.
How was the equity portion of the Portfolio positioned at the end of the reporting period?
As of June 30, 2019, the utilities sector was the most substantially overweight position in the equity portion of the Portfolio relative to the MSCI World Index. As a defensive area that includes a high percentage of dividend-yielding companies, the utilities sector is typically more heavily represented in the equity portion of the Portfolio than in the benchmark. Within the utilities sector, the Portfolio remained focused on regulated utilities where an aging infrastructure, the emergence of renewables, the shale revolution and digitization have driven growth in rate bases, earnings and cash flows. As of the same date, other overweight positions included energy and consumer staples.
As of June 30, 2019, the most substantially underweight sector position relative to the benchmark in the equity portion of the Portfolio was information technology, reflecting the fact that many companies in the sector are outside the Portfolio’s investible universe. As of the same date, the equity portion of the Portfolio also held underweight exposure to the consumer discretionary sector relative to the benchmark.
What factors affected the relative performance of the fixed-income portion of the Portfolio during the reporting period?
During the six months ended June 30, 2019, the fixed-income portion of the Portfolio outperformed the Bloomberg Barclays U.S. Aggregate Bond Index. The primary driver of this outperformance was the Portfolio’s overweight exposure to spread product,4 such as investment-grade corporate bonds and, to a lesser degree, high-yield bonds and bank loans. Spreads compressed during the reporting period in correlation with a strong equity market, a more dovish U.S. Federal Reserve posture toward interest rates and hopes of a resolution to the trade dispute between the United States and China.
What was the duration5 strategy of the fixed-income portion of the Portfolio during the reporting period?
Throughout the reporting period, the fixed-income portion of the Portfolio sought to keep its duration in line with that of the Bloomberg Barclays U.S. Aggregate Bond Index as a buffer to
| 4. | The terms “spread” and “yield spread” may refer to the difference in yield between a security or type of security and comparable U.S. Treasury issues. The terms may also refer to the difference in yield between two specific securities or types of securities at a given time. The term “spread product” refers to asset classes that typically trade at a spread to comparable U.S. Treasury securities. |
| 5. | Duration is a measure of the price sensitivity of a fixed-income investment to changes in interest rates. Duration is expressed as a number of years and is considered a more accurate sensitivity gauge than average maturity. |
the equity exposure of the Portfolio as a whole. As of June 30, 2019, the duration of the fixed-income portion of the Portfolio was 5.7 years, which was in line with the duration of the Bloomberg Barclays U.S. Aggregate Bond Index.
What specific factors, risks or market forces prompted significant decisions for the fixed-income portion of the Portfolio during the reporting period?
There were no specific factors or risks that prompted changes to the fixed-income portion of the Portfolio during the reporting period. That said, throughout the same period credit spreads continued to tighten after having widened by over 150 basis points in the fourth quarter of 2018. (A basis point is oneone-hundredth of a percentage point.) Based on spreads tightening we reduced the Portfolio’s exposure to bank loans and investment-grade credit. In their place, we methodically added securitized assets, such as commercial mortgage-backed securities and asset-backed securities, to the fixed-income portion of the Portfolio to reduce volatility and increase diversification. Additionally, we reduced the fixed-income portion of the Portfolio’s position in U.S. Treasury securities in favor of agency mortgages to pick up some incremental yield.
During the reporting period, which market segments were the strongest positive contributors to the absolute performance of the fixed-income portion of the Portfolio and which market segments were particularly weak?
The strongest positive contributor to the absolute performance of the fixed-income portion of the Portfolio was spread product, specifically investment-grade credit, high-yield corporate bonds, bank loans and emerging-market debt. Emerging markets benefited from renewed risk appetites sparked by dovish central banks.
Securitized assets, including residential mortgage-backed securities and consumer-related asset-backed securities, provided the fixed-income portion of the Portfolio with positive returns
during the reporting period. However, returns from those securities, which generally feature relatively high credit ratings and short durations, lagged the Bloomberg Barclays U.S. Aggregate Bond Index.
Did the fixed-income portion of the Portfolio make any significant purchases or sales during the reporting period?
Among agency mortgages, the fixed-income portion of the Portfolio increased its holdings of bonds that offered an incremental yield pick up compared to U.S. Treasury securities and very short investment-grade credits (those with maturities within one year). While we reduced the fixed-income portion of the Portfolio’s position in U.S. Treasury securities, the effect of duration remained roughly consistent as we sold shorter-term Treasury bonds and shifted the Portfolio’s positions toward the longer end of the yield curve.
How did sector weightings change in the fixed-income portion of the Portfolio during the reporting period?
During the reporting period, we trimmed the fixed-income portion of the Portfolio’s exposure to U.S. Treasury securities,high-yield bonds and bank loans. We increased exposure to agency mortgages and, to a lesser degree, securitized assets such as asset-backed securities and commercial mortgage-backed securities.
How was the fixed-income portion of the Portfolio positioned at the end of the reporting period?
As of June 30, 2019, the fixed-income portion of the Portfolio held overweight positions relative to the Bloomberg Barclays U.S. Aggregate Bond Index in investment-grade corporate bonds, high-yield bonds and bank loans. As of the same date, the fixed-income portion of the Portfolio held underweight exposure relative to the Index in U.S. Treasury securities.
The opinions expressed are those of the portfolio managers as of the date of this report and are subject to change. There is no guarantee that any forecasts will come to pass. This material does not constitute investment advice and is not intended as an endorsement of any specific investment.
Not all MainStay VP Portfolios and/or share classes are available under all policies.
| | |
| 10 | | MainStay VP Income Builder Portfolio |
Portfolio of InvestmentsJune 30, 2019 (Unaudited)
| | | | | | | | |
| | | Principal
Amount | | | Value | |
| Long-Term Bonds 54.5%† | |
| Asset-Backed Securities 1.3% | | | | | | | | |
Auto Floor Plan Asset-Backed Securities 0.4% | |
Ford Credit Floorplan Master Owner Trust
Series 2018-4, Class A
4.06%, due 11/15/30 | | $ | 930,000 | | | $ | 997,368 | |
Navistar Financial Dealer Note Master Owner Trust II
Series 2018-1, Class A
3.06% (1 Month LIBOR + 0.63%), due 9/25/23 (a)(b) | | | 1,090,000 | | | | 1,092,149 | |
| | | | | | | | |
| | | | | | | 2,089,517 | |
| | | | | | | | |
Automobile Asset-Backed Securities 0.4% | |
Toyota Auto Loan Extended Note Trust
Series 2019-1A, Class A
2.56%, due 11/25/31 (a) | | | 755,000 | | | | 763,848 | |
Volkswagen Auto Loan Enhanced Trust
Series 2018-1, Class A4
3.15%, due 7/22/24 | | | 945,000 | | | | 966,365 | |
World Omni Auto Receivables Trust
Series 2019-A, Class A3
3.04%, due 5/15/24 | | | 665,000 | | | | 680,068 | |
| | | | | | | | |
| | | | | | | 2,410,281 | |
| | | | | | | | |
Credit Cards 0.1% | |
Discover Card Execution Note Trust
Series 2019-A1, Class A1
3.04%, due 7/15/24 | | | 685,000 | | | | 701,625 | |
| | | | | | | | |
|
Home Equity 0.0%‡ | |
JPMorgan Mortgage Acquisition Trust
Series 2007-HE1, Class AF1
2.53% (1 Month LIBOR + 0.10%), due 3/25/47 (b) | | | 162,532 | | | | 116,821 | |
MASTR Asset-Backed Securities Trust
Series 2006-HE4, Class A1
2.48% (1 Month LIBOR + 0.05%), due 11/25/36 (b) | | | 234,155 | | | | 108,699 | |
| | | | | | | | |
| | | | | | | 225,520 | |
| | | | | | | | |
Other Asset-Backed Securities 0.4% | |
Daimler Trucks Retail Trust
Series 2019-1, Class A3
2.77%, due 8/15/22 (a) | | | 850,000 | | | | 857,720 | |
Verizon Owner Trust | | | | | | | | |
Series 2018-1A, Class A1A
2.82%, due 9/20/22 (a) | | | 685,000 | | | | 689,767 | |
Series 2019-A, Class A1A
2.93%, due 9/20/23 | | | 735,000 | | | | 747,942 | |
| | | | | | | | |
| | | | | | | 2,295,429 | |
| | | | | | | | |
| | | | | | | | |
| | | Principal
Amount | | | Value | |
Student Loans 0.0%‡ | |
KeyCorp Student Loan Trust
Series 2000-A, Class A2
2.971% (3 Month LIBOR + 0.32%), due 5/25/29 (b) | | $ | 60,830 | | | $ | 60,571 | |
| | | | | | | | |
Total Asset-Backed Securities
(Cost $7,686,689) | | | | | | | 7,782,943 | |
| | | | | | | | |
|
| Corporate Bonds 30.6% | |
Aerospace & Defense 0.1% | |
Harris Corp.
4.40%, due 6/15/28 | | | 810,000 | | | | 885,049 | |
| | | | | | | | |
|
Agriculture 0.3% | |
Altria Group, Inc.
3.80%, due 2/14/24 | | | 1,300,000 | | | | 1,355,145 | |
JBS Investments II GmbH
7.00%, due 1/15/26 (Austria) (a) | | | 460,000 | | | | 498,180 | |
| | | | | | | | |
| | | | | | | 1,853,325 | |
| | | | | | | | |
Airlines 0.9% | |
American Airlines Group, Inc.
4.625%, due 3/1/20 (a) | | | 1,400,000 | | | | 1,408,750 | |
Continental Airlines, Inc.
Series 2009-2, Class 2,
Pass Through Trust
7.25%, due 5/10/21 | | | 255,494 | | | | 259,174 | |
Delta Air Lines, Inc.
Series 2019-1, Class AA
3.204%, due 10/25/25 | | | 920,000 | | | | 952,787 | |
Northwest Airlines, Inc.
Series 2007-1, Class A
7.027%, due 5/1/21 | | | 931,505 | | | | 944,266 | |
U.S. Airways Group, Inc. | | | | | | | | |
Series 2012-1, Class A
5.90%, due 4/1/26 | | | 669,154 | | | | 737,475 | |
Series 2010-1, Class A
6.25%, due 10/22/24 | | | 362,645 | | | | 394,703 | |
United Airlines, Inc. | | | | | | | | |
Series 2014-2, Class B
4.625%, due 3/3/24 | | | 336,268 | | | | 346,054 | |
Series 2007-1, Pass Through Trust
6.636%, due 1/2/24 | | | 441,383 | | | | 468,837 | |
| | | | | | | | |
| | | | | | | 5,512,046 | |
| | | | | | | | |
Auto Manufacturers 0.8% | |
Daimler Finance North America LLC
3.115% (3 Month LIBOR + 0.55%),
due 5/4/21 (Germany) (a)(b) | | | 685,000 | | | | 685,113 | |
Ford Motor Credit Co. LLC | | | | | | | | |
4.25%, due 9/20/22 | | | 305,000 | | | | 312,815 | |
5.875%, due 8/2/21 | | | 150,000 | | | | 158,169 | |
| | | | | | |
The notes to the financial statements are an integral part of,
and should be read in conjunction with, the financial statements. | | | | | 11 | |
Portfolio of InvestmentsJune 30, 2019 (Unaudited) (continued)
| | | | | | | | |
| | | Principal
Amount | | | Value | |
| Corporate Bonds (continued) | |
Auto Manufacturers (continued) | |
General Motors Financial Co., Inc. | | | | | | | | |
3.15%, due 6/30/22 | | $ | 320,000 | | | $ | 321,955 | |
3.45%, due 4/10/22 | | | 1,500,000 | | | | 1,521,256 | |
Toyota Motor Credit Corp.
2.572% (3 Month LIBOR + 0.17%),
due 9/18/20 (b) | | | 1,765,000 | | | | 1,766,540 | |
| | | | | | | | |
| | | | | | | 4,765,848 | |
| | | | | | | | |
Banks 8.7% | |
Bank of America Corp. | | | | | | | | |
2.738%, due 1/23/22 (c) | | | 1,150,000 | | | | 1,155,160 | |
3.004%, due 12/20/23 (c) | | | 734,000 | | | | 747,466 | |
3.458%, due 3/15/25 (c) | | | 615,000 | | | | 638,406 | |
3.499%, due 5/17/22 (c) | | | 1,635,000 | | | | 1,666,509 | |
3.50%, due 4/19/26 | | | 150,000 | | | | 157,077 | |
3.705%, due 4/24/28 (c) | | | 555,000 | | | | 583,140 | |
4.078%, due 4/23/40 (c) | | | 785,000 | | | | 837,122 | |
4.20%, due 8/26/24 | | | 325,000 | | | | 345,475 | |
6.30%, due 3/10/26 (c)(d) | | | 735,000 | | | | 820,480 | |
BB&T Corp. | | | | | | | | |
3.05%, due 6/20/22 | | | 615,000 | | | | 628,201 | |
5.25%, due 11/1/19 | | | 930,000 | | | | 938,423 | |
Citibank N.A. | | | | | | | | |
2.125%, due 10/20/20 | | | 1,615,000 | | | | 1,612,222 | |
3.40%, due 7/23/21 | | | 1,340,000 | | | | 1,368,519 | |
Citigroup, Inc. | | | | | | | | |
3.352%, due 4/24/25 (c) | | | 780,000 | | | | 805,724 | |
3.40%, due 5/1/26 | | | 255,000 | | | | 263,938 | |
3.668%, due 7/24/28 (c) | | | 430,000 | | | | 448,753 | |
3.70%, due 1/12/26 | | | 545,000 | | | | 573,721 | |
3.98%, due 3/20/30 (c) | | | 930,000 | | | | 993,312 | |
4.05%, due 7/30/22 | | | 105,000 | | | | 109,561 | |
5.30%, due 5/6/44 | | | 436,000 | | | | 518,807 | |
6.625%, due 6/15/32 | | | 190,000 | | | | 245,509 | |
Citizens Financial Group, Inc.
4.30%, due 12/3/25 | | | 1,190,000 | | | | 1,259,067 | |
Discover Bank
8.70%, due 11/18/19 | | | 795,000 | | | | 812,622 | |
Goldman Sachs Group, Inc. | | | | | | | | |
2.905%, due 7/24/23 (c) | | | 310,000 | | | | 312,998 | |
2.908%, due 6/5/23 (c) | | | 285,000 | | | | 288,065 | |
3.625%, due 1/22/23 | | | 1,330,000 | | | | 1,379,813 | |
3.688% (3 Month LIBOR + 1.17%),
due 5/15/26 (b) | | | 815,000 | | | | 803,594 | |
5.25%, due 7/27/21 | | | 1,295,000 | | | | 1,368,755 | |
6.75%, due 10/1/37 | | | 159,000 | | | | 207,964 | |
HSBC Holdings PLC
3.973%, due 5/22/30 (United Kingdom) (c) | | | 465,000 | | | | 485,719 | |
| | | | | | | | |
| | | Principal
Amount | | | Value | |
Banks (continued) | |
Huntington Bancshares, Inc.
3.15%, due 3/14/21 | | $ | 1,295,000 | | | $ | 1,311,049 | |
JPMorgan Chase & Co. (c) | | | | | | | | |
3.207%, due 4/1/23 | | | 1,540,000 | | | | 1,571,706 | |
3.54%, due 5/1/28 | | | 800,000 | | | | 832,720 | |
Lloyds Banking Group PLC (United Kingdom) | | | | | | | | |
4.582%, due 12/10/25 | | | 508,000 | | | | 530,082 | |
4.65%, due 3/24/26 | | | 1,075,000 | | | | 1,122,394 | |
Morgan Stanley | | | | | | | | |
3.125%, due 1/23/23 | | | 1,560,000 | | | | 1,595,204 | |
4.875%, due 11/1/22 | | | 495,000 | | | | 529,733 | |
5.00%, due 11/24/25 | | | 1,150,000 | | | | 1,273,138 | |
5.45%, due 10/15/29 (c)(d) | | | 645,000 | | | | 643,388 | |
6.25%, due 8/9/26 | | | 881,000 | | | | 1,057,174 | |
7.25%, due 4/1/32 | | | 1,300,000 | | | | 1,831,483 | |
PNC Bank N.A.
2.55%, due 12/9/21 (e) | | | 815,000 | | | | 821,772 | |
PNC Financial Services Group, Inc.
3.45%, due 4/23/29 | | | 1,200,000 | | | | 1,262,503 | |
Royal Bank of Scotland Group PLC (United Kingdom) | | | | | | | | |
4.892%, due 5/18/29 (c) | | | 605,000 | | | | 646,050 | |
6.00%, due 12/19/23 | | | 70,000 | | | | 76,233 | |
Santander UK Group Holdings PLC (United Kingdom) | | | | | | | | |
3.571%, due 1/10/23 | | | 790,000 | | | | 803,741 | |
3.823%, due 11/3/28 (c) | | | 475,000 | | | | 479,755 | |
State Street Corp.
2.55%, due 8/18/20 | | | 915,000 | | | | 919,066 | |
Toronto-Dominion Bank (Canada) | | | | | | | | |
1.80%, due 7/13/21 | | | 1,535,000 | | | | 1,523,784 | |
3.15%, due 9/17/20 | | | 1,620,000 | | | | 1,639,160 | |
U.S. Bank N.A.
2.812% (3 Month LIBOR + 0.29%),
due 5/21/21 (b) | | | 1,300,000 | | | | 1,300,787 | |
Wells Fargo Bank N.A. | | | | | | | | |
2.40%, due 1/15/20 | | | 1,610,000 | | | | 1,610,484 | |
2.60%, due 1/15/21 | | | 985,000 | | | | 989,016 | |
3.55%, due 8/14/23 | | | 1,015,000 | | | | 1,059,399 | |
Westpac Banking Corp. (Australia) | | | | | | | | |
2.798% (3 Month LIBOR + 0.28%),
due 5/15/20 (b) | | | 700,000 | | | | 701,320 | |
4.875%, due 11/19/19 (e) | | | 1,935,000 | | | | 1,954,162 | |
| | | | | | | | |
| | | | | | | 50,461,425 | |
| | | | | | | | |
Beverages 0.4% | |
Anheuser-Busch InBev Worldwide,
Inc. (Belgium) | | | | | | | | |
4.15%, due 1/23/25 | | | 250,000 | | | | 270,806 | |
4.75%, due 1/23/29 | | | 495,000 | | | | 561,927 | |
| | | | |
| 12 | | MainStay VP Income Builder Portfolio | | The notes to the financial statements are an integral part of,
and should be read in conjunction with, the financial statements. |
| | | | | | | | |
| | | Principal
Amount | | | Value | |
| Corporate Bonds (continued) | |
Beverages (continued) | |
Constellation Brands, Inc.
2.00%, due 11/7/19 | | $ | 680,000 | | | $ | 678,493 | |
Diageo Capital PLC
2.76% (3 Month LIBOR + 0.24%), due 5/18/20 (United Kingdom) (b) | | | 950,000 | | | | 950,556 | |
| | | | | | | | |
| | | | | | | 2,461,782 | |
| | | | | | | | |
Biotechnology 0.5% | |
Biogen, Inc.
3.625%, due 9/15/22 | | | 1,240,000 | | | | 1,279,905 | |
Celgene Corp.
3.625%, due 5/15/24 | | | 1,400,000 | | | | 1,469,694 | |
| | | | | | | | |
| | | | | | | 2,749,599 | |
| | | | | | | | |
Building Materials 0.5% | |
Cemex S.A.B. de C.V.
3.125%, due 3/19/26 (Mexico) (a) | | | EUR 1,515,000 | | | | 1,762,450 | |
Standard Industries, Inc.
5.375%, due 11/15/24 (a) | | $ | 1,000,000 | | | | 1,035,000 | |
| | | | | | | | |
| | | | | | | 2,797,450 | |
| | | | | | | | |
Chemicals 0.6% | |
Air Liquide Finance S.A.
1.75%, due 9/27/21 (France) (a) | | | 610,000 | | | | 602,596 | |
Braskem Netherlands Finance B.V.
4.50%, due 1/10/28 (Netherlands) (a) | | | 1,490,000 | | | | 1,507,135 | |
Huntsman International LLC
4.50%, due 5/1/29 | | | 731,000 | | | | 754,471 | |
Mexichem S.A.B. de C.V.
4.00%, due 10/4/27 (Mexico) (a) | | | 625,000 | | | | 621,881 | |
| | | | | | | | |
| | | | | | | 3,486,083 | |
| | | | | | | | |
Commercial Services 0.2% | |
Herc Holdings, Inc.
5.50%, due 7/15/27 (a) | | | 710,000 | | | | 714,438 | |
Herc Rentals, Inc.
7.75%, due 6/1/24 (a)(e) | | | 542,000 | | | | 574,086 | |
| | | | | | | | |
| | | | | | | 1,288,524 | |
| | | | | | | | |
Computers 0.5% | |
Apple, Inc. | | | | | | | | |
1.55%, due 8/4/21 | | | 545,000 | | | | 539,726 | |
2.75%, due 1/13/25 | | | 715,000 | | | | 730,958 | |
Dell International LLC / EMC Corp.
5.30%, due 10/1/29 (a) | | | 838,000 | | | | 883,085 | |
Hewlett Packard Enterprise Co.
2.10%, due 10/4/19 (a) | | | 750,000 | | | | 748,948 | |
| | | | | | | | |
| | | | | | | 2,902,717 | |
| | | | | | | | |
Consumer Services 0.1% | |
Allied Universal Holdco. LLC
6.625%, due 7/15/26 (a) | | | 395,000 | | | | 400,925 | |
| | | | | | | | |
| | | | | | | | |
| | | Principal
Amount | | | Value | |
Cosmetics & Personal Care 0.2% | |
Unilever Capital Corp.
1.80%, due 5/5/20 (United Kingdom) | | $ | 1,100,000 | | | $ | 1,095,861 | |
| | | | | | | | |
|
Diversified Financial Services 1.7% | |
AerCap Ireland Capital DAC / AerCap Global Aviation Trust (Ireland) | | | | | | | | |
4.45%, due 12/16/21 | | | 285,000 | | | | 295,922 | |
4.625%, due 10/30/20 | | | 1,600,000 | | | | 1,640,650 | |
Air Lease Corp. | | | | | | | | |
2.125%, due 1/15/20 | | | 730,000 | | | | 728,248 | |
2.75%, due 1/15/23 | | | 500,000 | | | | 499,854 | |
3.50%, due 1/15/22 | | | 340,000 | | | | 348,174 | |
4.25%, due 9/15/24 | | | 420,000 | | | | 444,133 | |
Ally Financial, Inc. | | | | | | | | |
3.875%, due 5/21/24 | | | 310,000 | | | | 317,362 | |
8.00%, due 11/1/31 | | | 530,000 | | | | 700,506 | |
Capital One Bank USA N.A.
8.80%, due 7/15/19 | | | 775,000 | | | | 776,689 | |
Capital One Financial Corp.
4.20%, due 10/29/25 | | | 165,000 | | | | 173,284 | |
Caterpillar Financial Services Corp. | | | | | | | | |
2.698% (3 Month LIBOR + 0.18%), due 5/15/20 (b) | | | 830,000 | | | | 830,905 | |
2.90%, due 3/15/21 | | | 1,735,000 | | | | 1,754,990 | |
Peachtree Corners Funding Trust
3.976%, due 2/15/25 (a) | | | 425,000 | | | | 442,417 | |
Synchrony Financial
4.50%, due 7/23/25 | | | 825,000 | | | | 866,110 | |
| | | | | | | | |
| | | | | | | 9,819,244 | |
| | | | | | | | |
Electric 1.4% | |
AEP Transmission Co. LLC
3.10%, due 12/1/26 | | | 850,000 | | | | 863,666 | |
CMS Energy Corp. | | | | | | | | |
3.875%, due 3/1/24 | | | 550,000 | | | | 576,092 | |
5.05%, due 3/15/22 | | | 430,000 | | | | 457,537 | |
Connecticut Light & Power Co.
4.00%, due 4/1/48 | | | 450,000 | | | | 491,970 | |
Consolidated Edison, Inc.
2.00%, due 3/15/20 | | | 435,000 | | | | 433,550 | |
Duquesne Light Holdings, Inc. (a) | | | | | | | | |
3.616%, due 8/1/27 | | | 865,000 | | | | 869,848 | |
6.40%, due 9/15/20 | | | 925,000 | | | | 964,834 | |
Entergy Louisiana LLC
4.00%, due 3/15/33 | | | 790,000 | | | | 871,607 | |
Evergy, Inc.
5.292%, due 6/15/22 (f) | | | 500,000 | | | | 534,131 | |
Public Service Electric & Gas Co.
3.00%, due 5/15/27 | | | 800,000 | | | | 814,359 | |
Puget Energy, Inc.
5.625%, due 7/15/22 | | | 350,000 | | | | 375,490 | |
| | | | | | |
The notes to the financial statements are an integral part of,
and should be read in conjunction with, the financial statements. | | | | | 13 | |
Portfolio of InvestmentsJune 30, 2019 (Unaudited) (continued)
| | | | | | | | |
| | | Principal
Amount | | | Value | |
| Corporate Bonds (continued) | |
Electric (continued) | |
Southern California Edison Co.
3.70%, due 8/1/25 | | $ | 330,000 | | | $ | 341,222 | |
WEC Energy Group, Inc.
4.631% (3 Month LIBOR + 2.113%), due 5/15/67 (b) | | | 480,000 | | | | 396,000 | |
| | | | | | | | |
| | | | | | | 7,990,306 | |
| | | | | | | | |
Environmental Controls 0.2% | |
Republic Services, Inc.
4.75%, due 5/15/23 | | | 580,000 | | | | 626,072 | |
Waste Management, Inc.
2.40%, due 5/15/23 | | | 810,000 | | | | 812,746 | |
| | | | | | | | |
| | | | | | | 1,438,818 | |
| | | | | | | | |
Food 1.1% | |
Kerry Group Financial Services Unlimited Co.
3.20%, due 4/9/23 (Ireland) (a) | | | 1,290,000 | | | | 1,301,686 | |
Mondelez International Holdings Netherlands B.V.
2.00%, due 10/28/21 (Netherlands) (a) | | | 1,110,000 | | | | 1,099,791 | |
Nestle Holdings, Inc.
3.10%, due 9/24/21 (a) | | | 1,615,000 | | | | 1,648,581 | |
Smithfield Foods, Inc. (a) | | | | | | | | |
2.70%, due 1/31/20 | | | 605,000 | | | | 603,743 | |
3.35%, due 2/1/22 | | | 565,000 | | | | 563,593 | |
Tyson Foods, Inc.
3.95%, due 8/15/24 | | | 965,000 | | | | 1,023,219 | |
| | | | | | | | |
| | | | | | | 6,240,613 | |
| | | | | | | | |
Gas 0.1% | |
Southern California Gas Co.
4.30%, due 1/15/49 | | | 325,000 | | | | 358,496 | |
| | | | | | | | |
|
Health Care—Products 0.5% | |
Abbott Laboratories
3.40%, due 11/30/23 | | | 535,000 | | | | 557,799 | |
Becton Dickinson & Co. | | | | | | | | |
4.669%, due 6/6/47 | | | 335,000 | | | | 375,314 | |
3.70%, due 6/6/27 | | | 551,000 | | | | 575,342 | |
Stryker Corp.
2.625%, due 3/15/21 | | | 1,220,000 | | | | 1,225,255 | |
| | | | | | | | |
| | | | | | | 2,733,710 | |
| | | | | | | | |
Health Care—Services 0.0%‡ | |
Cigna Holding Co.
4.375%, due 12/15/20 | | | 135,000 | | | | 137,996 | |
| | | | | | | | |
|
Holding Company—Diversified 0.1% | |
CK Hutchison International (17) II, Ltd.
3.25%, due 9/29/27 (Hong Kong) (a) | | | 925,000 | | | | 937,081 | |
| | | | | | | | |
| | | | | | | | |
| | | Principal
Amount | | | Value | |
Home Builders 0.2% | |
Lennar Corp.
4.50%, due 11/15/19 | | $ | 200,000 | | | $ | 200,750 | |
MDC Holdings, Inc.
5.625%, due 2/1/20 | | | 1,100,000 | | | | 1,108,250 | |
| | | | | | | | |
| | | | | | | 1,309,000 | |
| | | | | | | | |
Insurance 2.0% | |
Alterra Finance LLC
6.25%, due 9/30/20 | | | 75,000 | | | | 78,221 | |
AXA Equitable Holdings, Inc.
5.00%, due 4/20/48 | | | 830,000 | | | | 856,436 | |
Jackson National Life Global Funding (a) | | | | | | | | |
2.20%, due 1/30/20 | | | 1,295,000 | | | | 1,294,012 | |
2.931% (3 Month LIBOR + 0.48%), due 6/11/21 (b) | | | 1,895,000 | | | | 1,899,573 | |
Liberty Mutual Group, Inc.
4.25%, due 6/15/23 (a) | | | 295,000 | | | | 311,861 | |
MassMutual Global Funding II (a) | | | | | | | | |
2.50%, due 10/17/22 | | | 1,270,000 | | | | 1,279,961 | |
2.95%, due 1/11/25 | | | 365,000 | | | | 372,965 | |
Metropolitan Life Global Funding I
1.75%, due 9/19/19 (a) | | | 735,000 | | | | 733,868 | |
Oil Insurance, Ltd.
5.301% (3 Month LIBOR + 2.982%), due 9/30/19 (Bermuda) (a)(b)(d) | | | 580,000 | | | | 559,616 | |
Pricoa Global Funding I
2.55%, due 11/24/20 (a) | | | 765,000 | | | | 767,972 | |
Principal Life Global Funding II
2.375%, due 11/21/21 (a) | | | 1,470,000 | | | | 1,470,708 | |
Protective Life Corp.
8.45%, due 10/15/39 | | | 725,000 | | | | 1,080,104 | |
Prudential Financial, Inc.
5.625%, due 6/15/43 (c) | | | 560,000 | | | | 592,178 | |
Voya Financial, Inc.
3.65%, due 6/15/26 | | | 310,000 | | | | 317,650 | |
| | | | | | | | |
| | | | | | | 11,615,125 | |
| | | | | | | | |
Internet 0.4% | |
Expedia Group, Inc. | | | | | | | | |
3.80%, due 2/15/28 | | | 157,000 | | | | 159,809 | |
5.00%, due 2/15/26 | | | 22,000 | | | | 23,963 | |
GrubHub Holdings, Inc.
5.50%, due 7/1/27 (a) | | | 375,000 | | | | 384,889 | |
Tencent Holdings, Ltd. (China) (a) | | | | | | | | |
3.595%, due 1/19/28 | | | 440,000 | | | | 449,241 | |
3.925%, due 1/19/38 | | | 675,000 | | | | 680,143 | |
Weibo Corp.
3.50%, due 7/5/24 | | | 465,000 | | | | 466,929 | |
| | | | | | | | |
| | | | | | | 2,164,974 | |
| | | | | | | | |
| | | | |
| 14 | | MainStay VP Income Builder Portfolio | | The notes to the financial statements are an integral part of,
and should be read in conjunction with, the financial statements. |
| | | | | | | | |
| | | Principal
Amount | | | Value | |
| Corporate Bonds (continued) | |
Iron & Steel 0.3% | |
ArcelorMittal
4.55%, due 3/11/26 (Luxembourg) | | $ | 800,000 | | | $ | 845,600 | |
Vale Overseas, Ltd. (Brazil) | | | | | | | | |
6.25%, due 8/10/26 | | | 435,000 | | | | 494,138 | |
6.875%, due 11/21/36 | | | 305,000 | | | | 366,381 | |
| | | | | | | | |
| | | | | | | 1,706,119 | |
| | | | | | | | |
Lodging 0.5% | |
Marriott International, Inc. | | | | | | | | |
2.30%, due 1/15/22 | | | 890,000 | | | | 887,063 | |
3.60%, due 4/15/24 | | | 920,000 | | | | 958,900 | |
7.15%, due 12/1/19 | | | 125,000 | | | | 127,214 | |
Sands China, Ltd. (Macao) | | | | | | | | |
4.60%, due 8/8/23 | | | 355,000 | | | | 373,118 | |
5.125%, due 8/8/25 | | | 460,000 | | | | 493,083 | |
| | | | | | | | |
| | | | | | | 2,839,378 | |
| | | | | | | | |
Machinery—Diversified 0.4% | |
CNH Industrial Capital LLC | | | | | | | | |
4.20%, due 1/15/24 | | | 545,000 | | | | 567,154 | |
4.875%, due 4/1/21 | | | 1,445,000 | | | | 1,494,910 | |
John Deere Capital Corp.
3.65%, due 10/12/23 | | | 135,000 | | | | 142,750 | |
| | | | | | | | |
| | | | | | | 2,204,814 | |
| | | | | | | | |
Media 0.9% | |
Comcast Corp. | | | | | | | | |
3.45%, due 10/1/21 | | | 1,945,000 | | | | 2,001,246 | |
4.70%, due 10/15/48 | | | 555,000 | | | | 650,023 | |
Grupo Televisa S.A.B.
5.25%, due 5/24/49 (Mexico) | | | 480,000 | | | | 498,003 | |
Sky, Ltd.
3.75%, due 9/16/24 (United Kingdom) (a) | | | 340,000 | | | | 361,283 | |
Time Warner Entertainment Co., L.P.
8.375%, due 3/15/23 | | | 355,000 | | | | 420,673 | |
UPCB Finance IV, Ltd.
5.375%, due 1/15/25 (Netherlands) (a) | | | 765,000 | | | | 786,275 | |
Virgin Media Secured Finance PLC
5.25%, due 1/15/26 (United Kingdom) (a) | | | 750,000 | | | | 768,532 | |
| | | | | | | | |
| | | | | | | 5,486,035 | |
| | | | | | | | |
Metal Fabricate & Hardware 0.3% | |
Precision Castparts Corp.
3.25%, due 6/15/25 | | | 1,455,000 | | | | 1,520,704 | |
| | | | | | | | |
|
Mining 0.1% | |
Anglo American Capital PLC
4.875%, due 5/14/25 (United Kingdom) (a) | | | 455,000 | | | | 490,283 | |
| | | | | | | | |
| | | | | | | | |
| | | Principal
Amount | | | Value | |
Miscellaneous—Manufacturing 0.3% | |
Siemens Financieringsmaatschappij N.V.
2.70%, due 3/16/22 (Germany) (a) | | $ | 760,000 | | | $ | 767,977 | |
Textron Financial Corp.
4.253% (3 Month LIBOR + 1.735%), due 2/15/67 (a)(b) | | | 1,295,000 | | | | 1,010,100 | |
| | | | | | | | |
| | | | | | | 1,778,077 | |
| | | | | | | | |
Oil & Gas 0.6% | |
Gazprom Via Gaz Capital S.A.
7.288%, due 8/16/37 (Luxembourg) (a) | | | 640,000 | | | | 807,439 | |
Marathon Petroleum Corp.
5.125%, due 12/15/26 | | | 450,000 | | | | 491,627 | |
Petrobras Global Finance B.V.
7.375%, due 1/17/27 (Brazil) | | | 680,000 | | | | 777,920 | |
Valero Energy Corp. | | | | | | | | |
3.65%, due 3/15/25 | | | 1,000,000 | | | | 1,037,462 | |
6.625%, due 6/15/37 | | | 415,000 | | | | 525,770 | |
| | | | | | | | |
| | | | | | | 3,640,218 | |
| | | | | | | | |
Packaging & Containers 0.3% | |
Reynolds Group Issuer, Inc. / Reynolds Group Issuer LLC (New Zealand) | | | | | | | | |
5.125%, due 7/15/23 (a) | | | 1,060,000 | | | | 1,079,875 | |
5.75%, due 10/15/20 | | | 823,742 | | | | 825,801 | |
| | | | | | | | |
| | | | | | | 1,905,676 | |
| | | | | | | | |
Pharmaceuticals 0.7% | |
Allergan Funding SCS
3.45%, due 3/15/22 | | | 1,005,000 | | | | 1,026,120 | |
Bausch Health Cos., Inc.
5.75%, due 8/15/27 (a) | | | 465,000 | | | | 488,706 | |
Bristol-Myers Squibb Co.
3.40%, due 7/26/29 (a) | | | 690,000 | | | | 722,389 | |
GlaxoSmithKline Capital PLC
2.878% (3 Month LIBOR + 0.35%), due 5/14/21 (United Kingdom) (b) | | | 1,260,000 | | | | 1,262,621 | |
Takeda Pharmaceutical Co., Ltd.
3.80%, due 11/26/20 (Japan) (a) | | | 400,000 | | | | 407,257 | |
| | | | | | | | |
| | | | | | | 3,907,093 | |
| | | | | | | | |
Pipelines 0.5% | |
Enterprise Products Operating LLC | | | | | | | | |
3.125%, due 7/31/29 | | | 630,000 | | | | 631,361 | |
4.20%, due 1/31/50 | | | 160,000 | | | | 163,605 | |
Southern Natural Gas Co. LLC
4.80%, due 3/15/47 (a) | | | 315,000 | | | | 329,871 | |
Spectra Energy Partners, L.P.
4.75%, due 3/15/24 | | | 795,000 | | | | 861,062 | |
Transcontinental Gas Pipe Line Co. LLC
4.60%, due 3/15/48 | | | 840,000 | | | | 891,342 | |
| | | | | | | | |
| | | | | | | 2,877,241 | |
| | | | | | | | |
Real Estate Investment Trusts 1.0% | |
American Tower Corp.
3.375%, due 10/15/26 | | | 1,080,000 | | | | 1,098,634 | |
| | | | | | |
The notes to the financial statements are an integral part of,
and should be read in conjunction with, the financial statements. | | | | | 15 | |
Portfolio of InvestmentsJune 30, 2019 (Unaudited) (continued)
| | | | | | | | |
| | | Principal
Amount | | | Value | |
| Corporate Bonds (continued) | |
Real Estate Investment Trusts (continued) | |
Crown Castle International Corp. | | | | | | | | |
3.40%, due 2/15/21 | | $ | 920,000 | | | $ | 932,567 | |
5.25%, due 1/15/23 | | | 1,290,000 | | | | 1,402,710 | |
Digital Realty Trust, L.P. | | | | | | | | |
2.75%, due 2/1/23 | | | 45,000 | | | | 44,955 | |
3.70%, due 8/15/27 | | | 170,000 | | | | 174,720 | |
GLP Capital, L.P. / GLP Financing II, Inc.
4.875%, due 11/1/20 | | | 1,045,000 | | | | 1,063,141 | |
Kilroy Realty, L.P.
3.45%, due 12/15/24 | | | 720,000 | | | | 740,792 | |
Welltower, Inc.
4.00%, due 6/1/25 | | | 310,000 | | | | 326,619 | |
| | | | | | | | |
| | | | | | | 5,784,138 | |
| | | | | | | | |
Retail 1.0% | |
Alimentation Couche-Tard, Inc.
3.55%, due 7/26/27 (Canada) (a) | | | 1,035,000 | | | | 1,055,937 | |
CVS Health Corp. | | | | | | | | |
4.00%, due 12/5/23 | | | 1,355,000 | | | | 1,418,166 | |
4.78%, due 3/25/38 | | | 400,000 | | | | 417,270 | |
CVS Pass-Through Trust
5.789%, due 1/10/26 (a)(g) | | | 31,801 | | | | 34,902 | |
McDonald’s Corp.
3.35%, due 4/1/23 | | | 1,085,000 | | | | 1,126,140 | |
O’Reilly Automotive, Inc.
3.55%, due 3/15/26 | | | 1,000,000 | | | | 1,031,087 | |
Starbucks Corp.
4.45%, due 8/15/49 | | | 475,000 | | | | 520,137 | |
| | | | | | | | |
| | | | | | | 5,603,639 | |
| | | | | | | | |
Semiconductors 0.3% | |
Broadcom, Inc.
3.125%, due 10/15/22 (a) | | | 945,000 | | | | 950,950 | |
NXP B.V. / NXP Funding LLC
4.625%, due 6/15/22 (Netherlands) (a) | | | 590,000 | | | | 618,025 | |
| | | | | | | | |
| | | | | | | 1,568,975 | |
| | | | | | | | |
Software 0.3% | |
Fiserv, Inc. | | | | | | | | |
2.75%, due 7/1/24 | | | 325,000 | | | | 327,896 | |
3.20%, due 7/1/26 | | | 205,000 | | | | 209,240 | |
salesforce.com, Inc. | | | | | | | | |
3.25%, due 4/11/23 | | | 510,000 | | | | 529,320 | |
3.70%, due 4/11/28 | | | 690,000 | | | | 743,914 | |
| | | | | | | | |
| | | | | | | 1,810,370 | |
| | | | | | | | |
Telecommunications 1.4% | |
AT&T, Inc. | | | | | | | | |
3.616% (3 Month LIBOR + 1.18%),
due 6/12/24 (b) | | | 755,000 | | | | 764,493 | |
4.35%, due 3/1/29 | | | 320,000 | | | | 344,666 | |
4.90%, due 8/15/37 | | | 670,000 | | | | 722,150 | |
| | | | | | | | |
| | | Principal
Amount | | | Value | |
Telecommunications (continued) | |
CommScope Technologies LLC
6.00%, due 6/15/25 (a) | | $ | 475,000 | | | $ | 445,175 | |
CommScope, Inc.
5.00%, due 6/15/21 (a) | | | 985,000 | | | | 982,538 | |
Crown Castle Towers LLC
4.241%, due 7/15/48 (a) | | | 990,000 | | | | 1,064,347 | |
Sprint Spectrum Co. LLC / Sprint Spectrum Co. II LLC / Sprint Spectrum Co. III LLC
4.738%, due 9/20/29 (a) | | | 1,545,000 | | | | 1,602,937 | |
Telefonica Emisiones SAU (Spain) | | | | | | | | |
5.134%, due 4/27/20 | | | 800,000 | | | | 816,350 | |
5.462%, due 2/16/21 | | | 175,000 | | | | 183,373 | |
Verizon Communications, Inc.
3.618% (3 Month LIBOR + 1.10%), due 5/15/25 (b) | | | 985,000 | | | | 997,657 | |
| | | | | | | | |
| | | | | | | 7,923,686 | |
| | | | | | | | |
Textiles 0.2% | |
Cintas Corp. No 2
3.70%, due 4/1/27 | | | 1,065,000 | | | | 1,133,982 | |
| | | | | | | | |
|
Transportation 0.0%‡ | |
XPO Logistics, Inc.
6.50%, due 6/15/22 (a) | | | 277,000 | | | | 282,540 | |
| | | | | | | | |
Total Corporate Bonds
(Cost $173,350,742) | | | | | | | 177,868,965 | |
| | | | | | | | |
|
| Foreign Bonds 0.1% | |
Banks 0.1% | |
Barclays Bank PLC
Series Reg S
10.00%, due 5/21/21 (United Kingdom) | | | GBP 525,000 | | | | 766,073 | |
| | | | | | | | |
Total Foreign Bonds
(Cost $845,752) | | | | | | | 766,073 | |
| | | | | | | | |
|
| Loan Assignments 1.7% (b) | |
Advertising 0.1% | |
Outfront Media Capital LLC
2017 Term Loan B
4.421% (1 Month LIBOR + 2.00%), due 3/18/24 | | $ | 800,000 | | | | 797,166 | |
| | | | | | | | |
|
Commercial Services 0.1% | |
Global Payments Inc.
2018 Term Loan B3
4.152% (1 Month LIBOR + 1.75%), due 4/21/23 | | | 469,200 | | | | 468,446 | |
| | | | | | | | |
| | | | |
| 16 | | MainStay VP Income Builder Portfolio | | The notes to the financial statements are an integral part of,
and should be read in conjunction with, the financial statements. |
| | | | | | | | |
| | | Principal
Amount | | | Value | |
| Loan Assignments (continued) | |
Electronics 0.1% | |
Worldpay, LLC
2018 1st Lien Term Loan B4
4.132% (1 Week LIBOR + 1.75%), due 8/9/24 | | $ | 273,504 | | | $ | 273,224 | |
2018 1st Lien Term Loan B4
4.151% (1 Month LIBOR + 1.75%), due 8/9/24 | | | 516,496 | | | | 515,968 | |
| | | | | | | | |
| | | | | | | 789,192 | |
| | | | | | | | |
Environmental Controls 0.3% | |
Advanced Disposal Services, Inc. Term Loan B3
4.635% (1 Week LIBOR + 2.25%), due 11/10/23 | | | 1,645,603 | | | | 1,642,404 | |
| | | | | | | | |
|
Hotels, Motels, Inns & Gaming 0.2% | |
Las Vegas Sands LLC
2018 Term Loan B
4.152% (1 Month LIBOR + 1.75%), due 3/27/25 | | | 1,372,625 | | | | 1,361,862 | |
| | | | | | | | |
|
Household Products & Wares 0.1% | |
Prestige Brands, Inc.
Term Loan B4
4.402% (1 Month LIBOR + 2.00%), due 1/26/24 | | | 550,091 | | | | 546,652 | |
| | | | | | | | |
|
Insurance 0.2% | |
MPH Acquisition Holdings LLC
2016 Term Loan B
5.08% (3 Month LIBOR + 2.75%), due 6/7/23 | | | 1,171,470 | | | | 1,118,265 | |
| | | | | | | | |
|
Media 0.1% | |
Virgin Media Bristol LLC
Term Loan K
4.894% (1 Month LIBOR + 2.50%), due 1/15/26 | | | 390,000 | | | | 388,429 | |
| | | | | | | | |
|
Software 0.2% | |
First Data Corp.
2024 Term Loan
4.404% (1 Month LIBOR + 2.00%), due 4/26/24 | | | 922,931 | | | | 921,905 | |
| | | | | | | | |
|
Telecommunications 0.2% | |
Level 3 Financing, Inc.
2017 Term Loan B
4.652% (1 Month LIBOR + 2.25%), due 2/22/24 | | | 1,065,000 | | | | 1,055,460 | |
| | | | | | | | |
| | | | | | | | |
| | | Principal
Amount | | | Value | |
Transportation 0.1% | |
XPO Logistics, Inc.
2018 Term Loan B
4.402% (1 Month LIBOR + 2.00%), due 2/24/25 | | $ | 565,000 | | | $ | 559,928 | |
| | | | | | | | |
Total Loan Assignments
(Cost $9,733,525) | | | | | | | 9,649,709 | |
| | | | | | | | |
|
| Mortgage-Backed Securities 6.4% | |
Agency Collateral (Collateralized Mortgage Obligations) 4.1% | |
Federal Home Loan Mortgage Corporation | | | | | | | | |
REMIC Series 4691, Class HA
2.50%, due 6/15/40 | | | 945,518 | | | | 941,386 | |
Series 2019-1, Class A1
3.50%, due 5/25/29 | | | 699,535 | | | | 727,579 | |
REMIC Series 4818, Class BD
3.50%, due 3/15/45 | | | 922,827 | | | | 956,652 | |
REMIC Series 4884, Class BA
3.50%, due 6/15/48 | | | 802,655 | | | | 835,166 | |
REMIC Series 4888, Class BA
3.50%, due 9/15/48 | | | 634,736 | | | | 660,814 | |
REMIC Series 4877, Class BE
3.50%, due 11/15/48 | | | 1,232,799 | | | | 1,292,403 | |
REMIC Series 4877, Class AT
3.50%, due 11/15/48 | | | 845,388 | | | | 887,020 | |
Federal National Mortgage Association | | | | | | | | |
REMICSeries 2013-77, Class CY
3.00%, due 7/25/43 | | | 746,000 | | | | 764,242 | |
Series 2019-25, Class PA
3.00%, due 5/25/48 | | | 776,041 | | | | 792,624 | |
Series 2019-13, Class PE
3.00%, due 3/25/49 | | | 988,995 | | | | 1,011,592 | |
REMICSeries 2019-13, Class CA
3.50%, due 4/25/49 | | | 1,489,303 | | | | 1,557,394 | |
Government National Mortgage Association | | | | | | | | |
Series 2017-123, Class AB
2.50%, due 1/20/47 | | | 786,431 | | | | 785,786 | |
REMICSeries 2014-91, Class MA
3.00%, due 1/16/40 | | | 889,060 | | | | 911,892 | |
Series 2018-127, Class PB
3.00%, due 9/20/47 | | | 2,062,750 | | | | 2,105,251 | |
Series 2019-29, Class CB
3.00%, due 10/20/48 | | | 719,793 | | | | 733,757 | |
REMICSeries 2019-29, Class AP
3.00%, due 10/20/48 | | | 1,349,112 | | | | 1,363,720 | |
Series 2019-52, Class JL
3.00%, due 11/20/48 | | | 786,404 | | | | 803,367 | |
Series 2019-59, Class KA
3.00%, due 12/20/48 | | | 1,346,864 | | | | 1,379,637 | |
Series 2019-43, Class PL
3.00%, due 4/20/49 | | | 1,576,991 | | | | 1,607,611 | |
| | | | | | |
The notes to the financial statements are an integral part of,
and should be read in conjunction with, the financial statements. | | | | | 17 | |
Portfolio of InvestmentsJune 30, 2019 (Unaudited) (continued)
| | | | | | | | |
| | | Principal
Amount | | | Value | |
| Mortgage-Backed Securities (continued) | |
Agency Collateral (Collateralized Mortgage Obligations) (continued) | |
Government National Mortgage Association (continued) | |
Series 2019-74, Class AT
3.00%, due 6/20/49 | | $ | 1,081,000 | | | $ | 1,106,882 | |
Series 2013-149, Class BA
3.25%, due 8/16/41 | | | 2,447,569 | | | | 2,534,206 | |
| | | | | | | | |
| | | | | | | 23,758,981 | |
| | | | | | | | |
Commercial Mortgage Loans
(Collateralized Mortgage Obligations) 1.6% | |
Bayview Commercial Asset Trust
Series 2006-4A, Class A1
2.66% (1 Month LIBOR + 0.23%), due 12/25/36 (a)(b) | | | 52,438 | | | | 50,990 | |
BX Commercial Mortgage Trust
Series 2018-IND, Class A
3.144% (1 Month LIBOR + 0.75%), due 11/15/35 (a)(b) | | | 791,821 | | | | 792,471 | |
Four Times Square Trust
Series 2006-4TS, Class A
5.401%, due 12/13/28 (a) | | | 451,256 | | | | 467,764 | |
FREMF Mortgage Trust (a)(h) | | | | | | | | |
Series 2013-K33, Class B
3.615%, due 8/25/46 | | | 1,094,000 | | | | 1,136,708 | |
Series 2013-K35, Class B
4.074%, due 8/25/23 | | | 660,000 | | | | 698,566 | |
GS Mortgage Securities Trust
Series 2019-GC40, Class A4
3.16%, due 7/10/52 (g) | | | 788,000 | | | | 812,585 | |
Hawaii Hotel Trust
Series 2019-MAUI, Class A
3.544%, due 5/15/38 (a)(b) | | | 640,000 | | | | 640,605 | |
Hudson Yards Mortgage Trust
Series 2019-30HY, Class A
3.228%, due 7/10/39 (a)(g) | | | 760,000 | | | | 782,116 | |
JP Morgan Chase Commercial Mortgage Securities Trust
Series 2013-C16, Class A4
4.166%, due 12/15/46 | | | 655,000 | | | | 702,122 | |
JPMBB Commercial Mortgage Securities Trust
Series 2015-C28, Class A4
3.227%, due 10/15/48 | | | 900,000 | | | | 933,815 | |
Wells Fargo Commercial Mortgage Trust (a)(h) | | | | | | | | |
Series 2018-1745, Class A
3.874%, due 6/15/36 | | | 1,150,000 | | | | 1,232,021 | |
Series 2018-AUS, Class A
4.194%, due 8/17/36 | | | 1,150,000 | | | | 1,257,567 | |
| | | | | | | | |
| | | | | | | 9,507,330 | |
| | | | | | | | |
| | | | | | | | |
| | | Principal
Amount | | | Value | |
Whole Loan (Collateralized Mortgage Obligations) 0.7% | |
American Tower Trust I
Series 2013, Class 2A
3.07%, due 3/15/48 (a) | | $ | 825,000 | | | $ | 838,408 | |
Chase Home Lending Mortgage Trust
Series 2019-ATR1, Class A4
4.00%, due 4/25/49 (a)(i) | | | 1,016,671 | | | | 1,034,370 | |
JP Morgan Mortgage Trust (a)(i) | | | | | | | | |
Series 2019-2, Class A4
4.00%, due 8/25/49 | | | 723,298 | | | | 735,419 | |
Series 2019-3, Class A3
4.00%, due 9/25/49 | | | 689,740 | | | | 704,928 | |
Series 2019-5, Class A4
4.00%, due 11/25/49 | | | 560,000 | | | | 570,603 | |
| | | | | | | | |
| | | | | | | 3,883,728 | |
| | | | | | | | |
Total Mortgage-Backed Securities
(Cost $36,416,548) | | | | | | | 37,150,039 | |
| | | | | | | | |
|
| U.S. Government & Federal Agencies 14.4% | |
Federal Home Loan Mortgage Corporation
(Mortgage Pass-Through Securities) 3.4% | |
3.00%, due 12/1/47 | | | 2,452,779 | | | | 2,478,572 | |
3.50%, due 1/1/48 | | | 4,699,248 | | | | 4,840,773 | |
3.50%, due 9/1/48 | | | 635,737 | | | | 652,011 | |
4.00%, due 2/1/49 | | | 699,990 | | | | 726,454 | |
4.00%, due 3/1/49 | | | 2,283,886 | | | | 2,370,401 | |
4.50%, due 11/1/48 | | | 3,731,678 | | | | 3,948,668 | |
5.00%, due 12/1/44 | | | 1,661,609 | | | | 1,803,859 | |
5.00%, due 12/1/48 | | | 2,542,391 | | | | 2,695,160 | |
| | | | | | | | |
| | | | | | | 19,515,898 | |
| | | | | | | | |
Federal National Mortgage Association
(Mortgage Pass-Through Securities) 7.3% | |
2.50%, due 12/1/37 | | | 1,245,024 | | | | 1,247,393 | |
3.00%, due 10/1/48 | | | 932,461 | | | | 942,469 | |
3.50%, due 3/1/37 | | | 2,037,320 | | | | 2,118,035 | |
3.50%, due 2/1/42 | | | 1,698,899 | | | | 1,761,608 | |
3.50%, due 8/1/46 | | | 2,982,681 | | | | 3,096,876 | |
3.50%, due 1/29/48 TBA (j) | | | 5,306,000 | | | | 5,424,763 | |
4.00%, due 4/1/48 | | | 4,068,980 | | | | 4,230,503 | |
4.00%, due 5/1/48 | | | 1,900,195 | | | | 1,974,566 | |
4.00%, due 9/1/48 | | | 2,820,314 | | | | 2,953,103 | |
4.00%, due 1/1/49 | | | 714,180 | | | | 751,953 | |
4.00%, due 2/1/49 | | | 998,323 | | | | 1,035,402 | |
4.00%, due 2/1/49 | | | 555,390 | | | | 576,093 | |
4.00%, due 4/1/49 | | | 5,899,541 | | | | 6,109,716 | |
4.50%, due 7/1/48 | | | 3,326,947 | | | | 3,498,313 | |
4.50%, due 1/1/49 | | | 4,578,893 | | | | 4,808,487 | |
5.00%, due 9/1/33 | | | 1,974,515 | | | | 2,143,853 | |
6.00%, due 4/1/37 | | | 11,356 | | | | 12,126 | |
| | | | | | | | |
| | | | | | | 42,685,259 | |
| | | | | | | | |
| | | | |
| 18 | | MainStay VP Income Builder Portfolio | | The notes to the financial statements are an integral part of,
and should be read in conjunction with, the financial statements. |
| | | | | | | | |
| | | Principal
Amount | | | Value | |
| U.S. Government & Federal Agencies (continued) | |
United States Treasury Bonds 2.3% | | | | | | | | |
3.00%, due 2/15/49 | | $ | 4,250,000 | | | $ | 4,667,695 | |
4.375%, due 11/15/39 | | | 6,085,000 | | | | 8,090,673 | |
5.00%, due 5/15/37 | | | 490,000 | | | | 690,862 | |
| | | | | | | | |
| | | | | | | 13,449,230 | |
| | | | | | | | |
United States Treasury Notes 0.5% | | | | | | | | |
2.375%, due 5/15/29 (e) | | | 2,595,000 | | | | 2,681,669 | |
| | | | | | | | |
|
United States Treasury Inflation—Indexed Notes 0.9% (k) | |
0.75%, due 7/15/28 | | | 1,654,039 | | | | 1,723,263 | |
0.875%, due 1/15/29 | | | 3,435,333 | | | | 3,615,897 | |
| | | | | | | | |
| | | | | | | 5,339,160 | |
| | | | | | | | |
Total U.S. Government & Federal Agencies
(Cost $81,146,036) | | | | | | | 83,671,216 | |
| | | | | | | | |
TotalLong-Term Bonds
(Cost $309,179,292) | | | | | | | 316,888,945 | |
| | | | | | | | |
| | |
| | | | | | | | |
| | | Shares | | | | |
| Common Stocks 42.3% | |
Aerospace & Defense 0.9% | |
BAE Systems PLC (United Kingdom) | | | 441,007 | | | | 2,774,520 | |
Lockheed Martin Corp. | | | 6,148 | | | | 2,235,044 | |
| | | | | | | | |
| | | | | | | 5,009,564 | |
| | | | | | | | |
Air Freight & Logistics 0.7% | |
Deutsche Post A.G., Registered (Germany) | | | 73,631 | | | | 2,419,676 | |
United Parcel Service, Inc., Class B | | | 15,245 | | | | 1,574,351 | |
| | | | | | | | |
| | | | | | | 3,994,027 | |
| | | | | | | | |
Auto Components 0.4% | |
Cie Generale des Etablissements Michelin SCA (France) | | | 19,204 | | | | 2,435,903 | |
| | | | | | | | |
|
Banks 2.3% | |
BB&T Corp. | | | 36,348 | | | | 1,785,777 | |
Commonwealth Bank of Australia (Australia) | | | 26,448 | | | | 1,537,044 | |
Lloyds Banking Group PLC (United Kingdom) | | | 2,620,690 | | | | 1,883,397 | |
People’s United Financial, Inc. | | | 85,494 | | | | 1,434,589 | |
Royal Bank of Canada (Canada) | | | 23,181 | | | | 1,842,195 | |
Svenska Handelsbanken A.B., Class A (Sweden) | | | 140,919 | | | | 1,394,296 | |
Wells Fargo & Co. | | | 32,427 | | | | 1,534,446 | |
Westpac Banking Corp. (Australia) | | | 99,982 | | | | 1,990,655 | |
| | | | | | | | |
| | | | | | | 13,402,399 | |
| | | | | | | | |
Beverages 0.7% | |
Coca-Cola Co. | | | 35,461 | | | | 1,805,674 | |
PepsiCo., Inc. | | | 16,088 | | | | 2,109,620 | |
| | | | | | | | |
| | | | | | | 3,915,294 | |
| | | | | | | | |
| | | | | | | | |
| | |
| | | Shares | | | Value | |
Biotechnology 0.3% | |
AbbVie, Inc. | | | 26,805 | | | $ | 1,949,260 | |
| | | | | | | | |
|
Capital Markets 0.8% | |
BlackRock, Inc. | | | 3,369 | | | | 1,581,072 | |
CME Group, Inc. | | | 7,917 | | | | 1,536,769 | |
Macquarie Group, Ltd. (Australia) | | | 16,172 | | | | 1,423,622 | |
| | | | | | | | |
| | | | | | | 4,541,463 | |
| | | | | | | | |
Chemicals 1.4% | |
BASF S.E. (Germany) | | | 31,361 | | | | 2,279,425 | |
Dow, Inc. | | | 38,577 | | | | 1,902,232 | |
LyondellBasell Industries N.V., Class A | | | 19,541 | | | | 1,683,066 | |
Nutrien, Ltd. (Canada) | | | 39,336 | | | | 2,102,903 | |
| | | | | | | | |
| | | | | | | 7,967,626 | |
| | | | | | | | |
Commercial Services & Supplies 0.0%‡ | |
Quad/Graphics, Inc. (e) | | | 6 | | | | 47 | |
| | | | | | | | |
|
Communications Equipment 0.5% | |
Cisco Systems, Inc. | | | 49,380 | | | | 2,702,567 | |
| | | | | | | | |
|
Construction & Engineering 0.4% | |
Vinci S.A. (France) | | | 21,394 | | | | 2,190,901 | |
| | | | | | | | |
|
Diversified Telecommunication Services 2.8% | |
AT&T, Inc. | | | 113,796 | | | | 3,813,304 | |
BCE, Inc. (Canada) | | | 98,669 | | | | 4,489,099 | |
Singapore Telecommunications, Ltd. (Singapore) | | | 627,096 | | | | 1,622,200 | |
TELUS Corp. (Canada) | | | 68,325 | | | | 2,525,763 | |
Verizon Communications, Inc. | | | 73,449 | | | | 4,196,141 | |
| | | | | | | | |
| | | | | | | 16,646,507 | |
| | | | | | | | |
Electric Utilities 3.5% | |
American Electric Power Co., Inc. | | | 26,280 | | | | 2,312,903 | |
Duke Energy Corp. | | | 48,517 | | | | 4,281,140 | |
Entergy Corp. | | | 40,515 | | | | 4,170,209 | |
FirstEnergy Corp. | | | 92,233 | | | | 3,948,495 | |
PPL Corp. | | | 85,747 | | | | 2,659,014 | |
Terna Rete Elettrica Nazionale S.p.A. (Italy) | | | 485,846 | | | | 3,093,751 | |
| | | | | | | | |
| | | | | | | 20,465,512 | |
| | | | | | | | |
Electrical Equipment 0.9% | |
Eaton Corp. PLC | | | 37,904 | | | | 3,156,645 | |
Emerson Electric Co. | | | 31,081 | | | | 2,073,724 | |
| | | | | | | | |
| | | | | | | 5,230,369 | |
| | | | | | | | |
Equity Real Estate Investment Trusts 1.9% | |
Iron Mountain, Inc. | | | 78,840 | | | | 2,467,692 | |
Public Storage | | | 7,075 | | | | 1,685,053 | |
Unibail-Rodamco-Westfield (France) | | | 15,498 | | | | 2,321,801 | |
Welltower, Inc. | | | 53,823 | | | | 4,388,189 | |
| | | | | | | | |
| | | | | | | 10,862,735 | |
| | | | | | | | |
| | | | | | |
The notes to the financial statements are an integral part of,
and should be read in conjunction with, the financial statements. | | | | | 19 | |
Portfolio of InvestmentsJune 30, 2019 (Unaudited) (continued)
| | | | | | | | |
| | |
| | | Shares | | | Value | |
| Common Stocks (continued) | |
Food Products 0.7% | |
Nestle S.A., Registered (Switzerland) | | | 20,552 | | | $ | 2,127,623 | |
Orkla ASA (Norway) | | | 251,514 | | | | 2,231,369 | |
| | | | | | | | |
| | | | | | | 4,358,992 | |
| | | | | | | | |
Gas Utilities 0.9% | |
Naturgy Energy Group S.A. (Spain) | | | 59,804 | | | | 1,647,716 | |
Snam S.p.A. (Italy) | | | 706,279 | | | | 3,510,394 | |
| | | | | | | | |
| | | | | | | 5,158,110 | |
| | | | | | | | |
Hotels, Restaurants & Leisure 0.8% | |
Las Vegas Sands Corp. | | | 43,126 | | | | 2,548,316 | |
McDonald’s Corp. | | | 10,276 | | | | 2,133,914 | |
| | | | | | | | |
| | | | | | | 4,682,230 | |
| | | | | | | | |
Household Durables 0.3% | |
Leggett & Platt, Inc. | | | 42,536 | | | | 1,632,106 | |
| | | | | | | | |
|
Household Products 0.8% | |
Kimberly-Clark Corp. | | | 18,109 | | | | 2,413,567 | |
Procter & Gamble Co. | | | 18,783 | | | | 2,059,556 | |
| | | | | | | | |
| | | | | | | 4,473,123 | |
| | | | | | | | |
Industrial Conglomerates 0.5% | |
3M Co. | | | 8,023 | | | | 1,390,707 | |
Siemens A.G., Registered (Germany) | | | 12,971 | | | | 1,542,779 | |
| | | | | | | | |
| | | | | | | 2,933,486 | |
| | | | | | | | |
Insurance 4.1% | |
Allianz S.E., Registered (Germany) | | | 19,304 | | | | 4,653,523 | |
Arthur J. Gallagher & Co. | | | 17,098 | | | | 1,497,614 | |
Assicurazioni Generali S.p.A. (Italy) | | | 136,875 | | | | 2,577,408 | |
AXA S.A. (France) | | | 176,802 | | | | 4,644,061 | |
MetLife, Inc. | | | 54,497 | | | | 2,706,866 | |
Muenchener Rueckversicherungs-Gesellschaft A.G., Registered (Germany) | | | 18,867 | | | | 4,734,825 | |
SCOR S.E. (France) | | | 34,366 | | | | 1,506,832 | |
Tokio Marine Holdings, Inc. (Japan) | | | 32,600 | | | | 1,632,494 | |
| | | | | | | | |
| | | | | | | 23,953,623 | |
| | | | | | | | |
IT Services 0.3% | |
International Business Machines Corp. | | | 12,634 | | | | 1,742,229 | |
| | | | | | | | |
|
Media 0.0%‡ | |
ION Media Networks, Inc. (g)(l)(m)(n)(o) | | | 8 | | | | 5,397 | |
| | | | | | | | |
|
Multi-Utilities 1.7% | |
Ameren Corp. | | | 26,027 | | | | 1,954,888 | |
Dominion Energy, Inc. | | | 39,925 | | | | 3,087,001 | |
National Grid PLC (United Kingdom) | | | 297,842 | | | | 3,161,365 | |
WEC Energy Group, Inc. | | | 22,585 | | | | 1,882,912 | |
| | | | | | | | |
| | | | | | | 10,086,166 | |
| | | | | | | | |
| | | | | | | | |
| | |
| | | Shares | | | Value | |
Multiline Retail 0.3% | |
Target Corp. | | | 21,851 | | | $ | 1,892,515 | |
| | | | | | | | |
|
Oil, Gas & Consumable Fuels 4.3% | |
Chevron Corp. | | | 18,289 | | | | 2,275,883 | |
Enterprise Products Partners, L.P. | | | 109,584 | | | | 3,163,690 | |
Exxon Mobil Corp. | | | 36,303 | | | | 2,781,899 | |
Magellan Midstream Partners, L.P. | | | 33,018 | | | | 2,113,152 | |
Occidental Petroleum Corp. | | | 41,947 | | | | 2,109,095 | |
Pembina Pipeline Corp. (Canada) | | | 73,529 | | | | 2,737,229 | |
Phillips 66 | | | 24,540 | | | | 2,295,472 | |
Royal Dutch Shell PLC, Class A, Sponsored ADR (Netherlands) | | | 60,730 | | | | 3,951,701 | |
TOTAL S.A. (France) | | | 69,912 | | | | 3,917,212 | |
| | | | | | | | |
| | | | | | | 25,345,333 | |
| | | | | | | | |
Personal Products 0.5% | |
Unilever PLC (United Kingdom) | | | 50,707 | | | | 3,151,829 | |
| | | | | | | | |
|
Pharmaceuticals 4.3% | |
AstraZeneca PLC, Sponsored ADR (United Kingdom) | | | 72,860 | | | | 3,007,661 | |
GlaxoSmithKline PLC (United Kingdom) | | | 155,445 | | | | 3,112,323 | |
Johnson & Johnson | | | 12,887 | | | | 1,794,901 | |
Merck & Co., Inc. | | | 26,859 | | | | 2,252,127 | |
Novartis A.G., Registered (Switzerland) | | | 36,135 | | | | 3,301,826 | |
Pfizer, Inc. | | | 80,104 | | | | 3,470,105 | |
Roche Holding A.G. (Switzerland) | | | 9,608 | | | | 2,703,173 | |
Sanofi (France) | | | 35,377 | | | | 3,053,646 | |
Takeda Pharmaceutical Co., Ltd. (Japan) | | | 60,100 | | | | 2,131,079 | |
| | | | | | | | |
| | | | | | | 24,826,841 | |
| | | | | | | | |
Semiconductors & Semiconductor Equipment 1.2% | |
Broadcom, Inc. | | | 4,801 | | | | 1,382,016 | |
Intel Corp. | | | 30,239 | | | | 1,447,541 | |
Taiwan Semiconductor Manufacturing Co., Ltd., Sponsored ADR (Taiwan) | | | 34,534 | | | | 1,352,697 | |
Texas Instruments, Inc. | | | 22,489 | | | | 2,580,837 | |
| | | | | | | | |
| | | | | | | 6,763,091 | |
| | | | | | | | |
Software 0.7% | |
Micro Focus International PLC (United Kingdom) | | | 76,482 | | | | 2,004,727 | |
Microsoft Corp. | | | 15,852 | | | | 2,123,534 | |
| | | | | | | | |
| | | | | | | 4,128,261 | |
| | | | | | | | |
Technology Hardware, Storage & Peripherals 0.3% | |
Samsung Electronics Co., Ltd., GDR
(Republic of Korea) (a) | | | 1,860 | | | | 1,891,620 | |
| | | | | | | | |
|
Textiles, Apparel & Luxury Goods 0.3% | |
Hanesbrands, Inc. | | | 89,959 | | | | 1,549,094 | |
| | | | | | | | |
| | | | |
| 20 | | MainStay VP Income Builder Portfolio | | The notes to the financial statements are an integral part of,
and should be read in conjunction with, the financial statements. |
| | | | | | | | |
| | |
| | | Shares | | | Value | |
| Common Stocks (continued) | |
Tobacco 2.1% | |
Altria Group, Inc. | | | 70,080 | | | $ | 3,318,288 | |
British American Tobacco PLC (United Kingdom) | | | 68,395 | | | | 2,387,731 | |
British American Tobacco PLC, Sponsored ADR (United Kingdom) | | | 24,511 | | | | 854,699 | |
Imperial Brands PLC (United Kingdom) | | | 118,345 | | | | 2,775,595 | |
Philip Morris International, Inc. | | | 39,167 | | | | 3,075,785 | |
| | | | | | | | |
| | | | | | | 12,412,098 | |
| | | | | | | | |
Trading Companies & Distributors 0.3% | |
Watsco, Inc. | | | 10,107 | | | | 1,652,798 | |
| | | | | | | | |
|
Wireless Telecommunication Services 0.4% | |
Rogers Communications, Inc., Class B (Canada) | | | 44,880 | | | | 2,402,419 | |
| | | | | | | | |
Total Common Stocks
(Cost $225,756,772) | | | | | | | 246,355,535 | |
| | | | | | | | |
|
| Short-Term Investments 4.4% | |
Affiliated Investment Company 3.9% | |
MainStay U.S. Government Liquidity Fund, 2.03% (p) | | | 22,815,158 | | | | 22,815,158 | |
| | | | | | | | |
|
Unaffiliated Investment Company 0.5% | |
State Street Navigator Securities Lending Government Money Market Portfolio, 2.33% (p)(q) | | | 2,708,289 | | | | 2,708,289 | |
| | | | | | | | |
TotalShort-Term Investments
(Cost $25,523,447) | | | | | | | 25,523,447 | |
| | | | | | | | |
Total Investments
(Cost $560,459,511) | | | 101.2 | % | | | 588,767,927 | |
Other Assets, Less Liabilities | | | (1.2 | ) | | | (6,849,402 | ) |
Net Assets | | | 100.0 | % | | $ | 581,918,525 | |
| † | Percentages indicated are based on Portfolio net assets. |
| ‡ | Less than one-tenth of a percent. |
| (a) | May be sold to institutional investors only under Rule 144A or securities offered pursuant to Section 4(a)(2) of the Securities Act of 1933, as amended. |
| (b) | Floating rate—Rate shown was the rate in effect as of June 30, 2019. |
| (c) | Fixed to floating rate—Rate shown was the rate in effect as of June 30, 2019. |
| (d) | Securities are perpetual and, thus, do not have a predetermined maturity date. The date shown, if applicable, reflects the next call date. |
| (e) | All or a portion of this security was held on loan. As of June 30, 2019, the aggregate market value of securities on loan was $2,653,818 and the Portfolio received cash collateral with a value of $2,708,289 (See Note 2(M)). |
| (f) | Step coupon—Rate shown was the rate in effect as of June 30, 2019. |
| (g) | Fair valued security—Represents fair value as measured in good faith under procedures approved by the Board of Trustees. As of June 30, 2019, the total market value of fair valued securities was $1,635,000, which represented 0.3% of the Portfolio’s net assets. |
| (h) | Collateral strip rate—A bond whose interest was based on the weighted net interest rate of the collateral. The coupon rate adjusts periodically based on a predetermined schedule. Rate shown was the rate in effect as of June 30, 2019. |
| (i) | Coupon rate may change based on changes of the underlying collateral or prepayments of principal. The coupon rate shown represents the rate at period end. |
| (j) | TBA—Securities purchased on a forward commitment basis with an approximate principal amount and maturity date. The actual principal amount and maturity date will be determined upon settlement. As of June 30, 2019, the total net market value of these securities was $5,424,763, which represented 0.9% of the Portfolio’s net assets. All or a portion of these securities are a part of a mortgage dollar roll agreement. |
| (k) | Treasury Inflation Protected Security—Pays a fixed rate of interest on a principal amount that is continuously adjusted for inflation based on the Consumer Price Index-Urban Consumers. |
| (l) | Security in which significant unobservable inputs (Level 3) were used in determining fair value. |
| (m) | Illiquid security—As of June 30, 2019, the total market value of the security deemed illiquid under procedures approved by the Board of Trustees was $5,397, which represented less than one-tenth of a percent of the Portfolio’s net assets. |
| (o) | Non-income producing security. |
| (p) | Current yield as of June 30, 2019. |
| (q) | Represents security purchased with cash collateral received for securities on loan. |
| | | | | | |
The notes to the financial statements are an integral part of,
and should be read in conjunction with, the financial statements. | | | | | 21 | |
Portfolio of InvestmentsJune 30, 2019 (Unaudited) (continued)
Foreign Currency Forward Contracts
As of June 30, 2019, the Portfolio held the following foreign currency forward contracts1:
| | | | | | | | | | | | | | | | | | |
Currency Purchased | | | Currency Sold | | | Counterparty | | Settlement
Date | | Unrealized
Appreciation
(Depreciation) | |
| JPY | | | 2,059,000,000 | | | USD | | | 18,550,887 | | | JPMorgan Chase Bank N.A. | | 8/1/19 | | $ | 591,033 | |
| USD | | | 16,976,603 | | | GBP | | | 13,060,000 | | | JPMorgan Chase Bank N.A. | | 8/1/19 | | | 366,034 | |
| | | | | | | | | | | | | | | | | | |
| Total unrealized appreciation | | | 957,067 | |
| | | | | | | | | | | | | | | | | | |
| USD | | | 6,711,059 | | | CAD | | | 9,000,000 | | | JPMorgan Chase Bank N.A. | | 8/1/19 | | | (166,413 | ) |
| USD | | | 24,800,710 | | | EUR | | | 22,000,000 | | | JPMorgan Chase Bank N.A. | | 8/1/19 | | | (277,677 | ) |
| | | | | | | | | | | | | | | | | | |
| Total unrealized depreciation | | | (444,090 | ) |
| | | | | | | | | | | | | | | | | | |
| Net unrealized appreciation | | $ | 512,977 | |
| | | | | | | | | | | | | | | | | | |
| 1. | Foreign Currency Forward Contracts are subject to limitations such that they cannot be “sold or repurchased,” although the Portfolio would be able to exit the transaction through other means, such as through the execution of an offsetting transaction. |
Futures Contracts
As of June 30, 2019, the Portfolio held the following futures contracts1:
| | | | | | | | | | | | | | | | | | | | |
Type | | Number of
Contracts | | | Expiration
Date | | | Value at
Trade Date | | | Current
Notional
Amount | | | Unrealized
Appreciation
(Depreciation)2 | |
Long Contracts | | | | | | | | | | | | | | | | | | | | |
| | | | | |
10-Year United States Treasury Note | | | 153 | | | | September 2019 | | | $ | 19,063,191 | | | $ | 19,579,219 | | | $ | 516,028 | |
| Nikkei 225 | | | 210 | | | | September 2019 | | | | 20,428,050 | | | | 20,748,736 | | | | 320,686 | |
| S&P 500 Index Mini | | | 415 | | | | September 2019 | | | | 60,143,742 | | | | 61,092,150 | | | | 948,408 | |
| United States Treasury Bond | | | 11 | | | | September 2019 | | | | 1,651,869 | | | | 1,711,531 | | | | 59,662 | |
| United States Treasury Ultra Bond | | | 126 | | | | September 2019 | | | | 21,238,101 | | | | 22,372,875 | | | | 1,134,774 | |
| | | | | | | | | | | | | | | | | | | | |
| Total Long Contracts | | | | | | | | | | | | | | | | | | | 2,979,558 | |
| | | | | | | | | | | | | | | | | | | | |
Short Contracts | | | | | | | | | | | | | |
| | | | | |
2-Year United States Treasury Note | | | (11 | ) | | | September 2019 | | | | (2,347,961 | ) | | | (2,366,977 | ) | | | (19,016 | ) |
| 10-Year United States Treasury Ultra Note | | | (33 | ) | | | September 2019 | | | | (4,399,969 | ) | | | (4,558,125 | ) | | | (158,156 | ) |
| | | | | | | | | | | | | | | | | | | | |
| Total Short Contracts | | | | | | | | | | | | | | | | | | | (177,172 | ) |
| | | | | | | | | | | | | | | | | | | | |
| Net Unrealized Appreciation | | | | | | | | | | | | | | | | | | $ | 2,802,386 | |
| | | | | | | | | | | | | | | | | | | | |
| 1. | As of June 30, 2019, cash in the amount of $4,190,786 was on deposit with a broker or futures commission merchant for futures transactions. |
| 2. | Represents the difference between the value of the contracts at the time they were opened and the value as of June 30, 2019. |
The following abbreviations are used in the preceding pages:
ADR—American Depositary Receipt
CAD—Canadian Dollar
EUR—Euro
GBP—British Pound Sterling
GDR—Global Depositary Receipt
JPY—Japanese Yen
LIBOR—London Interbank Offered Rate
REMIC—Real Estate Mortgage Investment Conduit
USD—United States Dollar
| | | | |
| 22 | | MainStay VP Income Builder Portfolio | | The notes to the financial statements are an integral part of,
and should be read in conjunction with, the financial statements. |
The following is a summary of the fair valuations according to the inputs used as of June 30, 2019, for valuing the Portfolio’s assets and liabilities:
| | | | | | | | | | | | | | | | |
Description | | Quoted
Prices in
Active
Markets for
Identical
Assets
(Level 1) | | | Significant
Other
Observable
Inputs
(Level 2) | | | Significant
Unobservable
Inputs
(Level 3) | | | Total | |
| | | | |
Asset Valuation Inputs | | | | | | | | | | | | | | | | |
| Investments in Securities (a) | | | | | | | | | | | | | | | | |
| Long-Term Bonds | | | | | | | | | | | | | | | | |
Asset-Backed Securities | | $ | — | | | $ | 7,782,943 | | | $ | — | | | $ | 7,782,943 | |
Corporate Bonds | | | — | | | | 177,868,965 | | | | — | | | | 177,868,965 | |
Foreign Bonds | | | — | | | | 766,073 | | | | — | | | | 766,073 | |
Loan Assignments | | | — | | | | 9,649,709 | | | | — | | | | 9,649,709 | |
Mortgage-Backed Securities | | | — | | | | 37,150,039 | | | | — | | | | 37,150,039 | |
U.S. Government & Federal Agencies | | | — | | | | 83,671,216 | | | | — | | | | 83,671,216 | |
| | | | | | | | | | | | | | | | |
| TotalLong-Term Bonds | | | — | | | | 316,888,945 | | | | — | | | | 316,888,945 | |
| | | | | | | | | | | | | | | | |
| Common Stocks (b) | | | 246,350,138 | | | | — | | | | 5,397 | | | | 246,355,535 | |
| Short-Term Investments | | | | | | | | | | | | | | | | |
Affiliated Investment Company | | | 22,815,158 | | | | — | | | | — | | | | 22,815,158 | |
Unaffiliated Investment Company | | | 2,708,289 | | | | — | | | | — | | | | 2,708,289 | |
| | | | | | | | | | | | | | | | |
| TotalShort-Term Investments | | | 25,523,447 | | | | — | | | | — | | | | 25,523,447 | |
| | | | | | | | | | | | | | | | |
| Total Investments in Securities | | | 271,873,585 | | | | 316,888,945 | | | | 5,397 | | | | 588,767,927 | |
| | | | | | | | | | | | | | | | |
| Other Financial Instruments | | | | | | | | | | | | | | | | |
Foreign Currency Forward Contracts (c) | | | — | | | | 957,067 | | | | — | | | | 957,067 | |
Futures Contracts (c) | | | 2,979,558 | | | | — | | | | — | | | | 2,979,558 | |
| | | | | | | | | | | | | | | | |
| Total Other Financial Instruments | | | 2,979,558 | | | | 957,067 | | | | — | | | | 3,936,625 | |
| | | | | | | | | | | | | | | | |
| Total Investments in Securities and Other Financial Instruments | | $ | 274,853,143 | | | $ | 317,846,012 | | | $ | 5,397 | | | $ | 592,704,552 | |
| | | | | | | | | | | | | | | | |
| | | | |
Liability Valuation Inputs | | | | | | | | | | | | | | | | |
| Other Financial Instruments | | | | | | | | | | | | | | | | |
Foreign Currency Forward Contracts (c) | | $ | — | | | $ | (444,090 | ) | | $ | — | | | $ | (444,090 | ) |
Futures Contracts (c) | | | (177,172 | ) | | | — | | | | — | | | | (177,172 | ) |
| | | | | | | | | | | | | | | | |
| Total Other Financial Instruments | | $ | (177,172 | ) | | $ | (444,090 | ) | | $ | — | | | $ | (621,262 | ) |
| | | | | | | | | | | | | | | | |
| (a) | For a complete listing of investments and their industries, see the Portfolio of Investments. |
| (b) | The Level 3 security valued at $5,397 is held in Media within the Common Stocks section of the Portfolio of Investments. |
| (c) | The value listed for these securities reflects unrealized appreciation (depreciation) as shown on the Portfolio of Investments. |
| | | | | | |
The notes to the financial statements are an integral part of,
and should be read in conjunction with, the financial statements. | | | | | 23 | |
Portfolio of InvestmentsJune 30, 2019 (Unaudited) (continued)
The following is a reconciliation of investments in which significant unobservable inputs (Level 3) were used in determining value:
| | | | | | | | | | | | | | | | | | | | | | | | | | | | | | | | | | | | | | | | |
Investments in Securities | | Balance
as of
December 31,
2018 | | | Accrued
Discounts
(Premiums) | | | Realized
Gain
(Loss) | | | Change in
Unrealized
Appreciation
(Depreciation) | | | Purchases | | | Sales (a) | | | Transfers
in to
Level 3 | | | Transfers
out of
Level 3 | | | Balance
as of
June 30,
2019 | | | Change in
Unrealized
Appreciation
(Depreciation)
from
Investments
Still Held at
June 30,
2019 (b) | |
| Long-Term Bonds | | | | | | | | | | | | | | | | | | | | | | | | | | | | | | | | | | | | | | | | |
Loan Assignments | | | | | | | | | | | | | | | | | | | | | | | | | | | | | | | | | | | | | | | | |
Packaging & Containers | | $ | 776,408 | | | $ | 11 | | | $ | (32,053 | ) | | $ | 46,458 | | | $ | — | | | $ | (790,824 | ) | | $ | — | | | $ | — | | | $ | — | | | $ | — | |
Mortgage-Backed Securities | | | | | | | | | | | | | | | | | | | | | | | | | | | | | | | | | | | | | | | | |
Residential Mortgage (Collateralized Mortgage Obligation) | | | 229,645 | | | | — | | | | (27,226 | ) | | | 16,813 | | | | — | | | | (219,232 | ) | | | — | | | | — | | | | — | | | | — | |
Common Stocks | | | | | | | | | | | | | | | | | | | | | | | | | | | | | | | | | | | | | | | | |
Media | | | 4,954 | | | | — | | | | — | | | | 443 | | | | — | | | | — | | | | — | | | | — | | | | 5,397 | | | | 443 | |
| | | | | | | | | | | | | | | | | | | | | | | | | | | | | | | | | | | | | | | | |
| Total | | $ | 1,011,007 | | | $ | 11 | | | $ | (59,279 | ) | | $ | 63,714 | | | $ | — | | | $ | (1,010,056 | ) | | $ | — | | | $ | — | | | $ | 5,397 | | | $ | 443 | |
| | | | | | | | | | | | | | | | | | | | | | | | | | | | | | | | | | | | | | | | |
| (a) | Sales include principal reductions. |
| (b) | Included in “Net change in unrealized appreciation (depreciation) on investments” in the Statement of Operations. |
| | | | |
| 24 | | MainStay VP Income Builder Portfolio | | The notes to the financial statements are an integral part of,
and should be read in conjunction with, the financial statements. |
Statement of Assets and Liabilitiesas of June 30, 2019 (Unaudited)
| | | | |
| Assets | | | | |
Investment in unaffiliated securities, at value
(identified cost $537,644,353) including securities on loan of $2,653,818 | | $ | 565,952,769 | |
Investment in affiliated investment company, at value (identified cost $22,815,158) | | | 22,815,158 | |
Cash collateral on deposit at broker for futures contracts | | | 4,190,786 | |
Cash denominated in foreign currencies (identified cost $147,319) | | | 147,302 | |
Receivables: | | | | |
Dividends and interest | | | 3,372,451 | |
Investment securities sold | | | 2,391,684 | |
Variation margin on futures contracts | | | 341,880 | |
Portfolio shares sold | | | 182,400 | |
Securities lending | | | 6,296 | |
Unrealized appreciation on foreign currency forward contracts | | | 957,067 | |
Other assets | | | 2,729 | |
| | | | |
Total assets | | | 600,360,522 | |
| | | | |
| |
| Liabilities | | | | |
Due to custodian | | | 301,159 | |
Cash collateral received for securities on loan | | | 2,708,289 | |
Payables: | | | | |
Investment securities purchased | | | 14,357,049 | |
Manager (See Note 3) | | | 269,587 | |
Portfolio shares redeemed | | | 156,353 | |
NYLIFE Distributors (See Note 3) | | | 79,995 | |
Professional fees | | | 42,220 | |
Shareholder communication | | | 39,843 | |
Custodian | | | 30,437 | |
Trustees | | | 714 | |
Accrued expenses | | | 12,261 | |
Unrealized depreciation on foreign currency forward contracts | | | 444,090 | |
| | | | |
Total liabilities | | | 18,441,997 | |
| | | | |
Net assets | | $ | 581,918,525 | |
| | | | |
| |
| Composition of Net Assets | | | | |
Shares of beneficial interest outstanding (par value of $.001 per share) unlimited number of shares authorized | | $ | 35,566 | |
Additional paid-in capital | | | 542,892,789 | |
| | | | |
| | | 542,928,355 | |
Total distributable earnings (loss) | | | 38,990,170 | |
| | | | |
Net assets | | $ | 581,918,525 | |
| | | | |
| | | | |
Initial Class | | | | |
Net assets applicable to outstanding shares | | $ | 187,584,040 | |
| | | | |
Shares of beneficial interest outstanding | | | 11,402,190 | |
| | | | |
Net asset value per share outstanding | | $ | 16.45 | |
| | | | |
Service Class | | | | |
Net assets applicable to outstanding shares | | $ | 394,334,485 | |
| | | | |
Shares of beneficial interest outstanding | | | 24,164,082 | |
| | | | |
Net asset value per share outstanding | | $ | 16.32 | |
| | | | |
| | | | | | |
The notes to the financial statements are an integral part of,
and should be read in conjunction with, the financial statements. | | | | | 25 | |
Statement of Operationsfor the six months ended June 30, 2019 (Unaudited)
| | | | |
| Investment Income (Loss) | | | | |
Income | | | | |
Dividends-unaffiliated (a) | | $ | 6,321,621 | |
Interest (b) | | | 5,428,386 | |
Dividends-affiliated | | | 264,774 | |
Securities lending | | | 48,042 | |
| | | | |
Total income | | | 12,062,823 | |
| | | | |
Expenses | | | | |
Manager (See Note 3) | | | 1,596,428 | |
Distribution/Service—Service Class (See Note 3) | | | 470,622 | |
Professional fees | | | 57,187 | |
Shareholder communication | | | 39,695 | |
Custodian | | | 36,742 | |
Trustees | | | 6,957 | |
Miscellaneous | | | 17,394 | |
| | | | |
Total expenses | | | 2,225,025 | |
| | | | |
Net investment income (loss) | | | 9,837,798 | |
| | | | |
|
| Realized and Unrealized Gain (Loss) on Investments, Futures Contracts and Foreign Currency Transactions | |
Net realized gain (loss) on: | | | | |
Unaffiliated investment transactions | | | (155,934 | ) |
Futures transactions | | | 8,488,826 | |
Foreign currency forward transactions | | | 702,418 | |
Foreign currency transactions | | | (23,840 | ) |
| | | | |
Net realized gain (loss) on investments, futures transactions and foreign currency transactions | | | 9,011,470 | |
| | | | |
Net change in unrealized appreciation (depreciation) on: | | | | |
Unaffiliated investments | | | 35,591,619 | |
Futures contracts | | | 4,931,837 | |
Foreign currency forward contracts | | | (245,058 | ) |
Translation of other assets and liabilities in foreign currencies | | | 60,842 | |
| | | | |
Net change in unrealized appreciation (depreciation) on investments, futures contracts and foreign currency transactions | | | 40,339,240 | |
| | | | |
Net realized and unrealized gain (loss) on investments, futures transactions and foreign currency transactions | | | 49,350,710 | |
| | | | |
Net increase (decrease) in net assets resulting from operations | | $ | 59,188,508 | |
| | | | |
| (a) | Dividends recorded net of foreign withholding taxes in the amount of $410,892. |
| (b) | Interest recorded net of foreign withholding taxes in the amount of $591. |
| | | | |
| 26 | | MainStay VP Income Builder Portfolio | | The notes to the financial statements are an integral part of,
and should be read in conjunction with, the financial statements. |
Statements of Changes in Net Assets
for the six months ended June 30, 2019 (Unaudited) and the year ended December 31, 2018
| | | | | | | | |
| | | 2019 | | | 2018 | |
| Increase (Decrease) in Net Assets | |
Operations: | | | | | | | | |
Net investment income (loss) | | $ | 9,837,798 | | | $ | 17,953,134 | |
Net realized gain (loss) on investments, futures contracts and foreign currency transactions | | | 9,011,470 | | | | 2,062,684 | |
Net change in unrealized appreciation (depreciation) on investments, futures contracts and foreign currency transactions | | | 40,339,240 | | | | (52,058,869 | ) |
| | | | |
Net increase (decrease) in net assets resulting from operations | | | 59,188,508 | | | | (32,043,051 | ) |
| | | | |
Distributions to shareholders: | | | | | | | | |
Initial Class | | | (5,406,835 | ) | | | (13,810,543 | ) |
Service Class | | | (10,809,322 | ) | | | (27,695,573 | ) |
| | | | |
Total distributions to shareholders | | | (16,216,157 | ) | | | (41,506,116 | ) |
| | | | |
Capital share transactions: | | | | | | | | |
Net proceeds from sale of shares | | | 23,433,319 | | | | 44,187,935 | |
Net asset value of shares issued to shareholders in reinvestment of dividends and distributions | | | 16,216,157 | | | | 41,506,116 | |
Cost of shares redeemed | | | (40,185,478 | ) | | | (105,059,494 | ) |
| | | | |
Increase (decrease) in net assets derived from capital share transactions | | | (536,002 | ) | | | (19,365,443 | ) |
| | | | |
Net increase (decrease) in net assets | | | 42,436,349 | | | | (92,914,610 | ) |
| | |
| Net Assets | | | | | | | | |
Beginning of period | | | 539,482,176 | | | | 632,396,786 | |
| | | | |
End of period | | $ | 581,918,525 | | | $ | 539,482,176 | |
| | | | |
| | | | | | |
The notes to the financial statements are an integral part of,
and should be read in conjunction with, the financial statements. | | | | | 27 | |
Financial Highlightsselected per share data and ratios
| | | | | | | | | | | | | | | | | | | | | | | | | | | | | | | | | | | |
| | | |
| | | Six months
ended
June 30, | | | | Year ended December 31, |
| | | | | | | |
| Initial Class | | 2019* | | | | 2018 | | 2017 | | 2016 | | 2015 | | 2014 |
| | | | | | | |
Net asset value at beginning of period | | | $ | 15.23 | | | | | | | | | $ | 17.29 | | | | $ | 15.94 | | | | $ | 15.31 | | | | $ | 17.30 | | | | $ | 17.70 | |
| | | | | | | | | | | | | | | | | | | | | | | | | | | | | | | | | | | |
| | | | | | | |
Net investment income (loss) (a) | | | | 0.29 | | | | | | | | | | 0.53 | | | | | 0.49 | | | | | 0.54 | | | | | 0.64 | | | | | 0.80 | |
| | | | | | | |
Net realized and unrealized gain (loss) on investments | | | | 1.40 | | | | | | | | | | (1.49 | ) | | | | 1.62 | | | | | 0.72 | | | | | (1.36 | ) | | | | 0.36 | |
| | | | | | | |
Net realized and unrealized gain (loss) on foreign currency transactions | | | | 0.01 | | | | | | | | | | 0.11 | | | | | (0.14 | ) | | | | 0.14 | | | | | 0.14 | | | | | 0.23 | |
| | | | | | | | | | | | | | | | | | | | | | | | | | | | | | | | | | | |
| | | | | | | |
Total from investment operations | | | | 1.70 | | | | | | | | | | (0.85 | ) | | | | 1.97 | | | | | 1.40 | | | | | (0.58 | ) | | | | 1.39 | |
| | | | | | | | | | | | | | | | | | | | | | | | | | | | | | | | | | | |
| | | | | | | |
| Less dividends and distributions: | | | | | | | | | | | | | | | | | | | | | | | | | | | | | | | | | | | |
| | | | | | | |
From net investment income | | | | (0.48 | ) | | | | | | | | | (0.46 | ) | | | | (0.54 | ) | | | | (0.68 | ) | | | | (0.80 | ) | | | | (1.04 | ) |
| | | | | | | |
From net realized gain on investments | | | | — | | | | | | | | | | (0.75 | ) | | | | (0.08 | ) | | | | (0.09 | ) | | | | (0.61 | ) | | | | (0.75 | ) |
| | | | | | | | | | | | | | | | | | | | | | | | | | | | | | | | | | | |
| | | | | | | |
Total dividends and distributions | | | | (0.48 | ) | | | | | | | | | (1.21 | ) | | | | (0.62 | ) | | | | (0.77 | ) | | | | (1.41 | ) | | | | (1.79 | ) |
| | | | | | | | | | | | | | | | | | | | | | | | | | | | | | | | | | | |
| | | | | | | |
Net asset value at end of period | | | $ | 16.45 | | | | | | | | | $ | 15.23 | | | | $ | 17.29 | | | | $ | 15.94 | | | | $ | 15.31 | | | | $ | 17.30 | |
| | | | | | | | | | | | | | | | | | | | | | | | | | | | | | | | | | | |
| | | | | | | |
Total investment return (b) | | | | 11.23 | % | | | | | | | | | (5.21 | %) | | | | 12.53 | % | | | | 9.30 | % | | | | (3.50 | %) | | | | 8.10 | % |
| | | | | | | |
| Ratios (to average net assets)/Supplemental Data: | | | | | | | | | | | | | | | | | | | | | | | | | | | | | | | | | | | |
| | | | | | | |
Net investment income (loss) | | | | 3.68 | %†† | | | | | | | | | 3.18 | % | | | | 2.91 | % | | | | 3.47 | % | | | | 3.79 | % | | | | 4.44 | % |
| | | | | | | |
Net expenses (c) | | | | 0.63 | %†† | | | | | | | | | 0.62 | % | | | | 0.62 | % | | | | 0.63 | % | | | | 0.63 | % | | | | 0.63 | % |
| | | | | | | |
Interest expense and fees | | | | — | | | | | | | | | | 0.00 | % (d) | | | | 0.01 | % | | | | — | | | | | — | | | | | — | |
| | | | | | | |
Portfolio turnover rate | | | | 33 | % (e) | | | | | | | | | 50 | % (e) | | | | 26 | % | | | | 28 | % | | | | 35 | % | | | | 13 | % |
| | | | | | | |
Net assets at end of period (in 000’s) | | | $ | 187,584 | | | | | | | | | $ | 178,608 | | | | $ | 207,056 | | | | $ | 202,450 | | | | $ | 206,198 | | | | $ | 234,670 | |
| (a) | Per share data based on average shares outstanding during the period. |
| (b) | Total return does not reflect any deduction of sales charges, mortality and expense charges, contract charges or administrative charges. For periods of less than one year, total return is not annualized. |
| (c) | In addition to the fees and expenses which the Portfolio bears directly, it also indirectly bears a pro-rata share of the fees and expenses of the underlying funds in which it invests. Such indirect expenses are not included in the above expense ratios. |
| (e) | The portfolio turnover rates not including mortgage dollar rolls were 30% and 39% for the six months ended June 30, 2019 and for the year ended December 31, 2018, respectively. |
| | | | |
| 28 | | MainStay VP Income Builder Portfolio | | The notes to the financial statements are an integral part of,
and should be read in conjunction with, the financial statements. |
Financial Highlightsselected per share data and ratios
| | | | | | | | | | | | | | | | | | | | | | | | | | | | | | | | | | | |
| | | |
| | | Six months
ended
June 30, | | | | Year ended December 31, |
| | | | | | | |
| Service Class | | 2019* | | | | 2018 | | 2017 | | 2016 | | 2015 | | 2014 |
| | | | | | | |
Net asset value at beginning of period | | | $ | 15.11 | | | | | | | | | $ | 17.17 | | | | $ | 15.83 | | | | $ | 15.21 | | | | $ | 17.20 | | | | $ | 17.57 | |
| | | | | | | | | | | | | | | | | | | | | | | | | | | | | | | | | | | |
| | | | | | | |
Net investment income (loss) (a) | | | | 0.27 | | | | | | | | | | 0.48 | | | | | 0.44 | | | | | 0.50 | | | | | 0.59 | | | | | 0.74 | |
| | | | | | | |
Net realized and unrealized gain (loss) on investments | | | | 1.39 | | | | | | | | | | (1.48 | ) | | | | 1.62 | | | | | 0.72 | | | | | (1.35 | ) | | | | 0.38 | |
| | | | | | | |
Net realized and unrealized gain (loss) on foreign currency transactions | | | | 0.01 | | | | | | | | | | 0.11 | | | | | (0.14 | ) | | | | 0.14 | | | | | 0.14 | | | | | 0.23 | |
| | | | | | | | | | | | | | | | | | | | | | | | | | | | | | | | | | | |
| | | | | | | |
Total from investment operations | | | | 1.67 | | | | | | | | | | (0.89 | ) | | | | 1.92 | | | | | 1.36 | | | | | (0.62 | ) | | | | 1.35 | |
| | | | | | | | | | | | | | | | | | | | | | | | | | | | | | | | | | | |
| | | | | | | |
| Less dividends and distributions: | | | | | | | | | | | �� | | | | | | | | | | | | | | | | | | | | | | | | |
| | | | | | | |
From net investment income | | | | (0.46 | ) | | | | | | | | | (0.42 | ) | | | | (0.50 | ) | | | | (0.65 | ) | | | | (0.76 | ) | | | | (0.97 | ) |
| | | | | | | |
From net realized gain on investments | | | | — | | | | | | | | | | (0.75 | ) | | | | (0.08 | ) | | | | (0.09 | ) | | | | (0.61 | ) | | | | (0.75 | ) |
| | | | | | | | | | | | | | | | | | | | | | | | | | | | | | | | | | | |
| | | | | | | |
Total dividends and distributions | | | | (0.46 | ) | | | | | | | | | (1.17 | ) | | | | (0.58 | ) | | | | (0.74 | ) | | | | (1.37 | ) | | | | (1.72 | ) |
| | | | | | | | | | | | | | | | | | | | | | | | | | | | | | | | | | | |
| | | | | | | |
Net asset value at end of period | | | $ | 16.32 | | | | | | | | | $ | 15.11 | | | | $ | 17.17 | | | | $ | 15.83 | | | | $ | 15.21 | | | | $ | 17.20 | |
| | | | | | | | | | | | | | | | | | | | | | | | | | | | | | | | | | | |
| | | | | | | |
Total investment return (b) | | | | 11.09 | % | | | | | | | | | (5.45 | %) | | | | 12.25 | % | | | | 9.03 | % | | | | (3.74 | %) | | | | 7.83 | % |
| | | | | | | |
| Ratios (to average net assets)/Supplemental Data: | | | | | | | | | | | | | | | | | | | | | | | | | | | | | | | | | | | |
| | | | | | | |
Net investment income (loss) | | | | 3.43 | %†† | | | | | | | | | 2.93 | % | | | | 2.65 | % | | | | 3.20 | % | | | | 3.54 | % | | | | 4.12 | % |
| | | | | | | |
Net expenses (including interest expense and fees) (c) | | | | 0.88 | %†† | | | | | | | | | 0.87 | % | | | | 0.87 | % | | | | 0.88 | % | | | | 0.88 | % | | | | 0.88 | % |
| | | | | | | |
Interest expense and fees | | | | — | | | | | | | | | | 0.00 | % (d) | | | | 0.01 | % | | | | — | | | | | — | | | | | — | |
| | | | | | | |
Portfolio turnover rate | | | | 33 | % (e) | | | | | | | | | 50 | % (e) | | | | 26 | % | | | | 28 | % | | | | 35 | % | | | | 13 | % |
| | | | | | | |
Net assets at end of period (in 000’s) | | | $ | 394,334 | | | | | | | | | $ | 360,874 | | | | $ | 425,340 | | | | $ | 361,357 | | | | $ | 309,350 | | | | $ | 284,391 | |
| (a) | Per share data based on average shares outstanding during the period. |
| (b) | Total return does not reflect any deduction of sales charges, mortality and expense charges, contract charges or administrative charges. For periods of less than one year, total return is not annualized. |
| (c) | In addition to the fees and expenses which the Portfolio bears directly, it also indirectly bears a pro-rata share of the fees and expenses of the underlying funds in which it invests. Such indirect expenses are not included in the above expense ratios. |
| (e) | The portfolio turnover rates not including mortgage dollar rolls were 30% and 39% for the six months ended June 30, 2019 and for the year ended December 31, 2018, respectively. |
| | | | | | |
The notes to the financial statements are an integral part of,
and should be read in conjunction with, the financial statements. | | | | | 29 | |
Notes to Financial Statements(Unaudited)
Note 1–Organization and Business
MainStay VP Funds Trust (the “Fund”) was organized as a Delaware statutory trust on February 1, 2011. The Fund is registered under the Investment Company Act of 1940, as amended (the “1940 Act”), as an open-end management investment company. The Fund is comprised of thirty-one separate series (collectively referred to as the “Portfolios”). These financial statements and notes relate to the MainStay VP Income Builder Portfolio (the “Portfolio”), a “diversified” portfolio, as that term is defined in the 1940 Act, as interpreted or modified by regulatory authorities having jurisdiction, from time to time.
Shares of the Portfolio are currently offered to certain separate accounts to fund variable annuity policies and variable universal life insurance policies issued by New York Life Insurance and Annuity Corporation (“NYLIAC”), awholly-owned subsidiary of New York Life Insurance Company (“New York Life”) and may also be offered to fund variable annuity policies and variable universal life insurance policies issued by other insurance companies. NYLIAC allocates shares of the Portfolios to, among others, certain NYLIAC separate accounts. Shares of the Portfolio are also offered to the MainStay VP Conservative Allocation Portfolio, MainStay VP Moderate Allocation Portfolio, MainStay VP Moderate Growth Allocation Portfolio and MainStay VP Growth Allocation Portfolio, which operate as “funds-of-funds.”
The Portfolio currently offers two classes of shares. Initial Class shares commenced operations on January 29, 1993. Service Class shares commenced operations on June 4, 2003. Shares of the Portfolio are offered and are redeemed at a price equal to their respective net asset value (“NAV”) per share. No sales or redemption charge is applicable to the purchase or redemption of the Portfolio’s shares. Under the terms of the Fund’s multiple class plan, adopted pursuant to Rule 18f-3 under the 1940 Act, the classes differ in that, among other things, Service Class shares of the Portfolio pay a combined distribution and service fee of 0.25% of average daily net assets attributable to Service Class shares of the Portfolio to the Distributor (as defined in Note 3(B)) pursuant to a plan adopted in accordance with Rule 12b-1 under the 1940 Act. Contract owners of variable annuity contracts purchased after June 2, 2003, are permitted to invest only in the Service Class shares.
The Portfolio’s investment objective is to seek current income consistent with reasonable opportunity for future growth of capital and income.
Note 2–Significant Accounting Policies
The Portfolio is an investment company and accordingly follows the investment company accounting and reporting guidance of the Financial Accounting Standards Board (“FASB”) Accounting Standard CodificationTopic 946 Financial Services—Investment Companies. The Portfolio prepares its financial statements in accordance with generally accepted accounting principles (“GAAP”) in the United States of America and follows the significant accounting policies described below.
(A) Securities Valuation. Investments are usually valued as of the close of regular trading on the New York Stock Exchange (the “Exchange”) (usually 4:00 p.m. Eastern time) on each day the Portfolio is open for business (“valuation date”).
The Board of Trustees of the Fund (the “Board”) adopted procedures establishing methodologies for the valuation of the Portfolio’s securities
and other assets and delegated the responsibility for valuation determinations under those procedures to the Valuation Committee of the Fund (the “Valuation Committee”). The Board authorized the Valuation Committee to appoint a Valuation Subcommittee (the “Subcommittee”) to deal in the first instance with establishing the prices of securities for which market quotations are not readily available or the prices of which are not otherwise readily determinable under these procedures. The Subcommittee meets (in person, via electronic mail or via teleconference) on an as-needed basis. Subsequently, the Valuation Committee meets to ensure that actions taken by the Subcommittee were appropriate. The procedures state that, subject to the oversight of the Board and unless otherwise noted, the responsibility for theday-to-day valuation of portfolio assets (including fair value measurements for the Portfolio’s assets and liabilities) rests with New York Life Investment Management LLC (“New York Life Investments” or the “Manager”), aided to whatever extent necessary by the Subadvisors (as defined in Note 3(A)).
To assess the appropriateness of security valuations, the Manager, the Subadvisors or the Portfolio’s third-party service provider, who is subject to oversight by the Manager, regularly compares prior day prices, prices on comparable securities and the sale prices to the prior and current day prices and challenges prices with changes exceeding certain tolerance levels with third-party pricing services or broker sources. For those securities valued through either a standardized fair valuation methodology or a fair valuation measurement, the Subcommittee deals in the first instance with such valuation and the Valuation Committee reviews and affirms, if appropriate, the reasonableness of the valuation based on such methodologies and measurements on a regular basis after considering information that is reasonably available and deemed relevant by the Valuation Committee. Any action taken by the Subcommittee with respect to the valuation of a portfolio security or other asset is submitted for review and ratification (if appropriate) to the Valuation Committee and the Board at the next regularly scheduled meeting.
“Fair value” is defined as the price the Portfolio would reasonably expect to receive upon selling an asset or liability in an orderly transaction to an independent buyer in the principal or most advantageous market for the asset or liability. Fair value measurements are determined within a framework that establishes a three-tier hierarchy which maximizes the use of observable market data and minimizes the use of unobservable inputs to establish a classification of fair value measurements for disclosure purposes. “Inputs” refer broadly to the assumptions that market participants would use in pricing the asset or liability, including assumptions about risk, such as the risk inherent in a particular valuation technique used to measure fair value using a pricing model and/or the risk inherent in the inputs for the valuation technique. Inputs may be observable or unobservable. Observable inputs reflect the assumptions market participants would use in pricing the asset or liability based on market data obtained from sources independent of the Portfolio. Unobservable inputs reflect the Portfolio’s own assumptions about the assumptions market participants would use in pricing the asset or liability based on the information available. The inputs or methodology used for valuing assets or liabilities may not be an indication of the risks associated with investing in those assets or liabilities. The three-tier hierarchy of inputs is summarized below.
| • | | Level 1—quoted prices in active markets for an identical asset or liability |
| | |
| 30 | | MainStay VP Income Builder Portfolio |
| • | | Level 2—other significant observable inputs (including quoted prices for a similar asset or liability in active markets, interest rates and yield curves, prepayment speeds, credit risk, etc.) |
| • | | Level 3—significant unobservable inputs (including the Portfolio’s own assumptions about the assumptions that market participants would use in measuring fair value of an asset or liability) |
The level of an asset or liability within the fair value hierarchy is based on the lowest level of an input, both individually and in the aggregate, that is significant to the fair value measurement. As of June 30, 2019, the aggregate value by input level of the Portfolio’s assets and liabilities is included at the end of the Portfolio’s Portfolio of Investments.
The Portfolio may use third-party vendor evaluations, whose prices may be derived from one or more of the following standard inputs, among others:
| | |
• Benchmark yields | | • Reported trades |
• Broker/dealer quotes | | • Issuer spreads |
• Two-sided markets | | • Benchmark securities |
• Bids/offers | | • Reference data (corporate actions or material event notices) |
• Industry and economic events | | • Comparable bonds |
• Monthly payment information | | |
An asset or liability for which market values cannot be measured using the methodologies described above is valued by methods deemed reasonable in good faith by the Valuation Committee, following the procedures established by the Board, to represent fair value. Under these procedures, the Portfolio generally uses a market-based approach which may use related or comparable assets or liabilities, recent transactions, market multiples, book values and other relevant information. The Portfolio may also use an income-based valuation approach in which the anticipated future cash flows of the asset or liability are discounted to calculate fair value. Discounts may also be applied due to the nature and/or duration of any restrictions on the disposition of the asset or liability. Fair value represents a good faith approximation of the value of a security. Fair value determinations involve the consideration of a number of subjective factors, an analysis of applicable facts and circumstances and the exercise of judgment. As a result, it is possible that the fair value for a security determined in good faith in accordance with the Portfolio’s valuation procedures may differ from valuations for the same security determined by other funds using their own valuation procedures. Although the Portfolio’s valuation procedures are designed to value a security at the price the Portfolio may reasonably expect to receive upon the security’s sale in an orderly transaction, there can be no assurance that any fair value determination thereunder would, in fact, approximate the amount that the Portfolio would actually realize upon the sale of the security or the price at which the security would trade if a reliable market price were readily available. During the six-month period ended June 30, 2019, there were no material changes to the fair value methodologies.
Securities which may be valued in this manner include, but are not limited to: (i) a security for which trading has been halted or suspended; (ii) a debt security that has recently gone into default and for which there is not a current market quotation; (iii) a security of an issuer that has entered into a restructuring; (iv) a security that has been delisted
from a national exchange; (v) a security for which the market price is not readily available from a third-party pricing source or, if so provided, does not, in the opinion of the Manager or the Subadvisors, reflect the security’s market value; (vi) a security subject to trading collars for which no or limited trading takes place; and (vii) a security whose principal market has been temporarily closed at a time when, under normal conditions, it would be open. Securities valued in this manner are generally categorized as Level 3 in the hierarchy. As of June 30, 2019, securities that were fair valued in such a manner are shown in the Portfolio of Investments.
Certain securities held by the Portfolio may principally trade in foreign markets. Events may occur between the time the foreign markets close and the time at which the Portfolio’s NAVs are calculated. These events may include, but are not limited to, situations relating to a single issuer in a market sector, significant fluctuations in U.S. or foreign markets, natural disasters, armed conflicts, governmental actions or other developments not tied directly to the securities markets. Should the Manager or Subadvisors conclude that such events may have affected the accuracy of the last price of such securities reported on the local foreign market, the Subcommittee may, pursuant to procedures adopted by the Board, adjust the value of the local price to reflect the estimated impact on the price of such securities as a result of such events. In this instance, securities are generally categorized as Level 3 in the hierarchy. Additionally, certain foreign equity securities are also fair valued whenever the movement of a particular index exceeds certain thresholds. In such cases, the securities are fair valued by applying factors provided by a third-party vendor in accordance with valuation procedures adopted by the Board and are generally categorized as Level 2 in the hierarchy. As of June 30, 2019, no foreign equity securities held by the Portfolio were fair valued in such a manner.
Equity securities are valued at the last quoted sales prices as of the close of regular trading on the relevant exchange on each valuation date. Securities that are not traded on the valuation date are valued at the mean of the last quoted bid and ask prices. Prices are normally taken from the principal market in which each security trades. Futures contracts are valued at the last posted settlement price on the market where such futures are primarily traded. These securities are generally categorized as Level 1 in the hierarchy.
Investments in mutual funds, including money market funds, are valued at their respective NAVs as of the close of the Exchange on the valuation date. These securities are generally categorized as Level 1 in the hierarchy.
Debt securities (other than convertible and municipal bonds) are valued at the evaluated bid prices (evaluated mean prices in the case of convertible and municipal bonds) supplied by a pricing agent or brokers selected by the Manager, in consultation with the Subadvisors. The evaluations are market-based measurements processed through a pricing application and represents the pricing agent’s good faith determination as to what a holder may receive in an orderly transaction under market conditions. The rules based logic utilizes valuation techniques that reflect participants’ assumptions and vary by asset class and per methodology, maximizing the use of relevant observable data including quoted prices for similar assets, benchmark yield curves and market corroborated inputs. The evaluated bid or mean prices are deemed by the Manager, in consultation with the Subadvisors to be
Notes to Financial Statements(Unaudited) (continued)
representative of market values at the regular close of trading of the Exchange on each valuation date. Debt securities purchased on a delayed delivery basis are marked to market daily until settlement at the forward settlement date. Debt securities, including corporate bonds, U.S. government and federal agency bonds, municipal bonds, foreign bonds, convertible bonds, asset-backed securities and mortgage-backed securities are generally categorized as Level 2 in the hierarchy.
Foreign currency forward contracts are valued at their fair market values measured on the basis of the mean between the last current bid and ask prices based on dealer or exchange quotations and are generally categorized as Level 2 in the hierarchy.
Loan assignments, participations and commitments are valued at the average of bid quotations obtained from the engaged independent pricing service and are generally categorized as Level 2 in the hierarchy. Certain loan assignments, participations and commitments may be valued by utilizing significant unobservable inputs obtained from the pricing service and are generally categorized as Level 3 in the hierarchy. As of June 30, 2019, there were no securities held by the Portfolio that were fair valued in such a manner.
Temporary cash investments acquired in excess of 60 days to maturity at the time of purchase are valued using the latest bid prices or using valuations based on a matrix system (which considers such factors as security prices, yields, maturities and ratings), both as furnished by independent pricing services. Other temporary cash investments which mature in 60 days or less at the time of purchase (“Short-Term Investments”) are valued using the amortized cost method of valuation, unless the use of such method would be inappropriate. The amortized cost method involves valuing a security at its cost on the date of purchase and thereafter assuming a constant amortization to maturity of the difference between such cost and the value on maturity date. Amortized cost approximates the current fair value of a security. Securities valued using the amortized cost method are not valued using quoted prices in an active market and are generally categorized as Level 2 in the hierarchy.
The information above is not intended to reflect an exhaustive list of the methodologies that may be used to value portfolio investments. The valuation procedures permit the use of a variety of valuation methodologies in connection with valuing portfolio investments. The methodology used for a specific type of investment may vary based on the market data available or other considerations. The methodologies summarized above may not represent the specific means by which portfolio investments are valued on any particular business day.
A portfolio security or other asset may be determined to be illiquid under procedures approved by the Board. Illiquidity of a security might prevent the sale of such security at a time when the Manager or the Subadvisors might wish to sell, and these securities could have the effect of decreasing the overall level of the Portfolio’s liquidity. Further, the lack of an established secondary market may make it more difficult to value illiquid securities, requiring the Portfolio to rely on judgments that may be somewhat subjective in measuring value, which could vary materially from the amount that the Portfolio could realize upon disposition. Difficulty in selling illiquid securities may result in a loss or may be costly to the Portfolio. Under the supervision of the Board, the Manager or the Subadvisors determine the liquidity of the Portfolio’s investments; in
doing so, the Manager or the Subadvisors may consider various factors, including: (i) the frequency of trades and quotations; (ii) the number of dealers and prospective purchasers; (iii) dealer undertakings to make a market; and (iv) the nature of the security and the market in which it trades (e.g., the time needed to dispose of the security, the method of soliciting offers and the mechanics of transfer). Illiquid securities are often valued in accordance with methods deemed by the Board in good faith to be reasonable and appropriate to accurately reflect their fair value. The liquidity of the Portfolio’s investments, as shown in the Portfolio of Investments, was determined as of June 30, 2019 and can change at any time in response to, among other relevant factors, market conditions or events or developments with respect to an individual issuer or instrument. As of June 30, 2019, securities deemed to be illiquid under procedures approved by the Board are shown in the Portfolio of Investments.
(B) Income Taxes. The Portfolio’s policy is to comply with the requirements of the Internal Revenue Code of 1986, as amended (the “Internal Revenue Code”), applicable to regulated investment companies and to distribute all of its taxable income to the shareholders of the Portfolio within the allowable time limits. Therefore, no federal, state and local income tax provisions are required.
Management evaluates the Portfolio’s tax positions to determine if the tax positions taken meet the minimum recognition threshold in connection with accounting for uncertainties in income tax positions taken or expected to be taken for the purposes of measuring and recognizing tax liabilities in the financial statements. Recognition of tax benefits of an uncertain tax position is permitted only to the extent the position is “more likely than not” to be sustained assuming examination by taxing authorities. Management has analyzed the Portfolio’s tax positions taken on federal, state and local income tax returns for all open tax years (for up to three tax years) and has concluded that no provisions for federal, state and local income tax are required in the Portfolio’s financial statements. The Portfolio’s federal, state and local income tax and federal excise tax returns for tax years for which the applicable statutes of limitations have not expired are subject to examination by the Internal Revenue Service and state and local departments of revenue.
(C) Foreign Taxes. The Portfolio may be subject to foreign taxes on income and other transaction-based taxes imposed by certain countries in which it invests. A portion of the taxes on gains on investments or currency purchases/repatriation may be reclaimable. The Portfolio will accrue such taxes and reclaims as applicable, based upon its current interpretation of tax rules and regulations that exist in the markets in which it invests.
The Portfolio may be subject to taxation on realized capital gains, repatriation proceeds and other transaction-based taxes imposed by certain countries in which it invests. The Portfolio will accrue such taxes as applicable based upon its current interpretation of tax rules and regulations that exist in the market in which it invests. Capital gains taxes relating to positions still held are reflected as a liability on the Statement of Assets and Liabilities, as well as an adjustment to the Portfolio’s net unrealized appreciation (depreciation). Taxes related to capital gains realized, if any, are reflected as part of net realized gain (loss) in the Statement of Operations. Changes in tax liabilities related to capital gains taxes on unrealized investment gains, if any, are reflected as part of the change in net unrealized appreciation (depreciation) on
| | |
| 32 | | MainStay VP Income Builder Portfolio |
investments in the Statement of Operations. Transaction-based charges are generally assessed as a percentage of the transaction amount.
(D) Dividends and Distributions to Shareholders. Dividends and distributions are recorded on the ex-dividend date. The Portfolio intends to declare and pay dividends from net investment income, if any, at least quarterly and distributions from net realized capital and currency gains, if any, at least annually. Unless the shareholder elects otherwise, all dividends and distributions are reinvested in the same class of shares of the Portfolio, at NAV. Dividends and distributions to shareholders are determined in accordance with federal income tax regulations and may differ from determinations using GAAP.
(E) Security Transactions and Investment Income. The Portfolio records security transactions on the trade date. Realized gains and losses on security transactions are determined using the identified cost method. Dividend income is recognized on the ex-dividend date; net of any foreign tax withheld at the source, and interest income is accrued as earned using the effective interest rate method and includes any realized gains and losses from repayments of principal on mortgage-backed securities. Discounts and premiums on securities purchased for the Portfolio are accreted and amortized, respectively, on the effective interest rate method over the life of the respective securities.
Investment income and realized and unrealized gains and losses on investments of the Portfolio are allocated pro rata to the separate classes of shares based upon their relative net assets on the date the income is earned or realized and unrealized gains and losses are incurred.
The Portfolio may place a debt security on non-accrual status and reduce related interest income by ceasing current accruals and writing off all or a portion of any interest receivables when the collection of all or a portion of such interest has become doubtful. A debt security is removed from non-accrual status when the issuer resumes interest payments or when collectability of interest is reasonably assured.
(F) Expenses. Expenses of the Fund are allocated to the individual Portfolios in proportion to the net assets of the respective Portfolios when the expenses are incurred, except where direct allocations of expenses can be made. Expenses (other than fees incurred under the distribution and service plans, further discussed in Note 3(B), which are charged directly to the Service Class shares) are allocated to separate classes of shares pro rata based upon their relative net assets on the date the expenses are incurred. The expenses borne by the Portfolio, including those of related parties to the Portfolio, are shown in the Statement of Operations.
Additionally, the Portfolio may invest in mutual funds, which are subject to management fees and other fees that may cause the costs of investing in mutual funds to be greater than the costs of owning the underlying securities directly. These indirect expenses of mutual funds are not included in the amounts shown as expenses in the Portfolio’s Statement of Operations or in the expense ratios included in the Financial Highlights.
(G) Use of Estimates. In preparing financial statements in conformity with GAAP, management makes estimates and assumptions that affect the reported amounts and disclosures in the financial statements. Actual results could differ from those estimates.
(H) Repurchase Agreements. The Portfolio may enter into repurchase agreements (i.e., buy a security from another party with the agreement that it be sold back in the future) to earn income. The Portfolio may enter into repurchase agreements only with counterparties, usually financial institutions, that are deemed by the Manager or the Subadvisors to be creditworthy, pursuant to guidelines established by the Board. During the term of any repurchase agreement, the Manager or the Subadvisors will continue to monitor the creditworthiness of the counterparty. Under the 1940 Act, repurchase agreements are considered to be collateralized loans by the Portfolio to the counterparty secured by the securities transferred to the Portfolio.
Repurchase agreements are subject to counterparty risk, meaning the Portfolio could lose money by the counterparty’s failure to perform under the terms of the agreement. The Portfolio mitigates this risk by ensuring the repurchase agreement is collateralized by cash, U.S. government securities, fixed income securities and/or other securities. The collateral is held by the Portfolio’s custodian and valued daily on a mark to market basis to determine if the value, including accrued interest, exceeds the repurchase price. In the event of the counterparty’s default on the obligation to repurchase, the Portfolio has the right to liquidate the collateral and apply the proceeds in satisfaction of the obligation. Under certain circumstances, such as in the event of default or bankruptcy by the counterparty, realization and/or retention of the collateral may be limited or subject to delay, to legal proceedings and possible realized loss to the Portfolio. As of June 30, 2019, the Portfolio did not hold any repurchase agreements.
(I) Futures Contracts. A futures contract is an agreement to purchase or sell a specified quantity of an underlying instrument at a specified future date and price, or to make or receive a cash payment based on the value of a financial instrument (e.g., foreign currency, interest rate, security or securities index). The Portfolio is subject to risks such as market price risk and/or interest rate risk in the normal course of investing in these transactions. Upon entering into a futures contract, the Portfolio is required to pledge to the broker or futures commission merchant an amount of cash and/or U.S. government securities equal to a certain percentage of the collateral amount, known as the “initial margin.” During the period the futures contract is open, changes in the value of the contract are recognized as unrealized appreciation or depreciation by marking to market such contract on a daily basis to reflect the market value of the contract at the end of each day’s trading. The Portfolio agrees to receive from or pay to the broker or futures commission merchant an amount of cash equal to the daily fluctuation in the value of the contract. Such receipts or payments are known as “variation margin.” When the futures contract is closed, the Portfolio records a realized gain or loss equal to the difference between the proceeds from (or cost of) the closing transaction and the Portfolio’s basis in the contract.
The use of futures contracts involves, to varying degrees, elements of market risk in excess of the amount recognized in the Statement of Assets and Liabilities. The contract or notional amounts and variation margin reflect the extent of the Portfolio’s involvement in open futures positions. There are several risks associated with the use of futures contracts as hedging techniques. There can be no assurance that a liquid market will exist at the time when the Portfolio seeks to close out a futures contract. If no liquid market exists, the Portfolio would remain
Notes to Financial Statements(Unaudited) (continued)
obligated to meet margin requirements until the position is closed. Futures may involve a small initial investment relative to the risk assumed, which could result in losses greater than if they had not been used. Futures may be more volatile than direct investments in the instrument underlying the futures and may not correlate to the underlying instrument, causing a given hedge not to achieve its objectives. The Portfolio’s activities in futures contracts have minimal counterparty risk as they are conducted through regulated exchanges that guarantee the futures against default by the counterparty. In the event of a bankruptcy or insolvency of a futures commission merchant that holds margin on behalf of the Portfolio, the Portfolio may not be entitled to the return of the entire margin owed to the Portfolio, potentially resulting in a loss. The Portfolio may invest in futures contracts in order to hedge against anticipated changes in interest rates that might otherwise have an adverse effect upon the value of the Portfolio’s securities. The Portfolio may also use equity index futures contracts to increase the equity sensitivity to the Portfolio. The Portfolio’s investment in futures contracts and other derivatives may increase the volatility of the Portfolio’s NAVs and may result in a loss to the Portfolio. As of June 30, 2019, open futures contracts are shown in the Portfolio of Investments.
(J) Foreign Currency Forward Contracts. The Portfolio may enter into foreign currency forward contracts, which are agreements to buy or sell foreign currencies on a specified future date at a specified rate. The Portfolio is subject to foreign currency exchange rate risk in the normal course of investing in these transactions. During the period the forward contract is open, changes in the value of the contract are recognized as unrealized appreciation or depreciation by marking to market such contract on a daily basis to reflect the market value of the contract at the end of each day’s trading. Cash movement occurs on settlement date. When the forward contract is closed, the Portfolio records a realized gain or loss equal to the difference between the proceeds from (or cost of) the closing transaction and the Portfolio’s basis in the contract. The Portfolio may purchase and sell foreign currency forward contracts for purposes of seeking to enhance portfolio returns and manage portfolio risk more efficiently. Foreign currency forward contracts may also be used to gain exposure to a particular currency or to hedge against the risk of loss due to changing currency exchange rates. Foreign currency forward contracts to purchase or sell a foreign currency may also be used in anticipation of future purchases or sales of securities denominated in foreign currency, even if the specific investments have not yet been selected.
The use of foreign currency forward contracts involves, to varying degrees, elements of risk in excess of the amount recognized in the Statement of Assets and Liabilities, including counterparty risk, market risk and illiquidity risk. Counterparty risk is heightened for these instruments because foreign currency forward contracts are not exchange-traded and therefore no clearinghouse or exchange stands ready to meet the obligations under such contracts. Thus, the Portfolio faces the risk that its counterparties under such contracts may not perform their obligations. Market risk is the risk that the value of a foreign currency forward contract will depreciate due to unfavorable changes in exchange rates. Illiquidity risk arises because the secondary market for foreign currency forward contracts may have less liquidity relative to markets for other securities and financial instruments. Risks also arise from the possible movements in the foreign exchange rates underlying these instruments. While the Portfolio may enter into forward contracts
to reduce currency exchange risks, changes in currency exchange rates may result in poorer overall performance for the Portfolio than if it had not engaged in such transactions. Exchange rate movements can be large, depending on the currency, and can last for extended periods of time, affecting the value of the Portfolio’s assets. Moreover, there may be an imperfect correlation between the Portfolio’s holdings of securities denominated in a particular currency and forward contracts entered into by the Portfolio. Such imperfect correlation may prevent the Portfolio from achieving the intended hedge or expose the Portfolio to the risk of currency exchange loss. The unrealized appreciation (depreciation) on forward contracts also reflects the Portfolio’s exposure at the valuation date to credit loss in the event of a counterparty’s failure to perform its obligations. As of June 30, 2019, all open forward currency contracts are shown in the Portfolio of Investments.
(K) Foreign Currency Transactions. The Portfolio’s books and records are maintained in U.S. dollars. Prices of securities denominated in foreign currency amounts are translated into U.S. dollars at the mean between the buying and selling rates last quoted by any major U.S. bank at the following dates:
| (i) | market value of investment securities, other assets and liabilities—at the valuation date; and |
| (ii) | purchases and sales of investment securities, income and expenses—at the date of such transactions. |
The assets and liabilities that are denominated in foreign currency amounts are presented at the exchange rates and market values at the close of the period. The realized and unrealized changes in net assets arising from fluctuations in exchange rates and market prices of securities are not separately presented.
Net realized gain (loss) on foreign currency transactions represents net gains and losses on foreign currency forward contracts, net currency gains or losses realized as a result of differences between the amounts of securities sale proceeds or purchase cost, dividends, interest and withholding taxes as recorded on the Portfolio’s books, and the U.S. dollar equivalent amount actually received or paid. Net currency gains or losses from valuing such foreign currency denominated assets and liabilities, other than investments at valuation date exchange rates, are reflected in unrealized foreign exchange gains or losses.
(L) Loan Assignments, Participations and Commitments. The Portfolio may invest in loan assignments and participations (“loans”). Commitments are agreements to make money available to a borrower in a specified amount, at a specified rate and within a specified time. The Portfolio records an investment when the borrower withdraws money on a commitment or when a funded loan is purchased (trade date) and records interest as earned. These loans pay interest at rates that are periodically reset by reference to a base lending rate plus a spread. These base lending rates are generally the prime rate offered by a designated U.S. bank or the London Interbank Offered Rate (“LIBOR”).
The loans in which the Portfolio may invest are generally readily marketable, but may be subject to some restrictions on resale. For example, the Portfolio may be contractually obligated to receive approval from the agent bank and/or borrower prior to the sale of these investments. If the Portfolio purchases an assignment from a lender, the Portfolio will generally have direct contractual rights against the borrower in favor of
| | |
| 34 | | MainStay VP Income Builder Portfolio |
the lender. If the Portfolio purchases a participation interest either from a lender or a participant, the Portfolio typically will have established a direct contractual relationship with the seller of the participation interest, but not with the borrower. Consequently, the Portfolio is subject to the credit risk of the lender or participant who sold the participation interest to the Portfolio, in addition to the usual credit risk of the borrower. In the event that the borrower, selling participant or intermediate participants become insolvent or enter into bankruptcy, the Portfolio may incur certain costs and delays in realizing payment, or may suffer a loss of principal and/or interest.
Unfunded commitments represent the remaining obligation of the Portfolio to the borrower. At any point in time, up to the maturity date of the issue, the borrower may demand the unfunded portion. Unfunded amounts, if any, are marked to market and any unrealized gains or losses are recorded in the Statement of Assets and Liabilities. As of June 30, 2019, the Portfolio did not hold any unfunded commitments.
(M) Securities Lending. In order to realize additional income, the Portfolio may engage in securities lending, subject to the limitations set forth in the 1940 Act and relevant guidance by the staff of the Securities and Exchange Commission (“SEC”). In the event the Portfolio does engage in securities lending, the Portfolio will lend through its custodian, State Street Bank and Trust Company (“State Street”), acting as securities lending agent on behalf of the Portfolio. State Street will manage the Portfolio’s collateral in accordance with the securities lending agency agreement between the Portfolio and State Street, and indemnify the Portfolio against counterparty risk. The loans will be collateralized by cash (which may be invested in a money market fund) and/ornon-cash collateral (which may include, U.S. Treasury securities and/or U.S. Government Agency securities issued or guaranteed by the United States government or its agencies or instrumentalities) at least equal at all times to the market value of the securities loaned. The Portfolio may bear the risk of delay in recovery of, or loss of rights in, the securities loaned should the borrower of the securities experience financial difficulty. The Portfolio may also record a realized gain or loss on securities deemed sold due to a borrower’s inability to return securities on loan. The Portfolio bears the risk of any loss on investment of cash collateral. The Portfolio will receive compensation for lending its securities in the form of fees or it will retain a portion of interest on the investment of any cash collateral. The Portfolio will also continue to receive interest and dividends on the securities loaned and any gain or loss in the market price of the securities loaned that may occur during the term of the loan will be for the account of the Portfolio. Income earned from securities lending activities, if any, is reflected in the Statement of Operations. As of June 30, 2019, the Portfolio had securities on loan with an aggregate market value of $2,653,818 and received cash collateral which was invested into the State Street Navigator Securities Lending Government Money Market Portfolio with a value of $2,708,289.
(N) Dollar Rolls. The Portfolio may enter into dollar roll transactions in which it sells mortgage-backed securities (“MBS”) from its portfolio to a counterparty from whom it simultaneously agrees to buy a similar security on a delayed delivery basis. The Portfolio generally transfers MBS where the MBS are “to be announced,” therefore, the Portfolio accounts for these transactions as purchases and sales.
When accounted for as purchase and sales, the securities sold in connection with the dollar rolls are removed from the portfolio and a realized gain or loss is recognized. The securities the Portfolio has agreed to acquire are included at market value in the Portfolio of Investments and liabilities for such purchase commitments are included as payables for investments purchased. During the roll period, the Portfolio foregoes principal and interest paid on the securities. The Portfolio is compensated by the difference between the current sales price and the forward price for the future as well as by the earnings on the cash proceeds of the initial sale. Dollar rolls may be renewed without physical delivery of the securities subject to the contract. The Portfolio maintains liquid assets from its portfolio having a value not less than the repurchase price, including accrued interest. Dollar roll transactions involve certain risks, including the risk that the securities returned to the Portfolio at the end of the roll period, while substantially similar, could be inferior to what was initially sold to the counterparty.
The Portfolio accounts for a dollar roll transaction as a purchase and sale whereby the difference in the sales price and purchase price of the security sold is recorded as a realized gain (loss).
(O) Debt and Foreign Securities Risk. The ability of issuers of debt securities held by the Portfolio to meet their obligations may be affected by, among other things, economic or political developments in a specific country, industry or region. Debt securities are also subject to the risks associated with changes in interest rates.
The Portfolio may invest in high-yield debt securities (sometimes called “junk bonds”), which are generally considered speculative because they present a greater risk of loss, including default, than higher quality debt securities. These securities pay investors a premium—a higher interest rate or yield than investment grade debt securities—because of the increased risk of loss. These securities can also be subject to greater price volatility. In times of unusual or adverse market, economic or political conditions, these securities may experience higher than normal default rates.
The Portfolio may invest in foreign securities, which carry certain risks that are in addition to the usual risks inherent in domestic securities. These risks include those resulting from currency fluctuations, future adverse political or economic developments and possible imposition of currency exchange blockages or other foreign governmental laws or restrictions. These risks are likely to be greater in emerging markets than in developed markets. The ability of issuers of securities held by the Portfolio to meet their obligations may be affected by, among other things, economic or political developments in a specific country, industry or region.
The Portfolio may invest in loans which are usually rated below investment grade and are generally considered speculative because they present a greater risk of loss, including default, than higher rated debt securities. These investments pay investors a higher interest rate than investment grade debt securities because of the increased risk of loss. Although certain loans are collateralized, there is no guarantee that the value of the collateral will be sufficient to repay the loan. In a recession or serious credit event, the value of these investments could decline significantly. As a result, the Portfolio’s NAVs could go down and you could lose money.
In addition, loans generally are subject to extended settlement periods that may be longer than seven days. As a result, the Portfolio may be
Notes to Financial Statements(Unaudited) (continued)
adversely affected by selling other investments at an unfavorable time and/or under unfavorable conditions or engaging in borrowing transactions, such as borrowing against its credit facility, to raise cash to meet redemption obligations or pursue other investment opportunities.
In certain circumstances, loans may not be deemed to be securities. As a result, the Portfolio may not have the protection of anti-fraud provisions of the federal securities laws. In such cases, the Portfolio generally must rely on the contractual provisions in the loan agreement and common-law fraud protections under applicable state law.
(P) Counterparty Credit Risk. In order to better define its contractual rights and to secure rights that will help the Portfolio mitigate its counterparty risk, the Portfolio may enter into an International Swaps and Derivatives Association, Inc. Master Agreement (“ISDA Master Agreement”) or similar agreement with its counterparties. An ISDA Master Agreement is a bilateral agreement between the Portfolio and a counterparty that governs certain OTC derivatives and typically contains collateral posting terms and netting provisions. Under an ISDA Master Agreement, the Portfolio may, under certain circumstances, offset with the counterparty certain derivative financial instruments’ payables and/or receivables with collateral held and/or posted and create one single net payment. The provisions of the ISDA Master Agreement typically permit a single net payment in the event of default including the bankruptcy or insolvency of the counterparty. Bankruptcy or insolvency laws of a particular jurisdiction may restrict or prohibit the right of offset in bankruptcy, insolvency or other events. In addition, certain ISDA Master Agreements may contain provisions for early termination of OTC derivative transactions in the event the net assets of the Portfolio decline below specific levels or if the Portfolio fails to meet the terms of its ISDA Master Agreements. The result would cause the Portfolio to accelerate payment of any net liability owed to the counterparty.
For financial reporting purposes, the Portfolio does not offset derivative assets and derivative liabilities that are subject to netting arrangements, if any, in the Statement of Assets and Liabilities.
(Q) Indemnifications. Under the Fund’s organizational documents, its officers and trustees are indemnified against certain liabilities that may arise out of performance of their duties to the Fund. Additionally, in the normal course of business, the Portfolio enters into contracts with third-party service providers that contain a variety of representations and warranties and which may provide general indemnifications. The Portfolio’s maximum exposure under these arrangements is unknown, as this would involve future claims that may be made against the Portfolio that have not yet occurred. Based on experience, management is of the view that the risk of loss in connection with these potential indemnification obligations is remote. However, there can be no assurance that material liabilities related to such obligations will not arise in the future, which could adversely impact the Portfolio.
(R) Quantitative Disclosure of Derivative Holdings. The following tables show additional disclosures related to the Portfolio’s derivative and hedging activities, including how such activities are accounted for and their effect on the Portfolio’s financial positions, performance and cash flows. The Portfolio entered into Treasury futures contracts in order to hedge against anticipated changes in interest rates that might otherwise have an adverse effect upon the value of the Portfolio’s securities. The Portfolio also entered into domestic and foreign equity index futures contracts to increase the equity sensitivity to the Portfolio. Foreign currency forward contracts were used to gain exposure to a particular currency or to hedge against the risk of loss due to changing currency exchange rates. These derivatives are not accounted for as hedging instruments.
Fair value of derivative instruments as of June 30, 2019:
Asset Derivatives
| | | | | | | | | | | | | | | | | | |
| | | Statement of Assets and Liabilities Location | | Foreign
Exchange
Contracts
Risk | | | Equity
Contracts
Risk | | | Interest
Rate
Contracts
Risk | | | Total | |
| | | | | |
Futures Contracts | | Net Assets—Net unrealized appreciation on investments and futures contracts (a) | | $ | — | | | $ | 1,269,094 | | | $ | 1,710,464 | | | $ | 2,979,558 | |
Forward Contracts | | Unrealized appreciation on foreign currency forward contracts | | | 957,067 | | | | — | | | | — | | | | 957,067 | |
| | | | | | |
Total Fair Value | | | | $ | 957,067 | | | $ | 1,269,094 | | | $ | 1,710,464 | | | $ | 3,936,625 | |
| | | | | | |
Liability Derivatives
| | | | | | | | | | | | | | | | | | |
| | | Statement of Assets and Liabilities Location | | Foreign
Exchange
Contracts
Risk | | | Equity
Contracts
Risk | | | Interest
Rate
Contracts
Risk | | | Total | |
| | | | | |
Futures Contracts | | Net Assets—Net unrealized depreciation on investments and futures contracts (a) | | $ | — | | | $ | — | | | $ | (177,172 | ) | | $ | (177,172 | ) |
Forward Contracts | | Unrealized depreciation on foreign currency forward contracts | | | (444,090 | ) | | | — | | | | — | | | | (444,090 | ) |
| | | | | | |
Total Fair Value | | | | $ | (444,090 | ) | | $ | — | | | $ | (177,172 | ) | | $ | (621,262 | ) |
| | | | | | |
| (a) | Includes cumulative appreciation (depreciation) of futures contracts as reported in the Portfolio of Investments. Only current day’s variation margin is reported within the Statement of Assets and Liabilities. |
| | |
| 36 | | MainStay VP Income Builder Portfolio |
The effect of derivative instruments on the Statement of Operations for the period ended June 30, 2019:
Realized Gain (Loss)
| | | | | | | | | | | | | | | | | | |
| | | Statement of Operations Location | | Foreign
Exchange
Contracts
Risk | | | Equity
Contracts
Risk | | | Interest
Rate
Contracts
Risk | | | Total | |
| | | | | |
Futures Contracts | | Net realized gain (loss) on futures transactions | | $ | — | | | $ | 5,115,561 | | | $ | 3,373,265 | | | $ | 8,488,826 | |
Forward Contracts | | Net realized gain (loss) on foreign currency forward transactions | | | 702,418 | | | | — | | | | — | | | | 702,418 | |
| | | | | | |
Total Realized Gain (Loss) | | | | $ | 702,418 | | | $ | 5,115,561 | | | $ | 3,373,265 | | | $ | 9,191,244 | |
| | | | | | |
Change in Unrealized Appreciation (Depreciation)
| | | | | | | | | | | | | | | | | | |
| | | Statement of Operations Location | | Foreign
Exchange
Contracts
Risk | | | Equity
Contracts
Risk | | | Interest
Rate
Contracts
Risk | | | Total | |
| | | | | |
Futures Contracts | | Net change in unrealized appreciation (depreciation) on futures contracts | | $ | — | | | $ | 5,460,608 | | | $ | (528,771 | ) | | $ | 4,931,837 | |
Forward Contracts | | Net change in unrealized appreciation (depreciation) on foreign currency forward contracts | | | (245,058 | ) | | | — | | | | — | | | | (245,058 | ) |
| | | | | | |
Total Change in Unrealized Appreciation (Depreciation) | | $ | (245,058 | ) | | $ | 5,460,608 | | | $ | (528,771 | ) | | $ | 4,686,779 | |
| | | | | | |
Average Notional Amount
| | | | | | | | | | | | | | |
| | | Foreign Exchange Contracts Risk | | Equity
Contracts
Risk | | | Interest
Rate
Contracts
Risk | | | Total | |
| | | | |
Futures Contracts Long | | $ — | | $ | 79,041,815 | | | $ | 61,318,029 | | | $ | 140,359,844 | |
Futures Contracts Short | | $ — | | $ | — | | | $ | (8,646,814 | ) | | $ | (8,646,814 | ) |
Forward Contracts Long | | $ 41,200,992 | | $ | — | | | $ | — | | | $ | 41,200,992 | |
Forward Contracts Short | | $(67,883,912) | | $ | — | | | $ | — | | | $ | (67,883,912 | ) |
| | | |
Note 3–Fees and Related Party Transactions
(A) Manager and Subadvisors. New York Life Investments, a registered investment adviser and an indirect,wholly-owned subsidiary of New York Life, serves as the Portfolio’s Manager, pursuant to an Amended and Restated Management Agreement (“Management Agreement”). The Manager provides offices, conducts clerical, recordkeeping and bookkeeping services, and keeps most of the financial and accounting records required to be maintained by the Portfolio. Except for the portion of salaries and expenses that are the responsibility of the Portfolio, the Manager pays the salaries and expenses of all personnel affiliated with the Portfolio and certain operational expenses of the Portfolio. The Portfolio reimburses New York Life Investments in an amount equal to a portion of the compensation of the Chief Compliance Officer attributable to the Portfolio. Pursuant to the terms of an Amended and Restated Subadvisory Agreement with New York Life Investments, MacKay Shields LLC (“MacKay Shields” or “Subadvisor”), a registered investment adviser and an indirect,wholly-owned subsidiary of New York Life, serves as a Subadvisor to the Portfolio and is responsible for theday-to-day portfolio management of the fixed-income portion of the Portfolio. Pursuant to the terms of an
Amended and Restated Subadvisory Agreement with New York Life Investments, Epoch Investment Partners, Inc. (“Epoch” or “Subadvisor” and, together with MacKay Shields, the “Subadvisors”), a registered investment adviser, also serves as a Subadvisor to the Portfolio and is responsible for theday-to-day portfolio management of the equity portion of the Portfolio. Asset allocation decisions for the Portfolio are made by a committee chaired by MacKay Shields in collaboration with New York Life Investments. New York Life Investments pays for the services of the Subadvisors.
The Fund, on behalf of the Portfolio, pays New York Life Investments in its capacity as the Portfolio’s investment manager and administrator, pursuant to the Management Agreement, a monthly fee for the services performed and the facilities furnished at an annual rate of the Portfolio’s average daily net assets as follows: 0.57% up to $1 billion and 0.55% in excess of $1 billion. During the six-month period ended June 30, 2019, the effective management fee rate was 0.57%.
During the six-month period ended June 30, 2019, New York Life Investments earned fees from the Portfolio in the amount of $1,596,428, and paid MacKay Shields and Epoch in the amounts of $449,729 and $348,485, respectively.
Notes to Financial Statements(Unaudited) (continued)
State Street providessub-administration andsub-accounting services to the Portfolio pursuant to an agreement with New York Life Investments. These services include calculating the daily NAVs of the Portfolio, maintaining the general ledger andsub-ledger accounts for the calculation of the Portfolio’s NAVs and assisting New York Life Investments in conducting various aspects of the Portfolio’s administrative operations. For providing these services to the Portfolio, State Street is compensated by New York Life Investments.
Pursuant to an agreement between the Fund and New York Life Investments, New York Life Investments is responsible for providing or procuring certain regulatory reporting services for the Portfolio. The Portfolio will reimburse New York Life Investments for the actual costs incurred by New York Life Investments in connection with providing or procuring these services for the Portfolio.
(B) Distribution and Service Fees. The Fund, on behalf of the Portfolio, has entered into a distribution agreement with NYLIFE Distributors LLC (the “Distributor”), an indirect,wholly-owned subsidiary of New York Life. The Portfolio has adopted a distribution plan (the “Plan”) in accordance with the provisions of Rule 12b-1 under the 1940 Act. Under the Plan, the Distributor has agreed to provide, through its affiliates or independent third parties, various distribution-related, shareholder and administrative support services to the Service Class shareholders. For its services, the Distributor is entitled to a combined distribution and service fee accrued daily and paid monthly at an annual rate of 0.25% of the average daily net assets attributable to the Service Class shares of the Portfolio.
(C) Investments in Affiliates (in 000’s). During the six-month period ended June 30, 2019, purchases and sales transactions, income earned from investments and shares held of investment companies managed by New York Life Investments or its affiliates were as follows:
| | | | | | | | | | | | | | | | | | | | | | | | | | | | | | | | | | | | |
Affiliated Investment
Company | | Value,
Beginning of
Period | | | Purchases
at Cost | | | Proceeds
from
Sales | | | Net Realized
Gain/(Loss)
on Sales | | | Change in
Unrealized
Appreciation/
(Depreciation) | | | Value,
End of
Period | | | Dividend
Income | | | Other
Distributions | | | Shares
End of
Period | |
MainStay U.S. Government Liquidity Fund | | $ | 20,625 | | | $ | 115,639 | | | $ | (113,449 | ) | | $ | — | | | $ | — | | | $ | 22,815 | | | $ | 265 | | | $ | — | | | | 22,815 | |
Note 4–Federal Income Tax
As of June 30, 2019, the cost and unrealized appreciation (depreciation) of the Portfolio’s investment portfolio, including applicable derivative contracts and other financial instruments, as determined on a federal income tax basis, were as follows:
| | | | | | | | | | | | | | | | |
| | | Federal Tax
Cost | | | Gross
Unrealized
Appreciation | | | Gross
Unrealized
(Depreciation) | | | Net
Unrealized
Appreciation/
(Depreciation) | |
| | | | |
Investments in Securities | | $ | 561,136,283 | | | $ | 43,020,268 | | | $ | (15,388,624 | ) | | $ | 27,631,644 | |
As of December 31, 2018, for federal income tax purposes, capital loss carryforwards of $2317,694, as shown in the table below, were available to the extent provided by the regulations to offset future realized gains of the Portfolio through the years indicated. Accordingly, no capital gains distributions are expected to be paid to shareholders until net gains have been realized in excess of such amounts.
| | | | |
Capital Loss
Available Through | | Short-Term
Capital Loss
Amounts (000’s) | | Long-Term
Capital Loss
Amounts (000’s) |
| | |
| Unlimited | | $2,318 | | $ — |
During the year ended December 31, 2018, the tax character of distributions paid as reflected in the Statements of Changes in Net Assets was as follows:
| | |
|
| 2018 |
Tax-Based
Distributions
from Ordinary
Income | | Tax-Based
Distributions
from Long-Term
Gains |
| |
| $19,896,282 | | $21,609,834 |
Note 5–Restricted Securities
Restricted securities are securities which have been purchased through a private offering and cannot be resold to the general public without prior registration under the Securities Act of 1933, as amended. Disposal of these securities may involve time-consuming negotiations and expenses, and it may be difficult to obtain a prompt sale at an acceptable price.
As of June 30, 2019, the Portfolio held the following restricted securities:
| | | | | | | | | | | | | | | | | | | | |
Security | | Date of
Acquisition | | | Shares | | | Cost | | | 6/30/19
Value | | | Percent of
Net Assets | |
| | | | | |
ION Media Networks, Inc.
Common Stock | | | 3/11/14 | | | | 8 | | | $ | 13 | | | $ | 5,397 | | | | 0.0 | %‡ |
| ‡ | Less than one-tenth of a percent. |
| | |
| 38 | | MainStay VP Income Builder Portfolio |
Note 6–Custodian
State Street is the custodian of cash and securities held by the Portfolio. Custodial fees are charged to the Portfolio based on the Portfolio’s net assets and/or the market value of securities held by the Portfolio and the number of certain transactions incurred by the Portfolio.
Note 7–Line of Credit
The Portfolio and certain other funds managed by New York Life Investments maintain a line of credit with a syndicate of banks in order to secure a source of funds for temporary purposes to meet unanticipated or excessive redemption requests.
Effective July 30, 2019, under the credit agreement (the “Credit Agreement”), the aggregate commitment amount is $600,000,000 with an additional uncommitted amount of $100,000,000. The commitment fee is an annual rate of 0.15% of the average commitment amount payable quarterly, regardless of usage, to State Street, who serves as the agent to the syndicate. The commitment fee is allocated among the Portfolio and certain other funds managed by New York Life Investments based upon their respective net assets and other factors. Interest on any revolving credit loan is charged based upon the Federal Funds Rate or the one-month London Interbank Offered Rate (“LIBOR”), whichever is higher. The Credit Agreement expires on July 28, 2020, although the Portfolio, certain other funds managed by New York Life Investments and the syndicate of banks may renew the Credit Agreement for an additional year on the same or different terms. Prior to July 30, 2019, the aggregate commitment amount and the commitment fee were the same as those under the current Credit Agreement. During the six-month period ended June 30, 2019, there were no borrowings made or outstanding with respect to the Portfolio under the Credit Agreement.
Note 8–Interfund Lending Program
Pursuant to an exemptive order issued by the SEC, the Portfolio, along with certain other funds managed by New York Life Investments, may participate in an interfund lending program. The interfund lending program provides an alternative credit facility that permits the Portfolio and certain other funds managed by New York Life Investments to lend or borrow money for temporary purposes directly to or from one another, subject to the conditions of the exemptive order. During the six-month period ended June 30, 2019, there were no interfund loans made or outstanding with respect to the Portfolio.
Note 9–Purchases and Sales of Securities (in 000’s)
During the six-month period ended June 30, 2019, purchases and sales of U.S. government securities were $120,864 and $80,773, respectively. Purchases and sales of securities, other than U.S. government securities andshort-term securities, were $77,096 and $92,765, respectively.
Note 10–Capital Share Transactions
Transactions in capital shares for the six-month period ended June 30, 2019 and the year ended December 31, 2018, were as follows:
| | | | | | | | |
Initial Class | | Shares | | | Amount | |
| | |
Six-month period ended June 30, 2019: | | | | | | | | |
Shares sold | | | 94,761 | | | $ | 1,530,020 | |
Shares issued to shareholders in reinvestment of dividends and distributions | | | 332,696 | | | | 5,406,835 | |
Shares redeemed | | | (755,358 | ) | | | (12,179,115 | ) |
| | | | |
Net increase (decrease) | | | (327,901 | ) | | $ | (5,242,260 | ) |
| | | | |
Year ended December 31, 2018: | | | | | | | | |
Shares sold | | | 300,882 | | | $ | 5,010,909 | |
Shares issued to shareholders in reinvestment of dividends and distributions | | | 858,893 | | | | 13,810,543 | |
Shares redeemed | | | (1,402,756 | ) | | | (23,271,546 | ) |
| | | | |
Net increase (decrease) | | | (242,981 | ) | | $ | (4,450,094 | ) |
| | | | |
|
| |
Service Class | | Shares | | | Amount | |
Six-month period ended June 30, 2019: | | | | | | | | |
Shares sold | | | 1,363,888 | | | $ | 21,903,299 | |
Shares issued to shareholders in reinvestment of dividends and distributions | | | 670,507 | | | | 10,809,322 | |
Shares redeemed | | | (1,756,947 | ) | | | (28,006,363 | ) |
| | | | |
Net increase (decrease) | | | 277,448 | | | $ | 4,706,258 | |
| | | | |
Year ended December 31, 2018: | | | | | | | | |
Shares sold | | | 2,355,913 | | | $ | 39,177,026 | |
Shares issued to shareholders in reinvestment of dividends and distributions | | | 1,735,492 | | | | 27,695,573 | |
Shares redeemed | | | (4,981,260 | ) | | | (81,787,948 | ) |
| | | | |
Net increase (decrease) | | | (889,855 | ) | | $ | (14,915,349 | ) |
| | | | |
Note 11–Recent Accounting Pronouncement
To improve the effectiveness of fair value disclosure requirements, the Financial Accounting Standards Board recently issued Accounting Standard Update (ASU)2018-13, Fair Value Measurement Disclosure Framework—Changes to the Disclosure Requirements for Fair Value Measurement (ASU2018-13), which adds, removes, and modifies certain aspects relating to fair value disclosure. ASU2018-13 is effective for interim and annual reporting periods beginning after December 15, 2019; early adoption of the additions relating to ASU2018-13 is not required. Management has evaluated the implications of certain other provisions of the ASU and has determined to early adopt aspects related to the removal and modifications of certain fair value measurement disclosures under the ASU effective immediately. At this time, management is evaluating the implications of certain other provisions of the ASU related to new disclosure requirements and any impact on the financial statement disclosures has not yet been determined.
Note 12–Subsequent Events
In connection with the preparation of the financial statements of the Portfolio as of and for the six-month period ended June 30, 2019, events and transactions subsequent to June 30, 2019, through the date the financial statements were issued have been evaluated by the Portfolio’s management for possible adjustment and/or disclosure. No subsequent events requiring financial statement adjustment or disclosure have been identified.
Proxy Voting Policies and Procedures and Proxy Voting Record
A description of the policies and procedures that New York Life Investments uses to vote proxies related to the Portfolio’s securities is available without charge, upon request (i) by calling800-598-2019; (ii) by visiting New York Life Investments website at https://www.nylinvestments.com/mainstay/products-and-performance/mainstay-vp-funds-trust; or (iii) by visiting the SEC’s website at www.sec.gov.
The Portfolio is required to file with the SEC its proxy voting record for the12-month period ending June 30 on Form N-PX. The Portfolio’s most recent Form N-PX or proxy voting record is available free of charge upon request (i) by calling800-598-2019; (ii) by visiting New York Life Investments website at https://www.nylinvestments.com/mainstay/products-and-performance/mainstay-vp-funds-trust; or (iii) by visiting the SEC’s website atwww.sec.gov.
Shareholder Reports and Quarterly Portfolio Disclosure
The Portfolio is required to file its complete schedule of portfolio holdings with the SEC 60 days after each fiscal quarter onForm N-PORT. The Portfolio’s holdings report is available without charge upon request (i) by calling800-598-2019; (ii) by visiting New York Life Investments website at https://www.nylinvestments.com/mainstay/products-and-performance/mainstay-vp-funds-trust; or (iii) on the SEC’s website at www.sec.gov.
| | |
| 40 | | MainStay VP Income Builder Portfolio |
MainStay VP Portfolios
MainStay VP offers a wide range of Portfolios. The full array of MainStay VP offerings is listed here, with information about the manager, subadvisors, legal counsel, and independent registered public accounting firm.
Equity Portfolios
MainStay VP Eagle Small Cap Growth Portfolio
MainStay VP Emerging Markets Equity Portfolio
MainStay VP Epoch U.S. Equity Yield Portfolio
MainStay VP Fidelity Institutional AM® Utilities Portfolio†
MainStay VP Large Cap Growth Portfolio
MainStay VP MacKay Common Stock Portfolio
MainStay VP MacKay Growth Portfolio
MainStay VP MacKay International Equity Portfolio
MainStay VP MacKay Mid Cap Core Portfolio
MainStay VP MacKay S&P 500 Index Portfolio
MainStay VP MacKay Small Cap Core Portfolio
MainStay VP Mellon Natural Resources Portfolio
MainStay VP T. Rowe Price Equity Income Portfolio
Mixed Asset Portfolios
MainStay VP Balanced Portfolio
MainStay VP Income Builder Portfolio
MainStay VP Janus Henderson Balanced Portfolio
MainStay VP MacKay Convertible Portfolio
Income Portfolios
MainStay VP Bond Portfolio
MainStay VP Floating Rate Portfolio
MainStay VP Indexed Bond Portfolio
MainStay VP MacKay Government Portfolio
MainStay VP MacKay High Yield Corporate Bond Portfolio
MainStay VP MacKay Unconstrained Bond Portfolio
MainStay VP PIMCO Real Return Portfolio
Money Market
MainStay VP U.S. Government Money Market Portfolio
Alternative
MainStay VP Cushing Renaissance Advantage Portfolio
MainStay VP IQ Hedge Multi-Strategy Portfolio
Asset Allocation Portfolios
MainStay VP Conservative Allocation Portfolio
MainStay VP Growth Allocation Portfolio
MainStay VP Moderate Allocation Portfolio
MainStay VP Moderate Growth Allocation Portfolio
Manager
New York Life Investment Management LLC
New York, New York
Subadvisors
Candriam Belgium*
Brussels, Belgium
Cushing Asset Management, LP
Dallas, Texas
Eagle Asset Management, Inc.
St Petersburg, Florida
Epoch Investment Partners, Inc.
New York, New York
FIAM LLC
Smithfield, Rhode Island
IndexIQ Advisors LLC*
New York, New York
Janus Capital Management LLC
Denver, Colorado
MacKay Shields LLC*
New York, New York
Mellon Investments Corporation
Boston, Massachusetts
NYL Investors LLC*
New York, New York
Pacific Investment Management Company LLC
Newport Beach, California
T. Rowe Price Associates, Inc.
Baltimore, Maryland
Winslow Capital Management, LLC
Minneapolis, Minnesota
Distributor
NYLIFE Distributors LLC*
Jersey City, New Jersey
Custodian
State Street Bank and Trust Company
Boston, Massachusetts
Independent Registered Public Accounting Firm
PricewaterhouseCoopers LLP
New York, New York
Legal Counsel
Dechert LLP
Washington, District of Columbia
Some Portfolios may not be available in all products.
| † | Fidelity Institutional AM is a registered trade mark of FMR LLC. Used with permission. |
| * | An affiliate of New York Life Investment Management LLC |
Not part of the Semiannual Report
2019 Semiannual Report
This report is for the general information of New York Life Variable Annuities and NYLIAC Variable Universal Life Insurance Products policyowners. It must be preceded or accompanied by the appropriate product(s) and funds prospectuses if it is given to anyone who is not an owner of a New York Life variable annuity policy or a NYLIAC Variable Universal Life Insurance Product. This report does not offer for sale or solicit orders to purchase securities.
The performance data quoted in this report represents past performance. Past performance is no guarantee of future results. Due to market volatility and other factors, current performance may be lower or higher than the figures shown. The most recent month-end performance summary for your variable annuity or variable life policy is available by calling 800-598-2019 and is updated periodically on www.newyorklife.com.
The New York Life Variable Annuities and NYLIAC Variable Universal Life Insurance Products are issued by New York Life Insurance and Annuity Corporation (a Delaware Corporation) and distributed by NYLIFE Distributors LLC (Member FINRA/SIPC).
New York Life Insurance Company
New York Life Insurance and Annuity Corporation (NYLIAC) (A Delaware Corporation)
51 Madison Avenue, Room 551
New York, NY 10010
www.newyorklife.com
Printed on recycled paper
nylinvestments.com
NYLIFE Distributors LLC, 30 Hudson Street, Jersey City, NJ 07302
New York Life Investment Management LLC is the investment manager to the MainStay VP Funds Trust
©2019 by NYLIFE Distributors LLC. All rights reserved.
You may obtain copies of the Prospectus and the Statement of Additional Information free of charge, upon request, by callingtoll-free 800-598-2019 or writing to New York Life Insurance and Annuity Corporation, 51 Madison Avenue, New York, NY 10010.
| | | | |
| | | |
| Not FDIC Insured | | No Bank Guarantee | | May Lose Value |
| | | | |
1781626 | | | | MSVPIB10-08/19 (NYLIAC) NI522 |
MainStay VP Indexed Bond Portfolio
Message from the President and Semiannual Report
Unaudited | June 30, 2019

Beginning on January 1, 2021, as permitted by regulations adopted by the Securities and Exchange Commission, paper copies of the MainStay VP Portfolio annual and semi-annual shareholder reports may no longer be sent by mail, unless you specifically request paper copies of the reports from the insurance company that offers your policy. Instead, the reports will be made available online, and you will be notified by mail each time a report is posted and provided with a website link to access the report. Instructions for requesting paper copies will be provided by your insurance company.
If you already elected to receive shareholder reports electronically, you will not be affected by this change and you need not take any action. At any time, you may elect to receive reports and other communications from the insurance company electronically by following the instructions provided by the insurance company.
You may elect to receive all future shareholder reports in paper form free of charge. You can inform the insurance company that you wish to receive paper copies of reports by following the instructions provided by the insurance company. Your election to receive reports in paper form will apply to all portfolio companies available under your contract.
| | | | | | | | |
| | | | | |
| Not FDIC/NCUA Insured | | Not a Deposit | | May Lose Value | | No Bank Guarantee | | Not Insured by Any Government Agency |

This page intentionally left blank
Message from the President
Most equity and fixed-income markets in the United States and around the world advanced in the face of conflicting political and macroeconomic forces during thesix-month period ended June 30, 2019.
The reporting period began on the heels of tumultuous December 2018, during which equities and equity-sensitive bonds spiked sharply lower on concerns regarding the pace of economic growth, a U.S. government shutdown and the potential impact of trade disputes between the United States and other nations, particularly China. Markets recovered quickly in early 2019 as trade tensions eased, the government reopened and the U.S. Federal Reserve Board (Fed) adopted a more patient tone regarding the future direction of interest rates. Markets moved broadly higher from January through April, supported by encouraging economic data and generally strong corporate earnings.
During the first four months of the reporting period, the improving economic environment encouraged investors to favor areas of the market viewed as offering greater return potential along with higher risks. Among U.S. stocks, cyclical, growth-oriented sectors tended to outperform more defensive, value-oriented sectors, whilelarge-cap stocks outperformed theirsmaller-cap counterparts. Within the S&P 500® Index, the information technology sector led the market’s advance, followed by communication services, consumer discretionary and consumer staples. Industrials, utilities, financials, materials, real estate and energy produced more modest gains. While some international equity markets outperformed or underperformed the U.S. market, on average international stocks mirrored the performance of their U.S. counterparts. Fixed-income securities gained ground as well, albeit along a more gradual trajectory. Among U.S. fixed-income instruments, corporate issues generally outperformed government bonds, with lower credit quality, higher yielding securities leading the sector’s advance. Long-term U.S. Treasury bond yields proved particularly weak, with
10-year yields dipping at times below3-month yields, reflecting investors’ continued concerns about domestic economic growth.
May 2019 saw a return of uncertainty and volatility. Trade discussions between the United States and China faltered, driving global equity prices lower. Government bond prices rose as investors sought safe havens. June brought yet anotherU-turn as equity prices climbed again after comments from the Fed raised hopes of an interest rate cut in response to weak economic data. Stock and bond prices rose, with U.S. equity markets ending the reporting period in record territory.
We are pleased to see renewed signs of strength in broad areas of the financial market. At the same time, we remained sharply focused on providing you, as a MainStay VP investor, with the experienced and disciplined fund management that we believe underpins an effective, long-term investment strategy. Whatever tomorrow’s investment environment brings, you can rely on our portfolio managers to pursue the objectives of their individual Portfolios as outlined in the prospectus with the energy and dedication you have come to expect.
The report that follows contains additional information on the market events, investment decisions and specific securities that shaped your VP Portfolio’s performance during the six months ended June 30, 2019. We encourage you to read the report carefully and use it to evaluate your Portfolio’s performance in light of your long-range financial plan.
Sincerely,

Kirk C. Lehneis
President
The opinions expressed are as of the date of this report and are subject to change. There is no guarantee that any forecast made will come to pass. This material does not constitute investment advice and is not intended as an endorsement of any specific investment. Past performance is no guarantee of future results.
Not part of the Semiannual Report
Table of Contents
Investors should refer to the Portfolio’s Summary Prospectus and/or Prospectus and consider the Portfolio’s investment objectives, strategies, risks, charges and expenses carefully before investing. The Summary Prospectus and/or Prospectus contain this and other information about the Portfolio. You may obtain copies of the Portfolio’s Summary Prospectus and/or the Prospectus and the Statement of Additional Information free of charge, upon request, by calling toll-free 800-598-2019, by writing to New York Life Insurance and Annuity Corporation, 51 Madison Avenue, Room 251, New York, New York 10010 or by sending an email to MainStayShareholdersServices@nylim.com. These documents are also available at nylinvestments.com/vpdocuments. Please read the Summary Prospectus and/or Prospectus carefully before investing. MainStay VP Funds Trust portfolios are separate account options which are purchased through a variable insurance or variable annuity contract.
Investment and Performance Comparison1(Unaudited)
Performance data quoted represents past performance. Past performance is no guarantee of future results. Because of market volatility and other factors, current performance may be lower or higher than the figures shown. Investment return and principal value will fluctuate, and as a result, when shares are redeemed, they may be worth more or less than their original cost. The performance table and graph do not reflect any deduction of sales charges, mortality and expense charges, contract charges or administrative charges. Please refer to the Performance Summary appropriate for your policy. For performance information current to the most recent month-end, please call800-598-2019 or visit www.newyorklife.com.
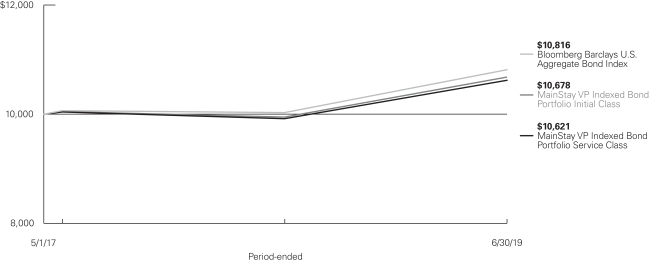
Average Annual Total Returns for the Period Ended June 30, 2019
| | | | | | | | | | | | | | | | | | | | |
| Class | | Inception Date | | | Six Months | | | One Year | | | Since Inception | | | Gross
Expense
Ratio2 | |
| | | | | |
Initial Class Shares | | | 5/1/2017 | | | | 6.00 | % | | | 7.34 | % | | | 3.07 | % | | | 0.31 | % |
Service Class Shares | | | 5/1/2017 | | | | 5.87 | | | | 7.07 | | | | 2.82 | | | | 0.56 | |
| | | | | | | | | | | | |
| Benchmark Performance | | Six
Months | | | One
Year | | | Since Inception | |
| | | |
Bloomberg Barclays U.S. Aggregate Bond Index3 | | | 6.11 | % | | | 7.87 | % | | | 3.69 | % |
Morningstar Intermediate-Term Bond Category Average4 | | | 5.77 | | | | 7.24 | | | | 3.39 | |
| 1. | Performance figures may reflect certain fee waivers and/or expense limitations, without which total returns may have been different. For information on current fee waivers and/or expense limitations (if any), please refer to the Notes to Financial Statements. |
| 2. | The gross expense ratios presented reflect the Portfolio’s “Total Annual Portfolio Operating Expenses” from the most recent Prospectus, as supplemented, and may differ from other expense ratios disclosed in this report. |
| 3. | The Bloomberg Barclays U.S. Aggregate Bond Index is the Portfolio’s primary broad-based securities market index for comparison purposes. The Bloomberg Barclays U.S. Aggregate Bond Index is a broad-based benchmark that measures performance of the investment-grade, U.S. dollar |
| | denominated, fixed-rate taxable bond market, including Treasurys, government-related and corporate securities, mortgage-backed securities (agency fixed-rate and hybrid adjustable-rate mortgage pass-throughs), asset-backed securities and commercial mortgage-backed securities. Results assume reinvestment of all dividends and capital gains. An investment cannot be made directly in an index. |
| 4. | The Morningstar Intermediate-Term Bond Category Average is representative of funds that invest primarily in corporate and other investment-grade U.S. fixed-income issues and typically have durations of 3.5 to 6.0 years. Results are based on average total returns of similar funds with all dividends and capital gain distributions reinvested. |
Cost in Dollars of a $1,000 Investment in MainStay VP Indexed Bond Portfolio (Unaudited)
The example below is intended to describe the fees and expenses borne by shareholders during the six-month period from January 1, 2019, to June 30, 2019, and the impact of those costs on your investment.
Example
As a shareholder of the Portfolio you incur two types of costs: (1) transaction costs, including exchange fees and sales charges (loads) on purchases (as applicable), and (2) ongoing costs, including management fees, distribution and/or service (12b-1) fees, and other Portfolio expenses (as applicable). This example is intended to help you understand your ongoing costs (in dollars) of investing in the Portfolio and to compare these costs with the ongoing costs of investing in other mutual funds. The example is based on an investment of $1,000 made at the beginning of the six-month period and held for the entire period from January 1, 2019, to June 30, 2019. Shares are only sold in connection with variable life and annuity contracts and the example does not reflect any contract level or transactional fees or expenses. If these costs had been included, your costs would have been higher.
This example illustrates your Portfolio’s ongoing costs in two ways:
Actual Expenses
The second and third data columns in the table below provide information about actual account values and actual expenses. You may use the information in these columns, together with the amount you invested, to estimate the expenses that you paid during the six months ended June 30, 2019. Simply divide your account value by $1,000
(for example, an $8,600 account value divided by $1,000 = 8.6), then multiply the result by the number under the heading entitled “Expenses Paid During Period” to estimate the expenses you paid on your account during this period.
Hypothetical Example for Comparison Purposes
The fourth and fifth data columns in the table below provide information about hypothetical account values and hypothetical expenses based on the Portfolio’s actual expense ratio and an assumed rate of return of 5% per year before expenses, which is not the Portfolio’s actual return. The hypothetical account values and expenses may not be used to estimate the actual ending account balances or expenses you paid for thesix-month period shown. You may use this information to compare the ongoing costs of investing in the Portfolio with the ongoing costs of investing in other mutual funds. To do so, compare this 5% hypothetical example with the 5% hypothetical examples that appear in the shareholder reports of the other mutual funds.
Please note that the expenses shown in the table are meant to highlight your ongoing costs only and do not reflect any transactional costs, such as exchange fees or sales charges (loads). Therefore, the fourth and fifth data columns of the table are useful in comparing ongoing costs only and will not help you determine the relative total costs of owning different funds. In addition, if these transactional costs were included, your costs would have been higher.
| | | | | | | | | | | | | | | | | | | | | | |
| | | | | | | | | | | | | | | | | | |
| Share Class | | Beginning
Account
Value
1/1/19 | | | Ending Account
Value (Based
on Actual
Returns and
Expenses)
6/30/19 | | | Expenses
Paid
During
Period1 | | | Ending Account
Value (Based
on Hypothetical
5% Annualized
Return and
Actual Expenses)
6/30/19 | | | Expenses
Paid
During
Period1 | | | Net Expense
Ratio
During
Period2 |
| | | | | | |
| Initial Class Shares | | $ | 1,000.00 | | | $ | 1,060.00 | | | $ | 1.53 | | | $ | 1,023.31 | | | $ | 1.51 | | | 0.30% |
| | | | | | |
| Service Class Shares | | $ | 1,000.00 | | | $ | 1,058.70 | | | $ | 2.81 | | | $ | 1,022.07 | | | $ | 2.76 | | | 0.55% |
| 1. | Expenses are equal to the Portfolio’s annualized expense ratio of each class multiplied by the average account value over the period, divided by 365 and multiplied by 181 (to reflect the six-month period). The table above represents the actual expenses incurred during the six-month period. In addition to the fees and expenses which the Portfolio bears directly, it also indirectly bears a pro rata share of the fees and expenses of the underlying funds in which it invests. Such indirect expenses are not included in the above-reported expense figures. |
| 2. | Expenses are equal to the Portfolio’s annualized expense ratio to reflect the six-month period. |
| | |
| 6 | | MainStay VP Indexed Bond Portfolio |
Portfolio Composition as of June 30, 2019(Unaudited)
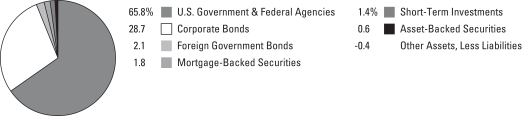
See Portfolio of Investments beginning on page 9 for specific holdings within these categories. The Portfolio’s holdings are suject to change.
Top Ten Issuers Held as of June 30, 2019(excluding short-term investments) (Unaudited)
| 1. | United States Treasury Notes, 1.375%–3.125%, due 9/30/19–5/15/29 |
| 2. | Federal National Mortgage Association (Mortgage Pass-Through Securities), 2.50%–5.50%, due 8/1/19–2/1/49 |
| 3. | United States Treasury Bonds, 2.75%–4.625%, due 2/15/36–2/15/49 |
| 4. | Government National Mortgage Association (Mortgage Pass-Through Securities), 2.50%–5.00%, due 9/29/40–3/20/49 |
| 5. | Federal Home Loan Mortgage Corporation (Mortgage Pass-Through Securities), 2.50%–5.50%, due 12/1/25–1/1/49 |
| 6. | KfW, 1.50%–2.125%, due 4/20/20–3/7/22 |
| 7. | Goldman Sachs Group, Inc., 2.60%–4.80%, due 12/27/20–7/8/44 |
| 8. | Federal National Mortgage Association, 1.875%–2.875%, due 10/30/20–9/24/26 |
| 9. | International Bank for Reconstruction & Development, 2.00%–3.00%, due 1/26/22–9/27/23 |
| 10. | Bank of America Corp., 3.248%–5.625%, due 7/1/20–1/21/44 |
Portfolio Management Discussion and Analysis (Unaudited)
Answers to the questions reflect the views of Kenneth Sommer and AJ Rzad, CFA, of NYL Investors LLC, the Portfolio’s Subadvisor.
How did MainStay VP Indexed Bond Portfolio perform relative to its benchmark and peers during the six months ended June 30, 2019?
During the six months ended June 30, 2019, MainStay VP Indexed Bond Portfolio returned 6.00% for Initial Class shares and 5.87% for Service Class shares. Over the same period, both share classes underperformed the 6.11% return of the Bloomberg Barclays U.S. Aggregate Bond Index,1 which is the Portfolio’s broad-based securities-market index. Although the Portfolio seeks investment results that correspond to the total return performance of fixed-income securities in the aggregate, as represented by the Portfolio’s broad-based securities-market index, the Portfolio’s performance will typically lag that of the Index because the Portfolio incurs fees and expenses that the Index does not. During the six months ended June 30, 2019, both share classes outperformed the 5.77% return of the Morningstar Intermediate-Term Bond Category Average.1
During the reporting period, how was the Portfolio’s performance materially affected by investments in derivatives?
The Portfolio used U.S. Treasury futures to reduce variations between the Portfolio and its benchmark. These trades reduced tracking error between the Portfolio and its benchmark.
During the reporting period, which credit-rating categories were strong performers and which credit-rating categories were weak?
During the reporting period, we saw the lowest-quality securities outperform the benchmark. Credits rated BBB2 had the highest excess returns3 followed by credits rated A.4 Credits rated AA slightly outperformed credits rated AAA.5 All credit rating categories produced positive excess returns, outperforming Treasury securities with comparable durations.6
What was the Portfolio’s duration strategy during the reporting period?
The Portfolio uses a passive strategy that seeks to replicate the duration of its benchmark. The Portfolio’s duration strategy had a neutral impact on performance during the reporting period. As of June 30, 2019, the Portfolio’s duration was approximately 5.53 years, which was equivalent to the duration of 5.53 years for the Bloomberg Barclays U.S. Aggregate Bond Index
Which market segments made the strongest contributions to the Portfolio’s performance, and which market segments detracted the most?
During the reporting period, all broad sectors in the Barclays Aggregate Bond Index produced positive total returns. The strongest-contributing sector in the Portfolio was the corporate sector. (Contributions take weightings and total returns into account.) Within the corporate sector, the industrial subcomponent was the best performer. Industrials, utilities and financials all outperformed thenon-corporate sector. Within thenon-corporate sector, the sovereign subsector was the Portfolio’s best performer. Among securitized products, commercial mortgage-backed securities outperformed both mortgage-backed securities and asset-backed securities. U.S. government agencies outperformed U.S. Treasury bonds during the reporting period.
Were there any significant changes to the Portfolio’s benchmark during the reporting period?
No changes to the Bloomberg Barclays U.S. Aggregate Bond Index were material enough to lead us to change our investment strategy.
| 1. | See page 5 for more information on benchmark and peer group returns. |
| 2. | An obligation rated ‘BBB’ by Standard & Poor’s (“S&P”) is deemed by S&P to exhibit adequate protection parameters. In the opinion of S&P, however, adverse economic conditions or changing circumstances are more likely to lead to a weakened capacity of the obligor to meet its financial commitment on the obligation. When applied to Portfolio holdings, ratings are based solely on the creditworthiness of the bonds in the portfolio and are not meant to represent the security or safety of the Portfolio. |
| 3. | The expression “excess return” may refer to the return that a security or portfolio provides above (or below) an investment with the lowest perceived risk, such as comparable U.S. Treasury securities. The expression may also refer to the return that a security or portfolio provides above (or below) an index or other benchmark. |
| 4. | An obligation rated ‘A’ by S&P is deemed by S&P to be somewhat more susceptible to the adverse effects of changes in circumstances and economic conditions than obligations in higher-rated categories. In the opinion of S&P, however, the obligor’s capacity to meet its financial commitment on the obligation is still strong. |
| 5. | An obligation rated ‘AAA’ has the highest rating assigned by S&P, and in the opinion of S&P, the obligor’s capacity to meet its financial commitment on the obligation is extremely strong. An obligation rated ‘AA’ by S&P is deemed by S&P to differ from the highest-rated obligations only to a small degree. In the opinion of S&P, the obligor’s capacity to meet its financial commitment on the obligation is very strong. |
| 6. | Duration is a measure of the price sensitivity of a fixed-income investment to changes in interest rates. Duration is expressed as a number of years and is considered a more accurate sensitivity gauge than average maturity. |
The opinions expressed are those of the portfolio managers as of the date of this report and are subject to change. There is no guarantee that any forecasts will come to pass. This material does not constitute investment advice and is not intended as an endorsement of any specific investment.
Not all MainStay VP Portfolios and/or share classes are available under all policies.
| | |
| 8 | | MainStay VP Indexed Bond Portfolio |
Portfolio of InvestmentsJune 30, 2019 (Unaudited)
| | | | | | | | |
| | | Principal
Amount | | | Value | |
Long-Term Bonds 99.0%† Asset-Backed Securities 0.6% | |
Automobile 0.6% | |
Ally Auto Receivables Trust
Series 2018-3, Class A3
3.00%, due 1/17/23 | | $ | 99,000 | | | $ | 99,931 | |
BMW Vehicle Lease Trust
Series 2018-1, Class A4
3.26%, due 7/20/21 | | | 200,000 | | | | 202,614 | |
Ford Credit Floorplan Master Owner Trust
Series 2017-2, Class A1
2.16%, due 9/15/22 | | | 300,000 | | | | 299,630 | |
GM Financial Securitized Term Auto Receivables Trust
Series 2018-3, Class A3
3.02%, due 5/16/23 | | | 700,000 | | | | 710,767 | |
Honda Auto Receivables Owner Trust
Series 2018-3, Class A3
2.95%, due 8/22/22 | | | 800,000 | | | | 810,004 | |
Hyundai Auto Lease Securitization Trust
Series 2018-B, Class A3
3.04%, due 10/15/21 (a) | | | 100,000 | | | | 100,714 | |
Hyundai Auto Receivables Trust
Series 2016-A, Class A3
1.56%, due 9/15/20 | | | 5,740 | | | | 5,737 | |
Mercedes Benz Auto Lease Trust
Series 2017-A, Class A3
1.79%, due 4/15/20 | | | 8,874 | | | | 8,871 | |
| | | | | | | | |
Total Asset-Backed Securities
(Cost $2,213,328) | | | | | | | 2,238,268 | |
| | | | | |
| | |
| Corporate Bonds 28.7% | | | | | | | | |
Aerospace & Defense 0.5% | | | | | | | | |
Boeing Co.
3.25%, due 3/1/28 | | | 210,000 | | | | 217,849 | |
General Dynamics Corp.
3.00%, due 5/11/21 | | | 255,000 | | | | 259,129 | |
Lockheed Martin Corp.
4.07%, due 12/15/42 | | | 255,000 | | | | 282,116 | |
Northrop Grumman Corp.
7.75%, due 2/15/31 | | | 210,000 | | | | 300,067 | |
Raytheon Co.
3.15%, due 12/15/24 | | | 255,000 | | | | 265,967 | |
Rockwell Collins, Inc.
3.50%, due 3/15/27 | | | 210,000 | | | | 218,526 | |
United Technologies Corp. | | | | | | | | |
2.65%, due 11/1/26 | | | 610,000 | | | | 610,013 | |
3.65%, due 8/16/23 | | | 50,000 | | | | 52,365 | |
| | | | | | | | |
| | | | | | | 2,206,032 | |
| | | | | | | | |
| | | | | | | | |
| | | Principal
Amount | | | Value | |
Apparel 0.0%‡ | |
Nike, Inc.
3.625%, due 5/1/43 | | $ | 65,000 | | | $ | 66,530 | |
| | | | | | | | |
|
Auto Manufacturers 0.6% | |
Ford Motor Credit Co. LLC
3.219%, due 1/9/22 | | | 1,300,000 | | | | 1,300,487 | |
General Motors Financial Co., Inc.
4.35%, due 1/17/27 | | | 665,000 | | | | 677,390 | |
Toyota Motor Credit Corp.
2.25%, due 10/18/23 | | | 290,000 | | | | 289,062 | |
| | | | | | | | |
| | | | | | | 2,266,939 | |
| | | | | | | | |
Banks 7.7% | |
Bank of America Corp. | | | | | | | | |
3.248%, due 10/21/27 | | | 405,000 | | | | 414,960 | |
3.30%, due 1/11/23 | | | 835,000 | | | | 860,699 | |
3.419%, due 12/20/28 (b) | | | 510,000 | | | | 524,788 | |
5.00%, due 1/21/44 | | | 320,000 | | | | 390,050 | |
5.625%, due 7/1/20 | | | 375,000 | | | | 387,143 | |
Bank of New York Mellon Corp. | | | | | | | | |
2.05%, due 5/3/21 | | | 95,000 | | | | 94,808 | |
2.50%, due 4/15/21 | | | 610,000 | | | | 613,353 | |
3.00%, due 2/24/25 | | | 410,000 | | | | 421,640 | |
Bank of Nova Scotia
2.70%, due 3/7/22 | | | 720,000 | | | | 729,669 | |
Barclays PLC
5.25%, due 8/17/45 | | | 270,000 | | | | 293,109 | |
BB&T Corp. | | | | | | | | |
2.05%, due 5/10/21 | | | 705,000 | | | | 701,257 | |
2.75%, due 4/1/22 | | | 255,000 | | | | 258,087 | |
BNP Paribas S.A.
3.25%, due 3/3/23 | | | 445,000 | | | | 460,249 | |
Capital One Financial Co.
3.05%, due 3/9/22 | | | 565,000 | | | | 573,792 | |
Citigroup, Inc. | | | | | | | | |
2.65%, due 10/26/20 | | | 610,000 | | | | 612,147 | |
3.375%, due 3/1/23 | | | 915,000 | | | | 943,303 | |
4.45%, due 9/29/27 | | | 735,000 | | | | 791,892 | |
4.65%, due 7/30/45 | | | 170,000 | | | | 195,814 | |
Cooperatieve Centrale Raiffeisen-Boerenleenbank B.A.
5.25%, due 5/24/41 | | | 405,000 | | | | 519,417 | |
Credit Suisse Group Funding Guernsey, Ltd.
3.80%, due 6/9/23 | | | 335,000 | | | | 347,419 | |
Fifth Third Bank
2.25%, due 6/14/21 | | | 470,000 | | | | 469,877 | |
Goldman Sachs Group, Inc. | | | | | | | | |
2.60%, due 12/27/20 | | | 525,000 | | | | 525,504 | |
2.905%, due 7/24/23 (b) | | | 1,420,000 | | | | 1,433,732 | |
3.85%, due 1/26/27 | | | 520,000 | | | | 543,502 | |
4.80%, due 7/8/44 | | | 220,000 | | | | 253,264 | |
| | | | | | |
The notes to the financial statements are an integral part of,
and should be read in conjunction with, the financial statements. | | | | | 9 | |
Portfolio of InvestmentsJune 30, 2019 (Unaudited) (continued)
| | | | | | | | |
| | | Principal
Amount | | | Value | |
| Corporate Bonds (continued) | |
Banks (continued) | | | | | | | | |
HSBC Holdings PLC | | | | | | | | |
2.65%, due 1/5/22 | | $ | 1,060,000 | | | $ | 1,064,116 | |
3.90%, due 5/25/26 | | | 250,000 | | | | 261,138 | |
JPMorgan Chase & Co. | | | | | | | | |
4.25%, due 10/1/27 | | | 1,340,000 | | | | 1,451,295 | |
4.26%, due 2/22/48 (b) | | | 500,000 | | | | 551,042 | |
Keybank N.A.
2.40%, due 6/9/22 | | | 335,000 | | | | 336,223 | |
KfW | | | | | | | | |
1.50%, due 4/20/20 | | | 830,000 | | | | 825,835 | |
2.125%, due 3/7/22 | | | 2,730,000 | | | | 2,753,466 | |
Lloyds Banking Group PLC
3.75%, due 1/11/27 | | | 270,000 | | | | 274,902 | |
Mitsubishi UFJ Financial Group, Inc.
3.455%, due 3/2/23 | | | 510,000 | | | | 524,329 | |
Morgan Stanley | | | | | | | | |
2.50%, due 4/21/21 | | | 450,000 | | | | 450,843 | |
3.625%, due 1/20/27 | | | 750,000 | | | | 787,152 | |
4.10%, due 5/22/23 | | | 555,000 | | | | 584,229 | |
National Australia Bank, Ltd.
2.50%, due 5/22/22 | | | 335,000 | | | | 336,994 | |
PNC Bank N.A.
2.625%, due 2/17/22 | | | 335,000 | | | | 337,866 | |
Royal Bank of Canada
2.75%, due 2/1/22 | | | 330,000 | | | | 335,226 | |
Royal Bank of Scotland Group PLC
3.875%, due 9/12/23 | | | 270,000 | | | | 277,034 | |
Santander UK PLC
2.375%, due 3/16/20 | | | 610,000 | | | | 609,920 | |
State Street Corp.
4.375%, due 3/7/21 | | | 350,000 | | | | 362,705 | |
Sumitomo Mitsui Banking Corp.
2.65%, due 7/23/20 | | | 1,355,000 | | | | 1,360,080 | |
Toronto-Dominion Bank
2.50%, due 12/14/20 | | | 445,000 | | | | 447,557 | |
U.S. Bank N.A.
2.00%, due 1/24/20 | | | 1,420,000 | | | | 1,418,263 | |
Wells Fargo & Co. | | | | | | | | |
2.55%, due 12/7/20 | | | 300,000 | | | | 300,841 | |
3.00%, due 4/22/26 | | | 600,000 | | | | 606,566 | |
3.50%, due 3/8/22 | | | 355,000 | | | | 365,259 | |
4.75%, due 12/7/46 | | | 500,000 | | | | 569,939 | |
Westpac Banking Corp.
2.80%, due 1/11/22 | | | 445,000 | | | | 450,537 | |
| | | | | | | | |
| | | | | | | 31,002,832 | |
| | | | | | | | |
Beverages 0.8% | |
Anheuser-Busch Cos., LLC / Anheuser-Busch InBev Worldwide, Inc.
4.90%, due 2/1/46 | | | 1,265,000 | | | | 1,408,491 | |
| | | | | | | | |
| | | Principal
Amount | | | Value | |
Beverages (continued) | | | | | | | | |
Anheuser-Busch InBev Worldwide, Inc.
2.50%, due 7/15/22 | | $ | 365,000 | | | $ | 367,945 | |
Coca Cola Co.
2.25%, due 9/1/26 | | | 290,000 | | | | 288,035 | |
Constellation Brands, Inc.
3.60%, due 2/15/28 | | | 100,000 | | | | 103,274 | |
Diageo Capital PLC
5.875%, due 9/30/36 | | | 218,000 | | | | 288,063 | |
Keurig Dr Pepper, Inc.
4.985%, due 5/25/38 | | | 65,000 | | | | 71,276 | |
Molson Coors Brewing Co.
4.20%, due 7/15/46 | | | 65,000 | | | | 62,052 | |
PepsiCo, Inc. | | | | | | | | |
2.75%, due 3/1/23 | | | 330,000 | | | | 337,081 | |
2.85%, due 2/24/26 | | | 210,000 | | | | 215,821 | |
4.45%, due 4/14/46 | | | 105,000 | | | | 125,627 | |
| | | | | | | | |
| | | | | | | 3,267,665 | |
| | | | | | | | |
Biotechnology 0.5% | |
Amgen, Inc. | | | | | | | | |
2.70%, due 5/1/22 | | | 180,000 | | | | 181,803 | |
3.125%, due 5/1/25 | | | 255,000 | | | | 261,120 | |
4.40%, due 5/1/45 | | | 180,000 | | | | 191,218 | |
Baxalta, Inc.
3.60%, due 6/23/22 | | | 39,000 | | | | 40,021 | |
Celgene Corp. | | | | | | | | |
2.75%, due 2/15/23 | | | 25,000 | | | | 25,222 | |
3.55%, due 8/15/22 | | | 155,000 | | | | 160,505 | |
3.625%, due 5/15/24 | | | 510,000 | | | | 535,388 | |
Gilead Sciences, Inc. | | | | | | | | |
3.65%, due 3/1/26 | | | 440,000 | | | | 464,528 | |
4.60%, due 9/1/35 | | | 180,000 | | | | 202,604 | |
| | | | | | | | |
| | | | | | | 2,062,409 | |
| | | | | | | | |
Building Materials 0.0%‡ | |
Johnson Controls International PLC
6.00%, due 1/15/36 | | | 50,000 | | | | 58,997 | |
| | | | | | | | |
|
Chemicals 0.4% | |
Dow Chemical Co.
3.00%, due 11/15/22 | | | 445,000 | | | | 451,130 | |
DuPont de Nemours, Inc.
4.493%, due 11/15/25 | | | 375,000 | | | | 414,960 | |
Mosaic Co.
4.05%, due 11/15/27 | | | 405,000 | | | | 418,591 | |
Nutrien, Ltd.
5.875%, due 12/1/36 | | | 210,000 | | | | 243,853 | |
Sherwin-Williams Co.
3.95%, due 1/15/26 | | | 255,000 | | | | 267,461 | |
| | | | | | | | |
| | | | | | | 1,795,995 | |
| | | | | | | | |
| | | | |
| 10 | | MainStay VP Indexed Bond Portfolio | | The notes to the financial statements are an integral part of,
and should be read in conjunction with, the financial statements. |
| | | | | | | | |
| | | Principal
Amount | | | Value | |
| Corporate Bonds (continued) | |
Commercial Services 0.1% | |
Ecolab, Inc.
2.70%, due 11/1/26 | | $ | 210,000 | | | $ | 211,955 | |
| | | | | | | | |
|
Computers 0.7% | |
Apple, Inc. | | | | | | | | |
2.15%, due 2/9/22 (c) | | | 180,000 | | | | 180,707 | |
2.90%, due 9/12/27 | | | 250,000 | | | | 255,936 | |
3.35%, due 2/9/27 | | | 16,000 | | | | 16,801 | |
4.25%, due 2/9/47 | | | 180,000 | | | | 202,351 | |
4.50%, due 2/23/36 | | | 245,000 | | | | 287,217 | |
Dell International LLC / EMC Corp. (a) | | | | | | | | |
5.45%, due 6/15/23 | | | 445,000 | | | | 479,617 | |
6.02%, due 6/15/26 | | | 300,000 | | | | 330,955 | |
Hewlett Packard Enterprise Co.
4.40%, due 10/15/22 | | | 180,000 | | | | 189,870 | |
IBM Corp. | | | | | | | | |
1.875%, due 8/1/22 | | | 200,000 | | | | 197,997 | |
3.45%, due 2/19/26 | | | 175,000 | | | | 182,934 | |
3.50%, due 5/15/29 | | | 290,000 | | | | 303,508 | |
| | | | | | | | |
| | | | | | | 2,627,893 | |
| | | | | | | | |
Cosmetics & Personal Care 0.1% | |
Procter & Gamble Co.
2.70%, due 2/2/26 | | | 210,000 | | | | 213,909 | |
Unilever Capital Corp.
3.10%, due 7/30/25 | | | 100,000 | | | | 103,653 | |
| | | | | | | | |
| | | | | | | 317,562 | |
| | | | | | | | |
Diversified Financial Services 0.5% | |
American Express Co. | | | | | | | | |
2.20%, due 10/30/20 | | | 300,000 | | | | 299,641 | |
3.40%, due 2/27/23 | | | 365,000 | | | | 377,857 | |
GE Capital International Funding Co.
3.373%, due 11/15/25 | | | 925,000 | | | | 936,380 | |
National Rural Utilities Cooperative Finance Corp.
2.70%, due 2/15/23 | | | 90,000 | | | | 91,260 | |
Visa, Inc.
2.80%, due 12/14/22 | | | 405,000 | | | | 414,705 | |
| | | | | | | | |
| | | | | | | 2,119,843 | |
| | | | | | | | |
Electric 1.8% | |
American Electric Power Co., Inc.
2.15%, due 11/13/20 | | | 525,000 | | | | 523,834 | |
CenterPoint Energy Houston Electric LLC
4.25%, due 2/1/49 | | | 250,000 | | | | 283,351 | |
Commonwealth Edison Co.
3.65%, due 6/15/46 | | | 390,000 | | | | 396,252 | |
Consolidated Edison Co. of New York, Inc.
5.85%, due 3/15/36 | | | 565,000 | | | | 707,496 | |
| | | | | | | | |
| | | Principal
Amount | | | Value | |
Electric (continued) | | | | | | | | |
DTE Electric Co.
3.375%, due 3/1/25 | | $ | 180,000 | | | $ | 187,565 | |
Duke Energy Carolinas LLC | | | | | | | | |
3.875%, due 3/15/46 | | | 690,000 | | | | 724,368 | |
4.00%, due 9/30/42 | | | 210,000 | | | | 224,068 | |
Edison International
2.95%, due 3/15/23 (c) | | | 180,000 | | | | 172,460 | |
Emera U.S. Finance, L.P.
2.70%, due 6/15/21 | | | 180,000 | | | | 180,615 | |
Exelon Corp.
2.85%, due 6/15/20 | | | 375,000 | | | | 376,188 | |
Florida Power & Light Co. | | | | | | | | |
2.75%, due 6/1/23 | | | 120,000 | | | | 122,253 | |
3.80%, due 12/15/42 | | | 165,000 | | | | 175,244 | |
Kentucky Utilities Co.
3.25%, due 11/1/20 | | | 260,000 | | | | 262,227 | |
MidAmerican Energy Co.
3.95%, due 8/1/47 | | | 330,000 | | | | 356,282 | |
Ohio Power Co.
Series G
6.60%, due 2/15/33 | | | 165,000 | | | | 224,074 | |
PPL Electric Utilities Corp.
3.95%, due 6/1/47 | | | 100,000 | | | | 106,486 | |
San Diego Gas & Electric Co.
4.15%, due 5/15/48 | | | 210,000 | | | | 218,816 | |
Sempra Energy
3.80%, due 2/1/38 | | | 210,000 | | | | 203,092 | |
Southern California Edison Co.
4.125%, due 3/1/48 | | | 210,000 | | | | 211,721 | |
Southern Co. | | | | | | | | |
2.95%, due 7/1/23 | | | 180,000 | | | | 182,696 | |
4.40%, due 7/1/46 | | | 250,000 | | | | 263,895 | |
Virginia Electric & Power Co.
4.00%, due 1/15/43 | | | 365,000 | | | | 385,625 | |
Xcel Energy, Inc.
3.30%, due 6/1/25 | | | 730,000 | | | | 753,477 | |
| | | | | | | | |
| | | | | | | 7,242,085 | |
| | | | | | | | |
Environmental Controls 0.1% | |
Republic Services, Inc.
3.20%, due 3/15/25 | | | 255,000 | | | | 263,485 | |
Waste Management, Inc.
3.15%, due 11/15/27 | | | 255,000 | | | | 263,310 | |
| | | | | | | | |
| | | | | | | 526,795 | |
| | | | | | | | |
Finance—Credit Card 0.1% | |
Visa, Inc.
4.30%, due 12/14/45 | | | 175,000 | | | | 207,292 | |
| | | | | | | | |
|
Food 0.3% | |
General Mills, Inc. | | | | | | | | |
3.15%, due 12/15/21 | | | 180,000 | | | | 183,030 | |
4.20%, due 4/17/28 | | | 65,000 | | | | 70,175 | |
| | | | | | |
The notes to the financial statements are an integral part of,
and should be read in conjunction with, the financial statements. | | | | | 11 | |
Portfolio of InvestmentsJune 30, 2019 (Unaudited) (continued)
| | | | | | | | |
| | | Principal
Amount | | | Value | |
| Corporate Bonds (continued) | |
Food (continued) | | | | | | | | |
Kraft Heinz Foods Co.
3.00%, due 6/1/26 | | $ | 555,000 | | | $ | 540,063 | |
Sysco Corp.
3.25%, due 7/15/27 | | | 255,000 | | | | 260,054 | |
Tyson Foods, Inc.
5.10%, due 9/28/48 | | | 250,000 | | | | 282,379 | |
| | | | | | | | |
| | | | | | | 1,335,701 | |
| | | | | | | | |
Forest Products & Paper 0.2% | |
Fibria Overseas Finance, Ltd.
5.50%, due 1/17/27 | | | 405,000 | | | | 433,962 | |
International Paper Co.
3.80%, due 1/15/26 | | | 260,000 | | | | 271,309 | |
| | | | | | | | |
| | | | | | | 705,271 | |
| | | | | | | | |
Gas 0.1% | |
NiSource, Inc.
3.49%, due 5/15/27 | | | 210,000 | | | | 217,220 | |
| | | | | | | | |
|
Health Care—Products 0.4% | |
Abbott Laboratories | | | | | | | | |
3.75%, due 11/30/26 | | | 150,000 | | | | 162,180 | |
4.90%, due 11/30/46 | | | 100,000 | | | | 123,576 | |
Becton Dickinson & Co.
3.70%, due 6/6/27 | | | 131,000 | | | | 136,787 | |
Boston Scientific Corp.
4.70%, due 3/1/49 | | | 200,000 | | | | 229,533 | |
Medtronic, Inc.
4.625%, due 3/15/45 | | | 430,000 | | | | 520,888 | |
Stryker Corp.
3.65%, due 3/7/28 | | | 210,000 | | | | 222,828 | |
Thermo Fisher Scientific, Inc. | | | | | | | | |
2.95%, due 9/19/26 | | | 290,000 | | | | 291,653 | |
3.60%, due 8/15/21 | | | 100,000 | | | | 102,317 | |
| | | | | | | | |
| | | | | | | 1,789,762 | |
| | | | | | | | |
Health Care—Services 0.4% | |
Aetna, Inc.
6.625%, due 6/15/36 | | | 210,000 | | | | 258,364 | |
Anthem, Inc.
4.375%, due 12/1/47 | | | 255,000 | | | | 272,286 | |
Laboratory Corporation of America Holdings
3.60%, due 2/1/25 | | | 255,000 | | | | 263,743 | |
UnitedHealth Group, Inc. | | | | | | | | |
3.10%, due 3/15/26 | | | 500,000 | | | | 514,953 | |
4.45%, due 12/15/48 | | | 250,000 | | | | 287,881 | |
| | | | | | | | |
| | | | | | | 1,597,227 | |
| | | | | | | | |
Household Products & Wares 0.1% | |
Clorox Co.
3.90%, due 5/15/28 | | | 210,000 | | | | 226,907 | |
| | | | | | | | |
| | | Principal
Amount | | | Value | |
Household Products & Wares (continued) | |
Kimberly-Clark Corp.
2.75%, due 2/15/26 | | $ | 210,000 | | | $ | 213,849 | |
| | | | | | | | |
| | | | | | | 440,756 | |
| | | | | | | | |
Housewares 0.1% | |
Newell Brands, Inc.
3.85%, due 4/1/23 | | | 265,000 | | | | 268,891 | |
| | | | | | | | |
|
Insurance 0.7% | |
Allstate Corp.
5.35%, due 6/1/33 | | | 210,000 | | | | 261,437 | |
American International Group, Inc.
6.25%, due 5/1/36 | | | 350,000 | | | | 437,035 | |
Berkshire Hathaway Finance Corp.
4.30%, due 5/15/43 | | | 355,000 | | | | 395,979 | |
Chubb INA Holdings, Inc.
3.35%, due 5/3/26 | | | 180,000 | | | | 188,778 | |
Marsh & McLennan Cos., Inc.
2.75%, due 1/30/22 | | | 390,000 | | | | 393,653 | |
Metlife, Inc.
3.00%, due 3/1/25 | | | 330,000 | | | | 340,443 | |
Progressive Corp.
3.75%, due 8/23/21 | | | 300,000 | | | | 309,976 | |
Prudential Financial, Inc. | | | | | | | | |
4.418%, due 3/27/48 | | | 125,000 | | | | 141,345 | |
4.50%, due 11/15/20 | | | 330,000 | | | | 340,079 | |
| | | | | | | | |
| | | | | | | 2,808,725 | |
| | | | | | | | |
Internet 0.3% | |
Alphabet, Inc.
3.375%, due 2/25/24 | | | 300,000 | | | | 316,875 | |
Amazon.com, Inc.
3.875%, due 8/22/37 | | | 810,000 | | | | 893,123 | |
| | | | | | | | |
| | | | | | | 1,209,998 | |
| | | | | | | | |
Machinery—Construction & Mining 0.1% | |
Caterpillar, Inc.
5.30%, due 9/15/35 | | | 260,000 | | | | 317,178 | |
| | | | | | | | |
|
Machinery—Diversified 0.0%‡ | |
Deere & Co.
3.90%, due 6/9/42 | | | 145,000 | | | | 158,043 | |
| | | | | | | | |
|
Media 1.2% | |
Charter Communications Operating LLC / Charter Communications Operating Capital | | | | | | | | |
4.908%, due 7/23/25 | | | 750,000 | | | | 814,233 | |
5.75%, due 4/1/48 | | | 250,000 | | | | 276,505 | |
Comcast Corp. | | | | | | | | |
1.625%, due 1/15/22 | | | 615,000 | | | | 607,356 | |
3.40%, due 7/15/46 | | | 555,000 | | | | 532,172 | |
4.15%, due 10/15/28 | | | 555,000 | | | | 611,693 | |
| | | | |
| 12 | | MainStay VP Indexed Bond Portfolio | | The notes to the financial statements are an integral part of,
and should be read in conjunction with, the financial statements. |
| | | | | | | | |
| | | Principal
Amount | | | Value | |
| Corporate Bonds (continued) | |
Media (continued) | |
Discovery Communications LLC
3.95%, due 3/20/28 | | $ | 350,000 | | | $ | 360,309 | |
TWDC Enterprises 18 Corp.
2.35%, due 12/1/22 | | | 510,000 | | | | 513,553 | |
Walt Disney Co. (a) | | | | | | | | |
3.00%, due 9/15/22 | | | 615,000 | | | | 629,881 | |
6.40%, due 12/15/35 | | | 410,000 | | | | 559,058 | |
| | | | | | | | |
| | | | | | | 4,904,760 | |
| | | | | | | | |
Mining 0.3% | |
Barrick North America Finance LLC
5.70%, due 5/30/41 | | | 100,000 | | | | 119,611 | |
BHP Billiton Finance USA, Ltd.
3.85%, due 9/30/23 | | | 430,000 | | | | 458,485 | |
Rio Tinto Finance USA, Ltd.
3.75%, due 6/15/25 | | | 405,000 | | | | 435,192 | |
| | | | | | | | |
| | | | | | | 1,013,288 | |
| | | | | | | | |
Miscellaneous—Manufacturing 0.4% | |
3m Co.
4.00%, due 9/14/48 | | | 250,000 | | | | 270,425 | |
Eaton Corp.
4.00%, due 11/2/32 | | | 210,000 | | | | 232,362 | |
General Electric Co.
4.125%, due 10/9/42 | | | 555,000 | | | | 511,177 | |
Ingersoll-Rand Luxembourg Finance S.A.
2.625%, due 5/1/20 | | | 375,000 | | | | 375,201 | |
Parker-Hannifin Corp. | | | | | | | | |
3.50%, due 9/15/22 | | | 240,000 | | | | 247,642 | |
4.20%, due 11/21/34 | | | 65,000 | | | | 71,030 | |
| | | | | | | | |
| | | | | | | 1,707,837 | |
| | | | | | | | |
Multi-National 1.8% | |
Asian Development Bank
2.75%, due 3/17/23 | | | 1,000,000 | | | | 1,033,760 | |
European Investment Bank | | | | | | | | |
2.25%, due 8/15/22 | | | 1,525,000 | | | | 1,545,291 | |
2.375%, due 5/24/27 | | | 570,000 | | | | 586,738 | |
Inter-American Development Bank
1.75%, due 4/14/22 | | | 915,000 | | | | 913,524 | |
International Bank for Reconstruction & Development | | | | | | | | |
2.00%, due 1/26/22 | | | 1,525,000 | | | | 1,533,105 | |
3.00%, due 9/27/23 | | | 1,000,000 | | | | 1,048,140 | |
Japan Bank for International Cooperation
2.875%, due 6/1/27 | | | 576,000 | | | | 597,460 | |
| | | | | | | | |
| | | | | | | 7,258,018 | |
| | | | | | | | |
Oil & Gas 1.4% | |
Anadarko Petroleum Corp.
5.55%, due 3/15/26 | | | 320,000 | | | | 359,641 | |
| | | | | | | | |
| | | Principal
Amount | | | Value | |
Oil & Gas (continued) | |
BP Capital Markets America, Inc.
3.588%, due 4/14/27 | | $ | 250,000 | | | $ | 262,409 | |
Canadian Natural Resources, Ltd.
6.25%, due 3/15/38 | | | 100,000 | | | | 123,471 | |
Cenovus Energy, Inc.
5.25%, due 6/15/37 | | | 300,000 | | | | 313,774 | |
Chevron Corp.
3.191%, due 6/24/23 | | | 410,000 | | | | 425,529 | |
ConocoPhillips Co.
5.95%, due 3/15/46 | | | 95,000 | | | | 131,122 | |
Devon Energy Corp.
4.75%, due 5/15/42 | | | 210,000 | | | | 229,962 | |
Enterprise Products Operating LLC
4.80%, due 2/1/49 | | | 350,000 | | | | 388,394 | |
EOG Resources, Inc.
3.90%, due 4/1/35 | | | 180,000 | | | | 189,170 | |
Equinor ASA
5.10%, due 8/17/40 | | | 360,000 | | | | 448,778 | |
Exxon Mobil Corp.
4.114%, due 3/1/46 | | | 390,000 | | | | 448,750 | |
Hess Corp.
7.125%, due 3/15/33 | | | 100,000 | | | | 122,567 | |
Marathon Petroleum Corp.
5.125%, due 3/1/21 | | | 1,020,000 | | | | 1,065,786 | |
Nabors Industries, Inc.
5.00%, due 9/15/20 | | | 35,000 | | | | 35,088 | |
Occidental Petroleum Corp.
3.00%, due 2/15/27 | | | 180,000 | | | | 177,935 | |
Petroleos Mexicanos
6.50%, due 6/2/41 | | | 250,000 | | | | 221,750 | |
Shell International Finance B.V. | | | | | | | | |
2.375%, due 8/21/22 | | | 290,000 | | | | 291,475 | |
3.75%, due 9/12/46 | | | 510,000 | | | | 539,953 | |
| | | | | | | | |
| | | | | | | 5,775,554 | |
| | | | | | | | |
Oil & Gas Services 0.1% | |
Halliburton Co.
3.80%, due 11/15/25 | | | 450,000 | | | | 471,839 | |
| | | | | | | | |
|
Pharmaceuticals 1.4% | |
AbbVie, Inc. | | | | | | | | |
3.20%, due 11/6/22 | | | 440,000 | | | | 446,510 | |
3.75%, due 11/14/23 | | | 70,000 | | | | 72,879 | |
4.70%, due 5/14/45 | | | 180,000 | | | | 183,243 | |
Allergan Funding SCS | | | | | | | | |
3.80%, due 3/15/25 | | | 200,000 | | | | 207,555 | |
4.75%, due 3/15/45 | | | 100,000 | | | | 102,718 | |
AstraZeneca PLC
6.45%, due 9/15/37 | | | 440,000 | | | | 601,060 | |
Bristol-Myers Squibb Co.
3.40%, due 7/26/29 (a) | | | 530,000 | | | | 554,879 | |
| | | | | | |
The notes to the financial statements are an integral part of,
and should be read in conjunction with, the financial statements. | | | | | 13 | |
Portfolio of InvestmentsJune 30, 2019 (Unaudited) (continued)
| | | | | | | | |
| | | Principal
Amount | | | Value | |
| Corporate Bonds (continued) | |
Pharmaceuticals (continued) | |
Cigna Corp. (a) | | | | | | | | |
4.125%, due 11/15/25 | | $ | 225,000 | | | $ | 239,612 | |
4.90%, due 12/15/48 | | | 250,000 | | | | 271,836 | |
Eli Lilly & Co.
3.95%, due 3/15/49 | | | 250,000 | | | | 270,635 | |
Express Scripts Holding Co.
3.90%, due 2/15/22 | | | 405,000 | | | | 418,493 | |
GlaxoSmithKline Capital, Inc.
3.875%, due 5/15/28 | | | 255,000 | | | | 279,110 | |
Johnson & Johnson | | | | | | | | |
3.55%, due 3/1/36 | | | 40,000 | | | | 42,315 | |
4.95%, due 5/15/33 | | | 250,000 | | | | 309,933 | |
Merck & Co., Inc.
3.70%, due 2/10/45 | | | 210,000 | | | | 222,120 | |
Mylan, Inc. | | | | | | | | |
4.20%, due 11/29/23 (c) | | | 50,000 | | | | 50,230 | |
5.20%, due 4/15/48 | | | 65,000 | | | | 60,021 | |
Novartis Capital Corp.
4.00%, due 11/20/45 | | | 260,000 | | | | 286,387 | |
Pfizer, Inc. | | | | | | | | |
3.00%, due 6/15/23 | | | 155,000 | | | | 159,377 | |
3.20%, due 9/15/23 | | | 25,000 | | | | 25,987 | |
4.00%, due 12/15/36 | | | 440,000 | | | | 479,669 | |
4.10%, due 9/15/38 | | | 70,000 | | | | 77,204 | |
Teva Pharmaceutical Finance Netherlands III B.V.
3.15%, due 10/1/26 | | | 150,000 | | | | 116,250 | |
| | | | | | | | |
| | | | | | | 5,478,023 | |
| | | | | | | | |
Pipelines 1.0% | |
Enbridge, Inc.
4.50%, due 6/10/44 | | | 210,000 | | | | 222,785 | |
Energy Transfer Operating, L.P.
4.05%, due 3/15/25 | | | 830,000 | | | | 863,986 | |
Enterprise Products Operating LLC
3.70%, due 2/15/26 | | | 400,000 | | | | 423,349 | |
Kinder Morgan Energy Partners, L.P.
5.80%, due 3/15/35 | | | 255,000 | | | | 294,057 | |
Kinder Morgan, Inc.
4.30%, due 6/1/25 | | | 515,000 | | | | 550,151 | |
MPLX, L.P.
4.125%, due 3/1/27 | | | 255,000 | | | | 266,923 | |
Phillips 66 Partners, L.P.
4.68%, due 2/15/45 | | | 412,000 | | | | 426,447 | |
Plains All American Pipeline, L.P. / PAA Finance Corp.
3.65%, due 6/1/22 | | | 180,000 | | | | 184,365 | |
TransCanada PipeLines, Ltd. | | | | | | | | |
4.875%, due 1/15/26 | | | 260,000 | | | | 286,957 | |
4.875%, due 5/15/48 | | | 100,000 | | | | 111,722 | |
| | | | | | | | |
| | | Principal
Amount | | | Value | |
Pipelines (continued) | �� |
Williams Cos., Inc.
3.35%, due 8/15/22 | | $ | 250,000 | | | $ | 254,800 | |
| | | | | | | | |
| | | | | | | 3,885,542 | |
| | | | | | | | |
Real Estate 0.0%‡ | |
Prologis, L.P.
3.75%, due 11/1/25 | | | 180,000 | | | | 192,418 | |
| | | | | | | | |
|
Real Estate Investment Trusts 0.3% | |
American Tower Corp.
5.00%, due 2/15/24 | | | 170,000 | | | | 187,159 | |
AvalonBay Communities, Inc.
2.90%, due 10/15/26 | | | 180,000 | | | | 182,056 | |
ERP Operating, L.P. | | | | | | | | |
3.25%, due 8/1/27 | | | 210,000 | | | | 217,595 | |
4.625%, due 12/15/21 | | | 225,000 | | | | 236,690 | |
Realty Income Corp.
4.65%, due 3/15/47 | | | 125,000 | | | | 144,856 | |
Simon Property Group, L.P.
4.25%, due 11/30/46 | | | 368,000 | | | | 407,872 | |
| | | | | | | | |
| | | | | | | 1,376,228 | |
| | | | | | | | |
Retail 0.9% | |
CVS Health Corp. | | | | | | | | |
2.75%, due 12/1/22 | | | 330,000 | | | | 331,077 | |
2.80%, due 7/20/20 | | | 300,000 | | | | 300,767 | |
4.30%, due 3/25/28 | | | 210,000 | | | | 221,440 | |
5.05%, due 3/25/48 | | | 405,000 | | | | 431,373 | |
Home Depot, Inc.
4.25%, due 4/1/46 | | | 355,000 | | | | 400,542 | |
Lowe’s Cos., Inc.
4.05%, due 5/3/47 | | | 360,000 | | | | 357,209 | |
McDonald’s Corp.
3.375%, due 5/26/25 | | | 560,000 | | | | 585,944 | |
Target Corp.
3.50%, due 7/1/24 | | | 250,000 | | | | 265,810 | |
Walmart, Inc. | | | | | | | | |
2.85%, due 7/8/24 | | | 225,000 | | | | 232,459 | |
3.30%, due 4/22/24 | | | 65,000 | | | | 68,333 | |
4.30%, due 4/22/44 | | | 300,000 | | | | 340,844 | |
| | | | | | | | |
| | | | | | | 3,535,798 | |
| | | | | | | | |
Semiconductors 0.5% | |
Applied Materials, Inc.
5.10%, due 10/1/35 | | | 210,000 | | | | 254,485 | |
Broadcom Corp. / Broadcom Cayman Finance, Ltd. | | | | | | | | |
2.20%, due 1/15/21 | | | 300,000 | | | | 297,395 | |
3.00%, due 1/15/22 | | | 180,000 | | | | 180,468 | |
Intel Corp.
3.70%, due 7/29/25 | | | 510,000 | | | | 546,815 | |
| | | | |
| 14 | | MainStay VP Indexed Bond Portfolio | | The notes to the financial statements are an integral part of,
and should be read in conjunction with, the financial statements. |
| | | | | | | | |
| | | Principal
Amount | | | Value | |
| Corporate Bonds (continued) | |
Semiconductors (continued) | |
QUALCOMM, Inc.
4.65%, due 5/20/35 | | $ | 210,000 | | | $ | 234,493 | |
Texas Instruments, Inc.
2.625%, due 5/15/24 | | | 300,000 | | | | 305,512 | |
| | | | | | | | |
| | | | | | | 1,819,168 | |
| | | | | | | | |
Software 0.7% | |
Fidelity National Information Services, Inc. | | | | | | | | |
2.25%, due 8/15/21 | | | 353,000 | | | | 352,277 | |
3.50%, due 4/15/23 | | | 63,000 | | | | 65,121 | |
Fiserv, Inc.
4.20%, due 10/1/28 | | | 50,000 | | | | 54,129 | |
Microsoft Corp. | | | | | | | | |
2.40%, due 2/6/22 | | | 410,000 | | | | 414,305 | |
3.30%, due 2/6/27 | | | 365,000 | | | | 387,841 | |
4.25%, due 2/6/47 | | | 495,000 | | | | 583,308 | |
Oracle Corp. | | | | | | | | |
2.95%, due 5/15/25 | | | 405,000 | | | | 416,763 | |
4.00%, due 7/15/46 | | | 180,000 | | | | 192,982 | |
5.375%, due 7/15/40 | | | 300,000 | | | | 380,127 | |
| | | | | | | | |
| | | | | | | 2,846,853 | |
| | | | | | | | |
Sovereign 0.1% | |
Svensk Exportkredit A.B.
2.375%, due 3/9/22 | | | 400,000 | | | | 405,082 | |
| | | | | | | | |
|
Telecommunications 1.3% | |
AT&T, Inc. | | | | | | | | |
3.60%, due 7/15/25 | | | 260,000 | | | | 269,681 | |
4.25%, due 3/1/27 | | | 750,000 | | | | 803,838 | |
5.15%, due 11/15/46 | | | 620,000 | | | | 685,563 | |
Cisco Systems, Inc.
2.95%, due 2/28/26 | | | 410,000 | | | | 422,682 | |
Deutsche Telekom International Finance B.V.
8.75%, due 6/15/30 | | | 210,000 | | | | 302,395 | |
Orange S.A.
5.375%, due 7/8/19 | | | 410,000 | | | | 410,193 | |
Telefonica Emisiones SAU
7.045%, due 6/20/36 | | | 300,000 | | | | 392,759 | |
Verizon Communications, Inc. | | | | | | | | |
4.016%, due 12/3/29 (a) | | | 515,000 | | | | 557,612 | |
5.50%, due 3/16/47 | | | 850,000 | | | | 1,067,227 | |
Vodafone Group PLC
4.375%, due 5/30/28 | | | 405,000 | | | | 437,800 | |
| | | | | | | | |
| | | | | | | 5,349,750 | |
| | | | | | | | |
Transportation 0.7% | |
Burlington Northern Santa Fe LLC
3.25%, due 6/15/27 (c) | | | 180,000 | | | | 189,323 | |
Canadian National Railway Co.
6.25%, due 8/1/34 | | | 210,000 | | | | 288,265 | |
| | | | | | | | |
| | | Principal
Amount | | | Value | |
Transportation (continued) | |
CSX Corp.
3.70%, due 11/1/23 | | $ | 615,000 | | | $ | 647,242 | |
FedEx Corp. | | | | | | | | |
2.625%, due 8/1/22 | | | 260,000 | | | | 261,805 | |
3.20%, due 2/1/25 | | | 255,000 | | | | 263,121 | |
Norfolk Southern Corp. | | | | | | | | |
3.942%, due 11/1/47 | | | 66,000 | | | | 68,690 | |
4.80%, due 8/15/43 | | | 40,000 | | | | 44,996 | |
Union Pacific Corp.
2.75%, due 3/1/26 | | | 705,000 | | | | 708,280 | |
United Parcel Service, Inc.
3.40%, due 11/15/46 | | | 405,000 | | | | 386,521 | |
| | | | | | | | |
| | | | | | | 2,858,243 | |
| | | | | | | | |
Total Corporate Bonds
(Cost $110,145,673) | | | | 115,707,997 | |
| | | | | | | | |
|
| Foreign Government Bonds 2.1% | |
Canada 0.4% | | | | | | | | |
Province of Ontario Canada
2.50%, due 4/27/26 | | | 970,000 | | | | 986,437 | |
Province of Quebec Canada
2.50%, due 4/20/26 | | | 650,000 | | | | 663,484 | |
| | | | | | | | |
| | | | | | | 1,649,921 | |
| | | | | | | | |
Colombia 0.2% | |
Republic of Colombia
6.125%, due 1/18/41 | | | 545,000 | | | | 674,443 | |
| | | | | | | | |
|
Mexico 0.6% | |
United Mexican States
4.125%, due 1/21/26 | | | 2,380,000 | | | | 2,493,050 | |
| | | | | | | | |
|
Panama 0.2% | |
Panama Government International Bond
3.75%, due 3/16/25 | | | 750,000 | | | | 790,508 | |
| | | | | | | | |
|
Peru 0.3% | |
Peruvian Government International Bond
7.35%, due 7/21/25 | | | 920,000 | | | | 1,174,380 | |
| | | | | | | | |
|
Philippines 0.1% | |
Philippine Government International Bond
5.00%, due 1/13/37 | | | 400,000 | | | | 499,280 | |
| | | | | | | | |
|
Republic of Korea 0.3% | |
Korea Development Bank | | | | | | | | |
2.25%, due 5/18/20 | | | 500,000 | | | | 499,956 | |
3.25%, due 2/19/24 | | | 850,000 | | | | 882,068 | |
| | | | | | | | |
| | | | | | | 1,382,024 | |
| | | | | | | | |
Total Foreign Government Bonds
(Cost $8,260,606) | | | | | | | 8,663,606 | |
| | | | | | | | |
| | | | | | |
The notes to the financial statements are an integral part of,
and should be read in conjunction with, the financial statements. | | | | | 15 | |
Portfolio of InvestmentsJune 30, 2019 (Unaudited) (continued)
| | | | | | | | |
| | | Principal
Amount | | | Value | |
| Mortgage-Backed Securities 1.8% | |
Commercial Mortgage Loans
(Collateralized Mortgage Obligations) 1.8% | |
Bank
Series 2018-BN14, Class A3
3.966%, due 9/15/60 | | $ | 800,000 | | | $ | 878,467 | |
Benchmark Mortgage Trust | | | | | | | | |
Series 2018-B1, Class A2
3.571%, due 1/15/51 | | | 100,000 | | | | 104,111 | |
Series 2018-B1, Class A5
3.666%, due 1/15/51 (d) | | | 800,000 | | | | 856,107 | |
Series 2018-B6, Class A3
3.995%, due 10/10/51 | | | 900,000 | | | | 990,392 | |
CFCRE Commercial Mortgage Trust | | | | | | | | |
Series 2016-C6, Class A3
3.217%, due 11/10/49 (d) | | | 300,000 | | | | 309,685 | |
Series 2017-C8, Class A3
3.305%, due 6/15/50 | | | 200,000 | | | | 206,519 | |
Citigroup Commercial Mortgage Trust | | | | | | | | |
Series 2017-P8, Class A4
3.465%, due 9/15/50 | | | 300,000 | | | | 316,297 | |
Series 2015-GC35, Class A4
3.818%, due 11/10/48 | | | 300,000 | | | | 321,926 | |
CSAIL Commercial Mortgage Trust
Series 2017-CX9, Class A5
3.446%, due 9/15/50 | | | 300,000 | | | | 315,070 | |
GS Mortgage Securities Trust | | | | | | | | |
Series 2016-GS3, Class A4
2.85%, due 10/10/49 | | | 300,000 | | | | 305,237 | |
Series 2014-GC22, Class A5
3.862%, due 6/10/47 | | | 300,000 | | | | 319,060 | |
Series 2018-GS9, Class A4
3.992%, due 3/10/51 (d) | | | 800,000 | | | | 874,396 | |
Morgan Stanley Bank of America Merrill Lynch Trust
Series 2013-C7, Class A4
2.918%, due 2/15/46 | | | 300,000 | | | | 305,906 | |
Morgan Stanley Capital I Trust
Series 2018-H3, Class A4
3.914%, due 7/15/51 | | | 500,000 | | | | 545,792 | |
Wells Fargo Commercial Mortgage Trust
Series 2015-SG1, Class A4
3.789%, due 9/15/48 | | | 300,000 | | | | 319,921 | |
WFRBS Commercial Mortgage Trust
Series 2012-C8, Class A3
3.001%, due 8/15/45 | | | 200,000 | | | | 203,922 | |
| | | | | | | | |
Total Mortgage-Backed Securities
(Cost $6,810,903) | | | | | | | 7,172,808 | |
| | | | | | | | |
| | | | | | | | |
| | | Principal
Amount | | | Value | |
| U.S. Government & Federal Agencies 65.8% | |
Federal Home Loan Bank 0.2% | | | | | | | | |
3.25%, due 11/16/28 | | $ | 700,000 | | | $ | 760,695 | |
| | | | | | | | |
|
Federal Home Loan Mortgage Corporation 0.3% | |
1.875%, due 11/17/20 | | | 400,000 | | | | 399,874 | |
2.375%, due 1/13/22 | | | 500,000 | | | | 507,387 | |
2.753%, due 1/30/23 | | | 225,000 | | | | 225,121 | |
| | | | | | | | |
| | | | | | | 1,132,382 | |
| | | | | | | | |
Federal Home Loan Mortgage Corporation
(Mortgage Pass-Through Securities) 7.4% | |
2.50%, due 10/1/31 | | | 69,751 | | | | 70,349 | |
2.50%, due 2/1/32 | | | 390,018 | | | | 393,161 | |
2.50%, due 2/1/33 | | | 491,042 | | | | 494,999 | |
2.50%, due 4/1/33 | | | 629,186 | | | | 634,256 | |
2.50%, due 6/1/33 | | | 102,973 | | | | 103,803 | |
2.50%, due 7/1/33 | | | 267,473 | | | | 269,629 | |
3.00%, due 9/1/27 | | | 242,749 | | | | 248,580 | |
3.00%, due 4/1/32 | | | 296,056 | | | | 302,820 | |
3.00%, due 6/1/32 | | | 76,878 | | | | 78,634 | |
3.00%, due 9/1/32 | | | 39,706 | | | | 40,613 | |
3.00%, due 10/1/32 | | | 171,253 | | | | 175,169 | |
3.00%, due 5/1/33 | | | 269,977 | | | | 275,572 | |
3.00%, due 9/1/33 | | | 346,189 | | | | 353,294 | |
3.00%, due 9/1/36 | | | 154,395 | | | | 157,909 | |
3.00%, due 11/1/37 | | | 169,909 | | | | 173,148 | |
3.00%, due 12/1/37 | | | 264,847 | | | | 269,241 | |
3.00%, due 9/1/46 | | | 1,235,010 | | | | 1,252,033 | |
3.00%, due 12/1/46 | | | 82,606 | | | | 83,628 | |
3.00%, due 2/1/47 | | | 87,223 | | | | 88,302 | |
3.00%, due 3/1/47 | | | 390,011 | | | | 394,736 | |
3.00%, due 4/1/47 | | | 114,469 | | | | 115,864 | |
3.00%, due 1/1/48 | | | 1,057,748 | | | | 1,068,036 | |
3.00%, due 2/1/48 | | | 679,878 | | | | 686,490 | |
3.00%, due 3/1/48 | | | 578,169 | | | | 583,792 | |
3.00%, due 4/1/48 | | | 688,830 | | | | 698,344 | |
3.00%, due 6/1/48 | | | 877,086 | | | | 885,617 | |
3.50%, due 12/1/25 | | | 58,713 | | | | 60,633 | |
3.50%, due 5/1/33 | | | 264,026 | | | | 273,848 | |
3.50%, due 9/1/33 | | | 86,230 | | | | 89,180 | |
3.50%, due 2/1/37 | | | 227,482 | | | | 234,824 | |
3.50%, due 1/1/38 | | | 267,444 | | | | 275,748 | |
3.50%, due 6/1/43 | | | 235,335 | | | | 244,479 | |
3.50%, due 9/1/44 | | | 225,374 | | | | 234,832 | |
3.50%, due 8/1/45 | | | 510,726 | | | | 527,087 | |
3.50%, due 8/1/46 | | | 718,369 | | | | 741,135 | |
3.50%, due 8/1/47 | | | 89,125 | | | | 91,814 | |
3.50%, due 9/1/47 | | | 202,874 | | | | 208,808 | |
3.50%, due 11/1/47 | | | 371,217 | | | | 382,743 | |
3.50%, due 12/1/47 | | | 891,113 | | | | 918,809 | |
3.50%, due 1/1/48 | | | 89,459 | | | | 92,118 | |
3.50%, due 3/1/48 | | | 1,045,872 | | | | 1,076,002 | |
| | | | |
| 16 | | MainStay VP Indexed Bond Portfolio | | The notes to the financial statements are an integral part of,
and should be read in conjunction with, the financial statements. |
| | | | | | | | |
| | | Principal
Amount | | | Value | |
| U.S. Government & Federal Agencies (continued) | |
Federal Home Loan Mortgage Corporation
(Mortgage Pass-Through Securities) (continued) | |
3.50%, due 5/1/48 | | $ | 371,599 | | | $ | 382,142 | |
3.50%, due 6/1/48 | | | 588,516 | | | | 604,114 | |
3.50%, due 8/1/48 | | | 884,882 | | | | 907,530 | |
3.50%, due 9/1/48 | | | 844,428 | | | | 865,465 | |
3.50%, due 11/1/48 | | | 294,781 | | | | 302,101 | |
3.50%, due 12/1/48 | | | 761,368 | | | | 780,278 | |
4.00%, due 4/1/46 | | | 564,816 | | | | 591,135 | |
4.00%, due 5/1/46 | | | 190,070 | | | | 198,927 | |
4.00%, due 4/1/47 | | | 171,596 | | | | 179,299 | |
4.00%, due 6/1/47 | | | 482,615 | | | | 503,883 | |
4.00%, due 8/1/47 | | | 812,166 | | | | 847,463 | |
4.00%, due 10/1/47 | | | 207,439 | | | | 216,156 | |
4.00%, due 12/1/47 | | | 537,388 | | | | 559,612 | |
4.00%, due 1/1/48 | | | 177,458 | | | | 184,819 | |
4.00%, due 5/1/48 | | | 364,515 | | | | 379,308 | |
4.00%, due 9/1/48 | | | 1,546,257 | | | | 1,600,190 | |
4.00%, due 12/1/48 | | | 915,073 | | | | 946,419 | |
4.50%, due 5/1/38 | | | 161,260 | | | | 169,872 | |
4.50%, due 9/1/46 | | | 113,967 | | | | 120,236 | |
4.50%, due 10/1/46 | | | 268,783 | | | | 283,638 | |
4.50%, due 2/1/47 | | | 64,393 | | | | 67,844 | |
4.50%, due 11/1/47 | | | 84,654 | | | | 89,188 | |
4.50%, due 2/1/48 | | | 166,284 | | | | 174,973 | |
4.50%, due 4/1/48 | | | 260,353 | | | | 273,824 | |
4.50%, due 6/1/48 | | | 171,824 | | | | 179,933 | |
4.50%, due 7/1/48 | | | 605,319 | | | | 633,865 | |
4.50%, due 8/1/48 | | | 619,690 | | | | 651,102 | |
5.00%, due 9/1/38 | | | 80,588 | | | | 87,544 | |
5.00%, due 11/1/41 | | | 141,626 | | | | 153,892 | |
5.00%, due 3/1/47 | | | 278,484 | | | | 295,530 | |
5.00%, due 9/1/48 | | | 431,799 | | | | 457,774 | |
5.00%, due 1/1/49 | | | 293,201 | | | | 310,948 | |
5.50%, due 1/1/29 | | | 104,517 | | | | 111,452 | |
5.50%, due 7/1/38 | | | 130,682 | | | | 141,843 | |
| | | | | | | | |
| | | | | | | 29,602,378 | |
| | | | | | | | |
Federal National Mortgage Association 0.6% | |
1.875%, due 4/5/22 | | | 300,000 | | | | 300,538 | |
1.875%, due 9/24/26 | | | 1,650,000 | | | | 1,633,183 | |
2.875%, due 10/30/20 | | | 650,000 | | | | 658,253 | |
| | | | | | | | |
| | | | | | | 2,591,974 | |
| | | | | | | | |
Federal National Mortgage Association
(Mortgage Pass-Through Securities) 12.3% | |
2.50%, due 10/1/27 | | | 260,591 | | | | 262,564 | |
2.50%, due 4/1/30 | | | 223,913 | | | | 226,747 | |
2.50%, due 10/1/31 | | | 353,753 | | | | 356,598 | |
2.50%, due 2/1/32 | | | 616,104 | | | | 620,767 | |
2.50%, due 8/1/32 | | | 545,491 | | | | 549,620 | |
2.50%, due 3/1/33 | | | 358,138 | | | | 361,109 | |
| | | | | | | | |
| | | Principal
Amount | | | Value | |
Federal National Mortgage Association
(Mortgage Pass-Through Securities) (continued) | |
2.50%, due 6/1/33 | | $ | 362,235 | | | $ | 364,977 | |
2.50%, due 4/1/46 | | | 89,247 | | | | 88,616 | |
2.50%, due 10/1/46 | | | 181,452 | | | | 180,169 | |
3.00%, due 4/1/25 | | | 91,128 | | | | 92,952 | |
3.00%, due 11/1/31 | | | 260,192 | | | | 265,983 | |
3.00%, due 1/1/32 | | | 383,346 | | | | 391,895 | |
3.00%, due 6/1/32 | | | 221,536 | | | | 226,461 | |
3.00%, due 1/1/33 | | | 187,328 | | | | 191,100 | |
3.00%, due 2/1/33 | | | 268,897 | | | | 274,846 | |
3.00%, due 4/1/33 | | | 478,744 | | | | 488,373 | |
3.00%, due 5/1/33 | | | 461,947 | | | | 471,260 | |
3.00%, due 9/1/33 | | | 223,482 | | | | 227,955 | |
3.00%, due 2/1/37 | | | 235,254 | | | | 240,317 | |
3.00%, due 1/1/38 | | | 790,281 | | | | 803,733 | |
3.00%, due 9/1/42 | | | 1,425,696 | | | | 1,450,258 | |
3.00%, due 12/1/43 | | | 1,050,018 | | | | 1,066,322 | |
3.00%, due 10/1/44 | | | 915,652 | | | | 931,390 | |
3.00%, due 10/1/46 | | | 204,389 | | | | 207,026 | |
3.00%, due 12/1/46 | | | 1,889,384 | | | | 1,913,762 | |
3.00%, due 2/1/47 | | | 286,567 | | | | 290,073 | |
3.00%, due 8/1/47 | | | 1,067,808 | | | | 1,088,807 | |
3.00%, due 10/1/47 | | | 919,175 | | | | 937,250 | |
3.00%, due 11/1/47 | | | 245,842 | | | | 248,991 | |
3.00%, due 6/1/48 | | | 189,194 | | | | 190,930 | |
3.50%, due 7/1/21 | | | 36,366 | | | | 37,537 | |
3.50%, due 3/1/22 | | | 72,044 | | | | 74,364 | |
3.50%, due 5/1/26 | | | 63,463 | | | | 65,506 | |
3.50%, due 11/1/31 | | | 71,345 | | | | 73,893 | |
3.50%, due 5/1/33 | | | 141,705 | | | | 146,457 | |
3.50%, due 6/1/33 | | | 354,606 | | | | 366,487 | |
3.50%, due 7/1/33 | | | 172,527 | | | | 178,304 | |
3.50%, due 9/1/33 | | | 272,701 | | | | 281,778 | |
3.50%, due 5/1/45 | | | 1,006,109 | | | | 1,048,861 | |
3.50%, due 9/1/45 | | | 178,119 | | | | 183,711 | |
3.50%, due 12/1/45 | | | 959,352 | | | | 992,981 | |
3.50%, due 1/1/46 | | | 684,201 | | | | 710,359 | |
3.50%, due 4/1/46 | | | 174,224 | | | | 179,558 | |
3.50%, due 9/1/46 | | | 613,328 | | | | 638,214 | |
3.50%, due 10/1/46 | | | 532,805 | | | | 548,600 | |
3.50%, due 1/1/47 | | | 326,956 | | | | 336,614 | |
3.50%, due 7/1/47 | | | 422,166 | | | | 437,093 | |
3.50%, due 10/1/47 | | | 345,120 | | | | 355,309 | |
3.50%, due 11/1/47 | | | 2,602,176 | | | | 2,679,798 | |
3.50%, due 12/1/47 | | | 89,589 | | | | 92,288 | |
3.50%, due 8/1/48 | | | 839,989 | | | | 861,691 | |
3.50%, due 9/1/48 | | | 1,058,432 | | | | 1,085,318 | |
3.50%, due 2/1/49 | | | 2,200,000 | | | | 2,249,535 | |
4.00%, due 8/1/19 | | | 843 | | | | 875 | |
4.00%, due 5/1/24 | | | 108,876 | | | | 113,043 | |
4.00%, due 11/1/29 | | | 244,588 | | | | 254,395 | |
| | | | | | |
The notes to the financial statements are an integral part of,
and should be read in conjunction with, the financial statements. | | | | | 17 | |
Portfolio of InvestmentsJune 30, 2019 (Unaudited) (continued)
| | | | | | | | |
| | | Principal
Amount | | | Value | |
| U.S. Government & Federal Agencies (continued) | |
Federal National Mortgage Association
(Mortgage Pass-Through Securities) (continued) | |
4.00%, due 2/1/37 | | $ | 63,246 | | | $ | 66,103 | |
4.00%, due 8/1/38 | | | 719,263 | | | | 748,361 | |
4.00%, due 8/1/44 | | | 306,255 | | | | 322,488 | |
4.00%, due 2/1/45 | | | 390,707 | | | | 409,015 | |
4.00%, due 9/1/45 | | | 74,680 | | | | 78,110 | |
4.00%, due 5/1/46 | | | 381,444 | | | | 398,965 | |
4.00%, due 9/1/46 | | | 293,164 | | | | 306,581 | |
4.00%, due 2/1/47 | | | 64,345 | | | | 67,296 | |
4.00%, due 4/1/47 | | | 38,341 | | | | 40,036 | |
4.00%, due 5/1/47 | | | 582,611 | | | | 608,254 | |
4.00%, due 6/1/47 | | | 891,845 | | | | 930,921 | |
4.00%, due 10/1/47 | | | 96,992 | | | | 101,304 | |
4.00%, due 11/1/47 | | | 89,142 | | | | 92,793 | |
4.00%, due 12/1/47 | | | 256,579 | | | | 265,798 | |
4.00%, due 1/1/48 | | | 1,301,573 | | | | 1,351,813 | |
4.00%, due 2/1/48 | | | 265,095 | | | | 275,673 | |
4.00%, due 6/1/48 | | | 998,623 | | | | 1,036,823 | |
4.00%, due 7/1/48 | | | 2,901,749 | | | | 3,007,225 | |
4.00%, due 8/1/48 | | | 273,780 | | | | 282,902 | |
4.00%, due 9/1/48 | | | 1,210,437 | | | | 1,254,302 | |
4.00%, due 10/1/48 | | | 187,140 | | | | 193,375 | |
4.00%, due 11/1/48 | | | 488,572 | | | | 505,518 | |
4.00%, due 1/1/49 | | | 371,790 | | | | 384,453 | |
4.50%, due 7/1/46 | | | 78,537 | | | | 82,880 | |
4.50%, due 12/1/46 | | | 74,323 | | | | 78,319 | |
4.50%, due 4/1/47 | | | 486,304 | | | | 512,012 | |
4.50%, due 5/1/47 | | | 37,940 | | | | 39,945 | |
4.50%, due 7/1/47 | | | 645,957 | | | | 680,104 | |
4.50%, due 8/1/47 | | | 55,477 | | | | 58,752 | |
4.50%, due 2/1/48 | | | 507,003 | | | | 533,123 | |
4.50%, due 4/1/48 | | | 481,871 | | | | 504,487 | |
4.50%, due 5/1/48 | | | 417,816 | | | | 439,359 | |
4.50%, due 6/1/48 | | | 252,282 | | | | 263,905 | |
4.50%, due 6/29/48 TBA (e) | | | 1,125,000 | | | | 1,175,570 | |
4.50%, due 8/1/48 | | | 522,562 | | | | 545,927 | |
4.50%, due 10/1/48 | | | 180,219 | | | | 188,268 | |
5.00%, due 8/1/31 | | | 238,248 | | | | 251,816 | |
5.00%, due 6/1/39 | | | 202,445 | | | | 219,482 | |
5.00%, due 6/1/40 | | | 44,838 | | | | 48,726 | |
5.00%, due 7/1/47 | | | 170,678 | | | | 181,002 | |
5.00%, due 1/1/48 | | | 364,485 | | | | 392,345 | |
5.00%, due 4/1/48 | | | 216,380 | | | | 232,108 | |
5.00%, due 5/1/48 | | | 258,325 | | | | 273,952 | |
5.00%, due 9/1/48 | | | 240,859 | | | | 258,185 | |
5.50%, due 8/1/27 | | | 79,720 | | | | 84,988 | |
5.50%, due 6/1/36 | | | 102,367 | | | | 113,447 | |
5.50%, due 5/1/44 | | | 122,200 | | | | 135,718 | |
5.50%, due 9/1/48 | | | 572,799 | | | | 612,266 | |
| | | | | | | | |
| | | | | | | 49,638,215 | |
| | | | | | | | |
| | | | | | | | |
| | | Principal
Amount | | | Value | |
Government National Mortgage Association
(Mortgage Pass-Through Securities) 7.8% | |
2.50%, due 4/20/47 | | $ | 86,362 | | | $ | 86,867 | |
3.00%, due 6/15/45 | | | 68,839 | | | | 70,317 | |
3.00%, due 10/15/45 | | | 31,061 | | | | 31,727 | |
3.00%, due 11/20/45 | | | 937,853 | | | | 960,105 | |
3.00%, due 8/20/46 | | | 361,113 | | | | 369,678 | |
3.00%, due 9/20/46 | | | 189,760 | | | | 194,376 | |
3.00%, due 10/20/46 | | | 1,182,914 | | | | 1,210,982 | |
3.00%, due 1/20/47 | | | 1,326,074 | | | | 1,357,508 | |
3.00%, due 5/20/47 | | | 227,795 | | | | 233,076 | |
3.00%, due 12/20/47 | | | 782,855 | | | | 801,002 | |
3.00%, due 2/20/48 | | | 888,735 | | | | 909,336 | |
3.00%, due 3/20/48 | | | 1,048,821 | | | | 1,073,133 | |
3.00%, due 5/15/48 | | | 182,468 | | | | 186,384 | |
3.50%, due 11/20/42 | | | 307,588 | | | | 318,143 | |
3.50%, due 9/20/44 | | | 500,585 | | | | 520,115 | |
3.50%, due 3/15/45 | | | 46,249 | | | | 47,809 | |
3.50%, due 4/15/45 | | | 65,880 | | | | 68,103 | |
3.50%, due 7/20/45 | | | 1,351,486 | | | | 1,400,402 | |
3.50%, due 11/20/45 | | | 612,738 | | | | 635,043 | |
3.50%, due 7/20/46 | | | 71,041 | | | | 73,522 | |
3.50%, due 10/20/46 | | | 70,992 | | | | 73,471 | |
3.50%, due 11/20/46 | | | 878,161 | | | | 908,823 | |
3.50%, due 1/20/47 | | | 1,022,063 | | | | 1,057,645 | |
3.50%, due 5/20/47 | | | 867,915 | | | | 897,775 | |
3.50%, due 9/20/47 | | | 933,753 | | | | 965,393 | |
3.50%, due 10/20/47 | | | 1,658,318 | | | | 1,714,331 | |
3.50%, due 12/20/47 | | | 815,120 | | | | 842,530 | |
3.50%, due 5/15/48 | | | 152,884 | | | | 158,043 | |
3.50%, due 7/20/48 | | | 461,065 | | | | 476,481 | |
3.50%, due 9/20/48 | | | 554,138 | | | | 572,666 | |
3.50%, due 10/20/48 | | | 575,918 | | | | 595,174 | |
4.00%, due 9/29/40 TBA (e) | | | 500,000 | | | | 521,321 | |
4.00%, due 8/15/46 | | | 121,034 | | | | 127,353 | |
4.00%, due 12/20/46 | | | 58,870 | | | | 61,620 | |
4.00%, due 1/20/47 | | | 487,472 | | | | 508,918 | |
4.00%, due 2/20/47 | | | 131,066 | | | | 136,808 | |
4.00%, due 3/20/47 | | | 104,097 | | | | 108,875 | |
4.00%, due 4/20/47 | | | 229,507 | | | | 239,760 | |
4.00%, due 5/20/47 | | | 194,259 | | | | 202,658 | |
4.00%, due 7/20/47 | | | 78,768 | | | | 82,188 | |
4.00%, due 11/15/47 | | | 196,832 | | | | 205,336 | |
4.00%, due 11/20/47 | | | 965,555 | | | | 1,006,348 | |
4.00%, due 12/20/47 | | | 218,811 | | | | 227,958 | |
4.00%, due 4/20/48 | | | 1,050,170 | | | | 1,091,622 | |
4.00%, due 5/20/48 | | | 443,013 | | | | 460,128 | |
4.00%, due 6/20/48 | | | 178,517 | | | | 185,326 | |
4.00%, due 8/20/48 | | | 1,176,675 | | | | 1,220,558 | |
4.00%, due 9/20/48 | | | 638,745 | | | | 662,136 | |
4.00%, due 3/20/49 | | | 198,322 | | | | 205,707 | |
4.50%, due 8/15/46 | | | 72,589 | | | | 76,931 | |
| | | | |
| 18 | | MainStay VP Indexed Bond Portfolio | | The notes to the financial statements are an integral part of,
and should be read in conjunction with, the financial statements. |
| | | | | | | | |
| | | Principal
Amount | | | Value | |
| U.S. Government & Federal Agencies (continued) | |
Government National Mortgage Association
(Mortgage Pass-Through Securities) (continued) | |
4.50%, due 8/20/46 | | $ | 174,490 | | | $ | 184,172 | |
4.50%, due 2/15/47 | | | 36,392 | | | | 38,605 | |
4.50%, due 4/15/47 | | | 65,568 | | | | 70,638 | |
4.50%, due 4/20/47 | | | 198,673 | | | | 208,692 | |
4.50%, due 8/15/47 | | | 883,967 | | | | 943,960 | |
4.50%, due 11/20/47 | | | 208,328 | | | | 218,637 | |
4.50%, due 1/20/48 | | | 530,755 | | | | 556,795 | |
4.50%, due 3/20/48 | | | 236,889 | | | | 248,268 | |
4.50%, due 5/20/48 | | | 242,641 | | | | 252,969 | |
4.50%, due 6/20/48 | | | 421,805 | | | | 441,143 | |
4.50%, due 8/20/48 | | | 768,782 | | | | 803,129 | |
5.00%, due 8/20/45 | | | 182,543 | | | | 196,041 | |
5.00%, due 11/20/46 | | | 113,751 | | | | 124,995 | |
5.00%, due 4/15/47 | | | 77,629 | | | | 82,405 | |
5.00%, due 11/20/47 | | | 163,259 | | | | 173,906 | |
5.00%, due 12/15/47 | | | 134,445 | | | | 141,089 | |
5.00%, due 3/20/48 | | | 139,191 | | | | 147,049 | |
5.00%, due 6/20/48 | | | 321,594 | | | | 336,411 | |
| | | | | | | | |
| | | | | | | 31,310,415 | |
| | | | | | | | |
United States Treasury Bonds 8.0% | |
2.75%, due 8/15/47 | | | 1,035,000 | | | | 1,080,200 | |
2.75%, due 11/15/47 | | | 300,000 | | | | 313,137 | |
2.875%, due 5/15/43 | | | 1,950,000 | | | | 2,085,586 | |
2.875%, due 11/15/46 | | | 140,000 | | | | 149,827 | |
3.00%, due 2/15/47 | | | 815,000 | | | | 893,794 | |
3.00%, due 5/15/47 | | | 1,175,000 | | | | 1,286,855 | |
3.00%, due 2/15/48 | | | 5,950,000 | | | | 6,518,271 | |
3.00%, due 8/15/48 | | | 2,790,000 | | | | 3,059,845 | |
3.00%, due 2/15/49 | | | 1,775,000 | | | | 1,949,449 | |
3.125%, due 5/15/48 | | | 7,900,000 | | | | 8,864,664 | |
3.375%, due 11/15/48 | | | 2,000,000 | | | | 2,354,297 | |
3.625%, due 2/15/44 | | | 150,000 | | | | 181,254 | |
4.50%, due 2/15/36 | | | 1,900,000 | | | | 2,506,887 | |
4.625%, due 2/15/40 | | | 750,000 | | | | 1,029,756 | |
| | | | | | | | |
| | | | | | | 32,273,822 | |
| | | | | | | | |
United States Treasury Notes 29.2% | |
1.375%, due 9/30/19 | | | 6,000,000 | | | | 5,987,578 | |
1.375%, due 9/15/20 | | | 775,000 | | | | 770,308 | |
1.50%, due 6/15/20 | | | 1,225,000 | | | | 1,219,593 | |
1.50%, due 7/15/20 | | | 460,000 | | | | 457,880 | |
1.50%, due 8/15/20 | | | 325,000 | | | | 323,502 | |
1.625%, due 10/15/20 | | | 2,450,000 | | | | 2,442,152 | |
1.625%, due 8/31/22 | | | 700,000 | | | | 697,758 | |
1.75%, due 11/15/20 | | | 3,950,000 | | | | 3,944,137 | |
1.75%, due 5/31/22 | | | 600,000 | | | | 600,398 | |
1.75%, due 6/15/22 | | | 1,800,000 | | | | 1,802,531 | |
1.75%, due 6/30/22 | | | 925,000 | | | | 926,156 | |
1.875%, due 12/15/20 | | | 3,375,000 | | | | 3,376,582 | |
| | | | | | | | |
| | | Principal
Amount | | | Value | |
United States Treasury Notes (continued) | |
1.875%, due 9/30/22 | | $ | 950,000 | | | $ | 954,676 | |
1.875%, due 8/31/24 | | | 325,000 | | | | 326,625 | |
2.00%, due 10/31/22 | | | 900,000 | | | | 907,875 | |
2.00%, due 4/30/24 | | | 5,885,000 | | | | 5,949,137 | |
2.00%, due 5/31/24 | | | 2,800,000 | | | | 2,832,922 | |
2.125%, due 5/31/21 | | | 9,000,000 | | | | 9,061,172 | |
2.125%, due 7/31/24 | | | 150,000 | | | | 152,555 | |
2.125%, due 5/31/26 | | | 925,000 | | | | 940,465 | |
2.25%, due 2/15/21 | | | 1,525,000 | | | | 1,535,365 | |
2.375%, due 3/15/21 | | | 150,000 | | | | 151,447 | |
2.375%, due 4/15/21 | | | 2,000,000 | | | | 2,020,313 | |
2.375%, due 4/30/26 | | | 200,000 | | | | 206,531 | |
2.375%, due 5/15/29 (c) | | | 2,025,000 | | | | 2,092,632 | |
2.50%, due 6/30/20 | | | 7,925,000 | | | | 7,966,482 | |
2.50%, due 2/15/22 | | | 350,000 | | | | 356,877 | |
2.50%, due 3/31/23 | | | 100,000 | | | | 102,789 | |
2.625%, due 7/31/20 | | | 55,000 | | | | 55,404 | |
2.625%, due 8/31/20 | | | 1,350,000 | | | | 1,361,074 | |
2.625%, due 5/15/21 | | | 2,150,000 | | | | 2,183,174 | |
2.625%, due 6/15/21 | | | 925,000 | | | | 940,429 | |
2.625%, due 7/15/21 | | | 4,965,000 | | | | 5,050,918 | |
2.625%, due 6/30/23 | | | 1,900,000 | | | | 1,965,238 | |
2.625%, due 12/31/23 | | | 150,000 | | | | 155,648 | |
2.625%, due 2/15/29 | | | 975,000 | | | | 1,028,168 | |
2.75%, due 9/30/20 | | | 3,775,000 | | | | 3,814,520 | |
2.75%, due 8/15/21 | | | 3,700,000 | | | | 3,776,457 | |
2.75%, due 9/15/21 | | | 1,000,000 | | | | 1,022,188 | |
2.75%, due 4/30/23 | | | 5,425,000 | | | | 5,628,437 | |
2.75%, due 5/31/23 | | | 1,700,000 | | | | 1,765,012 | |
2.75%, due 7/31/23 | | | 4,675,000 | | | | 4,860,174 | |
2.75%, due 8/31/23 | | | 4,000,000 | | | | 4,161,562 | |
2.75%, due 6/30/25 | | | 275,000 | | | | 289,405 | |
2.75%, due 2/15/28 | | | 2,400,000 | | | | 2,551,875 | |
2.875%, due 10/31/20 | | | 5,700,000 | | | | 5,774,145 | |
2.875%, due 11/15/21 | | | 375,000 | | | | 384,873 | |
2.875%, due 9/30/23 | | | 2,875,000 | | | | 3,007,632 | |
2.875%, due 10/31/23 | | | 5,300,000 | | | | 5,548,645 | |
2.875%, due 11/30/23 | | | 600,000 | | | | 628,734 | |
2.875%, due 4/30/25 | | | 950,000 | | | | 1,005,441 | |
2.875%, due 5/31/25 | | | 300,000 | | | | 317,660 | |
2.875%, due 7/31/25 | | | 1,425,000 | | | | 1,510,389 | |
2.875%, due 8/15/28 | | | 600,000 | | | | 644,766 | |
3.125%, due 11/15/28 | | | 150,000 | | | | 164,525 | |
| | | | | | | | |
| | | | | | | 117,702,931 | |
| | | | | | | | |
Total U.S. Government & Federal Agencies
(Cost $256,876,068) | | | | | | | 265,012,812 | |
| | | | | | | | |
TotalLong-Term Bonds
(Cost $384,306,578) | | | | | | | 398,795,491 | |
| | | | | | | | |
| | | | | | |
The notes to the financial statements are an integral part of,
and should be read in conjunction with, the financial statements. | | | | | 19 | |
Portfolio of InvestmentsJune 30, 2019 (Unaudited) (continued)
| | | | | | | | |
| | | Principal
Amount | | | Value | |
| Short-Term Investments 1.4% | |
Repurchase Agreement 0.4% | | | | | | | | |
RBC Capital Markets
2.46%, dated 6/28/19
due 7/1/19
Proceeds at Maturity $1,471,302 (Collateralized by a United States Treasury Note with a rate of 1.25%% and a maturity date between 3/31/21 , with a Principal Amount of $1,510,700 and a Market Value of $1,500,809) | | $ | 1,471,000 | | | $ | 1,471,000 | |
| | | | | | | | |
Total Repurchase Agreement
(Cost $1,471,000) | | | | | | | 1,471,000 | |
| | | | | | | | |
|
U.S. Government & Federal Agencies 0.7% | |
Federal Home Loan Bank Discount Notes
2.028%, due 7/1/19 (f)(g) | | | 3,000,000 | | | | 3,000,000 | |
| | | | | | | | |
Total U.S. Government & Federal Agencies
(Cost $3,000,000) | | | | | | | 3,000,000 | |
| | | | | | | | |
| | |
| | | | | | | | |
| | |
| | | Shares | | | | |
Unaffiliated Investment Company 0.3% | |
State Street Navigator Securities Lending Government Money Market Portfolio, 2.33% (g)(h) | | | 1,282,790 | | | | 1,282,790 | |
| | | | | | | | |
Total Unaffiliated Investment Company
(Cost $1,282,790) | | | | | | | 1,282,790 | |
| | | | | | | | |
TotalShort-Term Investments
(Cost $5,753,790) | | | | | | | 5,753,790 | |
| | | | | | | | |
Total Investments
(Cost $390,060,368) | | | 100.4 | % | | | 404,549,281 | |
Other Assets, Less Liabilities | | | (0.4 | ) | | | (1,508,585 | ) |
Net Assets | | | 100.0 | % | | $ | 403,040,696 | |
| † | Percentages indicated are based on Portfolio net assets. |
| ‡ | Less than one-tenth of a percent. |
| (a) | May be sold to institutional investors only under Rule 144A or securities offered pursuant to Section 4(a)(2) of the Securities Act of 1933, as amended. |
| (b) | Fixed to floating rate—Rate shown was the rate in effect as of June 30, 2019. |
| (c) | All or a portion of this security was held on loan. As of June 30, 2019, the aggregate market value of securities on loan was $1,257,411 and the Portfolio received cash collateral with a value of $1,282,790 (See Note 2(J)). |
| (d) | Coupon rate may change based on changes of the underlying collateral or prepayments of principal. The coupon rate shown represents the rate at period end. |
| (e) | TBA—Securities purchased on a forward commitment basis with an approximate principal amount and maturity date. The actual principal amount and maturity date will be determined upon settlement. As of June 30, 2019, the total net market value of these securities was $1,696,891, which represented 0.4% of the Portfolio’s net assets. All or a portion of these securities are a part of a mortgage dollar roll agreement. |
| (f) | Interest rate shown represents yield to maturity. |
| (g) | Current yield as of June 30, 2019. |
| (h) | Represents security purchased with cash collateral received for securities on loan. |
| | | | |
| 20 | | MainStay VP Indexed Bond Portfolio | | The notes to the financial statements are an integral part of,
and should be read in conjunction with, the financial statements. |
As of June 30, 2019, the Portfolio held the following futures contracts1:
| | | | | | | | | | | | | | | | | | | | |
Type | | Number of
Contracts | | | Expiration
Date | | | Value at
Trade Date | | | Current
Notional
Amount | | | Unrealized
Appreciation
(Depreciation)2 | |
| | | | | |
Long Contracts | | | | | | | | | | | | | | | | | | | | |
| 5-Year United States Treasury Note | | | 120 | | | | September 2019 | | | $ | 14,016,482 | | | $ | 14,178,750 | | | $ | 162,268 | |
| 10-Year United States Treasury Note | | | 60 | | | | September 2019 | | | | 7,533,856 | | | | 7,678,125 | | | | 144,269 | |
| 10-Year United States Treasury Ultra Note | | | 55 | | | | September 2019 | | | | 7,419,082 | | | | 7,596,875 | | | | 177,793 | |
| | | | | | | | | | | | | | | | | | | | |
Total Long Contracts | | | | | | | | | | | | | | | | | | | 484,330 | |
| | | | | | | | | | | | | | | | | | | | |
| | | | | |
Short Contracts | | | | | | | | | | | | | | | | | | | | |
| 2-Year United States Treasury Note | | | (17 | ) | | | September 2019 | | | | (3,645,761 | ) | | | (3,658,055 | ) | | | (12,294 | ) |
| United States Treasury Long Bond | | | (4 | ) | | | September 2019 | | | | (603,930 | ) | | | (622,375 | ) | | | (18,445 | ) |
| United States Treasury Ultra Bond | | | (18 | ) | | | September 2019 | | | | (3,084,516 | ) | | | (3,196,125 | ) | | | (111,609 | ) |
| | | | | | | | | | | | | | | | | | | | |
Total Short Contracts | | | | | | | | | | | | | | | | | | | (142,348 | ) |
| | | | | | | | | | | | | | | | | | | | |
Net Unrealized Appreciation (or Depreciation) | | | | | | | | | | | | | | | | | | $ | 341,982 | |
| | | | | | | | | | | | | | | | | | | | |
| 1. | As of June 30, 2019, cash in the amount of $158,728 was on deposit with a broker or futures commission merchant for futures transactions. |
| 2. | Represents the difference between the value of the contracts at the time they were opened and the value as of June 30, 2019. |
The following is a summary of the fair valuations according to the inputs used as of June 30, 2019, for valuing the Portfolio’s assets and liabilities:
| | | | | | | | | | | | | | | | |
Description | | Quoted
Prices in
Active
Markets for
Identical
Assets
(Level 1) | | | Significant
Other
Observable
Inputs
(Level 2) | | | Significant
Unobservable
Inputs
(Level 3) | | | Total | |
| | | | |
Asset Valuation Inputs | | | | | | | | | | | | | | | | |
| Investments in Securities (a) | | | | | | | | | | | | | | | | |
| Long-Term Bonds | | | | | | | | | | | | | | | | |
Asset-Backed Securities | | $ | — | | | $ | 2,238,268 | | | $ | — | | | $ | 2,238,268 | |
Corporate Bonds | | | — | | | | 115,707,997 | | | | — | | | | 115,707,997 | |
Foreign Government Bonds | | | — | | | | 8,663,606 | | | | — | | | | 8,663,606 | |
Mortgage-Backed Securities | | | — | | | | 7,172,808 | | | | — | | | | 7,172,808 | |
U.S. Government & Federal Agencies | | | — | | | | 265,012,812 | | | | — | | | | 265,012,812 | |
| | | | | | | | | | | | | | | | |
| TotalLong-Term Bonds | | | — | | | | 398,795,491 | | | | — | | | | 398,795,491 | |
| | | | | | | | | | | | | | | | |
| Short-Term Investments | | | | | | | | | | | | | | | | |
Repurchase Agreements | | | — | | | | 1,471,000 | | | | — | | | | 1,471,000 | |
U.S. Government & Federal Agencies | | | — | | | | 3,000,000 | | | | — | | | | 3,000,000 | |
Unaffiliated Investment Company | | | 1,282,790 | | | | — | | | | — | | | | 1,282,790 | |
| | | | | | | | | | | | | | | | |
| TotalShort-Term Investments | | | 1,282,790 | | | | 4,471,000 | | | | — | | | | 5,753,790 | |
| | | | | | | | | | | | | | | | |
| Total Investments in Securities | | | 1,282,790 | | | | 403,266,491 | | | | — | | | | 404,549,281 | |
| | | | | | | | | | | | | | | | |
| Other Financial Instruments | | | | | | | | | | | | | | | | |
Futures Contracts (b) | | | 484,330 | | | | — | | | | — | | | | 484,330 | |
| | | | | | | | | | | | | | | | |
| Total Investments in Securities and Other Financial Instruments | | $ | 1,767,120 | | | $ | 403,266,491 | | | $ | — | | | $ | 405,033,611 | |
| | | | | | | | | | | | | | | | |
| | | | |
Liability Valuation Inputs | | | | | | | | | | | | | | | | |
| Other Financial Instruments | | | | | | | | | | | | | | | | |
Futures Contracts (b) | | $ | (142,348 | ) | | $ | — | | | $ | — | | | $ | (142,348 | ) |
| | | | | | | | | | | | | | | | |
| (a) | For a complete listing of investments and their industries, see the Portfolio of Investments. |
| (b) | The value listed for these securities reflects unrealized appreciation (depreciation) as shown on the Portfolio of Investments. |
| | | | | | |
The notes to the financial statements are an integral part of,
and should be read in conjunction with, the financial statements. | | | | | 21 | |
Statement of Assets and Liabilitiesas of June 30, 2019 (Unaudited)
| | | | |
| Assets | | | | |
Investment in unaffiliated securities, at value
(identified cost $390,060,368) including securities on loan of $1,257,411 | | $ | 404,549,281 | |
Cash collateral on deposit at broker for futures contracts | | | 158,728 | |
Cash | | | 221 | |
Receivables: | | | | |
Investment securities sold | | | 3,807,136 | |
Interest | | | 2,477,547 | |
Portfolio shares sold | | | 297,765 | |
Variation margin on futures contracts | | | 8,998 | |
Securities lending | | | 886 | |
Other assets | | | 1,983 | |
| | | | |
Total assets | | | 411,302,545 | |
| | | | |
| |
| Liabilities | | | | |
Cash collateral received for securities on loan | | | 1,282,790 | |
Payables: | | | | |
Investment securities purchased | | | 6,461,102 | |
Portfolio shares redeemed | | | 352,372 | |
Manager (See Note 3) | | | 82,372 | |
Professional fees | | | 36,482 | |
Custodian | | | 24,952 | |
NYLIFE Distributors (See Note 3) | | | 14,996 | |
Shareholder communication | | | 4,418 | |
Trustees | | | 557 | |
Accrued expenses | | | 1,808 | |
| | | | |
Total liabilities | | | 8,261,849 | |
| | | | |
Net assets | | $ | 403,040,696 | |
| | | | |
| |
| Composition of Net Assets | | | | |
Shares of beneficial interest outstanding (par value of $.001 per share) unlimited number of shares authorized | | $ | 38,816 | |
Additional paid-in capital | | | 383,404,827 | |
| | | | |
| | | 383,443,643 | |
Total distributable earnings (loss) | | | 19,597,053 | |
| | | | |
Net assets | | $ | 403,040,696 | |
| | | | |
| | | | |
Initial Class | | | | |
Net assets applicable to outstanding shares | | $ | 325,690,173 | |
| | | | |
Shares of beneficial interest outstanding | | | 31,344,119 | |
| | | | |
Net asset value per share outstanding | | $ | 10.39 | |
| | | | |
Service Class | | | | |
Net assets applicable to outstanding shares | | $ | 77,350,523 | |
| | | | |
Shares of beneficial interest outstanding | | | 7,471,387 | |
| | | | |
Net asset value per share outstanding | | $ | 10.35 | |
| | | | |
| | | | |
| 22 | | MainStay VP Indexed Bond Portfolio | | The notes to the financial statements are an integral part of,
and should be read in conjunction with, the financial statements. |
Statement of Operationsfor the six months ended June 30, 2019 (Unaudited)
| | | | |
| Investment Income (Loss) | | | | |
Income | | | | |
Interest | | $ | 6,176,872 | |
Securities lending | | | 4,636 | |
Other | | | 776 | |
| | | | |
Total income | | | 6,182,284 | |
| | | | |
Expenses | | | | |
Manager (See Note 3) | | | 492,165 | |
Distribution/Service—Service Class (See Note 3) | | | 68,007 | |
Professional fees | | | 40,271 | |
Custodian | | | 26,636 | |
Shareholder communication | | | 8,883 | |
Trustees | | | 5,010 | |
Miscellaneous | | | 8,014 | |
| | | | |
Total expenses | | | 648,986 | |
| | | | |
Net investment income (loss) | | | 5,533,298 | |
| | | | |
|
| Realized and Unrealized Gain (Loss) on Investments and Futures Contracts | |
Net realized gain (loss) on: | | | | |
Investment transactions | | | 1,062,662 | |
Futures transactions | | | 401,772 | |
| | | | |
Net realized gain (loss) on investments and futures transactions | | | 1,464,434 | |
| | | | |
Net change in unrealized appreciation (depreciation) on: | | | | |
Investments | | | 15,903,868 | |
Futures contracts | | | 222,011 | |
| | | | |
Net change in unrealized appreciation (depreciation) on investments and futures contracts | | | 16,125,879 | |
| | | | |
Net realized and unrealized gain (loss) on investments and futures transactions | | | 17,590,313 | |
| | | | |
Net increase (decrease) in net assets resulting from operations | | $ | 23,123,611 | |
| | | | |
| | | | | | |
The notes to the financial statements are an integral part of,
and should be read in conjunction with, the financial statements. | | | | | 23 | |
Statements of Changes in Net Assets
for the six months ended June 30, 2019 (Unaudited) and the year ended December 31, 2018
| | | | | | | | |
| | | 2019 | | | 2018 | |
| Increase (Decrease) in Net Assets | |
Operations: | | | | | | | | |
Net investment income (loss) | | $ | 5,533,298 | | | $ | 6,692,786 | |
Net realized gain (loss) on investments and futures contracts | | | 1,464,434 | | | | (2,096,233 | ) |
Net change in unrealized appreciation (depreciation) on investments and futures contracts | | | 16,125,879 | | | | (1,374,360 | ) |
| | | | |
Net increase (decrease) in net assets resulting from operations | | | 23,123,611 | | | | 3,222,193 | |
| | | | |
Distributions to shareholders: | | | | | | | | |
Initial Class | | | — | | | | (6,178,249 | ) |
Service Class | | | — | | | | (573,525 | ) |
| | | | |
Total distributions to shareholders | | | — | | | | (6,751,774 | ) |
| | | | |
Capital share transactions: | | | | | | | | |
Net proceeds from sale of shares | | | 43,722,290 | | | | 372,695,629 | |
Net asset value of shares issued to shareholders in reinvestment of dividends and distributions | | | — | | | | 6,751,774 | |
Cost of shares redeemed | | | (62,909,946 | ) | | | (120,996,629 | ) |
| | | | |
Increase (decrease) in net assets derived from capital share transactions | | | (19,187,656 | ) | | | 258,450,774 | |
| | | | |
Net increase (decrease) in net assets | | | 3,935,955 | | | | 254,921,193 | |
|
| Net Assets | |
Beginning of period | | | 399,104,741 | | | | 144,183,548 | |
| | | | |
End of period | | $ | 403,040,696 | | | $ | 399,104,741 | |
| | | | |
| | | | |
| 24 | | MainStay VP Indexed Bond Portfolio | | The notes to the financial statements are an integral part of,
and should be read in conjunction with, the financial statements. |
Financial Highlightsselected per share data and ratios
| | | | | | | | | | | | |
| | | |
| Initial Class | | Six months
ended
June 30,
2019* | | | Year ended
December 31,
2018 | | | May 1,
2017**
through
December 31,
2017 | |
| | | |
Net asset value at beginning of period | | $ | 9.80 | | | $ | 10.04 | | | $ | 10.00 | |
| | | | | | | | | | | | |
| | | |
Net investment income (loss) (a) | | | 0.14 | | | | 0.26 | | | | 0.13 | |
| | | |
Net realized and unrealized gain (loss) on investments | | | 0.45 | | | | (0.33 | ) | | | 0.01 | |
| | | | | | | | | | | | |
| | | |
Total from investment operations | | | 0.59 | | | | (0.07 | ) | | | 0.14 | |
| | | | | | | | | | | | |
| | | |
| Less dividends and distributions: | | | | | | | | | | | | |
| | | |
From net investment income | | | — | | | | (0.17 | ) | | | (0.10 | ) |
| | | |
From net realized gain on investments | | | — | | | | — | | | | (0.00 | )‡ |
| | | | | | | | | | | | |
| | | |
Total dividends and distributions | | | — | | | | (0.17 | ) | | | (0.10 | ) |
| | | | | | | | | | | | |
| | | |
Net asset value at end of period | | $ | 10.39 | | | $ | 9.80 | | | $ | 10.04 | |
| | | | | | | | | | | | |
| | | |
Total investment return (b) | | | 6.02 | %(c) | | | (0.67 | %) | | | 1.42 | % |
| | | |
| Ratios (to average net assets)/Supplemental Data: | | | | | | | | | | | | |
| | | |
Net investment income (loss) | | | 2.85 | %†† | | | 2.67 | % | | | 1.92 | %†† |
| | | |
Net expenses (d) | | | 0.30 | %†† | | | 0.31 | % | | | 0.37 | %†† |
| | | |
Portfolio turnover rate (e) | | | 29 | % | | | 143 | % | | | 104 | %(f) |
| | | |
Net assets at end of period (in 000’s) | | $ | 325,690 | | | $ | 362,545 | | | $ | 140,759 | |
| ‡ | Less than one cent per share. |
| (a) | Per share data based on average shares outstanding during the period. |
| (b) | Total return does not reflect any deduction of sales charges, mortality and expense charges, contract charges or administrative charges. For periods of less than one year, total return is not annualized. |
| (c) | Total investment return may reflect adjustments to conform to generally accepted accounting principles. |
| (d) | In addition to the fees and expenses which the Portfolio bears directly, it also indirectly bears a pro-rata share of the fees and expenses of the underlying funds in which it invests. Such indirect expenses are not included in the above expense ratios. |
| (e) | The portfolio turnover rate not including mortgage dollar rolls were 24%, 104% and 59% for the six months ended June 30, 2019 and for the year ended December 31, 2018 and for the period ended December 31, 2017, respectively. |
| (f) | Portfolio turnover rate is not annualized. |
| | | | | | |
The notes to the financial statements are an integral part of,
and should be read in conjunction with, the financial statements. | | | | | 25 | |
Financial Highlightsselected per share data and ratios
| | | | | | | | | | | | |
| | | |
| Service Class | | Six months
ended
June 30,
2019* | | | Year ended
December 31,
2018 | | | May 1,
2017**
through
December 31,
2017 | |
| | | |
Net asset value at beginning of period | | $ | 9.78 | | | $ | 10.03 | | | $ | 10.00 | |
| | | | | | | | | | | | |
| | | |
Net investment income (loss) (a) | | | 0.13 | | | | 0.24 | | | | 0.12 | |
| | | |
Net realized and unrealized gain (loss) on investments | | | 0.44 | | | | (0.33 | ) | | | 0.00 | ‡ |
| | | | | | | | | | | | |
| | | |
Total from investment operations | | | 0.57 | | | | (0.09 | ) | | | 0.12 | |
| | | | | | | | | | | | |
| | | |
| Less dividends and distributions: | | | | | | | | | | | | |
| | | |
From net investment income | | | — | | | | (0.16 | ) | | | (0.09 | ) |
| | | |
From net realized gain on investments | | | — | | | | — | | | | (0.00 | )‡ |
| | | | | | | | | | | | |
| | | |
Total dividends and distributions | | | — | | | | (0.16 | ) | | | (0.09 | ) |
| | | | | | | | | | | | |
| | | |
Net asset value at end of period | | $ | 10.35 | | | $ | 9.78 | | | $ | 10.03 | |
| | | | | | | | | | | | |
| | | |
Total investment return (b) | | | 5.83 | %(c) | | | (0.92 | %) | | | 1.26 | % |
| | | |
| Ratios (to average net assets)/Supplemental Data: | | | | | | | | | | | | |
| | | |
Net investment income (loss) | | | 2.58 | %†† | | | 2.48 | % | | | 1.70 | %†† |
| | | |
Net expenses (d) | | | 0.55 | %†† | | | 0.56 | % | | | 0.62 | %†† |
| | | |
Portfolio turnover rate (e) | | | 29 | % | | | 143 | % | | | 104 | %(f) |
| | | |
Net assets at end of period (in 000’s) | | $ | 77,351 | | | $ | 36,560 | | | $ | 3,424 | |
| ‡ | Less than one cent per share. |
| (a) | Per share data based on average shares outstanding during the period. |
| (b) | Total return does not reflect any deduction of sales charges, mortality and expense charges, contract charges or administrative charges. For periods of less than one year, total return is not annualized. |
| (c) | Total investment return may reflect adjustments to conform to generally accepted accounting principles. |
| (d) | In addition to the fees and expenses which the Portfolio bears directly, it also indirectly bears a pro-rata share of the fees and expenses of the underlying funds in which it invests. Such indirect expenses are not included in the above expense ratios. |
| (e) | The portfolio turnover rate not including mortgage dollar rolls were 24%, 104% and 59% for the six months ended June 30, 2019 and for the year ended December 31, 2018 and for the period ended December 31, 2017, respectively. |
| (f) | Portfolio turnover rate is not annualized. |
| | | | |
| 26 | | MainStay VP Indexed Bond Portfolio | | The notes to the financial statements are an integral part of,
and should be read in conjunction with, the financial statements. |
Notes to Financial Statements(Unaudited)
Note 1–Organization and Business
MainStay VP Funds Trust (the “Fund”) was organized as a Delaware statutory trust on February 1, 2011. The Fund is registered under the Investment Company Act of 1940, as amended (the “1940 Act”), as an open-end management investment company. The Fund is comprised of thirty-one separate series (collectively referred to as the “Portfolios”). These financial statements and notes relate to the MainStay VP Indexed Bond Portfolio (the “Portfolio”), a “diversified” portfolio, as that term is defined in the 1940 Act, as interpreted or modified by regulatory authorities having jurisdiction, from time to time.
Shares of the Portfolio are currently offered to certain separate accounts to fund variable annuity policies and variable universal life insurance policies issued by New York Life Insurance and Annuity Corporation (“NYLIAC”), awholly-owned subsidiary of New York Life Insurance Company (“New York Life”) and may also be offered to fund variable annuity policies and variable universal life insurance policies issued by other insurance companies. NYLIAC allocates shares of the Portfolios to, among others, certain NYLIAC separate accounts. Shares of the Portfolio are also offered to the MainStay VP Conservative Allocation Portfolio, MainStay VP Moderate Allocation Portfolio, MainStay VP Moderate Growth Allocation Portfolio and MainStay VP Growth Allocation Portfolio, which operate as “funds-of-funds.”
The Portfolio currently offers two classes of shares. Initial Class and Service Class shares commenced operations on May 1, 2017. Shares of the Portfolio are offered and are redeemed at a price equal to their respective net asset value (“NAV”) per share. No sales or redemption charge is applicable to the purchase or redemption of the Portfolio’s shares. Under the terms of the Fund’s multiple class plan adopted pursuant to Rule 18f-3 under the 1940 Act, the classes differ in that, among other things, Service Class shares of the Portfolio pay a combined distribution and service fee of 0.25% of average daily net assets attributable to Service Class shares of the Portfolio to the Distributor (as defined in Note 3(B)) pursuant to a plan adopted in accordance with Rule 12b-1 under the 1940 Act. Contract owners of variable annuity contracts purchased after June 2, 2003, are permitted to invest only in the Service Class shares.
The Portfolio’s investment objective is to seek investment results that correspond to the total return performance of fixed-income securities in the aggregate, as represented by the Portfolio’s primary benchmark index.
Note 2–Significant Accounting Policies
The Portfolio is an investment company and accordingly follows the investment company accounting and reporting guidance of the Financial Accounting Standards Board (“FASB”) Accounting Standard CodificationTopic 946 Financial Services—Investment Companies. The Portfolio prepares its financial statements in accordance with generally accepted accounting principles (“GAAP”) in the United States of America and follows the significant accounting policies described below.
(A) Securities Valuation. Investments are usually valued as of the close of regular trading on the New York Stock Exchange (the “Exchange”) (usually 4:00 p.m. Eastern time) on each day the Portfolio is open for business (“valuation date”).
The Board of Trustees of the Fund (the “Board”) adopted procedures establishing methodologies for the valuation of the Portfolio’s securities and other assets and delegated the responsibility for valuation determinations under those procedures to the Valuation Committee of the Fund (the “Valuation Committee”). The Board authorized the Valuation Committee to appoint a Valuation Subcommittee (the “Subcommittee”) to deal in the first instance with establishing the prices of securities for which market quotations are not readily available or the prices of which are not otherwise readily determinable under these procedures. The Subcommittee meets (in person, via electronic mail or via teleconference) on an as-needed basis. Subsequently, the Valuation Committee meets to ensure that actions taken by the Subcommittee were appropriate. The procedures state that, subject to the oversight of the Board and unless otherwise noted, the responsibility for theday-to-day valuation of portfolio assets (including fair value measurements for the Portfolio’s assets and liabilities) rests with New York Life Investment Management LLC (“New York Life Investments” or the “Manager”), aided to whatever extent necessary by the Subadvisor (as defined in Note 3(A)).
To assess the appropriateness of security valuations, the Manager, the Subadvisor or the Portfolio’s third-party service provider, who is subject to oversight by the Manager, regularly compares prior day prices, prices on comparable securities and the sale prices to the prior and current day prices and challenges prices with changes exceeding certain tolerance levels with third-party pricing services or broker sources. For those securities valued through either a standardized fair valuation methodology or a fair valuation measurement, the Subcommittee deals in the first instance with such valuation and the Valuation Committee reviews and affirms, if appropriate, the reasonableness of the valuation based on such methodologies and measurements on a regular basis after considering information that is reasonably available and deemed relevant by the Valuation Committee. Any action taken by the Subcommittee with respect to the valuation of a portfolio security or other asset is submitted for review and ratification (if appropriate) to the Valuation Committee and the Board at the next regularly scheduled meeting.
“Fair value” is defined as the price the Portfolio would reasonably expect to receive upon selling an asset or liability in an orderly transaction to an independent buyer in the principal or most advantageous market for the asset or liability. Fair value measurements are determined within a framework that establishes a three-tier hierarchy which maximizes the use of observable market data and minimizes the use of unobservable inputs to establish a classification of fair value measurements for disclosure purposes. “Inputs” refer broadly to the assumptions that market participants would use in pricing the asset or liability, including assumptions about risk, such as the risk inherent in a particular valuation technique used to measure fair value using a pricing model and/or the risk inherent in the inputs for the valuation technique. Inputs may be observable or unobservable. Observable inputs reflect the assumptions market participants would use in pricing the asset or liability based on market data obtained from sources independent of the Portfolio. Unobservable inputs reflect the Portfolio’s own assumptions about the assumptions market participants would use in pricing the asset or liability based on the information available. The inputs or methodology used for valuing assets or liabilities may not be an indication of the risks
Notes to Financial Statements(Unaudited) (continued)
associated with investing in those assets or liabilities. The three-tier hierarchy of inputs is summarized below.
| • | | Level 1—quoted prices in active markets for an identical asset or liability |
| • | | Level 2—other significant observable inputs (including quoted prices for a similar asset or liability in active markets, interest rates and yield curves, prepayment speeds, credit risk, etc.) |
| • | | Level 3—significant unobservable inputs (including the Portfolio’s own assumptions about the assumptions that market participants would use in measuring fair value of an asset or liability) |
The level of an asset or liability within the fair value hierarchy is based on the lowest level of an input, both individually and in the aggregate, that is significant to the fair value measurement. As of June 30, 2019, the aggregate value by input level of the Portfolio’s assets and liabilities is included at the end of the Portfolio’s Portfolio of Investments.
The Portfolio may use third party vendor evaluations, whose prices may be derived from one or more of the following standard inputs, among others:
| | |
• Benchmark yields | | • Reported trades |
• Broker/dealer quotes | | • Issuer spreads |
• Two-sided markets | | • Benchmark securities |
• Bids/offers | | • Reference data (corporate actions or material event notices) |
• Industry and economic events | | • Comparable bonds |
• Monthly payment information | | |
An asset or liability for which market values cannot be measured using the methodologies described above is valued by methods deemed reasonable in good faith by the Valuation Committee, following the procedures established by the Board, to represent fair value. Under these procedures, the Portfolio generally uses a market-based approach which may use related or comparable assets or liabilities, recent transactions, market multiples, book values and other relevant information. The Portfolio may also use an income-based valuation approach in which the anticipated future cash flows of the asset or liability are discounted to calculate fair value. Discounts may also be applied due to the nature and/or duration of any restrictions on the disposition of the asset or liability. Fair value represents a good faith approximation of the value of a security. Fair value determinations involve the consideration of a number of subjective factors, an analysis of applicable facts and circumstances and the exercise of judgment. As a result, it is possible that the fair value for a security determined in good faith in accordance with the Portfolio’s valuation procedures may differ from valuations for the same security determined by other funds using their own valuation procedures. Although the Portfolio’s valuation procedures are designed to value a security at the price the Portfolio may reasonably expect to receive upon the security’s sale in an orderly transaction, there can be no assurance that any fair value determination thereunder would, in fact, approximate the amount that the Portfolio would actually realize upon the sale of the security or the price at which the security would trade if a reliable market price were readily available. During the six-month period ended June 30, 2019, there were no material changes to the fair value methodologies.
Securities which may be valued in this manner include, but are not limited to: (i) a security for which trading has been halted or suspended; (ii) a debt security that has recently gone into default and for which there is not a current market quotation; (iii) a security of an issuer that has entered into a restructuring; (iv) a security that has been delisted from a national exchange; (v) a security for which the market price is not readily available from a third-party pricing source or, if so provided, does not, in the opinion of the Manager or the Subadvisor, reflect the security’s market value; (vi) a security subject to trading collars for which no or limited trading takes place; and (vii) a security whose principal market has been temporarily closed at a time when, under normal conditions, it would be open. Securities valued in this manner are generally categorized as Level 3 in the hierarchy. As of June 30, 2019, there were no securities held by the Portfolio that were fair valued in such a manner.
Exchange-traded funds (“ETFs”) are valued at the last quoted sales prices as of the close of regular trading on the relevant exchange on each valuation date. Securities that are not traded on the valuation date are valued at the mean of the last quoted bid and ask prices. Prices are normally taken from the principal market in which each security trades. Futures contracts are valued at the last posted settlement price on the market where such futures are primarily traded. These securities are generally categorized as Level 1 in the hierarchy.
Investments in mutual funds, including money market funds, are valued at their respective NAVs as of the close of the Exchange on the valuation date. These securities are generally categorized as Level 1 in the hierarchy.
Debt securities (other than convertible and municipal bonds) are valued at the evaluated bid prices (evaluated mean prices in the case of convertible and municipal bonds) supplied by a pricing agent or brokers selected by the Manager, in consultation with the Subadvisor. The evaluations are market-based measurements processed through a pricing application and represents the pricing agent’s good faith determination as to what a holder may receive in an orderly transaction under market conditions. The rules based logic utilizes valuation techniques that reflect participants’ assumptions and vary by asset class and per methodology, maximizing the use of relevant observable data including quoted prices for similar assets, benchmark yield curves and market corroborated inputs. The evaluated bid or mean prices are deemed by the Manager, in consultation with the Subadvisor to be representative of market values, at the regular close of trading of the Exchange on each valuation date. Debt securities purchased on a delayed delivery basis are marked to market daily until settlement at the forward settlement date. Debt securities, including corporate bonds, U.S. government and federal agency bonds, municipal bonds, foreign bonds, convertible bonds, asset-backed securities and mortgage-backed securities are generally categorized as Level 2 in the hierarchy.
Temporary cash investments acquired in excess of 60 days to maturity at the time of purchase are valued using the latest bid prices or using valuations based on a matrix system (which considers such factors as security prices, yields, maturities and ratings), both as furnished by independent pricing services. Other temporary cash investments which mature in 60 days or less at the time of purchase (“Short-Term Investments”) are valued using the amortized cost method of valuation, unless the use of such method would be inappropriate. The amortized
| | |
| 28 | | MainStay VP Indexed Bond Portfolio |
cost method involves valuing a security at its cost on the date of purchase and thereafter assuming a constant amortization to maturity of
the difference between such cost and the value on maturity date. Amortized cost approximates the current fair value of a security. Securities valued using the amortized cost method are not valued using quoted prices in an active market and are generally categorized as Level 2 in the hierarchy.
The information above is not intended to reflect an exhaustive list of the methodologies that may be used to value portfolio investments. The valuation procedures permit the use of a variety of valuation methodologies in connection with valuing portfolio investments. The methodology used for a specific type of investment may vary based on the market data available or other considerations. The methodologies summarized above may not represent the specific means by which portfolio investments are valued on any particular business day.
(B) Income Taxes. The Portfolio’s policy is to comply with the requirements of the Internal Revenue Code of 1986, as amended (the “Internal Revenue Code”), applicable to regulated investment companies and to distribute all of its taxable income to the shareholders of the Portfolio within the allowable time limits. Therefore, no federal, state and local income tax provisions are required.
Management evaluates the Portfolio’s tax positions to determine if the tax positions taken meet the minimum recognition threshold in connection with accounting for uncertainties in income tax positions taken or expected to be taken for the purposes of measuring and recognizing tax liabilities in the financial statements. Recognition of tax benefits of an uncertain tax position is permitted only to the extent the position is “more likely than not” to be sustained assuming examination by taxing authorities. Management has analyzed the Portfolio’s tax positions taken on federal, state and local income tax returns for all open tax years (for up to three tax years) and has concluded that no provisions for federal, state and local income tax are required in the Portfolio’s financial statements. The Portfolio’s federal, state and local income tax and federal excise tax returns for tax years for which the applicable statutes of limitations have not expired are subject to examination by the Internal Revenue Service and state and local departments of revenue.
(C) Dividends and Distributions to Shareholders. Dividends and distributions are recorded on the ex-dividend date. The Portfolio intends to declare and pay dividends from net investment income and distributions from net realized capital and currency gains, if any, at least annually. Unless the shareholder elects otherwise, all dividends and distributions are reinvested in the same class of shares of the Portfolio, at NAV. Dividends and distributions to shareholders are determined in accordance with federal income tax regulations and may differ from determinations using GAAP.
(D) Security Transactions and Investment Income. The Portfolio records security transactions on the trade date. Realized gains and losses on security transactions are determined using the identified cost method. Dividend income is recognized on the ex-dividend date; net of any foreign tax withheld at the source, and interest income is accrued as earned using the effective interest rate method. Discounts and premiums on securities purchased, other thanShort-Term Investments, for the Portfolio are accreted and amortized, respectively, on the effective interest rate method over the life of the respective securities.
Investment income and realized and unrealized gains and losses on investments of the Portfolio are allocated pro rata to the separate classes of shares based upon their relative net assets on the date the income is earned or realized and unrealized gains and losses are incurred.
The Portfolio may place a debt security on non-accrual status and reduce related interest income by ceasing current accruals and writing off all or a portion of any interest receivables when the collection of all or a portion of such interest has become doubtful. A debt security is removed from non-accrual status when the issuer resumes interest payments or when collectability of interest is reasonably assured.
(E) Expenses. Expenses of the Fund are allocated to the individual Portfolios in proportion to the net assets of the respective Portfolios when the expenses are incurred, except where direct allocations of expenses can be made. Expenses (other than fees incurred under the distribution and service plans, further discussed in Note 3(B), which are charged directly to the Service Class shares) are allocated to separate classes of shares pro rata based upon their relative net assets on the date the expenses are incurred. The expenses borne by the Portfolio, including those of related parties to the Portfolio, are shown in the Statement of Operations.
Additionally, the Portfolio may invest in ETFs and mutual funds, which are subject to management fees and other fees that may cause the costs of investing in ETFs and mutual funds to be greater than the costs of owning the underlying securities directly. These indirect expenses of ETFs and mutual funds are not included in the amounts shown as expenses in the Portfolio’s Statement of Operations or in the expense ratios included in the Financial Highlights.
(F) Use of Estimates. In preparing financial statements in conformity with GAAP, management makes estimates and assumptions that affect the reported amounts and disclosures in the financial statements. Actual results could differ from those estimates.
(G) Repurchase Agreements. The Portfolio may enter into repurchase agreements (i.e., buy a security from another party with the agreement that it be sold back in the future) to earn income. The Portfolio may enter into repurchase agreements only with counterparties, usually financial institutions, that are deemed by the Manager or the Subadvisor to be creditworthy, pursuant to guidelines established by the Board. During the term of any repurchase agreement, the Manager or the Subadvisor will continue to monitor the creditworthiness of the counterparty. Under the 1940 Act, repurchase agreements are considered to be collateralized loans by the Portfolio to the counterparty secured by the securities transferred to the Portfolio.
Repurchase agreements are subject to counterparty risk, meaning the Portfolio could lose money by the counterparty’s failure to perform under the terms of the agreement. The Portfolio mitigates this risk by ensuring the repurchase agreement is collateralized by cash, U.S. government securities, fixed income securities and/or other securities. The collateral is held by the Portfolio’s custodian and valued daily on a mark to market basis to determine if the value, including accrued interest, exceeds the repurchase price. In the event of the counterparty’s default on the obligation to repurchase, the Portfolio has the right to liquidate the collateral and apply the proceeds in satisfaction of the obligation. Under certain circumstances, such as in the event of
Notes to Financial Statements(Unaudited) (continued)
default or bankruptcy by the counterparty, realization and/or retention of the collateral may be limited or subject to delay, to legal proceedings and possible realized loss to the Portfolio. As of June 30, 2019, repurchase agreements are shown in the Portfolio of Investments.
(H) Futures Contracts. A futures contract is an agreement to purchase or sell a specified quantity of an underlying instrument at a specified future date and price, or to make or receive a cash payment based on the value of a financial instrument (e.g., foreign currency, interest rate, security or securities index). The Portfolio is subject to risks such as market price risk and/or interest rate risk in the normal course of investing in these transactions. Upon entering into a futures contract, the Portfolio is required to pledge to the broker or futures commission merchant an amount of cash and/or U.S. government securities equal to a certain percentage of the collateral amount, known as the “initial margin.” During the period the futures contract is open, changes in the value of the contract are recognized as unrealized appreciation or depreciation by marking to market such contract on a daily basis to reflect the market value of the contract at the end of each day’s trading. The Portfolio agrees to receive from or pay to the broker or futures commission merchant an amount of cash equal to the daily fluctuation in the value of the contract. Such receipts or payments are known as “variation margin.” When the futures contract is closed, the Portfolio records a realized gain or loss equal to the difference between the proceeds from (or cost of) the closing transaction and the Portfolio’s basis in the contract.
The use of futures contracts involves, to varying degrees, elements of market risk in excess of the amount recognized in the Statement of Assets and Liabilities. The contract or notional amounts and variation margin reflect the extent of the Portfolio’s involvement in open futures positions. There are several risks associated with the use of futures contracts as hedging techniques. There can be no assurance that a liquid market will exist at the time when the Portfolio seeks to close out a futures contract. If no liquid market exists, the Portfolio would remain obligated to meet margin requirements until the position is closed. Futures may involve a small initial investment relative to the risk assumed, which could result in losses greater than if they had not been used. Futures may be more volatile than direct investments in the instrument underlying the futures and may not correlate to the underlying instrument, causing a given hedge not to achieve its objectives. The Portfolio’s activities in futures contracts have minimal counterparty risk as they are conducted through regulated exchanges that guarantee the futures against default by the counterparty. In the event of a bankruptcy or insolvency of a futures commission merchant that holds margin on behalf of the Portfolio, the Portfolio may not be entitled to the return of the entire margin owed to the Portfolio, potentially resulting in a loss. The Portfolio’s investment in futures contracts and other derivatives may increase the volatility of the Portfolio’s NAVs and may result in a loss to the Portfolio. As of June 30, 2019, open futures contracts are shown in the Portfolio of Investments.
(I) Dollar Rolls. The Portfolio may enter into dollar roll transactions in which it sells mortgage-backed securities (“MBS”) from its portfolio to a counterparty from whom it simultaneously agrees to buy a similar security on a delayed delivery basis. The Portfolio generally transfers MBS where the MBS are “to be announced,” therefore, the Portfolio accounts for these transactions as purchases and sales.
When accounted for as purchase and sales, the securities sold in connection with the dollar rolls are removed from the portfolio and a realized gain or loss is recognized. The securities the Portfolio has agreed to acquire are included at market value in the Portfolio of Investments and liabilities for such purchase commitments are included as payables for investments purchased. During the roll period, the Portfolio foregoes principal and interest paid on the securities. The Portfolio is compensated by the difference between the current sales price and the forward price for the future as well as by the earnings on the cash proceeds of the initial sale. Dollar rolls may be renewed without physical delivery of the securities subject to the contract. The Portfolio maintains liquid assets from its portfolio having a value not less than the repurchase price, including accrued interest. Dollar roll transactions involve certain risks, including the risk that the securities returned to the Portfolio at the end of the roll period, while substantially similar, could be inferior to what was initially sold to the counterparty.
The Portfolio accounts for a dollar roll transaction as a purchase and sale whereby the difference in the sales price and purchase price of the security sold is recorded as a realized gain (loss).
(J) Securities Lending. In order to realize additional income, the Portfolio may engage in securities lending, subject to the limitations set forth in the 1940 Act and relevant guidance by the staff of the Securities and Exchange Commission (“SEC”). In the event the Portfolio does engage in securities lending, the Portfolio will lend through its custodian, State Street Bank and Trust Company (“State Street”), acting as securities lending agent on behalf of the Portfolio. State Street will manage the Portfolio’s collateral in accordance with the securities lending agency agreement between the Portfolio and State Street, and indemnify the Portfolio against counterparty risk. The loans will be collateralized by cash (which may be invested in a money market fund) and/ornon-cash collateral (which may include, U.S. Treasury securities and/or U.S. Government Agency securities issued or guaranteed by the United States government or its agencies or instrumentalities) at least equal at all times to the market value of the securities loaned. The Portfolio may bear the risk of delay in recovery of, or loss of rights in, the securities loaned should the borrower of the securities experience financial difficulty. The Portfolio may also record a realized gain or loss on securities deemed sold due to a borrower’s inability to return securities on loan. The Portfolio bears the risk of any loss on investment of cash collateral. The Portfolio will receive compensation for lending its securities in the form of fees or it will retain a portion of interest on the investment of any cash collateral. The Portfolio will also continue to receive interest and dividends on the securities loaned and any gain or loss in the market price of the securities loaned that may occur during the term of the loan will be for the account of the Portfolio. Income earned from securities lending activities, if any, is reflected in the Statement of Operations. As of June 30, 2019, the Portfolio had securities on loan with an aggregate market value of $1,257,411 and received cash collateral which was invested into the State Street Navigator Securities Lending Government Money Market Portfolio with a value of $1,282,790.
(K) Securities Risk. The ability of issuers of debt securities held by the Portfolio to meet their obligations may be affected by, among other things, economic or political developments in a specific country, industry or region. Debt securities are also subject to the risks associated with changes in interest rates.
| | |
| 30 | | MainStay VP Indexed Bond Portfolio |
Investments in the Portfolio are not guaranteed, even though some of the Portfolio’s underlying investments are guaranteed by the U.S. government or its agencies or instrumentalities. The principal risk of mortgage-related and asset-backed securities is that the underlying debt may be prepaid ahead of schedule, if interest rates fall, thereby reducing the value of the Portfolio’s investment. If interest rates rise, less of the debt may be prepaid and the Portfolio may lose money because the Portfolio may be unable to invest in higher yielding assets. The Portfolio is subject to interest-rate risk and can lose principal value when interest rates rise. Bonds are also subject to credit risk, in which the bond issuer may fail to pay interest and principal in a timely manner.
The Portfolio may invest in foreign securities, which carry certain risks that are in addition to the usual risks inherent in domestic securities. These risks include those resulting from currency fluctuations, future adverse political or economic developments and possible imposition of currency exchange blockages or other foreign governmental laws or restrictions. These risks are likely to be greater in emerging markets than in developed markets. The ability of issuers of securities held by the Portfolio to meet their obligations may be affected by, among other things, economic or political developments in a specific country, industry or region.
(L) Indemnifications. Under the Fund’s organizational documents, its officers and trustees are indemnified against certain liabilities that may arise out of performance of their duties to the Fund. Additionally, in the normal course of business, the Portfolio enters into contracts with third-party service providers that contain a variety of representations and warranties and which may provide general indemnifications. The Portfolio’s maximum exposure under these arrangements is unknown, as this would involve future claims that may be made against the Portfolio that have not yet occurred. Based on experience, management is of the view that the risk of loss in connection with these potential indemnification obligations is remote. However, there can be no assurance that material liabilities related to such obligations will not arise in the future, which could adversely impact the Portfolio.
(M) Quantitative Disclosure of Derivative Holdings. The following tables show additional disclosures related to the Portfolio’s derivative and hedging activities, including how such activities are accounted for and their effect on the Portfolio’s financial positions, performance and cash flows. The Portfolio entered into futures contracts in order to hedge against anticipated changes in interest rates that might otherwise have an adverse effect upon the value of the Portfolio’s securities as well as help manage the duration and yield curve of the portfolio. These derivatives are not accounted for as hedging instruments.
Fair value of derivative instruments as of June 30, 2019:
Asset Derivatives
| | | | | | | | | | |
| | | Statement of
Assets and
Liabilities
Location | | Interest
Rate
Contracts
Risk | | | Total | |
| | | |
Futures Contracts | | Net Assets—Net unrealized appreciation on investments and futures contracts (a) | | $ | 484,330 | | | $ | 484,330 | |
| | | | | | |
Total Fair Value | | | | $ | 484,330 | | | $ | 484,330 | |
| | | | | | |
Liability Derivatives
| | | | | | | | | | |
| | | Statement of Assets and Liabilities Location | | Interest
Rate
Contracts
Risk | | | Total | |
| | | |
Futures Contracts | | Net Assets—Net unrealized depreciation on investments and futures contracts (a) | | $ | (142,348 | ) | | $ | (142,348 | ) |
| | | | | | |
Total Fair Value | | | | $ | (142,348 | ) | | $ | (142,348 | ) |
| | | | | | |
| (a) | Includes cumulative appreciation (depreciation) of futures contracts as reported in the Portfolio of Investments. Only current day’s variation margin is reported within the Statement of Assets and Liabilities. |
The effect of derivative instruments on the Statement of Operations for the period ended June 30, 2019:
Realized Gain (Loss)
| | | | | | | | | | |
| | | Statement of
Operations
Location | | Interest
Rate
Contracts
Risk | | | Total | |
| | | |
Futures Contracts | | Net realized gain (loss) on futures transactions | | $ | 401,772 | | | $ | 401,772 | |
| | | | | | |
Total Realized Gain (Loss) | | | | $ | 401,772 | | | $ | 401,772 | |
| | | | | | |
Change in Unrealized Appreciation (Depreciation)
| | | | | | | | | | |
| | | Statement of
Operations
Location | | Interest
Rate
Contracts
Risk | | | Total | |
| | | |
Futures Contracts | | Net change in unrealized appreciation (depreciation) on futures contracts | | $ | 222,011 | | | $ | 222,011 | |
| | | | | | |
Total Change in Unrealized Appreciation (Depreciation) | | | | $ | 222,011 | | | $ | 222,011 | |
| | | | | | |
Average Notional Amount
| | | | | | | | |
| | | Interest
Rate
Contracts
Risk | | | Total | |
| | |
Futures Contracts Long | | $ | 23,598,521 | | | $ | 23,598,521 | |
Futures Contracts Short | | $ | (5,810,932 | ) | | $ | (5,810,932 | ) |
| | | | | | | | |
Note 3–Fees and Related Party Transactions
(A) Manager and Subadvisor. New York Life Investments, a registered investment adviser and an indirect,wholly-owned subsidiary of New York Life, serves as the Portfolio’s Manager pursuant to an Amended and Restated Management Agreement (“Management Agreement”). The Manager provides offices, conducts clerical, recordkeeping and bookkeeping services, and keeps most of the financial and
Notes to Financial Statements(Unaudited) (continued)
accounting records required to be maintained by the Portfolio. Except for the portion of salaries and expenses that are the responsibility of the Portfolio, the Manager pays the salaries and expenses of all personnel affiliated with the Portfolio and certain operational expenses of the Portfolio. The Portfolio reimburses New York Life Investments in an amount equal to a portion of the compensation of the Chief Compliance Officer attributable to the Portfolio. NYL Investors LLC (“NYL Investors” or “Subadvisor”), a registered investment adviser and a direct,wholly-owned subsidiary of New York Life, serves as Subadvisor to the Portfolio and is responsible for theday-to-day portfolio management of the Portfolio. Pursuant to the terms of a Subadvisory Agreement (“Subadvisory Agreement”) between New York Life Investments and NYL Investors LLC, New York Life Investments pays for the services of the Subadvisor.
Under the Management Agreement, the Portfolio pays the Manager a monthly fee for the services performed and the facilities furnished at an annual rate of the Portfolio’s average daily net assets as follows: 0.25% up to $1 billion and 0.20% in excess of $1 billion. During the six-month period ended June 30, 2019, the effective management fee rate was 0.25%.
New York Life Investments has contractually agreed to waive fees and/or reimburse expenses so that Total Annual Portfolio Operating Expenses (excludes taxes, interest, litigation, extraordinary expenses, brokerage and other transaction expenses relating to the purchase or sale of portfolio investments, and acquired (underlying) fund fees and expenses) do not exceed the following percentages of average daily net assets: Initial Class, 0.375%; and Service Class, 0.625%. This agreement expires on May 1, 2020, and may only be amended or terminated prior to that date by action of the Board.
During the six-month period ended June 30, 2019, New York Life Investments earned fees from the Portfolio in the amount of $492,165, and paid the Subadvisor in the amount of $246,083.
State Street providessub-administration andsub-accounting services to the Portfolio pursuant to an agreement with New York Life Investments. These services include calculating the daily NAVs of the Portfolio, maintaining the general ledger andsub-ledger accounts for the calculation of the Portfolio’s NAVs and assisting New York Life Investments in conducting various aspects of the Portfolio’s administrative operations. For providing these services to the Portfolio, State Street is compensated by New York Life Investments.
Pursuant to an agreement between the Fund and New York Life Investments, New York Life Investments is responsible for providing or procuring certain regulatory reporting services for the Portfolio. The Portfolio will reimburse New York Life Investments for the actual costs incurred by New York Life Investments in connection with providing or procuring these services for the Portfolio.
(B) Distribution and Service Fees. The Fund, on behalf of the Portfolio, has entered into a distribution agreement with NYLIFE Distributors LLC (the “Distributor”), an indirect,wholly-owned subsidiary of New York Life. The Portfolio has adopted a distribution plan (the “Plan”) in accordance with the provisions of Rule 12b-1 under the 1940 Act. Under the Plan, the Distributor has agreed to provide, through its affiliates or independent third parties, various distribution-related, shareholder and administrative support services to the Service Class
shareholders. For its services, the Distributor is entitled to a combined distribution and service fee accrued daily and paid monthly at an annual rate of 0.25% of the average daily net assets attributable to the Service Class shares of the Portfolio.
Note 4–Federal Income Tax
As of June 30, 2019, the cost and unrealized appreciation (depreciation) of the Portfolio’s investment portfolio, including applicable derivative contracts and other financial instruments, as determined on a federal income tax basis, were as follows:
| | | | | | | | | | | | | | | | |
| | | Federal Tax
Cost | | | Gross
Unrealized
Appreciation | | | Gross
Unrealized
(Depreciation) | | | Net
Unrealized
Appreciation/
(Depreciation) | |
| | | | |
Investments in Securities | | $ | 390,317,378 | | | $ | 14,657,286 | | | $ | (425,383 | ) | | $ | 14,231,903 | |
During the year ended December 31, 2018, the tax character of distributions paid as reflected in the Statements of Changes in Net Assets was as follows:
| | |
|
| 2018 |
Tax-Based
Distributions
from Ordinary
Income | | Tax-Based
Distributions
from Long-Term
Gains |
| |
| $6,751,774 | | $— |
Note 5–Custodian
State Street is the custodian of cash and securities held by the Portfolio. Custodial fees are charged to the Portfolio based on the Portfolio’s net assets and/or the market value of securities held by the Portfolio and the number of certain transactions incurred by the Portfolio.
Note 6–Line of Credit
The Portfolio and certain other funds managed by New York Life Investments maintain a line of credit with a syndicate of banks in order to secure a source of funds for temporary purposes to meet unanticipated or excessive redemption requests.
Effective July 30, 2019, under the credit agreement (the “Credit Agreement”), the aggregate commitment amount is $600,000,000 with an additional uncommitted amount of $100,000,000. The commitment fee is an annual rate of 0.15% of the average commitment amount payable quarterly, regardless of usage, to State Street, who serves as the agent to the syndicate. The commitment fee is allocated among the Portfolio and certain other funds managed by New York Life Investments based upon their respective net assets and other factors. Interest on any revolving credit loan is charged based upon the Federal Funds Rate or the one-month London Interbank Offered Rate (“LIBOR”), whichever is higher. The Credit Agreement expires on July 28, 2020, although the Portfolio, certain other funds managed by New York Life Investments and the syndicate of banks may renew the Credit Agreement for an additional year on the same or different terms. Prior to July 30, 2019, the aggregate commitment amount and the commitment fee were the same as those under the current Credit Agreement. During the
| | |
| 32 | | MainStay VP Indexed Bond Portfolio |
six-month period ended June 30, 2019, there were no borrowings made or outstanding with respect to the Portfolio under the Credit Agreement.
Note 7–Interfund Lending Program
Pursuant to an exemptive order issued by the SEC, the Portfolio, along with certain other funds managed by New York Life Investments, may participate in an interfund lending program. The interfund lending program provides an alternative credit facility that permits the Portfolio and certain other funds managed by New York Life Investments to lend or borrow money for temporary purposes directly to or from one another subject to the conditions of the exemptive order. During the six-month period ended June 30, 2019, there were no interfund loans made or outstanding with respect to the Portfolio.
Note 8–Purchases and Sales of Securities (in 000’s)
During the six-month period ended June 30, 2019, purchases and sales of U.S. government securities were $94,948 and $103,232, respectively. Purchases and sales of securities, other than U.S. government securities andshort-term securities, were $19,183 and $21,254, respectively.
Note 9–Capital Share Transactions
Transactions in capital shares for the six-month period ended June 30, 2019 and the year ended December 31, 2018, were as follows:
| | | | | | | | |
Initial Class | | Shares | | | Amount | |
| | |
Six-month period ended June 30, 2019: | | | | | | | | |
Shares sold | | | 259,549 | | | $ | 2,638,364 | |
Shares redeemed | | | (5,902,067 | ) | | | (59,259,857 | ) |
| | | | |
Net increase (decrease) | | | (5,642,518 | ) | | $ | (56,621,493 | ) |
| | | | |
Year ended December 31, 2018: | | | | | | | | |
Shares sold | | | 34,397,047 | | | $ | 337,614,813 | |
Shares issued to shareholders in reinvestment of dividends and distributions | | | 631,924 | | | | 6,178,249 | |
Shares redeemed | | | (12,061,248 | ) | | | (118,666,105 | ) |
| | | | |
Net increase (decrease) | | | 22,967,723 | | | $ | 225,126,957 | |
| | | | |
| | |
| | | | | | | | |
Service Class | | Shares | | | Amount | |
Six-month period ended June 30, 2019: | | | | | | | | |
Shares sold | | | 4,099,328 | | | $ | 41,083,926 | |
Shares redeemed | | | (366,805 | ) | | | (3,650,089 | ) |
| | | | |
Net increase (decrease) | | | 3,732,523 | | | $ | 37,433,837 | |
| | | | |
Year ended December 31, 2018: | | | | | | | | |
Shares sold | | | 3,576,641 | | | $ | 35,080,816 | |
Shares issued to shareholders in reinvestment of dividends and distributions | | | 58,798 | | | | 573,525 | |
Shares redeemed | | | (237,940 | ) | | | (2,330,524 | ) |
| | | | |
Net increase (decrease) | | | 3,397,499 | | | $ | 33,323,817 | |
| | | | |
Note 10–Recent Accounting Pronouncement
To improve the effectiveness of fair value disclosure requirements, the Financial Accounting Standards Board recently issued Accounting Standard Update (ASU)2018-13, Fair Value Measurement Disclosure Framework—Changes to the Disclosure Requirements for Fair Value Measurement (ASU2018-13), which adds, removes, and modifies certain aspects relating to fair value disclosure. ASU2018-13 is effective for interim and annual reporting periods beginning after December 15, 2019; early adoption of the additions relating toASU 2018-13 is not required. Management has evaluated the implications of certain other provisions of the ASU and has determined to early adopt aspects related to the removal and modifications of certain fair value measurement disclosures under the ASU effective immediately. At this time, management is evaluating the implications of certain other provisions of the ASU related to new disclosure requirements and any impact on the financial statement disclosures has not yet been determined.
Note 11–Subsequent Events
In connection with the preparation of the financial statements of the Portfolio as of and for the six-month period ended June 30, 2019, events and transactions subsequent to June 30, 2019, through the date the financial statements were issued have been evaluated by the Portfolio’s management for possible adjustment and/or disclosure. No subsequent events requiring financial statement adjustment or disclosure have been identified.
Proxy Voting Policies and Procedures and Proxy Voting Record
A description of the policies and procedures that New York Life Investments uses to vote proxies related to the Portfolio’s securities is available without charge, upon request (i) by calling800-598-2019; (ii) by visiting New York Life Investments website at https://www.nylinvestments.com/mainstay/products-and-performance/mainstay-vp-funds-trust; or (iii) by visiting the SEC’s website at www.sec.gov.
The Portfolio is required to file with the SEC its proxy voting record for the12-month period ending June 30 on Form N-PX. The Portfolio’s most recent Form N-PX or proxy voting record is available free of charge upon request (i) by calling800-598-2019; (ii) by visiting New York Life Investments website at https://www.nylinvestments.com/mainstay/products-and-performance/mainstay-vp-funds-trust; or (iii) by visiting the SEC’s website atwww.sec.gov.
Shareholder Reports and Quarterly Portfolio Disclosure
The Portfolio is required to file its complete schedule of portfolio holdings with the SEC 60 days after each fiscal quarter onForm N-PORT. The Portfolio’s holdings report is available without charge upon request (i) by calling800-598-2019; (ii) by visiting New York Life Investments website at https://www.nylinvestments.com/mainstay/products-and-performance/mainstay-vp-funds-trust; or (iii) on the SEC’s website at www.sec.gov.
| | |
| 34 | | MainStay VP Indexed Bond Portfolio |
MainStay VP Portfolios
MainStay VP offers a wide range of Portfolios. The full array of MainStay VP offerings is listed here, with information about the manager, subadvisors, legal counsel, and independent registered public accounting firm.
Equity Portfolios
MainStay VP Eagle Small Cap Growth Portfolio
MainStay VP Emerging Markets Equity Portfolio
MainStay VP Epoch U.S. Equity Yield Portfolio
MainStay VP Fidelity Institutional AM® Utilities Portfolio†
MainStay VP Large Cap Growth Portfolio
MainStay VP MacKay Common Stock Portfolio
MainStay VP MacKay Growth Portfolio
MainStay VP MacKay International Equity Portfolio
MainStay VP MacKay Mid Cap Core Portfolio
MainStay VP MacKay S&P 500 Index Portfolio
MainStay VP MacKay Small Cap Core Portfolio
MainStay VP Mellon Natural Resources Portfolio
MainStay VP T. Rowe Price Equity Income Portfolio
Mixed Asset Portfolios
MainStay VP Balanced Portfolio
MainStay VP Income Builder Portfolio
MainStay VP Janus Henderson Balanced Portfolio
MainStay VP MacKay Convertible Portfolio
Income Portfolios
MainStay VP Bond Portfolio
MainStay VP Floating Rate Portfolio
MainStay VP Indexed Bond Portfolio
MainStay VP MacKay Government Portfolio
MainStay VP MacKay High Yield Corporate Bond Portfolio
MainStay VP MacKay Unconstrained Bond Portfolio
MainStay VP PIMCO Real Return Portfolio
Money Market
MainStay VP U.S. Government Money Market Portfolio
Alternative
MainStay VP Cushing Renaissance Advantage Portfolio
MainStay VP IQ Hedge Multi-Strategy Portfolio
Asset Allocation Portfolios
MainStay VP Conservative Allocation Portfolio
MainStay VP Growth Allocation Portfolio
MainStay VP Moderate Allocation Portfolio
MainStay VP Moderate Growth Allocation Portfolio
Manager
New York Life Investment Management LLC
New York, New York
Subadvisors
Candriam Belgium*
Brussels, Belgium
Cushing Asset Management, LP
Dallas, Texas
Eagle Asset Management, Inc.
St Petersburg, Florida
Epoch Investment Partners, Inc.
New York, New York
FIAM LLC
Smithfield, Rhode Island
IndexIQ Advisors LLC*
New York, New York
Janus Capital Management LLC
Denver, Colorado
MacKay Shields LLC*
New York, New York
Mellon Investments Corporation
Boston, Massachusetts
NYL Investors LLC*
New York, New York
Pacific Investment Management Company LLC
Newport Beach, California
T. Rowe Price Associates, Inc.
Baltimore, Maryland
Winslow Capital Management, LLC
Minneapolis, Minnesota
Distributor
NYLIFE Distributors LLC*
Jersey City, New Jersey
Custodian
State Street Bank and Trust Company
Boston, Massachusetts
Independent Registered Public Accounting Firm
PricewaterhouseCoopers LLP
New York, New York
Legal Counsel
Dechert LLP
Washington, District of Columbia
Some Portfolios may not be available in all products.
| † | Fidelity Institutional AM is a registered trade mark of FMR LLC. Used with permission. |
| * | An affiliate of New York Life Investment Management LLC |
Not part of the Semiannual Report
2019 Semiannual Report
This report is for the general information of New York Life Variable Annuities and NYLIAC Variable Universal Life Insurance Products policyowners. It must be preceded or accompanied by the appropriate product(s) and funds prospectuses if it is given to anyone who is not an owner of a New York Life variable annuity policy or a NYLIAC Variable Universal Life Insurance Product. This report does not offer for sale or solicit orders to purchase securities.
The performance data quoted in this report represents past performance. Past performance is no guarantee of future results. Due to market volatility and other factors, current performance may be lower or higher than the figures shown. The most recent month-end performance summary for your variable annuity or variable life policy is available by calling 800-598-2019 and is updated periodically on www.newyorklife.com.
The New York Life Variable Annuities and NYLIAC Variable Universal Life Insurance Products are issued by New York Life Insurance and Annuity Corporation (a Delaware Corporation) and distributed by NYLIFE Distributors LLC (Member FINRA/SIPC).
New York Life Insurance Company
New York Life Insurance and Annuity Corporation (NYLIAC) (A Delaware Corporation)
51 Madison Avenue, Room 551
New York, NY 10010
www.newyorklife.com
Printed on recycled paper
nylinvestments.com
NYLIFE Distributors LLC, 30 Hudson Street, Jersey City, NJ 07302
New York Life Investment Management LLC is the investment manager to the MainStay VP Funds Trust
©2019 by NYLIFE Distributors LLC. All rights reserved.
You may obtain copies of the Prospectus and the Statement of Additional Information free of charge, upon request, by callingtoll-free 800-598-2019 or writing to New York Life Insurance and Annuity Corporation, 51 Madison Avenue, New York, NY 10010.
| | | | |
| | | |
| Not FDIC Insured | | No Bank Guarantee | | May Lose Value |
| | | | |
| 1781627 | | | | MSVPIN10-08/19 (NYLIAC) NI555 |
MainStay VP Janus Henderson Balanced Portfolio
Message from the President and Semiannual Report
Unaudited | June 30, 2019

Beginning on January 1, 2021, as permitted by regulations adopted by the Securities and Exchange Commission, paper copies of the MainStay VP Portfolio annual and semi-annual shareholder reports may no longer be sent by mail, unless you specifically request paper copies of the reports from the insurance company that offers your policy. Instead, the reports will be made available online, and you will be notified by mail each time a report is posted and provided with a website link to access the report. Instructions for requesting paper copies will be provided by your insurance company.
If you already elected to receive shareholder reports electronically, you will not be affected by this change and you need not take any action. At any time, you may elect to receive reports and other communications from the insurance company electronically by following the instructions provided by the insurance company.
You may elect to receive all future shareholder reports in paper form free of charge. You can inform the insurance company that you wish to receive paper copies of reports by following the instructions provided by the insurance company. Your election to receive reports in paper form will apply to all portfolio companies available under your contract.
| | | | | | | | |
| | | | | |
| Not FDIC/NCUA Insured | | Not a Deposit | | May Lose Value | | No Bank Guarantee | | Not Insured by Any Government Agency |

This page intentionally left blank
Message from the President
Most equity and fixed-income markets in the United States and around the world advanced in the face of conflicting political and macroeconomic forces during thesix-month period ended June 30, 2019.
The reporting period began on the heels of tumultuous December 2018, during which equities and equity-sensitive bonds spiked sharply lower on concerns regarding the pace of economic growth, a U.S. government shutdown and the potential impact of trade disputes between the United States and other nations, particularly China. Markets recovered quickly in early 2019 as trade tensions eased, the government reopened and the U.S. Federal Reserve Board (Fed) adopted a more patient tone regarding the future direction of interest rates. Markets moved broadly higher from January through April, supported by encouraging economic data and generally strong corporate earnings.
During the first four months of the reporting period, the improving economic environment encouraged investors to favor areas of the market viewed as offering greater return potential along with higher risks. Among U.S. stocks, cyclical, growth-oriented sectors tended to outperform more defensive, value-oriented sectors, whilelarge-cap stocks outperformed theirsmaller-cap counterparts. Within the S&P 500® Index, the information technology sector led the market’s advance, followed by communication services, consumer discretionary and consumer staples. Industrials, utilities, financials, materials, real estate and energy produced more modest gains. While some international equity markets outperformed or underperformed the U.S. market, on average international stocks mirrored the performance of their U.S. counterparts. Fixed-income securities gained ground as well, albeit along a more gradual trajectory. Among U.S. fixed-income instruments, corporate issues generally outperformed government bonds, with lower credit quality, higher yielding securities leading the sector’s advance. Long-term U.S. Treasury bond yields proved particularly weak, with
10-year yields dipping at times below3-month yields, reflecting investors’ continued concerns about domestic economic growth.
May 2019 saw a return of uncertainty and volatility. Trade discussions between the United States and China faltered, driving global equity prices lower. Government bond prices rose as investors sought safe havens. June brought yet anotherU-turn as equity prices climbed again after comments from the Fed raised hopes of an interest rate cut in response to weak economic data. Stock and bond prices rose, with U.S. equity markets ending the reporting period in record territory.
We are pleased to see renewed signs of strength in broad areas of the financial market. At the same time, we remained sharply focused on providing you, as a MainStay VP investor, with the experienced and disciplined fund management that we believe underpins an effective, long-term investment strategy. Whatever tomorrow’s investment environment brings, you can rely on our portfolio managers to pursue the objectives of their individual Portfolios as outlined in the prospectus with the energy and dedication you have come to expect.
The report that follows contains additional information on the market events, investment decisions and specific securities that shaped your VP Portfolio’s performance during the six months ended June 30, 2019. We encourage you to read the report carefully and use it to evaluate your Portfolio’s performance in light of your long-range financial plan.
Sincerely,

Kirk C. Lehneis
President
The opinions expressed are as of the date of this report and are subject to change. There is no guarantee that any forecast made will come to pass. This material does not constitute investment advice and is not intended as an endorsement of any specific investment. Past performance is no guarantee of future results.
Not part of the Semiannual Report
Table of Contents
Investors should refer to the Portfolio’s Summary Prospectus and/or Prospectus and consider the Portfolio’s investment objectives, strategies, risks, charges and expenses carefully before investing. The Summary Prospectus and/or Prospectus contain this and other information about the Portfolio. You may obtain copies of the Portfolio’s Summary Prospectus and/or the Prospectus and the Statement of Additional Information free of charge, upon request, by calling toll-free 800-598-2019, by writing to New York Life Insurance and Annuity Corporation, 51 Madison Avenue, Room 251, New York, New York 10010 or by sending an email to MainStayShareholdersServices@nylim.com. These documents are also available at nylinvestments.com/vpdocuments. Please read the Summary Prospectus and/or Prospectus carefully before investing. MainStay VP Funds Trust portfolios are separate account options which are purchased through a variable insurance contract.
Investment and Performance Comparison1(Unaudited)
Performance data quoted represents past performance. Past performance is no guarantee of future results. Because of market volatility and other factors. current performance may be lower or higher than the figures shown. Investment return and principal value will fluctuate, and as a result, when shares are redeemed, they may be worth more or less than their original cost. The performance table and graph do not reflect any deduction of sales charges, mortality and expense charges, contract charges or administrative charges. Please refer to the Performance Summary appropriate for your policy. For performance information current to the most recent month-end, please call800-598-2019 or visit www.newyorklife.com.
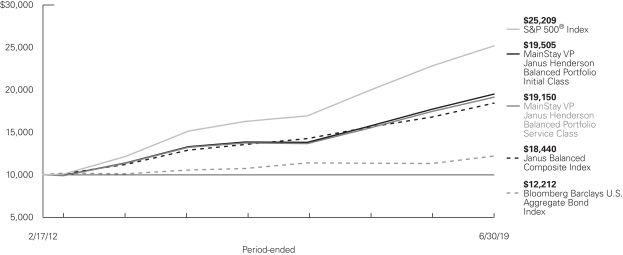
Average Annual Total Returns for the Period-Ended June 30, 2019
| | | | | | | | | | | | | | | | | | | | | | |
| Class | | Inception Date | | Six Months | | | One Year | | | Five Years | | | Since Inception | | | Gross
Expense
Ratio2 | |
| | | | | | |
| Initial Class Shares | | 2/17/2012 | | | 12.99 | % | | | 10.02 | % | | | 7.93 | % | | | 9.49 | % | | | 0.58 | % |
| Service Class Shares | | 2/17/2012 | | | 12.85 | | | | 9.74 | | | | 7.66 | | | | 9.22 | | | | 0.83 | |
| | | | | | | | | | | | | | | | |
| Benchmark Performance | | Six Months | | | One Year | | | Five
Years | | | Since Inception | |
| | | | |
S&P 500® Index3 | | | 18.54 | % | | | 10.42 | % | | | 10.71 | % | | | 13.38 | % |
Bloomberg Barclays U.S. Aggregate Bond Index4 | | | 6.11 | | | | 7.87 | | | | 2.95 | | | | 2.75 | |
Janus Balanced Composite Index5 | | | 13.01 | | | | 9.75 | | | | 7.36 | | | | 8.66 | |
Morningstar Allocation—50% to 70% Equity Category Average6 | | | 12.21 | | | | 5.73 | | | | 5.04 | | | | 6.90 | |
| 1. | Performance figures may reflect certain fee waivers and/or expense limitations, without which total returns may have been different. For information on current fee waivers and/or expense limitations (if any), please refer to the Notes to Financial Statements. |
| 2. | The gross expense ratios presented reflect the Portfolio’s “Total Annual Portfolio Operating Expenses” from the most recent Prospectus, as supplemented, and may differ from other expense ratios disclosed in this report. |
| 3. | The S&P 500® Index is the Portfolio’s primary broad-based securities market index for comparison purposes. “S&P 500®” Index is a trademark of The McGraw-Hill Companies, Inc. The S&P 500® Index is widely regarded as the standard index for measuringlarge-cap U.S. stock market performance. Results assume reinvestment of all dividends and capital gains. An investment cannot be made directly in an index. |
| 4. | The Portfolio has selected the Bloomberg Barclays U.S. Aggregate Bond Index as a secondary benchmark. The Bloomberg Barclays U.S. Aggregate Bond Index is a broad-based benchmark that measures performance of the investment-grade, U.S. dollar-denominated, fixed-rate taxable bond market, |
| | including Treasurys, government-related and corporate securities,mortgage-backed securities (agency fixed-rate and hybrid adjustable-rate mortgage pass-throughs), asset-backed securities and commercial mortgage-backed securities. Results assume reinvestment of all dividends and capital gains. An investment cannot be made directly in an index. |
| 5. | The Portfolio has selected the Janus Balanced Composite Index as an additional benchmark. The Janus Balanced Composite Index consists of the S&P 500® Index (55% weighted) and the Bloomberg Barclays U.S. Aggregate Bond Index (45% weighted). Results assume reinvestment of all dividends and capital gains. An investment cannot be made directly in an index. |
| 6. | The Morningstar Allocation—50% to 70% Equity Category Average is representative of funds that seek to provide both income and capital appreciation by investing in multiple asset classes, including stocks, bonds, and cash. These funds are dominated by domestic holdings and have equity exposures between 50% and 70%. Results are based on average total returns of similar funds with all dividends and capital gain distributions reinvested. |
Cost in Dollars of a $1,000 Investment in MainStay VP Janus Henderson Balanced Portfolio (Unaudited)
The example below is intended to describe the fees and expenses borne by shareholders during the six-month period from January 1, 2019, to June 30, 2019, and the impact of those costs on your investment.
Example
As a shareholder of the Portfolio you incur two types of costs: (1) transaction costs, including exchange fees and sales charges (loads) on purchases (as applicable), and (2) ongoing costs, including management fees, distribution and/or service (12b-1) fees, and other Portfolio expenses (as applicable). This example is intended to help you understand your ongoing costs (in dollars) of investing in the Portfolio and to compare these costs with the ongoing costs of investing in other mutual funds. The example is based on an investment of $1,000 made at the beginning of the six-month period and held for the entire period from January 1, 2019, to June 30, 2019. Shares are only sold in connection with variable life and annuity contracts and the example does not reflect any contract level or transactional fees or expenses. If these costs had been included, your costs would have been higher.
This example illustrates your Portfolio’s ongoing costs in two ways:
Actual Expenses
The second and third data columns in the table below provide information about actual account values and actual expenses. You may use the information in these columns, together with the amount you invested, to estimate the expenses that you paid during the six months ended June 30, 2019. Simply divide your account value by $1,000
(for example, an $8,600 account value divided by $1,000 = 8.6), then multiply the result by the number under the heading entitled “Expenses Paid During Period” to estimate the expenses you paid on your account during this period.
Hypothetical Example for Comparison Purposes
The fourth and fifth data columns in the table below provide information about hypothetical account values and hypothetical expenses based on the Portfolio’s actual expense ratio and an assumed rate of return of 5% per year before expenses, which is not the Portfolio’s actual return. The hypothetical account values and expenses may not be used to estimate the actual ending account balances or expenses you paid for thesix-month period shown. You may use this information to compare the ongoing costs of investing in the Portfolio with the ongoing costs of investing in other mutual funds. To do so, compare this 5% hypothetical example with the 5% hypothetical examples that appear in the shareholder reports of the other mutual funds.
Please note that the expenses shown in the table are meant to highlight your ongoing costs only and do not reflect any transactional costs, such as exchange fees or sales charges (loads). Therefore, the fourth and fifth data columns of the table are useful in comparing ongoing costs only and will not help you determine the relative total costs of owning different funds. In addition, if these transactional costs were included, your costs would have been higher.
| | | | | | | | | | | | | | | | | | | | | | |
| | | | | | | | | | | | | | | | | | |
| Share Class | | Beginning
Account
Value
1/1/19 | | | Ending Account
Value (Based
on Actual
Returns and
Expenses)
6/30/19 | | | Expenses
Paid
During
Period1 | | | Ending Account
Value (Based on
Hypothetical 5%
Annualized
Return and
Actual Expenses)
6/30/19 | | | Expenses
Paid
During
Period1 | | | Net Expense
Ratio
During
Period2 |
| | | | | | |
| Initial Class Shares | | $ | 1,000.00 | | | $ | 1,129.90 | | | $ | 3.06 | | | $ | 1,021.92 | | | $ | 2.91 | | | 0.58% |
| | | | | | |
| Service Class Shares | | $ | 1,000.00 | | | $ | 1,128.50 | | | $ | 4.38 | | | $ | 1,020.68 | | | $ | 4.16 | | | 0.83% |
| 1. | Expenses are equal to the Portfolio’s annualized expense ratio of each class multiplied by the average account value over the period, divided by 365 and multiplied by 181 (to reflect the six-month period). The table above represents the actual expenses incurred during the six-month period. In addition to the fees and expenses which the Portfolio bears directly, it also indirectly bears a pro rata share of the fees and expenses of the underlying funds in which it invests. Such indirect expenses are not included in the above-reported expense figures. |
| 2. | Expenses are equal to the Portfolio’s annualized expense ratio to reflect the six-month period. |
| | |
| 6 | | MainStay VP Janus Henderson Balanced Portfolio |
Portfolio Composition as of June 30, 2019(Unaudited)
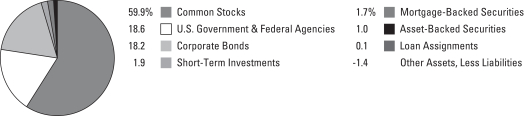
See Portfolio of Investments beginning on page 12 for specific holdings within these categories. The Portfolio’s holdings are subject to change.
Top Ten Holdings or Issuers Held as of June 30, 2019(excludingshort-term investments) (Unaudited)
| 1. | Federal National Mortgage Association (Mortgage Pass-Through Securities), 3.00%–6.00%, due 2/1/37–2/1/57 |
| 2. | United States Treasury Notes, 2.00%–3.125%, due 4/30/20–5/15/29 |
| 3. | Federal Home Loan Mortgage Corporation (Mortgage Pass-Through Securities), 3.00%–6.00%, due 5/1/38–1/1/49 |
| 5. | United States Treasury Bonds, 2.25%–3.375%, due 8/15/46–5/15/49 |
| 8. | Alphabet, Inc., Class C |
Portfolio Management Discussion and Analysis(Unaudited)
Answers to the questions reflect the views of portfolio managers Jeremiah Buckley, CFA, E. Marc Pinto, CFA, Mayur Saigal and Darrell Watters of Janus Capital Management LLC (“Janus Capital”), the Portfolio’s Subadvisor.
How did MainStay VP Janus Henderson Balanced Portfolio perform relative to its benchmarks and peers during the six months ended June 30, 2019?
For the six months ended June 30, 2019, MainStay VP Janus Henderson Balanced Portfolio returned 12.99% for Initial Class shares and 12.85% for Service Class shares. Over the same period, both share classes underperformed the 18.54% return of the S&P 500® Index, which is the Portfolio’s primary benchmark, and outperformed the 6.11% return of the Bloomberg Barclays U.S. Aggregate Bond Index, which is a secondary benchmark of the Portfolio. For the six months ended June 30, 2019, both share classes underperformed the 13.01% return of the Janus Balanced Composite Index, which is an additional benchmark of the Portfolio, and outperformed the 12.21% return of the Morningstar Allocation—50% to 70% Equity Category Average.1
What factors affected the Portfolio’s relative performance during the reporting period?
Equities outperformed fixed-income securities during the reporting period. The equity portion of the Portfolio modestly underperformed its benchmark, the S&P 500® Index. Security selection in the health care, industrials and consumer staples sectors detracted from relative results. Security selection in the financials and information technology sectors aided relative results. Positioning in the energy sector also contributed positively to relative performance. (Contributions take weightings and total returns into account.)
The security selection issues mentioned above also undermined the Portfolio performance relative to the Janus Balanced Composite Index, which is a blended benchmark of the S&P 500® Index (55%) and the Bloomberg Barclays U.S. Aggregate Bond Index (45%). However, the Portfolio’s overweight exposure to equity securities compared to the Janus Balanced Composite Index contributed positively to relative performance. During the reporting period, 59% of the equity portion of the Portfolio was invested in stocks on average (based onmonth-end data), and the equity weighting as of June 30, 2019 stood at approximately 60%. The Portfolio’s equity allocation may vary based on market conditions. The Portfolio’s equity allocation during the reporting period reflected our belief that equities offered greater risk-adjusted opportunities than fixed-income securities throughout the reporting period.
The fixed-income portion of the Portfolio outperformed its benchmark, the Bloomberg Barclays U.S. Aggregate Bond Index. The Portfolio’s Treasury positioning was a strong contributor to relative results as a bias to long-dated Treasury bonds performed well during the second half of the reporting period. As
spreads2 tightened, an allocation to investment-grade corporate credit and anout-of-index allocation to high-yield bonds further benefited relative performance. A small balance in cash and exposure to floating-rate securities, including commercial mortgage obligations and asset-backed securities, detracted from the Portfolio’s relative performance.
During the reporting period, which sectors were the strongest positive contributors to relative performance in the equity portion of Portfolio and which sectors were particularly weak?
In the equity portion of the Portfolio, strong stock selection and overweight positioning made the information technology sector the top contributor to the Portfolio’s performance relative to the S&P 500® Index. Stock selection made financials the second-strongest contributing sector. Stock selection and underweight exposure to energy made it the third-strongest contributing sector.
Stock selection detracted from performance in the health care sector, making it the weakest contributor to the relative returns of the equity portion of the Portfolio. Stock selection and overweight exposure to the consumer staples sector made it the second weakest contributor. The industrials sector also detracted from relative performance, largely because of stock selection.
During the reporting period, which individual stocks made the strongest positive contributions to the absolute performance of the equity portion of the Portfolio and which individual stocks detracted the most?
In the equity portion of the Portfolio, multinational technology company Microsoft was the strongest positive contributor to absolute performance. The company’s Azure cloud platform and subscription-based Office 365 suite continued to grow, and the demand outlook for these products remained robust.
Multinational financial services corporation Mastercard was another strong positive contributor to the absolute performance of the equity portion of the Portfolio. Mastercard grew faster than its competition and benefited from smart acquisitions and its fixed-cost business model, which resulted in high incremental margins. It also benefited along with other payments companies as credit cards and electronic payments grew in popularity among consumers and businesses globally.
Membership-only warehouse club Costco also provided a strong positive contribution to the absolute performance of the equity portion of the Portfolio. Costco continued to grow its grocery business and expand its organics line. In our opinion, the
| 1. | See page 5 for more information on benchmark and peer group returns. |
| 2. | The terms “spread” and “yield spread” may refer to the difference in yield between a security or type of security and comparable U.S. Treasury issues. The terms may also refer to the difference in yield between two specific securities or types of securities at a given time. |
| | |
| 8 | | MainStay VP Janus Henderson Balanced Portfolio |
retailer is well positioned from a competitive standpoint to take market share.
Biopharmaceuticals company AbbVie was the weakest contributor to absolute performance of the equity portion of the Portfolio during the reporting period, and its stock produced negative returns. Early in the reporting period, the company reported decliningnon-U.S. sales for its blockbuster rheumatoid arthritis drug, Humira, which now faces biosimilar competition in Europe. Further weighing on the name were uncertainties pertaining to changes to the management team and concern about whether the company’s pipeline could help replace some of the lost Humira sales. In the latter half of the reporting period, political rhetoric around pharmaceutical drug prices and Democratic candidate proposals of health care for all pressured health care names across the board. We trimmed the Portfolio’s position in AbbVie during the reporting period, and we arere-evaluating the Portfolio’s overall health care exposure amid the sector’s recent uncertainties.
Supermarket chain Kroger was another weak contributor to absolute performance during the reporting period, and its stock generated negative returns. The company’s three-year “Restock Kroger” plan, designed to improve shareholder value, got off to a slower-than-expected start. Doubts about the eventual costs of Kroger’s investments in its omnichannel shopping initiatives andin-store grocery pickup also raised concerns over the company’s ability to meet its operating targets and return value to shareholders. Given these factors, along with heightened competition from Amazon and Walmart in the grocer arena, we trimmed the Portfolio’s exposure to Kroger during the reporting period and continue to review our position.
Pharmaceutical company Bristol-Myers Squibb was also a weak contributor to absolute performance, and its stock generated negative returns. During the reporting period, the company announced it would acquire Celgene for $74 billion. Investors became concerned about the premium Bristol-Myers Squibb was paying for Celgene given the product-related challenges the latter faced. We added to the Portfolio’s position in the belief that the deal should help expand Bristol-Myers’ pipeline and create cost synergies.
Did the equity portion of the Portfolio make any significant purchases or sales during the reporting period?
The equity portion of the Portfolio initiated a position in media and entertainment company The Walt Disney Company during the reporting period. The company launched Disney+, adirect-to-consumer app and streaming service, which was unveiled with stronger content at a more attractive price point than investors were anticipating. Disney also continued to benefit from reinvestment into its parks, both in and outside the United States, and Disney Studios announced a strong movie
lineup for the coming year. We appreciate the company’s solid core business and, looking ahead, believe Disney+ may present a sizable revenue opportunity.
During the reporting period, the equity portion of the Portfolio also initiated a position in online retailer Amazon.com. In addition to its diverse product offering, Amazon offers personalized shopping services,web-based credit card payment and direct shipping to customers. We believe the company’s competitive advantages of alow-overhead cost structure—allowing for an aggressive pricing structure and faster shipping—should continue to cause consumers to shift an increasing amount of their general merchandise spending toward Amazon. Given that more than 90% of retail sales are still sold offline, we believe Amazon has significant opportunities ahead, particularly as they expand into new business lines and geographies.
During the reporting period, the equity portion of the Portfolio sold its position in pharmaceutical company Allergan. The company had struggled to divest itslow-return assets, negatively affecting management’s credibility. Political rhetoric around pharmaceutical drug prices and Democratic candidate proposals of health care for all further pressured the stock, leading us to exit the position.
The equity portion of the Portfolio also sold its position in energy exploration and production company Anadarko. The stock rose sharply when Chevron bid for the company early in the reporting period, and again when Occidental Petroleum started a bidding war. We exited the position after realizing these gains.
How did sector weightings change in the equity portion of the Portfolio during the reporting period?
During the reporting period, the equity portion of the Portfolio increased its exposure to real estate, information technology and communication services. Over the same period, the equity portion of the Portfolio decreased its exposure to health care, consumer staples and materials.
How was the equity portion of the Portfolio positioned at the end of the reporting period?
As of June 30, 2019, the most substantially overweight sector relative to the S&P 500® Index in the equity portion of the Portfolio was industrials, followed by information technology. As of the same date, the most substantially underweight sector relative to the Index in the equity portion of the Portfolio was energy, followed by health care. As of June 30, 2019, the equity portion of the Portfolio did not hold any utilities stocks.
What was the duration3 strategy of the fixed-income portion of the Portfolio during the reporting period?
As of June 30, 2019, the duration of the fixed-income portion of the Portfolio was 6.38 years, as compared with 5.69 years for the Bloomberg Barclays U.S. Aggregate Bond Index. We increased duration during the second half of the reporting period, largely by shifting into longer-dated Treasury securities. This helped to balance the risk from the increases made to the Portfolio’s corporate credit allocation. We expect lower Treasury yields and a relatively flat yield curve4 as U.S. yields remain attractive versus their global peers.
Overall, duration positioning was a modest positive contributor to the performance of the fixed-income portion of the Portfolio relative to the Bloomberg Barclays U.S. Aggregate Bond Index. The Portfolio’s increased duration was largely driven by a bias to longer-dated Treasury bonds, which helped the fixed-income portion of the Portfolio to outperform the Index during the rally in rates.
What specific factors, risks or market forces prompted significant decisions for the fixed-income portion of the Portfolio during the reporting period?
Citing global economic uncertainties, the U.S. Federal Reserve (the “Fed”) pivoted during the reporting period to a more accommodative stance toward interest rates. The tailwind we expected from the Fed’s dovish shift and its subsequent pledge to “act as appropriate” to sustain the economic expansion led us to increase the U.S.-based corporate credit allocation of the fixed-income portion of the Portfolio. Our expectation for limited net new issuance coupled with strong demand amid investors’ search for yield also contributed to our decision to raise the Portfolio’s corporate credit allocation off a multi-year low. While we added selectively to what we believed were higher-quality business models in high-yield securities, the increase was primarily in the investment-grade sector. We trimmed the Portfolio’s Treasury exposure during the reporting period but increased longer-dated Treasury exposure to extend duration and help to balance the risk from our corporate credit allocation. We also reduced the Portfolio’s exposure to floating-rate securities, including positions in certain asset-backed securities, commercial mortgage-backed securities and bank loans, because we believed that the Fed’s next move would likely be a rate cut.
During the reporting period, which market segments made the strongest positive contributions to the performance of the fixed-income portion of the Portfolio and which market segments were particularly weak?
Relative to the Bloomberg Barclays U.S. Aggregate Bond Index, the bias maintained by the fixed-income portion of the Portfolio toward longer-dated Treasuries contributed positively to performance as rates rallied. Security selection in investment-grade corporates, the strongest-performing benchmark sector, also bolstered the relative results of the fixed-income portion of the Portfolio. Anout-of-index allocation to high-yield corporate bonds contributed additionally to relative performance during the spread-tightening environment.
A modest cash balance detracted from relative performance of the fixed-income portion of the Portfolio as“risk-on” sentiment rose during the reporting period. Allocations tofront-end and floating-rate collateralized mortgage obligations, asset-backed securities and collateralized loan obligations also detracted from relative performance, largely due to their lack of duration.
Did the fixed-income portion of the Portfolio make any significant purchases or sales during the reporting period?
The fixed-income portion of the Portfolio added materially to its holdings in the food and beverage sector. Specifically, we established positions in The Kraft Heinz Company, Anheuser-Busch, Mars, Keurig Dr Pepper and JBS USA. We maintained an overall positive view of the food and beverage sector on a combination of valuations (which we felt reasonably reflected the challenges posed from a generational shift in consumer habits), improving fundamentals (as the worst of the consolidation activity was likely behind us) and the fact that the majority of companies in the sector were looking to reduce debt levels. Further, we believe that in the event of an economic downturn, the steady cash flow of these consumer staples is not likely to be affected.
As we sought to maintain diversification within the fixed-income portion of the Portfolio, we looked for attractively valued asset-backed (ABS) securities tied to the strength of the consumer and established a position in Jack in the Box. Jack in the Box is the fifth-largest quick service restaurant player in the United States, and the fixed-income portion of the Portfolio participated in its inaugural ABS securitization, which we felt came at an attractive valuation. With the sale of the company’s Qdoba business in the rear-view mirror, Jack in the Box management claims the chain is on a strategic path to growth.
| 3. | Duration is a measure of the price sensitivity of a fixed-income investment to changes in interest rates. Duration is expressed as a number of years and is considered a more accurate sensitivity gauge than average maturity. |
| 4. | The yield curve is a line that plots the yields of various securities of similar quality—typically U.S. Treasury issues—across a range of maturities. The U.S. Treasury yield curve serves as a benchmark for other debt and is used in economic forecasting. |
| | |
| 10 | | MainStay VP Janus Henderson Balanced Portfolio |
Regarding significant sales, as mentioned earlier, the fixed-income portion of the Portfolio reduced its exposure to floating-rate bank loans, asset-backed securities and commercial mortgage-backed securities throughout the reporting period as it became apparent to us that that the end of the Fed’s rate-hiking cycle was approaching.
During the reporting period, how did sector (or industry) weightings change in the fixed-income portion of the Portfolio?
In terms of industry areas, the fixed-income portion of the Portfolio increased its exposure to banking and food and beverage during the reporting period. The fixed-income portion of the Portfolio decreased its exposure to health insurance and brokerage, asset managers and exchanges during the same period.
How was the fixed-income portion of the Portfolio positioned at the end of the reporting period?
As of June 30, 2019, the fixed-income portion of the Portfolio held underweight exposure to Treasury securities, U.S. mortgage-backed securities and commercial mortgage-backed securities relative to the Bloomberg Barclays U.S. Aggregate Bond Index. As of the same date, the fixed-income portion of the Portfolio held overweight exposure to corporate credit and asset-backed securities. As of June 30, 2019, the fixed-income portion of the Portfolio heldout-of-index positions in high-yield corporate credit, collateralized mortgage obligations and cash. The fixed-income portion of the Portfolio ended the period with no exposure to government-related securities.
The opinions expressed are those of the portfolio managers as of the date of this report and are subject to change. There is no guarantee that any forecasts will come to pass. This material does not constitute investment advice and is not intended as an endorsement of any specific investment.
Not all MainStay VP Portfolios and/or share classes are available under all policies.
Portfolio of InvestmentsJune 30, 2019 (Unaudited)
| | | | | | | | |
| | | Principal
Amount | | | Value | |
Long-Term Bonds 39.6%† Asset-Backed Securities 1.0% | |
Automobile Asset-Backed Securities 0.5% | |
Credit Acceptance Auto Loan
Series 2018-2A, Class B
3.94%, due 7/15/27 (a) | | $ | 387,000 | | | $ | 398,495 | |
Drive Auto Receivables Trust | | | | | | | | |
Series 2019-1, Class D
4.09%, due 6/15/26 | | | 175,000 | | | | 181,107 | |
Series 2017-AA, Class D
4.16%, due 5/15/24 (a) | | | 415,000 | | | | 422,130 | |
Series 2017-1, Class E
5.17%, due 9/16/24 | | | 1,590,000 | | | | 1,652,207 | |
Series 2017-2, Class E
5.27%, due 11/15/24 | | | 1,400,000 | | | | 1,455,273 | |
OneMain Direct Auto Receivables Trust (a) | | | | | | | | |
Series 2018-1A, Class C
3.85%, due 10/14/25 | | | 181,000 | | | | 185,117 | |
Series 2018-1A, Class D
4.40%, due 1/14/28 | | | 180,000 | | | | 185,546 | |
Santander Drive Auto Receivables Trust
Series 2016-3, Class E
4.29%, due 2/15/24 | | | 1,868,000 | | | | 1,903,268 | |
| | | | | | | | |
| | | | | | | 6,383,143 | |
| | | | | | | | |
Other Asset-Backed Securities 0.5% | |
Applebee’s Funding LLC / IHOP
Funding LLC (a) | | | | | | | | |
Series 2019-1A, Class A2I
4.194%, due 6/7/49 | | | 798,000 | | | | 806,399 | |
Series 2019-1A, Class A2II
4.723%, due 6/7/49 | | | 358,000 | | | | 362,851 | |
DB Master Finance LLC (a) | | | | | | | | |
Series 2019-1A, Class A2I
3.787%, due 5/20/49 | | | 468,000 | | | | 477,978 | |
Series 2019-1A, Class A2II
4.021%, due 5/20/49 | | | 189,000 | | | | 194,538 | |
Series 2019-1A, Class A23
4.352%, due 5/20/49 | | | 374,000 | | | | 386,649 | |
Domino’s Pizza Master Issuer LLC (a) | | | | | | | | |
Series 2017-1A, Class A2II
3.082%, due 7/25/47 | | | 159,165 | | | | 159,405 | |
Series 2018-1A, Class A2I
4.116%, due 7/25/48 | | | 216,810 | | | | 223,273 | |
Jack In The Box Funding LLC | | | | | | | | |
3.982%, due 8/25/49 | | | 991,000 | | | | 909,436 | |
4.476%, due 8/25/49 | | | 991,000 | | | | 885,822 | |
4.97%, due 8/25/49 | | | 991,000 | | | | 883,113 | |
| | | | | | | | |
| | | Principal
Amount | | | Value | |
Other Asset-Backed Securities (continued) | |
Wendy’s Funding LLC
Series 2018-1A, Class A2I
3.573%, due 3/15/48 (a) | | $ | 299,440 | | | $ | 301,159 | |
| | | | | | | | |
| | | | | | | 5,590,623 | |
| | | | | | | | |
Total Asset-Backed Securities
(Cost $12,116,930) | | | | | | | 11,973,766 | |
| | | | | | | | |
|
| Corporate Bonds 18.2% | |
Aerospace & Defense 0.2% | |
Boeing Co. | | | | | | | | |
2.25%, due 6/15/26 | | | 144,000 | | | | 140,223 | |
3.20%, due 3/1/29 | | | 1,030,000 | | | | 1,066,470 | |
3.25%, due 3/1/28 | | | 178,000 | | | | 184,653 | |
3.60%, due 5/1/34 | | | 1,195,000 | | | | 1,246,028 | |
| | | | | | | | |
| | | | | | | 2,637,374 | |
| | | | | | | | |
Auto Manufacturers 0.5% | |
Ford Motor Credit Co. LLC | | | | | | | | |
3.815%, due 11/2/27 (b) | | | 1,066,000 | | | | 1,019,147 | |
4.389%, due 1/8/26 | | | 1,500,000 | | | | 1,507,811 | |
5.113%, due 5/3/29 | | | 1,243,000 | | | | 1,269,424 | |
General Motors Co.
5.00%, due 10/1/28 | | | 949,000 | | | | 996,667 | |
General Motors Financial Co., Inc. | | | | | | | | |
4.30%, due 7/13/25 | | | 223,000 | | | | 229,856 | |
4.35%, due 4/9/25 | | | 726,000 | | | | 748,931 | |
4.35%, due 1/17/27 | | | 437,000 | | | | 445,142 | |
| | | | | | | | |
| | | | | | | 6,216,978 | |
| | | | | | | | |
Banks 2.6% | |
Bank of America Corp. (c) | | | | | | | | |
3.705%, due 4/24/28 | | | 3,883,000 | | | | 4,079,876 | |
3.97%, due 3/5/29 | | | 949,000 | | | | 1,014,301 | |
3.974%, due 2/7/30 | | | 1,292,000 | | | | 1,384,897 | |
Bank of Montreal
3.30%, due 2/5/24 | | | 1,275,000 | | | | 1,322,475 | |
Citigroup, Inc.
3.887%, due 1/10/28 (c) | | | 4,770,000 | | | | 5,046,503 | |
Citizens Financial Group, Inc. | | | | | | | | |
3.75%, due 7/1/24 | | | 264,000 | | | | 268,223 | |
4.30%, due 12/3/25 | | | 684,000 | | | | 723,699 | |
4.35%, due 8/1/25 | | | 203,000 | | | | 213,091 | |
First Republic Bank
4.625%, due 2/13/47 | | | 594,000 | | | | 639,433 | |
Goldman Sachs Capital I
6.345%, due 2/15/34 | | | 1,744,000 | | | | 2,192,260 | |
JPMorgan Chase & Co. (c) | | | | | | | | |
3.702%, due 5/6/30 | | | 1,224,000 | | | | 1,290,549 | |
3.782%, due 2/1/28 | | | 1,422,000 | | | | 1,507,477 | |
3.96%, due 1/29/27 | | | 2,044,000 | | | | 2,186,462 | |
4.452%, due 12/5/29 | | | 3,823,000 | | | | 4,262,789 | |
| | | | |
| 12 | | MainStay VP Janus Henderson Balanced Portfolio | | The notes to the financial statements are an integral part of,
and should be read in conjunction with, the financial statements. |
| | | | | | | | |
| | | Principal
Amount | | | Value | |
| Corporate Bonds (continued) | |
Banks (continued) | |
Morgan Stanley | | | | | | | | |
3.95%, due 4/23/27 | | $ | 1,909,000 | | | $ | 1,996,764 | |
4.35%, due 9/8/26 | | | 1,128,000 | | | | 1,209,584 | |
4.431%, due 1/23/30 (c) | | | 2,171,000 | | | | 2,401,690 | |
| | | | | | | | |
| | | | | | | 31,740,073 | |
| | | | | | | | |
Beverages 0.4% | |
Anheuser-Busch InBev Worldwide, Inc. | | | | | | | | |
4.15%, due 1/23/25 | | | 2,345,000 | | | | 2,540,159 | |
4.75%, due 1/23/29 | | | 1,116,000 | | | | 1,266,890 | |
Keurig Dr Pepper, Inc. | | | | | | | | |
4.597%, due 5/25/28 | | | 1,145,000 | | | | 1,253,542 | |
5.085%, due 5/25/48 | | | 459,000 | | | | 511,064 | |
| | | | | | | | |
| | | | | | | 5,571,655 | |
| | | | | | | | |
Building Materials 0.0%‡ | |
Masonite International Corp.
5.625%, due 3/15/23 (a) | | | 271,000 | | | | 279,130 | |
| | | | | | | | |
|
Chemicals 0.2% | |
CF Industries, Inc.
4.50%, due 12/1/26 (a) | | | 472,000 | | | | 490,770 | |
Nutrien, Ltd. | | | | | | | | |
4.20%, due 4/1/29 | | | 226,000 | | | | 244,380 | |
5.00%, due 4/1/49 | | | 274,000 | | | | 310,350 | |
Valvoline, Inc. | | | | | | | | |
4.375%, due 8/15/25 | | | 835,000 | | | | 832,913 | |
5.50%, due 7/15/24 | | | 371,000 | | | | 382,130 | |
| | | | | | | | |
| | | | | | | 2,260,543 | |
| | | | | | | | |
Commercial Services 0.6% | |
IHS Markit, Ltd. (a) | | | | | | | | |
4.75%, due 2/15/25 | | | 924,000 | | | | 991,082 | |
5.00%, due 11/1/22 | | | 119,000 | | | | 126,081 | |
Service Corp. International
5.125%, due 6/1/29 | | | 1,226,000 | | | | 1,290,365 | |
Total System Services, Inc.
4.80%, due 4/1/26 | | | 902,000 | | | | 989,277 | |
UBM PLC
5.75%, due 11/3/20 (a) | | | 1,145,000 | | | | 1,185,851 | |
Verisk Analytics, Inc. | | | | | | | | |
4.125%, due 9/12/22 | | | 204,000 | | | | 214,294 | |
5.50%, due 6/15/45 | | | 526,000 | | | | 617,082 | |
5.80%, due 5/1/21 | | | 1,527,000 | | | | 1,619,548 | |
| | | | | | | | |
| | | | | | | 7,033,580 | |
| | | | | | | | |
Communications Equipment 0.1% | |
CommScope, Inc
5.50%, due 3/1/24 (a) | | | 813,000 | | | | 834,341 | |
| | | | | | | | |
| | | | | | | | |
| | | Principal
Amount | | | Value | |
Computers 0.3% | |
Dell International LLC
5.30%, due 10/1/29 (a) | | $ | 615,000 | | | $ | 648,087 | |
Western Digital Corp.
4.75%, due 2/15/26 | | | 3,180,000 | | | | 3,119,739 | |
| | | | | | | | |
| | | | | | | 3,767,826 | |
| | | | | | | | |
Diversified Financial Services 0.6% | |
CBOE Global Markets, Inc.
3.65%, due 1/12/27 | | | 1,030,000 | | | | 1,081,297 | |
E*TRADE Financial Corp. | | | | | | | | |
3.80%, due 8/24/27 | | | 892,000 | | | | 898,167 | |
4.50%, due 6/20/28 | | | 322,000 | | | | 338,591 | |
GE Capital International Funding Co.
4.418%, due 11/15/35 | | | 1,296,000 | | | | 1,282,725 | |
Raymond James Financial, Inc. | | | | | | | | |
4.95%, due 7/15/46 | | | 985,000 | | | | 1,111,167 | |
5.625%, due 4/1/24 | | | 866,000 | | | | 979,797 | |
Synchrony Financial | | | | | | | | |
3.95%, due 12/1/27 | | | 1,044,000 | | | | 1,042,796 | |
4.375%, due 3/19/24 | | | 250,000 | | | | 261,785 | |
5.15%, due 3/19/29 | | | 971,000 | | | | 1,046,320 | |
| | | | | | | | |
| | | | | | | 8,042,645 | |
| | | | | | | | |
Electric 1.2% | |
NRG Energy, Inc. | | | | | | | | |
3.75%, due 6/15/24 (a) | | | 1,258,000 | | | | 1,292,416 | |
4.45%, due 6/15/29 (a) | | | 1,211,000 | | | | 1,260,026 | |
5.25%, due 6/15/29 (a) | | | 488,000 | | | | 520,940 | |
5.75%, due 1/15/28 | | | 247,000 | | | | 264,908 | |
6.625%, due 1/15/27 | | | 1,343,000 | | | | 1,458,834 | |
7.25%, due 5/15/26 | | | 1,111,000 | | | | 1,223,489 | |
Oncor Electric Delivery Co. LLC (a) | | | | | | | | |
2.75%, due 6/1/24 | | | 994,000 | | | | 1,012,579 | |
3.70%, due 11/15/28 | | | 797,000 | | | | 858,291 | |
3.80%, due 6/1/49 | | | 1,220,000 | | | | 1,287,616 | |
PPL WEM, Ltd. / Western Power Distribution, Ltd.
5.375%, due 5/1/21 (a) | | | 756,000 | | | | 782,566 | |
Southern Co.
2.95%, due 7/1/23 | | | 579,000 | | | | 587,671 | |
Vistra Operations Co. LLC (a) | | | | | | | | |
5.00%, due 7/31/27 | | | 1,631,000 | | | | 1,690,124 | |
5.50%, due 9/1/26 | | | 464,000 | | | | 490,100 | |
5.625%, due 2/15/27 | | | 2,506,000 | | | | 2,653,228 | |
| | | | | | | | |
| | | | | | | 15,382,788 | |
| | | | | | | | |
Electronics 0.4% | |
Trimble, Inc. | | | | | | | | |
4.75%, due 12/1/24 | | | 1,896,000 | | | | 1,993,453 | |
4.90%, due 6/15/28 | | | 2,222,000 | | | | 2,380,662 | |
| | | | | | | | |
| | | | | | | 4,374,115 | |
| | | | | | | | |
| | | | | | |
The notes to the financial statements are an integral part of,
and should be read in conjunction with, the financial statements. | | | | | 13 | |
Portfolio of InvestmentsJune 30, 2019 (Unaudited) (continued)
| | | | | | | | |
| | | Principal
Amount | | | Value | |
| Corporate Bonds (continued) | |
Entertainment 0.0%‡ | |
GLP Capital, L.P. / GLP Financing II, Inc.
5.375%, due 4/15/26 | | $ | 420,000 | | | $ | 454,209 | |
| | | | | | | | |
|
Food 1.0% | |
Campbell Soup Co. | | | | | | | | |
3.95%, due 3/15/25 | | | 594,000 | | | | 617,907 | |
4.15%, due 3/15/28 | | | 896,000 | | | | 938,403 | |
4.80%, due 3/15/48 (b) | | | 979,000 | | | | 990,670 | |
General Mills, Inc.
4.20%, due 4/17/28 | | | 1,284,000 | | | | 1,386,229 | |
JBS USA LLC / JBS USA Finance, Inc.
5.875%, due 7/15/24 (a) | | | 287,000 | | | | 295,251 | |
JBS USA LUX S.A. / JBS Food Co. / JBS USA Finance, Inc.
6.50%, due 4/15/29 (a) | | | 225,000 | | | | 244,406 | |
JBS USA LUX S.A. / JBS USA Finance, Inc. (a) | | | | | | | | |
5.75%, due 6/15/25 | | | 516,000 | | | | 536,640 | |
6.75%, due 2/15/28 | | | 159,000 | | | | 172,714 | |
Kraft Heinz Foods Co. | | | | | | | | |
3.00%, due 6/1/26 | | | 2,139,000 | | | | 2,081,433 | |
4.00%, due 6/15/23 | | | 324,000 | | | | 339,466 | |
4.375%, due 6/1/46 | | | 906,000 | | | | 860,808 | |
4.625%, due 1/30/29 | | | 403,000 | | | | 433,630 | |
5.00%, due 6/4/42 | | | 339,000 | | | | 350,054 | |
Mars, Inc. (a) | | | | | | | | |
2.70%, due 4/1/25 | | | 468,000 | | | | 477,520 | |
3.20%, due 4/1/30 | | | 570,000 | | | | 592,267 | |
3.95%, due 4/1/49 | | | 764,000 | | | | 822,020 | |
4.20%, due 4/1/59 | | | 488,000 | | | | 530,452 | |
Sysco Corp.
2.50%, due 7/15/21 | | | 203,000 | | | | 203,877 | |
| | | | | | | | |
| | | | | | | 11,873,747 | |
| | | | | | | | |
Forest Products & Paper 0.2% | |
Georgia-Pacific LLC (a) | | | | | | | | |
3.163%, due 11/15/21 | | | 1,387,000 | | | | 1,407,036 | |
3.60%, due 3/1/25 | | | 742,000 | | | | 779,184 | |
| | | | | | | | |
| | | | | | | 2,186,220 | |
| | | | | | | | |
Gas 0.1% | |
AmeriGas Partners, L.P. / AmeriGas Finance Corp. | | | | | | | | |
5.50%, due 5/20/25 | | | 1,619,000 | | | | 1,703,997 | |
5.625%, due 5/20/24 | | | 43,000 | | | | 45,795 | |
| | | | | | | | |
| | | | | | | 1,749,792 | |
| | | | | | | | |
Health Care—Products 0.1% | |
Boston Scientific Corp. | | | | | | | | |
3.75%, due 3/1/26 | | | 560,000 | | | | 595,617 | |
4.00%, due 3/1/29 | | | 291,000 | | | | 314,798 | |
4.70%, due 3/1/49 | | | 467,000 | | | | 535,960 | |
| | | | | | | | |
| | | | | | | 1,446,375 | |
| | | | | | | | |
| | | | | | | | |
| | | Principal
Amount | | | Value | |
Health Care—Services 0.7% | |
Centene Corp. | | | | | | | | |
4.75%, due 5/15/22 | | $ | 64,000 | | | $ | 65,360 | |
5.375%, due 6/1/26 (a) | | | 1,748,000 | | | | 1,837,585 | |
6.125%, due 2/15/24 | | | 697,000 | | | | 730,107 | |
Cigna Corp. (a) | | | | | | | | |
3.40%, due 9/17/21 | | | 186,000 | | | | 189,627 | |
3.75%, due 7/15/23 | | | 758,000 | | | | 789,179 | |
HCA, Inc. | | | | | | | | |
4.125%, due 6/15/29 | | | 2,868,000 | | | | 2,948,247 | |
4.50%, due 2/15/27 | | | 1,183,000 | | | | 1,262,097 | |
5.125%, due 6/15/39 | | | 509,000 | | | | 529,217 | |
5.25%, due 6/15/49 | | | 741,000 | | | | 770,425 | |
| | | | | | | | |
| | | | | | | 9,121,844 | |
| | | | | | | | |
Home Builders 0.1% | |
MDC Holdings, Inc.
5.50%, due 1/15/24 | | | 708,000 | | | | 754,020 | |
| | | | | | | | |
|
Housewares 0.2% | |
Newell Brands, Inc. | | | | | | | | |
4.20%, due 4/1/26 | | | 1,301,000 | | | | 1,292,975 | |
5.375%, due 4/1/36 | | | 1,486,000 | | | | 1,467,761 | |
| | | | | | | | |
| | | | | | | 2,760,736 | |
| | | | | | | | |
Insurance 0.1% | |
Brown & Brown, Inc.
4.50%, due 3/15/29 | | | 574,000 | | | | 602,976 | |
| | | | | | | | |
|
Iron & Steel 0.2% | |
Allegheny Technologies, Inc.
5.95%, due 1/15/21 | | | 912,000 | | | | 937,080 | |
Reliance Steel & Aluminum Co.
4.50%, due 4/15/23 | | | 719,000 | | | | 754,927 | |
Steel Dynamics, Inc.
5.50%, due 10/1/24 | | | 1,166,000 | | | | 1,208,267 | |
| | | | | | | | |
| | | | | | | 2,900,274 | |
| | | | | | | | |
Lodging 0.1% | |
MGM Resorts International | | | | | | | | |
6.625%, due 12/15/21 | | | 507,000 | | | | 547,560 | |
7.75%, due 3/15/22 | | | 182,000 | | | | 202,930 | |
| | | | | | | | |
| | | | | | | 750,490 | |
| | | | | | | | |
Machinery—Diversified 0.0%‡ | |
Wabtec Corp.
3.45%, due 11/15/26 | | | 273,000 | | | | 266,766 | |
| | | | | | | | |
|
Media 1.1% | |
Charter Communications Operating LLC / Charter Communications Operating Capital | | | | | | | | |
4.908%, due 7/23/25 | | | 819,000 | | | | 889,142 | |
5.05%, due 3/30/29 | | | 4,155,000 | | | | 4,589,788 | |
| | | | |
| 14 | | MainStay VP Janus Henderson Balanced Portfolio | | The notes to the financial statements are an integral part of,
and should be read in conjunction with, the financial statements. |
| | | | | | | | |
| | | Principal
Amount | | | Value | |
| Corporate Bonds (continued) | |
Media (continued) | |
Comcast Corp. | | | | | | | | |
3.15%, due 3/1/26 | | $ | 584,000 | | | $ | 604,430 | |
4.15%, due 10/15/28 | | | 660,000 | | | | 727,419 | |
4.25%, due 10/15/30 | | | 749,000 | | | | 835,897 | |
4.60%, due 10/15/38 | | | 609,000 | | | | 697,334 | |
4.95%, due 10/15/58 | | | 627,000 | | | | 765,341 | |
CSC Holdings LLC
6.50%, due 2/1/29 (a) | | | 1,509,000 | | | | 1,646,696 | |
Fox Corp.
4.03%, due 1/25/24 (a) | | | 429,000 | | | | 456,305 | |
Sirius XM Radio, Inc.
5.50%, due 7/1/29 (a) | | | 977,000 | | | | 1,001,620 | |
Viacom, Inc.
5.85%, due 9/1/43 | | | 1,163,000 | | | | 1,368,742 | |
| | | | | | | | |
| | | | | | | 13,582,714 | |
| | | | | | | | |
Metal Fabricate & Hardware 0.2% | |
Novelis Corp.
5.875%, due 9/30/26 (a) | | | 2,309,000 | | | | 2,337,862 | |
| | | | | | | | |
|
Metals & Mining 0.1% | |
Hudbay Minerals, Inc.
7.25%, due 1/15/23 (a) | | | 1,248,000 | | | | 1,285,440 | |
| | | | | | | | |
|
Mining 0.3% | |
Constellium N.V.
5.75%, due 5/15/24 (a) | | | 1,162,000 | | | | 1,191,050 | |
Freeport-McMoRan, Inc. | | | | | | | | |
3.55%, due 3/1/22 | | | 1,456,000 | | | | 1,461,460 | |
3.875%, due 3/15/23 | | | 1,347,000 | | | | 1,347,000 | |
| | | | | | | | |
| | | | | | | 3,999,510 | |
| | | | | | | | |
Miscellaneous—Manufacturing 0.1% | |
General Electric Co.
5.00%, due 1/21/21 (c)(d) | | | 1,662,000 | | | | 1,602,932 | |
| | | | | | | | |
|
Oil & Gas 0.6% | |
Cenovus Energy, Inc.
4.25%, due 4/15/27 | | | 401,000 | | | | 415,385 | |
Continental Resources, Inc. | | | | | | | | |
4.50%, due 4/15/23 | | | 1,219,000 | | | | 1,280,781 | |
5.00%, due 9/15/22 | | | 1,468,000 | | | | 1,480,047 | |
Hess Corp.
4.30%, due 4/1/27 | | | 2,495,000 | | | | 2,588,012 | |
HollyFrontier Corp.
5.875%, due 4/1/26 | | | 996,000 | | | | 1,090,794 | |
| | | | | | | | |
| | | | | | | 6,855,019 | |
| | | | | | | | |
Packaging & Containers 0.3% | |
Ball Corp.
4.375%, due 12/15/20 | | | 641,000 | | | | 655,102 | |
| | | | | | | | |
| | | Principal
Amount | | | Value | |
Packaging & Containers (continued) | |
WRKCo, Inc. | | | | | | | | |
3.375%, due 9/15/27 | | $ | 80,000 | | | $ | 80,129 | |
3.75%, due 3/15/25 | | | 73,000 | | | | 75,738 | |
4.00%, due 3/15/28 | | | 270,000 | | | | 280,359 | |
4.65%, due 3/15/26 | | | 448,000 | | | | 487,302 | |
4.90%, due 3/15/29 | | | 1,885,000 | | | | 2,060,799 | |
| | | | | | | | |
| | | | | | | 3,639,429 | |
| | | | | | | | |
Pharmaceuticals 0.9% | |
Allergan Finance LLC
3.25%, due 10/1/22 | | | 721,000 | | | | 729,946 | |
Allergan Funding SCS | | | | | | | | |
3.45%, due 3/15/22 | | | 1,331,000 | | | | 1,358,971 | |
3.80%, due 3/15/25 | | | 857,000 | | | | 889,371 | |
Allergan, Inc.
2.80%, due 3/15/23 | | | 57,000 | | | | 56,843 | |
Bausch Health Cos., Inc.
7.00%, due 3/15/24 (a) | | | 923,000 | | | | 980,780 | |
Bristol-Myers Squibb Co. (a) | | | | | | | | |
3.40%, due 7/26/29 | | | 513,000 | | | | 537,081 | |
4.125%, due 6/15/39 | | | 370,000 | | | | 399,013 | |
4.25%, due 10/26/49 | | | 636,000 | | | | 703,034 | |
Elanco Animal Health, Inc. | | | | | | | | |
4.272%, due 8/28/23 | | | 450,000 | | | | 472,302 | |
4.90%, due 8/28/28 | | | 420,000 | | | | 469,062 | |
Eli Lilly & Co.
3.375%, due 3/15/29 | | | 2,426,000 | | | | 2,586,859 | |
GlaxoSmithKline Capital PLC
3.375%, due 6/1/29 | | | 1,375,000 | | | | 1,454,328 | |
Teva Pharmaceutical Finance Co. B.V.
3.65%, due 11/10/21 | | | 357,000 | | | | 343,613 | |
| | | | | | | | |
| | | | | | | 10,981,203 | |
| | | | | | | | |
Pipelines 1.0% | |
Cheniere Energy Partners, L.P.
5.625%, due 10/1/26 (a) | | | 655,000 | | | | 691,025 | |
Energy Transfer Operating, L.P. | | | | | | | | |
4.25%, due 3/15/23 | | | 600,000 | | | | 626,350 | |
4.95%, due 6/15/28 | | | 116,000 | | | | 126,825 | |
5.50%, due 6/1/27 | | | 401,000 | | | | 448,249 | |
5.875%, due 1/15/24 | | | 541,000 | | | | 602,222 | |
6.00%, due 6/15/48 | | | 1,025,000 | | | | 1,169,959 | |
6.125%, due 12/15/45 | | | 307,000 | | | | 347,835 | |
EnLink Midstream Partners, L.P.
4.15%, due 6/1/25 | | | 1,119,000 | | | | 1,096,620 | |
EQM Midstream Partners, L.P.
5.50%, due 7/15/28 | | | 1,197,000 | | | | 1,260,004 | |
Kinder Morgan Energy Partners, L.P.
5.00%, due 10/1/21 | | | 456,000 | | | | 478,159 | |
Kinder Morgan, Inc. | | | | | | | | |
4.30%, due 3/1/28 | | | 280,000 | | | | 300,108 | |
5.20%, due 3/1/48 | | | 178,000 | | | | 201,076 | |
| | | | | | |
The notes to the financial statements are an integral part of,
and should be read in conjunction with, the financial statements. | | | | | 15 | |
Portfolio of InvestmentsJune 30, 2019 (Unaudited) (continued)
| | | | | | | | |
| | | Principal
Amount | | | Value | |
| Corporate Bonds (continued) | |
Pipelines (continued) | |
5.55%, due 6/1/45 | | $ | 268,000 | | | $ | 310,110 | |
6.50%, due 9/15/20 (b) | | | 59,000 | | | | 61,758 | |
NGPL PipeCo LLC (a) | | | | | | | | |
4.375%, due 8/15/22 | | | 991,000 | | | | 1,020,730 | |
4.875%, due 8/15/27 | | | 559,000 | | | | 591,841 | |
Nustar Logistics, L.P.
5.625%, due 4/28/27 | | | 571,000 | | | | 575,283 | |
Plains All American Pipeline, L.P. / PAA Finance Corp.
4.65%, due 10/15/25 | | | 1,312,000 | | | | 1,399,287 | |
Tallgrass Energy Partners, L.P. / Tallgrass Energy Finance Corp. (a) | | | | | | | | |
4.75%, due 10/1/23 | | | 986,000 | | | | 999,577 | |
5.50%, due 9/15/24 | | | 369,000 | | | | 380,993 | |
| | | | | | | | |
| | | | | | | 12,688,011 | |
| | | | | | | | |
Real Estate 0.1% | |
Jones Lang LaSalle, Inc.
4.40%, due 11/15/22 | | | 903,000 | | | | 938,994 | |
| | | | | | | | |
|
Real Estate Investment Trusts 0.4% | |
Crown Castle International Corp. | | | | | | | | |
3.65%, due 9/1/27 | | | 548,000 | | | | 564,327 | |
4.30%, due 2/15/29 | | | 636,000 | | | | 687,258 | |
5.20%, due 2/15/49 | | | 708,000 | | | | 814,472 | |
GLP Capital, L.P. / GLP Financing II, Inc.
5.25%, due 6/1/25 | | | 361,000 | | | | 386,775 | |
Reckson Operating Partnership, L.P.
7.75%, due 3/15/20 | | | 1,335,000 | | | | 1,382,300 | |
Ventas Realty, L.P.
3.50%, due 4/15/24 | | | 1,150,000 | | | | 1,192,611 | |
| | | | | | | | |
| | | | | | | 5,027,743 | |
| | | | | | | | |
Retail 0.6% | |
AutoZone, Inc.
3.75%, due 4/18/29 | | | 984,000 | | | | 1,023,236 | |
CVS Health Corp. | | | | | | | | |
4.10%, due 3/25/25 | | | 1,369,000 | | | | 1,443,871 | |
4.30%, due 3/25/28 | | | 722,000 | | | | 761,333 | |
4.75%, due 12/1/22 | | | 388,000 | | | | 412,040 | |
5.05%, due 3/25/48 | | | 751,000 | | | | 799,905 | |
Lowe’s Cos., Inc.
3.65%, due 4/5/29 | | | 772,000 | | | | 806,069 | |
O’Reilly Automotive, Inc. | | | | | | | | |
3.60%, due 9/1/27 | | | 25,000 | | | | 25,705 | |
3.90%, due 6/1/29 | | | 1,129,000 | | | | 1,183,970 | |
4.35%, due 6/1/28 | | | 192,000 | | | | 207,595 | |
Starbucks Corp.
4.45%, due 8/15/49 | | | 740,000 | | | | 810,319 | |
| | | | | | | | |
| | | | | | | 7,474,043 | |
| | | | | | | | |
| | | | | | | | |
| | | Principal
Amount | | | Value | |
Road & Rail 0.3% | |
Wabtec Corp. (e) | | | | | | | | |
4.40%, due 3/15/24 | | $ | 1,014,000 | | | $ | 1,073,538 | |
4.95%, due 9/15/28 | | | 3,019,000 | | | | 3,237,030 | |
| | | | | | | | |
| | | | | | | 4,310,568 | |
| | | | | | | | |
Semiconductors 0.7% | |
Broadcom Corp. / Broadcom Cayman Finance, Ltd.
3.875%, due 1/15/27 | | | 552,000 | | | | 540,905 | |
Broadcom, Inc. (a) | | | | | | | | |
4.25%, due 4/15/26 | | | 734,000 | | | | 744,919 | |
4.75%, due 4/15/29 | | | 988,000 | | | | 1,014,461 | |
Entegris, Inc.
4.625%, due 2/10/26 (a) | | | 713,000 | | | | 718,347 | |
Lam Research Corp.
4.00%, due 3/15/29 | | | 208,000 | | | | 221,823 | |
Marvell Technology Group, Ltd. | | | | | | | | |
4.20%, due 6/22/23 | | | 440,000 | | | | 458,207 | |
4.875%, due 6/22/28 | | | 1,647,000 | | | | 1,746,013 | |
Micron Technology, Inc. | | | | | | | | |
4.975%, due 2/6/26 | | | 471,000 | | | | 495,005 | |
5.327%, due 2/6/29 | | | 1,204,000 | | | | 1,276,145 | |
5.50%, due 2/1/25 | | | 361,000 | | | | 371,379 | |
Qorvo, Inc.
5.50%, due 7/15/26 | | | 799,000 | | | | 845,582 | |
| | | | | | | | |
| | | | | | | 8,432,786 | |
| | | | | | | | |
Shipbuilding 0.2% | |
Huntington Ingalls Industries, Inc.
5.00%, due 11/15/25 (a) | | | 1,782,000 | | | | 1,844,370 | |
| | | | | | | | |
|
Software 0.1% | |
Fidelity National Information Services, Inc.
3.75%, due 5/21/29 | | | 341,000 | | | | 362,262 | |
IQVIA, Inc.
5.00%, due 5/15/27 (a) | | | 646,000 | | | | 666,995 | |
Oracle Corp.
3.90%, due 5/15/35 | | | 509,000 | | | | 551,057 | |
| | | | | | | | |
| | | | | | | 1,580,314 | |
| | | | | | | | |
Telecommunications 1.3% | |
AT&T, Inc. | | | | | | | | |
3.60%, due 7/15/25 | | | 687,000 | | | | 712,579 | |
4.35%, due 3/1/29 | | | 2,157,000 | | | | 2,323,264 | |
4.50%, due 3/9/48 | | | 792,000 | | | | 809,752 | |
4.75%, due 5/15/46 | | | 818,000 | | | | 863,820 | |
4.85%, due 3/1/39 | | | 733,000 | | | | 786,678 | |
5.15%, due 11/15/46 | | | 684,000 | | | | 756,330 | |
5.25%, due 3/1/37 | | | 296,000 | | | | 332,201 | |
CenturyLink, Inc. | | | | | | | | |
5.80%, due 3/15/22 | | | 419,000 | | | | 436,808 | |
6.45%, due 6/15/21 | | | 752,000 | | | | 795,240 | |
| | | | |
| 16 | | MainStay VP Janus Henderson Balanced Portfolio | | The notes to the financial statements are an integral part of,
and should be read in conjunction with, the financial statements. |
| | | | | | | | |
| | | Principal
Amount | | | Value | |
| Corporate Bonds (continued) | |
Telecommunications (continued) | |
CommScope, Inc.
6.00%, due 3/1/26 (a) | | $ | 1,342,000 | | | $ | 1,375,550 | |
T-Mobile USA, Inc.
6.375%, due 3/1/25 | | | 1,472,000 | | | | 1,528,672 | |
Verizon Communications, Inc. | | | | | | | | |
2.625%, due 8/15/26 | | | 1,108,000 | | | | 1,100,809 | |
3.875%, due 2/8/29 | | | 379,000 | | | | 406,524 | |
4.329%, due 9/21/28 | | | 2,326,000 | | | | 2,577,665 | |
4.522%, due 9/15/48 | | | 281,000 | | | | 314,839 | |
4.862%, due 8/21/46 | | | 381,000 | | | | 443,594 | |
5.012%, due 8/21/54 | | | 571,000 | | | | 683,485 | |
| | | | | | | | |
| | | | | | | 16,247,810 | |
| | | | | | | | |
Total Corporate Bonds
(Cost $215,478,884) | | | | | | | 225,837,245 | |
| | | | | | | | |
|
| Loan Assignments 0.1% | |
Utilities 0.1% | |
TEX Operations Co. LLC
Exit Term Loan B
4.402% (1 Month LIBOR + 2.00%), due 8/4/23 (f) | | | 1,346,264 | | | | 1,343,530 | |
| | | | | | | | |
Total Loan Assignments
(Cost $1,349,121) | | | | | | | 1,343,530 | |
| | | | | | | | |
|
| Mortgage-Backed Securities 1.7% | |
Agency (Collateralized Mortgage Obligations) 0.3% | |
Fannie Mae (Collateralized Mortgage Obligations)
Series 2018-27, Class EA
3.00%, due 5/25/48 | | | 1,249,375 | | | | 1,267,215 | |
Government National Mortgage Association (f) | | | | | | | | |
REMIC,Series 2019-18, Class QF
2.833% (1 Month LIBOR + 0.45%), due 2/20/49 | | | 918,928 | | | | 920,626 | |
REMIC,Series 2019-18, Class FQ
2.891% (1 Month LIBOR + 0.45%), due 2/20/49 | | | 1,044,390 | | | | 1,046,126 | |
| | | | | | | | |
| | | | | | | 3,233,967 | |
| | | | | | | | |
Commercial Mortgage Loans
(Collateralized Mortgage Obligations) 0.4% | |
Banc of America Merrill Lynch Large Loan, Inc.
Series 2018-DSNY, Class A
3.244% (1 Month LIBOR + 0.85%), due 9/15/34 (a)(f) | | | 566,000 | | | | 566,148 | |
| | | | | | | | |
| | | Principal
Amount | | | Value | |
Commercial Mortgage Loans
(Collateralized Mortgage Obligations) (continued) | |
Barclays Commercial Mortgage Securities LLC (a) | | | | | | | | |
Series 2018-TALL, Class A
3.116% (1 Month LIBOR + 0.722%), due 3/15/37 (f) | | $ | 1,457,000 | | | $ | 1,451,520 | |
Series 2015-SRCH, Class A2
4.197%, due 8/10/35 | | | 875,000 | | | | 962,634 | |
BX Commercial Mortgage Trust
Series 2018-IND, Class A
3.144% (1 Month LIBOR + 0.75%), due 11/15/35 (a)(f) | | | 1,388,732 | | | | 1,389,872 | |
BXP Trust
Series 2017-GM, Class A
3.379%, due 6/13/39 (a) | | | 396,000 | | | | 414,675 | |
CSMLT TRUST
Series 2015-2, Class A6
3.50%, due 8/25/45 (a)(g) | | | 417,563 | | | | 422,487 | |
Wachovia Bank Commercial Mortgage Trust
Series 2007-C34, Class AJ
6.308%, due 5/15/46 (g) | | | 69,158 | | | | 69,573 | |
Wells Fargo Mortgage Backed Securities Trust
Series 2018-1, Class A17
3.50%, due 7/25/47 (a)(h) | | | 202,884 | | | | 203,375 | |
| | | | | | | | |
| | | | | | | 5,480,284 | |
| | | | | | | | |
Whole Loan (Collateralized Mortgage Obligations) 1.0% | |
Angel Oak Mortgage Trust
Series 2018-2, Class A1
3.674%, due 7/27/48 (a)(h) | | | 206,562 | | | | 209,831 | |
Arroyo Mortgage Trust
Series 2018-1, Class A1
3.763%, due 4/25/48 (a)(h) | | | 355,981 | | | | 364,539 | |
Fannie Mae Connecticut Avenue Securities (Mortgage Pass-Through Securities) (f) | | | | | | | | |
Series 2018-C01, Class 1M1
3.03% (1 Month LIBOR + 0.60%), due 7/25/30 | | | 182,222 | | | | 182,123 | |
Series 2017-C06, Class 1M1
3.18% (1 Month LIBOR + 0.75%), due 2/25/30 | | | 82,340 | | | | 82,340 | |
Series 2017-C06, Class 2M1
3.18% (1 Month LIBOR + 0.75%), due 2/25/30 | | | 65,408 | | | | 65,444 | |
Series 2018-C05, Class 1M1
3.195% (1 Month LIBOR + 0.72%), due 1/25/31 | | | 54,738 | | | | 54,757 | |
| | | | | | |
The notes to the financial statements are an integral part of,
and should be read in conjunction with, the financial statements. | | | | | 17 | |
Portfolio of InvestmentsJune 30, 2019 (Unaudited) (continued)
| | | | | | | | |
| | | Principal
Amount | | | Value | |
| Mortgage-Backed Securities (continued) | |
Whole Loan (Collateralized Mortgage Obligations) (continued) | |
Fannie Mae Connecticut Avenue Securities (Mortgage Pass-Through Securities) (continued) | | | | | | | | |
Series 2017-C03, Class 1M1
3.38% (1 Month LIBOR + 0.95%), due 10/25/29 | | $ | 78,556 | | | $ | 78,762 | |
Series 2017-C02, Class 2M1
3.58% (1 Month LIBOR + 1.15%), due 9/25/29 | | | 110,342 | | | | 110,665 | |
Federal National Mortgage Association
Series 2014-C03, Class 1M2
5.43% (1 Month LIBOR + 3.00%), due 7/25/24 (f) | | | 1,139,149 | | | | 1,194,492 | |
JP Morgan Mortgage Trust
Series 2019-5, Class A11
3.304% (1 Month LIBOR + 0.90%), due 11/25/49 (a)(f) | | | 172,000 | | | | 172,110 | |
Mello Warehouse Securitization Trust
Series 2018-W1, Class A
3.28% (1 Month LIBOR + 0.85%), due 11/25/51 (a)(f) | | | 1,968,000 | | | | 1,963,609 | |
New Residential Mortgage Loan Trust
Series 2018-2A, Class A1
4.50%, due 2/25/58 (a)(h) | | | 411,106 | | | | 431,532 | |
Sequoia Mortgage Trust
Series 2018-7, Class A19
4.00%, due 9/25/48 (a)(h) | | | 242,846 | | | | 245,436 | |
Station Place Securitization Trust (i) | | | | | | | | |
Series 2018-7, Class A
3.28% (1 Month LIBOR + 0.85%), due 9/24/19 (a)(f) | | | 2,081,818 | | | | 2,081,818 | |
Series 2019-4, Class A
3.381%, due 6/24/20 | | | 1,862,000 | | | | 1,862,000 | |
Towd Point Asset Funding LLC
Series 2019-HE1, Class A1
3.341% (1 Month LIBOR + 0.90%), due 4/25/48 (a)(f) | | | 988,000 | | | | 984,858 | |
Wells Fargo Mortgage Backed Securities Trust (a)(h) | | | | | | | | |
Series 2019-1, Class A3
4.00%, due 11/25/48 | | | 401,561 | | | | 408,290 | |
Series 2019-2, Class A17
4.00%, due 4/25/49 | | | 428,507 | | | | 435,800 | |
Winwater Mortgage Loan Trust
Series 2015-5, Class A5
3.50%, due 8/20/45 (a)(h) | | | 1,310,088 | | | | 1,316,951 | |
| | | | | | | | |
| | | | | | | 12,245,357 | |
| | | | | | | | |
Total Mortgage-Backed Securities
(Cost $20,796,192) | | | | | | | 20,959,608 | |
| | | | | | | | |
| | | | | | | | |
| | | Principal
Amount | | | Value | |
| U.S. Government & Federal Agencies 18.6% | |
Federal Home Loan Mortgage Corporation
(Mortgage Pass-Through Securities) 4.0% | |
3.00%, due 1/1/45 | | $ | 361,287 | | | $ | 367,137 | |
3.00%, due 10/1/46 | | | 1,348,417 | | | | 1,369,157 | |
3.00%, due 12/1/46 | | | 2,293,007 | | | | 2,328,277 | |
3.00%, due 8/1/47 | | | 6,766,404 | | | | 6,882,813 | |
3.50%, due 2/1/43 | | | 379,063 | | | | 393,048 | |
3.50%, due 2/1/44 | | | 441,725 | | | | 457,946 | |
3.50%, due 12/1/44 | | | 953,405 | | | | 990,029 | |
3.50%, due 7/1/46 | | | 1,467,079 | | | | 1,527,829 | |
3.50%, due 10/1/46 | | | 1,982,825 | | | | 2,050,959 | |
3.50%, due 2/1/47 | | | 1,228,775 | | | | 1,270,833 | |
3.50%, due 9/1/47 | | | 1,993,447 | | | | 2,053,572 | |
3.50%, due 11/1/47 | | | 654,271 | | | | 677,030 | |
3.50%, due 12/1/47 | | | 2,617,734 | | | | 2,722,196 | |
3.50%, due 2/1/48 | | | 1,021,741 | | | | 1,055,754 | |
3.50%, due 3/1/48 | | | 1,637,854 | | | | 1,699,062 | |
3.50%, due 4/1/48 | | | 107,876 | | | | 111,556 | |
3.50%, due 8/1/48 | | | 1,177,257 | | | | 1,217,422 | |
3.50%, due 11/1/48 | | | 1,520,382 | | | | 1,572,227 | |
4.00%, due 5/1/46 | | | 248,678 | | | | 260,703 | |
4.00%, due 3/1/47 | | | 77,669 | | | | 81,377 | |
4.00%, due 3/1/48 | | | 352,716 | | | | 369,117 | |
4.00%, due 4/1/48 | | | 637,344 | | | | 665,488 | |
4.00%, due 5/1/48 | | | 1,558,465 | | | | 1,620,893 | |
4.00%, due 6/1/48 | | | 404,193 | | | | 420,171 | |
4.00%, due 8/1/48 | | | 9,386,832 | | | | 9,769,734 | |
4.00%, due 1/1/49 | | | 371,638 | | | | 394,959 | |
4.50%, due 5/1/38 | | | 871,134 | | | | 917,655 | |
4.50%, due 7/1/38 | | | 672,914 | | | | 709,079 | |
4.50%, due 9/1/38 | | | 442,890 | | | | 466,693 | |
4.50%, due 5/1/44 | | | 948,704 | | | | 1,018,071 | |
4.50%, due 3/1/48 | | | 837,259 | | | | 880,292 | |
4.50%, due 8/1/48 | | | 399,000 | | | | 419,445 | |
4.50%, due 9/1/48 | | | 1,550,995 | | | | 1,629,677 | |
4.50%, due 12/1/48 | | | 515,498 | | | | 549,362 | |
5.00%, due 9/1/48 | | | 106,579 | | | | 113,104 | |
6.00%, due 4/1/40 | | | 769,718 | | | | 885,459 | |
| | | | | | | | |
| | | | | | | 49,918,126 | |
| | | | | | | | |
Federal National Mortgage Association
(Mortgage Pass-Through Securities) 5.1% | |
3.00%, due 2/1/43 | | | 33,917 | | | | 34,397 | |
3.00%, due 5/1/43 | | | 126,750 | | | | 128,553 | |
3.00%, due 10/1/45 | | | 82,505 | | | | 83,378 | |
3.00%, due 1/1/46 | | | 6,656 | | | | 6,747 | |
3.00%, due 3/1/46 | | | 343,138 | | | | 347,792 | |
3.00%, due 11/1/46 | | | 320,781 | | | | 326,032 | |
3.00%, due 2/1/47 | | | 265,902 | | | | 271,191 | |
3.00%, due 3/1/47 | | | 993,900 | | | | 1,010,428 | |
3.00%, due 2/1/57 | | | 1,107,339 | | | | 1,116,839 | |
| | | | |
| 18 | | MainStay VP Janus Henderson Balanced Portfolio | | The notes to the financial statements are an integral part of,
and should be read in conjunction with, the financial statements. |
| | | | | | | | |
| | | Principal
Amount | | | Value | |
| U.S. Government & Federal Agencies (continued) | |
Federal National Mortgage Association
(Mortgage Pass-Through Securities) (continued) | |
3.50%, due 10/1/42 | | $ | 419,876 | | | $ | 433,360 | |
3.50%, due 12/1/42 | | | 958,840 | | | | 993,324 | |
3.50%, due 2/1/43 | | | 1,404,981 | | | | 1,455,724 | |
3.50%, due 4/1/43 | | | 1,014,017 | | | | 1,050,503 | |
3.50%, due 11/1/43 | | | 482,109 | | | | 499,478 | |
3.50%, due 4/1/44 | | | 602,050 | | | | 628,537 | |
3.50%, due 2/1/45 | | | 1,353,233 | | | | 1,402,096 | |
3.50%, due 12/1/45 | | | 306,169 | | | | 319,651 | |
3.50%, due 5/1/46 | | | 189,367 | | | | 195,752 | |
3.50%, due 7/1/46 | | | 969,206 | | | | 1,006,998 | |
3.50%, due 8/1/46 | | | 3,780,195 | | | | 3,907,094 | |
3.50%, due 12/1/46 | | | 96,196 | | | | 99,423 | |
3.50%, due 8/1/47 | | | 661,718 | | | | 684,337 | |
3.50%, due 12/1/47 | | | 994,371 | | | | 1,027,891 | |
3.50%, due 1/1/48 | | | 902,539 | | | | 933,176 | |
3.50%, due 3/1/48 | | | 292,597 | | | | 303,215 | |
3.50%, due 4/1/48 | | | 1,454,644 | | | | 1,505,751 | |
3.50%, due 11/1/48 | | | 1,154,842 | | | | 1,204,280 | |
3.50%, due 1/1/49 | | | 263,582 | | | | 272,360 | |
3.50%, due 8/1/56 | | | 1,813,022 | | | | 1,862,660 | |
3.50%, due 2/1/57 | | | 1,984,470 | | | | 2,038,800 | |
4.00%, due 10/1/46 | | | 30,979 | | | | 32,233 | |
4.00%, due 5/1/47 | | | 210,024 | | | | 219,570 | |
4.00%, due 6/1/47 | | | 255,265 | | | | 266,168 | |
4.00%, due 7/1/47 | | | 268,764 | | | | 280,921 | |
4.00%, due 8/1/47 | | | 1,611,511 | | | | 1,683,772 | |
4.00%, due 9/1/47 | | | 1,194,922 | | | | 1,270,901 | |
4.00%, due 10/1/47 | | | 903,054 | | | | 940,823 | |
4.00%, due 11/1/47 | | | 1,342,525 | | | | 1,400,857 | |
4.00%, due 12/1/47 | | | 706,297 | | | | 735,725 | |
4.00%, due 1/1/48 | | | 5,530,538 | | | | 5,774,109 | |
4.00%, due 3/1/48 | | | 655,770 | | | | 687,783 | |
4.00%, due 4/1/48 | | | 288,132 | | | | 305,569 | |
4.00%, due 4/29/48 TBA (j) | | | 10,651,000 | | | | 11,008,183 | |
4.00%, due 5/1/48 | | | 1,374,472 | | | | 1,428,954 | |
4.00%, due 6/1/48 | | | 561,115 | | | | 582,650 | |
4.00%, due 10/1/48 | | | 72,133 | | | | 75,529 | |
4.00%, due 2/1/49 | | | 218,861 | | | | 226,990 | |
4.50%, due 11/1/38 | | | 603,706 | | | | 635,771 | |
4.50%, due 11/1/42 | | | 134,331 | | | | 144,636 | |
4.50%, due 10/1/44 | | | 363,027 | | | | 394,132 | |
4.50%, due 3/1/45 | | | 576,784 | | | | 626,230 | |
4.50%, due 6/1/45 | | | 314,050 | | | | 336,934 | |
4.50%, due 2/1/46 | | | 780,383 | | | | 837,404 | |
4.50%, due 5/1/47 | | | 576,995 | | | | 616,989 | |
4.50%, due 6/1/47 | | | 455,284 | | | | 484,574 | |
4.50%, due 7/1/47 | | | 806,786 | | | | 856,753 | |
4.50%, due 8/1/47 | | | 424,562 | | | | 449,616 | |
4.50%, due 9/1/47 | | | 1,185,905 | | | | 1,255,892 | |
| | | | | | | | |
| | | Principal
Amount | | | Value | |
Federal National Mortgage Association
(Mortgage Pass-Through Securities) (continued) | |
4.50%, due 10/1/47 | | $ | 82,823 | | | $ | 87,677 | |
4.50%, due 11/1/47 | | | 266,833 | | | | 282,580 | |
4.50%, due 3/1/48 | | | 980,754 | | | | 1,035,412 | |
4.50%, due 4/1/48 | | | 344,661 | | | | 366,307 | |
4.50%, due 5/1/48 | | | 511,466 | | | | 542,449 | |
4.50%, due 6/1/48 | | | 275,263 | | | | 291,332 | |
4.50%, due 6/29/48 TBA (j) | | | 1,165,000 | | | | 1,217,368 | |
4.50%, due 8/1/48 | | | 554,372 | | | | 582,110 | |
5.00%, due 7/1/44 | | | 530,195 | | | | 573,457 | |
6.00%, due 2/1/37 | | | 42,811 | | | | 49,187 | |
| | | | | | | | |
| | | | | | | 63,737,314 | |
| | | | | | | | |
Government National Mortgage Association
(Mortgage Pass-Through Securities) 1.2% | |
3.50%, due 5/20/49 | | | 1,271,027 | | | | 1,299,157 | |
3.50%, due 6/20/49 | | | 534,987 | | | | 546,828 | |
4.00%, due 1/15/45 | | | 1,172,796 | | | | 1,246,363 | |
4.00%, due 7/15/47 | | | 1,220,851 | | | | 1,295,365 | |
4.00%, due 8/15/47 | | | 239,422 | | | | 254,008 | |
4.00%, due 8/20/47 | | | 207,574 | | | | 216,587 | |
4.00%, due 11/15/47 | | | 281,380 | | | | 295,358 | |
4.00%, due 12/15/47 | | | 366,574 | | | | 384,763 | |
4.50%, due 8/15/46 | | | 1,204,542 | | | | 1,297,838 | |
4.50%, due 5/20/48 | | | 985,345 | | | | 1,041,532 | |
4.50%, due 7/29/48 TBA (j) | | | 1,236,000 | | | | 1,288,325 | |
5.00%, due 7/29/48 TBA (j) | | | 5,079,506 | | | | 5,309,770 | |
| | | | | | | | |
| | | | | | | 14,475,894 | |
| | | | | | | | |
United States Treasury Bonds 3.2% | |
2.25%, due 8/15/46 | | | 2,564,000 | | | | 2,422,379 | |
2.75%, due 11/15/47 | | | 7,131,000 | | | | 7,443,260 | |
2.875%, due 5/15/49 | | | 17,872,000 | | | | 19,173,305 | |
3.00%, due 2/15/48 | | | 4,495,000 | | | | 4,924,308 | |
3.00%, due 2/15/49 | | | 3,570,000 | | | | 3,920,864 | |
3.375%, due 11/15/48 | | | 1,643,500 | | | | 1,934,643 | |
| | | | | | | | |
| | | | | | | 39,818,759 | |
| | | | | | | | |
United States Treasury Notes 5.1% | |
2.00%, due 5/31/24 | | | 5,344,000 | | | | 5,406,834 | |
2.25%, due 4/30/24 | | | 1,018,000 | | | | 1,041,104 | |
2.375%, due 4/30/20 | | | 6,635,000 | | | | 6,654,438 | |
2.375%, due 2/29/24 | | | 648,000 | | | | 666,250 | |
2.375%, due 4/30/26 | | | 463,000 | | | | 478,120 | |
2.375%, due 5/15/29 | | | 7,083,000 | | | | 7,319,561 | |
2.50%, due 1/31/24 | | | 554,000 | | | | 572,178 | |
2.625%, due 12/31/23 | | | 8,070,000 | | | | 8,373,886 | |
2.625%, due 2/15/29 | | | 5,424,600 | | | | 5,720,410 | |
2.75%, due 2/15/28 | | | 750,000 | | | | 797,461 | |
2.875%, due 10/31/23 | | | 12,417,300 | | | | 12,999,846 | |
2.875%, due 11/30/23 | | | 841,000 | | | | 881,276 | |
2.875%, due 11/30/25 | | | 9,000 | | | | 9,559 | |
| | | | | | |
The notes to the financial statements are an integral part of,
and should be read in conjunction with, the financial statements. | | | | | 19 | |
Portfolio of InvestmentsJune 30, 2019 (Unaudited) (continued)
| | | | | | | | |
| | | Principal
Amount | | | Value | |
| U.S. Government & Federal Agencies (continued) | |
United States Treasury Notes (continued) | |
2.875%, due 8/15/28 | | $ | 3,091,000 | | | $ | 3,321,618 | |
3.125%, due 11/15/28 | | | 8,214,000 | | | | 9,009,410 | |
| | | | | | | | |
| | | | | | | 63,251,951 | |
| | | | | | | | |
Total U.S. Government & Federal Agencies
(Cost $225,137,227) | | | | | | | 231,202,044 | |
| | | | | | | | |
TotalLong-Term Bonds
(Cost $474,878,354) | | | | | | | 491,316,193 | |
| | | | | | | | |
| | |
| | | | | | | | |
| | |
| | | Shares | | | | |
| Common Stocks 59.9% | |
Aerospace & Defense 3.4% | |
Boeing Co. | | | 70,574 | | | | 25,689,642 | |
General Dynamics Corp. | | | 94,605 | | | | 17,201,081 | |
| | | | | | | | |
| | | | | | | 42,890,723 | |
| | | | | | | | |
Air Freight & Logistics 0.5% | |
United Parcel Service, Inc., Class B | | | 58,408 | | | | 6,031,794 | |
| | | | | | | | |
|
Airlines 0.6% | |
Delta Air Lines, Inc. | | | 133,235 | | | | 7,561,086 | |
| | | | | | | | |
|
Automobiles 0.5% | |
General Motors Co. | | | 156,518 | | | | 6,030,639 | |
| | | | | | | | |
|
Banks 2.5% | |
Bank of America Corp. | | | 291,783 | | | | 8,461,707 | |
U.S. Bancorp | | | 424,602 | | | | 22,249,145 | |
| | | | | | | | |
| | | | | | | 30,710,852 | |
| | | | | | | | |
Biotechnology 0.4% | |
AbbVie, Inc. | | | 72,563 | | | | 5,276,781 | |
| | | | | | | | |
|
Capital Markets 3.1% | |
Blackstone Group L.P. | | | 201,915 | | | | 8,969,064 | |
CME Group, Inc. | | | 59,224 | | | | 11,495,970 | |
Morgan Stanley | | | 181,733 | | | | 7,961,723 | |
TD Ameritrade Holding Corp. | | | 206,667 | | | | 10,316,817 | |
| | | | | | | | |
| | | | | | | 38,743,574 | |
| | | | | | | | |
Chemicals 1.2% | |
LyondellBasell Industries N.V., Class A | | | 180,329 | | | | 15,531,737 | |
| | | | | | | | |
|
Consumer Finance 1.6% | |
American Express Co. | | | 62,760 | | | | 7,747,094 | |
Synchrony Financial | | | 337,304 | | | | 11,694,330 | |
| | | | | | | | |
| | | | | | | 19,441,424 | |
| | | | | | | | |
| | | | | | | | |
| | |
| | | Shares | | | Value | |
Electronic Equipment, Instruments & Components 0.6% | |
Corning, Inc. | | | 242,844 | | | $ | 8,069,706 | |
| | | | | | | | |
|
Entertainment 0.9% | |
Walt Disney Co. | | | 78,052 | | | | 10,899,181 | |
| | | | | | | | |
|
Equity Real Estate Investment Trusts 1.3% | |
Crown Castle International Corp. | | | 54,660 | | | | 7,124,931 | |
MGM Growth Properties LLC, Class A | | | 159,932 | | | | 4,901,916 | |
OUTFRONT Media, Inc. | | | 147,048 | | | | 3,792,368 | |
| | | | | | | | |
| | | | | | | 15,819,215 | |
| | | | | | | | |
Food & Staples Retailing 3.1% | |
Costco Wholesale Corp. | | | 84,449 | | | | 22,316,493 | |
Kroger Co. | | | 165,590 | | | | 3,594,959 | |
Sysco Corp. | | | 180,146 | | | | 12,739,925 | |
| | | | | | | | |
| | | | | | | 38,651,377 | |
| | | | | | | | |
Food Products 0.6% | |
Hershey Co. | | | 56,554 | | | | 7,579,933 | |
| | | | | | | | |
|
Health Care Equipment & Supplies 0.9% | |
Abbott Laboratories | | | 21,456 | | | | 1,804,449 | |
Medtronic PLC | | | 98,966 | | | | 9,638,299 | |
| | | | | | | | |
| | | | | | | 11,442,748 | |
| | | | | | | | |
Health Care Providers & Services 1.7% | |
UnitedHealth Group, Inc. | | | 85,597 | | | | 20,886,524 | |
| | | | | | | | |
|
Hotels, Restaurants & Leisure 3.3% | |
Hilton Worldwide Holdings, Inc. | | | 98,892 | | | | 9,665,704 | |
McDonald’s Corp. | | | 118,313 | | | | 24,568,878 | |
Norwegian Cruise Line Holdings, Ltd. (k) | | | 71,602 | | | | 3,840,015 | |
Six Flags Entertainment Corp. | | | 53,978 | | | | 2,681,627 | |
| | | | | | | | |
| | | | | | | 40,756,224 | |
| | | | | | | | |
Household Products 0.4% | |
Clorox Co. | | | 35,248 | | | | 5,396,821 | |
| | | | | | | | |
|
Industrial Conglomerates 0.6% | |
Honeywell International, Inc. | | | 46,183 | | | | 8,063,090 | |
| | | | | | | | |
|
Insurance 0.7% | |
Progressive Corp. | | | 101,187 | | | | 8,087,877 | |
| | | | | | | | |
|
Interactive Media & Services 2.1% | |
Alphabet, Inc., Class C (k) | | | 23,833 | | | | 25,761,328 | |
| | | | | | | | |
|
Internet & Direct Marketing Retail 0.9% | |
Amazon.com, Inc. (k) | | | 5,681 | | | | 10,757,712 | |
| | | | | | | | |
| | | | |
| 20 | | MainStay VP Janus Henderson Balanced Portfolio | | The notes to the financial statements are an integral part of,
and should be read in conjunction with, the financial statements. |
| | | | | | | | |
| | |
| | | Shares | | | Value | |
| Common Stocks (continued) | |
IT Services 4.2% | |
Accenture PLC, Class A | | | 87,715 | | | $ | 16,207,101 | |
Mastercard, Inc. | | | 134,559 | | | | 35,594,892 | |
| | | | | | | | |
| | | | | | | 51,801,993 | |
| | | | | | | | |
Leisure Products 0.6% | |
Hasbro, Inc. | | | 69,182 | | | | 7,311,154 | |
| | | | | | | | |
|
Life Sciences Tools & Services 0.4% | |
Thermo Fisher Scientific, Inc. | | | 17,152 | | | | 5,037,199 | |
| | | | | | | | |
|
Machinery 1.4% | |
Deere & Co. | | | 49,634 | | | | 8,224,850 | |
Parker-Hannifin Corp. | | | 21,834 | | | | 3,711,998 | |
Stanley Black & Decker, Inc. | | | 35,814 | | | | 5,179,063 | |
| | | | | | | | |
| | | | | | | 17,115,911 | |
| | | | | | | | |
Media 1.4% | |
Comcast Corp., Class A | | | 420,285 | | | | 17,769,650 | |
| | | | | | | | |
|
Oil, Gas & Consumable Fuels 1.1% | |
EOG Resources, Inc. | | | 58,994 | | | | 5,495,881 | |
Suncor Energy, Inc. | | | 280,924 | | | | 8,758,147 | |
| | | | | | | | |
| | | | | | | 14,254,028 | |
| | | | | | | | |
Personal Products 0.4% | |
Estee Lauder Cos., Inc., Class A | | | 29,855 | | | | 5,466,749 | |
| | | | | | | | |
|
Pharmaceuticals 3.2% | |
Bristol-Myers Squibb Co. | | | 220,042 | | | | 9,978,905 | |
Eli Lilly & Co. | | | 102,445 | | | | 11,349,881 | |
Merck & Co., Inc. | | | 223,247 | | | | 18,719,261 | |
| | | | | | | | |
| | | | | | | 40,048,047 | |
| | | | | | | | |
Real Estate Management & Development 0.5% | |
CBRE Group, Inc., Class A (k) | | | 114,553 | | | | 5,876,569 | |
| | | | | | | | |
|
Road & Rail 1.5% | |
CSX Corp. | | | 234,518 | | | | 18,144,658 | |
| | | | | | | | |
|
Semiconductors & Semiconductor Equipment 2.9% | |
Intel Corp. | | | 241,449 | | | | 11,558,164 | |
Lam Research Corp. | | | 48,041 | | | | 9,024,021 | |
NVIDIA Corp. | | | 33,660 | | | | 5,527,982 | |
Texas Instruments, Inc. | | | 85,381 | | | | 9,798,323 | |
| | | | | | | | |
| | | | | | | 35,908,490 | |
| | | | | | | | |
Software 5.6% | |
Adobe, Inc. (k) | | | 59,911 | | | | 17,652,776 | |
Microsoft Corp. | | | 350,225 | | | | 46,916,141 | |
salesforce.com, Inc. (k) | | | 36,966 | | | | 5,608,851 | |
| | | | | | | | |
| | | | | | | 70,177,768 | |
| | | | | | | | |
| | | | | | | | |
| | |
| | | Shares | | | Value | |
Specialty Retail 1.7% | |
Home Depot, Inc. | | | 99,994 | | | $ | 20,795,752 | |
| | | | | | | | |
|
Technology Hardware, Storage & Peripherals 1.8% | |
Apple, Inc. | | | 115,133 | | | | 22,787,123 | |
| | | | | | | | |
|
Textiles, Apparel & Luxury Goods 0.8% | |
NIKE, Inc., Class B | | | 120,531 | | | | 10,118,578 | |
| | | | | | | | |
|
Tobacco 1.5% | |
Altria Group, Inc. | | | 383,118 | | | | 18,140,637 | |
| | | | | | | | |
Total Common Stocks
(Cost $540,165,691) | | | | | | | 745,144,652 | |
| | | | | | | | |
|
| Short-Term Investments 1.9% | |
Affiliated Investment Company 1.8% | |
MainStay U.S. Government Liquidity Fund, 2.03% (l) | | | 22,443,591 | | | | 22,443,591 | |
| | | | | | | | |
|
Unaffiliated Investment Company 0.1% | |
State Street Navigator Securities Lending Government Money Market Portfolio, 2.33% (l)(m) | | | 1,805,445 | | | | 1,805,445 | |
| | | | | | | | |
TotalShort-Term Investments
(Cost $24,249,036) | | | | | | | 24,249,036 | |
| | | | | | | | |
Total Investments
(Cost $1,039,293,081) | | | 101.4 | % | | | 1,260,709,881 | |
Other Assets, Less Liabilities | | | (1.4 | ) | | | (17,031,955 | ) |
Net Assets | | | 100.0 | % | | $ | 1,243,677,926 | |
| † | Percentages indicated are based on Portfolio net assets. |
| ‡ | Less than one-tenth of a percent. |
| (a) | May be sold to institutional investors only under Rule 144A or securities offered pursuant to Section 4(a)(2) of the Securities Act of 1933, as amended. |
| (b) | All or a portion of this security was held on loan. As of June 30, 2019, the aggregate market value of securities on loan was $1,815,828 ; the total market value of collateral held by the Portfolio was $1,859,242. The market value of the collateral held included non-cash collateral in the form of U.S. Treasury securities with a value of $53,797 (See Note 2(I)). |
| (c) | Fixed to floating rate—Rate shown was the rate in effect as of June 30, 2019. |
| (d) | Securities are perpetual and, thus, do not have a predetermined maturity date. The date shown, if applicable, reflects the next call date. |
| (e) | Step coupon—Rate shown was the rate in effect as of June 30, 2019. |
| (f) | Floating rate—Rate shown was the rate in effect as of June 30, 2019. |
| | | | | | |
The notes to the financial statements are an integral part of,
and should be read in conjunction with, the financial statements. | | | | | 21 | |
Portfolio of InvestmentsJune 30, 2019 (Unaudited) (continued)
| (g) | Collateral strip rate—A bond whose interest was based on the weighted net interest rate of the collateral. The coupon rate adjusts periodically based on a predetermined schedule. Rate shown was the rate in effect as of June 30, 2019. |
| (h) | Coupon rate may change based on changes of the underlying collateral or prepayments of principal. The coupon rate shown represents the rate at period end. |
| (i) | Fair valued security—Represents fair value as measured in good faith under procedures approved by the Board of Trustees. As of June 30, 2019, the total market value of fair valued securities was $3,943,818, which represented 0.3% of the Portfolio’s net assets. |
| (j) | TBA—Securities purchased on a forward commitment basis with an approximate principal amount and maturity date. The actual principal |
| | amount and maturity date will be determined upon settlement. As of June 30, 2019, the total net market value of these securities was $18,823,646, which represented 1.5% of the Portfolio’s net assets. All or a portion of these securities are a part of a mortgage dollar roll agreement. |
| (k) | Non-income producing security. |
| (l) | Current yield as of June 30, 2019. |
| (m) | Represents security purchased with cash collateral received for securities on loan. |
The following abbreviations are used in the preceding pages:
LIBOR—London Interbank Offered Rate
REMIC—Real Estate Mortgage Investment Conduit
The following is a summary of the fair valuations according to the inputs used as of June 30, 2019, for valuing the Portfolio’s assets:
| | | | | | | | | | | | | | | | |
Description | | Quoted
Prices in
Active
Markets for
Identical
Assets
(Level 1) | | | Significant
Other
Observable
Inputs
(Level 2) | | | Significant
Unobservable
Inputs
(Level 3) | | | Total | |
| | | | |
Asset Valuation Inputs | | | | | | | | | | | | | | | | |
| Investments in Securities (a) | | | | | | | | | | | | | | | | |
| Long-Term Bonds | | | | | | | | | | | | | | | | |
Asset-Backed Securities | | $ | — | | | $ | 11,973,766 | | | $ | — | | | $ | 11,973,766 | |
Corporate Bonds | | | — | | | | 225,837,245 | | | | — | | | | 225,837,245 | |
Loan Assignments | | | — | | | | 1,343,530 | | | | — | | | | 1,343,530 | |
Mortgage-Backed Securities | | | — | | | | 20,959,608 | | | | — | | | | 20,959,608 | |
U.S. Government & Federal Agencies | | | — | | | | 231,202,044 | | | | — | | | | 231,202,044 | |
| | | | | | | | | | | | | | | | |
| TotalLong-Term Bonds | | | — | | | | 491,316,193 | | | | — | | | | 491,316,193 | |
| | | | | | | | | | | | | | | | |
| Common Stocks | | | 745,144,652 | | | | — | | | | — | | | | 745,144,652 | |
| Short-Term Investments | | | | | | | | | | | | | | | | |
Affiliated Investment Company | | | 22,443,591 | | | | — | | | | — | | | | 22,443,591 | |
Unaffiliated Investment Company | | | 1,805,445 | | | | — | | | | — | | | | 1,805,445 | |
| | | | | | | | | | | | | | | | |
| TotalShort-Term Investments | | | 24,249,036 | | | | — | | | | — | | | | 24,249,036 | |
| | | | | | | | | | | | | | | | |
| Total Investments in Securities | | $ | 769,393,688 | | | $ | 491,316,193 | | | $ | — | | | $ | 1,260,709,881 | |
| | | | | | | | | | | | | | | | |
| (a) | For a complete listing of investments and their industries, see the Portfolio of Investments. |
| | | | |
| 22 | | MainStay VP Janus Henderson Balanced Portfolio | | The notes to the financial statements are an integral part of,
and should be read in conjunction with, the financial statements. |
Statement of Assets and Liabilitiesas of June 30, 2019 (Unaudited)
| | | | |
| Assets | | | | |
Investment in unaffiliated securities, at value
(identified cost $1,016,849,490) including securities on loan of $1,815,828 | | $ | 1,238,266,290 | |
Investment in affiliated investment company, at value (identified cost $22,443,591) | | | 22,443,591 | |
Cash | | | 55,297 | |
Receivables: | | | | |
Dividends and interest | | | 4,439,298 | |
Investment securities sold | | | 3,142,957 | |
Portfolio shares sold | | | 610,615 | |
Securities lending | | | 5,044 | |
Other assets | | | 5,680 | |
| | | | |
Total assets | | | 1,268,968,772 | |
| | | | |
| |
| Liabilities | | | | |
Cash collateral received for securities on loan | | | 1,805,445 | |
Payables: | | | | |
Investment securities purchased | | | 22,016,315 | |
Portfolio shares redeemed | | | 604,550 | |
Manager (See Note 3) | | | 551,642 | |
NYLIFE Distributors (See Note 3) | | | 172,470 | |
Shareholder communication | | | 58,244 | |
Professional fees | | | 48,599 | |
Custodian | | | 19,723 | |
Trustees | | | 1,436 | |
Accrued expenses | | | 12,422 | |
| | | | |
Total liabilities | | | 25,290,846 | |
| | | | |
Net assets | | $ | 1,243,677,926 | |
| | | | |
| |
| Composition of Net Assets | | | | |
Shares of beneficial interest outstanding (par value of $.001 per share) unlimited number of shares authorized | | $ | 89,891 | |
Additional paid-in capital | | | 912,107,467 | |
| | | | |
| | | 912,197,358 | |
Total distributable earnings (loss) | | | 331,480,568 | |
| | | | |
Net assets | | $ | 1,243,677,926 | |
| | | | |
| | | | |
Initial Class | | | | |
Net assets applicable to outstanding shares | | $ | 394,155,414 | |
| | | | |
Shares of beneficial interest outstanding | | | 28,351,158 | |
| | | | |
Net asset value per share outstanding | | $ | 13.90 | |
| | | | |
Service Class | | | | |
Net assets applicable to outstanding shares | | $ | 849,522,512 | |
| | | | |
Shares of beneficial interest outstanding | | | 61,539,495 | |
| | | | |
Net asset value per share outstanding | | $ | 13.80 | |
| | | | |
| | | | | | |
The notes to the financial statements are an integral part of,
and should be read in conjunction with, the financial statements. | | | | | 23 | |
Statement of Operationsfor the six months ended June 30, 2019 (Unaudited)
| | | | |
| Investment Income (Loss) | | | | |
Income | | | | |
Interest | | $ | 8,457,396 | |
Dividends-unaffiliated (a) | | | 7,692,665 | |
Dividends-affiliated | | | 178,208 | |
Securities lending | | | 78,893 | |
| | | | |
Total income | | | 16,407,162 | |
| | | | |
Expenses | | | | |
Manager (See Note 3) | | | 3,248,898 | |
Distribution/Service—Service Class (See Note 3) | | | 1,006,733 | |
Professional fees | | | 69,869 | |
Shareholder communication | | | 58,721 | |
Custodian | | | 27,769 | |
Trustees | | | 14,577 | |
Miscellaneous | | | 24,666 | |
| | | | |
Total expenses | | | 4,451,233 | |
| | | | |
Net investment income (loss) | | | 11,955,929 | |
| | | | |
|
| Realized and Unrealized Gain (Loss) on Investments and Foreign Currency Transactions | |
Net realized gain (loss) on: | | | | |
Unaffiliated investment transactions | | | 14,103,534 | |
Foreign currency transactions | | | 495 | |
| | | | |
Net realized gain (loss) on investments and foreign currency transactions | | | 14,104,029 | |
| | | | |
Net change in unrealized appreciation (depreciation) on unaffiliated investments | | | 117,449,948 | |
| | | | |
Net realized and unrealized gain (loss) on investments and foreign currency transactions | | | 131,553,977 | |
| | | | |
Net increase (decrease) in net assets resulting from operations | | $ | 143,509,906 | |
| | | | |
| (a) | Dividends recorded net of foreign withholding taxes in the amount of $26,674. |
| | | | |
| 24 | | MainStay VP Janus Henderson Balanced Portfolio | | The notes to the financial statements are an integral part of,
and should be read in conjunction with, the financial statements. |
Statements of Changes in Net Assets
for the six months ended June 30, 2019 (Unaudited) and the year ended December 31, 2018
| | | | | | | | |
| | | 2019 | | | 2018 | |
| Increase (Decrease) in Net Assets | |
Operations: | | | | | | | | |
Net investment income (loss) | | $ | 11,955,929 | | | $ | 20,727,896 | |
Net realized gain (loss) on investments and foreign currency transactions | | | 14,104,029 | | | | 65,901,744 | |
Net change in unrealized appreciation (depreciation) on investments and foreign currency transactions | | | 117,449,948 | | | | (82,801,060 | ) |
| | | | |
Net increase (decrease) in net assets resulting from operations | | | 143,509,906 | | | | 3,828,580 | |
| | | | |
Distributions to shareholders: | | | | | | | | |
Initial Class | | | — | | | | (28,628,702 | ) |
Service Class | | | — | | | | (54,490,694 | ) |
| | | | |
Total distributions to shareholders | | | — | | | | (83,119,396 | ) |
| | | | |
Capital share transactions: | | | | | | | | |
Net proceeds from sale of shares | | | 59,754,090 | | | | 119,357,465 | |
Net asset value of shares issued to shareholders in reinvestment of dividends and distributions | | | — | | | | 83,119,396 | |
Cost of shares redeemed | | | (79,345,133 | ) | | | (151,861,485 | ) |
| | | | |
Increase (decrease) in net assets derived from capital share transactions | | | (19,591,043 | ) | | | 50,615,376 | |
| | | | |
Net increase (decrease) in net assets | | | 123,918,863 | | | | (28,675,440 | ) |
| | |
| Net Assets | | | | | | | | |
Beginning of period | | | 1,119,759,063 | | | | 1,148,434,503 | |
| | | | |
End of period | | $ | 1,243,677,926 | | | $ | 1,119,759,063 | |
| | | | |
| | | | | | |
The notes to the financial statements are an integral part of,
and should be read in conjunction with, the financial statements. | | | | | 25 | |
Financial Highlightsselected per share data and ratios
| | | | | | | | | | | | | | | | | | | | | | | | | | | | | | | | | | | |
| | | |
| | | Six months
ended
June 30, | | | | Year ended December 31, |
| | | | | | | |
| Initial Class | | 2019* | | | | 2018 | | 2017 | | 2016 | | 2015 | | 2014 |
| | | | | | | |
Net asset value at beginning of period | | | $ | 12.31 | | | | | | | | | $ | 13.18 | | | | $ | 11.82 | | | | $ | 12.11 | | | | $ | 13.13 | | | | $ | 12.47 | |
| | | | | | | | | | | | | | | | | | | | | | | | | | | | | | | | | | | |
| | | | | | | |
Net investment income (loss) (a) | | | | 0.14 | | | | | | | | | | 0.26 | | | | | 0.25 | | | | | 0.22 | | | | | 0.24 | | | | | 0.24 | |
| | | | | | | |
Net realized and unrealized gain (loss) on investments | | | | 1.45 | | | | | | | | | | (0.14 | ) | | | | 1.89 | | | | | 0.32 | | | | | (0.17 | ) | | | | 0.84 | |
| | | | | | | |
Net realized and unrealized gain (loss) on foreign currency transactions | | | | 0.00 | ‡ | | | | | | | | | (0.00 | )‡ | | | | 0.00 | ‡ | | | | 0.00 | ‡ | | | | (0.00 | )‡ | | | | (0.00 | )‡ |
| | | | | | | | | | | | | | | | | | | | | | | | | | | | | | | | | | | |
| | | | | | | |
Total from investment operations | | | | 1.59 | | | | | | | | | | 0.12 | | | | | 2.14 | | | | | 0.54 | | | | | 0.07 | | | | | 1.08 | |
| | | | | | | | | | | | | | | | | | | | | | | | | | | | | | | | | | | |
| | | | | | | |
| Less dividends and distributions: | | | | | | | | | | | | | | | | | | | | | | | | | | | | | | | | | | | |
| | | | | | | |
From net investment income | | | | — | | | | | | | | | | (0.25 | ) | | | | (0.23 | ) | | | | (0.23 | ) | | | | (0.25 | ) | | | | (0.19 | ) |
| | | | | | | |
From net realized gain on investments | | | | — | | | | | | | | | | (0.74 | ) | | | | (0.55 | ) | | | | (0.60 | ) | | | | (0.84 | ) | | | | (0.23 | ) |
| | | | | | | | | | | | | | | | | | | | | | | | | | | | | | | | | | | |
| | | | | | | |
Total dividends and distributions | | | | — | | | | | | | | | | (0.99 | ) | | | | (0.78 | ) | | | | (0.83 | ) | | | | (1.09 | ) | | | | (0.42 | ) |
| | | | | | | | | | | | | | | | | | | | | | | | | | | | | | | | | | | |
| | | | | | | |
Net asset value at end of period | | | $ | 13.90 | | | | | | | | | $ | 12.31 | | | | $ | 13.18 | | | | $ | 11.82 | | | | $ | 12.11 | | | | $ | 13.13 | |
| | | | | | | | | | | | | | | | | | | | | | | | | | | | | | | | | | | |
| | | | | | | |
Total investment return (b) | | | | 12.92 | %(c) | | | | | | | | | 0.42 | % | | | | 18.35 | % | | | | 4.70 | % | | | | 0.70 | % | | | | 8.68 | % |
| | | | | | | |
| Ratios (to average net assets)/Supplemental Data: | | | | | | | | | | | | | | | | | | | | | | | | | | | | | | | | | | | |
| | | | | | | |
Net investment income (loss) | | | | 2.18 | %†† | | | | | | | | | 1.93 | % | | | | 1.95 | % | | | | 1.87 | % | | | | 1.84 | % | | | | 1.85 | % |
| | | | | | | |
Net expenses (d) | | | | 0.58 | %†† | | | | | | | | | 0.58 | % | | | | 0.58 | % | | | | 0.59 | % | | | | 0.58 | % | | | | 0.58 | % |
| | | | | | | |
Expenses (before waiver/reimbursement) (d) | | | | 0.58 | %†† | | | | | | | | | 0.58 | %(e) | | | | 0.58 | %(e) | | | | 0.59 | % | | | | 0.58 | % | | | | 0.59 | % |
| | | | | | | |
Portfolio turnover rate | | | | 47 | %(f) | | | | | | | | | 132 | %(f) | | | | 73 | %(f) | | | | 74 | % | | | | 76 | % | | | | 86 | % |
| | | | | | | |
Net assets at end of period (in 000’s) | | | $ | 394,155 | | | | | | | | | $ | 371,106 | | | | $ | 417,996 | | | | $ | 401,219 | | | | $ | 429,680 | | | | $ | 478,480 | |
| ‡ | Less than one cent per share. |
| (a) | Per share data based on average shares outstanding during the period. |
| (b) | Total return does not reflect any deduction of sales charges, mortality and expense charges, contract charges or administrative charges. For periods of less than one year, total return is not annualized. |
| (c) | Total investment return may reflect adjustments to conform to generally accepted accounting principles. |
| (d) | In addition to the fees and expenses which the Portfolio bears directly, it also indirectly bears a pro-rata share of the fees and expenses of the underlying funds in which it invests. Such indirect expenses are not included in the above expense ratios. |
| (e) | Expense waiver/reimbursement less than 0.01%. |
| (f) | The portfolio turnover rate not including mortgage dollar rolls were 39%, 103% and 66% for the six months ended June 30, 2019 and for the years ended December 31, 2018 and 2017, respectively. |
| | | | |
| 26 | | MainStay VP Janus Henderson Balanced Portfolio | | The notes to the financial statements are an integral part of,
and should be read in conjunction with, the financial statements. |
Financial Highlightsselected per share data and ratios
| | | | | | | | | | | | | | | | | | | | | | | | | | | | | | | | | | | |
| | | |
| | | Six months
ended
June 30, | | | | Year ended December 31, |
| | | | | | | |
| Service Class | | 2019* | | | | 2018 | | 2017 | | 2016 | | 2015 | | 2014 |
| | | | | | | |
Net asset value at beginning of period | | | $ | 12.24 | | | | | | | | | $ | 13.11 | | | | $ | 11.77 | | | | $ | 12.06 | | | | $ | 13.08 | | | | $ | 12.44 | |
| | | | | | | | | | | | | | | | | | | | | | | | | | | | | | | | | | | |
| | | | | | | |
Net investment income (loss) (a) | | | | 0.13 | | | | | | | | | | 0.22 | | | | | 0.22 | | | | | 0.19 | | | | | 0.21 | | | | | 0.21 | |
| | | | | | | |
Net realized and unrealized gain (loss) on investments | | | | 1.43 | | | | | | | | | | (0.13 | ) | | | | 1.88 | | | | | 0.32 | | | | | (0.17 | ) | | | | 0.82 | |
| | | | | | | |
Net realized and unrealized gain (loss) on foreign currency transactions | | | | 0.00 | ‡ | | | | | | | | | (0.00 | )‡ | | | | 0.00 | ‡ | | | | 0.00 | ‡ | | | | (0.00 | )‡ | | | | (0.00 | )‡ |
| | | | | | | | | | | | | | | | | | | | | | | | | | | | | | | | | | | |
| | | | | | | |
Total from investment operations | | | | 1.56 | | | | | | | | | | 0.09 | | | | | 2.10 | | | | | 0.51 | | | | | 0.04 | | | | | 1.03 | |
| | | | | | | | | | | | | | | | | | | | | | | | | | | | | | | | | | | |
| | | | | | | |
| Less dividends and distributions: | | | | | | | | | | | | | | | | | | | | | | | | | | | | | | | | | | | |
| | | | | | | |
From net investment income | | | | — | | | | | | | | | | (0.22 | ) | | | | (0.21 | ) | | | | (0.20 | ) | | | | (0.22 | ) | | | | (0.16 | ) |
| | | | | | | |
From net realized gain on investments | | | | — | | | | | | | | | | (0.74 | ) | | | | (0.55 | ) | | | | (0.60 | ) | | | | (0.84 | ) | | | | (0.23 | ) |
| | | | | | | | | | | | | | | | | | | | | | | | | | | | | | | | | | | |
| | | | | | | |
Total dividends and distributions | | | | — | | | | | | | | | | (0.96 | ) | | | | (0.76 | ) | | | | (0.80 | ) | | | | (1.06 | ) | | | | (0.39 | ) |
| | | | | | | | | | | | | | | | | | | | | | | | | | | | | | | | | | | |
| | | | | | | |
Net asset value at end of period | | | $ | 13.80 | | | | | | | | | $ | 12.24 | | | | $ | 13.11 | | | | $ | 11.77 | | | | $ | 12.06 | | | | $ | 13.08 | |
| | | | | | | | | | | | | | | | | | | | | | | | | | | | | | | | | | | |
| | | | | | | |
Total investment return (b) | | | | 12.75 | %(c) | | | | | | | | | 0.17 | % | | | | 18.05 | % | | | | 4.44 | % | | | | 0.45 | % | | | | 8.41 | % |
| | | | | | | |
| Ratios (to average net assets)/Supplemental Data: | | | | | | | | | | | | | | | | | | | | | | | | | | | | | | | | | | | |
| | | | | | | |
Net investment income (loss) | | | | 1.93 | %†† | | | | | | | | | 1.69 | % | | | | 1.70 | % | | | | 1.62 | % | | | | 1.60 | % | | | | 1.61 | % |
| | | | | | | |
Net expenses (d) | | | | 0.83 | %†† | | | | | | | | | 0.83 | % | | | | 0.83 | % | | | | 0.84 | % | | | | 0.83 | % | | | | 0.83 | % |
| | | | | | | |
Expenses (before waiver/reimbursement) (d) | | | | 0.83 | %†† | | | | | | | | | 0.83 | %(e) | | | | 0.83 | %(e) | | | | 0.84 | % | | | | 0.83 | % | | | | 0.84 | % |
| | | | | | | |
Portfolio turnover rate | | | | 47 | %(f) | | | | | | | | | 132 | %(f) | | | | 73 | %(f) | | | | 74 | % | | | | 76 | % | | | | 86 | % |
| | | | | | | |
Net assets at end of period (in 000’s) | | | $ | 849,523 | | | | | | | | | $ | 748,653 | | | | $ | 730,439 | | | | $ | 619,849 | | | | $ | 591,626 | | | | $ | 568,868 | |
| ‡ | Less than one cent per share. |
| (a) | Per share data based on average shares outstanding during the period. |
| (b) | Total return does not reflect any deduction of sales charges, mortality and expense charges, contract charges or administrative charges. For periods of less than one year, total return is not annualized. |
| (c) | Total investment return may reflect adjustments to conform to generally accepted accounting principles. |
| (d) | In addition to the fees and expenses which the Portfolio bears directly, it also indirectly bears a pro-rata share of the fees and expenses of the underlying funds in which it invests. Such indirect expenses are not included in the above expense ratios. |
| (e) | Expense waiver/reimbursement less than 0.01%. |
| (f) | The portfolio turnover rate not including mortgage dollar rolls were 39%, 103% and 66% for the six months ended June 30, 2019 and for the years ended December 31, 2018 and 2017, respectively. |
| | | | | | |
The notes to the financial statements are an integral part of,
and should be read in conjunction with, the financial statements. | | | | | 27 | |
Notes to Financial Statements(Unaudited)
Note 1–Organization and Business
MainStay VP Funds Trust (the “Fund”) was organized as a Delaware statutory trust on February 1, 2011. The Fund is registered under the Investment Company Act of 1940, as amended (the “1940 Act”), as an open-end management investment company. The Fund is comprised of thirty-one separate series (collectively referred to as the “Portfolios”). These financial statements and notes relate to the MainStay VP Janus Henderson Balanced Portfolio (the “Portfolio”), a “diversified” portfolio, as that term is defined in the 1940 Act, as interpreted or modified by regulatory authorities having jurisdiction, from time to time.
Shares of the Portfolio are currently offered to certain separate accounts to fund variable annuity policies and variable universal life insurance policies issued by New York Life Insurance and Annuity Corporation (“NYLIAC”), awholly-owned subsidiary of New York Life Insurance Company (“New York Life”) and may also be offered to fund variable annuity policies and variable universal life insurance policies issued by other insurance companies. NYLIAC allocates shares of the Portfolios to, among others, certain NYLIAC separate accounts. Shares of the Portfolio are also offered to the MainStay VP Conservative Allocation Portfolio, MainStay VP Moderate Allocation Portfolio, MainStay VP Moderate Growth Allocation Portfolio and MainStay VP Growth Allocation Portfolio, which operate as “funds-of-funds.”
The Portfolio currently offers two classes of shares. Initial Class and Service Class shares commenced operations on February 17, 2012. Shares of the Portfolio are offered and are redeemed at a price equal to their respective net asset value (“NAV”) per share. No sales or redemption charge is applicable to the purchase or redemption of the Portfolio’s shares. Under the terms of the Fund’s multiple class plan adopted pursuant to Rule 18f-3 under the 1940 Act, the classes differ in that, among other things, Service Class shares of the Portfolio pay a combined distribution and service fee of 0.25% of average daily net assets attributable to Service Class shares of the Portfolio to the Distributor (as defined in Note 3(B)) pursuant to a plan adopted in accordance with Rule 12b-1 under the 1940 Act. Contract owners of variable annuity contracts purchased after June 2, 2003, are permitted to invest only in the Service Class shares.
The Portfolio’s investment objective is to seeklong-term capital growth, consistent with preservation of capital and balanced by current income.
Note 2–Significant Accounting Policies
The Portfolio is an investment company and accordingly follows the investment company accounting and reporting guidance of the Financial Accounting Standards Board (“FASB”) Accounting Standard CodificationTopic 946 Financial Services—Investment Companies. The Portfolio prepares its financial statements in accordance with generally accepted accounting principles (“GAAP”) in the United States of America and follows the significant accounting policies described below.
(A) Securities Valuation. Investments are usually valued as of the close of regular trading on the New York Stock Exchange (the “Exchange”) (usually 4:00 p.m. Eastern time) on each day the Portfolio is open for business (“valuation date”).
The Board of Trustees of the Fund (the “Board”) adopted procedures establishing methodologies for the valuation of the Portfolio’s securities
and other assets and delegated the responsibility for valuation determinations under those procedures to the Valuation Committee of the Fund (the “Valuation Committee”). The Board authorized the Valuation Committee to appoint a Valuation Subcommittee (the “Subcommittee”) to deal in the first instance with establishing the prices of securities for which market quotations are not readily available or the prices of which are not otherwise readily determinable under these procedures. The Subcommittee meets (in person, via electronic mail or via teleconference) on an as-needed basis. Subsequently, the Valuation Committee meets to ensure that actions taken by the Subcommittee were appropriate. The procedures state that, subject to the oversight of the Board and unless otherwise noted, the responsibility for theday-to-day valuation of portfolio assets (including fair value measurements for the Portfolio’s assets and liabilities) rests with New York Life Investment Management LLC (“New York Life Investments” or the “Manager”), aided to whatever extent necessary by the Subadvisor (as defined in Note 3(A)).
To assess the appropriateness of security valuations, the Manager, the Subadvisor or the Portfolio’s third-party service provider, who is subject to oversight by the Manager, regularly compares prior day prices, prices on comparable securities and the sale prices to the prior and current day prices and challenges prices with changes exceeding certain tolerance levels with third-party pricing services or broker sources. For those securities valued through either a standardized fair valuation methodology or a fair valuation measurement, the Subcommittee deals in the first instance with such valuation and the Valuation Committee reviews and affirms, if appropriate, the reasonableness of the valuation based on such methodologies and measurements on a regular basis after considering information that is reasonably available and deemed relevant by the Valuation Committee. Any action taken by the Subcommittee with respect to the valuation of a portfolio security or other asset is submitted for review and ratification (if appropriate) to the Valuation Committee and the Board at the next regularly scheduled meeting.
“Fair value” is defined as the price the Portfolio would reasonably expect to receive upon selling an asset or liability in an orderly transaction to an independent buyer in the principal or most advantageous market for the asset or liability. Fair value measurements are determined within a framework that establishes a three-tier hierarchy which maximizes the use of observable market data and minimizes the use of unobservable inputs to establish a classification of fair value measurements for disclosure purposes. “Inputs” refer broadly to the assumptions that market participants would use in pricing the asset or liability, including assumptions about risk, such as the risk inherent in a particular valuation technique used to measure fair value using a pricing model and/or the risk inherent in the inputs for the valuation technique. Inputs may be observable or unobservable. Observable inputs reflect the assumptions market participants would use in pricing the asset or liability based on market data obtained from sources independent of the Portfolio. Unobservable inputs reflect the Portfolio’s own assumptions about the assumptions market participants would use in pricing the asset or liability based on the information available. The inputs or methodology used for valuing assets or liabilities may not be an indication of the risks associated with investing in those assets or liabilities. The three-tier hierarchy of inputs is summarized below.
| • | | Level 1—quoted prices in active markets for an identical asset or liability |
| | |
| 28 | | MainStay VP Janus Henderson Balanced Portfolio |
| • | | Level 2—other significant observable inputs (including quoted prices for a similar asset or liability in active markets, interest rates and yield curves, prepayment speeds, credit risk, etc.) |
| • | | Level 3—significant unobservable inputs (including the Portfolio’s own assumptions about the assumptions that market participants would use in measuring fair value of an asset or liability) |
The level of an asset or liability within the fair value hierarchy is based on the lowest level of an input, both individually and in the aggregate, that is significant to the fair value measurement. As of June 30, 2019, the aggregate value by input level of the Portfolio’s assets and liabilities is included at the end of the Portfolio’s Portfolio of Investments.
The Portfolio may use third-party vendor evaluations, whose prices may be derived from one or more of the following standard inputs, among others:
| | |
• Benchmark yields | | • Reported trades |
• Broker/dealer quotes | | • Issuer spreads |
• Two-sided markets | | • Benchmark securities |
• Bids/offers | | • Reference data (corporate actions or material event notices) |
• Industry and economic events | | • Comparable bonds |
• Monthly payment information | | |
An asset or liability for which market values cannot be measured using the methodologies described above is valued by methods deemed reasonable in good faith by the Valuation Committee, following the procedures established by the Board, to represent fair value. Under these procedures, the Portfolio generally uses a market-based approach which may use related or comparable assets or liabilities, recent transactions, market multiples, book values and other relevant information. The Portfolio may also use an income-based valuation approach in which the anticipated future cash flows of the asset or liability are discounted to calculate fair value. Discounts may also be applied due to the nature and/or duration of any restrictions on the disposition of the asset or liability. Fair value represents a good faith approximation of the value of a security. Fair value determinations involve the consideration of a number of subjective factors, an analysis of applicable facts and circumstances and the exercise of judgment. As a result, it is possible that the fair value for a security determined in good faith in accordance with the Portfolio’s valuation procedures may differ from valuations for the same security determined by other funds using their own valuation procedures. Although the Portfolio’s valuation procedures are designed to value a security at the price the Portfolio may reasonably expect to receive upon the security’s sale in an orderly transaction, there can be no assurance that any fair value determination thereunder would, in fact, approximate the amount that the Portfolio would actually realize upon the sale of the security or the price at which the security would trade if a reliable market price were readily available. During the six-month period ended June 30, 2019, there were no material changes to the fair value methodologies.
Securities which may be valued in this manner include, but are not limited to: (i) a security for which trading has been halted or suspended; (ii) a debt security that has recently gone into default and for which there is not a current market quotation; (iii) a security of an issuer that has entered into a restructuring; (iv) a security that has been delisted
from a national exchange; (v) a security for which the market price is not readily available from a third-party pricing source or, if so provided, does not, in the opinion of the Manager or the Subadvisor, reflect the security’s market value; (vi) a security subject to trading collars for which no or limited trading takes place; and (vii) a security whose principal market has been temporarily closed at a time when, under normal conditions, it would be open. Securities valued in this manner are generally categorized as Level 3 in the hierarchy. As of June 30, 2019, there were no securities held by the Portfolio that were fair valued in such a manner.
Equity securities are valued at the last quoted sales prices as of the close of regular trading on the relevant exchange on each valuation date. Securities that are not traded on the valuation date are valued at the mean of the last quoted bid and ask prices. Prices are normally taken from the principal market in which each security trades. These securities are generally categorized as Level 1 in the hierarchy.
Investments in mutual funds, including money market funds, are valued at their respective NAVs as of the close of the Exchange on the valuation date. These securities are generally categorized as Level 1 in the hierarchy.
Debt securities (other than convertible and municipal bonds) are valued at the evaluated bid prices (evaluated mean prices in the case of convertible and municipal bonds) supplied by a pricing agent or brokers selected by the Manager, in consultation with the Subadvisor. The evaluations are market-based measurements processed through a pricing application and represents the pricing agent’s good faith determination as to what a holder may receive in an orderly transaction under market conditions. The rules based logic utilizes valuation techniques that reflect participants’ assumptions and vary by asset class and per methodology, maximizing the use of relevant observable data including quoted prices for similar assets, benchmark yield curves and market corroborated inputs. The evaluated bid or mean prices are deemed by the Manager, in consultation with the Subadvisor, to be representative of market values at the regular close of trading of the Exchange on each valuation date. Debt securities purchased on a delayed delivery basis are marked to market daily until settlement at the forward settlement date. Debt securities, including corporate bonds, U.S. government and federal agency bonds, municipal bonds, foreign bonds, convertible bonds, asset-backed securities and mortgage-backed securities are generally categorized as Level 2 in the hierarchy.
Loan assignments, participations and commitments are valued at the average of bid quotations obtained from the engaged independent pricing service and are generally categorized as Level 2 in the hierarchy. Certain loan assignments, participations and commitments may be valued by utilizing significant unobservable inputs obtained from the pricing service and are generally categorized as Level 3 in the hierarchy.
Temporary cash investments acquired in excess of 60 days to maturity at the time of purchase are valued using the latest bid prices or using valuations based on a matrix system (which considers such factors as security prices, yields, maturities and ratings), both as furnished by independent pricing services. Other temporary cash investments which mature in 60 days or less at the time of purchase (“Short-Term Investments”) are valued using the amortized cost method of valuation, unless the use of such method would be inappropriate. The amortized
Notes to Financial Statements(Unaudited) (continued)
cost method involves valuing a security at its cost on the date of purchase and thereafter assuming a constant amortization to maturity of the difference between such cost and the value on maturity date. Amortized cost approximates the current fair value of a security. Securities valued using the amortized cost method are not valued using quoted prices in an active market and are generally categorized as Level 2 in the hierarchy.
The information above is not intended to reflect an exhaustive list of the methodologies that may be used to value portfolio investments. The valuation procedures permit the use of a variety of valuation methodologies in connection with valuing portfolio investments. The methodology used for a specific type of investment may vary based on the market data available or other considerations. The methodologies summarized above may not represent the specific means by which portfolio investments are valued on any particular business day.
(B) Income Taxes. The Portfolio’s policy is to comply with the requirements of the Internal Revenue Code of 1986, as amended (the “Internal Revenue Code”), applicable to regulated investment companies and to distribute all of its taxable income to the shareholders of the Portfolio within the allowable time limits. Therefore, no federal, state and local income tax provisions are required.
Management evaluates the Portfolio’s tax positions to determine if the tax positions taken meet the minimum recognition threshold in connection with accounting for uncertainties in income tax positions taken or expected to be taken for the purposes of measuring and recognizing tax liabilities in the financial statements. Recognition of tax benefits of an uncertain tax position is permitted only to the extent the position is “more likely than not” to be sustained assuming examination by taxing authorities. Management has analyzed the Portfolio’s tax positions taken on federal, state and local income tax returns for all open tax years (for up to three tax years) and has concluded that no provisions for federal, state and local income tax are required in the Portfolio’s financial statements. The Portfolio’s federal, state and local income tax and federal excise tax returns for tax years for which the applicable statutes of limitations have not expired are subject to examination by the Internal Revenue Service and state and local departments of revenue.
(C) Dividends and Distributions to Shareholders. Dividends and distributions are recorded on the ex-dividend date. The Portfolio intends to declare and pay dividends from net investment income and distributions from net realized capital and currency gains, if any, at least annually. Unless the shareholder elects otherwise, all dividends and distributions are reinvested in the same class of shares of the Portfolio, at NAV. Dividends and distributions to shareholders are determined in accordance with federal income tax regulations and may differ from determinations using GAAP.
(D) Security Transactions and Investment Income. The Portfolio records security transactions on the trade date. Realized gains and losses on security transactions are determined using the identified cost method. Dividend income is recognized on the ex-dividend date; net of any foreign tax withheld at the source, and interest income is accrued as earned using the effective interest rate method and includes any realized gains and losses from repayments of principal on mortgage-backed securities. Discounts and premiums on securities purchased for the Portfolio are accreted and amortized, respectively, on
the effective interest rate method over the life of the respective securities.
Investment income and realized and unrealized gains and losses on investments of the Portfolio are allocated pro rata to the separate classes of shares based upon their relative net assets on the date the income is earned or realized and unrealized gains and losses are incurred.
The Portfolio may place a debt security on non-accrual status and reduce related interest income by ceasing current accruals and writing off all or a portion of any interest receivables when the collection of all or a portion of such interest has become doubtful. A debt security is removed from non-accrual status when the issuer resumes interest payments or when collectability of interest is reasonably assured.
(E) Expenses. Expenses of the Fund are allocated to the individual Portfolios in proportion to the net assets of the respective Portfolios when the expenses are incurred, except where direct allocations of expenses can be made. Expenses (other than fees incurred under the distribution and service plans, further discussed in Note 3(B), which are charged directly to the Service Class shares) are allocated to separate classes of shares pro rata based upon their relative net assets on the date the expenses are incurred. The expenses borne by the Portfolio, including those of related parties to the Portfolio, are shown in the Statement of Operations.
Additionally, the Portfolio may invest in mutual funds, which are subject to management fees and other fees that may cause the costs of investing in mutual funds to be greater than the costs of owning the underlying securities directly. These indirect expenses of mutual funds are not included in the amounts shown as expenses in the Portfolio’s Statement of Operations or in the expense ratios included in the Financial Highlights.
(F) Use of Estimates. In preparing financial statements in conformity with GAAP, management makes estimates and assumptions that affect the reported amounts and disclosures in the financial statements. Actual results could differ from those estimates.
(G) Repurchase Agreements. The Portfolio may enter into repurchase agreements (i.e., buy a security from another party with the agreement that it be sold back in the future) to earn income. The Portfolio may enter into repurchase agreements only with counterparties, usually financial institutions, that are deemed by the Manager or the Subadvisor to be creditworthy, pursuant to guidelines established by the Board. During the term of any repurchase agreement, the Manager or the Subadvisor will continue to monitor the creditworthiness of the counterparty. Under the 1940 Act, repurchase agreements are considered to be collateralized loans by the Portfolio to the counterparty secured by the securities transferred to the Portfolio.
Repurchase agreements are subject to counterparty risk, meaning the Portfolio could lose money by the counterparty’s failure to perform under the terms of the agreement. The Portfolio mitigates this risk by ensuring the repurchase agreement is collateralized by cash, U.S. government securities, fixed income securities and/or other securities. The collateral is held by the Portfolio’s custodian and valued daily on a mark to market basis to determine if the value, including accrued interest, exceeds the repurchase price. In the event of the counter-
| | |
| 30 | | MainStay VP Janus Henderson Balanced Portfolio |
party’s default on the obligation to repurchase, the Portfolio has the right to liquidate the collateral and apply the proceeds in satisfaction of the obligation. Under certain circumstances, such as in the event of default or bankruptcy by the counterparty, realization and/or retention of the collateral may be limited or subject to delay, to legal proceedings and possible realized loss to the Portfolio. As of June 30, 2019, the Portfolio did not hold any repurchase agreements.
(H) Loan Assignments, Participations and Commitments. The Portfolio may invest in loan assignments and participations (“loans”). Commitments are agreements to make money available to a borrower in a specified amount, at a specified rate and within a specified time. The Portfolio records an investment when the borrower withdraws money on a commitment or when a funded loan is purchased (trade date) and records interest as earned. These loans pay interest at rates that are periodically reset by reference to a base lending rate plus a spread. These base lending rates are generally the prime rate offered by a designated U.S. bank or the London Interbank Offered Rate (“LIBOR”).
The loans in which the Portfolio may invest are generally readily marketable, but may be subject to some restrictions on resale. For example, the Portfolio may be contractually obligated to receive approval from the agent bank and/or borrower prior to the sale of these investments. If the Portfolio purchases an assignment from a lender, the Portfolio will generally have direct contractual rights against the borrower in favor of the lender. If the Portfolio purchases a participation interest either from a lender or a participant, the Portfolio typically will have established a direct contractual relationship with the seller of the participation interest, but not with the borrower. Consequently, the Portfolio is subject to the credit risk of the lender or participant who sold the participation interest to the Portfolio, in addition to the usual credit risk of the borrower. In the event that the borrower, selling participant or intermediate participants become insolvent or enter into bankruptcy, the Portfolio may incur certain costs and delays in realizing payment, or may suffer a loss of principal and/or interest.
Unfunded commitments represent the remaining obligation of the Portfolio to the borrower. At any point in time, up to the maturity date of the issue, the borrower may demand the unfunded portion. Unfunded amounts, if any, are marked to market and any unrealized gains or losses are recorded in the Statement of Assets and Liabilities. As of June 30, 2019, the Portfolio did not hold any unfunded commitments.
(I) Securities Lending. In order to realize additional income, the Portfolio may engage in securities lending, subject to the limitations set forth in the 1940 Act and relevant guidance by the staff of the Securities and Exchange Commission (“SEC”). In the event the Portfolio does engage in securities lending, the Portfolio will lend through its custodian, State Street Bank and Trust Company (“State Street”), acting as securities lending agent on behalf of the Portfolio. State Street will manage the Portfolio’s collateral in accordance with the securities lending agency agreement between the Portfolio and State Street, and indemnify the Portfolio against counterparty risk. The loans will be collateralized by cash (which may be invested in a money market fund) and/ornon-cash collateral (which may include, U.S. Treasury securities and/or U.S. Government Agency securities issued or guaranteed by the United States government or its agencies or instrumentalities) at least equal at all times to the market value of the securities loaned. The Portfolio may bear the risk of delay in recovery of, or loss of rights in,
the securities loaned should the borrower of the securities experience financial difficulty. The Portfolio may also record a realized gain or loss on securities deemed sold due to a borrower’s inability to return securities on loan. The Portfolio bears the risk of any loss on investment of cash collateral. The Portfolio will receive compensation for lending its securities in the form of fees or it will retain a portion of interest on the investment of any cash collateral. The Portfolio will also continue to receive interest and dividends on the securities loaned and any gain or loss in the market price of the securities loaned that may occur during the term of the loan will be for the account of the Portfolio. Income earned from securities lending activities, if any, is reflected in the Statement of Operations. As of June 30, 2019, the Portfolio had securities on loan with an aggregate market value of $1,815,828; the total market value of collateral held by the Portfolio was $1,859,242. The market value of the collateral held includednon-cash collateral in the form of U.S. Treasury securities with a value of $53,797 and cash collateral which was invested into the State Street Navigator Securities Lending Government Money Market Portfolio with a value of $1,805,445.
(J) Debt Securities and Loan Risk. The ability of issuers of debt securities held by the Portfolio to meet their obligations may be affected by, among other things, economic or political developments in a specific country, industry or region. Debt securities are also subject to the risks associated with changes in interest rates.
The Portfolio may invest in high-yield debt securities (sometimes called “junk bonds”), which are generally considered speculative because they present a greater risk of loss, including default, than higher rated debt securities. These securities pay investors a premium—a higher interest rate or yield than investment grade debt securities—because of the increased risk of loss. These securities can also be subject to greater price volatility. In times of unusual or adverse market, economic or political conditions, these securities may experience higher than normal default rates.
The Portfolio’s investments may include loans which are usually rated below investment grade and are generally considered speculative because they present a greater risk of loss, including default, than higher rated debt securities. These investments pay investors a higher interest rate than investment grade debt securities because of the increased risk of loss. Although certain loans are collateralized, there is no guarantee that the value of the collateral will be sufficient to repay the loan. In a recession or serious credit event, the value of these investments could decline significantly. As a result, the Portfolio’s NAVs could go down and you could lose money.
In addition, loans generally are subject to extended settlement periods that may be longer than seven days. As a result, the Portfolio may be adversely affected by selling other investments at an unfavorable time and/or under unfavorable conditions or engaging in borrowing transactions, such as borrowing against its credit facility, to raise cash to meet redemption obligations or pursue other investment opportunities.
(K) Foreign Securities Risk. The Portfolio may invest in foreign securities, which carry certain risks that are in addition to the usual risks inherent in domestic securities. These risks include those resulting from currency fluctuations, future adverse political or economic developments and possible imposition of currency exchange blockages or other foreign
Notes to Financial Statements(Unaudited) (continued)
governmental laws or restrictions. These risks are likely to be greater in emerging markets than in developed markets. The ability of issuers of securities held by the Portfolio to meet their obligations may be affected by, among other things, economic or political developments in a specific country, industry or region.
(L) Indemnifications. Under the Fund’s organizational documents, its officers and trustees are indemnified against certain liabilities that may arise out of performance of their duties to the Fund. Additionally, in the normal course of business, the Portfolio enters into contracts with third-party service providers that contain a variety of representations and warranties and which may provide general indemnifications. The Portfolio’s maximum exposure under these arrangements is unknown, as this would involve future claims that may be made against the Portfolio that have not yet occurred. Based on experience, management is of the view that the risk of loss in connection with these potential indemnification obligations is remote. However, there can be no assurance that material liabilities related to such obligations will not arise in the future, which could adversely impact the Portfolio.
Note 3–Fees and Related Party Transactions
(A) Manager and Subadvisor. New York Life Investments, a registered investment adviser and an indirect,wholly-owned subsidiary of New York Life, serves as the Portfolio’s Manager pursuant to an Amended and Restated Management Agreement (“Management Agreement”). The Manager provides offices, conducts clerical, recordkeeping and bookkeeping services, and keeps most of the financial and accounting records required to be maintained by the Portfolio. Except for the portion of salaries and expenses that are the responsibility of the Portfolio, the Manager pays the salaries and expenses of all personnel affiliated with the Portfolio and certain operational expenses of the Portfolio. The Portfolio reimburses New York Life Investments in an amount equal to a portion of the compensation of the Chief Compliance Officer attributable to the Portfolio. Janus Capital Management LLC (“Janus” or “Subadvisor”), a registered investment adviser and wholly- owned subsidiary of Janus Henderson Group PLC, doing business as Janus Henderson Investors, serves as Subadvisor to the Portfolio and is responsible for theday-to-day portfolio management of the Portfolio. Pursuant to the terms of a Subadvisory Agreement (“Subadvisory Agreement”) between New York Life Investments and Janus. New York Life Investments pays for the services of the Subadvisor.
The Fund, on behalf of the Portfolio, pays New York Life Investments in its capacity as the Portfolio’s investment manager and administrator, pursuant to the Management Agreement, a monthly fee for the services performed and the facilities furnished at an annual rate of the average daily net assets as follows: 0.55% up to $1 billion; 0.525% from $1 billion to $2 billion; and 0.515% in excess of $2 billion. During the six-month period ended June 30, 2019, the effective management fee rate was 0.55% (exclusive of any applicable waivers/reimbursements).
During the six-month period ended June 30, 2019, New York Life Investments earned fees from the Portfolio in the amount of $3,248,898, and paid the Subadvisor in the amount of $1,512,854.
State Street providessub-administration andsub-accounting services to the Portfolio pursuant to an agreement with New York Life Investments. These services include calculating the daily NAVs of the Portfolio, maintaining the general ledger andsub-ledger accounts for the calculation of the Portfolio’s NAVs and assisting New York Life Investments in conducting various aspects of the Portfolio’s administrative operations. For providing these services to the Portfolio, State Street is compensated by New York Life Investments.
Pursuant to an agreement between the Fund and New York Life Investments, New York Life Investments is responsible for providing or procuring certain regulatory reporting services for the Portfolio. The Portfolio will reimburse New York Life Investments for the actual costs incurred by New York Life Investments in connection with providing or procuring these services for the Portfolio.
(B) Distribution and Service Fees. The Fund, on behalf of the Portfolio, has entered into a distribution agreement with NYLIFE Distributors LLC (the “Distributor”), an indirect,wholly-owned subsidiary of New York Life. The Portfolio has adopted a distribution plan (the “Plan”) in accordance with the provisions of Rule 12b-1 under the 1940 Act. Under the Plan, the Distributor has agreed to provide, through its affiliates or independent third parties, various distribution-related, shareholder and administrative support services to the Service Class shareholders. For its services, the Distributor is entitled to a combined distribution and service fee accrued daily and paid monthly at an annual rate of 0.25% of the average daily net assets attributable to the Service Class shares of the Portfolio.
(C) Investments in Affiliates (in 000’s). During the six-month period ended June 30, 2019, purchases and sales transactions, income earned from investments and shares held of investment companies managed by New York Life Investments or its affiliates were as follows:
| | | | | | | | | | | | | | | | | | | | | | | | | | | | | | | | | | | | |
Affiliated Investment
Company | | Value,
Beginning
of Period | | | Purchases
at Cost | | | Proceeds
from Sales | | | Net
Realized
Gain/(Loss)
on Sales | | | Change in
Unrealized
Appreciation/
(Depreciation) | | | Value,
End of
Period | | | Dividend
Income | | | Other
Distributions | | | Shares
End of
Period | |
MainStay U.S. Government Liquidity Fund | | $ | 7,540 | | | $ | 198,937 | | | $ | (184,033 | ) | | $ | — | | | $ | — | | | $ | 22,444 | | | $ | 178 | | | $ | — | | | | 22,444 | |
| | |
| 32 | | MainStay VP Janus Henderson Balanced Portfolio |
Note 4–Federal Income Tax
As of June 30, 2019, the cost and unrealized appreciation (depreciation) of the Portfolio’s investment portfolio, including applicable derivative contracts and other financial instruments, as determined on a federal income tax basis, were as follows:
| | | | | | | | | | | | | | | | |
| | | Federal Tax
Cost | | | Gross
Unrealized
Appreciation | | | Gross
Unrealized
(Depreciation) | | | Net
Unrealized
Appreciation/
(Depreciation) | |
Investments in Securities | | $ | 1,044,040,055 | | | $ | 231,957,083 | | | $ | (15,287,257 | ) | | $ | 216,669,826 | |
During the year ended December 31, 2018, the tax character of distributions paid as reflected in the Statements of Changes in Net Assets was as follows:
| | |
|
| 2018 |
Tax-Based
Distributions
from Ordinary
Income | | Tax-Based
Distributions
from Long-Term
Gains |
| |
| $24,613,607 | | $58,505,789 |
Note 5–Custodian
State Street is the custodian of cash and securities held by the Portfolio. Custodial fees are charged to the Portfolio based on the Portfolio’s net assets and/or the market value of securities held by the Portfolio and the number of certain transactions incurred by the Portfolio.
Note 6–Line of Credit
The Portfolio and certain other funds managed by New York Life Investments maintain a line of credit with a syndicate of banks in order to secure a source of funds for temporary purposes to meet unanticipated or excessive redemption requests.
Effective July 30, 2019, under the credit agreement (the “Credit Agreement”), the aggregate commitment amount is $600,000,000 with an additional uncommitted amount of $100,000,000. The commitment fee is an annual rate of 0.15% of the average commitment amount payable quarterly, regardless of usage, to State Street, who serves as the agent to the syndicate. The commitment fee is allocated among the Portfolio and certain other funds managed by New York Life Investments based upon their respective net assets and other factors. Interest on any revolving credit loan is charged based upon the Federal Funds Rate or the one-month London Interbank Offered Rate (“LIBOR”), whichever is higher. The Credit Agreement expires on July 28, 2020, although the Portfolio, certain other funds managed by New York Life Investments and the syndicate of banks may renew the Credit Agreement for an additional year on the same or different terms. Prior to July 30, 2019, the aggregate commitment amount and the commitment fee were the same as those under the current Credit Agreement. During the six-month period ended June 30, 2019, there were no borrowings made or outstanding with respect to the Portfolio under the Credit Agreement.
Note 7–Interfund Lending Program
Pursuant to an exemptive order issued by the SEC, the Portfolio, along with certain other funds managed by New York Life Investments, may
participate in an interfund lending program. The interfund lending program provides an alternative credit facility that permits the Portfolio and certain other funds managed by New York Life Investments to lend or borrow money for temporary purposes directly to or from one another subject to the conditions of the exemptive order. During the six-month period ended June 30, 2019, there were no interfund loans made or outstanding with respect to the Portfolio.
Note 8–Purchases and Sales of Securities (in 000’s)
During the six-month period ended June 30, 2019, purchases and sales of U.S. government securities were $310,145 and $383,896, respectively. Purchases and sales of securities, other than U.S. government securities andshort-term securities, were $247,884 and $188,532, respectively.
Note 9–Capital Share Transactions
Transactions in capital shares for the six-month period ended June 30, 2019 and the year ended December 31, 2018, were as follows:
| | | | | | | | |
Initial Class | | Shares | | | Amount | |
| | |
Six-month period ended June 30, 2019: | | | | | | | | |
Shares sold | | | 323,017 | | | $ | 4,255,504 | |
Shares issued to shareholders in reinvestment of dividends and distributions | | | — | | | | — | |
Shares redeemed | | | (2,126,107 | ) | | | (28,248,460 | ) |
| | | | |
Net increase (decrease) | | | (1,803,090 | ) | | $ | (23,992,956 | ) |
| | | | |
Year ended December 31, 2018: | | | | | | | | |
Shares sold | | | 464,139 | | | $ | 6,111,896 | |
Shares issued to shareholders in reinvestment of dividends and distributions | | | 2,165,990 | | | | 28,628,702 | |
Shares redeemed | | | (4,201,707 | ) | | | (56,325,618 | ) |
| | | | |
Net increase (decrease) | | | (1,571,578 | ) | | $ | (21,585,020 | ) |
| | | | |
| | |
| | | | | | | | |
Service Class | | Shares | | | Amount | |
Six-month period ended June 30, 2019: | | | | | | | | |
Shares sold | | | 4,210,212 | | | $ | 55,498,586 | |
Shares issued to shareholders in reinvestment of dividends and distributions | | | — | | | | — | |
Shares redeemed | | | (3,859,045 | ) | | | (51,096,673 | ) |
| | | | |
Net increase (decrease) | | | 351,167 | | | $ | 4,401,913 | |
| | | | |
Year ended December 31, 2018: | | | | | | | | |
Shares sold | | | 8,487,927 | | | $ | 113,245,569 | |
Shares issued to shareholders in reinvestment of dividends and distributions | | | 4,144,315 | | | | 54,490,694 | |
Shares redeemed | | | (7,165,986 | ) | | | (95,535,867 | ) |
| | | | |
Net increase (decrease) | | | 5,466,256 | | | $ | 72,200,396 | |
| | | | |
Note 10–Recent Accounting Pronouncement
To improve the effectiveness of fair value disclosure requirements, the Financial Accounting Standards Board recently issued Accounting Standard Update (ASU)2018-13, Fair Value Measurement Disclosure Framework—Changes to the Disclosure Requirements for Fair Value Measurement (ASU2018-13), which adds, removes, and modifies certain aspects relating to fair value disclosure. ASU2018-13 is effective for interim and annual reporting periods beginning after
Notes to Financial Statements(Unaudited) (continued)
December 15, 2019; early adoption of the additions relating toASU 2018-13 is not required. Management has evaluated the implications of certain other provisions of the ASU and has determined to early adopt aspects related to the removal and modifications of certain fair value measurement disclosures under the ASU effective immediately. At this time, management is evaluating the implications of certain other provisions of the ASU related to new disclosure requirements and any impact on the financial statement disclosures has not yet been determined.
Note 11–Subsequent Events
In connection with the preparation of the financial statements of the Portfolio as of and for the six-month period ended June 30, 2019, events and transactions subsequent to June 30, 2019, through the date the financial statements were issued have been evaluated by the Portfolio’s management for possible adjustment and/or disclosure. No subsequent events requiring financial statement adjustment or disclosure have been identified.
| | |
| 34 | | MainStay VP Janus Henderson Balanced Portfolio |
Proxy Voting Policies and Procedures and Proxy Voting Record
A description of the policies and procedures that New York Life Investments uses to vote proxies related to the Portfolio’s securities is available without charge, upon request, (i) by calling800-598-2019; (ii) by visiting New York Life Investments website at https://www.nylinvestments.com/mainstay/products-and-performance/mainstay-vp-funds-trust; or (iii) by visiting the SEC’s website at www.sec.gov.
The Portfolio is required to file with the SEC its proxy voting record for the12-month period ending June 30 on Form N-PX. The Portfolio’s most recent Form N-PX or proxy voting record is available free of charge upon request (i) by calling800-598-2019; (ii) by visiting New York Life Investments website at https://www.nylinvestments.com/mainstay/products-and-performance/mainstay-vp-funds-trust; or (iii) by visiting the SEC’s website atwww.sec.gov.
Shareholder Reports and Quarterly Portfolio Disclosure
The Portfolio is required to file its complete schedule of portfolio holdings with the SEC 60 days after each fiscal quarter onForm N-PORT. The Portfolio’s holdings report is available without charge upon request, (i) by calling800-598-2019; (ii) by visiting New York Life Investments website at https://www.nylinvestments.com/mainstay/products-and-performance/mainstay-vp-funds-trust; or (iii) on the SEC’s website at www.sec.gov.
MainStay VP Portfolios
MainStay VP offers a wide range of Portfolios. The full array of MainStay VP offerings is listed here, with information about the manager, subadvisors, legal counsel, and independent registered public accounting firm.
Equity Portfolios
MainStay VP Eagle Small Cap Growth Portfolio
MainStay VP Emerging Markets Equity Portfolio
MainStay VP Epoch U.S. Equity Yield Portfolio
MainStay VP Fidelity Institutional AM® Utilities Portfolio†
MainStay VP Large Cap Growth Portfolio
MainStay VP MacKay Common Stock Portfolio
MainStay VP MacKay Growth Portfolio
MainStay VP MacKay International Equity Portfolio
MainStay VP MacKay Mid Cap Core Portfolio
MainStay VP MacKay S&P 500 Index Portfolio
MainStay VP MacKay Small Cap Core Portfolio
MainStay VP Mellon Natural Resources Portfolio
MainStay VP T. Rowe Price Equity Income Portfolio
Mixed Asset Portfolios
MainStay VP Balanced Portfolio
MainStay VP Income Builder Portfolio
MainStay VP Janus Henderson Balanced Portfolio
MainStay VP MacKay Convertible Portfolio
Income Portfolios
MainStay VP Bond Portfolio
MainStay VP Floating Rate Portfolio
MainStay VP Indexed Bond Portfolio
MainStay VP MacKay Government Portfolio
MainStay VP MacKay High Yield Corporate Bond Portfolio
MainStay VP MacKay Unconstrained Bond Portfolio
MainStay VP PIMCO Real Return Portfolio
Money Market
MainStay VP U.S. Government Money Market Portfolio
Alternative
MainStay VP Cushing Renaissance Advantage Portfolio
MainStay VP IQ Hedge Multi-Strategy Portfolio
Asset Allocation Portfolios
MainStay VP Conservative Allocation Portfolio
MainStay VP Growth Allocation Portfolio
MainStay VP Moderate Allocation Portfolio
MainStay VP Moderate Growth Allocation Portfolio
Manager
New York Life Investment Management LLC
New York, New York
Subadvisors
Candriam Belgium*
Brussels, Belgium
Cushing Asset Management, LP
Dallas, Texas
Eagle Asset Management, Inc.
St Petersburg, Florida
Epoch Investment Partners, Inc.
New York, New York
FIAM LLC
Smithfield, Rhode Island
IndexIQ Advisors LLC*
New York, New York
Janus Capital Management LLC
Denver, Colorado
MacKay Shields LLC*
New York, New York
Mellon Investments Corporation
Boston, Massachusetts
NYL Investors LLC*
New York, New York
Pacific Investment Management Company LLC
Newport Beach, California
T. Rowe Price Associates, Inc.
Baltimore, Maryland
Winslow Capital Management, LLC
Minneapolis, Minnesota
Distributor
NYLIFE Distributors LLC*
Jersey City, New Jersey
Custodian
State Street Bank and Trust Company
Boston, Massachusetts
Independent Registered Public Accounting Firm
PricewaterhouseCoopers LLP
New York, New York
Legal Counsel
Dechert LLP
Washington, District of Columbia
Some Portfolios may not be available in all products.
| † | Fidelity Institutional AM is a registered trade mark of FMR LLC. Used with permission. |
| * | An affiliate of New York Life Investment Management LLC |
Not part of the Semiannual Report
2019 Semiannual Report
This report is for the general information of New York Life Variable Annuities and NYLIAC Variable Universal Life Insurance Products policyowners. It must be preceded or accompanied by the appropriate product(s) and funds prospectuses if it is given to anyone who is not an owner of a New York Life variable annuity policy or a NYLIAC Variable Universal Life Insurance Product. This report does not offer for sale or solicit orders to purchase securities.
The performance data quoted in this report represents past performance. Past performance is no guarantee of future results. Due to market volatility and other factors, current performance may be lower or higher than the figures shown. The most recent month-end performance summary for your variable annuity or variable life policy is available by calling 800-598-2019 and is updated periodically on www.newyorklife.com.
The New York Life Variable Annuities and NYLIAC Variable Universal Life Insurance Products are issued by New York Life Insurance and Annuity Corporation (a Delaware Corporation) and distributed by NYLIFE Distributors LLC (Member FINRA/SIPC).
New York Life Insurance Company
New York Life Insurance and Annuity Corporation (NYLIAC) (A Delaware Corporation)
51 Madison Avenue, Room 551
New York, NY 10010
www.newyorklife.com
Printed on recycled paper
nylinvestments.com
NYLIFE Distributors LLC, 30 Hudson Street, Jersey City, NJ 07302
New York Life Investment Management LLC is the investment manager to the MainStay VP Funds Trust
©2019 by NYLIFE Distributors LLC. All rights reserved.
You may obtain copies of the Prospectus and the Statement of Additional Information free of charge, upon request, by callingtoll-free 800-598-2019 or writing to New York Life Insurance and Annuity Corporation, 51 Madison Avenue, New York, NY 10010.
| | | | |
| | | |
| Not FDIC Insured | | No Bank Guarantee | | May Lose Value |
| | | | |
| 1781630 | | | | MSVPJB10-08/19 (NYLIAC) NI524 |
MainStay VP MacKay S&P 500 Index Portfolio
Message from the President and Semiannual Report
Unaudited | June 30, 2019

Beginning on January 1, 2021, as permitted by regulations adopted by the Securities and Exchange Commission, paper copies of the MainStay VP Portfolio annual and semi-annual shareholder reports may no longer be sent by mail, unless you specifically request paper copies of the reports from the insurance company that offers your policy. Instead, the reports will be made available online, and you will be notified by mail each time a report is posted and provided with a website link to access the report. Instructions for requesting paper copies will be provided by your insurance company.
If you already elected to receive shareholder reports electronically, you will not be affected by this change and you need not take any action. At any time, you may elect to receive reports and other communications from the insurance company electronically by following the instructions provided by the insurance company.
You may elect to receive all future shareholder reports in paper form free of charge. You can inform the insurance company that you wish to receive paper copies of reports by following the instructions provided by the insurance company. Your election to receive reports in paper form will apply to all portfolio companies available under your contract.
| | | | | | | | |
| | | | | |
| Not FDIC/NCUA Insured | | Not a Deposit | | May Lose Value | | No Bank Guarantee | | Not Insured by Any Government Agency |

This page intentionally left blank
Message from the President
Most equity and fixed-income markets in the United States and around the world advanced in the face of conflicting political and macroeconomic forces during thesix-month period ended June 30, 2019.
The reporting period began on the heels of tumultuous December 2018, during which equities and equity-sensitive bonds spiked sharply lower on concerns regarding the pace of economic growth, a U.S. government shutdown and the potential impact of trade disputes between the United States and other nations, particularly China. Markets recovered quickly in early 2019 as trade tensions eased, the government reopened and the U.S. Federal Reserve Board (Fed) adopted a more patient tone regarding the future direction of interest rates. Markets moved broadly higher from January through April, supported by encouraging economic data and generally strong corporate earnings.
During the first four months of the reporting period, the improving economic environment encouraged investors to favor areas of the market viewed as offering greater return potential along with higher risks. Among U.S. stocks, cyclical, growth-oriented sectors tended to outperform more defensive, value-oriented sectors, whilelarge-cap stocks outperformed theirsmaller-cap counterparts. Within the S&P 500® Index, the information technology sector led the market’s advance, followed by communication services, consumer discretionary and consumer staples. Industrials, utilities, financials, materials, real estate and energy produced more modest gains. While some international equity markets outperformed or underperformed the U.S. market, on average international stocks mirrored the performance of their U.S. counterparts. Fixed-income securities gained ground as well, albeit along a more gradual trajectory. Among U.S. fixed-income instruments, corporate issues generally outperformed government bonds, with lower credit quality, higher yielding securities leading the sector’s advance. Long-term U.S. Treasury bond yields proved particularly weak, with
10-year yields dipping at times below3-month yields, reflecting investors’ continued concerns about domestic economic growth.
May 2019 saw a return of uncertainty and volatility. Trade discussions between the United States and China faltered, driving global equity prices lower. Government bond prices rose as investors sought safe havens. June brought yet anotherU-turn as equity prices climbed again after comments from the Fed raised hopes of an interest rate cut in response to weak economic data. Stock and bond prices rose, with U.S. equity markets ending the reporting period in record territory.
We are pleased to see renewed signs of strength in broad areas of the financial market. At the same time, we remained sharply focused on providing you, as a MainStay VP investor, with the experienced and disciplined fund management that we believe underpins an effective, long-term investment strategy. Whatever tomorrow’s investment environment brings, you can rely on our portfolio managers to pursue the objectives of their individual Portfolios as outlined in the prospectus with the energy and dedication you have come to expect.
The report that follows contains additional information on the market events, investment decisions and specific securities that shaped your VP Portfolio’s performance during the six months ended June 30, 2019. We encourage you to read the report carefully and use it to evaluate your Portfolio’s performance in light of your long-range financial plan.
Sincerely,

Kirk C. Lehneis
President
The opinions expressed are as of the date of this report and are subject to change. There is no guarantee that any forecast made will come to pass. This material does not constitute investment advice and is not intended as an endorsement of any specific investment. Past performance is no guarantee of future results.
Not part of the Semiannual Report
Table of Contents
Investors should refer to the Portfolio’s Summary Prospectus and/or Prospectus and consider the Portfolio’s investment objectives, strategies, risks, charges and expenses carefully before investing. The Summary Prospectus and/or Prospectus contain this and other information about the Portfolio. You may obtain copies of the Portfolio’s Summary Prospectus and/or the Prospectus and the Statement of Additional Information free of charge, upon request, by calling toll-free 800-598-2019, by writing to New York Life Insurance and Annuity Corporation, 51 Madison Avenue, Room 251, New York, New York 10010 or by sending an email to MainStayShareholdersServices@nylim.com. These documents are also available at nylinvestments.com/vpdocuments. Please read the Summary Prospectus and/or Prospectus carefully before investing. MainStay VP Funds Trust portfolios are separate account options which are purchased through a variable insurance or variable annuity contract.
Investment and Performance Comparison1(Unaudited)
Performance data quoted represents past performance. Past performance is no guarantee of future results. Because of market volatility and other factors, current performance may be lower or higher than the figures shown. Investment return and principal value will fluctuate, and as a result, when shares are redeemed, they may be worth more or less than their original cost. The performance table and graph do not reflect any deduction of sales charges, mortality and expense charges, contract charges or administrative charges. Please refer to the Performance Summary appropriate for your policy. For performance information current to the most recent month-end, please call800-598-2019 or visit www.newyorklife.com.

Average Annual Total Returns for the Period-Ended June 30, 2019
| | | | | | | | | | | | | | | | | | | | | | |
| Class | | Inception
Date | | Six Months | | | One Year | | | Five Years | | | Ten Years | | | Gross
Expense
Ratio2 | |
| | | | | | |
Initial Class Shares | | 1/29/1993 | | | 18.44 | % | | | 10.26 | % | | | 10.44 | % | | | 14.40 | % | | | 0.16 | % |
Service Class Shares | | 6/5/2003 | | | 18.29 | | | | 9.99 | | | | 10.16 | | | | 14.11 | | | | 0.41 | |
| | | | | | | | | | | | | | | | |
| Benchmark Performance | | Six
Months | | | One
Year | | | Five
Years | | | Ten
Years | |
| | | | |
S&P 500® Index3 | | | 18.54 | % | | | 10.42 | % | | | 10.71 | % | | | 14.70 | % |
Morningstar Large Blend Category Average4 | | | 17.21 | | | | 8.20 | | | | 8.76 | % | | | 13.24 | |
| 1. | Performance figures may reflect certain fee waivers and/or expense limitations, without which total returns may have been different. For information on current fee waivers and/or expense limitations (if any), please refer to the Notes to Financial Statements. |
| 2. | The gross expense ratios presented reflect the Portfolio’s “Total Annual Portfolio Operating Expenses” from the most recent Prospectus, as supplemented, and may differ from other expense ratios disclosed in this report. |
| 3. | The S&P 500® Index is the Portfolio’s primary broad-based securities market index for comparison purposes. “S&P 500®” Index is a trademark of The McGraw-Hill Companies, Inc. The S&P 500® Index is widely regarded as the standard index for measuringlarge-cap U.S. stock market performance. |
| | Results assume reinvestment of all dividends and capital gains. An investment cannot be made directly in an index. |
| 4. | The Morningstar Large Blend Category Average is representative of funds that represent the overall US stock market in size, growth rates and price. Stocks in the top 70% of the capitalization of the US equity market are defined as large cap. The blend style is assigned to funds where neither growth nor value characteristics predominate. These funds tend to invest across the spectrum of US industries, and owing to their broad exposure, the funds’ returns are often similar to those of the S&P 500 Index. Results are based on average total returns of similar funds with all dividends and capital gain distributions reinvested. |
Cost in Dollars of a $1,000 Investment in MainStay VP MacKay S&P 500 Index Portfolio (Unaudited)
The example below is intended to describe the fees and expenses borne by shareholders during the six-month period from January 1, 2019, to June 30, 2019, and the impact of those costs on your investment.
Example
As a shareholder of the Portfolio you incur two types of costs: (1) transaction costs, including exchange fees and sales charges (loads) on purchases (as applicable), and (2) ongoing costs, including management fees, distribution and/or service (12b-1) fees, and other Portfolio expenses (as applicable). This example is intended to help you understand your ongoing costs (in dollars) of investing in the Portfolio and to compare these costs with the ongoing costs of investing in other mutual funds. The example is based on an investment of $1,000 made at the beginning of the six-month period and held for the entire period from January 1, 2019, to June 30, 2019. Shares are only sold in connection with variable life and annuity contracts and the example does not reflect any contract level or transactional fees or expenses. If these costs had been included, your costs would have been higher.
This example illustrates your Portfolio’s ongoing costs in two ways:
Actual Expenses
The second and third data columns in the table below provide information about actual account values and actual expenses. You may use the information in these columns, together with the amount you invested, to estimate the expenses that you paid during the six months ended June 30, 2019. Simply divide your account value by $1,000
(for example, an $8,600 account value divided by $1,000 = 8.6), then multiply the result by the number under the heading entitled “Expenses Paid During Period” to estimate the expenses you paid on your account during this period.
Hypothetical Example for Comparison Purposes
The fourth and fifth data columns in the table below provide information about hypothetical account values and hypothetical expenses based on the Portfolio’s actual expense ratio and an assumed rate of return of 5% per year before expenses, which is not the Portfolio’s actual return. The hypothetical account values and expenses may not be used to estimate the actual ending account balances or expenses you paid for thesix-month period shown. You may use this information to compare the ongoing costs of investing in the Portfolio with the ongoing costs of investing in other mutual funds. To do so, compare this 5% hypothetical example with the 5% hypothetical examples that appear in the shareholder reports of the other mutual funds.
Please note that the expenses shown in the table are meant to highlight your ongoing costs only and do not reflect any transactional costs, such as exchange fees or sales charges (loads). Therefore, the fourth and fifth data columns of the table are useful in comparing ongoing costs only and will not help you determine the relative total costs of owning different funds. In addition, if these transactional costs were included, your costs would have been higher.
| | | | | | | | | | | | | | | | | | | | | | |
| | | | | | | | | | | | | | | | | | |
| Share Class | | Beginning
Account
Value
1/1/19 | | | Ending Account
Value (Based
on Actual
Returns and
Expenses)
6/30/19 | | | Expenses
Paid
During
Period1 | | | Ending Account
Value (Based on
Hypothetical 5%
Annualized
Return and
Actual Expenses)
6/30/19 | | | Expenses
Paid
During
Period1 | | | Net Expense
Ratio
During
Period2 |
| | | | | | |
| Initial Class Shares | | $ | 1,000.00 | | | $ | 1,184.40 | | | $ | 0.87 | | | $ | 1,024.00 | | | $ | 0.80 | | | 0.16% |
| | | | | | |
| Service Class Shares | | $ | 1,000.00 | | | $ | 1,182.90 | | | $ | 2.22 | | | $ | 1,022.76 | | | $ | 2.06 | | | 0.41% |
| 1. | Expenses are equal to the Portfolio’s annualized expense ratio of each class multiplied by the average account value over the period, divided by 365 and multiplied by 181 (to reflect the six-month period). The table above represents the actual expenses incurred during the six-month period. In addition to the fees and expenses which the Portfolio bears directly, it also indirectly bears a pro rata share of the fees and expenses of the underlying funds in which it invests. Such indirect expenses are not included in the above-reported expense figures. |
| 2. | Expenses are equal to the Portfolio’s annualized expense ratio to reflect the six-month period. |
| | |
| 6 | | MainStay VP MacKay S&P 500 Index Portfolio |
Industry Composition as of June 30, 2019(Unaudited)
| | | | |
| |
| Software | | | 6.7 | % |
| |
| Banks | | | 5.4 | |
| |
| IT Services | | | 5.2 | |
| |
| Interactive Media & Services | | | 4.6 | |
| |
| Oil, Gas & Consumable Fuels | | | 4.5 | |
| |
| Pharmaceuticals | | | 4.5 | |
| |
| Technology Hardware, Storage & Peripherals | | | 3.9 | |
| |
| Internet & Direct Marketing Retail | | | 3.7 | |
| |
| Semiconductors & Semiconductor Equipment | | | 3.7 | |
| |
| Health Care Equipment & Supplies | | | 3.5 | |
| |
| Equity Real Estate Investment Trusts | | | 2.9 | |
| |
| Capital Markets | | | 2.7 | |
| |
| Health Care Providers & Services | | | 2.6 | |
| |
| Aerospace & Defense | | | 2.5 | |
| |
| Insurance | | | 2.5 | |
| |
| Specialty Retail | | | 2.3 | |
| |
| Biotechnology | | | 2.1 | |
| |
| Chemicals | | | 2.0 | |
| |
| Diversified Telecommunication Services | | | 2.0 | |
| |
| Electric Utilities | | | 2.0 | |
| |
| Entertainment | | | 2.0 | |
| |
| Hotels, Restaurants & Leisure | | | 1.9 | |
| |
| Beverages | | | 1.8 | |
| |
| Diversified Financial Services | | | 1.7 | |
| |
| Household Products | | | 1.7 | |
| |
| Food & Staples Retailing | | | 1.5 | |
| |
| Machinery | | | 1.5 | |
| |
| Industrial Conglomerates | | | 1.4 | |
| |
| Media | | | 1.4 | |
| |
| Communications Equipment | | | 1.2 | |
| |
| Food Products | | | 1.1 | |
| |
| Life Sciences Tools & Services | | | 1.1 | |
| |
| Multi-Utilities | | | 1.1 | |
| |
| Road & Rail | | | 1.0 | |
| | | | |
| |
| Tobacco | | | 0.8 | % |
| |
| Consumer Finance | | | 0.7 | |
| |
| Textiles, Apparel & Luxury Goods | | | 0.7 | |
| |
| Air Freight & Logistics | | | 0.5 | |
| |
| Electrical Equipment | | | 0.5 | |
| |
| Electronic Equipment, Instruments & Components | | | 0.5 | |
| |
| Multiline Retail | | | 0.5 | |
| |
| Airlines | | | 0.4 | |
| |
| Automobiles | | | 0.4 | |
| |
| Commercial Services & Supplies | | | 0.4 | |
| |
| Containers & Packaging | | | 0.4 | |
| |
| Energy Equipment & Services | | | 0.4 | |
| |
| Building Products | | | 0.3 | |
| |
| Household Durables | | | 0.3 | |
| |
| Metals & Mining | | | 0.3 | |
| |
| Professional Services | | | 0.3 | |
| |
| Personal Products | | | 0.2 | |
| |
| Trading Companies & Distributors | | | 0.2 | |
| |
| Auto Components | | | 0.1 | |
| |
| Construction & Engineering | | | 0.1 | |
| |
| Construction Materials | | | 0.1 | |
| |
| Distributors | | | 0.1 | |
| |
| Health Care Technology | | | 0.1 | |
| |
| Independent Power & Renewable Electricity Producers | | | 0.1 | |
| |
| Real Estate Management & Development | | | 0.1 | |
| |
| Water Utilities | | | 0.1 | |
| |
| Diversified Consumer Services | | | 0.0 | ‡ |
| |
| Gas Utilities | | | 0.0 | ‡ |
| |
| Leisure Products | | | 0.0 | ‡ |
| |
| Short-Term Investments | | | 1.7 | |
| |
| Other Assets, Less Liabilities | | | 0.0 | ‡ |
| | | | |
| |
| | | 100.0 | % |
| | | | |
See Portfolio of Investments beginning on page 9 for specific holdings within these categories. The Portfolio’s holdings are subject to change.
‡ Less than one-tenth of a percent.
Top Ten Holdings as of June 30, 2019(excludingshort-term investments) (Unaudited)
| 5. | Facebook, Inc., Class A |
| 6. | Berkshire Hathaway, Inc., Class B |
Portfolio Management Discussion and Analysis(Unaudited)
Answers to the questions reflect the views of portfolio managers Francis J. Ok and Lee Baker of MacKay Shields LLC, the Portfolio’s Subadvisor.
How did MainStay VP MacKay S&P 500 Index Portfolio perform relative to its benchmark and peers during the six months ended June 30, 2019?
For the six months ended June 30, 2019, MainStay VP MacKay S&P 500 Index Portfolio returned 18.44% for Initial Class shares and 18.29% for Service Class shares. Over the same period, both share classes underperformed the 18.54% return of the S&P 500® Index, which is the Portfolio’s benchmark. Although the Portfolio seeks investment results that correspond to the total return performance of common stocks in the aggregate as represented by the S&P 500® Index, the Portfolio’s net performance will typically lag that of the Index because the Portfolio incurs operating expenses that the Index does not. For the six months ended June 30, 2019, both share classes outperformed the 17.21% return of the Morningstar Large Blend Category Average.1
During the reporting period, how was the Portfolio’s performance materially affected by investments in derivatives?
The Portfolio invests in futures contracts to provide an efficient means of maintaining liquidity while remaining fully invested in the market.
During the reporting period, which S&P 500® industries had the highest total returns and which industries had the lowest total returns?
The S&P 500® industries that provided highest total returns during the reporting period included personal products, health care technology and building products. The S&P 500® industries providing the lowest total returns during the same period included biotechnology, health care providers & services, and independent power & renewable electricity producers.
During the reporting period, which S&P 500® industries made the strongest positive contributions to the Portfolio’s performance and which industries made the weakest contributions?
The S&P 500® industries that made the strongest positive contributions to the Portfolio’s performance during the reporting period included software; information technology services; and
technology hardware, storage & peripherals. (Contributions take weightings and total returns into account.) During the same period, the S&P 500® industries that made the weakest contributions to the Fund’s performance included health care providers & services, biotechnology, and independent power & renewable electricity producers.
During the reporting period, which individual stocks in the S&P 500® Index had the highest total returns and which individual stocks had the lowest total returns?
During the reporting period, the S&P 500® stocks that provided the highest total returns included personal products maker Coty, document management systems provider Xerox and restaurant chain operator Chipotle Mexican Grill. During the same period, the S&P 500® stocks that provided the lowest returns were drug maker Mylan, fashion retailer Nordstrom and apparel retailer The Gap.
During the reporting period, which S&P 500® stocks made the strongest positive contributions to the Portfolio’s absolute performance and which S&P 500® stocks made the weakest contributions?
During the reporting period, the strongest positive contributors to the Portfolio’s absolute performance included software company Microsoft, consumer technology maker Apple ande-commerce retailer Amazon.com. During the same period, the weakest contributors to the Portfolio’s absolute performance included biopharmaceutical company AbbVie, pharmaceutical chain CVS Health and health insurance company Cigna.
Were there any changes in the S&P 500® Index during the reporting period?
During the reporting period, there were 9 additions to and 13 deletions from the S&P 500® Index. In terms of index weight, significant additions to the S&P 500® Index included chemicals and consumer products maker Dow and agricultural producer Corteva. Significant deletions included media company Twenty-First Century Fox and communications equipment maker L3 Technologies. The difference between additions and deletions during the reporting period was due to spin offs.
| 1. | See page 5 for more information on benchmark and peer group returns. |
The opinions expressed are those of the portfolio managers as of the date of this report and are subject to change. There is no guarantee that any forecasts will come to pass. This material does not constitute investment advice and is not intended as an endorsement of any specific investment.
Not all MainStay VP Portfolios and/or share classes are available under all policies.
| | |
| 8 | | MainStay VP MacKay S&P 500 Index Portfolio |
Portfolio of InvestmentsJune 30, 2019 (Unaudited)
| | | | | | | | |
| | |
Shares | | | Value | |
| Common Stocks 98.3%† | |
Aerospace & Defense 2.5% | |
Arconic, Inc. | | | 35,468 | | | $ | 915,784 | |
Boeing Co. | | | 46,480 | | | | 16,919,185 | |
General Dynamics Corp. | | | 24,121 | | | | 4,385,680 | |
Huntington Ingalls Industries, Inc. | | | 3,691 | | | | 829,515 | |
L3 Technologies, Inc. | | | 7,057 | | | | 1,730,165 | |
L3harris Technologies, Inc. | | | 10,494 | | | | 1,984,730 | |
Lockheed Martin Corp. | | | 21,835 | | | | 7,937,896 | |
Northrop Grumman Corp. | | | 15,083 | | | | 4,873,468 | |
Raytheon Co. | | | 24,743 | | | | 4,302,313 | |
Textron, Inc. | | | 20,676 | | | | 1,096,655 | |
TransDigm Group, Inc. (a) | | | 4,346 | | | | 2,102,595 | |
United Technologies Corp. | | | 72,053 | | | | 9,381,300 | |
| | | | | | | | |
| | | | | | | 56,459,286 | �� |
| | | | | | | | |
Air Freight & Logistics 0.5% | |
C.H. Robinson Worldwide, Inc. | | | 12,131 | | | | 1,023,250 | |
Expeditors International of Washington, Inc. | | | 15,278 | | | | 1,158,989 | |
FedEx Corp. | | | 21,296 | | | | 3,496,590 | |
United Parcel Service, Inc., Class B | | | 61,961 | | | | 6,398,713 | |
| | | | | | | | |
| | | | | | | 12,077,542 | |
| | | | | | | | |
Airlines 0.4% | |
Alaska Air Group, Inc. | | | 10,971 | | | | 701,157 | |
American Airlines Group, Inc. | | | 35,169 | | | | 1,146,861 | |
Delta Air Lines, Inc. | | | 52,919 | | | | 3,003,153 | |
Southwest Airlines Co. | | | 43,416 | | | | 2,204,664 | |
United Continental Holdings, Inc. (a) | | | 19,634 | | | | 1,718,957 | |
| | | | | | | | |
| | | | | | | 8,774,792 | |
| | | | | | | | |
Auto Components 0.1% | |
Aptiv PLC | | | 22,903 | | | | 1,851,249 | |
BorgWarner, Inc. | | | 18,411 | | | | 772,894 | |
| | | | | | | | |
| | | | | | | 2,624,143 | |
| | | | | | | | |
Automobiles 0.4% | |
Ford Motor Co. | | | 348,098 | | | | 3,561,043 | |
General Motors Co. | | | 117,176 | | | | 4,514,791 | |
Harley-Davidson, Inc. | | | 14,130 | | | | 506,278 | |
| | | | | | | | |
| | | | | | | 8,582,112 | |
| | | | | | | | |
Banks 5.4% | |
Bank of America Corp. | | | 785,494 | | | | 22,779,326 | |
BB&T Corp. | | | 68,037 | | | | 3,342,658 | |
Citigroup, Inc. | | | 205,417 | | | | 14,385,352 | |
Citizens Financial Group, Inc. | | | 40,716 | | | | 1,439,718 | |
Comerica, Inc. | | | 13,694 | | | | 994,732 | |
Fifth Third Bancorp | | | 64,593 | | | | 1,802,145 | |
First Republic Bank | | | 14,637 | | | | 1,429,303 | |
Huntington Bancshares, Inc. | | | 92,956 | | | | 1,284,652 | |
JPMorgan Chase & Co. | | | 288,164 | | | | 32,216,735 | |
KeyCorp | | | 89,567 | | | | 1,589,814 | |
M&T Bank Corp. | | | 12,136 | | | | 2,063,970 | |
| | | | | | | | |
| | |
Shares | | | Value | |
Banks (continued) | |
People’s United Financial, Inc. | | | 35,032 | | | $ | 587,837 | |
PNC Financial Services Group, Inc. | | | 40,102 | | | | 5,505,203 | |
Regions Financial Corp. | | | 90,005 | | | | 1,344,675 | |
SunTrust Banks, Inc. | | | 39,425 | | | | 2,477,861 | |
SVB Financial Group (a) | | | 4,648 | | | | 1,043,894 | |
U.S. Bancorp | | | 132,938 | | | | 6,965,951 | |
Wells Fargo & Co. | | | 359,311 | | | | 17,002,596 | |
Zions Bancorp., N.A. | | | 16,217 | | | | 745,658 | |
| | | | | | | | |
| | | | | | | 119,002,080 | |
| | | | | | | | |
Beverages 1.8% | |
Brown-Forman Corp., Class B | | | 14,777 | | | | 819,089 | |
Coca-Cola Co. | | | 341,065 | | | | 17,367,030 | |
Constellation Brands, Inc., Class A | | | 14,853 | | | | 2,925,150 | |
Molson Coors Brewing Co., Class B | | | 16,681 | | | | 934,136 | |
Monster Beverage Corp. (a) | | | 34,766 | | | | 2,219,114 | |
PepsiCo., Inc. | | | 124,524 | | | | 16,328,832 | |
| | | | | | | | |
| | | | | | | 40,593,351 | |
| | | | | | | | |
Biotechnology 2.1% | |
AbbVie, Inc. | | | 131,320 | | | | 9,549,590 | |
Alexion Pharmaceuticals, Inc. (a) | | | 19,919 | | | | 2,608,991 | |
Amgen, Inc. | | | 54,181 | | | | 9,984,475 | |
Biogen, Inc. (a) | | | 17,224 | | | | 4,028,177 | |
Celgene Corp. (a) | | | 62,649 | | | | 5,791,273 | |
Gilead Sciences, Inc. | | | 112,952 | | | | 7,631,037 | |
Incyte Corp. (a) | | | 15,811 | | | | 1,343,303 | |
Regeneron Pharmaceuticals, Inc. (a) | | | 6,986 | | | | 2,186,618 | |
Vertex Pharmaceuticals, Inc. (a) | | | 22,751 | | | | 4,172,078 | |
| | | | | | | | |
| | | | | | | 47,295,542 | |
| | | | | | | | |
Building Products 0.3% | |
A.O. Smith Corp. | | | 12,537 | | | | 591,245 | |
Allegion PLC | | | 8,345 | | | | 922,540 | |
Fortune Brands Home & Security, Inc. | | | 12,425 | | | | 709,840 | |
Johnson Controls International PLC | | | 70,690 | | | | 2,920,204 | |
Masco Corp. | | | 26,077 | | | | 1,023,261 | |
| | | | | | | | |
| | | | | | | 6,167,090 | |
| | | | | | | | |
Capital Markets 2.7% | |
Affiliated Managers Group, Inc. | | | 4,548 | | | | 419,053 | |
Ameriprise Financial, Inc. | | | 11,895 | | | | 1,726,678 | |
Bank of New York Mellon Corp. | | | 78,252 | | | | 3,454,826 | |
BlackRock, Inc. | | | 10,569 | | | | 4,960,032 | |
Cboe Global Markets, Inc. | | | 9,923 | | | | 1,028,320 | |
Charles Schwab Corp. | | | 105,544 | | | | 4,241,813 | |
CME Group, Inc. | | | 31,799 | | | | 6,172,504 | |
E*TRADE Financial Corp. | | | 21,735 | | | | 969,381 | |
Franklin Resources, Inc. | | | 26,150 | | | | 910,020 | |
Goldman Sachs Group, Inc. | | | 30,223 | | | | 6,183,626 | |
Intercontinental Exchange, Inc. | | | 50,089 | | | | 4,304,649 | |
Invesco, Ltd. | | | 35,584 | | | | 728,049 | |
Marketaxess Holdings, Inc. | | | 3,498 | | | | 1,124,327 | |
| | | | | | |
The notes to the financial statements are an integral part of,
and should be read in conjunction with, the financial statements. | | | | | 9 | |
Portfolio of InvestmentsJune 30, 2019 (Unaudited) (continued)
| | | | | | | | |
| | |
Shares | | | Value | |
| Common Stocks (continued) | |
Capital Markets (continued) | |
Moody’s Corp. | | | 14,653 | | | $ | 2,861,877 | |
Morgan Stanley | | | 113,569 | | | | 4,975,458 | |
MSCI, Inc. | | | 7,522 | | | | 1,796,178 | |
Nasdaq, Inc. | | | 10,304 | | | | 990,936 | |
Northern Trust Corp. | | | 19,336 | | | | 1,740,240 | |
Raymond James Financial, Inc. | | | 11,224 | | | | 948,989 | |
S&P Global, Inc. | | | 21,859 | | | | 4,979,262 | |
State Street Corp. | | | 33,149 | | | | 1,858,333 | |
T. Rowe Price Group, Inc. | | | 21,006 | | | | 2,304,568 | |
| | | | | | | | |
| | | | | | | 58,679,119 | |
| | | | | | | | |
Chemicals 2.0% | |
Air Products & Chemicals, Inc. | | | 19,554 | | | | 4,426,439 | |
Albemarle Corp. | | | 9,412 | | | | 662,699 | |
Celanese Corp. | | | 11,247 | | | | 1,212,427 | |
CF Industries Holdings, Inc. | | | 19,639 | | | | 917,338 | |
Corteva, Inc. (a) | | | 66,517 | | | | 1,966,908 | |
Dow, Inc. (a) | | | 66,518 | | | | 3,280,002 | |
DuPont de Nemours, Inc. | | | 66,516 | | | | 4,993,356 | |
Eastman Chemical Co. | | | 12,310 | | | | 958,087 | |
Ecolab, Inc. | | | 22,532 | | | | 4,448,718 | |
FMC Corp. | | | 11,695 | | | | 970,100 | |
International Flavors & Fragrances, Inc. | | | 9,004 | | | | 1,306,390 | |
Linde PLC | | | 48,214 | | | | 9,681,371 | |
LyondellBasell Industries N.V., Class A | | | 26,975 | | | | 2,323,357 | |
Mosaic Co. | | | 31,528 | | | | 789,146 | |
PPG Industries, Inc. | | | 20,973 | | | | 2,447,759 | |
Sherwin-Williams Co. | | | 7,216 | | | | 3,307,021 | |
| | | | | | | | |
| | | | | | | 43,691,118 | |
| | | | | | | | |
Commercial Services & Supplies 0.4% | |
Cintas Corp. | | | 7,524 | | | | 1,785,370 | |
Copart, Inc. (a) | | | 17,910 | | | | 1,338,593 | |
Republic Services, Inc. | | | 19,140 | | | | 1,658,290 | |
Rollins, Inc. | | | 13,092 | | | | 469,610 | |
Waste Management, Inc. | | | 34,707 | | | | 4,004,147 | |
| | | | | | | | |
| | | | | | | 9,256,010 | |
| | | | | | | | |
Communications Equipment 1.2% | |
Arista Networks, Inc. (a) | | | 4,696 | | | | 1,219,176 | |
Cisco Systems, Inc. | | | 380,259 | | | | 20,811,575 | |
F5 Networks, Inc. (a) | | | 5,302 | | | | 772,130 | |
Juniper Networks, Inc. | | | 30,586 | | | | 814,505 | |
Motorola Solutions, Inc. | | | 14,638 | | | | 2,440,594 | |
| | | | | | | | |
| | | | | | | 26,057,980 | |
| | | | | | | | |
Construction & Engineering 0.1% | |
Jacobs Engineering Group, Inc. | | | 10,193 | | | | 860,187 | |
Quanta Services, Inc. | | | 12,621 | | | | 481,996 | |
| | | | | | | | |
| | | | | | | 1,342,183 | |
| | | | | | | | |
| | | | | | | | |
| | |
Shares | | | Value | |
Construction Materials 0.1% | |
Martin Marietta Materials, Inc. | | | 5,550 | | | $ | 1,277,110 | |
Vulcan Materials Co. | | | 11,734 | | | | 1,611,196 | |
| | | | | | | | |
| | | | | | | 2,888,306 | |
| | | | | | | | |
Consumer Finance 0.7% | |
American Express Co. | | | 60,828 | | | | 7,508,608 | |
Capital One Financial Corp. | | | 41,714 | | | | 3,785,128 | |
Discover Financial Services | | | 28,757 | | | | 2,231,256 | |
Synchrony Financial | | | 56,334 | | | | 1,953,100 | |
| | | | | | | | |
| | | | | | | 15,478,092 | |
| | | | | | | | |
Containers & Packaging 0.4% | |
Amcor PLC (a) | | | 144,179 | | | | 1,656,617 | |
Avery Dennison Corp. | | | 7,498 | | | | 867,369 | |
Ball Corp. | | | 29,736 | | | | 2,081,223 | |
International Paper Co. | | | 35,295 | | | | 1,528,979 | |
Packaging Corp. of America | | | 8,394 | | | | 800,116 | |
Sealed Air Corp. | | | 13,831 | | | | 591,690 | |
WestRock Co. | | | 22,834 | | | | 832,756 | |
| | | | | | | | |
| | | | | | | 8,358,750 | |
| | | | | | | | |
Distributors 0.1% | |
Genuine Parts Co. | | | 12,975 | | | | 1,343,951 | |
LKQ Corp. (a) | | | 27,892 | | | | 742,206 | |
| | | | | | | | |
| | | | | | | 2,086,157 | |
| | | | | | | | |
Diversified Consumer Services 0.0%‡ | |
H&R Block, Inc. | | | 18,059 | | | | 529,129 | |
| | | | | | | | |
|
Diversified Financial Services 1.7% | |
Berkshire Hathaway, Inc., Class B (a) | | | 172,136 | | | | 36,694,231 | |
Jefferies Financial Group, Inc. | | | 22,508 | | | | 432,829 | |
| | | | | | | | |
| | | | | | | 37,127,060 | |
| | | | | | | | |
Diversified Telecommunication Services 2.0% | |
AT&T, Inc. | | | 648,284 | | | | 21,723,997 | |
CenturyLink, Inc. | | | 85,231 | | | | 1,002,316 | |
Verizon Communications, Inc. | | | 367,376 | | | | 20,988,191 | |
| | | | | | | | |
| | | | | | | 43,714,504 | |
| | | | | | | | |
Electric Utilities 2.0% | |
Alliant Energy Corp. | | | 20,990 | | | | 1,030,189 | |
American Electric Power Co., Inc. | | | 43,832 | | | | 3,857,654 | |
Duke Energy Corp. | | | 64,673 | | | | 5,706,746 | |
Edison International | | | 28,942 | | | | 1,950,980 | |
Entergy Corp. | | | 16,871 | | | | 1,736,532 | |
Evergy, Inc. | | | 21,684 | | | | 1,304,293 | |
Eversource Energy | | | 28,524 | | | | 2,160,978 | |
Exelon Corp. | | | 86,250 | | | | 4,134,825 | |
FirstEnergy Corp. | | | 44,848 | | | | 1,919,943 | |
NextEra Energy, Inc. | | | 42,544 | | | | 8,715,564 | |
Pinnacle West Capital Corp. | | | 9,973 | | | | 938,360 | |
PPL Corp. | | | 64,113 | | | | 1,988,144 | |
Southern Co. | | | 92,458 | | | | 5,111,078 | |
| | | | |
| 10 | | MainStay VP MacKay S&P 500 Index Portfolio | | The notes to the financial statements are an integral part of,
and should be read in conjunction with, the financial statements. |
| | | | | | | | |
| | |
Shares | | | Value | |
| Common Stocks (continued) | |
Electric Utilities (continued) | |
Xcel Energy, Inc. | | | 45,718 | | | $ | 2,719,764 | |
| | | | | | | | |
| | | | | | | 43,275,050 | |
| | | | | | | | |
Electrical Equipment 0.5% | |
AMETEK, Inc. | | | 20,239 | | | | 1,838,511 | |
Eaton Corp. PLC | | | 37,584 | | | | 3,129,995 | |
Emerson Electric Co. | | | 54,596 | | | | 3,642,645 | |
Rockwell Automation, Inc. | | | 10,514 | | | | 1,722,509 | |
| | | | | | | | |
| | | | | | | 10,333,660 | |
| | | | | | | | |
Electronic Equipment, Instruments & Components 0.5% | |
Amphenol Corp., Class A | | | 26,536 | | | | 2,545,864 | |
Corning, Inc. | | | 69,710 | | | | 2,316,463 | |
FLIR Systems, Inc. | | | 12,030 | | | | 650,823 | |
IPG Photonics Corp. (a) | | | 3,163 | | | | 487,893 | |
Keysight Technologies, Inc. (a) | | | 16,715 | | | | 1,501,174 | |
TE Connectivity, Ltd. | | | 29,924 | | | | 2,866,121 | |
| | | | | | | | |
| | | | | | | 10,368,338 | |
| | | | | | | | |
Energy Equipment & Services 0.4% | |
Baker Hughes, a GE Co. | | | 45,739 | | | | 1,126,552 | |
Halliburton Co. | | | 77,635 | | | | 1,765,420 | |
Helmerich & Payne, Inc. | | | 9,817 | | | | 496,936 | |
National Oilwell Varco, Inc. | | | 34,282 | | | | 762,089 | |
Schlumberger, Ltd. | | | 123,041 | | | | 4,889,649 | |
TechnipFMC PLC | | | 37,414 | | | | 970,519 | |
| | | | | | | | |
| | | | | | | 10,011,165 | |
| | | | | | | | |
Entertainment 2.0% | |
Activision Blizzard, Inc. | | | 68,044 | | | | 3,211,677 | |
Electronic Arts, Inc. (a) | | | 26,351 | | | | 2,668,302 | |
Netflix, Inc. (a) | | | 38,839 | | | | 14,266,342 | |
Take-Two Interactive Software, Inc. (a) | | | 9,997 | | | | 1,134,959 | |
Viacom, Inc., Class B | | | 31,414 | | | | 938,336 | |
Walt Disney Co. | | | 155,072 | | | | 21,654,254 | |
| | | | | | | | |
| | | | | | | 43,873,870 | |
| | | | | | | | |
Equity Real Estate Investment Trusts 2.9% | |
Alexandria Real Estate Equities, Inc. | | | 10,032 | | | | 1,415,415 | |
American Tower Corp. | | | 39,265 | | | | 8,027,729 | |
Apartment Investment & Management Co., Class A | | | 13,221 | | | | 662,637 | |
AvalonBay Communities, Inc. | | | 12,383 | | | | 2,515,978 | |
Boston Properties, Inc. | | | 13,726 | | | | 1,770,654 | |
Crown Castle International Corp. | | | 36,931 | | | | 4,813,956 | |
Digital Realty Trust, Inc. | | | 18,502 | | | | 2,179,351 | |
Duke Realty Corp. | | | 31,928 | | | | 1,009,244 | |
Equinix, Inc. | | | 7,468 | | | | 3,766,038 | |
Equity Residential | | | 32,908 | | | | 2,498,375 | |
Essex Property Trust, Inc. | | | 5,838 | | | | 1,704,287 | |
Extra Space Storage, Inc. | | | 11,322 | | | | 1,201,264 | |
Federal Realty Investment Trust | | | 6,654 | | | | 856,769 | |
| | | | | | | | |
| | |
Shares | | | Value | |
Equity Real Estate Investment Trusts (continued) | |
HCP, Inc. | | | 42,460 | | | $ | 1,357,871 | |
Host Hotels & Resorts, Inc. | | | 65,814 | | | | 1,199,131 | |
Iron Mountain, Inc. | | | 25,483 | | | | 797,618 | |
Kimco Realty Corp. | | | 37,490 | | | | 692,815 | |
Macerich Co. | | | 9,409 | | | | 315,107 | |
Mid-America Apartment Communities, Inc. | | | 10,126 | | | | 1,192,438 | |
Prologis, Inc. | | | 56,033 | | | | 4,488,243 | |
Public Storage | | | 13,333 | | | | 3,175,521 | |
Realty Income Corp. | | | 27,965 | | | | 1,928,746 | |
Regency Centers Corp. | | | 14,844 | | | | 990,689 | |
SBA Communications Corp. (a) | | | 10,061 | | | | 2,262,115 | |
Simon Property Group, Inc. | | | 27,448 | | | | 4,385,093 | |
SL Green Realty Corp. | | | 7,490 | | | | 601,971 | |
UDR, Inc. | | | 25,032 | | | | 1,123,686 | |
Ventas, Inc. | | | 32,815 | | | | 2,242,905 | |
Vornado Realty Trust | | | 15,420 | | | | 988,422 | |
Welltower, Inc. | | | 35,971 | | | | 2,932,716 | |
Weyerhaeuser Co. | | | 66,160 | | | | 1,742,654 | |
| | | | | | | | |
| | | | | | | 64,839,438 | |
| | | | | | | | |
Food & Staples Retailing 1.5% | |
Costco Wholesale Corp. | | | 39,067 | | | | 10,323,845 | |
Kroger Co. | | | 71,658 | | | | 1,555,695 | |
Sysco Corp. | | | 42,004 | | | | 2,970,523 | |
Walgreens Boots Alliance, Inc. | | | 69,035 | | | | 3,774,144 | |
Walmart, Inc. | | | 124,257 | | | | 13,729,156 | |
| | | | | | | | |
| | | | | | | 32,353,363 | |
| | | | | | | | |
Food Products 1.1% | |
Archer-Daniels-Midland Co. | | | 49,760 | | | | 2,030,208 | |
Campbell Soup Co. | | | 17,121 | | | | 686,038 | |
Conagra Brands, Inc. | | | 43,164 | | | | 1,144,709 | |
General Mills, Inc. | | | 53,191 | | | | 2,793,591 | |
Hershey Co. | | | 12,373 | | | | 1,658,353 | |
Hormel Foods Corp. | | | 24,185 | | | | 980,460 | |
J.M. Smucker Co. | | | 10,104 | | | | 1,163,880 | |
Kellogg Co. | | | 22,080 | | | | 1,182,826 | |
Kraft Heinz Co. | | | 55,267 | | | | 1,715,488 | |
Lamb Weston Holdings, Inc. | | | 12,994 | | | | 823,300 | |
McCormick & Co., Inc. | | | 10,878 | | | | 1,686,199 | |
Mondelez International, Inc., Class A | | | 127,955 | | | | 6,896,775 | |
Tyson Foods, Inc., Class A | | | 26,187 | | | | 2,114,338 | |
| | | | | | | | |
| | | | | | | 24,876,165 | |
| | | | | | | | |
Gas Utilities 0.0%‡ | |
Atmos Energy Corp. | | | 10,393 | | | | 1,097,085 | |
| | | | | | | | |
|
Health Care Equipment & Supplies 3.5% | |
Abbott Laboratories | | | 156,712 | | | | 13,179,479 | |
ABIOMED, Inc. (a) | | | 4,009 | | | | 1,044,304 | |
Align Technology, Inc. (a) | | | 6,467 | | | | 1,770,018 | |
Baxter International, Inc. | | | 42,146 | | | | 3,451,757 | |
| | | | | | |
The notes to the financial statements are an integral part of,
and should be read in conjunction with, the financial statements. | | | | | 11 | |
Portfolio of InvestmentsJune 30, 2019 (Unaudited) (continued)
| | | | | | | | |
| | |
Shares | | | Value | |
| Common Stocks (continued) | |
Health Care Equipment & Supplies (continued) | |
Becton Dickinson & Co. | | | 23,960 | | | $ | 6,038,160 | |
Boston Scientific Corp. (a) | | | 123,532 | | | | 5,309,405 | |
Cooper Cos., Inc. | | | 4,396 | | | | 1,480,969 | |
Danaher Corp. | | | 55,966 | | | | 7,998,661 | |
DENTSPLY SIRONA, Inc. | | | 20,784 | | | | 1,212,954 | |
Edwards Lifesciences Corp. (a) | | | 18,521 | | | | 3,421,570 | |
Hologic, Inc. (a) | | | 23,811 | | | | 1,143,404 | |
IDEXX Laboratories, Inc. (a) | | | 7,640 | | | | 2,103,521 | |
Intuitive Surgical, Inc. (a) | | | 10,255 | | | | 5,379,260 | |
Medtronic PLC | | | 119,094 | | | | 11,598,565 | |
ResMed, Inc. | | | 12,738 | | | | 1,554,418 | |
Stryker Corp. | | | 27,508 | | | | 5,655,095 | |
Teleflex, Inc. | | | 4,100 | | | | 1,357,715 | |
Varian Medical Systems, Inc. (a) | | | 8,079 | | | | 1,099,794 | |
Zimmer Biomet Holdings, Inc. | | | 18,192 | | | | 2,141,926 | |
| | | | | | | | |
| | | | | | | 76,940,975 | |
| | | | | | | | |
Health Care Providers & Services 2.6% | |
AmerisourceBergen Corp. | | | 13,816 | | | | 1,177,952 | |
Anthem, Inc. | | | 22,846 | | | | 6,447,370 | |
Cardinal Health, Inc. | | | 26,477 | | | | 1,247,067 | |
Centene Corp. (a) | | | 36,719 | | | | 1,925,544 | |
Cigna Corp. (a) | | | 33,707 | | | | 5,310,538 | |
CVS Health Corp. | | | 115,399 | | | | 6,288,091 | |
DaVita, Inc. (a) | | | 11,234 | | | | 632,025 | |
HCA Healthcare, Inc. | | | 23,718 | | | | 3,205,962 | |
Henry Schein, Inc. (a) | | | 13,243 | | | | 925,686 | |
Humana, Inc. | | | 11,995 | | | | 3,182,273 | |
Laboratory Corp. of America Holdings (a) | | | 8,749 | | | | 1,512,702 | |
McKesson Corp. | | | 16,875 | | | | 2,267,831 | |
Quest Diagnostics, Inc. | | | 11,936 | | | | 1,215,204 | |
UnitedHealth Group, Inc. | | | 84,420 | | | | 20,599,324 | |
Universal Health Services, Inc., Class B | | | 7,363 | | | | 960,062 | |
WellCare Health Plans, Inc. (a) | | | 4,469 | | | | 1,273,978 | |
| | | | | | | | |
| | | | | | | 58,171,609 | |
| | | | | | | | |
Health Care Technology 0.1% | |
Cerner Corp. | | | 28,907 | | | | 2,118,883 | |
| | | | | | | | |
|
Hotels, Restaurants & Leisure 1.9% | |
Carnival Corp. | | | 35,568 | | | | 1,655,690 | |
Chipotle Mexican Grill, Inc. (a) | | | 2,166 | | | | 1,587,418 | |
Darden Restaurants, Inc. | | | 10,924 | | | | 1,329,779 | |
Hilton Worldwide Holdings, Inc. | | | 25,856 | | | | 2,527,165 | |
Marriott International, Inc., Class A | | | 24,551 | | | | 3,444,260 | |
McDonald’s Corp. | | | 67,827 | | | | 14,084,955 | |
MGM Resorts International | | | 45,333 | | | | 1,295,164 | |
Norwegian Cruise Line Holdings, Ltd. (a) | | | 19,134 | | | | 1,026,156 | |
Royal Caribbean Cruises, Ltd. | | | 15,271 | | | | 1,850,998 | |
Starbucks Corp. | | | 107,591 | | | | 9,019,354 | |
| | | | | | | | |
| | |
Shares | | | Value | |
Hotels, Restaurants & Leisure (continued) | |
Wynn Resorts, Ltd. | | | 8,607 | | | $ | 1,067,182 | |
Yum! Brands, Inc. | | | 27,179 | | | | 3,007,900 | |
| | | | | | | | |
| | | | | | | 41,896,021 | |
| | | | | | | | |
Household Durables 0.3% | |
D.R. Horton, Inc. | | | 30,166 | | | | 1,301,060 | |
Garmin, Ltd. | | | 10,772 | | | | 859,606 | |
Leggett & Platt, Inc. | | | 11,660 | | | | 447,394 | |
Lennar Corp., Class A | | | 25,355 | | | | 1,228,703 | |
Mohawk Industries, Inc. (a) | | | 5,468 | | | | 806,366 | |
Newell Brands, Inc. | | | 34,578 | | | | 533,193 | |
PulteGroup, Inc. | | | 22,649 | | | | 716,161 | |
Whirlpool Corp. | | | 5,626 | | | | 800,917 | |
| | | | | | | | |
| | | | | | | 6,693,400 | |
| | | | | | | | |
Household Products 1.7% | |
Church & Dwight Co., Inc. | | | 21,872 | | | | 1,597,968 | |
Clorox Co. | | | 11,314 | | | | 1,732,287 | |
Colgate-Palmolive Co. | | | 76,262 | | | | 5,465,698 | |
Kimberly-Clark Corp. | | | 30,539 | | | | 4,070,238 | |
Procter & Gamble Co. | | | 222,816 | | | | 24,431,774 | |
| | | | | | | | |
| | | | | | | 37,297,965 | |
| | | | | | | | |
Independent Power & Renewable Electricity Producers 0.1% | |
AES Corp. | | | 58,959 | | | | 988,153 | |
NRG Energy, Inc. | | | 23,731 | | | | 833,433 | |
| | | | | | | | |
| | | | | | | 1,821,586 | |
| | | | | | | | |
Industrial Conglomerates 1.4% | |
3M Co. | | | 51,204 | | | | 8,875,701 | |
General Electric Co. | | | 774,673 | | | | 8,134,067 | |
Honeywell International, Inc. | | | 64,645 | | | | 11,286,371 | |
Roper Technologies, Inc. | | | 9,224 | | | | 3,378,382 | |
| | | | | | | | |
| | | | | | | 31,674,521 | |
| | | | | | | | |
Insurance 2.5% | |
Aflac, Inc. | | | 66,221 | | | | 3,629,573 | |
Allstate Corp. | | | 29,590 | | | | 3,009,007 | |
American International Group, Inc. | | | 77,260 | | | | 4,116,413 | |
Aon PLC | | | 21,365 | | | | 4,123,018 | |
Arthur J. Gallagher & Co. | | | 16,456 | | | | 1,441,381 | |
Assurant, Inc. | | | 5,460 | | | | 580,835 | |
Chubb, Ltd. | | | 40,673 | | | | 5,990,726 | |
Cincinnati Financial Corp. | | | 13,476 | | | | 1,397,057 | |
Everest Re Group, Ltd. | | | 3,618 | | | | 894,297 | |
Hartford Financial Services Group, Inc. | | | 32,112 | | | | 1,789,281 | |
Lincoln National Corp. | | | 17,974 | | | | 1,158,424 | |
Loews Corp. | | | 23,833 | | | | 1,302,950 | |
Marsh & McLennan Cos., Inc. | | | 45,423 | | | | 4,530,944 | |
MetLife, Inc. | | | 84,422 | | | | 4,193,241 | |
Principal Financial Group, Inc. | | | 23,011 | | | | 1,332,797 | |
Progressive Corp. | | | 51,876 | | | | 4,146,449 | |
Prudential Financial, Inc. | | | 36,065 | | | | 3,642,565 | |
| | | | |
| 12 | | MainStay VP MacKay S&P 500 Index Portfolio | | The notes to the financial statements are an integral part of,
and should be read in conjunction with, the financial statements. |
| | | | | | | | |
| | |
Shares | | | Value | |
| Common Stocks (continued) | |
Insurance (continued) | |
Torchmark Corp. | | | 8,985 | | | $ | 803,798 | |
Travelers Cos., Inc. | | | 23,266 | | | | 3,478,732 | |
Unum Group | | | 18,822 | | | | 631,478 | |
Willis Towers Watson PLC | | | 11,480 | | | | 2,198,879 | |
| | | | | | | | |
| | | | | | | 54,391,845 | |
| | | | | | | | |
Interactive Media & Services 4.6% | |
Alphabet, Inc. (a) | | | | | | | | |
Class A | | | 26,599 | | | | 28,801,397 | |
Class C | | | 27,224 | | | | 29,426,694 | |
Facebook, Inc., Class A (a) | | | 213,418 | | | | 41,189,674 | |
TripAdvisor, Inc. (a) | | | 9,194 | | | | 425,590 | |
Twitter, Inc. (a) | | | 64,864 | | | | 2,263,754 | |
| | | | | | | | |
| | | | | | | 102,107,109 | |
| | | | | | | | |
Internet & Direct Marketing Retail 3.7% | |
Amazon.com, Inc. (a) | | | 36,737 | | | | 69,566,285 | |
Booking Holdings, Inc. (a) | | | 3,846 | | | | 7,210,135 | |
eBay, Inc. | | | 72,773 | | | | 2,874,534 | |
Expedia Group, Inc. | | | 10,511 | | | | 1,398,278 | |
| | | | | | | | |
| | | | | | | 81,049,232 | |
| | | | | | | | |
IT Services 5.2% | |
Accenture PLC, Class A | | | 56,659 | | | | 10,468,883 | |
Akamai Technologies, Inc. (a) | | | 14,577 | | | | 1,168,201 | |
Alliance Data Systems Corp. | | | 4,002 | | | | 560,800 | |
Automatic Data Processing, Inc. | | | 38,661 | | | | 6,391,823 | |
Broadridge Financial Solutions, Inc. | | | 10,317 | | | | 1,317,275 | |
Cognizant Technology Solutions Corp., Class A | | | 50,570 | | | | 3,205,632 | |
DXC Technology Co. | | | 23,830 | | | | 1,314,224 | |
Fidelity National Information Services, Inc. | | | 28,766 | | | | 3,529,013 | |
Fiserv, Inc. (a) | | | 34,860 | | | | 3,177,838 | |
FleetCor Technologies, Inc. (a) | | | 7,656 | | | | 2,150,188 | |
Gartner, Inc. (a) | | | 8,003 | | | | 1,288,003 | |
Global Payments, Inc. | | | 13,919 | | | | 2,228,849 | |
International Business Machines Corp. | | | 78,761 | | | | 10,861,142 | |
Jack Henry & Associates, Inc. | | | 6,858 | | | | 918,423 | |
Mastercard, Inc., Class A | | | 79,839 | | | | 21,119,811 | |
Paychex, Inc. | | | 28,413 | | | | 2,338,106 | |
PayPal Holdings, Inc. (a) | | | 104,370 | | | | 11,946,190 | |
Total System Services, Inc. | | | 14,462 | | | | 1,855,041 | |
VeriSign, Inc. (a) | | | 9,317 | | | | 1,948,744 | |
Visa, Inc., Class A | | | 154,475 | | | | 26,809,136 | |
Western Union Co. | | | 38,261 | | | | 761,011 | |
| | | | | | | | |
| | | | | | | 115,358,333 | |
| | | | | | | | |
Leisure Products 0.0%‡ | |
Hasbro, Inc. | | | 10,285 | | | | 1,086,919 | |
| | | | | | | | |
| | | | | | | | |
| | |
Shares | | | Value | |
Life Sciences Tools & Services 1.1% | |
Agilent Technologies, Inc. | | | 28,070 | | | $ | 2,095,987 | |
Illumina, Inc. (a) | | | 13,058 | | | | 4,807,303 | |
IQVIA Holdings, Inc. (a) | | | 14,016 | | | | 2,255,174 | |
Mettler-Toledo International, Inc. (a) | | | 2,203 | | | | 1,850,520 | |
PerkinElmer, Inc. | | | 9,853 | | | | 949,238 | |
Thermo Fisher Scientific, Inc. | | | 35,530 | | | | 10,434,450 | |
Waters Corp. (a) | | | 6,171 | | | | 1,328,246 | |
| | | | | | | | |
| | | | | | | 23,720,918 | |
| | | | | | | | |
Machinery 1.5% | |
Caterpillar, Inc. | | | 50,800 | | | | 6,923,532 | |
Cummins, Inc. | | | 12,871 | | | | 2,205,317 | |
Deere & Co. | | | 28,159 | | | | 4,666,228 | |
Dover Corp. | | | 12,910 | | | | 1,293,582 | |
Flowserve Corp. | | | 11,649 | | | | 613,786 | |
Fortive Corp. | | | 26,195 | | | | 2,135,416 | |
Illinois Tool Works, Inc. | | | 26,624 | | | | 4,015,165 | |
Ingersoll-Rand PLC | | | 21,422 | | | | 2,713,525 | |
PACCAR, Inc. | | | 30,775 | | | | 2,205,337 | |
Parker-Hannifin Corp. | | | 11,395 | | | | 1,937,264 | |
Pentair PLC | | | 14,048 | | | | 522,586 | |
Snap-On, Inc. | | | 4,921 | | | | 815,114 | |
Stanley Black & Decker, Inc. | | | 13,461 | | | | 1,946,595 | |
Wabtec Corp. (b) | | | 14,371 | | | | 1,031,263 | |
Xylem, Inc. | | | 15,984 | | | | 1,336,902 | |
| | | | | | | | |
| | | | | | | 34,361,612 | |
| | | | | | | | |
Media 1.4% | |
CBS Corp., Class B | | | 31,264 | | | | 1,560,074 | |
Charter Communications, Inc., Class A (a) | | | 15,281 | | | | 6,038,745 | |
Comcast Corp., Class A | | | 402,343 | | | | 17,011,062 | |
Discovery, Inc. (a) | | | | | | | | |
Class A (b) | | | 14,021 | | | | 430,445 | |
Class C | | | 32,028 | | | | 911,197 | |
DISH Network Corp., Class A (a) | | | 20,496 | | | | 787,251 | |
Fox Corp. (a) | | | | | | | | |
Class A | | | 31,477 | | | | 1,153,317 | |
Class B | | | 14,423 | | | | 526,872 | |
Interpublic Group of Cos., Inc. | | | 34,381 | | | | 776,667 | |
News Corp. | | | | | | | | |
Class A | | | 34,247 | | | | 461,992 | |
Class B | | | 10,995 | | | | 153,490 | |
Omnicom Group, Inc. | | | 19,557 | | | | 1,602,696 | |
| | | | | | | | |
| | | | | | | 31,413,808 | |
| | | | | | | | |
Metals & Mining 0.3% | |
Freeport-McMoRan, Inc. | | | 128,860 | | | | 1,496,065 | |
Newmont Goldcorp Corp. | | | 72,808 | | | | 2,800,924 | |
Nucor Corp. | | | 27,074 | | | | 1,491,777 | |
| | | | | | | | |
| | | | | | | 5,788,766 | |
| | | | | | | | |
| | | | | | |
The notes to the financial statements are an integral part of,
and should be read in conjunction with, the financial statements. | | | | | 13 | |
Portfolio of InvestmentsJune 30, 2019 (Unaudited) (continued)
| | | | | | | | |
| | |
Shares | | | Value | |
| Common Stocks (continued) | |
Multi-Utilities 1.1% | |
Ameren Corp. | | | 21,816 | | | $ | 1,638,600 | |
CenterPoint Energy, Inc. | | | 44,609 | | | | 1,277,156 | |
CMS Energy Corp. | | | 25,206 | | | | 1,459,679 | |
Consolidated Edison, Inc. | | | 29,056 | | | | 2,547,630 | |
Dominion Energy, Inc. | | | 71,274 | | | | 5,510,906 | |
DTE Energy Co. | | | 16,275 | | | | 2,081,247 | |
NiSource, Inc. | | | 33,143 | | | | 954,518 | |
Public Service Enterprise Group, Inc. | | | 44,897 | | | | 2,640,841 | |
Sempra Energy | | | 24,374 | | | | 3,349,963 | |
WEC Energy Group, Inc. | | | 28,020 | | | | 2,336,027 | |
| | | | | | | | |
| | | | | | | 23,796,567 | |
| | | | | | | | |
Multiline Retail 0.5% | |
Dollar General Corp. | | | 22,947 | | | | 3,101,516 | |
Dollar Tree, Inc. (a) | | | 21,104 | | | | 2,266,359 | |
Kohl’s Corp. | | | 14,393 | | | | 684,387 | |
Macy’s, Inc. | | | 27,438 | | | | 588,819 | |
Nordstrom, Inc. | | | 9,342 | | | | 297,636 | |
Target Corp. | | | 45,511 | | | | 3,941,708 | |
| | | | | | | | |
| | | | | | | 10,880,425 | |
| | | | | | | | |
Oil, Gas & Consumable Fuels 4.5% | |
Anadarko Petroleum Corp. | | | 44,604 | | | | 3,147,258 | |
Apache Corp. | | | 33,393 | | | | 967,395 | |
Cabot Oil & Gas Corp. | | | 37,601 | | | | 863,319 | |
Chevron Corp. | | | 169,214 | | | | 21,056,990 | |
Cimarex Energy Co. | | | 9,011 | | | | 534,623 | |
Concho Resources, Inc. | | | 17,819 | | | | 1,838,564 | |
ConocoPhillips | | | 100,394 | | | | 6,124,034 | |
Devon Energy Corp. | | | 36,882 | | | | 1,051,875 | |
Diamondback Energy, Inc. | | | 13,750 | | | | 1,498,337 | |
EOG Resources, Inc. | | | 51,550 | | | | 4,802,398 | |
Exxon Mobil Corp. | | | 375,850 | | | | 28,801,385 | |
Hess Corp. | | | 22,642 | | | | 1,439,352 | |
HollyFrontier Corp. | | | 13,956 | | | | 645,884 | |
Kinder Morgan, Inc. | | | 172,937 | | | | 3,610,925 | |
Marathon Oil Corp. | | | 72,656 | | | | 1,032,442 | |
Marathon Petroleum Corp. | | | 58,861 | | | | 3,289,153 | |
Noble Energy, Inc. | | | 42,481 | | | | 951,574 | |
Occidental Petroleum Corp. | | | 66,447 | | | | 3,340,955 | |
ONEOK, Inc. | | | 36,665 | | | | 2,522,919 | |
Phillips 66 | | | 37,102 | | | | 3,470,521 | |
Pioneer Natural Resources Co. | | | 14,961 | | | | 2,301,899 | |
Valero Energy Corp. | | | 37,064 | | | | 3,173,049 | |
Williams Cos., Inc. | | | 107,642 | | | | 3,018,282 | |
| | | | | | | | |
| | | | | | | 99,483,133 | |
| | | | | | | | |
Personal Products 0.2% | |
Coty, Inc., Class A | | | 26,699 | | | | 357,767 | |
Estee Lauder Cos., Inc., Class A | | | 19,478 | | | | 3,566,616 | |
| | | | | | | | |
| | | | | | | 3,924,383 | |
| | | | | | | | |
| | | | | | | | |
| | |
Shares | | | Value | |
Pharmaceuticals 4.5% | |
Allergan PLC | | | 27,372 | | | $ | 4,582,894 | |
Bristol-Myers Squibb Co. | | | 145,302 | | | | 6,589,445 | |
Eli Lilly & Co. | | | 76,753 | | | | 8,503,465 | |
Johnson & Johnson | | | 235,849 | | | | 32,849,049 | |
Merck & Co., Inc. | | | 228,707 | | | | 19,177,082 | |
Mylan N.V. (a) | | | 45,789 | | | | 871,822 | |
Nektar Therapeutics (a) | | | 15,484 | | | | 550,921 | |
Perrigo Co. PLC | | | 11,113 | | | | 529,201 | |
Pfizer, Inc. | | | 493,169 | | | | 21,364,081 | |
Zoetis, Inc. | | | 42,520 | | | | 4,825,595 | |
| | | | | | | | |
| | | | | | | 99,843,555 | |
| | | | | | | | |
Professional Services 0.3% | |
Equifax, Inc. | | | 10,733 | | | | 1,451,531 | |
IHS Markit, Ltd. (a) | | | 32,314 | | | | 2,059,048 | |
Nielsen Holdings PLC | | | 31,578 | | | | 713,663 | |
Robert Half International, Inc. | | | 10,524 | | | | 599,973 | |
Verisk Analytics, Inc. | | | 14,539 | | | | 2,129,382 | |
| | | | | | | | |
| | | | | | | 6,953,597 | |
| | | | | | | | |
Real Estate Management & Development 0.1% | |
CBRE Group, Inc., Class A (a) | | | 27,780 | | | | 1,425,114 | |
| | | | | | | | |
|
Road & Rail 1.0% | |
CSX Corp. | | | 68,285 | | | | 5,283,210 | |
J.B. Hunt Transport Services, Inc. | | | 7,727 | | | | 706,325 | |
Kansas City Southern | | | 8,935 | | | | 1,088,462 | |
Norfolk Southern Corp. | | | 23,626 | | | | 4,709,371 | |
Union Pacific Corp. | | | 62,877 | | | | 10,633,129 | |
| | | | | | | | |
| | | | | | | 22,420,497 | |
| | | | | | | | |
Semiconductors & Semiconductor Equipment 3.7% | |
Advanced Micro Devices, Inc. (a) | | | 78,784 | | | | 2,392,670 | |
Analog Devices, Inc. | | | 32,846 | | | | 3,707,328 | |
Applied Materials, Inc. | | | 83,155 | | | | 3,734,491 | |
Broadcom, Inc. | | | 35,163 | | | | 10,122,021 | |
Intel Corp. | | | 397,693 | | | | 19,037,564 | |
KLA-Tencor Corp. | | | 14,357 | | | | 1,696,998 | |
Lam Research Corp. | | | 13,318 | | | | 2,501,653 | |
Maxim Integrated Products, Inc. | | | 24,200 | | | | 1,447,644 | |
Microchip Technology, Inc. (b) | | | 21,136 | | | | 1,832,491 | |
Micron Technology, Inc. (a) | | | 98,307 | | | | 3,793,667 | |
NVIDIA Corp. | | | 54,098 | | | | 8,884,515 | |
Qorvo, Inc. (a) | | | 10,584 | | | | 705,000 | |
QUALCOMM, Inc. | | | 107,991 | | | | 8,214,875 | |
Skyworks Solutions, Inc. | | | 15,341 | | | | 1,185,399 | |
Texas Instruments, Inc. | | | 83,341 | | | | 9,564,213 | |
Xilinx, Inc. | | | 22,556 | | | | 2,659,804 | |
| | | | | | | | |
| | | | | | | 81,480,333 | |
| | | | | | | | |
Software 6.7% | |
Adobe, Inc. (a) | | | 43,345 | | | | 12,771,604 | |
ANSYS, Inc. (a) | | | 7,455 | | | | 1,526,933 | |
Autodesk, Inc. (a) | | | 19,509 | | | | 3,178,016 | |
| | | | |
| 14 | | MainStay VP MacKay S&P 500 Index Portfolio | | The notes to the financial statements are an integral part of,
and should be read in conjunction with, the financial statements. |
| | | | | | | | |
| | |
Shares | | | Value | |
| Common Stocks (continued) | |
Software (continued) | |
Cadence Design Systems, Inc. (a) | | | 24,964 | | | $ | 1,767,701 | |
Citrix Systems, Inc. | | | 11,111 | | | | 1,090,434 | |
Fortinet, Inc. (a) | | | 12,894 | | | | 990,646 | |
Intuit, Inc. | | | 23,029 | | | | 6,018,169 | |
Microsoft Corp. | | | 680,691 | | | | 91,185,366 | |
Oracle Corp. | | | 215,550 | | | | 12,279,884 | |
Red Hat, Inc. (a) | | | 15,790 | | | | 2,964,731 | |
salesforce.com, Inc. (a) | | | 68,981 | | | | 10,466,487 | |
Symantec Corp. | | | 54,915 | | | | 1,194,950 | |
Synopsys, Inc. (a) | | | 13,315 | | | | 1,713,507 | |
| | | | | | | | |
| | | | | | | 147,148,428 | |
| | | | | | | | |
Specialty Retail 2.3% | |
Advance Auto Parts, Inc. | | | 6,373 | | | | 982,334 | |
AutoZone, Inc. (a) | | | 2,179 | | | | 2,395,745 | |
Best Buy Co., Inc. | | | 20,638 | | | | 1,439,088 | |
CarMax, Inc. (a) | | | 14,763 | | | | 1,281,871 | |
Foot Locker, Inc. | | | 9,977 | | | | 418,236 | |
Gap, Inc. | | | 18,802 | | | | 337,872 | |
Home Depot, Inc. | | | 97,739 | | | | 20,326,780 | |
L Brands, Inc. | | | 20,374 | | | | 531,761 | |
Lowe’s Cos., Inc. | | | 69,547 | | | | 7,017,988 | |
O’Reilly Automotive, Inc. (a) | | | 6,953 | | | | 2,567,882 | |
Ross Stores, Inc. | | | 32,640 | | | | 3,235,277 | |
Tiffany & Co. | | | 9,598 | | | | 898,757 | |
TJX Cos., Inc. | | | 107,722 | | | | 5,696,339 | |
Tractor Supply Co. | | | 10,717 | | | | 1,166,010 | |
Ulta Beauty, Inc. (a) | | | 4,933 | | | | 1,711,208 | |
| | | | | | | | |
| | | | | | | 50,007,148 | |
| | | | | | | | |
Technology Hardware, Storage & Peripherals 3.9% | |
Apple, Inc. | | | 388,280 | | | | 76,848,378 | |
Hewlett Packard Enterprise Co. | | | 118,957 | | | | 1,778,407 | |
HP, Inc. | | | 133,804 | | | | 2,781,785 | |
NetApp, Inc. | | | 21,939 | | | | 1,353,636 | |
Seagate Technology PLC | | | 22,379 | | | | 1,054,499 | |
Western Digital Corp. | | | 26,027 | | | | 1,237,584 | |
Xerox Corp. | | | 17,359 | | | | 614,682 | |
| | | | | | | | |
| | | | | | | 85,668,971 | |
| | | | | | | | |
Textiles, Apparel & Luxury Goods 0.7% | |
Capri Holdings, Ltd. (a) | | | 13,408 | | | | 464,990 | |
Hanesbrands, Inc. | | | 32,109 | | | | 552,917 | |
NIKE, Inc., Class B | | | 111,635 | | | | 9,371,758 | |
PVH Corp. | | | 6,655 | | | | 629,829 | |
Ralph Lauren Corp. | | | 4,636 | | | | 526,603 | |
Tapestry, Inc. | | | 25,773 | | | | 817,777 | |
Under Armour, Inc. (a) | | | | | | | | |
Class A | | | 16,701 | | | | 423,371 | |
Class C | | | 17,256 | | | | 383,083 | |
VF Corp. | | | 28,929 | | | | 2,526,948 | |
| | | | | | | | |
| | | | | | | 15,697,276 | |
| | | | | | | | |
| | | | | | | | |
| | |
Shares | | | Value | |
Tobacco 0.8% | |
Altria Group, Inc. | | | 166,195 | | | $ | 7,869,333 | |
Philip Morris International, Inc. | | | 138,203 | | | | 10,853,082 | |
| | | | | | | | |
| | | | | | | 18,722,415 | |
| | | | | | | | |
Trading Companies & Distributors 0.2% | |
Fastenal Co. | | | 50,839 | | | | 1,656,843 | |
United Rentals, Inc. (a) | | | 6,985 | | | | 926,421 | |
W.W. Grainger, Inc. | | | 3,989 | | | | 1,069,969 | |
| | | | | | | | |
| | | | | | | 3,653,233 | |
| | | | | | | | |
Water Utilities 0.1% | |
American Water Works Co., Inc. | | | 16,036 | | | | 1,860,176 | |
| | | | | | | | |
Total Common Stocks (c)
(Cost $860,746,039) | | | | | | | 2,170,671,233 | |
| | | | | | | | |
|
| Short-Term Investments 1.7% | |
Affiliated Investment Company 0.0%‡ | |
MainStay U.S. Government Liquidity Fund, 2.03% (d) | | | 480,516 | | | | 480,516 | |
| | | | | | | | |
Total Affiliated Investment Company
(Cost $480,516) | | | | | | | 480,516 | |
| | | | | | | | |
| | |
| | | | | | | | |
| | | Principal
Amount | | | | |
| U.S. Government & Federal Agencies 1.7% | |
United States Treasury Bills (e) | | | | | | | | |
2.045%, due 7/5/19 | | $ | 600,000 | | | | 599,866 | |
2.054%, due 7/5/19 | | | 800,000 | | | | 799,820 | |
2.072%, due 10/3/19 | | | 500,000 | | | | 497,268 | |
2.094%, due 10/3/19 | | | 200,000 | | | | 198,907 | |
2.099%, due 10/3/19 | | | 400,000 | | | | 397,814 | |
2.146%, due 10/3/19 | | | 1,100,000 | | | | 1,093,990 | |
2.154%, due 10/3/19 | | | 100,000 | | | | 99,454 | |
2.188%, due 7/5/19 | | | 400,000 | | | | 399,904 | |
2.204%, due 7/5/19 | | | 5,300,000 | | | | 5,298,722 | |
2.255%, due 7/5/19 | | | 1,600,000 | | | | 1,599,605 | |
2.26%, due 7/25/19 (f) | | | 300,000 | | | | 299,556 | |
2.272%, due 7/5/19 | | | 300,000 | | | | 299,925 | |
2.274%, due 7/5/19 | | | 700,000 | | | | 699,826 | |
2.282%, due 7/5/19 | | | 1,300,000 | | | | 1,299,675 | |
2.313%, due 7/5/19 | | | 300,000 | | | | 299,924 | |
2.317%, due 7/5/19 | | | 1,100,000 | | | | 1,099,721 | |
2.318%, due 7/25/19 (f) | | | 200,000 | | | | 199,696 | |
2.319%, due 7/5/19 | | | 400,000 | | | | 399,899 | |
2.332%, due 7/5/19 | | | 1,200,000 | | | | 1,199,694 | |
2.334%, due 7/5/19 | | | 600,000 | | | | 599,847 | |
2.386%, due 7/5/19 | | | 500,000 | | | | 499,870 | |
2.404%, due 7/5/19 | | | 800,000 | | | | 799,790 | |
2.408%, due 7/5/19 | | | 600,000 | | | | 599,842 | |
2.411%, due 7/5/19 | | | 800,000 | | | | 799,790 | |
2.413%, due 7/5/19 | | | 400,000 | | | | 399,895 | |
| | | | | | |
The notes to the financial statements are an integral part of,
and should be read in conjunction with, the financial statements. | | | | | 15 | |
Portfolio of InvestmentsJune 30, 2019 (Unaudited) (continued)
| | | | | | | | |
| | | Principal
Amount | | | Value | |
| U.S. Government & Federal Agencies (continued) | |
United States Treasury Bills (continued) | |
2.415%, due 7/5/19 | | $ | 2,600,000 | | | $ | 2,599,315 | |
2.416%, due 7/5/19 | | | 700,000 | | | | 699,815 | |
2.418%, due 7/5/19 | | | 100,000 | | | | 99,974 | |
2.419%, due 7/25/19 (f) | | | 3,000,000 | | | | 2,995,257 | |
2.42%, due 7/5/19 | | | 1,000,000 | | | | 999,736 | |
2.422%, due 7/5/19 | | | 100,000 | | | | 99,974 | |
2.423%, due 7/5/19 | | | 300,000 | | | | 299,921 | |
2.424%, due 7/5/19 | | | 1,600,000 | | | | 1,599,577 | |
2.425%, due 7/5/19 | | | 4,600,000 | | | | 4,598,785 | |
2.427%, due 7/5/19 | | | 1,000,000 | | | | 999,735 | |
2.429%, due 7/5/19 | | | 1,200,000 | | | | 1,199,682 | |
2.43%, due 7/5/19 | | | 200,000 | | | | 199,947 | |
| | | | | | | | |
Total U.S. Government & Federal Agencies
(Cost $36,874,116) | | | | | | | 36,874,018 | |
| | | | | | | | |
TotalShort-Term Investments
(Cost $37,354,632) | | | | | | | 37,354,534 | |
| | | | | | | | |
Total Investments
(Cost $898,100,671) | | | 100.0 | % | | | 2,208,025,767 | |
Other Assets, Less Liabilities | | | (0.0 | )‡ | | | (453,795 | ) |
Net Assets | | | 100.0 | % | | $ | 2,207,571,972 | |
| † | Percentages indicated are based on Portfolio net assets. |
| ‡ | Less than one-tenth of a percent. |
| (a) | Non-income producing security. |
| (b) | All or a portion of this security was held on loan. As of June 30, 2019, the aggregate market value of securities on loan was $3,149,230 and the Portfolio received non-cash collateral in the form of U.S. Treasury securities with a value of $3,212,682 (See Note 2(I)). |
| (c) | The combined market value of common stocks and notional amount of Standard & Poor’s 500 Index futures contracts represents 100.0% of net assets. |
| (d) | Current yield as of June 30, 2019. |
| (e) | Interest rate shown represents yield to maturity. |
| (f) | Represents a security, or a portion thereof, which is maintained at a broker as collateral for futures contracts. |
As of June 30, 2019, the Portfolio held the following futures contracts:
| | | | | | | | | | | | | | | | | | | | |
Type | | Number of
Contracts | | | Expiration
Date | | | Value at
Trade Date | | | Current
Notional
Amount | | | Unrealized
Appreciation
(Depreciation)1 | |
Long Contracts | | | | | | | | | | | | | | | | | | | | |
| S&P 500 Index Mini | | | 244 | | | | September 2019 | | | $ | 35,747,882 | | | $ | 35,919,240 | | | $ | 171,358 | |
| | | | | | | | | | | | | | | | | | | | |
| 1. | Represents the difference between the value of the contracts at the time they were opened and the value as of June 30, 2019. |
The following is a summary of the fair valuations according to the inputs used as of June 30, 2019, for valuing the Portfolio’s assets:
| | | | | | | | | | | | | | | | |
Description | | Quoted
Prices in
Active
Markets for
Identical
Assets
(Level 1) | | | Significant
Other
Observable
Inputs
(Level 2) | | | Significant
Unobservable
Inputs
(Level 3) | | | Total | |
| | | | |
Asset Valuation Inputs | | | | | | | | | | | | | | | | |
| Investments in Securities (a) | | | | | | | | | | | | | | | | |
| Common Stocks | | $ | 2,170,671,233 | | | $ | — | | | $ | — | | | $ | 2,170,671,233 | |
| Short-Term Investments | | | | | | | | | | | | | | | | |
Affiliated Investment Company | | | 480,516 | | | | — | | | | — | | | | 480,516 | |
U.S. Government & Federal Agencies | | | — | | | | 36,874,018 | | | | — | | | | 36,874,018 | |
| | | | | | | | | | | | | | | | |
| TotalShort-Term Investments | | | 480,516 | | | | 36,874,018 | | | | — | | | | 37,354,534 | |
| | | | | | | | | | | | | | | | |
| Total Investments in Securities | | | 2,171,151,749 | | | | 36,874,018 | | | | — | | | | 2,208,025,767 | |
| | | | | | | | | | | | | | | | |
| Other Financial Instruments | | | | | | | | | | | | | | | | |
Futures Contracts (b) | | | 171,358 | | | | — | | | | — | | | | 171,358 | |
| | | | | | | | | | | | | | | | |
| Total Investments in Securities and Other Financial Instruments | | $ | 2,171,323,107 | | | $ | 36,874,018 | | | $ | — | | | $ | 2,208,197,125 | |
| | | | | | | | | | | | | | | | |
| (a) | For a complete listing of investments and their industries, see the Portfolio of Investments. |
| (b) | The value listed for these securities reflects unrealized appreciation (depreciation) as shown on the Portfolio of Investments. |
| | | | |
| 16 | | MainStay VP MacKay S&P 500 Index Portfolio | | The notes to the financial statements are an integral part of,
and should be read in conjunction with, the financial statements. |
Statement of Assets and Liabilitiesas of June 30, 2019 (Unaudited)
| | | | |
| Assets | | | | |
Investment in unaffiliated securities, at value
(identified cost $897,620,155) including securities on loan of $3,149,230 | | $ | 2,207,545,251 | |
Investment in affiliated investment company, at value (identified cost $480,516) | | | 480,516 | |
Receivables: | | | | |
Dividends | | | 1,765,473 | |
Portfolio shares sold | | | 625,729 | |
Variation margin on futures contracts | | | 167,002 | |
Securities lending | | | 736 | |
Other assets | | | 9,866 | |
| | | | |
Total assets | | | 2,210,594,573 | |
| | | | |
| |
| Liabilities | | | | |
Due to custodian | | | 397,781 | |
Payables: | | | | |
Investment securities purchased | | | 1,124,362 | |
Portfolio shares redeemed | | | 882,548 | |
Manager (See Note 3) | | | 243,185 | |
NYLIFE Distributors (See Note 3) | | | 232,599 | |
Shareholder communication | | | 64,819 | |
Professional fees | | | 46,812 | |
Custodian | | | 16,974 | |
Trustees | | | 2,503 | |
Accrued expenses | | | 11,018 | |
| | | | |
Total liabilities | | | 3,022,601 | |
| | | | |
Net assets | | $ | 2,207,571,972 | |
| | | | |
| |
| Composition of Net Assets | | | | |
Shares of beneficial interest outstanding (par value of $.001 per share) unlimited number of shares authorized | | $ | 38,924 | |
Additional paid-in capital | | | 841,240,901 | |
| | | | |
| | | 841,279,825 | |
Total distributable earnings (loss) | | | 1,366,292,147 | |
| | | | |
Net assets | | $ | 2,207,571,972 | |
| | | | |
| | | | |
Initial Class | | | | |
Net assets applicable to outstanding shares | | $ | 1,049,160,070 | |
| | | | |
Shares of beneficial interest outstanding | | | 18,411,360 | |
| | | | |
Net asset value per share outstanding | | $ | 56.98 | |
| | | | |
Service Class | | | | |
Net assets applicable to outstanding shares | | $ | 1,158,411,902 | |
| | | | |
Shares of beneficial interest outstanding | | | 20,512,931 | |
| | | | |
Net asset value per share outstanding | | $ | 56.47 | |
| | | | |
| | | | | | |
The notes to the financial statements are an integral part of,
and should be read in conjunction with, the financial statements. | | | | | 17 | |
Statement of Operationsfor the six months ended June 30, 2019 (Unaudited)
| | | | |
| Investment Income (Loss) | | | | |
Income | | | | |
Dividends-unaffiliated | | $ | 21,585,296 | |
Interest | | | 655,499 | |
Securities lending | | | 55,260 | |
Dividends-affiliated | | | 15,536 | |
| | | | |
Total income | | | 22,311,591 | |
| | | | |
Expenses | | | | |
Manager (See Note 3) | | | 1,710,323 | |
Distribution/Service—Service Class (See Note 3) | | | 1,331,586 | |
Professional fees | | | 85,688 | |
Shareholder communication | | | 71,627 | |
Trustees | | | 26,263 | |
Custodian | | | 17,530 | |
Miscellaneous | | | 42,825 | |
| | | | |
Total expenses before waiver/reimbursement | | | 3,285,842 | |
Expense waiver/reimbursement from Manager (See Note 3) | | | (243,844 | ) |
| | | | |
Net expenses | | | 3,041,998 | |
| | | | |
Net investment income (loss) | | | 19,269,593 | |
| | | | |
|
| Realized and Unrealized Gain (Loss) on Investments and Futures Contracts | |
Net realized gain (loss) on: | | | | |
Unaffiliated investment transactions | | | (273,657 | ) |
Futures transactions | | | 7,097,052 | |
| | | | |
Net realized gain (loss) on investments and futures transactions | | | 6,823,395 | |
| | | | |
Net change in unrealized appreciation (depreciation) on: | | | | |
Unaffiliated investments | | | 326,507,596 | |
Futures contracts | | | 1,354,163 | |
| | | | |
Net change in unrealized appreciation (depreciation) on investments and futures contracts | | | 327,861,759 | |
| | | | |
Net realized and unrealized gain (loss) on investments and futures transactions | | | 334,685,154 | |
| | | | |
Net increase (decrease) in net assets resulting from operations | | $ | 353,954,747 | |
| | | | |
| | | | |
| 18 | | MainStay VP MacKay S&P 500 Index Portfolio | | The notes to the financial statements are an integral part of,
and should be read in conjunction with, the financial statements. |
Statements of Changes in Net Assets
for the six months ended June 30, 2019 (Unaudited) and the year ended December 31, 2018
| | | | | | | | |
| | | 2019 | | | 2018 | |
| Increase (Decrease) in Net Assets | |
Operations: | | | | | | | | |
Net investment income (loss) | | $ | 19,269,593 | | | $ | 37,758,154 | |
Net realized gain (loss) on investments and futures contracts | | | 6,823,395 | | | | 12,120,271 | |
Net change in unrealized appreciation (depreciation) on investments and futures contracts | | | 327,861,759 | | | | (147,972,517 | ) |
| | | | |
Net increase (decrease) in net assets resulting from operations | | | 353,954,747 | | | | (98,094,092 | ) |
| | | | |
Distributions to shareholders: | | | | | | | | |
Initial Class | | | — | | | | (36,895,690 | ) |
Service Class | | | — | | | | (30,790,988 | ) |
| | | | |
Total distributions to shareholders | | | — | | | | (67,686,678 | ) |
| | | | |
Capital share transactions: | | | | | | | | |
Net proceeds from sale of shares | | | 133,092,760 | | | | 364,267,496 | |
Net asset value of shares issued to shareholders in reinvestment of dividends and distributions | | | — | | | | 67,686,678 | |
Cost of shares redeemed | | | (201,917,917 | ) | | | (397,688,197 | ) |
| | | | |
Increase (decrease) in net assets derived from capital share transactions | | | (68,825,157 | ) | | | 34,265,977 | |
| | | | |
Net increase (decrease) in net assets | | | 285,129,590 | | | | (131,514,793 | ) |
| | |
| Net Assets | | | | | | | | |
Beginning of period | | | 1,922,442,382 | | | | 2,053,957,175 | |
| | | | |
End of period | | $ | 2,207,571,972 | | | $ | 1,922,442,382 | |
| | | | |
| | | | | | |
The notes to the financial statements are an integral part of,
and should be read in conjunction with, the financial statements. | | | | | 19 | |
Financial Highlightsselected per share data and ratios
| | | | | | | | | | | | | | | | | | | | | | | | | | | | |
| | | |
| | | Six months
ended
June 30, | | | | | | Year ended December 31, | |
| | | | | | | |
| Initial Class | | 2019* | | | | | | 2018 | | | 2017 | | | 2016 | | | 2015 | | | 2014 | |
| | | | | | | |
Net asset value at beginning of period | | $ | 48.11 | | | | | | | $ | 52.02 | | | $ | 44.05 | | | $ | 41.29 | | | $ | 41.99 | | | $ | 37.58 | |
| | | | | | | | | | | | | | | | | | | | | | | | | | | | |
| | | | | | | |
Net investment income (loss) (a) | | | 0.52 | | | | | | | | 1.04 | | | | 0.80 | | | | 0.70 | | | | 0.70 | | | | 0.66 | |
| | | | | | | |
Net realized and unrealized gain (loss) on investments | | | 8.35 | | | | | | | | (3.15 | ) | | | 8.60 | | | | 4.02 | | | | (0.29 | ) | | | 4.34 | |
| | | | | | | | | | | | | | | | | | | | | | | | | | | | |
| | | | | | | |
Total from investment operations | | | 8.87 | | | | | | | | (2.11 | ) | | | 9.40 | | | | 4.72 | | | | 0.41 | | | | 5.00 | |
| | | | | | | | | | | | | | | | | | | | | | | | | | | | |
| | | | | | | |
| Less dividends and distributions: | | | | | | | | | | | | | | | | | | | | | | | | | | | | |
| | | | | | | |
From net investment income | | | — | | | | | | | | (0.78 | ) | | | (0.70 | ) | | | (0.70 | ) | | | (0.60 | ) | | | (0.59 | ) |
| | | | | | | |
From net realized gain on investments | | | — | | | | | | | | (1.02 | ) | | | (0.73 | ) | | | (1.26 | ) | | | (0.51 | ) | | | — | |
| | | | | | | | | | | | | | | | | | | | | | | | | | | | |
| | | | | | | |
Total dividends and distributions | | | — | | | | | | | | (1.80 | ) | | | (1.43 | ) | | | (1.96 | ) | | | (1.11 | ) | | | (0.59 | ) |
| | | | | | | | | | | | | | | | | | | | | | | | | | | | |
| | | | | | | |
Net asset value at end of period | | $ | 56.98 | | | | | | | $ | 48.11 | | | $ | 52.02 | | | $ | 44.05 | | | $ | 41.29 | | | $ | 41.99 | |
| | | | | | | | | | | | | | | | | | | | | | | | | | | | |
| | | | | | | |
Total investment return (b) | | | 18.44 | % | | | | | | | (4.52 | %) | | | 21.49 | % | | | 11.62 | % | | | 1.10 | % | | | 13.35 | % |
| | | | | | | |
| Ratios (to average net assets)/Supplemental Data: | | | | | | | | | | | | | | | | | | | | | | | | | | | | |
| | | | | | | |
Net investment income (loss) | | | 1.93 | %†† | | | | | | | 1.95 | % | | | 1.65 | % | | | 1.66 | % | | | 1.67 | % | | | 1.68 | % |
| | | | | | | |
Net expenses (c) | | | 0.16 | %†† | | | | | | | 0.16 | % | | | 0.22 | % | | | 0.28 | % | | | 0.27 | % | | | 0.28 | % |
| | | | | | | |
Expenses (before waiver/reimbursement) (c) | | | 0.18 | %†† | | | | | | | 0.19 | % | | | 0.23 | % | | | 0.28 | % | | | 0.27 | % | | | 0.28 | % |
| | | | | | | |
Portfolio turnover rate | | | 6 | % | | | | | | | 9 | % | | | 3 | % | | | 3 | % | | | 3 | % | | | 3 | % |
| | | | | | | |
Net assets at end of period (in 000’s) | | $ | 1,049,160 | | | | | | | $ | 1,001,911 | | | $ | 1,156,346 | | | $ | 899,633 | | | $ | 1,017,929 | | | $ | 890,188 | |
| (a) | Per share data based on average shares outstanding during the period. |
| (b) | Total return does not reflect any deduction of sales charges, mortality and expense charges, contract charges or administrative charges. For periods of less than one year, total return is not annualized. |
| (c) | In addition to the fees and expenses which the Portfolio bears directly, it also indirectly bears a pro-rata share of the fees and expenses of the underlying funds in which it invests. Such indirect expenses are not included in the above expense ratios. |
| | | | | | | | | | | | | | | | | | | | | | | | | | | | |
| | | |
| | | Six months
ended
June 30, | | | | | | Year ended December 31, | |
| | | | | | | |
| Service Class | | 2019* | | | | | | 2018 | | | 2017 | | | 2016 | | | 2015 | | | 2014 | |
| | | | | | | |
Net asset value at beginning of period | | $ | 47.74 | | | | | | | $ | 51.66 | | | $ | 43.80 | | | $ | 41.08 | | | $ | 41.79 | | | $ | 37.44 | |
| | | | | | | | | | | | | | | | | | | | | | | | | | | | |
| | | | | | | |
Net investment income (loss) (a) | | | 0.45 | | | | | | | | 0.90 | | | | 0.67 | | | | 0.59 | | | | 0.60 | | | | 0.56 | |
| | | | | | | |
Net realized and unrealized gain (loss) on investments | | | 8.28 | | | | | | | | (3.13 | ) | | | 8.54 | | | | 4.00 | | | | (0.28 | ) | | | 4.30 | |
| | | | | | | | | | | | | | | | | | | | | | | | | | | | |
| | | | | | | |
Total from investment operations | | | 8.73 | | | | | | | | (2.23 | ) | | | 9.21 | | | | 4.59 | | | | 0.32 | | | | 4.86 | |
| | | | | | | | | | | | | | | | | | | | | | | | | | | | |
| | | | | | | |
| Less dividends and distributions: | | | | | | | | | | | | | | | | | | | | | | | | | | | | |
| | | | | | | |
From net investment income | | | — | | | | | | | | (0.67 | ) | | | (0.62 | ) | | | (0.61 | ) | | | (0.52 | ) | | | (0.51 | ) |
| | | | | | | |
From net realized gain on investments | | | — | | | | | | | | (1.02 | ) | | | (0.73 | ) | | | (1.26 | ) | | | (0.51 | ) | | | — | |
| | | | | | | | | | | | | | | | | | | | | | | | | | | | |
| | | | | | | |
Total dividends and distributions | | | — | | | | | | | | (1.69 | ) | | | (1.35 | ) | | | (1.87 | ) | | | (1.03 | ) | | | (0.51 | ) |
| | | | | | | | | | | | | | | | | | | | | | | | | | | | |
| | | | | | | |
Net asset value at end of period | | $ | 56.47 | | | | | | | $ | 47.74 | | | $ | 51.66 | | | $ | 43.80 | | | $ | 41.08 | | | $ | 41.79 | |
| | | | | | | | | | | | | | | | | | | | | | | | | | | | |
| | | | | | | |
Total investment return (b) | | | 18.29 | % | | | | | | | (4.76 | %) | | | 21.19 | % | | | 11.34 | % | | | 0.85 | % | | | 13.06 | % |
| | | | | | | |
| Ratios (to average net assets)/Supplemental Data: | | | | | | | | | | | | | | | | | | | | | | | | | | | | |
| | | | | | | |
Net investment income (loss) | | | 1.68 | %†† | | | | | | | 1.70 | % | | | 1.40 | % | | | 1.41 | % | | | 1.42 | % | | | 1.43 | % |
| | | | | | | |
Net expenses (c) | | | 0.41 | %†† | | | | | | | 0.41 | % | | | 0.47 | % | | | 0.53 | % | | | 0.52 | % | | | 0.53 | % |
| | | | | | | |
Expenses (before waiver/reimbursement) (c) | | | 0.43 | %†† | | | | | | | 0.44 | % | | | 0.48 | % | | | 0.53 | % | | | 0.52 | % | | | 0.53 | % |
| | | | | | | |
Portfolio turnover rate | | | 6 | % | | | | | | | 9 | % | | | 3 | % | | | 3 | % | | | 3 | % | | | 3 | % |
| | | | | | | |
Net assets at end of period (in 000’s) | | $ | 1,158,412 | | | | | | | $ | 920,531 | | | $ | 897,611 | | | $ | 613,011 | | | $ | 476,730 | | | $ | 423,009 | |
| (a) | Per share data based on average shares outstanding during the period. |
| (b) | Total return does not reflect any deduction of sales charges, mortality and expense charges, contract charges or administrative charges. For periods of less than one year, total return is not annualized. |
| (c) | In addition to the fees and expenses which the Portfolio bears directly, it also indirectly bears a pro-rata share of the fees and expenses of the underlying funds in which it invests. Such indirect expenses are not included in the above expense ratios. |
| | | | |
| 20 | | MainStay VP MacKay S&P 500 Index Portfolio | | The notes to the financial statements are an integral part of,
and should be read in conjunction with, the financial statements. |
Notes to Financial Statements(Unaudited)
Note 1–Organization and Business
MainStay VP Funds Trust (the “Fund”) was organized as a Delaware statutory trust on February 1, 2011. The Fund is registered under the Investment Company Act of 1940, as amended (the “1940 Act”), as an open-end management investment company. The Fund is comprised of thirty-one separate series (collectively referred to as the “Portfolios”). These financial statements and notes relate to the MainStay VP MacKay S&P 500 Index Portfolio (the “Portfolio”), a “diversified” portfolio, as that term is defined in the 1940 Act, as interpreted or modified by regulatory authorities having jurisdiction, from time to time.
Shares of the Portfolio are currently offered to certain separate accounts to fund variable annuity policies and variable universal life insurance policies issued by New York Life Insurance and Annuity Corporation (“NYLIAC”), awholly-owned subsidiary of New York Life Insurance Company (“New York Life”) and may also be offered to fund variable annuity policies and variable universal life insurance policies issued by other insurance companies. NYLIAC allocates shares of the Portfolios to, among others, certain NYLIAC separate accounts. Shares of the Portfolio are also offered to the MainStay VP Conservative Allocation Portfolio, MainStay VP Moderate Allocation Portfolio, MainStay VP Moderate Growth Allocation Portfolio and MainStay VP Growth Allocation Portfolio, which operate as “funds-of-funds.”
The Portfolio currently offers two classes of shares. Initial Class shares commenced operations on January 29, 1993. Service Class shares commenced operations on June 5, 2003. Shares of the Portfolio are offered and are redeemed at a price equal to their respective net asset value (“NAV”) per share. No sales or redemption charge is applicable to the purchase or redemption of the Portfolio’s shares. Under the terms of the Fund’s multiple class plan adopted pursuant to Rule 18f-3 under the 1940 Act, the classes differ in that, among other things, Service Class shares of the Portfolio pay a combined distribution and service fee of 0.25% of average daily net assets attributable to Service Class shares of the Portfolio to the Distributor (as defined in Note 3(B)) pursuant to a plan adopted in accordance with Rule 12b-1 under the 1940 Act. Contract owners of variable annuity contracts purchased after June 2, 2003, are permitted to invest only in the Service Class shares.
The Portfolio’s investment objective is to seek investment results that correspond to the total return performance (reflecting reinvestment of dividends) of common stocks in the aggregate, as represented by the S&P 500® Index.
Note 2–Significant Accounting Policies
The Portfolio is an investment company and accordingly follows the investment company accounting and reporting guidance of the Financial Accounting Standards Board (“FASB”) Accounting Standard CodificationTopic 946 Financial Services—Investment Companies. The Portfolio prepares its financial statements in accordance with generally accepted accounting principles (“GAAP”) in the United States of America and follows the significant accounting policies described below.
(A) Securities Valuation. Investments are usually valued as of the close of regular trading on the New York Stock Exchange (the “Exchange”) (usually 4:00 p.m. Eastern time) on each day the Portfolio is open for business (“valuation date”).
The Board of Trustees of the Fund (the “Board”) adopted procedures establishing methodologies for the valuation of the Portfolio’s securities and other assets and delegated the responsibility for valuation determinations under those procedures to the Valuation Committee of the Fund (the “Valuation Committee”). The Board authorized the Valuation Committee to appoint a Valuation Subcommittee (the “Subcommittee”) to deal in the first instance with establishing the prices of securities for which market quotations are not readily available or the prices of which are not otherwise readily determinable under these procedures. The Subcommittee meets (in person, via electronic mail or via teleconference) on an as-needed basis. Subsequently, the Valuation Committee meets to ensure that actions taken by the Subcommittee were appropriate. The procedures state that, subject to the oversight of the Board and unless otherwise noted, the responsibility for theday-to-day valuation of portfolio assets (including fair value measurements for the Portfolio’s assets and liabilities) rests with New York Life Investment Management LLC (“New York Life Investments” or the “Manager”), aided to whatever extent necessary by the Subadvisor (as defined in Note 3(A)).
To assess the appropriateness of security valuations, the Manager, the Subadvisor or the Portfolio’s third-party service provider, who is subject to oversight by the Manager, regularly compares prior day prices, prices on comparable securities and the sale prices to the prior and current day prices and challenges prices with changes exceeding certain tolerance levels with third-party pricing services or broker sources. For those securities valued through either a standardized fair valuation methodology or a fair valuation measurement, the Subcommittee deals in the first instance with such valuation and the Valuation Committee reviews and affirms, if appropriate, the reasonableness of the valuation based on such methodologies and measurements on a regular basis after considering information that is reasonably available and deemed relevant by the Valuation Committee. Any action taken by the Subcommittee with respect to the valuation of a portfolio security or other asset is submitted for review and ratification (if appropriate) to the Valuation Committee and the Board at the next regularly scheduled meeting.
“Fair value” is defined as the price the Portfolio would reasonably expect to receive upon selling an asset or liability in an orderly transaction to an independent buyer in the principal or most advantageous market for the asset or liability. Fair value measurements are determined within a framework that establishes a three-tier hierarchy which maximizes the use of observable market data and minimizes the use of unobservable inputs to establish a classification of fair value measurements for disclosure purposes. “Inputs” refer broadly to the assumptions that market participants would use in pricing the asset or liability, including assumptions about risk, such as the risk inherent in a particular valuation technique used to measure fair value using a pricing model and/or the risk inherent in the inputs for the valuation technique. Inputs may be observable or unobservable. Observable inputs reflect the assumptions market participants would use in pricing the asset or liability based on market data obtained from sources independent of the Portfolio. Unobservable inputs reflect the Portfolio’s own assumptions about the assumptions market participants would use in pricing the asset or liability based on the information available. The inputs or methodology used for valuing assets or liabilities may not be an indication of the risks
Notes to Financial Statements(Unaudited) (continued)
associated with investing in those assets or liabilities. The three-tier hierarchy of inputs is summarized below.
| • | | Level 1—quoted prices in active markets for an identical asset or liability |
| • | | Level 2—other significant observable inputs (including quoted prices for a similar asset or liability in active markets, interest rates and yield curves, prepayment speeds, credit risk, etc.) |
| • | | Level 3—significant unobservable inputs (including the Portfolio’s own assumptions about the assumptions that market participants would use in measuring fair value of an asset or liability) |
The level of an asset or liability within the fair value hierarchy is based on the lowest level of an input, both individually and in the aggregate, that is significant to the fair value measurement. As of June 30, 2019, the aggregate value by input level of the Portfolio’s assets and liabilities is included at the end of the Portfolio’s Portfolio of Investments.
The Portfolio may use third-party vendor evaluations, whose prices may be derived from one or more of the following standard inputs, among others:
| | |
• Broker/dealer quotes | | • Benchmark securities |
• Two-sided markets | | • Reference data (corporate actions or material event notices) |
• Bids/offers | | • Monthly payment information |
• Industry and economic events | | • Reported trades |
An asset or liability for which market values cannot be measured using the methodologies described above is valued by methods deemed reasonable in good faith by the Valuation Committee, following the procedures established by the Board, to represent fair value. Under these procedures, the Portfolio generally uses a market-based approach which may use related or comparable assets or liabilities, recent transactions, market multiples, book values and other relevant information. The Portfolio may also use an income-based valuation approach in which the anticipated future cash flows of the asset or liability are discounted to calculate fair value. Discounts may also be applied due to the nature and/or duration of any restrictions on the disposition of the asset or liability. Fair value represents a good faith approximation of the value of a security. Fair value determinations involve the consideration of a number of subjective factors, an analysis of applicable facts and circumstances and the exercise of judgment. As a result, it is possible that the fair value for a security determined in good faith in accordance with the Portfolio’s valuation procedures may differ from valuations for the same security determined by other funds using their own valuation procedures. Although the Portfolio’s valuation procedures are designed to value a security at the price the Portfolio may reasonably expect to receive upon the security’s sale in an orderly transaction, there can be no assurance that any fair value determination thereunder would, in fact, approximate the amount that the Portfolio would actually realize upon the sale of the security or the price at which the security would trade if a reliable market price were readily available. During the six-month period ended June 30, 2019, there were no material changes to the fair value methodologies.
Securities which may be valued in this manner include, but are not limited to: (i) a security for which trading has been halted or suspended;
(ii) a debt security that has recently gone into default and for which there is not a current market quotation; (iii) a security of an issuer that has entered into a restructuring; (iv) a security that has been delisted from a national exchange; (v) a security for which the market price is not readily available from a third-party pricing source or, if so provided, does not, in the opinion of the Manager or the Subadvisor, reflect the security’s market value; (vi) a security subject to trading collars for which no or limited trading takes place; and (vii) a security whose principal market has been temporarily closed at a time when, under normal conditions, it would be open. Securities valued in this manner are generally categorized as Level 3 in the hierarchy. As of June 30, 2019, there were no securities held by the Portfolio that were fair valued in such a manner.
Equity securities, including shares of exchange-traded funds (“ETFs”), are valued at the last quoted sales prices as of the close of regular trading on the relevant exchange on each valuation date. Securities that are not traded on the valuation date are valued at the mean of the last quoted bid and ask prices. Prices are normally taken from the principal market in which each security trades. Futures contracts are valued at the last posted settlement price on the market where such futures are primarily traded. Investments in mutual funds, including money market funds, are valued at their respective Net Asset Value (“NAV”) as of the close of the Exchange on the valuation date. These securities are generally categorized as Level 1 in the hierarchy.
Investments in mutual funds, including money market funds, are valued at their respective NAVs as of the close of the Exchange on the valuation date. These securities are generally categorized as Level 1 in the hierarchy.
Temporary cash investments acquired in excess of 60 days to maturity at the time of purchase are valued using the latest bid prices or using valuations based on a matrix system (which considers such factors as security prices, yields, maturities and ratings), both as furnished by independent pricing services. Other temporary cash investments which mature in 60 days or less at the time of purchase (“Short-Term Investments”) are valued using the amortized cost method of valuation, unless the use of such method would be inappropriate. The amortized cost method involves valuing a security at its cost on the date of purchase and thereafter assuming a constant amortization to maturity of the difference between such cost and the value on maturity date. Amortized cost approximates the current fair value of a security. Securities valued using the amortized cost method are not valued using quoted prices in an active market and are generally categorized as Level 2 in the hierarchy.
The information above is not intended to reflect an exhaustive list of the methodologies that may be used to value portfolio investments. The valuation procedures permit the use of a variety of valuation methodologies in connection with valuing portfolio investments. The methodology used for a specific type of investment may vary based on the market data available or other considerations. The methodologies summarized above may not represent the specific means by which portfolio investments are valued on any particular business day.
(B) Income Taxes. The Portfolio’s policy is to comply with the requirements of the Internal Revenue Code of 1986, as amended (the “Internal Revenue Code”), applicable to regulated investment companies and to distribute all of its taxable income to the shareholders of the
| | |
| 22 | | MainStay VP MacKay S&P 500 Index Portfolio |
Portfolio within the allowable time limits. Therefore, no federal, state and local income tax provisions are required.
Management evaluates the Portfolio’s tax positions to determine if the tax positions taken meet the minimum recognition threshold in connection with accounting for uncertainties in income tax positions taken or expected to be taken for the purposes of measuring and recognizing tax liabilities in the financial statements. Recognition of tax benefits of an uncertain tax position is permitted only to the extent the position is “more likely than not” to be sustained assuming examination by taxing authorities. Management has analyzed the Portfolio’s tax positions taken on federal, state and local income tax returns for all open tax years (for up to three tax years) and has concluded that no provisions for federal, state and local income tax are required in the Portfolio’s financial statements. The Portfolio’s federal, state and local income tax and federal excise tax returns for tax years for which the applicable statutes of limitations have not expired are subject to examination by the Internal Revenue Service and state and local departments of revenue.
(C) Dividends and Distributions to Shareholders. Dividends and distributions are recorded on the ex-dividend date. The Portfolio intends to declare and pay dividends from net investment income and distributions from net realized capital and currency gains, if any, at least annually. Unless the shareholder elects otherwise, all dividends and distributions are reinvested in the same class of shares of the Portfolio, at NAV. Dividends and distributions to shareholders are determined in accordance with federal income tax regulations and may differ from determinations using GAAP.
(D) Security Transactions and Investment Income. The Portfolio records security transactions on the trade date. Realized gains and losses on security transactions are determined using the identified cost method. Dividend income is recognized on the ex-dividend date; net of any foreign tax withheld at the source, and interest income is accrued as earned using the effective interest rate method.
Investment income and realized and unrealized gains and losses on investments of the Portfolio are allocated pro rata to the separate classes of shares based upon their relative net assets on the date the income is earned or realized and unrealized gains and losses are incurred.
(E) Expenses. Expenses of the Fund are allocated to the individual Portfolios in proportion to the net assets of the respective Portfolios when the expenses are incurred, except where direct allocations of expenses can be made. Expenses (other than fees incurred under the distribution and service plans, further discussed in Note 3(B), which are charged directly to the Service Class shares) are allocated to separate classes of shares pro rata based upon their relative net assets on the date the expenses are incurred. The expenses borne by the Portfolio, including those of related parties to the Portfolio, are shown in the Statement of Operations.
Additionally, the Portfolio may invest in ETFs and mutual funds, which are subject to management fees and other fees that may cause the costs of investing in ETFs and mutual funds to be greater than the costs of owning the underlying securities directly. These indirect expenses of mutual funds are not included in the amounts shown as expenses in the Portfolio’s Statement of Operations or in the expense ratios included in the Financial Highlights.
(F) Use of Estimates. In preparing financial statements in conformity with GAAP, management makes estimates and assumptions that affect the reported amounts and disclosures in the financial statements. Actual results could differ from those estimates.
(G) Repurchase Agreements. The Portfolio may enter into repurchase agreements (i.e., buy a security from another party with the agreement that it be sold back in the future) to earn income. The Portfolio may enter into repurchase agreements only with counterparties, usually financial institutions, that are deemed by the Manager or the Subadvisor to be creditworthy, pursuant to guidelines established by the Board. During the term of any repurchase agreement, the Manager or the Subadvisor will continue to monitor the creditworthiness of the counterparty. Under the 1940 Act, repurchase agreements are considered to be collateralized loans by the Portfolio to the counterparty secured by the securities transferred to the Portfolio.
Repurchase agreements are subject to counterparty risk, meaning the Portfolio could lose money by the counterparty’s failure to perform under the terms of the agreement. The Portfolio mitigates this risk by ensuring the repurchase agreement is collateralized by cash, U.S. government securities, fixed income securities and/or other securities. The collateral is held by the Portfolio’s custodian and valued daily on a mark to market basis to determine if the value, including accrued interest, exceeds the repurchase price. In the event of the counterparty’s default on the obligation to repurchase, the Portfolio has the right to liquidate the collateral and apply the proceeds in satisfaction of the obligation. Under certain circumstances, such as in the event of default or bankruptcy by the counterparty, realization and/or retention of the collateral may be limited or subject to delay, to legal proceedings and possible realized loss to the Portfolio. As of June 30, 2019, the Portfolio did not hold any repurchase agreements.
(H) Futures Contracts. A futures contract is an agreement to purchase or sell a specified quantity of an underlying instrument at a specified future date and price, or to make or receive a cash payment based on the value of a financial instrument (e.g., foreign currency, interest rate, security or securities index). The Portfolio is subject to risks such as market price risk and/or interest rate risk in the normal course of investing in these transactions. Upon entering into a futures contract, the Portfolio is required to pledge to the broker or futures commission merchant an amount of cash and/or U.S. government securities equal to a certain percentage of the collateral amount, known as the “initial margin.” During the period the futures contract is open, changes in the value of the contract are recognized as unrealized appreciation or depreciation by marking to market such contract on a daily basis to reflect the market value of the contract at the end of each day’s trading. The Portfolio agrees to receive from or pay to the broker or futures commission merchant an amount of cash equal to the daily fluctuation in the value of the contract. Such receipts or payments are known as “variation margin.” When the futures contract is closed, the Portfolio records a realized gain or loss equal to the difference between the proceeds from (or cost of) the closing transaction and the Portfolio’s basis in the contract.
The use of futures contracts involves, to varying degrees, elements of market risk in excess of the amount recognized in the Statement of Assets and Liabilities. The contract or notional amounts and variation margin reflect the extent of the Portfolio’s involvement in open futures positions. There are several risks associated with the use of futures
Notes to Financial Statements(Unaudited) (continued)
contracts as hedging techniques. There can be no assurance that a liquid market will exist at the time when the Portfolio seeks to close out a futures contract. If no liquid market exists, the Portfolio would remain obligated to meet margin requirements until the position is closed. Futures may involve a small initial investment relative to the risk assumed, which could result in losses greater than if they had not been used. Futures may be more volatile than direct investments in the instrument underlying the futures and may not correlate to the underlying instrument, causing a given hedge not to achieve its objectives. The Portfolio’s activities in futures contracts have minimal counterparty risk as they are conducted through regulated exchanges that guarantee the futures against default by the counterparty. In the event of a bankruptcy or insolvency of a futures commission merchant that holds margin on behalf of the Portfolio, the Portfolio may not be entitled to the return of the entire margin owed to the Portfolio, potentially resulting in a loss. The Portfolio’s investment in futures contracts and other derivatives may increase the volatility of the Portfolio’s NAVs and may result in a loss to the Portfolio. As of June 30, 2019, open futures contracts are shown in the Portfolio of Investments.
(I) Securities Lending. In order to realize additional income, the Portfolio may engage in securities lending, subject to the limitations set forth in the 1940 Act and relevant guidance by the staff of the Securities and Exchange Commission (“SEC”). In the event the Portfolio does engage in securities lending, the Portfolio will lend through its custodian, State Street Bank and Trust Company (“State Street”), acting as securities lending agent on behalf of the Portfolio. State Street will manage the Portfolio’s collateral in accordance with the securities lending agency agreement between the Portfolio and State Street, and indemnify the Portfolio against counterparty risk. The loans will be collateralized by cash (which may be invested in a money market fund) and/ornon-cash collateral (which may include, U.S. Treasury securities and/or U.S. Government Agency securities issued or guaranteed by the United States government or its agencies or instrumentalities) at least equal at all times to the market value of the securities loaned. The Portfolio may bear the risk of delay in recovery of, or loss of rights in, the securities loaned should the borrower of the securities experience financial difficulty. The Portfolio may also record a realized gain or loss on securities deemed sold due to a borrower’s inability to return securities on loan. The Portfolio bears the risk of any loss on investment of cash collateral. The Portfolio will receive compensation for lending its securities in the form of fees or it will retain a portion of interest on the investment of any cash collateral. The Portfolio will also continue to receive interest and dividends on the securities loaned and any gain or loss in the market price of the securities loaned that may occur during the term of the loan will be for the account of the Portfolio. Income earned from securities lending activities, if any, is reflected in the Statement of Operations. As of June 30, 2019, the Portfolio had securities on loan with an aggregate market value of $3,149,230 and receivednon-cash collateral in the form of U.S. Treasury securities with a value of $3,212,682.
(J) Indemnifications. Under the Fund’s organizational documents, its officers and trustees are indemnified against certain liabilities that may arise out of performance of their duties to the Fund. Additionally, in the normal course of business, the Portfolio enters into contracts with third-party service providers that contain a variety of representations and warranties and which may provide general indemnifications. The Portfolio’s maximum exposure under these arrangements is unknown,
as this would involve future claims that may be made against the Portfolio that have not yet occurred. Based on experience, management is of the view that the risk of loss in connection with these potential indemnification obligations is remote. However, there can be no assurance that material liabilities related to such obligations will not arise in the future, which could adversely impact the Portfolio.
(K) Quantitative Disclosure of Derivative Holdings. The following tables show additional disclosures related to the Portfolio’s derivative and hedging activities, including how such activities are accounted for and their effect on the Portfolio’s financial positions, performance and cash flows. The Portfolio entered into futures contracts to help manage the duration and yield curve positioning of the portfolio while minimizing the exposure to wider bid/ask spreads in traditional bonds. These derivatives are not accounted for as hedging instruments.
Fair value of derivative instruments as of June 30, 2019:
Asset Derivatives
| | | | | | | | | | |
| | | Statement of
Assets and
Liabilities
Location | | Equity
Contracts
Risk | | | Total | |
| | | |
Futures Contracts | | Net Assets— Net unrealized appreciation on investments and futures contracts (a) | | $ | 171,358 | | | $ | 171,358 | |
| | | | | | |
Total Fair Value | | | | $ | 171,358 | | | $ | 171,358 | |
| | | | | | |
| (a) | Includes cumulative appreciation (depreciation) of futures contracts as reported in the Portfolio of Investments. Only current day’s variation margin is reported within the Statement of Assets and Liabilities. |
The effect of derivative instruments on the Statement of Operations for the period ended June 30, 2019:
Realized Gain (Loss)
| | | | | | | | | | |
| | | Statement of
Operations
Location | | Equity
Contracts
Risk | | | Total | |
| | | |
Futures Contracts | | Net realized gain (loss) on futures transactions | | $ | 7,097,052 | | | $ | 7,097,052 | |
| | | | | | |
Total Realized Gain (Loss) | | | | $ | 7,097,052 | | | $ | 7,097,052 | |
| | | | | | |
Change in Unrealized Appreciation (Depreciation)
| | | | | | | | | | |
| | | Statement of
Operations
Location | | Equity
Contracts
Risk | | | Total | |
| | | |
Futures Contracts | | Net change in unrealized appreciation (depreciation) on futures contracts | | $ | 1,354,163 | | | $ | 1,354,163 | |
| | | | | | |
Total Change in Unrealized Appreciation (Depreciation) | | | | $ | 1,354,163 | | | $ | 1,354,163 | |
| | | | | | |
| | |
| 24 | | MainStay VP MacKay S&P 500 Index Portfolio |
Average Notional Amount
| | | | | | | | |
| | | Equity
Contracts
Risk | | | Total | |
| | |
Futures Contracts Long | | $ | 46,460,545 | | | $ | 46,460,545 | |
| | | | |
Note 3–Fees and Related Party Transactions
(A) Manager and Subadvisor. New York Life Investments, a registered investment adviser and an indirect,wholly-owned subsidiary of New York Life, serves as the Portfolio’s Manager, pursuant to an Amended and Restated Management Agreement (“Management Agreement”). The Manager provides offices, conducts clerical, recordkeeping and bookkeeping services and keeps most of the financial and accounting records required to be maintained by the Portfolio. Except for the portion of salaries and expenses that are the responsibility of the Portfolio, the Manager pays the salaries and expenses of all personnel affiliated with the Portfolio and certain operational expenses of the Portfolio. The Portfolio reimburses New York Life Investments in an amount equal to a portion of the compensation of the Chief Compliance Officer attributable to the Portfolio. MacKay Shields LLC (“MacKay Shields” or the “Subadvisor”), a registered investment adviser and an indirect,wholly-owned subsidiary of New York Life, serves as Subadvisor to the Portfolio and is responsible for theday-to-day portfolio management of the Portfolio. Pursuant to the terms of an Amended and Restated Subadvisory Agreement (“Subadvisory Agreement”) between New York Life Investments and MacKay Shields, New York Life Investments pays for the services of the Subadvisor.
The Fund, on behalf of the Portfolio, pays New York Life Investments in its capacity as the Portfolio’s investment manager and administrator, pursuant to the Management Agreement, a monthly fee for the services performed and the facilities furnished at an annual rate of average daily net assets as follows: 0.16% up to $2.5 billion and 0.15% in excess of $2.5 billion.
New York Life Investments has contractually agreed to waive fees and/or reimburse expenses so that Total Annual Portfolio Operating Expenses (excluding taxes, interest, litigation, extraordinary expenses, brokerage and other transaction expenses relating to the purchase or sale of portfolio investments, and acquired (underlying) portfolio/fund fees and expenses) of Initial Class shares do not exceed 0.16% of
average daily net assets. New York Life Investments will apply an equivalent waiver or reimbursement, in an equal number of basis points to Service Class shares. This agreement will remain in effect until May 1, 2020, and shall renew automatically for one-year terms unless New York Life Investments provides written notice of termination prior to the start of the next term or upon approval of the Board of Trustees of the Portfolio. During the six-month period ended June 30, 2019, the effective management fee rate was 0.16% (exclusive of any applicable waivers/reimbursements).
During the six-month period ended June 30, 2019, New York Life Investments earned fees from the Portfolio in the amount of $1,710,323 and waived fees/reimbursed expenses in the amount of $243,844, and paid the Subadvisor in the amount of $733,239.
State Street providessub-administration andsub-accounting services to the Portfolio pursuant to an agreement with New York Life Investments. These services include calculating the daily NAVs of the Portfolio, maintaining the general ledger andsub-ledger accounts for the calculation of the Portfolio’s NAVs and assisting New York Life Investments in conducting various aspects of the Portfolio’s administrative operations. For providing these services to the Portfolio, State Street is compensated by New York Life Investments.
Pursuant to an agreement between the Fund and New York Life Investments, New York Life Investments is responsible for providing or procuring certain regulatory reporting services for the Portfolio. The Portfolio will reimburse New York Life Investments for the actual costs incurred by New York Life Investments in connection with providing or procuring these services for the Portfolio.
(B) Distribution and Service Fees. The Fund, on behalf of the Portfolio, has entered into a distribution agreement with NYLIFE Distributors LLC (the “Distributor”), an indirect,wholly-owned subsidiary of New York Life. The Portfolio has adopted a distribution plan (the “Plan”) in accordance with the provisions of Rule 12b-1 under the 1940 Act. Under the Plan, the Distributor has agreed to provide, through its affiliates or independent third parties, various distribution-related, shareholder and administrative support services to the Service Class shareholders. For its services, the Distributor is entitled to a combined distribution and service fee accrued daily and paid monthly at an annual rate of 0.25% of the average daily net assets attributable to the Service Class shares of the Portfolio.
(C) Investments in Affiliates (in 000’s). During the six-month period ended June 30, 2019, purchases and sales transactions, income earned from investments and shares held of investment companies managed by New York Life Investments or its affiliates were as follows:
| | | | | | | | | | | | | | | | | | | | | | | | | | | | | | | | | | | | |
Affiliated Investment Company | | Value,
Beginning
of Period | | | Purchases
at Cost | | | Proceeds
from Sales | | | Net
Realized
Gain/(Loss)
on Sales | | | Change in
Unrealized
Appreciation/
(Depreciation) | | | Value,
End of
Period | | | Dividend
Income | | | Other
Distributions | | | Shares
End of
Period | |
MainStay U.S. Government Liquidity Fund | | $ | 782 | | | $ | 164,321 | | | $ | (164,622 | ) | | $ | — | | | $ | — | | | $ | 481 | | | $ | 16 | | | $ | — | | | | 481 | |
Notes to Financial Statements(Unaudited) (continued)
Note 4–Federal Income Tax
As of June 30, 2019, the cost and unrealized appreciation (depreciation) of the Portfolio’s investment portfolio, including applicable derivative contracts and other financial instruments, as determined on a federal income tax basis, were as follows:
| | | | | | | | | | | | | | | | |
| | | Federal Tax
Cost | | | Gross
Unrealized
Appreciation | | | Gross
Unrealized
(Depreciation) | | | Net Unrealized
Appreciation/
(Depreciation) | |
| | | | |
Investments in Securities | | $ | 917,684,828 | | | $ | 1,331,891,687 | | | $ | (41,550,748 | ) | | $ | 1,290,340,939 | |
During the year ended December 31, 2018, the tax character of distributions paid as reflected in the Statements of Changes in Net Assets was as follows:
| | | | | | |
| 2018 | |
Tax-Based
Distributions
from Ordinary
Income | | | Tax-Based
Distributions
from Long-Term
Gains | |
| |
| | $41,885,167 | | | $ | 25,801,511 | |
Note 5–Custodian
State Street is the custodian of cash and securities held by the Portfolio. Custodial fees are charged to the Portfolio based on the Portfolio’s net assets and/or the market value of securities held by the Portfolio and the number of certain transactions incurred by the Portfolio.
Note 6–Line of Credit
The Portfolio and certain other funds managed by New York Life Investments maintain a line of credit with a syndicate of banks in order to secure a source of funds for temporary purposes to meet unanticipated or excessive redemption requests.
Effective July 30, 2019, under the credit agreement (the “Credit Agreement”), the aggregate commitment amount is $600,000,000 with an additional uncommitted amount of $100,000,000. The commitment fee is an annual rate of 0.15% of the average commitment amount payable quarterly, regardless of usage, to State Street, who serves as the agent to the syndicate. The commitment fee is allocated among the Portfolio and certain other funds managed by New York Life Investments based upon their respective net assets and other factors. Interest on any revolving credit loan is charged based upon the Federal Funds Rate or the one-month London Interbank Offered Rate (“LIBOR”), whichever is higher. The Credit Agreement expires on July 28, 2020, although the Portfolio, certain other funds managed by New York Life Investments and the syndicate of banks may renew the Credit Agreement for an additional year on the same or different terms. Prior to July 30, 2019, the aggregate commitment amount and the commitment fee were the same as those under the current Credit Agreement. During the six-month period ended June 30, 2019, there were no borrowings made or outstanding with respect to the Portfolio under the Credit Agreement.
Note 7–Interfund Lending Program
Pursuant to an exemptive order issued by the SEC, the Portfolio, along with certain other funds managed by New York Life Investments, may
participate in an interfund lending program. The interfund lending program provides an alternative credit facility that permits the Portfolio and certain other funds managed by New York Life Investments to lend or borrow money for temporary purposes directly to or from one another subject to the conditions of the exemptive order. During the six-month period ended June 30, 2019, there were no interfund loans made or outstanding with respect to the Portfolio.
Note 8–Purchases and Sales of Securities (in 000’s)
During the six-month period ended June 30, 2019, purchases and sales of securities, other thanshort-term securities, were $114,884 and $128,035, respectively.
Note 9–Capital Share Transactions
Transactions in capital shares for the six-month period ended June 30, 2019 and the year ended December 31, 2018, were as follows:
| | | | | | | | |
Initial Class | | Shares | | | Amount | |
| | |
Six-month period ended June 30, 2019: | | | | | | | | |
Shares sold | | | 299,389 | | | $ | 16,221,871 | |
Shares redeemed | | | (2,711,903 | ) | | | (149,678,620 | ) |
| | | | |
Net increase (decrease) | | | (2,412,514 | ) | | $ | (133,456,749 | ) |
| | | | |
Year ended December 31, 2018: | | | | | | | | |
Shares sold | | | 3,258,166 | | | $ | 174,397,749 | |
Shares issued to shareholders in reinvestment of dividends and distributions | | | 665,728 | | | | 36,895,690 | |
Shares redeemed | | | (5,327,906 | ) | | | (279,065,069 | ) |
| | | | |
Net increase (decrease) | | | (1,404,012 | ) | | $ | (67,771,630 | ) |
| | | | |
| | |
| | | | | | | | |
Service Class | | Shares | | | Amount | |
Six-month period ended June 30, 2019: | | | | | | | | |
Shares sold | | | 2,197,682 | | | $ | 116,870,889 | |
Shares redeemed | | | (966,810 | ) | | | (52,239,297 | ) |
| | | | |
Net increase (decrease) | | | 1,230,872 | | | $ | 64,631,592 | |
| | | | |
Year ended December 31, 2018: | | | | | | | | |
Shares sold | | | 3,592,164 | | | $ | 189,869,747 | |
Shares issued to shareholders in reinvestment of dividends and distributions | | | 559,584 | | | | 30,790,988 | |
Shares redeemed | | | (2,243,764 | ) | | | (118,623,128 | ) |
| | | | |
Net increase (decrease) | | | 1,907,984 | | | $ | 102,037,607 | |
| | | | |
Note 10–Litigation
The Portfolio has been named as a defendant in the case entitledKirschner v. FitzSimons, No.12-2652 (S.D.N.Y.) (the “FitzSimonsaction”) as a result of its ownership of shares in the Tribune Company (“Tribune”) in 2007 when Tribune effected a leveraged buyout transaction (“LBO”) by which Tribune converted to a privately-held company. In its complaint, the plaintiff asserts claims against certain insiders, major shareholders, professional advisers, and others involved in the LBO. Separately, the complaint also seeks to obtain from former Tribune shareholders, including the Portfolio, any proceeds they received in connection with the LBO. The sole claim and cause of action brought against the Portfolio is for fraudulent conveyance pursuant to United States Bankruptcy Code Section 548(a)(1)(A).
| | |
| 26 | | MainStay VP MacKay S&P 500 Index Portfolio |
In June 2011, certain Tribune creditors filed numerous additional actions asserting state law constructive fraudulent conveyance claims (the “SLCFC actions”) against specifically-named former Tribune shareholders and, in some cases, putative defendant classes comprised of former Tribune shareholders. One of the SLCFC actions, entitledDeutsche Bank Trust Co. Americas v. Blackrock Institutional Trust Co.,No.11-9319 (S.D.N.Y.) (the “Deutsche Bank action”), named the Portfolio as a defendant.
TheFitzSimonsaction andDeutsche Bankaction have been consolidated with the majority of the other Tribune LBO related lawsuits in a multidistrict litigation proceeding entitledIn re Tribune Co. Fraudulent Conveyance Litig., No. 11-md-2296 (S.D.N.Y.) (the “MDL Proceeding”).
On September 23, 2013, the District Court granted the defendants’ motion to dismiss the SLCFC actions, including theDeutsche Bankaction, on the basis that the plaintiffs did not have standing to pursue their claims. On September 30, 2013, the plaintiffs in the SLCFC actions filed a notice of appeal to the United States Court of Appeals for the Second Circuit. On October 28, 2013, the defendants filed a joint notice of cross-appeal of that same order. On March 29, 2016, the United States Court of Appeals for the Second Circuit issued its opinion on the appeal of the SLCFC actions. The appeals court affirmed the district court’s dismissal of those lawsuits, but on different grounds than the district court. The appeals court held that while the plaintiffs have standing under the U.S. Bankruptcy Code, their claims were preempted by Section 546(e) of the Bankruptcy Code-the statutory safe harbor for settlement payments. On April 12, 2016 the Plaintiffs in the SLCFC actions filed a petition seeking rehearing en banc before the appeals court. On July 22, 2016, the appeals court denied the petition. On September 9, 2016, the plaintiffs filed a petition for writ of certiorari in the U.S. Supreme Court challenging the Second Circuit’s decision that the safe harbor of Section 546(e) applied to their claims. Certain shareholder defendants filed a joint brief in opposition to the petition for certiorari on October 24, 2016. The plaintiffs filed a reply in support of the petition on November 4, 2016. On April 3, 2018, Justice Kennedy and Justice Thomas issued a “Statement” related to the petition for certiorari suggesting that the Second Circuit and/or District Court may want to take steps to reexamine the application of the Section 546(e) safe harbor to the previously dismissed state law constructive fraudulent transfer claims based on the Supreme Court’s decision inMerit Management Group LP v. FTI Consulting, Inc. On April 10, 2018, the plaintiffs filed in the Second Circuit a motion for that court to recall its mandate, vacate its prior decision, and remand to the district court for further proceedings consistent withMerit Management. On April 20, 2018, the shareholder defendants filed a response to the plaintiffs’ motion to recall the mandate. On May 15, 2018, the Second Circuit issued an order recalling the mandate “in anticipation of further panel review.”
On August 2, 2013, the plaintiff in theFitzSimonsaction filed a Fifth Amended Complaint. On May 23, 2014, the defendants filed motions to dismiss theFitzSimonsaction, including a global motion to dismiss Count I, which is the claim brought against former Tribune shareholders, for intentional fraudulent conveyance under U.S. federal law.
On January 6, 2017, the United States District Court for the Southern District of New York granted the shareholder defendants’ motion to dismiss the intentional fraudulent conveyance claim in the FitzSimons
action. In dismissing the intentional fraudulent conveyance claim, the Court denied the plaintiff’s request to amend the complaint. While the District Court’s dismissal of the intentional fraudulent conveyance claim was not immediately appealable, the Trustee asked the District Court to enter judgment immediately so that an appeal could be taken. On February 23, 2017, the Court issued an order stating that it intended to permit an interlocutory appeal of the dismissal order, but would wait to do so until it has resolved outstanding motions to dismiss filed by other defendants.
On July 18, 2017, the plaintiff submitted a letter to the District Court seeking leave to amend its complaint to add a constructive fraudulent transfer claim. The shareholder defendants opposed that request.
On August 24, 2017, the Court denied the plaintiff’s request without prejudice to renewal of the request in the event of an intervening change in the law. On March 8, 2018, the plaintiff renewed the request for leave to file a motion to amend the complaint to assert a constructive fraudulent transfer claim based on the Supreme Court’s ruling inMerit Management. The shareholder defendants opposed that request. On June 18, 2018, the District Court ordered that the request would be stayed pending further action by the Second Circuit in the still-pending appeal, discussed above. On December 18, 2018, the plaintiff filed a letter with the District Court requesting that the stay be dissolved in order to permit briefing on the motion to amend the complaint and indicating the plaintiff’s intention to file another motion to amend the complaint to reinstate claims for intentional fraudulent transfer. The shareholder defendants opposed that request. On January 14, 2019, the court held a case management conference, during which the court stated that it would not lift the stay prior to further action from the Second Circuit. The court stated that it would allow the plaintiff to file a motion to amend to try to reinstate its intentional fraudulent transfer claim. On January 23, 2019, the court ordered the parties still facing pending claims to participate in a mediation. On March 27, 2019, the court held a telephone conference and decided to allow the plaintiff to file a motion for leave to amend. On April 4, 2019, the plaintiff filed a motion to amend the Fifth Amended Complaint to assert a federal constructive fraudulent transfer claim against certain shareholder defendants. On April 10, 2019, the shareholder defendants filed a brief in opposition to the plaintiff’s motion to amend. On April 12, 2019, the plaintiff filed a reply brief. The court denied leave to amend the complaint on April 23, 2019. On June 13, 2019, the court entered judgment pursuant to Rule 54(b), which would permit an appeal of the court’s dismissal of the claim against the shareholder defendants.
The value of the proceeds received by the Portfolio in connection with the LBO and the Portfolio’s cost basis in shares of Tribune was as follows:
| | | | | | | | |
Portfolio | | Proceeds | | | Cost Basis | |
MainStay VP MacKay S&P 500 Index Portfolio | | $ | 682,856 | | | $ | 527,309 | |
At this stage of the proceedings, it would be difficult to assess with any reasonable certainty the probable outcome of the pending litigation or the effect, if any, on the Portfolio’s net asset value.
Notes to Financial Statements(Unaudited) (continued)
Note 11–Recent Accounting Pronouncement
To improve the effectiveness of fair value disclosure requirements, the Financial Accounting Standards Board recently issued Accounting Standard Update (ASU)2018-13, Fair Value Measurement Disclosure Framework—Changes to the Disclosure Requirements for Fair Value Measurement (ASU2018-13), which adds, removes, and modifies certain aspects relating to fair value disclosure. ASU2018-13 is effective for interim and annual reporting periods beginning after December 15, 2019; early adoption of the additions relating to ASU2018-13 is not required. Management has evaluated the implications of certain other provisions of the ASU and has determined to early adopt aspects related to the removal and modifications of certain fair value measurement disclosures under the ASU effective immediately. At this
time, management is evaluating the implications of certain other provisions of the ASU related to new disclosure requirements and any impact on the financial statement disclosures has not yet been determined.
Note 12–Subsequent Events
In connection with the preparation of the financial statements of the Portfolio as of and for the six-month period ended June 30, 2019, events and transactions subsequent to June 30, 2019, through the date the financial statements were issued have been evaluated by the Portfolio’s management for possible adjustment and/or disclosure. No subsequent events requiring financial statement adjustment or disclosure have been identified.
| | |
| 28 | | MainStay VP MacKay S&P 500 Index Portfolio |
Proxy Voting Policies and Procedures and Proxy Voting Record
A description of the policies and procedures that New York Life Investments uses to vote proxies related to the Portfolio’s securities is available without charge, upon request (i) by calling800-598-2019; (ii) by visiting New York Life Investments website at https://www.nylinvestments.com/mainstay/products-and-performance/mainstay-vp-funds-trust; or (iii) by visiting the SEC’s website at www.sec.gov.
The Portfolio is required to file with the SEC its proxy voting record for the12-month period ending June 30 on Form N-PX. The Portfolio’s most recent Form N-PX or proxy voting record is available free of charge upon request (i) by calling800-598-2019; (ii) by visiting New York Life Investments website at https://www.nylinvestments.com/mainstay/products-and-performance/mainstay-vp-funds-trust; or (iii) by visiting the SEC’s website atwww.sec.gov.
Shareholder Reports and Quarterly Portfolio Disclosure
The Portfolio is required to file its complete schedule of portfolio holdings with the SEC 60 days after each fiscal quarter onForm N-PORT. The Portfolio’s holdings report is available without charge upon request (i) by calling800-598-2019; (ii) by visiting New York Life Investments website at https://www.nylinvestments.com/mainstay/products-and-performance/mainstay-vp-funds-trust; or (iii) on the SEC’s website at www.sec.gov.
MainStay VP Portfolios
MainStay VP offers a wide range of Portfolios. The full array of MainStay VP offerings is listed here, with information about the manager, subadvisors, legal counsel, and independent registered public accounting firm.
Equity Portfolios
MainStay VP Eagle Small Cap Growth Portfolio
MainStay VP Emerging Markets Equity Portfolio
MainStay VP Epoch U.S. Equity Yield Portfolio
MainStay VP Fidelity Institutional AM® Utilities Portfolio†
MainStay VP Large Cap Growth Portfolio
MainStay VP MacKay Common Stock Portfolio
MainStay VP MacKay Growth Portfolio
MainStay VP MacKay International Equity Portfolio
MainStay VP MacKay Mid Cap Core Portfolio
MainStay VP MacKay S&P 500 Index Portfolio
MainStay VP MacKay Small Cap Core Portfolio
MainStay VP Mellon Natural Resources Portfolio
MainStay VP T. Rowe Price Equity Income Portfolio
Mixed Asset Portfolios
MainStay VP Balanced Portfolio
MainStay VP Income Builder Portfolio
MainStay VP Janus Henderson Balanced Portfolio
MainStay VP MacKay Convertible Portfolio
Income Portfolios
MainStay VP Bond Portfolio
MainStay VP Floating Rate Portfolio
MainStay VP Indexed Bond Portfolio
MainStay VP MacKay Government Portfolio
MainStay VP MacKay High Yield Corporate Bond Portfolio
MainStay VP MacKay Unconstrained Bond Portfolio
MainStay VP PIMCO Real Return Portfolio
Money Market
MainStay VP U.S. Government Money Market Portfolio
Alternative
MainStay VP Cushing Renaissance Advantage Portfolio
MainStay VP IQ Hedge Multi-Strategy Portfolio
Asset Allocation Portfolios
MainStay VP Conservative Allocation Portfolio
MainStay VP Growth Allocation Portfolio
MainStay VP Moderate Allocation Portfolio
MainStay VP Moderate Growth Allocation Portfolio
Manager
New York Life Investment Management LLC
New York, New York
Subadvisors
Candriam Belgium*
Brussels, Belgium
Cushing Asset Management, LP
Dallas, Texas
Eagle Asset Management, Inc.
St Petersburg, Florida
Epoch Investment Partners, Inc.
New York, New York
FIAM LLC
Smithfield, Rhode Island
IndexIQ Advisors LLC*
New York, New York
Janus Capital Management LLC
Denver, Colorado
MacKay Shields LLC*
New York, New York
Mellon Investments Corporation
Boston, Massachusetts
NYL Investors LLC*
New York, New York
Pacific Investment Management Company LLC
Newport Beach, California
T. Rowe Price Associates, Inc.
Baltimore, Maryland
Winslow Capital Management, LLC
Minneapolis, Minnesota
Distributor
NYLIFE Distributors LLC*
Jersey City, New Jersey
Custodian
State Street Bank and Trust Company
Boston, Massachusetts
Independent Registered Public Accounting Firm
PricewaterhouseCoopers LLP
New York, New York
Legal Counsel
Dechert LLP
Washington, District of Columbia
Some Portfolios may not be available in all products.
| † | Fidelity Institutional AM is a registered trade mark of FMR LLC. Used with permission. |
| * | An affiliate of New York Life Investment Management LLC |
Not part of the Semiannual Report
2019 Semiannual Report
This report is for the general information of New York Life Variable Annuities and NYLIAC Variable Universal Life Insurance Products policyowners. It must be preceded or accompanied by the appropriate product(s) and funds prospectuses if it is given to anyone who is not an owner of a New York Life variable annuity policy or a NYLIAC Variable Universal Life Insurance Product. This report does not offer for sale or solicit orders to purchase securities.
The performance data quoted in this report represents past performance. Past performance is no guarantee of future results. Due to market volatility and other factors, current performance may be lower or higher than the figures shown. The most recent month-end performance summary for your variable annuity or variable life policy is available by calling 800-598-2019 and is updated periodically on www.newyorklife.com.
The New York Life Variable Annuities and NYLIAC Variable Universal Life Insurance Products are issued by New York Life Insurance and Annuity Corporation (a Delaware Corporation) and distributed by NYLIFE Distributors LLC (Member FINRA/SIPC).
New York Life Insurance Company
New York Life Insurance and Annuity Corporation (NYLIAC) (A Delaware Corporation)
51 Madison Avenue, Room 551
New York, NY 10010
www.newyorklife.com
Printed on recycled paper
nylinvestments.com
NYLIFE Distributors LLC, 30 Hudson Street, Jersey City, NJ 07302
New York Life Investment Management LLC is the investment manager to the MainStay VP Funds Trust
©2019 by NYLIFE Distributors LLC. All rights reserved.
You may obtain copies of the Prospectus and the Statement of Additional Information free of charge, upon request, by callingtoll-free 800-598-2019 or writing to New York Life Insurance and Annuity Corporation, 51 Madison Avenue, New York, NY 10010.
| | | | |
| | | |
| Not FDIC Insured | | No Bank Guarantee | | May Lose Value |
| | | | |
| 1781637 | | | | MSVPSP10-08/19 (NYLIAC) NI529 |
MainStay VP MacKay Unconstrained
Bond Portfolio
Message from the President and Semiannual Report
Unaudited | June 30, 2019

Beginning on January 1, 2021, as permitted by regulations adopted by the Securities and Exchange Commission, paper copies of the MainStay VP Portfolio annual and semi-annual shareholder reports may no longer be sent by mail, unless you specifically request paper copies of the reports from the insurance company that offers your policy. Instead, the reports will be made available online, and you will be notified by mail each time a report is posted and provided with a website link to access the report. Instructions for requesting paper copies will be provided by your insurance company.
If you already elected to receive shareholder reports electronically, you will not be affected by this change and you need not take any action. At any time, you may elect to receive reports and other communications from the insurance company electronically by following the instructions provided by the insurance company.
You may elect to receive all future shareholder reports in paper form free of charge. You can inform the insurance company that you wish to receive paper copies of reports by following the instructions provided by the insurance company. Your election to receive reports in paper form will apply to all portfolio companies available under your contract.
| | | | | | | | |
| | | | | |
| Not FDIC/NCUA Insured | | Not a Deposit | | May Lose Value | | No Bank Guarantee | | Not Insured by Any Government Agency |

This page intentionally left blank
Message from the President
Most equity and fixed-income markets in the United States and around the world advanced in the face of conflicting political and macroeconomic forces during thesix-month period ended June 30, 2019.
The reporting period began on the heels of tumultuous December 2018, during which equities and equity-sensitive bonds spiked sharply lower on concerns regarding the pace of economic growth, a U.S. government shutdown and the potential impact of trade disputes between the United States and other nations, particularly China. Markets recovered quickly in early 2019 as trade tensions eased, the government reopened and the U.S. Federal Reserve Board (Fed) adopted a more patient tone regarding the future direction of interest rates. Markets moved broadly higher from January through April, supported by encouraging economic data and generally strong corporate earnings.
During the first four months of the reporting period, the improving economic environment encouraged investors to favor areas of the market viewed as offering greater return potential along with higher risks. Among U.S. stocks, cyclical, growth-oriented sectors tended to outperform more defensive, value-oriented sectors, whilelarge-cap stocks outperformed theirsmaller-cap counterparts. Within the S&P 500® Index, the information technology sector led the market’s advance, followed by communication services, consumer discretionary and consumer staples. Industrials, utilities, financials, materials, real estate and energy produced more modest gains. While some international equity markets outperformed or underperformed the U.S. market, on average international stocks mirrored the performance of their U.S. counterparts. Fixed-income securities gained ground as well, albeit along a more gradual trajectory. Among U.S. fixed-income instruments, corporate issues generally outperformed government bonds, with lower credit quality, higher yielding securities leading the sector’s advance. Long-term U.S. Treasury bond yields proved particularly weak, with
10-year yields dipping at times below3-month yields, reflecting investors’ continued concerns about domestic economic growth.
May 2019 saw a return of uncertainty and volatility. Trade discussions between the United States and China faltered, driving global equity prices lower. Government bond prices rose as investors sought safe havens. June brought yet anotherU-turn as equity prices climbed again after comments from the Fed raised hopes of an interest rate cut in response to weak economic data. Stock and bond prices rose, with U.S. equity markets ending the reporting period in record territory.
We are pleased to see renewed signs of strength in broad areas of the financial market. At the same time, we remained sharply focused on providing you, as a MainStay VP investor, with the experienced and disciplined fund management that we believe underpins an effective, long-term investment strategy. Whatever tomorrow’s investment environment brings, you can rely on our portfolio managers to pursue the objectives of their individual Portfolios as outlined in the prospectus with the energy and dedication you have come to expect.
The report that follows contains additional information on the market events, investment decisions and specific securities that shaped your VP Portfolio’s performance during the six months ended June 30, 2019. We encourage you to read the report carefully and use it to evaluate your Portfolio’s performance in light of your long-range financial plan.
Sincerely,

Kirk C. Lehneis
President
The opinions expressed are as of the date of this report and are subject to change. There is no guarantee that any forecast made will come to pass. This material does not constitute investment advice and is not intended as an endorsement of any specific investment. Past performance is no guarantee of future results.
Not part of the Semiannual Report
Table of Contents
Investors should refer to the Portfolio’s Summary Prospectus and/or Prospectus and consider the Portfolio’s investment objectives, strategies, risks, charges and expenses carefully before investing. The Summary Prospectus and/or Prospectus contain this and other information about the Portfolio. You may obtain copies of the Portfolio’s Summary Prospectus and/or the Prospectus and the Statement of Additional Information free of charge, upon request, by calling toll-free 800-598-2019, by writing to New York Life Insurance and Annuity Corporation, 51 Madison Avenue, Room 251, New York, New York 10010 or by sending an email to MainStayShareholdersServices@nylim.com. These documents are also available at nylinvestments.com/vpdocuments. Please read the Summary Prospectus and/or Prospectus carefully before investing. MainStay VP Funds Trust portfolios are separate account options which are purchased through a variable insurance or variable annuity contract.
Investment and Performance Comparison1(Unaudited)
Performance data quoted represents past performance. Past performance is no guarantee of future results. Because of market volatility and other factors, current performance may be lower or higher than the figures shown. Investment return and principal value will fluctuate, and as a result, when shares are redeemed, they may be worth more or less than their original cost. The performance table and graph do not reflect any deduction of sales charges, mortality and expense charges, contract charges or administrative charges. Please refer to the Performance Summary appropriate for your policy. For performance information current to the most recent month-end, please call800-598-2019 or visit www.newyorklife.com.
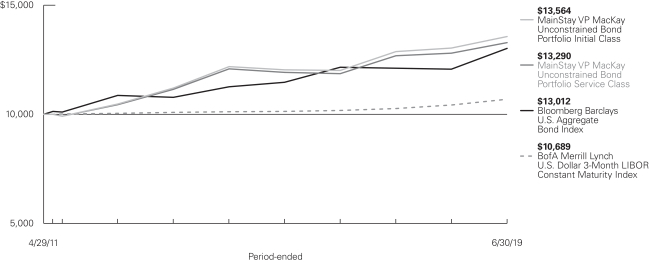
Average Annual Total Returns for the Period-Ended June 30, 2019
| | | | | | | | | | | | | | | | |
| Class | | Inception Date | | Six Months | | One Year | | Five Years | | Since Inception | | | Gross
Expense
Ratio2 | |
| | | | | | |
| Initial Class Shares | | 4/29/2011 | | 4.68% | | 4.10% | | 2.17% | | | 3.80 | % | | | 0.75 | % |
| Service Class Shares | | 4/29/2011 | | 4.55 | | 3.84 | | 1.92 | | | 3.54 | | | | 1.00 | |
| | | | | | | | | | | | | | | | |
| Benchmark Performance | | Six Months | | | One Year | | | Five Years | | | Since Inception | |
| | | | |
Bloomberg Barclays U.S. Aggregate Bond Index3 | | | 6.11 | % | | | 7.87 | % | | | 2.95 | % | | | 3.28 | % |
ICE BofA Merrill Lynch U.S. Dollar 3-Month LIBOR Constant Maturity Index4 | | | 1.43 | | | | 2.60 | | | | 1.12 | | | | 0.82 | |
Morningstar Nontraditional Bond Category Average5 | | | 4.46 | | | | 3.58 | | | | 2.14 | | | | 2.09 | |
| 1. | Performance figures may reflect certain fee waivers and/or expense limitations, without which total returns may have been different. For information on current fee waivers and/or expense limitations (if any), please refer to the Notes to Financial Statements. |
| 2. | The gross expense ratios presented reflect the Portfolio’s “Total Annual Portfolio Operating Expenses” from the most recent Prospectus, as supplemented, and may differ from other expense ratios disclosed in this report. |
| 3. | The Bloomberg Barclays U.S. Aggregate Bond Index is the Portfolio’s primary broad-based securities market index for comparison purposes. The Bloomberg Barclays U.S. Aggregate Bond Index is a broad-based benchmark that measures performance of the investment-grade, U.S. dollar denominated, fixed-rate taxable bond market, including Treasurys, government-related and corporate securities, mortgage-backed securities (agency fixed-rate and hybrid adjustable-rate mortgage pass-throughs), asset-backed securities and commercial mortgage-backed securities. |
| | Results assume reinvestment of all dividends and capital gains. An investment cannot be made directly in an index. |
| 4. | The Portfolio has selected the ICE BofA Merrill Lynch U.S. Dollar 3-Month LIBOR Constant Maturity Index as a secondary benchmark. The ICE BofA Merrill Lynch U.S. Dollar 3-Month LIBOR Constant Maturity Index represents the London InterBank Offered Rate (“LIBOR”) with a constant3-month average maturity. Results assume reinvestment of all dividends and capital gains. An investment cannot be made directly in an index. |
| 5. | The Portfolio has selected the Morningstar Nontraditional Bond Category Average as an additional benchmark. The Morningstar Nontraditional Bond Category Average contains funds that pursue strategies divergent in one or more ways from conventional practice in the broader bond-fund universe. Morningstar category averages are equal-weighted returns based on constituents of the category at the end of the period. Results are based on average total returns of similar funds with all dividends and capital gain distributions reinvested. |
Cost in Dollars of a $1,000 Investment in MainStay VP MacKay Unconstrained Bond Portfolio (Unaudited)
The example below is intended to describe the fees and expenses borne by shareholders during thesix-month period from January 1, 2019, to June 30, 2019, and the impact of those costs on your investment.
Example
As a shareholder of the Portfolio you incur two types of costs: (1) transaction costs, including exchange fees and sales charges (loads) on purchases (as applicable), and (2) ongoing costs, including management fees, distribution and/or service(12b-1) fees, and other Portfolio expenses (as applicable). This example is intended to help you understand your ongoing costs (in dollars) of investing in the Portfolio and to compare these costs with the ongoing costs of investing in other mutual funds. The example is based on an investment of $1,000 made at the beginning of thesix-month period and held for the entire period from January 1, 2019, to June 30, 2019. Shares are only sold in connection with variable life and annuity contracts and the example does not reflect any contract level or transactional fees or expenses. If these costs had been included, your costs would have been higher.
This example illustrates your Portfolio’s ongoing costs in two ways:
Actual Expenses
The second and third data columns in the table below provide information about actual account values and actual expenses. You may use the information in these columns, together with the amount you invested, to estimate the expenses that you paid during the six months ended June 30, 2019. Simply divide your account value by $1,000
(for example, an $8,600 account value divided by $1,000 = 8.6), then multiply the result by the number under the heading entitled “Expenses Paid During Period” to estimate the expenses you paid on your account during this period.
Hypothetical Example for Comparison Purposes
The fourth and fifth data columns in the table below provide information about hypothetical account values and hypothetical expenses based on the Portfolio’s actual expense ratio and an assumed rate of return of 5% per year before expenses, which is not the Portfolio’s actual return. The hypothetical account values and expenses may not be used to estimate the actual ending account balances or expenses you paid for thesix-month period shown. You may use this information to compare the ongoing costs of investing in the Portfolio with the ongoing costs of investing in other mutual funds. To do so, compare this 5% hypothetical example with the 5% hypothetical examples that appear in the shareholder reports of the other mutual funds.
Please note that the expenses shown in the table are meant to highlight your ongoing costs only and do not reflect any transactional costs, such as exchange fees or sales charges (loads). Therefore, the fourth and fifth data columns of the table are useful in comparing ongoing costs only and will not help you determine the relative total costs of owning different funds. In addition, if these transactional costs were included, your costs would have been higher.
| | | | | | | | | | | | | | | | | | | | | | |
| | | | | | | | | | | | | | | | | | |
| Share Class | | Beginning
Account
Value
1/1/19 | | | Ending Account
Value (Based
on Actual
Returns and
Expenses)
6/30/19 | | | Expenses
Paid
During
Period1 | | | Ending Account
Value (Based
on Hypothetical
5% Annualized
Return and
Actual Expenses)
6/30/19 | | | Expenses
Paid
During
Period1 | | | Net Expense
Ratio
During
Period2,3 |
| | | | | | |
| Initial Class Shares | | $ | 1,000.00 | | | $ | 1,046.80 | | | $ | 3.81 | | | $ | 1,021.08 | | | $ | 3.76 | | | 0.75% |
| | | | | | |
| Service Class Shares | | $ | 1,000.00 | | | $ | 1,045.50 | | | $ | 5.07 | | | $ | 1,019.84 | | | $ | 5.01 | | | 1.00% |
| 1. | Expenses are equal to the Portfolio’s annualized expense ratio of each class multiplied by the average account value over the period, divided by 365 and multiplied by 181 (to reflect thesix-month period). The table above represents the actual expenses incurred during thesix-month period. In addition to the fees and expenses which the Portfolio bears directly, it also indirectly bears a pro rata share of the fees and expenses of the underlying funds in which it invests. Such indirect expenses are not included in the above-reported expense figures. |
| 2. | Expenses are equal to the Portfolio’s annualized expense ratio to reflect thesix-month period. |
| 3. | Expenses are inclusive of dividends and interest on investments sold short. |
| | |
| 6 | | MainStay VP MacKay Unconstrained Bond Portfolio |
Portfolio Composition as of June 30, 2019 (Unaudited)
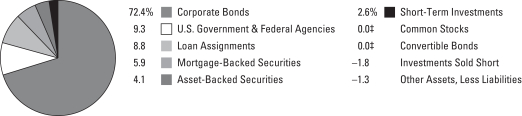
See Portfolio of Investments beginning on page 10 for specific holdings within these categories. The Portfolio’s holdings are subject to change.
| ‡ | Less thanone-tenth of a percent. |
Top Ten Holdings or Issuers as of June 30, 2019(excluding short-term investments) (Unaudited)
| 1. | Federal National Mortgage Association (Mortgage Pass-Through Securities), 3.00%–4.50%, due 8/1/48–2/1/49 |
| 2. | United States Treasury Inflation—Indexed Notes, 0.75%–0.875%, due 7/15/28–1/15/29 |
| 3. | Bank of America Corp., 3.004%–8.57%, due 7/29/19–4/24/28 |
| 4. | Citigroup, Inc., 2.35%–6.30%, due 8/2/21–7/1/26 |
| 5. | Morgan Stanley, 3.591%–5.45%, due 10/15/19–7/22/28 |
| 6. | Goldman Sachs Group, Inc., 2.30%–6.75%, due 12/13/19–10/1/37 |
| 7. | Caterpillar Financial Services Corp., 2.10%–2.90%, due 1/10/20–3/15/21 |
| 8. | Government National Mortgage Association, 3.00%, due 1/16/40–6/20/49 |
| 9. | Wells Fargo & Co., 2.60%–5.90%, due 7/22/20–10/23/26 |
| 10. | Ford Motor Credit Co. LLC., 2.681%–8.125%, due 1/9/2020–2/15/23 |
Portfolio Management Discussion and Analysis(Unaudited)
Answers to the questions reflect the views of portfolio managers Dan Roberts, PhD, Joseph Cantwell,Shu-Yang Tan, Matt Jacob, Stephen R. Cianci, CFA, and Neil Moriarty, III, of MacKay Shields LLC, the Portfolio’s Subadvisor.
How did MainStay VP MacKay Unconstrained Bond Portfolio perform relative to its benchmarks and peers during the six months ended June 30, 2019?
For the six months ended June 30, 2019, MainStay VP MacKay Unconstrained Bond Portfolio returned 4.68% for Initial Class shares and 4.55% for Service Class shares. Over the same period, both share classes underperformed the 6.11% return of the Bloomberg Barclays U.S. Aggregate Bond Index, which is the Portfolio’s primary benchmark. For the six months ended June 30, 2019, both share classes outperformed the 1.43% return of the ICE BofAML U.S. Dollar3-Month LIBOR Constant Maturity Index, which is the Portfolio’s secondary benchmark, and the 4.46% return of the Morningstar Nontraditional Bond Category Average, which is an additional benchmark of the Portfolio.1
What factors affected the Portfolio’s relative performance during the reporting period?
During the reporting period, the Portfolio held overweight exposure to spread product2 relative to the Bloomberg Barclays U.S. Aggregate Bond Index, a position that was beneficial to returns on both an absolute and relative basis. However, the Portfolio also maintained a lower duration3 profile than the primary benchmark, which detracted from relative returns as yields on U.S. Treasury securities declined and longer maturity bonds outperformed.
During the reporting period, how was the Portfolio’s performance materially affected by investments in derivatives?
Throughout the reporting period, we used futures and swaps to manage the Portfolio’s duration profile. Although we extended the duration of the Portfolio during the reporting period, it remained below the duration of the primary benchmark, which detracted from relative performance.
What was the Portfolio’s duration strategy during the reporting period?
We extended the Portfolio’s duration from 1 year to 1.4 years during the reporting period. However, the Portfolio’s duration remained below the5.7-year duration of the Bloomberg Barclays U.S. Aggregate Bond Index as of June 30, 2019.
What specific factors, risks or market forces prompted significant decisions for the Portfolio during the reporting period?
There were no specific factors or risks that prompted any changes to the Portfolio during the reporting period. That said, we did continue to reduce the Portfolio’s exposure to bank loans, shifting those assets into additional exposure to agency mortgage securities. This move improved the overall credit quality and liquidity of the Portfolio’s holdings.
During the reporting period, which market segments were the strongest positive contributors to the Portfolio’s absolute performance and which market segments were particularly weak?
The strongest positive contributor to the Portfolio’s absolute performance during the reporting period was spread product, specifically investment-grade credit, high-yield corporate bonds, bank loans and emerging-market debt. (Contributions take weightings and total returns into account.) Emerging markets benefited from renewed risk appetites sparked by dovish central banks.
Securitized assets, including residential mortgage-backed securities and consumer-related asset-backed securities, were the weakest contributors to the Portfolio’s absolute performance during the same period.
Did the Portfolio make any significant purchases or sales during the reporting period?
During the reporting period we took advantage of tighter spreads within the credit markets to trim our positions in investment-grade credit, high-yield as well as bank loans. To diversify the fund as well as decrease volatility, we added to the portfolio’s positions in agency mortgages, and CMBS and ABS.
How did the Portfolio’s sector weightings change during the reporting period?
As mentioned earlier, the Portfolio reduced its exposure to bank loans and increased its exposure to agency mortgage securities during the reporting period. By doing so, the Portfolio improved the liquidity and overall credit quality of its holdings in an environment of tightening spreads.
| 1. | See page 5 for more information on benchmark and peer group returns. |
| 2. | The terms “spread” and “yield spread” may refer to the difference in yield between a security or type of security and comparable U.S. Treasury issues. The terms may also refer to the difference in yield between two specific securities or types of securities at a given time. The term “spread product” refers to asset classes that typically trade at a spread to comparable U.S. Treasury securities. |
| 3. | Duration is a measure of the price sensitivity of a fixed-income investment to changes in interest rates. Duration is expressed as a number of years and is considered a more accurate sensitivity gauge than average maturity. |
| | |
| 8 | | MainStay VP MacKay Unconstrained Bond Portfolio |
How was the Portfolio positioned at the end of the reporting period?
As of June 30, 2019, the Portfolio held overweight exposure relative to the Bloomberg Barclays U.S. Aggregate Bond Index in investment-grade corporate bonds, high-yield bonds and bank loans. As of the same date, the Portfolio held underweight positions in U.S. Treasury securities and agency mortgage securities.
The opinions expressed are those of the portfolio managers as of the date of this report and are subject to change. There is no guarantee that any forecasts will come to pass. This material does not constitute investment advice and is not intended as an endorsement of any specific investment.
Not all MainStay VP Portfolios and/or share classes are available under all policies.
Portfolio of InvestmentsJune 30, 2019 (Unaudited)
| | | | | | | | |
| | | Principal
Amount | | | Value | |
Long-Term Bonds 100.5%† Asset-Backed Securities 4.1% | |
Auto Floor Plan Asset-Backed Securities 0.8% | |
Ford Credit Floorplan Master Owner Trust
Series 2018-4, Class A
4.06%, due 11/15/30 | | $ | 4,530,000 | | | $ | 4,858,147 | |
Navistar Financial Dealer Note Master Owner Trust II
Series 2018-1, Class A
3.06% (1 Month LIBOR + 0.63%), due 9/25/23 (a)(b) | | | 4,085,000 | | | | 4,093,055 | |
| | | | | | | | |
| | | | | | | 8,951,202 | |
| | | | | | | | |
Automobile Asset-Backed Securities 0.5% | |
Volkswagen Auto Loan Enhanced Trust
Series 2018-1, Class A4
3.15%, due 7/22/24 | | | 3,290,000 | | | | 3,364,382 | |
World Omni Auto Receivables Trust
Series 2019-A, Class A3
3.04%, due 5/15/24 | | | 2,430,000 | | | | 2,485,060 | |
| | | | | | | | |
| | | | | | | 5,849,442 | |
| | | | | | | | |
Credit Cards 1.4% | |
American Express Credit Account Master Trust | | | | | | | | |
Series 2018-9, Class A
2.82% (1 Month LIBOR + 0.38%), due 4/15/26 (b) | | | 1,970,000 | | | | 1,971,777 | |
Series 2019-1, Class A
2.87%, due 10/15/24 | | | 2,135,000 | | | | 2,182,275 | |
Capital One Multi-Asset Execution Trust
Series 2019-A1, Class A1
2.84%, due 12/15/24 | | | 3,445,000 | | | | 3,511,469 | |
Citibank Credit Card Issuance Trust
Series 2018-A2, Class A2
2.771% (1 Month LIBOR + 0.33%), due 1/20/25 (b) | | | 4,945,000 | | | | 4,941,508 | |
Discover Card Execution Note Trust
Series 2019-A1, Class A1
3.04%, due 7/15/24 | | | 2,505,000 | | | | 2,565,798 | |
| | | | | | | | |
| | | | | | | 15,172,827 | |
| | | | | | | | |
Home Equity 0.0%‡ | |
First NLC Trust
Series 2007-1, Class A1
2.50% (1 Month LIBOR + 0.07%), due 8/25/37 (a)(b) | | | 71,775 | | | | 45,207 | |
MASTR Asset-Backed Securities Trust
Series 2006-HE4, Class A1
2.48% (1 Month LIBOR + 0.05%), due 11/25/36 (b) | | | 19,110 | | | | 8,871 | |
| | | | | | | | |
| | | Principal
Amount | | | Value | |
Home Equity (continued) | | | | | | | | |
Morgan Stanley ABS Capital I Trust
Series 2007-HE4, Class A2A
2.54% (1 Month LIBOR + 0.11%), due 2/25/37 (b) | | $ | 19,322 | | | $ | 8,984 | |
| | | | | | | | |
| | | | | | | 63,062 | |
| | | | | | | | |
Other Asset-Backed Securities 1.4% | |
CNH Equipment Trust
Series 2019-B, Class A4
2.64%, due 5/15/26 | | | 4,405,000 | | | | 4,483,127 | |
Daimler Trucks Retail Trust
Series 2019-1, Class A3
2.77%, due 8/15/22 (a) | | | 3,140,000 | | | | 3,168,518 | |
Dell Equipment Finance Trust
Series 2018-2, Class A3
3.37%, due 10/22/23 (a) | | | 4,080,000 | | | | 4,150,690 | |
JPMorgan Mortgage Acquisition Trust
Series 2007-HE1, Class AF1
2.53% (1 Month LIBOR + 0.10%), due 3/25/47 (b) | | | 25,586 | | | | 18,390 | |
Verizon Owner Trust
Series 2019-A, Class A1A
2.93%, due 9/20/23 | | | 2,950,000 | | | | 3,001,944 | |
| | | | | | | | |
| | | | | | | 14,822,669 | |
| | | | | | | | |
Student Loans 0.0%‡ | |
KeyCorp Student Loan Trust
Series 2000-A, Class A2
2.971% (3 Month LIBOR + 0.32%), due 5/25/29 (b) | | | 58,032 | | | | 57,784 | |
| | | | | | | | |
Total Asset-Backed Securities
(Cost $44,064,053) | | | | | | | 44,916,986 | |
| | | | | | | | |
|
| Convertible Bonds 0.0%‡ | |
Health Care—Products 0.0%‡ | |
Danaher Corp.
(zero coupon), due 1/22/21 | | | 1,000 | | | | 5,458 | |
| | | | | | | | |
Total Convertible Bonds
(Cost $1,571) | | | | | | | 5,458 | |
| | | | | | | | |
|
| Corporate Bonds 72.4% | |
Advertising 0.1% | |
Lamar Media Corp.
5.00%, due 5/1/23 | | | 900,000 | | | | 915,750 | |
| | | | | | | | |
|
Aerospace & Defense 0.3% | |
Harris Corp.
4.40%, due 6/15/28 | | | 3,270,000 | | | | 3,572,975 | |
| | | | | | | | |
| | | | |
| 10 | | MainStay VP MacKay Unconstrained Bond Portfolio | | The notes to the financial statements are an integral part of,
and should be read in conjunction with, the financial statements. |
| | | | | | | | |
| | | Principal
Amount | | | Value | |
| Corporate Bonds (continued) | | | | | | | | |
Agriculture 0.7% | |
Altria Group, Inc.
3.80%, due 2/14/24 (c) | | $ | 3,400,000 | | | $ | 3,544,225 | |
Bunge, Ltd. Finance Corp.
3.50%, due 11/24/20 | | | 4,435,000 | | | | 4,476,338 | |
| | | | | | | | |
| | | | | | | 8,020,563 | |
| | | | | | | | |
Airlines 1.4% | |
American Airlines Pass-Through Trust | | | | | | | | |
Series 2015-2, Class AA,
3.60%, due 3/22/29 | | | 857,922 | | | | 885,890 | |
Series 2015-2, Class A
4.00%, due 3/22/29 | | | 428,963 | | | | 444,963 | |
Continental Airlines, Inc. | | | | | | | | |
Series 2007-1, Class A
5.983%, due 10/19/23 | | | 556,524 | | | | 590,305 | |
Series 2004-ERJ1
9.558%, due 3/1/21 | | | 216 | | | | 216 | |
Series 2005-ERJ1
9.798%, due 10/1/22 | | | 136,870 | | | | 142,549 | |
Delta Air Lines, Inc.
Series 2019-1, Class AA
3.204%, due 10/25/25 | | | 3,695,000 | | | | 3,826,684 | |
Northwest Airlines, Inc.
Series 2007-1, Class A
7.027%, due 5/1/21 | | | 4,193,840 | | | | 4,251,296 | |
U.S. Airways Group, Inc. | | | | | | | | |
Series 2012-1, Class A
5.90%, due 4/1/26 | | | 1,164,204 | | | | 1,283,069 | |
Series 2010-1, Class A
6.25%, due 10/22/24 | | | 797,819 | | | | 868,347 | |
United Airlines, Inc. | | | | | | | | |
Series 2014-2, Class B
4.625%, due 3/3/24 | | | 1,176,939 | | | | 1,211,188 | |
Series 2007-1, Pass Through Trust
6.636%, due 1/2/24 | | | 1,765,532 | | | | 1,875,348 | |
| | | | | | | | |
| | | | | | | 15,379,855 | |
| | | | | | | | |
Apparel 0.2% | |
VF Corp.
3.50%, due 9/1/21 | | | 2,185,000 | | | | 2,240,707 | |
| | | | | | | | |
|
Auto Manufacturers 2.6% | |
Daimler Finance North America LLC (a) | | | | | | | | |
2.30%, due 1/6/20 | | | 5,000,000 | | | | 4,993,143 | |
3.115% (3 Month LIBOR + 0.55%), due 5/4/21 (b) | | | 2,335,000 | | | | 2,335,386 | |
Ford Motor Credit Co. LLC | | | | | | | | |
2.681%, due 1/9/20 | | | 5,675,000 | | | | 5,671,536 | |
3.753% (3 Month LIBOR + 1.235%), due 2/15/23 (b) | | | 1,230,000 | | | | 1,193,746 | |
| | | | | | | | |
| | | Principal
Amount | | | Value | |
Auto Manufacturers (continued) | | | | | | | | |
Ford Motor Credit Co. LLC (continued) | | | | | | | | |
4.25%, due 9/20/22 | | $ | 900,000 | | | $ | 923,063 | |
8.125%, due 1/15/20 | | | 1,584,000 | | | | 1,628,845 | |
General Motors Financial Co., Inc.
3.45%, due 4/10/22 | | | 4,000,000 | | | | 4,056,682 | |
Toyota Motor Credit Corp.
1.95%, due 4/17/20 (c) | | | 4,300,000 | | | | 4,291,744 | |
Volkswagen Group of America Finance LLC
3.875%, due 11/13/20 (a) | | | 3,100,000 | | | | 3,165,870 | |
| | | | | | | | |
| | | | | | | 28,260,015 | |
| | | | | | | | |
Auto Parts & Equipment 0.4% | |
LKQ European Holdings B.V.
3.625%, due 4/1/26 (a) | | EUR | 2,835,000 | | | | 3,399,337 | |
ZF North America Capital, Inc.
4.00%, due 4/29/20 (a) | | $ | 740,000 | | | | 743,755 | |
| | | | | | | | |
| | | | | | | 4,143,092 | |
| | | | | | | | |
Banks 15.4% | |
Bank of America Corp. | | | | | | | | |
3.004%, due 12/20/23 (d) | | | 6,566,000 | | | | 6,686,456 | |
3.499%, due 5/17/22 (d) | | | 6,150,000 | | | | 6,268,521 | |
3.50%, due 4/19/26 | | | 6,165,000 | | | | 6,455,877 | |
3.705%, due 4/24/28 (d) | | | 1,695,000 | | | | 1,780,940 | |
5.797%, due 7/29/19 (e) | | | 2,010,000 | | | | 2,003,890 | |
6.30%, due 3/10/26 (d)(e) | | | 1,810,000 | | | | 2,020,503 | |
8.57%, due 11/15/24 | | | 455,000 | | | | 573,215 | |
Bank of New York Mellon Corp.
2.661%, due 5/16/23 (d) | | | 3,715,000 | | | | 3,745,109 | |
Barclays Bank PLC | | | | | | | | |
5.14%, due 10/14/20 | | | 4,249,000 | | | | 4,369,634 | |
Series Reg S
10.00%, due 5/21/21 | | GBP | 401,000 | | | | 585,134 | |
Barclays PLC
5.20%, due 5/12/26 | | $ | 1,725,000 | | | | 1,808,785 | |
BB&T Corp. | | | | | | | | |
2.75%, due 4/1/22 | | | 4,790,000 | | | | 4,847,981 | |
3.05%, due 6/20/22 | | | 1,880,000 | | | | 1,920,355 | |
Capital One Financial Corp.
5.55%, due 6/1/20 (c)(d)(e) | | | 2,365,000 | | | | 2,405,371 | |
Citibank N.A.
3.165%, due 2/19/22 (d) | | | 4,200,000 | | | | 4,252,576 | |
Citigroup, Inc. | | | | | | | | |
2.35%, due 8/2/21 | | | 4,801,000 | | | | 4,797,914 | |
3.569% (3 Month LIBOR + 1.25%), due 7/1/26 (b) | | | 10,035,000 | | | | 10,106,269 | |
5.50%, due 9/13/25 (c) | | | 2,710,000 | | | | 3,069,595 | |
6.30%, due 5/15/24 (d)(e) | | | 4,290,000 | | | | 4,456,237 | |
Citizens Bank N.A.
2.55%, due 5/13/21 | | | 1,145,000 | | | | 1,148,388 | |
| | | | | | |
The notes to the financial statements are an integral part of,
and should be read in conjunction with, the financial statements. | | | | | 11 | |
Portfolio of InvestmentsJune 30, 2019 (Unaudited) (continued)
| | | | | | | | |
| | | Principal
Amount | | | Value | |
| Corporate Bonds (continued) | | | | | | | | |
Banks (continued) | | | | | | | | |
Citizens Financial Group, Inc. | | | | | | | | |
4.15%, due 9/28/22 (a) | | $ | 1,450,000 | | | $ | 1,499,192 | |
4.30%, due 12/3/25 (c) | | | 2,550,000 | | | | 2,698,000 | |
Discover Bank | | | | | | | | |
7.00%, due 4/15/20 | | | 1,005,000 | | | | 1,039,317 | |
8.70%, due 11/18/19 | | | 420,000 | | | | 429,310 | |
Goldman Sachs Group, Inc. | | | | | | | | |
2.30%, due 12/13/19 | | | 2,100,000 | | | | 2,099,084 | |
2.876%, due 10/31/22 (c)(d) | | | 2,300,000 | | | | 2,319,029 | |
3.625%, due 1/22/23 | | | 2,813,000 | | | | 2,918,357 | |
3.688% (3 Month LIBOR + 1.17%), due 5/15/26 (b) | | | 3,075,000 | | | | 3,031,967 | |
5.25%, due 7/27/21 | | | 1,900,000 | | | | 2,008,212 | |
6.75%, due 10/1/37 | | | 1,828,000 | | | | 2,390,932 | |
Huntington Bancshares, Inc.
3.15%, due 3/14/21 | | | 3,910,000 | | | | 3,958,456 | |
Huntington National Bank
3.55%, due 10/6/23 | | | 1,445,000 | | | | 1,512,730 | |
JPMorgan Chase & Co.
3.54%, due 5/1/28 (d) | | | 6,265,000 | | | | 6,521,235 | |
Lloyds Banking Group PLC | | | | | | | | |
2.907%, due 11/7/23 (d) | | | 1,160,000 | | | | 1,161,927 | |
4.582%, due 12/10/25 | | | 2,500,000 | | | | 2,608,671 | |
Morgan Stanley | | | | | | | | |
3.591%, due 7/22/28 (d) | | | 1,645,000 | | | | 1,712,856 | |
3.625%, due 1/20/27 | | | 4,350,000 | | | | 4,565,483 | |
3.875%, due 4/29/24 | | | 6,015,000 | | | | 6,375,028 | |
3.875%, due 1/27/26 (c) | | | 400,000 | | | | 425,205 | |
4.875%, due 11/1/22 | | | 1,931,000 | | | | 2,066,493 | |
5.00%, due 11/24/25 | | | 3,840,000 | | | | 4,251,173 | |
5.45%, due 10/15/19 (d)(e) | | | 2,125,000 | | | | 2,119,687 | |
PNC Bank N.A.
2.45%, due 11/5/20 | | | 2,740,000 | | | | 2,746,192 | |
Royal Bank of Canada
2.50%, due 1/19/21 | | | 3,860,000 | | | | 3,876,395 | |
Royal Bank of Scotland Group PLC | | | | | | | | |
5.125%, due 5/28/24 | | | 2,239,000 | | | | 2,376,149 | |
6.00%, due 12/19/23 | | | 205,000 | | | | 223,255 | |
6.125%, due 12/15/22 | | | 970,000 | | | | 1,046,513 | |
Santander Holdings USA, Inc.
3.40%, due 1/18/23 | | | 5,055,000 | | | | 5,129,509 | |
Santander UK Group Holdings PLC
3.571%, due 1/10/23 | | | 2,030,000 | | | | 2,065,310 | |
Santander UK PLC
2.125%, due 11/3/20 | | | 3,000,000 | | | | 2,985,178 | |
U.S. Bank N.A.
2.812% (3 Month LIBOR + 0.29%), due 5/21/21 (b)(c) | | | 5,115,000 | | | | 5,118,096 | |
Wells Fargo & Co. | | | | | | | | |
2.60%, due 7/22/20 | | | 5,215,000 | | | | 5,232,152 | |
| | | | | | | | |
| | | Principal
Amount | | | Value | |
Banks (continued) | | | | | | | | |
Wells Fargo & Co. (continued) | | | | | | | | |
3.00%, due 10/23/26 | | $ | 1,640,000 | | | $ | 1,656,961 | |
5.875%, due 6/15/25 (d)(e) | | | 595,000 | | | | 646,789 | |
5.90%, due 6/15/24 (d)(e) | | | 3,270,000 | | | | 3,421,237 | |
Westpac Banking Corp.
2.798% (3 Month LIBOR + 0.28%), due 5/15/20 (b) | | | 2,710,000 | | | | 2,715,111 | |
| | | | | | | | |
| | | | | | | 170,253,941 | |
| | | | | | | | |
Beverages 1.6% | |
Anheuser-Busch InBev Worldwide, Inc. | | | | | | | | |
4.15%, due 1/23/25 | | | 915,000 | | | | 991,149 | |
4.75%, due 1/23/29 | | | 1,833,000 | | | | 2,080,833 | |
Constellation Brands, Inc.
4.25%, due 5/1/23 | | | 2,985,000 | | | | 3,176,118 | |
Diageo Capital PLC
2.76% (3 Month LIBOR + 0.24%), due 5/18/20 (b) | | | 5,020,000 | | | | 5,022,937 | |
Molson Coors Brewing Co.
2.10%, due 7/15/21 | | | 3,129,000 | | | | 3,108,148 | |
PepsiCo, Inc.
2.00%, due 4/15/21 | | | 3,450,000 | | | | 3,449,055 | |
| | | | | | | | |
| | | | | | | 17,828,240 | |
| | | | | | | | |
Biotechnology 0.3% | |
Biogen, Inc.
3.625%, due 9/15/22 | | | 3,560,000 | | | | 3,674,565 | |
| | | | | | | | |
|
Building Materials 0.4% | |
Masco Corp.
7.125%, due 3/15/20 | | | 142,000 | | | | 146,079 | |
Standard Industries, Inc. (a) | | | | | | | | |
4.75%, due 1/15/28 | | | 970,000 | | | | 962,725 | |
5.375%, due 11/15/24 | | | 3,680,000 | | | | 3,808,800 | |
| | | | | | | | |
| | | | | | | 4,917,604 | |
| | | | | | | | |
Chemicals 1.7% | |
Air Liquide Finance S.A. (a) | | | | | | | | |
1.375%, due 9/27/19 | | | 2,780,000 | | | | 2,771,959 | |
1.75%, due 9/27/21 | | | 1,895,000 | | | | 1,871,999 | |
Ashland LLC
4.75%, due 8/15/22 | | | 2,525,000 | | | | 2,638,625 | |
Braskem Netherlands Finance B.V. (a) | | | | | | | | |
3.50%, due 1/10/23 | | | 2,300,000 | | | | 2,306,900 | |
4.50%, due 1/10/28 | | | 2,025,000 | | | | 2,048,288 | |
Eastman Chemical Co.
2.70%, due 1/15/20 | | | 1,536,000 | | | | 1,535,498 | |
Mexichem S.A.B. de C.V.
4.00%, due 10/4/27 (a) | | | 2,200,000 | | | | 2,189,022 | |
W.R. Grace & Co.
5.125%, due 10/1/21 (a) | | | 2,915,000 | | | | 3,024,312 | |
| | | | | | | | |
| | | | | | | 18,386,603 | |
| | | | | | | | |
| | | | |
| 12 | | MainStay VP MacKay Unconstrained Bond Portfolio | | The notes to the financial statements are an integral part of,
and should be read in conjunction with, the financial statements. |
| | | | | | | | |
| | | Principal
Amount | | | Value | |
| Corporate Bonds (continued) | | | | | | | | |
Commercial Services 1.1% | |
Herc Holdings, Inc.
5.50%, due 7/15/27 (a) | | $ | 2,435,000 | | | $ | 2,450,219 | |
Herc Rentals, Inc.
7.75%, due 6/1/24 (a)(f) | | | 2,888,000 | | | | 3,058,970 | |
IHS Markit, Ltd. | | | | | | | | |
4.125%, due 8/1/23 | | | 2,175,000 | | | | 2,261,130 | |
4.75%, due 2/15/25 (a) | | | 3,105,000 | | | | 3,330,423 | |
Service Corp. International
5.375%, due 5/15/24 | | | 530,000 | | | | 545,237 | |
| | | | | | | | |
| | | | | | | 11,645,979 | |
| | | | | | | | |
Computers 1.4% | |
Apple, Inc.
1.55%, due 8/4/21 | | | 3,840,000 | | | | 3,802,841 | |
Dell International LLC / EMC Corp. (a) | | | | | | | | |
4.90%, due 10/1/26 | | | 3,695,000 | | | | 3,855,195 | |
6.02%, due 6/15/26 | | | 625,000 | | | | 689,489 | |
Hewlett Packard Enterprise Co. | | | | | | | | |
3.60%, due 10/15/20 | | | 2,000,000 | | | | 2,026,316 | |
4.40%, due 10/15/22 | | | 1,560,000 | | | | 1,645,541 | |
International Business Machines Corp.
1.90%, due 1/27/20 | | | 3,255,000 | | | | 3,248,475 | |
| | | | | | | | |
| | | | | | | 15,267,857 | |
| | | | | | | | |
Cosmetics & Personal Care 0.5% | |
Estee Lauder Cos., Inc.
1.80%, due 2/7/20 (f) | | | 2,050,000 | | | | 2,042,725 | |
Unilever Capital Corp.
1.80%, due 5/5/20 | | | 3,500,000 | | | | 3,486,830 | |
| | | | | | | | |
| | | | | | | 5,529,555 | |
| | | | | | | | |
Distribution & Wholesale 0.3% | |
H&E Equipment Services, Inc.
5.625%, due 9/1/25 | | | 3,000,000 | | | | 3,085,500 | |
| | | | | | | | |
|
Diversified Financial Services 2.2% | |
AerCap Ireland Capital DAC / AerCap Global Aviation Trust | | | | | | | | |
4.45%, due 12/16/21 | | | 2,200,000 | | | | 2,284,310 | |
4.625%, due 10/30/20 | | | 3,585,000 | | | | 3,676,080 | |
Air Lease Corp. | | | | | | | | |
2.125%, due 1/15/20 | | | 2,215,000 | | | | 2,209,685 | |
2.625%, due 7/1/22 | | | 2,155,000 | | | | 2,155,464 | |
2.75%, due 1/15/23 | | | 1,040,000 | | | | 1,039,696 | |
Ally Financial, Inc. | | | | | | | | |
3.75%, due 11/18/19 | | | 1,395,000 | | | | 1,397,790 | |
5.75%, due 11/20/25 | | | 3,570,000 | | | | 3,948,956 | |
8.00%, due 11/1/31 | | | 80,000 | | | | 105,737 | |
Discover Financial Services
3.85%, due 11/21/22 | | | 300,000 | | | | 312,841 | |
| | | | | | | | |
| | | Principal
Amount | | | Value | |
Diversified Financial Services (continued) | |
Protective Life Global Funding (a) | | | | | | | | |
1.555%, due 9/13/19 | | $ | 1,200,000 | | | $ | 1,197,751 | |
2.161%, due 9/25/20 | | | 3,420,000 | | | | 3,413,799 | |
Springleaf Finance Corp.
6.125%, due 3/15/24 | | | 880,000 | | | | 946,000 | |
Synchrony Financial
4.50%, due 7/23/25 | | | 1,810,000 | | | | 1,900,193 | |
| | | | | | | | |
| | | | | | | 24,588,302 | |
| | | | | | | | |
Diversified/Conglomerate Service 0.1% | |
Vantiv LLC / Vanity Issuer Corp.
4.375%, due 11/15/25 (a) | | | 1,325,000 | | | | 1,376,344 | |
| | | | | | | | |
|
Electric 3.6% | |
AEP Transmission Co. LLC
3.10%, due 12/1/26 (c) | | | 3,360,000 | | | | 3,414,022 | |
Appalachian Power Co.
3.30%, due 6/1/27 | | | 1,400,000 | | | | 1,426,166 | |
Baltimore Gas & Electric Co.
2.40%, due 8/15/26 | | | 3,260,000 | | | | 3,192,764 | |
Berkshire Hathaway Energy Co.
2.375%, due 1/15/21 | | | 1,700,000 | | | | 1,704,654 | |
CMS Energy Corp. | | | | | | | | |
3.875%, due 3/1/24 | | | 1,705,000 | | | | 1,785,886 | |
5.05%, due 3/15/22 | | | 1,350,000 | | | | 1,436,453 | |
Consolidated Edison Co. of New York, Inc.
2.749% (3 Month LIBOR + 0.40%), due 6/25/21 (b) | | | 1,000,000 | | | | 1,002,503 | |
Consolidated Edison, Inc.
2.00%, due 3/15/20 | | | 2,090,000 | | | | 2,083,034 | |
Duquesne Light Holdings, Inc. (a) | | | | | | | | |
5.90%, due 12/1/21 | | | 1,494,000 | | | | 1,594,500 | |
6.40%, due 9/15/20 | | | 3,435,000 | | | | 3,582,926 | |
Entergy Arkansas LLC
3.50%, due 4/1/26 | | | 960,000 | | | | 1,001,679 | |
Evergy, Inc.
4.85%, due 6/1/21 | | | 1,455,000 | | | | 1,506,979 | |
FirstEnergy Transmission LLC
4.35%, due 1/15/25 (a) | | | 1,675,000 | | | | 1,797,747 | |
Florida Power & Light Co.
2.75%, due 6/1/23 | | | 2,155,000 | | | | 2,195,467 | |
MidAmerican Energy Co.
3.10%, due 5/1/27 | | | 4,500,000 | | | | 4,622,519 | |
Public Service Electric & Gas Co.
3.00%, due 5/15/27 | | | 2,635,000 | | | | 2,682,295 | |
Puget Energy, Inc.
5.625%, due 7/15/22 | | | 585,000 | | | | 627,605 | |
WEC Energy Group, Inc. | | | | | | | | |
3.10%, due 3/8/22 | | | 2,165,000 | | | | 2,200,667 | |
4.631% (3 Month LIBOR + 2.113%), due 5/15/67 (b) | | | 1,860,340 | | | | 1,534,781 | |
| | | | | | | | |
| | | | | | | 39,392,647 | |
| | | | | | | | |
| | | | | | |
The notes to the financial statements are an integral part of,
and should be read in conjunction with, the financial statements. | | | | | 13 | |
Portfolio of InvestmentsJune 30, 2019 (Unaudited) (continued)
| | | | | | | | |
| | | Principal
Amount | | | Value | |
| Corporate Bonds (continued) | | | | | | | | |
Electronics 0.1% | |
Honeywell International, Inc.
1.40%, due 10/30/19 | | $ | 990,000 | | | $ | 987,082 | |
| | | | | | | | |
|
Entertainment 0.8% | |
Eldorado Resorts, Inc. | | | | | | | | |
6.00%, due 4/1/25 | | | 3,417,000 | | | | 3,592,121 | |
7.00%, due 8/1/23 | | | 2,395,000 | | | | 2,502,775 | |
International Game Technology PLC
6.25%, due 2/15/22 (a) | | | 2,595,000 | | | | 2,740,969 | |
| | | | | | | | |
| | | | | | | 8,835,865 | |
| | | | | | | | |
Environmental Controls 0.6% | |
Republic Services, Inc.
4.75%, due 5/15/23 | | | 3,665,000 | | | | 3,956,129 | |
Waste Management, Inc. | | | | | | | | |
2.40%, due 5/15/23 | | | 505,000 | | | | 506,712 | |
4.60%, due 3/1/21 | | | 1,800,000 | | | | 1,859,673 | |
| | | | | | | | |
| | | | | | | 6,322,514 | |
| | | | | | | | |
Food 2.6% | |
JBS Investments II GmbH
7.00%, due 1/15/26 (a) | | | 1,775,000 | | | | 1,922,325 | |
Kerry Group Financial Services Unlimited Co.
3.20%, due 4/9/23 (a) | | | 2,151,000 | | | | 2,170,487 | |
Kroger Co.
1.50%, due 9/30/19 | | | 2,805,000 | | | | 2,797,588 | |
Mondelez International Holdings Netherlands B.V. (a) | | | | | | | | |
1.625%, due 10/28/19 | | | 3,060,000 | | | | 3,049,235 | |
2.00%, due 10/28/21 | | | 3,355,000 | | | | 3,324,143 | |
Nestle Holdings, Inc.
3.10%, due 9/24/21 (a) | | | 4,990,000 | | | | 5,093,759 | |
Smithfield Foods, Inc. (a) | | | | | | | | |
2.70%, due 1/31/20 | | | 4,725,000 | | | | 4,715,181 | |
3.35%, due 2/1/22 | | | 1,805,000 | | | | 1,800,504 | |
Sysco Corp.
3.30%, due 7/15/26 | | | 1,735,000 | | | | 1,781,019 | |
Tyson Foods, Inc.
2.65%, due 8/15/19 | | | 1,660,000 | | | | 1,660,276 | |
| | | | | | | | |
| | | | | | | 28,314,517 | |
| | | | | | | | |
Forest Products & Paper 0.6% | |
Georgia-Pacific LLC | | | | | | | | |
5.40%, due 11/1/20 (a) | | | 4,000,000 | | | | 4,157,409 | |
8.00%, due 1/15/24 | | | 2,180,000 | | | | 2,693,451 | |
| | | | | | | | |
| | | | | | | 6,850,860 | |
| | | | | | | | |
Health Care—Products 1.7% | |
Abbott Laboratories
3.40%, due 11/30/23 (c) | | | 3,540,000 | | | | 3,690,855 | |
| | | | | | | | |
| | | Principal
Amount | | | Value | |
Health Care—Products (continued) | | | | | | | | |
Baxter International, Inc.
2.60%, due 8/15/26 | | $ | 6,085,000 | | | $ | 6,026,100 | |
Becton Dickinson & Co. | | | | | | | | |
2.675%, due 12/15/19 | | | 4,575,000 | | | | 4,576,445 | |
3.363%, due 6/6/24 | | | 2,245,000 | | | | 2,312,198 | |
Stryker Corp.
2.625%, due 3/15/21 | | | 1,500,000 | | | | 1,506,461 | |
Zimmer Biomet Holdings, Inc.
2.70%, due 4/1/20 | | | 1,190,000 | | | | 1,191,482 | |
| | | | | | | | |
| | | | | | | 19,303,541 | |
| | | | | | | | |
Health Care—Services 0.5% | |
Laboratory Corporation of America Holdings
2.625%, due 2/1/20 | | | 6,010,000 | | | | 6,013,716 | |
| | | | | | | | |
|
Home Builders 0.9% | |
D.R. Horton, Inc.
4.375%, due 9/15/22 | | | 3,350,000 | | | | 3,488,775 | |
KB Home
8.00%, due 3/15/20 | | | 1,925,000 | | | | 1,987,948 | |
Lennar Corp.
4.50%, due 11/15/19 | | | 1,300,000 | | | | 1,304,875 | |
MDC Holdings, Inc.
5.625%, due 2/1/20 | | | 1,072,000 | | | | 1,080,040 | |
Toll Brothers Finance Corp.
5.875%, due 2/15/22 | | | 2,475,000 | | | | 2,629,687 | |
| | | | | | | | |
| | | | | | | 10,491,325 | |
| | | | | | | | |
Housewares 0.2% | |
Scotts Miracle-Gro Co.
5.25%, due 12/15/26 | | | 1,960,000 | | | | 1,989,400 | |
| | | | | | | | |
|
Insurance 3.0% | |
Jackson National Life Global Funding
2.20%, due 1/30/20 (a) | | | 2,055,000 | | | | 2,053,432 | |
Liberty Mutual Group, Inc.
4.25%, due 6/15/23 (a) | | | 2,695,000 | | | | 2,849,037 | |
Lincoln National Corp.
4.883% (3 Month LIBOR + 2.358%), due 5/17/66 (b) | | | 7,583,000 | | | | 6,199,103 | |
MassMutual Global Funding II (a) | | | | | | | | |
2.50%, due 10/17/22 | | | 3,670,000 | | | | 3,698,784 | |
2.95%, due 1/11/25 | | | 2,995,000 | | | | 3,060,355 | |
Metropolitan Life Global Funding I
3.45%, due 10/9/21 (a) | | | 2,610,000 | | | | 2,671,384 | |
Oil Insurance, Ltd.
5.301% (3 Month LIBOR + 2.982%), due 9/30/19 (a)(b)(e) | | | 1,648,000 | | | | 1,590,082 | |
Pricoa Global Funding I
2.55%, due 11/24/20 (a) | | | 2,025,000 | | | | 2,032,867 | |
| | | | |
| 14 | | MainStay VP MacKay Unconstrained Bond Portfolio | | The notes to the financial statements are an integral part of,
and should be read in conjunction with, the financial statements. |
| | | | | | | | |
| | | Principal
Amount | | | Value | |
| Corporate Bonds (continued) | | | | | | | | |
Insurance (continued) | | | | | | | | |
Principal Life Global Funding II
2.375%, due 11/21/21 (a) | | $ | 5,550,000 | | | $ | 5,552,674 | |
Protective Life Corp.
8.45%, due 10/15/39 | | | 1,564,000 | | | | 2,330,045 | |
Prudential Financial, Inc.
5.625%, due 6/15/43 (d) | | | 1,245,000 | | | | 1,316,538 | |
| | | | | | | | |
| | | | | | | 33,354,301 | |
| | | | | | | | |
Internet 2.0% | |
Booking Holdings, Inc.
3.60%, due 6/1/26 | | | 2,875,000 | | | | 3,031,599 | |
Expedia Group, Inc. | | | | | | | | |
3.80%, due 2/15/28 | | | 2,245,000 | | | | 2,285,162 | |
5.00%, due 2/15/26 | | | 315,000 | | | | 343,109 | |
GrubHub Holdings, Inc.
5.50%, due 7/1/27 (a) | | | 1,350,000 | | | | 1,385,600 | |
Match Group, Inc.
5.00%, due 12/15/27 (a) | | | 1,775,000 | | | | 1,859,135 | |
Tencent Holdings, Ltd.
3.80%, due 2/11/25 (a) | | | 5,450,000 | | | | 5,683,293 | |
VeriSign, Inc.
4.625%, due 5/1/23 | | | 3,670,000 | | | | 3,729,821 | |
Weibo Corp.
3.50%, due 7/5/24 | | | 1,625,000 | | | | 1,631,742 | |
Zayo Group LLC / Zayo Capital, Inc.
5.75%, due 1/15/27 (a) | | | 2,090,000 | | | | 2,129,459 | |
| | | | | | | | |
| | | | | | | 22,078,920 | |
| | | | | | | | |
Iron & Steel 0.8% | |
AK Steel Corp.
7.625%, due 10/1/21 (c) | | | 2,860,000 | | | | 2,817,100 | |
ArcelorMittal
4.55%, due 3/11/26 | | | 3,205,000 | | | | 3,387,683 | |
Vale Overseas, Ltd.
6.25%, due 8/10/26 | | | 2,780,000 | | | | 3,157,941 | |
| | | | | | | | |
| | | | | | | 9,362,724 | |
| | | | | | | | |
Leisure Time 0.3% | |
NCL Corp., Ltd.
4.75%, due 12/15/21 (a) | | | 807,000 | | | | 818,096 | |
Royal Caribbean Cruises, Ltd.
2.65%, due 11/28/20 | | | 2,630,000 | | | | 2,636,702 | |
| | | | | | | | |
| | | | | | | 3,454,798 | |
| | | | | | | | |
Lodging 0.8% | |
Boyd Gaming Corp.
6.375%, due 4/1/26 | | | 1,000 | | | | 1,058 | |
Marriott International, Inc. | | | | | | | | |
3.75%, due 10/1/25 | | | 4,205,000 | | | | 4,376,613 | |
7.15%, due 12/1/19 | | | 1,334,000 | | | | 1,357,625 | |
| | | | | | | | |
| | | Principal
Amount | | | Value | |
Lodging (continued) | | | | | | | | |
MGM Resorts International | | | | | | | | |
6.00%, due 3/15/23 | | $ | 2,300,000 | | | $ | 2,492,625 | |
6.625%, due 12/15/21 | | | 475,000 | | | | 513,000 | |
| | | | | | | | |
| | | | | | | 8,740,921 | |
| | | | | | | | |
Machinery—Construction & Mining 1.1% | |
Caterpillar Financial Services Corp. | | | | | | | | |
2.10%, due 1/10/20 | | | 5,790,000 | | | | 5,783,514 | |
2.90%, due 3/15/21 | | | 6,385,000 | | | | 6,458,565 | |
| | | | | | | | |
| | | | | | | 12,242,079 | |
| | | | | | | | |
Machinery—Diversified 0.7% | |
CNH Industrial Capital LLC | | | | | | | | |
4.375%, due 4/5/22 | | | 3,550,000 | | | | 3,686,994 | |
4.875%, due 4/1/21 | | | 4,355,000 | | | | 4,505,422 | |
| | | | | | | | |
| | | | | | | 8,192,416 | |
| | | | | | | | |
Media 2.6% | |
Charter Communications Operating LLC / Charter Communications Operating Capital
4.464%, due 7/23/22 (c) | | | 2,770,000 | | | | 2,910,643 | |
Clear Channel Worldwide Holdings, Inc.
Series B
6.50%, due 11/15/22 | | | 1,385,000 | | | | 1,410,969 | |
Comcast Corp. | | | | | | | | |
3.30%, due 10/1/20 | | | 3,000,000 | | | | 3,041,128 | |
5.70%, due 7/1/19 | | | 3,000,000 | | | | 3,000,000 | |
Grupo Televisa S.A.B.
5.25%, due 5/24/49 | | | 1,735,000 | | | | 1,800,072 | |
Sirius XM Radio, Inc. (a) | | | | | | | | |
3.875%, due 8/1/22 | | | 2,545,000 | | | | 2,551,363 | |
5.375%, due 7/15/26 | | | 3,000,000 | | | | 3,108,750 | |
Sky, Ltd.
3.75%, due 9/16/24 (a) | | | 1,105,000 | | | | 1,174,171 | |
Time Warner Entertainment Co., L.P.
8.375%, due 3/15/23 | | | 740,000 | | | | 876,895 | |
UPCB Finance IV, Ltd.
5.375%, due 1/15/25 (a) | | | 5,335,000 | | | | 5,483,366 | |
Virgin Media Secured Finance PLC
5.25%, due 1/15/26 (a) | | | 2,785,000 | | | | 2,853,817 | |
| | | | | | | | |
| | | | | | | 28,211,174 | |
| | | | | | | | |
Mining 0.3% | |
Anglo American Capital PLC
4.125%, due 4/15/21 (a) | | | 3,300,000 | | | | 3,375,546 | |
| | | | | | | | |
|
Miscellaneous—Manufacturing 0.6% | |
Siemens Financieringsmaatschappij N.V. (a) | | | | | |
2.15%, due 5/27/20 | | | 1,480,000 | | | | 1,477,751 | |
2.70%, due 3/16/22 | | | 2,485,000 | | | | 2,511,083 | |
| | | | | | |
The notes to the financial statements are an integral part of,
and should be read in conjunction with, the financial statements. | | | | | 15 | |
Portfolio of InvestmentsJune 30, 2019 (Unaudited) (continued)
| | | | | | | | |
| | | Principal
Amount | | | Value | |
| Corporate Bonds (continued) | | | | | | | | |
Miscellaneous—Manufacturing (continued) | |
Textron Financial Corp.
4.253% (3 Month LIBOR + 1.735%), due 2/15/67 (a)(b) | | $ | 3,720,000 | | | $ | 2,901,600 | |
| | | | | | | | |
| | | | | | | 6,890,434 | |
| | | | | | | | |
Oil & Gas 2.7% | |
Anadarko Petroleum Corp.
(zero coupon), due 10/10/36 | | | 6,555,000 | | | | 3,096,911 | |
Concho Resources, Inc.
4.30%, due 8/15/28 | | | 2,900,000 | | | | 3,122,625 | |
Gazprom Via Gaz Capital S.A.
7.288%, due 8/16/37 (a) | | | 2,500,000 | | | | 3,154,060 | |
Marathon Petroleum Corp.
5.125%, due 12/15/26 | | | 5,755,000 | | | | 6,287,359 | |
Murphy Oil USA, Inc.
6.00%, due 8/15/23 | | | 4,348,000 | | | | 4,467,570 | |
Petrobras Global Finance B.V.
7.375%, due 1/17/27 | | | 2,538,000 | | | | 2,903,472 | |
Petroleos Mexicanos
6.75%, due 9/21/47 | | | 4,990,000 | | | | 4,443,595 | |
Valero Energy Corp.
4.00%, due 4/1/29 | | | 2,250,000 | | | | 2,355,664 | |
| | | | | | | | |
| | | | | | | 29,831,256 | |
| | | | | | | | |
Packaging & Containers 1.2% | |
Ball Corp.
5.00%, due 3/15/22 | | | 4,240,000 | | | | 4,457,300 | |
Reynolds Group Issuer, Inc. / Reynolds Group Issuer LLC
5.125%, due 7/15/23 (a) | | | 4,215,000 | | | | 4,294,031 | |
Sealed Air Corp.
4.875%, due 12/1/22 (a) | | | 1,875,000 | | | | 1,966,406 | |
WestRock RKT Co.
4.00%, due 3/1/23 | | | 2,230,000 | | | | 2,316,612 | |
| | | | | | | | |
| | | | | | | 13,034,349 | |
| | | | | | | | |
Pharmaceuticals 2.2% | |
Allergan Funding SCS
3.45%, due 3/15/22 | | | 4,165,000 | | | | 4,252,527 | |
Bausch Health Cos., Inc.
5.50%, due 11/1/25 (a) | | | 4,590,000 | | | | 4,785,075 | |
Bristol-Myers Squibb Co.
3.40%, due 7/26/29 (a) | | | 3,280,000 | | | | 3,433,968 | |
Eli Lilly & Co.
2.35%, due 5/15/22 | | | 1,700,000 | | | | 1,713,131 | |
Novartis Capital Corp.
1.80%, due 2/14/20 | | | 2,850,000 | | | | 2,841,379 | |
Syneos Health, Inc. / inVentiv Health, Inc. / inVentiv Health Clinical, Inc.
7.50%, due 10/1/24 (a) | | | 3,095,000 | | | | 3,234,275 | |
| | | | | | | | |
| | | Principal
Amount | | | Value | |
Pharmaceuticals (continued) | | | | | | | | |
Takeda Pharmaceutical Co., Ltd.
3.80%, due 11/26/20 (a) | | $ | 1,460,000 | | | $ | 1,486,488 | |
Zoetis, Inc. | | | | | | | | |
2.96% (3 Month LIBOR + 0.44%), due 8/20/21 (b) | | | 1,655,000 | | | | 1,642,722 | |
3.25%, due 8/20/21 | | | 1,045,000 | | | | 1,061,177 | |
| | | | | | | | |
| | | | | | | 24,450,742 | |
| | | | | | | | |
Pipelines 0.8% | |
Enterprise Products Operating LLC | | | | | | | | |
3.125%, due 7/31/29 | | | 2,345,000 | | | | 2,350,064 | |
4.20%, due 1/31/50 | | | 545,000 | | | | 557,281 | |
MPLX, L.P. | | | | | | | | |
4.00%, due 3/15/28 | | | 2,500,000 | | | | 2,589,119 | |
4.125%, due 3/1/27 | | | 1,780,000 | | | | 1,863,229 | |
Spectra Energy Partners, L.P.
4.75%, due 3/15/24 | | | 818,000 | | | | 885,973 | |
Targa Resources Partners, L.P. / Targa Resources Partners Finance Corp.
5.25%, due 5/1/23 | | | 950,000 | | | | 963,157 | |
| | | | | | | | |
| | | | | | | 9,208,823 | |
| | | | | | | | |
Private Equity 0.6% | |
Icahn Enterprises, L.P. / Icahn Enterprises Finance Corp. | | | | | | | | |
6.00%, due 8/1/20 | | | 4,445,000 | | | | 4,451,668 | |
6.25%, due 5/15/26 (a) | | | 2,440,000 | | | | 2,473,550 | |
| | | | | | | | |
| | | | | | | 6,925,218 | |
| | | | | | | | |
Real Estate 0.1% | |
Realogy Group LLC / RealogyCo-Issuer Corp.
5.25%, due 12/1/21 (a) | | | 640,000 | | | | 614,400 | |
| | | | | | | | |
|
Real Estate Investment Trusts 2.0% | |
American Tower Corp.
3.00%, due 6/15/23 (c) | | | 5,000,000 | | | | 5,048,497 | |
Boston Properties, L.P.
3.20%, due 1/15/25 | | | 4,800,000 | | | | 4,899,983 | |
Crown Castle International Corp.
3.40%, due 2/15/21 | | | 1,255,000 | | | | 1,272,143 | |
Equinix, Inc. | | | | | | | | |
5.75%, due 1/1/25 | | | 2,000,000 | | | | 2,082,000 | |
5.875%, due 1/15/26 | | | 2,275,000 | | | | 2,408,656 | |
ESH Hospitality, Inc.
5.25%, due 5/1/25 (a) | | | 5,145,000 | | | | 5,267,194 | |
Host Hotels & Resorts, L.P.
3.75%, due 10/15/23 | | | 329,000 | | | | 337,035 | |
Iron Mountain, Inc.
6.00%, due 8/15/23 | | | 340,000 | | | | 349,350 | |
| | | | | | | | |
| | | | | | | 21,664,858 | |
| | | | | | | | |
| | | | |
| 16 | | MainStay VP MacKay Unconstrained Bond Portfolio | | The notes to the financial statements are an integral part of,
and should be read in conjunction with, the financial statements. |
| | | | | | | | |
| | | Principal
Amount | | | Value | |
| Corporate Bonds (continued) | | | | | | | | |
Retail 1.6% | |
Alimentation Couche-Tard, Inc. (a) | | | | | | | | |
2.35%, due 12/13/19 | | $ | 3,035,000 | | | $ | 3,031,601 | |
2.70%, due 7/26/22 | | | 1,650,000 | | | | 1,653,252 | |
CVS Health Corp.
3.083% (3 Month LIBOR + 0.63%), due 3/9/20 (b) | | | 3,550,000 | | | | 3,558,614 | |
Darden Restaurants, Inc.
3.85%, due 5/1/27 | | | 2,025,000 | | | | 2,091,990 | |
Dollar General Corp.
3.25%, due 4/15/23 (c) | | | 4,115,000 | | | | 4,226,942 | |
QVC, Inc.
4.85%, due 4/1/24 | | | 455,000 | | | | 470,776 | |
Starbucks Corp.
4.45%, due 8/15/49 | | | 2,065,000 | | | | 2,261,228 | |
| | | | | | | | |
| | | | | | | 17,294,403 | |
| | | | | | | | |
Semiconductors 0.5% | |
Broadcom, Inc.
3.625%, due 10/15/24 (a) | | | 2,470,000 | | | | 2,482,278 | |
NXP B.V. / NXP Funding LLC (a) | | | | | | | | |
4.625%, due 6/15/22 | | | 1,755,000 | | | | 1,838,362 | |
4.625%, due 6/1/23 | | | 1,065,000 | | | | 1,122,617 | |
| | | | | | | | |
| | | | | | | 5,443,257 | |
| | | | | | | | |
Software 1.6% | |
First Data Corp.
5.00%, due 1/15/24 (a) | | | 2,103,000 | | | | 2,154,523 | |
Fiserv, Inc. | | | | | | | | |
2.75%, due 7/1/24 | | | 1,135,000 | | | | 1,145,115 | |
3.20%, due 7/1/26 | | | 720,000 | | | | 734,890 | |
Microsoft Corp. | | | | | | | | |
1.85%, due 2/6/20 (c) | | | 4,520,000 | | | | 4,510,312 | |
3.30%, due 2/6/27 | | | 2,055,000 | | | | 2,183,600 | |
MSCI, Inc.
5.75%, due 8/15/25 (a) | | | 4,005,000 | | | | 4,205,250 | |
PTC, Inc.
6.00%, due 5/15/24 (c) | | | 2,569,000 | | | | 2,691,027 | |
| | | | | | | | |
| | | | | | | 17,624,717 | |
| | | | | | | | |
Special Purpose Entity 0.3% | |
CK Hutchison International (17) II, Ltd.
3.25%, due 9/29/27 (a) | | | 3,260,000 | | | | 3,302,578 | |
| | | | | | | | |
|
Telecommunications 3.4% | |
AT&T, Inc. | | | | | | | | |
3.20%, due 3/1/22 | | | 4,275,000 | | | | 4,365,996 | |
3.616% (3 Month LIBOR + 1.18%), due 6/12/24 (b)(c) | | | 2,890,000 | | | | 2,926,336 | |
Cisco Systems, Inc.
1.85%, due 9/20/21 | | | 1,060,000 | | | | 1,053,776 | |
CommScope Technologies LLC
5.00%, due 3/15/27 (a) | | | 1,600,000 | | | | 1,392,000 | |
| | | | | | | | |
| | | Principal
Amount | | | Value | |
Telecommunications (continued) | | | | | | | | |
CommScope, Inc.
5.00%, due 6/15/21 (a) | | $ | 1,563,000 | | | $ | 1,559,092 | |
Crown Castle Towers LLC (a) | | | | | | | | |
3.72%, due 7/15/43 | | | 1,550,000 | | | | 1,595,170 | |
4.241%, due 7/15/48 | | | 3,755,000 | | | | 4,036,993 | |
Hughes Satellite Systems Corp.
5.25%, due 8/1/26 | | | 540,000 | | | | 554,850 | |
Sprint Spectrum Co. LLC / Sprint Spectrum Co. II LLC / Sprint Spectrum Co. III LLC
4.738%, due 9/20/29 (a) | | | 4,750,000 | | | | 4,928,125 | |
T-Mobile USA, Inc. | | | | | | | | |
4.50%, due 2/1/26 | | | 2,245,000 | | | | 2,298,319 | |
6.00%, due 3/1/23 | | | 1,200,000 | | | | 1,227,000 | |
6.50%, due 1/15/26 | | | 1,235,000 | | | | 1,335,109 | |
Telefonica Emisiones SAU | | | | | | | | |
4.57%, due 4/27/23 | | | 1,781,000 | | | | 1,925,947 | |
5.462%, due 2/16/21 | | | 279,000 | | | | 292,350 | |
5.877%, due 7/15/19 (c) | | | 3,625,000 | | | | 3,629,218 | |
Verizon Communications, Inc. | | | | | | | | |
3.618% (3 Month LIBOR + 1.10%), due 5/15/25 (b) | | | 2,455,000 | | | | 2,486,547 | |
5.15%, due 9/15/23 | | | 1,722,000 | | | | 1,922,743 | |
| | | | | | | | |
| | | | | | | 37,529,571 | |
| | | | | | | | |
Textiles 0.4% | |
Cintas Corp. No 2
2.90%, due 4/1/22 | | | 3,805,000 | | | | 3,869,699 | |
| | | | | | | | |
|
Transportation 0.5% | |
United Parcel Service, Inc.
2.50%, due 4/1/23 | | | 4,965,000 | | | | 5,018,479 | |
| | | | | | | | |
Total Corporate Bonds
(Cost $786,333,866) | | | | | | | 799,304,577 | |
| | | | | | | | |
|
| Loan Assignments 8.8% (b) | |
Advertising 1.2% | |
Las Vegas Sands LLC
2018 Term Loan B
4.152% (1 Month LIBOR + 1.75%), due 3/27/25 | | | 5,095,500 | | | | 5,055,546 | |
Outfront Media Capital LLC
2017 Term Loan B
4.421% (1 Month LIBOR + 2.00%), due 3/18/24 | | | 5,362,500 | | | | 5,343,506 | |
Syneos Health, Inc.
2018 Term Loan B
4.402% (1 Month LIBOR + 2.00%), due 8/1/24 | | | 3,133,674 | | | | 3,118,658 | |
| | | | | | | | |
| | | | | | | 13,517,710 | |
| | | | | | | | |
| | | | | | |
The notes to the financial statements are an integral part of,
and should be read in conjunction with, the financial statements. | | | | | 17 | |
Portfolio of InvestmentsJune 30, 2019 (Unaudited) (continued)
| | | | | | | | |
| | | Principal
Amount | | | Value | |
| Loan Assignments (continued) | |
Chemicals, Plastics & Rubber 0.4% | |
Axalta Coating Systems U.S. Holdings, Inc. Term Loan B3
4.08% (3 Month LIBOR + 1.75%), due 6/1/24 | | $ | 4,320,878 | | | $ | 4,266,867 | |
| | | | | | | | |
|
Commercial Services 0.2% | |
Global Payments Inc.
2018 Term Loan B3
4.152% (1 Month LIBOR + 1.75%), due 4/21/23 | | | 1,837,700 | | | | 1,834,747 | |
KAR Auction Services, Inc. Term Loan B4
4.625% (3 Month LIBOR + 2.25%), due 3/11/21 | | | 412,787 | | | | 411,755 | |
ServiceMaster Co.
2016 Term Loan B
4.902% (1 Month LIBOR + 2.50%), due 11/8/23 | | | 460,299 | | | | 459,628 | |
| | | | | | | | |
| | | | | | | 2,706,130 | |
| | | | | | | | |
Diversified/Conglomerate Service 0.4% | |
Worldpay, LLC
2018 1st Lien Term Loan B4
4.132% (1 Week LIBOR + 1.75%), due 8/9/24 | | | 1,386,325 | | | | 1,384,906 | |
2018 1st Lien Term Loan B4 4.151% (1 Month LIBOR + 1.75%), due 8/9/24 | | | 2,617,988 | | | | 2,615,310 | |
| | | | | | | | |
| | | | | | | 4,000,216 | |
| | | | | | | | |
Environmental Controls 0.4% | |
GFL Environmental, Inc.
2018 Term Loan B
5.402% (1 Month LIBOR + 3.00%), due 5/30/25 | | | 3,911,583 | | | | 3,842,152 | |
| | | | | | | | |
|
Food 0.1% | |
Post Holdings, Inc.
2017 Series A Incremental Term Loan
4.404% (1 Month LIBOR + 2.00%), due 5/24/24 | | | 1,577,352 | | | | 1,568,620 | |
| | | | | | | | |
|
Food—Wholesale 0.5% | |
U.S. Foods, Inc.
2016 Term Loan B
4.402% (1 Month LIBOR + 2.00%), due 6/27/23 | | | 5,116,750 | | | | 5,079,290 | |
| | | | | | | | |
| | | | | | | | |
| | | Principal
Amount | | | Value | |
Hand & Machine Tools 0.3% | |
Milacron LLC
Amended Term Loan B
4.902% (1 Month LIBOR + 2.50%), due 9/28/23 | | $ | 3,142,867 | | | $ | 3,056,438 | |
| | | | | | | | |
|
Health Care—Services 0.3% | |
MPH Acquisition Holdings LLC
2016 Term Loan B
5.08% (3 Month LIBOR + 2.75%), due 6/7/23 | | | 3,592,507 | | | | 3,429,346 | |
| | | | | | | | |
|
Health Services 0.4% | |
ExamWorks Group, Inc.
2017 Term Loan
5.652% (1 Month LIBOR + 3.25%), due 7/27/23 | | | 4,498,246 | | | | 4,492,623 | |
| | | | | | | | |
|
Household Products & Wares 0.2% | |
Prestige Brands, Inc.
Term Loan B4
4.402% (1 Month LIBOR + 2.00%),
due 1/26/24 | | | 2,385,799 | | | | 2,370,888 | |
| | | | | | | | |
|
Internet 0.2% | |
Match Group, Inc.
2017 Term Loan B
4.904% (1 Month LIBOR + 2.50%), due 11/16/22 | | | 1,859,375 | | | | 1,859,375 | |
| | | | | | | | |
|
Leisure Time 0.3% | |
Bombardier Recreational Products, Inc.
2016 Term Loan B
4.40% (1 Month LIBOR + 2.00%), due 5/23/25 | | | 3,051,938 | | | | 3,003,616 | |
| | | | | | | | |
|
Lodging 0.5% | |
Boyd Gaming Corp.
Term Loan B3
4.622% (1 Week LIBOR + 2.25%), due 9/15/23 | | | 450,854 | | | | 448,205 | |
Hilton Worldwide Finance LLC
Term Loan B2
4.154% (1 Month LIBOR + 1.75%), due 10/25/23 | | | 4,271,113 | | | | 4,270,579 | |
MGM Growth Properties Operating Partnership, L.P.
2016 Term Loan B
4.402% (1 Month LIBOR + 2.00%), due 3/21/25 | | | 967,500 | | | | 961,108 | |
| | | | | | | | |
| | | | | | | 5,679,892 | |
| | | | | | | | |
| | | | |
| 18 | | MainStay VP MacKay Unconstrained Bond Portfolio | | The notes to the financial statements are an integral part of,
and should be read in conjunction with, the financial statements. |
| | | | | | | | |
| | | Principal
Amount | | | Value | |
| Loan Assignments (continued) | |
Machinery—Diversified 0.1% | |
Zebra Technologies Corp.
2018 Term Loan B
4.181% (1 Month LIBOR + 1.75%), due 10/27/21 | | $ | 1,428,793 | | | $ | 1,429,983 | |
| | | | | | | | |
|
Media 0.4% | |
Nielsen Finance LLC
Term Loan B4
4.412% (1 Month LIBOR + 2.00%), due 10/4/23 | | | 2,940,000 | | | | 2,909,024 | |
Virgin Media Bristol LLC
Term Loan K
4.894% (1 Month LIBOR + 2.50%), due 1/15/26 | | | 1,225,000 | | | | 1,220,066 | |
| | | | | | | | |
| | | | | | | 4,129,090 | |
| | | | | | | | |
Packaging & Containers 0.1% | |
Berry Global, Inc.
2018 Term Loan S
4.162% (3 Month LIBOR + 1.75%), due 2/8/20 | | | 1,478,431 | | | | 1,476,122 | |
| | | | | | | | |
|
Semiconductors 0.2% | |
ON Semiconductor Corp.
2018 1st Lien Term Loan B
4.152% (1 Month LIBOR + 1.75%), due 3/31/23 | | | 1,886,148 | | | | 1,858,380 | |
| | | | | | | | |
|
Software 0.6% | |
First Data Corp.
2024 Term Loan
4.404% (1 Month LIBOR + 2.00%), due 4/26/24 | | | 2,315,868 | | | | 2,313,293 | |
IQVIA, Inc.
2018 USD Term Loan B3
4.152% (1 Month LIBOR + 1.75%), due 6/11/25 | | | 3,811,500 | | | | 3,788,360 | |
| | | | | | | | |
| | | | | | | 6,101,653 | |
| | | | | | | | |
Support Services 1.0% | |
Advanced Disposal Services, Inc.
Term Loan B3
4.635% (1 Week LIBOR + 2.25%), due 11/10/23 | | | 5,567,989 | | | | 5,557,165 | |
Change Healthcare Holdings, Inc.
2017 Term Loan B
5.152% (1 Month LIBOR + 2.75%), due 3/1/24 | | | 5,860,370 | | | | 5,808,277 | |
| | | | | | | | |
| | | | | | | 11,365,442 | |
| | | | | | | | |
| | | | | | | | |
| | | Principal
Amount | | | Value | |
Telecommunications 0.9% | |
Level 3 Financing, Inc.
2017 Term Loan B
4.652% (1 Month LIBOR + 2.25%), due 2/22/24 | | $ | 5,875,000 | | | $ | 5,822,372 | |
SBA Senior Finance II LLC
2018 Term Loan B
4.41% (1 Month LIBOR + 2.00%), due 4/11/25 | | | 4,234,269 | | | | 4,175,387 | |
| | | | | | | | |
| | | | | | | 9,997,759 | |
| | | | | | | | |
Transportation 0.2% | |
XPO Logistics, Inc.
2018 Term Loan B
4.402% (1 Month LIBOR + 2.00%), due 2/24/25 | | | 2,477,254 | | | | 2,455,016 | |
| | | | | | | | |
Total Loan Assignments
(Cost $97,947,889) | | | | | | | 97,686,608 | |
| | | | | | | | |
|
| Mortgage-Backed Securities 5.9% | |
Agency (Collateralized Mortgage Obligations) 1.6% | |
Federal Home Loan Mortgage Corporation REMIC Series 4888, Class BA
3.50%, due 9/15/48 | | | 2,221,077 | | | | 2,312,331 | |
Federal National Mortgage Association
Series 2019-25, Class PA
3.00%, due 5/25/48 | | | 2,726,093 | | | | 2,784,347 | |
Government National Mortgage Association | | | | | | | | |
Series 2014-91, Class MA
3.00%, due 1/16/40 | | | 3,191,230 | | | | 3,273,183 | |
Series 2019-29, Class CB
3.00%, due 10/20/48 | | | 2,252,832 | | | | 2,296,536 | |
Series 2019-43, Class PL
3.00%, due 4/20/49 | | | 2,607,757 | | | | 2,658,390 | |
Series 2019-74, Class AT
3.00%, due 6/20/49 | | | 3,709,000 | | | | 3,797,803 | |
| | | | | | | | |
| | | | | | | 17,122,590 | |
| | | | | | | | |
Commercial Mortgage Loans
(Collateralized Mortgage Obligations) 3.6% | |
BX Commercial Mortgage Trust
Series 2018-IND, Class A
3.144% (1 Month LIBOR + 0.75%), due 11/15/35 (a)(b) | | | 3,029,221 | | | | 3,031,708 | |
FREMF Mortgage Trust (a)(g) | | | | | | | | |
Series 2013-K33, Class B
3.615%, due 8/25/46 | | | 3,090,000 | | | | 3,210,628 | |
Series 2013-K35, Class B
4.074%, due 8/25/23 | | | 2,375,000 | | | | 2,513,778 | |
| | | | | | |
The notes to the financial statements are an integral part of,
and should be read in conjunction with, the financial statements. | | | | | 19 | |
Portfolio of InvestmentsJune 30, 2019 (Unaudited) (continued)
| | | | | | | | |
| | | Principal
Amount | | | Value | |
| Mortgage-Backed Securities (continued) | |
Commercial Mortgage Loans
(Collateralized Mortgage Obligations) (continued) | |
GS Mortgage Securities Trust | | | | | | | | |
Series 2019-GC40, Class A4
3.16%, due 7/10/52 (h) | | $ | 2,699,000 | | | $ | 2,783,209 | |
Series 2019-BOCA, Class A
3.65% (1 Month LIBOR + 1.20%), due 6/15/38 (a)(b) | | | 4,660,000 | | | | 4,663,052 | |
Hawaii Hotel Trust
Series 2019-MAUI, Class A
3.544% (1 Month LIBOR + 1.15%), due 5/15/38 (a)(b) | | | 2,480,000 | | | | 2,482,344 | |
Hudson Yards Mortgage Trust
Series 2019-30HY, Class A
3.228%, due 7/10/39 (a)(h) | | | 2,600,000 | | | | 2,675,660 | |
JP Morgan Chase Commercial Mortgage Securities Trust | | | | | | | | |
Series 2018-AON, Class A
4.128%, due 7/5/31 (a) | | | 3,643,000 | | | | 3,896,589 | |
Series 2013-C16, Class A4
4.166%, due 12/15/46 | | | 2,380,000 | | | | 2,551,220 | |
JPMBB Commercial Mortgage Securities Trust
Series 2015-C28, Class A4
3.227%, due 10/15/48 | | | 3,250,000 | | | | 3,372,109 | |
Wells Fargo Commercial Mortgage Trust (a)(g) | | | | | | | | |
Series 2018-1745, Class A
3.874%, due 6/15/36 | | | 3,450,000 | | | | 3,696,065 | |
Series 2018-AUS, Class A
4.194%, due 8/17/36 | | | 4,200,000 | | | | 4,592,855 | |
Wells Fargo Mortgage Backed Securities Trust
Series 2006-AR10, Class 5A2
4.992%, due 7/25/36 (g) | | | 11,835 | | | | 12,013 | |
| | | | | | | | |
| | | | | | | 39,481,230 | |
| | | | | | | | |
Whole Loan (Collateralized Mortgage Obligations) 0.7% | |
Chase Home Lending Mortgage Trust
Series 2019-ATR1, Class A4
4.00%, due 4/25/49 (a)(i) | | | 3,631,623 | | | | 3,694,842 | |
Federal Home Loan Mortgage Corporation
Series 2019-1, Class A1
3.50%, due 5/25/29 | | | 2,446,879 | | | | 2,544,975 | |
JP Morgan Mortgage Trust
Series 2019-1, Class A3
4.00%, due 5/25/49 (a)(i) | | | 1,921,093 | | | | 1,963,396 | |
| | | | | | | | |
| | | | | | | 8,203,213 | |
| | | | | | | | |
Total Mortgage-Backed Securities
(Cost $63,381,061) | | | | | | | 64,807,033 | |
| | | | | | | | |
| | | | | | | | |
| | | Principal
Amount | | | Value | |
| U.S. Government & Federal Agencies 9.3% | |
Federal Home Loan Mortgage Corporation
(Mortgage Pass-Through Securities) 0.2% | |
4.00%, due 2/1/49 | | $ | 2,523,908 | | | $ | 2,619,326 | |
| | | | | | | | |
|
Federal National Mortgage Association
(Mortgage Pass-Through Securities) 4.7% | |
3.00%, due 10/1/48 | | | 3,364,549 | | | | 3,400,661 | |
3.50%, due 1/29/48 TBA (j) | | | 14,396,000 | | | | 14,718,223 | |
4.00%, due 8/1/48 | | | 14,868,052 | | | | 15,453,060 | |
4.00%, due 2/1/49 | | | 5,644,501 | | | | 5,854,418 | |
4.50%, due 1/1/49 | | | 11,254,031 | | | | 11,818,327 | |
| | | | | | | | |
| | | | | | | 51,244,689 | |
| | | | | | | | |
United States Treasury Inflation—Indexed Notes 4.4% (k) | |
0.75%, due 7/15/28 | | | 12,188,993 | | | | 12,699,122 | |
0.875%, due 1/15/29 | | | 34,054,821 | | | | 35,844,779 | |
| | | | | | | | |
| | | | | | | 48,543,901 | |
| | | | | | | | |
Total U.S. Government & Federal Agencies
(Cost $99,397,957) | | | | | | | 102,407,916 | |
| | | | | | | | |
TotalLong-Term Bonds
(Cost $1,091,126,397) | | | | | | | 1,109,128,578 | |
| | | | | | | | |
| | |
| | | | | | | | |
| | |
Shares | | | | |
| Common Stocks 0.0%‡ | |
Software 0.0%‡ | |
salesforce.com, Inc. (l) | | | 1,267 | | | | 192,242 | |
| | | | | | | | |
Total Common Stocks
(Cost $146,797) | | | | | | | 192,242 | |
| | | | | | | | |
|
| Short-Term Investments 2.6% | |
Affiliated Investment Company 1.3% | |
MainStay U.S. Government Liquidity Fund, 2.03% (m) | | | 13,654,411 | | | | 13,654,411 | |
| | | | | | | | |
Total Affiliated Investment Company
(Cost $13,654,411) | | | | | | | 13,654,411 | |
| | | | | | | | |
|
Unaffiliated Investment Company 0.1% | |
State Street Navigator Securities Lending Government Money Market Portfolio, 2.33% (m)(n) | | | 1,400,338 | | | | 1,400,338 | |
| | | | | | | | |
Total Unaffiliated Investment Company
(Cost $1,400,338) | | | | | | | 1,400,338 | |
| | | | | | | | |
| | |
| | | | | | | | |
| | | | |
| 20 | | MainStay VP MacKay Unconstrained Bond Portfolio | | The notes to the financial statements are an integral part of,
and should be read in conjunction with, the financial statements. |
| | | | | | | | |
| | | Principal
Amount | | | Value | |
| Short-Term Investments (continued) | |
U.S. Governments 1.2% | |
United States Treasury Bills
2.103%, due 7/23/19 (o) | | $ | 13,540,000 | | | $ | 13,522,868 | |
| | | | | | | | |
Total U.S. Governments
(Cost $13,522,868) | | | | | | | 13,522,868 | |
| | | | | | | | |
TotalShort-Term Investments
(Cost $28,577,617) | | | | | | | 28,577,617 | |
| | | | | | | | |
Total Investments, Before Investments Sold Short
(Cost $1,119,850,811) | | | 103.1 | % | | | 1,137,898,437 | |
| | | | | | | | |
|
| Investments Sold Short (1.8%) | |
Corporate Bonds Sold Short (1.8%) | |
Health Care Providers & Services (0.5%) | |
Davita, Inc.
5.00%, due 5/1/25 | | | (3,015,000 | ) | | | (2,976,559 | ) |
Mylan N.V.
3.95%, due 6/15/26 | | | (3,175,000 | ) | | | (3,070,188 | ) |
| | | | | | | | |
| | | | | | | (6,046,747 | ) |
| | | | | | | | |
Internet & Direct Marketing Retail (0.8%) | |
Netflix, Inc.
4.375%, due 11/15/26 | | | (8,495,000 | ) | | | (8,688,686 | ) |
| | | | | | | | |
|
Semiconductors & Semiconductor Equipment (0.5%) | |
Amkor Technology, Inc.
6.625%, due 9/15/27 (a) | | | (5,050,000 | ) | | | (5,018,943 | ) |
| | | | | | | | |
Total Investments Sold Short
(Proceeds $19,310,069) | | | | | | | (19,754,376 | ) |
| | | | | | | | |
Total Investments, Net of Investments Sold Short
(Cost $1,100,540,742) | | | 101.3 | % | | | 1,118,144,061 | |
Other Assets, Less Liabilities | | | (1.3 | ) | | | (14,478,022 | ) |
Net Assets | | | 100.0 | % | | $ | 1,103,666,039 | |
| † | Percentages indicated are based on Portfolio net assets. |
| ‡ | Less than one-tenth of a percent. |
| (a) | May be sold to institutional investors only under Rule 144A or securities offered pursuant to Section 4(a)(2) of the Securities Act of 1933, as amended. |
| (b) | Floating rate—Rate shown was the rate in effect as of June 30, 2019. |
| (c) | Security, or a portion thereof, was maintained in a segregated account at the Portfolio’s custodian as collateral for securities sold short (See Note 2(O)). |
| (d) | Fixed to floating rate—Rate shown was the rate in effect as of June 30, 2019. |
| (e) | Securities are perpetual and, thus, do not have a predetermined maturity date. The date shown, if applicable, reflects the next call date. |
| (f) | All or a portion of this security was held on loan. As of June 30, 2019, the aggregate market value of securities on loan was $1,371,351 and the Portfolio received cash collateral with a value of $1,400,338 (See Note 2(P)). |
| (g) | Collateral strip rate—A bond whose interest was based on the weighted net interest rate of the collateral. The coupon rate adjusts periodically based on a predetermined schedule. Rate shown was the rate in effect as of June 30, 2019. |
| (h) | Fair valued security—Represents fair value as measured in good faith under procedures approved by the Board of Trustees. As of June 30, 2019, the total market value of fair valued securities was $5,458,869, which represented 0.5% of the Portfolio’s net assets. |
| (i) | Coupon rate may change based on changes of the underlying collateral or prepayments of principal. The coupon rate shown represents the rate at period end. |
| (j) | TBA—Securities purchased on a forward commitment basis with an approximate principal amount and maturity date. The actual principal amount and maturity date will be determined upon settlement. As of June 30, 2019, the total net market value of these securities was $14,718,223, which represented 1.3% of the Portfolio’s net assets. All or a portion of these securities are a part of a mortgage dollar roll agreement. |
| (k) | Treasury Inflation Protected Security—Pays a fixed rate of interest on a principal amount that is continuously adjusted for inflation based on the Consumer Price Index-Urban Consumers. |
| (l) | Non-income producing security. |
| (m) | Current yield as of June 30, 2019. |
| (n) | Represents security purchased with cash collateral received for securities on loan. |
| (o) | Interest rate shown represents yield to maturity. |
| | | | | | |
The notes to the financial statements are an integral part of,
and should be read in conjunction with, the financial statements. | | | | | 21 | |
Portfolio of InvestmentsJune 30, 2019 (Unaudited) (continued)
Foreign Currency Forward Contracts
As of June 30, 2019, the Portfolio held the following foreign currency forward contracts1:
| | | | | | | | | | | | | | | | | | |
Currency Purchased | | | Currency Sold | | | Counterparty | | Settlement
Date | | Unrealized
Appreciation
(Depreciation) | |
| | | | | | |
USD | | | 705,842 | | | GBP | | | 543,000 | | | JPMorgan Chase Bank N.A. | | 8/1/19 | | $ | 15,219 | |
Total unrealized appreciation | | | 15,219 | |
USD | | | 3,461,954 | | | EUR | | | 3,071,000 | | | JPMorgan Chase Bank N.A. | | 8/1/19 | | | (38,761 | ) |
Total unrealized depreciation | | | (38,761 | ) |
Net unrealized depreciation | | $ | (23,542 | ) |
| 1. | Foreign Currency Forward Contracts are subject to limitations such that they cannot be “sold or repurchased,” although the Portfolio would be able to exit the transaction through other means, such as through the execution of an offsetting transaction. |
Futures Contracts
As of June 30, 2019, the Portfolio held the following futures contracts1:
| | | | | | | | | | | | | | | | | | | | |
Type | | Number of
Contracts | | | Expiration
Date | | | Value at
Trade Date | | | Current
Notional
Amount | | | Unrealized
Appreciation
(Depreciation)2 | |
Long Contracts | | | | | | | | | | | | | | | | | | | | |
| Euro Bund | | | 19 | | | | September 2019 | | | $ | 3,651,475 | | | $ | 3,732,031 | | | $ | 80,556 | |
| United States Treasury Ultra Bond | | | 13 | | | | September 2019 | | | | 2,184,335 | | | | 2,308,312 | | | | 123,977 | |
| | | | | | | | | | | | | | | | | | | | |
| Total Long Contracts | | | | | | | | | | | | | | | | | | | 204,533 | |
| | | | | | | | | | | | | | | | | | | | |
Short Contracts | | | | | | | | | | | | | |
| 2-Year United States Treasury Note | | | (106 | ) | | | September 2019 | | | | (22,625,801 | ) | | | (22,809,047 | ) | | | (183,246 | ) |
| 5-Year United States Treasury Note | | | (578 | ) | | | September 2019 | | | | (67,092,535 | ) | | | (68,294,313 | ) | | | (1,201,778 | ) |
| 10-Year United States Treasury Note | | | (525 | ) | | | September 2019 | | | | (65,312,101 | ) | | | (67,183,594 | ) | | | (1,871,493 | ) |
| 10-Year United States Treasury Ultra Note | | | (526 | ) | | | September 2019 | | | | (70,302,561 | ) | | | (72,653,750 | ) | | | (2,351,189 | ) |
| Euro-BTP | | | (24 | ) | | | September 2019 | | | | (3,502,412 | ) | | | (3,665,101 | ) | | | (162,689 | ) |
| United States Treasury Long Bond | | | (5 | ) | | | September 2019 | | | | (742,617 | ) | | | (777,969 | ) | | | (35,352 | ) |
| | | | | | | | | | | | | | | | | | | | |
| Total Short Contracts | | | | | | | | | | | | | | | | | | | (5,805,747 | ) |
| | | | | | | | | | | | | | | | | | | | |
| Net Unrealized Depreciation | | | | | | | | | | | | | | | | | | $ | (5,601,214 | ) |
| | | | | | | | | | | | | | | | | | | | |
| 1. | As of June 30, 2019, cash in the amount of $1,918,170 was on deposit with a broker or futures commission merchant for futures transactions. |
| 2. | Represents the difference between the value of the contracts at the time they were opened and the value as of June 30, 2019. |
Swap Contracts
As of June 30, 2019, the Portfolio held the following centrally cleared interest rate swap agreements1:
| | | | | | | | | | | | | | | | | | | | | | | | | | | | |
Notional
Amount | | Currency | | | Expiration
Date | | | Payments
made by
Portfolio | | | Payments
Received by
Portfolio | | Payment
Frequency
Paid/Received | | Upfront
Premiums
Received/
(Paid) | | | Value | | | Unrealized
Appreciation /
(Depreciation) | |
| | | | | | | | |
$100,000,000 | | | USD | | | | 8/8/2019 | | | | Fixed 1.621% | | | 3-Month USD-LIBOR | | Semi-Annually/Quarterly | | $ | 1,218 | | | $ | 111,845 | | | $ | 113,063 | |
330,000,000 | | | USD | | | | 11/9/2019 | | | | Fixed 1.83% | | | 3-Month USD-LIBOR | | Semi-Annually/Quarterly | | | (5,570 | ) | | | 628,994 | | | | 623,424 | |
50,000,000 | | | USD | | | | 3/16/2023 | | | | Fixed 2.793% | | | 3-Month USD-LIBOR | | Semi-Annually/Quarterly | | | — | | | | (1,904,542 | ) | | | (1,904,542 | ) |
50,000,000 | | | USD | | | | 3/29/2023 | | | | Fixed 2.762% | | | 3-Month USD-LIBOR | | Semi-Annually/Quarterly | | | — | | | | (1,875,171 | ) | | | (1,875,171 | ) |
| | | | | | | | | | | | | | | | | | | $ | (4,352 | ) | | $ | (3,038,874 | ) | | $ | (3,043,226 | ) |
| 1. | As of June 30, 2019, cash in the amount of $1,249,705 was on deposit with a broker for centrally cleared swap agreements. |
The following abbreviations are used in the preceding pages:
BTP—Buoni del Tesoro Poliennali (Eurex Exchange index)
EUR—Euro
GBP—British Pound Sterling
LIBOR—London Interbank Offered Rate
REMIC—Real Estate Mortgage Investment Conduit
USD—United States Dollar
| | | | |
| 22 | | MainStay VP MacKay Unconstrained Bond Portfolio | | The notes to the financial statements are an integral part of,
and should be read in conjunction with, the financial statements. |
The following is a summary of the fair valuations according to the inputs used as of June 30, 2019, for valuing the Portfolio’s assets and liabilities:
| | | | | | | | | | | | | | | | |
Description | | Quoted
Prices in
Active
Markets for
Identical
Assets
(Level 1) | | | Significant
Other
Observable
Inputs
(Level 2) | | | Significant
Unobservable
Inputs
(Level 3) | | | Total | |
| | | | |
Asset Valuation Inputs | | | | | | | | | | | | | | | | |
| Investments in Securities (a) | | | | | | | | | | | | | | | | |
| Long-Term Bonds | | | | | | | | | | | | | | | | |
Asset-Backed Securities | | $ | — | | | $ | 44,916,986 | | | $ | — | | | $ | 44,916,986 | |
Convertible Bonds | | | — | | | | 5,458 | | | | — | | | | 5,458 | |
Corporate Bonds | | | — | | | | 799,304,577 | | | | — | | | | 799,304,577 | |
Loan Assignments | | | — | | | | 97,686,608 | | | | — | | | | 97,686,608 | |
Mortgage-Backed Securities | | | — | | | | 64,807,033 | | | | — | | | | 64,807,033 | |
U.S. Government & Federal Agencies | | | — | | | | 102,407,916 | | | | — | | | | 102,407,916 | |
| | | | | | | | | | | | | | | | |
| TotalLong-Term Bonds | | | — | | | | 1,109,128,578 | | | | — | | | | 1,109,128,578 | |
| | | | | | | | | | | | | | | | |
| Common Stocks | | | 192,242 | | | | — | | | | — | | | | 192,242 | |
| Short-Term Investments | | | | | | | | | | | | | | | | |
Affiliated Investment Company | | | 13,654,411 | | | | — | | | | — | | | | 13,654,411 | |
U.S. Governments | | | — | | | | 13,522,868 | | | | — | | | | 13,522,868 | |
Unaffiliated Investment Company | | | 1,400,338 | | | | — | | | | — | | | | 1,400,338 | |
| | | | | | | | | | | | | | | | |
| TotalShort-Term Investments | | | 15,054,749 | | | | 13,522,868 | | | | — | | | | 28,577,617 | |
| | | | | | | | | | | | | | | | |
| Total Investments in Securities | | | 15,246,991 | | | | 1,122,651,446 | | | | — | | | | 1,137,898,437 | |
| | | | | | | | | | | | | | | | |
| Other Financial Instruments | | | | | | | | | | | | | | | | |
Foreign Currency Forward Contracts (b) | | | — | | | | 15,219 | | | | — | | | | 15,219 | |
Futures Contracts (b) | | | 204,533 | | | | — | | | | — | | | | 204,533 | |
Interest Rate Swap Contracts (b) | | | — | | | | 736,487 | | | | — | | | | 736,487 | |
| | | | | | | | | | | | | | | | |
| Total Other Financial Instruments | | | 204,533 | | | | 751,706 | | | | — | | | | 956,239 | |
| | | | | | | | | | | | | | | | |
| Total Investments in Securities and Other Financial Instruments | | $ | 15,451,524 | | | $ | 1,123,403,152 | | | $ | — | | | $ | 1,138,854,676 | |
| | | | | | | | | | | | | | | | |
| | | | |
Liability Valuation Inputs | | | | | | | | | | | | | | | | |
| Long-Term Bonds Sold Short | | | | | | | | | | | | | | | | |
Corporate Bonds Sold Short | | $ | — | | | $ | (19,754,376 | ) | | $ | — | | | $ | (19,754,376 | ) |
| | | | | | | | | | | | | | | | |
| TotalLong-Term Bonds Sold Short | | | — | | | | (19,754,376 | ) | | | — | | | | (19,754,376 | ) |
| | | | | | | | | | | | | | | | |
| Other Financial Instruments | | | | | | | | | | | | | | | | |
Foreign Currency Forward Contracts (b) | | | — | | | | (38,761 | ) | | | — | | | | (38,761 | ) |
Futures Contracts (b) | | | (5,805,747 | ) | | | — | | | | — | | | | (5,805,747 | ) |
Interest Rate Swap Contracts (b) | | | — | | | | (3,779,713 | ) | | | — | | | | (3,779,713 | ) |
| | | | | | | | | | | | | | | | |
| Total Other Financial Instruments | | | (5,805,747 | ) | | | (3,818,474 | ) | | | — | | | | (9,624,221 | ) |
| | | | | | | | | | | | | | | | |
| Total Investments in Securities Sold Short and Other Financial Instruments | | $ | (5,805,747 | ) | | $ | (23,572,850 | ) | | $ | — | | | $ | (29,378,597 | ) |
| | | | | | | | | | | | | | | | |
| (a) | For a complete listing of investments and their industries, see the Portfolio of Investments. |
| (b) | The value listed for these securities reflects unrealized appreciation (depreciation) as shown on the Portfolio of Investments. |
| | | | | | |
The notes to the financial statements are an integral part of,
and should be read in conjunction with, the financial statements. | | | | | 23 | |
Portfolio of InvestmentsJune 30, 2019 (Unaudited) (continued)
The following is a reconciliation of investments in which significant unobservable inputs (Level 3) were used in determining value:
| | | | | | | | | | | | | | | | | | | | | | | | | | | | | | | | | | | | | | | | |
Investments in Securities | | Balance
as of
December 31,
2018 | | | Accrued
Discounts
(Premiums) | | | Realized
Gain
(Loss) | | | Change in
Unrealized
Appreciation
(Depreciation) | | | Purchases | | | Sales (a) | | | Transfers
into
Level 3 | | | Transfers
out of
Level 3 | | | Balance
as of
June 30,
2019 | | | Change in
Unrealized
Appreciation
(Depreciation)
from
Investments
Still Held at
June 30,
2019 | |
| Long-Term Bonds | | | | | | | | | | | | | | | | | | | | | | | | | | | | | | | | | | | | | | | | |
Loan Assignments Advertising | | $ | 2,937,500 | | | $ | 687 | | | $ | (178,093 | ) | | $ | 169,593 | | | $ | — | | | $ | (2,929,687 | ) | | $ | — | | | $ | — | | | $ | — | | | $ | — | |
| | | | | | | | | | | | | | | | | | | | | | | | | | | | | | | | | | | | | | | | |
| Total | | $ | 2,937,500 | | | $ | 687 | | | $ | (178,093 | ) | | $ | 169,593 | | | $ | — | | | $ | (2,929,687 | ) | | $ | — | | | $ | — | | | $ | — | | | $ | — | |
| | | | | | | | | | | | | | | | | | | | | | | | | | | | | | | | | | | | | | | | |
| (a) | Sales include principal reductions. |
| | | | |
| 24 | | MainStay VP MacKay Unconstrained Bond Portfolio | | The notes to the financial statements are an integral part of,
and should be read in conjunction with, the financial statements. |
Statement of Assets and Liabilitiesas of June 30, 2019 (Unaudited)
| | | | |
| Assets | | | | |
Investment in unaffiliated securities before investments sold short, at value (identified cost $1,106,196,400) including securities on loan of $1,371,351 | | $ | 1,124,244,026 | |
Investment in affiliated investment company, at value (identified cost $13,654,411) | | | 13,654,411 | |
Cash collateral on deposit at broker for futures contracts | | | 1,918,170 | |
Cash collateral on deposit at broker for swap contracts | | | 1,249,705 | |
Cash denominated in foreign currencies (identified cost $215,622) | | | 216,402 | |
Receivables: | | | | |
Dividends and interest | | | 9,119,846 | |
Investment securities sold | | | 2,427,229 | |
Portfolio shares sold | | | 861,320 | |
Securities lending | | | 1,069 | |
Unrealized appreciation on foreign currency forward contracts | | | 15,219 | |
Other assets | | | 5,598 | |
| | | | |
Total assets | | | 1,153,712,995 | |
| | | | |
| |
| Liabilities | | | | |
Investments sold short (proceeds $19,310,069) | | | 19,754,376 | |
Due to custodian | | | 262,196 | |
Cash collateral received for securities on loan | | | 1,400,338 | |
Payables: | | | | |
Investment securities purchased | | | 27,098,097 | |
Manager (See Note 3) | | | 516,621 | |
Variation margin on centrally cleared swap contracts | | | 313,255 | |
NYLIFE Distributors (See Note 3) | | | 206,511 | |
Interest on investments sold short | | | 176,698 | |
Broker fees and charges on short sales | | | 78,144 | |
Shareholder communication | | | 65,575 | |
Professional fees | | | 45,725 | |
Variation margin on futures contracts | | | 36,237 | |
Portfolio shares redeemed | | | 25,710 | |
Custodian | | | 18,037 | |
Trustees | | | 1,644 | |
Accrued expenses | | | 9,031 | |
Unrealized depreciation on foreign currency forward contracts | | | 38,761 | |
| | | | |
Total liabilities | | | 50,046,956 | |
| | | | |
Net assets | | $ | 1,103,666,039 | |
| | | | |
| |
| Composition of Net Assets | | | | |
Shares of beneficial interest outstanding (par value of $.001 per share) unlimited number of shares authorized | | $ | 112,450 | |
Additional paid-in capital | | | 1,142,667,870 | |
| | | | |
| | | 1,142,780,320 | |
Total distributable earnings (loss) | | | (39,114,281 | ) |
| | | | |
Net assets | | $ | 1,103,666,039 | |
| | | | |
| | | | |
Initial Class | | | | |
Net assets applicable to outstanding shares | | $ | 96,211,225 | |
| | | | |
Shares of beneficial interest outstanding | | | 9,774,967 | |
| | | | |
Net asset value per share outstanding | | $ | 9.84 | |
| | | | |
Service Class | | | | |
Net assets applicable to outstanding shares | | $ | 1,007,454,814 | |
| | | | |
Shares of beneficial interest outstanding | | | 102,674,983 | |
| | | | |
Net asset value per share outstanding | | $ | 9.81 | |
| | | | |
| | | | | | |
The notes to the financial statements are an integral part of,
and should be read in conjunction with, the financial statements. | | | | | 25 | |
Statement of Operationsfor the six months ended June 30, 2019 (Unaudited)
| | | | |
| Investment Income (Loss) | | | | |
Income | | | | |
Interest | | $ | 21,141,286 | |
Dividends-affiliated | | | 232,192 | |
Securities lending | | | 9,563 | |
| | | | |
Total income | | | 21,383,041 | |
| | | | |
Expenses | | | | |
Manager (See Note 3) | | | 3,132,736 | |
Distribution/Service—Service Class (See Note 3) | | | 1,244,325 | |
Interest on investments sold short | | | 537,195 | |
Broker fees and charges on short sales | | | 259,199 | |
Shareholder communication | | | 73,602 | |
Professional fees | | | 65,700 | |
Interest expense | | | 24,484 | |
Custodian | | | 21,706 | |
Trustees | | | 14,131 | |
Miscellaneous | | | 22,739 | |
| | | | |
Total expenses | | | 5,395,817 | |
| | | | |
Net investment income (loss) | | | 15,987,224 | |
| | | | |
|
| Realized and Unrealized Gain (Loss) on Investments, Futures Contracts, Swap Contracts and Foreign Currency Transactions | |
Net realized gain (loss) on: | | | | |
Unaffiliated investment transactions | | | (1,699,507 | ) |
Investments sold short | | | (626,247 | ) |
Futures transactions | | | (11,913,791 | ) |
Swap transactions | | | 1,797,522 | |
Foreign currency forward transactions | | | 103,791 | |
Foreign currency transactions | | | (19,250 | ) |
| | | | |
Net realized gain (loss) on investments, investments sold short, futures transactions, swap transactions and foreign currency transactions | | | (12,357,482 | ) |
| | | | |
Net change in unrealized appreciation (depreciation) on: | | | | |
Unaffiliated investments | | | 51,445,600 | |
Investments sold short | | | (815,544 | ) |
Futures contracts | | | 805,731 | |
Swap contracts | | | (5,450,685 | ) |
Foreign currency forward contracts | | | (19,326 | ) |
Translation of other assets and liabilities in foreign currencies | | | 3,916 | |
| | | | |
Net change in unrealized appreciation (depreciation) on investments, investments sold short, futures contracts, swap contracts and foreign currency transactions | | | 45,969,692 | |
| | | | |
Net realized and unrealized gain (loss) on investments, investments sold short, futures transactions, swap transactions and foreign currency transactions | | | 33,612,210 | |
| | | | |
Net increase (decrease) in net assets resulting from operations | | $ | 49,599,434 | |
| | | | |
| | | | |
| 26 | | MainStay VP MacKay Unconstrained Bond Portfolio | | The notes to the financial statements are an integral part of,
and should be read in conjunction with, the financial statements. |
Statements of Changes in Net Assets
for the six months ended June 30, 2019 (Unaudited) and the year ended December 31, 2018
| | | | | | | | |
| | | 2019 | | | 2018 | |
| Increase (Decrease) in Net Assets | |
Operations: | | | | | | | | |
Net investment income (loss) | | $ | 15,987,224 | | | $ | 34,155,942 | |
Net realized gain (loss) on investments, investments sold short, futures contracts, swap contracts and foreign currency transactions | | | (12,357,482 | ) | | | 6,106,337 | |
Net change in unrealized appreciation (depreciation) on investments, investments sold short, futures contracts, swap contracts and foreign currency transactions | | | 45,969,692 | | | | (56,748,864 | ) |
| | | | |
Net increase (decrease) in net assets resulting from operations | | | 49,599,434 | | | | (16,486,585 | ) |
| | | | |
Distributions to shareholders: | | | | | | | | |
Initial Class | | | (2,192,533 | ) | | | (4,472,392 | ) |
Service Class | | | (19,920,462 | ) | | | (33,201,095 | ) |
| | | | |
Total distributions to shareholders | | | (22,112,995 | ) | | | (37,673,487 | ) |
| | | | |
Capital share transactions: | | | | | | | | |
Net proceeds from sale of shares | | | 22,564,219 | | | | 141,396,906 | |
Net asset value of shares issued to shareholders in reinvestment of dividends and distributions | | | 22,112,995 | | | | 37,673,487 | |
Cost of shares redeemed | | | (84,497,899 | ) | | | (210,799,083 | ) |
| | | | |
Increase (decrease) in net assets derived from capital share transactions | | | (39,820,685 | ) | | | (31,728,690 | ) |
| | | | |
Net increase (decrease) in net assets | | | (12,334,246 | ) | | | (85,888,762 | ) |
| | |
| Net Assets | | | | | | | | |
Beginning of period | | | 1,116,000,285 | | | | 1,201,889,047 | |
| | | | |
End of period | | $ | 1,103,666,039 | | | $ | 1,116,000,285 | |
| | | | |
| | | | | | |
The notes to the financial statements are an integral part of,
and should be read in conjunction with, the financial statements. | | | | | 27 | |
Financial Highlightsselected per share data and ratios
| | | | | | | | | | | | | | | | | | | | | | | | |
| | |
| | | Six months
ended
June 30, | | | Year ended December 31, | |
| | | | | | |
| Initial Class | | 2019* | | | 2018 | | | 2017 | | | 2016 | | | 2015 | | | 2014 | |
| | | | | | |
Net asset value at beginning of period | | $ | 9.60 | | | $ | 10.06 | | | $ | 9.90 | | | $ | 9.54 | | | $ | 10.12 | | | $ | 10.32 | |
| | | | | | | | | | | | | | | | | | | | | | | | |
| | | | | | |
Net investment income (loss) (a) | | | 0.15 | | | | 0.30 | | | | 0.29 | | | | 0.37 | | | | 0.40 | | | | 0.45 | |
| | | | | | |
Net realized and unrealized gain (loss) on investments | | | 0.30 | | | | (0.43 | ) | | | 0.18 | | | | 0.33 | | | | (0.66 | ) | | | (0.28 | ) |
| | | | | | |
Net realized and unrealized gain (loss) on foreign currency transactions | | | 0.00 | ‡ | | | 0.00 | ‡ | | | 0.00 | ‡ | | | 0.01 | | | | 0.02 | | | | 0.03 | |
| | | | | | | | | | | | | | | | | | | | | | | | |
| | | | | | |
Total from investment operations | | | 0.45 | | | | (0.13 | ) | | | 0.47 | | | | 0.71 | | | | (0.24 | ) | | | 0.20 | |
| | | | | | | | | | | | | | | | | | | | | | | | |
| | | | | | |
| Less dividends: | | | | | | | | | | | | | | | | | | | | | | | | |
| | | | | | |
From net investment income | | | (0.21 | ) | | | (0.33 | ) | | | (0.31 | ) | | | (0.35 | ) | | | (0.34 | ) | | | (0.40 | ) |
| | | | | | | | | | | | | | | | | | | | | | | | |
| | | | | | |
Net asset value at end of period | | $ | 9.84 | | | $ | 9.60 | | | $ | 10.06 | | | $ | 9.90 | | | $ | 9.54 | | | $ | 10.12 | |
| | | | | | | | | | | | | | | | | | | | | | | | |
| | | | | | |
Total investment return (b) | | | 4.68 | % | | | (1.21 | %) | | | 4.81 | % | | | 7.50 | % | | | (2.42 | %) | | | 1.92 | % |
| | | | | | |
| Ratios (to average net assets)/Supplemental Data: | | | | | | | | | | | | | | | | | | | | | | | | |
| | | | | | |
Net investment income (loss) | | | 3.12 | %†† | | | 3.04 | % | | | 2.89 | % | | | 3.80 | % | | | 4.01 | % | | | 4.31 | % |
| | | | | | |
Net expenses (c)(d) | | | 0.75 | %†† | | | 0.75 | % | | | 0.67 | % | | | 0.72 | % | | | 0.65 | % | | | 0.64 | % |
| | | | | | |
Portfolio turnover rate | | | 25 | % | | | 33 | % | | | 32 | % | | | 34 | % | | | 26 | % | | | 18 | % |
| | | | | | |
Net assets at end of period (in 000’s) | | $ | 96,211 | | | $ | 116,901 | | | $ | 137,454 | | | $ | 122,586 | | | $ | 129,311 | | | $ | 166,855 | |
| ‡ | Less than one cent per share. |
| (a) | Per share data based on average shares outstanding during the period. |
| (b) | Total return does not reflect any deduction of sales charges, mortality and expense charges, contract charges or administrative charges. For periods of less than one year, total return is not annualized. |
| (c) | In addition to the fees and expenses which the Portfolio bears directly, it also indirectly bears a pro-rata share of the fees and expenses of the underlying funds in which it invests. Such indirect expenses are not included in the above expense ratios. |
| (d) | The expense ratios presented below exclude short sales expense: |
| | | | | | | | | | |
Period Ended | | Net Expenses
(excluding short
sale expenses) | | Short Sale
Expenses |
| June 30, 2019*†† | | | | 0.61 | % | | | | 0.14 | % |
| December 31, 2018 | | | | 0.60 | % | | | | 0.15 | % |
| December 31, 2017 | | | | 0.60 | % | | | | 0.07 | % |
| December 31, 2016 | | | | 0.62 | % | | | | 0.10 | % |
| December 31, 2015 | | | | 0.62 | % | | | | 0.03 | % |
| December 31, 2014 | | | | 0.64 | % | | | | — | |
| | | | |
| 28 | | MainStay VP MacKay Unconstrained Bond Portfolio | | The notes to the financial statements are an integral part of,
and should be read in conjunction with, the financial statements. |
Financial Highlightsselected per share data and ratios
| | | | | | | | | | | | | | | | | | | | | | | | |
| | |
| | | Six months
ended
June 30, | | | Year ended December 31, | |
| | | | | | |
| Service Class | | 2019* | | | 2018 | | | 2017 | | | 2016 | | | 2015 | | | 2014 | |
| | | | | | |
Net asset value at beginning of period | | $ | 9.57 | | | $ | 10.03 | | | $ | 9.87 | | | $ | 9.51 | | | $ | 10.09 | | | $ | 10.29 | |
| | | | | | | | | | | | | | | | | | | | | | | | |
| | | | | | |
Net investment income (loss) (a) | | | 0.14 | | | | 0.28 | | | | 0.26 | | | | 0.34 | | | | 0.38 | | | | 0.42 | |
| | | | | | |
Net realized and unrealized gain (loss) on investments | | | 0.30 | | | | (0.43 | ) | | | 0.19 | | | | 0.33 | | | | (0.66 | ) | | | (0.28 | ) |
| | | | | | |
Net realized and unrealized gain (loss) on foreign currency transactions | | | 0.00 | ‡ | | | 0.00 | ‡ | | | 0.00 | ‡ | | | 0.01 | | | | 0.02 | | | | 0.03 | |
| | | | | | | | | | | | | | | | | | | | | | | | |
| | | | | | |
Total from investment operations | | | 0.44 | | | | (0.15 | ) | | | 0.45 | | | | 0.68 | | | | (0.26 | ) | | | 0.17 | |
| | | | | | | | | | | | | | | | | | | | | | | | |
| | | | | | |
| Less dividends: | | | | | | | | | | | | | | | | | | | | | | | | |
| | | | | | |
From net investment income | | | (0.20 | ) | | | (0.31 | ) | | | (0.29 | ) | | | (0.32 | ) | | | (0.32 | ) | | | (0.37 | ) |
| | | | | | | | | | | | | | | | | | | | | | | | |
| | | | | | |
Net asset value at end of period | | $ | 9.81 | | | $ | 9.57 | | | $ | 10.03 | | | $ | 9.87 | | | $ | 9.51 | | | $ | 10.09 | |
| | | | | | | | | | | | | | | | | | | | | | | | |
| | | | | | |
Total investment return (b) | | | 4.55 | % | | | (1.46 | %) | | | 4.55 | % | | | 7.23 | % | | | (2.66 | %) | | | 1.67 | % |
| | | | | | |
| Ratios (to average net assets)/Supplemental Data: | | | | | | | | | | | | | | | | | | | | | | | | |
| | | | | | |
Net investment income (loss) | | | 2.87 | %†† | | | 2.79 | % | | | 2.64 | % | | | 3.54 | % | | | 3.77 | % | | | 4.06 | % |
| | | | | | |
Net expenses (c)(d) | | | 1.00 | %†† | | | 1.00 | % | | | 0.92 | % | | | 0.97 | % | | | 0.90 | % | | | 0.89 | % |
| | | | | | |
Portfolio turnover rate | | | 25 | % | | | 33 | % | | | 32 | % | | | 34 | % | | | 26 | % | | | 18 | % |
| | | | | | |
Net assets at end of period (in 000’s) | | $ | 1,007,455 | | | $ | 999,100 | | | $ | 1,064,435 | | | $ | 882,928 | | | $ | 748,317 | | | $ | 571,281 | |
| ‡ | Less than one cent per share. |
| (a) | Per share data based on average shares outstanding during the period. |
| (b) | Total return does not reflect any deduction of sales charges, mortality and expense charges, contract charges or administrative charges. For periods of less than one year, total return is not annualized. |
| (c) | In addition to the fees and expenses which the Portfolio bears directly, it also indirectly bears a pro-rata share of the fees and expenses of the underlying funds in which it invests. Such indirect expenses are not included in the above expense ratios. |
| (d) | The expense ratios presented below exclude short sales expense: |
| | | | | | | | | | |
Period Ended | | Net Expenses
(excluding short
sale expenses) | | Short Sale
Expenses |
| June 30, 2019*†† | | | | 0.86 | % | | | | 0.14 | % |
| December 31, 2018 | | | | 0.85 | % | | | | 0.15 | % |
| December 31, 2017 | | | | 0.85 | % | | | | 0.07 | % |
| December 31, 2016 | | | | 0.87 | % | | | | 0.10 | % |
| December 31, 2015 | | | | 0.87 | % | | | | 0.03 | % |
| December 31, 2014 | | | | 0.89 | % | | | | — | |
| | | | | | |
The notes to the financial statements are an integral part of,
and should be read in conjunction with, the financial statements. | | | | | 29 | |
Notes to Financial Statements(Unaudited)
Note 1–Organization and Business
MainStay VP Funds Trust (the “Fund”) was organized as a Delaware statutory trust on February 1, 2011. The Fund is registered under the Investment Company Act of 1940, as amended (the “1940 Act”), as anopen-end management investment company. The Fund is comprised ofthirty-one separate series (collectively referred to as the “Portfolios”). These financial statements and notes relate to the MainStay VP MacKay Unconstrained Bond Portfolio (the “Portfolio”), a “diversified” portfolio, as that term is defined in the 1940 Act, as interpreted or modified by regulatory authorities having jurisdiction, from time to time.
Shares of the Portfolio are currently offered to New York Life Insurance and Annuity Corporation (“NYLIAC”), a wholly-owned subsidiary of New York Life Insurance Company (“New York Life”) and may also be offered to fund variable annuity policies and variable universal life insurance policies issued by other insurance companies. NYLIAC allocates shares of the Portfolios to, among others, certain NYLIAC separate accounts. Shares of the Portfolio are also offered to the MainStay VP Conservative Allocation Portfolio, MainStay VP Moderate Allocation Portfolio, MainStay VP Moderate Growth Allocation Portfolio and MainStay VP Growth Allocation Portfolio, which operate as“funds-of-funds.”
The Portfolio currently offers two classes of shares. Initial Class and Service Class shares commenced operations on April 29, 2011. Shares of the Portfolio are offered and are redeemed at a price equal to their respective net asset value (“NAV”) per share. No sales or redemption charge is applicable to the purchase or redemption of the Portfolio’s shares. Under the terms of the Fund’s multiple class plan, adopted pursuant to Rule18f-3 under the 1940 Act, the classes differ in that, among other things, Service Class shares of the Portfolio pay a combined distribution and service fee of 0.25% of average daily net assets attributable to Service Class shares of the Portfolio to the Distributor (as defined in Note 3(B)) pursuant to a plan adopted in accordance with Rule12b-1 under the 1940 Act. Contract owners of variable annuity contracts purchased after June 2, 2003, are permitted to invest only in the Service Class shares.
The Portfolio’s investment objective is to seek total return by investing primarily in domestic and foreign debt securities.
Note 2–Significant Accounting Policies
The Portfolio is an investment company and accordingly follows the investment company accounting and reporting guidance of the Financial Accounting Standards Board (“FASB”) Accounting Standard CodificationTopic 946 Financial Services—Investment Companies. The Portfolio prepares its financial statements in accordance with generally accepted accounting principles (“GAAP”) in the United States of America and follows the significant accounting policies described below.
(A) Securities Valuation. Investments are usually valued as of the close of regular trading on the New York Stock Exchange (the “Exchange”) (usually 4:00 p.m. Eastern time) on each day the Portfolio is open for business (“valuation date”).
The Board of Trustees of the Fund (the “Board”) adopted procedures establishing methodologies for the valuation of the Portfolio’s securities and other assets and delegated the responsibility for valuation determinations under those procedures to the Valuation Committee of the Fund
(the “Valuation Committee”). The Board authorized the Valuation Committee to appoint a Valuation Subcommittee (the “Subcommittee”) to deal in the first instance with establishing the prices of securities for which market quotations are not readily available or the prices of which are not otherwise readily determinable under these procedures. The Subcommittee meets (in person, via electronic mail or via teleconference) on anas-needed basis. Subsequently, the Valuation Committee meets to ensure that actions taken by the Subcommittee were appropriate. The procedures state that, subject to the oversight of the Board and unless otherwise noted, the responsibility for theday-to-day valuation of portfolio assets (including fair value measurements for the Portfolio’s assets and liabilities) rests with New York Life Investment Management LLC (“New York Life Investments” or the “Manager”), aided to whatever extent necessary by the Subadvisor (as defined in Note 3(A)).
To assess the appropriateness of security valuations, the Manager, the Subadvisor or the Portfolio’s third-party service provider, who is subject to oversight by the Manager, regularly compares prior day prices, prices on comparable securities and the sale prices to the prior and current day prices and challenges prices with changes exceeding certain tolerance levels with third-party pricing services or broker sources. For those securities valued through either a standardized fair valuation methodology or a fair valuation measurement, the Subcommittee deals in the first instance with such valuation and the Valuation Committee reviews and affirms, if appropriate, the reasonableness of the valuation based on such methodologies and measurements on a regular basis after considering information that is reasonably available and deemed relevant by the Valuation Committee. Any action taken by the Subcommittee with respect to the valuation of a portfolio security or other asset is submitted for review and ratification (if appropriate) to the Valuation Committee and the Board at the next regularly scheduled meeting.
“Fair value” is defined as the price the Portfolio would reasonably expect to receive upon selling an asset or liability in an orderly transaction to an independent buyer in the principal or most advantageous market for the asset or liability. Fair value measurements are determined within a framework that establishes a three-tier hierarchy which maximizes the use of observable market data and minimizes the use of unobservable inputs to establish a classification of fair value measurements for disclosure purposes. “Inputs” refer broadly to the assumptions that market participants would use in pricing the asset or liability, including assumptions about risk, such as the risk inherent in a particular valuation technique used to measure fair value using a pricing model and/or the risk inherent in the inputs for the valuation technique. Inputs may be observable or unobservable. Observable inputs reflect the assumptions market participants would use in pricing the asset or liability based on market data obtained from sources independent of the Portfolio. Unobservable inputs reflect the Portfolio’s own assumptions about the assumptions market participants would use in pricing the asset or liability based on the information available. The inputs or methodology used for valuing assets or liabilities may not be an indication of the risks associated with investing in those assets or liabilities. The three-tier hierarchy of inputs is summarized below.
| • | | Level 1—quoted prices in active markets for an identical asset or liability |
| | |
| 30 | | MainStay VP MacKay Unconstrained Bond Portfolio |
| • | | Level 2—other significant observable inputs (including quoted prices for a similar asset or liability in active markets, interest rates and yield curves, prepayment speeds, credit risk, etc.) |
| • | | Level 3—significant unobservable inputs (including the Portfolio’s own assumptions about the assumptions that market participants would use in measuring fair value of an asset or liability) |
The level of an asset or liability within the fair value hierarchy is based on the lowest level of an input, both individually and in the aggregate, that is significant to the fair value measurement. As of June 30, 2019, the aggregate value by input level of the Portfolio’s assets and liabilities is included at the end of the Portfolio’s Portfolio of Investments.
The Portfolio may use third-party vendor evaluations, whose prices may be derived from one or more of the following standard inputs, among others:
| | |
• Benchmark yields | | • Reported trades |
• Broker/dealer quotes | | • Issuer spreads |
• Two-sided markets | | • Benchmark securities |
• Bids/offers | | • Reference data (corporate actions or material event notices) |
• Industry and economic events | | • Comparable bonds |
• Monthly payment information | | |
An asset or liability for which market values cannot be measured using the methodologies described above is valued by methods deemed reasonable in good faith by the Valuation Committee, following the procedures established by theBoard, to represent fair value. Under these procedures, the Portfolio generally uses a market-based approach which may use related or comparable assets or liabilities, recent transactions, market multiples, book values and other relevant information. The Portfolio may also use an income-based valuation approach in which the anticipated future cash flows of the asset or liability are discounted to calculate fair value. Discounts may also be applied due to the nature and/or duration of any restrictions on the disposition of the asset or liability. Fair value represents a good faith approximation of the value of a security. Fair value determinations involve the consideration of a number of subjective factors, an analysis of applicable facts and circumstances and the exercise of judgment. As a result, it is possible that the fair value for a security determined in good faith in accordance with the Portfolio’s valuation procedures may differ from valuations for the same security determined by other funds using their own valuation procedures. Although the Portfolio’s valuation procedures are designed to value a security at the price the Portfolio may reasonably expect to receive upon the security’s sale in an orderly transaction, there can be no assurance that any fair value determination thereunder would, in fact, approximate the amount that the Portfolio would actually realize upon the sale of the security or the price at which the security would trade if a reliable market price were readily available. During thesix-month period ended June 30, 2019, there were no material changes to the fair value methodologies.
Securities which may be valued in this manner include, but are not limited to: (i) a security for which trading has been halted or suspended; (ii) a debt security that has recently gone into default and for which there is not a current market quotation; (iii) a security of an issuer that
has entered into a restructuring; (iv) a security that has been delisted from a national exchange; (v) a security for which the market price is not readily available from a third-party pricing source or, if so provided, does not, in the opinion of the Manager or the Subadvisor, reflect the security’s market value; (vi) a security subject to trading collars for which no or limited trading takes place; and (vii) a security whose principal market has been temporarily closed at a time when, under normal conditions, it would be open. Securities valued in this manner are generally categorized as Level 3 in the hierarchy. As of June 30, 2019, there were no securities held by the Portfolio that were fair valued in such a manner.
Certain securities held by the Portfolio may principally trade in foreign markets. Events may occur between the time the foreign markets close and the time at which the Portfolio’s NAVs are calculated. These events may include, but are not limited to, situations relating to a single issuer in a market sector, significant fluctuations in U.S. or foreign markets, natural disasters, armed conflicts, governmental actions or other developments not tied directly to the securities markets. Should the Manager or the Subadvisor conclude that such events may have affected the accuracy of the last price of such securities reported on the local foreign market, the Subcommittee may, pursuant to procedures adopted by the Board, adjust the value of the local price to reflect the estimated impact on the price of such securities as a result of such events. In this instance, securities are generally categorized as Level 3 in the hierarchy. Additionally, certain foreign equity securities are also fair valued whenever the movement of a particular index exceeds certain thresholds. In such cases, the securities are fair valued by applying factors provided by a third-party vendor in accordance with valuation procedures adopted by the Board and are generally categorized as Level 2 in the hierarchy. As of June 30, 2019, no foreign equity securities held by the Portfolio were fair valued in such a manner.
Equity securities are valued at the last quoted sales prices as of the close of regular trading on the relevant exchange on each valuation date. Securities that are not traded on the valuation date are valued at the mean of the last quoted bid and ask prices. Prices are normally taken from the principal market in which each security trades. Futures contracts are valued at the last posted settlement price on the market where such futures are primarily traded. These securities are generally categorized as Level 1 in the hierarchy.
Investments in mutual funds, including money market funds, are valued at their respective NAVs as of the close of the Exchange on the valuation date. These securities are generally categorized as Level 1 in the hierarchy.
Debt securities (other than convertible and municipal bonds) are valued at the evaluated bid prices (evaluated mean prices in the case of convertible and municipal bonds) supplied by a pricing agent or brokers selected by the Manager, in consultation with the Subadvisor. The evaluations are market-based measurements processed through a pricing application and represents the pricing agent’s good faith determination as to what a holder may receive in an orderly transaction under market conditions. The rules based logic utilizes valuation techniques that reflect participants’ assumptions and vary by asset class and per methodology, maximizing the use of relevant observable data including quoted prices for similar assets, benchmark yield curves and market corroborated inputs. The evaluated bid or mean prices are
Notes to Financial Statements(Unaudited) (continued)
deemed by the Manager, in consultation with the Subadvisor, to be representative of market values at the regular close of trading of the Exchange on each valuation date. Debt securities purchased on a delayed delivery basis are marked to market daily until settlement at the forward settlement date. Debt securities, including corporate bonds, U.S. government and federal agency bonds, municipal bonds, foreign bonds, convertible bonds, asset-backed securities and mortgage-backed securities are generally categorized as Level 2 in the hierarchy.
Loan assignments, participations and commitments are valued at the average of bid quotations obtained from the engaged independent pricing service and are generally categorized as Level 2 in the hierarchy. Certain loan assignments, participations and commitments may be valued by utilizing significant unobservable inputs obtained from the pricing service and are generally categorized as Level 3 in the hierarchy. As of June 30, 2019, there were no securities held by the Portfolio that were fair valued in such a manner.
Foreign currency forward contracts are valued at their fair market values measured on the basis of the mean between the last current bid and ask prices based on dealer or exchange quotations and are generally categorized as Level 2 in the hierarchy.
Swaps are marked to market daily based upon quotations from pricing agents, brokers or market makers. These securities are generally categorized as Level 2 in the hierarchy.
Temporary cash investments acquired in excess of 60 days to maturity at the time of purchase are valued using the latest bid prices or using valuations based on a matrix system (which considers such factors as security prices, yields, maturities and ratings), both as furnished by independent pricing services. Other temporary cash investments which mature in 60 days or less at the time of purchase (“Short-Term Investments”) are valued using the amortized cost method of valuation, unless the use of such method would be inappropriate. The amortized cost method involves valuing a security at its cost on the date of purchase and thereafter assuming a constant amortization to maturity of the difference between such cost and the value on maturity date. Amortized cost approximates the current fair value of a security. Securities valued using the amortized cost method are not valued using quoted prices in an active market and are generally categorized as Level 2 in the hierarchy.
The information above is not intended to reflect an exhaustive list of the methodologies that may be used to value portfolio investments. The valuation procedures permit the use of a variety of valuation methodologies in connection with valuing portfolio investments. The methodology used for a specific type of investment may vary based on the market data available or other considerations. The methodologies summarized above may not represent the specific means by which portfolio investments are valued on any particular business day.
(B) Income Taxes. The Portfolio’s policy is to comply with the requirements of the Internal Revenue Code of 1986, as amended (the “Internal Revenue Code”), applicable to regulated investment companies and to distribute all of its taxable income to the shareholders of the Portfolio within the allowable time limits. Therefore, no federal, state and local income tax provisions are required.
Management evaluates the Portfolio’s tax positions to determine if the tax positions taken meet the minimum recognition threshold in connection with accounting for uncertainties in income tax positions taken or expected to be taken for the purposes of measuring and recognizing tax liabilities in the financial statements. Recognition of tax benefits of an uncertain tax position is permitted only to the extent the position is “more likely than not” to be sustained assuming examination by taxing authorities. Management has analyzed the Portfolio’s tax positions taken on federal, state and local income tax returns for all open tax years (for up to three tax years) and has concluded that no provisions for federal, state and local income tax are required in the Portfolio’s financial statements. The Portfolio’s federal, state and local income tax and federal excise tax returns for tax years for which the applicable statutes of limitations have not expired are subject to examination by the Internal Revenue Service and state and local departments of revenue.
(C) Foreign Taxes. The Portfolio may be subject to foreign taxes on income and other transaction-based taxes imposed by certain countries in which it invests. A portion of the taxes on gains on investments or currency purchases/repatriation may be reclaimable. The Portfolio will accrue such taxes and reclaims as applicable, based upon its current interpretation of tax rules and regulations that exist in the markets in which it invests.
The Portfolio may be subject to taxation on realized capital gains, repatriation proceeds and other transaction-based taxes imposed by certain countries in which it invests. The Portfolio will accrue such taxes as applicable based upon its current interpretation of tax rules and regulations that exist in the market in which it invests. Capital gains taxes relating to positions still held are reflected as a liability on the Statement of Assets and Liabilities, as well as an adjustment to the Portfolio’s net unrealized appreciation (depreciation). Taxes related to capital gains realized, if any, are reflected as part of net realized gain (loss) in the Statement of Operations. Changes in tax liabilities related to capital gains taxes on unrealized investment gains, if any, are reflected as part of the change in net unrealized appreciation (depreciation) on investments in the Statement of Operations. Transaction-based charges are generally assessed as a percentage of the transaction amount.
(D) Dividends and Distributions to Shareholders. Dividends and distributions are recorded on theex-dividend date. The Portfolio intends to declare and pay dividends from net investment income, if any, at least quarterly and distributions from net realized capital and currency gains, if any, at least annually. Unless the shareholder elects otherwise, all dividends and distributions are reinvested in the same class of shares of the Portfolio, at NAV. Dividends and distributions to shareholders are determined in accordance with federal income tax regulations and may differ from determinations using GAAP.
(E) Security Transactions and Investment Income. The Portfolio records security transactions on the trade date. Realized gains and losses on security transactions are determined using the identified cost method. Dividend income is recognized on theex-dividend date; net of any foreign tax withheld at the source, and interest income is accrued as earned using the effective interest rate method and includes any realized gains and losses from repayments of principal on mortgage-backed securities. Discounts and premiums on securities purchased for the Portfolio are accreted and amortized, respectively, on
| | |
| 32 | | MainStay VP MacKay Unconstrained Bond Portfolio |
the effective interest rate method over the life of the respective securities.
Investment income and realized and unrealized gains and losses on investments of the Portfolio are allocated pro rata to the separate classes of shares based upon their relative net assets on the date the income is earned or realized and unrealized gains and losses are incurred.
The Portfolio may place a debt security onnon-accrual status and reduce related interest income by ceasing current accruals and writing off all or a portion of any interest receivables when the collection of all or a portion of such interest has become doubtful. A debt security is removed fromnon-accrual status when the issuer resumes interest payments or when collectability of interest is reasonably assured.
(F) Expenses. Expenses of the Fund are allocated to the individual Portfolios in proportion to the net assets of the respective Portfolios when the expenses are incurred, except where direct allocations of expenses can be made. Expenses (other than fees incurred under the distribution and service plans, further discussed in Note 3(B), which are charged directly to the Service Class shares) are allocated to separate classes of shares pro rata based upon their relative net assets on the date the expenses are incurred. The expenses borne by the Portfolio, including those of related parties to the Portfolio, are shown in the Statement of Operations.
Additionally, the Portfolio may invest in mutual funds, which are subject to management fees and other fees that may cause the costs of investing in mutual funds to be greater than the costs of owning the underlying securities directly. These indirect expenses of mutual funds are not included in the amounts shown as expenses in the Portfolio’s Statement of Operations or in the expense ratios included in the Financial Highlights.
(G) Use of Estimates. In preparing financial statements in conformity with GAAP, management makes estimates and assumptions that affect the reported amounts and disclosures in the financial statements. Actual results could differ from those estimates.
(H) Repurchase Agreements. The Portfolio may enter into repurchase agreements (i.e., buy a security from another party with the agreement that it be sold back in the future) to earn income. The Portfolio may enter into repurchase agreements only with counterparties, usually financial institutions, that are deemed by the Manager or the Subadvisor to be creditworthy, pursuant to guidelines established by the Board. During the term of any repurchase agreement, the Manager or the Subadvisor will continue to monitor the creditworthiness of the counterparty. Under the 1940 Act, repurchase agreements are considered to be collateralized loans by the Portfolio to the counterparty secured by the securities transferred to the Portfolio.
Repurchase agreements are subject to counterparty risk, meaning the Portfolio could lose money by the counterparty’s failure to perform under the terms of the agreement. The Portfolio mitigates this risk by ensuring the repurchase agreement is collateralized by cash, U.S. government securities, fixed income securities and/or other securities. The collateral is held by the Portfolio’s custodian and valued daily on a mark to market basis to determine if the value, including accrued interest, exceeds the repurchase price. In the event of the
counterparty’s default on the obligation to repurchase, the Portfolio has the right to liquidate the collateral and apply the proceeds in satisfaction of the obligation. Under certain circumstances, such as in the event of default or bankruptcy by the counterparty, realization and/or retention of the collateral may be limited or subject to delay, to legal proceedings and possible realized loss to the Portfolio. As of June 30, 2019, the Portfolio did not hold any repurchase agreements.
(I) Loan Assignments, Participations and Commitments. The Portfolio may invest in loan assignments and participations (“loans”). Commitments are agreements to make money available to a borrower in a specified amount, at a specified rate and within a specified time. The Portfolio records an investment when the borrower withdraws money on a commitment or when a funded loan is purchased (trade date) and records interest as earned. These loans pay interest at rates that are periodically reset by reference to a base lending rate plus a spread. These base lending rates are generally the prime rate offered by a designated U.S. bank or the London Interbank Offered Rate (“LIBOR”).
The loans in which the Portfolio may invest are generally readily marketable, but may be subject to some restrictions on resale. For example, the Portfolio may be contractually obligated to receive approval from the agent bank and/or borrower prior to the sale of these investments. If the Portfolio purchases an assignment from a lender, the Portfolio will generally have direct contractual rights against the borrower in favor of the lender. If the Portfolio purchases a participation interest either from a lender or a participant, the Portfolio typically will have established a direct contractual relationship with the seller of the participation interest, but not with the borrower. Consequently, the Portfolio is subject to the credit risk of the lender or participant who sold the participation interest to the Portfolio, in addition to the usual credit risk of the borrower. In the event that the borrower, selling participant or intermediate participants become insolvent or enter into bankruptcy, the Portfolio may incur certain costs and delays in realizing payment, or may suffer a loss of principal and/or interest.
Unfunded commitments represent the remaining obligation of the Portfolio to the borrower. At any point in time, up to the maturity date of the issue, the borrower may demand the unfunded portion. Unfunded amounts, if any, are marked to market and any unrealized gains or losses are recorded in the Statement of Assets and Liabilities. As of June 30, 2019, the Portfolio did not hold any unfunded commitments.
(J) Futures Contracts. A futures contract is an agreement to purchase or sell a specified quantity of an underlying instrument at a specified future date and price, or to make or receive a cash payment based on the value of a financial instrument (e.g., foreign currency, interest rate, security or securities index). The Portfolio is subject to risks such as market price risk and/or interest rate risk in the normal course of investing in these transactions. Upon entering into a futures contract, the Portfolio is required to pledge to the broker or futures commission merchant an amount of cash and/or U.S. government securities equal to a certain percentage of the collateral amount, known as the “initial margin.” During the period the futures contract is open, changes in the value of the contract are recognized as unrealized appreciation or depreciation by marking to market such contract on a daily basis to reflect the market value of the contract at the end of each day’s trading. The Portfolio agrees to receive from or pay to the broker or futures commission merchant an amount of cash equal to the daily
Notes to Financial Statements(Unaudited) (continued)
fluctuation in the value of the contract. Such receipts or payments are known as “variation margin.” When the futures contract is closed, the Portfolio records a realized gain or loss equal to the difference between the proceeds from (or cost of) the closing transaction and the Portfolio’s basis in the contract.
The use of futures contracts involves, to varying degrees, elements of market risk in excess of the amount recognized in the Statement of Assets and Liabilities. The contract or notional amounts and variation margin reflect the extent of the Portfolio’s involvement in open futures positions. There are several risks associated with the use of futures contracts as hedging techniques. There can be no assurance that a liquid market will exist at the time when the Portfolio seeks to close out a futures contract. If no liquid market exists, the Portfolio would remain obligated to meet margin requirements until the position is closed. Futures may involve a small initial investment relative to the risk assumed, which could result in losses greater than if they had not been used. Futures may be more volatile than direct investments in the instrument underlying the futures and may not correlate to the underlying instrument, causing a given hedge not to achieve its objectives. The Portfolio’s activities in futures contracts have minimal counterparty risk as they are conducted through regulated exchanges that guarantee the futures against default by the counterparty. In the event of a bankruptcy or insolvency of a futures commission merchant that holds margin on behalf of the Portfolio, the Portfolio may not be entitled to the return of the entire margin owed to the Portfolio, potentially resulting in a loss. The Portfolio may invest in futures contracts to help manage the duration and yield curve of the portfolio while minimizing the exposure to wider bid/ask spreads in traditional bonds. The Portfolio’s investment in futures contracts and other derivatives may increase the volatility of the Portfolio’s NAVs and may result in a loss to the Portfolio. As of June 30, 2019, open futures contracts are shown in the Portfolio of Investments.
(K) Swap Contracts. The Portfolio may enter into credit default, interest rate, equity, index and currency exchange rate swap contracts (“swaps”). In a typical swap transaction, two parties agree to exchange the future returns (or differentials in rates of future returns) earned or realized at periodic intervals on a particular investment or instrument based on a notional principal amount. Generally, the Portfolio will enter into a swap on a net basis, which means that the two payment streams under the swap are netted, with the Portfolio receiving or paying (as the case may be) only the net amount of the two payment streams. Therefore, the Portfolio’s current obligation under a swap generally will be equal to the net amount to be paid or received under the swap, based on the relative value of notional positions attributable to each counterparty to the swap. The payments may be adjusted for transaction costs, interest payments, the amount of interest paid on the investment or instrument or other factors. Collateral, in the form of cash or securities, may be required to be held in segregated accounts with the custodian bank or broker in accordance with the terms of the swap. Swap agreements are privately negotiated in the over the counter (“OTC”) market and may be executed in a multilateral or other trade facilities platform, such as a registered commodities exchange (“centrally cleared swaps”).
Certain standardized swaps, including certain credit default and interest rate swaps, are subject to mandatory clearing and exchange-trading, and more types of standardized swaps are expected to be subject to
mandatory clearing and exchange-trading in the future. The counterparty risk for exchange-traded and cleared derivatives is expected to be generally lower than for uncleared derivatives, but cleared contracts are not risk-free. In a cleared derivative transaction, the Portfolio typically enters into the transaction with a financial institution counterparty, and performance of the transaction is effectively guaranteed by a central clearinghouse, thereby reducing or eliminating the Portfolio’s exposure to the credit risk of its original counterparty. The Portfolio will be required to post specified levels of margin with the clearinghouse or at the instruction of the clearinghouse; the margin required by a clearinghouse may be greater than the margin the Portfolio would be required to post in an uncleared transaction. As of June 30, 2019, all swap positions outstanding are shown in the Portfolio of Investments.
Swaps are marked to market daily based upon quotations from pricing agents, brokers or market makers and the change in value, if any, is recorded as unrealized appreciation or depreciation. Any payments made or received upon entering into a swap would be amortized or accreted over the life of the swap and recorded as a realized gain or loss. Early termination of a swap is recorded as a realized gain or loss. Daily changes in valuation of centrally cleared swaps, if any, are recorded as a receivable or payable for the change in value as appropriate (“variation margin”) on the Statement of Assets and Liabilities.
The Portfolio bears the risk of loss of the amount expected to be received under a swap in the event of the default or bankruptcy of the swap counterparty. The Portfolio may be able to eliminate its exposure under a swap either by assignment or other disposition, or by entering into an offsetting swap with the same party or a similar credit-worthy party. Swaps are not actively traded on financial markets. Entering into swaps involves elements of credit, market and documentation risk in excess of the amounts recognized on the Statement of Assets and Liabilities. Such risks involve the possibilities that there will be no liquid market for these swaps, that the counterparty to the swaps may default on its obligation to perform or disagree as to the meaning of the contractual terms in the swaps and that there may be unfavorable changes in interest rates, the price of the index or the security underlying these transactions.
Interest Rate Swaps: An interest rate swap is an agreement between two parties where one stream of future interest payments is exchanged for another based on a specified principal amount. Interest rate swaps often exchange a fixed payment for a floating payment that is linked to an interest rate (most often LIBOR). The Portfolio will typically use interest rate swaps to limit, or manage, its exposure to fluctuations in interest rates, or to obtain a marginally lower interest rate than it would have been able to get without the swap.
(L) Foreign Currency Forward Contracts. The Portfolio may enter into foreign currency forward contracts, which are agreements to buy or sell foreign currencies on a specified future date at a specified rate. The Portfolio is subject to foreign currency exchange rate risk in the normal course of investing in these transactions. During the period the forward contract is open, changes in the value of the contract are recognized as unrealized appreciation or depreciation by marking to market such contract on a daily basis to reflect the market value of the contract at the end of each day’s trading. Cash movement occurs on settlement date. When the forward contract is closed, the Portfolio records a realized gain or loss equal to the difference between the proceeds from
| | |
| 34 | | MainStay VP MacKay Unconstrained Bond Portfolio |
(or cost of) the closing transaction and the Portfolio’s basis in the contract. The Portfolio may purchase and sell foreign currency forward contracts for purposes of seeking to enhance portfolio returns and manage portfolio risk more efficiently. Foreign currency forward contracts may also be used to gain exposure to a particular currency or to hedge against the risk of loss due to changing currency exchange rates. Foreign currency forward contracts to purchase or sell a foreign currency may also be used in anticipation of future purchases or sales of securities denominated in foreign currency, even if the specific investments have not yet been selected.
The use of foreign currency forward contracts involves, to varying degrees, elements of risk in excess of the amount recognized in the Statement of Assets and Liabilities, including counterparty risk, market risk and illiquidity risk. Counterparty risk is heightened for these instruments because foreign currency forward contracts are not exchange-traded and therefore no clearinghouse or exchange stands ready to meet the obligations under such contracts. Thus, the Portfolio faces the risk that its counterparties under such contracts may not perform their obligations. Market risk is the risk that the value of a foreign currency forward contract will depreciate due to unfavorable changes in exchange rates. Illiquidity risk arises because the secondary market for foreign currency forward contracts may have less liquidity relative to markets for other securities and financial instruments. Risks also arise from the possible movements in the foreign exchange rates underlying these instruments. While the Portfolio may enter into forward contracts to reduce currency exchange risks, changes in currency exchange rates may result in poorer overall performance for the Portfolio than if it had not engaged in such transactions. Exchange rate movements can be large, depending on the currency, and can last for extended periods of time, affecting the value of the Portfolio’s assets. Moreover, there may be an imperfect correlation between the Portfolio’s holdings of securities denominated in a particular currency and forward contracts entered into by the Portfolio. Such imperfect correlation may prevent the Portfolio from achieving the intended hedge or expose the Portfolio to the risk of currency exchange loss. The unrealized appreciation (depreciation) on forward contracts also reflects the Portfolio’s exposure at the valuation date to credit loss in the event of a counterparty’s failure to perform its obligations. As of June 30, 2019, all open forward currency contracts are shown in the Portfolio of Investments.
(M) Foreign Currency Transactions. The Portfolio’s books and records are maintained in U.S. dollars. Prices of securities denominated in foreign currency amounts are translated into U.S. dollars at the mean between the buying and selling rates last quoted by any major U.S. bank at the following dates:
| (i) | market value of investment securities, other assets and liabilities—at the valuation date; and |
| (ii) | purchases and sales of investment securities, income and expenses—at the date of such transactions. |
The assets and liabilities that are denominated in foreign currency amounts are presented at the exchange rates and market values at the close of the period. The realized and unrealized changes in net assets arising from fluctuations in exchange rates and market prices of securities are not separately presented.
Net realized gain (loss) on foreign currency transactions represents net gains and losses on foreign currency forward contracts, net currency gains or losses realized as a result of differences between the amounts of securities sale proceeds or purchase cost, dividends, interest and withholding taxes as recorded on the Portfolio’s books, and the U.S. dollar equivalent amount actually received or paid. Net currency gains or losses from valuing such foreign currency denominated assets and liabilities, other than investments at valuation date exchange rates, are reflected in unrealized foreign exchange gains or losses.
(N) Rights and Warrants. Rights are certificates that permit the holder to purchase a certain number of shares, or a fractional share, of a new stock from the issuer at a specific price. Warrants are instruments that entitle the holder to buy an equity security at a specific price for a specific period of time. These investments can provide a greater potential for profit or loss than an equivalent investment in the underlying security. Prices of these investments do not necessarily move in tandem with the prices of the underlying securities.
There is risk involved in the purchase of rights and warrants in that these investments are speculative investments. The Portfolio could also lose the entire value of its investment in warrants if such warrants are not exercised by the date of its expiration. The Portfolio is exposed to risk until the sale or exercise of each right or warrant is completed. As of June 30, 2019, the Portfolio did not hold any rights or warrants.
(O) Securities Sold Short. The Portfolio may engage in sales of securities it does not own (“short sales”) as part of its investment strategies. When the Portfolio enters into a short sale, it must segregate or maintain with a broker the cash proceeds from the security sold short or other securities as collateral for its obligation to deliver the security upon conclusion of the sale. During the period a short position is open, depending on the nature and type of security, a short position is reflected as a liability and is marked to market in accordance with the valuation methodologies previously detailed (See Note 2(A)). Liabilities for securities sold short are closed out by purchasing the applicable securities for delivery to the counterparty broker. A gain, limited to the price at which the Portfolio sold the security short, or a loss, unlimited as to dollar amount, will be recognized upon termination of a short sale if the market price on the date the short position is closed out is less or greater, respectively, than the proceeds originally received. Any such gain or loss may be offset, completely or in part, by the change in the value of the hedged investments. Interest on short positions held is accrued daily, while dividends declared on short positions existing on the record date are recorded on theex-dividend date as a dividend expense in the Statement of Operations. Broker fees and other expenses related to securities sold short are disclosed in the Statement of Operations. Short sales involve risk of loss in excess of the related amounts reflected in the Statement of Assets and Liabilities. As of June 30, 2019, securities sold short are shown in the Portfolio of Investments.
(P) Securities Lending. In order to realize additional income, the Portfolio may engage in securities lending, subject to the limitations set forth in the 1940 Act and relevant guidance by the staff of the Securities and Exchange Commission (“SEC”). In the event the Portfolio does engage in securities lending, the Portfolio will lend through its custodian, State Street Bank and Trust Company (“State Street”), acting as securities lending agent on behalf of the Portfolio. State Street will
Notes to Financial Statements(Unaudited) (continued)
manage the Portfolio’s collateral in accordance with the securities lending agency agreement between the Portfolio and State Street, and indemnify the Portfolio against counterparty risk. The loans will be collateralized by cash (which may be invested in a money market fund) and/ornon-cash collateral (which may include, U.S. Treasury securities and/or U.S. Government Agency securities issued or guaranteed by the United States government or its agencies or instrumentalities) at least equal at all times to the market value of the securities loaned. The Portfolio may bear the risk of delay in recovery of, or loss of rights in, the securities loaned should the borrower of the securities experience financial difficulty. The Portfolio may also record a realized gain or loss on securities deemed sold due to a borrower’s inability to return securities on loan. The Portfolio bears the risk of any loss on investment of cash collateral. The Portfolio will receive compensation for lending its securities in the form of fees or it will retain a portion of interest on the investment of any cash collateral. The Portfolio will also continue to receive interest and dividends on the securities loaned and any gain or loss in the market price of the securities loaned that may occur during the term of the loan will be for the account of the Portfolio. Income earned from securities lending activities, if any, is reflected in the Statement of Operations. As of June 30, 2019, the Portfolio had securities on loan with an aggregate market value of $1,371,351 and received cash collateral which was invested into the State Street Navigator Securities Lending Government Money Market Portfolio with a value of $1,400,338.
(Q) Debt Securities and Loan Risk. The ability of issuers of debt securities held by the Portfolio to meet their obligations may be affected by, among other things, economic or political developments in a specific country, industry or region. Debt securities are also subject to the risks associated with changes in interest rates.
The Portfolio may invest in high-yield debt securities (sometimes called “junk bonds”), which are generally considered speculative because they present a greater risk of loss, including default, than higher quality debt securities. These securities pay investors a premium—a higher interest rate or yield than investment grade debt securities—because of the increased risk of loss. These securities can also be subject to greater price volatility. In times of unusual or adverse market, economic or political conditions, these securities may experience higher than normal default rates.
The Portfolio may invest in loans which are usually rated below investment grade and are generally considered speculative because they present a greater risk of loss, including default, than higher rated debt securities. These investments pay investors a higher interest rate than investment grade debt securities because of the increased risk of loss. Although certain loans are collateralized, there is no guarantee that the value of the collateral will be sufficient to repay the loan. In a recession or serious credit event, the value of these investments could decline significantly. As a result, the Portfolio’s NAVs could go down and you could lose money.
In addition, loans generally are subject to extended settlement periods that may be longer than seven days. As a result, the Portfolio may be adversely affected by selling other investments at an unfavorable time and/or under unfavorable conditions or engaging in borrowing transactions, such as borrowing against its credit facility, to raise cash to meet redemption obligations or pursue other investment opportunities.
In certain circumstances, loans may not be deemed to be securities. As a result, the Portfolio may not have the protection of anti-fraud provisions of the federal securities laws. In such cases, the Portfolio generally must rely on the contractual provisions in the loan agreement andcommon-law fraud protections under applicable state law.
(R) Foreign Securities Risk. The Portfolio may invest in foreign securities, which carry certain risks that are in addition to the usual risks inherent in domestic securities. These risks include those resulting from currency fluctuations, future adverse political or economic developments and possible imposition of currency exchange blockages or other foreign governmental laws or restrictions. These risks are likely to be greater in emerging markets than in developed markets. The ability of issuers of securities held by the Portfolio to meet their obligations may be affected by, among other things, economic or political developments in a specific country, industry or region.
(S) Counterparty Credit Risk. In order to better define its contractual rights and to secure rights that will help the Portfolio mitigate its counterparty risk, the Portfolio may enter into an International Swaps and Derivatives Association, Inc. Master Agreement (“ISDA Master Agreement”) or similar agreement with its counterparties. An ISDA Master Agreement is a bilateral agreement between the Portfolio and a counterparty that governs certain OTC derivatives and typically contains collateral posting terms and netting provisions. Under an ISDA Master
Agreement, the Portfolio may, under certain circumstances, offset with the counterparty certain derivative financial instruments’ payables and/or receivables with collateral held and/or posted and create one single net payment. The provisions of the ISDA Master Agreement typically permit a single net payment in the event of default including the bankruptcy or insolvency of the counterparty. Bankruptcy or insolvency laws of a particular jurisdiction may restrict or prohibit the right of offset in bankruptcy, insolvency or other events. In addition, certain ISDA Master Agreements may contain provisions for early termination of OTC derivative transactions in the event the net assets of the Portfolio decline below specific levels or if the Portfolio fails to meet the terms of its ISDA Master Agreements. The result would cause the Portfolio to accelerate payment of any net liability owed to the counterparty.
For financial reporting purposes, the Portfolio does not offset derivative assets and derivative liabilities that are subject to netting arrangements, if any, in the Statement of Assets and Liabilities.
(T) Indemnifications. Under the Fund’s organizational documents, its officers and trustees are indemnified against certain liabilities that may arise out of performance of their duties to the Fund. Additionally, in the normal course of business, the Portfolio enters into contracts with third-party service providers that contain a variety of representations and warranties and which may provide general indemnifications. The Portfolio’s maximum exposure under these arrangements is unknown, as this would involve future claims that may be made against the Portfolio that have not yet occurred. Based on experience, management is of the view that the risk of loss in connection with these potential indemnification obligations is remote. However, there can be no assurance that material liabilities related to such obligations will not arise in the future, which could adversely impact the Portfolio.
(U) Quantitative Disclosure of Derivative Holdings. The following tables show additional disclosures related to the Portfolio’s
| | |
| 36 | | MainStay VP MacKay Unconstrained Bond Portfolio |
derivative and hedging activities, including how such activities are accounted for and their effect on the Portfolio’s financial positions, performance and cash flows. The Portfolio entered into futures contracts to help manage the duration and yield curve of the portfolio while minimizing the exposure to wider bid/ask spreads in traditional bonds. The
Portfolio also entered into interest rate swaps to hedge the potential risk of rising short term interest rates. Foreign currency forward contracts were used to hedge against the risk of loss due to changing currency exchange rates. These derivatives are not accounted for as hedging instruments.
Fair value of derivative instruments as of June 30, 2019:
Asset Derivatives
| | | | | | | | | | | | | | |
| | | Statement of Assets and Liabilities Location | | Foreign
Exchange
Contracts
Risk | | | Interest Rate
Contracts
Risk | | | Total | |
| | | | |
Futures Contracts | | Net Assets—Net unrealized appreciation on investments, swap contracts and futures contracts | | $ | — | | | $ | 204,533 | | | $ | 204,533 | |
Centrally Cleared Swap Contracts | | Net Assets—Net unrealized appreciation on investments, swap contracts and futures contracts (b) | | | — | | | | 736,487 | | | | 736,487 | |
Forward Contracts | | Unrealized appreciation on foreign currency forward contracts | | | 15,219 | | | | — | | | | 15,219 | |
| | | | | | |
Total Fair Value | | | | $ | 15,219 | | | $ | 941,020 | | | $ | 956,239 | |
| | | | | | |
Liability Derivatives
| | | | | | | | | | | | | | |
| | | Statement of Assets and Liabilities Location | | Foreign
Exchange
Contracts
Risk | | | Interest Rate
Contracts
Risk | | | Total | |
| | | | |
Futures Contracts | | Net Assets—Net unrealized depreciation on investments, swap contracts and futures contracts (a) | | $ | — | | | $ | (5,805,747 | ) | | $ | (5,805,747 | ) |
Centrally Cleared Swap Contracts | | Net Assets—Net unrealized depreciation on investments, swap contracts and futures contracts (b) | | | — | | | | (3,779,713 | ) | | | (3,779,713 | ) |
Forward Contracts | | Unrealized depreciation on foreign currency forward contracts | | | (38,761 | ) | | | — | | | | (38,761 | ) |
| | | | | | |
Total Fair Value | | | | $ | (38,761 | ) | | $ | (9,585,460 | ) | | $ | (9,624,221 | ) |
| | | | | | |
| (a) | Includes cumulative appreciation (depreciation) of futures contracts as reported in the Portfolio of Investments. Only current day’s variation margin is reported within the Statement of Assets and Liabilities. |
| (b) | Includes cumulative appreciation (depreciation) of centrally cleared swap agreements as reported in the Portfolio of Investments. Only the current day’s variation margin is reported within the Statement of Assets and Liabilities. |
Notes to Financial Statements(Unaudited) (continued)
The effect of derivative instruments on the Statement of Operations for the period ended June 30, 2019:
Realized Gain (Loss)
| | | | | | | | | | | | | | |
| | | Statement of Operations Location | | Foreign
Exchange
Contracts
Risk | | | Interest Rate
Contracts
Risk | | | Total | |
| | | | |
Futures Contracts | | Net realized gain (loss) on futures transactions | | $ | — | | | $ | (11,913,791 | ) | | $ | (11,913,791 | ) |
Swap Contracts | | Net realized gain (loss) on swap transactions | | | — | | | | 1,797,522 | | | | 1,797,522 | |
Forward Contracts | | Net realized gain (loss) on foreign
currency forward transactions | | | 103,791 | | | | — | | | | 103,791 | |
| | | | | | |
Total Realized Gain (Loss) | | | | $ | 103,791 | | | $ | (10,116,269 | ) | | $ | (10,012,478 | ) |
| | | | | | |
Change in Unrealized Appreciation (Depreciation)
| | | | | | | | | | | | | | |
| | | Statement of Operations Location | | Foreign
Exchange
Contracts
Risk | | | Interest Rate
Contracts
Risk | | | Total | |
| | | | |
Futures Contracts | | Net change in unrealized appreciation (depreciation) on futures contracts | | $ | — | | | $ | 805,731 | | | $ | 805,731 | |
Swap Contracts | | Net change in unrealized appreciation (depreciation) on swap contracts | | | — | | | | (5,450,685 | ) | | | (5,450,685 | ) |
Forward Contracts | | Net change in unrealized appreciation (depreciation) on foreign currency
forward contracts | | | (19,326 | ) | | | — | | | | (19,326 | ) |
| | | | | | |
Total Change in Unrealized Appreciation (Depreciation) | | | | $ | (19,326 | ) | | $ | (4,644,954 | ) | | $ | (4,664,280 | ) |
| | | | | | |
Average Notional Amount
| | | | | | | | | | | | |
| | | Foreign
Exchange
Contracts
Risk | | | Interest Rate
Contracts Risk | | | Total | |
| | | |
Futures Contracts Long | | $ | — | | | $ | 29,259,786 | | | $ | 29,259,786 | |
Futures Contracts Short | | $ | — | | | $ | (283,154,641 | ) | | $ | (283,154,641 | ) |
Swap Contracts Long | | $ | — | | | $ | 530,000,000 | | | $ | 530,000,000 | |
Forward Contracts Long (a) | | $ | 4,018,452 | | | $ | — | | | $ | 4,018,452 | |
Forward Contracts Short | | $ | (5,474,673 | ) | | $ | — | | | $ | (5,474,673 | ) |
| | | | |
| (a) | Positions were open two months during the reporting period |
Note 3–Fees and Related Party Transactions
(A) Manager and Subadvisor. New York Life Investments, a registered investment adviser and an indirect, wholly-owned subsidiary of New York Life, serves as the Portfolio’s Manager pursuant to an Amended and Restated Management Agreement (“Management Agreement”). The Manager provides offices, conducts clerical, recordkeeping and bookkeeping services, and keeps most of the financial and accounting records required to be maintained by the Portfolio. Except for the portion of salaries and expenses that are the responsibility of the Portfolio, the Manager pays the salaries and expenses of all personnel affiliated with the Portfolio and certain operational expenses of the Portfolio. The Portfolio reimburses New York Life Investments in an amount equal to a portion of the compensation of the Chief Compliance Officer attributable to the Portfolio. MacKay Shields LLC (“MacKay Shields” or “Subadvisor”), a registered investment adviser and an indirect, wholly-owned subsidiary of New York Life, serves as
Subadvisor to the Portfolio and is responsible for theday-to-day portfolio management of the Portfolio. Pursuant to the terms of an Amended and Restated Subadvisory Agreement (“Subadvisory Agreement”) between New York Life Investments and MacKay Shields, New York Life Investments pays for the services of the Subadvisor.
The Fund, on behalf of the Portfolio, pays New York Life Investments in its capacity as the Portfolio’s investment manager and administrator, pursuant to the Management Agreement, a monthly fee for the services performed and the facilities furnished at an annual rate of the average daily net assets as follows: 0.60% up to $500 million; 0.55% from $500 million to $1 billion; 0.50% from $1 billion to $5 billion; and 0.475% in excess of $5 billion. During thesix-month period ended June 30, 2019, the effective management fee rate was 0.57%.
During thesix-month period ended June 30, 2019, New York Life Investments earned fees from the Portfolio in the amount of $3,132,736, and paid the Subadvisor in the amount of $1,566,368.
| | |
| 38 | | MainStay VP MacKay Unconstrained Bond Portfolio |
State Street providessub-administration andsub-accounting services to the Portfolio pursuant to an agreement with New York Life Investments. These services include calculating the daily NAVs of the Portfolio, maintaining the general ledger andsub-ledger accounts for the calculation of the Portfolio’s NAVs and assisting New York Life Investments in conducting various aspects of the Portfolio’s administrative operations. For providing these services to the Portfolio, State Street is compensated by New York Life Investments.
Pursuant to an agreement between the Fund and New York Life Investments, New York Life Investments is responsible for providing or procuring certain regulatory reporting services for the Portfolio. The Portfolio will reimburse New York Life Investments for the actual costs incurred by New York Life Investments in connection with providing or procuring these services for the Portfolio.
(B) Distribution and Service Fees. The Fund, on behalf of the Portfolio, has entered into a distribution agreement with NYLIFE Distributors LLC (the “Distributor”), an indirect, wholly-owned subsidiary of New York Life. The Portfolio has adopted a distribution plan (the “Plan”) in accordance with the provisions of Rule12b-1 under the 1940 Act. Under the Plan, the Distributor has agreed to provide, through its affiliates or independent third parties, various distribution-related, shareholder and administrative support services to the Service Class shareholders. For its services, the Distributor is entitled to a combined distribution and service fee accrued daily and paid monthly at an annual rate of 0.25% of the average daily net assets attributable to the Service Class shares of the Portfolio.
(C) Investments in Affiliates (in 000’s). During thesix-month period ended June 30, 2019, purchases and sales transactions, income earned from investments and shares held of investment companies managed by New York Life Investments or its affiliates were as follows:
| | | | | | | | | | | | | | | | | | | | | | | | | | | | | | | | | | | | |
Affiliated Investment Company | | Value,
Beginning of
Period | | | Purchases
at Cost | | | Proceeds
from Sales | | | Net
Realized
Gain/(Loss)
on Sales | | | Change in
Unrealized
Appreciation/
(Depreciation) | | | Value,
End of
Period | | | Dividend
Income | | | Other
Distributions | | | Shares
End of
Period | |
| | | | | | | | | |
MainStay U.S. Government Liquidity Fund | | $ | 7,374 | | | $ | 240,772 | | | $ | (234,492 | ) | | $ | — | | | $ | — | | | $ | 13,654 | | | $ | 232 | | | $ | — | | | | 13,654 | |
| | | | |
Note 4–Federal Income Tax
As of June 30, 2019, the cost and unrealized appreciation (depreciation) of the Portfolio’s investment portfolio, including applicable derivative contracts and other financial instruments, as determined on a federal income tax basis, were as follows:
| | | | | | | | | | | | | | | | |
| | | Federal Tax
Cost | | | Gross
Unrealized
Appreciation | | | Gross
Unrealized
(Depreciation) | | | Net
Unrealized
Appreciation/
(Depreciation) | |
| | | | |
Investments in Securities | | $ | 1,100,594,901 | | | $ | 22,540,312 | | | $ | (4,991,152 | ) | | $ | 17,549,160 | |
As of December 31, 2018, for federal income tax purposes, capital loss carryforwards of $39,620,447, as shown in the table below, were available to the extent provided by the regulations to offset future realized gains of the Portfolio through the years indicated. Accordingly, no capital gains distributions are expected to be paid to shareholders until net gains have been realized in excess of such amounts.
| | | | |
Capital Loss
Available Through | | Short-Term
Capital Loss
Amounts (000’s) | | Long-Term
Capital Loss
Amounts (000’s) |
| | |
| Unlimited | | $7,760 | | $31,860 |
During the year ended December 31, 2018, the tax character of distributions paid as reflected in the Statements of Changes in Net Assets was as follows:
| | | | |
|
| 2018 |
Tax-Based
Distributions from Ordinary
Income | | | Tax-Based
Distributions from Long-Term
Gains |
| |
| $ | 37,673,487 | | | $ — |
Note 5–Custodian
State Street is the custodian of cash and securities held by the Portfolio. Custodial fees are charged to the Portfolio based on the Portfolio’s net assets and/or the market value of securities held by the Portfolio and the number of certain transactions incurred by the Portfolio.
Note 6–Line of Credit
The Portfolio and certain other funds managed by New York Life Investments maintain a line of credit with a syndicate of banks in order to secure a source of funds for temporary purposes to meet unanticipated or excessive redemption requests.
Effective July 30, 2019, under the credit agreement (the “Credit Agreement”), the aggregate commitment amount is $600,000,000 with an additional uncommitted amount of $100,000,000. The commitment fee is an annual rate of 0.15% of the average commitment amount payable quarterly, regardless of usage, to State Street, who serves as the agent to the syndicate. The commitment fee is allocated among the Portfolio and certain other funds managed by New York Life Investments based upon their respective net assets and other factors. Interest on any
Notes to Financial Statements(Unaudited) (continued)
revolving credit loan is charged based upon the Federal Funds Rate or theone-month London Interbank Offered Rate (“LIBOR”), whichever is higher. The Credit Agreement expires on July 28, 2020, although the Portfolio, certain other funds managed by New York Life Investments and the syndicate of banks may renew the Credit Agreement for an additional year on the same or different terms. Prior to July 30, 2019, the aggregate commitment amount and the commitment fee were the same as those under the current Credit Agreement. During thesix-month period ended June 30, 2019, there were no borrowings made or outstanding with respect to the Portfolio under the Credit Agreement.
Note 7–Interfund Lending Program
Pursuant to an exemptive order issued by the SEC, the Portfolio, along with certain other funds managed by New York Life Investments, may participate in an interfund lending program. The interfund lending program provides an alternative credit facility that permits the Portfolio and certain other funds managed by New York Life Investments to lend or borrow money for temporary purposes directly to or from one another subject to the conditions of the exemptive order. During thesix-month period ended June 30, 2019, there were no interfund loans made or outstanding with respect to the Portfolio.
Note 8–Purchases and Sales of Securities (in 000’s)
During thesix-month period ended June 30, 2019, purchases and sales of U.S. government securities were $121,026 and $35,401, respectively. Purchases and sales of securities, other than U.S. government securities and short-term securities, were $141,972 and $267,167, respectively.
Note 9–Capital Share Transactions
Transactions in capital shares for thesix-month period ended June 30, 2019 and the year ended December 31, 2018, were as follows:
| | | | | | | | |
Initial Class | | Shares | | | Amount | |
| | |
Six-month period ended June 30, 2019: | | | | | | | | |
Shares sold | | | 137,308 | | | $ | 1,352,329 | |
Shares issued to shareholders in reinvestment of dividends
and distributions | | | 223,523 | | | | 2,192,533 | |
Shares redeemed | | | (2,759,022 | ) | | | (27,084,383 | ) |
| | | | |
Net increase (decrease) | | | (2,398,191 | ) | | $ | (23,539,521 | ) |
| | | | |
| | |
Year ended December 31, 2018: | | | | | | | | |
Shares sold | | | 4,511,420 | | | $ | 44,611,372 | |
Shares issued to shareholders in
reinvestment of dividends
and distributions | | | 456,270 | | | | 4,472,392 | |
Shares redeemed | | | (6,464,408 | ) | | | (63,695,434 | ) |
| | | | |
Net increase (decrease) | | | (1,496,718 | ) | | $ | (14,611,670 | ) |
| | | | |
| | | | | | | | |
Service Class | | Shares | | | Amount | |
| | |
Six-month period ended June 30, 2019: | | | | | | | | |
Shares sold | | | 2,159,195 | | | $ | 21,211,890 | |
Shares issued to shareholders in reinvestment of dividends and distributions | | | 2,036,817 | | | | 19,920,462 | |
Shares redeemed | | | (5,877,432 | ) | | | (57,413,516 | ) |
| | | | |
Net increase (decrease) | | | (1,681,420 | ) | | $ | (16,281,164 | ) |
| | | | |
| | |
Year ended December 31, 2018: | | | | | | | | |
Shares sold | | | 9,736,875 | | | $ | 96,785,534 | |
Shares issued to shareholders in reinvestment of dividends and distributions | | | 3,399,126 | | | | 33,201,095 | |
Shares redeemed | | | (14,954,626 | ) | | | (147,103,649 | ) |
| | | | |
Net increase (decrease) | | | (1,818,625 | ) | | $ | (17,117,020 | ) |
| | | | |
Note 10–Recent Accounting Pronouncement
To improve the effectiveness of fair value disclosure requirements, the Financial Accounting Standards Board recently issued Accounting Standard Update (ASU)2018-13, Fair Value Measurement Disclosure Framework—Changes to the Disclosure Requirements for Fair Value Measurement (ASU2018-13), which adds, removes, and modifies certain aspects relating to fair value disclosure. ASU2018-13 is effective for interim and annual reporting periods beginning after December 15, 2019; early adoption of the additions relating toASU 2018-13 is not required. Management has evaluated the implications of certain other provisions of the ASU and has determined to early adopt aspects related to the removal and modifications of certain fair value measurement disclosures under the ASU effective immediately. At this time, management is evaluating the implications of certain other provisions of the ASU related to new disclosure requirements and any impact on the financial statement disclosures has not yet been determined.
Note 11–Subsequent Events
In connection with the preparation of the financial statements of the Portfolio as of and for thesix-month period ended June 30, 2019, events and transactions subsequent to June 30, 2019, through the date the financial statements were issued have been evaluated by the Portfolio’s management for possible adjustment and/or disclosure. No subsequent events requiring financial statement adjustment or disclosure have been identified.
| | |
| 40 | | MainStay VP MacKay Unconstrained Bond Portfolio |
Proxy Voting Policies and Procedures and Proxy Voting Record
A description of the policies and procedures that New York Life Investments uses to vote proxies related to the Portfolio’s securities is available without charge, upon request (i) by calling800-598-2019; (ii) by visiting New York Life Investments website athttps://www.nylinvestments.com/mainstay/products-and-performance/mainstay-vp-funds-trust; or (iii) by visiting the SEC’s website at www.sec.gov.
The Portfolio is required to file with the SEC its proxy voting record for the12-month period ending June 30 on FormN-PX. The Portfolio’s most recent FormN-PX or proxy voting record is available free of charge upon request (i) by calling800-598-2019; (ii) by visiting New York Life Investments website athttps://www.nylinvestments.com/mainstay/products-and-performance/mainstay-vp-funds-trust; or (iii) by visiting the SEC’s website atwww.sec.gov.
Shareholder Reports and Quarterly Portfolio Disclosure
The Portfolio is required to file its complete schedule of portfolio holdings with the SEC 60 days after each fiscal quarter on FormN-PORT. The Portfolio’s holdings report is available without charge upon request (i) by calling800-598-2019; (ii) by visiting New York Life Investments website athttps://www.nylinvestments.com/mainstay/products-and-performance/mainstay-vp-funds-trust; or (iii) on the SEC’s website at www.sec.gov.
MainStay VP Portfolios
MainStay VP offers a wide range of Portfolios. The full array of MainStay VP offerings is listed here, with information about the manager, subadvisors, legal counsel, and independent registered public accounting firm.
Equity Portfolios
MainStay VP Eagle Small Cap Growth Portfolio
MainStay VP Emerging Markets Equity Portfolio
MainStay VP Epoch U.S. Equity Yield Portfolio
MainStay VP Fidelity Institutional AM® Utilities Portfolio†
MainStay VP Large Cap Growth Portfolio
MainStay VP MacKay Common Stock Portfolio
MainStay VP MacKay Growth Portfolio
MainStay VP MacKay International Equity Portfolio
MainStay VP MacKay Mid Cap Core Portfolio
MainStay VP MacKay S&P 500 Index Portfolio
MainStay VP MacKay Small Cap Core Portfolio
MainStay VP Mellon Natural Resources Portfolio
MainStay VP T. Rowe Price Equity Income Portfolio
Mixed Asset Portfolios
MainStay VP Balanced Portfolio
MainStay VP Income Builder Portfolio
MainStay VP Janus Henderson Balanced Portfolio
MainStay VP MacKay Convertible Portfolio
Income Portfolios
MainStay VP Bond Portfolio
MainStay VP Floating Rate Portfolio
MainStay VP Indexed Bond Portfolio
MainStay VP MacKay Government Portfolio
MainStay VP MacKay High Yield Corporate Bond Portfolio
MainStay VP MacKay Unconstrained Bond Portfolio
MainStay VP PIMCO Real Return Portfolio
Money Market
MainStay VP U.S. Government Money Market Portfolio
Alternative
MainStay VP Cushing Renaissance Advantage Portfolio
MainStay VP IQ Hedge Multi-Strategy Portfolio
Asset Allocation Portfolios
MainStay VP Conservative Allocation Portfolio
MainStay VP Growth Allocation Portfolio
MainStay VP Moderate Allocation Portfolio
MainStay VP Moderate Growth Allocation Portfolio
Manager
New York Life Investment Management LLC
New York, New York
Subadvisors
Candriam Belgium*
Brussels, Belgium
Cushing Asset Management, LP
Dallas, Texas
Eagle Asset Management, Inc.
St Petersburg, Florida
Epoch Investment Partners, Inc.
New York, New York
FIAM LLC
Smithfield, Rhode Island
IndexIQ Advisors LLC*
New York, New York
Janus Capital Management LLC
Denver, Colorado
MacKay Shields LLC*
New York, New York
Mellon Investments Corporation
Boston, Massachusetts
NYL Investors LLC*
New York, New York
Pacific Investment Management Company LLC
Newport Beach, California
T. Rowe Price Associates, Inc.
Baltimore, Maryland
Winslow Capital Management, LLC
Minneapolis, Minnesota
Distributor
NYLIFE Distributors LLC*
Jersey City, New Jersey
Custodian
State Street Bank and Trust Company
Boston, Massachusetts
Independent Registered Public Accounting Firm
PricewaterhouseCoopers LLP
New York, New York
Legal Counsel
Dechert LLP
Washington, District of Columbia
Some Portfolios may not be available in all products.
| † | Fidelity Institutional AM is a registered trade mark of FMR LLC. Used with permission. |
| * | An affiliate of New York Life Investment Management LLC |
Not part of the Semiannual Report
2019 Semiannual Report
This report is for the general information of New York Life Variable Annuities and NYLIAC Variable Universal Life Insurance Products policyowners. It must be preceded or accompanied by the appropriate product(s) and funds prospectuses if it is given to anyone who is not an owner of a New York Life variable annuity policy or a NYLIAC Variable Universal Life Insurance Product. This report does not offer for sale or solicit orders to purchase securities.
The performance data quoted in this report represents past performance. Past performance is no guarantee of future results. Due to market volatility and other factors, current performance may be lower or higher than the figures shown. The most recent month-end performance summary for your variable annuity or variable life policy is available by calling 800-598-2019 and is updated periodically on www.newyorklife.com.
The New York Life Variable Annuities and NYLIAC Variable Universal Life Insurance Products are issued by New York Life Insurance and Annuity Corporation (a Delaware Corporation) and distributed by NYLIFE Distributors LLC (Member FINRA/SIPC).
New York Life Insurance Company
New York Life Insurance and Annuity Corporation (NYLIAC) (A Delaware Corporation)
51 Madison Avenue, Room 551
New York, NY 10010
www.newyorklife.com
Printed on recycled paper
nylinvestments.com
NYLIFE Distributors LLC, 30 Hudson Street, Jersey City, NJ 07302
New York Life Investment Management LLC is the investment manager to the MainStay VP Funds Trust
©2019 by NYLIFE Distributors LLC. All rights reserved.
You may obtain copies of the Prospectus and the Statement of Additional Information free of charge, upon request, by callingtoll-free 800-598-2019 or writing to New York Life Insurance and Annuity Corporation, 51 Madison Avenue, New York, NY 10010.
| | | | |
| | | |
| Not FDIC Insured | | No Bank Guarantee | | May Lose Value |
| | | | |
| 1781647 | | | | MSVPUB10-08/19 (NYLIAC) NI532 |
MainStay VP IQ HedgeMulti-Strategy Portfolio
Message from the President and Semiannual Report
Unaudited | June 30, 2019

Beginning on January 1, 2021, as permitted by regulations adopted by the Securities and Exchange Commission, paper copies of the MainStay VP Portfolio annual and semi-annual shareholder reports may no longer be sent by mail, unless you specifically request paper copies of the reports from the insurance company that offers your policy. Instead, the reports will be made available online, and you will be notified by mail each time a report is posted and provided with a website link to access the report. Instructions for requesting paper copies will be provided by your insurance company.
If you already elected to receive shareholder reports electronically, you will not be affected by this change and you need not take any action. At any time, you may elect to receive reports and other communications from the insurance company electronically by following the instructions provided by the insurance company.
You may elect to receive all future shareholder reports in paper form free of charge. You can inform the insurance company that you wish to receive paper copies of reports by following the instructions provided by the insurance company. Your election to receive reports in paper form will apply to all portfolio companies available under your contract.
| | | | | | | | |
| | | | | |
| Not FDIC/NCUA Insured | | Not a Deposit | | May Lose Value | | No Bank Guarantee | | Not Insured by Any Government Agency |

This page intentionally left blank
Message from the President
Most equity and fixed-income markets in the United States and around the world advanced in the face of conflicting political and macroeconomic forces during thesix-month period ended June 30, 2019.
The reporting period began on the heels of tumultuous December 2018, during which equities and equity-sensitive bonds spiked sharply lower on concerns regarding the pace of economic growth, a U.S. government shutdown and the potential impact of trade disputes between the United States and other nations, particularly China. Markets recovered quickly in early 2019 as trade tensions eased, the government reopened and the U.S. Federal Reserve Board (Fed) adopted a more patient tone regarding the future direction of interest rates. Markets moved broadly higher from January through April, supported by encouraging economic data and generally strong corporate earnings.
During the first four months of the reporting period, the improving economic environment encouraged investors to favor areas of the market viewed as offering greater return potential along with higher risks. Among U.S. stocks, cyclical, growth-oriented sectors tended to outperform more defensive, value-oriented sectors, whilelarge-cap stocks outperformed theirsmaller-cap counterparts. Within the S&P 500® Index, the information technology sector led the market’s advance, followed by communication services, consumer discretionary and consumer staples. Industrials, utilities, financials, materials, real estate and energy produced more modest gains. While some international equity markets outperformed or underperformed the U.S. market, on average international stocks mirrored the performance of their U.S. counterparts. Fixed-income securities gained ground as well, albeit along a more gradual trajectory. Among U.S. fixed-income instruments, corporate issues generally outperformed government bonds, with lower credit quality, higher yielding securities leading the sector’s advance. Long-term U.S. Treasury bond yields proved particularly weak, with
10-year yields dipping at times below3-month yields, reflecting investors’ continued concerns about domestic economic growth.
May 2019 saw a return of uncertainty and volatility. Trade discussions between the United States and China faltered, driving global equity prices lower. Government bond prices rose as investors sought safe havens. June brought yet anotherU-turn as equity prices climbed again after comments from the Fed raised hopes of an interest rate cut in response to weak economic data. Stock and bond prices rose, with U.S. equity markets ending the reporting period in record territory.
We are pleased to see renewed signs of strength in broad areas of the financial market. At the same time, we remained sharply focused on providing you, as a MainStay VP investor, with the experienced and disciplined fund management that we believe underpins an effective, long-term investment strategy. Whatever tomorrow’s investment environment brings, you can rely on our portfolio managers to pursue the objectives of their individual Portfolios as outlined in the prospectus with the energy and dedication you have come to expect.
The report that follows contains additional information on the market events, investment decisions and specific securities that shaped your VP Portfolio’s performance during the six months ended June 30, 2019. We encourage you to read the report carefully and use it to evaluate your Portfolio’s performance in light of your long-range financial plan.
Sincerely,

Kirk C. Lehneis
President
The opinions expressed are as of the date of this report and are subject to change. There is no guarantee that any forecast made will come to pass. This material does not constitute investment advice and is not intended as an endorsement of any specific investment. Past performance is no guarantee of future results.
Not part of the Semiannual Report
Table of Contents
Investors should refer to the Portfolio’s Summary Prospectus and/or Prospectus and consider the Portfolio’s investment objectives, strategies, risks, charges and expenses carefully before investing. The Summary Prospectus and/or Prospectus contain this and other information about the Portfolio. You may obtain copies of the Portfolio’s Summary Prospectus and/or the Prospectus and the Statement of Additional Information free of charge, upon request, by calling toll-free 800-598-2019, by writing to New York Life Insurance and Annuity Corporation, 51 Madison Avenue, Room 251, New York, New York 10010 or by sending an email to MainStayShareholdersServices@nylim.com. These documents are also available at nylinvestments.com/vpdocuments. Please read the Summary Prospectus and/or Prospectus carefully before investing. MainStay VP Funds Trust portfolios are separate account options which are purchased through a variable insurance or variable annuity contract.
Investment and Performance Comparison1(Unaudited)
Performance data quoted represents past performance. Past performance is no guarantee of future results. Because of market volatility and other factors, current performance may be lower or higher than the figures shown. Investment return and principal value will fluctuate, and as a result, when shares are redeemed, they may be worth more or less than their original cost. The performance table and graph do not reflect any deduction of sales charges, mortality and expense charges, contract charges or administrative charges. Please refer to the Performance Summary appropriate for your policy. For performance information current to the most recent month-end, please call800-598-2019 or visit www.newyorklife.com.
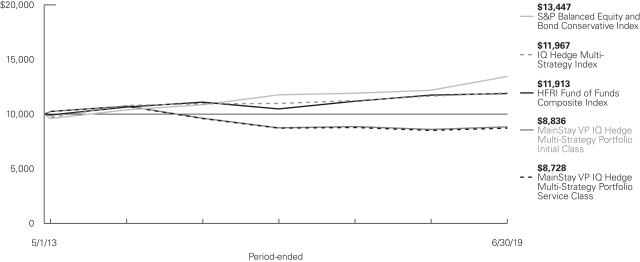
Average Annual Total Returns for the Period-Ended June 30, 2019
| | | | | | | | | | | | | | | | | | | | | | | | |
| Class | | Inception
Date | | | Six Months | | | One Year | | | Five Years | | | Since
Inception2 | | | Gross
Expense
Ratio3 | |
| | | | | | |
| Initial Class Shares | | | 5/1/2013 | | | | 5.20 | % | | | 2.47 | % | | | –3.87 | % | | | –1.99 | % | | | 1.07 | % |
Service Class Shares | | | 5/1/2013 | | | | 5.11 | | | | 2.22 | | | | –4.07 | | | | –2.18 | | | | 1.32 | |
| | | | | | | | | | | | | | | | |
| Benchmark Performance | | Six
Months | | | One
Year | | | Five
Years | | | Since
Inception | |
| | | | |
S&P Balanced Equity and Bond-Conservative Index4 | | | 9.57 | % | | | 10.28 | % | | | 5.26 | % | | | 4.92 | % |
HFRI Fund of Funds Composite Index5 | | | 6.27 | | | | 1.25 | | | | 2.21 | | | | 2.88 | |
IQ Hedge Multi-Strategy Index | | | 5.69 | | | | 2.54 | | | | 2.06 | | | | 2.95 | |
Morningstar Multialternative Category Average6 | | | 5.39 | | | | 1.81 | | | | 1.19 | | | | 1.04 | |
| 1. | Performance figures may reflect certain fee waivers and/or expense limitations, without which total returns may have been different. For information on current fee waivers and/or expense limitations (if any), please refer to the Notes to the Financial Statements. |
| 2. | Effective November 30, 2018, the Portfolio’s predecessor fund, MainStay VP Absolute Return Multi-Strategy Portfolio (the “VP ARMS Portfolio”), was reorganized into the Portfolio. The Portfolio assumed the VP ARMS Portfolio’s historical performance and accounting information. Therefore, the performance information prior to November 30, 2018, shown in this report is that of the VP ARMS Portfolio, which had a different investment objective and different principal investment strategies and subadvisors. Past performance may have been different if the Portfolio’s current subadvisor, investment objective or principal investment strategies had been in place during the periods. |
| 3. | The gross expense ratios presented reflect the Portfolio’s “Total Annual Portfolio Operating Expenses” from the most recent Prospectus, as supplemented, and may differ from other expense ratios disclosed in this report. |
| 4. | The Portfolio has selected the S&P Balanced Equity and Bond-Conservative Index as its primary benchmark. The S&P Balanced Equity and Bond- |
| | Conservative Index consists of a position in the S&P 500 Total Return Index (25%) and a position in the S&P U.S. Treasury Bond 7-10 Year Index (75%). Results assume reinvestment of all dividends and capital gains. An investment cannot be made directly in an index. |
| 5. | The Portfolio has selected the HFRI Fund of Funds Composite Index as its secondary benchmark. The HFRI Fund of Funds Composite Index is an equally weighted hedge fund index including over 650 domestic and off-shore fund of funds. The index is rebalanced monthly with performance updates three times per month. Results assume reinvestment of all dividends and capital gains. An investment cannot be made directly in an index. |
| 6. | The Morningstar Multialternative Category Average is representative of funds that have a majority of their assets exposed to alternative strategies. Funds in this category include both funds with static allocations to alternative strategies and funds tactically allocating among alternative strategies and asset classes. Results are based on average total returns of similar funds with all dividends and capital gain distributions reinvested. |
Cost in Dollars of a $1,000 Investment in MainStay VP IQ Hedge Multi-Strategy Portfolio (Unaudited)
The example below is intended to describe the fees and expenses borne by shareholders during the six-month period from January 1, 2019, to June 30, 2019, and the impact of those costs on your investment.
Example
As a shareholder of the Portfolio you incur two types of costs: (1) transaction costs, including exchange fees and sales charges (loads) on purchases (as applicable), and (2) ongoing costs, including management fees, distribution and/or service (12b-1) fees, and other Portfolio expenses (as applicable). This example is intended to help you understand your ongoing costs (in dollars) of investing in the Portfolio and to compare these costs with the ongoing costs of investing in other mutual funds. The example is based on an investment of $1,000 made at the beginning of the six-month period and held for the entire period from January 1, 2019, to June 30, 2019. Shares are only sold in connection with variable life and annuity contracts and the example does not reflect any contract level or transactional fees or expenses. If these costs had been included, your costs would have been higher.
This example illustrates your Portfolio’s ongoing costs in two ways:
Actual Expenses
The second and third data columns in the table below provide information about actual account values and actual expenses. You may use the information in these columns, together with the amount you invested, to estimate the expenses that you paid during the six months ended June 30, 2019. Simply divide your account value by $1,000
(for example, an $8,600 account value divided by $1,000 = 8.6), then multiply the result by the number under the heading entitled “Expenses Paid During Period” to estimate the expenses you paid on your account during this period.
Hypothetical Example for Comparison Purposes
The fourth and fifth data columns in the table below provide information about hypothetical account values and hypothetical expenses based on the Portfolio’s actual expense ratio and an assumed rate of return of 5% per year before expenses, which is not the Portfolio’s actual return. The hypothetical account values and expenses may not be used to estimate the actual ending account balances or expenses you paid for the six-month period shown. You may use this information to compare the ongoing costs of investing in the Portfolio with the ongoing costs of investing in other mutual funds. To do so, compare this 5% hypothetical example with the 5% hypothetical examples that appear in the shareholder reports of the other mutual funds.
Please note that the expenses shown in the table are meant to highlight your ongoing costs only and do not reflect any transactional costs, such as exchange fees or sales charges (loads). Therefore, the fourth and fifth data columns of the table are useful in comparing ongoing costs only and will not help you determine the relative total costs of owning different funds. In addition, if these transactional costs were included, your costs would have been higher.
| | | | | | | | | | | | | | | | | | | | | | |
| | | | | | | | | | | | | | | | | | |
| Share Class | | Beginning
Account
Value
1/1/19 | | | Ending Account
Value (Based
on Actual
Returns and
Expenses)
6/30/19 | | | Expenses
Paid
During
Period1 | | | Ending Account
Value (Based
on Hypothetical
5% Annualized
Return and
Actual Expenses)
6/30/19 | | | Expenses
Paid
During
Period1 | | | Net Expense
Ratio
During
Period2 |
| | | | | | |
| Initial Class Shares | | $ | 1,000.00 | | | $ | 1,052.00 | | | $ | 3.56 | | | $ | 1,021.32 | | | $ | 3.51 | | | 0.70% |
| | | | | | |
| Service Class Shares | | $ | 1,000.00 | | | $ | 1,051.10 | | | $ | 4.83 | | | $ | 1,020.08 | | | $ | 4.76 | | | 0.95% |
| 1. | Expenses are equal to the Portfolio’s annualized expense ratio of each class multiplied by the average account value over the period, divided by 365 and multiplied by 181 (to reflect the six-month period). The table above represents the actual expenses incurred during the six-month period. In addition to the fees and expenses which the Portfolio bears directly, it also indirectly bears a pro rata share of the fees and expenses of the underlying funds in which it invests. Such indirect expenses are not included in the above-reported expense figures. |
| 2. | Expenses are equal to the Portfolio’s annualized expense ratio to reflect the six-month period. |
| | |
| 6 | | MainStay VP IQ Hedge Multi-Strategy Portfolio |
Portfolio Composition as of June 30, 2019(Unaudited)
| | | | |
| |
| U.S. Ultra Short Term Treasury Bond Funds | | | 29.9 | % |
| |
| Investment Grade Corporate Bond Funds | | | 10.7 | |
| |
| Floating Rate—Investment Grade Funds | | | 8.9 | |
| |
| International Small Cap Equity Funds | | | 7.3 | |
| |
| Bank Loan Funds | | | 6.3 | |
| |
| Short-Term Investments | | | 4.6 | |
| |
| BRIC Equity Funds | | | 3.9 | |
| |
| Japan Equity Funds | | | 3.1 | |
| |
| Europe Equity Funds | | | 2.8 | |
| |
| Mortgage-Backed Security Funds | | | 2.7 | |
| |
| Euro Fund | | | 2.5 | |
| |
| Emerging Small Cap Equity Fund | | | 2.3 | |
| |
| Emerging Bonds—Local Currency Funds | | | 2.2 | |
| |
| Emerging Bonds—USD Funds | | | 2.1 | |
| |
| U.S. Medium Term Treasury Bond Funds | | | 2.1 | |
| |
| Asia ex Japan Equity Funds | | | 2.0 | |
| |
| High Yield Corporate Bond Funds | | | 1.6 | |
| |
| U.S. Large Cap Core Funds | | | 1.6 | |
| | | | |
| |
| U.S. Small Cap Growth Funds | | | 1.6 | % |
| |
| Japanese Yen Fund | | | 1.3 | |
| |
| International Equity Core Fund | | | 1.0 | |
| |
| US Dollar Fund | | | 0.8 | |
| |
| Silver Fund | | | 0.7 | |
| |
| U.S. Small Cap Core Funds | | | 0.7 | |
| |
| Broad Fund | | | 0.4 | |
| |
| U.S. Momentum Fund | | | 0.4 | |
| |
| International Large Cap Growth Fund | | | 0.2 | |
| |
| Municipal Bond Fund | | | 0.2 | |
| |
| U.S. Large Cap Growth Funds | | | 0.1 | |
| |
| Volatility Notes | | | 0.1 | |
| |
| British Pound Fund | | | 0.0 | ‡ |
| |
| U.S. Preferred | | | 0.0 | ‡ |
| |
| Other Assets, Less Liabilities | | | –4.1 | |
| | | | |
| |
| | | 100.0 | % |
| | | | |
| ‡ | Less than one-tenth of a percent. |
See Portfolio of Investments beginning on page 10 for specific holdings within these categories. The Portfolio’s holdings are subject to change.
Top Ten Holdings as of June 30, 2019(excludingshort-term investment) (Unaudited)
| 1. | iShares Short Treasury Bond ETF |
| 2. | SPDR Bloomberg Barclays 1-3 Month T-Bill ETF |
| 3. | Vanguard Intermediate-Term Corporate Bond ETF |
| 4. | iShares Floating Rate Bond ETF |
| 5. | Vanguard FTSE All World ex-U.S. Small-Cap ETF |
| 6. | Invesco Senior Loan ETF |
| 7. | Goldman Sachs Access Treasury 0-1 Year ETF |
| 8. | SPDR Bloomberg Barclays Investment Grade Floating Rate ETF |
| 9. | Invesco CurrencyShares Euro Trust |
| 10. | Xtrackers MSCI Europe Hedged Equity ETF |
Portfolio Management Discussion and Analysis(Unaudited)
Answers to the questions reflect the views of Greg Barrato and James Harrison of IndexIQ Advisors LLC, the Portfolio’s Subadvisor (“Index IQ Advisors”).
How did MainStay VP IQ Hedge Multi-Strategy Portfolio perform relative to its benchmarks and peers during the six months ended June 30, 2019?
For the six months ended June 30, 2019, MainStay VP IQ Hedge Multi-Strategy Portfolio returned 5.20% for Initial Class shares and 5.11% for Service Class shares. Over the same period, both share classes underperformed the 9.57% return for the S&P Balanced Equity and Bond Conservative Index, which is the Portfolio’s primary benchmark, and the 6.27% return for the HFRI Fund of Funds Composite Index, which is the Portfolio’s secondary benchmark. For the six months ended June 30, 2019, both share classes also underperformed the 5.69% return of the IQ Hedge Multi-Strategy Index, which is an additional benchmark of the Portfolio, and the 5.39% returns of the Morningstar Multialternative Category Average.1
What factors affected the Portfolio’s performance relative to its primary benchmark during the reporting period?
The Portfolio outperformed the S&P Balanced Equity and Bond Conservative Index in January and February 2019 but lagged the benchmark in the remaining four months of the reporting period. The Portfolio’s average asset allocation over the reporting period was 77% in fixed-income securities, 18% in equities and the remainder in currencies, commodities, volatility and real estate. Although the Portfolio’s asset allocation mix was similar to the benchmark, which allocates 75% to U.S. Treasury bonds and 25% to U.S. equities, the Portfolio was exposed to additional credit risk in its fixed-income holdings and additional geographic risk in its equity holdings, which included international and emerging-market equities.
During the reporting period, how did the Portfolio’s performance correlate with traditional equity and fixed-income indices?
During the reporting period, the Portfolio maintained a moderate correlation to traditional equity indices and a lower, but positive, correlation to investment-grade fixed-income indices. The Portfolio’s correlation to the S&P 500® Index2 was 18.54%. The Portfolio’s correlation to the Bloomberg Barclays U.S. Aggregate Bond Index3 was 6.11%.
During the reporting period, how did the Portfolio’s volatility compare to that of traditional fixed-income indices?
During the reporting period, the annualized daily volatility of the Portfolio was 3.13%, which compared to a volatility of 2.84% for the Bloomberg Barclays U.S. Aggregate Bond Index.
During the reporting period, how did the Portfolio use derivatives and how was the Portfolio’s performance materially affected by investments in derivatives?
During the reporting period, the Portfolio used derivative positions where necessary to help the Portfolio track its underlying index, the IQ Hedge Multi-Strategy Index, which contains both long and short weights. The Portfolio’s derivatives positions were primarily total return swaps on the component investment vehicles that make up the underlying index at the weights in which those investment vehicles are included in the underlying index. Derivatives are not used to gain additional leverage; rather, they are used exclusively to enable the Portfolio to track the underlying index.
How did you allocate the Portfolio’s assets among each of the hedge fund investment styles during the reporting period and why?
The Portfolio’s allocations are driven by the weightings of the component securities in the IQ Hedge Multi-Strategy Index (“Underlying Index”), which uses quantitative models to determine the weights across the various hedge fund investment styles represented in the Underlying Index, as well as the weights of the assets within these styles. Given the rules-based nature of the process, there is no subjectivity involved in the allocation decision process.
How did the tactical allocation among the hedge fund investment styles affect the Portfolio’s performance during the reporting period?
The Portfolio allocates its assets among six underlying hedge fund investment styles: emerging-markets, long/short, market neutral, event-driven, fixed-income arbitrage, and global macro. During the reporting period, the Portfolio maintained gross exposure ranging from 100% to 115% due to short allocations to the long/short strategy.
The aggregate performance of the weighted strategy index versus an equal-weighted allocation of the same strategy components indicates that the Portfolio experienced a negative
| 1. | See page 5 for more information on benchmark and peer group returns. |
| 2. | “S&P 500®” is a trademark of The McGraw-Hill Companies, Inc. The S&P 500® Index is widely regarded as the standard index for measuringlarge-cap U.S. stock market performance. Results assume reinvestment of all dividends and capital gains. An investment cannot be made directly in an index |
| 3. | The Bloomberg Barclays U.S. Aggregate Bond Index is a broad-based benchmark that measures the investment grade, U.S. dollar-denominated, fixed-rate taxable bond market, including Treasuries, government-related and corporate securities, mortgage-backed securities (agency fixed-rate and hybrid adjustable rate mortgage pass-throughs), asset-backed securities and commercial mortgage-backed securities. Results assume reinvestment of all dividends and capital gains. An investment cannot be made directly in an index. |
| | |
| 8 | | MainStay VP IQ HedgeMulti-Strategy Portfolio |
allocation effect attributable to weighting changes during the reporting period.
During the reporting period, how did each investment style either contribute to or detract from the Portfolio’s absolute performance?
For all months during the reporting period, except for May 2019, the investment styles that contributed to the Portfolio’s absolute performance outpaced the investment styles that detracted from the Portfolio’s absolute performance. (Contributions take weightings and total returns into account.) Contributions from the Emerging Markets and Market Neutral strategies generated nearly 60% of the overall performance of the strategy. Fixed Income Arbitrage and Global Macro contributed approximately 34% to the overall strategy’s return. In aggregate, the Directional Strategies contributed about 56% of the overall strategy’s returns.
How did the Portfolio’s investment style weightings change during the reporting period?
During the reporting period, the Portfolio’s allocation to its market-neutral investment style remained relatively constant,
rising from 33.20% in January 2019 to 33.33% in February 2019 and remaining at that level through June 30, 2019. The Portfolio’s allocation to its emerging-market investment style ranged from a low of 24.19% in January 2019 to a high of 27.63% in June 2019. The Portfolio’s allocation to its global macro investment style reached its upper level of 19.48% in January 2019, decreased as low as 7.26% in May 2019 and increased to 17.30% in June 2019. The Portfolio’s allocation to its fixed-income arbitrage investment style fluctuated between a low of 13.38% in January 2019 to a high of 21.90% in March 2019 before decreasing to 17.22% in June 2019. The Portfolio’s allocation to its event-driven investment style stood at 5.39% in January 2019, increased to a high of 12.91% in May 2019 and decreased to –0.50% in June 2019. The Portfolio’s allocation to its long/short investment style stood at 4.36% in January 2019, decreased to a low of –7.20% in April 2019 and increased to a high of 5.02% in June 2019.
The opinions expressed are those of the portfolio managers as of the date of this report and are subject to change. There is no guarantee that any forecasts will come to pass. This material does not constitute investment advice and is not intended as an endorsement of any specific investment.
Not all MainStay VP Portfolios and/or share classes are available under all policies.
Portfolio of InvestmentsJune 30, 2019 (Unaudited)
| | | | | | | | |
| | | Principal
Amount | | | Value | |
| Exchange-Traded Funds 93.7%† | |
| Bonds 66.7% | |
Bank Loan Funds 6.3% | |
Invesco Senior Loan ETF (a) | | $ | 753,740 | | | $ | 17,079,748 | |
SPDR Blackstone / GSO Senior Loan ETF (a) | | | 179,068 | | | | 8,276,523 | |
| | | | | | | | |
| | | | | | | 25,356,271 | |
| | | | | | | | |
Emerging Bonds—Local Currency Funds 2.2% | |
SPDR Bloomberg Barclays Emerging Markets Local Bond ETF | | | 41,149 | | | | 1,144,765 | |
VanEck Vectors J.P. Morgan EM Local Currency Bond ETF | | | 216,647 | | | | 7,517,651 | |
WisdomTree Emerging Markets Local Debt Fund | | | 8,259 | | | | 291,956 | |
| | | | | | | | |
| | | | | | | 8,954,372 | |
| | | | | | | | |
Emerging Bonds—USD Funds 2.1% | |
iShares JP Morgan USD Emerging Markets Bond ETF | | | 70,543 | | | | 7,991,816 | |
Vanguard Emerging Markets Government Bond ETF | | | 8,768 | | | | 705,123 | |
| | | | | | | | |
| | | | | | | 8,696,939 | |
| | | | | | | | |
Floating Rate—Investment Grade Funds 8.9% | |
iShares Floating Rate Bond ETF | | | 505,496 | | | | 25,744,911 | |
SPDR Bloomberg Barclays Investment Grade Floating Rate ETF | | | 334,475 | | | | 10,278,417 | |
| | | | | | | | |
| | | | | | | 36,023,328 | |
| | | | | | | | |
High Yield Corporate Bond Funds 1.6% | |
iShares 0-5 Year High Yield Corporate Bond ETF | | | 68,217 | | | | 3,185,734 | |
SPDR Bloomberg Barclays Short Term High Yield Bond ETF | | | 126,265 | | | | 3,438,196 | |
| | | | | | | | |
| | | | | | | 6,623,930 | |
| | | | | | | | |
Investment Grade Corporate Bond Funds 10.7% | |
iShares Broad USD Investment Grade Corporate Bond ETF (a) | | | 30,751 | | | | 1,754,960 | |
SPDR Portfolio Short Term Corporate Bond ETF | | | 64,618 | | | | 1,988,942 | |
Vanguard Intermediate-Term Corporate Bond ETF | | | 342,159 | | | | 30,742,986 | |
VanguardShort-Term Corporate Bond ETF | | | 108,943 | | | | 8,789,521 | |
| | | | | | | | |
| | | | | | | 43,276,409 | |
| | | | | | | | |
Mortgage-Backed Security Funds 2.7% | |
iShares MBS ETF | | | 66,174 | | | | 7,120,322 | |
Vanguard Mortgage-Backed Securities ETF | | | 72,436 | | | | 3,826,794 | |
| | | | | | | | |
| | | | | | | 10,947,116 | |
| | | | | | | | |
Municipal Bond Fund 0.2% | |
VanEck Vectors High-Yield Municipal Index ETF | | | 12,662 | | | | 807,582 | |
| | | | | | | | |
| | | | | | | | |
| | | Principal
Amount | | | Value | |
U.S. Medium Term Treasury Bond Funds 2.1% | |
iShares 3-7 Year Treasury Bond ETF (a) | | $ | 31,763 | | | $ | 3,994,515 | |
Schwab Intermediate-Term U.S. Treasury ETF | | | 41,385 | | | | 2,274,520 | |
Vanguard Intermediate-Term Treasury ETF | | | 32,433 | | | | 2,139,605 | |
| | | | | | | | |
| | | | | | | 8,408,640 | |
| | | | | | | | |
U.S. Ultra Short Term Treasury Bond Funds 29.9% | |
Goldman Sachs Access Treasury0-1 Year ETF | | | 116,011 | | | | 11,642,864 | |
Invesco Treasury Collateral ETF | | | 19,180 | | | | 2,025,312 | |
iShares Short Treasury Bond ETF (a) | | | 687,873 | | | | 76,113,148 | |
SPDR Bloomberg Barclays 1-3 MonthT-Bill ETF | | | 338,890 | | | | 31,045,713 | |
| | | | | | | | |
| | | | | | | 120,827,037 | |
| | | | | | | | |
Total Bonds
(Cost $265,383,441) | | | | | | | 269,921,624 | |
| | | | | | | | |
|
| Equity 27.0% | |
Asia ex Japan Equity Funds 2.0% | |
iShares Core MSCI Pacific ETF | | | 62,205 | | | | 3,462,952 | |
iShares MSCI All Country Asia ex-Japan ETF | | | 53,862 | | | | 3,759,029 | |
Vanguard FTSE Pacific ETF | | | 14,099 | | | | 931,662 | |
| | | | | | | | |
| | | | | | | 8,153,643 | |
| | | | | | | | |
BRIC Equity Funds 3.9% | |
iShares China Large-Cap ETF | | | 184,923 | | | | 7,909,157 | |
iShares MSCI China ETF (a) | | | 103,997 | | | | 6,182,622 | |
SPDR S&P China ETF | | | 19,285 | | | | 1,843,453 | |
| | | | | | | | |
| | | | | | | 15,935,232 | |
| | | | | | | | |
Emerging Small Cap Equity Fund 2.3% | |
SPDR S&P Emerging Markets Small Cap ETF | | | 205,696 | | | | 9,194,611 | |
| | | | | | | | |
|
Europe Equity Funds 2.8% | |
iShares Core MSCI Europe ETF (a) | | | 5,880 | | | | 274,008 | |
iShares MSCI Eurozone ETF | | | 13,263 | | | | 524,618 | |
Vanguard FTSE Europe ETF | | | 20,323 | | | | 1,115,733 | |
Xtrackers MSCI Europe Hedged Equity ETF (a) | | | 317,880 | | | | 9,250,308 | |
| | | | | | | | |
| | | | | | | 11,164,667 | |
| | | | | | | | |
International Equity Core Fund 1.0% | |
Xtrackers MSCI EAFE Hedged Equity ETF (a) | | | 131,016 | | | | 4,141,416 | |
| | | | | | | | |
|
International Large Cap Growth Fund 0.2% | |
iShares MSCI EAFE Growth ETF (a) | | | 11,482 | | | | 927,401 | |
| | | | | | | | |
|
International Small Cap Equity Funds 7.3% | |
Schwab International Small-Cap Equity ETF | | | 260,560 | | | | 8,504,678 | |
Vanguard FTSE All World ex-U.S. Small-Cap ETF (a) | | | 198,053 | | | | 20,847,059 | |
| | | | | | | | |
| | | | | | | 29,351,737 | |
| | | | | | | | |
| | | | |
| 10 | | MainStay VP IQ Hedge Multi-Strategy Portfolio | | The notes to the financial statements are an integral part of,
and should be read in conjunction with, the financial statements. |
| | | | | | | | |
| | | Principal
Amount | | | Value | |
| Equity (continued) | |
Japan Equity Funds 3.1% | |
iShares MSCI Japan ETF | | $ | 113,679 | | | $ | 6,204,600 | |
Xtrackers MSCI Japan Hedged Equity ETF (a) | | | 169,736 | | | | 6,461,849 | |
| | | | | | | | |
| | | | | | | 12,666,449 | |
| | | | | | | | |
U.S. Large Cap Core Funds 1.6% | |
Consumer Discretionary Select Sector SPDR Fund | | | 10,598 | | | | 1,263,282 | |
Energy Select Sector SPDR Fund | | | 25,453 | | | | 1,621,611 | |
Financial Select Sector SPDR Fund | | | 46,965 | | | | 1,296,234 | |
Health Care Select Sector SPDR Fund | | | 10,689 | | | | 990,229 | |
Invesco KBW Bank ETF | | | 5,262 | | | | 265,468 | |
SPDR S&P Bank ETF (a) | | | 20,043 | | | | 869,064 | |
| | | | | | | | |
| | | | | | | 6,305,888 | |
| | | | | | | | |
U.S. Large Cap Growth Funds 0.1% | |
iShares Core S&P U.S. Growth ETF (a) | | | 617 | | | | 38,674 | |
Schwab U.S. Large-Cap Growth ETF (a) | | | 574 | | | | 47,762 | |
SPDR Portfolio S&P 500 Growth ETF | | | 822 | | | | 31,836 | |
Vanguard Growth ETF (a) | | | 1,488 | | | | 243,124 | |
| | | | | | | | |
| | | | | | | 361,396 | |
| | | | | | | | |
U.S. Momentum Fund 0.4% | |
iShares Edge MSCI USA Momentum Factor ETF (a) | | | 14,378 | | | | 1,705,231 | |
| | | | | | | | |
|
U.S. Preferred 0.0%‡ | |
Invesco Preferred ETF | | | 1,003 | | | | 14,674 | |
iShares Preferred & Income Securities ETF | | | 1,184 | | | | 43,630 | |
| | | | | | | | |
| | | | | | | 58,304 | |
| | | | | | | | |
U.S. Small Cap Core Funds 0.7% | |
iShares Russell 2000 ETF (a) | | | 10,821 | | | | 1,682,666 | |
Schwab U.S. Small-Cap ETF (a) | | | 4,676 | | | | 334,240 | |
Vanguard Small-Cap ETF (a) | | | 6,473 | | | | 1,014,060 | |
| | | | | | | | |
| | | | | | | 3,030,966 | |
| | | | | | | | |
U.S. Small Cap Growth Funds 1.6% | |
iShares Russell 2000 Growth ETF (a) | | | 12,395 | | | | 2,489,784 | |
iShares S&P Small-Cap 600 Growth ETF | | | 8,295 | | | | 1,513,671 | |
Vanguard Small-Cap Growth ETF (a) | | | 13,142 | | | | 2,447,172 | |
| | | | | | | | |
| | | | | | | 6,450,627 | |
| | | | | | | | |
Total Equity
(Cost $108,034,222) | | | | | | | 109,447,568 | |
| | | | | | | | |
Total Exchange-Traded Funds
(Cost $373,417,662) | | | | | | | 379,369,192 | |
| | | | | | | | |
| | | | | | | | |
| | | Principal
Amount | | | Value | |
Exchange-Traded Note 0.1% Volatility 0.1% | |
iPath Series B S&P 500 VIXShort-Term Futures ETN (b) | | $ | 18,110 | | | $ | 470,860 | |
| | | | | | | | |
Total Exchange-Traded Notes
(Cost $515,727) | | | | | | | 470,860 | |
| | | | | | | | |
| | |
| | | | | | | | |
| | |
Shares | | | | |
Exchange-Traded Vehicles 5.7% Commodities 1.1% | |
Broad Fund 0.4% | |
FlexShares Global Upstream Natural Resources Index Fund | | | 48,194 | �� | | | 1,590,884 | |
| | | | | | | | |
|
Silver Fund 0.7% | |
iShares Silver Trust (a)(b) | | | 201,945 | | | | 2,893,872 | |
| | | | | | | | |
Total Commodities
(Cost $4,414,569) | | | | | | | 4,484,756 | |
| | | | | | | | |
|
| Currencies 4.6% | |
British Pound Fund 0.0%‡ | | | | | | | | |
Invesco CurrencyShares British Pound Sterling Trust (b) | | | 498 | | | | 61,324 | |
| | | | | | | | |
|
Euro Fund 2.5% | |
Invesco CurrencyShares Euro Trust (b) | | | 93,762 | | | | 10,151,612 | |
| | | | | | | | |
|
Japanese Yen Fund 1.3% | |
Invesco CurrencyShares Japanese Yen Trust (b) | | | 56,642 | | | | 5,003,754 | |
| | | | | | | | |
|
US Dollar Fund 0.8% | |
Invesco DB U.S. Dollar Index Bullish Fund (a) | | | 120,538 | | | | 3,130,372 | |
| | | | | | | | |
Total Currencies
(Cost $18,325,371) | | | | | | | 18,347,062 | |
| | | | | | | | |
Total Exchange-Traded Vehicles
(Cost $22,739,940) | | | | | | | 22,831,818 | |
| | | | | | | | |
|
| Short-Term Investments 4.6% | |
Affiliated Investment Company 0.4% | | | | | | | | |
MainStay U.S. Government Liquidity Fund, 2.03% (c) | | | 1,760,328 | | | | 1,760,328 | |
| | | | | | | | |
| | | | | | |
The notes to the financial statements are an integral part of,
and should be read in conjunction with, the financial statements. | | | | | 11 | |
Portfolio of InvestmentsJune 30, 2019 (Unaudited) (continued)
| | | | | | | | |
| | | Shares | | | Value | |
| Short-Term Investments (continued) | |
Unaffiliated Investment Company 4.2% | |
State Street Navigator Securities Lending Government Money Market Portfolio, 2.33% (c)(d) | | | 17,038,834 | | | $ | 17,038,834 | |
| | | | | | | | |
TotalShort-Term Investments
(Cost $18,799,162) | | | | | | | 18,799,162 | |
| | | | | | | | |
Total Investments
(Cost $415,472,492) | | | 104.1 | % | | | 421,471,032 | |
Other Assets, Less Liabilities | | | (4.1 | ) | | | (16,704,005 | ) |
Net Assets | | | 100.0 | % | | $ | 404,767,027 | |
| † | Percentages indicated are based on Portfolio net assets. |
| ‡ | Less than one-tenth of a percent. |
| (a) | All or a portion of this security was held on loan. As of June 30, 2019, the aggregate market value of securities on loan was $47,713,845; the total market value of collateral held by the Portfolio was $48,883,210. The market value of the collateral held included non-cash collateral in the form of U.S. Treasury securities with a value of $31,844,376 (See Note 2(Q)). |
| (b) | Non-income producing security. |
| (c) | Current yield as of June 30, 2019. |
| (d) | Represents security purchased with cash collateral received for securities on loan. |
Swap Contracts
Open OTC total return equity swap contracts as of June 30, 2019 were as follows1:
| | | | | | | | | | | | | | | | | | | | |
Swap Counterparty | | Reference Obligation | | Floating Rate2 | | Termination
Date(s) | | | Payment Frequency
Paid/
Received | | | Notional Amount Long/ (Short) (000)* | | | Unrealized
Appreciation3 | |
| | | | | | |
Bank of America Merrill Lynch | | Consumer Discretionary Select Sector SPDR Fund | | 1 month LIBOR plus 0.50% | | | 4/02/2020 | | | | Monthly | | | $ | 62 | | | $ | — | |
Morgan Stanley & Co. | | Consumer Discretionary Select Sector SPDR Fund | | Federal Fund Rate plus 0.03% | | | 9/15/2020 | | | | Monthly | | | | 62 | | | | — | |
Bank of America Merrill Lynch | | Energy Select Sector SPDR Fund | | 1 month LIBOR plus 0.50% | | | 4/02/2020 | | | | Monthly | | | | 77 | | | | — | |
Morgan Stanley & Co. | | Energy Select Sector SPDR Fund | | Federal Fund Rate minus 0.24% | | | 9/15/2020 | | | | Monthly | | | | 77 | | | | — | |
Morgan Stanley & Co. | | Financial Select Sector SPDR Fund | | Federal Fund Rate minus 0.14% | | | 9/15/2020 | | | | Monthly | | | | 131 | | | | — | |
Bank of America Merrill Lynch | | Flexshares Global Upstream | | 1 month LIBOR plus 0.50% | | | 4/02/2020 | | | | Monthly | | | | 77 | | | | — | |
Morgan Stanley & Co. | | Flexshares Global Upstream | | Federal Fund Rate plus 0.50% | | | 9/15/2020 | | | | Monthly | | | | 77 | | | | — | |
Bank of America Merrill Lynch | | Goldman Sachs Access Treasury 0-1 Year ETF | | 1 month LIBOR plus 0.50% | | | 4/02/2020 | | | | Monthly | | | | 600 | | | | — | |
Morgan Stanley & Co. | | Goldman Sachs Access Treasury 0-1 Year ETF | | Federal Fund Rate plus 0.50% | | | 9/15/2020 | | | | Monthly | | | | 600 | | | | — | |
Bank of America Merrill Lynch | | Graniteshares Gold Trust | | 1 month LIBOR | | | 4/02/2020 | | | | Monthly | | | | (9 | ) | | | — | |
Morgan Stanley & Co. | | Graniteshares Gold Trust | | Federal Fund Rate minus 10.03% | | | 9/15/2020 | | | | Monthly | | | | (9 | ) | | | — | |
Morgan Stanley & Co. | | Health Care Select Sector SPDR Fund | | Federal Fund Rate minus 0.09% | | | 9/15/2020 | | | | Monthly | | | | 99 | | | | — | |
Bank of America Merrill Lynch | | Invesco CurrencyShares Australian Dollar Trust | | 1 month LIBOR | | | 4/02/2020 | | | | Monthly | | | | (442 | ) | | | — | |
Morgan Stanley & Co. | | Invesco CurrencyShares Australian Dollar Trust | | Federal Fund Rate minus 5.68% | | | 9/15/2020 | | | | Monthly | | | | (442 | ) | | | — | |
Bank of America Merrill Lynch | | Invesco CurrencyShares British Pound Sterling Trust | | 1 month LIBOR plus 0.50% | | | 4/02/2020 | | | | Monthly | | | | 3 | | | | — | |
Morgan Stanley & Co. | | Invesco CurrencyShares British Pound Sterling Trust | | Federal Fund Rate plus 0.50% | | | 9/15/2020 | | | | Monthly | | | | 3 | | | | — | |
Bank of America Merrill Lynch | | Invesco CurrencyShares Euro Currency Trust | | 1 month LIBOR plus 0.50% | | | 4/02/2020 | | | | Monthly | | | | 515 | | | | — | |
| | | | |
| 12 | | MainStay VP IQ Hedge Multi-Strategy Portfolio | | The notes to the financial statements are an integral part of,
and should be read in conjunction with, the financial statements. |
| | | | | | | | | | | | | | | | | | | | |
Swap Counterparty | | Reference Obligation | | Floating Rate2 | | Termination
Date(s) | | | Payment Frequency
Paid/
Received | | | Notional Amount Long/ (Short) (000)* | | | Unrealized
Appreciation3 | |
Morgan Stanley & Co. | | Invesco CurrencyShares Euro Currency Trust | | Federal Fund Rate plus 0.50% | | | 9/15/2020 | | | | Monthly | | | $ | 515 | | | $ | — | |
Bank of America Merrill Lynch | | Invesco CurrencyShares Japanese Yen Trust | | 1 month LIBOR plus 0.50% | | | 4/02/2020 | | | | Monthly | | | | 257 | | | | — | |
Morgan Stanley & Co. | | Invesco CurrencyShares Japanese Yen Trust | | Federal Fund Rate plus 0.50% | | | 9/15/2020 | | | | Monthly | | | | 257 | | | | — | |
Bank of America Merrill Lynch | | Invesco DB US Dollar Index Bullish Fund | | 1 month LIBOR plus 0.50% | | | 4/02/2020 | | | | Monthly | | | | 163 | | | | — | |
Morgan Stanley & Co. | | Invesco DB US Dollar Index Bullish Fund | | Federal Fund Rate plus 0.50% | | | 9/15/2020 | | | | Monthly | | | | 163 | | | | — | |
Bank of America Merrill Lynch | | Invesco KBW Bank ETF | | 1 month LIBOR plus 0.50% | | | 4/02/2020 | | | | Monthly | | | | 13 | | | | — | |
Morgan Stanley & Co. | | Invesco KBW Bank ETF | | Federal Fund Rate plus 0.50% | | | 9/15/2020 | | | | Monthly | | | | 13 | | | | — | |
Morgan Stanley & Co. | | Invesco Preferred ETF | | Federal Fund Rate plus 0.50% | | | 9/15/2020 | | | | Monthly | | | | 1 | | | | — | |
Bank of America Merrill Lynch | | Invesco Preferred ETF | | 1 month LIBOR plus 0.50% | | | 4/02/2020 | | | | Monthly | | | | 1 | | | | — | |
Bank of America Merrill Lynch | | Invesco S&P 500 Low Volatiility | | 1 month LIBOR | | | 4/02/2020 | | | | Monthly | | | | (948 | ) | | | — | |
Morgan Stanley & Co. | | Invesco S&P 500 Low Volatiility | | Federal Fund Rate minus 1.38% | | | 9/15/2020 | | | | Monthly | | | | (948 | ) | | | — | |
Bank of America Merrill Lynch | | Invesco Senior Loan ETF | | 1 month LIBOR plus 0.50% | | | 4/02/2020 | | | | Monthly | | | | 880 | | | | — | |
Morgan Stanley & Co. | | Invesco Senior Loan ETF | | Federal Fund Rate plus 0.50% | | | 9/15/2020 | | | | Monthly | | | | 880 | | | | — | |
Bank of America Merrill Lynch | | Invesco Treasury Collateral ETF | | 1 month LIBOR plus 0.50% | | | 4/02/2020 | | | | Monthly | | | | 104 | | | | — | |
Morgan Stanley & Co. | | Invesco Treasury Collateral ETF | | Federal Fund Rate plus 0.50% | | | 9/15/2020 | | | | Monthly | | | | 104 | | | | — | |
Morgan Stanley & Co. | | iPath Series B S&P 500 VIX Short-Term Futures ETN | | Federal Fund Rate plus 0.50% | | | 9/15/2020 | | | | Monthly | | | | 27 | | | | — | |
Bank of America Merrill Lynch | | iPath Series B S&P 500 VIX Short-Term Futures ETN | | 1 month LIBOR plus 0.50% | | | 4/02/2020 | | | | Monthly | | | | 27 | | | | — | |
Bank of America Merrill Lynch | | iShares 0-5 Year High Yield Corporate Bond ETF | | 1 month LIBOR plus 0.50% | | | 4/02/2020 | | | | Monthly | | | | 162 | | | | — | |
Morgan Stanley & Co. | | iShares 0-5 Year High Yield Corporate Bond ETF | | Federal Fund Rate plus 0.50% | | | 9/15/2020 | | | | Monthly | | | | 162 | | | | — | |
Bank of America Merrill Lynch | | iShares 20+ Year Treasury Bond ETF | | 1 month LIBOR | | | 4/02/2020 | | | | Monthly | | | | (571 | ) | | | — | |
Morgan Stanley & Co. | | iShares 20+ Year Treasury Bond ETF | | Federal Fund Rate minus 0.73% | | | 9/15/2020 | | | | Monthly | | | | (571 | ) | | | — | |
Bank of America Merrill Lynch | | iShares 3-7 Year Treasury Bond ETF | | 1 month LIBOR plus 0.50% | | | 4/02/2020 | | | | Monthly | | | | 205 | | | | — | |
Morgan Stanley & Co. | | iShares 3-7 Year Treasury Bond ETF | | Federal Fund Rate plus 0.50% | | | 9/15/2020 | | | | Monthly | | | | 205 | | | | — | |
Bank of America Merrill Lynch | | iShares Broad USD Investment Grade Corporate Bond ETF | | 1 month LIBOR plus 0.50% | | | 4/02/2020 | | | | Monthly | | | | 89 | | | | — | |
Morgan Stanley & Co. | | iShares Broad USD Investment Grade Corporate Bond ETF | | Federal Fund Rate plus 0.50% | | | 9/15/2020 | | | | Monthly | | | | 89 | | | | — | |
Morgan Stanley & Co. | | iShares China Large-Cap ETF | | Federal Fund Rate plus 0.50% | | | 9/15/2020 | | | | Monthly | | | | 770 | | | | — | |
| | | | | | |
The notes to the financial statements are an integral part of,
and should be read in conjunction with, the financial statements. | | | | | 13 | |
Portfolio of InvestmentsJune 30, 2019 (Unaudited) (continued)
| | | | | | | | | | | | | | | | | | | | |
Swap Counterparty | | Reference Obligation | | Floating Rate2 | | Termination
Date(s) | | | Payment Frequency
Paid/
Received | | | Notional Amount Long/ (Short) (000)* | | | Unrealized
Appreciation3 | |
Bank of America Merrill Lynch | | iShares Core MSCI EAFE ETF | | 1 month LIBOR | | | 4/02/2020 | | | | Monthly | | | $ | (55 | ) | | $ | — | |
Morgan Stanley & Co. | | iShares Core MSCI EAFE ETF | | Federal Fund Rate minus 0.35% | | | 9/15/2020 | | | | Monthly | | | | (55 | ) | | | — | |
Bank of America Merrill Lynch | | iShares Core MSCI Emerging Markets ETF | | 1 month LIBOR | | | 4/02/2020 | | | | Monthly | | | | (1,563 | ) | | | — | |
Morgan Stanley & Co. | | iShares Core MSCI Emerging Markets ETF | | Federal Fund Rate minus 0.35% | | | 9/15/2020 | | | | Monthly | | | | (1,563 | ) | | | — | |
Bank of America Merrill Lynch | | iShares Core MSCI Europe ETF | | 1 month LIBOR plus 0.50% | | | 4/02/2020 | | | | Monthly | | | | 14 | | | | — | |
Morgan Stanley & Co. | | iShares Core MSCI Europe ETF | | Federal Fund Rate plus 0.50% | | | 9/15/2020 | | | | Monthly | | | | 14 | | | | — | |
Morgan Stanley & Co. | | iShares Core MSCI Pacific ETF | | Federal Fund Rate plus 0.50% | | | 9/15/2020 | | | | Monthly | | | | 174 | | | | — | |
Bank of America Merrill Lynch | | iShares Core MSCI Pacific ETF | | 1 month LIBOR plus 0.50% | | | 4/02/2020 | | | | Monthly | | | | 174 | | | | — | |
Bank of America Merrill Lynch | | iShares Core S&P U.S. Growth ETF | | 1 month LIBOR plus 0.50% | | | 4/02/2020 | | | | Monthly | | | | 2 | | | | — | |
Morgan Stanley & Co. | | iShares Core S&P U.S. Growth ETF | | Federal Fund Rate plus 0.50% | | | 9/15/2020 | | | | Monthly | | | | 2 | | | | — | |
Bank of America Merrill Lynch | | iShares Core S&P U.S. Value ETF | | 1 month LIBOR | | | 4/02/2020 | | | | Monthly | | | | (291 | ) | | | — | |
Morgan Stanley & Co. | | iShares Core S&P U.S. Value ETF | | Federal Fund Rate minus 5.28% | | | 9/15/2020 | | | | Monthly | | | | (291 | ) | | | — | |
Bank of America Merrill Lynch | | iShares Core US REIT ETF | | 1 month LIBOR | | | 4/02/2020 | | | | Monthly | | | | (9 | ) | | | — | |
Morgan Stanley & Co. | | iShares Core US REIT ETF | | Federal Fund Rate minus 5.38% | | | 9/15/2020 | | | | Monthly | | | | (9 | ) | | | — | |
Bank of America Merrill Lynch | | iShares Edge MSCI Min Vol Emerging Markets ETF | | 1 month LIBOR | | | 4/02/2020 | | | | Monthly | | | | (805 | ) | | | — | |
Morgan Stanley & Co. | | iShares Edge MSCI Min Vol Emerging Markets ETF | | Federal Fund Rate minus 0.35% | | | 9/15/2020 | | | | Monthly | | | | (805 | ) | | | — | |
Bank of America Merrill Lynch | | iShares Edge MSCI Min Vol USA ETF | | 1 month LIBOR | | | 4/02/2020 | | | | Monthly | | | | (2,324 | ) | | | — | |
Morgan Stanley & Co. | | iShares Edge MSCI Min Vol USA ETF | | Federal Fund Rate minus 0.63% | | | 9/15/2020 | | | | Monthly | | | | (2,324 | ) | | | — | |
Bank of America Merrill Lynch | | iShares Edge MSCI USA Momentum Factor ETF | | 1 month LIBOR plus 0.50% | | | 4/02/2020 | | | | Monthly | | | | 86 | | | | — | |
Morgan Stanley & Co. | | iShares Edge MSCI USA Momentum Factor ETF | | Federal Fund Rate plus 0.50% | | | 9/15/2020 | | | | Monthly | | | | 86 | | | | — | |
Bank of America Merrill Lynch | | iShares Floating Rate Bond ETF | | 1 month LIBOR plus 0.50% | | | 4/02/2020 | | | | Monthly | | | | 1,328 | | | | — | |
Morgan Stanley & Co. | | iShares Floating Rate Bond ETF | | Federal Fund Rate plus 0.50% | | | 9/15/2020 | | | | Monthly | | | | 1,328 | | | | — | |
Bank of America Merrill Lynch | | iShares iBoxx High Yield Corporate Bond ETF | | 1 month LIBOR | | | 4/02/2020 | | | | Monthly | | | | (1,187 | ) | | | — | |
Morgan Stanley & Co. | | iShares iBoxx High Yield Corporate Bond ETF | | Federal Fund Rate minus 1.88% | | | 9/15/2020 | | | | Monthly | | | | (1,187 | ) | | | — | |
Bank of America Merrill Lynch | | iShares JP Morgan USD Emerging Markets Bond ETF | | 1 month LIBOR plus 0.50% | | | 4/02/2020 | | | | Monthly | | | | 400 | | | | — | |
Morgan Stanley & Co. | | iShares JP Morgan USD Emerging Markets Bond ETF | | Federal Fund Rate plus 0.50% | | | 9/15/2020 | | | | Monthly | | | | 400 | | | | — | |
| | | | |
| 14 | | MainStay VP IQ Hedge Multi-Strategy Portfolio | | The notes to the financial statements are an integral part of,
and should be read in conjunction with, the financial statements. |
| | | | | | | | | | | | | | | | | | | | |
Swap Counterparty | | Reference Obligation | | Floating Rate2 | | Termination
Date(s) | | | Payment Frequency
Paid/
Received | | | Notional Amount Long/ (Short) (000)* | | | Unrealized
Appreciation3 | |
Morgan Stanley & Co. | | iShares MBS ETF | | Federal Fund Rate plus 0.50% | | | 9/15/2020 | | | | Monthly | | | $ | 365 | | | $ | — | |
Bank of America Merrill Lynch | | iShares MBS ETF | | 1 month LIBOR plus 0.50% | | | 4/02/2020 | | | | Monthly | | | | 365 | | | | — | |
Bank of America Merrill Lynch | | iShares MSCI All Country Asia ex Japan ETF | | 1 month LIBOR plus 0.50% | | | 4/02/2020 | | | | Monthly | | | | 183 | | | | — | |
Morgan Stanley & Co. | | iShares MSCI All Country Asia ex Japan ETF | | Federal Fund Rate plus 0.50% | | | 9/15/2020 | | | | Monthly | | | | 183 | | | | — | |
Morgan Stanley & Co. | | iShares MSCI China ETF | | Federal Fund Rate plus 0.50% | | | 9/15/2020 | | | | Monthly | | | | 594 | | | | — | |
Bank of America Merrill Lynch | | iShares MSCI EAFE Growth ETF | | 1 month LIBOR plus 0.50% | | | 4/02/2020 | | | | Monthly | | | | 46 | | | | — | |
Morgan Stanley & Co. | | iShares MSCI EAFE Growth ETF | | Federal Fund Rate plus 0.50% | | | 9/15/2020 | | | | Monthly | | | | 46 | | | | — | |
Bank of America Merrill Lynch | | iShares MSCI Eurozone ETF | | 1 month LIBOR plus 0.50% | | | 4/02/2020 | | | | Monthly | | | | 26 | | | | — | |
Morgan Stanley & Co. | | iShares MSCI Eurozone ETF | | Federal Fund Rate plus 0.50% | | | 9/15/2020 | | | | Monthly | | | | 26 | | | | — | |
Bank of America Merrill Lynch | | iShares MSCI Japan ETF | | 1 month LIBOR plus 0.50% | | | 4/02/2020 | | | | Monthly | | | | 313 | | | | — | |
Morgan Stanley & Co. | | iShares MSCI Japan ETF | | Federal Fund Rate plus 0.50% | | | 9/15/2020 | | | | Monthly | | | | 313 | | | | — | |
Bank of America Merrill Lynch | | iShares Russell 2000 ETF | | 1 month LIBOR plus 0.50% | | | 4/02/2020 | | | | Monthly | | | | 81 | | | | — | |
Morgan Stanley & Co. | | iShares Russell 2000 ETF | | Federal Fund Rate plus 0.50% | | | 9/15/2020 | | | | Monthly | | | | 81 | | | | — | |
Bank of America Merrill Lynch | | iShares Russell 2000 Growth ETF | | 1 month LIBOR plus 0.50% | | | 4/02/2020 | | | | Monthly | | | | 120 | | | | — | |
Morgan Stanley & Co. | | iShares Russell 2000 Growth ETF | | Federal Fund Rate plus 0.50% | | | 9/15/2020 | | | | Monthly | | | | 120 | | | | — | |
Bank of America Merrill Lynch | | iShares Russell 2000 Value ETF | | 1 month LIBOR | | | 4/02/2020 | | | | Monthly | | | | (1,025 | ) | | | — | |
Morgan Stanley & Co. | | iShares Russell 2000 Value ETF | | Federal Fund Rate minus 0.76% | | | 9/15/2020 | | | | Monthly | | | | (1,025 | ) | | | — | |
Bank of America Merrill Lynch | | iShares S&P Small CAP 600 Value ETF | | 1 month LIBOR | | | 4/02/2020 | | | | Monthly | | | | (708 | ) | | | — | |
Morgan Stanley & Co. | | iShares S&P Small CAP 600 Value ETF | | Federal Fund Rate minus 0.35% | | | 9/15/2020 | | | | Monthly | | | | (708 | ) | | | — | |
Bank of America Merrill Lynch | | iShares S&P Small-Cap 600 Growth ETF | | 1 month LIBOR plus 0.50% | | | 4/02/2020 | | | | Monthly | | | | 73 | | | | — | |
Morgan Stanley & Co. | | iShares S&P Small-Cap 600 Growth ETF | | Federal Fund Rate plus 0.50% | | | 9/15/2020 | | | | Monthly | | | | 73 | | | | — | |
Bank of America Merrill Lynch | | iShares Short Treasury Bond ETF | | 1 month LIBOR plus 0.50% | | | 4/02/2020 | | | | Monthly | | | | 3,924 | | | | — | |
Morgan Stanley & Co. | | iShares Short Treasury Bond ETF | | Federal Fund Rate plus 0.50% | | | 9/15/2020 | | | | Monthly | | | | 3,924 | | | | — | |
Bank of America Merrill Lynch | | iShares Silver Trust | | 1 month LIBOR plus 0.50% | | | 4/02/2020 | | | | Monthly | | | | 144 | | | | — | |
Morgan Stanley & Co. | | iShares Silver Trust | | Federal Fund Rate plus 0.50% | | | 9/15/2020 | | | | Monthly | | | | 144 | | | | — | |
Morgan Stanley & Co. | | iShares U.S. Preferred Stock ETF | | Federal Fund Rate plus 0.50% | | | 9/15/2020 | | | | Monthly | | | | 2 | | | | — | |
Bank of America Merrill Lynch | | iShares U.S. Preferred Stock ETF | | 1 month LIBOR plus 0.50% | | | 4/02/2020 | | | | Monthly | | | | 2 | | | | — | |
| | | | | | |
The notes to the financial statements are an integral part of,
and should be read in conjunction with, the financial statements. | | | | | 15 | |
Portfolio of InvestmentsJune 30, 2019 (Unaudited) (continued)
| | | | | | | | | | | | | | | | | | | | |
Swap Counterparty | | Reference Obligation | | Floating Rate2 | | Termination
Date(s) | | | Payment Frequency
Paid/
Received | | | Notional Amount Long/ (Short) (000)* | | | Unrealized
Appreciation3 | |
Bank of America Merrill Lynch | | Schwab Intermediate-Term U.S. Treasury ETF | | 1 month LIBOR plus 0.50% | | | 4/02/2020 | | | | Monthly | | | $ | 117 | | | $ | — | |
Morgan Stanley & Co. | | Schwab Intermediate-Term U.S. Treasury ETF | | Federal Fund Rate plus 0.50% | | | 9/15/2020 | | | | Monthly | | | | 117 | | | | — | |
Bank of America Merrill Lynch | | Schwab International Small-Cap Equity ETF | | 1 month LIBOR plus 0.50% | | | 4/02/2020 | | | | Monthly | | | | 422 | | | | — | |
Morgan Stanley & Co. | | Schwab International Small-Cap Equity ETF | | Federal Fund Rate plus 0.50% | | | 9/15/2020 | | | | Monthly | | | | 422 | | | | — | |
Bank of America Merrill Lynch | | Schwab U.S. Large Cap Growth ETF | | 1 month LIBOR plus 0.50% | | | 4/02/2020 | | | | Monthly | | | | 2 | | | | — | |
Morgan Stanley & Co. | | Schwab U.S. Large Cap Growth ETF | | Federal Fund Rate plus 0.50% | | | 9/15/2020 | | | | Monthly | | | | 2 | | | | — | |
Bank of America Merrill Lynch | | Schwab U.S. Large Cap Value ETF | | 1 month LIBOR | | | 4/02/2020 | | | | Monthly | | | | (306 | ) | | | — | |
Morgan Stanley & Co. | | Schwab U.S. Large Cap Value ETF | | Federal Fund Rate minus 4.03% | | | 9/15/2020 | | | | Monthly | | | | (306 | ) | | | — | |
Bank of America Merrill Lynch | | Schwab U.S. REIT ETF | | 1 month LIBOR | | | 4/02/2020 | | | | Monthly | | | | (37 | ) | | | — | |
Morgan Stanley & Co. | | Schwab U.S. REIT ETF | | Federal Fund Rate minus 3.38% | | | 9/15/2020 | | | | Monthly | | | | (37 | ) | | | — | |
Bank of America Merrill Lynch | | Schwab US Small-Cap ETF | | 1 month LIBOR plus 0.50% | | | 4/02/2020 | | | | Monthly | | | | 16 | | | | — | |
Morgan Stanley & Co. | | Schwab US Small-Cap ETF | | Federal Fund Rate plus 0.50% | | | 9/15/2020 | | | | Monthly | | | | 16 | | | | — | |
Bank of America Merrill Lynch | | SPDR Blackstone / GSO Senior Loan ETF | | 1 month LIBOR plus 0.50% | | | 4/02/2020 | | | | Monthly | | | | 426 | | | | — | |
Morgan Stanley & Co. | | SPDR Blackstone / GSO Senior Loan ETF | | Federal Fund Rate plus 0.50% | | | 9/15/2020 | | | | Monthly | | | | 426 | | | | — | |
Bank of America Merrill Lynch | | SPDR Bloomberg Barclays 1-3 Month T-Bill ETF | | 1 month LIBOR plus 0.50% | | | 4/02/2020 | | | | Monthly | | | | 1,601 | | | | — | |
Morgan Stanley & Co. | | SPDR Bloomberg Barclays 1-3 Month T-Bill ETF | | Federal Fund Rate plus 0.50% | | | 9/15/2020 | | | | Monthly | | | | 1,601 | | | | — | |
Bank of America Merrill Lynch | | SPDR Bloomberg Barclays Convertible Securities ETF | | 1 month LIBOR | | | 4/02/2020 | | | | Monthly | | | | (328 | ) | | | — | |
Morgan Stanley & Co. | | SPDR Bloomberg Barclays Convertible Securities ETF | | Federal Fund Rate minus 0.35% | | | 9/15/2020 | | | | Monthly | | | | (328 | ) | | | — | |
Bank of America Merrill Lynch | | SPDR Bloomberg Barclays Emerging Markets Local Bond ETF | | 1 month LIBOR plus 0.50% | | | 4/02/2020 | | | | Monthly | | | | 57 | | | | — | |
Morgan Stanley & Co. | | SPDR Bloomberg Barclays Emerging Markets Local Bond ETF | | Federal Fund Rate plus 0.50% | | | 9/15/2020 | | | | Monthly | | | | 57 | | | | — | |
Bank of America Merrill Lynch | | SPDR Bloomberg Barclays High Yield Bond ETF | | 1 month LIBOR | | | 4/02/2020 | | | | Monthly | | | | (670 | ) | | | — | |
Morgan Stanley & Co. | | SPDR Bloomberg Barclays High Yield Bond ETF | | Federal Fund Rate minus 1.13% | | | 9/15/2020 | | | | Monthly | | | | (670 | ) | | | — | |
Bank of America Merrill Lynch | | SPDR Bloomberg Barclays Invest | | 1 month LIBOR plus 0.50% | | | 4/02/2020 | | | | Monthly | | | | 530 | | | | — | |
Morgan Stanley & Co. | | SPDR Bloomberg Barclays Invest | | Federal Fund Rate plus 0.50% | | | 9/15/2020 | | | | Monthly | | | | 530 | | | | — | |
| | | | |
| 16 | | MainStay VP IQ Hedge Multi-Strategy Portfolio | | The notes to the financial statements are an integral part of,
and should be read in conjunction with, the financial statements. |
| | | | | | | | | | | | | | | | | | | | |
Swap Counterparty | | Reference Obligation | | Floating Rate2 | | Termination
Date(s) | | | Payment Frequency
Paid/
Received | | | Notional Amount Long/ (Short) (000)* | | | Unrealized
Appreciation3 | |
Bank of America Merrill Lynch | | SPDR Bloomberg Barclays Short Term High Yield Bond ETF | | 1 month LIBOR plus 0.50% | | | 4/02/2020 | | | | Monthly | | | $ | 175 | | | $ | — | |
Morgan Stanley & Co. | | SPDR Bloomberg Barclays Short Term High Yield Bond ETF | | Federal Fund Rate plus 0.50% | | | 9/15/2020 | | | | Monthly | | | | 175 | | | | — | |
Bank of America Merrill Lynch | | SPDR Dow Jones International Real Estate ETF | | 1 month LIBOR | | | 4/02/2020 | | | | Monthly | | | | (1,503 | ) | | | — | |
Morgan Stanley & Co. | | SPDR Dow Jones International Real Estate ETF | | Federal Fund Rate minus 0.68% | | | 9/15/2020 | | | | Monthly | | | | (1,503 | ) | | | — | |
Bank of America Merrill Lynch | | SPDR Gold MiniShares Trust | | 1 month LIBOR | | | 4/02/2020 | | | | Monthly | | | | (12 | ) | | | — | |
Morgan Stanley & Co. | | SPDR Gold MiniShares Trust | | Federal Fund Rate minus 2.78% | | | 9/15/2020 | | | | Monthly | | | | (12 | ) | | | — | |
Bank of America Merrill Lynch | | SPDR Gold Shares | | 1 month LIBOR | | | 4/02/2020 | | | | Monthly | | | | (543 | ) | | | — | |
Morgan Stanley & Co. | | SPDR Gold Shares | | Federal Fund Rate minus 0.35% | | | 9/15/2020 | | | | Monthly | | | | (543 | ) | | | — | |
Bank of America Merrill Lynch | | SPDR Portfolio Long Term Treasury ETF | | 1 month LIBOR | | | 4/02/2020 | | | | Monthly | | | | (78 | ) | | | — | |
Morgan Stanley & Co. | | SPDR Portfolio Long Term Treasury ETF | | Federal Fund Rate minus 3.38% | | | 9/15/2020 | | | | Monthly | | | | (78 | ) | | | — | |
Bank of America Merrill Lynch | | SPDR Portfolio S&P 500 Growth ETF | | 1 month LIBOR plus 0.50% | | | 4/02/2020 | | | | Monthly | | | | 2 | | | | — | |
Morgan Stanley & Co. | | SPDR Portfolio S&P 500 Growth ETF | | Federal Fund Rate plus 0.50% | | | 9/15/2020 | | | | Monthly | | | | 2 | | | | — | |
Bank of America Merrill Lynch | | SPDR Portfolio S&P 500 Value ETF | | 1 month LIBOR | | | 4/02/2020 | | | | Monthly | | | | (143 | ) | | | — | |
Morgan Stanley & Co. | | SPDR Portfolio S&P 500 Value ETF | | Federal Fund Rate minus 9.88% | | | 9/15/2020 | | | | Monthly | | | | (143 | ) | | | — | |
Bank of America Merrill Lynch | | SPDR Portfolio Short Term Corporate Bond ETF | | 1 month LIBOR plus 0.50% | | | 4/02/2020 | | | | Monthly | | | | 102 | | | | — | |
Morgan Stanley & Co. | | SPDR Portfolio Short Term Corporate Bond ETF | | Federal Fund Rate plus 0.50% | | | 9/15/2020 | | | | Monthly | | | | 102 | | | | — | |
Morgan Stanley & Co. | | SPDR S&P Bank ETF | | Federal Fund Rate plus 0.50% | | | 9/15/2020 | | | | Monthly | | | | 42 | | | | — | |
Bank of America Merrill Lynch | | SPDR S&P Bank ETF | | 1 month LIBOR plus 0.50% | | | 4/02/2020 | | | | Monthly | | | | 42 | | | | — | |
Morgan Stanley & Co. | | SPDR S&P China ETF | | Federal Fund Rate plus 0.50% | | | 9/15/2020 | | | | Monthly | | | | 178 | | | | — | |
Bank of America Merrill Lynch | | SPDR S&P Emerging Markets Small Cap ETF | | 1 month LIBOR plus 0.50% | | | 4/02/2020 | | | | Monthly | | | | 458 | | | | — | |
Morgan Stanley & Co. | | SPDR S&P Emerging Markets Small Cap ETF | | Federal Fund Rate plus 0.50% | | | 9/15/2020 | | | | Monthly | | | | 458 | | | | — | |
Morgan Stanley & Co. | | Technology Select Sector SPDR Fund | | Federal Fund Rate minus 0.35% | | | 9/15/2020 | | | | Monthly | | | | (48 | ) | | | — | |
Bank of America Merrill Lynch | | VanEck Vectors High-Yield Municipal Index ETF | | 1 month LIBOR plus 0.50% | | | 4/02/2020 | | | | Monthly | | | | 42 | | | | — | |
Morgan Stanley & Co. | | VanEck Vectors High-Yield Municipal Index ETF | | Federal Fund Rate plus 0.50% | | | 9/15/2020 | | | | Monthly | | | | 42 | | | | — | |
Bank of America Merrill Lynch | | VanEck Vectors J.P. Morgan EM Local Currency Bond ETF | | 1 month LIBOR plus 0.50% | | | 4/02/2020 | | | | Monthly | | | | 369 | | | | — | |
| | | | | | |
The notes to the financial statements are an integral part of,
and should be read in conjunction with, the financial statements. | | | | | 17 | |
Portfolio of InvestmentsJune 30, 2019 (Unaudited) (continued)
| | | | | | | | | | | | | | | | | | | | |
Swap Counterparty | | Reference Obligation | | Floating Rate2 | | Termination
Date(s) | | | Payment Frequency
Paid/
Received | | | Notional Amount Long/ (Short) (000)* | | | Unrealized
Appreciation3 | |
Morgan Stanley & Co. | | VanEck Vectors J.P. Morgan EM Local Currency Bond ETF | | Federal Fund Rate plus 0.50% | | | 9/15/2020 | | | | Monthly | | | $ | 369 | | | $ | — | |
Bank of America Merrill Lynch | | Vanguard Emerging Markets Government Bond ETF | | 1 month LIBOR plus 0.50% | | | 4/02/2020 | | | | Monthly | | | | 35 | | | | — | |
Morgan Stanley & Co. | | Vanguard Emerging Markets Government Bond ETF | | Federal Fund Rate plus 0.50% | | | 9/15/2020 | | | | Monthly | | | | 35 | | | | — | |
Bank of America Merrill Lynch | | Vanguard FTSE All World ex-U.S. Small-Cap ETF | | 1 month LIBOR plus 0.50% | | | 4/02/2020 | | | | Monthly | | | | 1,036 | | | | — | |
Morgan Stanley & Co. | | Vanguard FTSE All World ex-U.S. Small-Cap ETF | | Federal Fund Rate plus 0.50% | | | 9/15/2020 | | | | Monthly | | | | 1,036 | | | | — | |
Bank of America Merrill Lynch | | Vanguard FTSE Developed Markets ETF | | 1 month LIBOR | | | 4/02/2020 | | | | Monthly | | | | (61 | ) | | | — | |
Morgan Stanley & Co. | | Vanguard FTSE Developed Markets ETF | | Federal Fund Rate minus 0.35% | | | 9/15/2020 | | | | Monthly | | | | (61 | ) | | | — | |
Bank of America Merrill Lynch | | Vanguard FTSE Emerging Markets ETF | | 1 month LIBOR | | | 4/02/2020 | | | | Monthly | | | | (1,699 | ) | | | — | |
Morgan Stanley & Co. | | Vanguard FTSE Emerging Markets ETF | | Federal Fund Rate minus 0.35% | | | 9/15/2020 | | | | Monthly | | | | (1,699 | ) | | | — | |
Bank of America Merrill Lynch | | Vanguard FTSE Europe ETF | | 1 month LIBOR plus 0.50% | | | 4/02/2020 | | | | Monthly | | | | 55 | | | | — | |
Morgan Stanley & Co. | | Vanguard FTSE Europe ETF | | Federal Fund Rate plus 0.50% | | | 9/15/2020 | | | | Monthly | | | | 55 | | | | — | |
Bank of America Merrill Lynch | | Vanguard FTSE Pacific ETF | | 1 month LIBOR plus 0.50% | | | 4/02/2020 | | | | Monthly | | | | 46 | | | | — | |
Morgan Stanley & Co. | | Vanguard FTSE Pacific ETF | | Federal Fund Rate plus 0.50% | | | 9/15/2020 | | | | Monthly | | | | 46 | | | | — | |
Bank of America Merrill Lynch | | Vanguard Growth ETF | | 1 month LIBOR plus 0.50% | | | 4/02/2020 | | | | Monthly | | | | 12 | | | | — | |
Morgan Stanley & Co. | | Vanguard Growth ETF | | Federal Fund Rate plus 0.50% | | | 9/15/2020 | | | | Monthly | | | | 12 | | | | — | |
Bank of America Merrill Lynch | | Vanguard Intermediate-Term Corporate Bond ETF | | 1 month LIBOR plus 0.50% | | | 4/02/2020 | | | | Monthly | | | | 1,555 | | | | — | |
Morgan Stanley & Co. | | Vanguard Intermediate-Term Corporate Bond ETF | | Federal Fund Rate plus 0.50% | | | 9/15/2020 | | | | Monthly | | | | 1,555 | | | | — | |
Bank of America Merrill Lynch | | Vanguard Intermediate-Term Treasury ETF | | 1 month LIBOR plus 0.50% | | | 4/02/2020 | | | | Monthly | | | | 110 | | | | — | |
Morgan Stanley & Co. | | Vanguard Intermediate-Term Treasury ETF | | Federal Fund Rate plus 0.50% | | | 9/15/2020 | | | | Monthly | | | | 110 | | | | — | |
Bank of America Merrill Lynch | | Vanguard Long-Term Treasury ETF | | 1 month LIBOR | | | 4/02/2020 | | | | Monthly | | | | (43 | ) | | | — | |
Morgan Stanley & Co. | | Vanguard Long-Term Treasury ETF | | Federal Fund Rate minus 0.35% | | | 9/15/2020 | | | | Monthly | | | | (43 | ) | | | — | |
Bank of America Merrill Lynch | | Vanguard Mortgage-Backed Securities ETF | | 1 month LIBOR plus 0.50% | | | 4/02/2020 | | | | Monthly | | | | 197 | | | | — | |
Morgan Stanley & Co. | | Vanguard Mortgage-Backed Securities ETF | | Federal Fund Rate plus 0.50% | | | 9/15/2020 | | | | Monthly | | | | 197 | | | | — | |
Bank of America Merrill Lynch | | Vanguard Real Estate ETF | | 1 month LIBOR | | | 4/02/2020 | | | | Monthly | | | | (231 | ) | | | — | |
Morgan Stanley & Co. | | Vanguard Real Estate ETF | | Federal Fund Rate minus 0.35% | | | 9/15/2020 | | | | Monthly | | | | (231 | ) | | | — | |
Bank of America Merrill Lynch | | Vanguard Short-Term Corporate Bond ETF | | 1 month LIBOR plus 0.50% | | | 4/02/2020 | | | | Monthly | | | | 450 | | | | — | |
| | | | |
| 18 | | MainStay VP IQ Hedge Multi-Strategy Portfolio | | The notes to the financial statements are an integral part of,
and should be read in conjunction with, the financial statements. |
| | | | | | | | | | | | | | | | | | | | |
Swap Counterparty | | Reference Obligation | | Floating Rate2 | | Termination
Date(s) | | | Payment Frequency
Paid/
Received | | | Notional Amount Long/ (Short) (000)* | | | Unrealized
Appreciation3 | |
Morgan Stanley & Co. | | Vanguard Short-Term Corporate Bond ETF | | Federal Fund Rate plus 0.50% | | | 9/15/2020 | | | | Monthly | | | $ | 450 | | | $ | — | |
Bank of America Merrill Lynch | | Vanguard Small-Cap ETF | | 1 month LIBOR plus 0.50% | | | 4/02/2020 | | | | Monthly | | | | 49 | | | | — | |
Morgan Stanley & Co. | | Vanguard Small-Cap ETF | | Federal Fund Rate plus 0.50% | | | 9/15/2020 | | | | Monthly | | | | 49 | | | | — | |
Bank of America Merrill Lynch | | Vanguard Small-Cap Growth ETF | | 1 month LIBOR plus 0.50% | | | 4/02/2020 | | | | Monthly | | | | 118 | | | | — | |
Morgan Stanley & Co. | | Vanguard Small-Cap Growth ETF | | Federal Fund Rate plus 0.50% | | | 9/15/2020 | | | | Monthly | | | | 118 | | | | — | |
Bank of America Merrill Lynch | | Vanguard Small-Cap Value ETF | | 1 month LIBOR | | | 4/02/2020 | | | | Monthly | | | | (1,547 | ) | | | — | |
Morgan Stanley & Co. | | Vanguard Small-Cap Value ETF | | Federal Fund Rate minus 1.38% | | | 9/15/2020 | | | | Monthly | | | | (1,547 | ) | | | — | |
Morgan Stanley & Co. | | Vanguard Value ETF | | Federal Fund Rate minus 0.88% | | | 9/15/2020 | | | | Monthly | | | | (2,539 | ) | | | — | |
Bank of America Merrill Lynch | | Vanguard Value ETF | | 1 month LIBOR | | | 4/02/2020 | | | | Monthly | | | | (2,539 | ) | | | — | |
Bank of America Merrill Lynch | | WisdomTree Emerging Markets Local Debt Fund | | 1 month LIBOR plus 0.50% | | | 4/02/2020 | | | | Monthly | | | | 14 | | | | — | |
Morgan Stanley & Co. | | WisdomTree Emerging Markets Local Debt Fund | | Federal Fund Rate plus 0.50% | | | 9/15/2020 | | | | Monthly | | | | 14 | | | | — | |
Bank of America Merrill Lynch | | Xtrackers MSCI EAFE Hedged Equity ETF | | 1 month LIBOR plus 0.50% | | | 4/02/2020 | | | | Monthly | | | | 211 | | | | — | |
Morgan Stanley & Co. | | Xtrackers MSCI EAFE Hedged Equity ETF | | Federal Fund Rate plus 0.50% | | | 9/15/2020 | | | | Monthly | | | | 211 | | | | — | |
Bank of America Merrill Lynch | | Xtrackers MSCI Europe Hedged Equity ETF | | 1 month LIBOR plus 0.50% | | | 4/02/2020 | | | | Monthly | | | | 470 | | | | — | |
Morgan Stanley & Co. | | Xtrackers MSCI Europe Hedged Equity ETF | | Federal Fund Rate plus 0.50% | | | 9/15/2020 | | | | Monthly | | | | 470 | | | | — | |
Bank of America Merrill Lynch | | Xtrackers MSCI Japan Hedged Equity ETF | | 1 month LIBOR plus 0.50% | | | 4/02/2020 | | | | Monthly | | | | 333 | | | | — | |
Morgan Stanley & Co. | | Xtrackers MSCI Japan Hedged Equity ETF | | Federal Fund Rate plus 0.50% | | | 9/15/2020 | | | | Monthly | | | | 333 | | | | — | |
Morgan Stanley & Co. | | Xtrackers USD High Yield Corporate Bond ETF | | Federal Fund Rate minus 0.35% | | | 9/15/2020 | | | | Monthly | | | | (227 | ) | | | — | |
Bank of America Merrill Lynch | | Xtrackers USD High Yield Corporate Bond ETF | | 1 month LIBOR | | | 4/02/2020 | | | | Monthly | | | | (227 | ) | | | — | |
| | | | | | | | | | | | | | | $ | 1,048 | | | $ | — | |
| 1. | As of June 30, 2019, cash in the amount of $460,000 was on deposit with brokers for OTC swap contracts. |
| 2. | Portfolio pays or receives the floating rate and receives or pays the total return of the reference entity. |
| 3. | Reflects the value at reset date as of June 30, 2019. |
| * | Notional amounts reflected as a positive value indicate a long position held by the Portfolio or Index and a negative value indicates a short position. |
| | | | | | |
The notes to the financial statements are an integral part of,
and should be read in conjunction with, the financial statements. | | | | | 19 | |
Portfolio of InvestmentsJune 30, 2019 (Unaudited) (continued)
The following abbreviations are used in the preceding pages:
BRIC—Brazil, Russia, India and China
DB—Deutsche Bank
EAFE—Europe, Australasia and Far East
EM—Emerging Markets
ETF—Exchange-Traded Fund
ETN—Exchange-Traded Note
FTSE—Financial Times Stock Exchange
KBW—Keefe, Bruyette & Woods
LIBOR—London Interbank Offered Rate
MBS—Mortgage-Backed Security
MSCI—Morgan Stanley Capital International
SPDR—Standard & Poor’s Depositary Receipt
USD—United States Dollar
VIX—CBOE Volatility Index
The following is a summary of the fair valuations according to the inputs used as of June 30, 2019, for valuing the Portfolio’s assets:
| | | | | | | | | | | | | | | | |
Description | | Quoted
Prices in
Active
Markets for
Identical
Assets
(Level 1) | | | Significant
Other
Observable
Inputs
(Level 2) | | | Significant
Unobservable
Inputs
(Level 3) | | | Total | |
| | | | |
Asset Valuation Inputs | | | | | | | | | | | | | | | | |
| Investments in Securities (a) | | | | | | | | | | | | | | | | |
| Exchange-Traded Funds | | $ | 379,369,192 | | | $ | — | | | $ | — | | | $ | 379,369,192 | |
| Exchange-Traded Notes | | | 470,860 | | | | — | | | | — | | | | 470,860 | |
| Exchange-Traded Vehicles | | | 22,831,818 | | | | — | | | | — | | | | 22,831,818 | |
| Short-Term Investments | | | | | | | | | | | | | | | | |
Affiliated Investment Company | | | 1,760,328 | | | | — | | | | — | | | | 1,760,328 | |
Unaffiliated Investment Company | | | 17,038,834 | | | | — | | | | — | | | | 17,038,834 | |
| | | | | | | | | | | | | | | | |
| TotalShort-Term Investments | | | 18,799,162 | | | | — | | | | — | | | | 18,799,162 | |
| | | | | | | | | | | | | | | | |
| Total Investments in Securities | | $ | 421,471,032 | | | $ | — | | | $ | — | | | $ | 421,471,032 | |
| | | | | | | | | | | | | | | | |
| (a) | For a complete listing of investments and their industries, see the Portfolio of Investments. |
| | | | |
| 20 | | MainStay VP IQ Hedge Multi-Strategy Portfolio | | The notes to the financial statements are an integral part of,
and should be read in conjunction with, the financial statements. |
Statement of Assets and Liabilitiesas of June 30, 2019 (Unaudited)
| | | | |
| Assets | | | | |
Investment in unaffiliated securities, at value
(identified cost $413,712,164)
including securities on loan of $47,713,845 | | $ | 419,710,704 | |
Investment in affiliated investment company, at value (identified cost $1,760,328) | | | 1,760,328 | |
Cash collateral on deposit at broker for swap contracts | | | 460,000 | |
Cash | | | 294,339 | |
Receivables: | | | | |
Dividends | | | 703,160 | |
Portfolio shares sold | | | 324,592 | |
Securities lending | | | 72,532 | |
Prepaid offering costs | | | 2,134 | |
| | | | |
Total assets | | | 423,327,789 | |
| | | | |
| |
| Liabilities | | | | |
Due to custodian | | | 42 | |
Cash collateral received for securities on loan | | | 17,038,834 | |
Payables: | | | | |
Dividends and interest on OTC swaps contracts | | | 1,038,424 | |
Manager (See Note 3) | | | 110,849 | |
Custodian | | | 100,291 | |
Shareholder communication | | | 82,261 | |
NYLIFE Distributors (See Note 3) | | | 80,545 | |
Professional fees | | | 54,857 | |
Portfolio shares redeemed | | | 41,320 | |
Offering costs | | | 5,000 | |
Trustees | | | 570 | |
Accrued expenses | | | 7,769 | |
| | | | |
Total liabilities | | | 18,560,762 | |
| | | | |
Net assets | | $ | 404,767,027 | |
| | | | |
| |
| Composition of Net Assets | | | | |
Shares of beneficial interest outstanding (par value of $.001 per share) unlimited number of shares authorized | | $ | 47,087 | |
Additional paid-in capital | | | 467,388,655 | |
| | | | |
| | | 467,435,742 | |
Total distributable earnings (loss) | | | (62,668,715 | ) |
| | | | |
Net assets | | $ | 404,767,027 | |
| | | | |
| | | | |
Initial Class | | | | |
Net assets applicable to outstanding shares | | $ | 10,159,979 | |
| | | | |
Shares of beneficial interest outstanding | | | 1,176,165 | |
| | | | |
Net asset value per share outstanding | | $ | 8.64 | |
| | | | |
Service Class | | | | |
Net assets applicable to outstanding shares | | $ | 394,607,048 | |
| | | | |
Shares of beneficial interest outstanding | | | 45,910,476 | |
| | | | |
Net asset value per share outstanding | | $ | 8.60 | |
| | | | |
| | | | | | |
The notes to the financial statements are an integral part of,
and should be read in conjunction with, the financial statements. | | | | | 21 | |
Statement of Operationsfor the six months ended June 30, 2019 (Unaudited)
| | | | |
| Investment Income (Loss) | | | | |
Income | | | | |
Dividends-unaffiliated | | $ | 5,097,876 | |
Securities lending | | | 239,813 | |
Dividends-affiliated | | | 37,423 | |
| | | | |
Total income | | | 5,375,112 | |
| | | | |
Expenses | | | | |
Manager (See Note 3) | | | 1,499,895 | |
Distribution/Service—Service Class (See Note 3) | | | 487,991 | |
Custodian | | | 174,239 | |
Shareholder communication | | | 77,875 | |
Professional fees | | | 23,662 | |
Trustees | | | 5,099 | |
Offering (See Note 2) | | | 2,637 | |
Miscellaneous | | | 13,152 | |
| | | | |
Total expenses before waiver/reimbursement | | | 2,284,550 | |
Expense waiver/reimbursement from Manager (See Note 3) | | | (396,659 | ) |
| | | | |
Net expenses | | | 1,887,891 | |
| | | | |
Net investment income (loss) | | | 3,487,221 | |
| | | | |
|
| Realized and Unrealized Gain (Loss) on Investments, Swap Contracts and Foreign Currency Transactions | |
Net realized gain (loss) on: | | | | |
Unaffiliated investment transactions | | | 3,583,596 | |
Swap transactions | | | (3,185,397 | ) |
Foreign currency transactions | | | (7,479 | ) |
| | | | |
Net realized gain (loss) on investments, swap transactions and foreign currency transactions | | | 390,720 | |
| | | | |
Net change in unrealized appreciation (depreciation) on: | | | | |
Unaffiliated investments | | | 15,846,262 | |
Translation of other assets and liabilities in foreign currencies | | | 7,100 | |
| | | | |
Net change in unrealized appreciation (depreciation) on investments and foreign currency transactions | | | 15,853,362 | |
| | | | |
Net realized and unrealized gain (loss) on investments, swap transactions and foreign currency transactions | | | 16,244,082 | |
| | | | |
Net increase (decrease) in net assets resulting from operations | | $ | 19,731,303 | |
| | | | |
| | | | |
| 22 | | MainStay VP IQ Hedge Multi-Strategy Portfolio | | The notes to the financial statements are an integral part of,
and should be read in conjunction with, the financial statements. |
Statements of Changes in Net Assets
for the six months ended June 30, 2019 (Unaudited) and the year ended December 31, 2018
| | | | | | | | |
| | | 2019 | | | 2018† | |
| Increase (Decrease) in Net Assets | | | | | |
Operations: | | | | | | | | |
Net investment income (loss) | | $ | 3,487,221 | | | $ | (352,297 | ) |
Net realized gain (loss) on investments, investments sold short, futures contracts, swap contracts and foreign currency transactions | | | 390,720 | | | | (20,979,140 | ) |
Net change in unrealized appreciation (depreciation) on investments, investments sold short, futures contracts, swap contracts and foreign currency transactions | | | 15,853,362 | | | | (15,928,954 | ) |
| | | | |
Net increase (decrease) in net assets resulting from operations | | | 19,731,303 | | | | (37,260,391 | ) |
| | | | |
Distributions to shareholders: | | | | | | | | |
Initial Class | | | — | | | | (180,327 | ) |
Service Class | | | — | | | | (2,734,766 | ) |
| | | | |
Total distributions to shareholders | | | — | | | | (2,915,093 | ) |
| | | | |
Capital share transactions: | | | | | | | | |
Net proceeds from sale of shares | | | 6,736,917 | | | | 471,625,822 | |
Net asset value of shares issued in connection with the acquisition of MainStay VP Absolute Return Multi-Strategy Portfolio | | | — | | | | 1,472,556 | |
Net asset value of shares issued to shareholders in reinvestment of dividends and distributions | | | — | | | | 2,915,093 | |
Cost of shares redeemed | | | (21,854,362 | ) | | | (609,037,844 | ) |
| | | | |
Increase (decrease) in net assets derived from capital share transactions | | | (15,117,445 | ) | | | (133,024,373 | ) |
| | | | |
Net increase (decrease) in net assets | | | 4,613,858 | | | | (173,199,857 | ) |
| | |
| Net Assets | | | | | | | | |
Beginning of period | | | 400,153,169 | | | | 573,353,026 | |
| | | | |
End of period | | $ | 404,767,027 | | | $ | 400,153,169 | |
| | | | |
| † | Consolidated Statement of Changes in Net Assets for the period January 1, 2018 to November 30, 2018. |
| | | | | | |
The notes to the financial statements are an integral part of,
and should be read in conjunction with, the financial statements. | | | | | 23 | |
Financial Highlightsselected per share data and ratios
| | | | | | | | | | | | | | | | | | | | | | | | | | | | |
| | | |
| | | Six months
ended June 30, | | | | | | Year ended December 31, | |
| | | | | | | |
| Initial Class | | 2019* | | | | | | 2018† | | | 2017† | | | 2016† | | | 2015 | | | 2014 | |
| | | | | | | |
Net asset value at beginning of period | | $ | 8.22 | | | | | | | $ | 8.92 | | | $ | 9.04 | | | $ | 9.03 | | | $ | 9.82 | | | $ | 11.15 | |
| | | | | | | | | | | | | | | | | | | | | | | | | | | | |
| | | | | | | |
Net investment income (loss) (a) | | | 0.09 | | | | | | | | (0.05 | ) | | | (0.08 | ) | | | (0.10 | ) | | | (0.06 | ) | | | (0.08 | ) |
| | | | | | | |
Net realized and unrealized gain (loss) on investments | | | 0.33 | | | | | | | | (0.55 | ) | | | 0.16 | | | | 0.03 | | | | (0.72 | ) | | | (1.25 | ) |
| | | | | | | |
Net realized and unrealized gain (loss) on foreign currency transactions | | | (0.00 | )‡ | | | | | | | 0.00 | ‡ | | | (0.10 | ) | | | 0.08 | | | | (0.01 | ) | | | (0.00 | )‡ |
| | | | | | | | | | | | | | | | | | | | | | | | | | | | |
| | | | | | | |
Total from investment operations | | | 0.42 | | | | | | | | (0.60 | ) | | | (0.02 | ) | | | 0.01 | | | | (0.79 | ) | | | (1.33 | ) |
| | | | | | | | | | | | | | | | | | | | | | | | | | | | |
| | | | | | | |
| Less dividends: | | | | | | | | | | | | | | | | | | | | | | | | | | | | |
| | | | | | | |
From net investment income | | | — | | | | | | | | (0.10 | ) | | | (0.10 | ) | | | — | | | | — | | | | — | |
| | | | | | | | | | | | | | | | | | | | | | | | | | | | |
| | | | | | | |
Net asset value at end of period | | $ | 8.64 | | | | | | | $ | 8.22 | | | $ | 8.92 | | | $ | 9.04 | | | $ | 9.03 | | | $ | 9.82 | |
| | | | | | | | | | | | | | | | | | | | | | | | | | | | |
| | | | | | | |
Total investment return (b) | | | 5.24 | %(c) | | | | | | | (6.88 | %) | | | (0.25 | %) | | | 0.11 | % (c) | | | (8.04 | %) | | | (11.93 | %) |
| | | | | | | |
| Ratios (to average net assets)/Supplemental Data: | | | | | | | | | | | | | | | | | | | | | | | | | | | | |
| | | | | | | |
Net investment income (loss) | | | 2.02 | %†† | | | | | | | (0.53 | %) | | | (0.93 | %) | | | (1.11 | %) | | | (0.59 | %) | | | (0.78 | %) |
| | | | | | | |
Expenses (before waiver/
reimbursement) (d)(e) | | | 0.90 | %†† | | | | | | | 2.96 | % | | | 2.63 | % | | | 2.63 | % | | | 2.00 | % | | | 2.21 | % |
| | | | | | | |
Portfolio turnover rate | | | 80 | % | | | | | | | 450 | % | | | 185 | % | | | 267 | % | | | 115 | % | | | 113 | % |
| | | | | | | |
Net assets at end of period (in 000’s) | | $ | 10,160 | | | | | | | $ | 9,059 | | | $ | 149,753 | | | $ | 201,252 | | | $ | 3,051 | | | $ | 100,126 | |
| ‡ | Less than one cent per share. |
| † | Consolidated Financial Highlights for the periods January 1, 2018 to November 30, 2018, January 1, 2017 to December 31, 2017 and January 9, 2016 to December 31, 2016. |
| (a) | Per share data based on average shares outstanding during the period. |
| (b) | Total return does not reflect any deduction of sales charges, mortality and expense charges, contract charges or administrative charges. For periods of less than one year, total return is not annualized. |
| (c) | Total investment return may reflect adjustments to conform to generally accepted accounting principles. |
| (d) | In addition to the fees and expenses which the Portfolio bears directly, it also indirectly bears a pro-rata share of the fees and expenses of the underlying funds in which it invests. Such indirect expenses are not included in the above expense ratios. |
| (e) | The expense ratios presented below exclude short sales expense: |
| | | | | | | | | | |
Period Ended | | Net Expenses
(excluding short
sale expenses) | | Short Sale
Expenses |
| June 30, 2019 | | | | 0.70 | %*†† | | | | — | |
| December 31, 2018 | | | | 1.43 | % | | | | 1.28 | % |
| December 31, 2017 | | | | 1.43 | % | | | | 1.05 | % |
| December 31, 2016 | | | | 1.46 | % | | | | 0.95 | % |
| December 31, 2015 | | | | 1.47 | % | | | | 0.53 | % |
| December 31, 2014 | | | | 1.46 | % | | | | 0.75 | % |
| | | | |
| 24 | | MainStay VP IQ Hedge Multi-Strategy Portfolio | | The notes to the financial statements are an integral part of,
and should be read in conjunction with, the financial statements. |
Financial Highlightsselected per share data and ratios
| | | | | | | | | | | �� | | | | | | | | | | | | | | | | | |
| | | |
| | | Six months
ended
June 30, | | | | | | Year ended December 31, | |
| | | | | | | |
| Service Class | | 2019* | | | | | | 2018† | | | 2017† | | | 2016† | | | 2015 | | | 2014 | |
| | | | | | | |
Net asset value at beginning of period | | $ | 8.18 | | | | | | | $ | 8.87 | | | $ | 8.99 | | | $ | 9.00 | | | $ | 9.79 | | | $ | 11.14 | |
| | | | | | | | | | | | | | | | | | | | | | | | | | | | |
| | | | | | | |
Net investment income (loss) (a) | | | 0.07 | | | | | | | | (0.00 | )‡ | | | (0.11 | ) | | | (0.12 | ) | | | (0.11 | ) | | | (0.11 | ) |
| | | | | | | |
Net realized and unrealized gain (loss) on investments | | | 0.35 | | | | | | | | (0.63 | ) | | | 0.18 | | | | 0.03 | | | | (0.67 | ) | | | (1.24 | ) |
| | | | | | | |
Net realized and unrealized gain (loss) on foreign currency transactions | | | (0.00 | )‡ | | | | | | | 0.00 | ‡ | | | (0.11 | ) | | | 0.08 | | | | (0.01 | ) | | | (0.00 | )‡ |
| | | | | | | | | | | | | | | | | | | | | | | | | | | | |
| | | | | | | |
Total from investment operations | | | 0.42 | | | | | | | | (0.63 | ) | | | (0.04 | ) | | | (0.01 | ) | | | (0.79 | ) | | | (1.35 | ) |
| | | | | | | | | | | | | | | | | | | | | | | | | | | | |
| | | | | | | |
| Less dividends: | | | | | | | | | | | | | | | | | | | | | | | | | | | | |
| | | | | | | |
From net investment income | | | — | | | | | | | | (0.06 | ) | | | (0.08 | ) | | | — | | | | — | | | | — | |
| | | | | | | | | | | | | | | | | | | | | | | | | | | | |
| | | | | | | |
Net asset value at end of period | | $ | 8.60 | | | | | | | $ | 8.18 | | | $ | 8.87 | | | $ | 8.99 | | | $ | 9.00 | | | $ | 9.79 | |
| | | | | | | | | | | | | | | | | | | | | | | | | | | | |
| | | | | | | |
Total investment return (b) | | | 5.13 | %(c) | | | | | | | (7.14 | %) | | | (0.51 | %) | | | (0.11 | %)(c) | | | (8.07 | %)(c) | | | (12.12 | %)(c) |
| | | | | | | |
| Ratios (to average net assets)/Supplemental Data: | | | | | | | | | | | | | | | | | | | | | | | | | | | | |
| | | | | | | |
Net investment income (loss) | | | 1.74 | %†† | | | | | | | 0.03 | % | | | (1.20 | %) | | | (1.36 | %) | | | (1.15 | %) | | | (1.04 | %) |
| | | | | | | |
Expenses (before waiver/
reimbursement) (d)(e) | | | 1.15 | %†† | | | | | | | 2.84 | % | | | 2.88 | % | | | 2.80 | % | | | 2.51 | % | | | 2.48 | % |
| | | | | | | |
Portfolio turnover rate | | | 80 | % | | | | | | | 450 | % | | | 185 | % | | | 267 | % | | | 115 | % | | | 113 | % |
| | | | | | | |
Net assets at end of period (in 000’s) | | $ | 394,607 | | | | | | | $ | 391,094 | | | $ | 423,600 | | | $ | 366,470 | | | $ | 330,375 | | | $ | 344,385 | |
| ‡ | Less than one cent per share. |
| † | Consolidated Financial Highlights for the periods January 1, 2018 to November 30, 2018, January 1, 2017 to December 31, 2017 and January 9, 2016 to December 31, 2016. |
| (a) | Per share data based on average shares outstanding during the period. |
| (b) | Total return does not reflect any deduction of sales charges, mortality and expense charges, contract charges or administrative charges. For periods of less than one year, total return is not annualized. |
| (c) | Total investment return may reflect adjustments to conform to generally accepted accounting principles. |
| (d) | In addition to the fees and expenses which the Portfolio bears directly, it also indirectly bears a pro-rata share of the fees and expenses of the underlying funds in which it invests. Such indirect expenses are not included in the above expense ratios. |
| (e) | The expense ratios presented below exclude short sales expense: |
| | | | | | | | | | |
Period Ended | | Net Expenses
(excluding short
sale expenses) | | Short Sale
Expenses |
| June 30, 2019 | | | | 0.95 | %*†† | | | | — | |
| December 31, 2018 | | | | 1.60 | % | | | | 0.99 | % |
| December 31, 2017 | | | | 1.68 | % | | | | 1.05 | % |
| December 31, 2016 | | | | 1.71 | % | | | | 0.90 | % |
| December 31, 2015 | | | | 1.72 | % | | | | 0.79 | % |
| December 31, 2014 | | | | 1.71 | % | | | | 0.77 | % |
| | | | | | |
The notes to the financial statements are an integral part of,
and should be read in conjunction with, the financial statements. | | | | | 25 | |
Notes to Financial Statements(Unaudited)
Note 1–Organization and Business
MainStay VP Funds Trust (the “Fund”) was organized as a Delaware statutory trust on February 1, 2011. The Fund is registered under the Investment Company Act of 1940, as amended (the “1940 Act”), as an open-end management investment company. The Fund is comprised of thirty-one separate series (collectively referred to as the “Portfolios”). These financial statements and notes relate to the MainStay VP IQ Hedge Multi-Strategy Portfolio (the “Portfolio”), a “diversified” portfolio, as that term is defined in the 1940 Act, as interpreted or modified by regulatory authorities having jurisdiction, from time to time. Effective at the close of business on November 30, 2018, the Portfolio acquired the assets and liabilities of MainStay VP Absolute Return Multi-Strategy Portfolio (the “Reorganization”), which was a separate series of the Fund (the “VP ARMS Portfolio”). The Reorganization was approved by the Fund’s Board of Trustees (the “Board”) and shareholders pursuant to an Agreement and Plan of Reorganization (the “Reorganization Agreement”), see Note 10 for additional information. The VP ARMS Portfolio was the accounting survivor in the Reorganization and as such, the financial statements and the financial highlights reflect the financial information of the VP ARMS Portfolio through November 30, 2018.
Shares of the Portfolio are currently offered to certain separate accounts to fund variable annuity policies and variable universal life insurance policies issued by New York Life Insurance and Annuity Corporation (“NYLIAC”), awholly-owned subsidiary of New York Life Insurance Company (“New York Life”) and may also be offered to fund variable annuity policies and variable universal life insurance policies issued by other insurance companies. NYLIAC allocates shares of the Portfolios to, among others, certain NYLIAC separate accounts. Shares of the Portfolio are also offered to the MainStay VP Conservative Allocation Portfolio, MainStay VP Moderate Allocation Portfolio, MainStay VP Moderate Growth Allocation Portfolio and MainStay VP Growth Allocation Portfolio, which operate as “funds-of-funds.”
The Portfolio currently offers two classes of shares. Initial Class and Service Class shares commenced operations on May 1, 2013. Shares of the Portfolio are offered and are redeemed at a price equal to their respective net asset value (“NAV”) per share. No sales or redemption charge is applicable to the purchase or redemption of the Portfolio’s shares. Under the terms of the Fund’s multiple class plan adopted pursuant to Rule 18f-3 under the 1940 Act, the classes differ in that, among other things, Service Class shares of the Portfolio pay a combined distribution and service fee of 0.25% of average daily net assets attributable to Service Class shares of the Portfolio to the Distributor (as defined in Note 3(B)) pursuant to a plan adopted in accordance with Rule 12b-1 under the 1940 Act. Contract owners of variable annuity contracts purchased after June 2, 2003, are permitted to invest only in the Service Class shares.
The Portfolio’s investment objective is to seek investment returns that correspond (before fees and expenses) generally to the price and yield performance of its underlying index, the IQ Hedge Multi-Strategy Index. The IQ Hedge Multi-Strategy Index seeks to achieve performance similar to the overall hedge fund universe by replicating the “beta” portion of the hedge fund return characteristics (i.e., that portion of the returns that are non-idiosyncratic, or unrelated to manager skill) by using the following hedge fund investment styles: long/short equity; global macro; market neutral; event-driven; fixed-income arbitrage; and emerging
markets. The VP ARMS Portfolio’s investment objective until the November 30, 2018 Reorganization was to seeklong-term growth of capital.
The Portfolio is a “fund of funds” that seeks to achieve its investment objective by investing primarily in exchange-traded funds (“ETFs”), other exchange-traded vehicles issuing equity securities organized in the U.S., such as exchange-traded commodity pools (“ETVs”), and exchange-traded notes (“ETNs”) (such ETFs, ETVs and ETNs are referred to collectively as “exchange-traded products” or “ETPs”), but may also invest in one or more financial instruments, including but not limited to, futures contracts, reverse repurchase agreements, options, and swap agreements (collectively, “Financial Instruments”) in order to seek to achieve exposure to investment strategies and/or asset classes that are similar to those of the IQ Hedge Multi-Strategy Index.
Note 2–Significant Accounting Policies
The Portfolio is an investment company and accordingly follows the investment company accounting and reporting guidance of the Financial Accounting Standards Board (“FASB”) Accounting Standard CodificationTopic 946 Financial Services—Investment Companies. The Portfolio prepares its financial statements in accordance with generally accepted accounting principles (“GAAP”) in the United States of America and follows the significant accounting policies described below.
(A) Securities Valuation. Investments are usually valued as of the close of regular trading on the New York Stock Exchange (the “Exchange”) (usually 4:00 p.m. Eastern time) on each day the Portfolio is open for business (“valuation date”).
The Board adopted procedures establishing methodologies for the valuation of the Portfolio’s securities and other assets and delegated the responsibility for valuation determinations under those procedures to the Valuation Committee of the Fund (the “Valuation Committee”). The Board authorized the Valuation Committee to appoint a Valuation Subcommittee (the “Subcommittee”) to deal in the first instance with establishing the prices of securities for which market quotations are not readily available or the prices of which are not otherwise readily determinable under these procedures. The Subcommittee meets (in person, via electronic mail or via teleconference) on an as-needed basis. Subsequently, the Valuation Committee meets to ensure that actions taken by the Subcommittee were appropriate. The procedures state that, subject to the oversight of the Board and unless otherwise noted, the responsibility for theday-to-day valuation of portfolio assets (including fair value measurements for the Portfolio’s assets and liabilities) rests with New York Life Investment Management LLC (“New York Life Investments” or the “Manager”), aided to whatever extent necessary by the Subadvisor (as defined in Note 3(A)).
To assess the appropriateness of security valuations, the Manager, the Subadvisor or the Portfolio’s third party service provider, who is subject to oversight by the Manager, regularly compares prior day prices, prices on comparable securities and the sale prices to the prior and current day prices and challenges prices with changes exceeding certain tolerance levels with third-party pricing services or broker sources. For those securities valued through either a standardized fair valuation methodology or a fair valuation measurement, the Subcommittee deals in the first instance with such valuation and the Valuation Committee reviews
| | |
| 26 | | MainStay VP IQ Hedge Multi-Strategy Portfolio |
and affirms, if appropriate, the reasonableness of the valuation based on such methodologies and measurements on a regular basis after considering information that is reasonably available and deemed relevant by the Valuation Committee. Any action taken by the Subcommittee with respect to the valuation of a portfolio security or other asset is submitted for review and ratification (if appropriate) to the Valuation Committee and the Board at the next regularly scheduled meeting.
“Fair value” is defined as the price the Portfolio would reasonably expect to receive upon selling an asset or liability in an orderly transaction to an independent buyer in the principal or most advantageous market for the asset or liability. Fair value measurements are determined within a framework that establishes a three-tier hierarchy which maximizes the use of observable market data and minimizes the use of unobservable inputs to establish a classification of fair value measurements for disclosure purposes. “Inputs” refer broadly to the assumptions that market participants would use in pricing the asset or liability, including assumptions about risk, such as the risk inherent in a particular valuation technique used to measure fair value using a pricing model and/or the risk inherent in the inputs for the valuation technique. Inputs may be observable or unobservable. Observable inputs reflect the assumptions market participants would use in pricing the asset or liability based on market data obtained from sources independent of the Portfolio. Unobservable inputs reflect the Portfolio’s own assumptions about the assumptions market participants would use in pricing the asset or liability based on the information available. The inputs or methodology used for valuing assets or liabilities may not be an indication of the risks associated with investing in those assets or liabilities. The three-tier hierarchy of inputs is summarized below.
| • | | Level 1—quoted prices in active markets for an identical asset or liability |
| • | | Level 2—other significant observable inputs (including quoted prices for a similar asset or liability in active markets, interest rates and yield curves, prepayment speeds, credit risk, etc.) |
| • | | Level 3—significant unobservable inputs (including the Portfolio’s own assumptions about the assumptions that market participants would use in measuring fair value of an asset or liability) |
The level of an asset or liability within the fair value hierarchy is based on the lowest level of an input, both individually and in the aggregate, that is significant to the fair value measurement. As of June 30, 2019, the aggregate value by input level of the Portfolio’s assets and liabilities is included at the end of the Portfolio’s Portfolio of Investments.
The Portfolio may use third-party vendor evaluations, whose prices may be derived from one or more of the following standard inputs, among others:
| | |
• Benchmark yields | | • Reported trades |
• Broker/dealer quotes | | • Issuer spreads |
• Two-sided markets | | • Benchmark securities |
• Bids/offers | | • Reference data (corporate actions or material event notices) |
• Industry and economic events | | • Comparable bonds |
• Monthly payment information | | |
An asset or liability for which market values cannot be measured using the methodologies described above is valued by methods deemed reasonable in good faith by the Valuation Committee, following the procedures established by the Board, to represent fair value. Under these procedures, the Portfolio generally uses a market-based approach which may use related or comparable assets or liabilities, recent transactions, market multiples, book values and other relevant information. The Portfolio may also use an income-based valuation approach in which the anticipated future cash flows of the asset or liability are discounted to calculate fair value. Discounts may also be applied due to the nature and/or duration of any restrictions on the disposition of the asset or liability. Fair value represents a good faith approximation of the value of a security. Fair value determinations involve the consideration of a number of subjective factors, an analysis of applicable facts and circumstances and the exercise of judgment. As a result, it is possible that the fair value for a security determined in good faith in accordance with the Portfolio’s valuation procedures may differ from valuations for the same security determined by other funds using their own valuation procedures. Although the Portfolio’s valuation procedures are designed to value a security at the price the Portfolio may reasonably expect to receive upon the security’s sale in an orderly transaction, there can be no assurance that any fair value determination thereunder would, in fact, approximate the amount that the Portfolio would actually realize upon the sale of the security or the price at which the security would trade if a reliable market price were readily available. During the six-month period ended June 30, 2019, there were no material changes to the fair value methodologies.
Securities which may be valued in this manner include, but are not limited to: (i) a security for which trading has been halted or suspended; (ii) a debt security that has recently gone into default and for which there is not a current market quotation; (iii) a security of an issuer that has entered into a restructuring; (iv) a security that has been delisted from a national exchange; (v) a security for which the market price is not readily available from a third-party pricing source or, if so provided, does not, in the opinion of the Manager or the Subadvisor, reflect the security’s market value; (vi) a security subject to trading collars for which no or limited trading takes place; and (vii) a security whose principal market has been temporarily closed at a time when, under normal conditions, it would be open. Securities valued in this manner are generally categorized as Level 3 in the hierarchy. As of June 30, 2019, there were no securities held by the Portfolio that were fair valued in such a manner.
Certain securities held by the Portfolio may principally trade in foreign markets. Events may occur between the time the foreign markets close and the time at which the Portfolio’s NAVs are calculated. These events may include, but are not limited to, situations relating to a single issuer in a market sector, significant fluctuations in U.S. or foreign markets, natural disasters, armed conflicts, governmental actions or other developments not tied directly to the securities markets. Should the Manager or the Subadvisor conclude that such events may have affected the accuracy of the last price of such securities reported on the local foreign market, the Subcommittee may, pursuant to procedures adopted by the Board, adjust the value of the local price to reflect the estimated impact on the price of such securities as a result of such events. In this instance, securities are generally categorized as Level 3 in the hierarchy. Additionally, certain foreign equity securities are also fair valued
Notes to Financial Statements(Unaudited) (continued)
whenever the movement of a particular index exceeds certain thresholds. In such cases, the securities are fair valued by applying factors provided by a third-party vendor in accordance with valuation procedures adopted by the Board and are generally categorized as Level 2 in the hierarchy. As of June 30, 2019, there were no securities held by the Portfolio that were fair valued in such a manner.
Equity securities, including ETPs, are valued at the last quoted sales prices as of the close of regular trading on the relevant exchange on each valuation date. Securities that are not traded on the valuation date are valued at the mean of the last quoted bid and ask prices. Prices are normally taken from the principal market in which each security trades. These securities are generally categorized as Level 1 in the hierarchy.
Investments in mutual funds, including money market funds, are valued at their respective NAVs as of the close of the Exchange on the valuation date. These securities are generally categorized as Level 1 in the hierarchy.
Debt securities (other than convertible and municipal bonds) are valued at the evaluated bid prices (evaluated mean prices in the case of convertible and municipal bonds) supplied by a pricing agent or brokers selected by the Manager, in consultation with the Subadvisor. The evaluations are market-based measurements processed through a pricing application and represents the pricing agent’s good faith determination as to what a holder may receive in an orderly transaction under market conditions. The rules based logic utilizes valuation techniques that reflect participants’ assumptions and vary by asset class and per methodology, maximizing the use of relevant observable data including quoted prices for similar assets, benchmark yield curves and market corroborated inputs. The evaluated bid or mean prices are deemed by the Manager, in consultation with the Subadvisor, to be representative of market values at the regular close of trading of the Exchange on each valuation date. Debt securities purchased on a delayed delivery basis are marked to market daily until settlement at the forward settlement date. Debt securities, including corporate bonds, U.S. government and federal agency bonds, municipal bonds, foreign bonds, convertible bonds, asset-backed securities and mortgage-backed securities are generally categorized as Level 2 in the hierarchy. As of June 30, 2019, there were no securities held by the Portfolio that were fair valued in such a manner.
Swaps are marked to market daily based upon quotations from pricing agents, brokers or market makers. These securities are generally categorized as Level 2 in the hierarchy.
Total return swap contracts, which are arrangements to exchange a market-linked return for a periodic payment, are based on a notional principal amount. To the extent that the total return of the security, index or other financial measure underlying the transaction exceeds or falls short of the offsetting interest rate obligation, the Portfolio will receive a payment from or make a payment to the counterparty. Total return swap contracts are marked to market daily based upon quotations from market makers and these securities are generally categorized as Level 2 in the hierarchy.
Temporary cash investments acquired in excess of 60 days to maturity at the time of purchase are valued using the latest bid prices or using valuations based on a matrix system (which considers such factors as security prices, yields, maturities and ratings), both as furnished by
independent pricing services. Other temporary cash investments which mature in 60 days or less at the time of purchase (“Short-Term Investments”) are valued using the amortized cost method of valuation, unless the use of such method would be inappropriate. The amortized cost method involves valuing a security at its cost on the date of purchase and thereafter assuming a constant amortization to maturity of the difference between such cost and the value on maturity date. Amortized cost approximates the current fair value of a security. Securities valued using the amortized cost method are not valued using quoted prices in an active market and are generally categorized as Level 2 in the hierarchy.
The information above is not intended to reflect an exhaustive list of the methodologies that may be used to value portfolio investments. The valuation procedures permit the use of a variety of valuation methodologies in connection with valuing portfolio investments. The methodology used for a specific type of investment may vary based on the market data available or other considerations. The methodologies summarized above may not represent the specific means by which portfolio investments are valued on any particular business day.
(B) Income Taxes. The Portfolio’s policy is to comply with the requirements of the Internal Revenue Code of 1986, as amended (the “Internal Revenue Code”), applicable to regulated investment companies and to distribute all of its taxable income to the shareholders of the Portfolio within the allowable time limits. Therefore, no federal, state and local income tax provisions are required.
Management evaluates the Portfolio’s tax positions to determine if the tax positions taken meet the minimum recognition threshold in connection with accounting for uncertainties in income tax positions taken or expected to be taken for the purposes of measuring and recognizing tax liabilities in the financial statements. Recognition of tax benefits of an uncertain tax position is permitted only to the extent the position is “more likely than not” to be sustained assuming examination by taxing authorities. Management has analyzed the Portfolio’s tax positions taken on federal, state and local income tax returns for all open tax years (for up to three tax years) and has concluded that no provisions for federal, state and local income tax are required in the Portfolio’s financial statements. The Portfolio’s federal, state and local income tax and federal excise tax returns for tax years for which the applicable statutes of limitations have not expired are subject to examination by the Internal Revenue Service and state and local departments of revenue.
(C) Foreign Taxes. The Portfolio may be subject to foreign taxes on income and other transaction-based taxes imposed by certain countries in which it invests. A portion of the taxes on gains on investments or currency purchases/repatriation may be reclaimable. The Portfolio will accrue such taxes and reclaims as applicable, based upon its current interpretation of tax rules and regulations that exist in the markets in which it invests.
The Portfolio may be subject to taxation on realized capital gains, repatriation proceeds and other transaction-based taxes imposed by certain countries in which it invests. The Portfolio will accrue such taxes as applicable based upon its current interpretation of tax rules and regulations that exist in the market in which it invests. Capital gains taxes relating to positions still held are reflected as a liability on the Statement of Assets and Liabilities, as well as an adjustment to the Portfolio’s net
| | |
| 28 | | MainStay VP IQ Hedge Multi-Strategy Portfolio |
unrealized appreciation (depreciation). Taxes related to capital gains realized, if any, are reflected as part of net realized gain (loss) in the Statement of Operations. Changes in tax liabilities related to capital gains taxes on unrealized investment gains, if any, are reflected as part of the change in net unrealized appreciation (depreciation) on investments in the Statement of Operations. Transaction-based charges are generally assessed as a percentage of the transaction amount.
(D) Dividends and Distributions to Shareholders. Dividends and distributions are recorded on the ex-dividend date. The Portfolio intends to declare and pay dividends from net investment income and distributions from net realized capital and currency gains, if any, at least annually. Unless the shareholder elects otherwise, all dividends and distributions are reinvested in the same class of shares of the Portfolio, at NAV. Dividends and distributions to shareholders are determined in accordance with federal income tax regulations and may differ from determinations using GAAP.
(E) Security Transactions and Investment Income. The Portfolio records security transactions on the trade date. Realized gains and losses on security transactions are determined using the identified cost method. Dividend income is recognized on the ex-dividend date; net of any foreign tax withheld at the source, and interest income is accrued as earned using the effective interest rate method. Discounts and premiums on securities purchased for the Portfolio are accreted and amortized, respectively, on the effective interest rate method over the life of the respective securities. Income frompayment-in-kind securities is recorded daily based on the effective interest method of accrual.
Investment income and realized and unrealized gains and losses on investments of the Portfolio are allocated pro rata to the separate classes of shares based upon their relative net assets on the date the income is earned or realized and unrealized gains and losses are incurred.
The Portfolio may place a debt security on non-accrual status and reduce related interest income by ceasing current accruals and writing off all or a portion of any interest receivables when the collection of all or a portion of such interest has become doubtful. A debt security is removed from non-accrual status when the issuer resumes interest payments or when collectability of interest is reasonably assured.
(F) Expenses. Expenses of the Fund are allocated to the individual Portfolios in proportion to the net assets of the respective Portfolios when the expenses are incurred, except where direct allocations of expenses can be made. Expenses (other than fees incurred under the distribution and service plans, further discussed in Note 3(B), which are charged directly to the Service Class shares) are allocated to separate classes of shares pro rata based upon their relative net assets on the date the expenses are incurred. The expenses borne by the Portfolio, including those of related parties to the Portfolio, are shown in the Statement of Operations.
Additionally, the Portfolio may invest in ETPs and mutual funds, which are subject to management fees and other fees that may cause the costs of investing in ETPs and mutual funds to be greater than the costs of owning the underlying securities directly. These indirect expenses of ETPs and mutual funds are not included in the amounts shown as expenses in the Portfolio’s Statement of Operations or in the expense ratios included in the Financial Highlights.
In addition, the Portfolio bears a pro rata share of the fees and expenses of the ETPs in which it invests. Because the ETPs have varied expense and fee levels and the Portfolio may own different proportions of the ETPs at different times, the amount of fees and expenses incurred indirectly by the Portfolio may vary.
(G) Offering and Organization Costs. Offering costs paid in connection with the offering of shares of the Portfolio are amortized on a straight-line basis over 12 months from the date of commencement of operations. Organization costs paid in connection with the organization of the Portfolio are expensed on the first day of operations.
(H) Use of Estimates. In preparing the financial statements in conformity with GAAP, management makes estimates and assumptions that affect the reported amounts and disclosures in the financial statements. Actual results could differ from those estimates.
(I) Repurchase Agreements. The Portfolio may enter into repurchase agreements (i.e., buy a security from another party with the agreement that it be sold back in the future) to earn income. The Portfolio may enter into repurchase agreements only with counterparties, usually financial institutions, that are deemed by the Manager or the Subadvisor to be creditworthy, pursuant to guidelines established by the Board. During the term of any repurchase agreement, the Manager or the Subadvisor will continue to monitor the creditworthiness of the counterparty. Under the 1940 Act, repurchase agreements are considered to be collateralized loans by the Portfolio to the counterparty secured by the securities transferred to the Portfolio.
Repurchase agreements are subject to counterparty risk, meaning the Portfolio could lose money by the counterparty’s failure to perform under the terms of the agreement. The Portfolio mitigates this risk by ensuring the repurchase agreement is collateralized by cash, U.S. government securities, fixed income securities and/or other securities. The collateral is held by the Portfolio’s custodian and valued daily on a mark to market basis to determine if the value, including accrued interest, exceeds the repurchase price. In the event of the counterparty’s default on the obligation to repurchase, the Portfolio has the right to liquidate the collateral and apply the proceeds in satisfaction of the obligation. Under certain circumstances, such as in the event of default or bankruptcy by the counterparty, realization and/or retention of the collateral may be limited or subject to delay, to legal proceedings and possible realized loss to the Portfolio. As of June 30, 2019, the Portfolio did not hold any repurchase agreements.
(J) Futures Contracts. A futures contract is an agreement to purchase or sell a specified quantity of an underlying instrument at a specified future date and price, or to make or receive a cash payment based on the value of a financial instrument (e.g., foreign currency, interest rate, security or securities index). The Portfolio is subject to risks such as market price risk and/or interest rate risk in the normal course of investing in these transactions. Upon entering into a futures contract, the Portfolio is required to pledge to the broker or futures commission merchant an amount of cash and/or U.S. government securities equal to a certain percentage of the collateral amount, known as the “initial margin.” During the period the futures contract is open, changes in the value of the contract are recognized as unrealized appreciation or depreciation by marking to market such contract on a daily basis to reflect the market value of the contract at the end of each
Notes to Financial Statements(Unaudited) (continued)
day’s trading. The Portfolio agrees to receive from or pay to the broker or futures commission merchant an amount of cash equal to the daily fluctuation in the value of the contract. Such receipts or payments are known as “variation margin.” When the futures contract is closed, the Portfolio records a realized gain or loss equal to the difference between the proceeds from (or cost of) the closing transaction and the Portfolio’s basis in the contract.
The use of futures contracts involves, to varying degrees, elements of market risk in excess of the amount recognized in the Statement of Assets and Liabilities. The contract or notional amounts and variation margin reflect the extent of the Portfolio’s involvement in open futures positions. There are several risks associated with the use of futures contracts as hedging techniques. There can be no assurance that a liquid market will exist at the time when the Portfolio seeks to close out a futures contract. If no liquid market exists, the Portfolio would remain obligated to meet margin requirements until the position is closed. Futures may involve a small initial investment relative to the risk assumed, which could result in losses greater than if they had not been used. Futures may be more volatile than direct investments in the instrument underlying the futures and may not correlate to the underlying instrument, causing a given hedge not to achieve its objectives. The Portfolio’s activities in futures contracts have minimal counterparty risk as they are conducted through regulated exchanges that guarantee the futures against default by the counterparty. In the event of a bankruptcy or insolvency of a futures commission merchant that holds margin on behalf of the Portfolio, the Portfolio may not be entitled to the return of the entire margin owed to the Portfolio, potentially resulting in a loss. The Portfolio’s investment in futures contracts and other derivatives may increase the volatility of the Portfolio’s NAVs and may result in a loss to the Portfolio. As of June 30, 2019, the Portfolio did not hold any futures contracts.
(K) Foreign Currency Forward Contracts. The Portfolio may enter into foreign currency forward contracts, which are agreements to buy or sell foreign currencies on a specified future date at a specified rate. The Portfolio is subject to foreign currency exchange rate risk in the normal course of investing in these transactions. During the period the forward contract is open, changes in the value of the contract are recognized as unrealized appreciation or depreciation by marking to market such contract on a daily basis to reflect the market value of the contract at the end of each day’s trading. Cash movement occurs on settlement date. When the forward contract is closed, the Portfolio records a realized gain or loss equal to the difference between the proceeds from (or cost of) the closing transaction and the Portfolio’s basis in the contract. The Portfolio may purchase and sell foreign currency forward contracts for purposes of seeking to enhance portfolio returns and manage portfolio risk more efficiently. Foreign currency forward contracts may also be used to gain exposure to a particular currency or to hedge against the risk of loss due to changing currency exchange rates. Foreign currency forward contracts to purchase or sell a foreign currency may also be used in anticipation of future purchases or sales of securities denominated in foreign currency, even if the specific investments have not yet been selected.
The use of foreign currency forward contracts involves, to varying degrees, elements of risk in excess of the amount recognized in the Statement of Assets and Liabilities, including counterparty risk, market
risk and illiquidity risk. Counterparty risk is heightened for these instruments because foreign currency forward contracts are not exchange-traded and therefore no clearinghouse or exchange stands ready to meet the obligations under such contracts. Thus, the Portfolio faces the risk that its counterparties under such contracts may not perform their obligations. Market risk is the risk that the value of a foreign currency forward contract will depreciate due to unfavorable changes in exchange rates. Illiquidity risk arises because the secondary market for foreign currency forward contracts may have less liquidity relative to markets for other securities and financial instruments. Risks also arise from the possible movements in the foreign exchange rates underlying these instruments. While the Portfolio may enter into forward contracts to reduce currency exchange risks, changes in currency exchange rates may result in poorer overall performance for the Portfolio than if it had not engaged in such transactions. Exchange rate movements can be large, depending on the currency, and can last for extended periods of time, affecting the value of the Portfolio’s assets. Moreover, there may be an imperfect correlation between the Portfolio’s holdings of securities denominated in a particular currency and forward contracts entered into by the Portfolio. Such imperfect correlation may prevent the Portfolio from achieving the intended hedge or expose the Portfolio to the risk of currency exchange loss. The unrealized appreciation (depreciation) on forward contracts also reflects the Portfolio’s exposure at the valuation date to credit loss in the event of a counterparty’s failure to perform its obligations. As of June 30, 2019, the Portfolio did not hold any foreign currency forward contracts.
(L) Foreign Currency Transactions. The Portfolio’s books and records are maintained in U.S. dollars. Prices of securities denominated in foreign currency amounts are translated into U.S. dollars at the mean between the buying and selling rates last quoted by any major U.S. bank at the following dates:
| (i) | market value of investment securities, other assets and liabilities—at the valuation date; and |
| (ii) | purchases and sales of investment securities, income and expenses—at the date of such transactions. |
The assets and liabilities that are denominated in foreign currency amounts are presented at the exchange rates and market values at the close of the period. The realized and unrealized changes in net assets arising from fluctuations in exchange rates and market prices of securities are not separately presented.
Net realized gain (loss) on foreign currency transactions represents net gains and losses on foreign currency forward contracts, net currency gains or losses realized as a result of differences between the amounts of securities sale proceeds or purchase cost, dividends, interest and withholding taxes as recorded on the Portfolio’s books, and the U.S. dollar equivalent amount actually received or paid. Net currency gains or losses from valuing such foreign currency denominated assets and liabilities, other than investments at valuation date exchange rates, are reflected in unrealized foreign exchange gains or losses.
(M) Swap Contracts. The Portfolio may enter into credit default, interest rate, equity, index and currency exchange rate swap contracts (“swaps”). In a typical swap transaction, two parties agree to exchange the future returns (or differentials in rates of future returns) earned or realized at periodic intervals on a particular investment or instrument
| | |
| 30 | | MainStay VP IQ Hedge Multi-Strategy Portfolio |
based on a notional principal amount. Generally, the Portfolio will enter into a swap on a net basis, which means that the two payment streams under the swap are netted, with the Portfolio receiving or paying (as the case may be) only the net amount of the two payment streams. Therefore, the Portfolio’s current obligation under a swap generally will be equal to the net amount to be paid or received under the swap, based on the relative value of notional positions attributable to each counterparty to the swap. The payments may be adjusted for transaction costs, interest payments, the amount of interest paid on the investment or instrument or other factors. Collateral, in the form of cash or securities, may be required to be held in segregated accounts with the custodian bank or broker in accordance with the terms of the swap. Swap agreements are privately negotiated in the over the counter (“OTC”) market and may be executed in a multilateral or other trade facilities platform, such as a registered commodities exchange (“centrally cleared swaps”).
Certain standardized swaps, including certain credit default and interest rate swaps, are subject to mandatory clearing and exchange-trading, and more types of standardized swaps are expected to be subject to mandatory clearing and exchange-trading in the future. The counterparty risk for exchange-traded and cleared derivatives is expected to be generally lower than for uncleared derivatives, but cleared contracts are not risk-free. In a cleared derivative transaction, the Portfolio typically enters into the transaction with a financial institution counterparty, and performance of the transaction is effectively guaranteed by a central clearinghouse, thereby reducing or eliminating the Portfolio’s exposure to the credit risk of its original counterparty. The Portfolio will be required to post specified levels of margin with the clearinghouse or at the instruction of the clearinghouse; the margin required by a clearinghouse may be greater than the margin the Portfolio would be required to post in an uncleared transaction. As of June 30, 2019, all swap positions outstanding are shown in the Portfolio of Investments.
Swaps are marked to market daily based upon quotations from pricing agents, brokers, or market makers and the change in value, if any, is recorded as unrealized appreciation or depreciation. Any payments made or received upon entering into a swap would be amortized or accreted over the life of the swap and recorded as a realized gain or loss. Early termination of a swap is recorded as a realized gain or loss. Daily changes in valuation of centrally cleared swaps, if any, are recorded as a receivable or payable for the change in value as appropriate on the Statement of Assets and Liabilities.
The Portfolio bears the risk of loss of the amount expected to be received under a swap in the event of the default or bankruptcy of the swap counterparty. The Portfolio may be able to eliminate its exposure under a swap either by assignment or other disposition, or by entering into an offsetting swap with the same party or a similar credit-worthy party. Swaps are not actively traded on financial markets. Entering into swaps involves elements of credit, market, and documentation risk in excess of the amounts recognized on the Statement of Assets and Liabilities. Such risks involve the possibilities that there will be no liquid market for these swaps, that the counterparty to the swaps may default on its obligation to perform or disagree as to the meaning of the contractual terms in the swaps and that there may be unfavorable changes in interest rates, the price of the index or the security underlying these transactions.
Equity Swaps (Total Return Swaps): Total return swap contracts are agreements between counterparties to exchange cash flow, one based on a market-linked return of an individual asset or group of assets (such as an index), and the other on a fixed or floating rate. As a total return swap, an equity swap may be structured in different ways. For example, when the Portfolio enters into a “long” equity swap, the counterparty may agree to pay the Portfolio the amount, if any, by which the notional amount of the equity swap would have increased in value had it been invested in a particular referenced security or securities, plus the dividends that would have been received on those securities. In return, the Portfolio will generally agree to pay the counterparty interest on the notional amount of the equity swap plus the amount, if any, by which that notional amount would have decreased in value had it been invested in such referenced security or securities, plus, in certain instances, commissions or trading spreads on the notional amounts. Therefore, the Portfolio’s return on the equity swap generally should equal the gain or loss on the notional amount, plus dividends on the referenced security or securities less the interest paid by the Portfolio on the notional amount. Alternatively, when the Portfolio enters into a “short” equity swap, the counterparty will generally agree to pay the Portfolio the amount, if any, by which the notional amount of the equity swap would have decreased in value had the Portfolio sold a particular referenced security or securities short, less the dividend expense that the Portfolio would have incurred on the referenced security or securities, as adjusted for interest payments or other economic factors. In this situation, the Portfolio will generally be obligated to pay the amount, if any, by which the notional amount of the swap would have increased in value had it been invested directly in the referenced security or securities.
Equity swaps generally do not involve the delivery of securities or other referenced assets. Accordingly, the risk of loss with respect to equity swaps is normally limited to the net amount of payments that the Portfolio is contractually obligated to make. If the other party to an equity swap defaults, the Portfolio’s risk of loss consists of the net amount of payments that the Portfolio is contractually entitled to receive, if any. The Portfolio will segregate cash or liquid assets, enter into offsetting transactions or use other measures permitted by applicable law to “cover” the Portfolio’s current obligations. The Portfolio and New York Life Investments, however, believe these transactions do not constitute senior securities under the 1940 Act and, accordingly, will not treat them as being subject to the Portfolio’s borrowing restrictions.
Equity swaps are derivatives and their value can be very volatile. The Portfolio may engage in total return swaps to gain exposure to emerging markets securities, along with offsetting long total return swap positions to maintain appropriate currency balances and risk exposures across all swap positions. To the extent that the Manager, or the Subadvisor do not accurately analyze and predict future market trends, the values or assets or economic factors, the Portfolio may suffer a loss, which may be substantial.
(N) Rights and Warrants. Rights are certificates that permit the holder to purchase a certain number of shares, or a fractional share, of a new stock from the issuer at a specific price. Warrants are instruments that entitle the holder to buy an equity security at a specific price for a specific period of time. These investments can provide a greater
Notes to Financial Statements(Unaudited) (continued)
potential for profit or loss than an equivalent investment in the underlying security. Prices of these investments do not necessarily move in tandem with the prices of the underlying securities.
There is risk involved in the purchase of rights and warrants in that these investments are speculative investments. The Portfolio could also lose the entire value of its investment in warrants if such warrants are not exercised by the date of its expiration. The Portfolio is exposed to risk until the sale or exercise of each right or warrant is completed. As of June 30, 2019, the Portfolio did not hold any rights or warrants.
(O) Options Contracts. The Portfolio may write call and put options on securities and financial derivative instruments it owns or in which it may invest. Writing put options tends to increase the Portfolio’s exposure to the underlying instrument. Writing call options tends to decrease the Portfolio’s exposure to the underlying instrument. When the Portfolio writes a call or put, an amount equal to the premium received is recorded as a liability and subsequently marked to market to reflect the current value of the option written. These liabilities are reflected as written options outstanding on the Statement of Assets and Liabilities. Premiums received from writing options which expire are treated as realized gains. Premiums received from writing options which are exercised or closed are added to the proceeds or offset against amounts paid on the underlying futures, swaps, security or currency transaction to determine the realized gain or loss. Certain options may be written with premiums to be determined on a future date. The Portfolio, as a writer of an option, has no control over whether the underlying instrument may be sold (call) or purchased (put) and as a result bears the market risk of an unfavorable change in the price of the instrument underlying the written option. There is the risk the Portfolio may not be able to enter into a closing transaction because of an illiquid market. Writing call options involves risk of loss in excess of the related amounts reflected in the Statement of Assets and Liabilities.
The Portfolio may also purchase put and call options. Purchasing call options tends to increase the Portfolio’s exposure to the underlying instrument. Alternatively, purchasing put options tends to decrease the Portfolio’s exposure to the underlying instrument. The Portfolio pays a premium which is included on the Portfolio’s Statement of Assets and Liabilities as an investment and subsequently marked to market to reflect the current value of the option. Premiums paid for purchasing options which expire are treated as realized losses. Certain options may be purchased with premiums to be determined on a future date. The premiums for these options are based upon implied volatility parameters at specified terms. The risk associated with purchasing put and call options is limited to the premium paid. Premiums paid for purchasing options which are exercised or closed are added to the amounts paid or offset against the proceeds on the underlying investment transaction to determine the realized gain or loss when the underlying transaction is sold.
The Portfolio may purchase or write foreign currency options. Purchasing a foreign currency option gives the Portfolio the right, but not the obligation, to buy or sell a specified amount of the currency at a specified rate of exchange that may be exercised on or before the option’s expiration date. Writing a foreign currency option obligates the Portfolio to buy or sell a specified amount of foreign currency at a specified rate of exchange, and such option may be exercised on or before the option’s expiration date in exchange for an option premium. These
options may be used as a short or long hedge against possible variations in foreign exchange rates or to gain exposure to foreign currencies. The risks associated with writing a foreign currency put option include the risk that the Portfolio may incur a loss if the value of the referenced foreign currency decreases and the option is exercised. The risks associated with writing a foreign currency call option include the risk that if the value of the referenced foreign currency increases, and if the option is exercised, the Portfolio must either acquire the referenced foreign currency at the then higher price for delivery or, if the Portfolio already owns the referenced foreign currency, forego the opportunity for profit with respect to such foreign currency. As of June 30, 2019, the Portfolio did not purchase or write any options contracts.
(P) Securities Sold Short. The Portfolio may engage in sales of securities it does not own (“short sales”) as part of its investment strategies. When the Portfolio enters into a short sale, it must segregate or maintain with a broker the cash proceeds from the security sold short or other securities as collateral for its obligation to deliver the security upon conclusion of the sale. During the period a short position is open, depending on the nature and type of security, a short position is reflected as a liability and is marked to market in accordance with the valuation methodologies previously detailed (See Note 2(A)). Liabilities for securities sold short are closed out by purchasing the applicable securities for delivery to the counterparty broker. A gain, limited to the price at which the Portfolio sold the security short, or a loss, unlimited as to dollar amount, will be recognized upon termination of a short sale if the market price on the date the short position is closed out is less or greater, respectively, than the proceeds originally received. Any such gain or loss may be offset, completely or in part, by the change in the value of the hedged investments. Interest on short positions held is accrued daily, while dividends declared on short positions existing on the record date are recorded on the ex-dividend date as a dividend expense in the Statement of Operations. Broker fees and other expenses related to securities sold short are disclosed in the Statement of Operations. Short sales involve risk of loss in excess of the related amounts reflected in the Statement of Assets and Liabilities. As of June 30, 2019, the Portfolio did not enter into any securities sold short.
(Q) Securities Lending. In order to realize additional income, the Portfolio may engage in securities lending, subject to the limitations set forth in the 1940 Act and relevant guidance by the staff of the Securities and Exchange Commission (“SEC”). In the event the Portfolio does engage in securities lending, the Portfolio will lend through its custodian, State Street Bank and Trust Company (“State Street”), acting as securities lending agent on behalf of the Portfolio. State Street will manage the Portfolio’s collateral in accordance with the securities lending agency agreement between the Portfolio and State Street, and indemnify the Portfolio against counterparty risk. The loans will be collateralized by cash (which may be invested in a money market fund) and/ornon-cash collateral (which may include, U.S. Treasury securities and/or U.S. Government Agency securities issued or guaranteed by the United States government or its agencies or instrumentalities) at least equal at all times to the market value of the securities loaned. The Portfolio may bear the risk of delay in recovery of, or loss of rights in, the securities loaned should the borrower of the securities experience financial difficulty. The Portfolio may also record a realized gain or loss on securities deemed sold due to a borrower’s inability to return securities on loan. The Portfolio bears the risk of any loss on investment of
| | |
| 32 | | MainStay VP IQ Hedge Multi-Strategy Portfolio |
cash collateral. The Portfolio will receive compensation for lending its securities in the form of fees or it will retain a portion of interest on the investment of any cash collateral. The Portfolio will also continue to receive interest and dividends on the securities loaned and any gain or loss in the market price of the securities loaned that may occur during the term of the loan will be for the account of the Portfolio. Income earned from securities lending activities, if any, is reflected in the Statement of Operations. As of June 30, 2019, the Portfolio had securities on loan with an aggregate market value of $47,713,845; the total market value of collateral held by the Portfolio was $48,883,210. The market value of the collateral held includednon-cash collateral in the form of U.S. Treasury securities with a value of $31,844,376 and cash collateral which was invested into the State Street Navigator Securities Lending Government Money Market Portfolio with a value of $17,038,834.
(R) Foreign Securities Risk. The Portfolio may invest in foreign securities, which carry certain risks that are in addition to the usual risks inherent in domestic securities. These risks include those resulting from currency fluctuations, future adverse political or economic developments and possible imposition of currency exchange blockages or other foreign governmental laws or restrictions. These risks are likely to be greater in emerging markets than in developed markets. The ability of issuers of debt securities held by the Portfolio to meet their obligations may be affected by, among other things, economic or political developments in a specific country, industry or region.
(S) Counterparty Credit Risk. In order to better define its contractual rights and to secure rights that will help the Portfolio mitigate its counterparty risk, the Portfolio may enter into an International Swaps and Derivatives Association, Inc. Master Agreement (“ISDA Master Agreement”) or similar agreement with its counterparties. An ISDA Master Agreement is a bilateral agreement between the Portfolio and a counterparty that governs certain OTC derivatives and typically contains collateral posting terms and netting provisions. Under an ISDA Master Agreement, the Portfolio may, under certain circumstances, offset with the counterparty certain derivative financial instruments’ payables and/ or receivables with collateral held and/or posted and create one single net payment. The provisions of the ISDA Master Agreement typically permit a single net payment in the event of default including the bankruptcy or insolvency of the counterparty. Bankruptcy or insolvency laws of a particular jurisdiction may restrict or prohibit the right of offset in bankruptcy, insolvency or other events. In addition, certain ISDA Master Agreements may contain provisions for early termination of OTC derivative transactions in the event the net assets of the Portfolio decline below specific levels or if the Portfolio fails to meet the terms of its ISDA Master Agreements. The result would cause the Portfolio to accelerate payment of any net liability owed to the counterparty.
For financial reporting purposes, the Portfolio does not offset derivative assets and derivative liabilities that are subject to netting arrangements, if any, in the Statement of Assets and Liabilities.
(T) Indemnifications. Under the Fund’s organizational documents, its officers and trustees are indemnified against certain liabilities that may arise out of performance of their duties to the Fund. Additionally, in the normal course of business, the Portfolio enters into contracts with third-party service providers that contain a variety of representations and warranties and which may provide general indemnifications. The
Portfolio’s maximum exposure under these arrangements is unknown, as this would involve future claims that may be made against the Portfolio that have not yet occurred. Based on experience, management is of the view that the risk of loss in connection with these potential indemnification obligations is remote. However, there can be no assurance that material liabilities related to such obligations will not arise in the future, which could adversely impact the Portfolio.
(U) Quantitative Disclosure of Derivative Holdings. The following tables show additional disclosures related to the Portfolio’s derivative and hedging activities, including how such activities are accounted for and their effect on the Portfolio’s financial positions, performance and cash flows. The Portfolio entered into futures contracts in order to provide an efficient means of maintaining liquidity while remaining fully invested in the market.
The Portfolio utilizes a range of derivative instruments for a variety of different purposes. Total return swaps (“TRS”) are one form of derivative that is used. In some cases, TRS contracts are entered into so as to affect long and short exposure to individual securities or indices within a particular strategy. In other cases, TRS are used to gain exposure to the strategy itself, which may also use derivatives. For example, a TRS contract is used to generate the return available from a customized index comprised of a diversified basket of exchange-traded futures. Other examples of derivative positions into which the Portfolio may enter include interest rate swaps, credit default swaps and option contracts. These instruments are frequently used to obtain a desired return at a lower cost to the Portfolio than is available when investing directly in the underlying instrument or to hedge against credit and interest rate risks. The Portfolio may also enter into foreign currency forward contracts to gain exposure to a particular currency or to hedge against the risk of loss due to changing currency exchange rates. These derivatives are not accounted for as hedging instruments.
The effect of derivative instruments on the Statement of Operations for the period ended June 30, 2019:
Realized Gain (Loss)
| | | | | | | | | | |
| | | Statement of
Operations
Location | | Equity
Contracts
Risk | | | Total | |
| | | |
Swap Contracts | | Net realized gain (loss) on swap transactions | | $ | (3,185,397 | ) | | $ | (3,185,397 | ) |
| | | | | | |
Total Realized Gain (Loss) | | | | $ | (3,185,397 | ) | | $ | (3,185,397 | ) |
| | | | | | |
Average Notional Amount
| | | | | | | | |
| | | Equity
Contracts
Risk | | | Total | |
| | |
Swap Contracts Long | | $ | 40,952,321 | | | $ | 40,952,321 | |
Swap Contracts Short | | $ | 41,519,093 | | | $ | 41,519,093 | |
| | | | |
Notes to Financial Statements(Unaudited) (continued)
Note 3–Fees and Related Party Transactions
(A) Manager and Subadvisor. New York Life Investments, a registered investment adviser and an indirect,wholly-owned subsidiary of New York Life, serves as the Portfolio’s Manager, pursuant to an Amended and Restated Management Agreement (“Management Agreement”). The Manager provides offices, conducts clerical, recordkeeping and bookkeeping services, and keeps most of the financial and accounting records required to be maintained by the Portfolio. Except for the portion of salaries and expenses that are the responsibility of the Portfolio, the Manager pays the salaries and expenses of all personnel affiliated with the Portfolio and certain operational expenses of the Portfolio. The Portfolio reimburses New York Life Investments in an amount equal to a portion of the compensation of the Chief Compliance Officer attributable to the Portfolio. IndexIQ Advisors LLC (“IndexIQ Advisors” or “Subadvisor”), a registered investment adviser and an affiliate of New York Life Investments, serves as Subadvisor to the Portfolio and is responsible for theday-to-day portfolio management of the Portfolio. Pursuant to the terms of a Subadvisory Agreement (“Subadvisory Agreement”) between New York Life Investments and IndexIQ Advisors, New York Life Investments pays for the services of the Subadvisor.
Prior to the Reorganization, the VP ARMS Portfolio had different subadvisors. Candriam France, a registered investment adviser, served as a subadvisor, pursuant to the terms of a subadvisory agreement between New York Life Investments and Candriam France, and was responsible for theday-to-day portfolio management of a portion of the Portfolio and the Cayman Subsidiary. Cushing® Asset Management, LP (“Cushing”), a registered investment adviser, served as a subadvisor, pursuant to the terms of a subadvisory agreement between New York Life Investments and Cushing, and was responsible for theday-to-day portfolio management of a portion of the VP ARMS Portfolio. MacKay Shields LLC (“MacKay Shields”), a registered investment adviser and an indirect,wholly-owned subsidiary of New York Life, served as a subadvisor, pursuant to the terms of an amended and restated subadvisory agreement between New York Life Investments and MacKay Shields, and was responsible for theday-to-day portfolio management of a portion of the Portfolio. Prior to January 1, 2018, Cornerstone Capital Management Holdings LLC served as a subadvisor to the VP ARMS Portfolio. Effective January 1, 2018, all investment personnel of Cornerstone Capital Management Holdings LLC transitioned to MacKay Shields due to an organizational restructuring. New York Life Investments paid for the services of these subadvisors.
The Cayman Subsidiary had entered into a separate advisory agreement with New York Life Investments for the management of the Cayman Subsidiary’s portfolio pursuant to which the Cayman Subsidiary was obligated to pay New York Life Investments a management fee at the same rate that the VP ARMS Portfolio paid New York Life Investments for services provided to the VP ARMS Portfolio. New York Life Investments was contractually obligated to waive the management fee it received from the VP ARMS Portfolio in an amount equal to the management fee paid to New York Life Investments by the Cayman Subsidiary.
The Fund, on behalf of the Portfolio, pays New York Life Investments in its capacity as the Portfolio’s investment manager and administrator, pursuant to the Management Agreement, a monthly fee for the services
performed and the facilities furnished at an annual rate of 0.75% of the Portfolio’s average daily net assets.
New York Life Investments has contractually agreed to waive fees and/or reimburse expenses so that the total annual operating expenses (excluding taxes, interest, litigation, extraordinary expenses, brokerage and other transaction expenses relating to the purchase or sale of portfolio investments and acquired (underlying) portfolio/fund fees and expenses) do not exceed 0.70% and 0.95% for Initial Class shares and Service Class shares, respectively. This agreement will remain in effect until May 1, 2020, and shall renew automatically for one-year terms unless New York Life Investments provides written notice of termination prior to the start of the next term or upon approval of the Board.
During the six-month period ended June 30, 2019, New York Life Investments earned fees from the Portfolio in the amount of $1,499,895, waived its fees and/or reimbursed expenses in the amount of $396,659, and paid the Subadvisor in the amount of $524,139.
State Street providessub-administration andsub-accounting services to the Portfolio pursuant to an agreement with New York Life Investments. These services include calculating the daily NAVs of the Portfolio, maintaining the general ledger andsub-ledger accounts for the calculation of the Portfolio’s NAVs and assisting New York Life Investments in conducting various aspects of the Portfolio’s administrative operations. For providing these services to the Portfolio, State Street is compensated by New York Life Investments.
Pursuant to an agreement between the Fund and New York Life Investments, New York Life Investments is responsible for providing or procuring certain regulatory reporting services for the Portfolio. The Portfolio will reimburse New York Life Investments for the actual costs incurred by New York Life Investments in connection with providing or procuring these services for the Portfolio.
(B) Distribution and Service Fees. The Fund, on behalf of the Portfolio, has entered into a distribution agreement with NYLIFE Distributors LLC (the “Distributor”), an indirect,wholly-owned subsidiary of New York Life. The Portfolio has adopted a distribution plan (the “Plan”) in accordance with the provisions of Rule 12b-1 under the 1940 Act. Under the Plan, the Distributor has agreed to provide, through its affiliates or independent third parties, various distribution-related, shareholder and administrative support services to the Service Class shareholders. For its services, the Distributor is entitled to a combined distribution and service fee accrued daily and paid monthly at an annual rate of 0.25% of the average daily net assets attributable to the Service Class shares of the Portfolio.
| | |
| 34 | | MainStay VP IQ Hedge Multi-Strategy Portfolio |
(C) Investments in Affiliates (in 000’s). During the six-month period ended June 30, 2019, purchases and sales transactions, income
earned from investments and shares held of investment companies managed by New York Life Investments or its affiliates were as follows:
| | | | | | | | | | | | | | | | | | | | | | | | | | | | | | | | | | | | |
Affiliated Investment Company | | Value,
Beginning
of Period | | | Purchases
at Cost | | | Proceeds
from
Sales | | | Net Realized
Gain/(Loss)
on Sales | | | Change in
Unrealized
Appreciation/
(Depreciation) | | | Value,
End of
Period | | | Dividend
Income | | | Other
Distributions | | | Shares
End of
Period | |
MainStay U.S. Government Liquidity Fund | | $ | — | | | $ | 15,734 | | | $ | (13,974 | ) | | $ | — | | | $ | — | | | $ | 1,760 | | | $ | 37 | | | $ | — | | | | 1,760 | |
Note 4–Federal Income Tax
As of June 30, 2019, the cost and unrealized appreciation (depreciation) of the Portfolio’s investment portfolio, including applicable derivative contracts and other financial instruments, as determined on a federal income tax basis, were as follows:
| | | | | | | | | | | | | | | | |
| | | Federal Tax
Cost | | | Gross
Unrealized
Appreciation | | | Gross
Unrealized
(Depreciation) | | | Net
Unrealized
Appreciation/
(Depreciation) | |
Investments in Securities | | $ | 415,899,703 | | | $ | 6,227,686 | | | $ | (656,357 | ) | | $ | 5,571,329 | |
As of December 31, 2018, for federal income tax purposes, capital loss carryforwards of $72,933,965, as shown in the table below, were available to the extent provided by the regulations to offset future realized gains of the Portfolio through the years indicated. Accordingly, no capital gains distributions are expected to be paid to shareholders until net gains have been realized in excess of such amounts.
| | | | |
Capital Loss
Available Through | | Short-Term
Capital Loss
Amounts (000’s) | | Long-Term
Capital Loss
Amounts (000’s) |
| | |
| Unlimited | | $72,815 | | $119 |
During the year ended December 31, 2018, the tax character of distributions paid as reflected in the Statements of Changes in Net Assets was as follows:
| | |
|
| 2018 |
Tax-Based
Distributions
from Ordinary
Income | | Tax-Based
Distributions
from
Long-Term
Gains |
| |
| $2,915,093 | | $— |
Note 5–Custodian
State Street is the custodian of cash and securities held by the Portfolio. Custodial fees are charged to the Portfolio based on the Portfolio’s net assets and/or the market value of securities held by the Portfolio and the number of certain transactions incurred by the Portfolio.
Note 6–Line of Credit
The Portfolio and certain other funds managed by New York Life Investments maintain a line of credit with a syndicate of banks in order to secure a source of funds for temporary purposes to meet unanticipated or excessive redemption requests.
Effective July 30, 2019, under the credit agreement (the “Credit Agreement”), the aggregate commitment amount is $600,000,000 with an additional uncommitted amount of $100,000,000. The commitment fee is an annual rate of 0.15% of the average commitment amount payable quarterly, regardless of usage, to State Street, who serves as the agent to the syndicate. The commitment fee is allocated among the Portfolio and certain other funds managed by New York Life Investments based upon their respective net assets and other factors. Interest on any revolving credit loan is charged based upon the Federal Funds Rate or the one-month London Interbank Offered Rate (“LIBOR”), whichever is higher. The Credit Agreement expires on July 28, 2020, although the Portfolio, certain other funds managed by New York Life Investments and the syndicate of banks may renew the Credit Agreement for an additional year on the same or different terms. Prior to July 30, 2019, the aggregate commitment amount and the commitment fee were the same as those under the current Credit Agreement. During the six-month period ended June 30, 2019, there were no borrowings made or outstanding with respect to the Portfolio under the Credit Agreement.
Note 7–Interfund Lending Program
Pursuant to an exemptive order issued by the SEC, the Portfolio, along with certain other funds managed by New York Life Investments, may participate in an interfund lending program. The interfund lending program provides an alternative credit facility that permits the Portfolio and certain other funds managed by New York Life Investments to lend or borrow money for temporary purposes directly to or from one another subject to the conditions of the exemptive order. During the six-month period ended June 30, 2019, there were no interfund loans made or outstanding with respect to the Portfolio.
Note 8–Purchases and Sales of Securities (in 000’s)
During the six-month period ended June 30, 2019, purchases and sales of securities, other thanshort-term securities, were $320,675 and $333,151, respectively.
Notes to Financial Statements(Unaudited) (continued)
Note 9–Capital Share Transactions
Transactions in capital shares for the six-month period ended June 30, 2019 and the year ended December 31, 2018, were as follows:
| | | | | | | | |
Initial Class | | Shares | | | Amount | |
| | |
Six-month period ended June 30, 2019: | | | | | | | | |
Shares sold | | | 89,974 | | | $ | 765,451 | |
Shares redeemed | | | (16,439 | ) | | | (140,313 | ) |
| | | | |
Net increase (decrease) | | | 73,535 | | | $ | 625,138 | |
| | | | |
Year ended December 31, 2018: | | | | | | | | |
Shares sold | | | 1,208,739 | | | $ | 10,226,499 | |
Shares issued in connection with the acquisition of MainStay VP Absolute Return Multi-Strategy Portfolio | | | 171,924 | | | | 1,448,027 | |
Shares issued to shareholders in reinvestment of dividends and distributions | | | 21,468 | | | | 180,327 | |
Shares redeemed | | | (17,082,507 | ) | | | (146,009,563 | ) |
| | | | |
Net increase (decrease) | | | (15,680,376 | ) | | $ | (134,154,710 | ) |
| | | | |
| | |
| | | | | | | | |
Service Class | | Shares | | | Amount | |
Six-month period ended June 30, 2019: | | | | | | | | |
Shares sold | | | 701,895 | | | $ | 5,971,466 | |
Shares redeemed | | | (2,591,036 | ) | | | (21,714,049 | ) |
| | | | |
Net increase (decrease) | | | (1,889,141 | ) | | $ | (15,742,583 | ) |
| | | | |
Year ended December 31, 2018: | | | | | | | | |
Shares sold | | | 54,944,534 | | | $ | 461,399,323 | |
Shares issued in connection with the acquisition of MainStay VP Absolute Return Multi-Strategy Portfolio | | | 2,931 | | | | 24,529 | |
Shares issued to shareholders in reinvestment of dividends and distributions | | | 332,206 | | | | 2,734,766 | |
Shares redeemed | | | (55,252,849 | ) | | | (463,028,281 | ) |
| | | | |
Net increase (decrease) | | | 26,822 | | | $ | 1,130,337 | |
| | | | |
Note 10–Fund Acquisitions
At a meeting held on June19-21, 2018, the Board approved the Reorganization Agreement providing for the acquisition of the assets and liabilities of the VP ARMS Portfolio in exchange for shares of the Portfolio, followed by the complete liquidation of the VP ARMS Portfolio. The Reorganization was completed on November 30, 2018. The shareholders of VP ARMS Portfolio received newly-issued Service Class shares in tax-free transactions. The shares were issued at the NAV of the Service Class shares of the VP ARMS Portfolio as of November 30, 2018. Refer to the Statements of Changes in Net Assets and Note 9 for details of the capital transactions in relation to the acquisition. The Reorganization provided shareholders the opportunity to continue to participate in a suitable multi-alternative option of the VP ARMS Portfolio with lower management fees and estimated operating expenses. Additionally, the strategy pursued by the Portfolio provides exposure to sources of return not generally available through traditional equity and fixed-income indices and diversification. The aggregate net assets of the VP ARMS Portfolio immediately before the acquisition and the combined net assets after the acquisition were the same.
The chart below shows a summary of net assets, shares outstanding, net unrealized appreciation/(depreciation), undistributed net investment
income and accumulated net realized gains/(losses), before and after the reorganization:
| | | | | | | | | | | | |
| | | Before
Reorganization | | | After
Reorganization | |
| | | MainStay VP
Absolute
Return
Multi-Strategy
Portfolio* | | | MainStay VP
IQ Hedge
Multi-Strategy
Portfolio | | | MainStay VP
IQ Hedge
Multi-Strategy
Portfolio | |
Net Assets: | | | | | | | | | | | | |
Initial Class | | $ | 7,886,520 | | | $ | 1,448,027 | | | $ | 9,334,547 | |
Service Class | | | 409,673,122 | | | | 24,529 | | | | 409,697,651 | |
Shares Outstanding: | | | | | | | | | | | | |
Initial Class | | | 936,368 | | | | 147,500 | | | | 1,108,292 | |
Service Class | | | 48,946,792 | | | | 2,500 | | | | 48,949,723 | |
Net asset value per share outstanding: | | | | | | | | | | | | |
Initial Class | | $ | 8.42 | | | $ | 9.82 | | | $ | 8.42 | |
Service Class | | $ | 8.37 | | | $ | 9.81 | | | $ | 8.37 | |
Net unrealized appreciation/(depreciation) | | | 1,070,738 | | | | (24,021 | ) | | | 1,046,518 | |
Undistributed net investment income | | | (3,672,195 | ) | | | 4,328 | | | | (3,672,195 | ) |
Accumulated net realized gain/(loss) | | | (84,540,598 | ) | | | (7,951 | ) | | | (84,540,598 | ) |
| * | Represents the accounting survivor. |
Assuming the acquisition of VP ARMS Portfolio had been completed on January 1, 2018, the beginning of the annual reporting period of the Portfolio, the Portfolio’s pro forma results of operations for the period ended December 31, 2018, are as follows (Unaudited):
| | | | |
Net investment income (loss) | | $ | (3,363,799 | ) |
Net realized and unrealized gain (loss) | | | (58,076,467 | ) |
Net change in net assets resulting from operations | | $ | (61,440,266 | ) |
Because the combined investment portfolios have been managed as a single integrated portfolio since the acquisition was completed, it is not practicable to separate the amounts of revenue and earnings of the VP ARMS Portfolio that have been included in the Portfolio’s Statement of Operations since November 30, 2018.
For financial reporting purposes, assets received and shares issued by the Portfolio were recorded at fair value; however, the cost basis of the investments received from VP ARMS Portfolio, in the amount of $198,874,304, was carried forward to align ongoing reporting of the Portfolio’s realized and unrealized gains and losses with amounts distributable to shareholders for tax purposes.
Note 11–Recent Accounting Pronouncements
To improve the effectiveness of fair value disclosure requirements, the Financial Accounting Standards Board recently issued Accounting Standard Update (ASU)2018-13, Fair Value Measurement Disclosure Framework—Changes to the Disclosure Requirements for Fair Value Measurement (ASU2018-13), which adds, removes, and modifies
| | |
| 36 | | MainStay VP IQ Hedge Multi-Strategy Portfolio |
certain aspects relating to fair value disclosure. ASU2018-13 is effective for interim and annual reporting periods beginning after December 15, 2019; early adoption of the additions relating toASU 2018-13 is not required. Management has evaluated the implications of certain other provisions of the ASU and has determined to early adopt aspects related to the removal and modifications of certain fair value measurement disclosures under the ASU effective immediately. At this time, management is evaluating the implications of certain other provisions of the ASU related to new disclosure requirements and any impact on the financial statement disclosures has not yet been determined.
Note 12–Subsequent Events
In connection with the preparation of the financial statements of the Portfolio as of and for the six-month period ended June 30, 2019, events and transactions subsequent to June 30, 2019, through the date the financial statements were issued have been evaluated by the Portfolio’s management for possible adjustment and/or disclosure. No subsequent events requiring financial statement adjustment or disclosure have been identified.
Proxy Voting Policies and Procedures and Proxy Voting Record
A description of the policies and procedures that New York Life Investments uses to vote proxies related to the Portfolio’s securities is available without charge, upon request (i) by calling800-598-2019; (ii) by visiting New York Life Investments website at https://www.nylinvestments.com/mainstay/products-and-performance/mainstay-vp-funds-trust; or (iii) by visiting the SEC’s website at www.sec.gov.
The Portfolio is required to file with the SEC its proxy voting record for the12-month period ending June 30 on Form N-PX. The Portfolio’s most recent Form N-PX or proxy voting record is available free of charge upon request (i) by calling800-598-2019; (ii) by visiting New York Life Investments website at https://www.nylinvestments.com/mainstay/products-and-performance/mainstay-vp-funds-trust; or (iii) by visiting the SEC’s website atwww.sec.gov.
Shareholder Reports and Quarterly Portfolio Disclosure
The Portfolio is required to file its complete schedule of portfolio holdings with the SEC 60 days after each fiscal quarter onForm N-PORT. The Portfolio’s holdings report is available without charge upon request (i) by calling800-598-2019; (ii) by visiting New York Life Investments website at https://www.nylinvestments.com/mainstay/products-and-performance/mainstay-vp-funds-trust; or (iii) on the SEC’s website at www.sec.gov.
| | |
| 38 | | MainStay VP IQ Hedge Multi-Strategy Portfolio |
MainStay VP Portfolios
MainStay VP offers a wide range of Portfolios. The full array of MainStay VP offerings is listed here, with information about the manager, subadvisors, legal counsel, and independent registered public accounting firm.
Equity Portfolios
MainStay VP Eagle Small Cap Growth Portfolio
MainStay VP Emerging Markets Equity Portfolio
MainStay VP Epoch U.S. Equity Yield Portfolio
MainStay VP Fidelity Institutional AM® Utilities Portfolio†
MainStay VP Large Cap Growth Portfolio
MainStay VP MacKay Common Stock Portfolio
MainStay VP MacKay Growth Portfolio
MainStay VP MacKay International Equity Portfolio
MainStay VP MacKay Mid Cap Core Portfolio
MainStay VP MacKay S&P 500 Index Portfolio
MainStay VP MacKay Small Cap Core Portfolio
MainStay VP Mellon Natural Resources Portfolio
MainStay VP T. Rowe Price Equity Income Portfolio
Mixed Asset Portfolios
MainStay VP Balanced Portfolio
MainStay VP Income Builder Portfolio
MainStay VP Janus Henderson Balanced Portfolio
MainStay VP MacKay Convertible Portfolio
Income Portfolios
MainStay VP Bond Portfolio
MainStay VP Floating Rate Portfolio
MainStay VP Indexed Bond Portfolio
MainStay VP MacKay Government Portfolio
MainStay VP MacKay High Yield Corporate Bond Portfolio
MainStay VP MacKay Unconstrained Bond Portfolio
MainStay VP PIMCO Real Return Portfolio
Money Market
MainStay VP U.S. Government Money Market Portfolio
Alternative
MainStay VP Cushing Renaissance Advantage Portfolio
MainStay VP IQ Hedge Multi-Strategy Portfolio
Asset Allocation Portfolios
MainStay VP Conservative Allocation Portfolio
MainStay VP Growth Allocation Portfolio
MainStay VP Moderate Allocation Portfolio
MainStay VP Moderate Growth Allocation Portfolio
Manager
New York Life Investment Management LLC
New York, New York
Subadvisors
Candriam Belgium*
Brussels, Belgium
Cushing Asset Management, LP
Dallas, Texas
Eagle Asset Management, Inc.
St Petersburg, Florida
Epoch Investment Partners, Inc.
New York, New York
FIAM LLC
Smithfield, Rhode Island
IndexIQ Advisors LLC*
New York, New York
Janus Capital Management LLC
Denver, Colorado
MacKay Shields LLC*
New York, New York
Mellon Investments Corporation
Boston, Massachusetts
NYL Investors LLC*
New York, New York
Pacific Investment Management Company LLC
Newport Beach, California
T. Rowe Price Associates, Inc.
Baltimore, Maryland
Winslow Capital Management, LLC
Minneapolis, Minnesota
Distributor
NYLIFE Distributors LLC*
Jersey City, New Jersey
Custodian
State Street Bank and Trust Company
Boston, Massachusetts
Independent Registered Public Accounting Firm
PricewaterhouseCoopers LLP
New York, New York
Legal Counsel
Dechert LLP
Washington, District of Columbia
Some Portfolios may not be available in all products.
| † | Fidelity Institutional AM is a registered trade mark of FMR LLC. Used with permission. |
| * | An affiliate of New York Life Investment Management LLC |
Not part of the Semiannual Report
2019 Semiannual Report
This report is for the general information of New York Life Variable Annuities and NYLIAC Variable Universal Life Insurance Products policyowners. It must be preceded or accompanied by the appropriate product(s) and funds prospectuses if it is given to anyone who is not an owner of a New York Life variable annuity policy or a NYLIAC Variable Universal Life Insurance Product. This report does not offer for sale or solicit orders to purchase securities.
The performance data quoted in this report represents past performance. Past performance is no guarantee of future results. Due to market volatility and other factors, current performance may be lower or higher than the figures shown. The most recent month-end performance summary for your variable annuity or variable life policy is available by calling 800-598-2019 and is updated periodically on www.newyorklife.com.
The New York Life Variable Annuities and NYLIAC Variable Universal Life Insurance Products are issued by New York Life Insurance and Annuity Corporation (a Delaware Corporation) and distributed by NYLIFE Distributors LLC (Member FINRA/SIPC).
New York Life Insurance Company
New York Life Insurance and Annuity Corporation (NYLIAC) (A Delaware Corporation)
51 Madison Avenue, Room 551
New York, NY 10010
www.newyorklife.com
Printed on recycled paper
nylinvestments.com
NYLIFE Distributors LLC, 30 Hudson Street, Jersey City, NJ 07302
New York Life Investment Management LLC is the investment manager to the MainStay VP Funds Trust
©2019 by NYLIFE Distributors LLC. All rights reserved.
You may obtain copies of the Prospectus and the Statement of Additional Information free of charge, upon request, by callingtoll-free 800-598-2019 or writing to New York Life Insurance and Annuity Corporation, 51 Madison Avenue, New York, NY 10010.
| | | | |
| | | |
| Not FDIC Insured | | No Bank Guarantee | | May Lose Value |
| | | | |
| 1781596 | | | | MSVPARM10-08/19 (NYLIAC) NI506 |
MainStay VP PIMCO Real Return Portfolio
Message from the President and Semiannual Report
Unaudited | June 30, 2019

Beginning on January 1, 2021, as permitted by regulations adopted by the Securities and Exchange Commission, paper copies of the MainStay VP Portfolio annual and semi-annual shareholder reports may no longer be sent by mail, unless you specifically request paper copies of the reports from the insurance company that offers your policy. Instead, the reports will be made available online, and you will be notified by mail each time a report is posted and provided with a website link to access the report. Instructions for requesting paper copies will be provided by your insurance company.
If you already elected to receive shareholder reports electronically, you will not be affected by this change and you need not take any action. At any time, you may elect to receive reports and other communications from the insurance company electronically by following the instructions provided by the insurance company.
You may elect to receive all future shareholder reports in paper form free of charge. You can inform the insurance company that you wish to receive paper copies of reports by following the instructions provided by the insurance company. Your election to receive reports in paper form will apply to all portfolio companies available under your contract.
| | | | | | | | |
| | | | | |
| Not FDIC/NCUA Insured | | Not a Deposit | | May Lose Value | | No Bank Guarantee | | Not Insured by Any Government Agency |

This page intentionally left blank
Message from the President
Most equity and fixed-income markets in the United States and around the world advanced in the face of conflicting political and macroeconomic forces during thesix-month period ended June 30, 2019.
The reporting period began on the heels of tumultuous December 2018, during which equities and equity-sensitive bonds spiked sharply lower on concerns regarding the pace of economic growth, a U.S. government shutdown and the potential impact of trade disputes between the United States and other nations, particularly China. Markets recovered quickly in early 2019 as trade tensions eased, the government reopened and the U.S. Federal Reserve Board (Fed) adopted a more patient tone regarding the future direction of interest rates. Markets moved broadly higher from January through April, supported by encouraging economic data and generally strong corporate earnings.
During the first four months of the reporting period, the improving economic environment encouraged investors to favor areas of the market viewed as offering greater return potential along with higher risks. Among U.S. stocks, cyclical, growth-oriented sectors tended to outperform more defensive, value-oriented sectors, whilelarge-cap stocks outperformed theirsmaller-cap counterparts. Within the S&P 500® Index, the information technology sector led the market’s advance, followed by communication services, consumer discretionary and consumer staples. Industrials, utilities, financials, materials, real estate and energy produced more modest gains. While some international equity markets outperformed or underperformed the U.S. market, on average international stocks mirrored the performance of their U.S. counterparts. Fixed-income securities gained ground as well, albeit along a more gradual trajectory. Among U.S. fixed-income instruments, corporate issues generally outperformed government bonds, with lower credit quality, higher yielding securities leading the sector’s advance. Long-term U.S. Treasury bond yields proved particularly weak, with
10-year yields dipping at times below3-month yields, reflecting investors’ continued concerns about domestic economic growth.
May 2019 saw a return of uncertainty and volatility. Trade discussions between the United States and China faltered, driving global equity prices lower. Government bond prices rose as investors sought safe havens. June brought yet anotherU-turn as equity prices climbed again after comments from the Fed raised hopes of an interest rate cut in response to weak economic data. Stock and bond prices rose, with U.S. equity markets ending the reporting period in record territory.
We are pleased to see renewed signs of strength in broad areas of the financial market. At the same time, we remained sharply focused on providing you, as a MainStay VP investor, with the experienced and disciplined fund management that we believe underpins an effective, long-term investment strategy. Whatever tomorrow’s investment environment brings, you can rely on our portfolio managers to pursue the objectives of their individual Portfolios as outlined in the prospectus with the energy and dedication you have come to expect.
The report that follows contains additional information on the market events, investment decisions and specific securities that shaped your VP Portfolio’s performance during the six months ended June 30, 2019. We encourage you to read the report carefully and use it to evaluate your Portfolio’s performance in light of your long-range financial plan.
Sincerely,

Kirk C. Lehneis
President
The opinions expressed are as of the date of this report and are subject to change. There is no guarantee that any forecast made will come to pass. This material does not constitute investment advice and is not intended as an endorsement of any specific investment. Past performance is no guarantee of future results.
Not part of the Semiannual Report
Table of Contents
Investors should refer to the Portfolio’s Summary Prospectus and/or Prospectus and consider the Portfolio’s investment objectives, strategies, risks, charges and expenses carefully before investing. The Summary Prospectus and/or Prospectus contain this and other information about the Portfolio. You may obtain copies of the Portfolio’s Summary Prospectus and/or the Prospectus and the Statement of Additional Information free of charge, upon request, by calling toll-free 800-598-2019, by writing to New York Life Insurance and Annuity Corporation, 51 Madison Avenue, Room 251, New York, New York 10010 or by sending an email to MainStayShareholdersServices@nylim.com. These documents are also available at nylinvestments.com/vpdocuments. Please read the Summary Prospectus and/or Prospectus carefully before investing. MainStay VP Funds Trust portfolios are separate account options which are purchased through a variable insurance or variable annuity contract.
Investment and Performance Comparison1(Unaudited)
Performance data quoted represents past performance. Past performance is no guarantee of future results. Because of market volatility and other factors, current performance may be lower or higher than the figures shown. Investment return and principal value will fluctuate, and as a result, when shares are redeemed, they may be worth more or less than their original cost. The performance table and graph do not reflect any deduction of sales charges, mortality and expense charges, contract charges or administrative charges. Please refer to the Performance Summary appropriate for your policy. For performance information current to the most recent month-end, please call800-598-2019 or visit www.newyorklife.com.
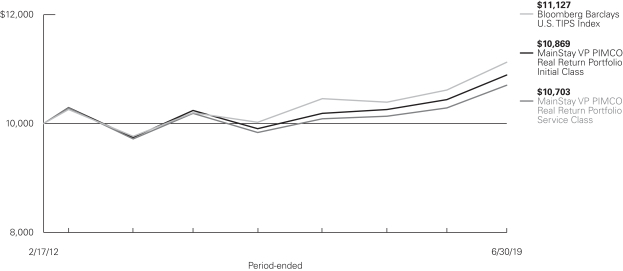
Average Annual Total Returns for the Period-Ended June 30, 2019
| | | | | | | | | | | | | | |
| Class | | Inception
Date | | Six Months | | One Year | | Five Years | | Since Inception | | Gross
Expense
Ratio2 | |
| | | | | | |
| Initial Class Shares | | 2/17/2012 | | 6.62% | | 4.32% | | 1.24% | | 1.16% | | | 1.43 | % |
| Service Class Shares | | 2/17/2012 | | 6.49 | | 4.06 | | 0.99 | | 0.93 | | | 1.68 | |
| | | | | | | | | | | | | | | | |
| Benchmark Performance | | Six Months | | | One Year | | | Five
Years | | | Since Inception | |
| | | | |
Bloomberg Barclays U.S. TIPS Index3 | | | 6.15 | % | | | 4.84 | % | | | 1.76 | % | | | 1.46 | % |
Morningstar Inflation-Protected Bond Category Average4 | | | 5.80 | | | | 4.11 | | | | 1.22 | | | | 0.96 | |
| 1. | Performance figures may reflect certain fee waivers and/or expense limitations, without which total returns may have been different. For information on current fee waivers and/or expense limitations (if any), please refer to the Notes to Financial Statements. |
| 2. | The gross expense ratios presented reflect the Portfolio’s “Total Annual Portfolio Operating Expenses” from the most recent Prospectus, as supplemented, and may differ from other expense ratios disclosed in this report. |
| 3. | The Bloomberg Barclays U.S. TIPS Index is the Portfolio’s primary broad-based securities market index for comparison purposes. The Bloomberg Barclays U.S. TIPS Index includes all publicly issued U.S. Treasury |
| | Inflation-Protected Securities (“TIPS”) that have at least one year remaining to maturity and are rated investment grade. Results assume reinvestment of all dividends and capital gains. An investment cannot be made directly in an index. |
| 4. | The Morningstar Inflation-Protected Bond Category Average is representative of funds that invest primarily in debt securities that adjust their principal values in line with the rate of inflation. These bonds can be issued by any organization, but the U.S. Treasury is currently the largest issuer for these types of securities. Results are based on average total returns of similar funds with all dividends and capital gain distributions reinvested. |
Cost in Dollars of a $1,000 Investment in MainStay VP PIMCO Real Return Portfolio (Unaudited)
The example below is intended to describe the fees and expenses borne by shareholders during thesix-month period from January 1, 2019, to June 30, 2019, and the impact of those costs on your investment.
Example
As a shareholder of the Portfolio you incur two types of costs: (1) transaction costs, including exchange fees and sales charges (loads) on purchases (as applicable), and (2) ongoing costs, including management fees, distribution and/or service(12b-1) fees, and other Portfolio expenses (as applicable). This example is intended to help you understand your ongoing costs (in dollars) of investing in the Portfolio and to compare these costs with the ongoing costs of investing in other mutual funds. The example is based on an investment of $1,000 made at the beginning of thesix-month period and held for the entire period from January 1, 2019, to June 30, 2019. Shares are only sold in connection with variable life and annuity contracts and the example does not reflect any contract level or transactional fees or expenses. If these costs had been included, your costs would have been higher.
This example illustrates your Portfolio’s ongoing costs in two ways:
Actual Expenses
The second and third data columns in the table below provide information about actual account values and actual expenses. You may use the information in these columns, together with the amount you invested, to estimate the expenses that you paid during the six months ended June 30, 2019. Simply divide your account value by $1,000
(for example, an $8,600 account value divided by $1,000 = 8.6), then multiply the result by the number under the heading entitled “Expenses Paid During Period” to estimate the expenses you paid on your account during this period.
Hypothetical Example for Comparison Purposes
The fourth and fifth data columns in the table below provide information about hypothetical account values and hypothetical expenses based on the Portfolio’s actual expense ratio and an assumed rate of return of 5% per year before expenses, which is not the Portfolio’s actual return. The hypothetical account values and expenses may not be used to estimate the actual ending account balances or expenses you paid for thesix-month period shown. You may use this information to compare the ongoing costs of investing in the Portfolio with the ongoing costs of investing in other mutual funds. To do so, compare this 5% hypothetical example with the 5% hypothetical examples that appear in the shareholder reports of the other mutual funds.
Please note that the expenses shown in the table are meant to highlight your ongoing costs only and do not reflect any transactional costs, such as exchange fees or sales charges (loads). Therefore, the fourth and fifth data columns of the table are useful in comparing ongoing costs only and will not help you determine the relative total costs of owning different funds. In addition, if these transactional costs were included, your costs would have been higher.
| | | | | | | | | | | | | | | | | | | | | | |
| | | | | | | | | | | | | | | | | | |
| Share Class | | Beginning
Account
Value
1/1/19 | | | Ending Account
Value (Based
on Actual
Returns and
Expenses)
6/30/19 | | | Expenses
Paid
During
Period1 | | | Ending Account
Value (Based
on Hypothetical
5% Annualized
Return and
Actual Expenses)
6/30/19 | | | Expenses
Paid
During
Period1 | | | Net Expense
Ratio
During
Period2,3 |
| | | | | | |
| Initial Class Shares | | $ | 1,000.00 | | | $ | 1,066.20 | | | $ | 9.07 | | | $ | 1,016.02 | | | $ | 8.85 | | | 1.77% |
| | | | | | |
| Service Class Shares | | $ | 1,000.00 | | | $ | 1,064.90 | | | $ | 10.34 | | | $ | 1,014.78 | | | $ | 10.09 | | | 2.02% |
| 1. | Expenses are equal to the Portfolio’s annualized expense ratio of each class multiplied by the average account value over the period, divided by 365 and multiplied by 181 (to reflect thesix-month period). The table above represents the actual expenses incurred during thesix-month period. In addition to the fees and expenses which the Portfolio bears directly, it also indirectly bears a pro rata share of the fees and expenses of the underlying funds in which it invests. Such indirect expenses are not included in the above-reported expense figures. |
| 2. | Expenses are equal to the Portfolio’s annualized expense ratio to reflect thesix-month period. |
| 3. | Expenses are inclusive of dividends and interest on investments sold short. |
| | |
| 6 | | MainStay VP PIMCO Real Return Portfolio |
Portfolio Composition as of June 30, 2019(Unaudited)
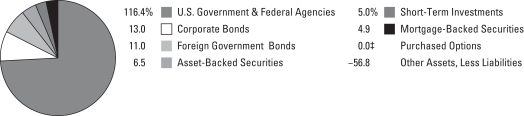
See Portfolio of Investments beginning on page 10 for specific holdings within these categories. The Portfolio’s holdings are subject to change.
| ‡ | Less thanone-tenth of a percent. |
Top Ten Issuers Held as of June 30, 2019(excluding short-term investments) (Unaudited)
| 1. | United States Treasury Inflation—Indexed Notes, 0.125%–1.375%, due 1/15/20–1/15/29 |
| 2. | United States Treasury Inflation—Indexed Bonds, 0.375%–3.375%, due 4/15/23–2/15/49 |
| 3. | Federal National Mortgage Association (Mortgage Pass-Through Securities), 3.50%–4.757%, due 11/1/34–4/29/48 |
| 4. | United Kingdom Gilt Inflation Linked, 0.125%–1.875%, due 11/22/22–11/22/65 |
| 5. | French Republic Government Bond OAT, 0.10%–2.25%, due 7/25/20–7/25/27 |
| 6. | Nykredit Realkredit A/S, 1.00%–2.50%, due 10/1/47–10/1/50 |
| 7. | BRFkredit A/S, 1.00%, due 10/1/50 |
| 8. | Japanese Government CPI Linked Bond, 0.10%, due 3/10/28–3/10/29 |
| 9. | New Zealand Government Inflation Linked Bond, 2.00%–3.00%, due 9/20/25–9/20/35 |
| 10. | Paragon Mortgages No.13 PLC, 1.167%, due 1/15/39 |
Portfolio Management Discussion and Analysis(Unaudited)
Answers to the questions reflect the views of portfolio managers Mihir Worah and Stephen A. Rodosky of Pacific Investment Management Company LLC (“PIMCO”), the Portfolio’s Subadvisor.
How did MainStay VP PIMCO Real Return Portfolio perform relative to its benchmark and peers during the six months ended June 30, 2019?
For the six months ended June 30, 2019, MainStay VP PIMCO Real Return Portfolio returned 6.62% for Initial Class shares and 6.49% for Service Class shares. Over the same period, both share classes outperformed the 6.15% return of the Bloomberg Barclays U.S. TIPS Index,1 which is the Portfolio’s benchmark, and the 5.80% return of the Morningstar Inflation-Protected Bond Category Average.
What factors affected the Portfolio’s performance relative to its primary prospectus benchmark during the reporting period?
Several strategies contributed positively to the Portfolio’s performance relative to the Bloomberg Barclays U.S. TIPS Index during the reporting period. These included:
| • | | Holding overweight exposure to U.S. real duration2 (nominal interest rates minus the inflation rate) as U.S. interest rates fell amid the Federal Reserve’s shift to a more dovish stance; |
| • | | Maintaining overweight exposure to German nominal duration as German interest rates fell; |
| • | | Adopting tactical short exposure to eurozone breakeven inflation (the difference between nominal and real yields) as regional inflation expectations in the region eased; |
| • | | Within spread3 sectors, holding positions in residential mortgage-backed securities and investment-grade corporate credit as spreads generally tightened; and |
| • | | Holding positions in emerging-market currencies, particularly the Russian ruble, as these appreciated versus the U.S. dollar. |
(Contributions take weightings and total returns into account.)
The primary strategy that detracted from the Portfolio’s relative performance during the reporting period was maintaining short nominal duration exposure in the United States, the U.K., France and Italy as interest rates generally fell globally.
During the reporting period, how was the Portfolio’s performance materially affected by investments in derivatives?
The use of long futures and options on the German nominal yield curve4 contributed positively to the Portfolio’s performance as yields declined. On the other hand, short exposures to
nominal duration in the United States, U.K., France and Italy, which the Portfolio established in part by use of futures, options and swaps, detracted from performance. Within spread sectors, smallbuy-protection positions on high-yield credit default swaps indices (CDX) modestly detracted from performance as spreads generally narrowed over the reporting period. Currency exposure, established using currency forwards, contributed positively to overall performance.
Derivatives may be used in the Portfolio to gain or decrease exposure to securities, markets or sectors; as a substitute for exposure that may not otherwise be accessible through cash bonds; for purposes of liquidity; or to take advantage of anticipated changes in market volatility.
What was the Portfolio’s duration strategy during the reporting period?
Throughout the reporting period, the Portfolio’s overall duration remained underweight relative to the Bloomberg Barclays U.S. TIPS Index. However, the Portfolio maintained an overweight to real duration in the United States, with a duration concentration to the intermediate andlong-end segments of the real yield curve. The Portfolio reduced the extent of its underweight relative to the benchmark during the reporting period, ending with a duration of 7.49 years as of June 30, 2019, compared to a duration of 7.55 years for the Bloomberg Barclays U.S. TIPS Index as of the same date.
What specific factors, risks or market forces prompted significant decisions for the Portfolio during the reporting period?
The Portfolio’s total duration remained shorter than the duration of the benchmark throughout the reporting period, with the majority of the underweight being sourced primarily from French and Italian nominal rates. The Portfolio also had short exposure to nominal rates in Japan and the U.K.; however, we brought these positions to neutral amid a dovish pivot in global central bank rhetoric and looming Brexit uncertainties. The Portfolio maintained an overweight to real duration and inflation exposure in the U.S., given relatively attractive levels of inflation expectations and the possible reemergence of inflation risk premiums. Within currencies, the Portfolio held varied positions but generally maintained long exposure to a diversified basket of higher-yielding emerging-market currencies.
| 1. | See page 5 for more information on benchmark and peer group returns. |
| 2. | Duration is a measure of the price sensitivity of a fixed-income investment to changes in interest rates. Duration is expressed as a number of years and is considered a more accurate sensitivity gauge than average maturity. |
| 3. | The terms “spread” and “yield spread” may refer to the difference in yield between a security or type of security and comparable U.S. Treasury issues. The terms may also refer to the difference in yield between two specific securities or types of securities at a given time. |
| 4. | The yield curve is a line that plots the yields of various securities of similar quality—typically U.S. Treasury issues—across a range of maturities. The U.S. Treasury yield curve serves as a benchmark for other debt and is used in economic forecasting. |
| | |
| 8 | | MainStay VP PIMCO Real Return Portfolio |
During the reporting period, which market segments were the strongest positive contributors to the Portfolio’s performance and which market segments were particularly weak?
Within real duration, the Portfolio’s long position in U.S. Treasury Inflation-Protected Securities (TIPS) added to performance as rates across the real yield curve declined. On the other hand, underweight nominal duration positions, specifically in the United States, U.K., France and Italy, detracted from performance amid falling global rates, while overweight duration positions in Germany enhanced returns. Falling inflation expectations in the eurozone supported performance given the Portfolio’s short exposure to eurozone breakeven inflation rates.Out-of-benchmark exposures to spread sectors such as investment-grade corporate credit and residential mortgage-backed securities contributed positively amid spread tightening. Lastly, currency strategies, namely a long position in the Russian ruble, bolstered performance over the reporting period.
Did the Portfolio make any significant purchases or sales during the reporting period?
The Portfolio increased overall duration and thus reduced its underweight position relative to the benchmark. In terms of
nominal duration, as mentioned earlier, the Portfolio largely sold its short positions in Japan and the U.K., while increasing short positions in France and Italy. Regarding inflation-linked duration exposure, the Portfolio moderately reduced its long positions in the United States and its short positions in the eurozone. Among currencies, the Portfolio added a long position to the Brazilian real while selling the Colombian peso.
How was the Portfolio positioned at the end of the reporting period?
As of June 30, 2019, the Portfolio held overweight exposure to U.S. TIPS relative to the Bloomberg Barclays U.S. TIPS Index, while maintaining a defensive posture towards nominal yields. As of the same date, the Portfolio maintainedout-of-index exposure to mortgage-backed securities, corporate securities, bonds ofnon-U.S. developed nations and U.S. dollar-denominated emerging-market securities.
The opinions expressed are those of the portfolio managers as of the date of this report and are subject to change. There is no guarantee that any forecasts will come to pass. This material does not constitute investment advice and is not intended as an endorsement of any specific investment.
Not all MainStay VP Portfolios and/or share classes are available under all policies.
Portfolio of InvestmentsJune 30, 2019 (Unaudited)
| | | | | | | | |
| | | Principal Amount | | | Value | |
Long-Term Bonds 151.8%† Asset-Backed Securities 6.5% | | | | | |
Other Asset-Backed Securities 6.5% | | | | | |
Argent Securities, Inc.
Series 2006-W4, Class A2C
2.589% (1 Month LIBOR + 0.16%), due 5/25/36 (a) | | $ | 331,016 | | | $ | 122,874 | |
Atrium CDO Corp.
Series 2012-A, Class AR
3.591% (1 Month LIBOR + 0.83%), due 4/22/27 (a)(b) | | | 300,000 | | | | 299,027 | |
Black Diamond CLO, Ltd.
Series 2015-1A, Class A1R
0.65% (1 Month LIBOR + 0.65%), due 10/3/29 (a)(b) | | EUR | 260,000 | | | | 295,692 | |
Catamaran CLO, Ltd.
Series 2013-1A, Class AR
3.614% (1 Month LIBOR + 0.85%), due 1/27/28 (a)(b) | | $ | 1,180,000 | | | | 1,174,767 | |
CIFC Funding, Ltd.
Series 2015-2A, Class AR
3.567% (1 Month LIBOR + 0.78%), due 4/15/27 (a)(b) | | | 1,460,000 | | | | 1,454,515 | |
Colony American Finance Trust
Series 2017-1, Class A
2.968%, due 10/15/49 (b) | | | 75,349 | | | | 75,768 | |
Countrywide Asset-Backed CertificatesSeries 2007-08, Class 1A1
2.619% (1 Month LIBOR + 0.19%), due 11/25/37 (a) | | | 856,763 | | | | 821,968 | |
Credit-Based Asset Servicing & Securitization LLC
Series 2007-CB6, Class A3
2.649% (1 Month LIBOR + 0.22%), due 7/25/37 (a)(b) | | | 1,216,102 | | | | 817,610 | |
Halcyon Loan Advisors Funding, Ltd.
Series 2015-1A, Class AR
3.681% (1 Month LIBOR + 0.92%), due 4/20/27 (a)(b) | | | 299,820 | | | | 299,062 | |
Jamestown CLO IV, Ltd.
Series 2014-4A, Class A1AR
3.477% (1 Month LIBOR + 0.69%), due 7/15/26 (a)(b) | | | 323,709 | | | | 322,773 | |
Jamestown CLO VII, Ltd.
Series 2015-7A, Class A1R
3.60% (1 Month LIBOR + 0.83%), due 7/25/27 (a)(b) | | | 1,450,000 | | | | 1,444,836 | |
Jubilee CDO B.V.
Series 2015-16A, Class A1R
0.49% (1 Month LIBOR + 0.80%), due 12/15/29 (a)(b) | | EUR | 1,660,000 | | | | 1,880,902 | |
| | | | | | | | |
| | | Principal Amount | | | Value | |
Other Asset-Backed Securities (continued) | |
KVK CLO, Ltd.
Series 2013-1A, Class AR
3.697%, due 1/14/28 (b) | | $ | 1,660,000 | | | $ | 1,652,122 | |
Legacy Mortgage Asset Trust
Series 2019-GS3, Class A1
3.75%, due 4/25/59 (b)(c) | | | 196,155 | | | | 198,308 | |
Long Beach Mortgage Loan Trust
Series 2006-7, Class 2A2
2.549% (1 Month LIBOR + 0.12%), due 8/25/36 (a) | | | 289,278 | | | | 148,649 | |
Marathon CLO V, Ltd.
Series 2013-5A, Class A1R
3.511% (1 Month LIBOR + 0.87%), due 11/21/27 (a)(b) | | | 1,660,000 | | | | 1,648,402 | |
Marlette Funding Trust
Series 2019-3A, Class A
2.69%, due 9/17/29 (b) | | | 200,000 | | | | 199,984 | |
Navient Student Loan Trust
Series 2016-7A, Class A
3.579% (1 Month LIBOR + 1.15%), due 3/25/66 (a)(b) | | | 421,183 | | | | 422,766 | |
New Residential Mortgage Loan Trust
Series 2018-3A, Class A1
4.50%, due 5/25/58 (b) | | | 258,901 | | | | 272,806 | |
OCP CLO, Ltd. (a)(b) | | | | | | | | |
Series 2015-10A, Class A1R
3.584% (1 Month LIBOR + 0.82%), due 10/26/27 | | | 1,660,000 | | | | 1,655,284 | |
Series 2015-9A, Class A1R
3.587% (1 Month LIBOR + 0.80%), due 7/15/27 | | | 300,000 | | | | 299,944 | |
RASC Trust (a) | | | | | | | | |
Series 2006-KS6, Class A4
2.679% (1 Month LIBOR + 0.25%), due 8/25/36 | | | 388,694 | | | | 387,743 | |
Series 2005-KS8, Class M4
3.314% (1 Month LIBOR + 0.59%), due 8/25/35 | | | 600,000 | | | | 600,939 | |
Residential Asset Securities Corp.
Series 2006-EMX4, Class A4
2.889% (1 Month LIBOR + 0.23%), due 6/25/36 (a) | | | 1,000,000 | | | | 970,641 | |
Saxon Asset Securities Trust
Series 2007-03, Class A1
2.739% (1 Month LIBOR + 0.31%), due 9/25/47 (a) | | | 203,359 | | | | 197,568 | |
Securitized Asset-Backed Receivables LLC Trust (a)
Series 2006-HE2, Class A2C
2.579% (1 Month LIBOR + 0.15%), due 7/25/36 | | | 241,144 | | | | 131,750 | |
| | | | |
| 10 | | MainStay VP PIMCO Real Return Portfolio | | The notes to the financial statements are an integral part of,
and should be read in conjunction with, the financial statements. |
| | | | | | | | |
| | | Principal Amount | | | Value | |
| Asset-Backed Securities (continued) | |
Other Asset-Backed Securities (continued) | |
Securitized Asset-Backed Receivables LLC Trust (continued) | | | | | | | | |
Series 2006-HE1, Class A2C
2.589% (1 Month LIBOR + 0.16%), due 7/25/36 | | $ | 681,492 | | | $ | 350,188 | |
SLM Student Loan Trust
Series 2003-5, Class A5,
Series Reg S (zero coupon) (3 Month EURIBOR + 0.27%), due 6/17/24 (a) | | EUR | 43,476 | | | | 49,261 | |
Series 2004-2, Class A5
0.204% (3 Month EURIBOR + 0.18%), due 1/25/24 (a) | | | 163,879 | | | | 185,933 | |
Series 2013-B, Class A2A
1.85%, due 6/17/30 (b) | | $ | 49,614 | | | | 49,550 | |
Series 2004-3A, Class A6B
3.32% (3 Month LIBOR + 0.55%), due 10/25/64 (a)(b) | | | 500,000 | | | | 492,839 | |
Series 2011-B, Class A3
4.689% (1 Month LIBOR + 2.25%), due 6/16/42 (a)(b) | | | 190,000 | | | | 192,163 | |
Sofi Professional Loan Program LLC
Series 2017-F, Class A1FX
2.05%, due 1/25/41 (b) | | | 265,861 | | | | 265,294 | |
Soundview Home Equity Loan Trust (a)
Series 2007-OPT2, Class 2A3
2.609% (1 Month LIBOR + 0.18%), due 7/25/37 | | | 256,580 | | | | 235,111 | |
Series 2007-OPT1, Class 1A1
2.629% (1 Month LIBOR + 0.20%), due 6/25/37 | | | 379,570 | | | | 281,546 | |
SpringCastle Funding Asset-Backed Notes
Series 2019-AA, Class A
3.20%, due 5/27/36 (b) | | | 968,546 | | | | 979,655 | |
THL Credit Wind River CLO, Ltd.
Series 2012-1A, Class AR2
3.282% (3 Month LIBOR + 0.88%), due 1/15/26 (a)(b) | | | 400,000 | | | | 400,000 | |
Venture CLO, Ltd.
Series 2018-35A, Class AS
3.797% (1 Month LIBOR + 1.15%), due 10/22/31 (a)(b) | | | 200,000 | | | | 199,786 | |
Venture XX CLO, Ltd.
Series 2015-20A, Class AR
3.607% (1 Month LIBOR + 0.82%), due 4/15/27 (a)(b) | | | 970,000 | | | | 967,072 | |
Venture XXI CLO, Ltd.
Series 2015-21A, Class AR
3.667% (1 Month LIBOR + 0.88%), due 7/15/27 (a)(b) | | | 400,000 | | | | 399,995 | |
| | | | | | | | |
| | | Principal Amount | | | Value | |
Other Asset-Backed Securities (continued) | |
Voya CLO, Ltd.
Series 2014-3A, Class A1R
3.49% (1 Month LIBOR + 0.72%), due 7/25/26 (a)(b) | | $ | 462,916 | | | $ | 461,694 | |
Wachovia Mortgage Loan Trust LLC
Series 2005-WMC1, Class M1
3.089% (1 Month LIBOR + 0.66%), due 10/25/35 (a) | | | 27,112 | | | | 27,064 | |
Z Capital Credit Partners CLO, Ltd.
Series 2015-1A, Class A1R
3.728% (1 Month LIBOR + 0.95%), due 7/16/27 (a)(b) | | | 570,000 | | | | 568,128 | |
| | | | | | | | |
Total Asset-Backed Securities
(Cost $23,948,880) | | | | | | | 23,901,979 | |
| | | | | | | | |
|
| Corporate Bonds 13.0% | |
Agriculture 0.1% | |
BAT Capital Corp.
3.118% (1 Month LIBOR + 0.59%), due 8/14/20 (a) | | | 500,000 | | | | 501,205 | |
| | | | | | | | |
| |
Auto Manufacturers 0.6% | | | | | |
FCE Bank PLC
Series Reg S
0.189% (3 Month EURIBOR + 0.50%), due 8/26/20 (a) | | EUR | 800,000 | | | | 904,806 | |
Series Reg S
1.875%, due 6/24/21 | | | 900,000 | | | | 1,045,960 | |
Volkswagen Group of America Finance LLC
4.00%, due 11/12/21 (b) | | $ | 200,000 | | | | 206,427 | |
| | | | | | | | |
| | | | | | | 2,157,193 | |
| | | | | | | | |
Banks 4.6% | | | | | |
Banco Bilbao Vizcaya Argentaria S.A.
Series Reg S
5.875% (3 Month LIBOR + 5.66%), due 9/24/23 (a)(d) | | EUR | 400,000 | | | | 470,236 | |
Bank of America Corp.
5.875%, due 3/15/28 (d)(e) | | $ | 190,000 | | | | 198,322 | |
Barclays Bank PLC
2.98% (3 Month LIBOR + 0.40%), due 10/25/19 (a)(b) | | | 2,000,000 | | | | 2,001,925 | |
Cooperatieve Rabobank U.A. (a)(d)
Series Reg S
5.50% (EUR 5 Year Interest Swap Rate + 5.25%), due 6/29/20 | | EUR | 200,000 | | | | 236,517 | |
Series Reg S
6.625% (EUR 5 Year Interest Swap Rate + 6.697%), due 6/29/21 | | | 200,000 | | | | 251,556 | |
| | | | | | |
The notes to the financial statements are an integral part of,
and should be read in conjunction with, the financial statements. | | | | | 11 | |
Portfolio of InvestmentsJune 30, 2019 (Unaudited) (continued)
| | | | | | | | |
| | | Principal Amount | | | Value | |
| Corporate Bonds (continued) | |
Banks (continued) | |
Credit Suisse Group Funding Guernsey, Ltd.
3.80%, due 9/15/22 | | $ | 300,000 | | | $ | 311,011 | |
Deutsche Bank A.G.
4.25%, due 10/14/21 | | | 1,400,000 | | | | 1,419,287 | |
Goldman Sachs Group, Inc.
3.61% (3 Month LIBOR + 1.20%), due 9/15/20 (a) | | | 1,300,000 | | | | 1,312,472 | |
ING Bank N.V.
2.625%, due 12/5/22 (b) | | | 400,000 | | | | 407,800 | |
Intesa Sanpaolo S.p.A.
6.50%, due 2/24/21 (b) | | | 400,000 | | | | 420,986 | |
Lloyds Banking Group PLC (a)
3.186% (3 Month LIBOR + 0.80%), due 6/21/21 | | | 400,000 | | | | 400,135 | |
Series Reg S
6.375% (EUR 5 Year Interest Swap Rate + 5.29%), due 6/27/20 (d) | | EUR | 200,000 | | | | 235,623 | |
Nykredit Realkredit A/S
Series Reg S
1.00%, due 10/1/50 | | DKK | 29,000,000 | | | | 4,351,668 | |
Series Reg S
2.50%, due 10/1/47 | | | 12,409 | | | | 1,979 | |
Realkredit Danmark A/S
2.50%, due 7/1/47 | | | 71,133 | | | | 11,325 | |
Royal Bank of Scotland Group PLC
3.899% (3 Month LIBOR + 0.80%), due 6/25/24 (a) | | $ | 300,000 | | | | 299,346 | |
4.519%, due 6/25/24 (e) | | | 200,000 | | | | 208,307 | |
State Bank of India
Series Reg S
3.539% (3 Month LIBOR + 0.95%), due 4/6/20 (a) | | | 700,000 | | | | 701,251 | |
Toronto-Dominion Bank
2.25%, due 3/15/21 (b) | | | 600,000 | | | | 601,776 | |
UBS A.G.
3.031% (3 Month LIBOR + 0.58%), due 6/8/20 (a)(b) | | | 800,000 | | | | 803,102 | |
UniCredit S.p.A.
7.83%, due 12/4/23 (b) | | | 1,900,000 | | | | 2,159,635 | |
| | | | | | | | |
| | | | | | | 16,804,259 | |
| | | | | | | | |
Beverages 0.8% | | | | | |
Keurig Dr Pepper, Inc.
3.551%, due 5/25/21 | | | 1,000,000 | | | | 1,021,551 | |
4.057%, due 5/25/23 (b) | | | 100,000 | | | | 104,988 | |
Pernod-Ricard S.A.
5.75%, due 4/7/21 (b) | | | 1,600,000 | | | | 1,689,422 | |
| | | | | | | | |
| | | | | | | 2,815,961 | |
| | | | | | | | |
| | | | | | | | |
| | | Principal Amount | | | Value | |
Commercial Services 0.1% | | | | | |
ERAC USA Finance LLC
4.50%, due 8/16/21 (b) | | $ | 400,000 | | | $ | 416,981 | |
| | | | | | | | |
| |
Computers 0.3% | | | | | |
EMC Corp.
2.65%, due 6/1/20 | | | 1,100,000 | | | | 1,093,971 | |
| | | | | | | | |
| |
Diversified Financial Services 1.4% | | | | | |
AerCap Ireland Capital DAC / AerCap Global Aviation Trust
4.625%, due 10/30/20 | | | 100,000 | | | | 102,540 | |
Ally Financial, Inc.
4.125%, due 3/30/20 | | | 400,000 | | | | 403,868 | |
BRFkredit A/S
Series Reg S
1.00%, due 10/1/50 | | DKK | 18,400,000 | | | | 2,760,217 | |
Jyske Realkredit A/S
2.50%, due 10/1/47 | | | 43,709 | | | | 6,972 | |
National Rural Utilities Cooperative Finance Corp.
2.694% (3 Month LIBOR + 0.375%), due 6/30/21 (a) | | $ | 100,000 | | | | 100,248 | |
Nordea Kredit Realkreditaktieselskab
Series Reg S
1.00%, due 10/1/50 | | DKK | 11,800,000 | | | | 1,770,679 | |
2.50%, due 10/1/47 | | | 14,028 | | | | 2,235 | |
| | | | | | | | |
| | | | | | | 5,146,759 | |
| | | | | | | | |
Electric 0.9% | | | | | |
Chugoku Electric Power Co., Inc.
Series Reg S
2.701%, due 3/16/20 | | $ | 500,000 | | | | 500,400 | |
Consolidated Edison Co. of New York, Inc.
2.749% (3 Month LIBOR + 0.40%), due 6/25/21 (a) | | | 100,000 | | | | 100,250 | |
Duke Energy Corp.
3.028% (3 Month LIBOR + 0.50%), due 5/14/21 (a)(b)(f) | | | 900,000 | | | | 902,169 | |
IPALCO Enterprises, Inc.
3.45%, due 7/15/20 | | | 500,000 | | | | 503,020 | |
NextEra Energy Capital Holdings, Inc. (a)
2.835% (3 Month LIBOR + 0.315%), due 9/3/19 | | | 560,000 | | | | 560,196 | |
2.921% (3 Month LIBOR + 0.40%), due 8/21/20 | | | 600,000 | | | | 599,660 | |
Southern Power Co.
2.937% (3 Month LIBOR + 0.55%), due 12/20/20 (a)(b) | | | 300,000 | | | | 300,004 | |
| | | | | | | | |
| | | | | | | 3,465,699 | |
| | | | | | | | |
| | | | |
| 12 | | MainStay VP PIMCO Real Return Portfolio | | The notes to the financial statements are an integral part of,
and should be read in conjunction with, the financial statements. |
| | | | | | | | |
| | | Principal Amount | | | Value | |
| Corporate Bonds (continued) | |
Gas 0.4% | | | | | |
Sempra Energy
2.86% (3 Month LIBOR + 0.45%), due 3/15/21 (a) | | $ | 100,000 | | | $ | 99,582 | |
Southern Co. Gas Capital Corp.
3.50%, due 9/15/21 | | | 1,400,000 | | | | 1,431,840 | |
| | | | | | | | |
| | | | | | | 1,531,422 | |
| | | | | | | | |
Home Builders 0.2% | | | | | |
D.R. Horton, Inc.
4.00%, due 2/15/20 | | | 900,000 | | | | 906,366 | |
| | | | | | | | |
| |
Machinery—Diversified 0.5% | | | | | |
John Deere Capital Corp.
2.633% (3 Month LIBOR + 0.29%), due 6/22/20 (a) | | | 1,100,000 | | | | 1,101,800 | |
Wabtec Corp.
3.71% (3 Month LIBOR + 1.30%), due 9/15/21 (a) | | | 600,000 | | | | 598,282 | |
| | | | | | | | |
| | | | | | | 1,700,082 | |
| | | | | | | | |
Media 0.3% | | | | | |
Charter Communications Operating LLC / Charter Communications Operating Capital Corp.
3.579%, due 7/23/20 | | | 800,000 | | | | 807,172 | |
DISH DBS Corp.
5.125%, due 5/1/20 | | | 300,000 | | | | 301,497 | |
| | | | | | | | |
| | | | | | | 1,108,669 | |
| | | | | | | | |
Miscellaneous—Manufacturing 0.2% | | | | | |
Textron, Inc.
3.095% (3 Month LIBOR + 0.55%), due 11/10/20 (a) | | | 580,000 | | | | 579,764 | |
| | | | | | | | |
| |
Oil & Gas 0.3% | | | | | |
Petrobras Global Finance B.V.
5.999%, due 1/27/28 | | | 706,000 | | �� | | 750,478 | |
6.125%, due 1/17/22 | | | 33,000 | | | | 35,348 | |
6.625%, due 1/16/34 | | GBP | 100,000 | | | | 141,282 | |
| | | | | | | | |
| | | | | | | 927,108 | |
| | | | | | | | |
Pharmaceuticals 0.2% | | | | | |
Teva Pharmaceutical Finance Netherlands III B.V.
2.80%, due 7/21/23 | | $ | 800,000 | | | | 692,000 | |
| | | | | | | | |
| |
Pipelines 0.6% | | | | | |
Enbridge, Inc. (a)
2.984% (3 Month LIBOR + 0.40%), due 1/10/20 | | | 600,000 | | | | 600,136 | |
3.11% (3 Month LIBOR + 0.70%), due 6/15/20 | | | 800,000 | | | | 802,174 | |
| | | | | | | | |
| | | Principal Amount | | | Value | |
Pipelines (continued) | |
Florida Gas Transmission Co LLC
5.45%, due 7/15/20 (b) | | $ | 700,000 | | | $ | 718,199 | |
Spectra Energy Partners, L.P.
3.179% (3 Month LIBOR + 0.70%), due 6/5/20 (a) | | | 100,000 | | | | 100,291 | |
| | | | | | | | |
| | | | | | | 2,220,800 | |
| | | | | | | | |
Real Estate Investment Trusts 0.1% | | | | | |
American Tower Corp.
3.30%, due 2/15/21 | | | 300,000 | | | | 303,727 | |
| | | | | | | | |
| |
Semiconductors 0.4% | | | | | |
Broadcom Corp. / Broadcom Cayman Finance, Ltd.
2.375%, due 1/15/20 | | | 1,500,000 | | | | 1,497,393 | |
| | | | | | | | |
| |
Software 0.1% | | | | | |
Fidelity National Information Services, Inc.
2.25%, due 8/15/21 | | | 500,000 | | | | 498,975 | |
| | | | | | | | |
| |
Telecommunications 0.7% | | | | | |
AT&T, Inc.
3.27% (3 Month LIBOR + 0.75%), due 6/1/21 (a) | | | 500,000 | | | | 502,473 | |
3.547% (3 Month LIBOR + 0.95%), due 7/15/21 (a) | | | 800,000 | | | | 806,981 | |
5.15%, due 2/15/50 | | | 300,000 | | | | 331,232 | |
5.30%, due 8/15/58 | | | 100,000 | | | | 111,375 | |
Sprint Corp.
7.25%, due 9/15/21 | | | 300,000 | | | | 318,750 | |
Telstra Corp., Ltd.
4.80%, due 10/12/21 (b) | | | 300,000 | | | | 315,612 | |
| | | | | | | | |
| | | | | | | 2,386,423 | |
| | | | | | | | |
Transportation 0.1% | | | | | |
TTX Co.
2.60%, due 6/15/20 (b) | | | 300,000 | | | | 300,197 | |
| | | | | | | | |
| |
Trucking & Leasing 0.0%‡ | | | | | |
Park Aerospace Holdings, Ltd.
5.25%, due 8/15/22 (b) | | | 100,000 | | | | 105,580 | |
| | | | | | | | |
| |
Utilities 0.1% | | | | | |
Dominion Energy Gas Holdings LLC
3.01% (3 Month LIBOR + 0.60%), due 6/15/21 (a) | | | 400,000 | | | | 401,777 | |
| | | | | | | | |
Total Corporate Bonds
(Cost $47,044,065) | | | | | | | 47,562,311 | |
| | | | | | | | |
| | | | | | |
The notes to the financial statements are an integral part of,
and should be read in conjunction with, the financial statements. | | | | | 13 | |
Portfolio of InvestmentsJune 30, 2019 (Unaudited) (continued)
| | | | | | | | |
| | | Principal Amount | | | Value | |
| Foreign Government Bonds 11.0% | |
Argentina 0.1% | | | | | |
Argentina Bocon
40.244% (BADLARPP Index + 0.00%), due 10/4/22 (a) | | ARS | 100,000 | | | $ | 3,778 | |
Argentina Bonar Bonds
52.006% (BADLARPP Index + 2.00%), due 4/3/22 (a) | | | 2,854,000 | | | | 66,917 | |
Argentina POM Politica Monetaria
63.705%, due 6/21/20 (g) | | | 20,103,000 | | | | 470,640 | |
| | | | | | | | |
| | | | | | | 541,335 | |
| | | | | | | | |
Australia 0.6% | | | | | |
Australia Government Bond
Series Reg S
1.25%, due 2/21/22 | | AUD | 980,000 | | | | 818,710 | |
Series Reg S
3.00%, due 9/20/25 | | | 1,450,000 | | | | 1,500,909 | |
| | | | | | | | |
| | | | | | | 2,319,619 | |
| | | | | | | | |
Canada 0.3% | | | | | |
Canadian Government Real Return Bond
4.25%, due 12/1/26 | | CAD | 928,974 | | | | 927,435 | |
| | | | | | | | |
| |
France 2.8% | | | | | |
French Republic Government Bond OAT
Series Reg S
0.10%, due 3/1/25 | | EUR | 1,090,751 | | | | 1,324,392 | |
Series Reg S
1.10%, due 7/25/22 | | | 4,199,167 | | | | 5,148,288 | |
Series Reg S
1.85%, due 7/25/27 | | | 2,214,472 | | | | 3,150,153 | |
Series Reg S
2.25%, due 7/25/20 | | | 638,330 | | | | 752,556 | |
| | | | | | | | |
| | | | | | | 10,375,389 | |
| | | | | | | | |
Japan 0.7% | | | | | |
Japanese Government CPI Linked Bond
0.10%, due 3/10/28 | | JPY | 189,866,840 | | | | 1,837,488 | |
0.10%, due 3/10/29 | | | 82,242,720 | | | | 796,377 | |
| | | | | | | | |
| | | | | | | 2,633,865 | |
| | | | | | | | |
New Zealand 0.7% | | | | | |
New Zealand Government Inflation Linked Bond
Series Reg S
2.00%, due 9/20/25 | | NZD | 1,800,000 | | | | 1,429,709 | |
Series Reg S
2.50%, due 9/20/35 | | | 800,000 | | | | 717,294 | |
Series Reg S
3.00%, due 9/20/30 | | | 500,000 | | | | 453,643 | |
| | | | | | | | |
| | | | | | | 2,600,646 | |
| | | | | | | | |
| | | | | | | | |
| | | Principal Amount | | | Value | |
Peru 0.4% | | | | | |
Peru Government Bond (b)
5.94%, due 2/12/29 | | PEN | 1,300,000 | | | $ | 429,859 | |
Series Reg S
6.15%, due 8/12/32 | | | 2,600,000 | | | | 865,640 | |
| | | | | | | | |
| | | | | | | 1,295,499 | |
| | | | | | | | |
Qatar 0.1% | | | | | |
Qatar Government International Bond
3.875%, due 4/23/23 (b) | | $ | 300,000 | | | | 314,640 | |
| | | | | | | | |
| |
Spain 0.2% | | | | | |
Autonomous Community of Catalonia
4.95%, due 2/11/20 | | EUR | 500,000 | | | | 583,884 | |
| | | | | | | | |
| |
United Kingdom 5.1% | | | | | |
United Kingdom Gilt Inflation Linked
Series Reg S
0.125%, due 3/22/26 | | GBP | 247,665 | | | | 375,438 | |
Series Reg S
0.125%, due 8/10/28 | | | 2,146,019 | | | | 3,444,552 | |
Series Reg S
0.125%, due 11/22/65 | | | 1 | | | | 3 | |
Series Reg S
1.25%, due 11/22/27 | | | 3,755,836 | | | | 6,451,858 | |
1.875%, due 11/22/22 | | | 5,561,375 | | | | 8,222,286 | |
| | | | | | | | |
| | | | | | | 18,494,137 | |
| | | | | | | | |
Total Foreign Government Bonds
(Cost $40,550,624) | | | | | | | 40,086,449 | |
| | | | | | | | |
|
| Mortgage-Backed Securities 4.9% | |
Agency (Collateralized Mortgage Obligations) 1.5% | |
Federal Home Loan Mortgage Corporation REMIC (Collateralized Mortgage Obligations)
Series 4779, Class WF
2.851% (1 Month LIBOR + 0.35%), due 7/15/44 (a) | | $ | 444,079 | | | | 441,046 | |
Federal Home Loan Mortgage Corporation Strips
Series 278, Class F1
2.889% (1 Month LIBOR + 0.45%), due 9/15/42 (a) | | | 585,483 | | | | 587,555 | |
Federal National Mortgage Association REMIC,Series 2019-5, Class FA
2.829% (1 Month LIBOR + 0.40%), due 3/25/49 (a) | | | 1,706,667 | | | | 1,701,893 | |
Government National Mortgage Association (a)
REMIC,Series 2019-20, Class FE
2.84% (1 Month LIBOR + 0.40%), due 2/20/49 | | | 1,677,264 | | | | 1,675,508 | |
| | | | |
| 14 | | MainStay VP PIMCO Real Return Portfolio | | The notes to the financial statements are an integral part of,
and should be read in conjunction with, the financial statements. |
| | | | | | | | |
| | | Principal Amount | | | Value | |
| Mortgage-Backed Securities (continued) | |
Agency (Collateralized Mortgage Obligations) (continued) | |
Government National Mortgage Association (continued) | | | | | | | | |
REMIC,Series 2018-H15, Class FG
3.03% (1 Month LIBOR + 0.15%), due 8/20/68 | | $ | 703,224 | | | $ | 689,604 | |
Government National Mortgage Association (Mortgage Pass-Through Securities)
Series 2017-H10, Class FB
3.629% (12 Month LIBOR + 0.75%), due 4/20/67 (a) | | | 372,770 | | | | 379,473 | |
| | | | | | | | |
| | | | | | | 5,475,079 | |
| | | | | | | | |
Commercial Mortgage Loans
(Collateralized Mortgage Obligations) 0.3% | |
CGGS Commercial Mortgage Trust
Series 2018-WSS, Class A
3.294% (1 Month LIBOR + 0.90%), due 2/15/37 (a)(b) | | | 1,000,000 | | | | 998,105 | |
| | | | | | | | |
|
Whole Loan (Collateralized Mortgage Obligations) 3.1% | |
BCAP LLC Trust
Series 2011-RR5, Class 5A1
5.25%, due 8/26/37 (b)(g) | | | 1,032,443 | | | | 1,052,222 | |
CHL Mortgage Pass-Through Trust
Series 2007-1, Class A1
6.00%, due 3/25/37 | | | 44,375 | | | | 37,761 | |
Citigroup Mortgage Loan Trust
Series 2007-AR4, Class 1A1A
4.625%, due 3/25/37 (h) | | | 448,035 | | | | 444,709 | |
Citigroup Mortgage Loan Trust, Inc.
Series 2019-B, Class A1
3.258%, due 4/25/66 (b)(g) | | | 300,000 | | | | 299,745 | |
Series 2004-NCM2, Class 1CB1
5.50%, due 8/25/34 | | | 272,435 | | | | 276,729 | |
Countrywide Alternative Loan Trust
Series 2007-1T1, Class 1A1
6.00%, due 3/25/37 | | | 835,106 | | | | 592,778 | |
Credit Suisse Mortgage Trust
Series 2019-RPL4, Class A1
3.83%, due 8/26/58 (b) | | | 297,068 | | | | 299,866 | |
Eurosail-UK PLC (a)
Series 2007-3A, Class A3C
1.792% (3 Month LIBOR + 0.95%), due 6/13/45 (b) | | GBP | 53,716 | | | | 67,535 | |
Series 2007-3X, Class A3A, Reg S
1.792% (3 Month LIBOR + 0.95%), due 6/13/45 | | | 201,460 | | | | 254,676 | |
Series 2007-3X, Class A3C, Reg S
1.792% (3 Month LIBOR + 0.95%), due 6/13/45 | | | 53,716 | | | | 67,535 | |
| | | | | | | | |
| | | Principal Amount | | | Value | |
Whole Loan (Collateralized Mortgage Obligations) (continued) | |
GreenPoint Mortgage Funding Trust
Series 2006-AR4, Class A6A
2.609% (1 Month LIBOR + 0.18%), due 9/25/46 (a) | | $ | 118,816 | | | $ | 112,352 | |
IndyMac Index Mortgage Loan Trust
Series 2005-AR14, Class 1A1A
2.989% (1 Month LIBOR + 0.28%), due 7/25/35 (a) | | | 1,214,649 | | | | 1,097,541 | |
Merrill Lynch Mortgage Investors Trust
Series 2005-A4, Class 1A
4.569%, due 7/25/35 (h) | | | 270,700 | | | | 216,366 | |
Onslow Bay Financial LLC
Series 2018-1, Class A2
3.079% (1 Month LIBOR + 0.65%), due 6/25/57 (a)(b) | | | 101,766 | | | | 101,215 | |
Paragon Mortgages No. 13 PLC
Series 13X, Class A1, Reg S
1.167% (3 Month LIBOR + 0.24%), due 1/15/39 (a) | | GBP | 2,081,467 | | | | 2,482,511 | |
Residential Asset Securitization Trust
Series 2006-A10, Class A5
6.50%, due 9/25/36 | | $ | 276,796 | | | | 187,258 | |
Silverstone Master Issuer PLC
Series 2019-1A, Class 2A
1.457%, due 1/21/70 (b) | | GBP | 300,000 | | | | 381,818 | |
Towd Point Mortgage Funding
Series 2019-GR4A, Class A1
1.855%, due 10/20/51 (b) | | | 1,400,000 | | | | 1,780,283 | |
Trinity Square PLC
Series 2015-1A, Class A
2.077% (3 Month LIBOR + 1.15%), due 7/15/51 (a)(b) | | | 646,374 | | | | 824,957 | |
Washington Mutual Mortgage Pass-Through Certificates
Series 2007-HY1, Class A2A
2.589% (1 Month LIBOR + 0.16%), due 2/25/37 (a) | | $ | 765,774 | | | | 611,363 | |
Series 2006-5, Class 2CB1
6.00%, due 7/25/36 | | | 51,912 | | | | 42,749 | |
| | | | | | | | |
| | | | | | | 11,231,969 | |
| | | | | | | | |
Total Mortgage-Backed Securities
(Cost $18,287,709) | | | | | | | 17,705,153 | |
| | | | | | | | |
|
| U.S. Government & Federal Agencies 116.4% | |
Federal National Mortgage Association
(Mortgage Pass-Through Securities) 13.7% | |
3.50%, due 1/29/48 TBA (i) | | | 41,700,000 | | | | 42,611,088 | |
3.50%, due 3/1/48 | | | 181,898 | | | | 186,784 | |
3.704% (12 Month Treasury Average Index + 1.20%), due 6/1/43 (a)(j) | | | 301,170 | | | | 303,028 | |
| | | | | | |
The notes to the financial statements are an integral part of,
and should be read in conjunction with, the financial statements. | | | | | 15 | |
Portfolio of InvestmentsJune 30, 2019 (Unaudited) (continued)
| | | | | | | | |
| | | Principal Amount | | | Value | |
| U.S. Government & Federal Agencies (continued) | |
Federal National Mortgage Association
(Mortgage Pass-Through Securities) (continued) | |
4.00%, due 4/29/48 TBA (i) | | $ | 5,800,000 | | | $ | 5,992,691 | |
4.236% (11th District Cost of Funds Index + 1.927%), due 12/1/36 (a)(j) | | | 304,696 | | | | 316,255 | |
4.757% (1 Year Treasury Constant Maturity Rate + 2.36%), due 11/1/34 (a)(j) | | | 366,792 | | | | 388,552 | |
| | | | | | | | |
| | | | | | | 49,798,398 | |
| | | | | | | | |
United States Treasury Notes 0.4% | |
2.25%, due 11/15/24 (k) | | | 300,000 | | | | 306,984 | |
2.50%, due 5/15/24 (j)(k) | | | 1,100,000 | | | | 1,137,770 | |
| | | | | | | | |
| | | | | | | 1,444,754 | |
| | | | | | | | |
United States Treasury Inflation—Indexed Bonds 39.3% | |
0.375%, due 7/15/25 | | | 13,229,640 | | | | 13,374,052 | |
0.375%, due 7/15/27 | | | 7,666,630 | | | | 7,737,311 | |
0.625%, due 4/15/23 | | | 390,879 | | | | 395,483 | |
0.625%, due 2/15/43 | | | 1,489,155 | | | | 1,443,592 | |
0.75%, due 2/15/42 | | | 3,878,438 | | | | 3,892,792 | |
0.75%, due 2/15/45 | | | 2,929,554 | | | | 2,897,828 | |
0.875%, due 2/15/47 | | | 9,423,469 | | | | 9,601,005 | |
1.00%, due 2/15/46 | | | 5,370,034 | | | | 5,626,229 | |
1.00%, due 2/15/48 | | | 4,235,693 | | | | 4,455,713 | |
1.00%, due 2/15/49 | | | 2,639,962 | | | | 2,792,273 | |
1.375%, due 2/15/44 | | | 15,635,335 | | | | 17,742,922 | |
1.75%, due 1/15/28 | | | 16,625,807 | | | | 18,635,916 | |
2.00%, due 1/15/26 | | | 11,119,870 | | | | 12,371,720 | |
2.125%, due 2/15/40 | | | 2,978,942 | | | | 3,811,442 | |
2.125%, due 2/15/41 | | | 3,196,840 | | | | 4,117,755 | |
2.375%, due 1/15/25 | | | 20,532,463 | | | | 22,942,037 | |
2.375%, due 1/15/27 | | | 988,237 | | | | 1,141,437 | |
2.50%, due 1/15/29 | | | 6,902,202 | | | | 8,302,702 | |
3.375%, due 4/15/32 | | | 1,550,288 | | | | 2,123,413 | |
| | | | | | | | |
| | | | | | | 143,405,622 | |
| | | | | | | | |
United States Treasury Inflation—Indexed Notes 63.0% | |
0.125%, due 4/15/20 (j) | | | 7,060,185 | | | | 6,986,120 | |
0.125%, due 4/15/21 (j) | | | 38,093,062 | | | | 37,738,919 | |
0.125%, due 1/15/22 (j) | | | 3,668,828 | | | | 3,645,763 | |
0.125%, due 4/15/22 (j) | | | 41,241,122 | | | | 40,917,664 | |
0.125%, due 7/15/22 (j) | | | 4,246,471 | | | | 4,233,629 | |
0.125%, due 1/15/23 (j) | | | 7,940,009 | | | | 7,895,059 | |
0.125%, due 7/15/26 (j) | | | 10,424,698 | | | | 10,353,480 | |
0.25%, due 1/15/25 (j) | | | 10,725,912 | | | | 10,737,662 | |
0.375%, due 7/15/23 (j) | | | 6,293,220 | | | | 6,343,920 | |
0.375%, due 1/15/27 (j) | | | 5,489,567 | | | | 5,527,055 | |
0.50%, due 1/15/28 | | | 15,556,432 | | | | 15,809,439 | |
0.625%, due 7/15/21 (j) | | | 2,017,879 | | | | 2,030,307 | |
0.625%, due 1/15/24 (j) | | | 685,489 | | | | 697,424 | |
0.625%, due 1/15/26 (j) | | | 38,679,716 | | | | 39,608,418 | |
| | | | | | | | |
| | | Principal Amount | | | Value | |
United States Treasury Inflation—Indexed Notes (continued) | |
0.75%, due 7/15/28 | | $ | 4,478,628 | | | $ | 4,666,066 | |
0.875%, due 1/15/29 | | | 25,032,548 | | | | 26,348,285 | |
1.25%, due 7/15/20 (j) | | | 5,613,209 | | | | 5,649,426 | |
1.375%, due 1/15/20 (j) | | | 401,724 | | | | 400,845 | |
| | | | | | | | |
| | | | | | | 229,589,481 | |
| | | | | | | | |
Total U.S. Government & Federal Agencies
(Cost $421,000,620) | | | | 424,238,255 | |
| | | | | | | | |
TotalLong-Term Bonds
(Cost $550,831,898) | | | | | | | 553,494,147 | |
| | | | | | | | |
| | |
| | | | | | | | |
| | |
| | | Shares | | | | |
| Short-Term Investments 5.0% | | | | | |
Affiliated Investment Company 0.2% | | | | | |
MainStay U.S. Government Liquidity Fund, 2.03% (l) | | | 803,745 | | | | 803,745 | |
| | | | | | | | |
Total Affiliated Investment Company
(Cost $803,745) | | | | | | | 803,745 | |
| | | | | | | | |
| | |
| | | | | | | | |
| | |
| | | Principal Amount | | | | |
Foreign Government Bonds 1.0% | | | | | |
Argentina Treasury Bills
(zero coupon), due 7/19/19 | | ARS | 3,734,000 | | | | 95,198 | |
(zero coupon), due 7/31/19 | | | 1,062,000 | | | | 27,749 | |
Brazil Letras do Tesouro Nacional
(zero coupon), due 1/1/20 | | BRL | 13,706,000 | | | | 3,462,905 | |
| | | | | | | | |
Total Foreign Government Bonds
(Cost $3,647,925) | | | | | | | 3,585,852 | |
| | | | | | | | |
Repurchase Agreement 2.7% | | | | | |
Societe Generale S.A.
2.57%, dated 6/28/19
due 7/1/19
Proceeds at Maturity $9,702,077 (Collateralized by a United States Treasury Note with a rate of 2.25% and a maturity date of 8/15/27, with a Principal Amount of $9,594,000 and a Market Value of $9,828,416) | | $ | 9,700,000 | | | | 9,700,000 | |
| | | | | | | | |
Total Repurchase Agreement
(Cost $9,700,000) | | | | | | | 9,700,000 | |
| | | | | | | | |
| | | | |
| 16 | | MainStay VP PIMCO Real Return Portfolio | | The notes to the financial statements are an integral part of,
and should be read in conjunction with, the financial statements. |
| | | | | | | | |
| | | Principal Amount | | | Value | |
| Short-Term Investments (continued) | | | | | |
Short Term Instruments 1.1% | | | | | |
Bank of Montreal
(zero coupon), due 7/19/19 | | CAD | 100,000 | | | $ | 76,294 | |
(zero coupon), due 7/22/19 | | | 100,000 | | | | 76,284 | |
(zero coupon), due 7/26/19 | | | 200,000 | | | | 152,536 | |
(zero coupon), due 7/31/19 | | | 700,000 | | | | 533,743 | |
Bank of Nova Scotia | | | | | | | | |
(zero coupon), due 7/22/19 | | | 400,000 | | | | 305,136 | |
(zero coupon), due 7/23/19 | | | 100,000 | | | | 76,280 | |
(zero coupon), due 7/25/19 | | | 100,000 | | | | 76,273 | |
Encana Corp.
(zero coupon), due 7/8/19 (b) | | $ | 250,000 | | | | 249,848 | |
HSBC Bank Canada
(zero coupon), due 7/11/19 | | CAD | 800,000 | | | | 610,587 | |
(zero coupon), due 7/24/19 | | | 200,000 | | | | 152,549 | |
(zero coupon), due 7/25/19 | | | 100,000 | | | | 76,270 | |
(zero coupon), due 7/26/19 | | | 100,000 | | | | 76,267 | |
Royal Bank of Canada
(zero coupon), due 7/2/19 | | | 200,000 | | | | 152,717 | |
(zero coupon), due 7/22/19 | | | 100,000 | | | | 76,284 | |
(zero coupon), due 7/25/19 | | | 100,000 | | | | 76,273 | |
(zero coupon), due 7/26/19 | | | 200,000 | | | | 152,538 | |
(zero coupon), due 7/31/19 | | | 400,000 | | | | 304,999 | |
Royal Caribbean Cruise
(zero coupon), due 7/30/19 (b) | | $ | 250,000 | | | | 249,426 | |
Toronto Dominion Bank
(zero coupon), due 7/2/19 | | CAD | 400,000 | | | | 305,434 | |
(zero coupon), due 7/19/19 | | | 100,000 | | | | 76,295 | |
(zero coupon), due 7/22/19 | | | 100,000 | | | | 76,284 | |
(zero coupon), due 7/24/19 | | | 200,000 | | | | 152,552 | |
| | | | | | | | |
Total Short Term Instruments
(Cost $4,063,135) | | | | | | | 4,084,869 | |
| | | | | | | | |
TotalShort-Term Investments
(Cost $18,214,805) | | | | | | | 18,174,466 | |
| | | | | | | | |
Total Investments Excluding
Purchased Options
(Cost $569,046,703) | | | 156.8 | % | | | 571,668,613 | |
| | | | | | | | |
Total Purchased Options
(Cost $12,190) | | | 0.0 | %‡ | | | 7,688 | |
| | | | | | | | |
Total Investments
(Cost $569,058,893) | | | 156.8 | % | | | 571,676,301 | |
Other Assets, Less Liabilities | | | (56.8 | ) | | | (207,075,313 | ) |
Net Assets | | | 100.0 | % | | $ | 364,600,988 | |
| † | Percentages indicated are based on Portfolio net assets. |
| ‡ | Less than one—tenth of a percent. |
| (a) | Floating rate—Rate shown was the rate in effect as of June 30, 2019. |
| (b) | May be sold to institutional investors only under Rule 144A or securities offered pursuant to Section 4(a)(2) of the Securities Act of 1933, as amended. |
| (c) | Step coupon—Rate shown was the rate in effect as of June 30, 2019. |
| (d) | Securities are perpetual and, thus, do not have a predetermined maturity date. The date shown, if applicable, reflects the next call date. |
| (e) | Fixed to floating rate—Rate shown was the rate in effect as of June 30, 2019. |
| (f) | Illiquid security—As of June 30, 2019, the total market value of the security deemed illiquid under procedures approved by the Board of Trustees was $902,169, which represented 0.2% of the Portfolio’s net assets. |
| (g) | Coupon rate may change based on changes of the underlying collateral or prepayments of principal. The coupon rate shown represents the rate at period end. |
| (h) | Collateral strip rate—A bond whose interest was based on the weighted net interest rate of the collateral. The coupon rate adjusts periodically based on a predetermined schedule. Rate shown was the rate in effect as of June 30, 2019. |
| (i) | TBA—Securities purchased on a forward commitment basis with an approximate principal amount and maturity date. The actual principal amount and maturity date will be determined upon settlement. As of June 30, 2019, the total net market value of these securities was $48,603,779, which represented 13.3% of the Portfolio’s net assets. All or a portion of these securities are a part of a mortgage dollar roll agreement. |
| (j) | Delayed delivery security. |
| (k) | Security, or a portion thereof, was maintained in a segregated account at the Portfolio’s custodian as collateral for swap contracts. (See Note 2(L)). |
| (l) | Current yield as of June 30, 2019. |
| | | | | | |
The notes to the financial statements are an integral part of,
and should be read in conjunction with, the financial statements. | | | | | 17 | |
Portfolio of InvestmentsJune 30, 2019 (Unaudited) (continued)
Foreign Currency Forward Contracts
As of June 30, 2019, the Portfolio held the following foreign currency forward contracts1:
| | | | | | | | | | | | | | | | | | |
Currency Purchased | | | Currency Sold | | | Counterparty | | Settlement
Date | | Unrealized
Appreciation
(Depreciation) | |
| | | | | | |
AUD | | | 3,273,000 | | | USD | | | 2,285,695 | | | Bank of America, N.A. | | 7/2/19 | | $ | 12,114 | |
CAD | | | 800,000 | | | USD | | | 601,123 | | | Bank of America, N.A. | | 7/2/19 | | | 9,773 | |
COP | | | 5,486,963,856 | | | USD | | | 1,624,660 | | | JPMorgan Chase Bank N.A.* | | 9/25/19 | | | 74,203 | |
EUR | | | 16,802,000 | | | USD | | | 19,093,793 | | | Bank of America, N.A. | | 7/2/19 | | | 11,764 | |
EUR | | | 3,836,000 | | | USD | | | 4,297,229 | | | JPMorgan Chase Bank N.A. | | 7/2/19 | | | 64,687 | |
IDR | | | 23,491,386,400 | | | USD | | | 1,595,340 | | | Bank of America, N.A.* | | 9/18/19 | | | 52,977 | |
IDR | | | 2,596,048,000 | | | USD | | | 182,000 | | | JPMorgan Chase Bank N.A.* | | 9/18/19 | | | 157 | |
MXN | | | 3,903,781 | | | USD | | | 198,277 | | | JPMorgan Chase Bank N.A. | | 8/14/19 | | | 3,681 | |
MXN | | | 1,941,000 | | | USD | | | 99,079 | | | JPMorgan Chase Bank N.A. | | 10/9/19 | | | 403 | |
PEN | | | 2,932,992 | | | USD | | | 888,247 | | | JPMorgan Chase Bank N.A. | | 7/17/19 | | | 1,923 | |
RUB | | | 97,934,908 | | | USD | | | 1,490,751 | | | Bank of America, N.A.* | | 8/15/19 | | | 48,272 | |
RUB | | | 16,339,075 | | | USD | | | 250,505 | | | JPMorgan Chase Bank N.A.* | | 7/15/19 | | | 7,396 | |
USD | | | 3,562,869 | | | BRL | | | 13,706,000 | | | JPMorgan Chase Bank N.A.* | | 1/3/20 | | | 53,230 | |
USD | | | 989,000 | | | COP | | | 3,179,635,000 | | | JPMorgan Chase Bank N.A.* | | 9/25/19 | | | 4,527 | |
USD | | | 1,805,373 | | | DKK | | | 11,755,000 | | | JPMorgan Chase Bank N.A. | | 10/1/19 | | | 869 | |
USD | | | 6,679,673 | | | GBP | | | 5,243,000 | | | Bank of America, N.A. | | 7/2/19 | | | 21,327 | |
USD | | | 946,713 | | | JPY | | | 101,300,000 | | | Bank of America, N.A. | | 7/2/19 | | | 7,140 | |
USD | | | 461,572 | | | PEN | | | 1,524,849 | | | JPMorgan Chase Bank N.A.* | | 10/28/19 | | | 780 | |
USD | | | 182,000 | | | TWD | | | 5,610,150 | | | Credit Suisse International* | | 9/18/19 | | | 582 | |
ZAR | | | 12,348,000 | | | USD | | | 847,932 | | | JPMorgan Chase Bank N.A. | | 7/8/19 | | | 28,084 | |
Total unrealized appreciation | | | 403,889 | |
BRL | | | 3,174,731 | | | USD | | | 826,000 | | | Bank of America, N.A.* | | 8/2/19 | | | (1,587 | ) |
BRL | | | 3,546,312 | | | USD | | | 924,000 | | | JPMorgan Chase Bank N.A.* | | 8/2/19 | | | (3,095 | ) |
DKK | | | 8,155,044 | | | USD | | | 1,252,036 | | | JPMorgan Chase Bank N.A. | | 10/1/19 | | | (158 | ) |
PEN | | | 1,524,850 | | | USD | | | 463,861 | | | JPMorgan Chase Bank N.A.* | | 7/15/19 | | | (1,023 | ) |
USD | | | 2,268,238 | | | AUD | | | 3,273,000 | | | Bank of America, N.A. | | 7/2/19 | | | (29,572 | ) |
USD | | | 2,288,086 | | | AUD | | | 3,273,000 | | | Bank of America, N.A. | | 8/2/19 | | | (12,244 | ) |
USD | | | 1,055,759 | | | CAD | | | 1,399,000 | | | Bank of America, N.A. | | 7/2/19 | | | (12,547 | ) |
USD | | | 151,821 | | | CAD | | | 200,000 | | | Bank of America, N.A. | | 7/19/19 | | | (967 | ) |
USD | | | 303,732 | | | CAD | | | 400,000 | | | Bank of America, N.A. | | 7/22/19 | | | (1,862 | ) |
USD | | | 151,857 | | | CAD | | | 200,000 | | | Bank of America, N.A. | | 7/25/19 | | | (950 | ) |
USD | | | 76,394 | | | CAD | | | 100,000 | | | Bank of America, N.A. | | 7/26/19 | | | (12 | ) |
USD | | | 840,435 | | | CAD | | | 1,100,000 | | | Bank of America, N.A. | | 7/31/19 | | | (125 | ) |
USD | | | 893,336 | | | CAD | | | 1,205,000 | | | JPMorgan Chase Bank N.A. | | 7/2/19 | | | (26,828 | ) |
USD | | | 600,136 | | | CAD | | | 800,000 | | | JPMorgan Chase Bank N.A. | | 7/11/19 | | | (10,897 | ) |
USD | | | 379,473 | | | CAD | | | 500,000 | | | JPMorgan Chase Bank N.A. | | 7/22/19 | | | (2,520 | ) |
USD | | | 75,896 | | | CAD | | | 100,000 | | | JPMorgan Chase Bank N.A. | | 7/23/19 | | | (504 | ) |
USD | | | 152,575 | | | CAD | | | 200,000 | | | JPMorgan Chase Bank N.A. | | 7/24/19 | | | (229 | ) |
USD | | | 76,289 | | | CAD | | | 100,000 | | | JPMorgan Chase Bank N.A. | | 7/25/19 | | | (115 | ) |
USD | | | 305,157 | | | CAD | | | 400,000 | | | JPMorgan Chase Bank N.A. | | 7/26/19 | | | (466 | ) |
USD | | | 724,000 | | | COP | | | 2,340,692,000 | | | JPMorgan Chase Bank N.A.* | | 9/25/19 | | | (721 | ) |
| | | | |
| 18 | | MainStay VP PIMCO Real Return Portfolio | | The notes to the financial statements are an integral part of,
and should be read in conjunction with, the financial statements. |
| | | | | | | | | | | | | | | | | | |
Currency Purchased | | | Currency Sold | | | Counterparty | | Settlement
Date | | Unrealized
Appreciation
(Depreciation) | |
USD | | | 4,211,478 | | | DKK | | | 27,443,538 | | | Bank of America, N.A. | | 10/1/19 | | $ | (1,370 | ) |
USD | | | 23,061,459 | | | EUR | | | 20,638,000 | | | Bank of America, N.A. | | 7/2/19 | | | (406,014 | ) |
USD | | | 19,142,451 | | | EUR | | | 16,802,000 | | | Bank of America, N.A. | | 8/2/19 | | | (12,167 | ) |
USD | | | 14,661,621 | | | GBP | | | 11,604,000 | | | Bank of America, N.A. | | 7/2/19 | | | (74,871 | ) |
USD | | | 3,732,710 | | | GBP | | | 2,955,000 | | | JPMorgan Chase Bank N.A. | | 7/2/19 | | | (19,990 | ) |
USD | | | 1,738,623 | | | JPY | | | 189,500,000 | | | JPMorgan Chase Bank N.A. | | 7/2/19 | | | (19,017 | ) |
USD | | | 1,790,854 | | | KRW | | | 2,107,950,170 | | | JPMorgan Chase Bank N.A.* | | 9/18/19 | | | (39,114 | ) |
USD | | | 346,899 | | | MXN | | | 6,883,000 | | | JPMorgan Chase Bank N.A. | | 8/14/19 | | | (9,185 | ) |
USD | | | 2,538,485 | | | NZD | | | 3,866,000 | | | Bank of America, N.A. | | 7/2/19 | | | (58,694 | ) |
USD | | | 11,231 | | | NZD | | | 17,000 | | | JPMorgan Chase Bank N.A. | | 7/2/19 | | | (190 | ) |
USD | | | 456,761 | | | PEN | | | 1,524,850 | | | JPMorgan Chase Bank N.A.* | | 7/15/19 | | | (6,078 | ) |
USD | | | 884,417 | | | PEN | | | 2,932,992 | | | JPMorgan Chase Bank N.A.* | | 7/17/19 | | | (5,753 | ) |
USD | | | 884,256 | | | PEN | | | 2,932,992 | | | JPMorgan Chase Bank N.A.* | | 10/28/19 | | | (2,060 | ) |
USD | | | 856,559 | | | SGD | | | 1,172,458 | | | Bank of America, N.A. | | 9/18/19 | | | (11,021 | ) |
USD | | | 1,625,131 | | | TWD | | | 50,963,895 | | | JPMorgan Chase Bank N.A.* | | 11/21/19 | | | (28,073 | ) |
Total unrealized depreciation | | | | | (800,019 | ) |
Net unrealized depreciation | | | | $ | (396,130 | ) |
| * | Non-deliverable forward. |
| 1. | Foreign Currency Forward Contracts are subject to limitations such that they cannot be “sold or repurchased,” although the Portfolio would be able to exit the transaction through other means, such as through the execution of an offsetting transaction. |
Future Contracts
As of June 30, 2019, the Portfolio held the following futures contracts1:
| | | | | | | | | | | | | | | | | | | | |
Type | | Number of
Contracts | | | Expiration
Date | | | Value at
Trade Date | | | Current
Notional
Amount | | | Unrealized
Appreciation
(Depreciation)2 | |
|
Long Contracts | |
| 5-Year United States Treasury Note | | | 131 | | | | September 2019 | | | $ | 15,423,684 | | | $ | 15,478,469 | | | $ | 54,785 | |
| Euro Bund | | | 282 | | | | September 2019 | | | | 54,876,798 | | | | 55,391,197 | | | | 514,399 | |
| | | | | | | | | | | | | | | | | | | | |
| Total Long Contracts | | | | | | | | | | | | | | | | | | | 569,184 | |
| | | | | | | | | | | | | | | | | | | | |
|
Short Contracts | |
| 10-Year Australia Government Bond | | | (7 | ) | | | September 2019 | | | | (697,470 | ) | | | (705,947 | ) | | | (8,477 | ) |
| 10-Year Japan Government Bond | | | (1 | ) | | | September 2019 | | | | (1,428,555 | ) | | | (1,426,982 | ) | | | 1,573 | |
| 10-Year United States Treasury Note | | | (66 | ) | | | September 2019 | | | | (8,317,906 | ) | | | (8,445,937 | ) | | | (128,031 | ) |
| 2-Year United States Treasury Note | | | (23 | ) | | | September 2019 | | | | (4,920,219 | ) | | | (4,949,133 | ) | | | (28,914 | ) |
| 3-Year Australia Government Bond | | | (13 | ) | | | September 2019 | | | | (1,047,178 | ) | | | (1,049,543 | ) | | | (2,365 | ) |
| Euro BOBL | | | (19 | ) | | | September 2019 | | | | (2,901,952 | ) | | | (2,904,563 | ) | | | (2,611 | ) |
| Euro Schatz | | | (812 | ) | | | September 2019 | | | | (103,570,932 | ) | | | (103,675,585 | ) | | | (104,653 | ) |
| Euro-BTP | | | (56 | ) | | | September 2019 | | | | (8,231,357 | ) | | | (8,551,903 | ) | | | (320,546 | ) |
| Euro-Buxl 30 Year Bond | | | (37 | ) | | | September 2019 | | | | (8,403,814 | ) | | | (8,536,552 | ) | | | (132,738 | ) |
| Euro-OAT | | | (146 | ) | | | September 2019 | | | | (26,813,202 | ) | | | (27,371,161 | ) | | | (557,959 | ) |
| Short-TermEuro-BTP | | | (1 | ) | | | September 2019 | | | | (125,285 | ) | | | (126,787 | ) | | | (1,502 | ) |
| UK Long Gilt | | | (74 | ) | | | September 2019 | | | | (12,181,519 | ) | | | (12,245,105 | ) | | | (63,586 | ) |
| United States Treasury Long Bond | | | (47 | ) | | | September 2019 | | | | (7,050,411 | ) | | | (7,312,907 | ) | | | (262,496 | ) |
| United States Treasury Ultra Bond | | | (19 | ) | | | September 2019 | | | | (3,362,413 | ) | | | (3,373,688 | ) | | | (11,275 | ) |
| | | | | | | | | | | | | | | | | | | | |
| Total Short Contracts | | | | | | | | | | | | | | | | | | | (1,623,580 | ) |
| | | | | | | | | | | | | | | | | | | | |
| Net Unrealized Depreciation | | | | | | | | | | | | | | | | | | $ | (1,054,396 | ) |
| | | | | | | | | | | | | | | | | | | | |
| 1. | As of June 30, 2019, cash in the amount of $2,133,929 was on deposit with a broker or futures commission merchant for futures transactions. |
| 2. | Represents the difference between the value of the contracts at the time they were opened and the value as of June 30, 2019. |
| | | | | | |
The notes to the financial statements are an integral part of,
and should be read in conjunction with, the financial statements. | | | | | 19 | |
Portfolio of InvestmentsJune 30, 2019 (Unaudited) (continued)
Purchased Options on Futures Contracts
| | | | | | | | | | | | | | | | | | | | | | | | | | | | |
Description | | Counterparty | | | Strike
Price | | | Expiration
Date | | | Number of
Contracts | | | Notional
Amount | | | Premium Paid
(Received) | | | Market
Value | |
Put-5-Year United States Treasury Note | | | Morgan Stanley & Co., LLC | | | $ | 108.00 | | | | 08/23/2019 | | | | 129 | | | $ | 129,000 | | | $ | 1,109 | | | $ | 129 | |
Put-Euro BOBL | | | Morgan Stanley & Co., LLC | | | | 129.75 | | | | 08/23/2019 | | | | 43 | | | EUR | 4,300,000 | | | | 287 | | | | 245 | |
Put-Euro Bund | | | Morgan Stanley & Co., LLC | | | | 155.00 | | | | 08/23/2019 | | | | 130 | | | | 13,000,000 | | | | 1,605 | | | | 1,478 | |
Put-Euro Bund | | | Morgan Stanley & Co., LLC | | | | 159.00 | | | | 08/23/2019 | | | | 86 | | | | 8,600,000 | | | | 1,062 | | | | 978 | |
Put-United States Treasury Ultra Bond | | | Morgan Stanley & Co., LLC | | | | 114.00 | | | | 08/23/2019 | | | | 2 | | | $ | 2,000 | | | | 17 | | | | 2 | |
Put-United States Treasury Ultra Bond | | | Morgan Stanley & Co., LLC | | | | 112.00 | | | | 08/23/2019 | | | | 13 | | | | 13,000 | | | | 112 | | | | 13 | |
| | | | | | | | | | | | | | | | | | | | | | | $ | 4,192 | | | $ | 2,845 | |
| | | | | | | | | | | | | | | | | | | | | | | | | | | | |
Description | | Counterparty | | | Strike
Price | | | Expiration
Date | | | Number of
Contracts | | | Notional
Amount | | | Premium Paid
(Received) | | | Market
Value | |
Call-10-Year United States Treasury Note | | | Morgan Stanley & Co., LLC | | | $ | 147.00 | | | | 08/23/2019 | | | | 4 | | | $ | 4,000 | | | $ | 34 | | | $ | 4 | |
Call-10-Year United States Treasury Note | | | Morgan Stanley & Co., LLC | | | | 146.00 | | | | 08/23/2019 | | | | 23 | | | | 23,000 | | | | 198 | | | | 23 | |
Call-10-Year United States Treasury Note | | | Morgan Stanley & Co., LLC | | | | 145.50 | | | | 08/23/2019 | | | | 153 | | | | 153,000 | | | | 1,316 | | | | 153 | |
Call-2-Year United States Treasury Note | | | Morgan Stanley & Co., LLC | | | | 110.00 | | | | 08/23/2019 | | | | 3 | | | | 6,000 | | | | 26 | | | | 3 | |
Call-2-Year United States Treasury Note | | | Morgan Stanley & Co., LLC | | | | 109.75 | | | | 08/23/2019 | | | | 20 | | | | 40,000 | | | | 172 | | | | 20 | |
Call-5-Year United States Treasury Note | | | Morgan Stanley & Co., LLC | | | | 128.25 | | | | 08/23/2019 | | | | 57 | | | | 57,000 | | | | 490 | | | | 57 | |
Call-Euro Schatz | | | Morgan Stanley & Co., LLC | | | | 113.80 | | | | 08/23/2019 | | | | 516 | | | | EUR 51,600,000 | | | | 3,379 | | | | 2,934 | |
Call-Euro-BTP | | | Morgan Stanley & Co., LLC | | | | 153.00 | | | | 08/23/2019 | | | | 58 | | | | 5,800,000 | | | | 716 | | | | 659 | |
Call-Euro-OAT | | | Morgan Stanley & Co., LLC | | | | 178.00 | | | | 08/23/2019 | | | | 80 | | | | 8,000,000 | | | | 988 | | | | 910 | |
Call-United States Treasury Long Bond | | | Morgan Stanley & Co., LLC | | | | 200.00 | | | | 08/23/2019 | | | | 2 | | | $ | 2,000 | | | | 17 | | | | 2 | |
Call-United States Treasury Long Bond | | | Morgan Stanley & Co., LLC | | | | 195.00 | | | | 08/23/2019 | | | | 15 | | | | 15,000 | | | | 129 | | | | 15 | |
Call-United States Treasury Long Bond | | | Morgan Stanley & Co., LLC | | | | 193.00 | | | | 08/23/2019 | | | | 30 | | | | 30,000 | | | | 258 | | | | 30 | |
Call-United States Treasury Ultra Bond | | | Morgan Stanley & Co., LLC | | | | 220.00 | | | | 08/23/2019 | | | | 11 | | | | 11,000 | | | | 95 | | | | 11 | |
| | | | | | | | | | | | | | | | | | | | | | | $ | 7,818 | | | $ | 4,821 | |
Purchased Swaptions
| | | | | | | | | | | | | | | | | | | | | | | | | | | | |
Description | | Counterparty | | | Strike
Price | | | Expiration
Date | | | Number of
Contracts | | | Notional
Amount | | | Premium Paid
(Received) | | | Market
Value | |
Put-Markit CDX N.A. I.G. Series 32 5 Year | | | Bank of America N.A. | | | $ | 1.95 | | | | 09/18/2019 | | | | 1,800,000 | | | $ | 1,800,000 | | | $ | 180 | | | $ | 22 | |
| | | | | | | | | | | | | | | | | | | | | | | $ | 180 | | | $ | 22 | |
Written Inflation-Capped Options
| | | | | | | | | | | | | | | | | | | | | | | | | | | | |
Description | | Counterparty | | Initial
Index | | | Floating Rate | | Expiration
Date | | | Number of
Contracts | | | Notional
Amount | | | Premium Paid
(Received) | | | Market
Value | |
| | | | | | | | |
Cap-OTC USANon-Revised Consumer Price Index-Urban(CPI-U), American Style-Call | | JPMorgan Chase Bank N.A. | | | 238.643 | | | Maximum of [0, Final Index/Initial Index – (1 + 4.000%)10] | | | 05/16/2024 | | | | (300,000 | ) | | | $ (300,000) | | | $ | (2,085 | ) | | $ | (16 | ) |
Floor-OTC USANon-Revised Consumer Price Index-Urban(CPI-U), AmericanStyle-Put | | JPMorgan Chase Bank N.A. | | | 234.781 | | | Maximum of [0, Final Index/Initial Index] | | | 10/02/2020 | | | | (1,900,000 | ) | | | (1,900,000 | ) | | | (35,068 | ) | | | (954 | ) |
| | | | | | | | | | | | | | | | | | | | | | | $ | (37,153 | ) | | $ | (970 | ) |
| | | | |
| 20 | | MainStay VP PIMCO Real Return Portfolio | | The notes to the financial statements are an integral part of,
and should be read in conjunction with, the financial statements. |
Written Options on Futures Contracts
| | | | | | | | | | | | | | | | | | | | | | | | | | | | |
Description | | Counterparty | | | Strike
Price | | | Expiration
Date | | | Number of
Contracts | | | Notional
Amount | | | Premium Paid
(Received) | | | Market
Value | |
Call-10-Year United States Treasury Note | | | Morgan Stanley & Co., LLC | | | $ | 129.00 | | | | 07/26/2019 | | | | (19 | ) | | | $ (19,000) | | | $ | (4,726 | ) | | $ | (5,047 | ) |
Call-Euro BOBL | | | Morgan Stanley & Co., LLC | | | | 134.50 | | | | 08/23/2019 | | | | (52 | ) | | | EUR (5,200,000) | | | | (19,898 | ) | | | (21,287 | ) |
Call-Euro Bund | | | Morgan Stanley & Co., LLC | | | | 170.00 | | | | 07/26/2019 | | | | (21 | ) | | | (2,100,000 | ) | | | (25,634 | ) | | | (68,055 | ) |
Call-Euro Bund | | | Morgan Stanley & Co., LLC | | | | 169.50 | | | | 07/26/2019 | | | | (25 | ) | | | (2,500,000 | ) | | | (31,780 | ) | | | (94,095 | ) |
| | | | | | | | | | | | | | | | | | | | | | | $ | (82,038 | ) | | $ | (188,484 | ) |
| | | | | | | | | | | | | | | | | | | | | | | | | | | | |
Description | | Counterparty | | | Strike
Price | | | Expiration
Date | | | Number of
Contracts | | | Notional
Amount | | | Premium Paid
(Received) | | | Market
Value | |
Put-Euro Bund | | | Morgan Stanley & Co., LLC | | | $ | 170.00 | | | | 07/26/2019 | | | | (21 | ) | | | $ (2,100,000) | | | $ | (23,417 | ) | | $ | (2,627 | ) |
Put-Euro Bund | | | Morgan Stanley & Co., LLC | | | | 169.50 | | | | 07/26/2019 | | | | (25 | ) | | | (2,500,000 | ) | | | (29,893 | ) | | | (1,990 | ) |
Put-Euro Schatz | | | Morgan Stanley & Co., LLC | | | | 112.10 | | | | 08/23/2019 | | | | (160 | ) | | | (16,000,000 | ) | | | (14,263 | ) | | | (6,367 | ) |
| | | | | | | | | | | | | | | | | | | | | | | $ | (67,573 | ) | | $ | (10,984 | ) |
Written Swaptions
| | | | | | | | | | | | | | | | | | | | | | | | | | |
Description | | Counterparty | | Strike
Price | | | Expiration
Date | | | Number of
Contracts | | | Notional
Amount | | | Premium Paid
(Received) | | | Market
Value | |
| | | | | | | |
Put-Markit CDX N.A. I.G. Series 32 5 Year | | Bank of America N.A. | | $ | 0.90 | | | | 08/21/2019 | | | | (700,000 | ) | | $ | (700,000 | ) | | $ | (840 | ) | | $ | (129 | ) |
Put-Markit CDX N.A. I.G. Series 32 5 Year | | Bank of America N.A. | | | 0.85 | | | | 07/17/2019 | | | | (1,000,000 | ) | | | (1,000,000 | ) | | | (950 | ) | | | (81 | ) |
Put-Markit CDX N.A. I.G. Series 32 5 Year | | Bank of America N.A. | | | 0.90 | | | | 08/21/2019 | | | | (800,000 | ) | | | (800,000 | ) | | | (936 | ) | | | (148 | ) |
Put-Markit CDX N.A. I.G. Series 32 5 Year | | Bank of America N.A. | | | 1.05 | | | | 09/18/2019 | | | | (300,000 | ) | | | (300,000 | ) | | | (330 | ) | | | (64 | ) |
| | | | | | | | | | | | | | | | | | | | | $ | (3,056 | ) | | $ | (422 | ) |
Swap Contracts
As of June 30, 2019, the Portfolio held the following centrally cleared interest rate swap agreements1:
| | | | | | | | | | | | | | | | | | | | | | | | | | | | | | |
| | | Notional
Amount | | | Currency | | | Expiration
Date | | | Payments
made by Portfolio | | Payments
Received by Portfolio | | Payment
Frequency
Paid/
Received | | Upfront
Premiums
Received/
(Paid) | | | Value | | | Unrealized
Appreciation/
(Depreciation) | |
| | | | | | | | | |
| | | | $4,800,000 | | | | USD | | | | 12/16/2022 | | | 3-MonthUSD-LIBOR | | Fixed 2.25% | | Quarterly/Semi-Annually | | $ | (6,428 | ) | | $ | 82,979 | | | $ | 76,551 | |
| | | | 50,000 | | | | USD | | | | 12/21/2026 | | | Fixed 1.75% | | 3-MonthUSD-LIBOR | | Semi-Annually/ Quarterly | | | 953 | | | | 347 | | | | 1,300 | |
| | | | 14,000,000 | | | | JPY | | | | 9/20/2027 | | | Fixed 0.30% | | 6-MonthJPY-LIBOR | | Semi-Annually/Semi-Annually | | | 209 | | | | (3,567 | ) | | | (3,358 | ) |
| | | | 50,000,000 | | | | JPY | | | | 3/20/2028 | | | Fixed 0.30% | | 6-MonthJPY-LIBOR | | Semi-Annually/Semi-Annually | | | 771 | | | | (12,859 | ) | | | (12,088 | ) |
| | | | 1,600,000 | | | | NZD | | | | 3/21/2028 | | | Fixed 3.25% | | 3-Month NZD Bank Bill | | Semi-Annually/ Quarterly | | | (4,120 | ) | | | (136,858 | ) | | | (140,978 | ) |
| | | | 2,770,000 | | | | USD | | | | 4/17/2028 | | | Fixed 3.10% | | 3-MonthUSD-LIBOR | | Semi-Annually/ Quarterly | | | 7,234 | | | | (129,215 | ) | | | (121,981 | ) |
| | | | 3,700,000 | | | | USD | | | | 6/20/2028 | | | Fixed 2.25% | | 3-MonthUSD-LIBOR | | Semi-Annually/ Quarterly | | | (178,869 | ) | | | (104,787 | ) | | | (283,656 | ) |
| | | | 2,900,000 | | | | USD | | | | 9/13/2028 | | | Fixed 3.134% | | 3-MonthUSD-LIBOR | | Semi-Annually/ Quarterly | | | — | | | | (132,590 | ) | | | (132,590 | ) |
| | | | 106,980,000 | | | | JPY | | | | 3/20/2029 | | | Fixed 0.45% | | 6-MonthJPY-LIBOR | | Semi-Annually/Semi-Annually | | | 4,765 | | | | (42,008 | ) | | | (37,243 | ) |
| | | | 610,000 | | | | USD | | | | 6/15/2046 | | | Fixed 2.50% | | 3-MonthUSD-LIBOR | | Semi-Annually/ Quarterly | | | 21,610 | | | | (34,608 | ) | | | (12,998 | ) |
| | | | 2,310,000 | | | | USD | | | | 12/21/2046 | | | Fixed 2.25% | | 3-MonthUSD-LIBOR | | Semi-Annually/ Quarterly | | | 169,884 | | | | (9,143 | ) | | | 160,741 | |
| | | | 1,170,000 | | | | USD | | | | 12/15/2047 | | | Fixed 2.00% | | 12-MonthUSD-FFR | | Annually/ Annually | | | (2,141 | ) | | | (9,173 | ) | | | (11,314 | ) |
| | | | 1,490,000 | | | | USD | | | | 12/20/2047 | | | Fixed 2.75% | | 3-MonthUSD-LIBOR | | Semi-Annually/ Quarterly | | | (68,219 | ) | | | (168,657 | ) | | | (236,876 | ) |
| | | | 1,290,000 | | | | USD | | | | 6/20/2048 | | | Fixed 2.50% | | 3-MonthUSD-LIBOR | | Semi-Annually/ Quarterly | | | (148,472 | ) | | | (76,180 | ) | | | (224,652 | ) |
| | | | 200,000 | | | | USD | | | | 12/19/2048 | | | Fixed 2.75% | | 3-MonthUSD-LIBOR | | Semi-Annually/ Quarterly | | | (4,110 | ) | | | (23,156 | ) | | | (27,266 | ) |
| | | | 1,500,000 | | | | USD | | | | 12/19/2048 | | | Fixed 3.00% | | 6-MonthGBP-LIBOR | | Semi-Annually/Quarterly | | | (87,386 | ) | | | (257,902 | ) | | | (345,288 | ) |
| | | | | | | | | | | | | | | | | | | | | $ | (294,319 | ) | | $ | (1,057,377 | ) | | $ | (1,351,696 | ) |
| | | | | | |
The notes to the financial statements are an integral part of,
and should be read in conjunction with, the financial statements. | | | | | 21 | |
Portfolio of InvestmentsJune 30, 2019 (Unaudited) (continued)
Open OTC interest rate swap agreements as of June 30, 2019 were as follows:
| | | | | | | | | | | | | | | | | | | | | | | | | | | | | | | | | | | | |
| | | Notional
Amount | | | Currency | | | Expiration
Date | | | Counterparty | | Payments made by Portfolio | | Payments
Received by
Portfolio | | | Payment
Frequency
Paid/
Received | | | Upfront
Premiums
Received/
(Paid) | | | Value | | | Unrealized
Appreciation/
(Depreciation) | |
| | | | | | | | | | |
| | | $ | 4,190,000 | | | | ILS | | | | 2/16/2020 | | | Bank of America N.A. | | Fixed 0.285% | | | 3-Month TELBOR | | | | Annually/Quarterly | | | $ | — | | | $ | (815 | ) | | $ | (815 | ) |
| | | | | | | | | | |
| | | | 880,000 | | | | ILS | | | | 2/16/2028 | | | Bank of America N.A. | | 3-Month TELBOR | | | Fixed 1.963% | | | | Quarterly/Annually | | | | — | | | | 14,739 | | | | 14,739 | |
| | | | | | | | | | |
| | | | 2,570,000 | | | | ILS | | | | 6/20/2020 | | | Bank of America N.A. | | Fixed 0.37% | | | 3-Month TELBOR | | | | Annually/Quarterly | | | | — | | | | (429 | ) | | | (429 | ) |
| | | | | | | | | | |
| | | | 540,000 | | | | ILS | | | | 6/20/2028 | | | Bank of America N.A. | | 3-Month TELBOR | | | Fixed 1.998% | | | | Quarterly/Annually | | | | — | | | | 8,217 | | | | 8,217 | |
| | | | | | | | | | |
| | | | | | | | | | | | | | | | | | | | | | | | | | | $ | — | | | $ | 21,712 | | | $ | 21,712 | |
As of June 30, 2019, the Portfolio held the following open centrally cleared inflation swap agreements1:
| | | | | | | | | | | | | | | | | | | | | | | | | | | | | | |
| | | Notional
Amount | | | Currency | | | Expiration Date | | | Payments made by Portfolio | | Payments Received by Portfolio | | Payment Frequency Paid/ Received | | Upfront
Premiums
Received/
(Paid) | | | Value | | | Unrealized Appreciation/ (Depreciation) | |
| | | | $1,300,000 | | | | USD | | | | 11/23/2020 | | | Fixed 2.026% | | 12-Month USD-CPI | | At Maturity | | $ | — | | | $ | (3,457 | ) | | $ | (3,457 | ) |
| | | | 1,300,000 | | | | USD | | | | 11/25/2020 | | | Fixed 2.021% | | 12-MonthUSD-CPI | | At Maturity | | | — | | | | (3,294 | ) | | | (3,294 | ) |
| | | | 1,100,000 | | | | USD | | | | 4/27/2023 | | | Fixed 2.264% | | 12-MonthUSD-CPI | | At Maturity | | | — | | | | (28,621 | ) | | | (28,621 | ) |
| | | | 510,000 | | | | USD | | | | 5/9/2023 | | | Fixed 2.262% | | 12-MonthUSD-CPI | | At Maturity | | | — | | | | (13,070 | ) | | | (13,070 | ) |
| | | | 780,000 | | | | USD | | | | 5/10/2023 | | | Fixed 2.281% | | 12-MonthUSD-CPI | | At Maturity | | | — | | | | (20,685 | ) | | | (20,685 | ) |
| | | | 4,400,000 | | | | EUR | | | | 3/15/2024 | | | Fixed 1.03% | | 12-MonthEUR-CPI | | At Maturity | | | 1,053 | | | | (43,374 | ) | | | (42,321 | ) |
| | | | 760,000 | | | | EUR | | | | 12/15/2026 | | | 12-MonthEUR-CPI | | Fixed 1.385% | | At Maturity | | | 2,193 | | | | 26,046 | | | | 28,239 | |
| | | | 800,000 | | | | EUR | | | | 6/15/2027 | | | 12-MonthEUR-CPI | | Fixed 1.36% | | At Maturity | | | 9,937 | | | | 27,101 | | | | 37,038 | |
| | | | 1,100,000 | | | | USD | | | | 7/25/2027 | | | 12-MonthUSD-CPI | | Fixed 2.067% | | At Maturity | | | — | | | | 14,899 | | | | 14,899 | |
| | | | 600,000 | | | | USD | | | | 9/25/2027 | | | 12-MonthUSD-CPI | | Fixed 2.15% | | At Maturity | | | — | | | | 11,893 | | | | 11,893 | |
| | | | 1,200,000 | | | | USD | | | | 10/17/2027 | | | 12-MonthUSD-CPI | | Fixed 2.155% | | At Maturity | | | — | | | | 25,052 | | | | 25,052 | |
| | | | 3,900,000 | | | | EUR | | | | 11/15/2027 | | | 12-MonthEUR-CPI | | Fixed 1.52% | | At Maturity | | | 2,993 | | | | 208,868 | | | | 211,861 | |
| | | | 1,000,000 | | | | EUR | | | | 3/15/2028 | | | 12-MonthEUR-CPI | | Fixed 1.535% | | At Maturity | | | (115 | ) | | | 56,910 | | | | 56,795 | |
| | | | 510,000 | | | | USD | | | | 5/9/2028 | | | 12-MonthUSD-CPI | | Fixed 2.352% | | At Maturity | | | — | | | | 25,365 | | | | 25,365 | |
| | | | 770,000 | | | | USD | | | | 5/9/2028 | | | 12-MonthUSD-CPI | | Fixed 2.36% | | At Maturity | | | — | | | | 38,909 | | | | 38,909 | |
| | | | 850,000 | | | | EUR | | | | 5/15/2028 | | | 12-MonthEUR-CPI | | Fixed 1.62% | | At Maturity | | | (48 | ) | | | 56,825 | | | | 56,777 | |
| | | | 3,460,000 | | | | GBP | | | | 6/15/2030 | | | UK RPI | | Fixed 3.40% | | At Maturity | | | (12,065 | ) | | | 18,813 | | | | 6,748 | |
| | | | 2,070,000 | | | | GBP | | | | 4/15/2031 | | | UK RPI | | Fixed 3.14% | | At Maturity | | | 170,890 | | | | (205,952 | ) | | | (35,062 | ) |
| | | | 2,690,000 | | | | GBP | | | | 10/15/2031 | | | UK RPI | | Fixed 3.53% | | At Maturity | | | 2,988 | | | | (7,744 | ) | | | (4,756 | ) |
| | | | 200,000 | | | | EUR | | | | 3/15/2033 | | | Fixed 1.71% | | 12-Month EUR-CPI | | At Maturity | | | 356 | | | | (20,853 | ) | | | (20,497 | ) |
| | | | 310,000 | | | | GBP | | | | 6/15/2039 | | | UK RPI | | Fixed 3.58% | | At Maturity | | | (313 | ) | | | 1,139 | | | | 826 | |
| | | | 350,000 | | | | GBP | | | | 6/15/2039 | | | UK RPI | | Fixed 3.59% | | At Maturity | | | — | | | | 2,714 | | | | 2,714 | |
| | | | 920,000 | | | | GBP | | | | 6/15/2039 | | | UK RPI | | Fixed 3.60% | | At Maturity | | | 378 | | | | 10,896 | | | | 11,274 | |
| | | | | | | | | | | | | | | | | | | | | $ | 178,247 | | | $ | 178,380 | | | $ | 356,627 | |
As of June 30, 2019, the Portfolio held the following centrally cleared credit default swap contracts1:
| | | | | | | | | | | | | | | | | | | | | | | | | | | | | | | | |
Reference Entity | | Termination
Date | | | Buy/Sell
Protection2 | | | Notional
Amount
(000)3 | | | (Pay)/
Receive
Fixed
Rate4 | | | Payment
Frequency
Paid/
Received | | | Upfront
Premiums
Received/
(Paid) | | | Value | | | Unrealized
Appreciation/
(Depreciation)5 | |
| | | | | | | | |
Daimler AG 0.625%, 03/05/20 | | | 12/20/2020 | | | | Sell | | | | 150 | | | | 1.00 | % | | | Quarterly | | | $ | (1,379 | ) | | $ | 2,122 | | | $ | 743 | |
General Electric Co. 2.70%, 10/09/22 | | | 12/20/2020 | | | | Sell | | | | 100 | | | | 1.00 | % | | | Quarterly | | | | 2,057 | | | | 1,113 | | | | 3,170 | |
CDX North American High Yield Series 31 | | | 12/20/2023 | | | | Buy | | | | 5,131 | | | | 5.00 | % | | | Quarterly | | | | 263,668 | | | | (419,269 | ) | | | (155,601 | ) |
General Electric Co. 2.70%, 10/09/22 | | | 12/20/2023 | | | | Sell | | | | 100 | | | | 1.00 | % | | | Quarterly | | | | 4,323 | | | | 819 | | | | 5,142 | |
CDX North American High Yield Series 32 | | | 6/20/2024 | | | | Buy | | | | 2,100 | | | | 5.00 | % | | | Quarterly | | | | 158,854 | | | | (157,541 | ) | | | 1,313 | |
| | | | | | | | | | | | | | | | | | | | | | | $ | 427,523 | | | $ | (572,756 | ) | | $ | (145,233 | ) |
| | | | |
| 22 | | MainStay VP PIMCO Real Return Portfolio | | The notes to the financial statements are an integral part of,
and should be read in conjunction with, the financial statements. |
As of June 30, 2019, the Portfolio held the following OTC credit default swap contracts:
| | | | | | | | | | | | | | | | | | | | | | | | | | | | | | | | | | | | |
Reference Entity | | Counterparty | | | Termination
Date | | | Buy/Sell
Protection2 | | | Notional
Amount
(000)3 | | | (Pay)/
Receive
Fixed
Rate4 | | | Payment
Frequency
Paid/
Received | | | Upfront
Premiums
Received/
(Paid) | | | Value | | | Unrealized
Appreciation/
(Depreciation)5 | |
United Mexican States | | | Bank of America N.A. | | | | 12/20/2023 | | | | Buy | | | | 3,400 | | | | 1.00 | % | | | Quarterly | | | $ | (29,241 | ) | | $ | (745 | ) | | $ | (29,986 | ) |
| | | | | | | | | | | | | | | | | | | | | | | | | | | $ | (29,241 | ) | | $ | (745 | ) | | $ | (29,986 | ) |
| 1. | As of June 30, 2019, cash in the amount of $1,699,000 was on deposit with a broker for centrally cleared swap agreements. |
| 2. | Buy—Portfolio pays premium and buys credit protection. If a credit event occurs, as defined under the terms of that particular swap agreement, the Portfolio will either (i) receive from the seller of protection an amount equal to the notional amount of the swap and deliver the referenced obligation or underlying securities comprising the referenced index or (ii) receive a net settlement amount in the form of cash or securities equal to the notional amount of the swap less the recovery value of the referenced obligation or underlying securities comprising the referenced index. |
| | Sell—Portfolio receives premium and sells credit protection. If a credit event occurs, as defined under the terms of that particular swap agreement, the Portfolio will either (i) pay to the buyer of protection an amount equal to the notional amount of the swap and take delivery of the referenced obligation or underlying securities comprising the referenced index or (ii) pay a net settlement amount in the form of cash or securities equal to the notional amount of the swap less the recovery value of the referenced obligation or underlying securities comprising the referenced index. |
| 3. | The maximum potential amount the Portfolio could be required to pay as a seller of credit protection or receive as a buyer of credit protection if a credit event occurs as defined under the terms of that particular swap contract. |
| 4. | The annual fixed rate represents the interest received by the Portfolio (as a seller of protection) or paid by the Portfolio (as a buyer of protection) annually on the notional amount of the credit default swap contract. |
| 5. | Represents the difference between the value of the credit default swap contracts at the time they were opened and the value at June 30, 2019. |
The following abbreviations are used in the preceding pages:
ARS—Argentine Peso
AUD—Australian Dollar
BADLARPP—Average rate on30-day deposits of at least 1 million Argentinian Pesos
BRL—Brazilian Real
BTP—Buoni del Tesoro Poliennali (Eurex Exchange index)
CAD—Canadian Dollar
CNH—Chinese Offshore Yuan
COP—Colombian Peso
DKK—Danish Krone
EUR—Euro
GBP—British Pound Sterling
IDR—Indonesian Rupiah
ILS—Israeli Shekel
JPY—Japanese Yen
KRW—South Korean Won
LIBOR—London Interbank Offered Rate
MXN—Mexican Peso
NZD—New Zealand Dollar
PEN—Peruvian Sol
REMIC—Real Estate Mortgage Investment Conduit
RUB—New Russian Ruble
SGD—Singapore Dollar
TBA—To Be Announced
TELBOR—Tel Aviv Interbank Offered Rate
TWD—New Taiwan Dollar
USD—United States Dollar
ZAR—South African Rand
| | | | | | |
The notes to the financial statements are an integral part of,
and should be read in conjunction with, the financial statements. | | | | | 23 | |
Portfolio of InvestmentsJune 30, 2019 (Unaudited) (continued)
The following is a summary of the fair valuations according to the inputs used as of June 30, 2019, for valuing the Portfolio’s assets and liabilities:
| | | | | | | | | | | | | | | | |
Description | | Quoted
Prices in
Active
Markets for
Identical
Assets (Level 1) | | | Significant
Other
Observable
Inputs
(Level 2) | | | Significant
Unobservable
Inputs
(Level 3) | | | Total | |
| | | | |
Asset Valuation Inputs | | | | | | | | | | | | | | | | |
| Investments in Securities (a) | | | | | | | | | | | | | | | | |
| Long-Term Bonds | | | | | | | | | | | | | | | | |
Asset-Backed Securities | | $ | — | | | $ | 23,901,979 | | | $ | — | | | $ | 23,901,979 | |
Corporate Bonds | | | — | | | | 47,562,311 | | | | — | | | | 47,562,311 | |
Foreign Government Bonds | | | — | | | | 40,086,449 | | | | — | | | | 40,086,449 | |
Mortgage-Backed Securities | | | — | | | | 17,705,153 | | | | — | | | | 17,705,153 | |
U.S. Government & Federal Agencies | | | — | | | | 424,238,255 | | | | — | | | | 424,238,255 | |
| | | | | | | | | | | | | | | | |
| Total Long-Term Bonds | | | — | | | | 553,494,147 | | | | — | | | | 553,494,147 | |
| | | | | | | | | | | | | | | | |
| Purchased Options | | | 7,688 | | | | — | | | | — | | | | 7,688 | |
| Short-Term Investments | | | | | | | | | | | | | | | | |
Affiliated Investment Company | | | 803,745 | | | | — | | | | — | | | | 803,745 | |
Foreign Government Bonds | | | — | | | | 3,585,852 | | | | — | | | | 3,585,852 | |
Repurchase Agreement | | | — | | | | 9,700,000 | | | | — | | | | 9,700,000 | |
Short Term Instruments | | | — | | | | 4,084,869 | | | | — | | | | 4,084,869 | |
| | | | | | | | | | | | | | | | |
| Total Short-Term Investments | | | 803,745 | | | | 17,370,721 | | | | — | | | | 18,174,466 | |
| | | | | | | | | | | | | | | | |
| Total Investments in Securities | | | 811,433 | | | | 570,864,868 | | | | — | | | | 571,676,301 | |
| | | | | | | | | | | | | | | | |
| Other Financial Instruments | | | | | | | | | | | | | | | | |
Credit Default Swap Contracts (b) | | | — | | | | 10,368 | | | | — | | | | 10,368 | |
Foreign Currency Forward Contracts (b) | | | — | | | | 403,889 | | | | — | | | | 403,889 | |
Futures Contracts (b) | | | 570,757 | | | | — | | | | — | | | | 570,757 | |
Inflation Swap Contracts (b) | | | — | | | | 528,390 | | | | — | | | | 528,390 | |
Interest Rate Swap Contracts (b) | | | — | | | | 261,548 | | | | — | | | | 261,548 | |
| | | | | | | | | | | | | | | | |
| Total Other Financial Instruments | | | 570,757 | | | | 1,204,195 | | | | — | | | | 1,774,952 | |
| | | | | | | | | | | | | | | | |
| Total Investments in Securities and Other Financial Instruments | | $ | 1,382,190 | | | $ | 572,069,063 | | | $ | — | | | $ | 573,451,253 | |
| | | | | | | | | | | | | | | | |
| | | | |
Liability Valuation Inputs | | | | | | | | | | | | | | | | |
| Other Financial Instruments | | | | | | | | | | | | | | | | |
Foreign Currency Forward Contracts (b) | | $ | — | | | $ | (800,019 | ) | | $ | — | | | $ | (800,019 | ) |
Futures Contracts (b) | | | (1,625,153 | ) | | | — | | | | — | | | | (1,625,153 | ) |
Credit Default Swap Contracts (b) | | | — | | | | (185,587 | ) | | | — | | | | (185,587 | ) |
Inflation Swap Contracts (b) | | | — | | | | (171,763 | ) | | | — | | | | (171,763 | ) |
Interest Rate Swap Contracts (b) | | | — | | | | (1,591,532 | ) | | | — | | | | (1,591,532 | ) |
Written Options | | | (199,890 | ) | | | (970 | ) | | | — | | | | (200,860 | ) |
| | | | | | | | | | | | | | | | |
| Total Other Financial Instruments | | $ | (1,825,043 | ) | | $ | (2,749,871 | ) | | $ | — | | | $ | (4,574,914 | ) |
| | | | | | | | | | | | | | | | |
| (a) | For a complete listing of investments and their industries, see the Portfolio of Investments. |
| (b) | The value listed for these securities reflects unrealized appreciation (depreciation) as shown on the Portfolio of Investments. |
| | | | |
| 24 | | MainStay VP PIMCO Real Return Portfolio | | The notes to the financial statements are an integral part of,
and should be read in conjunction with, the financial statements. |
Sale-Buyback Transactions (a)
| | | | | | | | | | | | | | | | | | | | |
Counterparty | | Borrowing
Rate | | | Borrowing
Date | | | Maturity
Date | | | Ammount
Borrowed | | | Payable for
Sale-Buyback
Transcations (b) | |
| | | | | |
Barclays Capital Inc. | | | 2.72 | % | | | 6/17/2019 | | | | 7/1/2019 | | | $ | 122,356 | | | $ | 122,356 | |
| | | | | |
Barclays Capital Inc. | | | 2.75 | | | | 6/25/2019 | | | | 7/2/2019 | | | | 5,684,215 | | | | 5,684,360 | |
| | | | | |
Barclays Capital Inc. | | | 2.65 | | | | 6/10/2019 | | | | 7/10/2019 | | | | 248,329 | | | | 248,524 | |
| | | | | |
Barclays Capital Inc. | | | 2.60 | | | | 4/24/2019 | | | | 7/23/2019 | | | | 6,393,565 | | | | 6,402,788 | |
| | | | | |
Barclays Capital Inc. | | | 2.61 | | | | 6/11/2019 | | | | 7/24/2019 | | | | 3,759,408 | | | | 3,764,399 | |
| | | | | |
Barclays Capital Inc. | | | 2.57 | | | | 6/12/2019 | | | | 7/25/2019 | | | | 3,122,955 | | | | 3,126,518 | |
| | | | | |
Barclays Capital Inc. | | | 2.61 | | | | 6/17/2019 | | | | 7/30/2019 | | | | 984,021 | | | | 985,521 | |
| | | | | |
Barclays Capital Inc. | | | 2.62 | | | | 6/17/2019 | | | | 7/30/2019 | | | | 25,959,491 | | | | 25,996,183 | |
| | | | | |
Barclays Capital Inc. | | | 2.55 | | | | 5/6/2019 | | | | 8/6/2019 | | | | 22,630,318 | | | | 22,682,002 | |
| | | | | |
Barclays Capital Inc. | | | 2.58 | | | | 5/6/2019 | | | | 8/6/2019 | | | | 16,218,496 | | | | 16,280,323 | |
| | | | | |
Barclays Capital Inc. | | | 2.55 | | | | 5/6/2019 | | | | 8/6/2019 | | | | 27,469,826 | | | | 27,531,730 | |
| | | | | |
Barclays Capital Inc. | | | 2.56 | | | | 5/6/2019 | | | | 8/6/2019 | | | | 38,673,254 | | | | 38,777,475 | |
| Barclays Capital Inc. | | | 2.55 | | | | 5/6/2019 | | | | 8/6/2019 | | | | 29,947,853 | | | | 30,015,889 | |
| | | | | | | | | | | | | | | | | | | | |
| | | | | | | | | | | | | | $ | 181,214,087 | | | $ | 181,618,068 | |
| | | | | | | | | | | | | | | | | | | | |
| (a) | During the period ended June 30, 2019, the Portfolio’s average amount of borrowing was $150,579,236 at a weighted average interest rate of 2.65%. |
| (b) | Payable for sale-buyback transactions includes $403,981 of deferred price drop. |
| | | | | | |
The notes to the financial statements are an integral part of,
and should be read in conjunction with, the financial statements. | | | | | 25 | |
Statement of Assets and Liabilitiesas of June 30, 2019 (Unaudited)
| | | | |
| Assets | |
Investment in unaffiliated securities before outstanding written options, at value (identified cost $568,255,148) | | $ | 570,872,556 | |
Investment in affiliated investment company, at value (identified cost $803,745) | | | 803,745 | |
Cash collateral on deposit at broker for futures contracts | | | 2,133,929 | |
Cash collateral on deposit at broker for swap contracts | | | 1,699,000 | |
Cash denominated in foreign currencies (identified cost $1,168,464) | | | 1,137,398 | |
Receivables: | | | | |
Investment securities sold | | | 125,384,332 | |
Dividends and interest | | | 1,496,349 | |
Portfolio shares sold | | | 361,211 | |
Variation margin on centrally cleared swap contracts | | | 278,887 | |
Unrealized appreciation on foreign currency forward contracts | | | 403,889 | |
Other assets | | | 188,868 | |
Premiums paid for OTC swap contracts | | | 29,241 | |
Unrealized appreciation on OTC swap contracts | | | 22,956 | |
| | | | |
Total assets | | | 704,812,361 | |
| | | | |
| |
| Liabilities | | | | |
Cash collateral due to broker for foreign currency forward contracts | | | 2,400,000 | |
Cash collateral due to broker for TBA | | | 330,000 | |
Written options, at value (premiums received $189,820) | | | 200,860 | |
Due to custodian | | | 70,591 | |
Payables: | | | | |
Sale buyback transaction | | | 181,214,087 | |
Investment securities purchased | | | 153,789,454 | |
Variation margin on futures contracts | | | 880,126 | |
Portfolio shares redeemed | | | 135,455 | |
Manager (See Note 3) | | | 124,119 | |
Custodian | | | 71,471 | |
NYLIFE Distributors (See Note 3) | | | 65,090 | |
Professional fees | | | 52,745 | |
Shareholder communication | | | 35,774 | |
Interest on investments sold short | | | 6,955 | |
Trustees | | | 417 | |
Accrued expenses | | | 2,980 | |
Unrealized depreciation on foreign currency forward contracts | | | 800,019 | |
Unrealized depreciation on OTC swap contracts | | | 31,230 | |
| | | | |
Total liabilities | | | 340,211,373 | |
| | | | |
Net assets | | $ | 364,600,988 | |
| | | | |
| |
| Composition of Net Assets | | | | |
Shares of beneficial interest outstanding (par value of $.001 per share) unlimited number of shares authorized | | $ | 41,909 | |
Additionalpaid-in capital | | | 425,141,883 | |
| | | | |
| | | 425,183,792 | |
Total distributable earnings (loss) | | | (60,582,804 | ) |
| | | | |
Net assets | | $ | 364,600,988 | |
| | | | |
| | | | |
Initial Class | | | | |
Net assets applicable to outstanding shares | | $ | 45,180,853 | |
| | | | |
Shares of beneficial interest outstanding | | | 5,181,200 | |
| | | | |
Net asset value per share outstanding | | $ | 8.72 | |
| | | | |
Service Class | | | | |
Net assets applicable to outstanding shares | | $ | 319,420,135 | |
| | | | |
Shares of beneficial interest outstanding | | | 36,727,970 | |
| | | | |
Net asset value per share outstanding | | $ | 8.70 | |
| | | | |
| | | | |
| 26 | | MainStay VP PIMCO Real Return Portfolio | | The notes to the financial statements are an integral part of,
and should be read in conjunction with, the financial statements. |
Statement of Operationsfor the six months ended June 30, 2019 (Unaudited)
| | | | |
| Investment Income (Loss) | |
Income | | | | |
Interest | | $ | 7,739,768 | |
Dividends-affiliated | | | 11,480 | |
Securities lending | | | 344 | |
| | | | |
Total income | | | 7,751,592 | |
| | | | |
Expenses | | | | |
Interest expense | | | 2,021,008 | |
Manager (See Note 3) | | | 853,702 | |
Distribution/Service—Service Class (See Note 3) | | | 370,685 | |
Custodian | | | 76,067 | |
Professional fees | | | 58,561 | |
Shareholder communication | | | 43,959 | |
Trustees | | | 4,087 | |
Miscellaneous | | | 7,524 | |
| | | | |
Total expenses before waiver/reimbursement | | | 3,435,593 | |
Expense waiver/reimbursement from Manager (See Note 3) | | | (48,645 | ) |
| | | | |
Net expenses | | | 3,386,948 | |
| | | | |
Net investment income (loss) | | | 4,364,644 | |
| | | | |
|
| Realized and Unrealized Gain (Loss) on Investments, Futures Contracts, Swap Contracts, Written Options and Foreign Currency Transactions | |
Net realized gain (loss) on: | | | | |
Unaffiliated investment transactions | | | 2,186,178 | |
Futures transactions | | | (3,301,292 | ) |
Written option transactions | | | (391,136 | ) |
Swap transactions | | | 276,319 | |
Foreign currency forward transactions | | | 2,865 | |
Foreign currency transactions | | | 1,390,828 | |
| | | | |
Net realized gain (loss) on investments, investments sold short, futures transactions, written options, swap transactions and foreign currency transactions | | | 163,762 | |
| | | | |
Net change in unrealized appreciation (depreciation) on: | | | | |
Unaffiliated investments | | | 18,399,710 | |
Futures contracts | | | 365,451 | |
Swap contracts | | | (1,561,937 | ) |
Written option contracts | | | (23,369 | ) |
Foreign currency forward contracts | | | (1,008,884 | ) |
Translation of other assets and liabilities in foreign currencies | | | 27,880 | |
| | | | |
Net change in unrealized appreciation (depreciation) on investments, futures contracts, swap contracts, written options and foreign currency transactions | | | 16,198,851 | |
| | | | |
Net realized and unrealized gain (loss) on investments, investments sold short, futures transactions, written options, swap transactions and foreign currency transactions | | | 16,362,613 | |
| | | | |
Net increase (decrease) in net assets resulting from operations | | $ | 20,727,257 | |
| | | | |
| | | | | | |
The notes to the financial statements are an integral part of,
and should be read in conjunction with, the financial statements. | | | | | 27 | |
Statements of Changes in Net Assets
for the six months ended June 30, 2019 (Unaudited) and the year ended December 31, 2018
| | | | | | | | |
| | | 2019 | | | 2018 | |
| Increase (Decrease) in Net Assets | |
Operations: | | | | | | | | |
Net investment income (loss) | | $ | 4,364,644 | | | $ | 8,405,382 | |
Net realized gain (loss) on investments, futures contracts, written options, swap contracts, written options and foreign currency transactions | | | 163,762 | | | | (3,673,329 | ) |
Net change in unrealized appreciation (depreciation) on investments, futures contracts, written options, swap contracts, written options and foreign currency transactions | | | 16,198,851 | | | | (13,460,121 | ) |
| | | | |
Net increase (decrease) in net assets resulting from operations | | | 20,727,257 | | | | (8,728,068 | ) |
| | | | |
Distributions to shareholders: | | | | | | | | |
Initial Class | | | — | | | | (740,327 | ) |
Service Class | | | — | | | | (3,847,156 | ) |
| | | | |
Total distributions to shareholders | | | — | | | | (4,587,483 | ) |
| | | | |
Capital share transactions: | | | | | | | | |
Net proceeds from sale of shares | | | 38,056,775 | | | | 46,796,177 | |
Net asset value of shares issued to shareholders in reinvestment of dividends and distributions | | | — | | | | 4,587,483 | |
Cost of shares redeemed | | | (20,757,820 | ) | | | (44,576,278 | ) |
| | | | |
Increase (decrease) in net assets derived from capital share transactions | | | 17,298,955 | | | | 6,807,382 | |
| | | | |
Net increase (decrease) in net assets | | | 38,026,212 | | | | (6,508,169 | ) |
|
| Net Assets | |
Beginning of period | | | 326,574,776 | | | | 333,082,945 | |
| | | | |
End of period | | $ | 364,600,988 | | | $ | 326,574,776 | |
| | | | |
| | | | |
| 28 | | MainStay VP PIMCO Real Return Portfolio | | The notes to the financial statements are an integral part of,
and should be read in conjunction with, the financial statements. |
Statement of Cash Flows
for the six months ended June 30, 2019 (Unaudited)
| | | | |
| Cash flows from operating activities: | |
Net increase in net assets resulting from operations | | $ | 20,727,257 | |
Adjustments to reconcile net increase in net assets resulting from operations to net cash from operating activities: | | | | |
Long term investments purchased | | | (400,602,346 | ) |
Long term investments sold | | | 362,347,594 | |
Purchase of short term investments, net | | | 3,929,620 | |
Purchase of affiliated investments, net | | | 60,345 | |
Amortization (accretion) of discount and premium, net | | | (3,694,330 | ) |
Decrease in investment securities sold receivable | | | 8,116,042 | |
Decrease in dividends and interest receivable | | | 53,243 | |
Increase in premiums paid for OTC swap contracts | | | (29,241 | ) |
Increase in other assets | | | (188,868 | ) |
Decrease in unrealized appreciation for open forward foreign currency contracts | | | 514,292 | |
Increase in premiums from written options | | | 110,981 | |
Increase in investment securities purchased payable | | | 96,097,564 | |
Increase in interest payable for securities sold short | | | 5 | |
Increase in cash collateral due to broker for foreign currency forward contracts | | | 1,500,000 | |
Decrease in cash collateral due to broker for TBA | | | 60,000 | |
Decrease in professional fees payable | | | (9,762 | ) |
Increase in variation margin on centrally cleared swap contracts | | | (134,420 | ) |
Decrease in custodian payable | | | (4,990 | ) |
Decrease in shareholder communication payable | | | (3,754 | ) |
Increase in due to Trustees | | | 53 | |
Decrease in due to manager | | | (14,560 | ) |
Increase in due to NYLIFE Distributors | | | 5,258 | |
Decrease in variation margin on futures contracts | | | (152,314 | ) |
Increase in unrealized depreciation for open forward foreign currency contracts | | | 494,592 | |
Increase in accrued expenses | | | 1,967 | |
Increase in unrealized appreciation on OTC swap contracts | | | (19,959 | ) |
Increase in unrealized depreciation on OTC swap contracts | | | 24,813 | |
Net realized loss from unaffiliated investments | | | (2,186,178 | ) |
Net change in unrealized (appreciation) depreciation on unaffiliated investments | | | (18,399,710 | ) |
Net change in unrealized (appreciation) depreciation on written options | | | 23,369 | |
| | | | |
Net cash from operating activities* | | | 68,626,563 | |
| | | | |
| | | | |
| Cash flows used in financing activities: | |
Proceeds from shares sold | | $ | 38,116,615 | |
Payment on shares redeemed | | | (20,840,866 | ) |
Increase in due to custodian | | | 70,591 | |
Proceeds from sale-buyback transactions | | | 1,175,417,518 | |
Payments on sale-buyback transactions | | | (1,261,641,002 | ) |
| | | | |
Net cash used in financing activities | | | (68,877,144 | ) |
| | | | |
Effect of exchange rate changes on cash | | | 8,802 | |
Net decrease in cash and restricted cash | | | (241,779 | ) |
Cash, restricted cash and foreign currency at beginning of period | | | 5,212,106 | |
| | | | |
Cash, restricted cash and foreign currency at end of period | | $ | 4,970,327 | |
| | | | |
| * | Included in operating expenses is cash of $2,020,912 paid for interest on borrowings. |
| | |
| Supplemental disclosure of cash flow information: |
The following tables provide a reconciliation of cash and restricted cash reported within the Statement of Assets and Liabilities that sums to the total of the such amounts shown on the Statement of Cash Flows:
| | | | |
Cash and restricted cash at beginning of period | | | | |
Cash | | $ | 25,920 | |
Cash denominated in foreign currencies | | | 1,004,149 | |
Cash collateral on deposit at broker for futures contracts | | | 2,316,399 | |
Cash collateral on deposit at broker for swap contracts | | | 1,865,638 | |
| | | | |
Total cash and restricted cash shown in the Statement of Cash Flows | | $ | 5,212,106 | |
| | | | |
Cash and restricted cash at end of period | | | | |
Cash denominated in foreign currencies | | $ | 1,137,398 | |
Cash collateral on deposit at broker for futures contracts | | | 2,133,929 | |
Cash collateral on deposit at broker for swap contracts | | | 1,699,000 | |
| | | | |
Total cash and restricted cash shown in the Statement of Cash Flows | | $ | 4,970,327 | |
| | | | |
Restricted cash consists of cash that has been segregated to cover the Portfolio’s collateral or margin obligations under derivative contracts. It is separately reported on the Statement of Assets and Liabilities as cash collateral on deposit at brokers.
| | | | | | |
The notes to the financial statements are an integral part of,
and should be read in conjunction with, the financial statements. | | | | | 29 | |
Financial Highlightsselected per share data and ratios
| | | | | | | | | | | | | | | | | | | | | | | | | | | | | | |
| | |
| | | Six months
ended
June 30, | | Year ended December 31, |
| | | | | | |
| Initial Class | | 2019* | | 2018 | | 2017 | | 2016 | | 2015 | | 2014 |
| | | | | | |
Net asset value at beginning of period | | | $ | 8.20 | | | | $ | 8.54 | | | | $ | 8.40 | | | | $ | 8.11 | | | | $ | 8.71 | | | | $ | 9.44 | |
| | | | | | | | | | | | | | | | | | | | | | | | | | | | | | |
| | | | | | |
Net investment income (loss) (a) | | | | 0.11 | | | | | 0.23 | | | | | 0.23 | | | | | 0.17 | | | | | 0.11 | | | | | 0.26 | |
| | | | | | |
Net realized and unrealized gain (loss) on investments | | | | 0.40 | | | | | (0.53 | ) | | | | 0.15 | | | | | 0.21 | | | | | (0.51 | ) | | | | (0.18 | ) |
| | | | | | |
Net realized and unrealized gain (loss) on foreign currency transactions | | | | 0.01 | | | | | 0.10 | | | | | (0.09 | ) | | | | 0.05 | | | | | 0.19 | | | | | 0.18 | |
| | | | | | | | | | | | | | | | | | | | | | | | | | | | | | |
| | | | | | |
Total from investment operations | | | | 0.52 | | | | | (0.20 | ) | | | | 0.29 | | | | | 0.43 | | | | | (0.21 | ) | | | | 0.26 | |
| | | | | | | | | | | | | | | | | | | | | | | | | | | | | | |
| | | | | | |
| Less dividends and distributions: | | | | | | | | | | | | | | | | | | | | | | | | | | | | | | |
| | | | | | |
From net investment income | | | | — | | | | | (0.14 | ) | | | | (0.15 | ) | | | | (0.14 | ) | | | | (0.39 | ) | | | | (0.09 | ) |
| | | | | | |
From net realized gain on investments | | | | — | | | | | — | | | | | — | | | | | — | | | | | — | | | | | (0.90 | ) |
| | | | | | | | | | | | | | | | | | | | | | | | | | | | | | |
| | | | | | |
Total dividends and distributions | | | | — | | | | | (0.14 | ) | | | | (0.15 | ) | | | | (0.14 | ) | | | | (0.39 | ) | | | | (0.99 | ) |
| | | | | | | | | | | | | | | | | | | | | | | | | | | | | | |
| | | | | | |
Net asset value at end of period | | | $ | 8.72 | | | | $ | 8.20 | | | | $ | 8.54 | | | | $ | 8.40 | | | | $ | 8.11 | | | | $ | 8.71 | |
| | | | | | | | | | | | | | | | | | | | | | | | | | | | | | |
| | | | | | |
Total investment return (b) | | | | 6.34 | %(c) | | | | (2.38 | %)(c) | | | | 3.45 | % | | | | 5.28 | % | | | | (2.51 | %) | | | | 2.50 | % |
| | | | | | |
| Ratios (to average net assets)/Supplemental Data: | | | | | | | | | | | | | | | | | | | | | | | | | | | | | | |
| | | | | | |
Net investment income (loss) | | | | 2.68 | %†† | | | | 2.78 | % | | | | 2.71 | % | | | | 2.05 | %(d) | | | | 1.26 | % | | | | 2.74 | % |
| | | | | | |
Net expenses (e) | | | | 1.77 | %†† | | | | 1.43 | % | | | | 1.03 | % | | | | 0.91 | %(f) | | | | 0.72 | % | | | | 0.64 | % |
| | | | | | |
Expenses (before waiver/reimbursement) (e) | | | | 1.80 | %†† | | | | — | | | | | — | | | | | — | | | | | — | | | | | — | |
| | | | | | |
Interest expense and fees | | | | 1.18 | %†† | | | | 0.81 | % | | | | 0.42 | % | | | | 0.32 | % | | | | 0.15 | % | | | | 0.08 | % |
| | | | | | |
Portfolio turnover rate (g) | | | | 89 | % | | | | 157 | % | | | | 121 | % | | | | 143 | % | | | | 84 | % | | | | 85 | % |
| | | | | | |
Net assets at end of period (in 000’s) | | | $ | 45,181 | | | | $ | 44,523 | | | | $ | 45,563 | | | | $ | 36,060 | | | | $ | 68,794 | | | | $ | 9,479 | |
| (a) | Per share data based on average shares outstanding during the period. |
| (b) | Total return does not reflect any deduction of sales charges, mortality and expense charges, contract charges or administrative charges. For periods of less than one year, total return is not annualized. |
| (c) | Total investment return may reflect adjustments to conform to generally accepted accounting principles. |
| (d) | Without the custody fee reimbursement, net investment income (loss) would have been 2.04%. |
| (e) | In addition to the fees and expenses which the Portfolio bears directly, it also indirectly bears apro-rata share of the fees and expenses of the underlying funds in which it invests. Such indirect expenses are not included in the above expense ratios. |
| (f) | Without the custody fee reimbursement, net expenses would have been 0.92%. |
| (g) | The portfolio turnover rates not including mortgage dollar rolls were 21%, 48%, 96%, 91%, 59% and 49% for the six months ended June 30, 2019 and for the years ended December 31, 2018, 2017, 2016, 2015 and 2014, respectively. |
| | | | |
| 30 | | MainStay VP PIMCO Real Return Portfolio | | The notes to the financial statements are an integral part of,
and should be read in conjunction with, the financial statements. |
Financial Highlightsselected per share data and ratios
| | | | | | | | | | | | | | | | | | | | | | | | |
| | |
| | | Six months
ended
June 30, | | | Year ended December 31, | |
| | | | | | |
| Service Class | | 2019* | | | 2018 | | | 2017 | | | 2016 | | | 2015 | | | 2014 | |
| | | | | | |
Net asset value at beginning of period | | $ | 8.19 | | | $ | 8.53 | | | $ | 8.39 | | | $ | 8.10 | | | $ | 8.70 | | | $ | 9.42 | |
| | | | | | | | | | | | | | | | | | | | | | | | |
| | | | | | |
Net investment income (loss) (a) | | | 0.11 | | | | 0.21 | | | | 0.21 | | | | 0.18 | | | | 0.05 | | | | 0.24 | |
| | | | | | |
Net realized and unrealized gain (loss) on investments | | | 0.39 | | | | (0.54 | ) | | | 0.15 | | | | 0.19 | | | | (0.46 | ) | | | (0.18 | ) |
| | | | | | |
Net realized and unrealized gain (loss) on foreign currency transactions | | | 0.01 | | | | 0.10 | | | | (0.09 | ) | | | 0.04 | | | | 0.17 | | | | 0.18 | |
| | | | | | | | | | | | | | | | | | | | | | | | |
| | | | | | |
Total from investment operations | | | 0.51 | | | | (0.23 | ) | | | 0.27 | | | | 0.41 | | | | (0.24 | ) | | | 0.24 | |
| | | | | | | | | | | | | | | | | | | | | | | | |
| | | | | | |
| Less dividends and distributions: | | | | | | | | | | | | | | | | | | | | | | | | |
| | | | | | |
From net investment income | | | — | | | | (0.11 | ) | | | (0.13 | ) | | | (0.12 | ) | | | (0.36 | ) | | | (0.06 | ) |
| | | | | | |
From net realized gain on investments | | | — | | | | — | | | | — | | | | — | | | | — | | | | (0.90 | ) |
| | | | | | | | | | | | | | | | | | | | | | | | |
| | | | | | |
Total dividends and distributions | | | — | | | | (0.11 | ) | | | (0.13 | ) | | | (0.12 | ) | | | (0.36 | ) | | | (0.96 | ) |
| | | | | | | | | | | | | | | | | | | | | | | | |
| | | | | | |
Net asset value at end of period | | $ | 8.70 | | | $ | 8.19 | | | $ | 8.53 | | | $ | 8.39 | | | $ | 8.10 | | | $ | 8.70 | |
| | | | | | | | | | | | | | | | | | | | | | | | |
| | | | | | |
Total investment return (b) | | | 6.23 | %(c) | | | (2.63 | %)(c) | | | 3.20 | % | | | 5.03 | % | | | (2.76 | %) | | | 2.26 | % |
| | | | | | |
| Ratios (to average net assets)/Supplemental Data: | | | | | | | | | | | | | | | | | | | | | | | | |
| | | | | | |
Net investment income (loss) | | | 2.54 | %†† | | | 2.53 | % | | | 2.46 | % | | | 2.15 | %(d) | | | 0.56 | % | | | 2.52 | % |
| | | | | | |
Net expenses (e) | | | 2.02 | %†† | | | 1.68 | % | | | 1.28 | % | | | 1.16 | %(f) | | | 0.97 | % | | | 0.87 | % |
| | | | | | |
Expenses (before waiver/reimbursement) (e) | | | 2.05 | %†† | | | — | | | | — | | | | — | | | | — | | | | — | |
| | | | | | |
Interest expense and fees | | | 1.18 | %†† | | | 0.81 | % | | | 0.42 | % | | | 0.32 | % | | | 0.15 | % | | | 0.08 | % |
| | | | | | |
Portfolio turnover rate (g) | | | 89 | % | | | 157 | % | | | 121 | % | | | 143 | % | | | 84 | % | | | 85 | % |
| | | | | | |
Net assets at end of period (in 000’s) | | $ | 319,420 | | | $ | 282,052 | | | $ | 287,520 | | | $ | 282,006 | | | $ | 283,273 | | | $ | 331,595 | |
| (a) | Per share data based on average shares outstanding during the period. |
| (b) | Total return does not reflect any deduction of sales charges, mortality and expense charges, contract charges or administrative charges. For periods of less than one year, total return is not annualized. |
| (c) | Total investment return may reflect adjustments to conform to generally accepted accounting principles. |
| (d) | Without the custody fee reimbursement, net investment income (loss) would have been 2.14%. |
| (e) | In addition to the fees and expenses which the Portfolio bears directly, it also indirectly bears apro-rata share of the fees and expenses of the underlying funds in which it invests. Such indirect expenses are not included in the above expense ratios. |
| (f) | Without the custody fee reimbursement, net expenses would have been 1.17%. |
| (g) | The portfolio turnover rates not including mortgage dollar rolls were 21%, 48%, 96%, 91%, 59% and 49% for the six months ended June 30, 2019 and for the years ended December 31, 2018, 2017, 2016, 2015 and 2014, respectively. |
| | | | | | |
The notes to the financial statements are an integral part of,
and should be read in conjunction with, the financial statements. | | | | | 31 | |
Notes to Financial Statements(Unaudited)
Note 1–Organization and Business
MainStay VP Funds Trust (the “Fund”) was organized as a Delaware statutory trust on February 1, 2011. The Fund is registered under the Investment Company Act of 1940, as amended (the “1940 Act”), as anopen-end management investment company. The Fund is comprised ofthirty-one separate series (collectively referred to as the “Portfolios”). These financial statements and notes relate to the MainStay VP PIMCO Real Return Portfolio (the “Portfolio”), a“non-diversified” portfolio, as that term is defined in the 1940 Act, as interpreted or modified by regulatory authorities having jurisdiction, from time to time. Since the Portfolio has historically operated as a “diversified” portfolio, it will not operate as“non-diversified” without first obtaining shareholder approval.
Shares of the Portfolio are currently offered to certain separate accounts to fund variable annuity policies and variable universal life insurance policies issued by New York Life Insurance and Annuity Corporation (“NYLIAC”), a wholly-owned subsidiary of New York Life Insurance Company (“New York Life”) and may also be offered to fund variable annuity policies and variable universal life insurance policies issued by other insurance companies. NYLIAC allocates shares of the Portfolios, among others, certain NYLIAC separate accounts. Shares of the Portfolio are also offered to the MainStay VP Conservative Allocation Portfolio, MainStay VP Moderate Allocation Portfolio, MainStay VP Moderate Growth Allocation Portfolio and MainStay VP Growth Allocation Portfolio, which operate as“funds-of-funds.”
The Portfolio currently offers two classes of shares. Initial Class and Service Class shares commenced operations on February 17, 2012. Shares of the Portfolio are offered and are redeemed at a price equal to their respective net asset value (“NAV”) per share. No sales or redemption charge is applicable to the purchase or redemption of the Portfolio’s shares. Under the terms of the Fund’s multiple class plan adopted pursuant to Rule18f-3 under the 1940 Act, the classes differ in that, among other things, Service Class shares of the Portfolio pay a combined distribution and service fee of 0.25% of average daily net assets attributable to Service Class shares of the Portfolio to the Distributor (as defined in Note 3(B)) pursuant to a plan adopted in accordance with Rule12b-1 under the 1940 Act. Contract owners of variable annuity contracts are permitted to invest only in the Service Class shares.
The Portfolio’s investment objective is to seek maximum real return, consistent with preservation of real capital and prudent investment management.
Note 2–Significant Accounting Policies
The Portfolio is an investment company and accordingly follows the investment company accounting and reporting guidance of the Financial Accounting Standards Board (“FASB”) Accounting Standard CodificationTopic 946 Financial Services—Investment Companies. The Portfolio prepares its financial statements in accordance with generally accepted accounting principles (“GAAP”) in the United States of America and follows the significant accounting policies described below.
(A) Securities Valuation. Investments are usually valued as of the close of regular trading on the New York Stock Exchange (the
“Exchange”) (usually 4:00 p.m. Eastern time) on each day the Portfolio is open for business (“valuation date”).
The Board of Trustees of the Fund (the “Board”) adopted procedures establishing methodologies for the valuation of the Portfolio’s securities and other assets and delegated the responsibility for valuation determinations under those procedures to the Valuation Committee of the Fund (the “Valuation Committee”). The Board authorized the Valuation Committee to appoint a Valuation Subcommittee (the “Subcommittee”) to deal in the first instance with establishing the prices of securities for which market quotations are not readily available or the prices of which are not otherwise readily determinable under these procedures. The Subcommittee meets (in person, via electronic mail or via teleconference) on anas-needed basis. Subsequently, the Valuation Committee meets to ensure that actions taken by the Subcommittee were appropriate. The procedures state that, subject to the oversight of the Board and unless otherwise noted, the responsibility for theday-to-day valuation of portfolio assets (including fair value measurements for the Portfolio’s assets and liabilities) rests with New York Life Investment Management LLC (“New York Life Investments” or the “Manager”), aided to whatever extent necessary by the Subadvisor (as defined in Note 3(A)).
To assess the appropriateness of security valuations, the Manager, the Subadvisor or the Portfolio’s third-party service provider, who is subject to oversight by the Manager, regularly compares prior day prices, prices on comparable securities and the sale prices to the prior and current day prices and challenges prices with changes exceeding certain tolerance levels with third-party pricing services or broker sources. For those securities valued through either a standardized fair valuation methodology or a fair valuation measurement, the Subcommittee deals in the first instance with such valuation and the Valuation Committee reviews and affirms, if appropriate, the reasonableness of the valuation based on such methodologies and measurements on a regular basis after considering information that is reasonably available and deemed relevant by the Valuation Committee. Any action taken by the Subcommittee with respect to the valuation of a portfolio security or other asset is submitted for review and ratification (if appropriate) to the Valuation Committee and the Board at the next regularly scheduled meeting.
“Fair value” is defined as the price the Portfolio would reasonably expect to receive upon selling an asset or liability in an orderly transaction to an independent buyer in the principal or most advantageous market for the asset or liability. Fair value measurements are determined within a framework that establishes a three-tier hierarchy which maximizes the use of observable market data and minimizes the use of unobservable inputs to establish a classification of fair value measurements for disclosure purposes. “Inputs” refer broadly to the assumptions that market participants would use in pricing the asset or liability, including assumptions about risk, such as the risk inherent in a particular valuation technique used to measure fair value using a pricing model and/or the risk inherent in the inputs for the valuation technique. Inputs may be observable or unobservable. Observable inputs reflect the assumptions market participants would use in pricing the asset or liability based on market data obtained from sources independent of the Portfolio. Unobservable inputs reflect the Portfolio’s own assumptions about the assumptions market participants would use in pricing the asset or liability based on the information available. The inputs or methodology
| | |
| 32 | | MainStay VP PIMCO Real Return Portfolio |
used for valuing assets or liabilities may not be an indication of the risks associated with investing in those assets or liabilities. The three-tier hierarchy of inputs is summarized below.
| • | | Level 1—quoted prices in active markets for an identical asset or liability |
| • | | Level 2—other significant observable inputs (including quoted prices for a similar asset or liability in active markets, interest rates and yield curves, prepayment speeds, credit risk, etc.) |
| • | | Level 3—significant unobservable inputs (including the Portfolio’s own assumptions about the assumptions that market participants would use in measuring fair value of an asset or liability) |
The level of an asset or liability within the fair value hierarchy is based on the lowest level of an input, both individually and in the aggregate, that is significant to the fair value measurement. As of June 30, 2019, the aggregate value by input level of the Portfolio’s assets and liabilities is included at the end of the Portfolio’s Portfolio of Investments.
The Portfolio may use third-party vendor evaluations, whose prices may be derived from one or more of the following standard inputs, among others:
| | |
• Benchmark yields | | • Reported trades |
• Broker/dealer quotes | | • Issuer spreads |
• Two-sided markets | | • Benchmark securities |
• Bids/offers | | • Reference data (corporate actions or material event notices) |
• Industry and economic events | | • Comparable bonds |
• Monthly payment information | | |
An asset or liability for which market values cannot be measured using the methodologies described above is valued by methods deemed reasonable in good faith by the Valuation Committee, following the procedures established by theBoard, to represent fair value. Under these procedures, the Portfolio generally uses a market-based approach which may use related or comparable assets or liabilities, recent transactions, market multiples, book values and other relevant information. The Portfolio may also use an income-based valuation approach in which the anticipated future cash flows of the asset or liability are discounted to calculate fair value. Discounts may also be applied due to the nature and/or duration of any restrictions on the disposition of the asset or liability. Fair value represents a good faith approximation of the value of a security. Fair value determinations involve the consideration of a number of subjective factors, an analysis of applicable facts and circumstances and the exercise of judgment. As a result, it is possible that the fair value for a security determined in good faith in accordance with the Portfolio’s valuation procedures may differ from valuations for the same security determined by other funds using their own valuation procedures. Although the Portfolio’s valuation procedures are designed to value a security at the price the Portfolio may reasonably expect to receive upon the security’s sale in an orderly transaction, there can be no assurance that any fair value determination thereunder would, in fact, approximate the amount that the Portfolio would actually realize upon the sale of the security or the price at which the security would trade if a reliable market price were readily available. During thesix-month period ended June 30, 2019, there were no material changes to the fair value methodologies.
Securities which may be valued in this manner include, but are not limited to: (i) a security for which trading has been halted or suspended; (ii) a debt security that has recently gone into default and for which there is not a current market quotation; (iii) a security of an issuer that has entered into a restructuring; (iv) a security that has been delisted from a national exchange; (v) a security for which the market price is not readily available from a third-party pricing source or, if so provided, does not, in the opinion of the Manager or the Subadvisor, reflect the security’s market value; (vi) a security subject to trading collars for which no or limited trading takes place; and (vii) a security whose principal market has been temporarily closed at a time when, under normal conditions, it would be open. Securities valued in this manner are generally categorized as Level 3 in the hierarchy. As of June 30, 2019, there were no securities held by the Portfolio that were fair valued in such a manner.
Certain securities held by the Portfolio may principally trade in foreign markets. Events may occur between the time the foreign markets close and the time at which the Portfolio’s NAVs are calculated. These events may include, but are not limited to, situations relating to a single issuer in a market sector, significant fluctuations in U.S. or foreign markets, natural disasters, armed conflicts, governmental actions or other developments not tied directly to the securities markets. Should the Manager or the Subadvisor conclude that such events may have affected the accuracy of the last price of such securities reported on the local foreign market, the Subcommittee may, pursuant to procedures adopted by the Board, adjust the value of the local price to reflect the estimated impact on the price of such securities as a result of such events. In this instance, securities are generally categorized as Level 3 in the hierarchy. Additionally, certain foreign equity securities are also fair valued whenever the movement of a particular index exceeds certain thresholds. In such cases, the securities are fair valued by applying factors provided by a third-party vendor in accordance with valuation procedures adopted by the Board and are generally categorized as Level 2 in the hierarchy. As of June 30, 2019, no foreign equity securities were held by the Portfolio.
Futures contracts are valued at the last posted settlement price on the market where such futures are primarily traded. These securities are generally categorized as Level 1 in the hierarchy.
Investments in mutual funds, including money market funds, are valued at their respective NAVs as of the close of the Exchange on the valuation date. These securities are generally categorized as Level 1 in the hierarchy.
Options contracts are valued at the last posted settlement price on the market where such options are primarily traded.
Debt securities (other than convertible and municipal bonds) are valued at the evaluated bid prices (evaluated mean prices in the case of convertible and municipal bonds) supplied by a pricing agent or brokers selected by the Manager, in consultation with the Subadvisor. The evaluations are market-based measurements processed through a pricing application and represents the pricing agent’s good faith determination as to what a holder may receive in an orderly transaction under market conditions. The rules based logic utilizes valuation techniques that reflect participants’ assumptions and vary by asset class and per methodology, maximizing the use of relevant observable data
Notes to Financial Statements(Unaudited) (continued)
including quoted prices for similar assets, benchmark yield curves and market corroborated inputs. The evaluated bid or mean prices are deemed by the Manager, in consultation with the Subadvisor, to be representative of market values at the regular close of trading of the Exchange on each valuation date. Debt securities purchased on a delayed delivery basis are marked to market daily until settlement at the forward settlement date. Debt securities, including corporate bonds, U.S. government and federal agency bonds, municipal bonds, foreign bonds, convertible bonds, asset-backed securities and mortgage-backed securities are generally categorized as Level 2 in the hierarchy.
Foreign currency forward contracts are valued at their fair market values measured on the basis of the mean between the last current bid and ask prices based on dealer or exchange quotations and are generally categorized as Level 2 in the hierarchy.
Swaps are marked to market daily based upon quotations from pricing agents, brokers or market makers. These securities are generally categorized as Level 2 in the hierarchy.
Loan assignments, participations and commitments are valued at the average of bid quotations obtained from the engaged independent pricing service and are generally categorized as Level 2 in the hierarchy. Certain loan assignments, participations and commitments may be valued by utilizing significant unobservable inputs obtained from the pricing service and are generally categorized as Level 3 in the hierarchy. As of June 30, 2019, there were no securities held by the Portfolio that were fair valued in such a manner.
Temporary cash investments acquired in excess of 60 days to maturity at the time of purchase are valued using the latest bid prices or using valuations based on a matrix system (which considers such factors as security prices, yields, maturities and ratings), both as furnished by independent pricing services. Other temporary cash investments which mature in 60 days or less at the time of purchase (“Short-Term Investments”) are valued using the amortized cost method of valuation, unless the use of such method would be inappropriate. The amortized cost method involves valuing a security at its cost on the date of purchase and thereafter assuming a constant amortization to maturity of the difference between such cost and the value on maturity date. Amortized cost approximates the current fair value of a security. Securities valued using the amortized cost method are not valued using quoted prices in an active market and are generally categorized as Level 2 in the hierarchy.
The information above is not intended to reflect an exhaustive list of the methodologies that may be used to value portfolio investments. The valuation procedures permit the use of a variety of valuation methodologies in connection with valuing portfolio investments. The methodology used for a specific type of investment may vary based on the market data available or other considerations. The methodologies summarized above may not represent the specific means by which portfolio investments are valued on any particular business day.
A portfolio security or other asset may be determined to be illiquid under procedures approved by the Board. Illiquidity of a security might prevent the sale of such security at a time when the Manager or the Subadvisor might wish to sell, and these securities could have the effect of decreasing the overall level of the Portfolio’s liquidity. Further, the lack of an established secondary market may make it more difficult to value
illiquid securities, requiring the Portfolio to rely on judgments that may be somewhat subjective in measuring value, which could vary materially from the amount that the Portfolio could realize upon disposition. Difficulty in selling illiquid securities may result in a loss or may be costly to the Portfolio. Under the supervision of the Board, the Manager or the Subadvisor determine the liquidity of the Portfolio’s investments; in doing so, the Manager or the Subadvisor may consider various factors, including: (i) the frequency of trades and quotations; (ii) the number of dealers and prospective purchasers; (iii) dealer undertakings to make a market; and (iv) the nature of the security and the market in which it trades (e.g., the time needed to dispose of the security, the method of soliciting offers and the mechanics of transfer). Illiquid securities are often valued in accordance with methods deemed by the Board in good faith to be reasonable and appropriate to accurately reflect their fair value. The liquidity of the Portfolio’s investments, as shown in the Portfolio of Investments, was determined as of June 30, 2019 and can change at any time in response to, among other relevant factors, market conditions or events or developments with respect to an individual issuer or instrument.
(B) Income Taxes. The Portfolio’s policy is to comply with the requirements of the Internal Revenue Code of 1986, as amended (the “Internal Revenue Code”), applicable to regulated investment companies and to distribute all of its taxable income to the shareholders of the Portfolio within the allowable time limits. Therefore, no federal, state and local income tax provisions are required.
Management evaluates the Portfolio’s tax positions to determine if the tax positions taken meet the minimum recognition threshold in connection with accounting for uncertainties in income tax positions taken or expected to be taken for the purposes of measuring and recognizing tax liabilities in the financial statements. Recognition of tax benefits of an uncertain tax position is permitted only to the extent the position is “more likely than not” to be sustained assuming examination by taxing authorities. Management has analyzed the Portfolio’s tax positions taken on federal, state and local income tax returns for all open tax years (for up to three tax years) and has concluded that no provisions for federal, state and local income tax are required in the Portfolio’s financial statements. The Portfolio’s federal, state and local income tax and federal excise tax returns for tax years for which the applicable statutes of limitations have not expired are subject to examination by the Internal Revenue Service and state and local departments of revenue.
(C) Foreign Taxes. The Portfolio may be subject to foreign taxes on income and other transaction-based taxes imposed by certain countries in which it invests. A portion of the taxes on gains on investments or currency purchases/repatriation may be reclaimable. The Portfolio will accrue such taxes and reclaims as applicable, based upon its current interpretation of tax rules and regulations that exist in the markets in which it invests.
The Portfolio may be subject to taxation on realized capital gains, repatriation proceeds and other transaction-based taxes imposed by certain countries in which it invests. The Portfolio will accrue such taxes as applicable based upon its current interpretation of tax rules and regulations that exist in the market in which it invests. Capital gains taxes relating to positions still held are reflected as a liability on the Statement of Assets and Liabilities, as well as an adjustment to the Portfolio’s net unrealized appreciation (depreciation). Taxes related to capital gains
| | |
| 34 | | MainStay VP PIMCO Real Return Portfolio |
realized, if any, are reflected as part of net realized gain (loss) in the Statement of Operations. Changes in tax liabilities related to capital gains taxes on unrealized investment gains, if any, are reflected as part of the change in net unrealized appreciation (depreciation) on investments in the Statement of Operations. Transaction-based charges are generally assessed as a percentage of the transaction amount.
(D) Dividends and Distributions to Shareholders. Dividends and distributions are recorded on theex-dividend date. The Portfolio intends to declare and pay dividends from net investment income and distributions from net realized capital and currency gains, if any, at least annually. Unless the shareholder elects otherwise, all dividends and distributions are reinvested in the same class of shares of the Portfolio, at NAV. Dividends and distributions to shareholders are determined in accordance with federal income tax regulations and may differ from determinations using GAAP.
(E) Security Transactions and Investment Income. The Portfolio records security transactions on the trade date. Realized gains and losses on security transactions are determined using the identified cost method. Dividend income is recognized on theex-dividend date; net of any foreign tax withheld at the source, and interest income is accrued as earned using the effective interest rate method. Discounts and premiums on securities purchased for the Portfolio are accreted and amortized, respectively, on the effective interest rate method over the life of the respective securities.
Investment income and realized and unrealized gains and losses on investments of the Portfolio are allocated pro rata to the separate classes of shares based upon their relative net assets on the date the income is earned or realized and unrealized gains and losses are incurred.
The Portfolio may place a debt security onnon-accrual status and reduce related interest income by ceasing current accruals and writing off all or a portion of any interest receivables when the collection of all or a portion of such interest has become doubtful. A debt security is removed fromnon-accrual status when the issuer resumes interest payments or when collectability of interest is reasonably assured.
(F) Expenses. Expenses of the Fund are allocated to the individual Portfolios in proportion to the net assets of the respective Portfolios when the expenses are incurred, except where direct allocations of expenses can be made. Expenses (other than fees incurred under the distribution and service plans, further discussed in Note 3(B), which are charged directly to the Service Class shares) are allocated to separate classes of shares pro rata based upon their relative net assets on the date the expenses are incurred. The expenses borne by the Portfolio, including those of related parties to the Portfolio, are shown in the Statement of Operations.
Additionally, the Portfolio may invest in mutual funds, which are subject to management fees and other fees that may cause the costs of investing in mutual funds to be greater than the costs of owning the underlying securities directly. These indirect expenses of mutual funds are not included in the amounts shown as expenses in the Portfolio’s Statement of Operations or in the expense ratios included in the Financial Highlights.
(G) Use of Estimates. In preparing financial statements in conformity with GAAP, management makes estimates and assumptions that affect the reported amounts and disclosures in the financial statements. Actual results could differ from those estimates.
(H) Repurchase Agreements. The Portfolio may enter into repurchase agreements (i.e., buy a security from another party with the agreement that it be sold back in the future) to earn income. The Portfolio may enter into repurchase agreements only with counterparties, usually financial institutions, that are deemed by the Manager or the Subadvisor to be creditworthy, pursuant to guidelines established by the Board. During the term of any repurchase agreement, the Manager or the Subadvisor will continue to monitor the creditworthiness of the counterparty. Under the 1940 Act, repurchase agreements are considered to be collateralized loans by the Portfolio to the counterparty secured by the securities transferred to the Portfolio.
Repurchase agreements are subject to counterparty risk, meaning the Portfolio could lose money by the counterparty’s failure to perform under the terms of the agreement. The Portfolio mitigates this risk by ensuring the repurchase agreement is collateralized by cash, U.S. government securities, fixed income securities and/or other securities. The collateral is held by the Portfolio’s custodian and valued daily on a mark to market basis to determine if the value, including accrued interest, exceeds the repurchase price. In the event of the counterparty’s default on the obligation to repurchase, the Portfolio has the right to liquidate the collateral and apply the proceeds in satisfaction of the obligation. Under certain circumstances, such as in the event of default or bankruptcy by the counterparty, realization and/or retention of the collateral may be limited or subject to delay, to legal proceedings and possible realized loss to the Portfolio. As of June 30, 2019, repurchase agreements are shown in the Portfolio of Investments.
(I) Futures Contracts. A futures contract is an agreement to purchase or sell a specified quantity of an underlying instrument at a specified future date and price, or to make or receive a cash payment based on the value of a financial instrument (e.g., foreign currency, interest rate, security or securities index). The Portfolio is subject to risks such as market price risk and/or interest rate risk in the normal course of investing in these transactions. Upon entering into a futures contract, the Portfolio is required to pledge to the broker or futures commission merchant an amount of cash and/or U.S. government securities equal to a certain percentage of the collateral amount, known as the “initial margin.” During the period the futures contract is open, changes in the value of the contract are recognized as unrealized appreciation or depreciation by marking to market such contract on a daily basis to reflect the market value of the contract at the end of each day’s trading. The Portfolio agrees to receive from or pay to the broker or futures commission merchant an amount of cash equal to the daily fluctuation in the value of the contract. Such receipts or payments are known as “variation margin.” When the futures contract is closed, the Portfolio records a realized gain or loss equal to the difference between the proceeds from (or cost of) the closing transaction and the Portfolio’s basis in the contract.
The use of futures contracts involves, to varying degrees, elements of market risk in excess of the amount recognized in the Statement of Assets and Liabilities. The contract or notional amounts and variation margin reflect the extent of the Portfolio’s involvement in open futures
Notes to Financial Statements(Unaudited) (continued)
positions. There are several risks associated with the use of futures contracts as hedging techniques. There can be no assurance that a liquid market will exist at the time when the Portfolio seeks to close out a futures contract. If no liquid market exists, the Portfolio would remain obligated to meet margin requirements until the position is closed. Futures may involve a small initial investment relative to the risk assumed, which could result in losses greater than if they had not been used. Futures may be more volatile than direct investments in the instrument underlying the futures and may not correlate to the underlying instrument, causing a given hedge not to achieve its objectives. The Portfolio’s activities in futures contracts have minimal counterparty risk as they are conducted through regulated exchanges that guarantee the futures against default by the counterparty. In the event of a bankruptcy or insolvency of a futures commission merchant that holds margin on behalf of the Portfolio, the Portfolio may not be entitled to the return of the entire margin owed to the Portfolio, potentially resulting in a loss. The Portfolio’s investment in futures contracts and other derivatives may increase the volatility of the Portfolio’s NAVs and may result in a loss to the Portfolio. As of June 30, 2019, open futures contracts are shown in the Portfolio of Investments.
(J) Foreign Currency Forward Contracts. The Portfolio may enter into foreign currency forward contracts, which are agreements to buy or sell foreign currencies on a specified future date at a specified rate. The Portfolio is subject to foreign currency exchange rate risk in the normal course of investing in these transactions. During the period the forward contract is open, changes in the value of the contract are recognized as unrealized appreciation or depreciation by marking to market such contract on a daily basis to reflect the market value of the contract at the end of each day’s trading. Cash movement occurs on settlement date. When the forward contract is closed, the Portfolio records a realized gain or loss equal to the difference between the proceeds from (or cost of) the closing transaction and the Portfolio’s basis in the contract. The Portfolio may purchase and sell foreign currency forward contracts for purposes of seeking to enhance portfolio returns and manage portfolio risk more efficiently. Foreign currency forward contracts may also be used to gain exposure to a particular currency or to hedge against the risk of loss due to changing currency exchange rates. Foreign currency forward contracts to purchase or sell a foreign currency may also be used in anticipation of future purchases or sales of securities denominated in foreign currency, even if the specific investments have not yet been selected.
The use of foreign currency forward contracts involves, to varying degrees, elements of risk in excess of the amount recognized in the Statement of Assets and Liabilities, including counterparty risk, market risk and illiquidity risk. Counterparty risk is heightened for these instruments because foreign currency forward contracts are not exchange-traded and therefore no clearinghouse or exchange stands ready to meet the obligations under such contracts. Thus, the Portfolio faces the risk that its counterparties under such contracts may not perform their obligations. Market risk is the risk that the value of a foreign currency forward contract will depreciate due to unfavorable changes in exchange rates. Illiquidity risk arises because the secondary market for foreign currency forward contracts may have less liquidity relative to markets for other securities and financial instruments. Risks also arise from the possible movements in the foreign exchange rates underlying these instruments. While the Portfolio may enter into forward contracts
to reduce currency exchange risks, changes in currency exchange rates may result in poorer overall performance for the Portfolio than if it had not engaged in such transactions. Exchange rate movements can be large, depending on the currency, and can last for extended periods of time, affecting the value of the Portfolio’s assets. Moreover, there may be an imperfect correlation between the Portfolio’s holdings of securities denominated in a particular currency and forward contracts entered into by the Portfolio. Such imperfect correlation may prevent the Portfolio from achieving the intended hedge or expose the Portfolio to the risk of currency exchange loss. The unrealized appreciation (depreciation) on forward contracts also reflects the Portfolio’s exposure at the valuation date to credit loss in the event of a counterparty’s failure to perform its obligations. As of June 30, 2019, all open forward currency contracts are shown in the Portfolio of Investments.
(K) Foreign Currency Transactions. The Portfolio’s books and records are maintained in U.S. dollars. Prices of securities denominated in foreign currency amounts are translated into U.S. dollars at the mean between the buying and selling rates last quoted by any major U.S. bank at the following dates:
| (i) | market value of investment securities, other assets and liabilities—at the valuation date; and |
| (ii) | purchases and sales of investment securities, income and expenses—at the date of such transactions. |
The assets and liabilities that are denominated in foreign currency amounts are presented at the exchange rates and market values at the close of the period. The realized and unrealized changes in net assets arising from fluctuations in exchange rates and market prices of securities are not separately presented.
Net realized gain (loss) on foreign currency transactions represents net gains and losses on foreign currency forward contracts, net currency gains or losses realized as a result of differences between the amounts of securities sale proceeds or purchase cost, dividends, interest and withholding taxes as recorded on the Portfolio’s books, and the U.S. dollar equivalent amount actually received or paid. Net currency gains or losses from valuing such foreign currency denominated assets and liabilities, other than investments at valuation date exchange rates, are reflected in unrealized foreign exchange gains or losses.
(L) Swap Contracts. The Portfolio may enter into credit default, interest rate, equity, index and currency exchange rate swap contracts (“swaps”). In a typical swap transaction, two parties agree to exchange the future returns (or differentials in rates of future returns) earned or realized at periodic intervals on a particular investment or instrument based on a notional principal amount. Generally, the Portfolio will enter into a swap on a net basis, which means that the two payment streams under the swap are netted, with the Portfolio receiving or paying (as the case may be) only the net amount of the two payment streams. Therefore, the Portfolio’s current obligation under a swap generally will be equal to the net amount to be paid or received under the swap, based on the relative value of notional positions attributable to each counterparty to the swap. The payments may be adjusted for transaction costs, interest payments, the amount of interest paid on the investment or instrument or other factors. Collateral, in the form of cash or securities, may be required to be held in segregated accounts with the custodian bank or broker in accordance with the terms of the swap. Swap
| | |
| 36 | | MainStay VP PIMCO Real Return Portfolio |
agreements are privately negotiated in the over the counter (“OTC”) market and may be executed in a multilateral or other trade facilities platform, such as a registered commodities exchange (“centrally cleared swaps”).
Certain standardized swaps, including certain credit default and interest rate swaps, are subject to mandatory clearing and exchange-trading, and more types of standardized swaps are expected to be subject to mandatory clearing and exchange-trading in the future. The counterparty risk for exchange-traded and cleared derivatives is expected to be generally lower than for uncleared derivatives, but cleared contracts are not risk-free. In a cleared derivative transaction, the Portfolio typically enters into the transaction with a financial institution counterparty, and performance of the transaction is effectively guaranteed by a central clearinghouse, thereby reducing or eliminating the Portfolio’s exposure to the credit risk of its original counterparty. The Portfolio will be required to post specified levels of margin with the clearinghouse or at the instruction of the clearinghouse; the margin required by a clearinghouse may be greater than the margin the Portfolio would be required to post in an uncleared transaction. As of June 30, 2019, all swap positions outstanding are shown in the Portfolio of Investments.
Swaps are marked to market daily based upon quotations from pricing agents, brokers, or market makers and the change in value, if any, is recorded as unrealized appreciation or depreciation. Any payments made or received upon entering into a swap would be amortized or accreted over the life of the swap and recorded as a realized gain or loss. Early termination of a swap is recorded as a realized gain or loss. Daily changes in valuation of centrally cleared swaps, if any, are recorded as a receivable or payable for the change in value as appropriate (“variation margin”) on the Statement of Assets and Liabilities.
The Portfolio bears the risk of loss of the amount expected to be received under a swap in the event of the default or bankruptcy of the swap counterparty. The Portfolio may be able to eliminate its exposure under a swap either by assignment or other disposition, or by entering into an offsetting swap with the same party or a similar creditworthy party. Swaps are not actively traded on financial markets. Entering into swaps involves elements of credit, market, and documentation risk in excess of the amounts recognized on the Statement of Assets and Liabilities. Such risks involve the possibilities that there will be no liquid market for these swaps, that the counterparty to the swaps may default on its obligation to perform or disagree as to the meaning of the contractual terms in the swaps and that there may be unfavorable changes in interest rates, the price of the index or the security underlying these transactions.
Interest Rate Swaps: An interest rate swap is an agreement between two parties where one stream of future interest payments is exchanged for another based on a specified principal amount. Interest rate swaps often exchange a fixed payment for a floating payment that is linked to an interest rate (most often the London Interbank Offered Rate (“LIBOR”)). The Portfolio will typically use interest rate swaps to limit, or manage, its exposure to fluctuations in interest rates, or to obtain a marginally lower interest rate than it would have been able to get without the swap.
Credit Default Swaps: The Portfolio may enter into credit default swaps to simulate long and short bond positions or to take an active long or short position with respect to the likelihood of a default or credit event by the issuer of the underlying reference obligation. The types of reference obligations underlying the swaps that may be entered into by the Portfolio include debt obligations of a single issuer of corporate or sovereign debt, a basket of obligations of different issuers or a credit index. A credit index is an equally-weighted credit default swap index that is designed to track a representative segment of the credit default swap market (e.g., investment grade, high volatility, below investment grade or emerging markets) and provides an investor with exposure to specific “baskets” of issuers of certain debt instruments. Index credit default swaps have standardized terms including a fixed spread and standard maturity dates. The composition of the obligations within a particular index changes periodically. Credit default swaps involve one party, the protection buyer, making a stream of payments to another party, the protection seller, in exchange for the right to receive a contingent payment if there is a credit event related to the underlying reference obligation. In the event that the reference obligation matures prior to the termination date of the contract, a similar security will be substituted for the duration of the contract term. Credit events are defined under individual swap agreements and generally include bankruptcy, failure to pay, restructuring, repudiation/moratorium, obligation acceleration and obligation default. Selling protection effectively adds leverage to a portfolio up to the notional amount of the swap agreement. Potential liabilities under these contracts may be reduced by: the auction rates of the underlying reference obligations; upfront payments received at the inception of a swap; and net amounts received from credit default swaps purchased with the identical reference obligation.
(M) Options Contracts. The Portfolio may write call and put options on securities and financial derivative instruments it owns or in which it may invest. Writing put options tends to increase the Portfolio’s exposure to the underlying instrument. Writing call options tends to decrease the Portfolio’s exposure to the underlying instrument. When the Portfolio writes a call or put, an amount equal to the premium received is recorded as a liability and subsequently marked to market to reflect the current value of the option written. These liabilities are reflected as written options outstanding on the Statement of Assets and Liabilities. Premiums received from writing options which expire are treated as realized gains. Premiums received from writing options which are exercised or closed are added to the proceeds or offset against amounts paid on the underlying futures, swaps, security or currency transaction to determine the realized gain or loss. Certain options may be written with premiums to be determined on a future date. The Portfolio, as a writer of an option, has no control over whether the underlying instrument may be sold (call) or purchased (put) and as a result bears the market risk of an unfavorable change in the price of the instrument underlying the written option. There is the risk the Portfolio may not be able to enter into a closing transaction because of an illiquid market. Writing call options involves risk of loss in excess of the related amounts reflected in the Statement of Assets and Liabilities.
The Portfolio may also purchase put and call options. Purchasing call options tends to increase the Portfolio’s exposure to the underlying instrument. Alternatively, purchasing put options tends to decrease the Portfolio’s exposure to the underlying instrument. The Portfolio pays a premium which is included on the Portfolio’s Statement of Assets and
Notes to Financial Statements(Unaudited) (continued)
Liabilities as an investment and subsequently marked to market to reflect the current value of the option. Premiums paid for purchasing options which expire are treated as realized losses. Certain options may be purchased with premiums to be determined on a future date. The premiums for these options are based upon implied volatility parameters at specified terms. The risk associated with purchasing put and call options is limited to the premium paid. Premiums paid for purchasing options which are exercised or closed are added to the amounts paid or offset against the proceeds on the underlying investment transaction to determine the realized gain or loss when the underlying transaction is sold.
The Portfolio may purchase or write foreign currency options. Purchasing a foreign currency option gives the Portfolio the right, but not the obligation, to buy or sell a specified amount of the currency at a specified rate of exchange that may be exercised on or before the option’s expiration date. Writing a foreign currency option obligates the Portfolio to buy or sell a specified amount of foreign currency at a specified rate of exchange, and such option may be exercised on or before the option’s expiration date in exchange for an option premium. These options may be used as a short or long hedge against possible variations in foreign exchange rates or to gain exposure to foreign currencies. The risks associated with writing a foreign currency put option include the risk that the Portfolio may incur a loss if the value of the referenced foreign currency decreases and the option is exercised. The risks associated with writing a foreign currency call option include the risk that if the value of the referenced foreign currency increases, and if the option is exercised, the Portfolio must either acquire the referenced foreign currency at the then higher price for delivery or, if the Portfolio already owns the referenced foreign currency, forego the opportunity for profit with respect to such foreign currency.
The Portfolio may purchase or write option on exchanged-traded futures contracts (“Futures Option”) to hedge an existing position or futures investment, for speculative purposes or to manage exposure to market movements. A Futures Option is an option contract in which the underlying instrument is a single futures contract.
The Portfolio may purchase or write inflation-capped options to enhance returns or for hedging opportunities. An inflation-capped option pays out if inflation exceeds a certain level over a specified period of time. The purpose of purchasing inflation-capped options is to protect the Portfolio from inflation erosion above a certain rate on a given notional exposure. When the Portfolio writes an inflation-capped option, an amount equal to the premium received is recorded as a liability and subsequently marked to market to reflect the current value of the option written. As of June 30, 2019, all open options are shown in the Portfolio of Investments.
(N) Interest Rate and Credit Default Swaptions. The Portfolio may enter into interest rate or credit default swaption agreements. A swaption is an option to enter into apre-defined swap agreement at a specified date in the future. The writer of the swaption becomes the counterparty to the swap if the buyer exercises. The interest rate swaption agreement will specify whether the buyer of the swaption will be a fixed-rate receiver or a fixed rate buyer. The credit default swaption agreement will specify whether the buyer of the swaption will be buying protection or selling protection. As of June 30, 2019, swaptions are shown in the Portfolio of Investments.
(O) Loan Assignments, Participations and Commitments. The Portfolio may invest in loan assignments and participations (“loans”). Commitments are agreements to make money available to a borrower in a specified amount, at a specified rate and within a specified time. The Portfolio records an investment when the borrower withdraws money on a commitment or when a funded loan is purchased (trade date) and records interest as earned. These loans pay interest at rates that are periodically reset by reference to a base lending rate plus a spread. These base lending rates are generally the prime rate offered by a designated U.S. bank or the LIBOR.
The loans in which the Portfolio may invest are generally readily marketable, but may be subject to some restrictions on resale. For example, the Portfolio may be contractually obligated to receive approval from the agent bank and/or borrower prior to the sale of these investments. If the Portfolio purchases an assignment from a lender, the Portfolio will generally have direct contractual rights against the borrower in favor of the lender. If the Portfolio purchases a participation interest either from a lender or a participant, the Portfolio typically will have established a direct contractual relationship with the seller of the participation interest, but not with the borrower. Consequently, the Portfolio is subject to the credit risk of the lender or participant who sold the participation interest to the Portfolio, in addition to the usual credit risk of the borrower. In the event that the borrower, selling participant or intermediate participants become insolvent or enter into bankruptcy, the Portfolio may incur certain costs and delays in realizing payment, or may suffer a loss of principal and/or interest.
Unfunded commitments represent the remaining obligation of the Portfolio to the borrower. At any point in time, up to the maturity date of the issue, the borrower may demand the unfunded portion. Unfunded amounts, if any, are marked to market and any unrealized gains or losses are recorded in the Statement of Assets and Liabilities. As of June 30, 2019, the Portfolio did not hold any unfunded commitments.
(P) Dollar Rolls. The Portfolio may enter into dollar roll transactions in which it sells mortgage-backed securities (“MBS”) from its portfolios to a counterparty from whom the Portfolio simultaneously agrees to buy a similar security on a delayed delivery basis. The Portfolio generally transfers MBS where the MBS are “to be announced,” therefore, the Portfolio accounts for these transactions as purchases and sales.
When accounted for as purchase and sales, the securities sold in connection with the dollar rolls are removed from a portfolio and a realized gain or loss is recognized. The securities the Portfolio has agreed to acquire are included at market value in the Portfolio of Investments and liabilities for such purchase commitments are included as payables for investments purchased. During the roll period, the Portfolio foregoes principal and interest paid on the securities. The Portfolio is compensated by the difference between the current sales price and the forward price for the future as well as by the earnings on the cash proceeds of the initial sale. Dollar rolls may be renewed without physical delivery of the securities subject to the contract. The Portfolio maintains liquid assets from its portfolio having a value not less than the repurchase price, including accrued interest. Dollar roll transactions involve certain risks, including the risk that the securities returned to the Portfolio at the end of the roll period, while substantially similar, could be inferior to what was initially sold to the counterparty.
| | |
| 38 | | MainStay VP PIMCO Real Return Portfolio |
The Portfolio accounts for a dollar roll transaction as a purchase and sale whereby the difference in the sales price and purchase price of the security sold is recorded as a realized gain (loss).
(Q) Reverse Repurchase Agreements. The Portfolio may enter into reverse repurchase agreements with banks or broker/dealers, which involve the sale of a security by a Portfolio and its agreement to repurchase the instrument at a specified time and price. Under a reverse repurchase agreement, the Portfolio continues to receive any principal and interest payments on the underlying security during the term of the agreement. These agreements involve the sale of debt securities, or obligations, held by a Portfolio, with an agreement to repurchase the obligations at an agreed-upon price, date and interest payment. The proceeds will be used to purchase other debt securities either maturing, or under an agreement to resell, at a date simultaneous with or prior to the expiration of the reverse repurchase agreement. Reverse repurchase agreements will be utilized, when permitted by law, only when the interest income to be earned from the investment of the proceeds from the transaction is greater than the interest expense of the reverse repurchase transaction.
The Portfolio will limit its investments in reverse repurchase agreements and other borrowing to no more than 33%, or as otherwise limited herein, of its total assets. While a reverse repurchase agreement is outstanding, the Portfolios will maintain liquid assets in an amount at least equal in value to the Portfolios’ commitments to cover their obligations under the agreement. The use of reverse repurchase agreements by the Portfolio creates leverage that increases the Portfolio’s investment risk. If the income and gains on securities purchased with the proceeds of reverse repurchase agreements exceed the cost of the agreements, the Portfolio’s earnings or NAV will increase faster than otherwise would be the case; conversely, if the income and gains fail to exceed the costs, earnings or NAV would decline faster than otherwise would be the case. If the buyer of the obligation subject to the reverse repurchase agreement becomes bankrupt, realization upon the underlying securities may be delayed and there is a risk of loss due to any decline in their value. As of June 30, 2019, the Portfolio did not hold any reverse repurchase agreements.
(R) Sale-Buybacks. The Portfolio may enter into financing transactions referred to as ‘sale-buybacks’. A sale-buyback transaction consists of a sale of a security by the Portfolio to a financial institution, the counterparty, with a simultaneous agreement to repurchase the same or substantially the same security at an agreed-upon price and date. The Portfolio is not entitled to receive principal and interest payments, if any, made on the security sold to the counterparty during the term of the agreement. The agreed-upon proceeds for securities to be repurchased by the Portfolio are reflected as a liability on the Statement of Assets and Liabilities. The Portfolio will recognize net income represented by the price differential between the price received for the transferred security and the agreed-upon repurchase price. This is commonly referred to as the “price drop”. A price drop consists of (i) the foregone interest and inflationary income adjustments, if any, the Portfolio would have otherwise received had the security not been sold and (ii) the negotiated financing terms between the Portfolio and counterparty. Foregone interest and inflationary income adjustments, if any, are recorded as components of interest income on the Statement of Operations. Interest payments based upon negotiated financing terms
made by the Portfolio to counterparties are recorded as a component of interest expense on the Statement of Operations. In periods of increased demand for the security, the Portfolio may receive a fee for use of the security by the counterparty, which may result in interest income to the Portfolio. The Portfolio will segregate cash or liquid assets, enter intooff-setting transactions or use other measures permitted by applicable laws to “cover” the Portfolio’s current obligations.
(S) Securities Sold Short. The Portfolio may engage in sales of securities it does not own (“short sales”) as part of its investment strategies. When the Portfolio enters into a short sale, it must segregate or maintain with a broker the cash proceeds from the security sold short or other securities as collateral for its obligation to deliver the security upon conclusion of the sale. During the period a short position is open, depending on the nature and type of security, a short position is reflected as a liability and is marked to market in accordance with the valuation methodologies previously detailed (See Note 2(A)). Liabilities for securities sold short are closed out by purchasing the applicable securities for delivery to the counterparty broker. A gain, limited to the price at which the Portfolio sold the security short, or a loss, unlimited as to dollar amount, will be recognized upon termination of a short sale if the market price on the date the short position is closed out is less or greater, respectively, than the proceeds originally received. Any such gain or loss may be offset, completely or in part, by the change in the value of the hedged investments. Interest on short positions held is accrued daily, while dividends declared on short positions existing on the record date are recorded on theex-dividend date as a dividend expense in the Statement of Operations. Broker fees and other expenses related to securities sold short are disclosed in the Statement of Operations. Short sales involve risk of loss in excess of the related amounts reflected in the Statement of Assets and Liabilities. As of June 30, 2019, the Portfolio did not hold any securities sold short.
(T) Delayed Delivery Transactions. The Portfolio may purchase or sell securities on a delayed delivery basis. These transactions involve a commitment by the Portfolio to purchase or sell securities for a predetermined price or yield, with payment and delivery taking place beyond the customary settlement period. When delayed delivery purchases are outstanding, the Portfolio will designate liquid assets in an amount sufficient to meet the purchase price. When purchasing a security on a delayed delivery basis, the Portfolio assumes the rights and risks of ownership of the security, including the risk of price and yield fluctuations, and takes such fluctuations into account when determining its NAV. The Portfolio may dispose of or renegotiate a delayed delivery transaction after it is entered into, and may sell delayed delivery securities before they are delivered, which may result in a realized gain or loss. When the Portfolio has sold a security it owns on a delayed delivery basis, the Portfolio does not participate in future gains and losses with respect to the security.
(U) Treasury Inflation-Protected Securities. The Portfolio invests in Treasury Inflation-Protected Securities (“TIPS”) which are specially structured bonds in which the principal amount is adjusted to keep pace with inflation. The inflation (deflation) adjustment is applied to the principal of each bond on a monthly basis and is accounted for as interest income on the Statement of Operations. TIPS are subject to interest rate risk.
Notes to Financial Statements(Unaudited) (continued)
(V) Securities Lending. In order to realize additional income, the Portfolio may engage in securities lending, subject to the limitations set forth in the 1940 Act and relevant guidance by the staff of the Securities and Exchange Commission (“SEC”). In the event the Portfolio does engage in securities lending, the Portfolio will lend through its custodian, State Street Bank and Trust Company (“State Street”), acting as securities lending agent on behalf of the Portfolio. State Street will manage the Portfolio’s collateral in accordance with the securities lending agency agreement between the Portfolio and State Street, and indemnify the Portfolio against counterparty risk. The loans will be collateralized by cash (which may be invested in a money market fund) and/ornon-cash collateral (which may include, U.S. Treasury securities and/or U.S. Government Agency securities issued or guaranteed by the United States government or its agencies or instrumentalities) at least equal at all times to the market value of the securities loaned. The Portfolio may bear the risk of delay in recovery of, or loss of rights in, the securities loaned should the borrower of the securities experience financial difficulty. The Portfolio may also record a realized gain or loss on securities deemed sold due to a borrower’s inability to return securities on loan. The Portfolio bears the risk of any loss on investment of cash collateral. The Portfolio will receive compensation for lending its securities in the form of fees or it will retain a portion of interest on the investment of any cash collateral. The Portfolio will also continue to receive interest and dividends on the securities loaned and any gain or loss in the market price of the securities loaned that may occur during the term of the loan will be for the account of the Portfolio. Income earned from securities lending activities, if any, is reflected in the Statement of Operations. As of June 30, 2019, the Portfolio did not have any portfolio securities on loan.
(W) Debt and Foreign Securities Risk. The ability of issuers of debt securities held by the Portfolio to meet their obligations may be affected by, among other things, economic or political developments in a specific country, industry or region. Debt securities are also subject to the risks associated with changes in interest rates.
The Portfolio may invest in foreign securities, which carry certain risks that are in addition to the usual risks inherent in domestic securities. These risks include those resulting from currency fluctuations, future adverse political or economic developments and possible imposition of currency exchange blockages or other foreign governmental laws or restrictions. These risks are likely to be greater in emerging markets than in developed markets. The ability of issuers of debt securities held by the Portfolio to meet their obligations may be affected by, among other things, economic or political developments in a specific country, industry or region.
(X) Counterparty Credit Risk. In order to better define its contractual rights and to secure rights that will help the Portfolio mitigate its counterparty risk, the Portfolio may enter into an International Swaps and Derivatives Association, Inc. Master Agreement (“ISDA Master Agreement”) or similar agreement with its counterparties. An ISDA Master Agreement is a bilateral agreement between the Portfolio and a counterparty that governs certain OTC derivatives and typically contains collateral posting terms and netting provisions. Under an ISDA Master Agreement, the Portfolio may, under certain circumstances, offset with the counterparty certain derivative financial instruments’ payables and/or receivables with collateral held and/or posted and create one single
net payment. The provisions of the ISDA Master Agreement typically permit a single net payment in the event of default including the bankruptcy or insolvency of the counterparty. Bankruptcy or insolvency laws of a particular jurisdiction may restrict or prohibit the right of offset in bankruptcy, insolvency or other events. In addition, certain ISDA Master Agreements may contain provisions for early termination of OTC derivative transactions in the event the net assets of the Portfolio declines below specific levels or if the Portfolio fails to meet the terms of its ISDA Master Agreements. The result would cause the Portfolio to accelerate payment of any net liability owed to the counterparty.
For financial reporting purposes, the Portfolio does not offset derivative assets and derivative liabilities that are subject to netting arrangements, if any, in the Statement of Assets and Liabilities.
(Y) Indemnifications. Under the Fund’s organizational documents, its officers and trustees are indemnified against certain liabilities that may arise out of performance of their duties to the Fund. Additionally, in the normal course of business, the Portfolio enters into contracts with third-party service providers that contain a variety of representations and warranties and which may provide general indemnifications. The Portfolio’s maximum exposure under these arrangements is unknown, as this would involve future claims that may be made against the Portfolio that have not yet occurred. Based on experience, management is of the view that the risk of loss in connection with these potential indemnification obligations is remote. However, there can be no assurance that material liabilities related to such obligations will not arise in the future, which could adversely impact the Portfolio.
(Z) Quantitative Disclosure of Derivative Holdings. The following tables show additional disclosures related to the Portfolio’s derivative and hedging activities, including how such activities are accounted for and their effect on the Portfolio’s financial positions, performance and cash flows. The Portfolio entered into futures contracts to manage its exposure to the securities markets or to movements in interest rates and currency values. The Portfolio wrote or purchased options to enhance returns or to hedge an existing position or future investment. The Portfolio entered into forward foreign currency contracts to hedge the currency exposure associated with some or all of the Portfolio’s securities or as a part of an investment strategy. The Portfolio utilizes credit default, interest rate and inflation swap agreements to manage its exposure to credit, interest rate and inflation risk
| | |
| 40 | | MainStay VP PIMCO Real Return Portfolio |
Fair value of derivative instruments as of June 30, 2019:
Asset Derivatives
| | | | | | | | | | | | | | | | | | |
| | | Statement of Assets and Liabilities Location | | Foreign
Exchange
Contracts
Risk | | | Credit
Contracts
Risk | | | Interest
Rate
Contracts
Risk | | | Total | |
| | | | | |
Purchased Options | | Investments in securities, at value | | $ | — | | | $ | — | | | $ | 7,688 | | | $ | 7,688 | |
Futures Contracts | | Net Assets—Net unrealized appreciation on investments, swap contracts and futures contracts (a) | | | — | | | | — | | | | 569,184 | | | | 569,184 | |
OTC Swap Contracts | | Unrealized appreciation on OTC swap contracts | | | — | | | | — | | | | 22,956 | | | | 22,956 | |
Centrally Cleared Swap Contracts | | Net Assets—Net unrealized appreciation on investments, swap contracts and futures contracts (b) | | | — | | | | 10,368 | | | | 766,982 | | | | 777,350 | |
Forward Contracts | | Unrealized appreciation on foreign currency forward contracts | | | 403,889 | | | | — | | | | — | | | | 403,889 | |
| | | | | | |
Total Fair Value | | | | $ | 403,889 | | | $ | 10,368 | | | $ | 1,366,810 | | | $ | 1,781,067 | |
| | | | | | |
Liability Derivatives
| | | | | | | | | | | | | | | | | | |
| | | Statement of Assets and Liabilities Location | | Foreign
Exchange
Contracts
Risk | | | Credit
Contracts
Risk | | | Interest
Rate
Contracts
Risk | | | Total | |
| | | | | |
Written Options | | Investments in written options, at value | | $ | — | | | $ | — | | | $ | (200,860 | ) | | $ | (200,860 | ) |
Futures Contracts | | Net Assets—Net unrealized depreciation on investments, swap contracts and futures contracts (a) | | | — | | | | — | | | | (1,623,580 | ) | | | (1,623,580 | ) |
OTC Swap Contracts | | Unrealized depreciation on OTC swap contracts | | | — | | | | (29,986 | ) | | | (1,244 | ) | | | (31,230 | ) |
Centrally Cleared Swap Contracts | | Net Assets—Net unrealized depreciation on investments, swap contracts and futures contracts (b) | | | — | | | | (155,601 | ) | | | (1,762,051 | ) | | | (1,917,652 | ) |
Forward Contracts | | Unrealized depreciation on foreign currency forward contracts | | | (800,019 | ) | | | — | | | | — | | | | (800,019 | ) |
| | | | | | |
Total Fair Value | | | | $ | (800,019 | ) | | $ | (185,587 | ) | | $ | (3,587,735 | ) | | $ | (4,573,341 | ) |
| | | | | | |
| (a) | Includes cumulative appreciation (depreciation) of futures contracts as reported in the Portfolio of Investments. Only current day’s variation margin is reported within the Statement of Assets and Liabilities. |
| (b) | Includes cumulative appreciation (depreciation) of centrally cleared swap agreements as reported in the Portfolio of Investments. Only the current day’s variation margin is reported within the Statement of Assets and Liabilities. |
The effect of derivative instruments on the Statement of Operations for the period ended June 30, 2019:
Realized Gain (Loss)
| | | | | | | | | | | | | | | | | | |
| | | Statement of Operations Location | | Foreign
Exchange
Contracts
Risk | | | Credit
Contracts
Risk | | | Interest
Rate
Contracts
Risk | | | Total | |
| | | | | |
Purchased Options | | Net realized gain (loss) on investment transactions | | $ | — | | | $ | — | | | $ | 779,901 | | | $ | 779,901 | |
Written Options | | Net realized gain (loss) on written option transactions | | | — | | | | — | | | | (391,136 | ) | | | (391,136 | ) |
Futures Contracts | | Net realized gain (loss) on futures transactions | | | — | | | | — | | | | (3,301,292 | ) | | | (3,301,292 | ) |
Swap Contracts | | Net realized gain (loss) on swap transactions | | | — | | | | (99,617 | ) | | | 375,936 | | | | 276,319 | |
Forward Contracts | | Net realized gain (loss) on foreign currency forward transactions | | | 2,865 | | | | — | | | | — | | | | 2,865 | |
| | | | | | |
Total Realized Gain (Loss) | | | | $ | 2,865 | | | $ | (99,617 | ) | | $ | (2,536,591 | ) | | $ | (2,633,343 | ) |
| | | | | | |
Notes to Financial Statements(Unaudited) (continued)
Change in Unrealized Appreciation (Depreciation)
| | | | | | | | | | | | | | | | | | |
| | | Statement of Operations Location | | Foreign
Exchange
Contracts
Risk | | | Credit
Contracts
Risk | | | Interest
Rate
Contracts
Risk | | | Total | |
| | | | | |
Purchased Options | | Net change in unrealized appreciation (depreciation) on investments | | $ | — | | | $ | — | | | $ | (4,396 | ) | | $ | (4,396 | ) |
Written Options | | Net change in unrealized appreciation (depreciation) on written options | | | — | | | | — | | | | (23,369 | ) | | | (23,369 | ) |
Futures Contracts | | Net change in unrealized appreciation (depreciation) on futures contracts | | | — | | | | — | | | | 365,451 | | | | 365,451 | |
Swap Contracts | | Net change in unrealized appreciation (depreciation) on swap contracts | | | — | | | | (279,594 | ) | | | (1,282,343 | ) | | | (1,561,937 | ) |
Forward Contracts | | Net change in unrealized appreciation (depreciation) on foreign currency forward contracts | | | (1,008,884 | ) | | | — | | | | — | | | | (1,008,884 | ) |
| | | | | | |
Total Change in Unrealized Appreciation (Depreciation) | | | | $ | (1,008,884 | ) | | $ | (279,594 | ) | | $ | (944,657 | ) | | $ | (2,233,135 | ) |
| | | | | | |
Average Notional Amount
| | | | | | | | | | | | | | | | |
| | | Foreign
Exchange
Contracts
Risk | | | Credit
Contracts
Risk | | | Interest Rate
Contracts
Risk | | | Total | |
| | | | |
Purchased Options | | $ | — | | | $ | — | | | $ | 133,164,679 | | | $ | 133,179,679 | |
Written Options | | $ | — | | | $ | — | | | $ | (23,350,210 | ) | | $ | (23,350,210 | ) |
Written Swaptions | | $ | — | | | $ | — | | | $ | (24,850,000 | ) | | $ | (24,850,000 | ) |
Written Inflation—Capped Options | | $ | — | | | $ | — | | | $ | (2,200,000 | ) | | $ | (2,200,000 | ) |
Futures Contracts Long | | $ | — | | | $ | — | | | $ | 65,626,285 | | | $ | 65,626,285 | |
Futures Contracts Short | | $ | — | | | $ | — | | | $ | (143,412,080 | ) | | $ | (143,412,080 | ) |
Swap Contracts Long | | $ | — | | | $ | 9,132,575 | | | $ | 97,873,900 | | | $ | 107,006,475 | |
Forward Contracts Long | | $ | 28,550,702 | | | $ | — | | | $ | — | | | $ | 28,550,702 | |
Forward Contracts Short | | $ | (90,970,247 | ) | | $ | — | | | $ | — | | | $ | (90,970,247 | ) |
| | | | | | | | | | | | |
Borrowings and other financing transactions summary
The following is a summary by counterparty of the market value of Borrowings and Other Financing Transactions and collateral (received)/pledged as of June 30, 2019:
| | | | | | | | | | | | | | | | |
Counterparty | | Payable for
Sale-Buyback
Transactions | | | Total
Borrowings and
Other Financing
Transactions | | | Collateral
(Received)/
Pledged | | | Net
Exposure (a) | |
| | | | |
Master Securities Forward Transaction Agreement
Barclays Capital Inc. | | $ | (181,618,068 | ) | | $ | (181,618,068 | ) | | $ | 183,405,606 | | | $ | 1,787,538 | |
| | | | | | | | | | | | | | | | |
Total Borrowings and Other Financing Transactions | | $ | (181,618,068 | ) | | | | | | | | | | | | |
| | | | | | | | | | | | | | | | |
| (a) | Net Exposure represents the net receivable/(payable) that would be due from/to the counterparty in the event of default. Exposure from borrowings and other financing transactions can only be netted across transactions governed under the same master agreement with the same legal entity. |
| | |
| 42 | | MainStay VP PIMCO Real Return Portfolio |
Certain Transfers Accounted for as Secured Borrowings
Remaining Contractual Maturity of the Agreements
| | | | | | | | | | | | | | | | | | | | |
| | | Overnight and
Continuous | | | Up to 30 days | | | 31-90 days | | | Greater than
90 days | | | Total | |
| | | | | |
Sale-Buyback Transactions | | | | | | | | | | | | | | | | | | | | |
United States Treasury Obligations | | $ | — | | | $ | 46,274,340 | | | $ | 134,939,747 | | | $ | — | | | $ | 181,214,087 | |
| | | | |
Total Borrowings | | $ | — | | | $ | 46,274,340 | | | $ | 134,939,747 | | | $ | — | | | $ | 181,214,087 | |
| | | | |
Gross amount of recognized liabilities for reverse repurchase agreements and sale-buyback financing transactions | | | | | | | | | | | | | | | | | | $ | 181,214,087 | |
| | | | | | | | | | | | | | | | | | | | |
Note 3–Fees and Related Party Transactions
(A) Manager and Subadvisor. New York Life Investments, a registered investment adviser and an indirect, wholly-owned subsidiary of New York Life, serves as the Portfolio’s Manager pursuant to an Amended and Restated Management Agreement (“Management Agreement”). The Manager provides offices, conducts clerical, recordkeeping and bookkeeping services, and keeps most of the financial and accounting records required to be maintained by the Portfolio. Except for the portion of salaries and expenses that are the responsibility of the Portfolio, the Manager pays the salaries and expenses of all personnel affiliated with the Portfolio and certain operational expenses of the Portfolio. The Portfolio reimburses New York Life Investments in an amount equal to a portion of the compensation of the Chief Compliance Officer attributable to the Portfolio. Pacific Investment Management Company LLC (“ PIMCO” or the “Subadvisor”), a registered investment adviser, serves as Subadvisor to the Portfolio and is responsible for theday-to-day portfolio management of the Portfolio. Pursuant to the terms of a Subadvisory Agreement (“Subadvisory Agreement”) between New York Life Investments and PIMCO, New York Life Investments pays for the services of the Subadvisor.
Effective, May 1, 2019, New York Life Investments has contractually agreed to waive fees and/or reimburse expenses so that Total Annual Portfolio Operating Expenses (excluding taxes, interest, litigation, extraordinary expenses, brokerage and other transaction expenses relating to the purchase or sale of portfolio investments, and acquired (underlying) portfolio/fund fees and expenses) do not exceed the following percentages of average daily net assets: Initial Class, 0.53%; and Service Class, 0.78%. This agreement will remain in effect until May 1, 2020, and shall renew automatically forone-year terms unless New York Life Investments provides written notice of termination prior to the start of the next term or upon approval of the Board.
The Fund, on behalf of the Portfolio, pays New York Life Investments in its capacity as the Portfolio’s investment manager and administrator, pursuant to the Management Agreement, a monthly fee for the services
performed and the facilities furnished at an annual percentage of the average daily net assets of 0.50%. During thesix-month period ended June 30, 2019, the effective management fee rate was 0.50%.
During thesix-month period ended June 30, 2019, New York Life Investments earned fees from the Portfolio in the amount of $853,702, waived its fees and/or reimbursed expenses in the amount of $48,645, and paid the Subadvisor in the amount of $426,851.
State Street providessub-administration andsub-accounting services to the Portfolio pursuant to an agreement with New York Life Investments. These services include calculating the daily NAVs of the Portfolio, maintaining the general ledger andsub-ledger accounts for the calculation of the Portfolio’s NAVs and assisting New York Life Investments in conducting various aspects of the Portfolio’s administrative operations. For providing these services to the Portfolio, State Street is compensated by New York Life Investments.
Pursuant to an agreement between the Fund and New York Life Investments, New York Life Investments is responsible for providing or procuring certain regulatory reporting services for the Portfolio. The Portfolio will reimburse New York Life Investments for the actual costs incurred by New York Life Investments in connection with providing or procuring these services for the Portfolio.
(B) Distribution and Service Fees. The Fund, on behalf of the Portfolio, has entered into a distribution agreement with NYLIFE Distributors LLC (the “Distributor”), an indirect, wholly-owned subsidiary of New York Life. The Portfolio has adopted a distribution plan (the “Plan”) in accordance with the provisions of Rule12b-1 under the 1940 Act. Under the Plan, the Distributor has agreed to provide, through its affiliates or independent third parties, various distribution-related, shareholder and administrative support services to the Service Class shareholders. For its services, the Distributor is entitled to a combined distribution and service fee accrued daily and paid monthly at an annual rate of 0.25% of the average daily net assets attributable to the Service Class shares of the Portfolio.
(C) Investments in Affiliates (in 000’s). During thesix-month period ended June 30, 2019, purchases and sales transactions, income earned from investments and shares held of investment companies managed by New York Life Investments or its affiliates were as follows:
| | | | | | | | | | | | | | | | | | | | | | | | | | | | | | | | | | | | |
Affiliated Investment Company | | Value,
Beginning
of Period | | | Purchases
at Cost | | | Proceeds
from
Sales | | | Net
Realized Gain/(Loss) on Sales | | | Change in
Unrealized
Appreciation/
(Depreciation) | | | Value,
End of
Period | | | Dividend
Income | | | Other
Distributions | | | Shares
End of
Period | |
MainStay U.S. Government Liquidity Fund | | $ | 864 | | | $ | 38,764 | | | $ | (38,824 | ) | | $ | — | | | $ | — | | | $ | 804 | | | $ | 11 | | | $ | — | | | | 804 | |
Notes to Financial Statements(Unaudited) (continued)
Note 4–Federal Income Tax
As of June 30, 2019, the cost and unrealized appreciation (depreciation) of the Portfolio’s investment portfolio, including applicable derivative contracts and other financial instruments, as determined on a federal income tax basis, were as follows:
| | | | | | | | | | | | | | | | |
| | | Federal Tax
Cost | | | Gross
Unrealized
Appreciation | | | Gross
Unrealized
(Depreciation) | | | Net
Unrealized
Appreciation/
(Depreciation) | |
| | | | |
Investments in Securities | | $ | 569,287,846 | | | $ | 4,587,329 | | | $ | (2,198,874 | ) | | $ | 2,388,455 | |
As of December 31, 2018, for federal income tax purposes, capital loss carryforwards of $76,580,670, as shown in the table below, were available to the extent provided by the regulations to offset future realized gains of the Portfolio through the years indicated. Accordingly, no capital gains distributions are expected to be paid to shareholders until net gains have been realized in excess of such amounts.
| | | | |
Capital Loss
Available Through | | Short-Term
Capital Loss
Amounts (000’s) | | Long-Term
Capital Loss
Amounts (000’s) |
| | |
| Unlimited | | $26,573 | | $50,008 |
During the year ended December 31, 2018, the tax character of distributions paid as reflected in the Statements of Changes in Net Assets was as follows:
| | | | |
|
| 2018 | |
Tax-Based
Distributions from Ordinary
Income | | Tax-Based
Distributions from Long-Term
Gains | |
| |
| $4,587,483 | | $ | — | |
Note 5–Custodian
State Street is the custodian of cash and securities held by the Portfolio. Custodial fees are charged to the Portfolio based on the Portfolio’s net assets and/or the market value of securities held by the Portfolio and the number of certain transactions incurred by the Portfolio.
Note 6–Line of Credit
The Portfolio and certain other funds managed by New York Life Investments maintain a line of credit with a syndicate of banks in order to secure a source of funds for temporary purposes to meet unanticipated or excessive redemption requests.
Effective July 30, 2019, under the credit agreement (the “Credit Agreement”), the aggregate commitment amount is $600,000,000 with an additional uncommitted amount of $100,000,000. The commitment fee is an annual rate of 0.15% of the average commitment amount payable quarterly, regardless of usage, to State Street, who serves as the agent to the syndicate. The commitment fee is allocated among the Portfolio and certain other funds managed by New York Life Investments based upon their respective net assets and other factors. Interest on any revolving credit loan is charged based upon the Federal Funds Rate or
theone-month London Interbank Offered Rate (“LIBOR”), whichever is higher. The Credit Agreement expires on July 28, 2020, although the Portfolio, certain other funds managed by New York Life Investments and the syndicate of banks may renew the Credit Agreement for an additional year on the same or different terms. Prior to July 30, 2019, the aggregate commitment amount and the commitment fee were the same as those under the current Credit Agreement. During thesix-month period ended June 30, 2019, there were no borrowings made or outstanding with respect to the Portfolio under the Credit Agreement.
Note 7–Interfund Lending Program
Pursuant to an exemptive order issued by the SEC, the Portfolio, along with certain other funds managed by New York Life Investments, may participate in an interfund lending program. The interfund lending program provides an alternative credit facility that permits the Portfolio and certain other funds managed by New York Life Investments to lend or borrow money for temporary purposes directly to or from one another subject to the conditions of the exemptive order. During thesix-month period ended June 30, 2019, there were no interfund loans made or outstanding with respect to the Portfolio.
Note 8–Purchases and Sales of Securities (in 000’s)
During thesix-month period ended June 30, 2019, purchases and sales of U.S. government securities were $469,831 and $427,780, respectively. Purchases and sales of securities, other than U.S. government securities and short-term securities, were $47,393 and $16,447, respectively.
The Portfolio may purchase securities from or sell securities to other portfolios managed by the Subadvisor. These interportfolio transactions are primarily used for cash management purposes and are made pursuant to Rule17a-7 under the 1940 Act. The Rule17a-7 transactions during thesix-month period ended June 30, 2019, were as follows:
| | | | |
Purchases (000’s) | | Sales (000’s) | | Realized
Gain/(Loss) (000’s) |
| | |
| $— | | $543 | | $(17) |
| | |
| 44 | | MainStay VP PIMCO Real Return Portfolio |
Note 9–Capital Share Transactions
Transactions in capital shares for thesix-month period ended June 30, 2019 and the year ended December 31, 2018, were as follows:
| | | | | | | | |
Initial Class | | Shares | | | Amount | |
| | |
Six-month period ended June 30, 2019: | | | | | | | | |
Shares sold | | | 143,462 | | | $ | 1,203,337 | |
Shares redeemed | | | (389,623 | ) | | | (3,323,367 | ) |
| | | | |
Net increase (decrease) | | | (246,161 | ) | | $ | (2,120,030 | ) |
| | | | |
Year ended December 31, 2018: | | | | | | | | |
Shares sold | | | 442,236 | | | $ | 3,714,900 | |
Shares issued to shareholders in reinvestment of dividends and distributions | | | 89,899 | | | | 740,327 | |
Shares redeemed | | | (438,397 | ) | | | (3,643,210 | ) |
| | | | |
Net increase (decrease) | | | 93,738 | | | $ | 812,017 | |
| | | | |
| | |
| | | | | | | | |
Service Class | | Shares | | | Amount | |
| | |
Six-month period ended June 30, 2019: | | | | | | | | |
Shares sold | | | 4,361,963 | | | $ | 36,853,438 | |
Shares redeemed | | | (2,069,873 | ) | | | (17,434,453 | ) |
| | | | |
Net increase (decrease) | | | 2,292,090 | | | $ | 19,418,985 | |
| | | | |
Year ended December 31, 2018: | | | | | | | | |
Shares sold | | | 5,154,188 | | | $ | 43,081,277 | |
Shares issued to shareholders in reinvestment of dividends and distributions | | | 467,591 | | | | 3,847,156 | |
Shares redeemed | | | (4,893,856 | ) | | | (40,933,068 | ) |
| | | | |
Net increase (decrease) | | | 727,923 | | | $ | 5,995,365 | |
| | | | |
Note 10–Recent Accounting Pronouncement
To improve the effectiveness of fair value disclosure requirements, the Financial Accounting Standards Board recently issued Accounting Standard Update (ASU)2018-13, Fair Value Measurement Disclosure Framework—Changes to the Disclosure Requirements for Fair Value Measurement (ASU2018-13), which adds, removes, and modifies certain aspects relating to fair value disclosure. ASU2018-13 is effective for interim and annual reporting periods beginning after December 15, 2019; early adoption of the additions relating toASU 2018-13 is not required. Management has evaluated the implications of certain other provisions of the ASU and has determined to early adopt aspects related to the removal and modifications of certain fair value measurement disclosures under the ASU effective immediately. At this time, management is evaluating the implications of certain other provisions of the ASU related to new disclosure requirements and any impact on the financial statement disclosures has not yet been determined.
Note 11–Subsequent Events
In connection with the preparation of the financial statements of the Portfolio as of and for thesix-month period ended June 30, 2019, events and transactions subsequent to June 30, 2019, through the date the financial statements were issued have been evaluated by the Portfolio’s management for possible adjustment and/or disclosure. No subsequent events requiring financial statement adjustment or disclosure have been identified.
Proxy Voting Policies and Procedures and Proxy Voting Record
A description of the policies and procedures that New York Life Investments uses to vote proxies related to the Portfolio’s securities is available without charge, upon request (i) by calling800-598-2019; (ii) by visiting New York Life Investments website athttps://www.nylinvestments.com/mainstay/products-and-performance/mainstay-vp-funds-trust; or (iii) by visiting the SEC’s website at www.sec.gov.
The Portfolio is required to file with the SEC its proxy voting record for the12-month period ending June 30 on FormN-PX. The Portfolio’s most recent FormN-PX or proxy voting record is available free of charge upon request (i) by calling800-598-2019; (ii) by visiting New York Life Investments website athttps://www.nylinvestments.com/mainstay/products-and-performance/mainstay-vp-funds-trust; or (iii) by visiting the SEC’s website atwww.sec.gov.
Shareholder Reports and Quarterly Portfolio Disclosure
The Portfolio is required to file its complete schedule of portfolio holdings with the SEC 60 days after each fiscal quarter onForm N-PORT. The Portfolio’s holdings report is available without charge upon request (i) by calling800-598-2019; (ii) by visiting New York Life Investments website athttps://www.nylinvestments.com/mainstay/products-and-performance/mainstay-vp-funds-trust; or (iii) on the SEC’s website at www.sec.gov.
| | |
| 46 | | MainStay VP PIMCO Real Return Portfolio |
MainStay VP Portfolios
MainStay VP offers a wide range of Portfolios. The full array of MainStay VP offerings is listed here, with information about the manager, subadvisors, legal counsel, and independent registered public accounting firm.
Equity Portfolios
MainStay VP Eagle Small Cap Growth Portfolio
MainStay VP Emerging Markets Equity Portfolio
MainStay VP Epoch U.S. Equity Yield Portfolio
MainStay VP Fidelity Institutional AM® Utilities Portfolio†
MainStay VP Large Cap Growth Portfolio
MainStay VP MacKay Common Stock Portfolio
MainStay VP MacKay Growth Portfolio
MainStay VP MacKay International Equity Portfolio
MainStay VP MacKay Mid Cap Core Portfolio
MainStay VP MacKay S&P 500 Index Portfolio
MainStay VP MacKay Small Cap Core Portfolio
MainStay VP Mellon Natural Resources Portfolio
MainStay VP T. Rowe Price Equity Income Portfolio
Mixed Asset Portfolios
MainStay VP Balanced Portfolio
MainStay VP Income Builder Portfolio
MainStay VP Janus Henderson Balanced Portfolio
MainStay VP MacKay Convertible Portfolio
Income Portfolios
MainStay VP Bond Portfolio
MainStay VP Floating Rate Portfolio
MainStay VP Indexed Bond Portfolio
MainStay VP MacKay Government Portfolio
MainStay VP MacKay High Yield Corporate Bond Portfolio
MainStay VP MacKay Unconstrained Bond Portfolio
MainStay VP PIMCO Real Return Portfolio
Money Market
MainStay VP U.S. Government Money Market Portfolio
Alternative
MainStay VP Cushing Renaissance Advantage Portfolio
MainStay VP IQ Hedge Multi-Strategy Portfolio
Asset Allocation Portfolios
MainStay VP Conservative Allocation Portfolio
MainStay VP Growth Allocation Portfolio
MainStay VP Moderate Allocation Portfolio
MainStay VP Moderate Growth Allocation Portfolio
Manager
New York Life Investment Management LLC
New York, New York
Subadvisors
Candriam Belgium*
Brussels, Belgium
Cushing Asset Management, LP
Dallas, Texas
Eagle Asset Management, Inc.
St Petersburg, Florida
Epoch Investment Partners, Inc.
New York, New York
FIAM LLC
Smithfield, Rhode Island
IndexIQ Advisors LLC*
New York, New York
Janus Capital Management LLC
Denver, Colorado
MacKay Shields LLC*
New York, New York
Mellon Investments Corporation
Boston, Massachusetts
NYL Investors LLC*
New York, New York
Pacific Investment Management Company LLC
Newport Beach, California
T. Rowe Price Associates, Inc.
Baltimore, Maryland
Winslow Capital Management, LLC
Minneapolis, Minnesota
Distributor
NYLIFE Distributors LLC*
Jersey City, New Jersey
Custodian
State Street Bank and Trust Company
Boston, Massachusetts
Independent Registered Public Accounting Firm
PricewaterhouseCoopers LLP
New York, New York
Legal Counsel
Dechert LLP
Washington, District of Columbia
Some Portfolios may not be available in all products.
| † | Fidelity Institutional AM is a registered trade mark of FMR LLC. Used with permission. |
| * | An affiliate of New York Life Investment Management LLC |
Not part of the Semiannual Report
2019 Semiannual Report
This report is for the general information of New York Life Variable Annuities and NYLIAC Variable Universal Life Insurance Products policyowners. It must be preceded or accompanied by the appropriate product(s) and funds prospectuses if it is given to anyone who is not an owner of a New York Life variable annuity policy or a NYLIAC Variable Universal Life Insurance Product. This report does not offer for sale or solicit orders to purchase securities.
The performance data quoted in this report represents past performance. Past performance is no guarantee of future results. Due to market volatility and other factors, current performance may be lower or higher than the figures shown. The most recent month-end performance summary for your variable annuity or variable life policy is available by calling 800-598-2019 and is updated periodically on www.newyorklife.com.
The New York Life Variable Annuities and NYLIAC Variable Universal Life Insurance Products are issued by New York Life Insurance and Annuity Corporation (a Delaware Corporation) and distributed by NYLIFE Distributors LLC (Member FINRA/SIPC).
New York Life Insurance Company
New York Life Insurance and Annuity Corporation (NYLIAC) (A Delaware Corporation)
51 Madison Avenue, Room 551
New York, NY 10010
www.newyorklife.com
Printed on recycled paper
nylinvestments.com
NYLIFE Distributors LLC, 30 Hudson Street, Jersey City, NJ 07302
New York Life Investment Management LLC is the investment manager to the MainStay VP Funds Trust
©2019 by NYLIFE Distributors LLC. All rights reserved.
You may obtain copies of the Prospectus and the Statement of Additional Information free of charge, upon request, by callingtoll-free 800-598-2019 or writing to New York Life Insurance and Annuity Corporation, 51 Madison Avenue, New York, NY 10010.
| | | | |
| | | |
| Not FDIC Insured | | No Bank Guarantee | | May Lose Value |
| | | | |
| 1781636 | | | | MSVPPRR10-08/19 (NYLIAC) NI528 |
Not applicable.
| Item 3. | Audit Committee Financial Expert. |
Not applicable.
| Item 4. | Principal Accountant Fees and Services. |
Not applicable.
| Item 5. | Audit Committee of Listed Registrants |
Not applicable.
| Item 6. | Schedule of Investments |
The Schedule of Investments is included as part of Item 1 of this report.
| Item 7. | Disclosure of Proxy Voting Policies and Procedures forClosed-End Management Investment Companies. |
Not applicable.
| Item 8. | Portfolio Managers ofClosed-End Management Investment Companies. |
Not applicable.
| Item 9. | Purchases of Equity Securities byClosed-End Management Investment Company and Affiliated Purchasers. |
Not Applicable.
| Item 10. | Submission of Matters to a Vote of Security Holders. |
Since the Registrant’s last response to this Item, there have been no material changes to the procedures by which shareholders may recommend nominees to the Registrant’s Board of Trustees.
| Item 11. | Controls and Procedures. |
| (a) | Based on an evaluation of the Registrant’s Disclosure Controls and Procedures (as defined in Rule30a-3(c) under the Investment Company Act of 1940) (the “Disclosure Controls”), as of a date within 90 days prior to the filing date (the “Filing Date”) of this FormN-CSR (the “Report”), the Registrant’s principal executive officer and principal |
| | financial officer have concluded that the Disclosure Controls are reasonably designed to ensure that information required to be disclosed by the Registrant in the Report is recorded, processed, summarized and reported by the Filing Date, including ensuring that information required to be disclosed in the Report is accumulated and communicated to the Registrant’s management, including the Registrant’s principal executive officer and principal financial officer, as appropriate to allow timely decisions regarding required disclosure. |
| (b) | There were no changes in the Registrant’s internal control over financial reporting (as defined in Rule30a-3(d)) under the Investment Company Act of 1940 that occurred during the second fiscal quarter of the period covered by this report that has materially affected, or is reasonably likely to materially affect, the Registrant’s internal control over financial reporting. |
| (a) | Certifications of principal executive officer and principal financial officer as required by Rule30a-2 under the Investment Company Act of 1940. |
| (b) | Certifications of principal executive officer and principal financial officer as required by Section 906 of the Sarbanes-Oxley Act of 2002. |
SIGNATURES
Pursuant to the requirements of the Securities Exchange Act of 1934 and the Investment Company Act of 1940, the Registrant has duly caused this Report to be signed on its behalf by the undersigned, thereunto duly authorized.
MAINSTAY VP FUNDS TRUST
| | |
| By: | | /s/ Kirk C. Lehneis |
| | Kirk C. Lehneis |
| | President and Principal Executive Officer |
| |
| Date: | | September 4, 2019 |
Pursuant to the requirements of the Securities Exchange Act of 1934 and the Investment Company Act of 1940, this Report has been signed below by the following persons on behalf of the Registrant and in the capacities and on the dates indicated.
| | |
| By: | | /s/ Kirk C. Lehneis |
| | Kirk C. Lehneis |
| | President and Principal Executive Officer |
| |
| Date: | | September 4, 2019 |
| |
| By: | | /s/ Jack R. Benintende |
| | Jack R. Benintende |
| | Treasurer and Principal Financial and Accounting Officer |
| |
| Date: | | September 4, 2019 |
EXHIBIT INDEX
| (a) | Certifications of principal executive officer and principal financial officer as required by Rule30a-2 under the Investment Company Act of 1940. |
| (b) | Certification of principal executive officer and principal financial officer as required by Section 906 of the Sarbanes-Oxley Act of 2002. |