UNITED STATES
SECURITIES AND EXCHANGE COMMISSION
Washington, D.C. 20549
FORM N-CSR
CERTIFIED SHAREHOLDER REPORT OF REGISTERED
MANAGEMENT INVESTMENT COMPANIES
Investment Company Act file number 811-06669
Name of Fund: BlackRock Capital Appreciation Fund, Inc.
Fund Address: 100 Bellevue Parkway, Wilmington, DE 19809
Name and address of agent for service: John M. Perlowski, Chief Executive Officer, BlackRock Capital Appreciation Fund, Inc., 55 East 52nd Street, New York, NY 10055
Registrant’s telephone number, including area code: (800) 441-7762
Date of fiscal year end: 09/30/2011
Date of reporting period: 03/31/2011
| | | | |
| Item 1 | | – | | Report to Stockholders |
| | |
 | | March 31, 2011 |
Semi-Annual Report (Unaudited)
BlackRock Capital Appreciation Fund, Inc.
Not FDIC Insured ¡ No Bank Guarantee ¡ May Lose Value
Table of Contents
| | | | | | |
| 2 | | BLACKROCK CAPITAL APPRECIATION FUND, INC. | | MARCH 31, 2011 | | |
Dear Shareholder
Over the past 12 months, we have seen a sluggish, stimulus-driven economic recovery at long last gain real traction, accelerate, and transition into a consumption-driven expansion. For the most part, 2010 was plagued with widely fluctuating economic data, but as the year drew to a close, it became clear that cyclical stimulus had beaten out structural problems as economic data releases generally became more positive and financial markets showed signs of continuing improvement. Although the sovereign debt crises and emerging market inflation that troubled the global economy in 2010 remain a challenge today, overall investor sentiment had improved considerably. In the first quarter of 2011, significant global events gave rise to new concerns about the future of the global economy. Political turmoil spread across the Middle East/North Africa (“MENA”) region, oil and other commodity prices soared, and markets recoiled as the nuclear crisis unfolded in the wake of a 9.0-magnitude earthquake and tsunami that struck Japan in March. These events shook investor confidence, but the global economic recovery would not be derailed.
In the United States, strength from the corporate sector and increasing consumer spending have been key drivers of economic growth, while the housing and labor markets have been the heaviest burdens. While housing has yet to show any meaningful sign of improvement, labor statistics have become increasingly positive in recent months.
Global equity markets experienced uneven growth and high volatility over the course of 2010, but ended the year strong. Following a strong start to 2011, the aforementioned headwinds brought high volatility back to equity markets. A pick up in inflationary pressures caused emerging market equities to underperform developed markets, where threats of inflation remained relatively subdued. Overall, equities posted strong returns for the 12-month period. US stocks outpaced most international markets and small cap stocks outperformed large caps as investors moved into higher-risk assets.
Fixed income markets saw yields trend lower over most of 2010, until the fourth quarter brought an abrupt reversal in sentiment and risk tolerance that drove yields sharply upward (pushing bond prices down) through year end. Improving economic data continued to pressure fixed income yields in 2011; however, escalating geopolitical risks have acted as a counterweight, restoring relative stability to yield movements. Global credit markets were surprisingly resilient in the face of major headwinds during the first quarter. Yield curves globally remained steep by historical standards and higher-risk sectors continued to outperform higher-quality assets.
The tax-exempt municipal market enjoyed a powerful rally during the period of low interest rates in 2010; however, when the yield trend reversed, the market was dealt an additional blow as it became evident that the Build America Bond program would expire at year end. In addition, negative headlines regarding fiscal challenges faced by state and local governments damaged investor confidence and further heightened volatility in the municipal market. Tax-exempt mutual funds experienced heavy outflows, resulting in wider quality spreads and further downward pressure on municipal bond prices. These headwinds began to abate in 2011 and the tax-exempt municipal market staged a mild rebound in the first quarter.
Cash investments, as represented by the 3-month Treasury bill, returned only a fraction over 0% for the 12-month period as short-term interest rates remained low. Yields on money market securities remain near all-time lows.
| | | | | | | | | | |
Total Returns as of March 31, 2011 | | 6-month | | 12-month |
US large cap equities (S&P 500 Index) | | | | 17.31 | % | | | | 15.65 | % |
US small cap equities (Russell 2000 Index) | | | | 25.48 | | | | | 25.79 | |
International equities (MSCI Europe, Australasia, Far East Index) | | | | 10.20 | | | | | 10.42 | |
3-month Treasury bill (BofA Merrill Lynch 3-Month Treasury Bill Index) | | | | 0.09 | | | | | 0.16 | |
US Treasury securities (BofA Merrill Lynch 10-Year US Treasury Index) | | | | (5.90 | ) | | | | 6.52 | |
US investment grade bonds (Barclays Capital US Aggregate Bond Index) | | | | (0.88 | ) | | | | 5.12 | |
Tax-exempt municipal bonds (Barclays Capital Municipal Bond Index) | | | | (3.68 | ) | | | | 1.63 | |
US high yield bonds (Barclays Capital US Corporate High Yield 2% Issuer Capped Index) | | | | 7.24 | | | | | 14.26 | |
Past performance is no guarantee of future results. Index performance shown for illustrative purposes only. You cannot invest directly in an index.
While no one can peer into a crystal ball and eliminate the uncertainties presented by the economic landscape and financial markets, BlackRock can offer investors the next best thing: partnership with the world’s largest asset management firm and a unique global perspective that allows us to identify trends early and capitalize on market opportunities. For additional market perspective and investment insight, visit www.blackrock.com/shareholdermagazine, where you’ll find the most recent issue of our award-winning Shareholder® magazine, as well as its quarterly companion newsletter, Shareholder Perspectives. As always, we thank you for entrusting BlackRock with your investments, and we look forward to your continued partnership in the months and years ahead.
|
| Sincerely, |
|
 |
| Rob Kapito |
| President, BlackRock Advisors, LLC |
| | | | | | |
| | | THIS PAGE NOT PART OF YOUR FUND REPORT | | 3 |
| | |
| Fund Summary as of March 31, 2011 | | |
Investment Objective
BlackRock Capital Appreciation Fund, Inc.’s (the “Fund”) investment objective is to seek long-term growth of capital.
Portfolio Management Commentary
How did the Fund perform?
| | • | | The Fund delivered positive, double-digit returns for the six-month period ended March 31, 2011. The Fund’s Investor A, BlackRock and Institutional Shares slightly outperformed the benchmark, the Russell 1000 Growth Index, while the Investor B, Investor C and Class R Shares slightly underperformed the benchmark. All of the Fund’s share classes outperformed the broad-market S&P 500 Index. |
What factors influenced performance?
| | • | | The strongest contribution to the Fund’s positive performance for the period came from stock selection in the energy sector, where the Fund’s holdings, collectively, rose approximately 60%. Shares of coal miner Massey Energy Co. surged on the speculated and eventually announced acquisition of the company at a large premium by Alpha Natural Resources, Inc. As the price of oil rallied from $80 to more than $105 per barrel, oil services holdings Schlumberger Ltd. and Halliburton Co. rose sharply on expectations of an increase in drilling activity. In the information technology (“IT”) sector, the Fund’s investments in communications equipment (namely, QUALCOMM, Inc. and Alcatel-Lucent-ADR) and software (Check Point Software Technologies Ltd.) powered the Fund’s outperformance in the sector versus the benchmark composition. The Fund’s avoidance of Cisco Systems, Inc. and an underweight position in Microsoft Corp. also proved beneficial as both of the mega-cap technology companies significantly underperformed the broader IT sector. Stock selection in consumer staples also contributed positively, with the Fund’s investment in Whole Foods Market, Inc. rising sharply during the period. |
| | • | | The Fund’s sector positioning relative to the benchmark Russell 1000 Growth Index detracted from performance during the period. Underweight positions in energy and materials had a negative impact as these sectors posted the largest gains in the index on the back of strong commodity price appreciation. Stock selection in the industrials sector had a negative impact on performance. The Fund’s airline holdings declined despite the positive market environment. Delta Air Lines, Inc. and United Continental Holdings, Inc. came under pressure as oil prices soared and investors began to anticipate the effect that elevated oil prices would have on future airline profitability. |
Describe recent portfolio activity.
| | • | | As a result of market appreciation and trading activity during the six-month period, the Fund’s weightings in energy and industrials increased at the expense of consumer discretionary and financials. |
Describe Fund positioning at period end.
| | • | | At period end, the Fund’s notable sector overweights relative to the Russell 1000 Growth Index were in IT and industrials, while underweights were in energy and materials. |
The views expressed reflect the opinions of BlackRock as of the date of this report and are subject to change based on changes in market, economic or other conditions. These views are not intended to be a forecast of future events and are no guarantee of future results.
Portfolio Information
| | | | | |
Ten Largest Holdings | | Percent of
Long-Term
Investments |
Apple, Inc. | | | | 6 | % |
QUALCOMM, Inc. | | | | 4 | |
The Boeing Co. | | | | 3 | |
Schlumberger Ltd. | | | | 3 | |
Oracle Corp. | | | | 3 | |
Google, Inc., Class A | | | | 3 | |
The Procter & Gamble Co. | | | | 3 | |
Danaher Corp. | | | | 3 | |
Anadarko Petroleum Corp. | | | | 3 | |
Amazon.com, Inc. | | | | 2 | |
| | | | | |
Sector Allocation | | Percent of
Long-Term
Investments |
Information Technology | | | | 35 | % |
Industrials | | | | 16 | |
Consumer Discretionary | | | | 16 | |
Health Care | | | | 11 | |
Energy | | | | 9 | |
Consumer Staples | | | | 7 | |
Materials | | | | 2 | |
Financials | | | | 2 | |
Telecommunication Services | | | | 2 | |
For Fund compliance purposes, the Fund’s sector classifications refer to any one or more of the sector sub-classifications used by one or more widely recognized market indexes or ratings group indexes, and/or as defined by Fund management. These definitions may not apply for purposes of this report, which may combine sector sub-classifications for reporting ease.
| | | | | | |
| 4 | | BLACKROCK CAPITAL APPRECIATION FUND, INC. | | MARCH 31, 2011 | | |
Total Return Based on a $10,000 Investment
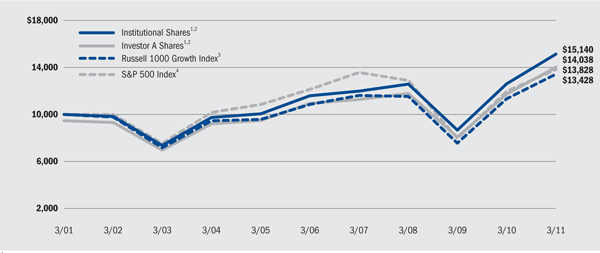
| | 1 | Assuming maximum sales charge, if any, transaction costs and other operating expenses, including investment advisory fees. Institutional Shares do not have a sales charge. |
| | 2 | The Fund invests primarily in equity securities with a particular emphasis on US companies that have exhibited above-average growth rates in earnings over the long term. |
| | 3 | An index composed of those Russell 1000 securities with greater-than-average growth orientation, generally having higher price-to-book and price-to-earnings ratios, lower dividend yields and higher forecasted growth values. |
| | 4 | This unmanaged total return index covers 500 industrial, utility, transportation and financial companies of the US markets (mostly New York Stock Exchange (“NYSE”) issues) representing about 75% of NYSE market capitalization and 30% of NYSE issues. S&P 500 is a trademark of The McGraw-Hill Companies, Inc. |
Performance Summary for the Period Ended March 31, 2011
| | | | | | | | | | | | | | | | | | | | | | | | | | | | | | | | | | | |
| | | | | Average Annual Total Returns5 |
| | | | | 1 Year | | 5 Years | | 10 Years |
| | | 6-Month
Total Returns | | w/o sales
charge | | w/sales
charge | | w/o sales
charge | | w/sales
charge | | w/o sales
charge | | w/sales
charge |
BlackRock | | | | 18.89 | % | | | | 20.05 | % | | | | N/A | | | | | 5.63 | % | | | | N/A | | | | | 4.41 | % | | | | N/A | |
Institutional | | | | 18.79 | | | | | 19.91 | | | | | N/A | | | | | 5.46 | | | | | N/A | | | | | 4.23 | | | | | N/A | |
Investor A | | | | 18.69 | | | | | 19.60 | | | | | 13.33 | % | | | | 5.12 | | | | | 3.99 | % | | | | 4.01 | | | | | 3.45 | % |
Investor B | | | | 18.08 | | | | | 18.51 | | | | | 14.01 | | | | | 4.24 | | | | | 3.90 | | | | | 3.39 | | | | | 3.39 | |
Investor C | | | | 18.15 | | | | | 18.59 | | | | | 17.59 | | | | | 4.39 | | | | | 4.39 | | | | | 3.27 | | | | | 3.27 | |
Class R | | | | 18.43 | | | | | 19.15 | | | | | N/A | | | | | 4.74 | | | | | N/A | | | | | 3.51 | | | | | N/A | |
Russell 1000 Growth Index | | | | 18.57 | | | | | 18.26 | | | | | N/A | | | | | 4.34 | | | | | N/A | | | | | 2.99 | | | | | N/A | |
S&P 500 Index | | | | 17.31 | | | | | 15.65 | | | | | N/A | | | | | 2.62 | | | | | N/A | | | | | 3.29 | | | | | N/A | |
| | 5 | Assuming maximum sales charges, if any. Average annual total returns with and without sales charges reflect reductions for distribution and service fees. See “About Fund Performance” on page 6 for a detailed description of share classes, including any related sales charges and fees. |
N/A—Not applicable as share class and index do not have a sales charge.
Past performance is not indicative of future results.
Expense Example
| | | | | | | | | | | | | | | | | | | | | | | | | | | | | | | | | | | |
| | | Actual | | Hypothetical7 | | |
| | | Beginning
Account Value
October 1,
2010 | | Ending
Account Value
March 31,
2011 | | Expenses
Paid During
the Period6 | | Beginning
Account Value
October 1,
2010 | | Ending
Account Value
March 31,
2011 | | Expenses
Paid During
the Period6 | | Annualized
Expense
Ratio |
BlackRock | | | $ | 1,000.00 | | | | $ | 1,188.90 | | | | $ | 3.93 | | | | $ | 1,000.00 | | | | $ | 1,021.34 | | | | $ | 3.63 | | | | | 0.72 | % |
Institutional | | | $ | 1,000.00 | | | | $ | 1,187.90 | | | | $ | 4.20 | | | | $ | 1,000.00 | | | | $ | 1,021.09 | | | | $ | 3.88 | | | | | 0.77 | % |
Investor A | | | $ | 1,000.00 | | | | $ | 1,186.90 | | | | $ | 5.78 | | | | $ | 1,000.00 | | | | $ | 1,019.65 | | | | $ | 5.34 | | | | | 1.06 | % |
Investor B | | | $ | 1,000.00 | | | | $ | 1,180.80 | | | | $ | 10.87 | | | | $ | 1,000.00 | | | | $ | 1,014.96 | | | | $ | 10.05 | | | | | 2.00 | % |
Investor C | | | $ | 1,000.00 | | | | $ | 1,181.50 | | | | $ | 10.39 | | | | $ | 1,000.00 | | | | $ | 1,015.41 | | | | $ | 9.60 | | | | | 1.91 | % |
Class R | | | $ | 1,000.00 | | | | $ | 1,184.30 | | | | $ | 7.57 | | | | $ | 1,000.00 | | | | $ | 1,018.00 | | | | $ | 6.99 | | | | | 1.39 | % |
| | 6 | For each class of the Fund, expenses are equal to the annualized expense ratio for the class multiplied by the average account value over the period, multiplied by 182/365 (to reflect the one-half year period shown). |
| | 7 | Hypothetical 5% annual return before expenses is calculated by pro rating the number of days in the most recent fiscal half year divided by 365. |
See “Disclosure of Expenses” on page 6 for further information on how expenses were calculated.
| | | | | | |
| | | BLACKROCK CAPITAL APPRECIATION FUND, INC. | | MARCH 31, 2011 | | 5 |
About Fund Performance
| | • | | BlackRock and Institutional Shares are not subject to any sales charge. BlackRock and Institutional Shares bear no ongoing distribution or service fees and are available only to eligible investors. Prior to June 28, 2010, BlackRock Shares’ performance results are those of the Institutional Shares of BlackRock Capital Appreciation Portfolio. Prior to June 28, 2010, Institutional Shares’ performance results are those of the BlackRock Shares restated to reflect the Institutional Shares’ fees. |
| | • | | Investor A Shares incur a maximum initial sales charge (front-end load) of 5.25% and a service fee of 0.25% per year (but no distribution fee). |
| | • | | Investor B Shares are subject to a maximum contingent deferred sales charge of 4.50% declining to 0% after six years. In addition, Investor B Shares are subject to a distribution fee of 0.75% per year and a service fee of 0.25% per year. Investor B Shares automatically convert to Investor A Shares after approximately eight years. (There is no initial sales charge for automatic share conversions.) All returns for periods greater than eight years reflect this conversion. Investor B Shares are only available through exchanges, dividend reinvestments by existing shareholders or for purchase by certain qualified employee benefit plans. |
| | • | | Investor C Shares are subject to a 1.00% contingent deferred sales charge if redeemed within one year of purchase. In addition, Investor C Shares are subject to a distribution fee of 0.75% per year and a service fee of 0.25% per year. |
| | • | | Class R Shares are not subject to any sales charge. Class R Shares are subject to a distribution fee of 0.25% per year and a service fee of 0.25% per year. Class R Shares are available only to certain retirement and other similar plans. Prior to June 28,2010, Class R Shares’ performance results are those of BlackRock Shares (which have no distribution or service fees) restated to reflect Class R Shares’ fees. |
Performance information reflects past performance and does not guarantee future results. Current performance may be lower or higher than the performance data quoted. Refer to www.blackrock.com/funds to obtain performance data current to the most recent month-end. Performance results do not reflect the deduction of taxes that a shareholder would pay on Fund distributions or the redemption of Fund shares. Figures shown in the performance tables on the previous page assume reinvestment of all dividends and distributions, if any, at net asset value on the payable date. Investment return and principal value of shares will fluctuate so that shares, when redeemed, may be worth more or less than their original cost.
Performance for the Fund for periods prior to June 28, 2010 is based on performance of BlackRock Capital Appreciation Portfolio, a series of BlackRockSM Funds (the “Predecessor Fund”), that reorganized with the Fund on that date.
Performance for the Fund for the periods prior to January 31, 2005 is based on performance of a certain former State Street Research mutual fund that reorganized with the Predecessor Fund on that date.
The Fund’s investment advisor waived and/or reimbursed a portion of the Fund’s expenses. Without such waiver and/or reimbursement, the Fund’s performance would have been lower. BlackRock Advisors, LLC has contractually agreed to waive fees and/or reimburse expenses until February 1, 2021. On February 1 of each year, the waiver agreement will renew automatically so that the agreement will have a perpetual ten year term. This agreement may be terminated upon 90 days’ notice by a majority of the Independent Directors or by a majority shareholder vote. Dividends paid to each class of shares will vary because of the different levels of service, distribution and transfer agency fees applicable to each class, which are deducted from the income available to be paid to shareholders.
Disclosure of Expenses
Shareholders of the Fund may incur the following charges: (a) expenses related to transactions, including sales charges and (b) operating expenses, including investment advisory fees, service and distribution fees, including 12b-1 fees, and other Fund expenses. The expense example on the previous page (which is based on a hypothetical investment of $1,000 invested on October 1, 2010 and held through March 31, 2011) is intended to assist shareholders both in calculating expenses based on an investment in the Fund and in comparing these expenses with similar costs of investing in other mutual funds.
The table provides information about actual account values and actual expenses. In order to estimate the expenses a shareholder paid during the period covered by this report, shareholders can divide their account value by $1,000 and then multiply the result by the number corresponding to their share class under the heading entitled “Expenses Paid During the Period.”
The table also provides information about hypothetical account values and hypothetical expenses based on the Fund’s actual expense ratio and an assumed rate of return of 5% per year before expenses. In order to assist shareholders in comparing the ongoing expenses of investing in the Fund and other funds, compare the 5% hypothetical example with the 5% hypothetical examples that appear in other funds’ shareholder reports.
The expenses shown in the table are intended to highlight shareholders’ ongoing costs only and do not reflect any transactional expenses, such as sales charges. Therefore, the hypothetical examples are useful in comparing ongoing expenses only, and will not help shareholders determine the relative total expenses of owning different funds. If these transactional expenses were included, shareholder expenses would have been higher.
| | | | | | |
| 6 | | BLACKROCK CAPITAL APPRECIATION FUND, INC. | | MARCH 31, 2011 | | |
| | |
| Schedule of Investments March 31, 2011 (Unaudited) | | |
| | (Percentages shown are based on Net Assets) |
| | | | | | | | | | |
Common Stocks | | Shares | | Value |
Aerospace & Defense – 4.8% | | | | | | | | | | |
The Boeing Co. | | | | 2,121,900 | | | | $ | 156,872,067 | |
General Dynamics Corp. | | | | 1,011,600 | | | | | 77,448,096 | |
| | | | | | | | | | |
| | | | | | | | | 234,320,163 | |
| | | | | | | | | | |
Air Freight & Logistics – 1.7% | | | | | | | | | | |
United Parcel Service, Inc., Class B | | | | 1,114,700 | | | | | 82,844,504 | |
| | | | | | | | | | |
Airlines – 2.0% | | | | | | | | | | |
Delta Air Lines, Inc. (a) | | | | 6,498,400 | | | | | 63,684,320 | |
United Continental Holdings, Inc. (a)(b) | | | | 1,423,300 | | | | | 32,721,667 | |
| | | | | | | | | | |
| | | | | | | | | 96,405,987 | |
| | | | | | | | | | |
Auto Components – 1.4% | | | | | | | | | | |
BorgWarner, Inc. (a) | | | | 329,100 | | | | | 26,225,979 | |
Johnson Controls, Inc. | | | | 1,060,000 | | | | | 44,064,200 | |
| | | | | | | | | | |
| | | | | | | | | 70,290,179 | |
| | | | | | | | | | |
Automobiles – 2.1% | | | | | | | | | | |
Ford Motor Co. (a)(b) | | | | 2,088,200 | | | | | 31,135,062 | |
General Motors Co. (a)(b) | | | | 1,920,300 | | | | | 59,586,909 | |
Tesla Motors, Inc. (a) | | | | 487,300 | | | | | 13,498,210 | |
| | | | | | | | | | |
| | | | | | | | | 104,220,181 | |
| | | | | | | | | | |
Beverages – 2.3% | | | | | | | | | | |
The Coca-Cola Co. | | | | 1,689,854 | | | | | 112,121,813 | |
| | | | | | | | | | |
Biotechnology – 2.9% | | | | | | | | | | |
Alexion Pharmaceuticals, Inc. (a) | | | | 506,200 | | | | | 49,951,816 | |
Dendreon Corp. (a) | | | | 1,556,300 | | | | | 58,252,309 | |
Vertex Pharmaceuticals, Inc. (a) | | | | 725,600 | | | | | 34,778,008 | |
| | | | | | | | | | |
| | | | | | | | | 142,982,133 | |
| | | | | | | | | | |
Capital Markets – 0.8% | | | | | | | | | | |
Jefferies Group, Inc. (b) | | | | 1,646,800 | | | | | 41,071,192 | |
| | | | | | | | | | |
Chemicals – 1.3% | | | | | | | | | | |
Monsanto Co. | | | | 893,500 | | | | | 64,564,310 | |
| | | | | | | | | | |
Communications Equipment – 6.2% | | | | | | | | | | |
Acme Packet, Inc. (a) | | | | 169,500 | | | | | 12,027,720 | |
Alcatel-Lucent - ADR (a) | | | | 9,042,200 | | | | | 52,535,182 | |
Juniper Networks, Inc. (a) | | | | 1,106,900 | | | | | 46,578,352 | |
QUALCOMM, Inc. | | | | 3,503,100 | | | | | 192,074,973 | |
| | | | | | | | | | |
| | | | | | | | | 303,216,227 | |
| | | | | | | | | | |
Computers & Peripherals – 7.7% | | | | | | | | | | |
Apple, Inc. (a) | | | | 896,058 | | | | | 312,231,410 | |
NetApp, Inc. (a) | | | | 1,361,000 | | | | | 65,572,980 | |
| | | | | | | | | | |
| | | | | | | | | 377,804,390 | |
| | | | | | | | | | |
Construction & Engineering – 1.2% | | | | | | | | | | |
Fluor Corp. | | | | 781,600 | | | | | 57,572,656 | |
| | | | | | | | | | |
Diversified Financial Services – 1.5% | | | | | | | | | | |
Moody’s Corp. (b) | | | | 2,162,200 | | | | | 73,320,202 | |
| | | | | | | | | | |
Diversified Telecommunication Services – 1.3% | | | | | | | | | | |
Verizon Communications, Inc. | | | | 1,681,200 | | | | | 64,793,448 | |
| | | | | | | | | | |
Energy Equipment & Services – 4.4% | | | | | | | | | | |
Halliburton Co. | | | | 1,294,500 | | | | | 64,517,880 | |
Schlumberger Ltd. | | | | 1,628,117 | | | | | 151,838,191 | |
| | | | | | | | | | |
| | | | | | | | | 216,356,071 | |
| | | | | | | | | | |
Food & Staples Retailing – 1.7% | | | | | | | | | | |
Whole Foods Market, Inc. | | | | 1,236,300 | | | | | 81,472,170 | |
| | | | | | | | | | |
Health Care Equipment & Supplies – 1.0% | | | | | | | | | | |
St. Jude Medical, Inc. | | | | 920,800 | | | | | 47,200,208 | |
| | | | | | | | | | |
Health Care Providers & Services – 3.4% | | | | | | | | | | |
AmerisourceBergen Corp. | | | | 854,100 | | | | | 33,788,196 | |
Express Scripts, Inc. (a) | | | | 1,475,500 | | | | | 82,052,555 | |
Lincare Holdings, Inc. | | | | 1,830,100 | | | | | 54,280,766 | |
| | | | | | | | | | |
| | | | | | | | | 170,121,517 | |
| | | | | | | | | | |
Health Care Technology – 1.3% | | | | | | | | | | |
Cerner Corp. (a)(b) | | | | 597,500 | | | | | 66,442,000 | |
| | | | | | | | | | |
Hotels, Restaurants & Leisure – 4.2% | | | | | | | | | | |
Ctrip.com International Ltd. - ADR (a) | | | | 610,200 | | | | | 25,317,198 | |
Las Vegas Sands Corp. (a)(b) | | | | 1,721,400 | | | | | 72,677,508 | |
Starbucks Corp. | | | | 1,833,580 | | | | | 67,750,781 | |
Starwood Hotels & Resorts Worldwide, Inc. | | | | 736,390 | | | | | 42,798,987 | |
| | | | | | | | | | |
| | | | | | | | | 208,544,474 | |
| | | | | | | | | | |
Household Durables – 1.1% | | | | | | | | | | |
Stanley Black & Decker, Inc. | | | | 739,600 | | | | | 56,653,360 | |
| | | | | | | | | | |
Household Products – 2.8% | | | | | | | | | | |
The Procter & Gamble Co. | | | | 2,226,086 | | | | | 137,126,898 | |
| | | | | | | | | | |
Internet & Catalog Retail – 3.3% | | | | | | | | | | |
Amazon.com, Inc. (a) | | | | 647,440 | | | | | 116,623,367 | |
NetFlix, Inc. (a)(b) | | | | 189,600 | | | | | 44,997,768 | |
| | | | | | | | | | |
| | | | | | | | | 161,621,135 | |
| | | | | | | | | | |
Internet Software & Services – 4.1% | | | | | | | | | | |
Baidu, Inc. - ADR (a) | | | | 422,600 | | | | | 58,238,506 | |
Google, Inc., Class A (a) | | | | 246,354 | | | | | 144,415,178 | |
| | | | | | | | | | |
| | | | | | | | | 202,653,684 | |
| | | | | | | | | | |
IT Services – 3.2% | | | | | | | | | | |
Accenture Plc | | | | 965,400 | | | | | 53,068,038 | |
Cognizant Technology Solutions Corp., Class A (a) | | | | 792,200 | | | | | 64,485,080 | |
VeriFone Systems, Inc. (a)(b) | | | | 722,600 | | | | | 39,706,870 | |
| | | | | | | | | | |
| | | | | | | | | 157,259,988 | |
| | | | | | | | | | |
Life Sciences Tools & Services – 1.3% | | | | | | | | | | |
Covance, Inc. (a)(b) | | | | 1,202,300 | | | | | 65,789,856 | |
| | | | | | | | | | |
Machinery – 4.9% | | | | | | | | | | |
Caterpillar, Inc. | | | | 292,800 | | | | | 32,603,280 | |
Danaher Corp. | | | | 2,592,744 | | | | | 134,563,414 | |
Joy Global, Inc. | | | | 323,100 | | | | | 31,925,511 | |
Terex Corp. (a) | | | | 1,100,900 | | | | | 40,777,336 | |
| | | | | | | | | | |
| | | | | | | | | 239,869,541 | |
| | | | | | | | | | |
Media – 1.5% | | | | | | | | | | |
The Walt Disney Co. | | | | 1,695,500 | | | | | 73,059,095 | |
| | | | | | | | | | |
Portfolio Abbreviation
| | |
| ADR | | American Depositary Receipts |
See Notes to Financial Statements.
| | | | | | |
| | | BLACKROCK CAPITAL APPRECIATION FUND, INC. | | MARCH 31, 2011 | | 7 |
| | |
| Schedule of Investments (continued) | | |
| | (Percentages shown are based on Net Assets) |
| | | | | | | | | | |
Common Stocks | | Shares | | Value |
Metals & Mining – 1.0% | | | | | | | | | | |
Freeport-McMoRan Copper & Gold, Inc. | | | | 913,374 | | | | $ | 50,737,926 | |
| | | | | | | | | | |
Oil, Gas & Consumable Fuels – 4.7% | | | | | | | | | | |
Anadarko Petroleum Corp. | | | | 1,474,600 | | | | | 120,799,232 | |
Massey Energy Co. | | | | 1,597,826 | | | | | 109,227,385 | |
| | | | | | | | | | |
| | | | | | | | | 230,026,617 | |
| | | | | | | | | | |
Pharmaceuticals – 1.1% | | | | | | | | | | |
Allergan, Inc. | | | | 746,000 | | | | | 52,980,920 | |
| | | | | | | | | | |
Professional Services – 1.2% | | | | | | | | | | |
Manpower, Inc. | | | | 968,800 | | | | | 60,918,144 | |
| | | | | | | | | | |
Semiconductors & Semiconductor Equipment – 3.0% | | | | | | | | | | |
Broadcom Corp., Class A | | | | 1,556,367 | | | | | 61,289,732 | |
Micron Technology, Inc. (a) | | | | 5,875,430 | | | | | 67,332,428 | |
NVIDIA Corp. (a) | | | | 1,050,200 | | | | | 19,386,692 | |
| | | | | | | | | | |
| | | | | | | | | 148,008,852 | |
| | | | | | | | | | |
Software – 9.8% | | | | | | | | | | |
Check Point Software Technologies Ltd. (a) | | | | 1,697,415 | | | | | 86,653,036 | |
Microsoft Corp. | | | | 1,517,742 | | | | | 38,489,937 | |
Oracle Corp. | | | | 4,345,400 | | | | | 145,005,998 | |
Red Hat, Inc. (a) | | | | 1,565,400 | | | | | 71,053,506 | |
Salesforce.com, Inc. (a)(b) | | | | 670,509 | | | | | 89,566,592 | |
VMware, Inc., Class A (a)(b) | | | | 639,000 | | | | | 52,104,060 | |
| | | | | | | | | | |
| | | | | | | | | 482,873,129 | |
| | | | | | | | | | |
Specialty Retail – 1.7% | | | | | | | | | | |
The Home Depot, Inc. | | | | 2,288,900 | | | | | 84,826,634 | |
| | | | | | | | | | |
Wireless Telecommunication Services – 0.7% | | | | | | | | | | |
NII Holdings, Inc. (a) | | | | 854,300 | | | | | 35,598,681 | |
| | | | | | | | | | |
Total Long-Term Investments
(Cost — $3,698,303,109) – 98.6% | | | | | | | | | 4,855,668,285 | |
| | | | | | | | | | |
| | |
Short-Term Securities | | | | |
BlackRock Liquidity Funds, TempFund, Institutional Class, 0.14% (c)(d) | | | | 96,539,110 | | | | | 96,539,110 | |
| | | | | | | | | | |
| | |
| | | Beneficial
Interest
(000) | | |
BlackRock Liquidity Series, LLC Money Market Series, 0.43% (c)(d)(e) | | | $ | 266,008 | | | | | 266,008,050 | |
| | | | | | | | | | |
Total Short-Term Securities
(Cost — $362,547,160) – 7.3% | | | | | | | | | 362,547,160 | |
| | | | | | | | | | |
Total Investments
(Cost — $4,060,850,269*) – 105.9% | | | | | | | | | 5,218,215,445 | |
Liabilities in Excess of Other Assets – (5.9)% | | | | | | | | | (292,394,569 | ) |
| | | | | | | | | | |
Net Assets – 100.0% | | | | | | | | $ | 4,925,820,876 | |
| | | | | | | | | | |
| * | The cost and unrealized appreciation (depreciation) of investments as of March 31, 2011, as computed for federal income tax purposes, were as follows: |
| | | | | |
Aggregate cost | | | $ | 4,078,631,470 | |
| | | | | |
Gross unrealized appreciation | | | $ | 1,153,277,665 | |
Gross unrealized depreciation | | | | (13,693,690 | ) |
| | | | | |
Net unrealized appreciation | | | $ | 1,139,583,975 | |
| | | | | |
| (a) | Non-income producing security. |
| (b) | Security, or a portion of security, is on loan. |
| (c) | Investments in companies considered to be an affiliate of the Fund during the period, for purposes of Section 2(a)(3) of the Investment Company Act of 1940, as amended, were as follows: |
| | | | | | | | | | | | | | | | | | | | | | | | | |
Affiliate | | Shares/
Beneficial
Interest
Held at
September 30,
2010 | | Net Activity | | Shares/
Beneficial
Interest
Held at
March 31,
2011 | | Realized
Gain | | Income |
BlackRock Liquidity Funds, TempFund, Institutional Class | | | | 13,327,636 | | | | | 83,211,474 | | | | | 96,539,110 | | | | $ | 489 | | | | $ | 53,006 | |
BlackRock Liquidity Series, LLC Money Market Series | | | $ | 378,305,550 | | | | $ | (112,297,500 | ) | | | $ | 266,008,050 | | | | | – | | | | $ | 246,940 | |
| (d) | Represents the current yield as of report date. |
| (e) | Security was purchased with the cash collateral from loaned securities. |
See Notes to Financial Statements.
| | | | | | |
| 8 | | BLACKROCK CAPITAL APPRECIATION FUND, INC. | | MARCH 31, 2011 | | |
| | |
| Schedule of Investments (concluded) | | |
| | |
| | • | | For Fund compliance purposes, the Fund’s industry classifications refer to any one or more of the industry sub-classifications used by one or more widely recognized market indexes or ratings group indexes, and/or as defined by Fund management. These definitions may not apply for purposes of this report, which may combine industry sub-classifications for reporting ease. |
| | • | | Fair Value Measurements – Various inputs are used in determining the fair value of investments. These inputs are summarized in three broad levels for financial statement purposes as follows: |
| | • | | Level 1 – price quotations in active markets/exchanges for identical assets and liabilities |
| | • | | Level 2 – other observable inputs (including, but not limited to: quoted prices for similar assets or liabilities in markets that are active, quoted prices for identical or similar assets or liabilities in markets that are not active, inputs other than quoted prices that are observable for the assets or liabilities (such as interest rates, yield curves, volatilities, prepayment speeds, loss severities, credit risks and default rates) or other market–corroborated inputs) |
| | • | | Level 3 – unobservable inputs based on the best information available in the circumstances, to the extent observable inputs are not available (including the Fund’s own assumptions used in determining the fair value of investments) |
The inputs or methodologies used for valuing securities are not necessarily an indication of the risk associated with investing in those securities. For information about the Fund’s policy regarding valuation of investments and other significant accounting policies, please refer to Note 1 of the Notes to Financial Statements.
The following table summarizes the inputs used as of March 31, 2011 in determining the fair valuation of the Fund’s investments:
| | | | | | | | | | | | | | | | |
Valuation Inputs | | Level 1 | | | Level 2 | | | Level 3 | | | Total | |
Assets: | | | | | | | | | | | | | | | | |
Investments: | | | | | | | | | | | | | | | | |
Long-Term Investments1 | | $ | 4,855,668,285 | | | | – | | | | – | | | $ | 4,855,668,285 | |
Short-Term Securities | | | 96,539,110 | | | $ | 266,008,050 | | | | – | | | | 362,547,160 | |
| | | | | | | | | | | | | | | | |
Total | | $ | 4,952,207,395 | | | $ | 266,008,050 | | | | – | | | $ | 5,218,215,445 | |
| | | | | | | | | | | | | | | | |
| 1 | See above Schedule of Investments for values in each industry. |
See Notes to Financial Statements.
| | | | | | |
| | | BLACKROCK CAPITAL APPRECIATION FUND, INC. | | MARCH 31, 2011 | | 9 |
Statement of Assets and Liabilities
| | | | | |
March 31, 2011 (Unaudited) | | |
Assets | | | | | |
Investments at value – unaffiliated (including securities loaned at value of $258,012,877) (cost – $3,698,303,109) | | | $ | 4,855,668,285 | |
Investments at value – affiliated (cost – $362,547,160) | | | | 362,547,160 | |
Cash | | | | 92,876 | |
Investments sold receivable | | | | 68,314,342 | |
Capital shares sold receivable | | | | 40,502,918 | |
Dividends receivable | | | | 1,697,492 | |
Receivable from advisor | | | | 387 | |
Prepaid expenses | | | | 134,961 | |
| | | | | |
Total assets | | | | 5,328,958,421 | |
| | | | | |
Liabilities | | | | | |
Collateral on securities loaned at value | | | | 266,008,050 | |
Investments purchased payable | | | | 122,799,187 | |
Capital shares redeemed payable | | | | 9,128,825 | |
Investment advisory fees payable | | | | 2,418,872 | |
Service and distribution fees payable | | | | 1,185,542 | |
Other affiliates payable | | | | 43,791 | |
Officer’s and Directors’ fees payable | | | | 26,936 | |
Other accrued expenses payable | | | | 1,526,342 | |
| | | | | |
Total liabilities | | | | 403,137,545 | |
| | | | | |
Net Assets | | | $ | 4,925,820,876 | |
| | | | | |
Net Assets Consist of | | | | | |
Paid-in capital | | | $ | 5,227,325,459 | |
Accumulated net investment loss | | | | (6,351,151 | ) |
Accumulated net realized loss | | | | (1,452,518,608 | ) |
Net unrealized appreciation/depreciation | | | | 1,157,365,176 | |
| | | | | |
Net Assets | | | $ | 4,925,820,876 | |
| | | | | |
Net Asset Value | | | | | |
BlackRock – Based on net assets of $882,190,312 and 35,578,807 shares outstanding, 300,000,000 shares authorized, $0.10 par value | | | $ | 24.80 | |
| | | | | |
Institutional – Based on net assets of $932,812,340 and 37,640,914 shares outstanding, 300,000,000 shares authorized, $0.10 par value | | | $ | 24.78 | |
| | | | | |
Investor A – Based on net assets of $2,156,399,868 and 90,087,886 shares outstanding, 300,000,000 shares authorized, $0.10 par value | | | $ | 23.94 | |
| | | | | |
Investor B – Based on net assets of $152,449,308 and 7,225,529 shares outstanding, 500,000,000 shares authorized, $0.10 par value | | | $ | 21.10 | |
| | | | | |
Investor C – Based on net assets of $705,157,526 and 33,228,204 shares outstanding, 300,000,000 shares authorized, $0.10 par value | | | $ | 21.22 | |
| | | | | |
Class R – Based on net assets of $96,811,522 and 4,404,532 shares outstanding, 500,000,000 shares authorized, $0.10 par value | | | $ | 21.98 | |
| | | | | |
See Notes to Financial Statements.
| | | | | | |
| 10 | | BLACKROCK CAPITAL APPRECIATION FUND, INC. | | MARCH 31, 2011 | | |
Statement of Operations
| | | | | |
Six Months Ended March 31, 2011 (Unaudited) | | |
Investment Income | | | | | |
Dividends | | | $ | 18,663,507 | |
Securities lending – affiliated | | | | 246,940 | |
Dividends – affiliated | | | | 53,006 | |
Interest | | | | 15,988 | |
| | | | | |
Total income | | | | 18,979,441 | |
| | | | | |
Expenses | | | | | |
Investment advisory | | | | 13,209,455 | |
Service and distribution – class specific | | | | 6,721,601 | |
Transfer agent – class specific | | | | 3,683,416 | |
Administration | | | | 249,315 | |
Printing | | | | 123,375 | |
Custodian | | | | 84,507 | |
Registration | | | | 50,664 | |
Professional | | | | 46,045 | |
Officer and Directors | | | | 41,760 | |
Miscellaneous | | | | 32,645 | |
| | | | | |
Total expenses | | | | 24,242,783 | |
Less fees waived by advisor | | | | (22,783 | ) |
Less transfer agent fees waived – class specific | | | | (724 | ) |
Less transfer agent fees reimbursed – class specific | | | | (33,665 | ) |
Less fees paid indirectly | | | | (735 | ) |
| | | | | |
Total expenses after fees waived, reimbursed and paid indirectly | | | | 24,184,876 | |
| | | | | |
Net investment loss | | | | (5,205,435 | ) |
| | | | | |
Realized and Unrealized Gain | | | | | |
Net realized gain from investments | | | | 201,792,545 | |
Net change in unrealized appreciation/depreciation on investments | | | | 510,708,818 | |
| | | | | |
Total realized and unrealized gain | | | | 712,501,363 | |
| | | | | |
Net Increase in Net Assets Resulting from Operations | | | $ | 707,295,928 | |
| | | | | |
See Notes to Financial Statements.
| | | | | | |
| | | BLACKROCK CAPITAL APPRECIATION FUND, INC. | | MARCH 31, 2011 | | 11 |
Statements of Changes in Net Assets
| | | | | | | | | | |
Increase in Net Assets: | | Six Months
Ended
March 31,
2011
(Unaudited) | | Year Ended
September 30,
20101 |
Operations | | | | | | | | | | |
Net investment loss | | | $ | (5,205,435 | ) | | | $ | (2,809,962 | ) |
Net realized gain | | | | 201,792,545 | | | | | 29,639,438 | |
Net change in unrealized appreciation/depreciation | | | | 510,708,818 | | | | | 229,434,550 | |
| | | | | | | | | | |
Net increase in net assets resulting from operations | | | | 707,295,928 | | | | | 256,264,026 | |
| | | | | | | | | | |
Dividends to Shareholders From | | | | | | | | | | |
Net investment income: | | | | | | | | | | |
BlackRock | | | | – | | | | | (1,050,157 | ) |
Investor A | | | | – | | | | | (49,881 | ) |
| | | | | | | | | | |
Decrease in net assets resulting from dividends to shareholders | | | | – | | | | | (1,100,038 | ) |
| | | | | | | | | | |
Capital Share Transactions | | | | | | | | | | |
Net increase in net assets derived from capital share transactions | | | | 759,236,580 | | | | | 2,808,379,751 | |
| | | | | | | | | | |
Net Assets | | | | | | | | | | |
Total increase in net assets | | | | 1,466,532,508 | | | | | 3,063,543,739 | |
Beginning of period | | | | 3,459,288,368 | | | | | 395,744,629 | |
| | | | | | | | | | |
End of period | | | $ | 4,925,820,876 | | | | $ | 3,459,288,368 | |
| | | | | | | | | | |
Accumulated net investment loss | | | $ | (6,351,151 | ) | | | $ | (1,145,716 | ) |
| | | | | | | | | | |
| 1 | On June 28, 2010, BlackRock Capital Appreciation Portfolio was reorganized into the Fund. The activity in the table presented above is for the accounting survivor, BlackRock Capital Appreciation Portfolio, for the periods prior to the date of the reorganization, and for the post-reorganization fund thereafter. See Note 1 in the Notes to Financial Statements. |
See Notes to Financial Statements.
| | | | | | |
| 12 | | BLACKROCK CAPITAL APPRECIATION FUND, INC. | | MARCH 31, 2011 | | |
| | | | | | | | | | | | | | | | | | | | | | | | | | | | | | |
| | | BlackRock Shares1 |
| | Six Months
Ended
March 31, 2011
(Unaudited) | | Year Ended September 30, |
| | | 2010 | | 2009 | | 2008 | | 2007 | | 2006 |
Per Share Operating Performance | | | | | | | | | | | | | | | | | | | | | | | | | | | | | | |
Net asset value, beginning of period | | | $ | 20.86 | | | | $ | 18.72 | | | | $ | 18.94 | | | | $ | 22.62 | | | | $ | 18.52 | | | | $ | 17.63 | |
| | | | | | | | | | | | | | | | | | | | | | | | | | | | | | |
Net investment income2 | | | | 0.02 | | | | | 0.05 | | | | | 0.09 | | | | | 0.09 | | | | | 0.07 | | | | | 0.00 | 3 |
Net realized and unrealized gain (loss) | | | | 3.92 | | | | | 2.16 | | | | | (0.31 | ) | | | | (3.77 | )4 | | | | 4.03 | | | | | 0.89 | 4 |
| | | | | | | | | | | | | | | | | | | | | | | | | | | | | | |
Net increase (decrease) from investment operations | | | | 3.94 | | | | | 2.21 | | | | | (0.22 | ) | | | | (3.68 | ) | | | | 4.10 | | | | | 0.89 | |
| | | | | | | | | | | | | | | | | | | | | | | | | | | | | | |
Dividends from net investment income | | | | – | | | | | (0.07 | ) | | | | – | | | | | – | | | | | – | | | | | – | |
| | | | | | | | | | | | | | | | | | | | | | | | | | | | | | |
Net asset value, end of period | | | $ | 24.80 | | | | $ | 20.86 | | | | $ | 18.72 | | | | $ | 18.94 | | | �� | $ | 22.62 | | | | $ | 18.52 | |
| | | | | | | | | | | | | | | | | | | | | | | | | | | | | | |
Total Investment Return5 | | | | | | | | | | | | | | | | | | | | | | | | | | | | | | |
Based on net asset value | | | | 18.89 | %6 | | | | 11.93 | % | | | | (1.18 | )%7 | | | | (16.26 | )%8 | | | | 22.13 | % | | | | 5.07 | %8 |
| | | | | | | | | | | | | | | | | | | | | | | | | | | | | | |
Ratios to Average Net Assets | | | | | | | | | | | | | | | | | | | | | | | | | | | | | | |
Total expenses | | | | 0.73 | %9 | | | | 0.87 | % | | | | 0.92 | % | | | | 0.85 | % | | | | 0.88 | % | | | | 1.00 | % |
| | | | | | | | | | | | | | | | | | | | | | | | | | | | | | |
Total expenses after fees waived, reimbursed and paid indirectly | | | | 0.72 | %9 | | | | 0.72 | % | | | | 0.71 | % | | | | 0.70 | % | | | | 0.75 | % | | | | 0.95 | % |
| | | | | | | | | | | | | | | | | | | | | | | | | | | | | | |
Net investment income | | | | 0.16 | %9 | | | | 0.25 | % | | | | 0.59 | % | | | | 0.42 | % | | | | 0.38 | % | | | | 0.00 | %10 |
| | | | | | | | | | | | | | | | | | | | | | | | | | | | | | |
Supplemental Data | | | | | | | | | | | | | | | | | | | | | | | | | | | | | | |
Net assets, end of period (000) | | | $ | 882,190 | | | | $ | 292,967 | | | | $ | 192,614 | | | | $ | 77,323 | | | | $ | 71,072 | | | | $ | 48,146 | |
| | | | | | | | | | | | | | | | | | | | | | | | | | | | | | |
Portfolio turnover | | | | 37 | % | | | | 71 | % | | | | 87 | % | | | | 80 | % | | | | 97 | % | | | | 87 | % |
| | | | | | | | | | | | | | | | | | | | | | | | | | | | | | |
| | | | | | | | | | |
| | | Institutional Shares |
| | | Six Months
Ended
March 31, 2011
(Unaudited) | | Period
June 28,
201011 to
September 30,
2010 |
Per Share Operating Performance | | | | | | | | | | |
Net asset value, beginning of period | | | $ | 20.86 | | | | $ | 19.39 | |
| | | | | | | | | | |
Net investment income2 | | | | 0.01 | | | | | 0.01 | |
Net realized and unrealized gain | | | | 3.91 | | | | | 1.46 | |
| | | | | | | | | | |
Net increase from investment operations | | | | 3.92 | | | | | 1.47 | |
| | | | | | | | | | |
Net asset value, end of period | | | $ | 24.78 | | | | $ | 20.86 | |
| | | | | | | | | | |
Total Investment Return5,6 | | | | | | | | | | |
Based on net asset value | | | | 18.79 | % | | | | 7.58 | % |
| | | | | | | | | | |
Ratios to Average Net Assets9 | | | | | | | | | | |
Total expenses | | | | 0.77 | % | | | | 0.80 | % |
| | | | | | | | | | |
Total expenses after fees waived, reimbursed and paid indirectly | | | | 0.77 | % | | | | 0.80 | % |
| | | | | | | | | | |
Net investment income | | | | 0.12 | % | | | | 0.08 | % |
| | | | | | | | | | |
Supplemental Data | | | | | | | | | | |
Net assets, end of period (000) | | | $ | 932,812 | | | | $ | 728,129 | |
| | | | | | | | | | |
Portfolio turnover | | | | 37 | % | | | | 71 | % |
| | | | | | | | | | |
| | 1 | On June 28, 2010, BlackRock Capital Appreciation Portfolio was reorganized into the Fund. The activity in the table presented above is for the accounting survivor, BlackRock Capital Appreciation Portfolio, for the periods prior to the date of the reorganization, and for the post-reorganization fund thereafter. The net asset values and other per share information have been restated for periods prior to the reorganization to reflect the share conversion ratio of 0.80500157. See Note 1 in the Notes to Financial Statements. |
| | 2 | Based on average shares outstanding. |
| | 3 | Less than $0.01 per share. |
| | 4 | Includes redemption fees, which are less than $0.01 per share. |
| | 5 | Where applicable, total investment returns exclude the effects of any sales charges and include the reinvestment of dividends and distributions. |
| | 6 | Aggregate total investment return. |
| | 7 | Includes proceeds received from a settlement of litigation, which impacted the Fund’s total return. Excluding these proceeds, the Fund’s total return would have been (1.31)%. |
| | 8 | Redemption fee of 2.00% is reflected in total return calculations. There was no impact to the return. |
| | 11 | Commencement of operations. |
See Notes to Financial Statements.
| | | | | | |
| | | BLACKROCK CAPITAL APPRECIATION FUND, INC. | | MARCH 31, 2011 | | 13 |
| | |
| Financial Highlights (continued) | | |
| | |
| | | | | | | | | | | | | | | | | | | | | | | | | | | | | | |
| | | Investor A Shares1 |
| | | Six Months
Ended
March 31, 2011
(Unaudited) | | Year Ended September 30, |
| | | | 2010 | | 2009 | | 2008 | | 2007 | | 2006 |
Per Share Operating Performance | | | | | | | | | | | | | | | | | | | | | | | | | | | | | | |
Net asset value, beginning of period | | | $ | 20.17 | | | | $ | 18.12 | | | | $ | 18.37 | | | | $ | 22.11 | | | | $ | 18.20 | | | | $ | 17.40 | |
| | | | | | | | | | | | | | | | | | | | | | | | | | | | | | |
Net investment income (loss)2 | | | | (0.02 | ) | | | | (0.04 | ) | | | | 0.01 | | | | | (0.03 | ) | | | | (0.03 | ) | | | | (0.07 | ) |
Net realized and unrealized gain (loss) | | | | 3.79 | | | | | 2.09 | | | | | (0.26 | ) | | | | (3.71 | )3 | | | | 3.94 | | | | | 0.87 | 3 |
| | | | | | | | | | | | | | | | | | | | | | | | | | | | | | |
Net increase (decrease) from investment operations | | | | 3.77 | | | | | 2.05 | | | | | (0.25 | ) | | | | (3.74 | ) | | | | 3.91 | | | | | 0.80 | |
| | | | | | | | | | | | | | | | | | | | | | | | | | | | | | |
Dividends from net investment income | | | | – | | | | | (0.00 | )4 | | | | – | | | | | – | | | | | – | | | | | – | |
| | | | | | | | | | | | | | | | | | | | | | | | | | | | | | |
Net asset value, end of period | | | $ | 23.94 | | | | $ | 20.17 | | | | $ | 18.12 | | | | $ | 18.37 | | | | $ | 22.11 | | | | $ | 18.20 | |
| | | | | | | | | | | | | | | | | | | | | | | | | | | | | | |
Total Investment Return5 | | | | | | | | | | | | | | | | | | | | | | | | | | | | | | |
Based on net asset value | | | | 18.69 | %6 | | | | 11.37 | % | | | | (1.37 | )%7 | | | | (16.91 | )%8 | | | | 21.44 | % | | | | 4.63 | %8 |
| | | | | | | | | | | | | | | | | | | | | | | | | | | | | | |
Ratios to Average Net Assets | | | | | | | | | | | | | | | | | | | | | | | | | | | | | | |
Total expenses | | | | 1.06 | %9 | | | | 1.15 | % | | | | 1.35 | % | | | | 1.33 | % | | | | 1.35 | % | | | | 1.53 | % |
| | | | | | | | | | | | | | | | | | | | | | | | | | | | | | |
Total expenses excluding recoupment of past waived fees | | | | 1.06 | %9 | | | | 1.15 | % | | | | 1.35 | % | | | | 1.33 | % | | | | 1.35 | % | | | | 1.53 | % |
| | | | | | | | | | | | | | | | | | | | | | | | | | | | | | |
Total expenses after fees waived, reimbursed and paid indirectly | | | | 1.06 | %9 | | | | 1.13 | % | | | | 1.23 | % | | | | 1.23 | % | | | | 1.28 | % | | | | 1.35 | % |
| | | | | | | | | | | | | | | | | | | | | | | | | | | | | | |
Net investment income (loss) | | | | (0.18 | %)9 | | | | (0.21 | %) | | | | 0.07 | % | | | | (0.10 | )% | | | | (0.16 | )% | | | | (0.40 | )% |
| | | | | | | | | | | | | | | | | | | | | | | | | | | | | | |
Supplemental Data | | | | | | | | | | | | | | | | | | | | | | | | | | | | | | |
Net assets, end of period (000) | | | $ | 2,156,400 | | | | $ | 1,583,570 | | | | $ | 169,865 | | | | $ | 125,521 | | | | $ | 131,712 | | | | $ | 112,737 | |
| | | | | | | | | | | | | | | | | | | | | | | | | | | | | | |
Portfolio turnover | | | | 37 | % | | | | 71 | % | | | | 87 | % | | | | 80 | % | | | | 97 | % | | | | 87 | % |
| | | | | | | | | | | | | | | | | | | | | | | | | | | | | | |
| |
| | | Investor B Shares1 |
| | | Six Months
Ended
March 31, 2011
(Unaudited) | | Year Ended September 30, |
| | | | 2010 | | 2009 | | 2008 | | 2007 | | 2006 |
Per Share Operating Performance | | | | | | | | | | | | | | | | | | | | | | | | | | | | | | |
Net asset value, beginning of period | | | $ | 17.87 | | | | $ | 16.18 | | | | $ | 16.60 | | | | $ | 20.08 | | | | $ | 16.66 | | | | $ | 16.05 | |
| | | | | | | | | | | | | | | | | | | | | | | | | | | | | | |
Net investment loss2 | | | | (0.11 | ) | | | | (0.18 | ) | | | | (0.09 | ) | | | | (0.17 | ) | | | | (0.17 | ) | | | | (0.20 | ) |
Net realized and unrealized gain (loss) | | | | 3.34 | | | | | 1.87 | | | | | (0.33 | ) | | | | (3.31 | )3 | | | | 3.59 | | | | | 0.81 | 3 |
| | | | | | | | | | | | | | | | | | | | | | | | | | | | | | |
Net increase (decrease) from investment operations | | | | 3.23 | | | | | 1.69 | | | | | (0.42 | ) | | | | (3.48 | ) | | | | 3.42 | | | | | 0.61 | |
| | | | | | | | | | | | | | | | | | | | | | | | | | | | | | |
Net asset value, end of period | | | $ | 21.10 | | | | $ | 17.87 | | | | $ | 16.18 | | | | $ | 16.60 | | | | $ | 20.08 | | | | $ | 16.66 | |
| | | | | | | | | | | | | | | | | | | | | | | | | | | | | | |
Total Investment Return5 | | | | | | | | | | | | | | | | | | | | | | | | | | | | | | |
Based on net asset value | | | | 18.08 | %6 | | | | 10.34 | % | | | | (2.52 | )%10 | | | | (17.32 | )%8 | | | | 20.50 | % | | | | 3.83 | %8 |
| | | | | | | | | | | | | | | | | | | | | | | | | | | | | | |
Ratios to Average Net Assets | | | | | | | | | | | | | | | | | | | | | | | | | | | | | | |
Total expenses | | | | 2.00 | %9 | | | | 2.01 | % | | | | 2.36 | % | | | | 2.11 | % | | | | 2.20 | % | | | | 2.20 | % |
| | | | | | | | | | | | | | | | | | | | | | | | | | | | | | |
Total expenses excluding recoupment of past waived fees | | | | 2.00 | %9 | | | | 2.01 | % | | | | 2.27 | % | | | | 2.11 | % | | | | 2.20 | % | | | | 2.20 | % |
| | | | | | | | | | | | | | | | | | | | | | | | | | | | | | |
Total expenses after fees waived, reimbursed and paid indirectly | | | | 2.00 | %9 | | | | 2.00 | % | | | | 2.11 | % | | | | 2.00 | % | | | | 2.07 | % | | | | 2.10 | % |
| | | | | | | | | | | | | | | | | | | | | | | | | | | | | | |
Net investment loss | | | | (1.10 | )%9 | | | | (1.10 | )% | | | | (0.77 | )% | | | | (0.87 | )% | | | | (0.95 | )% | | | | (1.16 | )% |
| | | | | | | | | | | | | | | | | | | | | | | | | | | | | | |
Supplemental Data | | | | | | | | | | | | | | | | | | | | | | | | | | | | | | |
Net assets, end of period (000) | | | $ | 152,449 | | | | $ | 171,808 | | | | $ | 10,279 | | | | $ | 19,663 | | | | $ | 48,260 | | | | $ | 71,078 | |
| | | | | | | | | | | | | | | | | | | | | | | | | | | | | | |
Portfolio turnover | | | | 37 | % | | | | 71 | % | | | | 87 | % | | | | 80 | % | | | | 97 | % | | | | 87 | % |
| | | | | | | | | | | | | | | | | | | | | | | | | | | | | | |
See Notes to Financial Statements.
| | | | | | |
| 14 | | BLACKROCK CAPITAL APPRECIATION FUND, INC. | | MARCH 31, 2011 | | |
| | |
| Financial Highlights (continued) | | |
| | |
| | | | | | | | | | | | | | | | | | | | | | | | | | | | | | |
| | | Investor C Shares1 |
| | | Six Months
Ended
March 31, 2011
(Unaudited) | | Year Ended September 30, |
| | | 2010 | | 2009 | | 2008 | | 2007 | | 2006 |
Per Share Operating Performance | | | | | | | | | | | | | | | | | | | | | | | | | | | | | | |
Net asset value, beginning of period | | | $ | 17.96 | | | | $ | 16.25 | | | | $ | 16.63 | | | | $ | 20.09 | | | | $ | 16.64 | | | | $ | 16.02 | |
| | | | | | | | | | | | | | | | | | | | | | | | | | | | | | |
Net investment loss2 | | | | (0.10 | ) | | | | (0.17 | ) | | | | (0.09 | ) | | | | (0.13 | ) | | | | (0.15 | ) | | | | (0.18 | ) |
Net realized and unrealized gain (loss) | | | | 3.36 | | | | | 1.88 | | | | | (0.29 | ) | | | | (3.33 | )3 | | | | 3.60 | | | | | 0.80 | 3 |
| | | | | | | | | | | | | | | | | | | | | | | | | | | | | | |
Net increase (decrease) from investment operations | | | | 3.26 | | | | | 1.71 | | | | | (0.38 | ) | | | | (3.46 | ) | | | | 3.45 | | | | | 0.62 | |
| | | | | | | | | | | | | | | | | | | | | | | | | | | | | | |
Net asset value, end of period | | | $ | 21.22 | | | | $ | 17.96 | | | | $ | 16.25 | | | | $ | 16.63 | | | | $ | 20.09 | | | | $ | 16.64 | |
| | | | | | | | | | | | | | | | | | | | | | | | | | | | | | |
Total Investment Return5 | | | | | | | | | | | | | | | | | | | | | | | | | | | | | | |
Based on net asset value | | | | 18.15 | %6 | | | | 10.52 | % | | | | (2.29 | )%11 | | | | (17.22 | )%8 | | | | 20.71 | % | | | | 3.91 | %8 |
| | | | | | | | | | | | | | | | | | | | | | | | | | | | | | |
Ratios to Average Net Assets | | | | | | | | | | | | | | | | | | | | | | | | | | | | | | |
Total expenses | | | | 1.92 | %9 | | | | 1.97 | % | | | | 2.04 | % | | | | 1.96 | % | | | | 1.99 | % | | | | 2.10 | % |
| | | | | | | | | | | | | | | | | | | | | | | | | | | | | | |
Total expenses after fees waived, reimbursed and paid indirectly | | | | 1.91 | %9 | | | | 1.94 | % | | | | 1.92 | % | | | | 1.85 | % | | | | 1.92 | % | | | | 2.04 | % |
| | | | | | | | | | | | | | | | | | | | | | | | | | | | | | |
Net investment loss | | | | (1.03 | )%9 | | | | (1.04 | )% | | | | (0.61 | )% | | | | (0.73 | )% | | | | (0.80 | )% | | | | (1.10 | )% |
| | | | | | | | | | | | | | | | | | | | | | | | | | | | | | |
Supplemental Data | | | | | | | | | | | | | | | | | | | | | | | | | | | | | | |
Net assets, end of period (000) | | | $ | 705,158 | | | | $ | 608,137 | | | | $ | 22,986 | | | | $ | 12,361 | | | | $ | 15,160 | | | | $ | 17,079 | |
| | | | | | | | | | | | | | | | | | | | | | | | | | | | | | |
Portfolio turnover | | | | 37 | % | | | | 71 | % | | | | 87 | % | | | | 80 | % | | | | 97 | % | | | | 87 | % |
| | | | | | | | | | | | | | | | | | | | | | | | | | | | | | |
| | 1 | On June 28, 2010, BlackRock Capital Appreciation Portfolio was reorganized into the Fund. The activity in the table presented above is for the accounting survivor, BlackRock Capital Appreciation Portfolio, for the periods prior to the date of the reorganization, and for the post-reorganization fund thereafter. The net asset values and other per share information have been restated for periods prior to the reorganization to reflect the share conversion ratio of 0.79434657, 0.81383276 and 0.81539389 for Investor A, Investor B and Investor C Shares, respectively. See Note 1 in the Notes to Financial Statements. |
| | 2 | Based on average shares outstanding. |
| | 3 | Includes redemption fees, which are less than $0.01 per share. |
| | 4 | Less than $(0.01) per share. |
| | 5 | Where applicable, total investment returns exclude the effects of any sales charges and include the reinvestment of dividends and distributions. |
| | 6 | Aggregate total investment return. |
| | 7 | Includes proceeds received from a settlement of litigation, which impacted the Fund’s total return. Excluding these proceeds, the Fund’s total return would have been (1.51)%. |
| | 8 | Redemption fee of 2.00% is reflected in total return calculations. There was no impact to the return. |
| | 10 | Includes proceeds received from a settlement of litigation, which impacted the Fund’s total return. Excluding these proceeds, the Fund’s total return would have been (2.67)%. |
| | 11 | Includes proceeds received from a settlement of litigation, which impacted the Fund’s total return. Excluding these proceeds, the Fund’s total return would have been (2.43)%. |
See Notes to Financial Statements.
| | | | | | |
| | | BLACKROCK CAPITAL APPRECIATION FUND, INC. | | MARCH 31, 2011 | | 15 |
| | |
| Financial Highlights (concluded) | | |
| | |
| | | | | | | | | | |
| | | Class R Shares |
| | | Six Months
Ended
March 31, 2011
(Unaudited) | | Period
June 28,
20101 to
September 30,
2010 |
Per Share Operating Performance | | | | | | | | | | |
Net asset value, beginning of period | | | $ | 18.56 | | | | $ | 17.28 | |
| | | | | | | | | | |
Net investment loss2 | | | | (0.05 | ) | | | | (0.03 | ) |
Net realized and unrealized gain | | | | 3.47 | | | | | 1.31 | |
| | | | | | | | | | |
Net increase from investment operations | | | | 3.42 | | | | | 1.28 | |
| | | | | | | | | | |
Net asset value, end of period | | | $ | 21.98 | | | | $ | 18.56 | |
| | | | | | | | | | |
Total Investment Return3,4 | | | | | | | | | | |
Based on net asset value | | | | 18.43 | % | | | | 7.41 | % |
| | | | | | | | | | |
Ratios to Average Net Assets5 | | | | | | | | | | |
Total expenses | | | | 1.39 | % | | | | 1.44 | % |
| | | | | | | | | | |
Total expenses after fees waived, reimbursed and paid indirectly | | | | 1.39 | % | | | | 1.43 | % |
| | | | | | | | | | |
Net investment loss | | | | (0.50 | )% | | | | (0.55 | )% |
| | | | | | | | | | |
Supplemental Data | | | | | | | | | | |
Net assets, end of period (000) | | | $ | 96,812 | | | | $ | 74,677 | |
| | | | | | | | | | |
Portfolio turnover | | | | 37 | % | | | | 71 | % |
| | | | | | | | | | |
| | 1 | Commencement of operations. |
| | 2 | Based on average shares outstanding. |
| | 3 | Where applicable, total investment returns exclude the effects of any sales charges and include the reinvestment of dividends and distributions. |
| | 4 | Aggregate total investment return. |
See Notes to Financial Statements.
| | | | | | |
| 16 | | BLACKROCK CAPITAL APPRECIATION FUND, INC. | | MARCH 31, 2011 | | |
| | |
| Notes to Financial Statements (Unaudited) | | |
1. Organization and Significant Accounting Policies:
BlackRock Capital Appreciation Fund, Inc. (the “Fund”) is registered under the Investment Company Act of 1940, as amended (the “1940 Act”), as a diversified, open-end management investment company. The Fund is organized as a Maryland corporation. The Fund’s financial statements are prepared in conformity with accounting principles generally accepted in the United States of America (“US GAAP”), which may require management to make estimates and assumptions that affect the reported amounts and disclosures in the financial statements. Actual results could differ from those estimates. The Fund offers multiple classes of shares. BlackRock and Institutional Shares are sold without a sales charge and only to certain eligible investors. Investor A Shares are generally sold with a front-end sales charge. Investor B and Investor C Shares may be subject to a contingent deferred sales charge. Class R Shares are sold without a sales charge and only to certain retirement and other similar plans. All classes of shares have identical voting, dividend, liquidation and other rights and the same terms and conditions, except that Investor A, Investor B, Investor C and Class R Shares bear certain expenses related to the shareholder servicing of such shares, and Investor B, Investor C and Class R Shares also bear certain expenses related to the distribution of such shares. Investor B Shares automatically convert to Investor A Shares after approximately eight years. Investor B Shares are only available through exchanges, dividend reinvestment by existing shareholders or for purchase by certain qualified employee benefit plans. Each class has exclusive voting rights with respect to matters relating to its shareholder servicing and distribution expenditures (except that Investor B shareholders may vote on material changes to the Investor A distribution and service plan).
Reorganization: The Board of Trustees and shareholders of BlackRock Capital Appreciation Portfolio of BlackRock FundsSM (the “Predecessor Fund”) and the Board of Directors (the “Board”) and shareholders of the BlackRock Fundamental Growth Fund, Inc. (the “Fundamental Growth Fund”) approved a reorganization of the Predecessor Fund into the Fundamental Growth Fund, pursuant to which the Fundamental Growth Fund acquired substantially all of the assets and assumed substantially all of the liabilities of the Predecessor Fund in exchange for an equal aggregate value of the Fundamental Growth Fund shares.
In connection with the acquisition, the Predecessor Fund was terminated as a series of the BlackRock FundsSM. Effective June 28, 2010, the Fundamental Growth Fund changed its name to BlackRock Capital Appreciation Fund, Inc., hereafter referred to as the Fund. Although the Fundamental Growth Fund is the legal surviving entity in the reorganization, the Predecessor Fund is the accounting or continuing portfolio for purposes of maintaining the financial statements and performance history in the post-reorganization fund.
Each shareholder of the Predecessor Fund received shares of the Fund with the same class designation and an aggregate net asset value of such shareholder’s Predecessor Fund shares, as determined at the close of business on June 25, 2010, the date of merger, except the Predecessor Fund’s Institutional Shares were exchanged for the Fund’s newly established BlackRock Shares.
The reorganization was accomplished by a tax-free exchange of shares of the Fund in the following amounts and at the following conversion ratios:
| | | | | | | | | | | | | | | |
| | | Predecessor Fund Shares
Prior to
Reorganization | | Conversion
Ratio | | Shares of
the Fund |
Institutional/BlackRock | | | | 17,530,970 | | | | | 0.80500157 | | | | | 14,112,459 | |
Investor A/Investor A | | | | 12,307,692 | | | | | 0.79434657 | | | | | 9,776,573 | |
Investor B/Investor B | | | | 530,664 | | | | | 0.81383276 | | | | | 431,872 | |
Investor C/Investor C | | | | 2,158,860 | | | | | 0.81539389 | | | | | 1,760,321 | |
The Fundamental Growth Fund’s net assets and composition of net assets on June 25, 2010, were as follows:
| | | | | | | | | | | | | | | | | | |
| Net Assets | | | Paid-in Capital | | | Accumulated
Net
Investment
Loss | | | Accumulated
Net
Realized
Loss | | | Net
Unrealized
Appreciation | |
| $ | 2,802,852,682 | | | $ | 4,171,509,277 | | | $ | (6,803,403 | ) | | $ | (1,710,210,520 | ) | | $ | 348,357,328 | |
For financial reporting purposes, assets received and shares issued by the Fund were recorded at fair value; however, the cost basis of the investments received from the Fundamental Growth Fund was carried forward to align ongoing reporting of the Fund’s realized and unrealized gains and losses with amounts distributable to shareholders for tax purposes.
The aggregate net assets of the Fund immediately after the acquisition amounted to $3,296,688,986. The Fundamental Growth Fund’s fair value and cost of investments prior to the reorganization were $2,794,316,306 and $2,445,999,410, respectively.
The purpose of this transaction was to combine two funds managed by BlackRock Advisors, LLC (the “Manager”), the Fund’s investment advisor, an indirect, wholly owned subsidiary of BlackRock, Inc. (“BlackRock”) with the same or substantially similar (but not identical) investment objectives, investment policies, strategies, risks and restrictions. The reorganization was a tax-free event and was effective on June 28, 2010.
Assuming the acquisition had been completed on October 1, 2009, the beginning of the annual reporting period of the Fund, the pro forma results of operations for the year ended September 30, 2010, are as follows:
| | • | | Net investment loss: $(9,041,452) |
| | • | | Total realized and unrealized gain: $381,413,862 |
| | • | | Net increase in the net assets resulting from operations: $372,372,410 |
Because the combined investment portfolios have been managed as a single integrated portfolio since the acquisition was completed, it is not practicable to separate the amounts of revenue and earnings of the Fundamental Growth Fund that have been included in the Fund’s Statement of Changes since June 25, 2010.
| | | | | | |
| | | BLACKROCK CAPITAL APPRECIATION FUND, INC. | | MARCH 31, 2011 | | 17 |
| | |
| Notes to Financial Statements (continued) | | |
The following is a summary of significant accounting policies followed by the Fund:
Valuation: US GAAP defines fair value as the price the Fund would receive to sell an asset or pay to transfer a liability in an orderly transaction between market participants at the measurement date. The Fund fair values its financial instruments at market value using independent dealers or pricing services under policies approved by the Board. Equity investments traded on a recognized securities exchange or the NASDAQ Global Market System (“NASDAQ”) are valued at the last reported sale price that day or the NASDAQ official closing price, if applicable. For equity investments traded on more than one exchange, the last reported sale price on the exchange where the stock is primarily traded is used. Equity investments traded on a recognized exchange for which there were no sales on that day are valued at the last available bid price. If no bid price is available, the prior day’s price will be used, unless it is determined that such prior day’s price no longer reflects the fair value of the security. Short-term securities with remaining maturities of 60 days or less may be valued at amortized cost, which approximates fair value. Investments in open-end registered investment companies are valued at net asset value each business day.
The Fund values its investment in BlackRock Liquidity Series, LLC Money Market Series (the “Money Market Series”) at fair value, which is ordinarily based upon its pro rata ownership in the net assets of the underlying fund. The Money Market Series seeks current income consistent with maintaining liquidity and preserving capital. Although the Money Market Series is not registered under the 1940 Act, its investments will follow the parameters of investments by a money market fund that is subject to Rule 2a-7 promulgated by the Securities and Exchange Commission (“SEC”) under the 1940 Act. The Fund may withdraw up to 25% of its investment daily, although the manager of the Money Market Series, in its sole discretion, may permit an investor to withdraw more than 25% on any one day.
In the event that application of these methods of valuation results in a price for an investment which is deemed not to be representative of the market value of such investment or is not available, the investment will be valued in accordance with a policy approved by the Board as reflecting fair value (“Fair Value Assets”). When determining the price for Fair Value Assets, the investment advisor and/or sub-advisor seek to determine the price that the Fund might reasonably expect to receive from the current sale of that asset in an arm’s-length transaction. Fair value determinations shall be based upon all available factors that the investment advisor and/or sub-advisor deem relevant. The pricing of all Fair Value Assets is subsequently reported to the Board or a committee thereof.
Investment Transactions and Investment Income: For financial reporting purposes, investment transactions are recorded on the dates the transactions are entered into (the trade dates). Realized gains and losses on investment transactions are determined on the identified cost basis. Dividend income is recorded on the ex-dividend dates. Dividends from foreign securities where the ex-dividend date may have passed are subsequently recorded when the Fund is informed of the ex-dividend date. Under the applicable foreign tax laws, a withholding tax at various rates may be imposed on capital gains, dividends and interest. Income and realized and unrealized gains and losses are allocated daily to each class based on its relative net assets.
Dividends and Distributions: Dividends and distributions paid by the Fund are recorded on the ex-dividend dates. The amount and timing of dividends and distributions are determined in accordance with federal income tax regulations, which may differ from US GAAP.
Securities Lending: The Fund may lend securities to approved borrowers, such as banks, brokers and other financial institutions. The borrower pledges cash, securities issued or guaranteed by the US government or irrevocable letters of credit issued by a bank as collateral, which will be maintained at all times in an amount equal to at least 100% of the current market value of the loaned securities. The market value of the loaned securities is determined at the close of business of the Fund and any additional required collateral is delivered to the Fund on the next business day. Securities lending income, as disclosed in the Statement of Operations, represents the income earned from the investment of the cash collateral, net of rebates paid to, or fees paid by, borrowers and less the fees paid to the securities lending agent. During the term of the loan, the Fund earns dividends on the securities loaned but does not receive dividend or interest income on the securities received as collateral. Loans of securities are terminable at any time and the borrower, after notice, is required to return borrowed securities within the standard time period for settlement of securities transactions. In the event that the borrower defaults on its obligation to return borrowed securities because of insolvency or for any other reason, the Fund could experience delays and costs in gaining access to the collateral. The Fund also could suffer a loss if the value of an investment purchased with cash collateral falls below the market value of loaned securities or if the value of an investment purchased with cash collateral falls below the value of the original cash collateral received.
Income Taxes: It is the Fund’s policy to comply with the requirements of the Internal Revenue Code of 1986, as amended, applicable to regulated investment companies and to distribute substantially all of its taxable income to its shareholders. Therefore, no federal income tax provision is required. The Fund has a tax year end of August 31.
The Fund files US federal and various state and local tax returns. No income tax returns are currently under examination. The statute of limitations on the Fund’s US federal tax returns remains open for each of the four years ended August 31, 2010. The statutes of limitations on the Fund’s state and local tax returns may remain open for an additional year depending upon the jurisdiction. Management does not believe there are any uncertain tax positions that require recognition of a tax liability.
Other: Expenses directly related to the Fund or its classes are charged to the Fund or class. Other operating expenses shared by several funds are
| | | | | | |
| 18 | | BLACKROCK CAPITAL APPRECIATION FUND, INC. | | MARCH 31, 2011 | | |
| | |
| Notes to Financial Statements (continued) | | |
pro rated among those funds on the basis of relative net assets or other appropriate methods. Other expenses of the Fund are allocated daily to each class based on its relative net assets.
The Fund has an arrangement with the custodian whereby fees may be reduced by credits earned on uninvested cash balances, which if applicable are shown as fees paid indirectly in the Statement of Operations. The custodian imposes fees on overdrawn cash balances, which can be offset by accumulated credits earned or may result in additional custody charges.
2. Investment Advisory Agreements and Other Transactions with Affiliates:
The PNC Financial Services Group Inc. (“PNC”), Bank of America Corporation (“BAC”) and Barclays Bank PLC (“Barclays”) are the largest stockholders of BlackRock. Due to the ownership structure, PNC is an affiliate of the Fund for 1940 Act purposes, but BAC and Barclays are not.
The Fund entered into an Investment Advisory Agreement with the Manager to provide investment advisory and administration services. The Manager is responsible for the management of the Fund’s portfolio and provides the necessary personnel, facilities, equipment and certain other services necessary to the operations of the Fund. For such services, the Fund pays the Manager a monthly fee at the following annual rates of the Fund’s average daily net assets as follows:
| | | | | |
Average Daily Net Assets | | Investment
Advisory Fee |
First $1 Billion | | | | 0.650 | % |
$1 Billion – $1.5 Billion | | | | 0.625 | % |
$1.5 Billion – $5 Billion | | | | 0.600 | % |
$5 Billion – $7.5 Billion | | | | 0.575 | % |
Greater Than $7.5 Billion | | | | 0.550 | % |
The Manager contractually agreed to waive and/or reimburse fees or expenses, excluding interest expense, dividend expense, acquired fund fees and expenses and certain other fund expenses, in order to limit expenses. The Manager has agreed not to reduce or discontinue this contractual waiver or reimbursement prior to February 1, 2021 unless approved by the Board, including a majority of the Independent Directors. On February 1 of each year the waiver agreement will renew automatically for an additional one year so that the agreement will have a perpetual ten-year term. These amounts are shown as administration fees waived – class specific, transfer agent fees waived – class specific and transfer agent fees reimbursed – class specific, respectively, in the Statement of Operations. The expense limitations as a percentage of average daily net assets are as follows:
| | |
Share Classes |
BlackRock | | Investor C |
0.72% | | 1.94% |
The Manager voluntarily agreed to waive its investment advisory fees by the amount of investment advisory fees the Fund pays to the Manager indirectly through its investment in affiliated money market funds; however the Manager does not waive its investment advisory fees by the amount of investment advisory fees paid through the Fund’s investment in other affiliated investment companies, if any. This amount is included in fees waived by advisor in the Statement of Operations. For the six months ended March 31, 2011, the Manager waived $22,783.
The Manager entered into a sub-advisory agreement with BlackRock Investment Management, LLC (“BIM”), an affiliate of the Manager. The Manager pays BIM for services it provides, a monthly fee that is a percentage of the investment advisory fees paid by the Fund to the Manager.
The Fund entered into a Distribution Agreement and Distribution and Service Plan with BlackRock Investments, LLC (“BRIL”), an affiliate of BlackRock. Pursuant to the Distribution and Service Plan and in accordance with Rule 12b-1 under the 1940 Act, the Fund pays BRIL ongoing service and distribution fees. The fees are accrued daily and paid monthly at annual rates based upon the average daily net assets of the shares of the Fund as follows:
| | | | | | | | | | |
| | | Service
Fee | | Distribution
Fee |
Investor A | | | | 0.25 | % | | | | – | |
Investor B | | | | 0.25 | % | | | | 0.75 | % |
Investor C | | | | 0.25 | % | | | | 0.75 | % |
Class R | | | | 0.25 | % | | | | 0.25 | % |
Pursuant to sub-agreements with BRIL, broker-dealers and BRIL provide shareholder servicing and distribution services to the Fund. The ongoing service and/or distribution fee compensates BRIL and each broker-dealer for providing shareholder servicing and/or distribution related services to Investor A, Investor B, Investor C and Class R shareholders.
For the six months ended March 31, 2011, affiliates earned underwriting discounts, direct commissions and dealer concessions on sales of the Fund’s Investor A Shares of $87,483.
For the six months ended March 31, 2011, affiliates received contingent deferred sales charges relating to transactions in Investor A, Investor B, and Investor C Shares of $846, $26,335 and $23,795, respectively.
Pursuant to written agreements, certain financial intermediaries, some of which may be affiliates, provide the Fund with sub-accounting, recordkeeping, sub-transfer agency and other administrative services with respect to sub-accounts they service. For these services, these entities receive an annual fee per shareholder account, which will vary depending on share class and/or net assets. For the six months ended March 31, 2011, the Fund paid $243,302 to affiliates in return for these services, which is included in transfer agent – class specific in the Statement of Operations.
The Manager maintains a call center, which is responsible for providing certain shareholder services to the Fund, such as responding to shareholder inquiries and processing transactions based upon instructions from shareholders with respect to the subscription and redemption of Fund shares. For the six months ended March 31, 2011, the Fund reimbursed the Manager the following amounts for costs incurred in running the call center, which are included in transfer agent – class specific in
| | | | | | |
| | | BLACKROCK CAPITAL APPRECIATION FUND, INC. | | MARCH 31, 2011 | | 19 |
| | |
| Notes to Financial Statements (continued) | | |
the Statement of Operations.
| | | | | | | | | | |
Share Classes |
BlackRock | | Institutional | | Investor A | | Investor B | | Investor C | | Class R |
$1,134 | | $1,462 | | $19,159 | | $1,441 | | $3,305 | | $233 |
The Fund received an exemptive order from the SEC permitting it, among other things, to pay an affiliated securities lending agent a fee based on a share of the income derived from the securities lending activities and has retained BIM as the securities lending agent. BIM may, on behalf of the Fund, invest cash collateral received by the Fund for such loans, among other things, in a private investment company managed by the Manager or in registered money market funds advised by the Manager or its affiliates. The market value of securities on loan and the value of the related collateral if applicable, are shown in the Statement of Assets and Liabilities as securities loaned at value and collateral on securities loaned at value, respectively. The cash collateral invested by BIM is disclosed in the Schedule of Investments. The share of income earned by the Fund on such investments is shown as securities lending – affiliated in the Statement of Operations. For the six months ended March 31, 2011, BIM received $67,743 in securities lending agent fees related to securities lending activities for the Fund.
For the six months ended March 31, 2011, the following table shows the various types of class specific expenses borne directly by each class of the Fund and any associated waivers or reimbursements of those expenses:
| | | | | | | | | | | | | | | | | | | | | | | | | | | | | | | | | | | |
| | | Share Classes |
| | | BlackRock | | Institutional | | Investor A | | Investor B | | Investor C | | Class R | | Total |
Service and Distribution Fees | | | | – | | | | | – | | | | $ | 2,299,610 | | | | $ | 849,799 | | | | $ | 3,355,476 | | | | $ | 216,716 | | | | $ | 6,721,601 | |
Transfer Agent Fees | | | $ | 298,308 | | | | $ | 518,878 | | | | $ | 1,536,344 | | | | $ | 307,044 | | | | $ | 916,563 | | | | $ | 106,279 | | | | $ | 3,683,416 | |
Transfer Agent Fees Waived | | | $ | (724 | ) | | | $ | – | | | | | – | | | | | – | | | | | – | | | | | – | | | | $ | (724 | ) |
Transfer Agent Fees Reimbursed | | | $ | (30,957 | ) | | | $ | – | | | | | – | | | | | – | | | | | (2,708 | ) | | | | – | | | | $ | (33,665 | ) |
Affiliates earned $270,036 in transfer agent fees which are included in transfer agent – class specific fees in the Statement of Operations.
Certain officers and/or directors of the Fund are officers and/or directors of BlackRock or its affiliates. The Fund reimburses the Manager for compensation paid to the Fund’s Chief Compliance Officer.
3. Investments:
Purchases and sales of investments, excluding short-term securities, for the six months ended March 31, 2011, were $2,238,273,104 and $1,539,780,480, respectively.
4. Borrowings:
The Fund, along with certain other funds managed by the Manager and its affiliates, is a party to a $500 million credit agreement with a group of lenders, which expired in November 2010. The Fund may borrow under the credit agreement to fund shareholder redemptions. Effective November 2009, the credit agreement had the following terms: 0.02% upfront fee on the aggregate commitment amount which was allocated to the Fund based on its net assets as of October 31, 2009, a commitment fee of 0.10% per annum based on the Fund’s pro rata share of the unused portion of the credit agreement and interest at a rate equal to the higher of (a) the one-month LIBOR plus 1.25% per annum and (b) the Fed Funds rate plus 1.25% per annum on amounts borrowed. In addition, the Fund paid administration and arrangement fees which were allocated to the Fund based on its net assets as of October 31, 2009. Effective November 2010, the credit agreement was renewed until November 2011 with the following terms: a commitment fee of 0.08% per annum based on the Fund’s pro rata share of the unused portion of the credit agreement and interest at a rate equal to the higher of (a) the one-month LIBOR plus 1.00% per annum and (b) the Fed Funds rate plus 1.00% per annum on amounts borrowed. In addition, the Fund paid administration and arrangement fees which were allocated to the Fund based on its net assets as of October 31, 2010. The Fund did not borrow under the credit agreement during the six months ended March 31, 2011.
5. Capital Loss Carryforwards:
On August 31, 2010, the Fund’s last tax year-end, the Fund had capital loss carryforwards available to offset future realized capital gains of $1,636,529,952, of which $1,181,351,691 expires in 2011, $68,218,211 expires in 2012, $10,784,067 expires in 2016, $105,719,903 expires in 2017 and $270,456,080 expires in 2018.
Under the recently enacted Regulated Investment Company Modernization Act of 2010, capital losses incurred by the Fund after August 31, 2011 will not be subject to expiration. In addition, these losses must be utilized prior to the losses incurred in pre-enactment taxable years.
6. Concentration, Market and Credit Risk:
In the normal course of business, the Fund invests in securities and enters into transactions where risks exist due to fluctuations in the market (market risk) or failure of the issuer of a security to meet all its obligations (issuer credit risk). The value of securities held by the Fund may decline in response to certain events, including those directly involving the issuers whose securities are owned by the Fund; conditions affecting the general economy; overall market changes; local, regional or global political, social or economic instability; and currency and interest rate and price fluctuations. Similar to issuer credit risk, the Fund may be
| | | | | | |
| 20 | | BLACKROCK CAPITAL APPRECIATION FUND, INC. | | MARCH 31, 2011 | | |
| | |
| Notes to Financial Statements (continued) | | |
exposed to counterparty credit risk, or the risk that an entity with which the Fund has unsettled or open transactions may fail to or be unable to perform on its commitments. The Fund manages counterparty credit risk by entering into transactions only with counterparties that it believes have the financial resources to honor their obligations and by monitoring the financial stability of those counterparties. Financial assets, which potentially expose the Fund to market, issuer and counterparty credit risks, consist principally of financial instruments and receivables due from counterparties. The extent of the Fund’s exposure to market, issuer and counterparty credit risks with respect to these financial assets is generally approximated by their value recorded in the Fund’s Statement of Assets and Liabilities, less any collateral held by the Fund.
As of March 31, 2011, the Fund invested a significant portion of its assets in securities in the information technology sector. Changes in economic conditions affecting the information technology sector would have a greater impact on the Fund and could affect the value, income and/or liquidity of positions in such securities.
7. Capital Shares Transactions:
Transactions in capital shares for each class were as follows:
| | | | | | | | | | | | | | | | | | | | |
| | | Six Months Ended
March 31, 2011 | | Year Ended
September 30, 2010 |
| | | Shares | | Amount | | Shares | | Amount |
| | | | |
BlackRock1 | | | | | | | | |
Net change in shares from the reorganization2 | | | | – | | | | | – | | | | | (3,418,511 | ) | | | | – | |
Shares sold | | | | 25,985,760 | | | | $ | 581,055,292 | | | | | 8,145,744 | | | | $ | 133,277,695 | |
Shares issued in reinvestment of dividends | | | | – | | | | | – | | | | | 37,867 | | | | | 591,493 | |
| | | | | | | | | | | | | | | | | | | | |
Total issued | | | | 25,985,760 | | | | | 581,055,292 | | | | | 4,765,100 | | | | | 133,869,188 | |
Shares redeemed | | | | (4,450,275 | ) | | | | (104,287,748 | ) | | | | (3,502,040 | ) | | | | (60,870,810 | ) |
| | | | | | | | | | | | | | | | | | | | |
Net increase | | | | 21,535,485 | | | | $ | 476,767,544 | | | | | 1,263,060 | | | | $ | 72,998,378 | |
| | | | | | | | | | | | | | | | | | | | |
| | | |
| | | | | | | Period
June 28, 20103 to
September 30, 2010 |
| | | | | | | Shares | | Amount |
| | | | |
Institutional | | | | | | | | |
Shares issued in the reorganization2 | | | | – | | | | | – | | | | | 34,834,603 | | | | $ | 675,440,062 | |
Shares sold | | | | 8,730,030 | | | | $ | 207,449,045 | | | | | 2,129,274 | | | | | 41,540,474 | |
| | | | | | | | | | | | | | | | | | | | |
Total issued | | | | 8,730,030 | | | | | 207,449,045 | | | | | 36,963,877 | | | | | 716,980,536 | |
Shares redeemed | | | | (5,998,952 | ) | | | | (141,087,189 | ) | | | | (2,054,040 | ) | | | | (39,974,564 | ) |
| | | | | | | | | | | | | | | | | | | | |
Net increase | | | | 2,731,078 | | | | $ | 66,361,856 | | | | | 34,909,837 | | | | $ | 677,005,972 | |
| | | | | | | | | | | | | | | | | | | | |
| | | |
| | | | | | | Year Ended
September 30, 2010 |
| | | | | | | Shares | | Amount |
Investor A1 | | | | | | | | |
Shares issued in the reorganization2 | | | | – | | | | | – | | | | | 70,707,933 | | | | $ | 1,327,248,764 | |
Net change in shares from the reorganization2 | | | | – | | | | | – | | | | | (2,531,119 | ) | | | | – | |
Shares sold | | | | 21,110,945 | | | | $ | 484,456,118 | | | | | 7,166,700 | | | | | 125,287,019 | |
Shares issued in reinvestment of dividends | | | | – | | | | | – | | | | | 3,149 | | | | | 47,110 | |
| | | | | | | | | | | | | | | | | | | | |
Total issued | | | | 21,110,945 | | | | | 484,456,118 | | | | | 75,346,663 | | | | | 1,452,582,893 | |
Shares redeemed | | | | (9,518,217 | ) | | | | (216,444,933 | ) | | | | (8,659,438 | ) | | | | (156,513,074 | ) |
| | | | | | | | | | | | | | | | | | | | |
Net increase | | | | 11,592,728 | | | | $ | 268,011,185 | | | | | 66,687,225 | | | | $ | 1,296,069,819 | |
| | | | | | | | | | | | | | | | | | | | |
| 1 | Includes capital share activity of the Predecessor Fund prior to the reorganization. |
| 2 | See Note 1 regarding the reorganization. |
| 3 | Commencement of operations. |
| | | | | | |
| | | BLACKROCK CAPITAL APPRECIATION FUND, INC. | | MARCH 31, 2011 | | 21 |
| | |
| Notes to Financial Statements (concluded) | | |
| | | | | | | | | | | | | | | | | | | | |
| | | Six Months Ended
March 31, 2011 | | Year Ended
September 30, 2010 |
| | | Shares | | Amount | | Shares | | Amount |
| | | | |
Investor B1 | | | | | | | | |
Shares issued in the reorganization2 | | | | – | | | | | – | | | | | 10,532,951 | | | | $ | 175,499,052 | |
Net change in shares from the reorganization2 | | | | – | | | | | – | | | | | (98,792 | ) | | | | – | |
Shares sold | | | | 593,839 | | | | $ | 11,885,049 | | | | | 322,373 | | | | | 5,319,465 | |
| | | | | | | | | | | | | | | | | | | | |
Total issued | | | | 593,839 | | | | | 11,885,049 | | | | | 10,756,532 | | | | | 180,818,517 | |
Shares redeemed and automatic conversion of shares | | | | (2,984,095 | ) | | | | (59,914,640 | ) | | | | (1,921,260 | ) | | | | (31,391,002 | ) |
| | | | | | | | | | | | | | | | | | | | |
Net increase (decrease) | | | | (2,390,256 | ) | | | $ | (48,029,591 | ) | | | | 8,835,272 | | | | $ | 149,427,515 | |
| | | | | | | | | | | | | | | | | | | | |
| | | | |
Investor C1 | | | | | | | | |
Shares issued in the reorganization2 | | | | – | | | | | – | | | | | 33,201,701 | | | | $ | 556,154,494 | |
Net change in shares from the reorganization2 | | | | – | | | | | – | | | | | (398,539 | ) | | | | – | |
Shares sold | | | | 3,595,515 | | | | $ | 73,308,313 | | | | | 1,922,915 | | | | | 30,131,646 | |
| | | | | | | | | | | | | | | | | | | | |
Total issued | | | | 3,595,515 | | | | | 73,308,313 | | | | | 34,726,077 | | | | | 586,286,140 | |
Shares redeemed | | | | (4,221,698 | ) | | | | (85,239,576 | ) | | | | (2,607,119 | ) | | | | (42,862,133 | ) |
| | | | | | | | | | | | | | | | | | | | |
Net increase (decrease) | | | | (626,183 | ) | | | $ | (11,931,263 | ) | | | | 32,118,958 | | | | $ | 543,424,007 | |
| | | | | | | | | | | | | | | | | | | | |
| | | |
| | | | | | | Period
June 28, 20103 to
September 30, 2010 |
| | | | | | | Shares | | Amount |
Class R | | | | | | | | |
Shares issued in the reorganization2 | | | | – | | | | | – | | | | | 3,964,636 | | | | $ | 68,510,310 | |
Shares sold | | | | 1,290,846 | | | | $ | 27,175,035 | | | | | 452,808 | | | | | 7,777,118 | |
| | | | | | | | | | | | | | | | | | | | |
Total issued | | | | 1,290,846 | | | | | 27,175,035 | | | | | 4,417,444 | | | | | 76,287,428 | |
Shares redeemed | | | | (910,608 | ) | | | | (19,118,186 | ) | | | | (393,150 | ) | | | | (6,833,368 | ) |
| | | | | | | | | | | | | | | | | | | | |
Net increase | | | | 380,238 | | | | $ | 8,056,849 | | | | | 4,024,294 | | | | $ | 69,454,060 | |
| | | | | | | | | | | | | | | | | | | | |
| 1 | Includes capital share activity of the Predecessor Fund prior to the reorganization. |
| 2 | See Note 1 regarding the reorganization. |
| 3 | Commencement of operations. |
8. Subsequent Events:
Management has evaluated the impact of all subsequent events on the Fund through the date the financial statements were issued and has determined that there were no subsequent events requiring adjustment or additional disclosure in the financial statements.
| | | | | | |
| 22 | | BLACKROCK CAPITAL APPRECIATION FUND, INC. | | MARCH 31, 2011 | | |
Officers and Directors
Robert M. Hernandez, Chairman of the Board, Member of the Audit Committee and Director
Fred G. Weiss, Vice Chairman of the Board, Chairman of the Audit Committee and Director
James H. Bodurtha, Director
Bruce R. Bond, Director
Donald W. Burton, Director
Richard S. Davis, Director
Honorable Stuart E. Eizenstat, Director and Member of the Audit Committee
Laurence D. Fink, Director
Kenneth A. Froot, Director
Henry Gabbay, Director
John F. O’Brien, Director
Roberta Cooper Ramo, Director
David H. Walsh, Director
John M. Perlowski, President and Chief Executive Officer
Brendan Kyne, Vice President
Brian Schmidt, Vice President
Neal Andrews, Chief Financial Officer
Jay Fife, Treasurer
Brian Kindelan, Chief Compliance Officer
Ira P. Shapiro, Secretary
Investment Advisor
BlackRock Advisors, LLC
Wilmington, DE 19809
Sub-Advisor
BlackRock Investment Management, LLC
Plainsboro, NJ 08536
Accounting Agent and Transfer Agent
BNY Mellon Investment Servicing (US) Inc.
Wilmington, DE 19809
Custodian
The Bank of New York Mellon
New York, NY 10286
Distributor
BlackRock Investments, LLC
New York, NY 10022
Legal Counsel
Willkie Farr & Gallagher LLP
New York, NY 10019
Independent Registered Public Accounting Firm
Deloitte & Touche LLP
Philadelphia, PA 19103
Address of the Fund
100 Bellevue Parkway
Wilmington, DE 19809
Effective November 10, 2010, Ira P. Shapiro became Secretary of the Fund.
Effective December 31, 2010, Richard R. West retired as Director of the Fund. The Board wishes Mr. West well in his retirement.
| | | | | | |
| | | BLACKROCK CAPITAL APPRECIATION FUND, INC. | | MARCH 31, 2011 | | 23 |
Additional Information
General Information
Electronic Delivery
Electronic copies of most financial reports and prospectuses are available on the Fund’s website or shareholders can sign up for e-mail notifications of quarterly statements, annual and semi-annual reports and prospectuses by enrolling in the Fund’s electronic delivery program.
To enroll:
Shareholders Who Hold Accounts with Investment Advisors, Banks or Brokerages:
Please contact your financial advisor. Please note that not all investment advisors, banks or brokerages may offer this service.
Shareholders Who Hold Accounts Directly With BlackRock
| 1) | Access the BlackRock website at http://www.blackrock.com/ edelivery |
| 2) | Select “eDelivery” under the “More Information” section |
Householding
The Fund will mail only one copy of shareholder documents, including annual and semi-annual reports and proxy statements, to shareholders with multiple accounts at the same address. This practice is commonly called “householding” and it is intended to reduce expenses and eliminate duplicate mailings of shareholder documents. Mailings of your shareholder documents may be householded indefinitely unless you instruct us otherwise. If you do not want the mailing of these documents to be combined with those for other members of your household, please contact the Fund at (800) 441-7762.
Availability of Quarterly Portfolio Schedule
The Fund files its complete schedule of portfolio holdings with the Securities and Exchange Commission (the “SEC”) for the first and third quarters of each fiscal year on Form N-Q. The Fund’s Forms N-Q are available on the SEC’s website at http://www.sec.gov and may also be reviewed and copied at the SEC’s Public Reference Room in Washington, D.C. Information on how to access documents on the SEC’s website without charge may be obtained by calling (800) SEC-0330. The Fund’s Forms N-Q may also be obtained upon request and without charge by calling (800) 441-7762.
Availability of Proxy Voting Policies and Procedures
A description of the policies and procedures that the Fund uses to determine how to vote proxies relating to portfolio securities is available (1) without charge, upon request, by calling (800) 441-7762; (2) at http://www.blackrock.com; and (3) on the SEC’s website at http:// www.sec.gov.
Availability of Proxy Voting Record
Information about how the Fund voted proxies relating to securities held in the Fund’s portfolios during the most recent 12-month period ended June 30 is available, upon request and without charge (1) at http:// www.blackrock.com or by calling (800) 441-7762 and (2) on the SEC’s website at http://www.sec.gov.
Shareholder Privileges
Account Information
Call us at (800) 441-7762 from 8:00 AM to 6:00 PM EST on any business day to get information about your account balances, recent transactions and share prices. You can also reach us on the Web at http:// www.blackrock.com/funds.
Automatic Investment Plans
Investor Class shareholders who want to invest regularly can arrange to have $50 or more automatically deducted from their checking or savings account and invested in any of the BlackRock funds.
Systematic Withdrawal Plan
Investor Class shareholders can establish a systematic withdrawal plan and receive periodic payments of $50 or more from their BlackRock portfolios, as long as their account balance is at least $10,000.
Retirement Plans
Shareholders may make investments in conjunction with Traditional, Rollover, Roth, Coverdell, Simple IRAs, SEP IRAs and 403(b) Plans.
| | | | | | |
| 24 | | BLACKROCK CAPITAL APPRECIATION FUND, INC. | | MARCH 31, 2011 | | |
Additional Information (concluded)
BlackRock Privacy Principles
BlackRock is committed to maintaining the privacy of its current and former fund investors and individual clients (collectively, “Clients”) and to safeguarding their non-public personal information. The following information is provided to help you understand what personal information BlackRock collects, how we protect that information and why in certain cases we share such information with select parties.
If you are located in a jurisdiction where specific laws, rules or regulations require BlackRock to provide you with additional or different privacy-related rights beyond what is set forth below, then BlackRock will comply with those specific laws, rules or regulations.
BlackRock obtains or verifies personal non-public information from and about you from different sources, including the following: (i) information we receive from you or, if applicable, your financial intermediary, on applications, forms or other documents; (ii) information about your transactions with us, our affiliates, or others; (iii) information we receive from a consumer reporting agency; and (iv) from visits to our websites.
BlackRock does not sell or disclose to non-affiliated third parties any non-public personal information about its Clients, except as permitted by law or as is necessary to respond to regulatory requests or to service Client accounts. These non-affiliated third parties are required to protect the confidentiality and security of this information and to use it only for its intended purpose.
We may share information with our affiliates to service your account or to provide you with information about other BlackRock products or services that may be of interest to you. In addition, BlackRock restricts access to non-public personal information about its Clients to those BlackRock employees with a legitimate business need for the information. BlackRock maintains physical, electronic and procedural safeguards that are designed to protect the non-public personal information of its Clients, including procedures relating to the proper storage and disposal of such information.
| | | | | | |
| | | BLACKROCK CAPITAL APPRECIATION FUND, INC. | | MARCH 31, 2011 | | 25 |
A World-Class Mutual Fund Family
BlackRock offers a diverse lineup of open-end mutual funds crossing all investment styles and managed by experts in equity, fixed income and tax-exempt investing.
| | | | | | | | |
Equity Funds | | | | |
BlackRock All-Cap Energy & Resources Portfolio | | BlackRock Global SmallCap Fund | | BlackRock Mid Cap Value Opportunities Fund |
BlackRock Asset Allocation Portfolio† | | BlackRock Health Sciences Opportunities Portfolio | | BlackRock Natural Resources Trust |
BlackRock Balanced Capital Fund† | | BlackRock Healthcare Fund | | BlackRock Pacific Fund |
BlackRock Basic Value Fund | | BlackRock Index Equity Portfolio | | BlackRock Russell 1000 Index Fund |
BlackRock Capital Appreciation Fund | | BlackRock India Fund | �� | BlackRock Science & Technology Opportunities Portfolio |
BlackRock China Fund | | BlackRock International Fund | | |
BlackRock Energy & Resources Portfolio | | BlackRock International Index Fund | | BlackRock Small Cap Growth Equity Portfolio |
BlackRock Equity Dividend Fund | | BlackRock International Opportunities Portfolio | | BlackRock Small Cap Growth Fund II |
BlackRock EuroFund | | BlackRock International Value Fund | | BlackRock Small Cap Index Fund |
BlackRock Focus Growth Fund | | BlackRock Large Cap Core Fund | | BlackRock Small/Mid-Cap Growth Portfolio |
BlackRock Focus Value Fund | | BlackRock Large Cap Core Plus Fund | | BlackRock S&P 500 Index Fund |
BlackRock Global Allocation Fund† | | BlackRock Large Cap Growth Fund | | BlackRock S&P 500 Stock Fund |
BlackRock Global Dividend Income Portfolio | | BlackRock Large Cap Value Fund | | BlackRock U.S. Opportunities Portfolio |
BlackRock Global Dynamic Equity Fund | | BlackRock Latin America Fund | | BlackRock Utilities and Telecommunications Fund |
BlackRock Global Emerging Markets Fund | | BlackRock Mid-Cap Growth Equity Portfolio | | BlackRock Value Opportunities Fund |
BlackRock Global Growth Fund | | BlackRock Mid-Cap Value Equity Portfolio | | BlackRock World Gold Fund |
BlackRock Global Opportunities Portfolio | | | | |
| | |
Fixed Income Funds | | | | |
BlackRock Bond Index Fund | | BlackRock Income Portfolio† | | BlackRock Multi-Sector Bond Portfolio |
BlackRock Bond Portfolio | | BlackRock Inflation Protected Bond Portfolio | | BlackRock Short-Term Bond Fund |
BlackRock Emerging Market Debt Portfolio | | BlackRock Intermediate Government Bond Portfolio | | BlackRock Strategic Income Opportunities Portfolio |
BlackRock Floating Rate Income Portfolio | | | | BlackRock Total Return Fund |
BlackRock GNMA Portfolio | | BlackRock International Bond Portfolio | | BlackRock Total Return Portfolio II |
BlackRock Government Income Portfolio | | BlackRock Long Duration Bond Portfolio | | BlackRock World Income Fund |
BlackRock High Income Fund | | BlackRock Low Duration Bond Portfolio | | |
BlackRock High Yield Bond Portfolio | | BlackRock Managed Income Portfolio | | |
Municipal Bond Funds | | | | |
BlackRock AMT-Free Municipal Bond Portfolio | | BlackRock Municipal Fund | | BlackRock New York Municipal Bond Fund |
BlackRock California Municipal Bond Fund | | BlackRock National Municipal Fund | | BlackRock Pennsylvania Municipal Bond Fund |
BlackRock High Yield Municipal Fund | | BlackRock New Jersey Municipal Bond Fund | | BlackRock Short-Term Municipal Fund |
BlackRock Intermediate Municipal Fund | | | | |
| | |
Target Risk & Target Date Funds† | | | | |
BlackRock Prepared Portfolios | | BlackRock Lifecycle Prepared Portfolios | | BlackRock LifePath Portfolios |
Conservative Prepared Portfolio | | 2015 | | 2035 | | Retirement | | 2040 |
Moderate Prepared Portfolio | | 2020 | | 2040 | | 2020 | | 2045 |
Growth Prepared Portfolio | | 2020 | | 2045 | | 2025 | | 2050 |
Aggressive Growth Prepared Portfolio | | 2030 | | 2050 | | 2030 | | 2055 |
| | | | | | 2035 | | |
BlackRock mutual funds are distributed by BlackRock Investments, LLC. You should consider the investment objectives, risks, charges and expenses of the funds under consideration carefully before investing. Each fund’s prospectus contains this and other information and is available at www.blackrock.com or by calling (800) 441-7762 or from your financial advisor. The prospectus should be read carefully before investing.
| | | | | | |
| 26 | | BLACKROCK CAPITAL APPRECIATION FUND, INC. | | MARCH 31, 2011 | | |
[THIS PAGE INTENTIONALLY LEFT BLANK.]
This report is transmitted to shareholders only. It is not authorized for use as an offer of sale or a solicitation of an offer to buy shares of the Fund unless accompanied or preceded by the Fund’s current prospectus. Past performance results shown in this report should not be considered a representation of future performance. Investment returns and principal value of shares will fluctuate so that shares, when redeemed, may be worth more or less than their original cost. Statements and other information herein are as dated and are subject to change.

| | |
| CapApp-3/11-SAR | |  |
| | | | |
| Item 2 | | – | | Code of Ethics – Not Applicable to this semi-annual report |
| | |
| Item 3 | | – | | Audit Committee Financial Expert – Not Applicable to this semi-annual report |
| | |
| Item 4 | | – | | Principal Accountant Fees and Services – Not Applicable to this semi-annual report |
| | |
| Item 5 | | – | | Audit Committee of Listed Registrants – Not Applicable |
| | |
| Item 6 | | – | | Investments |
| | |
| | | | (a) The registrant’s Schedule of Investments is included as part of the Report to Stockholders filed under Item 1 of this Form. |
| | |
| | | | (b) Not Applicable due to no such divestments during the semi-annual period covered since the previous Form N-CSR filing. |
| | |
| Item 7 | | – | | Disclosure of Proxy Voting Policies and Procedures for Closed-End Management Investment Companies – Not Applicable |
| | |
| Item 8 | | – | | Portfolio Managers of Closed-End Management Investment Companies – Not Applicable |
| | |
| Item 9 | | – | | Purchases of Equity Securities by Closed-End Management Investment Company and Affiliated Purchasers – Not Applicable |
| | |
| Item 10 | | – | | Submission of Matters to a Vote of Security Holders – There have been no material changes to these procedures. |
| | |
| Item 11 | | – | | Controls and Procedures |
| | |
| 11(a) | | – | | The registrant’s principal executive and principal financial officers, or persons performing similar functions, have concluded that the registrant’s disclosure controls and procedures (as defined in Rule 30a-3(c) under the Investment Company Act of 1940, as amended (the “1940 Act”)) are effective as of a date within 90 days of the filing of this report based on the evaluation of these controls and procedures required by Rule 30a-3(b) under the 1940 Act and Rule 15d-15(b) under the Securities Exchange Act of 1934, as amended. |
| | |
| 11(b) | | – | | There were no changes in the registrant’s internal control over financial reporting (as defined in Rule 30a-3(d) under the 1940 Act) that occurred during the second fiscal quarter of the period covered by this report that have materially affected, or are reasonably likely to materially affect, the registrant’s internal control over financial reporting. |
| | |
| Item 12 | | – | | Exhibits attached hereto |
| | |
| 12(a)(1) | | – | | Code of Ethics – Not Applicable to this semi-annual report |
| | |
| 12(a)(2) | | – | | Certifications – Attached hereto |
| | |
| 12(a)(3) | | – | | Not Applicable |
| | |
| 12(b) | | – | | Certifications – Attached hereto |
Pursuant to the requirements of the Securities Exchange Act of 1934 and the Investment Company Act of 1940, the registrant has duly caused this report to be signed on its behalf by the undersigned, thereunto duly authorized.
BlackRock Capital Appreciation Fund, Inc.
| | | | | | |
| By: | | /s/ John M. Perlowski | | | | |
| | John M. Perlowski | | | | |
| | Chief Executive Officer (principal executive officer) of | | |
| | BlackRock Capital Appreciation Fund, Inc. | | | | |
Date: June 3, 2011
Pursuant to the requirements of the Securities Exchange Act of 1934 and the Investment Company Act of 1940, this report has been signed below by the following persons on behalf of the registrant and in the capacities and on the dates indicated.
| | | | | | |
| By: | | /s/ John M. Perlowski | | | | |
| | John M. Perlowski | | | | |
| | Chief Executive Officer (principal executive officer) of | | |
| | BlackRock Capital Appreciation Fund, Inc. | | | | |
Date: June 3, 2011
| | | | | | |
| By: | | /s/ Neal J. Andrews | | | | |
| | Neal J. Andrews | | | | |
| | Chief Financial Officer (principal financial officer) of | | |
| | BlackRock Capital Appreciation Fund, Inc. | | | | |
Date: June 3, 2011