UNITED STATES
SECURITIES AND EXCHANGE COMMISSION
Washington, D.C. 20549
FORM N-CSR
CERTIFIED SHAREHOLDER REPORT OF REGISTERED MANAGEMENT INVESTMENT COMPANIES
Investment Company Act file number: 811-06669
Name of Fund: BlackRock Capital Appreciation Fund, Inc.
Fund Address: 100 Bellevue Parkway, Wilmington, DE 19809
Name and address of agent for service: John M. Perlowski, Chief Executive Officer, BlackRock Capital Appreciation Fund, Inc., 55 East 52nd Street, New York, NY 10055
Registrant’s telephone number, including area code: (800) 441-7762
Date of fiscal year end: 09/30/2014
Date of reporting period: 03/31/2014
Item 1 – Report to Stockholders
MARCH 31, 2014
| | | | |
SEMI-ANNUAL REPORT (UNAUDITED) | | | | BLACKROCK® |
| | | | |
| | BlackRock Capital Appreciation Fund, Inc. | | |
| | |
| Not FDIC Insured ¡ May Lose Value ¡ No Bank Guarantee | | |
| | | | | | |
| 2 | | BLACKROCK CAPITAL APPRECIATION FUND, INC. | | MARCH 31, 2014 | | |
Dear Shareholder,
One year ago, U.S. financial markets were improving despite a sluggish global economy, as easy monetary policy provided investors with enough conviction to take on more risk in their portfolios. Slow but positive growth in the U.S. was sufficient to support corporate earnings, while uncomfortably high unemployment reinforced expectations that the Federal Reserve would continue to maintain its aggressive monetary stimulus programs.
Sentiment swiftly reversed in May when then-Fed Chairman Bernanke first mentioned the possibility of reducing (or “tapering”) the central bank’s asset purchase programs — comments that were widely misinterpreted as signaling an end to the Fed’s zero-interest-rate policy. U.S. Treasury yields rose sharply, triggering a steep sell-off across fixed income markets. (Bond prices move in the opposite direction of yields.) Global equities also suffered as investors feared the implications of a potential end to a program that had greatly supported the markets. Emerging markets, which are more sensitive to changes in global liquidity, were particularly hurt by the prospect of ebbing cash flows from the U.S. Markets rebounded in late June, however, when the Fed’s tone turned more dovish, and improving economic indicators and better corporate earnings helped extend gains through most of the summer.
Although the tone of economic and financial news was mixed during the autumn, it was a surprisingly positive period for most asset classes. Early on, the Fed defied market expectations with its decision to delay tapering, but higher volatility returned in late September when the U.S. Treasury Department warned that the national debt would soon breach its statutory maximum. The ensuing political brinksmanship led to a partial government shutdown, roiling global financial markets through the first half of October. Equities and other so-called “risk assets” managed to resume their rally when politicians engineered a compromise to reopen the government and extend the debt ceiling.
The remainder of 2013 was generally positive for stock markets in the developed world, although investors continued to grapple with uncertainty about when and how much the Fed would scale back on stimulus. When the Fed ultimately announced its tapering plans in mid-December, markets reacted positively, as this action signaled the Fed’s perception of real improvement in the economy, and investors were finally relieved from the anxiety that had gripped them for quite some time.
The start of the new year brought another turn in sentiment, as heightened risks in emerging markets and mixed U.S. economic data caused global equities to weaken in January while bond markets found renewed strength. Although these headwinds persisted, equities were back on the rise in February as investors were encouraged by a one-year extension of the U.S. debt ceiling and market-friendly comments from the Fed’s new Chairwoman, Janet Yellen. While U.S. economic data pointed to softer growth, investors viewed this trend as temporarily driven by poor winter weather and continued adding risk to their portfolios on the belief that growth would pick up in the coming months. In March, markets focused on decelerating growth in China and tensions between Russia and Ukraine over the disputed region of Crimea. Additionally, investors were caught off guard by a statement from Chairwoman Yellen indicating that the Fed may raise short-term interest rates earlier than the markets had previously forecasted. Bond markets came under pressure as the middle of the yield curve vaulted higher in response to the unexpected shift in forward guidance.
Against a backdrop of modest economic growth, investors over the past year remained highly attuned to potential changes in monetary policy. Despite the fact that markets were gearing up for a modest shift toward tighter conditions from the Fed, equity markets in the developed world generated strong returns for the six- and 12-month periods ended March 31, with stocks in the United States performing particularly well. In contrast, emerging markets were weighed down by concerns about reduced global liquidity, severe currency weakness, high levels of debt and uneven growth.
Interest rate uncertainty posed a headwind for fixed income assets, and higher-quality sectors of the market experienced heightened volatility and poor performance over the reporting period. High yield bonds, however, benefited from income-oriented investors’ search for yield in the overall low-rate environment. Short-term interest rates remained near zero, keeping yields on money market securities close to historic lows.
At BlackRock, we believe investors need to think globally, extend their scope across a broad array of asset classes and be prepared to move freely as market conditions change over time. We encourage you to talk with your financial advisor and visit www.blackrock.com for further insight about investing in today’s world.
Sincerely,

Rob Kapito
President, BlackRock Advisors, LLC

In a modest global growth environment, expectations around monetary policy changes continued to be a key theme in financial market performance.
Rob Kapito
President, BlackRock Advisors, LLC
| | | | | | | | |
| Total Returns as of March 31, 2014 | |
| | | 6-month | | | 12-month | |
U.S. large cap equities
(S&P 500® Index) | | | 12.51 | % | | | 21.86 | % |
U.S. small cap equities
(Russell 2000® Index) | | | 9.94 | | | | 24.90 | |
International equities
(MSCI Europe, Australasia,
Far East Index) | | | 6.41 | | | | 17.56 | |
Emerging market equities
(MSCI Emerging Markets Index) | | | 1.39 | | | | (1.43 | ) |
3-month Treasury bill
(BofA Merrill Lynch
3-Month U.S. Treasury
Bill Index) | | | 0.03 | | | | 0.07 | |
U.S. Treasury securities
(BofA Merrill Lynch
10- Year U.S. Treasury
Index) | | | 0.85 | | | | (4.38 | ) |
U.S. investment grade
bonds (Barclays U.S.
Aggregate Bond Index) | | | 1.70 | | | | (0.10 | ) |
Tax-exempt municipal
bonds (S&P Municipal Bond Index) | | | 3.91 | | | | 0.31 | |
U.S. high yield bonds
(Barclays U.S. Corporate
High Yield 2% Issuer
Capped Index) | | | 6.66 | | | | 7.53 | |
|
| Past performance is no guarantee of future results. Index performance is shown for illustrative purposes only. You cannot invest directly in an index. | |
| | | | | | | | |
| | | THIS PAGE NOT PART OF YOUR FUND REPORT | | | | | 3 | |
| | |
| Fund Summary as of March 31, 2014 | | |
BlackRock Capital Appreciation Fund, Inc.’s (the “Fund”) investment objective is to seek long-term growth of capital.
|
| Portfolio Management Commentary |
How did the Fund perform?
| Ÿ | | For the six-month period ended March 31, 2014, the Fund underperformed its benchmark, the Russell 1000® Growth Index, and the broad-market S&P 500® Index. The following discussion of relative performance pertains to the Russell 1000® Growth Index. |
What factors influenced performance?
| Ÿ | | While the Fund had been performing above the benchmark index through most of the period, its holdings were not immune to the market volatility toward the end of the period as investors stampeded out of high-growth, more volatile companies in favor of the more defensive, value-oriented areas of the market. For the month of March alone, large-cap value stocks, as represented by the Russell 1000® Value Index, outperformed the Fund’s benchmark by 3.40%. The reversal exacted the greatest toll on the strongest performing stocks of 2013, a number of which were held in the Fund. |
| Ÿ | | Relative to the Russell 1000® Growth Index, the Fund’s holdings in the information technology (“IT”) sector were the largest detractors from performance, with professional networking firm LinkedIn Corp. and Chinese online media company SINA Corp. having the most negative impact. After reporting strong earnings results for the second half of 2013, LinkedIn Corp. shares fell on a lower-than-expected revenue forecast for the fourth quarter, followed by a weak 2014 first-quarter outlook. Of note, the company proceeded to handily beat the fourth-quarter revenue forecast. Broader weakness in the IT sector late in the reporting period also weighed on the stock’s performance. The Fund continued to hold an overweight in LinkedIn Corp. given conviction in the company’s high incremental margin business model, strong network effects and long-term growth potential relative to the current valuation. |
| Ÿ | | SINA shares lost ground amid a confluence of factors, including concerns about growth in China; the larger decline in high-growth technology names; worries about user growth for the company’s social media platform Weibo as well as 2014 margins; and, finally, the turmoil in emerging markets. The Fund’s zero exposure to strong performer Microsoft Corp. also hurt relative performance in IT, as did a position in Citrix Systems, Inc. |
| Ÿ | | Elsewhere in the Fund, energy holdings Gulfport Energy Corp., Laredo Petroleum, Inc. and FMC Technologies, Inc. detracted from returns. |
| Ÿ | | Positive relative performance was supported by favorable stock selection in the health care and consumer discretionary sectors. An underweight to consumer staples also had a positive impact. |
| Ÿ | | In health care, shares of drug maker Valeant Pharmaceuticals International, Inc. posted gains after the company issued strong revenue and earnings forecasts for 2014. Completing the integration of Bausch & Lomb (which Valeant acquired in 2013 to expand its foray into the ophthalmology market) and expectations for new pharmaceutical product |
| | | launches were among the reasons for the upgraded outlook. Allergan, Inc. and Intuitive Surgical, Inc. also contributed to performance in the sector. |
| Ÿ | | Within the consumer discretionary sector, shares of casino operator Wynn Resorts Ltd. surged as the Macau gaming market continued its rapid growth and third-party data suggested the company’s casinos had begun to gain market share. Peer company Melco Crown Entertainment Ltd. also posted strong gains amid expanding growth in the mass market in China, where the company increased its market share. Elsewhere in the sector, online travel retailers Expedia, Inc., TripAdvisor, Inc. and priceline.com, Inc. added to returns as these companies benefited from robust global demand and the continued consumer trend toward booking travel via online and mobile channels. |
| Ÿ | | Also helping relative results was the Fund’s overall underexposure to the consumer staples sector, with zero positions in tobacco, food & staples retailing and beverages proving particularly beneficial. |
Describe recent portfolio activity.
| Ÿ | | The Fund continued to actively manage risk and reduced the overall level of risk in the portfolio during the six-month period. As the top quintile of revenue-growing companies became expensive, the Fund decreased exposure to Superior Growth1 companies (industry leaders taking share, with long-term persistent advantages and untapped growth opportunities) and increased positions in both Durable Growth1 (sustainable business models more mature in their life cycle) and Periodic Growth1 names (businesses that thrive in expanding economies, but where margins are volatile). In addition, the Fund moderated exposure to internet-related and non-U.S. stocks. |
| Ÿ | | On a sector basis, the most notable decrease was within IT, where the Fund trimmed holdings in the software and internet software & services industries. The Fund increased exposure to chemicals (materials), electrical equipment and airlines (industrials), and auto components and hotels, restaurants & leisure (consumer discretionary). |
Describe portfolio positioning at period end.
| Ÿ | | As of period end, the Fund maintained a diversified mix of Durable Growth1 and Superior Growth1 holdings, supplemented by a small number of Periodic Growth1 names. The Fund’s largest sector overweight relative to the Russell 1000® Growth Index remained consumer discretionary given the investment adviser’s favorable view on companies that continue to take share in the expanding growth of consumer wealth globally and, in particular, the rise of e-commerce. The most notable underweight continued to be consumer staples. |
| | 1 | The terms Superior Growth, Durable Growth and Periodic Growth are used, in this context, to denote three distinct categories of growth stocks as viewed by the investment adviser. They are not indicators of individual security performance or that of the strategy. |
The views expressed reflect the opinions of BlackRock as of the date of this report and are subject to change based on changes in market, economic or other conditions. These views are not intended to be a forecast of future events and are no guarantee of future results.
| | | | | | |
| 4 | | BLACKROCK CAPITAL APPRECIATION FUND, INC. | | MARCH 31, 2014 | | |
| | |
| Fund Summary as of March 31, 2014 | | |
| | |
| Ten Largest Holdings | | Percent of
Long-Term
Investments |
| | | | |
Google, Inc., Class A | | | 5 | % |
Visa, Inc., Class A | | | 4 | |
Comcast Corp., Class A | | | 3 | |
Amazon.com, Inc. | | | 3 | |
Gilead Sciences, Inc. | | | 3 | |
priceline.com, Inc. | | | 3 | |
Eaton Corp. PLC | | | 3 | |
Precision Castparts Corp. | | | 3 | |
Yahoo!, Inc. | | | 3 | |
SoftBank Corp. | | | 3 | |
| | |
| Sector Allocation | | Percent of
Long-Term
Investments |
| | | | |
Consumer Discretionary | | | 29 | % |
Information Technology | | | 26 | |
Industrials | | | 15 | |
Health Care | | | 14 | |
Energy | | | 4 | |
Financials | | | 4 | |
Telecommunication Services | | | 3 | |
Materials | | | 3 | |
Consumer Staples | | | 2 | |
For Fund compliance purposes, the Fund’s sector classifications refer to any one or more of the sector sub-classifications used by one or more widely recognized market indexes or ratings group indexes, and/or as defined by the investment advisor. These definitions may not apply for purposes of this report, which may combine sector sub-classifications for reporting ease.
| | | | | | |
| | | BLACKROCK CAPITAL APPRECIATION FUND, INC. | | MARCH 31, 2014 | | 5 |
| | |
| Fund Summary as of March 31, 2014 | | |
|
| Total Return Based on a $10,000 Investment |
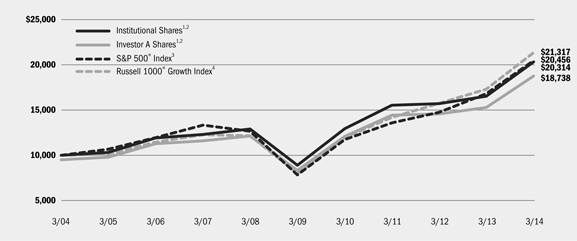
| | 1 | Assuming maximum sales charges, if any, transaction costs and other operating expenses, including investment advisory fees and administration fees, if any. Institutional Shares do not have a sales charge. |
| | 2 | The Fund invests primarily in a diversified portfolio consisting primarily of common stock of U.S. companies that the investment advisor believes have exhibited above-average growth rates in earnings over the long-term. |
| | 3 | This unmanaged index covers 500 industrial, utility, transportation and financial companies of the U.S. markets (mostly New York Stock Exchange (“NYSE”) issues) representing about 75% of NYSE market capitalization and 30% of NYSE issues. |
| | 4 | A subset of the Russell 1000® Index that consists of those Russell 1000® securities with a greater than average growth orientation. |
|
| Performance Summary for the Period Ended March 31, 2014 |
| | | | | | | | | | | | | | | | | | | | | | | | | | | | |
| | | | | | Average Annual Total Returns5 | |
| | | | | | 1 Year | | | 5 Years | | | 10 Years | |
| | | 6-Month Total Returns | | | w/o sales charge | | | w/ sales charge | | | w/o sales charge | | | w/ sales charge | | | w/o sales charge | | | w/ sales charge | |
BlackRock | | | 9.75 | % | | | 23.19 | % | | | N/A | | | | 18.09 | % | | | N/A | | | | 7.49 | % | | | N/A | |
Institutional | | | 9.73 | | | | 23.09 | | | | N/A | | | | 17.97 | | | | N/A | | | | 7.34 | | | | N/A | |
Investor A | | | 9.58 | | | | 22.76 | | | | 16.32 | % | | | 17.63 | | | | 16.36 | % | | | 7.06 | | | | 6.48 | % |
Investor B | | | 8.97 | | | | 21.41 | | | | 16.91 | | | | 16.48 | | | | 16.27 | | | | 6.36 | | | | 6.36 | |
Investor C | | | 9.16 | | | | 21.76 | | | | 20.76 | | | | 16.71 | | | | 16.71 | | | | 6.28 | | | | 6.28 | |
Class R | | | 9.40 | | | | 22.42 | | | | N/A | | | | 17.25 | | | | N/A | | | | 6.65 | | | | N/A | |
Russell 1000® Growth Index | | | 11.67 | | | | 23.22 | | | | N/A | | | | 21.67 | | | | N/A | | | | 7.86 | | | | N/A | |
S&P 500® Index | | | 12.51 | | | | 21.86 | | | | N/A | | | | 21.16 | | | | N/A | | | | 7.42 | | | | N/A | |
| | 5 | Assuming maximum sales charges, if any. Average annual total returns with and without sales charges reflect reductions for distribution and service fees. See “About Fund Performance” on page 7 for a detailed description of share classes, including any related sales charges and fees. |
| | | N/A—Not applicable as share class and index do not have a sales charge. |
| | | Past performance is not indicative of future results. |
| | | | | | | | | | | | | | |
| | | Actual | | Hypothetical7 | | |
| | | Beginning
Account Value
October 1, 2013 | | Ending
Account Value
March 31, 2014 | | Expenses Paid
During the Period6 | | Beginning
Account Value
October 1, 2013 | | Ending
Account Value
March 31, 2014 | | Expenses Paid
During the Period6 | | Annualized
Expense Ratio |
BlackRock | | $1,000.00 | | $1,097.50 | | $3.77 | | $1,000.00 | | $1,021.34 | | $3.63 | | 0.72% |
Institutional | | $1,000.00 | | $1,097.30 | | $4.18 | | $1,000.00 | | $1,020.94 | | $4.03 | | 0.80% |
Investor A | | $1,000.00 | | $1,095.80 | | $5.59 | | $1,000.00 | | $1,019.60 | | $5.39 | | 1.07% |
Investor B | | $1,000.00 | | $1,089.70 | | $11.51 | | $1,000.00 | | $1,013.91 | | $11.10 | | 2.21% |
Investor C | | $1,000.00 | | $1,091.60 | | $9.70 | | $1,000.00 | | $1,015.66 | | $9.35 | | 1.86% |
Class R | | $1,000.00 | | $1,094.00 | | $7.00 | | $1,000.00 | | $1,018.25 | | $6.74 | | 1.34% |
| | 6 | For each class of the Fund, expenses are equal to the annualized expense ratio for the class, multiplied by the average account value over the period, multiplied by 182/365 (to reflect the one-half year period shown). |
| | 7 | Hypothetical 5% annual return before expenses is calculated by pro rating the number of days in the most recent fiscal half year divided by 365. See “Disclosure of Expenses” on page 7 for further information on how expenses were calculated. |
| | | | | | |
| 6 | | BLACKROCK CAPITAL APPRECIATION FUND, INC. | | MARCH 31, 2014 | | |
| Ÿ | | BlackRock and Institutional Shares are not subject to any sales charge. These shares bear no ongoing distribution or service fees and are available only to eligible investors. Prior to June 28, 2010, BlackRock Shares performance results are those of the Institutional Shares of BlackRock Capital Appreciation Portfolio, a series of BlackRock FundsSM (the “Predecessor Fund”). Prior to June 28, 2010, Institutional Shares performance results are those of the Institutional Shares of the Predecessor Fund restated to reflect Institutional Share fees. |
| Ÿ | | Investor A Shares are subject to a maximum initial sales charge (front-end load) of 5.25% and a service fee of 0.25% per year (but no distribution fee). Certain redemptions of these shares may be subject to a contingent deferred sales charge (“CDSC”) where no initial sales charge was paid at the time of purchase. |
| Ÿ | | Investor B Shares are subject to a maximum CDSC of 4.50% declining to 0% after six years. In addition, these shares are subject to a distribution fee of 0.75% per year and a service fee of 0.25% per year. These shares automatically convert to Investor A Shares after approximately eight years. (There is no initial sales charge for automatic share conversions.) All returns for periods greater than eight years reflect this conversion. These shares are only available through exchanges and dividend reinvestments by existing shareholders and for purchase by certain employer-sponsored retirement plans. |
| Ÿ | | Investor C Shares are subject to a 1.00% CDSC if redeemed within one year of purchase. In addition, these shares are subject to a distribution fee of 0.75% per year and a service fee of 0.25% per year. |
| Ÿ | | Class R Shares are not subject to any sales charge. These shares are subject to a distribution fee of 0.25% per year and a service fee of 0.25% per year. These shares are available only to certain employer-sponsored retirement plans. Prior to June 28, 2010, Class R Shares performance results are those of the Institutional Shares of the |
| | | Predecessor Fund (which have no distribution or service fees) restated to reflect Class R Share fees. |
Performance information reflects past performance and does not guarantee future results. Current performance may be lower or higher than the performance data quoted. Refer to www.blackrock.com/funds to obtain performance data current to the most recent month-end. Performance results do not reflect the deduction of taxes that a shareholder would pay on fund distributions or the redemption of fund shares. Figures shown in the performance tables on the previous page assume reinvestment of all dividends and distributions, if any, at net asset value (“NAV”) on the ex-dividend date. Investment return and principal value of shares will fluctuate so that shares, when redeemed, may be worth more or less than their original cost. Dividends paid to each class of shares will vary because of the different levels of service, distribution and transfer agency fees applicable to each class, which are deducted from the income available to be paid to shareholders.
Performance for the Fund for periods prior to June 28, 2010 is based on performance of the Predecessor Fund, that reorganized with the Fund on that date.
Performance for the Fund for the periods prior to January 28, 2005 is based on performance of a certain former State Street Research mutual fund that reorganized with the Predecessor Fund on that date.
BlackRock Advisors, LLC (the “Manager”), the Fund’s investment advisor, waived and/or reimbursed a portion of the Fund’s expenses. Without such waiver and/or reimbursement, the Fund’s performance would have been lower. The Manager is under no obligation to waive or reimburse or to continue waiving or reimbursing its fees after the applicable termination date. See Note 5 of the Notes to Financial Statements for additional information on waivers and reimbursements.
Shareholders of the Fund may incur the following charges: (a) transactional expenses, such as sales charges; and (b) operating expenses, including investment advisory fees, administration fees, service and distribution fees, including 12b-1 fees, acquired fund fees and expenses and other Fund expenses. The expense example on the previous page (which is based on a hypothetical investment of $1,000 invested on October 1, 2013 and held through March 31, 2014) is intended to assist shareholders both in calculating expenses based on an investment in the Fund and in comparing these expenses with similar costs of investing in other mutual funds.
The expense example provides information about actual account values and actual expenses. In order to estimate the expenses a shareholder paid during the period covered by this report, shareholders can divide their account value by $1,000 and then multiply the result by the number corresponding to their share class under the heading entitled “Expenses Paid During the Period.”
The expense example also provides information about hypothetical account values and hypothetical expenses based on the Fund’s actual expense ratio and an assumed rate of return of 5% per year before expenses. In order to assist shareholders in comparing the ongoing expenses of investing in the Fund and other funds, compare the 5% hypothetical example with the 5% hypothetical examples that appear in other funds’ shareholder reports.
The expenses shown in the expense example are intended to highlight shareholders’ ongoing costs only and do not reflect any transactional expenses, such as sales charges, if any. Therefore, the hypothetical example is useful in comparing ongoing expenses only, and will not help shareholders determine the relative total expenses of owning different funds. If these transactional expenses were included, shareholder expenses would have been higher.
| | | | | | |
| | | BLACKROCK CAPITAL APPRECIATION FUND, INC. | | MARCH 31, 2014 | | 7 |
| | |
| Derivative Financial Instruments | | |
The Fund may invest in various derivative financial instruments, including forward foreign currency exchange contracts, as specified in Note 4 of the Notes to Financial Statements, which may constitute forms of economic leverage. Such derivative financial instruments are used to obtain exposure to a security, index and/or market without owning or taking physical custody of securities or to hedge market, and/or foreign currency exchange rate risks. Derivative financial instruments involve risks, including the imperfect correlation between the value of a derivative financial instrument and the underlying asset, possible default of the counterparty to the transaction or illiquidity of the derivative financial instrument. The Fund’s ability to use a derivative financial instrument
successfully depends on the investment advisor’s ability to predict pertinent market movements accurately, which cannot be assured. The use of derivative financial instruments may result in losses greater than if they had not been used, may require a Fund to sell or purchase portfolio investments at inopportune times or for distressed values, may limit the amount of appreciation a Fund can realize on an investment, may result in lower dividends paid to shareholders or may cause a Fund to hold an investment that it might otherwise sell. The Fund’s investments in these instruments are discussed in detail in the Notes to Financial Statements.
| | | | | | |
| 8 | | BLACKROCK CAPITAL APPRECIATION FUND, INC. | | MARCH 31, 2014 | | |
| | | | |
| Schedule of Investments March 31, 2014 (Unaudited) | | | | |
| | | (Percentages shown are based on Net Assets) | |
| | | | | | | | |
| Common Stocks | | Shares | | | Value | |
Aerospace & Defense — 4.7% | | | | | | | | |
Precision Castparts Corp. | | | 429,991 | | | $ | 108,684,525 | |
United Technologies Corp. | | | 706,236 | | | | 82,516,614 | |
| | | | | | | | |
| | | | | | | | 191,201,139 | |
Airlines — 0.8% | | | | | | | | |
American Airlines Group, Inc. (a) | | | 890,304 | | | | 32,585,126 | |
Auto Components — 1.5% | | | | | | | | |
Delphi Automotive PLC | | | 904,179 | | | | 61,357,587 | |
Biotechnology — 6.2% | | | | | | | | |
Gilead Sciences, Inc. (a)(b) | | | 1,639,221 | | | | 116,155,200 | |
Regeneron Pharmaceuticals, Inc. (a)(b) | | | 187,705 | | | | 56,364,057 | |
United Therapeutics Corp. (a) | | | 827,242 | | | | 77,785,565 | |
| | | | | | | | |
| | | | | | | | 250,304,822 | |
Chemicals — 2.7% | | | | | | | | |
Eastman Chemical Co. | | | 542,364 | | | | 46,757,200 | |
Monsanto Co. | | | 531,909 | | | | 60,515,287 | |
| | | | | | | | |
| | | | | | | | 107,272,487 | |
Consumer Finance — 0.9% | | | | | | | | |
Discover Financial Services | | | 650,634 | | | | 37,860,393 | |
Diversified Financial Services — 2.6% | | | | | | | | |
IntercontinentalExchange Group, Inc. | | | 249,797 | | | | 49,417,341 | |
Moody’s Corp. | | | 677,949 | | | | 53,774,915 | |
| | | | | | | | |
| | | | | | | | 103,192,256 | |
Diversified Telecommunication Services — 1.0% | | | | | | | | |
Vivendi SA | | | 1,491,401 | | | | 41,510,159 | |
Electrical Equipment — 5.7% | | | | | | | | |
Eaton Corp. PLC | | | 1,459,056 | | | | 109,604,287 | |
Emerson Electric Co. | | | 816,714 | | | | 54,556,495 | |
Roper Industries, Inc. | | | 344,839 | | | | 46,039,455 | |
SolarCity Corp. (a)(b) | | | 321,023 | | | | 20,102,460 | |
| | | | | | | | |
| | | | | | | | 230,302,697 | |
Energy Equipment & Services — 1.6% | | | | | | | | |
FMC Technologies, Inc. (a) | | | 1,259,196 | | | | 65,843,359 | |
Food Products — 1.2% | | | | | | | | |
Mondelez International, Inc., Class A | | | 1,404,488 | | | | 48,525,060 | |
Health Care Equipment & Supplies — 1.1% | | | | | | | | |
Intuitive Surgical, Inc. (a)(b) | | | 99,205 | | | | 43,450,798 | |
Hotels, Restaurants & Leisure — 4.7% | | | | | | | | |
Starbucks Corp. | | | 1,293,230 | | | | 94,897,217 | |
Wynn Resorts Ltd. | | | 416,365 | | | | 92,495,485 | |
| | | | | | | | |
| | | | | | | | 187,392,702 | |
Internet & Catalog Retail — 7.5% | | | | | | | | |
Amazon.com, Inc. (a) | | | 379,781 | | | | 127,803,902 | |
Expedia, Inc. | | | 447,276 | | | | 32,427,510 | |
priceline.com, Inc. (a) | | | 95,215 | | | | 113,485,806 | |
| | | | | | | | |
| Common Stocks | | Shares | | | Value | |
Internet & Catalog Retail (concluded) | | | | | | | | |
TripAdvisor, Inc. (a)(b) | | | 310,331 | | | $ | 28,112,885 | |
| | | | | | | | |
| | | | | | | | 301,830,103 | |
Internet Software & Services — 14.3% | | | | | | | | |
AOL, Inc. (a) | | | 777,803 | | | | 34,044,437 | |
eBay, Inc. (a) | | | 688,782 | | | | 38,048,318 | |
Facebook, Inc., Class A (a) | | | 790,237 | | | | 47,603,877 | |
Google, Inc., Class A (a) | | | 175,434 | | | | 195,522,947 | |
LinkedIn Corp., Class A (a) | | | 376,437 | | | | 69,618,259 | |
Twitter, Inc. (a)(b) | | | 520,763 | | | | 24,304,009 | |
Yahoo!, Inc. (a) | | | 3,007,411 | | | | 107,966,055 | |
Yelp, Inc. (a)(b) | | | 748,901 | | | | 57,612,954 | |
| | | | | | | | |
| | | | | | | | 574,720,856 | |
IT Services — 7.0% | | | | | | | | |
Alliance Data Systems Corp. (a)(b) | | | 256,471 | | | | 69,875,524 | |
MasterCard, Inc., Class A | | | 742,274 | | | | 55,447,868 | |
Visa, Inc., Class A | | | 722,892 | | | | 156,043,467 | |
| | | | | | | | |
| | | | | | | | 281,366,859 | |
Media — 12.0% | | | | | | | | |
Comcast Corp., Class A | | | 2,659,605 | | | | 133,033,442 | |
Liberty Global PLC, Series A (a) | | | 2,355,857 | | | | 98,003,651 | |
Time Warner, Inc. | | | 1,353,604 | | | | 88,430,949 | |
Twenty-First Century Fox, Inc., Class A | | | 2,272,127 | | | | 72,639,900 | |
The Walt Disney Co. | | | 1,150,480 | | | | 92,118,934 | |
| | | | | | | | |
| | | | | | | | 484,226,876 | |
Oil, Gas & Consumable Fuels — 1.9% | | | | | | | | |
Concho Resources, Inc. (a) | | | 303,788 | | | | 37,214,030 | |
Laredo Petroleum, Inc. (a)(b) | | | 1,532,504 | | | | 39,630,554 | |
| | | | | | | | |
| | | | | | | | 76,844,584 | |
Personal Products — 1.1% | | | | | | | | |
The Estee Lauder Cos., Inc., Class A | | | 688,286 | | | | 46,032,568 | |
Pharmaceuticals — 6.0% | | | | | | | | |
AbbVie, Inc. | | | 1,912,887 | | | | 98,322,392 | |
Allergan, Inc. | | | 349,993 | | | | 43,434,131 | |
Valeant Pharmaceuticals International, Inc. (a) | | | 746,809 | | | | 98,451,831 | |
| | | | | | | | |
| | | | | | | | 240,208,354 | |
Professional Services — 0.9% | | | | | | | | |
Verisk Analytics, Inc., Class A (a) | | | 597,280 | | | | 35,812,909 | |
Road & Rail — 2.4% | | | | | | | | |
Union Pacific Corp. | | | 520,595 | | | | 97,694,858 | |
Software — 3.4% | | | | | | | | |
Autodesk, Inc. (a) | | | 1,402,052 | | | | 68,952,917 | |
VMware, Inc., Class A (a)(b) | | | 633,692 | | | | 68,451,410 | |
| | | | | | | | |
| | | | | | | | 137,404,327 | |
| | |
JPY | | Japanese Yen |
USD | | U.S. Dollar |
See Notes to Financial Statements.
| | | | | | |
| | | BLACKROCK CAPITAL APPRECIATION FUND, INC. | | MARCH 31, 2014 | | 9 |
| | | | |
| Schedule of Investments (continued) | | | | |
| | | (Percentages shown are based on Net Assets) | |
| | | | | | | | |
| Common Stocks | | Shares | | | Value | |
Specialty Retail — 0.5% | | | | | | | | |
Lumber Liquidators Holdings, Inc. (a) | | | 221,825 | | | $ | 20,807,185 | |
Textiles, Apparel & Luxury Goods — 2.0% | | | | | | | | |
NIKE, Inc., Class B | | | 1,108,855 | | | | 81,900,030 | |
Wireless Telecommunication Services — 2.5% | | | | | | | | |
SoftBank Corp. | | | 1,311,700 | | | | 99,122,883 | |
Total Long-Term Investments (Cost — $2,967,959,508) — 96.2% | | | | 3,878,770,977 | |
| | | | | | | | |
| Preferred Stocks | | | | | | |
Software — 0.8% | | | | | | | | |
Palantir Technologies, Inc. (Acquired 2/07/14, cost $31,222,542) (c) | | | 5,093,400 | | | | 31,222,542 | |
Total Preferred Stocks — 0.8% | | | | | | | 31,222,542 | |
Total Long-Term Investments (Cost — $2,999,182,050) — 97.0% | | | | 3,909,993,519 | |
| | | | | | | | |
| | | | | | | |
| | | | | | | | |
| Short-Term Securities | | Shares | | | Value | |
BlackRock Liquidity Funds, TempFund, Institutional Class, 0.03% (d)(e) | | | 120,008,118 | | | $ | 120,008,118 | |
| | | | | | | | |
| | | Beneficial
Interest (000) | | | | |
BlackRock Liquidity Series, LLC, Money Market Series, 0.16% (d)(e)(f) | | $ | 250,246 | | | | 250,245,640 | |
Total Short-Term Securities (Cost — $370,253,758) — 9.2% | | | | 370,253,758 | |
Total Investments (Cost — $3,369,435,808) — 106.2% | | | | 4,280,247,277 | |
Liabilities in Excess of Other Assets — (6.2)% | | | | (249,316,245 | ) |
| | | | | | | | |
Net Assets — 100.0% | | | | | | $ | 4,030,931,032 | |
| | | | | | | | |
|
| Notes to Schedule of Investments |
| (a) | Non-income producing security. |
| (b) | Security, or a portion of security, is on loan. |
| (c) | Restricted security as to resale. As of report date, the Fund held restricted securities with a current value of $31,222,542 and an original cost of $31,222,542 which was 0.8% of its net assets. |
| (d) | Investments in issuers considered to be an affiliate of the Fund during the six months ended March 31, 2014, for purposes of Section 2(a)(3) of the Investment Company Act of 1940, as amended, were as follows: |
| | | | | | | | | | | | | | | | |
| Affiliate | | Shares/Beneficial
Interest Held at
September 30, 2013 | | | Net Activity | | | Shares/Beneficial
Interest Held at
March 31, 2014 | | | Income | |
BlackRock Liquidity Funds, TempFund, Institutional Class | | | — | | | | 120,008,118 | | | | 120,008,118 | | | $ | 3,740 | |
BlackRock Liquidity Series, LLC, Money Market Series | | $ | 234,256,943 | | | $ | 15,988,697 | | | $ | 250,245,640 | | | $ | 251,346 | |
| (e) | Represents the current yield as of report date. |
| (f) | Security was purchased with the cash collateral from loaned securities. The Fund may withdraw up to 25% of its investment daily, although the manager of the BlackRock Liquidity Series, LLC, Money Market Series, in its sole discretion, may permit an investor to withdraw more than 25% on any one day. |
| Ÿ | | For Fund compliance purposes, the Fund’s industry classifications refer to any one or more of the industry sub-classifications used by one or more widely recognized market indexes or ratings group indexes, and/or as defined by the investment advisor. These definitions may not apply for purposes of this report, which may combine such industry sub-classifications for reporting ease. |
| Ÿ | | Forward foreign currency exchange contracts outstanding as of March 31, 2014 were as follows: |
| | | | | | | | | | | | | | | | | | | | | | |
Currency Purchased | | | Currency
Sold | | | Counterparty | | Settlement
Date | | | Unrealized
Appreciation | |
| USD | | | 74,843,379 | | | | JPY | | | | 7,652,720,549 | | | Royal Bank of Scotland PLC | | | 5/28/14 | | | $ | 676,641 | |
| Ÿ | | Fair Value Measurements — Various inputs are used in determining the fair value of investments and derivative financial instruments. These inputs to valuation techniques are categorized into a disclosure hierarchy consisting of three broad levels for financial statement purposes as follows: |
| | Ÿ | | Level 1 — unadjusted price quotations in active markets/exchanges for identical assets or liabilities that the Fund has the ability to access |
| | Ÿ | | Level 2 — other observable inputs (including, but not limited to, quoted prices for similar assets or liabilities in markets that are active, quoted prices for identical or similar assets or liabilities in markets that are not active, inputs other than quoted prices that are observable for the assets or liabilities (such as interest rates, yield curves, volatilities, prepayment speeds, loss severities, credit risks and default rates) or other market–corroborated inputs) |
See Notes to Financial Statements.
| | | | | | |
| 10 | | BLACKROCK CAPITAL APPRECIATION FUND, INC. | | MARCH 31, 2014 | | |
| | |
| Schedule of Investments (continued) | | |
| | Ÿ | | Level 3 — unobservable inputs based on the best information available in the circumstances, to the extent observable inputs are not available (including the Fund’s own assumptions used in determining the fair value of investments and derivative financial instruments) |
The hierarchy gives the highest priority to unadjusted quoted prices in active markets for identical assets or liabilities (Level 1 measurements) and the lowest priority to unobservable inputs (Level 3 measurements). Accordingly, the degree of judgment exercised in determining fair value is greatest for instruments categorized in Level 3. The inputs used to measure fair value may fall into different levels of the fair value hierarchy. In such cases, for disclosure purposes, the fair value hierarchy classification is determined based on the lowest level input that is significant to the fair value measurement in its entirety.
Changes in valuation techniques may result in transfers into or out of an assigned level within the disclosure hierarchy. In accordance with the Fund’s policy, transfers between different levels of the fair value disclosure hierarchy are deemed to have occurred as of the beginning of the reporting period. The categorization of a value determined for investments and derivative financial instruments is based on the pricing transparency of the investment and derivative financial instrument and is not necessarily an indication of the risks associated with investing in those securities. For information about the Fund’s policy regarding valuation of investments and derivative financial instruments, please refer to Note 2 of the Notes to Financial Statements.
The following tables summarize the Fund’s investments and derivative financial instruments categorized in the disclosure hierarchy as of March 31, 2014:
| | | | | | | | | | | | | | | | |
| | | Level 1 | | | Level 2 | | | Level 3 | | | Total | |
Assets: | | | | | | | | | | | | | | | | |
Investments: | | | | | | | | | | | | | | | | |
Long-Term Investments: | | | | | | | | | | | | | | | | |
Common Stocks: | | | | | | | | | | | | | | | | |
Aerospace & Defense | | $ | 191,201,139 | | | | — | | | | — | | | $ | 191,201,139 | |
Airlines | | | 32,585,126 | | | | — | | | | — | | | | 32,585,126 | |
Auto Components | | | 61,357,587 | | | | — | | | | — | | | | 61,357,587 | |
Biotechnology | | | 250,304,822 | | | | — | | | | — | | | | 250,304,822 | |
Chemicals | | | 107,272,487 | | | | — | | | | — | | | | 107,272,487 | |
Consumer Finance | | | 37,860,393 | | | | — | | | | — | | | | 37,860,393 | |
Diversified Financial Services | | | 103,192,256 | | | | — | | | | — | | | | 103,192,256 | |
Diversified Telecommunication Services | | | — | | | $ | 41,510,159 | | | | — | | | | 41,510,159 | |
Electrical Equipment | | | 230,302,697 | | | | — | | | | — | | | | 230,302,697 | |
Energy Equipment & Services | | | 65,843,359 | | | | — | | | | — | | | | 65,843,359 | |
Food Products | | | 48,525,060 | | | | — | | | | — | | | | 48,525,060 | |
Health Care Equipment & Supplies | | | 43,450,798 | | | | — | | | | — | | | | 43,450,798 | |
Hotels, Restaurants & Leisure | | | 187,392,702 | | | | — | | | | — | | | | 187,392,702 | |
Internet & Catalog Retail | | | 301,830,103 | | | | — | | | | — | | | | 301,830,103 | |
Internet Software & Services | | | 574,720,856 | | | | — | | | | — | | | | 574,720,856 | |
IT Services | | | 281,366,859 | | | | — | | | | — | | | | 281,366,859 | |
Media | | | 484,226,876 | | | | — | | | | — | | | | 484,226,876 | |
Oil, Gas & Consumable Fuels | | | 76,844,584 | | | | — | | | | — | | | | 76,844,584 | |
Personal Products | | | 46,032,568 | | | | — | | | | — | | | | 46,032,568 | |
Pharmaceuticals | | | 240,208,354 | | | | — | | | | — | | | | 240,208,354 | |
Professional Services | | | 35,812,909 | | | | — | | | | — | | | | 35,812,909 | |
Road & Rail | | | 97,694,858 | | | | — | | | | — | | | | 97,694,858 | |
Software | | | 137,404,327 | | | | — | | | | — | | | | 137,404,327 | |
Specialty Retail | | | 20,807,185 | | | | — | | | | — | | | | 20,807,185 | |
Textiles, Apparel & Luxury Goods | | | 81,900,030 | | | | — | | | | — | | | | 81,900,030 | |
Wireless Telecommunication Services | | | — | | | | 99,122,883 | | | | — | | | | 99,122,883 | |
Preferred Stocks | | | — | | | | — | | | $ | 31,222,542 | | | | 31,222,542 | |
Short-Term Securities | | | 120,008,118 | | | | 250,245,640 | | | | — | | | | 370,253,758 | |
Total | | $ | 3,858,146,053 | | | $ | 390,878,682 | | | $ | 31,222,542 | | | $ | 4,280,247,277 | |
| | | | |
| | | | | | | | | | | | | | | | |
| | | Level 1 | | | Level 2 | | | Level 3 | | | Total | |
Derivative Financial Instruments1 | | | | | | | | | | | | | | | | |
Assets: | | | | | | | | | | | | | | | | |
Foreign currency exchange contracts | | | — | | | $ | 676,641 | | | | — | | | $ | 676,641 | |
1 Derivative financial instruments are forward foreign currency exchange contracts which are valued at the unrealized appreciation/depreciation on the instrument. | |
See Notes to Financial Statements.
| | | | | | |
| | | BLACKROCK CAPITAL APPRECIATION FUND, INC. | | MARCH 31, 2014 | | 11 |
| | |
| Schedule of Investments (concluded) | | |
The carrying amount for certain of the Fund’s liabilities approximates fair value for financial statement purposes. As of March 31, 2014, such liabilities are categorized within the disclosure hierarchy as follows:
| | | | | | | | | | | | | | | | |
| | | Level 1 | | | Level 2 | | | Level 3 | | | Total | |
Liabilities: | | | | | | | | | | | | | | | | |
Collateral on securities loaned at value | | | — | | | $ | (250,245,640 | ) | | | — | | | $ | (250,245,640 | ) |
Bank overdraft | | | — | | | | (14,227 | ) | | | — | | | | (14,227 | ) |
Total | | | — | | | $ | (250,259,867 | ) | | | — | | | $ | (250,259,867 | ) |
| | | | |
There were no transfers between levels during the six months ended March 31, 2014.
See Notes to Financial Statements.
| | | | | | |
| 12 | | BLACKROCK CAPITAL APPRECIATION FUND, INC. | | MARCH 31, 2014 | | |
| | |
| Statement of Assets and Liabilities | | |
| | | | |
| March 31, 2014 (Unaudited) | | | |
| | | | |
| Assets | | | | |
Investments at value — unaffiliated (including securities loaned at value of $247,806,365) (cost — $2,999,182,050) | | $ | 3,909,993,519 | |
Investments at value — affiliated (cost — $370,253,758) | | | 370,253,758 | |
Investments sold receivable | | | 86,578,565 | |
Capital shares sold receivable | | | 28,083,000 | |
Dividends receivable — unaffiliated | | | 2,101,634 | |
Dividends receivable — affiliated | | | 570 | |
Unrealized appreciation on forward foreign currency exchange contracts | | | 676,641 | |
Securities lending income receivable — affiliated | | | 108,545 | |
Receivable from Manager | | | 7,681 | |
Prepaid expenses | | | 87,545 | |
| | | | |
Total assets | | | 4,397,891,458 | |
| | | | |
| | | | |
| Liabilities | | | | |
Bank overdraft | | | 14,227 | |
Collateral on securities loaned at value | | | 250,245,640 | |
Investments purchased payable | | | 103,967,952 | |
Capital shares redeemed payable | | | 7,315,982 | |
Investment advisory fees payable | | | 2,181,071 | |
Service and distribution fees payable | | | 1,005,853 | |
Other affiliates payable | | | 205,201 | |
Officer’s and Directors’ fees payable | | | 21,459 | |
Other accrued expenses payable | | | 2,003,041 | |
| | | | |
Total liabilities | | | 366,960,426 | |
| | | | |
Net Assets | | $ | 4,030,931,032 | |
| | | | |
| | | | |
| Net Assets Consist of | | | | |
Paid-in capital | | $ | 2,812,164,884 | |
Accumulated net investment loss | | | (9,226,957 | ) |
Accumulated net realized gain | | | 316,507,413 | |
Net unrealized appreciation/depreciation | | | 911,485,692 | |
| | | | |
Net Assets | | $ | 4,030,931,032 | |
| | | | |
| | | | |
| Net Asset Value | | | | |
BlackRock — Based on net assets of $587,138,706 and 21,051,477 shares outstanding, 300,000,000 shares authorized, $0.10 par value | | $ | 27.89 | |
| | | | |
Institutional — Based on net assets of $914,646,255 and 32,846,423 shares outstanding, 300,000,000 shares authorized, $0.10 par value | | $ | 27.85 | |
| | | | |
Investor A — Based on net assets of $1,788,731,279 and 67,025,738 shares outstanding, 300,000,000 shares authorized, $0.10 par value | | $ | 26.69 | |
| | | | |
Investor B — Based on net assets of $20,204,123 and 898,811 shares outstanding, 500,000,000 shares authorized, $0.10 par value | | $ | 22.48 | |
| | | | |
Investor C — Based on net assets of $630,878,966 and 27,770,743 shares outstanding, 300,000,000 shares authorized, $0.10 par value | | $ | 22.72 | |
| | | | |
Class R — Based on net assets of $89,331,703 and 3,717,647 shares outstanding, 500,000,000 shares authorized, $0.10 par value | | $ | 24.03 | |
| | | | |
See Notes to Financial Statements.
| | | | | | |
| | | BLACKROCK CAPITAL APPRECIATION FUND, INC. | | MARCH 31, 2014 | | 13 |
| | | | |
| Six Months Ended March 31, 2014 (Unaudited) | | | |
| | | | |
| Investment Income | |
Dividends — unaffiliated | | $ | 13,657,697 | |
Other income — affiliated | | | 467,132 | |
Securities lending — affiliated — net | | | 251,346 | |
Dividends — affiliated | | | 3,740 | |
Foreign taxes withheld | | | (47,410 | ) |
| | | | |
Total income | | | 14,332,505 | |
| | | | |
| | | | |
| Expenses | | | | |
Investment advisory | | | 12,936,732 | |
Service and distribution — Investor A | | | 2,331,510 | |
Service and distribution — Investor B | | | 122,757 | |
Service and distribution — Investor C | | | 3,211,073 | |
Service and distribution — Class R | | | 235,418 | |
Transfer agent — BlackRock | | | 321,811 | |
Transfer agent — Institutional | | | 788,955 | |
Transfer agent — Investor A | | | 1,678,751 | |
Transfer agent — Investor B | | | 69,214 | |
Transfer agent — Investor C | | | 699,224 | |
Transfer agent — Class R | | | 91,068 | |
Administration | | | 249,315 | |
Custodian | | | 86,770 | |
Professional | | | 68,275 | |
Registration | | | 56,933 | |
Printing | | | 43,028 | |
Officer and Directors | | | 39,638 | |
Miscellaneous | | | 43,930 | |
| | | | |
Total expenses | | | 23,074,402 | |
Less fees waived by Manager | | | (7,308 | ) |
Less transfer agent fees waived — BlackRock | | | (1,641 | ) |
Less transfer agent fees reimbursed — BlackRock | | | (105,784 | ) |
| | | | |
Total expenses after fees waived and reimbursed | | | 22,959,669 | |
| | | | |
Net investment loss | | | (8,627,164 | ) |
| | | | |
| | | | |
| Realized and Unrealized Gain (Loss) | | | | |
Net realized gain (loss) from: | | | | |
Investments | | | 393,924,525 | |
Foreign currency transactions | | | (1,153,797 | ) |
| | | | |
| | | 392,770,728 | |
| | | | |
Net change in unrealized appreciation/depreciation on: | | | | |
Investments | | | 5,643,810 | |
Foreign currency translations | | | 729,906 | |
| | | | |
| | | 6,373,716 | |
| | | | |
Total realized and unrealized gain | | | 399,144,444 | |
| | | | |
Net Increase in Net Assets Resulting from Operations | | $ | 390,517,280 | |
| | | | |
See Notes to Financial Statements.
| | | | | | |
| 14 | | BLACKROCK CAPITAL APPRECIATION FUND, INC. | | MARCH 31, 2014 | | |
| | |
| Statements of Changes in Net Assets | | |
| | | | | | | | |
| Increase (Decrease) in Net Assets: | | Six Months Ended March 31, 2014 (Unaudited) | | | Year Ended September 30, 2013 | |
| | | | | | | | |
| Operations | | | | | | | | |
Net investment income (loss) | | $ | (8,627,164 | ) | | $ | 9,047,628 | |
Net realized gain | | | 392,770,728 | | | | 1,021,125,421 | |
Net change in unrealized appreciation/depreciation | | | 6,373,716 | | | | (335,982,316 | ) |
| | | | |
Net increase in net assets resulting from operations | | | 390,517,280 | | | | 694,190,733 | |
| | | | |
| | | | | | | | |
| Dividends and Distributions to Shareholders From | | | | | | | | |
Net investment income: | | | | | | | | |
BlackRock | | | — | | | | (7,219,609 | )1 |
Institutional | | | — | | | | (9,017,557 | )1 |
Investor A | | | — | | | | (3,763,148 | )1 |
Net realized gain: | | | | | | | | |
BlackRock | | | (75,564,333 | ) | | | — | |
Institutional | | | (140,169,800 | ) | | | — | |
Investor A | | | (262,649,073 | ) | | | — | |
Investor B | | | (3,890,530 | ) | | | — | |
Investor C | | | (99,584,571 | ) | | | — | |
Class R | | | (14,352,101 | ) | | | — | |
| | | | |
Decrease in net assets resulting from dividends and distributions to shareholders | | | (596,210,408 | ) | | | (20,000,314 | ) |
| | | | |
| | | | | | | | |
| Capital Share Transactions | | | | | | | | |
Net increase (decrease) in net assets derived from capital share transactions | | | 91,172,422 | | | | (1,902,976,968 | ) |
| | | | |
| | | | | | | | |
| Net Assets | | | | | | | | |
Total decrease in net assets | | | (114,520,706 | ) | | | (1,228,786,549 | ) |
Beginning of period | | | 4,145,451,738 | | | | 5,374,238,287 | |
| | | | |
End of period | | $ | 4,030,931,032 | | | $ | 4,145,451,738 | |
| | | | |
Accumulated net investment loss, end of period | | $ | (9,226,957 | ) | | $ | (599,793 | ) |
| | | | |
| | 1 | Determined in accordance with federal income tax regulations. |
See Notes to Financial Statements.
| | | | | | |
| | | BLACKROCK CAPITAL APPRECIATION FUND, INC. | | MARCH 31, 2014 | | 15 |
| | | | | | | | | | | | | | | | | | | | | | | | |
| | | BlackRock | |
| | | Six Months
Ended
March 31,
2014 (Unaudited) | | | Year Ended September 30, | |
| | | | 2013 | | | 2012 | | | 2011 | | | 20101 | | | 20091 | |
| | | | | | | | | | | | | | | | | | | | | | | | |
| Per Share Operating Performance | | | | | |
Net asset value, beginning of period | | $ | 29.44 | | | $ | 25.11 | | | $ | 20.25 | | | $ | 20.86 | | | $ | 18.72 | | | $ | 18.94 | |
| | | | |
Net investment income (loss)2 | | | (0.01 | ) | | | 0.16 | | | | 0.14 | | | | 0.07 | | | | 0.05 | | | | 0.09 | |
Net realized and unrealized gain (loss) | | | 2.74 | | | | 4.35 | | | | 4.72 | | | | (0.68 | ) | | | 2.16 | | | | (0.31 | ) |
| | | | |
Net increase (decrease) from investment operations | | | 2.73 | | | | 4.51 | | | | 4.86 | | | | (0.61 | ) | | | 2.21 | | | | (0.22 | ) |
| | | | |
Dividends and distributions from: | | | | | | | | | | | | | | | | | | | | | | | | |
Net investment income | | | — | | | | (0.18 | )3 | | | — | | | | — | | | | (0.07 | )3 | | | — | |
Net realized gain | | | (4.28 | ) | | | — | | | | — | | | | — | | | | — | | | | — | |
| | | | |
Total dividends and distributions | | | (4.28 | ) | | | (0.18 | ) | | | — | | | | — | | | | (0.07 | ) | | | — | |
| | | | |
Net asset value, end of period | | $ | 27.89 | | | $ | 29.44 | | | $ | 25.11 | | | $ | 20.25 | | | $ | 20.86 | | | $ | 18.72 | |
| | | | |
| | | | | | | | | | | | | | | | | | | | | | | | |
| Total Investment Return4 | | | | | |
Based on net asset value | | | 9.75 | %5 | | | 18.12 | % | | | 24.00 | % | | | (2.92 | )% | | | 11.93 | % | | | (1.18 | )%6 |
| | | | |
| | | | | | | | | | | | | | | | | | | | | | | | |
| Ratios to Average Net Assets | | | | | |
Total expenses | | | 0.76 | %7 | | | 0.79 | % | | | 0.77 | % | | | 0.76 | % | | | 0.87 | % | | | 0.92 | % |
| | | | |
Total expenses after fees waived, reimbursed and paid indirectly | | | 0.72 | %7 | | | 0.72 | % | | | 0.72 | % | | | 0.72 | % | | | 0.72 | % | | | 0.71 | % |
| | | | |
Net investment income (loss) | | | (0.04 | )%7 | | | 0.63 | % | | | 0.60 | % | | | 0.28 | % | | | 0.25 | % | | | 0.59 | % |
| | | | |
| | | | | | | | | | | | | | | | | | | | | | | | |
| Supplemental Data | | | | | |
Net assets, end of period (000) | | $ | 587,139 | | | $ | 523,231 | | | $ | 1,010,259 | | | $ | 883,370 | | | $ | 292,967 | | | $ | 192,614 | |
| | | | |
Portfolio turnover | | | 43 | % | | | 134 | % | | | 77 | % | | | 81 | % | | | 71 | % | | | 87 | % |
| | | | |
| | 1 | On June 28, 2010, BlackRock Capital Appreciation Portfolio was reorganized into the Fund. The activity in the table above is for the accounting survivor, BlackRock Capital Appreciation Portfolio, for the periods prior to the date of the reorganization, and for the post-reorganization combined fund thereafter. The net asset values and other per share information have been restated for periods prior to the reorganization to reflect the share conversion ratio of 0.80500157. |
| | 2 | Based on average shares outstanding. |
| | 3 | Determined in accordance with federal income tax regulations. |
| | 4 | Where applicable, assumes the reinvestment of dividends and distributions. |
| | 5 | Aggregate total investment return. |
| | 6 | Includes proceeds received from a settlement of litigation, which impacted the Fund’s total return. Excluding these proceeds, the Fund’s total return would have been (1.31)%. |
See Notes to Financial Statements.
| | | | | | |
| 16 | | BLACKROCK CAPITAL APPRECIATION FUND, INC. | | MARCH 31, 2014 | | |
| | |
| Financial Highlights (continued) | | |
| | | | | | | | | | | | | | | | | | | | |
| | | Institutional | |
| | | Six Months
Ended
March 31, 2014 (Unaudited) | | | Year Ended September 30, | | | Period June 28,
20101 to
September 30, 2010 | |
| | | | 2013 | | | 2012 | | | 2011 | | |
| | | | | | | | | | | | | | | | | | | | |
| Per Share Operating Performance | | | | | | | | | | | | | | | | | | | | |
Net asset value, beginning of period | | $ | 29.39 | | | $ | 25.06 | | | $ | 20.24 | | | $ | 20.86 | | | $ | 19.39 | |
| | | | |
Net investment income (loss)2 | | | (0.02 | ) | | | 0.13 | | | | 0.11 | | | | 0.05 | | | | 0.01 | |
Net realized and unrealized gain (loss) | | | 2.74 | | | | 4.35 | | | | 4.71 | | | | (0.67 | ) | | | 1.46 | |
| | | | |
Net increase (decrease) from investment operations | | | 2.72 | | | | 4.48 | | | | 4.82 | | | | (0.62 | ) | | | 1.47 | |
| | | | |
Dividends and distributions from: | | | | | | | | | | | | | | | | | | | | |
Net investment income | | | — | | | | (0.15 | )3 | | | — | | | | — | | | | — | |
Net realized gain | | | (4.26 | ) | | | — | | | | — | | | | — | | | | — | |
| | | | |
Total dividends and distributions | | | (4.26 | ) | | | (0.15 | ) | | | — | | | | — | | | | — | |
| | | | |
Net asset value, end of period | | $ | 27.85 | | | $ | 29.39 | | | $ | 25.06 | | | $ | 20.24 | | | $ | 20.86 | |
| | | | |
| | | | | | | | | | | | | | | | | | | | |
| Total Investment Return4 | | | | | | | | | | | | | | | | | | | | |
Based on net asset value | | | 9.73 | %5 | | | 17.99 | % | | | 23.81 | % | | | (2.97 | )% | | | 7.58 | %5 |
| | | | |
| | | | | | | | | | | | | | | | | | | | |
| Ratios to Average Net Assets | | | | | | | | | | | | | | | | | | | | |
Total expenses | | | 0.80 | %6 | | | 0.83 | % | | | 0.84 | % | | | 0.78 | % | | | 0.80 | %6 |
| | | | |
Total expenses after fees waived, reimbursed and paid indirectly | | | 0.80 | %6 | | | 0.83 | % | | | 0.84 | % | | | 0.78 | % | | | 0.80 | %6 |
| | | | |
Net investment income (loss) | | | (0.11 | )%6 | | | 0.51 | % | | | 0.48 | % | | | 0.21 | % | | | 0.08 | %6 |
| | | | |
| | | | | | | | | | | | | | | | | | | | |
| Supplemental Data | | | | | | | | | | | | | | | | | | | | |
Net assets, end of period (000) | | $ | 914,646 | | | $ | 1,043,889 | | | $ | 1,514,881 | | | $ | 1,025,307 | | | $ | 728,129 | |
| | | | |
Portfolio turnover | | | 43 | % | | | 134 | % | | | 77 | % | | | 81 | % | | | 71 | % |
| | | | |
| | 1 | Commencement of operations. |
| | 2 | Based on average shares outstanding. |
| | 3 | Determined in accordance with federal income tax regulations. |
| | 4 | Where applicable, assumes the reinvestment of dividends and distributions. |
| | 5 | Aggregate total investment return. |
See Notes to Financial Statements.
| | | | | | |
| | | BLACKROCK CAPITAL APPRECIATION FUND, INC. | | MARCH 31, 2014 | | 17 |
| | |
| Financial Highlights (continued) | | |
| | | | | | | | | | | | | | | | | | | | | | | | |
| | | Investor A | |
| | | Six Months
Ended
March 31,
2014 (Unaudited) | | | Year Ended September 30, | |
| | | | 2013 | | | 2012 | | | 2011 | | | 20101 | | | 20091 | |
| Per Share Operating Performance | | | | | |
Net asset value, beginning of period | | $ | 28.31 | | | $ | 24.11 | | | $ | 19.51 | | | $ | 20.17 | | | $ | 18.12 | | | $ | 18.37 | |
| | | | |
Net investment income (loss)2 | | | (0.05 | ) | | | 0.04 | | | | 0.05 | | | | (0.02 | ) | | | (0.04 | ) | | | 0.01 | |
Net realized and unrealized gain (loss) | | | 2.63 | | | | 4.21 | | | | 4.55 | | | | (0.64 | ) | | | 2.09 | | | | (0.26 | ) |
| | | | |
Net increase (decrease) from investment operations | | | 2.58 | | | | 4.25 | | | | 4.60 | | | | (0.66 | ) | | | 2.05 | | | | (0.25 | ) |
| | | | |
Dividends and distributions from: | | | | | | | | | | | | | | | | | | | | | | | | |
Net investment income | | | — | | | | (0.05 | )3 | | | — | | | | — | | | | (0.00 | )3,4 | | | — | |
Net realized gain | | | (4.20 | ) | | | — | | | | — | | | | — | | | | — | | | | — | |
| | | | |
Total dividends and distributions | | | (4.20 | ) | | | (0.05 | ) | | | — | | | | — | | | | — | | | | — | |
| | | | |
Net asset value, end of period | | $ | 26.69 | | | $ | 28.31 | | | $ | 24.11 | | | $ | 19.51 | | | $ | 20.17 | | | $ | 18.12 | |
| | | | |
| | | | | | | | | | | | | | | | | | | | | | | | |
| Total Investment Return5 | | | | | |
Based on net asset value | | | 9.58 | %6 | | | 17.67 | % | | | 23.58 | % | | | (3.27 | )% | | | 11.37 | % | | | (1.37 | )%7 |
| | | | |
| | | | | | | | | | | | | | | | | | | | | | | | |
| Ratios to Average Net Assets | | | | | |
Total expenses | | | 1.07 | %8 | | | 1.09 | % | | | 1.09 | % | | | 1.08 | % | | | 1.15 | %9 | | | 1.35 | %9 |
| | | | |
Total expenses after fees waived, reimbursed and paid indirectly | | | 1.07 | %8 | | | 1.09 | % | | | 1.09 | % | | | 1.07 | % | | | 1.13 | % | | | 1.23 | % |
| | | | |
Net investment income (loss) | | | (0.39 | )%8 | | | 0.14 | % | | | 0.23 | % | | | (0.09 | )% | | | (0.21 | )% | | | 0.07 | % |
| | | | |
| | | | | | | | | | | | | | | | | | | | | | | | |
| Supplemental Data | | | | | |
Net assets, end of period (000) | | $ | 1,788,731 | | | $ | 1,845,224 | | | $ | 2,085,079 | | | $ | 1,848,149 | | | $ | 1,583,570 | | | $ | 169,865 | |
| | | | |
Portfolio turnover | | | 43 | % | | | 134 | % | | | 77 | % | | | 81 | % | | | 71 | % | | | 87 | % |
| | | | |
| | 1 | On June 28, 2010, BlackRock Capital Appreciation Portfolio was reorganized into the Fund. The activity in the table above is for the accounting survivor, BlackRock Capital Appreciation Portfolio, for the periods prior to the date of the reorganization, and for the post-reorganization combined fund thereafter. The net asset values and other per share information have been restated for periods prior to the reorganization to reflect the share conversion ratio of 0.79434657. |
| | 2 | Based on average shares outstanding. |
| | 3 | Determined in accordance with federal income tax regulations. |
| | 4 | Amount is greater than $(0.005) per share. |
| | 5 | Where applicable, excludes the effects of any sales charges and assumes the reinvestment of dividends and distributions. |
| | 6 | Aggregate total investment return. |
| | 7 | Includes proceeds received from a settlement of litigation, which impacted the Fund’s total return. Excluding these proceeds, the Fund’s total return would have been (1.51)%. |
| | 9 | Includes recoupment of past waived fees. There was no financial impact to the expense ratios. |
See Notes to Financial Statements.
| | | | | | |
| 18 | | BLACKROCK CAPITAL APPRECIATION FUND, INC. | | MARCH 31, 2014 | | |
| | |
| Financial Highlights (continued) | | |
| | | | | | | | | | | | | | | | | | | | | | | | |
| | | Investor B | |
| | | Six Months Ended
March 31, 2014 (Unaudited) | | | Year Ended September 30, | |
| | | | 2013 | | | 2012 | | | 2011 | | | 20101 | | | 20091 | |
| Per Share Operating Performance | | | | | | | | | | | | | | | | | | | | | | | | |
Net asset value, beginning of period | | $ | 24.40 | | | $ | 20.95 | | | $ | 17.13 | | | $ | 17.87 | | | $ | 16.18 | | | $ | 16.60 | |
| | | | |
Net investment loss2 | | | (0.18 | ) | | | (0.17 | ) | | | (0.14 | ) | | | (0.20 | ) | | | (0.18 | ) | | | (0.09 | ) |
Net realized and unrealized gain (loss) | | | 2.26 | | | | 3.62 | | | | 3.96 | | | | (0.54 | ) | | | 1.87 | | | | (0.33 | ) |
| | | | |
Net increase (decrease) from investment operations | | | 2.08 | | | | 3.45 | | | | 3.82 | | | | (0.74 | ) | | | 1.69 | | | | (0.42 | ) |
| | | | |
Distributions from net realized gain | | | (4.00 | ) | | | — | | | | — | | | | — | | | | — | | | | — | |
| | | | |
Net asset value, end of period | | $ | 22.48 | | | $ | 24.40 | | | $ | 20.95 | | | $ | 17.13 | | | $ | 17.87 | | | $ | 16.18 | |
| | | | |
| | | | | | | | | | | | | | | | | | | | | | | | |
| Total Investment Return3 | | | | | | | | | | | | | | | | | | | | | | | | |
Based on net asset value | | | 8.97 | %4 | | | 16.47 | % | | | 22.30 | % | | | (4.14 | )% | | | 10.34 | % | | | (2.52 | )%5 |
| | | | |
| | | | | | | | | | | | | | | | | | | | | | | | |
| Ratios to Average Net Assets | | | | | | | | | | | | | | | | | | | | | | | | |
Total expenses | | | 2.21 | %6 | | | 2.16 | % | | | 2.04 | % | | | 1.99 | % | | | 2.01 | %7 | | | 2.36 | %7 |
| | | | |
Total expenses after fees waived, reimbursed and paid indirectly | | | 2.21 | %6 | | | 2.16 | % | | | 2.04 | % | | | 1.99 | % | | | 2.00 | % | | | 2.11 | % |
| | | | |
Net investment loss | | | (1.53 | )%6 | | | (0.79 | )% | | | (0.72 | )% | | | (1.01 | )% | | | (1.10 | )% | | | (0.77 | )% |
| | | | |
| | | | | | | | | | | | | | | | | | | | | | | | |
| Supplemental Data | | | | | | | | | | | | | | | | | | | | | | | | |
Net assets, end of period (000) | | $ | 20,204 | | | $ | 26,552 | | | $ | 60,559 | | | $ | 96,030 | | | $ | 171,808 | | | $ | 10,279 | |
| | | | |
Portfolio turnover | | | 43 | % | | | 134 | % | | | 77 | % | | | 81 | % | | | 71 | % | | | 87 | % |
| | | | |
| | 1 | On June 28, 2010, BlackRock Capital Appreciation Portfolio was reorganized into the Fund. The activity in the table above is for the accounting survivor, BlackRock Capital Appreciation Portfolio, for the periods prior to the date of the reorganization, and for the post-reorganization combined fund thereafter. The net asset values and other per share information have been restated for periods prior to the reorganization to reflect the share conversion ratio of 0.81383276. |
| | 2 | Based on average shares outstanding. |
| | 3 | Where applicable, excludes the effects of any sales charges and assumes the reinvestment of dividends and distributions. |
| | 4 | Aggregate total investment return. |
| | 5 | Includes proceeds received from a settlement of litigation, which impacted the Fund’s total return. Excluding these proceeds, the Fund’s total return would have been (2.67)%. |
| | 7 | Includes recoupment of past waived fees. There was no financial impact to the expense ratios for the year ended September 30, 2010. Excluding the recoupment of past waived fees for the year ended September 30, 2009, the ratio would have been 2.27%. |
See Notes to Financial Statements.
| | | | | | |
| | | BLACKROCK CAPITAL APPRECIATION FUND, INC. | | MARCH 31, 2014 | | 19 |
| | |
| Financial Highlights (concluded) | | |
| | | | | | | | | | | | | | | | | | | | | | | | |
| | | Investor C | |
| | | Six Months Ended
March 31, 2014 (Unaudited) | | | Year Ended September 30, | |
| | | | 2013 | | | 2012 | | | 2011 | | | 20101 | | | 20091 | |
| Per Share Operating Performance | | | | | | | | | | | | | | | | | | | | | | | | |
Net asset value, beginning of period | | $ | 24.64 | | | $ | 21.11 | | | $ | 17.23 | | | $ | 17.96 | | | $ | 16.25 | | | $ | 16.63 | |
| | | | |
Net investment loss2 | | | (0.14 | ) | | | (0.15 | ) | | | (0.12 | ) | | | (0.19 | ) | | | (0.17 | ) | | | (0.09 | ) |
Net realized and unrealized gain (loss) | | | 2.28 | | | | 3.68 | | | | 4.00 | | | | (0.54 | ) | | | 1.88 | | | | (0.29 | ) |
| | | | |
Net increase (decrease) from investment operations | | | 2.14 | | | | 3.53 | | | | 3.88 | | | | (0.73 | ) | | | 1.71 | | | | (0.38 | ) |
| | | | |
Distributions from net realized gain | | | (4.06 | ) | | | — | | | | — | | | | — | | | | — | | | | — | |
| | | | |
Net asset value, end of period | | $ | 22.72 | | | $ | 24.64 | | | $ | 21.11 | | | $ | 17.23 | | | $ | 17.96 | | | $ | 16.25 | |
| | | | |
| | | | | | | | | | | | | | | | | | | | | | | | |
| Total Investment Return3 | | | | | | | | | | | | | | | | | | | | | | | | |
Based on net asset value | | | 9.16 | %4 | | | 16.72 | % | | | 22.52 | % | | | (4.07 | )% | | | 10.52 | % | | | (2.29 | )%5 |
| | | | |
| | | | | | | | | | | | | | | | | | | | | | | | |
| Ratios to Average Net Assets | | | | | | | | | | | | | | | | | | | | | | | | |
Total expenses | | | 1.86 | %6 | | | 1.90 | % | | | 1.92 | % | | | 1.91 | % | | | 1.97 | % | | | 2.04 | % |
| | | | |
Total expenses after fees waived, reimbursed and paid indirectly | | | 1.86 | %6 | | | 1.90 | % | | | 1.92 | % | | | 1.91 | % | | | 1.94 | % | | | 1.92 | % |
| | | | |
Net investment loss | | | (1.18 | )%6 | | | (0.68 | )% | | | (0.60 | )% | | | (0.93 | )% | | | (1.04 | )% | | | (0.61 | )% |
| | | | |
| | | | | | | | | | | | | | | | | | | | | | | | |
| Supplemental Data | | | | | | | | | | | | | | | | | | | | | | | | |
Net assets, end of period (000) | | $ | 630,879 | | | $ | 613,338 | | | $ | 586,862 | | | $ | 552,456 | | | $ | 608,137 | | | $ | 22,986 | |
| | | | |
Portfolio turnover | | | 43 | % | | | 134 | % | | | 77 | % | | | 81 | % | | | 71 | % | | | 87 | % |
| | | | |
| | | | | | | | | | | | | | | | | | | | |
| | | Class R | |
| | | Six Months
Ended
March 31,
2014 (Unaudited) | | | Year Ended September 30, | | | Period June 28,
20107 to
September 30, 2010 | |
| | | | 2013 | | | 2012 | | | 2011 | | |
| Per Share Operating Performance | | | | | | | | | | | | | | | | | | | | |
Net asset value, beginning of period | | $ | 25.86 | | | $ | 22.03 | | | $ | 17.88 | | | $ | 18.56 | | | $ | 17.28 | |
| | | | |
Net investment loss2 | | | (0.08 | ) | | | (0.03 | ) | | | (0.01 | ) | | | (0.09 | ) | | | (0.03 | ) |
Net realized and unrealized gain (loss) | | | 2.39 | | | | 3.86 | | | | 4.16 | | | | (0.59 | ) | | | 1.31 | |
| | | | |
Net increase (decrease) from investment operations | | | 2.31 | | | | 3.83 | | | | 4.15 | | | | (0.68 | ) | | | 1.28 | |
| | | | |
Distributions from net realized gain | | | (4.14 | ) | | | — | | | | — | | | | — | | | | — | |
| | | | |
Net asset value, end of period | | $ | 24.03 | | | $ | 25.86 | | | $ | 22.03 | | | $ | 17.88 | | | $ | 18.56 | |
| | | | |
| | | | | | | | | | | | | | | | | | | | |
| Total Investment Return3 | | | | | | | | | | | | | | | | | | | | |
Based on net asset value | | | 9.40 | %4 | | | 17.39 | % | | | 23.21 | % | | | (3.66 | )% | | | 7.41 | %4 |
| | | | |
| | | | | | | | | | | | | | | | | | | | |
| Ratios to Average Net Assets | | | | | | | | | | | | | | | | | | | | |
Total expenses | | | 1.34 | %6 | | | 1.38 | % | | | 1.39 | % | | | 1.40 | % | | | 1.44 | %6 |
| | | | |
Total expenses after fees waived, reimbursed and paid indirectly | | | 1.34 | %6 | | | 1.38 | % | | | 1.39 | % | | | 1.40 | % | | | 1.43 | %6 |
| | | | |
Net investment loss | | | (0.65 | )%6 | | | (0.13 | )% | | | (0.07 | )% | | | (0.42 | )% | | | (0.55 | )%6 |
| | | | |
| | | | | | | | | | | | | | | | | | | | |
| Supplemental Data | | | | | | | | | | | | | | | | | | | | |
Net assets, end of period (000) | | $ | 89,332 | | | $ | 93,218 | | | $ | 116,598 | | | $ | 87,400 | | | $ | 74,677 | |
| | | | |
Portfolio turnover | | | 43 | % | | | 134 | % | | | 77 | % | | | 81 | % | | | 71 | % |
| | | | |
| | 1 | On June 28, 2010, BlackRock Capital Appreciation Portfolio was reorganized into the Fund. The activity in the table above is for the accounting survivor, BlackRock Capital Appreciation Portfolio, for the periods prior to the date of the reorganization, and for the post-reorganization combined fund thereafter. The net asset values and other per share information have been restated for periods prior to the reorganization to reflect the share conversion ratio of 0.81539389. |
| | 2 | Based on average shares outstanding. |
| | 3 | Where applicable, excludes the effects of any sales charges and assumes the reinvestment of dividends and distributions. |
| | 4 | Aggregate total investment return. |
| | 5 | Includes proceeds received from a settlement of litigation, which impacted the Fund’s total return. Excluding these proceeds, the Fund’s total return would have been (2.43)%. |
| | 7 | Commencement of operations. |
See Notes to Financial Statements.
| | | | | | |
| 20 | | BLACKROCK CAPITAL APPRECIATION FUND, INC. | | MARCH 31, 2014 | | |
| | |
| Notes to Financial Statements (Unaudited) | | |
1. Organization:
BlackRock Capital Appreciation Fund, Inc. (the “Fund”) is registered under the Investment Company Act of 1940, as amended (the “1940 Act”), as a diversified, open-end management investment company. The Fund is organized as a Maryland corporation. The Fund offers multiple classes of shares. BlackRock and Institutional Shares are sold without a sales charge and only to certain eligible investors. Investor A Shares are generally sold with an initial sales charge, but may be subject to a CDSC for certain redemptions where no initial sales charge was paid at the time of purchase. Investor B and Investor C Shares may be subject to a CDSC. Class R Shares are sold without a sales charge and only to certain employer-sponsored retirement plans. All classes of shares have identical voting, dividend, liquidation and other rights and are subject to the same terms and conditions, except that Investor A, Investor B, Investor C and Class R Shares bear certain expenses related to the shareholder servicing of such shares, and Investor B, Investor C and Class R Shares also bear certain expenses related to the distribution of such shares. Investor B Shares automatically convert to Investor A Shares after approximately eight years. Investor B Shares are only available through exchanges and dividend reinvestments by existing shareholders and for purchase by certain employer-sponsored retirement plans. Each class has exclusive voting rights with respect to matters relating to its shareholder servicing and distribution expenditures (except that Investor B shareholders may vote on material changes to the Investor A distribution and service plan).
The Fund, together with certain other registered investment companies advised by the Manager or its affiliates, is included in a complex of open-end funds referred to as the Equity-Bond Complex.
2. Significant Accounting Policies:
The Fund’s financial statements are prepared in conformity with accounting principles generally accepted in the United States of America (“U.S. GAAP”), which may require management to make estimates and assumptions that affect the reported amounts of assets and liabilities in the financial statements and the reported amounts of increases and decreases in net assets from operations during the reporting period. Actual results could differ from those estimates. The following is a summary of significant accounting policies followed by the Fund:
Valuation: U.S. GAAP defines fair value as the price the Fund would receive to sell an asset or pay to transfer a liability in an orderly transaction between market participants at the measurement date. The Fund determines the fair values of its financial instruments at market value using independent dealers or pricing services under policies approved by the Board of Directors of the Fund (the “Board”). The BlackRock Global Valuation Methodologies Committee (the “Global Valuation Committee”) is the committee formed by management to develop global pricing policies and procedures and to provide oversight of the pricing function for the Fund for all financial instruments.
Equity investments traded on a recognized securities exchange or the NASDAQ Stock Market (“NASDAQ”) are valued at the last reported sale price that day or the NASDAQ official closing price, if applicable. For equity investments traded on more than one exchange, the last reported sale price on the exchange where the stock is primarily traded is used. Equity investments traded on a recognized exchange for which there were no sales on that day are valued at the last available bid (long positions) or ask (short positions) price. Investments in open-end registered investment companies are valued at NAV each business day.
Securities and other assets and liabilities denominated in foreign currencies are translated into U.S. dollars using exchange rates determined as of the close of business on the New York Stock Exchange (“NYSE”). Forward foreign currency exchange contracts are valued at the mean between the bid and ask prices and are determined as of the close of business on the NYSE. Interpolated values are derived when the settlement date of the contract is an interim date for which quotations are not available.
The Fund values its investments in BlackRock Liquidity Series, LLC, Money Market Series (the “Money Market Series”) at fair value, which is ordinarily based upon its pro rata ownership in the underlying fund’s net assets. The Money Market Series seeks current income consistent with maintaining liquidity and preserving capital. Although the Money Market Series is not registered under the 1940 Act, its investments will follow the parameters of investments by a money market fund that is subject to Rule 2a-7 under the 1940 Act. The Fund may withdraw up to 25% of its investment daily, although the manager of the Money Market Series, in its sole discretion, may permit an investor to withdraw more than 25% on any one day.
In the event that the application of these methods of valuation results in a price for an investment that is deemed not to be representative of the market value of such investment, or if a price is not available, the investment will be valued by the Global Valuation Committee, or its delegate, in accordance with a policy approved by the Board as reflecting fair value (“Fair Value Assets”). When determining the price for Fair Value Assets, the Global Valuation Committee, or its delegate, seeks to determine the price that each Fund might reasonably expect to receive from the current sale of that asset in an arm’s-length transaction. Fair value determinations shall be based upon all available factors that the Global Valuation Committee, or its delegate, deems relevant consistent with the principles of fair value measurement, which include the market approach, income approach and/or in the case of recent investments, the cost approach, as appropriate. The market approach generally consists of using comparable market transactions. The income approach generally is used to discount future cash flows to present value and is adjusted for liquidity as appropriate. These factors include but are not limited to: (i) attributes specific to the investment or asset; (ii) the principal market for the investment or asset; (iii) the customary participants in the principal market for the investment or asset; (iv) data assumptions
| | | | | | |
| | | BLACKROCK CAPITAL APPRECIATION FUND, INC. | | MARCH 31, 2014 | | 21 |
| | |
| Notes to Financial Statements (continued) | | |
by market participants for the investment or asset, if reasonably available; (v) quoted prices for similar investments or assets in active markets; and (vi) other factors, such as future cash flows, interest rates, yield curves, volatilities, prepayment speeds, loss severities, credit risks, recovery rates, liquidation amounts and/or default rates. Due to the inherent uncertainty of valuations of such investments, the fair values may differ from the values that would have been used had an active market existed. The Global Valuation Committee, or its delegate, employs various methods for calibrating valuation approaches for investments where an active market does not exist, including regular due diligence of the Fund’s pricing vendors, regular reviews of key inputs and assumptions, transactional back-testing or disposition analysis to compare unrealized gains and losses to realized gains and losses, reviews of missing or stale prices and large movements in market values and reviews of any market related activity. The pricing of all Fair Value Assets is subsequently reported to the Board or a committee thereof on a quarterly basis.
Generally, trading in foreign instruments is substantially completed each day at various times prior to the close of business on the NYSE. Occasionally, events affecting the values of such instruments may occur between the foreign market close and the close of business on the NYSE that may not be reflected in the computation of the Fund’s net assets. If events (e.g., a company announcement, market volatility or a natural disaster) occur during such periods that are expected to materially affect the value of such instruments, those instruments may be Fair Value Assets and valued at their fair value, as determined in good faith by the Global Valuation Committee, or its delegate, using a pricing service and/or policies approved by the Board. Each business day, the Fund uses a pricing service to assist with the valuation of certain foreign exchange-traded equity securities and foreign exchange-traded and over-the-counter (“OTC”) options (the “Systematic Fair Value Price”). Using current market factors, the Systematic Fair Value Price is designed to value such foreign securities and foreign options at fair value as of the close of business on the NYSE, which follows the close of the local markets.
Foreign Currency: The Fund’s books and records are maintained in U.S. dollars. Purchases and sales of investment securities are recorded at the rates of exchange prevailing on the respective date of such transactions. Generally, when the U.S. dollar rises in value against a foreign currency, the Fund’s investments denominated in that currency will lose value because that currency is worth fewer U.S. dollars; the opposite effect occurs if the U.S. dollar falls in relative value.
The Fund does not isolate the portion of the results of operations arising as a result of changes in the foreign exchange rates from the changes in the market prices of investments held or sold for financial reporting purposes. Accordingly, the effects of changes in foreign currency exchange rates on investments are not segregated in the Statement of Operations from the effects of changes in market prices of those investments but are included as a component of net realized and unrealized gain (loss) from investments. The Fund reports realized currency gains (losses) on foreign currency related transactions as components of net realized gain (loss)
for financial reporting purposes, whereas such components are generally treated as ordinary income for federal income tax purposes.
Segregation and Collateralization: In cases where a Fund enters into certain investments (e.g., forward foreign currency exchange contracts), that would be “senior securities” for 1940 Act purposes, the Fund may segregate or designate on its books and records cash or liquid securities having a market value at least equal to the amount of the Fund’s future obligations under such investments. Doing so allows the investment to be excluded from treatment as a “senior security.” Furthermore, if required by an exchange or counterparty agreement, the Fund may be required to deliver/deposit cash and/or securities to/with an exchange, or broker-dealer or custodian as collateral for certain investments or obligations.
Investment Transactions and Investment Income: For financial reporting purposes, investment transactions are recorded on the dates the transactions are entered into (the trade dates). Realized gains and losses on investment transactions are determined on the identified cost basis. Dividend income is recorded on the ex-dividend date. Dividends from foreign securities where the ex-dividend date may have passed are subsequently recorded when the Fund is informed of the ex-dividend date. Under the applicable foreign tax laws, a withholding tax at various rates may be imposed on capital gains, dividends and interest. Income, expenses and realized and unrealized gains and losses are allocated daily to each class based on its relative net assets.
Dividends and Distributions: Dividends and distributions paid by the Fund are recorded on the ex-dividend date. The character and timing of dividends and distributions are determined in accordance with federal income tax regulations, which may differ from U.S. GAAP.
Income Taxes: It is the Fund’s policy to comply with the requirements of the Internal Revenue Code of 1986, as amended, applicable to regulated investment companies, and to distribute substantially all of its taxable income to its shareholders. Therefore, no federal income tax provision is required.
The Fund files U.S. federal and various state and local tax returns. No income tax returns are currently under examination. The statute of limitations on the Fund’s U.S. federal tax returns remains open for each of the three years ended August 31, 2012, the period ended September 30, 2012, and the year ended September 30, 2013. The statutes of limitations on the Fund’s state and local tax returns may remain open for an additional year depending upon the jurisdiction.
Management has analyzed tax laws and regulations and their application to the Funds’ facts and circumstances and does not believe there are any uncertain tax positions that require recognition of a tax liability.
Other: Expenses directly related to the Fund or its classes are charged to the Fund or class. Other operating expenses shared by several funds are pro rated among those funds on the basis of relative net assets or other appropriate methods. Expenses directly related to the Fund and other
| | | | | | |
| 22 | | BLACKROCK CAPITAL APPRECIATION FUND, INC. | | MARCH 31, 2014 | | |
| | |
| Notes to Financial Statements (continued) | | |
shared expenses pro rated to the Fund are allocated daily to each class based on its relative net assets or other appropriate methods.
The Fund has an arrangement with the custodian whereby fees may be reduced by credits earned on uninvested cash balances, which, if applicable, are shown as fees paid indirectly in the Statement of Operations. The custodian imposes fees on overdrawn cash balances, which can be offset by accumulated credits earned or may result in additional custody charges.
3. Securities and Other Investments:
Securities Lending: The Fund may lend its securities to approved borrowers, such as brokers, dealers and other financial institutions. The borrower pledges collateral consisting of cash, an irrevocable letter of credit issued by a bank, or securities issued or guaranteed by the U.S. government. The initial collateral received by the Fund is required to have a value of at least 102% of the current value of the loaned securities for securities traded on U.S. exchanges and a value of at least 105% for all other securities. The collateral is maintained thereafter, at a value equal to at least 100% of the current market value of the securities on loan. The market value of the loaned securities is determined at the close of each business day of the Fund and any additional required collateral is delivered to the Fund on the next business day. During the term of the loan, the Fund earns dividend or interest income on the securities loaned but does not receive interest income on the securities received as collateral. Loans of securities are terminable at any time and the borrower, after notice, is required to return borrowed securities within the standard time period for settlement of securities transactions.
The market value of securities on loan and the value of the related collateral are shown separately in the Statement of Assets and Liabilities as a component of investments at value, and collateral on securities loaned at value, respectively. As of March 31, 2014, any securities on loan were collateralized by cash. The cash collateral invested by the securities lending agent, BlackRock Investment Management, LLC (“BIM”), if any, is disclosed in the Schedule of Investments.
Securities lending transactions are entered into by the Fund under Master Securities Lending Agreements (an “MSLA”) which provide the right, in the event of default (including bankruptcy or insolvency), for the non-defaulting party to liquidate the collateral and calculate a net exposure to the defaulting party or request additional collateral. In the event that a borrower defaults, the Fund, as lender, would offset the market value of the collateral received against the market value of the securities loaned. The value of the collateral is typically greater than that of the market value of the securities loaned, leaving the lender with a net amount payable to the defaulting party. However, bankruptcy or insolvency laws of a particular jurisdiction may impose restrictions on or prohibitions against such a right of offset in the event of an MSLA counterparty’s bankruptcy or insolvency. Under the MSLA, the borrower can resell or re-pledge the loaned securities, and the Fund can reinvest cash collateral, or, upon an event of default, resell or re-pledge the collateral.
The following table is a summary of the Fund’s securities lending agreements by counterparty which are subject to offset under an MSLA as of March 31, 2014:
| | | | | | | | | | | | |
| Counterparty | | Securities Loaned at Value | | | Cash Collateral Received1 | | | Net Amount | |
Barclays Capital Inc. | | $ | 47,040,691 | | | $ | (47,040,691 | ) | | | — | |
Citigroup Global Markets, Inc. | | | 116,208 | | | | (116,208 | ) | | | — | |
Credit Suisse Securities (USA) LLC | | | 27,573,809 | | | | (27,573,809 | ) | | | — | |
Deutsche Bank Securities Inc. | | | 12,052,528 | | | | (12,052,528 | ) | | | — | |
Goldman Sachs & Co. | | | 12,222,190 | | | | (12,222,190 | ) | | | — | |
Morgan Stanley | | | 137,316,599 | | | | (137,316,599 | ) | | | — | |
UBS Securities LLC | | | 11,484,340 | | | | (11,484,340 | ) | | | — | |
| | | | |
Total | | $ | 247,806,365 | | | $ | (247,806,365 | ) | | | — | |
| | | | |
| | 1 | Collateral with a value of $250,245,640 has been received in connection with securities lending transactions. Excess of collateral received from the individual counterparty is not shown for financial reporting purposes. |
The risks of securities lending include the risk that the borrower may not provide additional collateral when required or may not return the securities when due. To mitigate these risks, the Fund benefits from a borrower default indemnity provided by BIM. BIM’s indemnity allows for full replacement of the securities lent. Each Fund could suffer a loss if the value of an investment purchased with cash collateral falls below the market value of loaned securities or if the value of an investment purchased with cash collateral falls below the value of the original cash collateral received.
4. Derivative Financial Instruments:
The Fund engages in various portfolio investment strategies using derivative contracts both to increase the returns of the Fund and/or to economically hedge their exposure to certain risks such as foreign currency exchange rate risk. These contracts may be transacted on an exchange or OTC.
Forward Foreign Currency Exchange Contracts: The Fund enters into forward foreign currency exchange contracts as an economic hedge against either specific transactions or portfolio instruments or to obtain exposure to, or hedge exposure away from, foreign currencies (foreign currency exchange rate risk). A forward foreign currency exchange contract is an agreement between two parties to buy and sell a currency at a set exchange rate on a future date. Forward foreign currency exchange contracts, when used by the Fund, help to manage the overall exposure to the currencies in which some of the investments held by the Fund are denominated. The contract is marked-to-market daily and the change in market value is recorded by the Fund as an unrealized gain or loss. When the contract is closed, the Fund records a realized gain or loss equal to the difference between the value at the time it was opened and the value at the time it was closed. The use of forward foreign currency exchange contracts involves the risk that the value of a foreign currency exchange contract changes unfavorably due to movements in the value of the referenced foreign currencies.
| | | | | | |
| | | BLACKROCK CAPITAL APPRECIATION FUND, INC. | | MARCH 31, 2014 | | 23 |
| | |
| Notes to Financial Statements (continued) | | |
The following is a summary of the Fund’s derivative financial instruments categorized by risk exposure:
| | | | | | |
| Fair Values of Derivative Financial Instruments as of March 31, 2014 | |
| | | Derivative Assets | |
| | | Statements of
Assets and Liabilities
Location | | Value | |
Forward foreign currency exchange contracts | | Unrealized
appreciation on forward
foreign currency
exchange contracts | | $ | 676,641 | |
| | | | |
The Effect of Derivative Financial Instruments in the Statement of Operations
Six Months Ended March 31, 2014 | |
| Net Realized Loss From | |
Forward foreign currency exchange contracts: | | | | |
Foreign currency transactions. | | $ | (1,170,188 | ) |
| | | | |
| Net Change in Unrealized Appreciation/Depreciation on | |
Forward foreign currency exchange contracts: | | | | |
Foreign currency translations | | $ | 738,182 | |
For the six months ended March 31, 2014, the average quarterly balances of outstanding derivative financial instruments were as follows:
| | | | |
Forward foreign currency exchange contracts: | | | | |
Average number of contracts — USD purchased | | | 2 | |
Average number of contracts — USD sold | | | 1 | 1 |
Average USD amounts purchased | | $ | 99,271,204 | |
Average USD amounts sold | | $ | 74,808,700 | 1 |
| 1 | Actual contract amounts for the period are shown due to limited outstanding derivative financial instruments as of each quarter. |
Counterparty Credit Risk: A derivative contract may suffer a mark-to-market loss if the value of the contract decreases due to an unfavorable change in the market rates or values of the underlying instrument. Losses can also occur if the counterparty does not perform under the contract.
A Fund’s risk of loss from counterparty credit risk on OTC derivatives is generally limited to the aggregate unrealized gain netted against any collateral held by such Fund.
In order to better define its contractual rights and to secure rights that will help the Fund mitigate its counterparty risk, the Fund may enter into an International Swaps and Derivatives Association, Inc. Master Agreement (“ISDA Master Agreement”) or similar agreement with its derivative contract counterparties. An ISDA Master Agreement is a bilateral agreement between each Fund and a counterparty that governs certain OTC derivatives and typically contains, among other things, collateral posting
terms and netting provisions in the event of a default and/or termination event. Under an ISDA Master Agreement, each Fund may, under certain circumstances, offset with the counterparty certain derivative financial instruments’ payables and/or receivables with collateral held and/or posted and create one single net payment. The provisions of the ISDA Master Agreement typically permit a single net payment in the event of default including the bankruptcy or insolvency of the counterparty. Bankruptcy or insolvency laws of a particular jurisdiction may impose restrictions on or prohibitions against the right of offset in bankruptcy, insolvency or other events. In addition, certain ISDA Master Agreements allow counterparties to OTC derivatives to terminate derivative contracts prior to maturity in the event the Fund’s net assets decline by a stated percentage or the Fund fails to meet the terms of its ISDA Master Agreements, which would cause the Fund to accelerate payment of any net liability owed to the counterparty.
Collateral Requirements: For derivatives traded under an ISDA Master Agreement, the collateral requirements are typically calculated by netting the mark-to-market amount for each transaction under such agreement and comparing that amount to the value of any collateral currently pledged by the Fund and the counterparty.
Cash collateral that has been pledged to cover obligations of the Fund and cash collateral received from the counterparty, if any, is reported separately on the Statement of Assets and Liabilities as cash pledged as collateral and cash received as collateral, respectively. Non-cash collateral pledged by the Fund, if any, is noted in the Schedule of Investments. Generally, the amount of collateral due from or to a party has to exceed a minimum transfer amount threshold (typically either $250,000 or $500,000) before a transfer is required, which is determined at the close of business of the Fund and any additional required collateral is delivered to/pledged by the Fund on the next business day. Typically, the Fund and counterparties are not permitted to sell, re-pledge or use the collateral they receive. To the extent amounts due to the Fund from its counterparties are not fully collateralized, contractually or otherwise, the Fund bears the risk of loss from counterparty non-performance. The Fund attempts to mitigate counterparty risk by entering into agreements only with counterparties that it believes have the financial resources to honor their obligations and by monitoring the financial stability of those counterparties.
For financial reporting purposes, the Fund does not offset derivative assets and derivative liabilities that are subject to netting agreements, if any, in the Statement of Assets and Liabilities.
At March 31, 2014, the Fund’s derivative assets and liabilities (by type) are as follows:
| | | | | | | | |
| | | Assets | | | Liabilities | |
Derivative Financial Instruments: | | | | | | | | |
Forward foreign currency exchange contracts | | $ | 676,641 | | | $ | — | |
| | | | |
Total derivative assets and liabilities in the Statement of Assets and Liabilities | | | 676,641 | | | | — | |
| | | | |
Derivatives not subject to a Master Netting Agreement or similar agreement (“MNA”) | | | — | | | | — | |
| | | | |
Total derivative assets and liabilities subject to an MNA | | $ | 676,641 | | | $ | — | |
| | | | |
| | | | | | |
| 24 | | BLACKROCK CAPITAL APPRECIATION FUND, INC. | | MARCH 31, 2014 | | |
| | |
| Notes to Financial Statements (continued) | | |
The following table presents the Fund’s derivative assets by counterparty net of amounts available for offset under an MNA and net of the related collateral received by the Fund as of March 31, 2014:
| | | | | | | | | | | | | | | | | | | | |
| Counterparty | | Derivative Assets
Subject to an MNA by
Counterparty | | | Derivatives
Available for Offset | | | Non-cash Collateral
Received | | | Cash Collateral
Received | | | Net Amount of
Derivative Assets1 | |
Royal Bank of Scotland PLC | | $ | 676,641 | | | | — | | | | — | | | | — | | | $ | 676,641 | |
| | | | |
| | 1 | Net amount represents the net amount receivable from the counterparty in the event of default. |
5. Investment Advisory Agreement and Other Transactions with Affiliates:
The PNC Financial Services Group, Inc. is the largest stockholder and an affiliate, for 1940 Act purposes, of BlackRock.
The Fund entered into an Investment Advisory Agreement with the Manager, the Fund’s investment advisor, an indirect, wholly owned subsidiary of BlackRock, to provide investment advisory and administration services. The Manager is responsible for the management of the Fund’s portfolio and provides the necessary personnel, facilities, equipment and certain other services necessary to the operations of the Fund. For such services, the Fund pays the Manager a monthly fee based on a percentage of the Fund’s average daily net assets at the following annual rates:
| | | | |
| Average Daily Net Assets | | Investment
Advisory Fee | |
First $1 Billion | | | 0.650 | % |
$1 Billion - $1.5 Billion | | | 0.625 | % |
$1.5 Billion - $5 Billion | | | 0.600 | % |
$5 Billion - $7.5 Billion | | | 0.575 | % |
Greater than $7.5 Billion | | | 0.550 | % |
The Manager voluntarily agreed to waive its investment advisory fees by the amount of investment advisory fees the Fund pays to the Manager indirectly through its investment in affiliated money market funds. However, the Manager does not waive its investment advisory fees by the amount of investment advisory fees paid in connection with the Fund’s investment in other affiliated investment companies, if any. This amount is shown as fees waived by Manager in the Statement of Operations.
The Manager, on behalf of the Fund, entered into sub-advisory agreements with BIM, an affiliate of the Manager. The Manager pays BIM, for services it provides, a monthly fee that is a percentage of the investment advisory fees paid by the Fund to the Manager.
The Fund entered into a Distribution Agreement and a Distribution and Service Plan with BlackRock Investments, LLC (“BRIL”), an affiliate of the Manager. Pursuant to the Distribution and Service Plan and in accordance with Rule 12b-1 under the 1940 Act, the Fund pays BRIL ongoing service and distribution fees. The fees are accrued daily and paid monthly at annual rates based upon the average daily net assets of the shares of the Fund as follows:
| | | | | | | | |
| | | Service
Fee | | | Distribution
Fee | |
Investor A | | | 0.25 | % | | | — | |
Investor B | | | 0.25 | % | | | 0.75 | % |
Investor C | | | 0.25 | % | | | 0.75 | % |
Class R | | | 0.25 | % | | | 0.25 | % |
Pursuant to sub-agreements with BRIL, broker-dealers and BRIL provide shareholder servicing and distribution services to the Fund. The ongoing service and/or distribution fee compensates BRIL and each broker-dealer for providing shareholder servicing and/or distribution related services to Investor A, Investor B, Investor C and Class R shareholders.
Pursuant to written agreements, certain financial intermediaries, some of which may be affiliates, provide the Fund with sub-accounting, recordkeeping, sub-transfer agency and other administrative services with respect to sub-accounts they service. For these services, these entities receive an asset based fee or an annual fee per shareholder account, which will vary depending on share class and/or net assets. For the six months ended March 31, 2014, the Fund paid $297,336 to the affiliates in return for these services, which is included in transfer agent — class specific in the Statement of Operations.
The Manager maintains a call center, which is responsible for providing certain shareholder services to the Fund, such as responding to shareholder inquiries and processing transactions based upon instructions from shareholders with respect to the subscription and redemption of Fund shares. For the six months ended March 31, 2014, the Fund reimbursed the Manager the following amounts for costs incurred in running the call center, which are included in transfer agent — class specific in the Statement of Operations:
| | | | |
BlackRock | | $ | 1,956 | |
Institutional | | | 1,754 | |
Investor A | | | 36,446 | |
Investor B | | | 1,636 | |
Investor C | | | 4,555 | |
Class R | | | 445 | |
Total | | $ | 46,792 | |
| | | | |
| | | | | | |
| | | BLACKROCK CAPITAL APPRECIATION FUND, INC. | | MARCH 31, 2014 | | 25 |
| | |
| Notes to Financial Statements (continued) | | |
The Manager contractually agreed to waive and/or reimburse fees or expenses in order to limit expenses, excluding interest expense, dividend expense, income tax expense, acquired fund fees and expenses and certain other fund expenses, which constitute extraordinary expenses not incurred in the ordinary course of the Fund’s business. The expense limitations as a percentage of average daily net assets are as follows:
| | | | |
BlackRock | | | 0.72 | % |
Investor C | | | 1.94 | % |
The Manager has agreed not to reduce or discontinue this contractual waiver or reimbursement prior to February 1, 2023 unless approved by the Board, including a majority of the Independent Directors. On February 1 of each year, the waiver will renew automatically, so that the agreement will have a perpetual ten-year term. These amounts waived or reimbursed are shown as transfer agent fees waived — BlackRock and transfer agent fees reimbursed — BlackRock, respectively, in the Statement of Operations.
For the six months ended March 31, 2014, affiliates earned underwriting discounts, direct commissions and dealer concessions on sales of the Fund’s Investor A Shares of $91,208.
For the six months ended March 31, 2014, affiliates received CDSCs relating to transactions in Investor A, Investor B, and Investor C Shares of $1,729, $2,339 and $20,123, respectively.
The U.S. Securities and Exchange Commission has issued an exemptive order which permits BIM, an affiliate of the Manager, to serve as securities lending agent for the Fund, subject to applicable conditions. As securities lending agent, BIM bears all operational costs directly related to securities lending. The Fund is responsible for expenses in connection with the investment of cash collateral received for securities on loan (the “collateral investment expenses”). The cash collateral is invested in a private investment company managed by the Manager or its affiliates. However, BIM has agreed to cap the collateral investment expenses of the private investment company to an annual rate of 0.04%. The investment advisor to the private investment company will not charge any advisory fees with respect to shares purchased by the Fund.
Securities lending income is equal to the total of income earned from the reinvestment of cash collateral, net of fees and other payments to and from borrowers of securities, and less the collateral investment expenses. The Fund retains a portion of securities lending income and remits a remaining portion to BIM as compensation for its services as securities lending agent.
Pursuant to a securities lending agreement effective February 1, 2014, the Fund retains 70% of securities lending income, and this amount retained can never be less than 65% of the total of securities lending income plus the collateral investment expenses.
In addition, commencing the business day following the date that the aggregate securities lending income earned across the Equity-Bond Complex in a calendar year exceeds the aggregate securities lending
income earned across the Equity-Bond Complex in the calendar year 2013, the Fund, pursuant to the securities lending agreement, will retain for the remainder of that calendar year securities lending income as follows: 75% of securities lending income, and this amount retained can never be less than 65% of the total of securities lending income plus the collateral investment expenses.
Prior to February 1, 2014, the Fund retained 65% of securities lending income and paid a fee to BIM equal to 35% of such income. The share of securities lending income earned by the Fund is shown as securities lending — affiliated — net in the Statement of Operations. For the six months ended March 31, 2014, the Fund paid BIM $117,524 for securities lending agent services.
The Fund recorded a payment from an affiliate to compensate for foregone securities lending revenue in the amount of $467,132, which is shown as other income — affiliated in the Statement of Operations.
Certain officers and/or directors of the Fund are officers and/or directors of BlackRock or its affiliates. The Fund reimburses the Manager for a portion of the compensation paid to the Fund’s Chief Compliance Officer, which is included in officer and directors in the Statement of Operations.
6. Purchases and Sales:
Purchases and sales of investments, excluding short-term securities, for the six months ended March 31, 2014, were $1,775,116,991 and $2,418,846,791, respectively.
7. Income Tax Information:
As of March 31, 2014, gross unrealized appreciation and depreciation based on cost for federal income tax purposes were as follows:
| | | | |
Tax cost | | $ | 3,375,480,277 | |
| | | | |
Gross unrealized appreciation | | $ | 927,602,165 | |
Gross unrealized depreciation | | | (22,835,165 | ) |
| | | | |
Net unrealized appreciation | | $ | 904,767,000 | |
| | | | |
8. Bank Borrowings:
The Fund, along with certain other funds managed by the Manager and its affiliates (“Participating Funds”), is a party to a 364-day, $800 million credit agreement with a group of lenders, under which the Fund may borrow to fund shareholder redemptions. The agreement expires in April 2014. Excluding commitments designated for a certain individual fund, other Participating Funds, including the Fund, can borrow up to an aggregate commitment amount of $500 million, subject to asset coverage and other limitations as specified in the agreement. The credit agreement has the following terms: a fee of 0.065% per annum on unused commitment amounts and interest at a rate equal to the higher of (a) the one-month LIBOR plus 0.80% per annum or (b) the Fed Funds rate plus 0.80% per annum on amounts borrowed. Participating Funds paid administration and arrangement fees, which, along with commitment fees, were allocated among such funds based upon portions of the
| | | | | | |
| 26 | | BLACKROCK CAPITAL APPRECIATION FUND, INC. | | MARCH 31, 2014 | | |
| | |
| Notes to Financial Statements (continued) | | |
aggregate commitment available to them and relative net assets of Participating Funds. The Fund did not borrow under the credit agreement during the six months ended March 31, 2014.
9. Concentration, Market and Credit Risk:
In the normal course of business, the Fund invests in securities and enters into transactions where risks exist due to fluctuations in the market (market risk) or failure of the issuer of a security to meet all its obligations (issuer credit risk). The value of securities held by the Fund may decline in response to certain events, including those directly involving the issuers whose securities are owned by the Fund; conditions affecting the general economy; overall market changes; local, regional or global political, social or economic instability; and currency and interest rate and price fluctuations. Similar to issuer credit risk, the Fund may be exposed to counterparty credit risk, or the risk that an entity with which the Fund has unsettled or open transactions may fail to or be unable to
perform on its commitments. The Fund manages counterparty credit risk by entering into transactions only with counterparties that it believes have the financial resources to honor their obligations and by monitoring the financial stability of those counterparties. Financial assets, which potentially expose the Fund to market, issuer and counterparty credit risks, consist principally of financial instruments and receivables due from counterparties. The extent of the Fund’s exposure to market, issuer and counterparty credit risks with respect to these financial assets is generally approximated by their value recorded in the Statement of Assets and Liabilities, less any collateral held by the Fund.
As of March 31, 2014, the Fund invested a significant portion of its assets in securities in the consumer discretionary and information technology sectors. Changes in economic conditions affecting these sectors would have a greater impact on the Fund and could affect the value, income and/or liquidity of positions in such securities.
10. Capital Share Transactions:
Transactions in capital shares for each class were as follows:
| | | | | | | | | | | | | | | | | | |
| | | Six Months Ended
March 31, 2014 | | | | | Year Ended
September 30, 2013 | |
| | | Shares | | | Amount | | | | | Shares | | | Amount | |
BlackRock | | | | | | | | | | | | | | | | | | |
Shares sold | | | 3,403,895 | | | $ | 98,544,624 | | | | | | 6,067,970 | | | $ | 157,217,180 | |
Shares issued in reinvestment of dividends and distributions | | | 2,689,621 | | | | 72,700,462 | | | | | | 231,493 | | | | 5,664,624 | |
Shares redeemed | | | (2,814,104 | ) | | | (82,462,474 | ) | | | | | (28,761,646 | ) | | | (755,420,209 | ) |
| | | | | | | | | | |
Net increase (decrease) | | | 3,279,412 | | | $ | 88,782,612 | | | | | | (22,462,183 | ) | | $ | (592,538,405 | ) |
| | | | | | | | | | |
| | | | | | | | | | | | | | | | | | |
Institutional | | | | | | | | | | | | | | | | | | |
Shares sold | | | 2,876,080 | | | $ | 83,533,623 | | | | | | 10,041,428 | | | $ | 256,301,600 | |
Shares issued in reinvestment of dividends and distributions | | | 4,721,193 | | | | 127,424,932 | | | | | | 342,733 | | | | 8,383,032 | |
Shares redeemed | | | (10,267,682 | ) | | | (300,894,059 | ) | | | | | (35,326,262 | ) | | | (908,126,351 | ) |
| | | | | | | | | | |
Net decrease | | | (2,670,409 | ) | | $ | (89,935,504 | ) | | | | | (24,942,101 | ) | | $ | (643,441,719 | ) |
| | | | | | | | | | |
| | | | | | | | | | | | | | | | | | |
Investor A | | | | | | | | | | | | | | | | | | |
Shares sold and automatic conversion of shares | | | 4,064,129 | | | $ | 113,346,124 | | | | | | 10,753,603 | | | $ | 270,760,484 | |
Shares issued in reinvestment of dividends and distributions | | | 9,416,838 | | | | 243,798,759 | | | | | | 61,616 | | | | 1,454,138 | |
Shares redeemed | | | (11,628,788 | ) | | | (323,336,363 | ) | | | | | (32,137,874 | ) | | | (796,967,727 | ) |
| | | | | | | | | | |
Net increase (decrease) | | | 1,852,179 | | | $ | 33,808,520 | | | | | | (21,322,655 | ) | | $ | (524,753,105 | ) |
| | | | | | | | | | |
| | | | | | | | | | | | | | | | | | |
Investor B | | | | | | | | | | | | | | | | | | |
Shares sold | | | 28,047 | | | $ | 667,575 | | | | | | 170,233 | | | $ | 3,626,143 | |
Shares issued in reinvestment of distributions | | | 158,330 | | | | 3,464,260 | | | | | | — | | | | — | |
Shares redeemed and automatic conversion of shares | | | (375,589 | ) | | | (8,914,053 | ) | | | | | (1,972,209 | ) | | | (42,960,677 | ) |
| | | | | | | | | | |
Net decrease | | | (189,212 | ) | | $ | (4,782,218 | ) | | | | | (1,801,976 | ) | | $ | (39,334,534 | ) |
| | | | | | | | | | |
| | | | | | |
| | | BLACKROCK CAPITAL APPRECIATION FUND, INC. | | MARCH 31, 2014 | | 27 |
| | |
| Notes to Financial Statements (concluded) | | |
| | | | | | | | | | | | | | | | | | |
| | | Six Months
Ended
March 31, 2014 | | | | | Year
Ended
September 30, 2013 | |
| | | Shares | | | Amount | | | | | Shares | | | Amount | |
Investor C | | | | | | | | | | | | | | | | | | |
Shares sold | | | 2,053,076 | | | $ | 49,117,595 | | | | | | 3,653,323 | | | $ | 80,826,231 | |
Shares issued in reinvestment of distributions | | | 4,012,867 | | | | 88,643,466 | | | | | | — | | | | — | |
Shares redeemed | | | (3,184,022 | ) | | | (76,220,794 | ) | | | | | (6,565,835 | ) | | | (144,702,724 | ) |
| | | | | | | | | | |
Net increase (decrease) | | | 2,881,921 | | | $ | 61,540,267 | | | | | | (2,912,512 | ) | | $ | (63,876,493 | ) |
| | | | | | | | | | |
| | | | | | | | | | | | | | | | | | |
Class R | | | | | | | | | | | | | | | | | | |
Shares sold | | | 522,977 | | | $ | 13,193,721 | | | | | | 1,122,325 | | | $ | 25,759,328 | |
Shares issued in reinvestment of distributions | | | 614,635 | | | | 14,339,430 | | | | | | — | | | | — | |
Shares redeemed | | | (1,024,639 | ) | | | (25,774,406 | ) | | | | | (2,809,431 | ) | | | (64,792,040 | ) |
| | | | | | | | | | |
Net increase (decrease) | | | 112,973 | | | $ | 1,758,745 | | | | | | (1,687,106 | ) | | $ | (39,032,712 | ) |
| | | | | | | | | | |
Total Net Increase (Decrease) | | | 5,266,864 | | | $ | 91,172,422 | | | | | | (75,128,533 | ) | | $ | (1,902,976,968 | ) |
| | | | | | | | | | |
11. Subsequent Events:
Management’s evaluation of the impact of all subsequent events on the Fund’s financial statements was completed through the date the financial statements were issued and the following item was noted:
Effective April 24, 2014, the credit agreement was terminated and a new agreement was entered into. The Fund became a party to a 364-day, $1.1 billion credit agreement, which expires in April 2015. Excluding commitments designated for a certain individual fund, the Fund can borrow up to an aggregate commitment amount of $650 million, subject to asset coverage and other limitations as specified in the agreement. The credit agreement has the following terms: a fee of 0.06% per annum on unused commitment amounts and interest at a rate equal to the higher of (a) the one-month LIBOR plus 0.80% per annum or (b) the Fed Funds rate plus 0.80% per annum on amounts borrowed.
| | | | | | |
| 28 | | BLACKROCK CAPITAL APPRECIATION FUND, INC. | | MARCH 31, 2014 | | |
Robert M. Hernandez, Chairman of the Board and Director
Fred G. Weiss, Vice Chairman of the Board and Director
Paul L. Audet, Director
James H. Bodurtha, Director
Bruce R. Bond, Director
Donald W. Burton, Director
Honorable Stuart E. Eizenstat, Director
Laurence D. Fink, Director
Kenneth A. Froot, Director
Henry Gabbay, Director
John F. O’Brien, Director
Roberta Cooper Ramo, Director
David H. Walsh, Director
John M. Perlowski, President and Chief Executive Officer
Brendan Kyne, Vice President
Neal Andrews, Chief Financial Officer
Jay Fife, Treasurer
Brian Kindelan, Chief Compliance Officer and Anti-Money Laundering Officer
Benjamin Archibald, Secretary
Investment Advisor
BlackRock Advisors, LLC
Wilmington, DE 19809
Sub-Advisor
BlackRock Investment Management, LLC
Princeton, NJ 08540
Accounting Agent and Transfer Agent
BNY Mellon Investment Servicing (US) Inc.
Wilmington, DE 19809
Custodian
The Bank of New York Mellon
New York, NY 10286
Distributor
BlackRock Investments, LLC
New York, NY 10022
Legal Counsel
Willkie Farr & Gallagher LLP
New York, NY 10019
Independent Registered Public Accounting Firm
Deloitte & Touche LLP
Philadelphia, PA 19103
Address of the Fund
100 Bellevue Parkway
Wilmington, DE 19809
|
| Effective May 14, 2014, Brian Kindelan resigned as Chief Compliance Officer and Anti-Money Laundering Officer of the Fund and Charles Park became Chief Compliance Officer and Anti-Money Laundering Officer of the Fund. |
| | | | | | |
| | | BLACKROCK CAPITAL APPRECIATION FUND, INC. | | MARCH 31, 2014 | | 29 |
Electronic Delivery
Electronic copies of most financial reports and prospectuses are available on the Fund’s website or shareholders can sign up for e-mail notifications of quarterly statements, annual and semi-annual reports and prospectuses by enrolling in the Fund’s electronic delivery program.
To enroll:
Shareholders Who Hold Accounts with Investment Advisors, Banks or Brokerages:
Please contact your financial advisor. Please note that not all investment advisors, banks or brokerages may offer this service.
Shareholders Who Hold Accounts Directly with BlackRock:
| 1) | Access the BlackRock website at http://www.blackrock.com/edelivery |
| 2) | Select “eDelivery” under the “More Information” section |
Householding
The Fund will mail only one copy of shareholder documents, including prospectuses, annual and semi-annual reports and proxy statements, to shareholders with multiple accounts at the same address. This practice is commonly called “householding” and is intended to reduce expenses and eliminate duplicate mailings of shareholder documents. Mailings of your shareholder documents may be householded indefinitely unless you instruct us otherwise. If you do not want the mailing of these documents to be combined with those for other members of your household, please contact the Fund at (800) 441-7762.
Availability of Quarterly Schedule of Investments
The Fund files its complete schedule of portfolio holdings with the SEC for the first and third quarters of each fiscal year on Form N-Q. The Fund’s Forms N-Q are available on the SEC’s website at http://www.sec.gov and may also be reviewed and copied at the SEC’s Public Reference Room in Washington, D.C. Information on how to access documents on the SEC’s website without charge may be obtained by calling (800) SEC-0330. The Fund’s Forms N-Q may also be obtained upon request and without charge by calling (800) 441-7762.
Availability of Proxy Voting Policies and Procedures
A description of the policies and procedures that the Fund uses to determine how to vote proxies relating to portfolio securities is available (1) without charge, upon request, by calling (800) 441-7762; (2) at http://www.blackrock.com; and (3) on the SEC’s website at http://www.sec.gov.
Availability of Proxy Voting Record
Information about how the Fund voted proxies relating to securities held in the Fund’s portfolios during the most recent 12-month period ended June 30 is available, upon request and without charge (1) at http://www.blackrock.com or by calling (800) 441-7762 and (2) on the SEC’s website at http://www.sec.gov.
Account Information
Call us at (800) 441-7762 from 8:00 AM to 6:00 PM EST on any business day to get information about your account balances, recent transactions and share prices. You can also reach us on the Web at http://www.blackrock.com/funds.
Automatic Investment Plans
Investor Class shareholders who want to invest regularly can arrange to have $50 or more automatically deducted from their checking or savings account and invested in any of the BlackRock funds.
Systematic Withdrawal Plans
Investor Class shareholders can establish a systematic withdrawal plan and receive periodic payments of $50 or more from their BlackRock portfolios, as long as their account balance is at least $10,000.
Retirement Plans
Shareholders may make investments in conjunction with Traditional, Rollover, Roth, Coverdell, Simple IRAs, SEP IRAs and 403(b) Plans.
| | | | | | |
| 30 | | BLACKROCK CAPITAL APPRECIATION FUND, INC. | | MARCH 31, 2014 | | |
| | |
| Additional Information (concluded) | | |
| | |
| BlackRock Privacy Principles | | |
BlackRock is committed to maintaining the privacy of its current and former fund investors and individual clients (collectively, “Clients”) and to safeguarding their non-public personal information. The following information is provided to help you understand what personal information BlackRock collects, how we protect that information and why in certain cases we share such information with select parties.
If you are located in a jurisdiction where specific laws, rules or regulations require BlackRock to provide you with additional or different privacy-related rights beyond what is set forth below, then BlackRock will comply with those specific laws, rules or regulations.
BlackRock obtains or verifies personal non-public information from and about you from different sources, including the following: (i) information we receive from you or, if applicable, your financial intermediary, on applications, forms or other documents; (ii) information about your transactions with us, our affiliates, or others; (iii) information we receive from a consumer reporting agency; and (iv) from visits to our websites.
BlackRock does not sell or disclose to non-affiliated third parties any non-public personal information about its Clients, except as permitted by law or as is necessary to respond to regulatory requests or to service Client accounts. These non-affiliated third parties are required to protect the confidentiality and security of this information and to use it only for its intended purpose.
We may share information with our affiliates to service your account or to provide you with information about other BlackRock products or services that may be of interest to you. In addition, BlackRock restricts access to non-public personal information about its Clients to those BlackRock employees with a legitimate business need for the information. BlackRock maintains physical, electronic and procedural safeguards that are designed to protect the non-public personal information of its Clients, including procedures relating to the proper storage and disposal of such information.
| | | | | | |
| | | BLACKROCK CAPITAL APPRECIATION FUND, INC. | | MARCH 31, 2014 | | 31 |
| | |
| A World-Class Mutual Fund Family | | |
BlackRock offers a diverse lineup of open-end mutual funds crossing all investment styles and managed by experts in equity, fixed income and tax-exempt investing.
BlackRock ACWI ex-US Index Fund
BlackRock All-Cap Energy & Resources Portfolio
BlackRock Basic Value Fund
BlackRock Capital Appreciation Fund
BlackRock Commodity Strategies Fund
BlackRock Disciplined Small Cap Core Fund
BlackRock Emerging Markets Dividend Fund
BlackRock Emerging Markets Fund
BlackRock Emerging Markets Long/Short Equity Fund
BlackRock Energy & Resources Portfolio
BlackRock Equity Dividend Fund
BlackRock EuroFund
BlackRock Flexible Equity Fund
BlackRock Focus Growth Fund
BlackRock Global Dividend Portfolio
BlackRock Global Long/Short Equity Fund
BlackRock Global Opportunities Portfolio
BlackRock Global SmallCap Fund
BlackRock Health Sciences Opportunities Portfolio
BlackRock International Fund
BlackRock International Index Fund
BlackRock International Opportunities Portfolio
BlackRock Large Cap Core Fund
BlackRock Large Cap Core Plus Fund
BlackRock Large Cap Growth Fund
BlackRock Large Cap Value Fund
BlackRock Latin America Fund
BlackRock Long-Horizon Equity Fund
BlackRock Mid-Cap Growth Equity Portfolio
BlackRock Mid-Cap Value Opportunities Fund
BlackRock Natural Resources Trust
BlackRock Pacific Fund
BlackRock Real Estate Securities Fund
BlackRock Russell 1000® Index Fund
BlackRock Science & Technology Opportunities Portfolio
BlackRock Small Cap Growth Equity Portfolio
BlackRock Small Cap Growth Fund II
BlackRock Small Cap Index Fund
BlackRock S&P 500 Stock Fund
BlackRock U.S. Opportunities Portfolio
BlackRock Value Opportunities Fund
| | | | |
| Taxable Fixed Income Funds | | | | |
BlackRock Bond Index Fund
BlackRock Core Bond Portfolio
BlackRock CoreAlpha Bond Fund
BlackRock CoRI Funds
2015
2017
2019
2021
2023
BlackRock Emerging Markets Flexible Dynamic Bond Portfolio
BlackRock Floating Rate Income Portfolio
BlackRock Global Long/Short Credit Fund
BlackRock GNMA Portfolio
BlackRock High Yield Bond Portfolio
BlackRock Inflation Protected Bond Portfolio
BlackRock Investment Grade Bond Portfolio
BlackRock Low Duration Bond Portfolio
BlackRock Secured Credit Portfolio
BlackRock Short Obligations Fund
BlackRock Short-Term Treasury Fund
BlackRock Strategic Income Opportunities Portfolio
BlackRock Total Return Fund
BlackRock U.S. Government Bond Portfolio
BlackRock U.S. Mortgage Portfolio
BlackRock Ultra-Short Obligations Fund
BlackRock World Income Fund
| | | | |
| Municipal Fixed Income Funds | | | | |
BlackRock California Municipal Bond Fund
BlackRock High Yield Municipal Fund
BlackRock National Municipal Fund
BlackRock New Jersey Municipal Bond Fund
BlackRock New York Municipal Bond Fund
BlackRock Pennsylvania Municipal Bond Fund
BlackRock Short-Term Municipal Fund
BlackRock Strategic Municipal Opportunities Fund
| | | | | | | | | | | | | | |
| BlackRock Balanced Capital Fund | | LifePath Active Portfolios | | LifePath Index Portfolios |
| BlackRock Emerging Market Allocation Portfolio | | 2015 | | | 2040 | | | | | Retirement | | 2040 | | |
| BlackRock Global Allocation Fund | | 2020 | | | 2045 | | | | | 2020 | | 2045 | | |
| BlackRock Managed Volatility Portfolio | | 2025 | | | 2050 | | | | | 2025 | | 2050 | | |
| BlackRock Multi-Asset Income Portfolio | | 2030 | | | 2055 | | | | | 2030 | | 2055 | | |
| BlackRock Multi-Asset Real Return Fund | | 2035 | | | | | | | | 2035 | | | | |
| BlackRock Strategic Risk Allocation Fund | | | | | | | | | | | | | | |
| | | | | | |
| | LifePath Portfolios | | | | | | | | | | | | |
| BlackRock Prepared Portfolios | | Retirement | | | 2040 | | | | | | | | | |
Conservative Prepared Portfolio | | 2020 | | | 2045 | | | | | | | | | |
Moderate Prepared Portfolio | | 2025 | | | 2050 | | | | | | | | | |
Growth Prepared Portfolio | | 2030 | | | 2055 | | | | | | | | | |
Aggressive Growth Prepared Portfolio | | 2035 | | | | | | | | | | | | |
BlackRock mutual funds are currently distributed by BlackRock Investments, LLC. You should consider the investment objectives, risks, charges and expenses of the funds under consideration carefully before investing. Each fund’s prospectus contains this and other information and is available at www.blackrock.com or by calling (800) 441-7762 or from your financial advisor. The prospectus should be read carefully before investing.
| | | | | | |
| 32 | | BLACKROCK CAPITAL APPRECIATION FUND, INC. | | MARCH 31, 2014 | | |
| | |
This report is transmitted to shareholders only. It is not authorized for use as an offer of sale or a solicitation of an offer to buy shares of the Fund unless accompanied or preceded by the Fund’s current prospectus. Past performance results shown in this report should not be considered a representation of future performance. Investment returns and principal value of shares will fluctuate so that shares, when redeemed, may be worth more or less than their original cost. Statements and other information herein are as dated and are subject to change. Investment in foreign securities involves special risks including fluctuating foreign exchange rates, foreign government regulations, differing degrees of liquidity and the possibility of substantial volatility due to adverse political, economic or other developments. | |  |
| | |
| CapApp-3/14-SAR | |  |
| | |
| |
| Item 2 – | | Code of Ethics – Not Applicable to this semi-annual report |
| |
| Item 3 – | | Audit Committee Financial Expert – Not Applicable to this semi-annual report |
| |
| Item 4 – | | Principal Accountant Fees and Services – Not Applicable to this semi-annual report |
| |
| Item 5 – | | Audit Committee of Listed Registrants – Not Applicable |
| |
| Item 6 – | | Investments |
| | (a) The registrant’s Schedule of Investments is included as part of the Report to Stockholders filed under Item 1 of this Form. |
| | (b) Not Applicable due to no such divestments during the semi-annual period covered since the previous Form N-CSR filing. |
| |
| Item 7 – | | Disclosure of Proxy Voting Policies and Procedures for Closed-End Management Investment Companies – Not Applicable |
| |
| Item 8 – | | Portfolio Managers of Closed-End Management Investment Companies – Not Applicable |
| |
| Item 9 – | | Purchases of Equity Securities by Closed-End Management Investment Company and Affiliated Purchasers – Not Applicable |
| |
| Item 10 – | | Submission of Matters to a Vote of Security Holders – There have been no material changes to these procedures. |
| |
| Item 11 – | | Controls and Procedures |
| |
| | (a) – The registrant’s principal executive and principal financial officers, or persons performing similar functions, have concluded that the registrant’s disclosure controls and procedures (as defined in Rule 30a-3(c) under the Investment Company Act of 1940, as amended (the “1940 Act”)) are effective as of a date within 90 days of the filing of this report based on the evaluation of these controls and procedures required by Rule 30a-3(b) under the 1940 Act and Rule 15d-15(b) under the Securities Exchange Act of 1934, as amended. |
| |
| | (b) – There were no changes in the registrant’s internal control over financial reporting (as defined in Rule 30a-3(d) under the 1940 Act) that occurred during the second fiscal quarter of the period covered by this report that have materially affected, or are reasonably likely to materially affect, the registrant’s internal control over financial reporting. |
| |
| Item 12 – | | Exhibits attached hereto |
| |
| | (a)(1) – Code of Ethics – Not Applicable to this semi-annual report |
| |
| | (a)(2) – Certifications – Attached hereto |
| |
| | (a)(3) – Not Applicable |
| |
| | (b) – Certifications – Attached hereto |
2
Pursuant to the requirements of the Securities Exchange Act of 1934 and the Investment Company Act of 1940, the registrant has duly caused this report to be signed on its behalf by the undersigned, thereunto duly authorized.
| | |
| BlackRock Capital Appreciation Fund, Inc. |
| |
| By: | | /s/ John M. Perlowski |
| | John M. Perlowski |
| | Chief Executive Officer (principal executive officer) of |
| | BlackRock Capital Appreciation Fund, Inc. |
Date: June 2, 2014
Pursuant to the requirements of the Securities Exchange Act of 1934 and the Investment Company Act of 1940, this report has been signed below by the following persons on behalf of the registrant and in the capacities and on the dates indicated.
| | |
| By: | | /s/ John M. Perlowski |
| | John M. Perlowski |
| | Chief Executive Officer (principal executive officer) of |
| | BlackRock Capital Appreciation Fund, Inc. |
|
| Date: June 2, 2014 |
| |
| By: | | /s/ Neal J. Andrews |
| | Neal J. Andrews |
| | Chief Financial Officer (principal financial officer) of |
| | BlackRock Capital Appreciation Fund, Inc. |
Date: June 2, 2014
3