UNITED STATES
SECURITIES AND EXCHANGE COMMISSION
Washington, D.C. 20549
FORM N-CSR
CERTIFIED SHAREHOLDER REPORT OF REGISTERED MANAGEMENT INVESTMENT
COMPANIES
Investment Company Act file number 811-06669
Name of Fund: BlackRock Capital Appreciation Fund, Inc.
Fund Address: 100 Bellevue Parkway, Wilmington, DE 19809
Name and address of agent for service: John M. Perlowski, Chief Executive Officer, BlackRock Capital
Appreciation Fund, Inc., 55 East 52nd Street, New York, NY 10055
Registrant’s telephone number, including area code: (800) 441-7762
Date of fiscal year end: 09/30/2012
Date of reporting period: 03/31/2012
Item 1 – Report to Stockholders
| | |

| | March 31, 2012 |
|
Semi-Annual Report (Unaudited) |
BlackRock Capital Appreciation Fund, Inc.
| | | | |
| Not FDIC Insured ¡ No Bank Guarantee ¡ May Lose Value | | | | |
Table of Contents
| | | | | | |
| | | | | | | |
| 2 | | BLACKROCK CAPITAL APPRECIATION FUND, INC. | | MARCH 31, 2012 | | |
Dear Shareholder
Twelve months ago, risk assets were charging forward, only to be met with a sharp reversal in May 2011 when escalating political strife in Greece rekindled fears about sovereign debt problems spreading across Europe. Concurrently, global economic indicators signaled that the recovery had slowed. Confidence was further shaken by the prolonged debt ceiling debate in Washington, DC. On August 5, 2011, Standard & Poor’s made history by downgrading the US government’s credit rating, and turmoil erupted in financial markets around the world. Extraordinary levels of volatility persisted in the months that followed as the European debt crisis intensified. Macro news flow became a greater influence on trading decisions than the fundamentals of the securities traded, resulting in high correlations between asset prices. By the end of the third quarter, equity markets had fallen nearly 20% from their April peak while safe-haven assets such as US Treasuries and gold had rallied to historic highs.
October brought enough positive economic data to assuage fears of a global double-dip recession. Additionally, European leaders began to show progress toward stemming the region’s debt crisis. Investors began to reenter the markets, putting risk assets on the road to recovery. Improving investor sentiment carried over into the first several months of 2012. Debt problems in Europe stabilized as policymakers secured a bailout plan for Greece and completed the nation’s debt restructuring without significant market disruptions. While concerns about slowing growth in China and a European recession weighed on the outlook for the global economy, an acceleration of the US recovery lifted sentiment. Several consecutive months of stronger jobs data signaled solid improvement in the US labor market, a pivotal factor for economic growth. Meanwhile, the European Central Bank revived financial markets with additional liquidity through its long-term refinancing operations. The improving market conditions and generally better-than-expected economic news lured investors still holding cash on the sidelines back to risk assets. Stocks, commodities and high yield bonds rallied through the first two months of the year while rising Treasury yields pressured higher-quality fixed income assets. The rally softened in late March, however, as concerns about slowing growth in China were refueled by negative signals from the world’s second-largest economy. Additionally, concerns over the European debt crisis resurfaced given uncertainty around policies for sovereign debt financing in peripheral countries and rising yields in Portugal and Spain.
Thanks in large part to an exceptionally strong first quarter of 2012, risk assets, including equities and high yield bonds, posted solid returns for the 6-month period ended March 31, 2012. On a 12-month basis, US large-cap stocks and high yield bonds delivered positive results, while small-cap stocks finished in slightly negative territory. International and emerging markets, which experienced significant downturns in 2011, lagged the broader rebound. Fixed income securities experienced mixed results, given recent volatility in yields. US Treasury bonds performed particularly well for the 12-month period; however, an early-2012 sell-off resulted in a negative return for the 6–month period. Municipal bonds staged a solid advance over the past year. Continued low short-term interest rates kept yields on money market securities near their all-time lows.
While markets have improved in recent months, considerable headwinds remain. Europe faces a prolonged recession and the financial situations in Italy, Portugal and Spain remain worrisome. Higher oil and gasoline prices along with slowing growth in China and other emerging-market countries weigh heavily on the future of the global economy. But, we believe that with these challenges come opportunities. We remain committed to working with you and your financial professional to identify actionable ideas for your portfolio. We encourage you to visit www.blackrock.com/newworld for more information.
Sincerely,

Rob Kapito
President, BlackRock Advisors, LLC

“While markets have improved in recent months, considerable headwinds remain.”
Rob Kapito
President, BlackRock Advisors, LLC
Total Returns as of March 31, 2012
| | | | | | | | |
| | | 6-month | | | 12-month | |
| US large cap equities (S&P 500® Index) | | | 25.89 | % | | | 8.54 | % |
| US small cap equities (Russell 2000® Index) | | | 29.83 | | | | (0.18 | ) |
| International equities (MSCI Europe, Australasia, Far East Index) | | | 14.56 | | | | (5.77 | ) |
| Emerging market equities (MSCI Emerging Markets Index) | | | 19.12 | | | | (8.81 | ) |
| 3-month Treasury bill (BofA Merrill Lynch 3-Month Treasury Bill Index) | | | 0.01 | | | | 0.06 | |
| US Treasury securities (BofA Merrill Lynch 10- Year US Treasury Index) | | | (1.05 | ) | | | 14.92 | |
| US investment grade bonds (Barclays US Aggregate Bond Index) | | | 1.43 | | | | 7.71 | |
| Tax-exempt municipal bonds (S&P Municipal Bond Index) | | | 4.16 | | | | 12.56 | |
| US high yield bonds (Barclays US Corporate High Yield 2% Issuer Capped Index) | | | 12.17 | | | | 6.43 | |
Past performance is no guarantee of future results. Index performance is shown for illustrative purposes only. You cannot invest directly in an index.
| | | | | | |
| | | | | | | |
| | THIS PAGE NOT PART OF YOUR FUND REPORT | | | | 3 |
| | |
| | |
Fund Summary as of March 31, 2012 | | |
BlackRock Capital Appreciation Fund, Inc.’s (the “Fund”) investment objective is to seek long-term growth of capital.
|
Portfolio Management Commentary |
How did the Fund perform?
| — | | For the six-month period ended March 31, 2012, the Fund generated a strong, double-digit return, but underperformed its benchmark, the Russell 1000® Growth Index, and the broad-market S&P 500® Index. The following discussion of relative performance pertains to the Russell 1000® Growth Index. |
What factors influenced performance?
| — | | Stock selection in the information technology (“IT”), consumer discretionary and financials sectors contributed positively to the Fund’s performance. In IT, Apple, Inc., the Fund’s largest individual holding during the period, delivered the strongest performance as the stock surged over 57% on strong iPhone and iPad sales. Other notable contributors in the IT sector included digital telecommunications equipment maker QUALCOMM, Inc., NXP Semiconductor NV and cloud computing company Rackspace Hosting, Inc. Consumer discretionary stocks were buoyed by signs of economic improvement during the period. Holdings of Starbucks Corp., Coach, Inc. and Michael Kors Holding Ltd. were particularly beneficial for the Fund’s performance. A position in Las Vegas Sands Corp. also made a notable contribution as continued strong growth in gaming revenues from the company’s Macau-based operations combined with investor anticipation of the opening of an additional property in the same region pushed the stock price higher. In financials, Wells Fargo & Co. was a key contributor to performance as the stock rallied on solid earnings and improving loan growth. Shares of Jefferies Group, Inc. also moved higher on better-than-expected quarterly results and easing concerns over the company’s exposure to European sovereign debt. |
| — | | Detracting from performance was stock selection within health care, consumer staples and energy. In health care, a position in biotechnology firm Vertex Pharmaceuticals, Inc. weighed heavily on relative returns. |
| | Vertex shares declined sharply after the firm reported slowing growth in prescription volume and increased competition for its Hepatitis C drug. The Fund sold its position following the firm’s announcement. Other holdings that lagged the broader health care sector included drug distributors AmerisourceBergen Corp. and Cardinal Health, Inc. In consumer staples, a position in Green Mountain Coffee Roasters, Inc. detracted from performance as concerns about future earnings growth and increased competition prompted a sharp decline in the share price. Consumer goods conglomerate The Proctor & Gamble Co. was another weak performer as investors favored higher-growth companies during the period. In the energy sector, Alpha Natural Resources, Inc. was a notable laggard as shares of the metallurgical coal producer declined on increasing concerns about slowing economic growth in China and a corresponding weakening demand for coal. |
Describe recent portfolio activity.
| — | | During the six-month period, the Fund increased exposure to financials with the addition of The Goldman Sachs Group, Inc. The Fund also increased its allocation to the industrials sector with new investments in Eaton Corp., PACCAR, Inc. and Roper Industries, Inc. Conversely, the Fund reduced its weighting in the more defensive consumer staples sector by selling Wal-Mart Stores, Inc. and trimming it positions in The Procter & Gamble Co. and PepsiCo, Inc. |
Describe portfolio positioning at period end.
| — | | At period end, the Fund’s holdings reflected a bias toward more opportunistic growth names, favoring companies that are generating consistent earnings growth and that are positioned to benefit from strong secular trends. The Fund’s most notable sector weightings relative to the Russell 1000® Growth Index included overweights in IT and industrials, and underweights in consumer staples and materials. |
The views expressed reflect the opinions of BlackRock as of the date of this report and are subject to change based on changes in market, economic or other conditions. These views are not intended to be a forecast of future events and are no guarantee of future results.
| | | | | |
| Ten Largest Holdings | | Percent of
Long-Term
Investments |
Apple, Inc. | | | | 9 | % |
QUALCOMM, Inc. | | | | 4 | |
The Boeing Co. | | | | 4 | |
Microsoft Corp. | | | | 3 | |
Amazon.com, Inc. | | | | 3 | |
Google, Inc., Class A | | | | 3 | |
Danaher Corp. | | | | 3 | |
The Coca-Cola Co. | | | | 3 | |
Exxon Mobil Corp. | | | | 2 | |
Salesforce.com, Inc. | | | | 2 | |
| | | | | |
| Sector Allocation | | Percent of
Long-Term
Investments |
Information Technology | | | | 36 | % |
Consumer Discretionary | | | | 14 | |
Industrials | | | | 14 | |
Health Care | | | | 11 | |
Energy | | | | 8 | |
Consumer Staples | | | | 7 | |
Financials | | | | 5 | |
Materials | | | | 3 | |
Telecommunication Services | | | | 2 | |
For Fund compliance purposes, the Fund’s sector classifications refer to any one or more of the sector sub-classifications used by one or more widely recognized market indexes or ratings group indexes, and/or as defined by Fund management. These definitions may not apply for purposes of this report, which may combine sector sub-classifications for reporting ease.
| | | | | | |
| | | | | | | |
| 4 | | BLACKROCK CAPITAL APPRECIATION FUND, INC. | | MARCH 31, 2012 | | |
|
Total Return Based on a $10,000 Investment |
| | |
| | 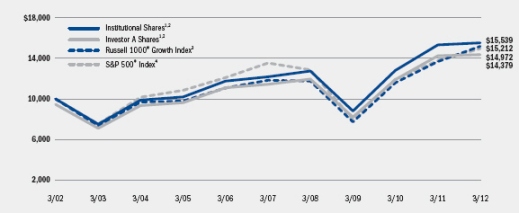 |
| | 1 Assuming maximum sales charges, if any, transaction costs and other operating expenses, including investment advisory fees. Institutional Shares do not have a sales charge. 2 The Fund invests primarily in common stock of US companies that Fund management believes have shown above-average growth rates in earnings over the long-term. 3 This unmanaged broad-based index is a subset of the Russell 1000® Index consisting of those Russell 1000® securities with greater-than-average growth orientation. 4 This unmanaged index covers 500 industrial, utility, transportation and financial companies of the US markets (mostly New York Stock Exchange (“NYSE”) issues) representing about 75% of NYSE market capitalization and 30% of NYSE issues. |
|
Performance Summary for the Period Ended March 31, 2012 |
| | | | | | | | | | | | | | | | | | | | | | | | | | | | | | | | | | | |
| | | | | Average Annual Total Returns5 |
| | | | | 1 Year | | 5 Years | | 10 Years |
| | | 6-Month
Total Returns | | w/o sales
charge | | w/sales
charge | | w/o sales
charge | | w/sales
charge | | w/o sales
charge | | w/sales
charge |
BlackRock | | | | 23.95 | % | | | | 1.21 | % | | | | N/A | | | | | 5.14 | % | | | | N/A | | | | | 4.67 | % | | | | N/A | |
Institutional | | | | 23.81 | | | | | 1.13 | | | | | N/A | | | | | 4.99 | | | | | N/A | | | | | 4.51 | | | | | N/A | |
Investor A | | | | 23.73 | | | | | 0.84 | | | | | (4.47 | )% | | | | 4.65 | | | | | 3.53 | % | | | | 4.26 | | | | | 3.70 | % |
Investor B | | | | 23.06 | | | | | (0.10 | ) | | | | (4.59 | ) | | | | 3.75 | | | | | 3.40 | | | | | 3.62 | | | | | 3.62 | |
Investor C | | | | 23.16 | | | | | 0.00 | | | | | (1.00 | ) | | | | 3.90 | | | | | 3.90 | | | | | 3.51 | | | | | 3.51 | |
Class R | | | | 23.60 | | | | | 0.55 | | | | | N/A | | | | | 4.29 | | | | | N/A | | | | | 3.80 | | | | | N/A | |
Russell 1000® Growth Index | | | | 26.85 | | | | | 11.02 | | | | | N/A | | | | | 5.10 | | | | | N/A | | | | | 4.28 | | | | | N/A | |
S&P 500® Index | | | | 25.89 | | | | | 8.54 | | | | | N/A | | | | | 2.01 | | | | | N/A | | | | | 4.12 | | | | | N/A | |
| | 5 | Assuming maximum sales charges, if any. Average annual total returns with and without sales charges reflect reductions for distribution and service fees. See “About Fund Performance” on page 6 for a detailed description of share classes, including any related sales charges and fees. |
N/A - Not applicable as share class and index do not have a sales charge.
Past performance is not indicative of future results.
| | | | | | | | | | | | | | | | | | | | | | | | | | | | | | | | | | | |
| | | Actual | | Hypothetical7 | | |
| | | Beginning
Account Value
October 1, 2011 | | Ending
Account Value
March 31, 2012 | | Expenses Paid
During the Period6 | | Beginning
Account Value
October 1, 2011 | | Ending
Account Value
March 31, 2012 | | Expenses Paid
During the Period6 | | Annualized
Expense
Ratio |
BlackRock | | | $ | 1,000.00 | | | | $ | 1,239.50 | | | | $ | 4.03 | | | | $ | 1,000.00 | | | | $ | 1,021.40 | | | | $ | 3.64 | | | | | 0.72 | % |
Institutional | | | $ | 1,000.00 | | | | $ | 1,238.10 | | | | $ | 4.36 | | | | $ | 1,000.00 | | | | $ | 1,021.10 | | | | $ | 3.94 | | | | | 0.78 | % |
Investor A | | | $ | 1,000.00 | | | | $ | 1,237.30 | | | | $ | 6.04 | | | | $ | 1,000.00 | | | | $ | 1,019.60 | | | | $ | 5.45 | | | | | 1.08 | % |
Investor B | | | $ | 1,000.00 | | | | $ | 1,230.60 | | | | $ | 11.32 | | | | $ | 1,000.00 | | | | $ | 1,014.85 | | | | $ | 10.23 | | | | | 2.03 | % |
Investor C | | | $ | 1,000.00 | | | | $ | 1,231.60 | | | | $ | 10.77 | | | | $ | 1,000.00 | | | | $ | 1,015.35 | | | | $ | 9.72 | | | | | 1.93 | % |
Class R | | | $ | 1,000.00 | | | | $ | 1,236.00 | | | | $ | 7.66 | | | | $ | 1,000.00 | | | | $ | 1,018.15 | | | | $ | 6.91 | | | | | 1.37 | % |
| | 6 | For each class of the Fund, expenses are equal to the annualized expense ratio for the class, multiplied by the average account value over the period, multiplied by 183/366 (to reflect the one-half year period shown). |
| | 7 | Hypothetical 5% annual return before expenses is calculated by pro rating the number of days in the most recent fiscal half year divided by 366. |
See “Disclosure of Expenses” on page 6 for further information on how expenses were calculated.
| | | | | | |
| | | | | | | |
| | BLACKROCK CAPITAL APPRECIATION FUND, INC. | | MARCH 31, 2012 | | 5 |
| — | | BlackRock and Institutional Shares are not subject to any sales charge. BlackRock and Institutional Shares bear no ongoing distribution or service fees and are available only to eligible investors. Prior to June 28, 2010, BlackRock Shares’ performance results are those of the Institutional Shares of BlackRock Capital Appreciation Portfolio, a series of BlackRockSM Funds (the “Predecessor Fund”). Prior to June 28, 2010, Institutional Shares’ performance results are those of the BlackRock Shares restated to reflect the Institutional Shares’ fees. |
| — | | Investor A Shares incur a maximum initial sales charge (front-end load) of 5.25% and a service fee of 0.25% per year (but no distribution fee). |
| — | | Investor B Shares are subject to a maximum contingent deferred sales charge (“CDSC”) of 4.50% declining to 0% after six years. In addition, Investor B Shares are subject to a distribution fee of 0.75% per year and a service fee of 0.25% per year. Investor B Shares automatically convert to Investor A Shares after approximately eight years. (There is no initial sales charge for automatic share conversions.) All returns for periods greater than eight years reflect this conversion. Investor B Shares are only available through exchanges, dividend reinvestments by existing shareholders or for purchase by certain qualified employee benefit plans. |
| — | | Investor C Shares are subject to a 1.00% CDSC if redeemed within one year of purchase. In addition, Investor C Shares are subject to a distribution fee of 0.75% per year and a service fee of 0.25% per year. |
| — | | Class R Shares are not subject to any sales charge. Class R Shares are subject to a distribution fee of 0.25% per year and a service fee of 0.25% per year. Class R Shares are available only to certain retirement and other similar plans. Prior to June 28, 2010, Class R Shares’ performance results are those of BlackRock Shares (which have no distribution or service fees) restated to reflect Class R Shares’ fees. |
Performance information reflects past performance and does not guarantee future results. Current performance may be lower or higher than the performance data quoted. Refer to www.blackrock.com/funds to obtain performance data current to the most recent month-end. Performance results do not reflect the deduction of taxes that a shareholder would pay on Fund distributions or the redemption of Fund shares. Figures shown in the performance tables on the previous page assume reinvestment of all dividends and distributions, if any, at net asset value (“NAV”) on the ex-dividend date. Investment return and principal value of shares will fluctuate so that shares, when redeemed, may be worth more or less than their original cost.
Performance for the Fund for periods prior to June 28, 2010 is based on performance of the Predecessor Fund, that reorganized with the Fund on that date.
Performance for the Fund for the periods prior to January 31, 2005 is based on performance of a certain former State Street Research mutual fund that reorganized with the Predecessor Fund on that date.
The Fund’s investment advisor, BlackRock Advisors, LLC (the “Manager”), waived and/or reimbursed a portion of the Fund’s expenses. Without such waiver and/or reimbursement, the Fund’s performance would have been lower. The Manager has contractually agreed to waive fees and/or reimburse expenses until February 1, 2022. On February 1 of each year, the waiver agreement will renew automatically so that the agreement will have a perpetual ten year term. This agreement may be terminated upon 90 days’ notice by a majority of the Independent Directors or by a majority shareholder vote. Dividends paid to each class of shares will vary because of the different levels of service, distribution and transfer agency fees applicable to each class, which are deducted from the income available to be paid to shareholders.
Disclosure of Expenses
Shareholders of the Fund may incur the following charges: (a) expenses related to transactions, including sales charges and exchange fees; and (b) operating expenses, including investment advisory fees, service and distribution fees, including 12b-1 fees, acquired fund fees and expenses and other Fund expenses. The expense example on the previous page (which is based on a hypothetical investment of $1,000 invested on October 1, 2011 and held through March 31, 2012) is intended to assist shareholders both in calculating expenses based on an investment in the Fund and in comparing these expenses with similar costs of investing in other mutual funds.
The table provides information about actual account values and actual expenses. In order to estimate the expenses a shareholder paid during the period covered by this report, shareholders can divide their account value by $1,000 and then multiply the result by the number corresponding to their share class under the heading entitled “Expenses Paid During the Period.”
The table also provides information about hypothetical account values and hypothetical expenses based on the Fund’s actual expense ratio and an assumed rate of return of 5% per year before expenses. In order to assist shareholders in comparing the ongoing expenses of investing in the Fund and other funds, compare the 5% hypothetical example with the 5% hypothetical examples that appear in other funds’ shareholder reports.
The expenses shown in the table are intended to highlight shareholders’ ongoing costs only and do not reflect any transactional expenses, such as sales charges or exchange fees, if any. Therefore, the hypothetical examples are useful in comparing ongoing expenses only, and will not help shareholders determine the relative total expenses of owning different funds. If these transactional expenses were included, shareholder expenses would have been higher.
| | | | | | |
| | | | | | | |
| 6 | | BLACKROCK CAPITAL APPRECIATION FUND, INC. | | MARCH 31, 2012 | | |
| | |
| | |
Schedule of Investments March 31, 2012 (Unaudited) | | (Percentages shown are based on Net Assets) |
| | | | | | | | |
| Common Stocks | | Shares | | | Value | |
Aerospace & Defense – 6.2% | | | | | | | | |
The Boeing Co. | | | 2,654,300 | | | $ | 197,400,291 | |
Precision Castparts Corp. | | | 377,600 | | | | 65,287,040 | |
United Technologies Corp. | | | 808,500 | | | | 67,056,990 | |
| | | | | | | | |
| | | | | | | | 329,744,321 | |
Auto Components – 0.9% | | | | | | | | |
Allison Transmission Holdings, Inc. (a) | | | 886,000 | | | | 21,157,680 | |
BorgWarner, Inc. (a) | | | 301,400 | | | | 25,420,076 | |
| | | | | | | | |
| | | | | | | | 46,577,756 | |
Automobiles – 0.8% | | | | | | | | |
Tesla Motors, Inc. (a)(b) | | | 1,115,900 | | | | 41,556,116 | |
Beverages – 3.0% | | | | | | | | |
The Coca-Cola Co. | | | 1,893,454 | | | | 140,134,530 | |
PepsiCo, Inc. | | | 325,600 | | | | 21,603,560 | |
| | | | | | | | |
| | | | | | | | 161,738,090 | |
Biotechnology – 3.0% | | | | | | | | |
Biogen Idec, Inc. (a) | | | 596,700 | | | | 75,166,299 | |
Celgene Corp. (a) | | | 725,000 | | | | 56,202,000 | |
Gilead Sciences, Inc. (a) | | | 537,400 | | | | 26,251,990 | |
| | | | | | | | |
| | | | | | | | 157,620,289 | |
Capital Markets – 2.2% | | | | | | | | |
The Goldman Sachs Group, Inc. | | | 522,900 | | | | 65,033,073 | |
Jefferies Group, Inc. | | | 2,679,700 | | | | 50,485,548 | |
| | | | | | | | |
| | | | | | | | 115,518,621 | |
Chemicals – 2.0% | | | | | | | | |
Celanese Corp. | | | 1,306,000 | | | | 60,311,080 | |
Monsanto Co. | | | 593,100 | | | | 47,305,656 | |
| | | | | | | | |
| | | | | | | | 107,616,736 | |
Commercial Banks – 1.4% | | | | | | | | |
Wells Fargo & Co. | | | 2,179,800 | | | | 74,418,372 | |
Communications Equipment – 4.4% | | | | | |
F5 Networks, Inc. (a)(b) | | | 163,400 | | | | 22,052,464 | |
QUALCOMM, Inc. | | | 3,121,500 | | | | 212,324,430 | |
| | | | | | | | |
| | | | | | | | 234,376,894 | |
Computers & Peripherals – 11.3% | | | | | | | | |
Apple, Inc. | | | 816,080 | | | | 489,215,478 | |
EMC Corp. (a) | | | 741,469 | | | | 22,155,094 | |
Fusion-io, Inc. (a)(b) | | | 905,010 | | | | 25,711,334 | |
NetApp, Inc. (a)(b) | | | 1,465,700 | | | | 65,619,389 | |
| | | | | | | | |
| | | | | | | | 602,701,295 | |
Diversified Telecommunication Services – 1.8% | |
Level 3 Communications, Inc. (a) | | | 527,700 | | | | 13,577,721 | |
Verizon Communications, Inc. | | | 2,110,800 | | | | 80,695,884 | |
| | | | | | | | |
| | | | | | | | 94,273,605 | |
Electrical Equipment – 0.5% | | | | | | | | |
Roper Industries, Inc. | | | 271,100 | | | | 26,882,276 | |
Energy Equipment & Services – 3.0% | | | | | |
National Oilwell Varco, Inc. | | | 718,900 | | | | 57,130,983 | |
Noble Corp. | | | 945,300 | | | | 35,420,391 | |
Schlumberger Ltd. | | | 932,417 | | | | 65,203,921 | |
| | | | | | | | |
| | | | | | | | 157,755,295 | |
Food & Staples Retailing – 2.6% | | | | | | | | |
Costco Wholesale Corp. | | | 898,100 | | | | 81,547,480 | |
| | | | | | | | |
| Common Stocks | | Shares | | | Value | |
Food & Staples Retailing (concluded) | | | | | | | | |
Whole Foods Market, Inc. | | | 664,500 | | | $ | 55,286,400 | |
| | | | | | | | |
| | | | | | | | 136,833,880 | |
Food Products – 0.5% | | | | | | | | |
Green Mountain Coffee Roasters,
Inc. (a)(b) | | | 547,100 | | | | 25,626,164 | |
Health Care Equipment & Supplies – 0.7% | |
Intuitive Surgical, Inc. (a) | | | 49,764 | | | | 26,959,647 | |
Stryker Corp. | | | 229,719 | | | | 12,744,810 | |
| | | | | | | | |
| | | | | | | | 39,704,457 | |
Health Care Providers & Services – 3.3% | | | | | |
AmerisourceBergen Corp. | | | 1,304,700 | | | | 51,770,496 | |
Cardinal Health, Inc. | | | 882,300 | | | | 38,035,953 | |
Medco Health Solutions, Inc. (a) | | | 1,214,000 | | | | 85,344,200 | |
| | | | | | | | |
| | | | | | | | 175,150,649 | |
Health Care Technology – 1.7% | | | | | | | | |
Cerner Corp. (a)(b) | | | 1,219,300 | | | | 92,861,888 | |
Hotels, Restaurants & Leisure – 3.7% | | | | | |
Chipotle Mexican Grill, Inc. (a) | | | 65,300 | | | | 27,295,400 | |
Las Vegas Sands Corp. | | | 1,422,800 | | | | 81,910,596 | |
Starbucks Corp. | | | 1,543,680 | | | | 86,276,275 | |
| | | | | | | | |
| | | | | | | | 195,482,271 | |
Household Products – 0.6% | | | | | | | | |
The Procter & Gamble Co. | | | 446,517 | | | | 30,010,407 | |
Industrial Conglomerates – 2.7% | | | | | | | | |
Danaher Corp. | | | 2,559,544 | | | | 143,334,464 | |
Internet & Catalog Retail – 4.0% | | | | | | | | |
Amazon.com, Inc. (a)(b) | | | 793,740 | | | | 160,740,287 | |
priceline.com, Inc. (a) | | | 74,900 | | | | 53,740,750 | |
| | | | | | | | |
| | | | | | | | 214,481,037 | |
Internet Software & Services – 4.8% | | | | | |
eBay, Inc. (a) | | | 1,693,300 | | | | 62,465,837 | |
Google, Inc., Class A (a)(b) | | | 235,526 | | | | 151,028,692 | |
Rackspace Hosting, Inc. (a)(b) | | | 748,000 | | | | 43,226,920 | |
| | | | | | | | |
| | | | | | | | 256,721,449 | |
IT Services – 2.3% | | | | | | | | |
VeriFone Systems, Inc. (a)(b) | | | 1,107,500 | | | | 57,446,025 | |
Visa, Inc., A Shares | | | 543,400 | | | | 64,121,200 | |
| | | | | | | | |
| | | | | | | | 121,567,225 | |
Machinery – 3.9% | | | | | | | | |
Eaton Corp. | | | 1,362,800 | | | | 67,908,324 | |
PACCAR, Inc. | | | 840,000 | | | | 39,337,200 | |
Stanley Black & Decker, Inc. | | | 794,000 | | | | 61,106,240 | |
Terex Corp. (a)(b) | | | 1,826,745 | | | | 41,101,763 | |
| | | | | | | | |
| | | | | | | | 209,453,527 | |
Media – 1.2% | | | | | | | | |
Comcast Corp., Class A | | | 2,183,500 | | | | 65,526,835 | |
Metals & Mining – 0.9% | | | | | | | | |
Freeport-McMoRan Copper & Gold, Inc. | | | 1,289,174 | | | | 49,040,179 | |
Oil, Gas & Consumable Fuels – 5.5% | | | | | | | | |
Alpha Natural Resources, Inc. (a) | | | 1,485,051 | | | | 22,587,626 | |
Anadarko Petroleum Corp. | | | 1,142,600 | | | | 89,511,284 | |
Exxon Mobil Corp. | | | 1,411,300 | | | | 122,402,049 | |
Range Resources Corp. | | | 1,049,400 | | | | 61,012,116 | |
| | | | | | | | |
| | | | | | | | 295,513,075 | |
| | | | | | |
| See Notes to Financial Statements. |
| | | | | | | |
| | BLACKROCK CAPITAL APPRECIATION FUND, INC. | | MARCH 31, 2012 | | 7 |
| | |
| | |
Schedule of Investments (continued) | | (Percentages shown are based on Net Assets) |
| | | | | | | | |
| Common Stocks | | Shares | | | Value | |
Personal Products – 0.5% | | | | | | | | |
Herbalife Ltd. | | | 382,500 | | | $ | 26,323,650 | |
Pharmaceuticals – 1.9% | | | | | | | | |
Pfizer, Inc. | | | 2,693,000 | | | | 61,023,380 | |
Valeant Pharmaceuticals International,
Inc. (a) | | | 795,200 | | | | 42,694,288 | |
| | | | | | | | |
| | | | | | | | 103,717,668 | |
Professional Services – 0.7% | | | | | | | | |
Manpower, Inc. | | | 742,600 | | | | 35,176,962 | |
Real Estate Investment Trusts (REITs) – 1.0% | | | | | |
American Tower Corp. | | | 813,300 | | | | 51,254,166 | |
Semiconductors & Semiconductor Equipment – 4.5% | |
Avago Technologies Ltd. | | | 718,900 | | | | 28,015,533 | |
Broadcom Corp., Class A (a) | | | 1,446,919 | | | | 56,863,917 | |
Marvell Technology Group Ltd. (a) | | | 4,093,400 | | | | 64,389,182 | |
NXP Semiconductor NV (a) | | | 1,959,500 | | | | 52,142,295 | |
Xilinx, Inc. | | | 1,123,200 | | | | 40,918,176 | |
| | | | | | | | |
| | | | | | | | 242,329,103 | |
Software – 8.3% | | | | | | | | |
Check Point Software Technologies Ltd. (a) | | | 1,097,015 | | | | 70,033,438 | |
Microsoft Corp. | | | 5,106,400 | | | | 164,681,400 | |
Red Hat, Inc. (a) | | | 980,354 | | | | 58,713,401 | |
Salesforce.com, Inc. (a)(b) | | | 623,354 | | | | 96,314,426 | |
VMware, Inc., Class A (a) | | | 477,607 | | | | 53,668,699 | |
| | | | | | | | |
| | | | | | | | 443,411,364 | |
| | | | | | | | |
| Common Stocks | | Shares | | | Value | |
Specialty Retail – 1.8% | | | | | | | | |
The Home Depot, Inc. | | | 1,854,400 | | | $ | 93,294,864 | |
Textiles, Apparel & Luxury Goods – 2.1% | | | | | |
Coach, Inc. | | | 699,550 | | | | 54,061,224 | |
Michael Kors Holdings Ltd. (a) | | | 752,800 | | | | 35,072,952 | |
Under Armour, Inc., Class A (a) | | | 219,100 | | | | 20,595,400 | |
| | | | | | | | |
| | | | | | | | 109,729,576 | |
Total Long-Term Investments | | | | | | | | |
(Cost – $4,045,328,565) – 99.7% | | | | | | | 5,307,324,526 | |
| | | | | | | | |
| | | | | | | | |
Short-Term Securities | | | | | | |
BlackRock Liquidity Funds, TempFund, Institutional Class, 0.14% (c)(d) | | | 7,867,503 | | | | 7,867,503 | |
| | | Beneficial
Interest
(000) | | | | |
BlackRock Liquidity Series, LLC Money Market Series, 0.24% (c)(d)(e) | | $ | 284,536 | | | | 284,535,788 | |
Total Short-Term Securities (Cost – $292,403,291) – 5.5% | | | | 292,403,291 | |
Total Investments (Cost – $4,337,731,856) – 105.2% | | | | 5,599,727,817 | |
Liabilities in Excess of Other Assets – (5.2)% | | | | (275,345,206 | ) |
Net Assets – 100.0% | | | | | | $ | 5,324,382,611 | |
| (a) | Non-income producing security. |
| (b) | Security, or a portion of security, is on loan. |
| (c) | Investments in companies considered to be an affiliate of the Fund during the period, for purposes of Section 2(a)(3) of the Investment Company Act of 1940, as amended, were as follows: |
| | | | | | | | | | | | | | | | | | | | |
| Affiliate | | Shares/ Beneficial Interest Held at September 30, 2011 | | | Net Activity | | | Shares/ Beneficial Interest Held at
March 31, 2012 | | | Realized Gain | | | Income | |
BlackRock Liquidity Funds, TempFund, Institutional Class | | | 74,155,048 | | | | (66,287,545 | ) | | | 7,867,503 | | | | $1,079 | | | $ | 17,548 | |
BlackRock Liquidity Series, LLC Money Market Series | | | $143,560,634 | | | $ | 140,975,154 | | | $ | 284,535,788 | | | | – | | | $ | 1,336,084 | |
| (d) | Represents the current yield as of report date. |
| (e) | Security was purchased with the cash collateral from loaned securities. |
| | | | | | |
| See Notes to Financial Statements. |
| | | | | | | |
| 8 | | BLACKROCK CAPITAL APPRECIATION FUND, INC. | | MARCH 31, 2012 | | |
| | |
| | |
Schedule of Investments (concluded) | | |
| — | | For Fund compliance purposes, the Fund’s industry classifications refer to any one or more of the industry sub-classifications used by one or more widely recognized market indexes or ratings group indexes, and/or as defined by Fund management. These definitions may not apply for purposes of this report, which may combine industry sub-classifications for reporting ease. |
| — | | Fair Value Measurements – Various inputs are used in determining the fair value of investments. These inputs are categorized into a disclosure hierarchy consisting of three broad levels for financial statement purposes as follows: |
| | — | | Level 1 – unadjusted price quotations in active markets/exchanges for identical assets and liabilities |
| | — | | Level 2 – other observable inputs (including, but not limited to: quoted prices for similar assets or liabilities in markets that are active, quoted prices for identical or similar assets or liabilities in markets that are not active, inputs other than quoted prices that are observable for the assets or liabilities (such as interest rates, yield curves, volatilities, prepayment speeds, loss severities, credit risks and default rates) or other market–corroborated inputs) |
| | — | | Level 3 – unobservable inputs based on the best information available in the circumstances, to the extent observable inputs are not available (including the Fund’s own assumptions used in determining the fair value of investments) |
Changes in valuation techniques may result in transfers into or out of an assigned level within the disclosure hierarchy. The categorization of a value determined for investments is based on the pricing transparency of the investment and is not necessarily an indication of the risks associated with investing in those securities. For information about the Fund’s policy regarding valuation of investments and other significant accounting policies, please refer to Note 1 of the Notes to Financial Statements.
The following table summarizes the inputs used as of March 31, 2012 in determining the fair valuation of the Fund’s investments:
| | | | | | | | |
| Valuation Inputs | | Level 1 | | Level 2 | | Level 3 | | Total |
Assets: | | | | | | | | |
| Investments: | | | | | | | | |
Long-Term Investments1 | | $5,307,324,526 | | – | | – | | $5,307,324,526 |
Short-Term Securities | | 7,867,503 | | $284,535,788 | | – | | 292,403,291 |
Total | | $5,315,192,029 | | $284,535,788 | | – | | $5,599,727,817 |
1 See above Schedule of Investments for values in each industry.
| | | | | | |
| See Notes to Financial Statements. |
| | | | | | | |
| | BLACKROCK CAPITAL APPRECIATION FUND, INC. | | MARCH 31, 2012 | | 9 |
| | |
| | |
Statement of Assets and Liabilities | | |
| | | | |
| March 31, 2012 (Unaudited) | | | |
Assets | | | | |
Investments at value – unaffiliated (including securities loaned at value of $275,818,727) (cost – $4,045,328,565) | | $ | 5,307,324,526 | |
Investments at value – affiliated (cost – $292,403,291) | | | 292,403,291 | |
Investments sold receivable | | | 86,110,669 | |
Capital shares sold receivable | | | 5,653,517 | |
Dividends receivable – unaffiliated | | | 2,131,443 | |
Dividends receivable – affiliated | | | 3,793 | |
Securities lending income receivable – affiliated | | | 271,921 | |
Receivable from advisor | | | 42,008 | |
Prepaid expenses | | | 144,667 | |
Total assets | | | 5,694,085,835 | |
| | | | |
Liabilities | | | | |
Collateral on securities loaned at value | | | 284,535,788 | |
Investments purchased payable | | | 64,819,618 | |
Capital shares redeemed payable | | | 14,383,722 | |
Investment advisory fees payable | | | 2,791,389 | |
Service and distribution fees payable | | | 1,150,295 | |
Other affiliates payable | | | 170,092 | |
Officer’s and Directors’ fees payable | | | 13,403 | |
Other accrued expenses payable | | | 1,838,917 | |
Total liabilities | | | 369,703,224 | |
Net Assets | | $ | 5,324,382,611 | |
| | | | |
Net Assets Consist of | | | | |
Paid-in capital | | $ | 4,551,033,393 | |
Undistributed net investment income | | | 2,783,570 | |
Accumulated net realized loss | | | (491,430,313 | ) |
Net unrealized appreciation/depreciation | | | 1,261,995,961 | |
Net Assets | | $ | 5,324,382,611 | |
| | | | |
Net Asset Value | | | | |
BlackRock – Based on net assets of $1,065,915,384 and 42,474,971 shares outstanding, 300,000,000 shares authorized, $0.10 par value | | $ | 25.10 | |
Institutional – Based on net assets of $1,195,277,410 and 47,689,087 shares outstanding, 300,000,000 shares authorized, $0.10 par value | | $ | 25.06 | |
Investor A – Based on net assets of $2,217,064,630 and 91,853,661 shares outstanding, 300,000,000 shares authorized, $0.10 par value | | $ | 24.14 | |
Investor B – Based on net assets of $92,687,445 and 4,396,673 shares outstanding, 500,000,000 shares authorized, $0.10 par value | | $ | 21.08 | |
Investor C – Based on net assets of $633,866,107 and 29,867,667 shares outstanding, 300,000,000 shares authorized, $0.10 par value | | $ | 21.22 | |
Class R – Based on net assets of $119,571,635 and 5,411,358 shares outstanding, 500,000,000 shares authorized, $0.10 par value | | $ | 22.10 | |
| | | | | | |
| See Notes to Financial Statements. |
| | | | | | | |
| 10 | | BLACKROCK CAPITAL APPRECIATION FUND, INC. | | MARCH 31, 2012 | | |
| | | | |
| Six Months Ended March 31, 2012 (Unaudited) | | | |
Investment Income | | | | |
Dividends – unaffiliated | | $ | 30,163,764 | |
Securities lending – affiliated | | | 1,336,084 | |
Dividends – affiliated | | | 17,548 | |
Total income | | | 31,517,396 | |
| | | | |
Expenses | | | | |
Investment advisory | | | 15,416,224 | |
Service and distribution – class specific | | | 6,281,027 | |
Transfer agent – class specific | | | 4,595,086 | |
Administration | | | 250,382 | |
Registration | | | 126,673 | |
Custodian | | | 120,202 | |
Printing | | | 96,011 | |
Professional | | | 65,035 | |
Officer and Directors | | | 54,195 | |
Miscellaneous | | | 45,849 | |
Total expenses | | | 27,050,684 | |
Less fees waived by advisor | | | (12,609 | ) |
Less transfer agent fees waived – class specific | | | (5,936 | ) |
Less transfer agent fees reimbursed – class specific | | | (293,858 | ) |
Total expenses after fees waived and reimbursed | | | 26,738,281 | |
Net investment income | | | 4,779,115 | |
| | | | |
Realized and Unrealized Gain | | | | |
Net realized gain from: | | | | |
Investments – unaffiliated | | | 34,066,153 | |
Investments – affiliated | | | 1,079 | |
| | | 34,067,232 | |
Net change in unrealized appreciation/depreciation on investments | | | 1,031,248,734 | |
Total realized and unrealized gain | | | 1,065,315,966 | |
Net Increase in Net Assets Resulting from Operations | | $ | 1,070,095,081 | |
| | | | | | |
| See Notes to Financial Statements. |
| | | | | | | |
| | BLACKROCK CAPITAL APPRECIATION FUND, INC. | | MARCH 31, 2012 | | 11 |
| | |
| | |
Statements of Changes in Net Assets | | |
| | | | | | | | |
| Increase in Net Assets: | | Six Months
Ended
March 31, 2012
(Unaudited) | | | Year Ended
September 30,
2011 | |
Operations | | | | | | | | |
Net investment income (loss) | | $ | 4,779,115 | | | $ | (5,538,306 | ) |
Net realized gain | | | 34,067,232 | | | | 114,668,498 | |
Net change in unrealized appreciation/depreciation | | | 1,031,248,734 | | | | (415,909,131 | ) |
Net increase (decrease) in net assets resulting from operations | | | 1,070,095,081 | | | | (306,778,939 | ) |
| | | | | | | | |
Capital Share Transactions | | | | | | | | |
Net increase (decrease) in net assets derived from capital share transactions | | | (238,423,967 | ) | | | 1,340,202,068 | |
| | | | | | | | |
Net Assets | | | | | | | | |
Total increase in net assets | | | 831,671,114 | | | | 1,033,423,129 | |
Beginning of period | | | 4,492,711,497 | | | | 3,459,288,368 | |
End of period | | $ | 5,324,382,611 | | | $ | 4,492,711,497 | |
Undistributed (accumulated) net investment income (loss) | | $ | 2,783,570 | | | $ | (1,995,545 | ) |
| | | | | | |
| See Notes to Financial Statements. |
| | | | | | | |
| 12 | | BLACKROCK CAPITAL APPRECIATION FUND, INC. | | MARCH 31, 2012 | | |
| | | | | | | | | | | | | | | | | | | | | | | | | | | | | | |
| | | BlackRock |
| | | Six Months
Ended
March 31, 2012 | | Year Ended
September 30, |
| | | (Unaudited) | | 2011 | | 20101 | | 20091 | | 20081 | | 20071 |
Per Share Operating Performance | | | | | | | | | | | | | | | | | | | | | | | | | | | | | | |
Net asset value, beginning of period | | | $ | 20.25 | | | | $ | 20.86 | | | | $ | 18.72 | | | | $ | 18.94 | | | | $ | 22.62 | | | | $ | 18.52 | |
Net investment income2 | | | | 0.06 | | | | | 0.07 | | | | | 0.05 | | | | | 0.09 | | | | | 0.09 | | | | | 0.07 | |
Net realized and unrealized gain (loss) | | | | 4.79 | | | | | (0.68 | ) | | | | 2.16 | | | | | (0.31 | ) | | | | (3.77 | )3 | | | | 4.03 | |
Net increase (decrease) from investment operations | | | | 4.85 | | | | | (0.61 | ) | | | | 2.21 | | | | | (0.22 | ) | | | | (3.68 | ) | | | | 4.10 | |
Dividends from net investment income | | | | – | | | | | – | | | | | (0.07 | ) | | | | – | | | | | – | | | | | – | |
Net asset value, end of period | | | $ | 25.10 | | | | $ | 20.25 | | | | $ | 20.86 | | | | $ | 18.72 | | | | $ | 18.94 | | | | $ | 22.62 | |
| | | | | | | | | | | | | | | | | | | | | | | | | | | | | | |
Total Investment Return4 | | | | | | | | | | | | | | | | | | | | | | | | | | | | | | |
Based on net asset value | | | | 23.95% | 5 | | | | (2.92)% | | | | | 11.93% | | | | | (1.18)% | 6 | | | | (16.26)% | 7 | | | | 22.13% | |
| | | | | | | | | | | | | | | | | | | | | | | | | | | | | | |
Ratios to Average Net Assets | | | | | | | | | | | | | | | | | | | | | | | | | | | | | | |
Total expenses | | | | 0.78% | 8 | | | | 0.76% | | | | | 0.87% | | | | | 0.92% | | | | | 0.85% | | | | | 0.88% | |
Total expenses after fees waived, reimbursed and paid indirectly | | | | 0.72% | 8 | | | | 0.72% | | | | | 0.72% | | | | | 0.71% | | | | | 0.70% | | | | | 0.75% | |
Net investment income | | | | 0.53% | 8 | | | | 0.28% | | | | | 0.25% | | | | | 0.59% | | | | | 0.42% | | | | | 0.38% | |
| | | | | | | | | | | | | | | | | | | | | | | | | | | | | | |
Supplemental Data | | | | | | | | | | | | | | | | | | | | | | | | | | | | | | |
Net assets, end of period (000) | | | $ | 1,065,915 | | | | $ | 883,370 | | | | $ | 292,967 | | | | $ | 192,614 | | | | $ | 77,323 | | | | $ | 71,072 | |
Portfolio turnover | | | | 46% | | | | | 81% | | | | | 71% | | | | | 87% | | | | | 80% | | | | | 97% | |
| | | | | | | | | | | | | | | |
| | | Institutional |
| | | Six Months
Ended
March 31, 2012
(Unaudited) | | Year Ended
September 30,
2011 | | Period June 28,
20109 to
September 30,
2010 |
Per Share Operating Performance | | | | | | | | | | | | | | | |
Net asset value, beginning of period | | | $ | 20.24 | | | | $ | 20.86 | | | | $ | 19.39 | |
Net investment income2 | | | | 0.05 | | | | | 0.05 | | | | | 0.01 | |
Net realized and unrealized gain (loss) | | | | 4.77 | | | | | (0.67 | ) | | | | 1.46 | |
Net increase (decrease) from investment operations | | | | 4.82 | | | | | (0.62 | ) | | | | 1.47 | |
Net asset value, end of period | | | $ | 25.06 | | | | $ | 20.24 | | | | $ | 20.86 | |
| | | | | | | | | | | | | | | |
Total Investment Return4 | | | | | | | | | | | | | | | |
Based on net asset value | | | | 23.81% | 5 | | | | (2.97)% | | | | | 7.58% | 5 |
| | | | | | | | | | | | | | | |
Ratios to Average Net Assets | | | | | | | | | | | | | | | |
Total expenses | | | | 0.78% | 8 | | | | 0.78% | | | | | 0.80% | 8 |
Total expenses after fees waived, reimbursed and paid indirectly | | | | 0.78% | 8 | | | | 0.78% | | | | | 0.80% | 8 |
Net investment income | | | | 0.47% | 8 | | | | 0.21% | | | | | 0.08% | 8 |
| | | | | | | | | | | | | | | |
Supplemental Data | | | | | | | | | | | | | | | |
Net assets, end of period (000) | | | $ | 1,195,277 | | | | $ | 1,025,307 | | | | $ | 728,129 | |
Portfolio turnover | | | | 46% | | | | | 81% | | | | | 71% | |
| | 1 | On June 28, 2010, BlackRock Capital Appreciation Portfolio was reorganized into the Fund. The activity in the table presented above is for the accounting survivor, BlackRock Capital Appreciation Portfolio, for the periods prior to the date of the reorganization, and for the post-reorganization combined fund thereafter. The net asset values and other per share information have been restated for periods prior to the reorganization to reflect the share conversion ratio of 0.80500157. |
| | 2 | Based on average shares outstanding. |
| | 3 | Includes redemption fees, which are less than $0.01 per share. |
| | 4 | Where applicable, total investment returns exclude the effects of any sales charges and include the reinvestment of dividends and distributions. |
| | 5 | Aggregate total investment return. |
| | 6 | Includes proceeds received from a settlement of litigation, which impacted the Fund’s total return. Excluding these proceeds, the Fund’s total return would have been (1.31)%. |
| | 7 | Redemption fee of 2.00% is reflected in total return calculations. There was no impact to the return. |
| | 9 | Commencement of operations. |
See Notes to Financial Statements.
| | | | | | |
| | | | | | | |
| | BLACKROCK CAPITAL APPRECIATION FUND, INC. | | MARCH 31, 2012 | | 13 |
| | |
| | |
Financial Highlights (continued) | | |
| | | | | | | | | | | | | | | | | | | | | | | | | | | | | | |
| | | Investor A |
| | | Six Months
Ended
March 31, 2012 | | Year Ended
September 30, |
| | | (Unaudited) | | 2011 | | 20101 | | 20091 | | 20081 | | 20071 |
Per Share Operating Performance | | | | | | | | | | | | | | | | | | | | | | | | | | | | | | |
Net asset value, beginning of period | | | $ | 19.51 | | | | $ | 20.17 | | | | $ | 18.12 | | | | $ | 18.37 | | | | $ | 22.11 | | | | $ | 18.20 | |
Net investment income (loss)2 | | | | 0.02 | | | | | (0.02 | ) | | | | (0.04 | ) | | | | 0.01 | | | | | (0.03 | ) | | | | (0.03 | ) |
Net realized and unrealized gain (loss) | | | | 4.61 | | | | | (0.64 | ) | | | | 2.09 | | | | | (0.26 | ) | | | | (3.71 | )3 | | | | 3.94 | |
Net increase (decrease) from investment operations | | | | 4.63 | | | | | (0.66 | ) | | | | 2.05 | | | | | (0.25 | ) | | | | (3.74 | ) | | | | 3.91 | |
Dividends from net investment income | | | | – | | | | | – | | | | | (0.00 | )4 | | | | – | | | | | – | | | | | – | |
Net asset value, end of period | | | $ | 24.14 | | | | $ | 19.51 | | | | $ | 20.17 | | | | $ | 18.12 | | | | $ | 18.37 | | | | $ | 22.11 | |
| | | | | | | | | | | | | | | | | | | | | | | | | | | | | | |
Total Investment Return5 | | | | | | | | | | | | | | | | | | | | | | | | | | | | | | |
Based on net asset value | | | | 23.73% | 6 | | | | (3.27% | ) | | | | 11.37% | | | | | (1.37)% | 7 | | | | (16.91)% | 8 | | | | 21.44% | |
| | | | | | | | | | | | | | | | | | | | | | | | | | | | | | |
Ratios to Average Net Assets | | | | | | | | | | | | | | | | | | | | | | | | | | | | | | |
Total expenses | �� | | | 1.08% | 9 | | | | 1.08% | | | | | 1.15% | | | | | 1.35% | | | | | 1.33% | | | | | 1.35% | |
Total expenses excluding recoupment of past waived fees | | | | 1.08% | 9 | | | | 1.08% | | | | | 1.15% | | | | | 1.35% | | | | | 1.33% | | | | | 1.35% | |
Total expenses after fees waived, reimbursed and paid indirectly | | | | 1.08% | 9 | | | | 1.07% | | | | | 1.13% | | | | | 1.23% | | | | | 1.23% | | | | | 1.28% | |
Net investment income (loss) | | | | 0.17% | 9 | | | | (0.09% | ) | | | | (0.21% | ) | | | | 0.07% | | | | | (0.10)% | | | | | (0.16)% | |
| | | | | | | | | | | | | | | | | | | | | | | | | | | | | | |
Supplemental Data | | | | | | | | | | | | | | | | | | | | | | | | | | | | | | |
Net assets, end of period (000) | | | $ | 2,217,065 | | | | $ | 1,848,149 | | | | $ | 1,583,570 | | | | $ | 169,865 | | | | $ | 125,521 | | | | $ | 131,712 | |
Portfolio turnover | | | | 46% | | | | | 81% | | | | | 71% | | | | | 87% | | | | | 80% | | | | | 97% | |
| | 1 | On June 28, 2010, BlackRock Capital Appreciation Portfolio was reorganized into the Fund. The activity in the table presented above is for the accounting survivor, BlackRock Capital Appreciation Portfolio, for the periods prior to the date of the reorganization, and for the post-reorganization combined fund thereafter. The net asset values and other per share information have been restated for periods prior to the reorganization to reflect the share conversion ratio of 0.79434657. |
| | 2 | Based on average shares outstanding. |
| | 3 | Includes redemption fees, which are less than $0.01 per share. |
| | 4 | Less than $(0.01) per share. |
| | 5 | Where applicable, total investment returns exclude the effects of any sales charges and include the reinvestment of dividends and distributions. |
| | 6 | Aggregate total investment return. |
| | 7 | Includes proceeds received from a settlement of litigation, which impacted the Fund’s total return. Excluding these proceeds, the Fund’s total return would have been (1.51)%. |
| | 8 | Redemption fee of 2.00% is reflected in total return calculations. There was no impact to the return. |
| | | | | | |
| See Notes to Financial Statements. | | | | |
| | | | | | | |
| 14 | | BLACKROCK CAPITAL APPRECIATION FUND, INC. | | MARCH 31, 2012 | | |
| | |
| | |
Financial Highlights (continued) | | |
| | | | | | | | | | | | | | | | | | | | | | | | | | | | | | |
| | | Investor B |
| | | Six Months Ended March 31, 2012 | | Year Ended
September 30, |
| | | (Unaudited) | | 2011 | | 20101 | | 20091 | | 20081 | | 20071 |
Per Share Operating Performance | | | | | | | | | | | | | | | | | | | | | | | | | | | | | | |
Net asset value, beginning of period | | | $ | 17.13 | | | | $ | 17.87 | | | | $ | 16.18 | | | | $ | 16.60 | | | | $ | 20.08 | | | | $ | 16.66 | |
Net investment loss2 | | | | (0.07 | ) | | | | (0.20 | ) | | | | (0.18 | ) | | | | (0.09 | ) | | | | (0.17 | ) | | | | (0.17 | ) |
Net realized and unrealized gain (loss) | | | | 4.02 | | | | | (0.54 | ) | | | | 1.87 | | | | | (0.33 | ) | | | | (3.31 | )3 | | | | 3.59 | |
Net increase (decrease) from investment operations | | | | 3.95 | | | | | (0.74 | ) | | | | 1.69 | | | | | (0.42 | ) | | | | (3.48 | ) | | | | 3.42 | |
Net asset value, end of period | | | $ | 21.08 | | | | $ | 17.13 | | | | $ | 17.87 | | | | $ | 16.18 | | | | $ | 16.60 | | | | $ | 20.08 | |
| | | | | | | | | | | | | | | | | | | | | | | | | | | | | | |
Total Investment Return4 | | | | | | | | | | | | | | | | | | | | | | | | | | | | | | |
Based on net asset value | | | | 23.06% | 5 | | | | (4.14)% | | | | | 10.34% | | | | | (2.52)% | 6 | | | | (17.32)% | 7 | | | | 20.50% | |
| | | | | | | | | | | | | | | | | | | | | | | | | | | | | | |
Ratios to Average Net Assets | | | | | | | | | | | | | | | | | | | | | | | | | | | | | | |
Total expenses | | | | 2.03% | 8 | | | | 1.99% | | | | | 2.01% | | | | | 2.36% | | | | | 2.11% | | | | | 2.20% | |
Total expenses excluding recoupment of past waived fees | | | | 2.03% | 8 | | | | 1.99% | | | | | 2.01% | | | | | 2.27% | | | | | 2.11% | | | | | 2.20% | |
Total expenses after fees waived, reimbursed and paid indirectly | | | | 2.03% | 8 | | | | 1.99% | | | | | 2.00% | | | | | 2.11% | | | | | 2.00% | | | | | 2.07% | |
Net investment loss | | | | (0.77)% | 8 | | | | (1.01)% | | | | | (1.10)% | | | | | (0.77)% | | | | | (0.87)% | | | | | (0.95)% | |
| | | | | | | | | | | | | | | | | | | | | | | | | | | | | | |
Supplemental Data | | | | | | | | | | | | | | | | | | | | | | | | | | | | | | |
Net assets, end of period (000) | | | $ | 92,687 | | | | $ | 96,030 | | | | $ | 171,808 | | | | $ | 10,279 | | | | $ | 19,663 | | | | $ | 48,260 | |
Portfolio turnover | | | | 46% | | | | | 81% | | | | | 71% | | | | | 87% | | | | | 80% | | | | | 97% | |
| | 1 | On June 28, 2010, BlackRock Capital Appreciation Portfolio was reorganized into the Fund. The activity in the table presented above is for the accounting survivor, BlackRock Capital Appreciation Portfolio, for the periods prior to the date of the reorganization, and for the post-reorganization combined fund thereafter. The net asset values and other per share information have been restated for periods prior to the reorganization to reflect the share conversion ratio of 0.81383276. |
| | 2 | Based on average shares outstanding. |
| | 3 | Includes redemption fees, which are less than $0.01 per share. |
| | 4 | Where applicable, total investment returns exclude the effects of any sales charges and include the reinvestment of dividends and distributions. |
| | 5 | Aggregate total investment return. |
| | 6 | Includes proceeds received from a settlement of litigation, which impacted the Fund’s total return. Excluding these proceeds, the Fund’s total return would have been (2.67)%. |
| | 7 | Redemption fee of 2.00% is reflected in total return calculations. There was no impact to the return. |
| | | | | | |
| See Notes to Financial Statements. | | | | |
| | | | | | | |
| | BLACKROCK CAPITAL APPRECIATION FUND, INC. | | MARCH 31, 2012 | | 15 |
| | |
| | |
Financial Highlights (concluded) | | |
| | | | | | | | | | | | | | | | | | | | | | | | | | | | | | |
| | | Investor C |
| | | Six Months
Ended
March 31, 2012 | | Year Ended
September 30, |
| | | (Unaudited) | | 2011 | | 20101 | | 20091 | | 20081 | | 20071 |
Per Share Operating Performance | | | | | | | | | | | | | | | | | | | | | | | | | | | | | | |
Net asset value, beginning of period | | | $ | 17.23 | | | | $ | 17.96 | | | | $ | 16.25 | | | | $ | 16.63 | | | | $ | 20.09 | | | | $ | 16.64 | |
Net investment loss2 | | | | (0.06 | ) | | | | (0.19 | ) | | | | (0.17 | ) | | | | (0.09 | ) | | | | (0.13 | ) | | | | (0.15 | ) |
Net realized and unrealized gain (loss) | | | | 4.05 | | | | | (0.54 | ) | | | | 1.88 | | | | | (0.29 | ) | | | | (3.33 | )3 | | | | 3.60 | |
Net increase (decrease) from investment operations | | | | 3.99 | | | | | (0.73 | ) | | | | 1.71 | | | | | (0.38 | ) | | | | (3.46 | ) | | | | 3.45 | |
Net asset value, end of period | | | $ | 21.22 | | | | $ | 17.23 | | | | $ | 17.96 | | | | $ | 16.25 | | | | $ | 16.63 | | | | $ | 20.09 | |
| | | | | | | | | | | | | | | | | | | | | | | | | | | | | | |
Total Investment Return4 | | | | | | | | | | | | | | | | | | | | | | | | | | | | | | |
Based on net asset value | | | | 23.16% | 5 | | | | (4.07)% | | | | | 10.52% | | | | | (2.29)% | 6 | | | | (17.22)% | 7 | | | | 20.71% | |
| | | | | | | | | | | | | | | | | | | | | | | | | | | | | | |
Ratios to Average Net Assets | | | | | | | | | | | | | | | | | | | | | | | | | | | | | | |
Total expenses | | | | 1.94% | 8 | | | | 1.91% | | | | | 1.97% | | | | | 2.04% | | | | | 1.96% | | | | | 1.99% | |
Total expenses after fees waived, reimbursed and paid indirectly | | | | 1.93% | 8 | | | | 1.91% | | | | | 1.94% | | | | | 1.92% | | | | | 1.85% | | | | | 1.92% | |
Net investment loss | | | | (0.68)% | 8 | | | | (0.93)% | | | | | (1.04)% | | | | | (0.61)% | | | | | (0.73)% | | | | | (0.80)% | |
| |
| | | | | | | | | | | | | | | | | | | | | | | | | | | | | | |
Supplemental Data | | | | | | | | | | | | | | | | | | | | | | | | | | | | | | |
Net assets, end of period (000) | | | $ | 633,866 | | | | $ | 552,456 | | | | $ | 608,137 | | | | $ | 22,986 | | | | $ | 12,361 | | | | $ | 15,160 | |
Portfolio turnover | | | | 46% | | | | | 81% | | | | | 71% | | | | | 87% | | | | | 80% | | | | | 97% | |
| | | | | | | | | | | | | | | |
| | | Class R |
| | | Six Months
Ended
March 31, 2012
(Unaudited) | | Year Ended
September 30,
2011 | | Period June 28,
20109 to
September 30,
2010 |
Per Share Operating Performance | | | | | | | | | | | | | | | |
Net asset value, beginning of period | | | $ | 17.88 | | | | $ | 18.56 | | | | $ | 17.28 | |
Net investment loss2 | | | | (0.01 | ) | | | | (0.09 | ) | | | | (0.03 | ) |
Net realized and unrealized gain (loss) | | | | 4.23 | | | | | (0.59 | ) | | | | 1.31 | |
Net increase (decrease) from investment operations | | | | 4.22 | | | | | (0.68 | ) | | | | 1.28 | |
Net asset value, end of period | | | $ | 22.10 | | | | $ | 17.88 | | | | $ | 18.56 | |
| | | | | | | | | | | | | | | |
Total Investment Return4 | | | | | | | | | | | | | | | |
Based on net asset value | | | | 23.60% | 5 | | | | (3.66)% | | | | | 7.41% | 5 |
| | | | | | | | | | | | | | | |
Ratios to Average Net Assets | | | | | | | | | | | | | | | |
Total expenses | | | | 1.37% | 8 | | | | 1.40% | | | | | 1.44% | 8 |
Total expenses after fees waived, reimbursed and paid indirectly | | | | 1.37% | 8 | | | | 1.40% | | | | | 1.43% | 8 |
Net investment loss | | | | (0.12)% | 8 | | | | (0.42)% | | | | | (0.55)% | 8 |
| | | | | | | | | | | | | | | |
Supplemental Data | | | | | | | | | | | | | | | |
Net assets, end of period (000) | | | $ | 119,572 | | | | $ | 87,400 | | | | $ | 74,677 | |
Portfolio turnover | | | | 46% | | | | | 81% | | | | | 71% | |
| | 1 | On June 28, 2010, BlackRock Capital Appreciation Portfolio was reorganized into the Fund. The activity in the table presented above is for the accounting survivor, BlackRock Capital Appreciation Portfolio, for the periods prior to the date of the reorganization, and for the post-reorganization combined fund thereafter. The net asset values and other per share information have been restated for periods prior to the reorganization to reflect the share conversion ratio of 0.81539389. |
| | 2 | Based on average shares outstanding. |
| | 3 | Includes redemption fees, which are less than $0.01 per share. |
| | 4 | Where applicable, total investment returns exclude the effects of any sales charges and include the reinvestment of dividends and distributions. |
| | 5 | Aggregate total investment return. |
| | 6 | Includes proceeds received from a settlement of litigation, which impacted the Fund’s total return. Excluding these proceeds, the Fund’s total return would have been (2.43)%. |
| | 7 | Redemption fee of 2.00% is reflected in total return calculations. There was no impact to the return. |
| | 9 | Commencement of operations. |
| | | | | | |
| See Notes to Financial Statements. | | | | |
| | | | | | | |
| 16 | | BLACKROCK CAPITAL APPRECIATION FUND, INC. | | MARCH 31, 2012 | | |
|
| |
Notes to Financial Statements (Unaudited) |
1. Organization and Significant Accounting Policies:
BlackRock Capital Appreciation Fund, Inc. (the “Fund”) is registered under the Investment Company Act of 1940, as amended (the “1940 Act”), as a diversified, open-end management investment company. The Fund is organized as a Maryland corporation. The Fund’s financial statements are prepared in conformity with accounting principles generally accepted in the United States of America (“US GAAP”), which may require management to make estimates and assumptions that affect the reported amounts and disclosures in the financial statements. Actual results could differ from those estimates. The Fund offers multiple classes of shares. BlackRock and Institutional Shares are sold without a sales charge and only to certain eligible investors. Investor A Shares are generally sold with a front-end sales charge. Investor B and Investor C Shares may be subject to a CDSC. Class R Shares are sold without a sales charge and only to certain retirement and other similar plans. All classes of shares have identical voting, dividend, liquidation and other rights and the same terms and conditions, except that Investor A, Investor B, Investor C and Class R Shares bear certain expenses related to the shareholder servicing of such shares, and Investor B, Investor C and Class R Shares also bear certain expenses related to the distribution of such shares. Investor B Shares automatically convert to Investor A Shares after approximately eight years. Investor B Shares are only available through exchanges, dividend reinvestment by existing shareholders or for purchase by certain qualified employee benefit plans. Each class has exclusive voting rights with respect to matters relating to its shareholder servicing and distribution expenditures (except that Investor B shareholders may vote on material changes to the Investor A distribution and service plan).
The following is a summary of significant accounting policies followed by the Fund:
Valuation: US GAAP defines fair value as the price the Fund would receive to sell an asset or pay to transfer a liability in an orderly transaction between market participants at the measurement date. The Fund fair values its financial instruments at market value using independent dealers or pricing services under policies approved by the Board of Directors of the Fund (the “Board”). Equity investments traded on a recognized securities exchange or the NASDAQ Global Market System (“NASDAQ”) are valued at the last reported sale price that day or the NASDAQ official closing price, if applicable. For equity investments traded on more than one exchange, the last reported sale price on the exchange where the stock is primarily traded is used. Equity investments traded on a recognized exchange for which there were no sales on that day are valued at the last available bid price. If no bid price is available, the prior day’s price will be used, unless it is determined that such prior day’s price no longer reflects the fair value of the security. Investments in open-end registered investment companies are valued at NAV each business day. Short-term securities with remaining maturities of 60 days or less may be valued at amortized cost, which approximates fair value.
The Fund values its investment in BlackRock Liquidity Series, LLC Money Market Series (the “Money Market Series”) at fair value, which is ordinarily based upon its pro rata ownership in the underlying fund’s net assets. The Money Market Series seeks current income consistent with maintaining liquidity and preserving capital. Although the Money Market Series is not registered under the 1940 Act, its investments will follow the parameters of investments by a money market fund that is subject to Rule 2a-7 under the 1940 Act. The Fund may withdraw up to 25% of its investment daily, although the manager of the Money Market Series, in its sole discretion, may permit an investor to withdraw more than 25% on any one day.
In the event that application of these methods of valuation results in a price for an investment which is deemed not to be representative of the market value of such investment or if a price is not available, the investment will be valued in accordance with a policy approved by the Board as reflecting fair value (“Fair Value Assets”). When determining the price for Fair Value Assets, the investment advisor and/or the sub-advisor seek to determine the price that the Fund might reasonably expect to receive from the current sale of that asset in an arm’s-length transaction. Fair value determinations shall be based upon all available factors that the investment advisor and/or sub-advisor deem relevant. The pricing of all Fair Value Assets is subsequently reported to the Board or a committee thereof.
Investment Transactions and Investment Income: For financial reporting purposes, investment transactions are recorded on the dates the transactions are entered into (the trade dates). Realized gains and losses on investment transactions are determined on the identified cost basis. Dividend income is recorded on the ex-dividend dates. Upon notification from issuers, some of the dividend income received from a real estate investment trust may be redesignated as a reduction of cost of the related investment and/or realized gain. Income and realized and unrealized gains and losses are allocated daily to each class based on its relative net assets.
Dividends and Distributions: Dividends and distributions paid by the Fund are recorded on the ex-dividend dates. The amount and timing of dividends and distributions are determined in accordance with federal income tax regulations, which may differ from US GAAP.
Securities Lending: The Fund may lend securities to approved borrowers, such as banks, brokers and other financial institutions. The borrower pledges cash, securities issued or guaranteed by the US government or irrevocable letters of credit issued by a bank as collateral, which will be maintained at all times in an amount equal to at least 100% of the current market value of the loaned securities. The market value of the loaned securities is determined at the close of business of the Fund and any additional required collateral is delivered to the Fund on the next business day. Securities lending income, as disclosed in the Statement of Operations, represents the income earned from the investment of the cash collateral, net of rebates paid to, or fees paid by, borrowers and less the fees paid to the securities lending agent. During the term of the
| | | | | | |
| | | | | | | |
| | BLACKROCK CAPITAL APPRECIATION FUND, INC. | | MARCH 31, 2012 | | 17 |
| | |
| | |
Notes to Financial Statements (continued) | | |
loan, the Fund earns dividend or interest income on the securities loaned but does not receive dividend or interest income on the securities received as collateral. Loans of securities are terminable at any time and the borrower, after notice, is required to return borrowed securities within the standard time period for settlement of securities transactions. In the event that the borrower defaults on its obligation to return borrowed securities because of insolvency or for any other reason, the Fund could experience delays and costs in gaining access to the collateral. The Fund also could suffer a loss if the value of an investment purchased with cash collateral falls below the market value of loaned securities or if the value of an investment purchased with cash collateral falls below the value of the original cash collateral received. During the six months ended March 31, 2012, any securities on loan were collaterized by cash.
Income Taxes: It is the Fund’s policy to comply with the requirements of the Internal Revenue Code of 1986, as amended, applicable to regulated investment companies and to distribute substantially all of its taxable income to its shareholders. Therefore, no federal income tax provision is required. The Fund has a tax year end of August 31.
The Fund files US federal and various state and local tax returns. No income tax returns are currently under examination. The statute of limitations on the Fund’s US federal tax returns remains open for each of the four years ended August 31, 2011. The statutes of limitations on the Fund’s state and local tax returns may remain open for an additional year depending upon the jurisdiction. Management does not believe there are any uncertain tax positions that require recognition of a tax liability.
Recent Accounting Standards: In May 2011, the Financial Accounting Standards Board (the “FASB”) issued amended guidance to improve disclosure about fair value measurements which will require the following disclosures for fair value measurements categorized as Level 3: quantitative information about the unobservable inputs and assumptions used in the fair value measurement, a description of the valuation policies and procedures and a narrative description of the sensitivity of the fair value measurement to changes in unobservable inputs and the interrelationships between those unobservable inputs. In addition, the amounts and reasons for all transfers in and out of Level 1 and Level 2 will be required to be disclosed as well as disclosure of the level in the fair value hierarchy of assets and liabilities not recorded at fair value but where fair value is disclosed. The amended guidance is effective for financial statements for fiscal years beginning after December 15, 2011, and interim periods within those fiscal years. Management is evaluating the impact of this guidance on the Fund’s financial statement disclosures.
In December 2011, the FASB issued guidance that will expand current disclosure requirements on the offsetting of certain assets and liabilities. The new disclosures will be required for investments and derivative financial instruments subject to master netting or similar agreements which are eligible for offset in the Statement of Assets and Liabilities and will require an entity to disclose both gross and net information about such investments and transactions in the financial statements. The guidance
is effective for financial statements with fiscal years beginning on or after January 1, 2013, and interim periods within those fiscal years. Management is evaluating the impact of this guidance on the Fund’s financial statement disclosures.
Other: Expenses directly related to the Fund or its classes are charged to the Fund or class. Other operating expenses shared by several funds are pro rated among those funds on the basis of relative net assets or other appropriate methods. Expenses directly related to the Fund and other shared expenses pro rated to the Fund are allocated daily to each class based on its relative net assets or other appropriate methods.
The Fund has an arrangement with the custodian whereby fees may be reduced by credits earned on uninvested cash balances, which, if applicable, are shown as fees paid indirectly in the Statement of Operations. The custodian imposes fees on overdrawn cash balances, which can be offset by accumulated credits earned or may result in additional custody charges.
2. Investment Advisory Agreements and Other Transactions with Affiliates:
The PNC Financial Services Group Inc. (“PNC”) and Barclays Bank PLC (“Barclays”) are the largest stockholders of BlackRock, Inc. (“BlackRock”). Due to the ownership structure, PNC is an affiliate for 1940 Act purposes, but Barclays is not.
The Fund entered into an Investment Advisory Agreement with the Manager, the Fund’s investment advisor, an indirect, wholly owned subsidiary of BlackRock, to provide investment advisory and administration services. The Manager is responsible for the management of the Fund’s portfolio and provides the necessary personnel, facilities, equipment and certain other services necessary to the operations of the Fund. For such services, the Fund pays the Manager a monthly fee based on a percentage of the Fund’s average daily net assets at the following annual rates:
| | | | | |
| Average Daily Net Assets | | Investment
Advisory Fee |
First $1 Billion | | | | 0.650 | % |
$1 Billion - $1.5 Billion | | | | 0.625 | % |
$1.5 Billion - $5 Billion | | | | 0.600 | % |
$5 Billion - $7.5 Billion | | | | 0.575 | % |
Greater than $7.5 Billion | | | | 0.550 | % |
The Manager contractually agreed to waive and/or reimburse fees or expenses, excluding interest expense, dividend expense, acquired fund fees and expenses and certain other fund expenses, in order to limit expenses. The expense limitations as a percentage of average daily net assets are as follows:
| | |
Share Classes |
BlackRock | | Investor C |
0.72% | | 1.94% |
The Manager has agreed not to reduce or discontinue this contractual waiver or reimbursement prior to February 1, 2022 unless approved by
| | | | | | |
| | | | | | | |
| 18 | | BLACKROCK CAPITAL APPRECIATION FUND, INC. | | MARCH 31, 2012 | | |
|
| |
Notes to Financial Statements (continued) |
the Board, including a majority of the Independent Directors. On February 1 of each year, the waiver will renew automatically, so that the agreement will have a perpetual ten-year term. These amounts are shown as transfer agent fees waived – class specific and transfer agent fees reimbursed – class specific, respectively, in the Statement of Operations. Class specific expense waivers or reimbursements are as follows:
| | | | | | | | | | | | | | | |
| | | Share Classes |
| | | | | BlackRock | | | | | Investor C | | | | | Total | |
Transfer Agent Fees Waived | | | $ | 2,361 | | | | $ | 3,575 | | | | $ | 5,936 | |
Transfer Agent Fees Reimbursed | | | $ | 276,541 | | | | $ | 17,317 | | | | $ | 293,858 | |
The Manager voluntarily agreed to waive its investment advisory fees by the amount of investment advisory fees the Fund pays to the Manager indirectly through its investment in affiliated money market funds. However the Manager does not waive its investment advisory fees by the amount of investment advisory fees paid in connection with the Fund’s investment in other affiliated investment companies, if any. This amount is shown as fees waived by advisor in the Statement of Operations. For the six months ended March 31, 2012, the Manager waived $12,609.
The Manager entered into a sub-advisory agreement with BlackRock Investment Management, LLC (“BIM”), an affiliate of the Manager. The Manager pays BIM, for services it provides, a monthly fee that is a percentage of the investment advisory fees paid by the Fund to the Manager.
The Fund entered into a Distribution Agreement and Distribution and Service Plan with BlackRock Investments, LLC (“BRIL”), an affiliate of the Manager. Pursuant to the Distribution and Service Plan and in accordance with Rule 12b-1 under the 1940 Act, the Fund pays BRIL ongoing service and distribution fees. The fees are accrued daily and paid monthly at annual rates based upon the average daily net assets of the shares of the Fund as follows:
| | | | | | | | | | |
| | | Service
Fee | | Distribution Fee |
Investor A | | | | 0.25 | % | | | | – | |
Investor B | | | | 0.25 | % | | | | 0.75 | % |
Investor C | | | | 0.25 | % | | | | 0.75 | % |
Class R | | | | 0.25 | % | | | | 0.25 | % |
Pursuant to sub-agreements with BRIL, broker-dealers and BRIL provide shareholder servicing and distribution services to the Fund. The ongoing service and/or distribution fee compensate BRIL and each broker-dealer for providing shareholder servicing and/or distribution related services to Investor A, Investor B, Investor C and Class R shareholders.
For the six months ended March 31, 2012, the following table shows the class specific service and distribution fees borne directly by each class of the Fund:
| | | | | | | | |
| Share Classes |
| Investor A | | Investor B | | Investor C | | Class R | | Total |
$2,554,224 | | $481,205 | | $2,987,960 | | $257,638 | | $6,281,027 |
For the six months ended March 31, 2012, affiliates earned underwriting discounts, direct commissions and dealer concessions on sales of the Fund’s Investor A Shares of $53,664.
For the six months ended March 31, 2012, affiliates received CDSCs relating to transactions in Investor A, Investor B, and Investor C Shares of $25,114, $17,968 and $35,017, respectively.
Pursuant to written agreements, certain financial intermediaries, some of which may be affiliates, provide the Fund with sub-accounting, recordkeeping, sub-transfer agency and other administrative services with respect to sub-accounts they service. For these services, these entities receive an annual fee per shareholder account, which will vary depending on share class and/or net assets. For the six months ended March 31, 2012, the Fund paid $361,099 to affiliates in return for these services, which is included in transfer agent – class specific in the Statement of Operations.
The Manager maintains a call center, which is responsible for providing certain shareholder services to the Fund, such as responding to shareholder inquiries and processing transactions based upon instructions from shareholders with respect to the subscription and redemption of Fund shares. For the six months ended March 31, 2012, the Fund reimbursed the Manager the following amounts for costs incurred in running the call center, which are included in transfer agent – class specific in the Statement of Operations:
| | | | | | | | | | | | |
| Share Classes |
| BlackRock | | Institutional | | Investor A | | Investor B | | Investor C | | Class R | | Total |
$2,361 | | $3,143 | | $33,439 | | $1,808 | | $6,673 | | $461 | | $47,885 |
For the six months ended March 31, 2012, the following table shows the class specific transfer agent fees borne directly by each class of the Fund:
| | | | | | | | | | | | |
| Share Classes |
| BlackRock | | Institu- tional | | Investor A | | Investor B | | Investor C | | Class R | | Total |
$660,419 | | $844,994 | | $1,909,142 | | $187,869 | | $875,861 | | $116,801 | | $4,595,086 |
The Fund received an exemptive order from the SEC permitting it, among other things, to pay an affiliated securities lending agent a fee based on a share of the income derived from the securities lending activities and has retained BIM as the securities lending agent. BIM may, on behalf of the Fund, invest cash collateral received by the Fund for such loans, among other things, in a private investment company managed by the Manager or in registered money market funds advised by the Manager or its affiliates. As securities lending agent, BIM is responsible for all transaction fees and all other operational costs relating to securities lending activities, other than extraordinary expenses. BIM does not receive any fees for managing the cash collateral. The market value of securities on loan and the value of the related collateral, if applicable, are shown in the Statement of Assets and Liabilities as securities loaned at value and collateral on securities loaned at value, respectively. The cash collateral invested by BIM is disclosed in the Schedule of Investments, if any. Securities lending income is equal to the total of income earned from the reinvestment of cash collateral, net of rebates paid to, or fees paid by, borrowers of securities. The Fund retains 65% of securities lending income and pays a fee to BIM equal to 35% of such income. The share of income earned by the Fund on the reinvestment of cash collateral is shown as securities lending – affiliated in the Statement of Operations.
| | | | | | |
| | | | | | | |
| | BLACKROCK CAPITAL APPRECIATION FUND, INC. | | MARCH 31, 2012 | | 19 |
| | |
| | |
Notes to Financial Statements (continued) | | |
For the six months ended March 31, 2012, BIM received $810,723 in securities lending agent fees related to securities lending activities for the Fund.
Certain officers and/or directors of the Fund are officers and/or directors of BlackRock or its affiliates. The Fund reimburses the Manager for compensation paid to the Fund’s Chief Compliance Officer.
3. Investments:
Purchases and sales of investments, excluding short-term securities, for the six months ended March 31, 2012, were $2,283,682,633 and $2,462,307,545, respectively.
4. Income Tax Information:
On August 31, 2011, the Fund’s last tax year-end, the Fund had capital loss carryforwards of $455,178,261, of which $68,218,211 expires in 2012, $10,784,067 expires in 2016, $105,719,903 expires in 2017 and $270,456,080 expires in 2018.
Under the Regulated Investment Company Modernization Act of 2010, capital losses incurred by the Fund after August 31, 2011 will not be subject to expiration. In addition, any such losses must be utilized prior to the losses incurred in pre-enactment taxable years.
As of March 31, 2012, gross unrealized appreciation and gross unrealized depreciation based on cost for federal income tax purposes were as follows:
| | | | |
| | | | |
Tax cost | | $ | 4,353,696,629 | |
| | | | |
Gross unrealized appreciation | | $ | 1,316,944,740 | |
Gross unrealized depreciation | | | (70,913,552 | ) |
| | | | |
Net unrealized appreciation | | $ | 1,246,031,188 | |
| | | | |
5. Borrowings:
The Fund, along with certain other funds managed by the Manager and its affiliates, is a party to a $500 million credit agreement with a group of lenders. The Fund may borrow under the credit agreement to fund shareholder redemptions. Effective November 2010 to November 2011, the credit agreement had the following terms: a commitment fee of 0.08% per annum based on the Fund’s pro rata share of the unused portion of the credit agreement and interest at a rate equal to the higher of (a) the one-month LIBOR plus 1.00% per annum or (b) the Fed Funds rate plus 1.00% per annum on amounts borrowed. In addition,
the Fund paid administration and arrangement fees which were allocated to the Fund based on its net assets as of October 31, 2010. The credit agreement, which expired in November 2011, was renewed until November 2012. Effective November 2011 to November 2012, the credit agreement has the following terms: a commitment fee of 0.065% per annum based on the Fund’s pro rata share of the unused portion of the credit agreement and interest at a rate equal to the higher of (a) the one-month LIBOR plus 0.80% per annum or (b) the Fed Funds rate plus 0.80% per annum on amounts borrowed. In addition, the Fund paid administration and arrangement fees which were allocated to the Fund based on its net assets as of October 31, 2011. The Fund did not borrow under the credit agreement during the six months ended March 31, 2012.
6. Concentration, Market and Credit Risk:
In the normal course of business, the Fund invests in securities and enters into transactions where risks exist due to fluctuations in the market (market risk) or failure of the issuer of a security to meet all its obligations (issuer credit risk). The value of securities held by the Fund may decline in response to certain events, including those directly involving the issuers whose securities are owned by the Fund; conditions affecting the general economy; overall market changes; local, regional or global political, social or economic instability; and currency and interest rate and price fluctuations. Similar to issuer credit risk, the Fund may be exposed to counterparty credit risk, or the risk that an entity with which the Fund has unsettled or open transactions may fail to or be unable to perform on its commitments. The Fund manages counterparty credit risk by entering into transactions only with counterparties that it believes have the financial resources to honor their obligations and by monitoring the financial stability of those counterparties. Financial assets, which potentially expose the Fund to market, issuer and counterparty credit risks, consist principally of financial instruments and receivables due from counterparties. The extent of the Fund’s exposure to market, issuer and counterparty credit risks with respect to these financial assets is generally approximated by their value recorded in the Fund’s Statement of Assets and Liabilities, less any collateral held by the Fund.
As of March 31, 2012, the Fund invested a significant portion of its assets in securities in the information technology sector. Changes in economic conditions affecting the information technology sector would have a greater impact on the Fund and could affect the value, income and/or liquidity of positions in such securities.
| | | | | | |
| | | | | | | |
| 20 | | BLACKROCK CAPITAL APPRECIATION FUND, INC. | | MARCH 31, 2012 | | |
| | |
| | |
Notes to Financial Statements (concluded) | | |
7. Capital Shares Transactions:
Transactions in capital shares for each class were as follows:
| | | | | | | | | | | | | | | | | | |
| | | Six Months Ended March 31, 2012 | | | | | Year Ended September 30, 2011 | |
| | | Shares | | | Amount | | | | | Shares | | | Amount | |
BlackRock | | | | | | | | | | | | | | | | | | |
Shares sold | | | 6,545,381 | | | $ | 148,177,378 | | | | | | 42,558,670 | | | $ | 979,285,363 | |
Shares redeemed | | | (7,690,612 | ) | | | (174,561,256 | ) | | | | | (12,981,790 | ) | | | (296,790,502 | ) |
Net increase (decrease) | | | (1,145,231 | ) | | $ | (26,383,878 | ) | | | | | 29,576,880 | | | $ | 682,494,861 | |
| | | | | |
| | | | | | | | | | | | | | | | | | |
Institutional | | | | | | | | | | | | | | | | | | |
Shares sold | | | 14,233,947 | | | $ | 318,094,924 | | | | | | 27,651,181 | | | $ | 652,485,632 | |
Shares redeemed | | | (17,211,733 | ) | | | (410,059,446 | ) | | | | | (11,894,145 | ) | | | (277,153,373 | ) |
Net increase (decrease) | | | (2,977,786 | ) | | $ | (91,964,522 | ) | | | | | 15,757,036 | | | $ | 375,332,259 | |
| | | | | |
| | | | | | | | | | | | | | | | | | |
Investor A | | | | | | | | | | | | | | | | | | |
Shares sold and automatic conversion of shares | | | 10,625,399 | | | $ | 230,686,244 | | | | | | 40,270,918 | | | $ | 916,973,192 | |
Shares redeemed | | | (13,491,086 | ) | | | (295,110,070 | ) | | | | | (24,046,729 | ) | | | (538,998,855 | ) |
Net increase (decrease) | | | (2,865,687 | ) | | $ | (64,423,826 | ) | | | | | 16,224,189 | | | $ | 377,974,337 | |
| | | | | |
| | | | | | | | | | | | | | | | | | |
Investor B | | | | | | | | | | | | | | | | | | |
Shares sold | | | 277,500 | | | $ | 5,282,355 | | | | | | 1,005,491 | | | $ | 20,082,825 | |
Shares redeemed and automatic conversion of shares | | | (1,487,730 | ) | | | (28,755,011 | ) | | | | | (5,014,374 | ) | | | (100,264,415 | ) |
Net decrease | | | (1,210,230 | ) | | $ | (23,472,656 | ) | | | | | (4,008,883 | ) | | $ | (80,181,590 | ) |
| | | | | |
| | | | | | | | | | | | | | | | | | |
Investor C | | | | | | | | | | | | | | | | | | |
Shares sold | | | 2,414,836 | | | $ | 46,412,842 | | | | | | 7,126,468 | | | $ | 144,094,375 | |
Shares redeemed | | | (4,610,043 | ) | | | (89,056,246 | ) | | | | | (8,917,981 | ) | | | (178,344,833 | ) |
Net decrease | | | (2,195,207 | ) | | $ | (42,643,404 | ) | | | | | (1,791,513 | ) | | $ | (34,250,458 | ) |
| | | | | |
| | | | | | | | | | | | | | | | | | |
Class R | | | | | | | | | | | | | | | | | | |
Shares sold | | | 1,548,221 | | | $ | 31,001,569 | | | | | | 3,165,431 | | | $ | 66,191,205 | |
Shares redeemed | | | (1,025,339 | ) | | | (20,537,250 | ) | | | | | (2,301,249 | ) | | | (47,358,546 | ) |
Net increase | | | 522,882 | | | $ | 10,464,319 | | | | | | 864,182 | | | $ | 18,832,659 | |
| | | | | | | | | | | | | | | | | | |
Total net increase (decrease) | | | (9,871,259 | ) | | $ | (238,423,967 | ) | | | | | 56,621,891 | | | $ | 1,340,202,068 | |
8. Subsequent Events:
Management has evaluated the impact of all subsequent events on the Fund through the date the financial statements were issued and has determined that there were no subsequent events requiring adjustment or additional disclosure in the financial statements.
| | | | | | |
| | | | | | | |
| | BLACKROCK CAPITAL APPRECIATION FUND, INC. | | MARCH 31, 2012 | | 21 |
Robert M. Hernandez, Chairman of the Board and Director
Fred G. Weiss, Vice Chairman of the Board and Director
Paul L. Audet, Director
James H. Bodurtha, Director
Bruce R. Bond, Director
Donald W. Burton, Director
Honorable Stuart E. Eizenstat, Director
Laurence D. Fink, Director Kenneth A. Froot, Director
Henry Gabbay, Director
John F. O’Brien, Director
Roberta Cooper Ramo, Director
David H. Walsh, Director
John M. Perlowski, President and Chief Executive Officer
Brendan Kyne, Vice President
Neal Andrews, Chief Financial Officer
Jay Fife, Treasurer
Brian Kindelan, Chief Compliance Officer and Anti-Money Laundering Office
Ira P. Shapiro, Secretary
Investment Advisor
BlackRock Advisors, LLC
Wilmington, DE 19809
Sub-Advisor
BlackRock Investment Management, LLC
Princeton, NJ 08540
Accounting Agent and Transfer Agent
BNY Mellon Investment Servicing (US) Inc.
Wilmington, DE 19809
Custodian
The Bank of New York Mellon
New York, NY 10286
Distributor
BlackRock Investments, LLC
New York, NY 10022
Legal Counsel
Willkie Farr & Gallagher LLP
New York, NY 10019
Independent Registered Public Accounting Firm
Deloitte & Touche LLP
Philadelphia, PA 19103
Address of the Fund
100 Bellevue Parkway
Wilmington, DE 19809
| | | | | | |
| | | | | | | |
| 22 | | BLACKROCK CAPITAL APPRECIATION FUND, INC. | | MARCH 31, 2012 | | |
Electronic Delivery
Electronic copies of most financial reports and prospectuses are available on the Fund’s website or shareholders can sign up for e-mail notifications of quarterly statements, annual and semi-annual reports and prospectuses by enrolling in the Fund’s electronic delivery program.
To enroll:
Shareholders Who Hold Accounts with Investment Advisors, Banks or Brokerages:
Please contact your financial advisor. Please note that not all investment advisors, banks or brokerages may offer this service.
Shareholders Who Hold Accounts Directly With BlackRock:
| 1) | Access the BlackRock website at http://www.blackrock.com/ edelivery |
| 2) | Select “eDelivery” under the “More Information” section |
Householding
The Fund will mail only one copy of shareholder documents, including prospectuses, annual and semi-annual reports and proxy statements, to shareholders with multiple accounts at the same address. This practice is commonly called “householding” and is intended to reduce expenses and eliminate duplicate mailings of shareholder documents. Mailings of your shareholder documents may be householded indefinitely unless you instruct us otherwise. If you do not want the mailing of these documents to be combined with those for other members of your household, please contact the Fund at (800) 441-7762.
Availability of Quarterly Schedule of Investments
The Fund files its complete schedule of portfolio holdings with the SEC for the first and third quarters of each fiscal year on Form N-Q. The Fund’s Forms N-Q are available on the SEC’s website at http:// www.sec.gov and may also be reviewed and copied at the SEC’s Public Reference Room in Washington, D.C. Information on how to access documents on the SEC’s website without charge may be obtained by calling (800) SEC-0330. The Fund’s Forms N-Q may also be obtained upon request and without charge by calling (800) 441-7762.
Availability of Proxy Voting Policies and Procedures
A description of the policies and procedures that the Fund uses to determine how to vote proxies relating to portfolio securities is available (1) without charge, upon request, by calling (800) 441-7762; (2) at http://www.blackrock.com; and (3) on the SEC’s website at http://www.sec.gov.
Availability of Proxy Voting Record
Information about how the Fund voted proxies relating to securities held in the Fund’s portfolios during the most recent 12-month period ended June 30 is available, upon request and without charge (1) at http://www.blackrock.com or by calling (800) 441-7762 and (2) on the SEC’s website at http://www.sec.gov.
Account Information
Call us at (800) 441-7762 from 8:00 AM to 6:00 PM EST on any business day to get information about your account balances, recent transactions and share prices. You can also reach us on the Web at http://www.blackrock.com/funds.
Automatic Investment Plans
Investor Class shareholders who want to invest regularly can arrange to have $50 or more automatically deducted from their checking or savings account and invested in any of the BlackRock funds.
Systematic Withdrawal Plan
Investor Class shareholders can establish a systematic withdrawal plan and receive periodic payments of $50 or more from their BlackRock portfolios, as long as their account balance is at least $10,000.
Retirement Plans
Shareholders may make investments in conjunction with Traditional, Rollover, Roth, Coverdell, Simple IRAs, SEP IRAs and 403(b) Plans.
| | | | | | |
| | | | | | | |
| | BLACKROCK CAPITAL APPRECIATION FUND, INC. | | MARCH 31, 2012 | | 23 |
| | |
| | |
Additional Information (concluded) | | |
|
BlackRock Privacy Principles |
BlackRock is committed to maintaining the privacy of its current and former fund investors and individual clients (collectively, “Clients”) and to safeguarding their non-public personal information. The following information is provided to help you understand what personal information BlackRock collects, how we protect that information and why in certain cases we share such information with select parties.
If you are located in a jurisdiction where specific laws, rules or regulations require BlackRock to provide you with additional or different privacy-related rights beyond what is set forth below, then BlackRock will comply with those specific laws, rules or regulations.
BlackRock obtains or verifies personal non-public information from and about you from different sources, including the following: (i) information we receive from you or, if applicable, your financial intermediary, on applications, forms or other documents; (ii) information about your transactions with us, our affiliates, or others; (iii) information we receive from a consumer reporting agency; and (iv) from visits to our websites.
BlackRock does not sell or disclose to non-affiliated third parties any non-public personal information about its Clients, except as permitted by law or as is necessary to respond to regulatory requests or to service Client accounts. These non-affiliated third parties are required to protect the confidentiality and security of this information and to use it only for its intended purpose.
We may share information with our affiliates to service your account or to provide you with information about other BlackRock products or services that may be of interest to you. In addition, BlackRock restricts access to non-public personal information about its Clients to those BlackRock employees with a legitimate business need for the information. BlackRock maintains physical, electronic and procedural safeguards that are designed to protect the non-public personal information of its Clients, including procedures relating to the proper storage and disposal of such information.
| | | | | | |
| | | | | | | |
| 24 | | BLACKROCK CAPITAL APPRECIATION FUND, INC. | | MARCH 31, 2012 | | |
| | |
| | |
A World-Class Mutual Fund Family | | |
BlackRock offers a diverse lineup of open-end mutual funds crossing all investment styles and managed by experts in equity, fixed income and tax-exempt investing.
| | | | |
Equity Funds | | | | |
BlackRock ACWI ex-US Index Fund | | BlackRock Global Dynamic Equity Fund | | BlackRock Mid-Cap Value Equity Portfolio |
BlackRock All-Cap Energy & Resources Portfolio | | BlackRock Global Opportunities Portfolio | | BlackRock Mid Cap Value Opportunities Fund |
BlackRock Balanced Capital Fund† | | BlackRock Global SmallCap Fund | | BlackRock Natural Resources Trust |
BlackRock Basic Value Fund | | BlackRock Health Sciences Opportunities Portfolio | | BlackRock Pacific Fund |
BlackRock Capital Appreciation Fund | | BlackRock Index Equity Portfolio | | BlackRock Russell 1000 Index Fund |
BlackRock China Fund | | BlackRock India Fund | | BlackRock Science & Technology |
BlackRock Commodity Strategies Fund | | BlackRock International Fund | | Opportunities Portfolio |
BlackRock Emerging Markets Fund | | BlackRock International Index Fund | | BlackRock Small Cap Growth Equity Portfolio |
BlackRock Emerging Markets Long/Short | | BlackRock International Opportunities Portfolio | | BlackRock Small Cap Growth Fund II |
Equity Fund | | BlackRock Large Cap Core Fund | | BlackRock Small Cap Index Fund |
BlackRock Energy & Resources Portfolio | | BlackRock Large Cap Core Plus Fund | | BlackRock S&P 500 Index Fund |
BlackRock Equity Dividend Fund | | BlackRock Large Cap Growth Fund | | BlackRock S&P 500 Stock Fund |
BlackRock EuroFund | | BlackRock Large Cap Value Fund | | BlackRock U.S. Opportunities Portfolio |
BlackRock Focus Growth Fund | | BlackRock Latin America Fund | | BlackRock Value Opportunities Fund |
BlackRock Global Allocation Fund | | BlackRock Managed Volatility Portfolio† | | BlackRock World Gold Fund |
BlackRock Global Dividend Income Portfolio† | | BlackRock Mid-Cap Growth Equity Portfolio | | |
| | | | |
Fixed Income Funds | | | | |
BlackRock Bond Index Fund | | BlackRock High Yield Bond Portfolio | | BlackRock Strategic Income |
BlackRock Core Bond Portfolio | | BlackRock Inflation Protected Bond Portfolio | | Opportunities Portfolio |
BlackRock CoreAlpha Bond Fund | | BlackRock International Bond Portfolio | | BlackRock Total Return Fund |
BlackRock Emerging Market Debt Portfolio | | BlackRock Long Duration Bond Portfolio | | BlackRock US Government Bond Portfolio |
BlackRock Floating Rate Income Portfolio | | BlackRock Low Duration Bond Portfolio | | BlackRock US Mortgage Portfolio |
BlackRock Global Long/Short Credit Fund | | BlackRock Multi-Asset Income Portfolio† | | BlackRock World Income Fund |
BlackRock GNMA Portfolio | | BlackRock Multi-Sector Bond Portfolio | | |
| | | | |
| | | | |
Municipal Bond Funds | | | | |
BlackRock California Municipal Bond Fund | | BlackRock National Municipal Fund | | BlackRock Pennsylvania Municipal Bond Fund |
BlackRock High Yield Municipal Fund | | BlackRock New Jersey Municipal Bond Fund | | BlackRock Short-Term Municipal Fund |
BlackRock Intermediate Municipal Fund | | BlackRock New York Municipal Bond Fund | | |
| | | | | | | | | | | | |
Target Risk & Target Date Funds† | | | | | | | | | | | | |
BlackRock Prepared Portfolios | | BlackRock Lifecycle | | Prepared Portfolios | | LifePath Portfolios | | LifePath Index Portfolios |
Conservative Prepared Portfolio | | 2015 | | 2035 | | Retirement | | 2040 | | Retirement | | 2040 |
Moderate Prepared Portfolio | | 2020 | | 2040 | | 2020 | | 2045 | | 2020 | | 2045 |
Growth Prepared Portfolio | | 2025 | | 2045 | | 2025 | | 2050 | | 2025 | | 2050 |
Aggressive Growth Prepared Portfolio | | 2030 | | 2050 | | 2030 | | 2055 | | 2030 | | 2055 |
| | | | | | 2035 | | | | 2035 | | |
† Mixed asset fund.
BlackRock mutual funds are currently distributed by BlackRock Investments, LLC. You should consider the investment objectives, risks, charges and expenses of the funds under consideration carefully before investing. Each fund’s prospectus contains this and other information and is available at www.blackrock.com or by calling (800) 441-7762 or from your financial advisor. The prospectus should be read carefully before investing.
| | | | | | |
| | | | | | | |
| | BLACKROCK CAPITAL APPRECIATION FUND, INC. | | MARCH 31, 2012 | | 25 |
[THIS PAGE INTENTIONALLY LEFT BLANK.]
[THIS PAGE INTENTIONALLY LEFT BLANK.]
| | |
| This report is transmitted to shareholders only. It is not authorized for use as an offer of sale or a solicitation of an offer to buy shares of the Fund unless accompanied or preceded by the Fund’s current prospectus. Past performance results shown in this report should not be considered a representation of future performance. Investment returns and principal value of shares will fluctuate so that shares, when redeemed, may be worth more or less than their original cost. Statements and other information herein are as dated and are subject to change. | |  |
| | |
CapApp-3/12-SAR | |  |
| | |
| Item 2 – | | Code of Ethics – Not Applicable to this semi-annual report |
| |
| Item 3 – | | Audit Committee Financial Expert – Not Applicable to this semi-annual report |
| |
| Item 4 – | | Principal Accountant Fees and Services – Not Applicable to this semi-annual report |
| |
| Item 5 – | | Audit Committee of Listed Registrants – Not Applicable |
| |
| Item 6 – | | Investments |
| | (a) The registrant’s Schedule of Investments is included as part of the Report to Stockholders filed under Item 1 of this Form. |
| | (b) Not Applicable due to no such divestments during the semi-annual period covered since the previous Form N-CSR filing. |
| |
| Item 7 – | | Disclosure of Proxy Voting Policies and Procedures for Closed-End Management Investment Companies – Not Applicable |
| |
| Item 8 – | | Portfolio Managers of Closed-End Management Investment Companies – Not Applicable |
| |
| Item 9 – | | Purchases of Equity Securities by Closed-End Management Investment Company and Affiliated Purchasers – Not Applicable |
| |
| Item 10 – | | Submission of Matters to a Vote of Security Holders –There have been no material changes to these procedures. |
| |
| Item 11 – | | Controls and Procedures |
| |
| (a) – | | The registrant’s principal executive and principal financial officers, or persons performing similar functions, have concluded that the registrant’s disclosure controls and procedures (as defined in Rule 30a-3(c) under the Investment Company Act of 1940, as amended (the “1940 Act”)) are effective as of a date within 90 days of the filing of this report based on the evaluation of these controls and procedures required by Rule 30a-3(b) under the 1940 Act and Rule 15d-15(b) under the Securities Exchange Act of 1934, as amended. |
| |
| (b) – | | There were no changes in the registrant’s internal control over financial reporting (as defined in Rule 30a-3(d) under the 1940 Act) that occurred during the second fiscal quarter of the period covered by this report that have materially affected, or are reasonably likely to materially affect, the registrant’s internal control over financial reporting. |
| |
| Item 12 – | | Exhibits attached hereto |
(a)(1) – Code of Ethics – Not Applicable to this semi-annual report
(a)(2) – Certifications – Attached hereto
(a)(3) – Not Applicable
(b) – Certifications – Attached hereto
2
Pursuant to the requirements of the Securities Exchange Act of 1934 and the Investment Company Act of 1940, the registrant has duly caused this report to be signed on its behalf by the undersigned, thereunto duly authorized.
BlackRock Capital Appreciation Fund, Inc.
| | | | |
By: | | /s/ John M. Perlowski | | |
| | John M. Perlowski |
| | Chief Executive Officer (principal executive officer) of |
| | BlackRock Capital Appreciation Fund, Inc. |
| | |
Date: | | June 4, 2012 | | |
Pursuant to the requirements of the Securities Exchange Act of 1934 and the Investment Company Act of 1940, this report has been signed below by the following persons on behalf of the registrant and in the capacities and on the dates indicated.
| | | | |
By: | | /s/ John M. Perlowski | | |
| | John M. Perlowski |
| | Chief Executive Officer (principal executive officer) of |
| | BlackRock Capital Appreciation Fund, Inc. |
| | |
Date: | | June 4, 2012 | | |
| | | | |
By: | | /s/ Neal J. Andrews | | |
| | Neal J. Andrews |
| | Chief Financial Officer (principal financial officer) of |
| | BlackRock Capital Appreciation Fund, Inc. |
| | |
Date: | | June 4, 2012 | | |
3