UNITED STATES
SECURITIES AND EXCHANGE COMMISSION
Washington, D.C. 20549
FORM N-CSR
CERTIFIED SHAREHOLDER REPORT OF REGISTERED
MANAGEMENT INVESTMENT COMPANIES
Investment Company Act file number: 811-06686
|
| JF China Region Fund, Inc. |
(Exact name of registrant as specified in charter)
|
One Beacon Street, 18th Floor Boston, MA 02108 |
(Address of principal executive offices) (Zip code)
|
Dechert LLP 1095 Avenue of the Americas New York, NY 10036 |
(Name and Address of Agent for Service)
Registrant’s telephone number, including area code: (800) 441-9800
Date of fiscal year end: December 31
Date of reporting period: January 1, 2012 through June 30, 2012
ITEM 1. REPORTS TO STOCKHOLDERS.
The following is a copy of the report transmitted to shareholders pursuant to Rule 30e-1 under the Investment Company Act of 1940 (17 CFR 270.30e-1).
This report, including the financial statements herein, is sent to the stockholders of the Fund for their information. It is not a prospectus, circular or representation intended for use in the purchase or sale of shares of the Fund or of any securities mentioned in this report.

Semi-Annual Report
June 30, 2012 (Unaudited)


CONTENTS
OBJECTIVES
JF China Region Fund, Inc. (the ‘Fund’) seeks to achieve long-term capital appreciation through investments primarily in equity securities of companies with substantial assets in, or revenues derived from, the People’s Republic of China (‘China’), Hong Kong, Taiwan and Macau — collectively, the ‘China Region’.
The Fund provides investors with an opportunity to participate in the growing economies of the China Region where the economies of China, Hong Kong, Taiwan and Macau have become increasingly linked over recent years. Hong Kong enterprises have made substantial investments in China, particularly where labor and land prices are lower than in Hong Kong. Similarly, many Chinese companies have Hong Kong based subsidiaries with securities listed on the Hong Kong Stock Exchange. Renminbi denominated China A-shares, which are listed in China, are available for acquisition by the Fund by direct investment up to $20m and by indirect investment up to 10% of the Fund’s total assets through exposure to China A-share investment companies. It is intended that the Fund will maintain a $20m direct investment in China A-shares. Further details on China A-shares are provided in note 7(iii) of the Notes to Financial Statements on page 20.
The Fund invests to take advantage of the many opportunities that result from this linkage among the markets of the China Region.
MANAGEMENT
JF International Management Inc. (‘JFIMI’) is the investment management company appointed to advise and manage the Fund’s portfolio (the ‘Investment Advisor’). JFIMI is part of JPMorgan Chase & Co. (‘JPMC’), one of the world’s premier financial services institutions. In asset management, JPMC operates globally under the name of J.P. Morgan Asset Management (‘JPMAM’), although in Asia it also uses the sub-brand JF Asset Management. Funds under management for the global asset management business of JPMAM were US$1.4 trillion as of June 30, 2012.
The Fund’s lead portfolio manager is Emerson Yip, Senior Portfolio Manager within JPMAM’s Greater China investment team in Hong Kong.
| | | | | | | | |
| | | |
JUNE 30, 2012 | | JF CHINA REGION FUND, INC. | | | | | 1 | |
FORWARD-LOOKING STATEMENTS
This report contains certain forward-looking statements within the meaning of Section 21E of the Securities Exchange Act of 1934. Forward-looking statements include statements regarding the goals, beliefs, plans or current expectations of the Fund and JFIMI and their respective representatives, taking into account the information currently available to them. Forward-looking statements include all statements that do not relate solely to current or historical fact. For example, forward-looking statements include the use of words such as “anticipate,” “estimate,” “intend,” “expect,” “believe,” “plan,” “may,” “should,” “would,” or other words that convey uncertainty of future events or outcomes. Forward-looking statements involve known and unknown risks, uncertainties and other factors that may cause the actual results, performance or achievements of the Fund to be materially different from any future results, performance or achievements expressed or implied by the forward-looking statements. Factors that could materially and negatively affect the results, performance or achievements of the Fund include changes in economic, political, legal and regulatory conditions in the China Region and elsewhere, changes in interest and exchange rates and related policies and other risks. When evaluating the information included in this report, you are cautioned not to place undue reliance on these forward-looking statements, which reflect the judgment of the Fund, JFIMI or its respective representatives only as of the date hereof. The Fund, JFIMI and their respective representatives undertake no obligation to publicly revise or update these forward-looking statements to reflect events and circumstances that arise after the date hereof.
|
| MARKET INFORMATION |
The Fund is listed on the New York Stock Exchange (symbol JFC). The share price is published in • The Wall Street Journal (daily online at www.WSJ.com/Free) |
The estimated net asset value is published in • The Wall Street Journal under “Closed-End Funds” (every Saturday) • www.jfchinaregion.com |
| | | | | | |
| | | |
| 2 | | | | JF CHINA REGION FUND, INC. | | JUNE 30, 2012 |
HIGHLIGHTS (unaudited)
| | | | | | | | |
| | | JUNE 30, 2012
US$ (Unaudited) | | | DECEMBER 31, 2011
US$ (Audited) | |
Net Assets | | | $87.6 million | | | | $82.2 million | |
Net Asset Value Per Share | | | $13.59 | | | | $12.75 | |
| | |
Market Data | | | | | | | | |
Share Price on the New York Stock Exchange | | | $12.11 | | | | $11.02 | |
Discount to Net Asset Value | | | 10.9% | | | | 13.6% | |
| | |
Total Return for the Six Months Ended June 30, 2012 | | | | | | | | |
Net Asset Value | | | | | | | 6.7% | |
Share Price | | | | | | | 9.9% | |
| | |
JFC Benchmark Index* | | | | | | | 5.3% | |
Previous Benchmark Index** | | | | | | | 4.8% | |
MSCI Hong Kong Index (Total) | | | | | | | 7.9% | |
MSCI China Index (Total) | | | | | | | 4.1% | |
MSCI Taiwan Index (Total) | | | | | | | 3.6% | |
| | |
Net Asset Value and Share Price vs. Benchmark Index | | | | | | | | |
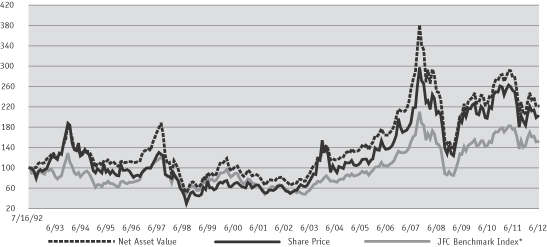
| * | | JFC Benchmark Index: 80% MSCI Golden Dragon Index (GDR) + 20% CSI 300 (Total). Prior to April 13, 2012, the MSCI Golden Dragon Index (Total). At December 31, 2011 the MSCI Golden Dragon Index (Total) comprised 24.1% of the MSCI Hong Kong Index (Total), 42.7% of the MSCI China Index (Total) and 33.2% of the MSCI Taiwan Index (Total). Prior to March 2001, 25% Taiwan Weighted Index, 20% BNP Paribas China Index, 50% MSCI Hong Kong, 5% HSBC; Prior to March 1999, 60% Hong Kong All Ordinaries, 30% Credit Lyonnais Securities Asia All China B Index, 10% Taiwan Weighted Index. Prior to January 1997, Peregrine Greater China Index. |
| ** | | Previous Benchmark Index: MSCI Golden Dragon Index (Total). |
| *** | | Commencement of operations. |
Source: J.P. Morgan Asset Management.
| | | | | | | | |
| | | |
JUNE 30, 2012 | | JF CHINA REGION FUND, INC. | | | | | 3 | |
CHAIRMAN‘S STATEMENT
JUNE 30, 2012
Dear fellow Stockholder,
Performance
The Greater China markets started 2012 positively on news of reductions in the required bank reserve ratio in China and improving global economic momentum. However, gains proved short lived as stock markets fell in the second quarter on weak Chinese macro data, renewed Eurozone debt worries and a slowdown in the US economy. The Greater China markets did improve towards the end of June on speculation of loosening monetary policy and increased spending in China infrastructure.
Against this backdrop, I am pleased to report that the Fund achieved a positive net asset value (‘NAV’) return of 6.7% in the six months to June 30, 2012. This was ahead of the return of 5.3% from the Fund’s benchmark1 and 4.8% of the Fund’s previous benchmark1 representing an outperformance of 1.4% and 1.9%, respectively. Over the same period, the Fund’s share price rose by 9.9% reflecting a tightening of the discount from 13.6% to 10.9%. The Fund’s outperformance was largely attributable to positive allocation decisions and stock selection. Specifically, stock selection in A-share financials and Taiwan technology stocks were the largest contributors to outperformance.
China A-Shares
In my last Chairman’s Statement, I stated that the Fund was close to securing an allocation to invest up to $20m in the domestic China, renminbi denominated, A-share market. I am pleased to report that the Fund has since received the necessary approvals and, with effect from April 13, 2012, commenced direct investment in the A-share market.
Your Board believes the A-share market presents significant investment opportunities, providing greater access to leading domestic companies in sectors which benefit directly from China’s consumption growth opportunities. To date, the Fund’s A-share exposure has contributed positively to performance. As at June 30, 2012, the Fund had invested in 13 A-share stocks representing 22.4% of the Fund’s net assets.
Benchmark
Further to the Fund’s investment in the A-share market, your Board agreed to adopt the following composite benchmark, effective April 13 2012, by which it will compare the Fund’s relative performance: 80% MSCI Golden Dragon Index, 20% CSI 300 Index. Your Board considered that the revised benchmark better reflects the proportion of the Fund’s holdings in China A-shares and other Greater China securities.
Leverage
I am pleased to announce that with effect from February 27 2012, the Fund entered into a financing arrangement with Scotiabank (Ireland) Ltd. Under this arrangement, Scotiabank Ireland Ltd provides a secured, committed credit facility in the aggregate amount of $17.5 million to the Fund. This financing arrangement gives the Investment Advisor the flexibility to tactically manage borrowed monies at its discretion under the supervision of the Board. Since entering into this financing arrangement and up to June 30, 2012, the Fund’s leverage ranged between 0.0% and 19.1% and at the time of writing is 0.0%.
At the Fund’s Annual Stockholders’ Meeting on May 10 2012, stockholders voted in favour of amending the Investment Advisory and Management Agreement to provide that fees paid under the Investment Advisory Agreement will be based on all
| 1 | Currently 80% MSCI Golden Dragon Index, 20% CSI 300 Index. Prior to April 13, 2012, the benchmark was 100% MSCI Golden Dragon Index. |
For more information please refer to the Fund’s website at www.jfchinaregion.com
| | | | | | |
| | | |
| 4 | | | | JF CHINA REGION FUND, INC. | | JUNE 30, 2012 |
CHAIRMAN‘S STATEMENT (continued)
managed assets (previously net assets). As previously stated, the Investment Advisor has waived its entitlement to a management fee on any cash held when borrowings are drawn under a borrowing facility.
Merger Proposals
On August 2, 2012, your Board announced that it had made a merger approach to the Board of the Greater China Fund, Inc (‘GCH’). At the GCH Annual Meeting of Stockholders on June 29, 2012, stockholders approved a proposal to terminate GCH’s Investment Advisory Agreement with Baring Asset Management (Asia) Ltd. Prior to this, on October 10, 2011, City of London Investment Management Company (a significant stockholder in both companies) had released an announcement in which it indicated that it would support a merger proposal between the Fund and GCH on the terms summarized in its announcement. Consequently your Board approached the Board of GCH with proposals which it believes are in the best interests of the Fund’s shareholders as a whole, and further believes offers significant potential benefits to GCH shareholders.
Your Board looks forward to hearing the views of the Fund’s shareholders on these proposals and, whilst there is no guarantee that any merger will proceed, it remains hopeful that terms can be agreed in the near future. The Fund’s announcement and terms of the proposals are available on the Fund’s website at www.jfchinaregion.com.
Outlook
Your Board expects continued growth in the second half of 2012, but this is likely to be at a slower pace than 2011 given the potential impact the European sovereign debt situation has on global growth. Your Board, together with the Investment Advisor, believes that the Fund’s recent structural enhancements have helped to position the Fund to better benefit from the growth opportunities offered by the Greater China Markets.
Respectfully submitted
The Rt. Hon. The Earl of Cromer
Chairman
August 29, 2012
For more information please refer to the Fund’s website at www.jfchinaregion.com
| | | | | | | | |
| | | |
JUNE 30, 2012 | | JF CHINA REGION FUND, INC. | | | | | 5 | |
INVESTMENT ADVISOR‘S REPORT
During the first half of 2012, the Fund achieved a total return on net assets of +6.7% (in USD terms), outperforming the benchmark return of +5.3% by 1.4%.
Performance was particularly strong in the first half of the period with stock selection and allocation decisions contributing to the outperformance. In particular, stock selection in A-share property developers and insurers as well as Taiwan financials were the primary positive contributors. China technology and Hong Kong property stocks also added to performance.
We continue to see interesting valuations in Greater China markets, which when paired with a policy inflection point in China, bodes well for equities over the medium-term. Short-term newsflow may continue to be challenging as China attempts to loosen policy without re-inflating its property market while pressure from European debt markets can never be ruled out. We continue to add policy sensitive stocks in China while adding secular growth names in all three markets that have underperformed for cyclical reasons.
China
Market Performance
Chinese equities registered gains in the first quarter of the year on news of another cut in the required reserve ratio, however, performance faded following a lack of demand post Chinese New Year and generally disappointing 2011 year-end results reported in March. On the economic front, the consumer price index continued to trend down and fixed asset investment growth of 21.5% for the January to February period was slightly higher than market expectations of 20%. Real demand recovery, however, has been slow and below expectations.
Over the second quarter, Chinese equities gave back most of their first quarter gains due to weak China economic data, renewed Europe debt worries, and a
slowing US economy. The market, again, was volatile, rising in April in anticipation of better seasonal demand recovery only to be disappointed by much worse than expected April and May data, driving the index down by double digits. Industrial production, a key demand indicator, came in at 9.3% and 9.6% in April and May year on year respectively — below the normal trend of 12-13%. Government policy turned increasingly more pro-growth with further required reserve ratio cuts in May, interest rate cuts, home appliance subsidies, as well as accelerated approval of infrastructure projects. First quarter earnings reported in April were generally below expectations, particularly in end demand areas such as the consumer sector as well as in mid stream cyclicals, consistent with a falling consumer price index trend.
A-shares
In the first quarter of 2012 the A-share market, like its H-share counterpart, swung upwards first and subsequently fell. There was a divergence between large and small caps, and cyclicals and non-cyclicals: the Shanghai composite index added 2.8%, SHSZ 300 advanced 4.6%, but the small/mid cap index only increased by 2.7%. Cyclicals and financials outperformed the overall market with nonferrous metals, securities, real estate, auto & parts and coal being among the top gainers, whereas telecom services, health care, city utilities, media and software services posted losses.
During the second quarter, non-bank financials including insurance, property and brokers, consumer staples and pharmaceutical stocks outperformed during the quarter as investors favored those sectors with solid 2012 earnings growth or with potential upside earnings revision. Those cyclical sectors that correlated to investment (such as materials and capital equipment) and banks underperformed on the back of more downside earnings risks. A-shares outperformed their H-share counterparts until May, though the trend reversed in June when despite the
| | | | | | |
| | | |
| 6 | | | | JF CHINA REGION FUND, INC. | | JUNE 30, 2012 |
INVESTMENT ADVISOR‘S REPORT (continued)
interest rate cut, A-shares lost almost 7% as economic indicators pointed to a further modest contraction in the Chinese economy.
Market Outlook
Economic activity remains weak but policy support has helped to stabilize growth in the second quarter of 2012. Three required reserve ratio cuts, which started in November 2011, two consecutive interest rate cuts in June and July, and rebounding bank loans have eased liquidity conditions. Property sales, one of the key leading indicators, have been increasing five months in a row with May daily transaction volumes up 30% year on year. Infrastructure spending is also showing some tentative signs of acceleration, fixed asset investment in power generation and water irrigation is up 20% and 15% respectively from single digit increases last year. Many suspended railway construction projects were expected to be 100% resumed by end of the second quarter of 2012. We expect to see more signs of macro recovery toward end of the third quarter although weak data out of Europe and the US will put a damper on share prices in the near term and markets are also facing seasonal weakness.
Hong Kong
Market Performance
The MSCI Hong Kong Index rose 13% in the first quarter of 2012. The rally continued into the Chinese New Year on the back of improving global economic momentum coupled with lessening fears of a “hard landing” for China’s economy. However, the rally was halted by the election of CY Leung to the Chief Executive post on a more populist platform. Moreover, the arrest of the two co-chairmen of Sun Hung Kai Properties on potential corruption charges exacerbated market concerns. While the impact of the election of CY Leung remains unknown, the market is growing more concerned about the potential for property sector reform. However, transaction
volumes staged a rebound due to pent-up demand and falling mortgage rates.
Hong Kong equities gave away much of the first-quarter gains in the second quarter owing to the deterioration in the European debt situation as well as the declining growth momentum in the Chinese economy. While tourist arrivals continued to hold up, overall retail sales growth slowed given the high base effect and a drop in average spending per tourist. Therefore, consumer stocks were negatively impacted. Export-oriented stocks also fared poorly in the second quarter due to weakening global economic momentum. Macau gaming stocks corrected in the quarter due to slowing year-over-year growth rates as well as the tepid responses to a new property opening in April.
Market Outlook
Policy uncertainty both in Hong Kong and Beijing have complicated the necessary responses to a slowing economy. However, given our base view that China’s economy will avoid a hard landing, we believe that Hong Kong equities present an attractive risk-to-reward proposition. The property sector in particular remains attractively valued and specific stocks exposed to the external sector are trading at appealing valuations relative to growth prospects.
Taiwan
Market Performance
The TWSE Index gained 15.1% in USD in the first quarter of 2012. The market’s response to President Ma’s re-election was initially disappointing as investors were reluctant to participate ahead of a long, post-election Chinese New Year break. However, the Taiwan market gained momentum after Chinese New Year, driven by Kuomintang victories in the presidential and legislative elections, which should result in steady progress in cross-strait relations. Strong results from Apple, better global economic data and the European Central Bank boosting
| | | | | | | | |
| | | |
JUNE 30, 2012 | | JF CHINA REGION FUND, INC. | | | | | 7 | |
INVESTMENT ADVISOR‘S REPORT (continued)
liquidity through long term refinancing operations all helped to lift the TWSE in the first two months of the quarter.
Over the second quarter the TWSE Index gave back much of the year-to-date gains and fell by over 8.0% in USD terms. Domestically, the proposed energy price increases and capital gains tax for equity trading were in the spotlight over the quarter. This, coupled with increasingly negative news flow on the European debt crisis and weaker than expected data points from the US, weighed on the market.
Market Outlook
The continuing turmoil in the Eurozone, worries of a slowdown in China and uncertain government policies are likely to be a drag on the stock market’s
sentiment. That said, while the global outlook remains uncertain, US housing and auto markets are showing signs of improvement while the Eurozone also seems to be making some progress at the margin. Domestically, the uncertainty of capital gains tax is abating. Following weak guidance in a number of sectors, the aggressive cuts to 2011 earnings estimates should be mostly done. Thus, a lot of pessimism may be already factored into share prices. The market looks supported at a level of 7000 (currently at 7130) and we continue to favour companies with structural growth and earnings resilience.
Emerson Yip
JF International Management, Inc
August 29, 2012
| | | | | | |
| | | |
| 8 | | | | JF CHINA REGION FUND, INC. | | JUNE 30, 2012 |
TOP TEN HOLDINGS
AT JUNE 30, 2012 (Unaudited)
| | | | |
| | | % OF
NET ASSETS | |
Taiwan Semiconductor Manufacturing Co., Ltd. ('TSMC') | | | 6.2 | |
| Manufactures and markets integrated circuits. The company provides the following services: wafer manufacturing, wafer probing, assembly and testing, mask production and design services. The company’s integrated circuits are used in computer, communication, consumer electronics, automotive and industrial equipment industries. | | | | |
| |
Industrial & Commercial Bank of China | | | 4.5 | |
| Provides a broad range of personal and corporate commercial banking services across China. The bank’s businesses include deposit, loan, credit card, fund underwriting and trust, and foreign currency settlement and trading. | | | | |
| |
China Mobile Ltd. | | | 4.4 | |
| Through its subsidiaries, provides cellular telecommunications and related services in China and Hong Kong. | | | | |
| |
China Construction Bank Corp., 'A' | | | 3.9 | |
| Provides a complete range of banking services and other financial services to individual and corporate customers. The bank’s services include retail banking, international settlement, project finance and credit card services. | | | | |
| |
Ping An Insurance Group Co. of China Ltd., 'A' | | | 3.7 | |
| Provides a variety of insurance service in China. The company writes property, casualty, and life insurance. Ping An Insurance also offers financial services. | | | | |
| |
Tencent Holdings Ltd. | | | 3.7 | |
| Provides internet, mobile, and telecommunication value-added services in China. The company has an instant messaging community in China. Tencent also provides online advertising services. | | | | |
| |
CNOOC Ltd. | | | 3.2 | |
| Through its subsidiaries, explores, develops, produces, and sells crude oil and natural gas. | | | | |
| |
China Vanke Co., Ltd., 'A' | | | 3.2 | |
| Develops residential properties in Shenzhen, Shanghai, Beijing, Tianjin, Shenyang, Nanjing, and other big cities in China. | | | | |
| |
AIA Group Ltd. | | | 3.1 | |
| Offers insurance and financial services. The company writes life insurance for individuals and businesses, accident and health insurance, retirement planning, and wealth management services. | | | | |
| |
Cheung Kong Holdings Ltd. | | | 2.9 | |
| Through its subsidiaries, develops and invests in real estate. The company also provides real estate agency and management services, operates hotels, and invests in securities. | | | | |
| | | | | | | | |
| | | |
| JUNE 30, 2012 | | JF CHINA REGION FUND, INC. | | | | | 9 | |
INVESTMENT PORTFOLIO
AT JUNE 30,2012 (Unaudited)
| | | | | | | | |
| DESCRIPTION | | HOLDINGS
(IN SHARES) | | | MARKET
VALUE
(IN US$) | |
COMMON STOCK (unless otherwise noted) | |
CHINA (50.4%) | |
Airlines (0.5%) | |
China Eastern Airlines Corp., Ltd. (a) | | | 718,000 | | | | 227,673 | |
China Southern Airlines Co., Ltd. | | | 568,000 | | | | 248,932 | |
| | | | | | | | |
| | | | | | | 476,605 | |
| | | | | | | | |
Auto Components (0.6%) | |
Minth Group Ltd. | | | 490,000 | | | | 526,131 | |
| | | | | | | | |
Automobiles (1.6%) | |
Dongfeng Motor Group Co., Ltd. | | | 156,000 | | | | 239,290 | |
Great Wall Motor Co., Ltd. | | | 173,500 | | | | 343,961 | |
SAIC Motor Corp. Ltd., ‘A’ | | | 361,312 | | | | 812,569 | |
| | | | | | | | |
| | | | | | | 1,395,820 | |
| | | | | | | | |
Beverages (1.6%) | |
Jiangsu Yanghe Brewery Joint-Stock Co., Ltd., ‘A’ (a) | | | 19,937 | | | | 422,172 | |
Kweichow Moutai Co., Ltd., ‘A’ | | | 24,963 | | | | 939,535 | |
| | | | | | | | |
| | | | | | | 1,361,707 | |
| | | | | | | | |
Capital Markets (2.0%) | |
CITIC Securities Co., Ltd., ‘A’ | | | 857,937 | | | | 1,705,315 | |
| | | | | | | | |
Commercial Banks (11.7%) | |
Agricultural Bank of China Ltd., ‘A’ | | | 3,900,000 | | | | 1,589,682 | |
China Citic Bank Corp. Ltd. | | | 2,483,000 | | | | 1,264,232 | |
China Construction Bank Corp., ‘A’ | | | 5,128,100 | | | | 3,389,626 | |
Industrial & Commercial Bank of China | | | 7,160,930 | | | | 3,959,859 | |
| | | | | | | | |
| | | | | | | 10,203,399 | |
| | | | | | | | |
Communications Equipment (0.4%) | |
AAC Technologies Holdings, Inc. | | | 116,000 | | | | 333,439 | |
| | | | | | | | |
Construction Materials (2.1%) | | | | | | | | |
Anhui Conch Cement Co., Ltd., ‘A’ | | | 330,000 | | | | 769,677 | |
China National Building Material Co., Ltd. | | | 1,024,000 | | | | 1,094,227 | |
| | | | | | | | |
| | | | | | | 1,863,904 | |
| | | | | | | | |
Diversified Telecommunication Services (0.8%) | |
China Telecom Corp. Ltd. | | | 1,680,000 | | | | 729,781 | |
| | | | | | | | |
Energy Equipment & Services (1.1%) | |
China Oilfield Services Ltd. | | | 700,000 | | | | 999,749 | |
| | | | | | | | |
| | | | | | | | |
| DESCRIPTION | | HOLDINGS
(IN SHARES) | | | MARKET
VALUE
(IN US$) | |
Food Products (1.5%) | |
Want Want China Holdings Ltd. | | | 1,099,000 | | | | 1,345,781 | |
| | | | | | | | |
Hotels, Restaurants & Leisure (1.4%) | |
Sands China Ltd. | | | 390,400 | | | | 1,232,903 | |
| | | | | | | | |
Household Durables (1.8%) | |
Gree Electric Appliances, Inc., ‘A’ (a) | | | 202,600 | | | | 664,801 | |
Hisense Electric Co., Ltd., ‘A’ | | | 355,992 | | | | 941,789 | |
| | | | | | | | |
| | | | | | | 1,606,590 | |
| | | | | | | | |
Insurance (5.0%) | |
New China Life Insurance Co., Ltd. | | | 302,900 | | | | 1,153,745 | |
Ping An Insurance Group Co. of China Ltd., ‘A’ | | | 449,865 | | | | 3,238,354 | |
| | | | | | | | |
| | | | | | | 4,392,099 | |
| | | | | | | | |
Internet Software & Services (4.0%) | |
NetEase, Inc., ADR (a) | | | 3,933 | | | | 231,457 | |
Tencent Holdings Ltd. | | | 110,700 | | | | 3,224,847 | |
| | | | | | | | |
| | | | | | | 3,456,304 | |
| | | | | | | | |
Machinery (1.6%) | |
Sany Heavy Industry Co., Ltd., ‘A’ (a) | | | 168,199 | | | | 368,475 | |
Zhengzhou Coal Mining Machinery Group Co., Ltd., ‘A’ | | | 224,808 | | | | 410,408 | |
Zoomlion Heavy Industry Science and Technology Co., Ltd. (a) | | | 489,600 | | | | 617,842 | |
| | | | | | | | |
| | | | | | | 1,396,725 | |
| | | | | | | | |
Multiline Retail (1.4%) | |
Intime Department Store Group Co., Ltd. | | | 717,000 | | | | 702,402 | |
Springland International Holdings Ltd. | | | 919,000 | | | | 515,297 | |
| | | | | | | | |
| | | | | | | 1,217,699 | |
| | | | | | | | |
Oil, Gas & Consumable Fuels (5.5%) | |
China Petroleum & Chemical Corp. | | | 1,588,000 | | | | 1,408,290 | |
CNOOC Ltd. | | | 1,429,000 | | | | 2,836,651 | |
Yanzhou Coal Mining Co., Ltd. (a) | | | 368,000 | | | | 568,274 | |
| | | | | | | | |
| | | | | | | 4,813,215 | |
| | | | | | | | |
Real Estate Investment Trusts (REITs) (0.5%) | |
Hui Xian Real Estate Investment Trust | | | 730,000 | | | | 421,358 | |
| | | | | | | | |
SEE ACCOMPANYING NOTES TO FINANCIAL STATEMENTS.
| | | | | | |
| | | |
| 10 | | | | JF CHINA REGION FUND, INC. | | JUNE 30, 2012 |
| | | | | | | | |
| DESCRIPTION | | HOLDINGS
(IN SHARES) | | | MARKET
VALUE
(IN US$) | |
COMMON STOCKS — continued | |
Real Estate Management & Development (5.0%) | |
China Vanke Co. Ltd., ‘A’ | | | 2,000,000 | | | | 2,804,488 | |
Poly Real Estate Group Co., Ltd., ‘A’ | | | 887,821 | | | | 1,584,472 | |
| | | | | | | | |
| | | | | | | 4,388,960 | |
| | | | | | | | |
Textiles, Apparel & Luxury Goods (0.3%) | |
China Lilang Ltd. | | | 421,000 | | | | 287,072 | |
| | | | | | | | |
TOTAL CHINA | | | | | | | 44,154,556 | |
| | | | | | | | |
HONG KONG (26.6%) | |
Commercial Banks (2.0%) | |
BOC Hong Kong Holdings Ltd. | | | 319,500 | | | | 971,932 | |
Dah Sing Financial Holdings Ltd. | | | 132,100 | | | | 408,665 | |
Wing Hang Bank Ltd. | | | 35,582 | | | | 343,301 | |
| | | | | | | | |
| | | | | | | 1,723,898 | |
| | | | | | | | |
Distributors (1.1%) | |
Dah Chong Hong Holdings Ltd. | | | 451,000 | | | | 401,124 | |
Li & Fung Ltd. | | | 284,000 | | | | 542,525 | |
| | | | | | | | |
| | | | | | | 943,649 | |
| | | | | | | | |
Electric Utilities (1.5%) | |
Cheung Kong Infrastructure Holdings Ltd. | | | 96,000 | | | | 578,503 | |
Power Assets Holdings Ltd. | | | 95,000 | | | | 711,464 | |
| | | | | | | | |
| | | | | | | 1,289,967 | |
| | | | | | | | |
Gas Utilities (1.3%) | |
China Resources Gas Group Ltd. | | | 642,000 | | | | 1,103,936 | |
| | | | | | | | |
Hotels, Restaurants & Leisure (0.4%) | |
REXLot Holdings Ltd. | | | 5,425,000 | | | | 384,605 | |
| | | | | | | | |
Industrial Conglomerates (1.9%) | |
Hutchison Whampoa Ltd. | | | 93,000 | | | | 797,182 | |
Jardine Matheson Holdings Ltd. | | | 12,628 | | | | 611,195 | |
NWS Holdings Ltd. | | | 161,000 | | | | 233,263 | |
| | | | | | | | |
| | | | | | | 1,641,640 | |
| | | | | | | | |
Insurance (3.1%) | |
AIA Group Ltd. | | | 806,600 | | | | 2,755,225 | |
| | | | | | | | |
Marine (0.1%) | |
Pacific Basin Shipping Ltd. | | | 326,000 | | | | 138,671 | |
| | | | | | | | |
Media (0.3%) | |
Television Broadcasts Ltd. | | | 37,000 | | | | 256,350 | |
| | | | | | | | |
| | | | | | | | |
| DESCRIPTION | | HOLDINGS
(IN SHARES) | | | MARKET
VALUE
(IN US$) | |
Multiline Retail (0.2%) | |
Lifestyle International Holdings Ltd. | | | 78,000 | | | | 170,117 | |
| | | | | | | | |
Real Estate Management & Development (9.2%) | |
Cheung Kong Holdings Ltd. | | | 211,000 | | | | 2,572,922 | |
China Overseas Land & Investment Ltd. | | | 526,000 | | | | 1,219,069 | |
China Resources Land Ltd. | | | 354,000 | | | | 720,964 | |
Kerry Properties Ltd. | | | 142,000 | | | | 604,941 | |
Midland Holdings Ltd. | | | 1,082,000 | | | | 520,222 | |
New World Development Co., Ltd. | | | 604,300 | | | | 701,828 | |
Wharf Holdings Ltd. | | | 310,400 | | | | 1,702,450 | |
| | | | | | | | |
| | | | | | | 8,042,396 | |
| | | | | | | | |
Specialty Retail (1.1%) | |
Belle International Holdings Ltd. | | | 581,000 | | | | 982,569 | |
| | | | | | | | |
Wireless Telecommunication Services (4.4%) | |
China Mobile Ltd. | | | 350,000 | | | | 3,823,497 | |
| | | | | | | | |
TOTAL HONG KONG | | | | | | | 23,256,520 | |
| | | | | | | | |
TAIWAN (22.4%) | |
Airlines (0.3%) | |
Eva Airways Corp. | | | 467,700 | | | | 284,047 | |
| | | | | | | | |
Chemicals (1.3%) | |
Formosa Chemicals & Fibre Corp. | | | 194,000 | | | | 508,938 | |
Formosa Plastics Corp. | | | 144,000 | | | | 384,514 | |
Oriental Union Chemical Corp. | | | 181,000 | | | | 217,430 | |
| | | | | | | | |
| | | | | | | 1,110,882 | |
| | | | | | | | |
Commercial Banks (1.6%) | |
E.Sun Financial Holding Co., Ltd. | | | 1,019,504 | | | | 521,948 | |
Mega Financial Holding Co., Ltd. | | | 1,192,920 | | | | 872,186 | |
| | | | | | | | |
| | | | | | | 1,394,134 | |
| | | | | | | | |
Computers & Peripherals (2.8%) | |
Catcher Technology Co., Ltd. | | | 95,000 | | | | 631,002 | |
Foxconn Technology Co., Ltd. | | | 212,100 | | | | 762,950 | |
Quanta Computer, Inc. | | | 390,000 | | | | 1,036,172 | |
| | | | | | | | |
| | | | | | | 2,430,124 | |
| | | | | | | | |
Diversified Financial Services (1.2%) | |
Chailease Holding Co., Ltd. (a) | | | 232,000 | | | | 336,918 | |
Fubon Financial Holding Co., Ltd. | | | 679,877 | | | | 677,943 | |
| | | | | | | | |
| | | | | | | 1,014,861 | |
| | | | | | | | |
SEE ACCOMPANYING NOTES TO FINANCIAL STATEMENTS.
| | | | | | | | |
| | | |
| JUNE 30, 2012 | | JF CHINA REGION FUND, INC. | | | | | 11 | |
INVESTMENT PORTFOLIO
AT JUNE 30, 2010 (Unaudited) (continued)
| | | | | | | | |
| DESCRIPTION | | HOLDINGS
(IN SHARES) | | | MARKET
VALUE
(IN US$) | |
COMMON STOCKS — continued | |
Electronic Equipment, Instruments & Components (2.1%) | |
Delta Electronics, Inc. | | | 177,000 | | | | 538,374 | |
Hon Hai Precision Industry Co., Ltd. | | | 299,000 | | | | 894,449 | |
TPK Holding Co., Ltd. | | | 36,349 | | | | 454,894 | |
| | | | | | | | |
| | | | | | | 1,887,717 | |
| | | | | | | | |
Food & Staples Retailing (0.6%) | |
President Chain Store Corp. | | | 108,000 | | | | 572,796 | |
| | | | | | | | |
Food Products (1.3%) | | | | | | | | |
Uni-President Enterprises Corp. | | | 735,000 | | | | 1,170,687 | |
| | | | | | | | |
Internet Software & Services (0.3%) | |
PChome Online, Inc. | | | 45,000 | | | | 252,970 | |
| | | | | | | | |
Leisure Equipment & Products (0.3%) | |
Johnson Health Tech Co., Ltd. | | | 119,000 | | | | 283,912 | |
| | | | | | | | |
Real Estate Management & Development (1.1%) | |
Huaku Development Co., Ltd. (a) | | | 149,370 | | | | 361,367 | |
Prince Housing & Development Corp. | | | 842,700 | | | | 563,962 | |
| | | | | | | | |
| | | | | | | 925,329 | |
| | | | | | | | |
Semiconductors & Semiconductor Equipment (9.1%) | |
Advanced Semiconductor Engineering, Inc. | | | 1,479,640 | | | | 1,210,547 | |
MediaTek, Inc. | | | 100,000 | | | | 913,502 | |
MStar Semiconductor, Inc. | | | 56,000 | | | | 372,896 | |
Taiwan Semiconductor Manufacturing Co., Ltd. (a) | | | 2,013,057 | | | | 5,476,377 | |
| | | | | | | | |
| | | | | | | 7,973,322 | |
| | | | | | | | |
Textiles, Apparel & Luxury Goods (0.4%) | |
Pou Chen Corp. | | | 406,000 | | | | 345,749 | |
| | | | | | | | |
TOTAL TAIWAN | | | | | | | 19,646,530 | |
| | | | | | | | |
TOTAL INVESTMENTS
(99.4% of Net Assets)
(Cost $83,529,220) | | | | | | | 87,057,606 | |
| | | | | | | | |
Other assets in excess of liabilities
(0.6% of Net Assets) | | | | 565,067 | |
| | | | | | | | |
NET ASSETS (100.0%) | | | | | | | 87,622,673 | |
| | | | | | | | |
| | | | |
As of June 30, 2012, aggregate cost for Federal income tax purposes was $83,529,220. The aggregate unrealized gain for all securities is as follows | |
Excess of market value over cost | | | 9,121,139 | |
Excess of cost over market value | | | (5,592,753 | ) |
| | | | |
Net unrealized gain | | | 3,528,386 | |
| | | | |
NOTES TO PORTFOLIO INVESTMENTS:
| ADR – | American Depositary Receipt |
| (a) | Non-income producing security |
| A | China A shares (See Note 7.iii.) |
SEE ACCOMPANYING NOTES TO FINANCIAL STATEMENTS.
| | | | | | |
| | | |
| 12 | | | | JF CHINA REGION FUND, INC. | | JUNE 30, 2012 |
STATEMENT OF ASSETS AND LIABILITIES
AT JUNE 30, 2012 (Unaudited)
| | | | |
| | | (in US$) | |
ASSETS: | | | | |
Investments in non-affiliates, at value (cost $83,529,220) | | | 87,057,606 | |
Cash (including foreign currencies with a cost of $367,348 and value of $367,483) | | | 503,977 | |
Deposits at broker (See Note 7.iii.) | | | 27,714 | |
Receivable for securities sold | | | 441,252 | |
Dividends receivable | | | 570,651 | |
| | | | |
Total Assets | | | 88,601,200 | |
| | | | |
| |
LIABILITIES: | | | | |
Payables | | | | |
Payable for securities purchased | | | 442,092 | |
Accrued liabilities | | | | |
Investment advisory fees | | | 182,597 | |
Directors' fees and expenses | | | 93,319 | |
Custodian and accounting fees | | | 54,355 | |
Administration fees | | | 34,012 | |
Deferred China capital gains tax | | | 139,686 | |
Other | | | 32,466 | |
| | | | |
Total Liabilities | | | 978,527 | |
| | | | |
Net Assets | | | 87,622,673 | |
| | | | |
| |
| Net assets consist of: | | | | |
Common stock, $0.01 par value
(100,000,000 shares authorized; 6,447,637 shares issued and outstanding) | | | 64,476 | |
Paid-in capital | | | 98,994,145 | |
Undistributed net investment income | | | 978,694 | |
Accumulated realized loss on investments and foreign currency transactions | | | (15,854,715 | ) |
Accumulated net unrealized appreciation on investments, foreign currency holdings, and other
assets and liabilities denominated in foreign currencies | | | 3,440,073 | |
| | | | |
Net Assets | | | 87,622,673 | |
| | | | |
Net Asset Value Per Share ($87,622,673 ÷ 6,447,637) | | | 13.59 | |
| | | | |
SEE ACCOMPANYING NOTES TO FINANCIAL STATEMENTS.
| | | | | | | | |
| | | |
| JUNE 30, 2012 | | JF CHINA REGION FUND, INC. | | | | | 13 | |
STATEMENT OF OPERATIONS
FOR THE SIX MONTHS ENDED JUNE 30, 2012 (Unaudited)
| | | | |
| | | (in US$) | |
INVESTMENT INCOME: | | | | |
Dividends from non-affiliates (net of foreign withholding tax of $87,378) | | | 1,298,197 | |
| | | | |
Total Investment Income | | | 1,298,197 | |
| | | | |
| |
EXPENSES: | | | | |
Investment advisory fees | | | 437,059 | |
Directors’ fees and expenses | | | 140,474 | |
Legal fees | | | 73,892 | |
Custodian and accounting fees | | | 66,956 | |
Administration fees | | | 43,631 | |
Audit fees | | | 30,914 | |
Interest expense | | | 26,414 | |
Insurance fees | | | 22,271 | |
NYSE listing fee | | | 12,407 | |
Shareholder service fees | | | 12,305 | |
Shareholder report fees | | | 11,674 | |
Lending facility arrangement fee | | | 9,000 | |
| | | | |
Total Expenses | | | 886,997 | |
| | | | |
Net Investment Income | | | 411,200 | |
| | | | |
| |
REALIZED AND UNREALIZED GAIN (LOSS) ON INVESTMENTS, FOREIGN CURRENCY
HOLDINGS AND OTHER ASSETS AND LIABILITIES DENOMINATED IN FOREIGN CURRENCIES: | | | | |
Net realized gain (loss) | | | | |
Investments in non-affiliates (net of China tax of $38,114 on realized gain) | | | (218,105 | ) |
Foreign currency transactions | | | (15,697 | ) |
| | | | |
Net realized gain (loss) | | | (233,802 | ) |
| | | | |
Net change in unrealized appreciation/depreciation | | | | |
Investments in non-affiliates (net of China tax of $89,118 on unrealized appreciation) | | | 4,190,336 | |
Investments in affiliates | | | 1,029,651 | |
Foreign currency translations | | | (1,190 | ) |
| | | | |
Change in net unrealized appreciation/depreciation | | | 5,218,797 | |
| | | | |
Net realized and unrealized gain on investments, foreign currency holdings and other assets
and liabilities denominated in foreign currencies | | | 4,984,995 | |
| | | | |
Net increase in net assets resulting from operations | | | 5,396,195 | |
| | | | |
SEE ACCOMPANYING NOTES TO FINANCIAL STATEMENTS.
| | | | | | |
| | | |
| 14 | | | | JF CHINA REGION FUND, INC. | | JUNE 30, 2012 |
STATEMENT OF CHANGES IN NET ASSETS
FOR THE PERIODS INDICATED
| | | | | | | | |
| | | Six Months Ended
June 30, 2012
(Unaudited)
(in US$) | | | Year Ended
December 31, 2011
(in US$) | |
INCREASE IN NET ASSETS: | | | | | | | | |
Operations | | | | | | | | |
Net investment income | | | 411,200 | | | | 886,463 | |
Net realized gain (loss) on investment transactions | | | (233,802 | ) | | | (2,656,679 | ) |
Net change in unrealized appreciation (depreciation) on investments,
foreign currency holdings and other assets and liabilities denominated
in foreign currencies | | | 5,218,797 | | | | (27,593,792 | ) |
| | | | | | | | |
Net increase (decrease) in net assets resulting from operations | | | 5,396,195 | | | | (29,364,008 | ) |
| | | | | | | | |
| | |
DISTRIBUTIONS TO STOCKHOLDERS: | | | | | | | | |
Net investment income | | | — | | | | (658,304 | ) |
| | | | | | | | |
Total distributions to shareholders | | | — | | | | (658,304 | ) |
| | | | | | | | |
Total increase (decrease) in net assets | | | 5,396,195 | | | | (30,022,312 | ) |
| | | | | | | | |
| | |
NET ASSETS: | | | | | | | | |
Beginning of period | | | 82,226,478 | | | | 112,248,790 | |
| | | | | | | | |
End of period (including undistributed net investment income of $978,694
and $567,494, respectively) | | | 87,622,673 | | | | 82,226,478 | |
| | | | | | | | |
| | |
SHARE TRANSACTIONS | | | | | | | | |
Opening number of shares | | | 6,447,637 | | | | 6,447,637 | |
| | | | | | | | |
Closing number of shares | | | 6,447,637 | | | | 6,447,637 | |
| | | | | | | | |
SEE ACCOMPANYING NOTES TO FINANCIAL STATEMENTS.
| | | | | | | | |
| | | |
| JUNE 30, 2012 | | JF CHINA REGION FUND, INC. | | | | | 15 | |
FINANCIAL HIGHLIGHTS
FOR THE PERIODS INDICATED
| | | | | | | | | | | | | | | | | | | | | | | | |
| | | For the
Six Months
Ended
June 30,
2012
(Unaudited)
(in US$) | | | For the
Year Ended
December 31,
2011
(in US$) | | | For the
Year Ended
December 31,
2010
(in US$) | | | For the
Year Ended
December 31,
2009
(in US$) | | | For the
Year Ended
December 31,
2008
(in US$) | | | For the
Year Ended
December 31,
2007
(in US$) | |
For a share outstanding throughout each year: | | | | | | | | | | | | | | | | | | | | | | | | |
Net asset value, beginning of period | | | 12.75 | | | | 17.41 | | | | 15.27 | | | | 9.50 | | | | 30.24 | | | | 22.82 | |
| | | | | | | | | | | | | | | | | | | | | | | | |
Net investment income | | | 0.06 | | | | 0.14 | | | | 0.05 | | | | 0.02 | | | | 0.32 | | | | 0.11 | |
Net realized and unrealized gain (loss) | | | 0.78 | | | | (4.70 | ) | | | 2.11 | | | | 5.81 | | | | (16.36 | ) | | | 12.54 | |
| | | | | | | | | | | | | | | | | | | | | | | | |
Total from investment operations | | | 0.84 | | | | (4.56 | ) | | | 2.16 | | | | 5.83 | | | | (16.04 | ) | | | 12.65 | |
| | | | | | | | | | | | | | | | | | | | | | | | |
Dividends from net investment income | | | — | | | | (0.10 | ) | | | (0.02 | ) | | | (0.06 | ) | | | (0.01 | ) | | | (1.25 | ) |
| | | | | | | | | | | | | | | | | | | | | | | | |
Distributions from net realized gains | | | — | | | | — | | | | — | | | | — | | | | (4.69 | ) | | | (3.98 | ) |
| | | | | | | | | | | | | | | | | | | | | | | | |
Total distributions | | | — | | | | (0.10 | ) | | | (0.02 | ) | | | (0.06 | ) | | | (4.70 | ) | | | (5.23 | ) |
| | | | | | | | | | | | | | | | | | | | | | | | |
Net asset value, end of period | | | 13.59 | | | | 12.75 | | | | 17.41 | | | | 15.27 | | | | 9.50 | | | | 30.24 | |
| | | | | | | | | | | | | | | | | | | | | | | | |
Market value, end of period | | | 12.11 | | | | 11.02 | | | | 15.79 | | | | 13.78 | | | | 8.77 | | | | 25.47 | |
| | | | | | | | | | | | | | | | | | | | | | | | |
Total Investment Return | | | | | | | | | | | | | | | | | | | | | | | | |
Per share market value * | | | 9.9 | % | | | (29.6 | %) | | | 14.7 | % | | | 57.8 | % | | | (45.6 | %) | | | 35.0 | % |
| | | | | | |
RATIOS/SUPPLEMENTAL DATA | | | | | | | | | | | | | | | | | | | | | | | | |
Net assets, end of period | | | 87,622,673 | | | | 82,226,478 | | | | 112,248,790 | | | | 98,457,230 | | | | 61,256,551 | | | | 138,632,521 | |
Ratios of total expenses to average net assets | | | 1.96 | %** | | | 1.89 | % | | | 1.99 | % | | | 2.12 | % | | | 1.92 | % | | | 1.54 | % |
Ratios of total expenses to average net assets, excluding interest expense | | | 1.93 | %** | | | 1.89 | % | | | 1.99 | % | | | 2.12 | % | | | 1.92 | % | | | 1.54 | % |
Ratios of net investment income to average net assets | | | 0.91 | %** | | | 0.87 | % | | | 0.32 | % | | | 0.19 | % | | | 0.98 | % | | | 0.39 | % |
Portfolio turnover rate | | | 51.0 | % | | | 66.8 | % | | | 76.1 | % | | | 101.0 | % | | | 114.8 | % | | | 118.8 | % |
Number of shares outstanding at end of period (in thousands) | | | 6,448 | | | | 6,448 | | | | 6,448 | | | | 6,448 | | | | 6,448 | | | | 4,585 | |
| * | Total investment return is calculated assuming a purchase of common stock at the current market price on the first day of each period reported and a sale at the current market price on the day of each period reported. The total investment return excludes the effect of commissions. Dividends and distributions, if any, are assumed for the purpose of this calculation to be reinvested at prices obtained under the Fund's dividend reinvestment plan or if specified in accordance with the terms of the distribution. |
SEE ACCOMPANYING NOTES TO FINANCIAL STATEMENTS.
| | | | | | |
| | | |
| 16 | | | | JF CHINA REGION FUND, INC. | | JUNE 30, 2012 |
NOTES TO FINANCIAL STATEMENTS
AT JUNE 30, 2012 (Unaudited)
1. Organization and Capital
JF China Region Fund, Inc. (the ‘Fund’) was incorporated in the State of Maryland on May 22, 1992, and is registered as a non-diversified, closed-end management investment company under the Investment Company Act of 1940 (‘1940 Act’). The Fund commenced operations on July 16, 1992.
The Fund seeks to achieve long-term capital appreciation through investments primarily in equity securities of companies with substantial assets in, or revenues derived from, the People’s Republic of China (‘China’), Hong Kong, Taiwan and Macau — collectively, the ‘China Region’.
2. Significant Accounting Policies
The following significant accounting policies, which are in conformity with accounting principles generally accepted in the United States of America (‘GAAP’), are consistently followed by the Fund in the preparation of its financial statements.
The preparation of financial statements in conformity with GAAP requires management to make estimates and assumptions that affect the reported amounts of assets and liabilities and disclosure of contingent assets and liabilities at the date of the financial statements and the reported amounts of increases and decreases in net assets from operations during the reported period. Actual results could differ from these estimates.
i) Security Valuation — All securities for which market quotations are readily available are valued at the last sales price prior to the time of determination or, if no sales price is available at that time, at the mean between the last current bid and ask prices. Securities that are traded over-the-counter are valued, if bid and ask quotations are available, at the mean between the current bid and ask prices. Certain investments of the Fund may, depending upon market conditions, trade in relatively thin markets and/or in markets that experience significant volatility. As a result of these conditions, the prices used by the Fund to value securities may differ from the value that would be realized if these securities were sold and the differences could be material. All other securities and assets are valued at fair value as determined in good faith by the Board of Directors. It is possible that the estimated values may differ significantly from the values that would have been used had a ready market for the investments existed, and such differences could be material. In valuing the Fund’s assets, quotations of foreign securities in a foreign currency are translated to United States (‘U.S.’) dollar equivalents at the prevailing exchange rate in effect on the valuation date. Investments in open ended mutual funds are valued at current day’s closing net asset value per share, with the exception of the JF China Pioneer A-Share Fund, which is valued at the current day’s closing bid price.
Valuations reflected in this report are as of the report date. As a result, changes in valuation due to market events and/or issuer related events after the report date and prior to issuance of the report are not reflected herein.
The various inputs that are used in determining the fair value of the Fund’s investments are summarized into the three broad levels listed below.
| • | | Level 1 — quoted prices in active markets for identical securities |
| • | | Level 2 — other significant observable inputs (including quoted prices for similar securities, interest rates, prepayment speeds, credit risk, etc.) |
| • | | Level 3 — significant unobservable inputs (including the Fund’s own assumptions in determining the fair value of investments) |
A financial instrument’s level within the fair value hierarchy is based on the lowest level of any input both individually and in aggregate that is significant to the fair value measurement. The inputs or methodology used for valuing securities are not necessarily an indication of the risk associated with investing in those securities.
| | | | | | | | |
| | | |
| JUNE 30, 2012 | | JF CHINA REGION FUND, INC. | | | | | 17 | |
NOTES TO FINANCIAL STATEMENTS
AT JUNE 30, 2010 (Unaudited) (continued)
The following table represents each valuation input as presented on the Investment Portfolio:
| | | | | | | | | | | | | | | | |
| | | Level 1
Quoted prices | | | Level 2
Other significant
observable inputs | | | Level 3
Significant
unobservable inputs | | | Total | |
Total Investment in Securities (a) | | $ | 87,057,606 | | | $ | — | | | $ | — | | | $ | 87,057,606 | |
| | | | | | | | | | | | | | | | |
| (a) | | All portfolio holdings designated as Level 1 are disclosed individually in the Investment Portfolio. |
There were no transfers between Levels 1 and 2 during the six months ended June 30, 2012.
ii) Foreign Currency Translation — The books and records of the Fund are maintained in U.S. dollars. Foreign currency amounts are translated into U.S. dollars at the mid-market price of such currencies against U.S. dollars as follows:
| • | | investments, other assets, and liabilities at the prevailing rates of exchange on the valuation date; |
| • | | investment transactions and investment income at the prevailing rates of exchange on the dates of such transactions. |
Although the net assets of the Fund are presented at the foreign exchange rates and market values at the close of the period, the Fund does not isolate that portion of the results of operations arising as a result of changes in the foreign exchange rates from the fluctuations arising from changes in the market prices of the securities held or sold during the period. Similarly, the Fund does not isolate the effect of changes in foreign exchange rates from the fluctuations arising from changes in the market prices of securities sold during the period. Accordingly, realized and unrealized foreign currency gains (losses) are included in the reported net realized and unrealized gains (losses) on investments.
Unrealized currency gains (losses) resulting from valuing foreign currency denominated assets and liabilities at period-end exchange rates are reflected as a component of accumulated net unrealized gain (loss) on investments, foreign currency holdings, and other assets and liabilities denominated in foreign currencies.
iii) Restricted and Illiquid Securities — Certain securities held by the Fund may be subject to legal or contractual restrictions on resale or are illiquid. Restricted securities generally may be resold in transactions exempt from registration under the Securities Act of 1933. An illiquid security is a security which cannot be disposed of promptly (within seven days) and in the usual course of business at approximately its fair value and includes, but is not limited to, repurchase agreements maturing in excess of seven days, time deposits with a withdrawal penalty, non-negotiable instruments and instruments for which no market exists. Disposal of these securities may involve time-consuming negotiations and expense. Prompt sale at the current valuation may be difficult and could adversely affect the net assets of the Fund.
iv) Distribution of Income and Gains — The Fund intends to distribute to stockholders, at least annually, substantially all of its net investment income and expects to distribute annually any net long-term capital gains in excess of net short-term capital losses. An additional distribution may be made to the extent necessary to avoid the payment of a 4% Federal excise tax.
Income and capital gain distributions are determined in accordance with Federal income tax regulations and may differ from those determined in accordance with GAAP.
v) Other — Security transactions are accounted for on trade date. Realized gains and losses on the sale of investment securities are determined on the identified cost basis. Interest income is recognized on the accrual basis. Dividend income and distributions to shareholders are recorded on the ex-dividend date or when the Fund first learns of the dividend.
vi) Foreign Taxes — The Fund may be subject to foreign taxes on income, gains on investments or currency purchases/repatriation, a portion of which may be recoverable. The Fund will accrue such taxes and recoveries as applicable, based upon its current interpretation of tax rules and regulations that exist in the markets in which it invests.
| | | | | | |
| | | |
| 18 | | | | JF CHINA REGION FUND, INC. | | JUNE 30, 2012 |
NOTES TO FINANCIAL STATEMENTS
AT JUNE 30, 2010 (Unaudited) (continued)
| * | At the Fund’s Annual Stockholders meeting on May 10, 2012, Shareholders voted in favor of an amendment to the Investment Advisory and Management Agreement to provide that fees paid under the Investment Advisory Agreement will be based on all gross managed assets (previously net assets). |
Unless indicated in the Portfolio, all Chinese stocks held are traded in Hong Kong.
3. Investment Transactions
During the six months ended June 30, 2012, the Fund made purchases of $46,066,945 and sales of $45,567,487 of investment securities other than short-term investments. There were no purchases or sales of U.S. Government securities.
4. Related party, Other Service Provider Transactions and Directors
i) JF International Management Inc. (the Investment ‘Advisor’), an indirect wholly-owned subsidiary of JPMorgan Chase & Co. (“JPMorgan”) provides investment advisory services to the Fund under the terms of an investment advisory agreement. The Advisor is paid a fee, computed weekly and payable monthly, at the annual rate of 1.00% of the Fund’s weekly managed gross assets*. Investments in funds on which the Advisor or its affiliates charges a management fee are excluded from the calculation. The Investment Advisor has agreed to waive its entitlement to a management fee on any cash held when borrowings are drawn under a borrowing facility.
ii) During the six months ended June 30, 2012, the Fund did not pay any brokerage commissions to JPMorgan Chase Group companies or affiliated brokers/dealers.
iii) Other Service Providers — Pursuant to an Administration Agreement, JPMorgan Chase Bank, N.A. (“JPMCB”), a wholly-owned subsidiary of JPMorgan, and successor in interest to JPMorgan Investor Services, Co. (the “Administrator”), provides certain administration services to the Fund. The Fund pays an annual administration fee of $43,631 in respect of tax, compliance, financial reporting and regulatory services.
JPMCB provides portfolio custody and accounting services for the Fund. The amounts paid directly to JPMCB by the Fund for custody and accounting services are included in Custodian and accounting fees in the Statement of Operations. In consideration of the accounting services, JPMCB receives a fee computed daily and paid monthly at the annual rate of 0.02% of the first $12.5 billion of the average daily net assets of all funds in the JPMorgan International Fund Complex and 0.0175% of the average daily net assets in excess of $12.5 billion of all such funds subject to a minimum annual fee of $35,000. The custodian fees are split between safekeeping and transaction changes and vary by market.
iv) Directors — The Fund pays each of its Directors who is not a director, officer or employee of the Advisor, Administrator or any affiliate thereof, an annual fee of $22,000, the Audit Committee Chairman $26,000 and the Chairman $32,000 plus a $3,000 attendance fee for each Board meeting, Management Engagement Committee meeting and Audit Committee meeting attended. In addition, the Fund reimburses all Directors for travel and out-of-pocket expenses incurred in connection with Board of Directors meetings. Under normal circumstances, in order to minimize expenses, the Board expects to hold two meetings a year by telephone.
v) As of June 30, 2012, the Fund had two shareholders who held more than 5% of the Fund’s outstanding shares.
5. Capital Share Transactions
On September 15, 2011, the Board of Directors renewed an authority for the Fund to purchase shares of its common stock from Fund stockholders, as described below. When shares trade at a discount to net asset value, any purchase of shares by the Fund has the effect of increasing the net asset value per share of the Fund’s remaining shares outstanding. All shares purchased by the Fund are thereafter considered authorized and unissued.
| | | | | | | | |
| | | |
| JUNE 30, 2012 | | JF CHINA REGION FUND, INC. | | | | | 19 | |
NOTES TO FINANCIAL STATEMENTS
AT JUNE 30, 2010 (Unaudited) (continued)
i) Share Repurchase Program — The Fund was authorized to repurchase up to 644,764 shares (10% of its then issued and outstanding shares) in the open market through September 5, 2012. Repurchases can be made only when the Fund’s shares are trading at less than net asset value and at such times and amounts as it is believed to be in the best interest of the Fund’s stockholders.
During the six months ended June 30, 2012 and the year ended December 31, 2011, the Fund did not repurchase any shares under the share repurchase program.
6. Borrowings
On February 27, 2012, the Fund entered into a financing arrangement with Scotiabank (Ireland) Ltd (the ‘Lender’). Under this arrangement, the Lender provides a secured, committed credit facility in the aggregate amount of $17.5 million to the Fund. Interest on borrowings, if any, will be payable at 1.20% plus the London Interbank Offered Rate (‘LIBOR’). Interest on undrawn borrowings will be payable at 0.25% if the undrawn borrowings are equal to or less than 50% of the committed amount and 0.35% if the undrawn borrowings are greater than 50% of the committed amount. This agreement is in effect until at least February 25, 2013, with the option to extend the agreement, under amended terms, by a further 364 day period. The credit agreement governing the credit facility includes usual and customary covenants for this type of transaction.
The Fund had no borrowings outstanding from the secured, committed credit facility at June 30, 2012. Average borrowings from the credit facility for the year ended June 30, 2012, were as follows:
| | | | | | | | | | | | |
| | | Average
Borrowings | | | Number of
Days Outstanding | | | Interest
Paid | |
| | $ | 17,500,000 | | | | 30 | | | $ | 26,414 | |
7. Risks and Uncertainties
i) China Region — Investing in securities of “China Region companies” may include certain risks and considerations not typically associated with investing in U.S. securities. In general, China Region companies are those that are organized under the laws of, or have a principal office in, China, Hong Kong, Taiwan and Macau; the principal securities market for which is China or Taiwan; that derives at least 50% of its total revenues or profits from goods or services that are produced or sold, investments made, or services performed in China or Taiwan; or at least 50% of the assets of which are located in China or Taiwan. Such risks include fluctuating currency values and changing local and regional economic, political and social conditions, which may result in greater market volatility. In addition, these securities may not be as liquid as U.S. securities. At June 30, 2012, the Fund had 50.4%, 26.6% and 22.4%, based on total net assets, of its total investments invested in China, Hong Kong and Taiwan, respectively.
ii) Foreign Transactions — Foreign security and currency transactions may involve certain considerations and risks not typically associated with those of U.S. dollar denominated transactions as a result of, among other factors, the level of governmental supervision and regulation of foreign securities markets and the possibility of political or economic instability.
iii) Direct Investments in China A-Share Securities — The China Securities Regulatory Commission (“CSRC”) may grant qualified foreign institutional investor (“QFII”) licenses, which allow foreign investments in A-shares on the Shanghai and Shenzhen Stock Exchanges and certain other securities historically not eligible for investment by non-Chinese investors. Each QFII is authorized to invest in China A-shares only up to a specified quota established by the Chinese State Administration of Foreign Exchange (“SAFE”). JF Asset Management Limited has received a QFII license permitting it to invest a specific portion of the assets of certain funds (which may include the Fund) in local Chinese securities. Although the laws of China permit the use of nominee accounts for clients of QFIIs, the Chinese regulators require the general securities trading and settlement accounts to be maintained in the name of the QFII. As the Fund is permitted to invest in China
| | | | | | |
| | | |
| 20 | | | | JF CHINA REGION FUND, INC. | | JUNE 30, 2012 |
NOTES TO FINANCIAL STATEMENTS
AT JUNE 30, 2010 (Unaudited) (continued)
A-Shares, the Fund’s local custodian bank maintains a specific sub-account for the A-share investments in the name of the Fund. However, there is a risk that creditors of the QFII and its affiliates (each, a “JP Morgan Affiliate”) may assert that a JP Morgan Affiliate, and not the Fund, has recourse against the securities and other assets in the account and/or sub-accounts. If a court upholds such an assertion, creditors of a JP Morgan Affiliate could seek payment from the Fund’s A-share investments.
Additional risks for the Fund’s A-share investments include a potential lack of liquidity, greater price volatility, and restrictions on the repatriation of invested capital. Because of low trading volume and various restrictions on the free flow of capital into the A-share market, the China A-share market could be less liquid and trading prices of A-shares could be more volatile than other local securities markets. In addition, net realized profits on fund investments in A-shares may only be repatriated under certain conditions and upon the approval of SAFE. Rules regarding taxation of investments in mainland China are unsettled and may be subject to change. Changes in the taxation of A-Shares could materially affect the Fund’s performance.
iv) Other — In the normal course of business, the Fund may enter into contracts that provide general indemnifications. The maximum exposure under these arrangements is dependent on future claims that may be made against the Fund and, therefore, cannot be estimated; however, based on experience, the risk of any loss from such claims is considered remote.
8. Tax Status
U.S. Federal Income Taxes — No provision for federal income taxes is required since the Fund intends to continue to qualify as a regulated investment company under subchapter M of the Internal Revenue Code and distribute substantially all of its taxable income. The Fund is not aware of any tax positions for which it is reasonably possible that the total amounts of unrecognized tax benefits or losses will significantly change in the next twelve months. However, the Fund’s conclusions may be subject to future review based on changes in, or the interpretation of, the accounting standards or tax laws and regulations. The Fund’s Federal tax returns for the prior three fiscal years remain subject to examination by the Internal Revenue Service.
Under the Regulated Investment Company Modernization Act of 2010 (the “Act”), net capital losses recognized by the Fund after December 31, 2010, may get carried forward indefinitely, and retain their character as short-term and/or long term losses. Prior to the Act, pre-enactment net capital losses incurred by the Fund were carried forward for eight years and treated as short-term losses. The Act requires that post-enactment net capital losses be used before pre-enactment net capital losses.
At December 31, 2011, the Fund had post-enactment net capital loss carryforwards of $1,246,035 related to short-term losses.
At December 31, 2011, the Fund had pre-enactment net capital loss carryforwards of $10,450,827, expiring during 2017, which are available to offset future realized gains.
| | | | | | | | |
| | | |
| JUNE 30, 2012 | | JF CHINA REGION FUND, INC. | | | | | 21 | |
RESULTS OF THE ANNUAL STOCKHOLDERS‘ MEETING
The Fund held its annual stockholders’ meeting on May 10, 2012. At this meeting, stockholders elected The Rt. Hon. The Earl of Cromer and Simon J. Crinage to the Fund’s Board of Directors and approved an amendment to the Fund’s Investment Advisory and Management Agreement, the results of which are set out below.
I) Election of Directors
| | | | | | | | | | | | | | | | | | | | |
| Nominees | | Votes For | | | Votes Against | | | Votes Withheld | | | Shares Not
Voted | | | Total Voting Shares | |
| The Rt. Hon. The Earl of Cromer | | | 4,769,518 | | | | — | | | | 409,662 | | | | 1,268,457 | | | | 6,447,637 | |
| Simon J. Crinage | | | 4,768,821 | | | | — | | | | 410,359 | | | | 1,268,457 | | | | 6,447,637 | |
|
| II) Amendments to the Fund’s Investment Policies | |
| | | Votes For | | | Votes Against | | | Votes Withheld | | | Shares Not
Voted | | | Total Voting Shares | |
Amendments to
the Fund’s
Investment Advisory
and Management Agreement | | | 4,100,373 | | | | 273,784 | | | | 13,094 | | | | 2,060,386 | | | | 6,447,637 | |
OTHER INFORMATION
Fundamental Investment Restriction on Borrowing
On May 12, 2011, shareholders of the Fund approved a change to the Fund’s fundamental investment restrictions to permit, inter alia, the Fund to borrow up to 20% of its net assets for investment purposes.
This change is intended to give the Investment Advisor flexibility to take advantage of additional investment opportunities when it believes that the return from the additional investment would exceed the cost of borrowing. If the Fund borrows money, it may be exposed to additional risks. If the return on securities purchased with borrowed funds is less than the borrowing costs of those funds, then the use of borrowing will detract from Fund performance. In particular, borrowing will magnify losses in times of negative performance. Nonetheless, the Investment Advisor may maintain leverage if it expects that the long-term benefits to investors of maintaining leverage outweigh any current reduced return. Borrowing may also increase the Fund’s interest and other expenses. Finally, the use of borrowing would subject the Fund to additional restrictions imposed by lenders and the Investment Company Act of 1940 on the Fund’s investments.
The Investment Advisor will utilize borrowed monies at its discretion and under the supervision of the Board. The Investment Advisor has agreed to waive any entitlement to a management fee on any cash held when borrowings are drawn under a borrowing facility.
The entire text of the Fund’s fundamental investment restriction on borrowing is as follows:
“Under its fundamental investment restrictions, the Fund may not: Issue senior securities, borrow or pledge its assets, except that the Fund may (i) borrow from a bank for the purpose of obtaining amounts necessary to make distributions for qualification as a registered investment company to avoid imposition of an excise tax under United States tax law; and (ii) borrow money (including through reverse repurchase agreements) up to the maximum amount permitted under the Investment Company Act of 1940 (a) for temporary or emergency purposes, (b) for such short-term credits as may be necessary for the clearance or settlement of transactions, (c) for repurchases of its Common Stock and (d) for investment purposes, provided that amounts borrowed under this clause shall not exceed 20% on the net assets of the Fund. The Fund may also pledge its assets to secure such borrowings. Notwithstanding the
| | | | | | |
| | | |
| 22 | | | | JF CHINA REGION FUND, INC. | | JUNE 30, 2012 |
above, initial and variation margin in respect of futures contracts and options thereon and any collateral arrangement in respect of options on securities or indexes will not be prohibited by this paragraph 3 or any other investment restrictions.”
Information About Portfolio Holdings
The Fund files its complete schedule of portfolio holdings with the U.S. Securities and Exchange Commission (the ‘Commission’) for the first and third quarters of each fiscal year on Form N-Q. The Fund’s Forms N-Q are available on the Commission’s website at http://www.sec.gov and may be reviewed and copied at the Commission’s Public Reference Room in Washington, DC. Information on the operation of the Public Reference Room may be obtained by calling 1-800-SEC-0330. The Fund’s Forms N-Q are also available on the Fund’s website at www.jfchinaregion.com.
Proxy Voting Policies and Procedures and Proxy Voting Record
A description of the policies and procedures that are used by the Fund’s investment advisor to vote proxies relating
to the Fund’s portfolio securities is available (1) without charge, upon request, by calling +44 20 7742 3477; and (2) as an exhibit to the Fund’s annual report on Form N-CSR which is available on the website of the Securities and Exchange Commission (the “Commission”) at http://www.sec.gov. Information regarding how the investment adviser votes these proxies is now available by calling the same number and on the Commission’s website. The Fund has filed its report on Form N-PX covering the Fund’s proxy voting record for the 12 month period ended June 30, 2012.
Certifications
Simon J. Crinage, as the Fund’s President, has certified to the New York Stock Exchange that, as of June 11, 2012, he was not aware of any violation by the Fund of applicable NYSE corporate governance listing standards. The Fund’s reports to the Commission on Forms N-CSR and N-CSRS contain certifications by the Fund’s principal executive officer and principal financial officer that relate to the Fund’s disclosure in such reports and that are required by Rule 30a-2(a) under the 1940 Act.
| | | | | | | | |
| | | |
| JUNE 30, 2012 | | JF CHINA REGION FUND, INC. | | | | | 23 | |
FUND MANAGEMENT
Information pertaining to the Directors and officers of the Fund is set forth below.
| | | | | | | | |
Name, (DOB), Address and
Position(s) with Fund | | Term of
Office and
Length of
Time Served | | Principal Occupation(s) During
Past 5 Years | | Number of
Portfolios in
Fund Complex
Overseen by
Director* | | Other Trusteeships/
Directorships Held by Director |
Independent Directors | | | | |
| | | | |
| The Rt. Hon. The Earl of Cromer (June 3, 1946) Finsbury Dials 20 Finsbury Street London, EC2Y 9AQ United Kingdom Chairman and Class I Director | | Three year term ends in 2015; Chairman and Director since 1994. | | Chairman of the Board of the Fund; Chairman of the Board, Western Provident Association (insurance), LG India Plus Fund Ltd (financial), Pedder Street Asia Absolute Return Fund Limited (financial); LG Asia Plus Fund Limited (financial); Director, Cheetah Korea Value Fund Ltd (financial) and Chief Executive Officer, Cromer Associates Limited (family business). | | 1 | | See Principal Occupation. |
| | | | |
| Alexander Reid Hamilton (October 4, 1941) P.O. Box 12343 General Post Office Hong Kong Class II Director | | Three year term ends in 2013; Director since 1994. | | Director of Citic Pacific Limited (infrastructure), Cosco International Holdings Limited (shipping), Esprit Holdings Limited (clothing retail), Shangri-La Asia Limited (hotels) and Octopus Cards Limited (financial services). Former Director of China Cosco Holdings Co. Limited (shipping). | | 1 | | See Principal Occupation. |
| | | | |
| Julian M. I. Reid (August 7, 1944) Finsbury Dials, 20 Finsbury Street London, EC2Y 9AQ United Kingdom Class III Director | | Three year term ends in 2014; Director since 1998. | | Chief Executive Officer of 3a Funds Group (financial); Director and Chairman of Morgan’s Walk Properties Limited (property); Director and Chairman of The Korea Fund, Inc. (financial); Director and Chairman of Prosperity Voskhod Fund (financial); Director and Chairman of ASA Limited (financial) and Director of 3a Global Growth Fund Limited (financial). | | 1 | | See Principal Occupation. |
| | | | | | |
| | | |
| 24 | | | | JF CHINA REGION FUND, INC. | | JUNE 30, 2012 |
| | | | | | | | |
Name, (DOB), Address and
Position(s) with Fund | | Term of
Office and
Length of
Time Served | | Principal Occupation(s) During
Past 5 Years | | Number of
Portfolios in
Fund Complex
Overseen by
Director* | | Other Trusteeships/
Directorships Held by Director |
Independent Directors (continued) | | | | |
| | | | |
John R. Rettberg (September 1, 1937) 1 Beacon St. Boston, MA 02108
USA
Class II Director | | Term ends in 2013; Director since 2008 | | Former Trustee, JPMorgan Alternative Products mutual fund Board. | | 1 | | None. |
Interested Director & President of the Fund | | | | |
| | | | |
| Simon J. Crinage (May 10, 1965) Finsbury Dials, 20 Finsbury Street London, EC2Y 9AQ United Kingdom Class I Director and President | | Term as Director ends in 2015; Director since May, 2009 & President since 2003 | | Managing Director, J.P. Morgan Asset Management. | | 1 | | None. |
| * | The Fund is the only fund in the Fund Complex. |
| | | | | | | | |
| | | |
| JUNE 30, 2012 | | JF CHINA REGION FUND, INC. | | | | | 25 | |
FUND MANAGEMENT
(continued)
Information pertaining to the officers of the Fund is set forth below.
| | | | |
Name, (DOB), Address and
Position(s) with Fund | | Term of Office and
Length of Time Served | | Principal Occupation(s) During Past 5 Years |
Officers who are not Directors |
| | |
Michael J. James
(May 11, 1967)
8 Connaught Road
Central/Hong Kong
Treasurer | | Since 2006** | | Treasurer of the Fund; Executive Director, J.P. Morgan Asset Management. |
| | |
Christopher D. Legg
(March 12, 1982)
Finsbury Dials,
20 Finsbury Street
London, EC2Y 9AQ
United Kingdom
Secretary | | Since 2008** | | Secretary of the Fund; Associate, J.P. Morgan Asset Management. |
| | |
Muriel Y.K. Sung
(September 25, 1966)
8 Connaught Road
Central/Hong Kong
Chief Compliance Officer | | Since 2004** | | Chief Compliance Officer of the Fund;
Managing Director, J.P. Morgan Asset Management. |
| ** | | The officers of the Fund serve at the discretion of the Board. |
| | | | | | |
| | | |
| 26 | | | | JF CHINA REGION FUND, INC. | | JUNE 30, 2012 |
DIVIDEND REINVESTMENT AND CASH PURCHASE PLAN
(Unaudited)
The Fund operates an optional Dividend Reinvestment and Cash Purchase Plan (the ‘Plan’) whereby:
| | a) | shareholders may elect to receive dividend and capital gain distributions in the form of additional shares of the Fund (the Share Distribution Plan). |
| | b) | shareholders may make optional payments (any amount between $100 and $3,000) which will be used to purchase additional shares in the open market (the Share Purchase Plan). |
For a copy of the Plan brochure, as well as a dividend reinvestment authorization card, please contact the Plan Agent:
Computershare Trust Company, N.A.
P. O. Box 43010
Providence, RI 02940-3010
USA Telephone No.: 800-426-5523 (toll-free)
www.computershare.com
The following should be noted with respect to the Plan:
If you participate in the Share Distribution Plan, whenever the Board of Directors of the Fund declares an income dividend or net capital gain distribution, you will automatically receive your distribution in newly issued shares (cash will be paid in lieu of fractional shares) if the market price of the shares on the date of the distribution is at or above the net asset value of the shares. The number of shares to be issued to you by the Fund will be determined by dividing the amount of the cash distribution to which you are entitled (net of any applicable withholding taxes) by the greater of the net asset value (‘NAV’) per share on such date or 95% of the market price of a share on such date. If the market price of the shares on such a distribution date is below the NAV, the Plan Agent will, as agent for the participants, buy shares on the open market, on the New York Stock Exchange or elsewhere, for
the participant’s account on, or after, the payment date. There is no service charge for purchases under this Plan.
For U.S. federal income tax purposes, shareholders receiving newly issued shares pursuant to the Share Distribution Plan will be treated as receiving income or capital gains in an amount equal to the fair market value (determined as of the distribution date) of the shares received and will have a cost basis equal to such fair market value. Shareholders receiving a distribution in the form of shares purchased in the open market pursuant to the Plan will be treated as receiving a distribution of the cash distribution that such shareholder would have received had the shareholder not elected to have such distribution reinvested and will have a cost basis in such shares equal to the amount of the distribution.
There will be no brokerage charge to participants for shares issued directly by the Fund under the Plan. Each participant will pay a pro rata share of brokerage commissions incurred with respect to the Plan Agent’s open market purchases of shares in connection with the Plan. The Fund will pay the fees of the Plan Agent for handling the Plan.
You may terminate your account under the Share Distribution Plan by notifying the Plan Agent in writing. The Plan may be terminated by the Plan Agent or the Fund with notice to you at least 30 days prior to any record date for the payment of any distribution by the Fund. Upon any termination, the Plan Agent will deliver a certificate or certificates for the full shares held for you under the Plan and a cash adjustment for any fractional shares.
You also have the option of instructing the Plan Agent to make semi-annual cash purchases of shares in the open market. There is a service charge of $1.25 for each purchase under this Share Purchase Plan.
| | | | | | | | |
| | | |
| JUNE 30, 2012 | | JF CHINA REGION FUND, INC. | | | | | 27 | |
DIRECTORS AND ADMINISTRATION
(Unaudited)
| | |
| Officers and Directors | | The Rt. Hon. The Earl of Cromer — Director and Chairman of the Board and Management Engagement Committee Simon J. Crinage — Director and President Alexander R. Hamilton — Director and Chairman of the Audit Committee and Pricing Committee Julian M. I. Reid — Director John R. Rettberg — Director Michael J. James — Treasurer Christopher D. Legg — Secretary Muriel Y.K. Sung — Chief Compliance Officer |
| |
| Investment Advisor | | JF International Management Inc. P.O. Box 3151 Road Town, Tortola British Virgin Islands |
| |
| Administrator | | JPMorgan Chase Bank, N.A. 1 Beacon Street, 18th Floor Boston, Massachusetts 02108 U.S.A. |
| |
| Custodian | | JPMorgan Chase Bank N.A. 1 Beacon Street, 18th Floor Boston, Massachusetts 02108 U.S.A. |
| |
Independent Registered Public
Accounting Firm | | PricewaterhouseCoopers LLP 300 Madison Avenue New York, New York 10017 U.S.A. |
| |
| Legal Counsel | | Dechert LLP New York: 1095 Avenue of the Americas New York, New York 10036 U.S.A. |
| |
| | Hong Kong: 27/F Henley Building 5 Queens Road Central Hong Kong |
| |
| Registrar, Transfer Agent, and Dividend Paying Agent | | Computershare Trust Company, N.A. P. O. Box 43010 Providence, Rhode Island 02940-3010 U.S.A. |
Notice is hereby given in accordance with Section 23(c) of the Investment Company Act of 1940, as amended, that from time to time the Fund may purchase shares of its common stock in the open market.
www.jfchinaregion.com
| | | | | | |
| | | |
| 28 | | | | JF CHINA REGION FUND, INC. | | JUNE 30, 2012 |

This report, including the financial statements herein, is sent to the stockholders of the Fund for their information. It is not a prospectus, circular or representation intended for use in the purchase or sale of shares of the Fund or of any securities mentioned in this report.
© JPMorgan Chase & Co., 2012 All rights reserved. June 30.
ITEM 2. CODE OF ETHICS.
Not required for this filing.
ITEM 3. AUDIT COMMITTEE FINANCIAL EXPERT.
Not required for this filing.
ITEM 4. PRINCIPAL ACCOUNTANT FEES AND SERVICES.
Not required for this filing.
ITEM 5. AUDIT COMMITTEE OF LISTED REGISTRANTS.
Not required for this filing.
ITEM 6. SCHEDULE OF INVESTMENTS
(a) Schedule of Investments is included as part of Item 1.
(b) Not applicable to the Fund.
ITEM 7. DISCLOSURE OF PROXY VOTING POLICIES AND PROCEDURES FOR CLOSED-END MANAGEMENT INVESTMENT COMPANIES.
Not required for this filing.
ITEM 8. PORTFOLIO MANAGERS OF CLOSED-END MANAGEMENT INVESTMENT COMPANIES.
| | (a) | Not applicable to a semiannual report. |
| | (b) | There has been no change, as of the date of this filing, in any of the portfolio managers identified in response to paragraph (a)(1) of this Item in the registrant’s most recently filed annual report on Form N-CSR. |
ITEM 9. PURCHASE OF EQUITY SECURITIES BY CLOSED-END MANAGEMENT INVESTMENT COMPANY AND AFFILIATED PURCHASERS.
Not applicable to the Fund.
ITEM 10. SUBMISSION OF MATTERS TO A VOTE OF SECURITY HOLDERS.
There have been no material changes to the procedures by which the shareholders may recommend nominees to the Fund’s board of directors since the Fund filed its last form N-CSR.
ITEM 11. CONTROLS AND PROCEDURES.
(a) The Fund’s principal executive and principal financial officers have concluded that the Fund’s disclosure controls and procedures (as defined in Rule 30a-3(c) under the Investment Company Act of 1940, as amended (the “1940 Act”) (17 CFR 270.30a-3(c))) are effective, as of a date within 90 days of the filing date of this Form N-CSR based on their evaluation of these controls and procedures required by Rule 30a-3(b) under the 1940 Act (17 CFR 270.30a-3(b)) and Rules 13a-15(b) or 15d-15(b) under the 1934 Act (17 CFR 240.13a-15(b) or 240.15d-15(b)).
(b) There were no changes in the Fund’s internal control over financial reporting (as defined in Rule 30a-3(d) under the 1940 Act (17 CFR 270.30a-3(d))) that occurred during the Fund’s second fiscal quarter that has materially affected, or is reasonably likely to materially affect, the Fund’s internal control over financial reporting.
ITEM 12. EXHIBITS.
(a)(1) Not required for this filing.
(a)(2) Certifications pursuant to Rule 30a-2(a) under the Investment Company Act of 1940.
(a)(3) Not required for this filing.
(a)(4) Not required for this filing.
(b) The certifications required by Rule 30a-2(b) of the 1940 Act and Section 906 of the Sarbanes-Oxley Act of 2002 are attached hereto.
SIGNATURES
Pursuant to the requirements of the Securities Exchange Act of 1934 and the Investment Company Act of 1940, the registrant has duly caused this report to be signed on its behalf by the undersigned, thereunto duly authorized.
| | |
| JF China Region Fund, Inc. |
| |
| By: | | /s/ Simon Crinage |
| | Simon Crinage President and Principal Executive Officer September 7, 2012 |
Pursuant to the requirements of the Securities Exchange Act of 1934 and the Investment Company Act of 1940, this report has been signed below by the following persons on behalf of the registrant and in the capacities and on the dates indicated.
| | |
| By: | | /s/ Simon Crinage |
| | Simon Crinage President and Principal Executive Officer September 7, 2012 |
| | |
| By: | | /s/ Michael J. James |
| | Michael J. James Treasurer and Principal Financial Officer September 7, 2012 |