UNITED STATES
SECURITIES AND EXCHANGE COMMISSION
Washington, D.C. 20549
FORM N-CSR
CERTIFIED SHAREHOLDER REPORT OF REGISTERED
MANAGEMENT INVESTMENT COMPANIES
Investment Company Act file number: 811-06686
JF China Region Fund, Inc.
(Exact name of registrant as specified in charter)
One Beacon Street, 18th Floor
Boston, MA 02108
(Address of principal executive offices) (Zip code)
Dechert LLP
1095 Avenue of the Americas
New York, NY 10036
(Name and Address of Agent for Service)
Registrant’s telephone number, including area code: (800) 441-9800
Date of fiscal year end: December 31
Date of reporting period: January 1, 2013 through June 30, 2013
| ITEM 1. | REPORTS TO STOCKHOLDERS. |
The following is a copy of the report transmitted to shareholders pursuant to Rule 30e-1 under the Investment Company Act of 1940 (17 CFR 270.30e-1).
This report, including the financial statements herein, is sent to the stockholders of the Fund for their information. It is not a prospectus, circular or representation intended for use in the purchase or sale of shares of the Fund or of any securities mentioned in this report.

Semi-Annual Report
June 30, 2013 (Unaudited)


CONTENTS
OBJECTIVES
JF China Region Fund, Inc. (the ‘Fund’) seeks to achieve long-term capital appreciation through investments primarily in equity securities of companies with substantial assets in, or revenues derived from, the People’s Republic of China (‘China’), Hong Kong, Taiwan and Macau — collectively, the ‘China Region’.
The Fund provides investors with an opportunity to participate in the growing economies of the China Region where the economies of China, Hong Kong, Taiwan and Macau have become increasingly linked over recent years. Hong Kong enterprises have made substantial investments in China, particularly where labor and land prices are lower than in Hong Kong. Similarly, many Chinese companies have Hong Kong based subsidiaries with securities listed on the Hong Kong Stock Exchange. Renminbi denominated China A-shares, which are listed in China, are available for acquisition by the Fund by direct investment up to $20m and by indirect investment up to 10% of the Fund’s total assets through exposure to China A-share investment companies. It is intended that the Fund will maintain a $20m direct investment in China A-shares. Further details on China A-shares are provided in note 7(iii) of the Notes to Financial Statements on page 21.
The Fund invests to take advantage of the many opportunities that result from this linkage among the markets of the China Region.
MANAGEMENT
JF International Management Inc. (‘JFIMI’) is the investment management company appointed to advise and manage the Fund’s portfolio (the ‘Investment Advisor’). JFIMI is part of JPMorgan Chase & Co. (‘JPMC’), one of the world’s premier financial services institutions. In asset management, JPMC operates globally under the name of J.P. Morgan Asset Management (‘JPMAM’). Funds under management for the global asset management business of JPMAM were US$1.5 trillion as of June 30, 2013.
The Fund’s lead portfolio manager is Emerson Yip, Senior Portfolio Manager within JPMAM’s Greater China investment team in Hong Kong.
| | | | | | | | |
| | | |
| JUNE 30, 2013 | | JF CHINA REGION FUND, INC. | | | | | 1 | |
FORWARD-LOOKING STATEMENTS
This report contains certain forward-looking statements within the meaning of Section 21E of the Securities Exchange Act of 1934. Forward-looking statements include statements regarding the goals, beliefs, plans or current expectations of the Fund and JFIMI and their respective representatives, taking into account the information currently available to them. Forward-looking statements include all statements that do not relate solely to current or historical fact. For example, forward-looking statements include the use of words such as “anticipate,” “estimate,” “intend,” “expect,” “believe,” “plan,” “may,” “should,” “would,” or other words that convey uncertainty of future events or outcomes. Forward-looking statements involve known and unknown risks, uncertainties and other factors that may cause the actual results, performance or achievements of the Fund to be materially different from any future results, performance or achievements expressed or implied by the forward-looking statements. Factors that could materially and negatively affect the results, performance or achievements of the Fund include changes in economic, political, legal and regulatory conditions in the China Region and elsewhere, changes in interest and exchange rates and related policies and other risks. When evaluating the information included in this report, you are cautioned not to place undue reliance on these forward-looking statements, which reflect the judgment of the Fund, JFIMI or its respective representatives only as of the date hereof. The Fund, JFIMI and their respective representatives undertake no obligation to publicly revise or update these forward-looking statements to reflect events and circumstances that arise after the date hereof.
|
| MARKET INFORMATION |
The Fund is listed on the New York Stock Exchange (symbol JFC). The share price is published in • The Wall Street Journal (daily online at www.WSJ.com/Free) |
The estimated net asset value is published in • The Wall Street Journal under “Closed-End Funds” (every Saturday) • www.jfchinaregion.com |
| | | | | | |
| | | |
| 2 | | | | JF CHINA REGION FUND, INC. | | JUNE 30, 2013 |
HIGHLIGHTS (unaudited)
| | | | | | | | |
| | | JUNE 30, 2013
US$ (Unaudited) | | | DECEMBER 31, 2012
US$ (Audited) | |
Net Assets | | | $97.4 million | | | | $99.7 million | |
Net Asset Value Per Share | | | $15.10 | | | | $15.47 | |
| | |
Market Data | | | | | | | | |
Share Price on the New York Stock Exchange | | | $13.18 | | | | $14.00 | |
Discount to Net Asset Value | | | 12.7% | | | | 9.5% | |
| | |
Total Return for the Six Months Ended June 30, 2013 | | | | | | | | |
Net Asset Value | | | | | | | –2.4% | |
Share Price | | | | | | | –5.9% | |
| | |
JFC Benchmark Index* | | | | | | | –6.1% | |
Previous Benchmark Index** | | | | | | | –5.2% | |
MSCI Hong Kong Index (Total) | | | | | | | –1.3% | |
MSCI China Index (Total) | | | | | | | –10.8% | |
MSCI Taiwan Index (Total) | | | | | | | 1.4% | |
| | |
Net Asset Value and Share Price vs. Benchmark Index | | | | | | | | |
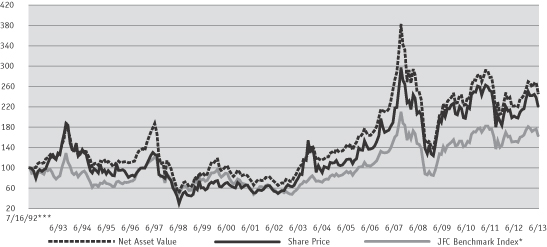
| * | | JFC Benchmark Index: 80% MSCI Golden Dragon Index (GDR) + 20% CSI 300 (Total). Prior to April 13, 2012, the MSCI Golden Dragon Index (Total). At December 31, 2011 the MSCI Golden Dragon Index (Total) comprised 24.1% of the MSCI Hong Kong Index (Total), 42.7% of the MSCI China Index (Total) and 33.2% of the MSCI Taiwan Index (Total). Prior to March 2001, 25% Taiwan Weighted Index, 20% BNP Paribas China Index, 50% MSCI Hong Kong, 5% HSBC; Prior to March 1999, 60% Hong Kong All Ordinaries, 30% Credit Lyonnais Securities Asia All China B Index, 10% Taiwan Weighted Index. Prior to January 1997, Peregrine Greater China Index. |
| ** | | Previous Benchmark Index: MSCI Golden Dragon Index (Total). |
| *** | | Commencement of operations. |
Source: J.P. Morgan Asset Management.
| | | | | | | | |
| | | |
| JUNE 30, 2013 | | JF CHINA REGION FUND, INC. | | | | | 3 | |
CHAIRMAN‘S STATEMENT
JUNE 30, 2013
Dear fellow Stockholder,
Performance
The Greater China markets were challenging in the first half of 2013. The year began with a continuation of the year-end rally in Hong Kong, but most of those gains were eroded as there were renewed concerns over the Eurozone crisis. Chinese equities, in which the Fund has its largest exposure, fell during the reporting period, especially in June, when global markets began to price in the possibility of a reduction in the pace of Federal Reserve quantitative easing at the same time that China both purposely engineered a credit crunch in the interbank funding markets (in order to slow down growth in the shadow banking markets) and reported weak economic data.
Despite this backdrop, although the Fund’s net asset value (‘NAV’) declined 2.4% in the six months to June 30, 2013, it outperformed its benchmark1 which fell by 6.1% over the same period. The outperformance of 3.7% relative to the benchmark was primarily attributable to stock selection contributions in China and Hong Kong, further details of which are provided in the Investment Advisor’s Report on pages 5 to 7 of this report. Over the same period, the Fund’s share price fell by 5.9%, which when compared against the Fund’s NAV return resulted in a widening of the discount from 9.5% to 12.7%.
Leverage
On February 25 2013, the Fund renewed its $17.5m credit facility with Scotiabank (Ireland) Ltd (‘Scotiabank’) for a further two year period. Under this arrangement, Scotiabank provides a secured, committed credit facility which can be utilized at any time. This financing arrangement gives the Investment Advisor the flexibility to manage tactically borrowed monies at its discretion under the close supervision of the Board. Since renewing this financing arrangement and up to June 30, 2013, the Fund’s
equity exposure ranged from 110% to 114% and at the time of writing is 112%.
Outlook
Your Board believes that the policy environment in the Greater China Region, particularly in China where the leadership intends to focus on the quality of growth and public sector de-leveraging, lends itself towards a structural deceleration in the economic growth rate. Your Board is cautious of the outcome of the Chinese Communist Party Central Committee Plenum at the end of October this year which is expected to herald some major reforms including price reforms of water and electricity, tax changes and possibly even more property taxes, environmental and energy savings and interest rate reforms. These reforms should lay the foundation for social stability and further sustainable economic growth. However, they will potentially drag on Chinese equities in the short to medium term, especially State owned enterprises, which will be impacted detrimentally by increased costs and taxes leading to declining earnings into 2014.
Whilst this stabilisation process should result in a moderate re-rating of the market, the Investment Advisor’s investment thesis is not hinged on that outcome. Rather, it is focusing on identifying companies that can deliver strong earnings growth through a combination of attractive market focus and superior management execution. Despite the cautious outlook, the Greater China markets continue to offer good investment opportunities at attractive valuations and your Board believes that the Fund’s Investment Advisor, with its bottom-up research driven approach, is well positioned to seek out these opportunities and deliver outperformance.
Respectfully submitted
The Rt. Hon. The Earl of Cromer
Chairman
August 29, 2013
| 1 | Currently 80% MSCI Golden Dragon Index, 20% CSI 300 Index. Prior to April 13, 2012, the benchmark was 100% MSCI Golden Dragon Index. |
For more information please refer to the Fund’s website at www.jfchinaregion.com
| | | | | | |
| | | |
| 4 | | | | JF CHINA REGION FUND, INC. | | JUNE 30, 2013 |
INVESTMENT ADVISOR’S REPORT
During the first half of 2013, the Fund achieved a total return on net assets of –2.4% (in USD terms), outperforming the benchmark return of –6.1% by 3.7%.
Performance was particularly strong in the first half of the period with stock selection decisions in China (both A-shares and offshore) and Hong Kong contributing to the outperformance. At the sector level, avoiding materials and energy and carrying an overweight position in consumer and information technology (‘IT’) related stocks worked well. Top contributors over the reporting period were Hong Kong’s AAC Technologies Holdings Inc. and Tencent Holdings Ltd in China. Avoiding the higher beta, more cyclical counters such as China Shenhua Energy Co. Ltd. also added to returns. In Taiwan, stock selection contributed but was offset by the Fund’s underweight position. The Fund’s average gearing of 111% hurt over the period.
China
Market Performance
Chinese equities corrected in the first quarter of 2013 on concerns of incremental policy tightening in China and rising sovereign debt risks in Europe. The offshore-listed Chinese market (MSCI China) dropped 4.4% with cyclical stocks leading the fall, while defensive sectors such as staples, healthcare and telecommunications fared better. The People’s Bank of China (‘PBOC’) started mopping up liquidity through open market operations in February, after very strong January Total Social Financing (‘TSF’) data. Furthermore, shares were weighed down by an anticorruption campaign by the new leadership which negatively affected consumption, with retail sales in January and February at 12.3%, coming in below expectations.
Chinese equities continued to fall in the second quarter of 2013, especially in June, when global markets began to price in the possibility of a
reduction in the pace of Federal Reserve quantitative easing, at the same time that China both purposely engineered a credit crunch in the interbank funding markets and reported weak economic leading indicators. Offshore-listed Chinese equities (MSCI China) returned –6.5% quarter-on-quarter. Again it was financials, energy, commodities and industrials which declined most, while IT, consumer staples and telecommunications performed better. The expected macro recovery came in below expectations despite relatively loose financial conditions. Corporates still remained cautious on capital expenditure due to low profitability, while local government infrastructure spending was constrained by high gearing. Industrial Production (‘IP’) in April and May remained weak, similar to first quarter levels. Earnings revisions remained neutral in comparison to the first quarter, after a negative trend throughout 2012. The multiple contraction mainly reflects the market’s concern of slower growth when China faces structural growth bottlenecks.
A-shares
In the first quarter of 2013, the A-share market pulled back after initially making gains until mid February, still underperforming the world’s major stock market indices. This was due in part to December’s market upswing alone limiting the first quarter’s upside potential; but mainly caused by the fact that some optimistic expectations from investors failed to materialize. Media-related names largely outperformed, while coal, non-ferrous, steel, and transportation stocks posted big losses.
In the second quarter of 2013 large and small caps continued diverging in terms of performance with the SHSZ300 returning –11.8% but the GEM index (smaller caps) gaining 16.8%. Changes in liquidity became more critical to the A-share market in the second quarter of 2013. Liquidity began to tighten from mid-to-late May, causing a clear fall in the A-share market and a sharp rise in domestic interest
| | | | | | | | |
| | | |
| JUNE 30, 2013 | | JF CHINA REGION FUND, INC. | | | | | 5 | |
INVESTMENT ADVISOR‘S REPORT (continued)
rates. In the second quarter of 2013, health care, aerospace & defense, technology, media & Telecoms and utilities were among the top performers, whereas coal, non-ferrous, insurance, securities and property underperformed.
Market Outlook
We expect the macro environment to be stable despite remaining at relatively low levels as the new leadership focuses on structural reforms. We do not expect a sharp slowdown in the economy as property sector Fixed Asset Investment (‘FAI’) should remain strong. After the additional property tightening measures announced at the end of February, the second quarter of 2013 transaction volumes remained stable and, in fact, surprised on the upside. The weak economic recovery in the second quarter has reduced further property policy tightening risk, stabilising developers’ capital expenditure expectations.
Overall, we believe China’s growth may enter into a period of slower pace as corporates are forced to de-lever, while the new leadership carries out much needed structural reforms. Some of the low hanging fruit such as interest rate liberalization and resource price reforms have already been gradually implemented this year. We expect bigger structural reforms such as land reforms, Hukou (urban residential permit) reform, the opening of the capital account, income distribution, and the opening up of more sectors for private enterprises to be the next areas of focus.
Hong Kong
Market Performance
2013 began with a continuation of the year-end rally in Hong Kong, but most of those gains were eroded as there were renewed concerns over the Eurozone crisis, including an election fiasco in Italy and a banking crisis in Cyprus. In China, there were concerns over both monetary and property
tightening, coupled with anti-corruption efforts which weighed on the market. The Hong Kong government implemented further measures to dampen the property market, including the doubling of stamp duties and mortgage tightening. Macau shares once again proved to be volatile with initial concerns over a weak February overcome as March came in at record levels with strong year-over-year growth.
The second quarter of 2013 was volatile as initially macro and geopolitical concerns dissipated but the U.S. Federal Reserve’s comment over tapering of quantitative easing resulted in a global sell-off in risk assets. Hong Kong equities were not spared, especially the rate-sensitive counters — most notably, real estate investment trusts and utilities. Despite the beneficial impact of rising rates on interest margins, Hong Kong bank shares were under pressure. The market is concerned about the negative impact of rising rates on credit quality and asset pricing, especially in light of the interbank rate scare in China. May retail sales in Hong Kong disappointed expectations, increasing only 12.8%, however, this is largely due to elevated expectations.
Market Outlook
The downward pressure facing Hong Kong equities in the near term remains given the ongoing worries over liquidity withdrawal — whether owing to potential tightening in the U.S. or China’s diminishing appeal for capital due to weakening economic performance. Despite solid underlying demand and supply dynamics, the property sector remains under pressure due to policy overhang and the adverse impact of a potential rate rise, despite solid underlying demand and supply conditions. The market response to the delayed launches into the second half of the year will be a test of the buying demand. In the meantime, the government continues with multiple attempts to increase the land supply, whose impact is likely to be felt over the longer term.
| | | | | | |
| | | |
| 6 | | | | JF CHINA REGION FUND, INC. | | JUNE 30, 2013 |
Macau gaming remains a resilient growth story, despite worries over tightening liquidity in China. Industry dynamics remain attractive given rapid demand growth driven by increasing penetration and rising per-capita spend while supply discipline is enforced by the government.
Taiwan
Market Performance
The Taiex was largely flat in USD terms in the first quarter of 2013, led by non-technology and financial sectors, while technology remained muted and underperformed slightly. With an improving demand / supply situation, commodity technology sectors like DRAM, TFT and LED performed well this quarter. Especially stocks within the low-end smart-phone supply chain continued to outperform. In anticipation of financial deregulation, momentum in the financial sector was led by a strong rally in insurance companies which also benefit from yield recovery and asset appreciation themes. However, concerns over China’s cooling measures have weakened stocks in the steel, machinery, cement and property sectors.
The Taiwanese market closed up 2.2% quarter-on-quarter in the second quarter of 2013 but the uptrend in the early part of the quarter quickly turned south as global markets started to worry about the possibility of the FED tapering its quantitative easing programme and the credit crunch in China. Taiwan’s parliament finally revised its capital gains tax for retail investors, which initially weighed on the market. The Central Bank stated that it aimed to maintain an accommodative
monetary environment as global liquidity has started to tighten. Taiwan and mainland China concluded a cross-Strait Trade in Services Agreement on June 21 in Shanghai, introducing a new era in bilateral business ties and strengthening Taiwan’s bid for greater economic integration in the region. The pact is expected to fast track discussions on other follow-up issues, including agreements on commodity trade, dispute settlement and double taxation.
Market Outlook
While concerns over China’s liquidity crunch and Fed QE tapering could continue to weigh on markets, much of these issues are priced in. In fact, an index level of 7700 should see very strong support post heavy profit taking in May and June. With the capital gains tax removed, the TWSE Index is likely to further trend higher with better retail participation.
While notebooks and Apple related products are facing headwinds, there will be some technology recovery in the latter part of 2013 as new products are introduced. However, interest in the technology sector is likely to be selective and in areas where visibility of earnings growth are clearer. The non-technology space has been seeing positive earnings revisions. Benign interest rates, excess liquidity and rotation out of technology should be supportive of non-technology stocks exposed to the regional markets. Risk reward remains attractive for the Taiwanese market as valuations remain undemanding.
Emerson Yip
JF International Management, Inc
August 29, 2013
| | | | | | | | |
| | | |
| JUNE 30, 2013 | | JF CHINA REGION FUND, INC. | | | | | 7 | |
TOP TEN HOLDINGS
AT JUNE 30, 2013 (Unaudited)
| | | | |
| | | % OF
NET ASSETS | |
Taiwan Semiconductor Manufacturing Co., Ltd. (‘TSMC’) | | | 7.7 | |
| Manufactures and markets integrated circuits. The company provides the following services: wafer manufacturing, wafer probing, assembly and testing, mask production and design services. The company’s integrated circuits are used in computer, communication, consumer electronics, automotive and industrial equipment industries. | | | | |
| |
Industrial & Commercial Bank of China Ltd. | | | 4.8 | |
| Provides a broad range of personal and corporate commercial banking services across China. The bank’s businesses include deposit, loan, credit card, fund underwriting and trust, and foreign currency settlement and trading. | | | | |
| |
Tencent Holdings Ltd. | | | 4.7 | |
| Provides internet, mobile, and telecommunication value-added services in China. The company has an instant messaging community in China. Tencent also provides online advertising services. | | | | |
| |
AIA Group Ltd. | | | 3.8 | |
| Offers insurance and financial services. The company writes life insurance for individuals and businesses, accident and health insurance, retirement planning, and wealth management services. | | | | |
| |
China Construction Bank Corp. | | | 3.1 | |
| Provides a complete range of banking services and other financial services to individual and corporate customers. The bank’s services include retail banking, international settlement, project finance and credit card services. | | | | |
| |
China Mobile Ltd. | | | 2.9 | |
| Through its subsidiaries, provides cellular telecommunications and related services in China and Hong Kong. | | | | |
| |
China Vanke Co., Ltd., ‘A’ | | | 2.5 | |
| Develops residential properties in Shenzhen, Shanghai, Beijing, Tianjin, Shenyang, Nanjing, and other big cities in China. | | | | |
| |
Cheung Kong Holdings Ltd. | | | 2.4 | |
| Through its subsidiaries, develops and invests in real estate. The company also provides real estate agency and management services, operates hotels, and invests in securities. | | | | |
| |
China Petroleum & Chemical Corp. | | | 2.3 | |
| Refines, produces and trades petroleum and petrochemical products such as gasoline, diesel, jet fuel, kerosene, ethylene, synthetic fibers, synthetic rubber, synthetic resins, and chemical fertilizers. Also, the Company explores for and produces oil and natural gas in China. | | | | |
| |
Hutchison Whampoa Ltd. | | | 2.2 | |
| Operates businesses in ports and related services, telecommunications, property and hotels, retail and manufacturing, and energy and infrastructure. | | | | |
| | | | | | |
| | | |
| 8 | | | | JF CHINA REGION FUND, INC. | | JUNE 30, 2013 |
INVESTMENT PORTFOLIO
AT JUNE 30, 2013 (Unaudited)
| | | | | | | | |
| DESCRIPTION | | HOLDINGS
(IN SHARES) | | | MARKET
VALUE
(IN US$) | |
COMMON STOCK (unless otherwise noted) | |
CHINA (51.9%) | |
Airlines (0.6%) | |
China Eastern Airlines Corp., Ltd. (a) | | | 1,858,000 | | | | 574,932 | |
| | | | | | | | |
Auto Components (0.9%) | |
Minth Group Ltd. | | | 552,000 | | | | 858,313 | |
| | | | | | | | |
Automobiles (2.1%) | |
FAW CAR Co., Ltd., ‘A’ (a) | | | 212,223 | | | | 425,304 | |
Great Wall Motor Co., Ltd. | | | 255,500 | | | | 1,101,911 | |
Great Wall Motor Co., Ltd., ‘A’ | | | 74,479 | | | | 429,817 | |
SAIC Motor Corp., Ltd., ‘A’ | | | 96,224 | | | | 207,104 | |
| | | | | | | | |
| | | | | | | 2,164,136 | |
| | | | | | | | |
Beverages (0.4%) | |
Tsingtao Brewery Co., Ltd., ‘A’ | | | 62,799 | | | | 388,606 | |
| | | | | | | | |
Capital Markets (2.1%) | |
CITIC Securities Co., Ltd., ‘A’ | | | 517,937 | | | | 854,846 | |
Haitong Securities Co., Ltd., ‘A’ | | | 619,957 | | | | 947,471 | |
Southwest Securities Co., Ltd., ‘A’ | | | 149,937 | | | | 187,372 | |
| | | | | | | | |
| | | | | | | 1,989,689 | |
| | | | | | | | |
Commercial Banks (13.7%) | |
Agricultural Bank of China Ltd., ‘A’ | | | 4,735,000 | | | | 1,897,826 | |
China Construction Bank Corp. | | | 4,262,000 | | | | 3,016,791 | |
China Construction Bank Corp., ‘A’ | | | 3,002,100 | | | | 2,029,900 | |
China Merchants Bank Co., Ltd., ‘A’ | | | 105,000 | | | | 198,449 | |
China Minsheng Banking Corp., Ltd. | | | 1,124,000 | | | | 1,099,936 | |
China Minsheng Banking Corp., Ltd., ‘A’ | | | 319,850 | | | | 446,610 | |
Industrial & Commercial Bank of China Ltd. | | | 7,391,930 | | | | 4,660,431 | |
| | | | | | | | |
| | | | | | | 13,349,943 | |
| | | | | | | | |
Communications Equipment (1.6%) | |
AAC Technologies Holdings, Inc. | | | 274,000 | | | | 1,547,334 | |
| | | | | | | | |
Construction & Engineering (1.0%) | |
China State Construction Engineering Corp., Ltd., ‘A’ (a) | | | 395,000 | | | | 210,449 | |
Sinopec Engineering Group Co., Ltd. (a) | | | 444,500 | | | | 598,317 | |
Suzhou Gold Mantis Construction Decoration Co., Ltd., ‘A’ | | | 49,674 | | | | 230,419 | |
| | | | | | | | |
| | | | | | | 1,039,185 | |
| | | | | | | | |
| | | | | | | | |
| DESCRIPTION | | HOLDINGS
(IN SHARES) | | | MARKET
VALUE
(IN US$) | |
Construction Materials (2.0%) | |
Anhui Conch Cement Co., Ltd. | | | 351,500 | | | | 951,709 | |
Anhui Conch Cement Co., Ltd., ‘A’ | | | 251,523 | | | | 548,321 | |
Gansu Qilianshan Cement Group Co., Ltd., ‘A’ (a) | | | 256,950 | | | | 357,526 | |
| | | | | | | | |
| | | | | | | 1,857,556 | |
| | | | | | | | |
Containers & Packaging (0.5%) | |
Greatview Aseptic Packaging Co., Ltd. | | | 805,000 | | | | 498,192 | |
| | | | | | | | |
Distributors (0.1%) | |
Shanghai Jahwa United Co., Ltd., ‘A’ | | | 9,000 | | | | 65,972 | |
| | | | | | | | |
Diversified Telecommunication Services (1.2%) | |
China Telecom Corp., Ltd. | | | 2,422,000 | | | | 1,155,408 | |
| | | | | | | | |
Electrical Equipment (0.4%) | |
Jiangnan Group Ltd. | | | 818,000 | | | | 155,035 | |
NARI Technology Development Co., Ltd., ‘A’ | | | 86,980 | | | | 211,583 | |
| | | | | | | | |
| | | | | | | 366,618 | |
| | | | | | | | |
Electronic Equipment, Instruments & Components (0.6%) | |
Hangzhou Hikvision Digital Technology Co., Ltd., ‘A’ (a) | | | 57,811 | | | | 332,873 | |
Zhejiang Dahua Technology Co., Ltd., ‘A’ | | | 45,916 | | | | 286,002 | |
| | | | | | | | |
| | | | | | | 618,875 | |
| | | | | | | | |
Energy Equipment & Services (1.9%) | |
China Oilfield Services Ltd. | | | 570,000 | | | | 1,115,594 | |
Yantai Jereh Oilfield Services Group Co., Ltd., ‘A’ | | | 67,821 | | | | 762,456 | |
| | | | | | | | |
| | | | | | | 1,878,050 | |
| | | | | | | | |
Food & Staples Retailing (0.2%) | |
Yonghui Superstores Co., Ltd., ‘A’ | | | 100,000 | | | | 190,139 | |
| | | | | | | | |
Food Products (2.7%) | |
Bright Dairy & Food Co., Ltd., ‘A’ | | | 149,861 | | | | 329,384 | |
Inner Mongolia Yili Industrial Group Co., Ltd., ‘A’ | | | 116,102 | | | | 591,709 | |
Want Want China Holdings Ltd. | | | 1,051,000 | | | | 1,479,738 | |
Zhejiang Beingmate Technology Industry & Trade Co., Ltd., ‘A’ | | | 54,988 | | | | 250,410 | |
| | | | | | | | |
| | | | | | | 2,651,241 | |
| | | | | | | | |
SEE ACCOMPANYING NOTES TO FINANCIAL STATEMENTS.
| | | | | | | | |
| | | |
| JUNE 30, 2013 | | JF CHINA REGION FUND, INC. | | | | | 9 | |
INVESTMENT PORTFOLIO
AT JUNE 30, 2013 (Unaudited) (continued)
| | | | | | | | |
| DESCRIPTION | | HOLDINGS
(IN SHARES) | | | MARKET
VALUE
(IN US$) | |
COMMON STOCK — continued | |
Hotels, Restaurants & Leisure (0.2%) | |
Shenzhen Overseas Chinese Town Co., Ltd., ‘A’ (a) | | | 250,000 | | | | 210,587 | |
| | | | | | | | |
Household Durables (1.8%) | |
BesTV New Media Co., Ltd., ‘A’ (a) | | | 33,000 | | | | 150,547 | |
GD Midea Holding Co., Ltd., ‘A’ | | | 95,000 | | | | 192,241 | |
GoerTek, Inc., ‘A’ | | | 91,836 | | | | 543,002 | |
Gree Electric Appliances, Inc., ‘A’ | | | 152,501 | | | | 622,666 | |
Hangzhou Robam Appliances Co., Ltd., ‘A’ | | | 11,311 | | | | 60,115 | |
Qingdao Haier Co., Ltd., ‘A’ | | | 73,000 | | | | 129,762 | |
| | | | | | | | |
| | | | | | | 1,698,333 | |
| | | | | | | | |
Independent Power Producers & Energy Traders (0.6%) | |
China Longyuan Power Group Corp. | | | 545,000 | | | | 564,953 | |
| | | | | | | | |
Insurance (2.3%) | |
China Pacific Insurance Group Co., Ltd. | | | 158,200 | | | | 504,825 | |
New China Life Insurance Co., Ltd. | | | 268,000 | | | | 825,833 | |
Ping An Insurance Group Co. of China Ltd., ‘A’ | | | 177,865 | | | | 1,007,330 | |
| | | | | | | | |
| | | | | | | 2,337,988 | |
| | | | | | | | |
Internet Software & Services (4.7%) | |
Tencent Holdings Ltd. | | | 116,000 | | | | 4,549,635 | |
| | | | | | | | |
Machinery (0.1%) | |
Fujian Tianguang Fire-fighting Scie-Tech Co., Ltd., ‘A’ | | | 48,000 | | | | 68,587 | |
| | | | | | | | |
Multiline Retail (0.8%) | |
Intime Department Store Group Co., Ltd. | | | 759,500 | | | | 741,281 | |
| | | | | | | | |
Oil, Gas & Consumable Fuels (4.8%) | |
China Petroleum & Chemical Corp. | | | 3,117,400 | | | | 2,194,545 | |
CNOOC Ltd. | | | 1,118,000 | | | | 1,896,955 | |
PetroChina Co., Ltd. | | | 526,000 | | | | 559,499 | |
| | | | | | | | |
| | | | | | | 4,650,999 | |
| | | | | | | | |
Pharmaceuticals (1.3%) | |
Kangmei Pharmaceutical Co., Ltd., ‘A’ (a) | | | 119,973 | | | | 375,893 | |
Tasly Pharmaceutical Group Co., Ltd., ‘A’ | | | 94,347 | | | | 601,813 | |
Yunnan Baiyao Group Co., Ltd., ‘A’ | | | 24,982 | | | | 341,948 | |
| | | | | | | | |
| | | | | | | 1,319,654 | |
| | | | | | | | |
| | | | | | | | |
| DESCRIPTION | | HOLDINGS
(IN SHARES) | | | MARKET
VALUE
(IN US$) | |
Real Estate Management & Development (2.8%) | |
China Vanke Co., Ltd., ‘A’ | | | 1,538,000 | | | | 2,468,277 | |
Gemdale Corp., ‘A’ | | | 250,000 | | | | 279,425 | |
| | | | | | | | |
| | | | | | | 2,747,702 | |
| | | | | | | | |
Road & Rail (0.2%) | |
Daqin Railway Co., Ltd., ‘A’ | | | 179,980 | | | | 174,186 | |
| | | | | | | | |
Software (0.0%) (g) | |
Anhui USTC iFlytek Co., Ltd., ‘A’ (a) | | | 5,000 | | | | 37,637 | |
| | | | | | | | |
Transportation Infrastructure (0.3%) | |
Shanghai International Airport Co., Ltd., ‘A’ | | | 160,940 | | | | 312,566 | |
| | | | | | | | |
TOTAL CHINA | | | | | | | 50,608,297 | |
| | | | | | | | |
HONG KONG (36.4%) | |
Auto Components (0.6%) | |
Xinyi Glass Holdings Ltd. | | | 796,000 | | | | 618,856 | |
| | | | | | | | |
Automobiles (0.5%) | |
Geely Automobile Holdings Ltd. | | | 1,100,000 | | | | 476,531 | |
| | | | | | | | |
Commercial Banks (3.0%) | |
BOC Hong Kong Holdings Ltd. | | | 354,000 | | | | 1,088,557 | |
Dah Sing Financial Holdings Ltd. | | | 204,100 | | | | 819,710 | |
HSBC Holdings plc | | | 76,800 | | | | 804,533 | |
Wing Hang Bank Ltd. | | | 37,000 | | | | 332,263 | |
| | | | | | | | |
| | | | | | | 3,045,063 | |
| | | | | | | | |
Distributors (0.4%) | |
Dah Chong Hong Holdings Ltd. | | | 433,000 | | | | 345,572 | |
| | | | | | | | |
Diversified Telecommunication Services (0.5%) | |
HKT Trust/HKT Ltd. | | | 468,000 | | | | 448,930 | |
| | | | | | | | |
Electric Utilities (1.4%) | |
Cheung Kong Infrastructure Holdings Ltd. | | | 210,000 | | | | 1,399,811 | |
| | | | | | | | |
Electronic Equipment, Instruments & Components (0.3%) | |
Anxin-China Holdings Ltd. | | | 1,212,000 | | | | 295,341 | |
| | | | | | | | |
Gas Utilities (1.8%) | |
China Resources Gas Group Ltd. | | | 688,000 | | | | 1,774,099 | |
| | | | | | | | |
Hotels, Restaurants & Leisure (4.4%) | |
Dorsett Hospitality International Ltd. | | | 1,050,000 | | | | 243,681 | |
Galaxy Entertainment Group Ltd. (a) | | | 191,000 | | | | 935,786 | |
SEE ACCOMPANYING NOTES TO FINANCIAL STATEMENTS.
| | | | | | |
| | | |
| 10 | | | | JF CHINA REGION FUND, INC. | | JUNE 30, 2013 |
| | | | | | | | |
| DESCRIPTION | | HOLDINGS
(IN SHARES) | | | MARKET
VALUE
(IN US$) | |
COMMON STOCK — continued | |
Hotels, Restaurants & Leisure — continued | |
Melco Crown Entertainment Ltd., ADR (a) | | | 40,455 | | | | 904,574 | |
REXLot Holdings Ltd. | | | 5,525,000 | | | | 363,297 | |
Sands China Ltd. | | | 304,400 | | | | 1,434,470 | |
Tsui Wah Holdings Ltd. (a) (e) | | | 764,000 | | | | 429,476 | |
| | | | | | | | |
| | | | | | | 4,311,284 | |
| | | | | | | | |
Household Durables (0.5%) | |
Man Wah Holdings Ltd. | | | 176,800 | | | | 221,796 | |
Skyworth Digital Holdings Ltd. | | | 533,746 | | | | 269,762 | |
| | | | | | | | |
| | | | | | | 491,558 | |
| | | | | | | | |
Industrial Conglomerates (3.2%) | |
Hutchison Whampoa Ltd. | | | 203,000 | | | | 2,134,418 | |
Jardine Matheson Holdings Ltd. | | | 10,228 | | | | 618,794 | |
Shun Tak Holdings Ltd. | | | 760,000 | | | | 368,435 | |
| | | | | | | | |
| | | | | | | 3,121,647 | |
| | | | | | | | |
Insurance (3.8%) | |
AIA Group Ltd. | | | 868,600 | | | | 3,678,871 | |
| | | | | | | | |
Marine (0.8%) | |
Orient Overseas International Ltd. | | | 127,500 | | | | 823,583 | |
| | | | | | | | |
Multiline Retail (0.7%) | |
Lifestyle International Holdings Ltd. | | | 346,500 | | | | 725,519 | |
| | | | | | | | |
Pharmaceuticals (0.4%) | |
CSPC Pharmaceutical Group Ltd. | | | 734,000 | | | | 367,187 | |
| | | | | | | | |
Real Estate Investment Trusts (REITs) (0.9%) | |
Yuexiu Real Estate Investment Trust | | | 1,572,000 | | | | 857,338 | |
| | | | | | | | |
Real Estate Management & Development (8.9%) | |
Cheung Kong Holdings Ltd. | | | 172,000 | | | | 2,332,940 | |
China Overseas Land & Investment Ltd. | | | 446,000 | | | | 1,170,196 | |
China Resources Land Ltd. | | | 362,000 | | | | 989,473 | |
Far East Consortium International Ltd. | | | 740,000 | | | | 247,110 | |
Hongkong Land Holdings Ltd. | | | 82,000 | | | | 563,340 | |
Midland Holdings Ltd. | | | 1,196,000 | | | | 447,186 | |
New World Development Co., Ltd. | | | 782,228 | | | | 1,083,171 | |
Wharf Holdings Ltd. | | | 209,400 | | | | 1,760,288 | |
| | | | | | | | |
| | | | | | | 8,593,704 | |
| | | | | | | | |
Road & Rail (0.2%) | |
MTR Corp., Ltd. | | | 46,000 | | | | 169,622 | |
| | | | | | | | |
| | | | | | | | |
| DESCRIPTION | | HOLDINGS
(IN SHARES) | | | MARKET
VALUE
(IN US$) | |
Semiconductors & Semiconductor Equipment (0.7%) | |
GCL-Poly Energy Holdings Ltd. (a) | | | 2,978,000 | | | | 641,210 | |
| | | | | | | | |
Specialty Retail (0.5%) | |
IT Ltd. | | | 604,000 | | | | 215,713 | |
Luk Fook Holdings International Ltd. | | | 108,000 | | | | 251,200 | |
| | | | | | | | |
| | | | | | | 466,913 | |
| | | | | | | | |
Wireless Telecommunication Services (2.9%) | |
China Mobile Ltd. | | | 269,000 | | | | 2,809,291 | |
| | | | | | | | |
TOTAL HONG KONG | | | | | | | 35,461,930 | |
| | | | | | | | |
TAIWAN (22.5%) | |
Auto Components (1.1%) | |
Cheng Shin Rubber Industry Co., Ltd. | | | 339,000 | | | | 1,070,014 | |
| | | | | | | | |
Chemicals (0.8%) | |
China Steel Chemical Corp. | | | 104,000 | | | | 517,033 | |
Nan Ya Plastics Corp. | | | 149,000 | | | | 314,197 | |
| | | | | | | | |
| | | | | | | 831,230 | |
| | | | | | | | |
Commercial Banks (0.9%) | |
E.Sun Financial Holding Co., Ltd. | | | 1,362,479 | | | | 831,916 | |
| | | | | | | | |
Computers & Peripherals (0.9%) | |
Pegatron Corp. (a) | | | 509,000 | | | | 840,663 | |
| | | | | | | | |
Diversified Financial Services (0.6%) | |
Fubon Financial Holding Co., Ltd. | | | 436,989 | | | | 595,609 | |
| | | | | | | | |
Electrical Equipment (0.2%) | |
Teco Electric and Machinery Co., Ltd. | | | 165,000 | | | | 165,160 | |
| | | | | | | | |
Electronic Equipment, Instruments & Components (2.7%) | |
Delta Electronics, Inc. | | | 210,000 | | | | 956,424 | |
Innolux Corp. (a) | | | 1,252,430 | | | | 624,731 | |
Largan Precision Co., Ltd. | | | 10,000 | | | | 320,310 | |
TPK Holding Co., Ltd. (a) | | | 45,349 | | | | 726,286 | |
| | | | | | | | |
| | | | | | | 2,627,751 | |
| | | | | | | | |
Food Products (0.8%) | |
Uni-President Enterprises Corp. | | | 415,450 | | | | 809,525 | |
| | | | | | | | |
Internet Software & Services (0.4%) | |
PChome Online, Inc. | | | 80,025 | | | | 420,538 | |
| | | | | | | | |
Leisure Equipment & Products (0.3%) | |
Johnson Health Tech Co., Ltd. | | | 119,595 | | | | 328,406 | |
| | | | | | | | |
SEE ACCOMPANYING NOTES TO FINANCIAL STATEMENTS.
| | | | | | | | |
| | | |
| JUNE 30, 2013 | | JF CHINA REGION FUND, INC. | | | | | 11 | |
INVESTMENT PORTFOLIO
AT JUNE 30, 2013 (Unaudited) (continued)
| | | | | | | | |
| DESCRIPTION | | HOLDINGS
(IN SHARES) | | | MARKET
VALUE
(IN US$) | |
COMMON STOCK — continued | |
Multiline Retail (0.3%) | |
Poya Co., Ltd. | | | 73,000 | | | | 260,619 | |
| | | | | | | | |
Real Estate Management & Development (2.1%) | |
Huaku Development Co., Ltd. | | | 135,000 | | | | 389,627 | |
Prince Housing & Development Corp. | | | 955,270 | | | | 639,057 | |
Ruentex Development Co., Ltd. | | | 546,000 | | | | 989,216 | |
| | | | | | | | |
| | | | | | | 2,017,900 | |
| | | | | | | | |
Semiconductors & Semiconductor Equipment (11.0%) | |
Advanced Semiconductor Engineering, Inc. | | | 1,056,802 | | | | 886,810 | |
MediaTek, Inc. | | | 87,000 | | | | 1,011,628 | |
Novatek Microelectronics Corp. | | | 144,000 | | | | 699,076 | |
Taiwan Semiconductor Manufacturing Co., Ltd. | | | 2,020,057 | | | | 7,481,443 | |
United Microelectronics Corp. | | | 1,306,000 | | | | 631,844 | |
| | | | | | | | |
| | | | | | | 10,710,801 | |
| | | | | | | | |
Textiles, Apparel & Luxury Goods (0.4%) | |
Pou Chen Corp. | | | 406,000 | | | | 385,396 | |
| | | | | | | | |
TOTAL TAIWAN | | | | | | | 21,895,528 | |
| | | | | | | | |
INVESTMENT COMPANY | |
HONG KONG (1.4%) | |
JPMorgan China Pioneer A-Share Fund (a)* | | | 57,031 | | | | 1,344,224 | |
| | | | | | | | |
RIGHT | |
Financials — 0.0% (g) | |
New World Development Co., Ltd., expiring 12/31/49 (a) | | | 9,777 | | | | — | |
| | | | | | | | |
TOTAL INVESTMENTS
(112.2% of Net Assets)
(Cost $95,962,105) | | | | | | | 109,309,979 | |
| | | | | | | | |
Liabilities in excess of other assets
(-12.2% of Net Assets) | | | | (11,932,307 | ) |
| | | | | | | | |
NET ASSETS (100.0%) | | | | | | | 97,377,672 | |
| | | | | | | | |
| | | | |
As of June 30, 2013, aggregate cost for Federal income tax purposes was $95,962,105. The aggregate unrealized gain for all securities is as follows | |
Excess of market value over cost | | $ | 18,268,616 | |
Excess of cost over market value | | $ | (4,920,742 | ) |
| | | | |
Net unrealized gain | | $ | 13,347,874 | |
| | | | |
| * | No advisor’s fee is levied on this investment. Please refer to note 4.1 on pg 19 for more information. |
NOTES TO PORTFOLIO INVESTMENTS :
| ADR – | American Depositary Receipt. |
| (a) | Non-income producing security. |
| (e) | Security is exempt from registration under Rule 144A of the Securities Act of 1933, as amended. Unless otherwise indicated, this security has been determined to be liquid under procedures established by the Board of Directors and may be resold in transactions exempt from registration, normally to qualified institutional buyers. |
| (g) | Amount rounds to less than 0.1%. |
| A | China A shares (See Note 7.iii.) |
SEE ACCOMPANYING NOTES TO FINANCIAL STATEMENTS.
| | | | | | |
| | | |
| 12 | | | | JF CHINA REGION FUND, INC. | | JUNE 30, 2013 |
STATEMENT OF ASSETS AND LIABILITIES
AS OF JUNE 30, 2013 (Unaudited)
| | | | |
| | | (in US$) | |
ASSETS: | | | | |
Investments in non-affiliates, at value (cost $94,689,892) | | | 107,965,755 | |
Investments in affiliates, at value (cost $1,272,213) | | | 1,344,224 | |
| | | | |
Total investments, at value (cost $95,962,105) | | | 109,309,979 | |
Cash | | | 149,202 | |
Foreign currency, at value (cost $2,604,882) | | | 2,607,657 | |
Deposits at broker (See Note 7.iii.) | | | 27,714 | |
Receivable for securities sold | | | 1,182,674 | |
Dividends receivable | | | 847,438 | |
| | | | |
Total Assets | | | 114,124,664 | |
| | | | |
| |
LIABILITIES: | | | | |
Loan payable to bank (See Note 6) | | | 14,500,000 | |
Payables | | | | |
Payable for securities purchased | | | 1,672,918 | |
Accrued liabilities | | | | |
Deferred China capital gains tax | | | 348,979 | |
Other | | | 58,826 | |
Investment advisory fees | | | 53,666 | |
Custodian and accounting fees | | | 36,504 | |
Administration fees | | | 35,661 | |
Directors’ fees and expenses | | | 33,601 | |
Interest on loan | | | 6,837 | |
| | | | |
Total Liabilities | | | 16,746,992 | |
| | | | |
Net Assets | | | 97,377,672 | |
| | | | |
| |
| Net assets consist of: | | | | |
Common stock, $0.01 par value
(100,000,000 shares authorized; 6,447,637 shares issued and outstanding) | | | 64,476 | |
Paid-in capital | | | 98,994,145 | |
Undistributed net investment income | | | 1,331,165 | |
Accumulated realized loss on investments and foreign currency transactions | | | (16,201,923 | ) |
Accumulated net unrealized appreciation on investments, foreign currency holdings, and other
assets and liabilities denominated in foreign currencies | | | 13,189,809 | |
| | | | |
Net Assets | | | 97,377,672 | |
| | | | |
Net Asset Value Per Share ($97,377,672 ÷ 6,447,637) | | | 15.10 | |
| | | | |
SEE ACCOMPANYING NOTES TO FINANCIAL STATEMENTS.
| | | | | | | | |
| | | |
| JUNE 30, 2013 | | JF CHINA REGION FUND, INC. | | | | | 13 | |
STATEMENT OF OPERATIONS
FOR THE SIX MONTHS ENDED JUNE 30, 2013 (Unaudited)
| | | | |
| | | (in US$) | |
INVESTMENT INCOME: | | | | |
Dividends from non-affiliates (net of foreign withholding tax of $84,120) | | | 1,802,950 | |
Interest income from non-affiliates | | | 1,690 | |
Interest income from affiliates | | | 152 | |
| | | | |
Total Investment Income | | | 1,804,792 | |
| | | | |
| |
EXPENSES: | | | | |
Investment advisory fees | | | 511,237 | |
Directors’ fees and expenses | | | 141,475 | |
Interest expense to non-affiliates (See Note 6) | | | 110,856 | |
Legal fees | | | 89,018 | |
Custodian and accounting fees | | | 84,408 | |
Administration fees | | | 43,747 | |
Audit fees | | | 34,831 | |
Insurance fees | | | 24,542 | |
Other expenses | | | 22,161 | |
Shareholder service fees | | | 21,772 | |
Lending facility arrangement fee | | | 17,500 | |
Shareholder report fees | | | 13,156 | |
NYSE listing fees | | | 12,564 | |
| | | | |
Total Expenses | | | 1,127,267 | |
| | | | |
Less amounts waived | | | (3,790 | ) |
| | | | |
Net expenses | | | 1,123,477 | |
| | | | |
Net Investment Income | | | 681,315 | |
| | | | |
| |
REALIZED AND UNREALIZED GAIN (LOSS) ON INVESTMENTS, FOREIGN CURRENCY
HOLDINGS AND OTHER ASSETS AND LIABILITIES DENOMINATED IN FOREIGN CURRENCIES: | | | | |
Net realized gain (loss) | | | | |
Investments in non-affiliates (net of China tax of $92,940 on realized gain) | | | 288,084 | |
Investments in affiliates | | | 10,931 | |
Foreign currency transactions | | | 8,436 | |
| | | | |
Net realized gain (loss) | | | 307,451 | |
| | | | |
Net change in unrealized appreciation/depreciation | | | | |
Investments in non-affiliates (net of China tax of $16,061 on unrealized depreciation) | | | (3,263,276 | ) |
Investments in affiliates | | | (76,894 | ) |
Foreign currency translations | | | 1,033 | |
| | | | |
Change in net unrealized appreciation/depreciation | | | (3,339,137 | ) |
| | | | |
Net realized and unrealized gain (loss) on investments, foreign currency holdings and other assets
and liabilities denominated in foreign currencies | | | (3,031,686 | ) |
| | | | |
Net decrease in net assets resulting from operations | | | (2,350,371 | ) |
| | | | |
SEE ACCOMPANYING NOTES TO FINANCIAL STATEMENTS.
| | | | | | |
| | | |
| 14 | | | | JF CHINA REGION FUND, INC. | | JUNE 30, 2013 |
STATEMENT OF CHANGES IN NET ASSETS
FOR THE PERIODS INDICATED
| | | | | | | | |
| | | Six Months Ended
June 30, 2013
(Unaudited)
(in US$) | | | Year Ended
December 31, 2012
(in US$) | |
INCREASE IN NET ASSETS: | | | | | | | | |
Operations | | | | | | | | |
Net investment income | | | 681,315 | | | | 490,550 | |
Net realized gain (loss) on investment transactions | | | 307,451 | | | | (626,101 | ) |
Net change in unrealized appreciation (depreciation) on investments, foreign
currency holdings and other assets and liabilities denominated in foreign
currencies | | | (3,339,137 | ) | | | 18,307,670 | |
| | | | | | | | |
Net increase (decrease) in net assets resulting from operations | | | (2,350,371 | ) | | | 18,172,119 | |
| | | | | | | | |
| | |
DISTRIBUTIONS TO STOCKHOLDERS: | | | | | | | | |
Net investment income | | | — | | | | (670,554 | ) |
| | | | | | | | |
Total distributions to shareholders | | | — | | | | (670,554 | ) |
| | | | | | | | |
Total increase (decrease) in net assets | | | (2,350,371 | ) | | | 17,501,565 | |
| | | | | | | | |
| | |
NET ASSETS: | | | | | | | | |
Beginning of period | | | 99,728,043 | | | | 82,226,478 | |
| | | | | | | | |
End of period (including undistributed net investment income of $1,331,165 and $649,850, respectively) | | | 97,377,672 | | | | 99,728,043 | |
| | | | | | | | |
| | |
SHARE TRANSACTIONS | | | | | | | | |
Opening number of shares | | | 6,447,637 | | | | 6,447,637 | |
| | | | | | | | |
Closing number of shares | | | 6,447,637 | | | | 6,447,637 | |
| | | | | | | | |
SEE ACCOMPANYING NOTES TO FINANCIAL STATEMENTS.
| | | | | | | | |
| | | |
| JUNE 30, 2013 | | JF CHINA REGION FUND, INC. | | | | | 15 | |
FINANCIAL HIGHLIGHTS
FOR THE PERIODS INDICATED
| | | | | | | | | | | | | | | | | | | | | | | | |
| | | For the
Six Months
Ended
June 30,
2013
(Unaudited)
(in US$) | | | For the
Year Ended
December 31,
2012
(in US$) | | | For the
Year Ended
December 31,
2011
(in US$) | | | For the
Year Ended
December 31,
2010
(in US$) | | | For the
Year Ended
December 31,
2009
(in US$) | | | For the
Year Ended
December 31,
2008
(in US$) | |
For a share outstanding throughout each year: | | | | | | | | | | | | | | | | | | | | | | | | |
Net asset value, beginning of period | | | 15.47 | | | | 12.75 | | | | 17.41 | | | | 15.27 | | | | 9.50 | | | | 30.24 | |
| | | | | | | | | | | | | | | | | | | | | | | | |
Net investment income (loss) | | | 0.11 | | | | 0.08 | | | | 0.14 | | | | 0.05 | | | | 0.02 | | | | 0.32 | |
Net realized and unrealized gain (loss) | | | (0.48 | ) | | | 2.74 | | | | (4.70 | ) | | | 2.11 | | | | 5.81 | | | | (16.36 | ) |
| | | | | | | | | | | | | | | | | | | | | | | | |
Total from investment operations | | | (0.37 | ) | | | 2.82 | | | | (4.56 | ) | | | 2.16 | | | | 5.83 | | | | (16.04 | ) |
| | | | | | | | | | | | | | | | | | | | | | | | |
Dividends from net investment income | | | — | | | | (0.10 | ) | | | (0.10 | ) | | | (0.02 | ) | | | (0.06 | ) | | | (0.01 | ) |
| | | | | | | | | | | | | | | | | | | | | | | | |
Distributions from net realized gains | | | — | | | | — | | | | — | | | | — | | | | — | | | | (4.69 | ) |
| | | | | | | | | | | | | | | | | | | | | | | | |
Total distributions | | | — | | | | (0.10 | ) | | | (0.10 | ) | | | (0.02 | ) | | | (0.06 | ) | | | (4.70 | ) |
| | | | | | | | | | | | | | | | | | | | | | | | |
Net asset value, end of period | | | 15.10 | | | | 15.47 | | | | 12.75 | | | | 17.41 | | | | 15.27 | | | | 9.50 | |
| | | | | | | | | | | | | | | | | | | | | | | | |
Market value, end of period | | | 13.18 | | | | 14.00 | | | | 11.02 | | | | 15.79 | | | | 13.78 | | | | 8.77 | |
| | | | | | | | | | | | | | | | | | | | | | | | |
Total Investment Return | | | | | | | | | | | | | | | | | | | | | | | | |
Per share market value * | | | (2.4 | %) | | | 28.2 | % | | | (29.6 | %) | | | 14.7 | % | | | 57.8 | % | | | (45.6 | %) |
| | | | | | |
RATIOS/SUPPLEMENTAL DATA | | | | | | | | | | | | | | | | | | | | | | | | |
Net assets, end of period | | | 97,377,672 | | | | 99,728,043 | | | | 82,226,478 | | | | 112,248,790 | | | | 98,457,230 | | | | 61,256,551 | |
Ratio of net expenses to average net assets | | | 2.20 | % | | | 2.11 | % | | | 1.89 | % | | | 1.99 | % | | | 2.12 | % | | | 1.92 | % |
Ratio of net expenses to average net assets, excluding interest expense | | | 1.98 | % | | | 2.04 | % | | | 1.89 | % | | | 1.99 | % | | | 2.12 | % | | | 1.92 | % |
Ratios of net investment income to average net assets | | | 1.33 | % | | | 0.54 | % | | | 0.87 | % | | | 0.32 | % | | | 0.19 | % | | | 0.98 | % |
Ratios of total expenses to average net assets | | | 2.21 | % | | | 2.12 | % | | | — | | | | — | | | | — | | | | — | |
Portfolio turnover rate | | | 29.2 | % | | | 85.8 | % | | | 66.8 | % | | | 76.1 | % | | | 101.0 | % | | | 114.8 | % |
Number of shares outstanding at end of period (in thousands) | | | 6,448 | | | | 6,448 | | | | 6,448 | | | | 6,448 | | | | 6,448 | | | | 6,448 | |
| * | The total investment return excludes the effect of commissions. Dividends and distributions, if any, are assumed for the purpose of this calculation to be reinvested at prices obtained under the Fund’s dividend reinvestment plan or if specified in accordance with the terms of the distribution. |
SEE ACCOMPANYING NOTES TO FINANCIAL STATEMENTS.
| | | | | | |
| | | |
| 16 | | | | JF CHINA REGION FUND, INC. | | JUNE 30, 2013 |
NOTES TO FINANCIAL STATEMENTS
AT JUNE 30, 2013 (Unaudited)
1. Organization and Capital
JF China Region Fund, Inc. (the ‘Fund’) was incorporated in the State of Maryland on May 22, 1992, and is registered as a non-diversified, closed-end management investment company under the Investment Company Act of 1940 (‘1940 Act’). The Fund commenced operations on July 16, 1992.
The Fund seeks to achieve long-term capital appreciation through investments primarily in equity securities of companies with substantial assets in, or revenues derived from, the People’s Republic of China (‘China’), Hong Kong, Taiwan and Macau — collectively, the ‘China Region’.
2. Significant Accounting Policies
The following significant accounting policies, which are in conformity with accounting principles generally accepted in the United States of America (‘GAAP’), are consistently followed by the Fund in the preparation of its financial statements.
The preparation of financial statements in conformity with GAAP requires management to make estimates and assumptions that affect the reported amounts of assets and liabilities and disclosure of contingent assets and liabilities at the date of the financial statements and the reported amounts of increases and decreases in net assets from operations during the reported period. Actual results could differ from these estimates.
i) Security Valuation — All securities for which market quotations are readily available are valued at the last sales price prior to the time of determination or, if no sales price is available at that time, at the mean between the last current bid and ask prices. Securities that are traded over-the-counter are valued, if bid and ask quotations are available, at the mean between the current bid and ask prices. Certain investments of the Fund may, depending upon market conditions, trade in relatively thin markets and/or in markets that experience significant volatility. As a result of these conditions, the prices used by the Fund to value securities may differ from the value that would be realized if these securities were sold and the differences could be material. All other securities and assets are valued at fair value as determined in good faith by the Board of Directors. It is possible that the estimated values may differ significantly from the values that would have been used had a ready market for the investments existed, and such differences could be material. In valuing the Fund’s assets, quotations of foreign securities in a foreign currency are translated to United States (‘U.S.’) dollar equivalents at the prevailing exchange rate in effect on the valuation date. Investments in open ended mutual funds are valued at current day’s closing net asset value per share (“NAV”), with the exception of the JF China Pioneer A-Share Fund, which is valued at the current day’s closing bid price.
Valuations reflected in this report are as of the report date. As a result, changes in valuation due to market events and/or issuer related events after the report date and prior to issuance of the report are not reflected herein.
The various inputs that are used in determining the fair value of the Fund’s investments are summarized into the three broad levels listed below.
| • | | Level 1 — quoted prices in active markets for identical securities |
| • | | Level 2 — other significant observable inputs (including quoted prices for similar securities, interest rates, prepayment speeds, credit risk, etc.) |
| • | | Level 3 — significant unobservable inputs (including the Fund’s own assumptions in determining the fair value of investments) |
A financial instrument’s level within the fair value hierarchy is based on the lowest level of any input, both individually and in the aggregate, that is significant to the fair value measurement. The inputs or methodology used for valuing securities are not necessarily an indication of the risk associated with investing in those securities.
| | | | | | | | |
| | | |
| JUNE 30, 2013 | | JF CHINA REGION FUND, INC. | | | | | 17 | |
NOTES TO FINANCIAL STATEMENTS
AT JUNE 30, 2013 (Unaudited) (continued)
The following table represents each valuation input as presented on the Investment Portfolio:
| | | | | | | | | | | | | | | | |
| | | Level 1
Quoted prices | | | Level 2
Other significant
observable inputs | | | Level 3
Significant
unobservable inputs | | | Total | |
Total Investments in Securities (a) | | $ | 109,309,979 | | | $ | — | | | $ | — | | | $ | 109,309,979 | |
| | | | | | | | | | | | | | | | |
| (a) | All portfolio holdings designated as Level 1 are disclosed individually in the Investment Portfolio. Please refer to the SOI for industry specifics of portfolio holdings. |
There were no transfers between any levels during the six months ended June 30, 2013.
ii) Foreign Currency Translation — The books and records of the Fund are maintained in U.S. dollars. Foreign currency amounts are translated into U.S. dollars at the mid-market price of such currencies against U.S. dollars as follows:
| • | | investments, other assets, and liabilities at the prevailing rates of exchange on the valuation date; |
| • | | investment transactions and investment income at the prevailing rates of exchange on the dates of such transactions. |
Although the net assets of the Fund are presented at the foreign exchange rates and market values at the close of the period, the Fund does not isolate that portion of the results of operations arising as a result of changes in the foreign exchange rates from the fluctuations arising from changes in the market prices of the securities held or sold during the period. Similarly, the Fund does not isolate the effect of changes in foreign exchange rates from the fluctuations arising from changes in the market prices of securities sold during the period. Accordingly, realized and unrealized foreign currency gains (losses) are included in the reported net realized and unrealized gains (losses) on investments.
Unrealized currency gains (losses) resulting from valuing foreign currency denominated assets and liabilities at period-end exchange rates are reflected as a component of accumulated net unrealized gain (loss) on investments, foreign currency holdings, and other assets and liabilities denominated in foreign currencies.
iii) Restricted and Illiquid Securities — Certain securities held by the Fund may be subject to legal or contractual restrictions on resale or are illiquid. Restricted securities generally may be resold in transactions exempt from registration under the Securities Act of 1933 (the “Securities Act). An illiquid security is a security which cannot be disposed of promptly (within seven days) and in the usual course of business at approximately its fair value and includes, but is not limited to, repurchase agreements maturing in excess of seven days, time deposits with a withdrawal penalty, non-negotiable instruments and instruments for which no market exists. Disposal of these securities may involve time-consuming negotiations and expense. Prompt sale at the current valuation may be difficult and could adversely affect the net assets of the Fund.
iv) Distribution of Income and Gains — The Fund intends to distribute to stockholders, at least annually, substantially all of its net investment income and expects to distribute annually any net long-term capital gains in excess of net short-term capital losses. An additional distribution may be made to the extent necessary to avoid the payment of a 4% Federal excise tax.
Income and capital gain distributions are determined in accordance with Federal income tax regulations and may differ from those determined in accordance with GAAP.
v) Other — Security transactions are accounted for on trade date. Realized gains and losses on the sale of investment securities are determined on the identified cost basis. Interest income is recognized on the accrual basis. Dividend income, net of foreign taxes withheld, if any, is recorded on the ex-dividend date or when the Fund first learns of the dividend.
| | | | | | |
| | | |
| 18 | | | | JF CHINA REGION FUND, INC. | | JUNE 30, 2013 |
vi) Foreign Taxes — The Fund may be subject to foreign taxes on income, gains on investments or currency purchases/repatriation, a portion of which may be recoverable. The Fund will accrue such taxes and recoveries as applicable, based upon its current interpretation of tax rules and regulations that exist in the markets in which it invests.
As described in Note 7.iii, the Fund invests in China A-shares, which are separately identified in the Investment Portfolio. Based upon its current interpretation of tax rules in China, the Fund records an estimated deferred tax liability for realized and unrealized gains on Chinese A-share securities sold during, or held at the end of, the reporting period.
3. Investment Transactions
During the six months ended June 30, 2013, the Fund made purchases of $40,138,680 and sales of $33,125,606 of investment securities other than short-term investments. There were no purchases or sales of U.S. Government securities.
4. Related party, Other Service Provider Transactions and Directors
i) JF International Management Inc. (the Investment ‘Advisor’), an indirect wholly-owned subsidiary of JPMorgan Chase & Co. (“JPMorgan”) provides investment advisory services to the Fund under the terms of an investment advisory agreement. The Advisor is paid a fee, computed weekly and payable monthly, at the annual rate of 1.00% of the Fund’s weekly managed gross assets. Investments in funds on which the Advisor or its affiliates charges a management fee are excluded from the calculation. The Investment Advisor has agreed to waive its entitlement to a management fee on any cash held when borrowings are drawn under a borrowing facility. For the six months ended June 30, 2013, the Investment Advisor waived Investment Advisory fees of $3,790.
ii) During the six months ended June 30, 2013, the Fund did not pay any brokerage commissions to JPMorgan companies or affiliated brokers/dealers.
iii) Other Service Providers — Pursuant to an Administration Agreement, JPMorgan Chase Bank, N.A. (“JPMCB”), a wholly-owned subsidiary of JPMorgan (the “Administrator”), provides certain administration services to the Fund. The Fund pays an annual administration fee of $87,500 in respect of tax, compliance, financial reporting and regulatory services.
JPMCB provides portfolio custody and accounting services for the Fund. The amounts paid directly to JPMCB by the Fund for custody and accounting services are included in Custodian and accounting fees in the Statement of Operations. In consideration of the accounting services, JPMCB receives a fee accrued daily and paid monthly at the annual rate of 0.02% of the first $12.5 billion of the average daily net assets of all funds in the JPMorgan International Fund Complex and 0.0175% of the average daily net assets in excess of $12.5 billion of all such funds subject to a minimum annual fee of $35,000. The custodian fees are split between safekeeping and transaction changes and vary by market.
iv) Directors — The Fund pays each of its Directors who is not a director, officer or employee of the Advisor, Administrator or any affiliate thereof, an annual fee of $24,100, the Audit Committee Chairman $28,500 and the Chairman $35,000 plus a $3,300 attendance fee for each Board meeting, Management Engagement Committee meeting and Audit Committee meeting attended. A per diem allowance of $2,000 per day, or $1,000 per half day, is paid to Directors in respect of time spent by Directors on Fund business outside normal Board and Committee meetings. In addition, the Fund reimburses all Directors for travel and out-of-pocket expenses incurred in connection with Board of Directors meetings. Under normal circumstances, in order to minimize expenses, the Board expects to hold two meetings a year by telephone.
v) As of June 30, 2013, the Fund had two shareholders, each holding more than 5% of the Fund’s outstanding shares, who held in aggregate approximately 58% of the Fund’s outstanding shares
| | | | | | | | |
| | | |
| JUNE 30, 2013 | | JF CHINA REGION FUND, INC. | | | | | 19 | |
NOTES TO FINANCIAL STATEMENTS
AT JUNE 30, 2013 (Unaudited) (continued)
5. Capital Share Transactions
On September 15, 2011, the Board of Directors renewed an authority for the Fund to purchase shares of its common stock from Fund stockholders, as described below. When shares trade at a discount to NAV, any purchase of shares by the Fund has the effect of increasing the NAV of the Fund’s remaining shares outstanding. All shares purchased by the Fund are thereafter considered authorized and unissued.
i) Share Repurchase Program — On September 5, 2012, the Board renewed the Fund’s share repurchase authority up to 644,764 shares (10% of its then issued and outstanding shares) in the open market through September 6, 2013. Repurchases can be made only when the Fund’s shares are trading at less than NAV and at such times and amounts as it is believed to be in the best interest of the Fund’s stockholders.
During the six months ended June 30, 2013 and the years ended December 31, 2012 and December 31, 2011, the Fund did not repurchase any shares under the share repurchase program.
6. Borrowings
On February 25, 2013, the Fund renewed its financing arrangement with Scotiabank (Ireland) Ltd (the ‘Lender’), which was originally entered into on February 27, 2012. Under this arrangement, the Lender provides a secured, committed credit facility in the aggregate amount of $17.5 million to the Fund. No compensating balances are required. The Fund has paid an upfront loan arrangement fee of $17,500, as required under this agreement. Interest on borrowings, if any, will be payable at 1.25% plus the London Interbank Offered Rate (‘LIBOR’). Interest on unutilized amounts will be payable at 0.25% if the unutilized amounts are equal to or less than 50% of the committed amount and 0.35% if the unutilized amounts are greater than 50% of the committed amount. At June 30, 2013, the interest rate on outstanding borrowings was 1.43%. This agreement is in effect until February 25, 2015. The credit agreement governing the credit facility includes usual and customary covenants for this type of transaction.
Borrowings outstanding from the secured, committed credit facility and average borrowings from the credit facility for the six months ended June 30, 2013, were as follows:
| | | | | | | | | | | | | | | | | | | | |
Outstanding
Borrowings at
June 30, 2013 | | Weighted
Average
Borrowings
For Days Drawn Upon | | | Average
Interest
Rate on
Borrowings | | | Number of
Days
Outstanding | | | Interest
Expense on
Borrowings | | | Interest
Expense on
Unutilized Amounts | |
$14,500,000 | | $ | 11,437,500 | | | | 1.43 | % | | | 170 | | | $ | 104,321 | | | $ | 6,535 | |
The maximum borrowings during the six months ended June 30, 2013 was $17,500,000, from February 25 to May 20, 2013. Interest expense to non-affiliates in the Statement of Operations includes interest expense on borrowings and unutilized amounts during the six months ended June 30, 2013.
7. Risks and Uncertainties
i) China Region — Investing in securities of “China Region companies” may include certain risks and considerations not typically associated with investing in U.S. securities. In general, China Region companies are companies organized in the People’s Republic of China, the Hong Kong Special Administrative Region, the Macau Special Administrative Region or Taiwan (the “China Region”) or for which the principal securities trading market is in the China Region; or companies, regardless of where organized, which have 50% or more of their assets in, or derive 50% or more of their revenues or profits from, the China Region. Such risks include fluctuating currency values and changing local and regional economic, political and social conditions, which may result in greater market volatility. In addition, these securities may not be as liquid as U.S. securities. At June 30, 2013, the Fund had 51.9%, 37.8% and 22.5%, based on total net assets, of its total investments invested in China, Hong Kong and Taiwan, respectively.
| | | | | | |
| | | |
| 20 | | | | JF CHINA REGION FUND, INC. | | JUNE 30, 2013 |
ii) Foreign Transactions — Foreign security and currency transactions may involve certain considerations and risks not typically associated with those of U.S. dollar denominated transactions as a result of, among other factors, the level of governmental supervision and regulation of foreign securities markets and the possibility of political or economic instability.
iii) Direct Investments in China A-Share Securities — The China Securities Regulatory Commission (“CSRC”) may grant qualified foreign institutional investor (“QFII”) licenses, which allow foreign investments in A-shares on the Shanghai and Shenzhen Stock Exchanges and certain other securities historically not eligible for investment by non-Chinese investors. Each QFII is authorized to invest in China A-shares only up to a specified quota established by the Chinese State Administration of Foreign Exchange (“SAFE”). JF Asset Management Limited has a QFII license permitting it to invest a specific portion of the assets of certain funds (which may include the Fund) in local Chinese securities. Although the laws of China permit the use of nominee accounts for clients of QFIIs, the Chinese regulators require the general securities trading and settlement accounts to be maintained in the name of the QFII. As the Fund is permitted to invest in China A-Shares, the Fund’s local custodian bank maintains a specific sub-account for the A-share investments in the name of the Fund. This amount is included in Deposits at broker in the Statement of Assets and Liabilities. However, there is a risk that creditors of the QFII and its affiliates (each, a “JP Morgan Affiliate”) may assert that a JP Morgan Affiliate, and not the Fund, has recourse against the securities and other assets in the account and/or sub-accounts. If a court upholds such an assertion, creditors of a JP Morgan Affiliate could seek payment from the Fund’s A-share investments.
Additional risks for the Fund’s A-share investments include a potential lack of liquidity, greater price volatility, and restrictions on the repatriation of invested capital. Because of low trading volume and various restrictions on the free flow of capital into the A-share market, the China A-share market could be less liquid and trading prices of A-shares could be more volatile than other local securities markets. In addition, net realized profits on fund investments in A-shares may only be repatriated under certain conditions and upon the approval of SAFE. Rules regarding taxation of investments in mainland China are unsettled and may be subject to change. Changes in the taxation of A-shares could materially affect the Fund’s performance.
iv) Other — In the normal course of business, the Fund may enter into contracts that provide general indemnifications. The maximum exposure under these arrangements is dependent on future claims that may be made against the Fund and, therefore, cannot be estimated; however, based on experience, the risk of any loss from such claims is considered remote.
8. Tax Status
U.S. Federal Income Taxes — No provision for federal income taxes is required since the Fund intends to continue to qualify as a regulated investment company under subchapter M of the Internal Revenue Code and distribute substantially all of its taxable income. Management has reviewed the Funds tax positions for all open tax years and has determined that as of June 30, 2013, no liability for income tax is required in the fund’s financial statements for net unrecognized tax benefits. However, management’s conclusions may be subject to future review based on changes in, or the interpretation of, the accounting standards or tax laws and regulations. The Fund’s Federal tax returns for the prior three fiscal years remain subject to examination by the Internal Revenue Service.
Under the Regulated Investment Company Modernization Act of 2010 (the “Act”), net capital losses recognized by the Fund after December 31, 2010, may get carried forward indefinitely, and retain their character as short-term and/or long term losses. Prior to the Act, pre-enactment net capital losses incurred by the Fund were carried forward for eight years and treated as short-term losses. The Act requires that post-enactment net capital losses be used before pre-enactment net capital losses.
At December 31, 2012, the Fund had post-enactment net capital loss carryforwards of $4,764,340 related to short-term losses.
At December 31, 2012, the Fund had pre-enactment net capital loss carryforwards of $10,450,827, expiring during 2017, which are available to offset future realized gains.
| | | | | | | | |
| | | |
| JUNE 30, 2013 | | JF CHINA REGION FUND, INC. | | | | | 21 | |
RESULTS OF THE ANNUAL STOCKHOLDERS‘ MEETING
The Fund held its annual stockholders’ meeting on May 9, 2013. At this meeting, stockholders re-elected Alexander R. Hamilton and John R. Rettberg to the Fund’s Board of Directors, the results of which are set out below.
I) Election of Directors
| | | | | | | | | | | | | | | | | | | | |
| Nominees | | Votes For | | | Votes Against | | | Votes Withheld | | | Shares Not
Voted | | | Total Voting Shares | |
| Alexander R. Hamilton | | | 5,455,053 | | | | 326,882 | | | | — | | | | 665,702 | | | | 6,447,637 | |
| John R. Rettberg | | | 5,731,716 | | | | 50,219 | | | | — | | | | 665,702 | | | | 6,447,637 | |
OTHER INFORMATION
Fundamental Investment Restriction on Borrowing
On May 12, 2011, shareholders of the Fund approved a change to the Fund’s fundamental investment restrictions to permit, inter alia, the Fund to borrow up to 20% of its net assets for investment purposes.
This gives the Investment Advisor flexibility to take advantage of additional investment opportunities when it believes that the return from the additional investment would exceed the cost of borrowing. If the Fund borrows money, it may be exposed to additional risks. If the return on securities purchased with borrowed funds is less than the borrowing costs of those funds, then the use of borrowing will detract from Fund performance. In particular, borrowing will magnify losses in times of negative performance. Nonetheless, the Investment Advisor may maintain leverage if it expects that the long-term benefits to investors of maintaining leverage outweigh any current reduced return. Borrowing may also increase the Fund’s interest and other expenses. Finally, the use of borrowing would subject the Fund to additional restrictions imposed by lenders and the Investment Company Act of 1940 on the Fund’s investments.
The Investment Advisor will utilize borrowed monies at its discretion and under the supervision of the Board. The Investment Advisor has agreed to waive any entitlement to a management fee on any cash held when borrowings are drawn under a borrowing facility.
The entire text of the Fund’s fundamental investment restriction on borrowing is as follows:
“Under its fundamental investment restrictions, the Fund may not: Issue senior securities, borrow or pledge its assets, except that the Fund may (i) borrow from a bank for the purpose of obtaining amounts necessary to make distributions for qualification as a registered investment company to avoid imposition of an excise tax under United States tax law; and (ii) borrow money (including through reverse repurchase agreements) up to the maximum amount permitted under the Investment Company Act of 1940 (a) for temporary or emergency purposes, (b) for such short-term credits as may be necessary for the clearance or settlement of transactions, (c) for repurchases of its Common Stock and (d) for investment purposes, provided that amounts borrowed under this clause shall not exceed 20% on the net assets of the Fund. The Fund may also pledge its assets to secure such borrowings. Notwithstanding the above, initial and variation margin in respect of futures contracts and options thereon and any collateral arrangement in respect of options on securities or indexes will not be prohibited by this paragraph 3 or any other investment restrictions.”
Information About Portfolio Holdings
The Fund files its complete schedule of portfolio holdings with the U.S. Securities and Exchange Commission (the ‘Commission’) for the first and third quarters of each fiscal year on Form N-Q. The Fund’s Forms N-Q are available on the Commission’s website at http://www.sec.gov and may be reviewed and copied at the Commission’s Public Reference Room in Washington, DC. Information on the operation of the Public Reference Room may be obtained by calling 1-800-SEC-0330. The Fund’s Forms N-Q are also available on the Fund’s website at www.jfchinaregion.com.
| | | | | | |
| | | |
| 22 | | | | JF CHINA REGION FUND, INC. | | JUNE 30, 2013 |
Proxy Voting Policies and Procedures and Proxy Voting Record
A description of the policies and procedures that are used by the Fund’s investment advisor to vote proxies relating to the Fund’s portfolio securities is available (1) without charge, upon request, by calling +44 20 7742 3735; and (2) as an exhibit to the Fund’s annual report on Form N-CSR which is available on the website of the Securities and Exchange Commission (the “Commission”) at http://www.sec.gov. Information regarding how the investment adviser votes these proxies is now available by calling the same number and on the Commission’s website. The Fund has filed its report on Form N-PX covering the
Fund’s proxy voting record for the 12 month period ended June 30, 2013.
Certifications
Simon J. Crinage, as the Fund’s President, has certified to the New York Stock Exchange that, as of July 8, 2013, he was not aware of any violation by the Fund of applicable NYSE corporate governance listing standards. The Fund’s reports to the Commission on Forms N-CSR and N-CSRS contain certifications by the Fund’s principal executive officer and principal financial officer that relate to the Fund’s disclosure in such reports and that are required by Rule 30a-2(a) under the 1940 Act.
| | | | | | | | |
| | | |
| JUNE 30, 2013 | | JF CHINA REGION FUND, INC. | | | | | 23 | |
FUND MANAGEMENT
Information pertaining to the Directors and officers of the Fund is set forth below.
| | | | | | | | |
Name, (DOB), Address and
Position(s) with Fund | | Term of
Office and
Length of
Time Served | | Principal Occupation(s) During
Past 5 Years | | Number of
Portfolios in
Fund Complex
Overseen by
Director* | | Other Trusteeships/
Directorships Held by Director |
Independent Directors | | | | |
| | | | |
| The Rt. Hon. The Earl of Cromer (June 3, 1946) Finsbury Dials 20 Finsbury Street London, EC2Y 9AQ United Kingdom Chairman and Class I Director | | Three year term ends in 2015; Chairman and Director since 1994. | | Chairman of the Board of the Fund; Chairman of the Board, Western Provident Association (insurance), LG India Plus Fund Ltd (financial), Pedder Street Asia Absolute Return Fund Limited (financial); LG Asia Plus Fund Limited (financial); Director, Cheetah Korea Value Fund Ltd (financial) and Chief Executive Officer, Cromer Associates Limited (family business). | | 1 | | See Principal Occupation. |
| | | | |
| Alexander R. Hamilton (October 4, 1941) P.O. Box 12343 General Post Office Hong Kong Class II Director | | Three year term ends in 2016; Director since 1994. | | Director of Citic Pacific Limited (infrastructure), Cosco International Holdings Limited (shipping), Esprit Holdings Limited (clothing retail), Shangri-La Asia Limited (hotels) and Octopus Cards Limited (financial services). Former Director of China Cosco Holdings Co. Limited (shipping). | | 1 | | See Principal Occupation. |
| | | | |
| Julian M. I. Reid (August 7, 1944) Finsbury Dials, 20 Finsbury Street London, EC2Y 9AQ United Kingdom Class III Director | | Three year term ends in 2014; Director since 1998. | | Chief Executive Officer of 3a Funds Group (financial); Director and Chairman of Morgan’s Walk Properties Limited (property); Director and Chairman of The Korea Fund, Inc. (financial); Director and Chairman of Prosperity Voskhod Fund (financial); Director and Chairman of ASA Limited (financial) and Director of 3a Global Growth Fund Limited (financial). | | 1 | | See Principal Occupation. |
| | | | | | |
| | | |
| 24 | | | | JF CHINA REGION FUND, INC. | | JUNE 30, 2013 |
| | | | | | | | |
Name, (DOB), Address and
Position(s) with Fund | | Term of
Office and
Length of
Time Served | | Principal Occupation(s) During
Past 5 Years | | Number of
Portfolios in
Fund Complex
Overseen by
Director* | | Other Trusteeships/
Directorships Held by Director |
Independent Directors (continued) | | | | |
| | | | |
John R. Rettberg (September 1, 1937) 1 Beacon St. Boston, MA 02108
USA
Class II Director | | Term ends in 2016; Director since 2008 | | Former Trustee, JPMorgan Alternative Products mutual fund Board. | | 1 | | None. |
Interested Director & President of the Fund | | | | |
| | | | |
| Simon J. Crinage (May 10, 1965) Finsbury Dials, 20 Finsbury Street London, EC2Y 9AQ United Kingdom Class I Director and President | | Term as Director ends in 2015; Director since May, 2009 & President since 2003 | | Managing Director, J.P. Morgan Asset Management. | | 1 | | None. |
| * | The Fund is the only fund in the Fund Complex. |
| | | | | | | | |
| | | |
| JUNE 30, 2013 | | JF CHINA REGION FUND, INC. | | | | | 25 | |
FUND MANAGEMENT
(continued)
Information pertaining to the officers of the Fund is set forth below.
| | | | |
Name, (DOB), Address and
Position(s) with Fund | | Term of Office and
Length of Time Served | | Principal Occupation(s) During Past 5 Years |
Officers who are not Directors |
| | |
Michael J. James
(May 11, 1967)
8 Connaught Road
Central/Hong Kong
Treasurer | | Since 2006** | | Treasurer of the Fund; Executive Director, J.P. Morgan Asset Management. |
| | |
Lucy Dina
(January 15, 1977)
Finsbury Dials,
20 Finsbury Street
London, EC2Y 9AQ
United Kingdom
Secretary | | Since 2013** | | Secretary of the Fund; Associate, J.P. Morgan Asset Management. |
| | |
Muriel Y.K. Sung
(September 25, 1966)
8 Connaught Road
Central/Hong Kong
Chief Compliance Officer | | Since 2004** | | Chief Compliance Officer of the Fund;
Managing Director, J.P. Morgan Asset Management. |
| ** | | The officers of the Fund serve at the discretion of the Board. |
| | | | | | |
| | | |
| 26 | | | | JF CHINA REGION FUND, INC. | | JUNE 30, 2013 |
DIVIDEND REINVESTMENT AND CASH PURCHASE PLAN
(Unaudited)
The Fund operates an optional Dividend Reinvestment and Cash Purchase Plan (the ‘Plan’) whereby:
| | a) | shareholders may elect to receive dividend and capital gain distributions in the form of additional shares of the Fund (the Share Distribution Plan). |
| | b) | shareholders may make optional payments (any amount between $100 and $3,000) which will be used to purchase additional shares in the open market (the Share Purchase Plan). |
For a copy of the Plan brochure, as well as a dividend reinvestment authorization card, please contact the Plan Agent:
Computershare Trust Company, N.A.
P. O. Box 43010
Providence, RI 02940-3010
USA Telephone No.: 800-426-5523 (toll-free)
www.computershare.com
The following should be noted with respect to the Plan:
If you participate in the Share Distribution Plan, whenever the Board of Directors of the Fund declares an income dividend or net capital gain distribution, you will automatically receive your distribution in newly issued shares (cash will be paid in lieu of fractional shares) if the market price of the shares on the date of the distribution is at or above the net asset value of the shares. The number of shares to be issued to you by the Fund will be determined by dividing the amount of the cash distribution to which you are entitled (net of any applicable withholding taxes) by the greater of the net asset value (‘NAV’) per share on such date or 95% of the market price of a share on such date. If the market price of the shares on such a distribution date is below the NAV, the Plan Agent will, as agent for the participants, buy shares on the open market, on the New York Stock Exchange or elsewhere, for
the participant’s account on, or after, the payment date. There is no service charge for purchases under this Plan.
For U.S. federal income tax purposes, shareholders receiving newly issued shares pursuant to the Share Distribution Plan will be treated as receiving income or capital gains in an amount equal to the fair market value (determined as of the distribution date) of the shares received and will have a cost basis equal to such fair market value. Shareholders receiving a distribution in the form of shares purchased in the open market pursuant to the Plan will be treated as receiving a distribution of the cash distribution that such shareholder would have received had the shareholder not elected to have such distribution reinvested and will have a cost basis in such shares equal to the amount of the distribution.
There will be no brokerage charge to participants for shares issued directly by the Fund under the Plan. Each participant will pay a pro rata share of brokerage commissions incurred with respect to the Plan Agent’s open market purchases of shares in connection with the Plan. The Fund will pay the fees of the Plan Agent for handling the Plan.
You may terminate your account under the Share Distribution Plan by notifying the Plan Agent in writing. The Plan may be terminated by the Plan Agent or the Fund with notice to you at least 30 days prior to any record date for the payment of any distribution by the Fund. Upon any termination, the Plan Agent will deliver a certificate or certificates for the full shares held for you under the Plan and a cash adjustment for any fractional shares.
You also have the option of instructing the Plan Agent to make semi-annual cash purchases of shares in the open market. There is a service charge of $1.25 for each purchase under this Share Purchase Plan.
| | | | | | | | |
| | | |
| JUNE 30, 2013 | | JF CHINA REGION FUND, INC. | | | | | 27 | |
DIRECTORS AND ADMINISTRATION
(Unaudited)
| | |
| Officers and Directors | | The Rt. Hon. The Earl of Cromer — Director and Chairman of the Board and Management Engagement Committee Simon J. Crinage — Director and President Alexander R. Hamilton — Director and Chairman of the Audit Committee and Pricing Committee Julian M. I. Reid — Director John R. Rettberg — Director Michael J. James — Treasurer Lucy J. Dina — Secretary Muriel Y.K. Sung — Chief Compliance Officer |
| |
| Investment Advisor | | JF International Management Inc. P.O. Box 3151 Road Town, Tortola British Virgin Islands |
| |
| Administrator | | JPMorgan Chase Bank, N.A. 1 Beacon Street, 18th Floor Boston, Massachusetts 02108 U.S.A. |
| |
| Custodian | | JPMorgan Chase Bank N.A. 1 Beacon Street, 18th Floor Boston, Massachusetts 02108 U.S.A. |
| |
Independent Registered Public
Accounting Firm | | PricewaterhouseCoopers LLP 300 Madison Avenue New York, New York 10017 U.S.A. |
| |
| Legal Counsel | | Dechert LLP New York: 1095 Avenue of the Americas New York, New York 10036 U.S.A. |
| |
| | Hong Kong: 27/F Henley Building 5 Queens Road Central Hong Kong |
| |
| Registrar, Transfer Agent, and Dividend Paying Agent | | Computershare Trust Company, N.A. P. O. Box 43010 Providence, Rhode Island 02940-3010 U.S.A. |
Notice is hereby given in accordance with Section 23(c) of the Investment Company Act of 1940, as amended, that from time to time the Fund may purchase shares of its common stock in the open market.
www.jfchinaregion.com
| | | | | | |
| | | |
| 28 | | | | JF CHINA REGION FUND, INC. | | JUNE 30, 2013 |

This report, including the financial statements herein, is sent to the stockholders of the Fund for their information. It is not a prospectus, circular or representation intended for use in the purchase or sale of shares of the Fund or of any securities mentioned in this report.
© JPMorgan Chase & Co., 2013 All rights reserved. June 30.
Not required for this filing.
| ITEM 3. | AUDIT COMMITTEE FINANCIAL EXPERT. |
Not required for this filing.
| ITEM 4. | PRINCIPAL ACCOUNTANT FEES AND SERVICES. |
Not required for this filing.
| ITEM 5. | AUDIT COMMITTEE OF LISTED REGISTRANTS. |
Not required for this filing.
| ITEM 6. | SCHEDULE OF INVESTMENTS |
(a) Schedule of Investments is included as part of Item 1.
(b) Not applicable to the Fund.
| ITEM 7. | DISCLOSURE OF PROXY VOTING POLICIES AND PROCEDURES FOR CLOSED-END MANAGEMENT INVESTMENT COMPANIES. |
Not required for this filing.
| ITEM 8. | PORTFOLIO MANAGERS OF CLOSED-END MANAGEMENT INVESTMENT COMPANIES. |
| | (a) | Not applicable to a semiannual report. |
| | (b) | There has been no change, as of the date of this filing, in any of the portfolio managers identified in response to paragraph (a)(1) of this Item in the registrant’s most recently filed annual report on Form N-CSR. |
| ITEM 9. | PURCHASE OF EQUITY SECURITIES BY CLOSED-END MANAGEMENT INVESTMENT COMPANY AND AFFILIATED PURCHASERS. |
Not applicable to the Fund.
| ITEM 10. | SUBMISSION OF MATTERS TO A VOTE OF SECURITY HOLDERS. |
There have been no material changes to the procedures by which the shareholders may recommend nominees to the Fund’s board of directors since the Fund filed its last form N-CSR.
| ITEM 11. | CONTROLS AND PROCEDURES. |
(a) The Fund’s principal executive and principal financial officers have concluded that the Fund’s disclosure controls and procedures (as defined in Rule 30a-3(c) under the Investment Company Act of 1940, as amended (the “1940 Act”) (17 CFR 270.30a-3(c))) are effective, as of a date within 90 days of the filing date of this Form N-CSR based on their evaluation of these controls and procedures required by Rule 30a-3(b) under the 1940 Act (17 CFR 270.30a-3(b)) and Rules 13a-15(b) or 15d-15(b) under the 1934 Act (17 CFR 240.13a-15(b) or 240.15d-15(b)).
(b) There were no changes in the Fund’s internal control over financial reporting (as defined in Rule 30a-3(d) under the 1940 Act (17 CFR 270.30a-3(d))) that occurred during the Fund’s second fiscal quarter that has materially affected, or is reasonably likely to materially affect, the Fund’s internal control over financial reporting.
(a)(1) Not required for this filing.
(a)(2) Certifications pursuant to Rule 30a-2(a) under the Investment Company Act of 1940.
(a)(3) Not required for this filing.
(a)(4) Not required for this filing.
(b) The certifications required by Rule 30a-2(b) of the 1940 Act and Section 906 of the Sarbanes-Oxley Act of 2002 are attached hereto.
SIGNATURES
Pursuant to the requirements of the Securities Exchange Act of 1934 and the Investment Company Act of 1940, the registrant has duly caused this report to be signed on its behalf by the undersigned, thereunto duly authorized.
| | |
| JF China Region Fund, Inc. |
| |
| By: | | /s/ Simon Crinage |
| | Simon Crinage |
| | President and Principal Executive Officer |
| | September 6, 2013 |
Pursuant to the requirements of the Securities Exchange Act of 1934 and the Investment Company Act of 1940, this report has been signed below by the following persons on behalf of the registrant and in the capacities and on the dates indicated.
| | |
| By: | | /s/ Simon Crinage |
| | Simon Crinage |
| | President and Principal Executive Officer |
| | September 6, 2013 |
| |
| By: | | /s/ Michael J. James |
| | Michael J. James |
| | Treasurer and Principal Financial Officer |
| | September 6, 2013 |