UNITED STATES
SECURITIES AND EXCHANGE COMMISSION
Washington, D.C. 20549
FORM N-CSR
CERTIFIED SHAREHOLDER REPORT OF REGISTERED
MANAGEMENT INVESTMENT COMPANIES
Investment Company Act file number: 811-06686
JPMorgan China Region Fund, Inc.
(Exact name of registrant as specified in charter)
One Beacon Street, 18th Floor
Boston, MA 02108
(Address of principal executive offices) (Zip code)
Dechert LLP
1095 Avenue of the Americas
New York, NY 10036
(Name and Address of Agent for Service)
Registrant’s telephone number, including area code: (800) 441-9800
Date of fiscal year end: December 31
Date of reporting period: January 1, 2015 through June 30, 2015
ITEM 1. REPORTS TO STOCKHOLDERS.
The following is a copy of the report transmitted to shareholders pursuant to Rule 30e-1 under the Investment Company Act of 1940 (17 CFR 270.30e-1).
This report, including the financial statements herein, is sent to the stockholders of the Fund for their information. It is not a prospectus, circular or representation intended for use in the purchase or sale of shares of the Fund or of any securities mentioned in this report.

Semi-Annual Report
June 30, 2015 (Unaudited)


CONTENTS
OBJECTIVES
JPMorgan China Region Fund, Inc. (the ‘Fund’) seeks to achieve long-term capital appreciation through investments primarily in equity securities of companies with substantial assets in, or revenues derived from, the People’s Republic of China (‘China’), Hong Kong, Taiwan and Macau — collectively, the ‘China Region’.
The Fund provides investors with an opportunity to participate in the growing economies of the China Region where the economies of China, Hong Kong, Taiwan and Macau have become increasingly linked over recent years. Hong Kong enterprises have made substantial investments in China, particularly where labor and land prices are lower than in Hong Kong. Similarly, many Chinese companies have Hong Kong based subsidiaries with securities listed on the Hong Kong Stock Exchange (H-shares). Renminbi denominated China A-shares, which are listed in China, are available for acquisition by the Fund by direct investment up to $20m at the time of original investment (in April 2012). The current value of these holdings reflects any capital appreciation or depreciation since the initial investment. In addition, the Fund can make indirect China A-share investments up to 10% of the Fund’s total assets through exposure to China A-share investment companies. Further details on China A-shares are provided in note 7(iii) of the Notes to Financial Statements on page 26.
The Fund invests to take advantage of the many opportunities that result from this linkage among the markets of the China Region.
MANAGEMENT
JF International Management Inc. (‘JFIMI’) is the investment management company appointed to advise and manage the Fund’s portfolio (the ‘Investment Advisor’). JFIMI is part of JPMorgan Chase & Co. (‘JPMC’), one of the world’s premier financial services institutions. In asset management, JPMC operates globally under the name of J.P. Morgan Asset Management (‘JPMAM’). Funds under management for the global asset management business of JPMAM were US$1.8 trillion as of June 30, 2015.
The Fund’s lead portfolio manager is Emerson Yip, a Senior Portfolio Manager within JPMAM’s Greater China investment team in Hong Kong.
| | | | | | | | |
| | | |
| JUNE 30, 2015 | | JPMORGAN CHINA REGION FUND, INC. | | | | | 1 | |
FORWARD-LOOKING STATEMENTS
This report contains certain forward-looking statements within the meaning of Section 21E of the Securities Exchange Act of 1934. Forward-looking statements include statements regarding the goals, beliefs, plans or current expectations of the Fund and JFIMI and their respective representatives, taking into account the information currently available to them. Forward-looking statements include all statements that do not relate solely to current or historical fact. For example, forward-looking statements include the use of words such as ‘anticipate,’ ‘estimate,’ ‘intend,’ ‘expect,’ ‘believe,’ ‘plan,’ ‘may,’ ‘should,’ ‘would,’ or other words that convey uncertainty of future events or outcomes. Forward-looking statements involve known and unknown risks, uncertainties and other factors that may cause the actual results, performance or achievements of the Fund to be materially different from any future results, performance or achievements expressed or implied by the forward-looking statements. Factors that could materially and negatively affect the results, performance or achievements of the Fund include changes in economic, political, legal and regulatory conditions in the China Region and elsewhere, changes in interest and exchange rates and related policies and other risks. When evaluating the information included in this report, you are cautioned not to place undue reliance on these forward-looking statements, which reflect the judgment of the Fund, JFIMI or its respective representatives only as of the date hereof. The Fund, JFIMI and their respective representatives undertake no obligation to publicly revise or update these forward-looking statements to reflect events and circumstances that arise after the date hereof.
|
| MARKET INFORMATION |
The Fund is listed on the New York Stock Exchange (symbol JFC). The share price is published in • The Wall Street Journal (daily online at www.WSJ.com/Free) |
The estimated net asset value is published in • The Wall Street Journal under “Closed-End Funds” (every Saturday) • www.jpmchinaregionfund.com |
| | | | | | |
| | | |
| 2 | | | | JPMORGAN CHINA REGION FUND, INC. | | JUNE 30, 2015 |
HIGHLIGHTS (unaudited)
| | | | | | | | |
| | | JUNE 30, 2015
US$ (Unaudited) | | | DECEMBER 31, 2014
US$ (Audited) | |
Net Assets | | | $144.9 million | | | | $125.0 million | |
Net Asset Value Per Share | | | $22.47 | | | | $19.39 | |
| | |
Market Data | | | | | | | | |
Share Price on the New York Stock Exchange | | | $18.83 | | | | $16.91 | |
Discount to Net Asset Value | | | 16.2% | | | | 12.8% | |
| | |
Total Return for the Six Months Ended June 30, 2015 | | | | | | | | |
Net Asset Value | | | | | | | +15.9% | |
Share Price | | | | | | | +11.4% | |
| | |
JFC Benchmark Index* | | | | | | | +14.5% | |
MSCI Hong Kong Index | | | | | | | +11.9% | |
MSCI China Index | | | | | | | +14.8% | |
MSCI Taiwan Index | | | | | | | +5.2% | |
CSI 300 Index | | | | | | | +27.4% | |
|
Net Asset Value and Share Price vs. Benchmark Index | |
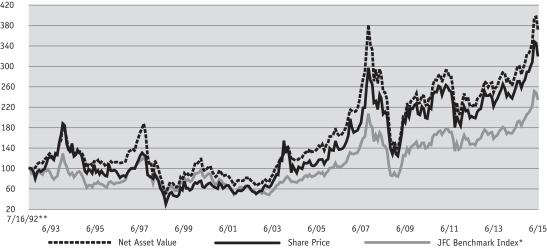
| * | | JFC Benchmark Index: 80% MSCI Golden Dragon Index (Net) 20% CSI 300 Index (Net). Prior to October 1, 2013, 80% MSCI Golden Dragon Index (GDR) +20% CSI 300 Index (Total). Prior to April 13, 2012, the MSCI Golden Dragon Index (Total). At December 31, 2011 the MSCI Golden Dragon Index (Total) comprised 24.1% of the MSCI Hong Kong Index (Total), 42.7% of the MSCI China Index (Total) and 33.2% of the MSCI Taiwan Index (Total). Prior to March 2001, 25% Taiwan Weighted Index, 20% BNP Paribas China Index, 50% MSCI Hong Kong, 5% HSBC; Prior to March 1999, 60% Hong Kong All Ordinaries, 30% Credit Lyonnais Securities Asia All China B Index, 10% Taiwan Weighted Index. Prior to January 1997, Peregrine Greater China Index. |
| ** | | Commencement of operations. |
Source: J.P. Morgan Asset Management.
| | | | | | | | |
| | | |
| JUNE 30, 2015 | | JPMORGAN CHINA REGION FUND, INC. | | | | | 3 | |
CHAIRMAN’S STATEMENT
JUNE 30, 2015 (Unaudited)
Dear fellow Stockholder,
Performance
The Greater China markets ended the six months to June 30, 2015 in positive territories, despite periods of volatility. China A-shares led gains, rising over 27% during the period, overcoming a few sharp corrections driven by regulatory crackdowns on margin financing. The onshore sell-offs spilled over to the offshore-listed equities and domestic Hong Kong equities, compounded by concerns over Greece, whilst further relaxation of monetary policy and fiscal stimulus helped support market performance. Additional capital market liberalization measures encouraged cross-borders flows buoying Hong Kong equities. Taiwan also advanced, although tech weakness offset some of the gains.
Against this backdrop, I am pleased to report that the Fund achieved a positive net asset value (‘NAV’) return of +15.9% in the six months to June 30, 2015. This was ahead of the return of +14.5% from the Fund’s benchmark1 representing an outperformance of 1.4% over the same period. The outperformance relative to the benchmark was largely attributable to positive allocation decisions and stock selection in Hong Kong and Taiwan, further details of which are provided in the Investment Advisor’s Report on pages 5 to 9 of this report. Over the same period, the Fund’s share price rose by 11.4%, which when compared against the Fund’s NAV return resulted in a widening of the discount from 12.8% to 16.2%. This was not surprising given the volatility and uncertainty in the China A-share market during the period.
Leverage
On February 25, 2015, your Board renewed the Fund’s US$17.5m credit facility with Scotiabank (Ireland) Ltd (‘Scotiabank’) for a further two year period. Under this arrangement, Scotiabank provides a secured, committed credit facility which can be utilized at any time. On July 10, 2015, given the growth in your fund’s net assets, this facility was increased to US$22m. This financing arrangement gives the Investment Advisor the flexibility to manage tactically borrowed monies at his discretion under the supervision of the Board. Since the beginning of the reporting period and up to
June 30, 2015 the Fund’s equity exposure ranged from 109.4% to 112.1%, and at the time of writing is 107.8%.
Outlook
Your Board believes the macro environment in the Greater China region will further stabilise from very low levels, underpinned by easing monetary and fiscal policies in China. The three interest rate cuts since last November have effectively boosted property sales, which should drive an eventual rebound in fixed asset investment. We also continue to see progress on the structural reform front with additional commitments to help local governments deleverage. The recent market corrections are expected to be temporary as the Chinese government has taken a series of measures to boost market confidence, including cutting interest rates, the Reserve Requirement Ratio (‘RRR’), transaction fees and rationalisation of brokers’ margin financing requirements. Despite possible near term pressure from the domestic China market, Hong Kong equities remain attractively valued and should benefit from more capital market liberalization measures such as mutual fund recognition and the further growth of Shanghai-Hong Kong Stock Connect. Your Investment Advisor remains positive on the Taiwan market given its muted performance to date and moderate valuations.
With its recent easing moves, China’s government continues to show that it is targeting the equity market as an instrument of both stimulus and economic reform. After the recent market correction, valuations for certain secular growth names have become attractive; your Investment Advisor is selectively buying while being mindful of extremely high volatility given the interplay between government liquidity support, profit-taking and perceived loss avoidance. From a bottom-up stock selection basis, your Investment Advisor continues to demonstrate interesting ideas that are leveraged to both the region’s secular growth and the Chinese government’s reform agenda.
Respectfully submitted
The Rt. Hon. The Earl of Cromer
Chairman
August 27, 2015
| 1. | | 80% MSCI Golden Dragon Index (net) and 20% CSI 300 Index (net). |
For more information please refer to the Fund’s website at www.jpmchinaregionfund.com
| | | | | | |
| | | |
| 4 | | | | JPMORGAN CHINA REGION FUND, INC. | | JUNE 30, 2015 |
INVESTMENT ADVISOR’S REPORT
In the first half of 2015, the Fund achieved a total return on net assets of 15.9% (in USD terms), outperforming the benchmark return of 14.5% by 1.3%.
During the review period, country allocation contributed to outperformance, driven by our overweight position in China, including A-shares. Positive stock selection in Taiwan and Hong Kong was somewhat offset by weaker stock choices in China.
At the stock level, in China, the Fund benefited from an overweight position in a basket of A-share names, such as Hangzhou Hikvision and media names of China South Publishing and Zhejiang Huace Film. We feel these names have fundamental support and believe in the long-term outlook of the media holdings as proxies to consumption in China. Another key contributor to performance was an overweight position in CAR INC, an auto rental company in China that rose by almost 60% in the first half of the year on strong structural demand growth. We were also correctly underweight in China Shenhua Energy and Petrochina, which both fell early in the year in line with weak energy prices. Our overweight position in financials such as China Merchants Bank and Ping An Insurance also helped performance as they continued to benefit from a favorable liquidity environment. In Taiwan, we continued to see strength in stocks geared to the Apple i-Phone food-chain, as overweight positions in lens maker Largan Precision and casing supplier Catcher Technology helped as the stocks rose on a positive earnings outlook. Underweight positions in several other technology stocks which we felt had limited growth prospects, such as Inotera Memories and flat panel producers also contributed to performance.
Meanwhile, an overweight position in Alibaba Group was a key detractor to performance over the first half of the year. The stock, which is not in the benchmark, fell early in the year after missing elevated earnings expectations. China Minsheng Bank hurt performance as well as the stock corrected after the President resigned to cooperate in an
anti-corruption investigation. Our underweight position in China Mobile was another notable detractor, as the stock rose due to stronger-than-expected 4G subscriber additions. Several of our Taiwan technology overweight positions, such as memory chip producer Nanya Technology and power component supplier Delta Electronics, disappointed over the quarter on releasing poorer than expected earnings. In Hong Kong, one of the largest detractors from performance was an underweight position in Hong Kong Exchanges, which fared well over the quarter given strong trading activity in Hong Kong as the Southbound leg of Shanghai-Hong Kong Stock Connect saw increased participation. Shipping company Orient Overseas International also hurt performance as the stock fell due to concerns over weak shipping rates.
China
Market Performance
Chinese equities rallied in the first quarter of 2015, with offshore-listed equities up 8%, continuing the rally of the final quarter of 2014. The key catalysts were accommodative policy in terms of both cyclical stimulus (easing monetary/fiscal policies) and structural reforms (pertaining to Local Government Finance Vehicle (‘LGFV’) debt swaps and deposit insurance, for example), despite the macroeconomic backdrop remaining weak. The gains have been led by both cyclical names (beneficiaries of policy easing) as well as growth sectors. On the macro front, concurrent indicators remain weak. January-February industrial production (up 6.8% year on year) and fixed-asset investment (up 13.9% year on year) both reached new post 2008-09 global financial crisis lows, due to still very high real interest rates as well as muted infrastructure spending (affected by anti-corruption campaigns). January’s consumer price inflation falling below 1% (posing a potential deflection risk) has prompted more monetary easing. The People’s Bank of China (‘PBOC’) implemented one more rate cut (since November 2014) as well as a
| | | | | | | | |
| | | |
| JUNE 30, 2015 | | JPMORGAN CHINA REGION FUND, INC. | | | | | 5 | |
INVESTMENT ADVISOR’S REPORT (continued)
first reduction in reserve ratio requirements, both in February. M2 (money supply) growth in February at 12.5% year on year marked an improvement from January’s 10.8% year-on-year levels. Earnings revisions continued to be negative, led by energy (due to the global oil price declines), materials, and staples, as a result of demand headwinds. Sectors seeing positive earnings revisions included non-bank financials (benefiting from underlying equity market strength) and transportation (also a beneficiary of oil price weakness).
Despite a rollercoaster second quarter, Chinese equities ended the period with offshore-listed equities up 4.2%. The offshore market was dragged down in June by A-shares and renewed concerns over Greece. On the macro front, concurrent indicators showed some signs of stabilisation from a very low base, thanks to monetary easing. May M2 money supply accelerated to 10.8% year on year vs. April’s 10.1%. May’s industrial production (6.1%) was higher than April (5.9%) and March (5.6%, post global financial crisis low). Fixed asset investment rebounded slightly to 9.9% after April’s sharp slowdown to 9.6% from March 13.2%. Retail sales stabilised at 10.1% in May vs. 10% in April. Earnings revisions remained negative, in line with weak economic conditions, with industrials and materials representing the main detractors. Sectors with positive revisions were led by brokers and insurance as underlying fundamentals continued to strengthen.
A-shares
In the first quarter of 2015, the domestic A-share market (CSI 300 Index) rallied, up 15% over the period. Despite a correction in January after regulators suspended new margin account openings, A-shares rebounded in February and continued their strength in March. Expectations of further relaxation of monetary policies and additional fiscal stimulus including domestic infrastructure investment and increasing external demand from the new “One Belt One Road” initiative pushed the market higher.
In the second quarter of 2015, onshore A-shares finished up 10.4%. The market surged in April and May as the Chinese government continued its monetary easing and fiscal stimulus measures. The progress on mutual recognition to sell mutual funds cross-border between Hong Kong and China also encouraged liquidity provisions that buoyed mainland stock markets. The gains were somewhat offset by sharp corrections that came in the second half of June after touching new highs in the middle of the month as regulators increased scrutiny on margin financing. The government stepped in to support the market but market sentiment took a hit. Valuations, however, for certain secular growth names have become more attractive.
Market Outlook
We expect the macro environment to further stabilise from very low levels, underpinned by easing monetary and fiscal policies. The three interest rate cuts since last November have effectively boosted property sales. Twenty-five out of thirty-one cities surveyed reported median volume up 71% year on year through end of June. We anticipate further room for monetary easing. After three cuts to the RRR in this easing cycle, 18.5% is still at very high levels compared to the 16% low of 2009 and the 6% level of the 1999 cycle. Recovering property sales should eventually lead new property construction to turn positive, driving a rebound in fixed asset investment.
On the structural reform front, we have also seen good progress. A second trillion debt swap has been announced, demonstrating the government’s commitment to help local governments deleverage. Another major milestone we expect would be an IPO registration system to be launched late this year or early next year, making equity market access much easier for the more productive private sector.
Market valuations at 11X forward one-year price — earnings are undemanding (vs. mid cycle 12X). We
| | | | | | |
| | | |
| 6 | | | | JPMORGAN CHINA REGION FUND, INC. | | JUNE 30, 2015 |
believe the recent sharp A-share market sell-off has been caused by the government crackdown on grey market margin financing. The sell-off should be temporary as the government has taken a series of measures to boost market confidence, including cutting interest rates and RRR recently, reducing transaction fees, and the rationalisation of brokers‘ margin financing business.
Hong Kong
Market Performance
Most of the gains in Hong Kong equities during the first quarter occurred during January, driven by proposed corporate restructuring. The market witnessed explosive growth in turnover towards the end of the quarter, spurred by rule clarifications regarding easier participation from mainland-based mutual funds in the Stock Connect programme. However, the primary beneficiaries of the ensuing stock rally were China-related stocks rather than Hong Kong equities. The surprise announcement of the re-organisation of Cheung Kong and Hutchison Whampoa led to a share price appreciation due to the elimination of a holding company discount and the enhanced ability to undertake corporate actions following the restructure. Moreover, companies with similar restructuring potential also benefited from market speculation. As largely expected, the Hong Kong Monetary Authority announced further tightening measures at the end of February, primarily targeting mortgages on homes selling for under HKD 7 million. However, new property launches following the announcement of these measures were positively received as developers were able to take on additional financing while secondary property volumes were reduced. Retail sales in Hong Kong appear to be in structural decline as December sales fell 4% year over year, while in January and February combined, sales fell 2%, reflecting weakness in overnight visitor growth and per capita spending. Hong Kong appears to be losing its share of mainland tourists to Japan, Korea, and Taiwan, owing in part
to relative currency strength. Gaming revenues continued on their recent downward spiral, with declines worse than expected for each of the three months. Broker downgrades have generally lagged the weakness of the underlying results.
Hong Kong equities began the second quarter with a sharp rally sparked ostensibly by the clarification of the rules on domestic mainland China funds investing in Hong Kong equities under the Stock Connect programme. Market turnover set record highs on multiple fronts, including full utilisation of the southbound quota for the first time. However, at quarter end, the market sold off on concerns over Greece’s potential exit from the eurozone, coupled with a substantial market correction in the domestic China equity market. The de-listing of Hutchison Whampoa as part of the group reorganisation was positively received by the market. BOC Hong Kong also announced a sweeping re-focus — officially announcing its intention to sell its China operation in order to deploy more resources into growing its ASEAN business in conjunction with China’s “One Belt, One Road” initiative. The failure to pass the electoral reform package proposed by Beijing had little immediate impact on the market, with popular reaction rather muted. The retail sector in Hong Kong took another hit with the announcement of once-a-week restriction on visitors with Shenzhen resident visas. While this is targeted at parallel traders and should help to improve relations between local residents and mainland tourists, the change will nonetheless affect near-term tourist sales. In Macau, Galaxy Entertainment opened two new gaming properties in late May. These were generally well received, but failed to spark much new demand as June gaming revenue fell 36% year on year. However, the Macau government surprised the market with a relaxation of transit visa restrictions, exactly a year after they were first tightened. While the near-term impact will be modest, this represents the first positive policy to be introduced over the past year or so.
| | | | | | | | |
| | | |
| JUNE 30, 2015 | | JPMORGAN CHINA REGION FUND, INC. | | | | | 7 | |
INVESTMENT ADVISOR’S REPORT (continued)
Market Outlook
The Greek crisis and the correction in the China A-share market will continue to exert near-term pressure on Hong Kong equities. However, they remain attractive on a relative valuation basis and should also benefit from the enhanced cross-border flows from mutual fund recognition, which began on 1 July. Moreover, progress on the Shenzhen Connect programme remains on track, although the timing of the launch itself has become more uncertain. The office sector remains the brightest segment in the property space, as rental rates are set to increase given central office vacancy rates have already fallen to 2.3%, as long as the stock market correction does not detract from office demand. In Macau, the policy change on transit visas is a positive first step and largely removes the risk of a sustained long-term slide in gaming revenues. However, negative policy changes continue to affect the sector, including the proposed full smoking ban. Moreover, share valuations are not cheap, especially given likely earnings pressures in the first half.
Taiwan
Market Performance
The Taiex Index gained 3% in the first quarter. The Taiwanese market saw profit taking in the technology sector at the start of the year, particularly in stocks that are part of the Apple supply chain, following a very strong iPhone 6 launch late in the third quarter of last year, as well as concerns that the consumer technology product cycle will be much more moderate in 2015. However, the selling reversed quickly, with qualified foreign institutional investors (‘QFIIs’) becoming strong net buyers of Taiwanese stocks again. This trend reversal started in mid January as the Taiwanese market continued to deliver the best earnings revisions in the region (+5% vs. –2%), while still being seen as one of the most defensive of emerging markets, with a high dividend yield and a high current account surplus-
to-GDP ratio of 12-13%. However, there was a shift in technology sentiment again in the final two weeks of the quarter after softer guidance from Taiwan Semiconductor Manufacturing Company as well as concerns about Mediatek’s margins. Foreign investors led the selling in upstream technology stocks in late March. Domestically, the government decided to postpone the implementation of the big player tax until 2018. The tax was seen as an impediment to trading volume as high net worth investors had been avoiding the market ahead of the implementation of the tax. The Government policy on capital markets has remained supportive, with more proposals to enhance retail participation and market turnover, which provided some support for the over the counter (‘OTC’) market and domestic sectors. Most notably, Taiwan’s Financial Supervisory Commission (‘FSC’) allows more stocks for day trading and stock borrowing/lending (‘SBL’) while removing the current cap on retail margin trading. At the same time, the FSC announced that it would widen the daily stock up/down limit from 7% to 10% on 3 February 2015. The margin maintenance ratio was raised to 130% from 120%, along with higher price limits. The new daily limit is the first major revision to the stock limit in the past 25 years. The Central Bank of the Republic of China (‘CBC’) kept the policy rate unchanged at 1.875%, marking the fourteenth consecutive quarter that the CBC has kept the rate unchanged — one of the longest periods of an unchanged policy rate in history. On the exchange rate, the CBC said that it would keep the currency dynamically stable. It would not intentionally support either the appreciation or the depreciation of the currency.
During the second quarter, the Taiex Index trended higher in April, but failed to sustain this momentum in later sessions. The TWSE Index finished down 2.7% quarter on quarter. The strength in April was boosted by speculation over the establishment of a stock trading link between Taipei and Shanghai. Not surprisingly, financials were one of the strongest
| | | | | | |
| | | |
| 8 | | | | JPMORGAN CHINA REGION FUND, INC. | | JUNE 30, 2015 |
performers for the quarter. Besides being the biggest beneficiaries of a stock connect, financials reported stronger-than-expected first-quarter 2015 results. The market turned weak in May and June, with investors locking in profits ahead of the summer. Technology wrapped up the quarter with 4.5% quarter-on-quarter decline, with weakness in most sub-sectors on concerns over slower-than-expected first-half momentum. Besides weak sales of PCs and notebooks, sluggish smartphone demand from China and the emerging markets meant inventory digestion was taking longer than expected. Non-technology fared better in comparison, with gains in energy, textile, financials and food. The textile sub-sector was helped by the fast-growing leisurewear market in the US, while the China Securities Finance Corporation’s new Renminbi Qualified Foreign Institutional Investor measure is expected to benefit Taiwan.
Market Outlook
Market sentiment remains fragile, weighed down by the generally sluggish second quarter for technology and concerns over the second half of 2015. The only visibly positive area has been Apple iPhone’s supply chain, where sales of its current model surpassed expectations, and expectations for the replacement model remain high. As a whole, however, technology continues to suffer from weakness across the end markets for PCs, notebooks, TVs and smartphones.
For the financial sector, strong results so far have been driven largely by trading gains and low credit costs. However, the sustainability of these earnings will need to be closely monitored. Despite the shaky outlook, we maintain a constructive view given Taiwan’s muted performance within the region. The sluggish second quarter and concerns over the second half of 2015 should already have been partly priced in. Valuations are not stretched and, at the margin, domestic interest could shift back to Taiwan given the volatility of the China market.
| | | | | | | | |
| | | |
| JUNE 30, 2015 | | JPMORGAN CHINA REGION FUND, INC. | | | | | 9 | |
TOP TEN HOLDINGS
AT JUNE 30, 2015 (Unaudited)
| | | | |
| | | % OF
NET ASSETS | |
Tencent Holdings Ltd. | | | 5.7 | |
| Provides internet, mobile, and telecommunication value-added services in China. The company has an instant messaging community in China. Tencent also provides online advertising services. | | | | |
| |
Taiwan Semiconductor Manufacturing Co., Ltd. (‘TSMC’) | | | 5.3 | |
| Manufactures and markets integrated circuits. The company provides the following services: wafer manufacturing, wafer probing, assembly and testing, mask production and design services. The company’s integrated circuits are used in computer, communication, consumer electronics, automotive and industrial equipment industries. | | | | |
| |
China Construction Bank Corp. ‘A’ ‘H’ | | | 4.8 | |
| Provides a complete range of banking services and other financial services to individual and corporate customers. The bank’s services include retail banking, international settlement, project finance and credit card services. | | | | |
| |
Ping An Insurance Group Co. Ltd. ‘A’ ‘H’ | | | 4.0 | |
| Provides a variety of insurance service in China. The Company writes property, casualty, and life insurance. Ping An Insurance also offers financial services. | | | | |
| |
AIA Group Ltd. | | | 3.9 | |
| Offers insurance and financial services. The company writes life insurance for individuals and businesses, accident and health insurance, retirement planning, and wealth management services. | | | | |
| |
China Merchants Bank Co., Ltd. ‘A’ ‘H’ | | | 2.7 | |
| Provides a wide range of commercial banking services including deposits, loan, bill discount, government bonds underwriting and trading, interbank lending, letter of credit, bank guarantee, and other related services. | | | | |
| |
China Petroleum & Chemical Corp. | | | 2.0 | |
| Refines, produces and trades petroleum and petrochemical products such as gasoline, diesel, jet fuel, kerosene, ethylene, synthetic fibers, synthetic rubber, synthetic resins and chemical fertilizers. Also, the Company explores for and produces oil and natural gas in China. | | | | |
| |
CK Hutchison Holdings Ltd. | | | 1.9 | |
| Holds all of the non-property businesses of the Cheung Kong Group and the Hutchison Group, including ports and related services, telecommunications, retail, infrastructure, energy and movable assets leasing operations. | | | | |
| |
China Pacific Insurance Group Co., Ltd. ‘A’ ‘H’ | | | 1.8 | |
| Provides integrated insurance services. The Company offers life and property insurance products through its subsidiaries. | | | | |
| |
Fubon Financial Holding Co., Ltd. | | | 1.8 | |
| Provides financial holding services. The Company was formed through the merger of Fubon Insurance, Fubon Securities, Fubon Commercial Bank, and Fubon Life Assurance. | | | | |
| | | | | | |
| | | |
| 10 | | | | JPMORGAN CHINA REGION FUND, INC. | | JUNE 30, 2015 |
INVESTMENT PORTFOLIO
AT JUNE 30, 2015 (Unaudited)
| | | | | | | | |
| DESCRIPTION | | HOLDINGS
(IN SHARES) | | | VALUE
(IN US$) | |
COMMON STOCK (unless otherwise noted) | |
CHINA (61.5%) | |
Aerospace & Defense (0.4%) | |
AVIC Aircraft Co., Ltd., ‘A’ | | | 52,400 | | | | 368,262 | |
China Avionics Systems Co., Ltd., ‘A’ | | | 33,006 | | | | 185,921 | |
| | | | | | | | |
| | | | | | | 554,183 | |
| | | | | | | | |
Airlines (0.6%) | |
China Southern Airlines Co., Ltd., ‘A’ | | | 163,000 | | | | 382,199 | |
Spring Airlines Co., Ltd., ‘A’ | | | 21,400 | | | | 435,144 | |
| | | | | | | | |
| | | | | | | 817,343 | |
| | | | | | | | |
Auto Components (0.7%) | |
Fuyao Glass Industry Group Co., Ltd. (a) (e) | | | 257,200 | | | | 629,765 | |
Fuyao Glass Industry Group Co., Ltd., ‘A’ | | | 81,978 | | | | 188,784 | |
Huayu Automotive Systems Co., Ltd., ‘A’ | | | 65,900 | | | | 226,893 | |
| | | | | | | | |
| | | | | | | 1,045,442 | |
| | | | | | | | |
Automobiles (0.9%) | |
Chongqing Changan Automobile Co., Ltd., ‘A’ | | | 91,502 | | | | 312,090 | |
Chongqing Changan Automobile Co., Ltd., ‘B’ | | | 217,778 | | | | 557,119 | |
FAW CAR Co., Ltd., ‘A’ | | | 37,000 | | | | 148,453 | |
SAIC Motor Corp., Ltd., ‘A’ | | | 66,200 | | | | 241,271 | |
| | | | | | | | |
| | | | | | | 1,258,933 | |
| | | | | | | | |
Banks (14.0%) | |
Agricultural Bank of China Ltd. (a) | | | 3,031,000 | | | | 1,630,547 | |
Agricultural Bank of China Ltd., ‘A’ | | | 727,700 | | | | 435,376 | |
Bank of Communications Co., Ltd., ‘A’ | | | 699,800 | | | | 929,907 | |
China CITIC Bank Corp., Ltd. (a) | | | 1,564,000 | | | | 1,246,914 | |
China Construction Bank Corp. | | | 7,333,000 | | | | 6,697,711 | |
China Construction Bank Corp., ‘A’ | | | 270,000 | | | | 310,450 | |
China Merchants Bank Co., Ltd. | | | 856,000 | | | | 2,495,707 | |
China Merchants Bank Co., Ltd., ‘A’ | | | 445,981 | | | | 1,346,358 | |
China Minsheng Banking Corp., Ltd. | | | 1,307,900 | | | | 1,714,272 | |
China Minsheng Banking Corp., Ltd., ‘A’ | | | 408,900 | | | | 655,453 | |
Huaxia Bank Co., Ltd., ‘A’ | | | 100,000 | | | | 245,283 | |
Industrial Bank Co., Ltd., ‘A’ | | | 336,300 | | | | 935,523 | |
Ping An Bank Co., Ltd., ‘A’ | | | 315,202 | | | | 739,080 | |
| | | | | | | | |
| DESCRIPTION | | HOLDINGS
(IN SHARES) | | | VALUE
(IN US$) | |
Banks — continued | |
Shanghai Pudong Development Bank Co., Ltd., ‘A’ | | | 318,800 | | | | 871,932 | |
| | | | | | | | |
| | | | | | | 20,254,513 | |
| | | | | | | | |
Beverages (0.7%) | |
Kweichow Moutai Co., Ltd., ‘A’ (a) | | | 14,800 | | | | 614,936 | |
Luzhou Laojiao Co., Ltd., ‘A’ | | | 88,500 | | | | 465,407 | |
| | | | | | | | |
| | | | | | | 1,080,343 | |
| | | | | | | | |
Biotechnology (0.2%) | |
Hualan Biological Engineering, Inc., ‘A’ | | | 35,200 | | | | 251,412 | |
| | | | | | | | |
Capital Markets (2.9%) | |
China Cinda Asset Management Co., Ltd. (a) | | | 1,152,000 | | | | 642,019 | |
China Merchants Securities Co., Ltd., ‘A’ | | | 67,400 | | | | 287,599 | |
CITIC Securities Co., Ltd., ‘A’ | | | 235,737 | | | | 1,023,010 | |
GF Securities Co., Ltd., ‘A’ | | | 93,200 | | | | 340,426 | |
Haitong Securities Co., Ltd., ‘A’ (a) | | | 312,000 | | | | 1,096,855 | |
Huatai Securities Co., Ltd. (a) (e) | | | 168,400 | | | | 475,771 | |
Huatai Securities Co., Ltd., ‘A’ | | | 97,500 | | | | 363,679 | |
| | | | | | | | |
| | | | | | | 4,229,359 | |
| | | | | | | | |
Chemicals (0.3%) | |
Kingfa Sci & Tech Co., Ltd., ‘A’ | | | 86,000 | | | | 165,315 | |
Qinghai Salt Lake Industry Co., Ltd., ‘A’ | | | 62,249 | | | | 284,894 | |
| | | | | | | | |
| | | | | | | 450,209 | |
| | | | | | | | |
Commercial Services & Supplies (0.2%) | |
Beijing Originwater Technology Co., Ltd., ‘A’ | | | 37,000 | | | | 291,119 | |
| | | | | | | | |
Communications Equipment (0.3%) | |
Guangzhou Haige Communications Group, Inc. Co., ‘A’ | | | 55,300 | | | | 287,068 | |
ZTE Corp., ‘A’ | | | 48,800 | | | | 187,377 | |
| | | | | | | | |
| | | | | | | 474,445 | |
| | | | | | | | |
Construction & Engineering (1.6%) | |
China Communications Construction Co., Ltd., ‘A’ | | | 120,700 | | | | 341,799 | |
China Machinery Engineering Corp. | | | 498,000 | | | | 537,090 | |
China Railway Construction Corp., Ltd., ‘A’ | | | 152,700 | | | | 384,890 | |
SEE ACCOMPANYING NOTES TO FINANCIAL STATEMENTS.
| | | | | | | | |
| | | |
| JUNE 30, 2015 | | JPMORGAN CHINA REGION FUND, INC. | | | | | 11 | |
INVESTMENT PORTFOLIO
AT JUNE 30, 2015 (Unaudited) (continued)
| | | | | | | | |
| DESCRIPTION | | HOLDINGS
(IN SHARES) | | | VALUE
(IN US$) | |
COMMON STOCK — continued | |
Construction & Engineering — continued | |
China State Construction Engineering Corp., Ltd., ‘A’ | | | 378,000 | | | | 506,560 | |
Suzhou Gold Mantis Construction Decoration Co., Ltd., ‘A’ | | | 106,500 | | | | 484,153 | |
| | | | | | | | |
| | | | | | | 2,254,492 | |
| | | | | | | | |
Construction Materials (0.6%) | |
Anhui Conch Cement Co., Ltd., ‘A’ | | | 70,000 | | | | 242,138 | |
BBMG Corp. | | | 550,000 | | | | 556,986 | |
| | | | | | | | |
| | | | | | | 799,124 | |
| | | | | | | | |
Diversified Consumer Services (0.3%) | |
China Maple Leaf Educational Systems Ltd. | | | 1,264,000 | | | | 391,354 | |
| | | | | | | | |
Diversified Financial Services (0.1%) | |
Avic Capital Co., Ltd., ‘A’ | | | 50,000 | | | | 186,663 | |
| | | | | | | | |
Diversified Telecommunication Services (1.0%) | |
China Telecom Corp., Ltd. | | | 2,502,000 | | | | 1,468,622 | |
| | | | | | | | |
Electrical Equipment (0.1%) | |
Henan Pinggao Electric Co., Ltd., ‘A’ | | | 54,600 | | | | 198,818 | |
| | | | | | | | |
Electronic Equipment, Instruments & Components (1.2%) | |
AAC Technologies Holdings, Inc. | | | 118,500 | | | | 669,582 | |
Hangzhou Hikvision Digital Technology Co., Ltd., ‘A’ | | | 97,680 | | | | 705,703 | |
Shenzhen Deren Electronic Co., Ltd., ‘A’ | | | 26,500 | | | | 247,351 | |
Shenzhen O-film Tech Co., Ltd., ‘A’ (a) | | | 34,100 | | | | 185,540 | |
| | | | | | | | |
| | | | | | | 1,808,176 | |
| | | | | | | | |
Food & Staples Retailing (0.2%) | |
Yonghui Superstores Co., Ltd., ‘A’ (a) | | | 156,500 | | | | 292,507 | |
| | | | | | | | |
Food Products (1.5%) | |
China Mengniu Dairy Co., Ltd. | | | 233,000 | | | | 1,161,761 | |
Heilongjiang Agriculture Co., Ltd., ‘A’ | | | 69,000 | | | | 188,718 | |
Inner Mongolia Yili Industrial Group Co., Ltd., ‘A’ | | | 292,508 | | | | 891,534 | |
| | | | | | | | |
| | | | | | | 2,242,013 | |
| | | | | | | | |
Health Care Equipment & Supplies (0.1%) | |
Shinva Medical Instrument Co., Ltd., ‘A’ | | | 22,800 | | | | 215,572 | |
| | | | | | | | |
| | | | | | | | |
| DESCRIPTION | | HOLDINGS
(IN SHARES) | | | VALUE
(IN US$) | |
Health Care Providers & Services (1.5%) | |
Aier Eye Hospital Group Co., Ltd., ‘A’ | | | 36,466 | | | | 189,710 | |
iKang Healthcare Group, Inc. ADR (a) | | | 35,028 | | | | 677,441 | |
Phoenix Healthcare Group Co., Ltd. | | | 597,000 | | | | 1,136,769 | |
Searainbow Holding Corp., ‘A’ (a) | | | 20,500 | | | | 161,990 | |
| | | | | | | | |
| | | | | | | 2,165,910 | |
| | | | | | | | |
Hotels, Restaurants & Leisure (0.3%) | |
China International Travel Service Corp., Ltd., ‘A’ (a) | | | 25,050 | | | | 267,830 | |
Shenzhen Tempus Global Travel Holdings Ltd., ‘A’ | | | 30,740 | | | | 179,007 | |
| | | | | | | | |
| | | | | | | 446,837 | |
| | | | | | | | |
Household Durables (1.3%) | |
Gree Electric Appliances, Inc. of Zhuhai, ‘A’ (a) | | | 46,001 | | | | 474,031 | |
JANUS Dongguan Precision Components Co., Ltd., ‘A’ | | | 48,901 | | | | 295,567 | |
Midea Group Co., Ltd., ‘A’ | | | 70,500 | | | | 423,841 | |
Qingdao Haier Co., Ltd., ‘A’ (a) | | | 79,800 | | | | 390,313 | |
TCL Corp., ‘A’ | | | 375,000 | | | | 341,679 | |
| | | | | | | | |
| | | | | | | 1,925,431 | |
| | | | | | | | |
Independent Power & Renewable Electricity Producers (1.6%) | |
China Longyuan Power Group Corp., Ltd. | | | 1,134,000 | | | | 1,261,049 | |
China Yangtze Power Co., Ltd., ‘A’ | | | 209,000 | | | | 483,686 | |
GD Power Development Co., Ltd., ‘A’ (a) | | | 347,000 | | | | 390,032 | |
SDIC Power Holdings Co., Ltd., ‘A’ | | | 58,100 | | | | 139,333 | |
| | | | | | | | |
| | | | | | | 2,274,100 | |
| | | | | | | | |
Insurance (5.8%) | |
China Pacific Insurance Group Co., Ltd. | | | 459,600 | | | | 2,205,639 | |
China Pacific Insurance Group Co., Ltd., ‘A’ | | | 84,000 | | | | 408,825 | |
Ping An Insurance Group Co. of China Ltd. | | | 285,000 | | | | 3,849,488 | |
Ping An Insurance Group Co. of China Ltd., ‘A’ | | | 145,176 | | | | 1,918,355 | |
| | | | | | | | |
| | | | | | | 8,382,307 | |
| | | | | | | | |
Internet & Catalog Retail (0.3%) | |
Vipshop Holdings Ltd. ADR (a) | | | 16,200 | | | | 360,450 | |
| | | | | | | | |
SEE ACCOMPANYING NOTES TO FINANCIAL STATEMENTS.
| | | | | | |
| | | |
| 12 | | | | JPMORGAN CHINA REGION FUND, INC. | | JUNE 30, 2015 |
| | | | | | | | |
| DESCRIPTION | | HOLDINGS
(IN SHARES) | | | VALUE
(IN US$) | |
COMMON STOCK — continued | |
Internet Software & Services (6.2%) | |
Beijing Tensyn Digital Marketing Technology JSC, ‘A’ | | | 8,500 | | | | 183,324 | |
Tencent Holdings Ltd. | | | 414,800 | | | | 8,278,288 | |
Wangsu Science & Technology Co., Ltd., ‘A’ | | | 60,200 | | | | 450,650 | |
| | | | | | | | |
| | | | | | | 8,912,262 | |
| | | | | | | | |
IT Services (0.6%) | |
Beijing eGOVA Co., Ltd., ‘A’ | | | 48,600 | | | | 295,393 | |
Hand Enterprise Solutions Co., Ltd., ‘A’ (a) | | | 84,750 | | | | 331,975 | |
Wonders Information Co., Ltd., ‘A’ | | | 35,000 | | | | 277,246 | |
| | | | | | | | |
| | | | | | | 904,614 | |
| | | | | | | | |
Machinery (1.5%) | |
China Conch Venture Holdings Ltd. | | | 350,500 | | | | 804,858 | |
China Shipbuilding Industry Co., Ltd., ‘A’ (a) | | | 271,600 | | | | 648,231 | |
CRRC Corp., Ltd., ‘A’ | | | 95,490 | | | | 282,728 | |
Shanghai Mechanical and Electrical Industry Co., Ltd., ‘A’ | | | 25,000 | | | | 132,801 | |
Zhengzhou Yutong Bus Co., Ltd., ‘A’ | | | 75,000 | | | | 248,549 | |
| | | | | | | | |
| | | | | | | 2,117,167 | |
| | | | | | | | |
Media (0.7%) | |
Beijing Gehua CATV Network Co., Ltd., ‘A’ | | | 36,400 | | | | 184,906 | |
China South Publishing & Media Group Co., Ltd., ‘A’ | | | 73,500 | | | | 271,550 | |
Guangdong Advertising Co., Ltd., ‘A’ | | | 42,546 | | | | 173,313 | |
Zhejiang Huace Film & TV Co., Ltd., ‘A’ | | | 71,350 | | | | 310,668 | |
| | | | | | | | |
| | | | | | | 940,437 | |
| | | | | | | | |
Metals & Mining (1.4%) | |
Angang Steel Co., Ltd. | | | 950,000 | | | | 655,675 | |
Baoshan Iron & Steel Co., Ltd., ‘A’ | | | 227,000 | | | | 319,945 | |
Hebei Iron & Steel Co., Ltd., ‘A’ | | | 229,600 | | | | 259,184 | |
Jiangxi Copper Co., Ltd. | | | 361,000 | | | | 602,633 | |
Shenzhen Zhongjin Lingnan Nonfemet Co., Ltd., ‘A’ | | | 72,500 | | | | 217,348 | |
| | | | | | | | |
| | | | | | | 2,054,785 | |
| | | | | | | | |
Oil, Gas & Consumable Fuels (3.1%) | |
China Petroleum & Chemical Corp. | | | 3,407,400 | | | | 2,940,768 | |
China Shenhua Energy Co., Ltd., ‘A’ | | | 66,400 | | | | 223,261 | |
| | | | | | | | |
| DESCRIPTION | | HOLDINGS
(IN SHARES) | | | VALUE
(IN US$) | |
Oil, Gas & Consumable Fuels — continued | |
CNOOC Ltd. | | | 934,000 | | | | 1,325,412 | |
| | | | | | | | |
| | | | | | | 4,489,441 | |
| | | | | | | | |
Personal Products (0.2%) | |
Hengan International Group Co., Ltd. | | | 22,000 | | | | 261,393 | |
| | | | | | | | |
Pharmaceuticals (1.9%) | |
CSPC Pharmaceutical Group Ltd. | | | 986,000 | | | | 974,355 | |
Humanwell Healthcare Group Co., Ltd., ‘A’ | | | 34,900 | | | | 208,522 | |
Inner Mongolia Furui Medical Science Co., Ltd., ‘A’ (a) | | | 11,000 | | | | 159,634 | |
Jiangsu Hengrui Medicine Co., Ltd., ‘A’ | | | 70,094 | | | | 503,465 | |
Kangmei Pharmaceutical Co., Ltd., ‘A’ | | | 101,200 | | | | 289,352 | |
Tasly Pharmaceutical Group Co., Ltd., ‘A’ | | | 54,447 | | | | 436,911 | |
Zhejiang Huahai Pharmaceutical Co., Ltd., ‘A’ | | | 34,500 | | | | 173,863 | |
| | | | | | | | |
| | | | | | | 2,746,102 | |
| | | | | | | | |
Real Estate Management & Development (3.5%) | |
Beijing Capital Development Co., Ltd., ‘A’ | | | 75,000 | | | | 233,309 | |
China Fortune Land Development Co., Ltd., ‘A’ | | | 55,000 | | | | 270,077 | |
China Vanke Co., Ltd. | | | 825,100 | | | | 2,030,937 | |
China Vanke Co., Ltd., ‘A’ (a) | | | 200,500 | | | | 469,482 | |
Financial Street Holdings Co., Ltd.,‘A’ | | | 123,000 | | | | 280,276 | |
Poly Real Estate Group Co., Ltd., ‘A’ | | | 260,450 | | | | 479,655 | |
Sunac China Holdings Ltd. | | | 1,172,000 | | | | 1,283,650 | |
| | | | | | | | |
| | | | | | | 5,047,386 | |
| | | | | | | | |
Road & Rail (1.2%) | | | | | | | | |
CAR, Inc. (a) | | | 519,000 | | | | 1,104,747 | |
Daqin Railway Co., Ltd., ‘A’ | | | 141,980 | | | | 321,464 | |
Guangshen Railway Co., Ltd., ‘A’ | | | 195,800 | | | | 259,551 | |
| | | | | | | | |
| | | | | | | 1,685,762 | |
| | | | | | | | |
Software (0.6%) | |
Aisino Co., Ltd., ‘A’ | | | 46,500 | | | | 485,247 | |
Beijing Thunisoft Corp., Ltd., ‘A’ | | | 43,704 | | | | 308,768 | |
Hundsun Technologies, Inc., ‘A’ | | | 6,800 | | | | 122,874 | |
| | | | | | | | |
| | | | | | | 916,889 | |
| | | | | | | | |
SEE ACCOMPANYING NOTES TO FINANCIAL STATEMENTS.
| | | | | | | | |
| | | |
| JUNE 30, 2015 | | JPMORGAN CHINA REGION FUND, INC. | | | | | 13 | |
INVESTMENT PORTFOLIO
AT JUNE 30, 2015 (Unaudited) (continued)
| | | | | | | | |
| DESCRIPTION | | HOLDINGS
(IN SHARES) | | | VALUE
(IN US$) | |
COMMON STOCK — continued | |
Specialty Retail (0.7%) | |
China Harmony New Energy Auto Holding Ltd. | | | 578,000 | | | | 644,994 | |
Suning Commerce Group Co., Ltd., ‘A’ | | | 165,200 | | | | 407,605 | |
| | | | | | | | |
| | | | | | | 1,052,599 | |
| | | | | | | | |
Technology Hardware, Storage & Peripherals (0.1%) | |
BOE Technology Group Co., Ltd., ‘A’ (a) | | | 200,000 | | | | 167,392 | |
| | | | | | | | |
Trading Companies & Distributors (0.1%) | |
Xiamen C & D, Inc., ‘A’ | | | 73,208 | | | | 206,720 | |
| | | | | | | | |
Transportation Infrastructure (0.5%) | |
Shanghai International Airport Co., Ltd., ‘A’ | | | 72,000 | | | | 368,070 | |
Shenzhen Airport Co., ‘A’ (a) | | | 103,000 | | | | 187,363 | |
Sichuan Haite High-tech Co., Ltd., ‘A’ | | | 37,800 | | | | 138,070 | |
| | | | | | | | |
| | | | | | | 693,503 | |
| | | | | | | | |
Water Utilities (0.3%) | |
SIIC Environment Holdings Ltd. (a) | | | 3,131,300 | | | | 453,357 | |
| | | | | | | | |
Wireless Telecommunication Services (0.2%) | |
China United Network Communications Ltd., ‘A’ (a) | | | 218,000 | | | | 257,691 | |
| | | | | | | | |
TOTAL CHINA | | | | | | | 89,027,177 | |
| | | | | | | | |
HONG KONG (29.8%) | | | | | | | | |
Auto Components (0.4%) | | | | | | | | |
Xinyi Glass Holdings Ltd. | | | 1,104,000 | | | | 586,783 | |
| | | | | | | | |
Banks (2.7%) | |
BOC Hong Kong Holdings Ltd. | | | 423,500 | | | | 1,764,686 | |
Dah Sing Financial Holdings Ltd. | | | 120,169 | | | | 788,306 | |
Hang Seng Bank Ltd. | | | 50,100 | | | | 979,178 | |
HSBC Holdings plc | | | 34,947 | | | | 316,264 | |
| | | | | | | | |
| | | | | | | 3,848,434 | |
| | | | | | | | |
Commercial Services & Supplies (1.2%) | |
China Everbright International Ltd. | | | 925,000 | | | | 1,658,700 | |
| | | | | | | | |
Communications Equipment (0.2%) | |
VTech Holdings Ltd. | | | 24,400 | | | | 323,904 | |
| | | | | | | | |
| | | | | | | | |
| DESCRIPTION | | HOLDINGS
(IN SHARES) | | | VALUE
(IN US$) | |
Diversified Financial Services (1.5%) | |
Hong Kong Exchanges and Clearing Ltd. | | | 62,812 | | | | 2,217,023 | |
| | | | | | | | |
Diversified Telecommunication Services (1.9%) | |
China Unicom Hong Kong Ltd. | | | 1,072,000 | | | | 1,687,198 | |
CITIC Telecom International Holdings Ltd. | | | 913,000 | | | | 424,018 | |
HKBN Ltd. (a) | | | 218,000 | | | | 226,675 | |
HKT Trust & HKT Ltd. | | | 373,000 | | | | 438,849 | |
| | | | | | | | |
| | | | | | | 2,776,740 | |
| | | | | | | | |
Electric Utilities (0.7%) | |
Cheung Kong Infrastructure Holdings Ltd. | | | 121,000 | | | | 939,709 | |
| | | | | | | | |
Gas Utilities (0.9%) | |
China Resources Gas Group Ltd. | | | 442,000 | | | | 1,311,480 | |
| | | | | | | | |
Hotels, Restaurants & Leisure (0.7%) | |
Melco Crown Entertainment Ltd. ADR | | | 35,908 | | | | 704,874 | |
Sands China Ltd. | | | 91,200 | | | | 307,077 | |
| | | | | | | | |
| | | | | | | 1,011,951 | |
| | | | | | | | |
Household Durables (0.8%) | |
Man Wah Holdings Ltd. | | | 472,800 | | | | 464,166 | |
Techtronic Industries Co., Ltd. | | | 226,000 | | | | 740,549 | |
| | | | | | | | |
| | | | | | | 1,204,715 | |
| | | | | | | | |
Industrial Conglomerates (2.5%) | |
CK Hutchison Holdings Ltd. | | | 192,000 | | | | 2,821,216 | |
Shun Tak Holdings Ltd. | | | 1,468,000 | | | | 812,447 | |
| | | | | | | | |
| | | | | | | 3,633,663 | |
| | | | | | | | |
Insurance (4.5%) | |
AIA Group Ltd. | | | 870,400 | | | | 5,698,577 | |
China Taiping Insurance Holdings Co., Ltd. (a) | | | 235,400 | | | | 845,752 | |
| | | | | | | | |
| | | | | | | 6,544,329 | |
| | | | | | | | |
Marine (0.7%) | |
Orient Overseas International Ltd. | | | 187,000 | | | | 956,525 | |
| | | | | | | | |
Multiline Retail (0.4%) | |
Lifestyle International Holdings Ltd. | | | 297,000 | | | | 550,968 | |
| | | | | | | | |
Pharmaceuticals (1.0%) | |
Sino Biopharmaceutical Ltd. | | | 1,272,000 | | | | 1,476,866 | |
| | | | | | | | |
SEE ACCOMPANYING NOTES TO FINANCIAL STATEMENTS.
| | | | | | |
| | | |
| 14 | | | | JPMORGAN CHINA REGION FUND, INC. | | JUNE 30, 2015 |
| | | | | | | | |
| DESCRIPTION | | HOLDINGS
(IN SHARES) | | | VALUE
(IN US$) | |
COMMON STOCK — continued | |
Real Estate Investment Trusts (REITs) (1.4%) | |
Champion REIT | | | 872,000 | | | | 479,223 | |
Link REIT (The) | | | 170,000 | | | | 995,672 | |
Yuexiu Real Estate Investment Trust | | | 1,114,000 | | | | 613,655 | |
| | | | | | | | |
| | | | | | | 2,088,550 | |
| | | | | | | | |
Real Estate Management & Development (5.0%) | |
Cheung Kong Property Holdings Ltd. (a) | | | 204,000 | | | | 1,692,203 | |
Great Eagle Holdings Ltd. | | | 118,170 | | | | 440,572 | |
Hongkong Land Holdings Ltd. | | | 218,000 | | | | 1,787,600 | |
Kerry Properties Ltd. | | | 224,000 | | | | 878,482 | |
New World Development Co., Ltd. | | | 490,094 | | | | 641,104 | |
Sun Hung Kai Properties Ltd. | | | 69,000 | | | | 1,118,022 | |
Wheelock & Co., Ltd. | | | 120,000 | | | | 613,039 | |
| | | | | | | | |
| | | | | | | 7,171,022 | |
| | | | | | | | |
Specialty Retail (0.7%) | |
Chow Tai Fook Jewellery Group Ltd. | | | 863,600 | | | | 931,387 | |
| | | | | | | | |
Textiles, Apparel & Luxury Goods (0.7%) | |
Pacific Textiles Holdings Ltd. | | | 161,000 | | | | 257,133 | |
Samsonite International S.A. | | | 227,700 | | | | 787,244 | |
| | | | | | | | |
| | | | | | | 1,044,377 | |
| | | | | | | | |
Water Utilities (0.8%) | |
Beijing Enterprises Water Group Ltd. (a) | | | 1,480,000 | | | | 1,214,312 | |
| | | | | | | | |
Wireless Telecommunication Services (1.1%) | |
China Mobile Ltd. | | | 128,500 | | | | 1,645,300 | |
| | | | | | | | |
TOTAL HONG KONG | | | | | | | 43,136,738 | |
| | | | | | | | |
TAIWAN (17.5%) | | | | | | | | |
Banks (0.9%) | | | | | | | | |
E.Sun Financial Holding Co., Ltd. | | | 1,907,044 | | | | 1,273,238 | |
| | | | | | | | |
Chemicals (0.4%) | |
China Steel Chemical Corp. | | | 134,000 | | | | 603,672 | |
| | | | | | | | |
Diversified Financial Services (2.5%) | |
Chailease Holding Co., Ltd. | | | 457,000 | | | | 1,101,972 | |
Fubon Financial Holding Co., Ltd. | | | 1,308,989 | | | | 2,604,869 | |
| | | | | | | | |
| | | | | | | 3,706,841 | |
| | | | | | | | |
Electronic Equipment, Instruments & Components (2.5%) | |
Delta Electronics, Inc. | | | 279,000 | | | | 1,428,706 | |
Largan Precision Co., Ltd. | | | 19,000 | | | | 2,170,672 | |
| | | | | | | | |
| | | | | | | 3,599,378 | |
| | | | | | | | |
| | | | | | | | |
| DESCRIPTION | | HOLDINGS
(IN SHARES) | | | VALUE
(IN US$) | |
Food & Staples Retailing (0.7%) | |
President Chain Store Corp. | | | 146,000 | | | | 1,026,819 | |
| | | | | | | | |
Internet Software & Services (0.6%) | |
PChome Online, Inc. | | | 49,917 | | | | 825,088 | |
| | | | | | | | |
Leisure Products (0.3%) | |
Johnson Health Tech Co., Ltd. | | | 180,288 | | | | 418,955 | |
| | | | | | | | |
Semiconductors & Semiconductor Equipment (8.5%) | |
Advanced Semiconductor Engineering, Inc. | | | 1,432,802 | | | | 1,941,082 | |
Chipbond Technology Corp. | | | 418,000 | | | | 903,616 | |
Nanya Technology Corp. (a) | | | 335,000 | | | | 561,328 | |
Powertech Technology, Inc. | | | 232,000 | | | | 502,280 | |
Silicon Motion Technology Corp. ADR | | | 19,805 | | | | 685,451 | |
Taiwan Semiconductor Manufacturing Co., Ltd. | | | 1,691,057 | | | | 7,700,449 | |
| | | | | | | | |
| | | | | | | 12,294,206 | |
| | | | | | | | |
Technology Hardware, Storage & Peripherals (1.1%) | |
Catcher Technology Co., Ltd. | | | 131,000 | | | | 1,638,853 | |
| | | | | | | | |
TOTAL TAIWAN | | | | | | | 25,387,050 | |
| | | | | | | | |
TOTAL INVESTMENTS
(108.8% of Net Assets)
(Cost $121,436,255) | | | | | | | 157,550,965 | |
| | | | | | | | |
Liabilities in excess of other assets
(-8.8% of Net Assets) | | | | (12,689,535 | ) |
| | | | | | | | |
NET ASSETS (100.0%) | | | | | | | 144,861,430 | |
| | | | | | | | |
| | | | |
As of June 30, 2015, aggregate cost for Federal income tax purposes was $121,436,255. The aggregate unrealized gain for all securities is as follows: | |
Excess of value over cost | | | 39,453,954 | |
Excess of cost over value | | | (3,339,244 | ) |
| | | | |
Net unrealized gain | | | 36,114,710 | |
| | | | |
NOTES TO SCHEDULE OF PORTFOLIO INVESTMENTS:
| ADR – | American Depositary Receipt |
| (a) | Non-income producing security. |
| (e) | Security is exempt from registration under Rule 144A of the Securities Act of 1933, as amended. Unless otherwise indicated, this security has been determined to be liquid under procedures established by the Board of Directors and may be resold in transactions exempt from registration, normally to qualified institutional buyers. |
| A | China A shares (See Note 7.iii on page 26) |
| B | China B shares (See Note 7.iii on page 26) |
SEE ACCOMPANYING NOTES TO FINANCIAL STATEMENTS.
| | | | | | | | |
| | | |
| JUNE 30, 2015 | | JPMORGAN CHINA REGION FUND, INC. | | | | | 15 | |
STATEMENT OF ASSETS AND LIABILITIES
AS OF JUNE 30, 2015
| | | | |
| | | (in US$) | |
ASSETS: | | | | |
Investments in non-affiliates, at value (cost $121,436,255) | | | 157,550,965 | |
Cash | | | 629,952 | |
Foreign currency, at value (cost $1,863,959) | | | 1,863,043 | |
Deposits at broker (See Note 7.iii.) | | | 28,444 | |
Receivable for securities sold | | | 2,262,807 | |
Dividends receivable | | | 1,116,499 | |
| | | | |
Total Assets | | | 163,451,710 | |
| | | | |
| |
LIABILITIES: | | | | |
Loan payable to bank (See Note 6) | | | 17,500,000 | |
Payables | | | | |
Payable for securities purchased | | | 379,090 | |
Accrued Liabilities | | | | |
Deferred China capital gains tax | | | 514,259 | |
Investment advisory fees | | | 34,100 | |
Administration fees | | | 30,103 | |
Custodian and accounting fees | | | 24,377 | |
Directors’ fees and expenses | | | 5,645 | |
Interest on loan | | | 3,025 | |
Other | | | 99,681 | |
| | | | |
Total Liabilities | | | 18,590,280 | |
| | | | |
Net Assets | | | 144,861,430 | |
| | | | |
| |
| Net assets consist of: | | | | |
Common stock, $0.01 par value
(100,000,000 shares authorized; 6,447,637 shares issued and outstanding) | | | 64,476 | |
Paid-in capital | | | 98,994,144 | |
Undistributed net investment income | | | 2,184,738 | |
Accumulated realized gain on investments and foreign currency transactions | | | 7,518,152 | |
Accumulated net unrealized appreciation on investments, foreign currency holdings, and other
assets and liabilities denominated in foreign currencies | | | 36,099,920 | |
| | | | |
Net Assets | | | 144,861,430 | |
| | | | |
Net Asset Value Per Share ($144,861,430 ÷ 6,447,637) | | | 22.47 | |
| | | | |
SEE ACCOMPANYING NOTES TO FINANCIAL STATEMENTS.
| | | | | | |
| | | |
| 16 | | | | JPMORGAN CHINA REGION FUND, INC. | | JUNE 30, 2015 |
STATEMENT OF OPERATIONS
FOR THE SIX MONTHS ENDED JUNE 30, 2015 (Unaudited)
| | | | |
| | | (in US$) | |
INVESTMENT INCOME: | | | | |
Dividends from non-affiliates (net of foreign withholding tax of $204,183) | | | 2,016,526 | |
Interest income from non-affiliates | | | 718 | |
Interest income from affiliates | | | 594 | |
| | | | |
Total Investment Income | | | 2,017,838 | |
| | | | |
| |
EXPENSES: | | | | |
Investment advisory fees | | | 764,039 | |
Directors’ fees and expenses | | | 153,181 | |
Custodian and accounting fees | | | 107,201 | |
Interest expense to non-affiliates (See Note 6) | | | 92,456 | |
Legal fees | | | 57,905 | |
Administration fees | | | 43,820 | |
Audit fees | | | 35,675 | |
Insurance fees | | | 25,040 | |
Shareholder report fees | | | 17,833 | |
NYSE listing fees | | | 12,610 | |
Shareholder service fees | | | 8,296 | |
Interest expense to affiliates | | | 70 | |
Other expenses | | | 15,273 | |
| | | | |
Total Expenses | | | 1,333,399 | |
Less amounts waived | | | (8,712 | ) |
| | | | |
Net Expenses | | | 1,324,687 | |
| | | | |
Net Investment Income | | | 693,151 | |
| | | | |
| |
REALIZED AND UNREALIZED GAIN (LOSS) ON INVESTMENTS, FOREIGN CURRENCY
HOLDINGS AND OTHER ASSETS AND LIABILITIES DENOMINATED IN FOREIGN CURRENCIES: | | | | |
Net realized gain (loss) | | | | |
Investments in non-affiliates (net of China tax of $1,963 on realized loss) | | | 10,907,954 | |
Foreign currency transactions | | | 3,996 | |
| | | | |
Net realized gain (loss) | | | 10,911,950 | |
| | | | |
Net change in unrealized appreciation/depreciation | | | | |
Investments in non-affiliates (net of China tax of $15,874 on unrealized depreciation) | | | 8,234,549 | |
Foreign currency translations | | | (527 | ) |
| | | | |
Change in net unrealized appreciation/depreciation | | | 8,234,022 | |
| | | | |
Net realized and unrealized gain (loss) on investments, foreign currency holdings and other assets
and liabilities denominated in foreign currencies | | | 19,145,972 | |
| | | | |
Net increase in net assets resulting from operations | | | 19,839,123 | |
| | | | |
SEE ACCOMPANYING NOTES TO FINANCIAL STATEMENTS.
| | | | | | | | |
| | | |
| JUNE 30, 2015 | | JPMORGAN CHINA REGION FUND, INC. | | | | | 17 | |
STATEMENTS OF CHANGES IN NET ASSETS
FOR THE PERIODS INDICATED
| | | | | | | | |
| | | Six Months Ended
June 30, 2015
(Unaudited)
(in US$) | | | Year Ended
December 31, 2014
(in US$) | |
INCREASE IN NET ASSETS: | | | | | | | | |
Operations | | | | | | | | |
Net investment income | | | 693,151 | | | | 907,437 | |
Net realized gain (loss) on investment transactions | | | 10,911,950 | | | | 8,321,030 | |
Net change in unrealized appreciation (depreciation) on investments, foreign currency holdings and other assets and liabilities denominated in foreign currencies | | | 8,234,022 | | | | 5,177,093 | |
| | | | | | | | |
Net increase (decrease) in net assets resulting from operations | | | 19,839,123 | | | | 14,405,560 | |
| | | | | | | | |
| | |
DISTRIBUTIONS TO STOCKHOLDERS: | | | | | | | | |
Net investment income | | | — | | | | (818,850 | ) |
| | | | | | | | |
Total distributions to shareholders | | | — | | | | (818,850 | ) |
| | | | | | | | |
Total increase (decrease) in net assets | | | 19,839,123 | | | | 13,586,710 | |
| | | | | | | | |
| | |
NET ASSETS: | | | | | | | | |
Beginning of period | | | 125,022,307 | | | | 111,435,597 | |
| | | | | | | | |
End of period (including undistributed net investment income of $2,184,738 and $1,491,587, respectively) | | | 144,861,430 | | | | 125,022,307 | |
| | | | | | | | |
| | |
SHARE TRANSACTIONS | | | | | | | | |
Opening number of shares | | | 6,447,637 | | | | 6,447,637 | |
| | | | | | | | |
Closing number of shares | | | 6,447,637 | | | | 6,447,637 | |
| | | | | | | | |
SEE ACCOMPANYING NOTES TO FINANCIAL STATEMENTS.
| | | | | | |
| | | |
| 18 | | | | JPMORGAN CHINA REGION FUND, INC. | | JUNE 30, 2015 |
STATEMENT OF CASH FLOWS
FOR THE SIX MONTHS ENDED JUNE 30, 2015 (Unaudited)
| | | | |
| | | (in US$) | |
INCREASE (DECREASE) IN CASH | | | | |
Cash flows provided (used) by operating activities: | | | | |
Net increase/decrease in net assets from operations | | | 19,839,123 | |
Adjustments to reconcile net increase/decrease in net assets
from operations to net cash provided (used) by operating activities: | | | | |
Purchase of investment securities | | | (78,459,859 | ) |
Proceeds from disposition of investment securities | | | 76,700,443 | |
Change in unrealized (appreciation)/depreciation on investments in non-affiliates | | | (8,250,423 | ) |
Net realized (gain)/loss on investments | | | (10,909,918 | ) |
Increase in deposits at broker | | | (13 | ) |
Increase in dividends receivable | | | (1,067,271 | ) |
Increase in Deferred China capital gains tax | | | 17,838 | |
Decrease in accrued expenses and other liabilities | | | (145,962 | ) |
| | | | |
Net cash provided (used) by operating activities | | | (2,276,042 | ) |
| | | | |
| |
Cash flows provided (used) by financing activities: | | | | |
Proceeds from borrowings | | | 2,500,000 | |
| | | | |
Net cash provided (used) by financing activities | | | 2,500,000 | |
| | | | |
Net increase/decrease in cash | | | 223,958 | |
| | | | |
| |
Cash: | | | | |
Beginning of period (including foreign currency of $1,162,989) | | | 2,269,037 | |
| | | | |
End of period (including foreign currency of $1,863,043) | | | 2,492,995 | |
| | | | |
Supplemental disclosure of cash flow information:
For the six month period, the Fund paid $102,910 in interest expense, including $70 to affiliates.
For purposes of reporting the Statement of Cash Flows, the Fund considers all cash accounts that are not subject to withdrawal restrictions or penalties to be cash equivalents.
SEE ACCOMPANYING NOTES TO FINANCIAL STATEMENTS.
| | | | | | | | |
| | | |
| JUNE 30, 2015 | | JPMORGAN CHINA REGION FUND, INC. | | | | | 19 | |
FINANCIAL HIGHLIGHTS
FOR THE PERIODS INDICATED
| | | | | | | | | | | | | | | | | | | | | | | | |
| | | For the
Six Months
Ended
June 30,
2015
(Unaudited)
(in US$) | | | For the
Year Ended
December 31,
2014
(in US$) | | | For the
Year Ended
December 31,
2013
(in US$) | | | For the
Year Ended
December 31,
2012
(in US$) | | | For the
Year Ended
December 31,
2011
(in US$) | | | For the
Year Ended
December 31,
2010
(in US$) | |
For a share outstanding throughout each year: | | | | | | | | | | | | | | | | | | | | | | | | |
Net asset value, beginning of period | | | 19.39 | | | | 17.28 | | | | 15.47 | | | | 12.75 | | | | 17.41 | | | | 15.27 | |
| | | | | | | | | | | | | | | | | | | | | | | | |
Net investment income (loss) | | | 0.11 | | | | 0.14 | | | | 0.10 | | | | 0.08 | | | | 0.14 | | | | 0.05 | |
Net realized and unrealized gain (loss) | | | 2.97 | | | | 2.10 | | | | 1.84 | | | | 2.74 | | | | (4.70 | ) | | | 2.11 | |
| | | | | | | | | | | | | | | | | | | | | | | | |
Total from investment operations | | | 3.08 | | | | 2.24 | | | | 1.94 | | | | 2.82 | | | | (4.56 | ) | | | 2.16 | |
| | | | | | | | | | | | | | | | | | | | | | | | |
Dividends from net investment income | | | — | | | | (0.13 | ) | | | (0.13 | ) | | | (0.10 | ) | | | (0.10 | ) | | | (0.02 | ) |
| | | | | | | | | | | | | | | | | | | | | | | | |
Net asset value, end of period | | | 22.47 | | | | 19.39 | | | | 17.28 | | | | 15.47 | | | | 12.75 | | | | 17.41 | |
| | | | | | | | | | | | | | | | | | | | | | | | |
Market value, end of period | | | 18.83 | | | | 16.91 | | | | 15.16 | | | | 14.00 | | | | 11.02 | | | | 15.79 | |
| | | | | | | | | | | | | | | | | | | | | | | | |
Total Investment Return | | | | | | | | | | | | | | | | | | | | | | | | |
Per share market value | | | 11.4 | % | | | 12.5 | % | | | 9.2 | % | | | 28.2 | % | | | (29.6 | %) | | | 14.7 | % |
| | | | | | |
RATIOS/SUPPLEMENTAL DATA | | | | | | | | | | | | | | | | | | | | | | | | |
Net assets, end of period | | | 144,861,430 | | | | 125,022,307 | | | | 111,435,597 | | | | 99,728,043 | | | | 82,226,478 | | | | 112,248,790 | |
Ratio of net expenses to average net assets | | | 1.92 | % | | | 2.14 | % | | | 2.26 | % | | | 2.11 | % | | | 1.89 | % | | | 1.99 | % |
Ratio of net expenses to average net assets, excluding interest expense | | | 1.79 | % | | | 1.94 | % | | | 2.05 | % | | | 2.04 | % | | | 1.89 | % | | | 1.99 | % |
Ratios of net investment income to average net assets | | | 1.01 | % | | | 0.82 | % | | | 0.61 | % | | | 0.54 | % | | | 0.87 | % | | | 0.32 | % |
Portfolio turnover rate | | | 50.9 | % | | | 86.7 | % | | | 66.6 | % | | | 85.8 | % | | | 66.8 | % | | | 76.1 | % |
Number of shares outstanding at end of period (in thousands) | | | 6,448 | | | | 6,448 | | | | 6,448 | | | | 6,448 | | | | 6,448 | | | | 6,448 | |
| * | The total investment return excludes the effect of commissions. Dividends and distributions, if any, are assumed for the purpose of this calculation to be reinvested at prices obtained under the Fund’s dividend reinvestment plan or if specified in accordance with the terms of the distribution. |
SEE ACCOMPANYING NOTES TO FINANCIAL STATEMENTS.
| | | | | | |
| | | |
| 20 | | | | JPMORGAN CHINA REGION FUND, INC. | | JUNE 30, 2015 |
NOTES TO FINANCIAL STATEMENTS
AT JUNE 30, 2015
1. Organization and Capital
JPMorgan China Region Fund, Inc. (the ‘Fund’) was incorporated in the State of Maryland on May 22, 1992, and is registered as a non-diversified, closed-end management investment company under the Investment Company Act of 1940 (‘1940 Act’). The Fund commenced operations on July 16, 1992.
The Fund seeks to achieve long-term capital appreciation through investments primarily in equity securities of companies with substantial assets in, or revenues derived from, the People’s Republic of China (‘China’), Hong Kong, Taiwan and Macau — collectively, the ‘China Region’.
2. Significant Accounting Policies
The following significant accounting policies, which are in conformity with U.S. generally accepted accounting principles (‘GAAP’), are consistently followed by the Fund in the preparation of its financial statements.
The Fund is an investment company and, accordingly, follows the investment company accounting and reporting guidance of the Financial Accounting Standards Board Accounting Standards Codification Topic 946 — Investment Companies, which is part of GAAP.
The preparation of financial statements in conformity with GAAP requires management to make estimates and assumptions that affect the reported amounts of assets and liabilities and disclosure of contingent assets and liabilities at the date of the financial statements and the reported amounts of increases and decreases in net assets from operations during the reported period. Actual results could differ from these estimates.
i) Security Valuation — All securities for which market quotations are readily available are valued at the last sales price prior to the time of determination or, if no sales price is available at that time, at the mean between the last current bid and ask prices. Securities that are traded over-the-counter are valued, if bid and ask quotations are available, at the mean between the current bid and ask prices. Certain investments of the Fund may, depending upon market conditions, trade in relatively thin markets and/or in markets that experience significant volatility. As a result of these conditions, the prices used by the Fund to value securities may differ from the value that would be realized if these securities were sold and the differences could be material. All other securities and assets are valued at fair value as determined in good faith by the Board of Directors. It is possible that the estimated values may differ significantly from the values that would have been used had a ready market for the investments existed, and such differences could be material. In valuing the Fund’s assets, quotations of foreign securities in a foreign currency are translated to United States (‘U.S.’) dollar equivalents at the prevailing exchange rate in effect on the valuation date. Investments in open ended mutual funds are valued at current day’s closing net asset value per share (‘NAV’).
Valuations reflected in this report are as of the report date. As a result, changes in valuation due to market events and/or issuer related events after the report date and prior to issuance of the report are not reflected herein.
The various inputs that are used in determining the fair value of the Fund’s investments are summarized into the three broad levels listed below.
| • | | Level 1 — quoted prices in active markets for identical securities |
| • | | Level 2 — other significant observable inputs (including quoted prices for similar securities, interest rates, prepayment speeds, credit risk, etc.) |
| • | | Level 3 — significant unobservable inputs (including the Fund’s own assumptions in determining the fair value of investments) |
| | | | | | | | |
| | | |
| JUNE 30, 2015 | | JPMORGAN CHINA REGION FUND, INC. | | | | | 21 | |
NOTES TO FINANCIAL STATEMENTS
AT JUNE 30, 2015 (continued)
A financial instrument’s level within the fair value hierarchy is based on the lowest level of any input, both individually and in the aggregate, that is significant to the fair value measurement. The inputs or methodology used for valuing securities are not necessarily an indication of the risk associated with investing in those securities.
The following table represents each valuation input as presented on the Investment Portfolio:
| | | | | | | | | | | | | | | | |
| | | Level 1
Quoted prices | | | Level 2
Other significant
observable inputs | | | Level 3
Significant
unobservable inputs | | | Total | |
Total Investments in Securities (a) | | $ | 157,550,965 | | | $ | — | | | $ | — | | | $ | 157,550,965 | |
| | | | | | | | | | | | | | | | |
| (a) | All portfolio holdings are designated as Level 1 are disclosed individually on the SOI. Please refer to the Investment Portfolio for industry specifics of portfolio holdings. |
ii) Foreign Currency Translation — The books and records of the Fund are maintained in U.S. dollars. Foreign currency amounts are translated into U.S. dollars at the mid-market price of such currencies against U.S. dollars as follows:
| • | | investments, other assets, and liabilities at the prevailing rates of exchange on the valuation date; |
| • | | investment transactions and investment income at the prevailing rates of exchange on the dates of such transactions. |
Although the net assets of the Fund are presented at the foreign exchange rates and market values at the close of the period, the Fund does not isolate that portion of the results of operations arising as a result of changes in the foreign exchange rates from the fluctuations arising from changes in the market prices of the securities held. Similarly, the Fund does not isolate the effect of changes in foreign exchange rates from the fluctuations arising from changes in the market prices of securities sold during the period. Accordingly, realized and unrealized foreign currency gains (losses) are included in the reported net unrealized appreciation/depreciation on investments. The Fund does isolate the effect of changes in foreign exchange rates from fluctuations when determining realized gain or loss for sales of fixed income securities.
Unrealized currency gains (losses) resulting from valuing foreign currency denominated assets and liabilities at period-end exchange rates are reflected as a component of accumulated net unrealized gain (loss) on investments, foreign currency holdings, and other assets and liabilities denominated in foreign currencies.
iii) Restricted and Illiquid Securities — Certain securities held by the Fund may be subject to legal or contractual restrictions on resale or are illiquid. Restricted securities generally may be resold in transactions exempt from registration under the Securities Act of 1933 (the ‘Securities Act’). Illiquid securities are securities which cannot be disposed of promptly (within seven days) and in the usual course of business at approximately its fair value and include, but are not limited to, repurchase agreements maturing in excess of seven days, time deposits with a withdrawal penalty, non-negotiable instruments and instruments for which no market exists. Disposal of these securities may involve time-consuming negotiations and expense. Prompt sale at the current valuation may be difficult and could adversely affect the net assets of the Fund.
iv) Distribution of Income and Gains — The Fund intends to distribute to stockholders, at least annually, substantially all of its net investment income and expects to distribute annually any net long-term capital gains in excess of net short-term capital losses.
Income and capital gain distributions are determined in accordance with Federal income tax regulations and may differ from those determined in accordance with GAAP.
v) Other — Security transactions are accounted for on trade date. Realized gains and losses on the sale of investment securities are determined on the identified cost basis. Interest income is recognized on the accrual basis. Dividend income, net of foreign taxes withheld, if any, is recorded on the ex-dividend date or when the Fund first learns of the dividend.
| | | | | | |
| | | |
| 22 | | | | JPMORGAN CHINA REGION FUND, INC. | | JUNE 30, 2015 |
NOTES TO FINANCIAL STATEMENTS
AT JUNE 30, 2015 (continued)
vi) Foreign Taxes — The Fund may be subject to foreign taxes on income, gains on investments or currency purchases/repatriation, a portion of which may be recoverable. The Fund will accrue such taxes and recoveries as applicable, based upon its current interpretation of tax rules and regulations that exist in the markets in which it invests.
As described in Note 7.iii, the Fund invests in China A-shares, which are separately identified in the Investment Portfolio.
On November 14, 2014, the People’s Republic of China (‘PRC’) Ministry of Finance, State Administration of Taxation and China Securities Regulatory Commission jointly issued notices confirming that they would no longer seek to claim 10% capital gains tax (‘CGT’) on foreign institutional investors who trade China A-shares. The Fund’s policy has been to accrue 100% of the contingent CGT liability for all realized and unrealized gains in A Shares and B Shares.
Further to these announcements and in accordance with J.P. Morgan’s recommendation, the Fund’s Board approved the following PRC tax provisioning policy with effect from November 17, 2014:
| | 1. | PRC income tax will no longer be provided for gains realized from sale of China A-shares on or after November 17, 2014. |
| | 2. | PRC income tax will not be provided for unrealized gains of China A-shares. |
| | 3. | Full provision (10%) CGT will be provided for all realized and unrealized gains (no netting against losses) for China B-shares, bonds (corporate and government), futures, index futures and exchange traded funds. |
| | 4. | Full provision of the 10% withholding tax for all dividends (on A-shares, B-shares and H-shares) and PRC sourced interest income (except interest derived from PRC government bonds which are tax exempt). |
Based on its current interpretation of PRC tax rules, the Fund has maintained its accrual for CGT on gains realized from the sale of China A-shares prior to November 17, 2014. The announcements referred to above confirmed that such gains were taxable; however, the PRC tax authorities have not issued guidance on how such tax would be collected.
3. Investment Transactions
During the six months ended June 30, 2015, the Fund made purchases of $77,729,001 and sales of $78,102,877 of investment securities other than short-term investments. There were no purchases or sales of U.S. Government securities.
4. Related party, Other Service Provider Transactions and Directors
i) JF International Management Inc. (the Investment ‘Advisor’), an indirect wholly-owned subsidiary of JPMorgan Chase & Co. (‘JPMorgan’) provides investment advisory services to the Fund under the terms of an investment advisory agreement. The Advisor is paid a fee, computed weekly and payable monthly, at the annual rate of 1.00% of the Fund’s weekly managed gross assets. Investments in funds on which the Advisor or its affiliates charges a management fee are excluded from the calculation. The Advisor has agreed to waive its entitlement to a management fee on any cash held when borrowings are drawn under a borrowing facility. For the six months ended June 30, 2015, the Investment Advisor waived Investment Advisory fees of $8,712.
ii) During the six months ended June 30, 2015, the Fund did not pay any brokerage commissions to JPMorgan companies or affiliated brokers/dealers.
iii) Other Service Providers — Pursuant to an Administration Agreement, JPMorgan Chase Bank, N.A. (‘JPMCB’), an indirect, wholly-owned subsidiary of JPMorgan (the ‘Administrator’), provides certain administration services to the Fund. For six months ended June 30, 2015, the Fund paid an administration fee of $107,201 in respect of tax, compliance, financial reporting and regulatory services.
JPMCB provides portfolio custody and accounting services for the Fund. The amounts paid directly to JPMCB by the Fund for custody and accounting services are included in Custodian and accounting fees on the Statement of Operations. In
| | | | | | | | |
| | | |
| JUNE 30, 2015 | | JPMORGAN CHINA REGION FUND, INC. | | | | | 23 | |
NOTES TO FINANCIAL STATEMENTS
AT JUNE 30, 2015 (continued)
consideration of the accounting services, JPMCB receives a fee accrued daily and paid monthly at the annual rate of 0.02% of the first $12.5 billion of the average daily net assets of all funds in the JPMorgan International Fund Complex and 0.0175% of the average daily net assets in excess of $12.5 billion of all such funds subject to a minimum annual fee of $35,000. The custodian fees are split between safekeeping and transaction charges and vary by market.
iv) Directors — The Fund pays each of its Directors who is not a director, officer or employee of the Advisor, Administrator or any affiliate thereof, an annual fee of $24,100, the Audit Committee Chairman $28,500 and the Chairman $35,000 plus a $3,300 attendance fee for each Board meeting, Management Engagement Committee meeting and Audit Committee meeting attended. A per diem allowance of $2,000 per day, or $1,000 per half day, is paid to Directors in respect of time spent by Directors on Fund business outside normal Board and Committee meetings. The per diem allowance is subject to Board approval in advance. In addition, the Fund reimburses all Directors for travel and out-of-pocket expenses incurred in connection with Board of Directors meetings. Under normal circumstances, in order to minimize expenses, the Board expects to hold two meetings a year by telephone.
v) As of June 30, 2015, the Fund had two shareholders, each holding more than 5% of the Fund’s outstanding shares, who held in aggregate approximately 64% of the Fund’s outstanding shares.
5. Capital Share Transactions
On September 4, 2014, the Board of Directors renewed an authority for the Fund to purchase shares of its common stock from Fund stockholders, as described below. When shares trade at a discount to NAV, any purchase of shares by the Fund has the effect of increasing the NAV of the Fund’s remaining shares outstanding. All shares purchased by the Fund are thereafter considered authorized and unissued.
i) Share Repurchase Program — On September 4, 2014, the Board renewed the Fund’s share repurchase authority up to 644,764 shares (10% of its then issued and outstanding shares) in the open market through September 12, 2016. Repurchases can be made only when the Fund’s shares are trading at less than NAV and at such times and amounts as it is believed to be in the best interest of the Fund’s stockholders.
During the six months ended June 30, 2015 and the years ended December 31, 2014 and December 31, 2013, the Fund did not repurchase any shares under the share repurchase program.
6. Borrowings
On February 25, 2015, the Fund renewed its financing arrangement with Scotiabank (Ireland) Ltd (the ‘Lender’) which was originally entered into on February 27, 2012 and renewed and amended on February 25, 2013. Under this arrangement, the Lender provides a secured, committed credit facility in the aggregate amount of $17.5 million to the Fund. No compensating balances are required. The Fund has paid an upfront loan arrangement fee of $8,750 and has a flat commitment fee of 0.25% on the aggregate amount, as required under this agreement. Interest on borrowings, if any, will be payable at 0.85% plus the London Interbank Offered Rate (‘LIBOR’). Prior to February 25, 2015, interest on unutilized amounts were payable at 0.25% if the unutilized amounts were equal to or less than 50% of the committed amount and 0.35% if the unutilized amounts were greater than 50% of the committed amount and there was a loan arrangement fee of $17.500. At June 30, 2015, the interest rate on outstanding borrowings was 1.04%. This agreement is in effect until February 24, 2017. See note 9 on page 27 for the renewed terms of the agreement, effective July 10, 2015. The credit agreement governing the credit facility includes usual and customary covenants for this type of transaction.
| | | | | | |
| | | |
| 24 | | | | JPMORGAN CHINA REGION FUND, INC. | | JUNE 30, 2015 |
NOTES TO FINANCIAL STATEMENTS
AT JUNE 30, 2015 (continued)
Borrowings outstanding from the secured, committed credit facility and average borrowings from the credit facility for the six months ended June 30, 2015, were as follows:
| | | | | | | | | | | | | | | | | | | | |
Outstanding
Borrowings at
June 30, 2015 | | Weighted
Average
Borrowings
For Days Drawn Upon | | | Average
Interest
Rate on
Borrowings | | | Number of
Days
Outstanding | | | Interest
Expense on
Borrowings | | | Interest Expense on Unutilized Amounts | |
| $17,500,000 | | $ | 15,625,000 | | | | 1.17 | % | | | 181 | | | $ | 89,435 | | | $ | 3,021 | |
The maximum borrowings during the six months ended June 30, 2015 were as follows; $15,000,000, from January 1, 2015 to May 20, 2015 and $17,500,000, from May 20, 2015 to June 30, 2015. Interest expense to non-affiliates on the Statement of Operations includes interest expense on borrowings and unutilized amounts during the six months ended June 30, 2015.
7. Risks and Uncertainties
i) China Region — Investing in securities of ‘China Region companies’ may include certain risks and considerations not typically associated with investing in U.S. securities. In general, China Region companies are companies organized in the People’s Republic of China, the Hong Kong Special Administrative Region, the Macau Special Administrative Region or Taiwan (the ‘China Region’) or for which the principal securities trading market is in the China Region; or companies, regardless of where organized, which have 50% or more of their assets in, or derive 50% or more of their revenues or profits from, the China Region. Such risks include fluctuating currency values and changing local and regional economic, political and social conditions, which may result in greater market volatility. In addition, these securities may not be as liquid as U.S. securities. At June 30, 2015, the Fund had 61.5%, 29.8% and 17.5%, based on net assets, of its total investments invested in China, Hong Kong and Taiwan, respectively.
ii) Foreign Transactions — Foreign security and currency transactions may involve certain considerations and risks not typically associated with those of U.S. dollar denominated transactions as a result of, among other factors, the level of governmental supervision and regulation of foreign securities markets and the possibility of political or economic instability.
iii) Direct Investments in China A-share securities — The China Securities Regulatory Commission (‘CSRC’) may grant qualified foreign institutional investor (‘QFII’) licenses, which allow foreign investments in A-shares on the Shanghai and Shenzhen Stock Exchanges and certain other securities historically not eligible for investment by non-Chinese investors. Each QFII is authorized to invest in China A-shares only up to a specified quota established by the Chinese State Administration of Foreign Exchange (‘SAFE’). JF Asset Management Limited has a QFII license permitting it to invest a specific portion of the assets of certain funds (which may include the Fund) in local Chinese securities. Although the laws of China permit the use of nominee accounts for clients of QFIIs, the Chinese regulators require the general securities trading and settlement accounts to be maintained in the name of the QFII. As the Fund is permitted to invest in China A-shares, the Fund’s local custodian bank maintains a specific sub-account for the A-share investments in the name of the Fund. This amount is included in Deposits at broker on the Statement of Assets and Liabilities. However, there is a risk that creditors of the QFII and its affiliates (each, a ‘JP Morgan Affiliate’) may assert that a JP Morgan Affiliate, and not the Fund, has recourse against the securities and other assets in the account and/or sub-accounts. If a court upholds such an assertion, creditors of a JP Morgan Affiliate could seek payment from the Fund’s A-share investments.
Additional risks for the Fund’s A-share investments include a potential lack of liquidity, greater price volatility, and restrictions on the repatriation of invested capital. Because of low trading volume and various restrictions on the free flow of capital into the A-share market, the China A-share market could be less liquid and trading prices of A-shares could be more volatile than other local securities markets. In addition, net realized profits on fund investments in A-shares may only be repatriated under certain conditions and upon the approval of SAFE. Rules regarding taxation of investments in mainland China are unsettled and may be subject to change. Changes in the taxation of A-shares could materially affect the Fund’s performance.
| | | | | | | | |
| | | |
| JUNE 30, 2015 | | JPMORGAN CHINA REGION FUND, INC. | | | | | 25 | |
NOTES TO FINANCIAL STATEMENTS
AT JUNE 30, 2015 (continued)
iv) Other — In the normal course of business, the Fund may enter into contracts that provide general indemnifications. The maximum exposure under these arrangements is dependent on future claims that may be made against the Fund and, therefore, cannot be estimated; however, based on experience, the risk of any loss from such claims is considered remote.
8. Tax Status
U.S. Federal Income Taxes — No provision for federal income taxes is required since the Fund intends to continue to qualify as a regulated investment company under subchapter M of the Internal Revenue Code and distribute substantially all of its taxable income. Management has reviewed the Fund’s tax positions for all open tax years and has determined that as of June 30, 2015, no liability for income tax is required in the Fund’s financial statements for net unrecognized tax benefits. However, management’s conclusions may be subject to future review based on changes in, or the interpretation of, the accounting standards or tax laws and regulations. The Fund’s Federal tax returns for the prior three fiscal years remain subject to examination by the Internal Revenue Service.
Under the Regulated Investment Company Modernization Act of 2010 (the ‘Act’), net capital losses recognized by the Fund after December 31, 2010, are carried forward indefinitely, and retain their character as short-term and/or long-term losses. Prior to the Act, pre-enactment net capital losses incurred by the Fund were carried forward for eight years and treated as short-term losses. The Act requires that post-enactment net capital losses be used before pre-enactment net capital losses.
At December 31, 2014, the Fund had pre-enactment net capital loss carryforwards of $2,552,688, expiring during 2017, which are available to offset future realized gains.
9. Subsequent Event
On July 10, 2015, the Fund renewed its financing arrangement with Scotiabank (Ireland) Ltd (the ‘Lender’). Under this arrangement, the Lender provides a secured, committed credit facility in the aggregate amount of $22 million to the Fund, and further, allowing future increases up to $32 million. Interest on borrowings, if any, will be payable at 0.85% plus the London Interbank Offered Rate (‘LIBOR’). The Fund has paid an upfront loan arrangement fee of $2,250 and a flat commitment fee of 0.25% on the extended aggregate amount, as required under this agreement. Interest on unutilized amounts will be payable, irrespective of the amount of the utilized commitment. This agreement is in effect until February 24, 2017. The credit agreement governing the credit facility includes usual and customary covenants for this type of transaction.
| | | | | | |
| | | |
| 26 | | | | JPMORGAN CHINA REGION FUND, INC. | | JUNE 30, 2015 |
RESULTS OF THE ANNUAL STOCKHOLDERS‘ MEETING (Unaudited)
The Fund held its annual stockholders’ meeting on May 15, 2015. At this meeting, stockholders re-elected The Rt. Hon. The Earl of Cromer and Mr. Simon J. Crinage to the Fund’s Board of Directors, the results of which are set out below.
I) Election of Director
| | | | | | | | | | | | | | | | | | | | |
| Nominee | | Votes For | | | Votes Against | | | Votes Withheld | | | Shares Not
Voted | | | Total Voting Shares | |
The Rt. Hon. The Earl of Cromer | | | 5,177,498 | | | | 207,352 | | | | — | | | | 1,062,787 | | | | 6,447,637 | |
Mr. Simon J. Crinage | | | 5,171,924 | | | | 212,927 | | | | — | | | | 1,062,786 | | | | 6,447,637 | |
OTHER INFORMATION
Fundamental Investment Restriction on Borrowing
On May 12, 2011, shareholders of the Fund approved a change to the Fund’s fundamental investment restrictions to permit, inter alia, the Fund to borrow up to 20% of its net assets for investment purposes.
This gives the Investment Advisor flexibility to take advantage of additional investment opportunities when it believes that the return from the additional investment would exceed the cost of borrowing. If the Fund borrows money, it may be exposed to additional risks. If the return on securities purchased with borrowed funds is less than the borrowing costs of those funds, then the use of borrowing will detract from Fund performance. In particular, borrowing will magnify losses in times of negative performance. Nonetheless, the Investment Advisor may maintain leverage if it expects that the long-term benefits to investors of maintaining leverage outweigh any current reduced return. Borrowing may also increase the Fund’s interest and other expenses. Finally, the use of borrowing would subject the Fund to additional restrictions imposed by lenders and the Investment Company Act of 1940 on the Fund’s investments.
The Investment Advisor will utilize borrowed monies at its discretion and under the supervision of the Board. The Investment Advisor has agreed to waive any entitlement to a management fee on any cash held when borrowings are drawn under a borrowing facility.
The entire text of the Fund’s fundamental investment restriction on borrowing is as follows:
“Under its fundamental investment restrictions, the Fund may not: Issue senior securities, borrow or pledge its assets, except that the Fund may (i) borrow from a bank for the purpose of obtaining amounts necessary to make distributions for qualification as a registered investment company to avoid imposition of an excise tax under United States tax law; and (ii) borrow money (including through reverse repurchase agreements) up to the maximum amount permitted under the Investment Company Act of 1940 (a) for temporary or emergency purposes, (b) for such short-term credits as may be necessary for the clearance or settlement of transactions, (c) for repurchases of its Common Stock and (d) for investment purposes, provided that amounts borrowed under this clause shall not exceed 20% on the net assets of the Fund. The Fund may also pledge its assets to secure such borrowings. Notwithstanding the above, initial and variation margin in respect of futures contracts and options thereon and any collateral arrangement in respect of options on securities or indexes will not be prohibited by this paragraph 3 or any other investment restrictions.”
Information About Portfolio Holdings
The Fund files its complete schedule of portfolio holdings with the U.S. Securities and Exchange Commission (the ‘Commission’) for the first and third quarters of each fiscal year on Form N-Q. The Fund’s Forms N-Q are available on the Commission’s website at http://www.sec.gov and may be reviewed and copied at the Commission’s Public Reference Room in Washington, DC. Information on the operation of the Public Reference Room may be obtained by calling 1-800-SEC-0330. The Fund’s Forms N-Q are also available on the Fund’s website at www.jpmchinaregionfund.com.
| | | | | | | | |
| | | |
| JUNE 30, 2015 | | JPMORGAN CHINA REGION FUND, INC. | | | | | 27 | |
RESULTS OF THE ANNUAL STOCKHOLDERS‘ MEETING (Unaudited)
(continued)
Proxy Voting Policies and Procedures and Proxy Voting Record
A description of the policies and procedures that are used by the Fund’s investment advisor to vote proxies relating to the Fund’s portfolio securities is available (1) without charge, upon request, by calling +44 20 7742 3735; and (2) as an exhibit to the Fund’s annual report on Form N-CSR which is available on the website of the Securities and Exchange Commission (the ‘Commission’) at http://www.sec.gov. Information regarding how the investment advisor votes these proxies is now available by calling the same number and on the Commission’s website. The Fund has filed its report on Form N-PX covering the Fund’s proxy voting record for the 12 month period ended June 30, 2015.
Certifications
Simon J. Crinage, as the Fund’s President, has certified to the New York Stock Exchange that, as of June 15, 2015, he was not aware of any violation by the Fund of applicable NYSE corporate governance listing standards. The Fund’s reports to the Commission on Forms N-CSR and N-CSRS contain certifications by the Fund’s principal executive officer and principal financial officer that relate to the Fund’s disclosure in such reports and that are required by Rule 30a-2(a) under the 1940 Act.
| | | | | | |
| | | |
| 28 | | | | JPMORGAN CHINA REGION FUND, INC. | | JUNE 30, 2015 |
FUND MANAGEMENT
Information pertaining to the Directors and officers of the Fund is set forth below.
| | | | | | | | |
Name, (YOB), Address and
Position(s) with Fund | | Term of
Office and
Length of
Time Served | | Principal Occupation(s) During
Past 5 Years | | Number of
Portfolios in
Fund Complex
Overseen by
Director* | | Other Trusteeships/
Directorships Held by Director |
Independent Directors | | | | |
| | | | |
The Rt. Hon. The Earl of Cromer (1946) 60 Victoria Embankment London EC4Y 0JP United Kingdom | | Three year term ends in 2018; Chairman and Director since 1994. | | Chairman of the Board of the Fund; Chairman of the Board, Western Provident Association (insurance), LG India Plus Fund Ltd (financial), Pedder Street Asia Absolute Return Fund Limited (financial); LG Asia Plus Fund Limited (financial); Director, Cheetah Korea Value Fund Ltd (financial) and Chief Executive Officer, Cromer Associates Limited (family business). | | 1 | | See Principal Occupation. |
| | | | |
Alexander R. Hamilton (1941) P.O. Box 12343 General Post Office Hong Kong Class II Director | | Three year term ends in 2016; Director since 1994. | | Director of Cosco International Holdings Limited (shipping), Esprit Holdings Limited (clothing retail), Shangri-La Asia Limited (hotels) and Octopus Cards Limited (financial services). Former Director of China Cosco Holdings Co. Limited (shipping) (retired May 2011), CITIC Limited (infrastructure) (retired June 2015), and DBS Bank (Hong Kong) Ltd (financial) (retired April 2015). | | 1 | | See Principal Occupation. |
| | | | |
Julian M. I. Reid (1944) 60 Victoria Embankment London EC4Y 0JP United Kingdom | | Three year term ends in 2017; Director since 1998. | | Chief Executive Officer of 3a Funds Group (financial); Director and Chairman of Morgan’s Walk Properties Limited (property); Director and Chairman of The Korea Fund, Inc. (financial); Director and Chairman of Prosperity Voskhod Fund (financial); Director and Chairman of ASA Limited (financial) and Director of J M Properties Limited (property). | | 1 | | See Principal Occupation. |
| | | | | | | | |
| | | |
| JUNE 30, 2015 | | JPMORGAN CHINA REGION FUND, INC. | | | | | 29 | |
FUND MANAGEMENT
(continued)
| | | | | | | | |
Name, (YOB), Address and
Position(s) with Fund | | Term of
Office and
Length of
Time Served | | Principal Occupation(s) During
Past 5 Years | | Number of
Portfolios in
Fund Complex
Overseen by
Director* | | Other Trusteeships/
Directorships Held by Director |
Independent Directors (continued) | | | | |
| | | | |
John R. Rettberg (1937) 1 Beacon St. Boston, MA 02108
USA
Class II Director | | Three year term ends in 2016; Director since 2008 | | Former Trustee, JPMorgan Alternative Products mutual fund Board (1997-2009). | | 1 | | None. |
Interested Director & President of the Fund | | | | |
| | | | |
Simon J. Crinage (1965) 60 Victoria Embankment London, EC4Y 0JP United Kingdom Class I Director and President | | Three year term ends in 2018; Director since 2009 & President since 2003** | | Managing Director, J.P. Morgan. | | 1 | | Director of The Association of Investment Companies Limited and JF International Management Inc. |
| * | | The Fund is the only fund in the Fund Complex. |
| ** | | The officers of the Fund serve at the discretion of the Board of Directors. |
| | | | | | |
| | | |
| 30 | | | | JPMORGAN CHINA REGION FUND, INC. | | JUNE 30, 2015 |
Information pertaining to the officers of the Fund is set forth below.
| | | | |
Name, (YOB), Address and
Position(s) with Fund | | Term of Office and
Length of Time Served | | Principal Occupation(s) During Past 5 Years |
Officers who are not Directors |
| | |
Neil S. Martin
(1971)
60 Victoria Embankment
London EC4Y 0JP
United Kingdom | | Since 2014** | | Chief Operating Officer and Treasurer of the Fund; Executive Director, J.P. Morgan. |
| | |
Lucy J. Dina
(1977)
60 Victoria Embankment
London EC4Y 0JP
United Kingdom
Secretary | | Since 2013** | | Secretary of the Fund; Vice President, J.P. Morgan. |
| | |
Steve M. Ungerman
(1953)
270 Park Avenue
New York
Chief Compliance Officer | | Since 2014** | | Chief Compliance Officer of the Fund;
Managing Director, J.P. Morgan Chase Bank NA. |
| ** | | The officers of the Fund serve at the discretion of the Board of Directors. |
| | | | | | | | |
| | | |
| JUNE 30, 2015 | | JPMORGAN CHINA REGION FUND, INC. | | | | | 31 | |
DIVIDEND REINVESTMENT AND CASH PURCHASE PLAN
(Unaudited)
The Fund operates an optional Dividend Reinvestment and Cash Purchase Plan (the ‘Plan’) whereby:
| | a) | shareholders may elect to receive dividend and capital gain distributions in the form of additional shares of the Fund (the Share Distribution Plan). |
| | b) | shareholders may make optional payments (any amount between $100 and $3,000) which will be used to purchase additional shares in the open market (the Share Purchase Plan). |
For a copy of the Plan brochure, as well as a dividend reinvestment authorization card, please contact the Plan Agent:
Computershare Trust Company, N.A.
P. O. Box 30170
College Station, TX 77842-3170
USA Telephone No.: 800-426-5523 (toll-free)
www.computershare.com
The following should be noted with respect to the Plan:
If you participate in the Share Distribution Plan, whenever the Board of Directors of the Fund declares an income dividend or net capital gain distribution, you will automatically receive your distribution in newly issued shares (cash will be paid in lieu of fractional shares) if the market price of the shares on the date of the distribution is at or above the net asset value of the shares. The number of shares to be issued to you by the Fund will be determined by dividing the amount of the cash distribution to which you are entitled (net of any applicable withholding taxes) by the greater of the net asset value (‘NAV’) per share on such date or 95% of the market price of a share on such date. If the market price of the shares on such a distribution date is below the NAV, the Plan Agent will, as agent for the participants, buy shares on the open market, on the New York Stock Exchange or elsewhere, for
the participant’s account on, or after, the payment date. There is no service charge for purchases under this Plan.
For U.S. federal income tax purposes, shareholders receiving newly issued shares pursuant to the Share Distribution Plan will be treated as receiving income or capital gains in an amount equal to the fair market value (determined as of the distribution date) of the shares received and will have a cost basis equal to such fair market value. Shareholders receiving a distribution in the form of shares purchased in the open market pursuant to the Plan will be treated as receiving a distribution of the cash distribution that such shareholder would have received had the shareholder not elected to have such distribution reinvested and will have a cost basis in such shares equal to the amount of the distribution.
There will be no brokerage charge to participants for shares issued directly by the Fund under the Plan. Each participant will pay a pro rata share of brokerage commissions incurred with respect to the Plan Agent’s open market purchases of shares in connection with the Plan. The Fund will pay the fees of the Plan Agent for handling the Plan.
You may terminate your account under the Share Distribution Plan by notifying the Plan Agent in writing. The Plan may be terminated by the Plan Agent or the Fund with notice to you at least 30 days prior to any record date for the payment of any distribution by the Fund. Upon any termination, the Plan Agent will deliver a certificate or certificates for the full shares held for you under the Plan and a cash adjustment for any fractional shares.
You also have the option of instructing the Plan Agent to make semi-annual cash purchases of shares in the open market. There is a service charge of $1.25 for each purchase under this Share Purchase Plan.
| | | | | | |
| | | |
| 32 | | | | JPMORGAN CHINA REGION FUND, INC. | | JUNE 30, 2015 |
DIRECTORS AND ADMINISTRATION
(Unaudited)
| | |
| Officers and Directors | | The Rt. Hon. The Earl of Cromer — Director and Chairman of the Board and Management Engagement Committee Simon J. Crinage — Director and President Alexander R. Hamilton — Director and Chairman of the Audit Committee and Pricing Committee Julian M. I. Reid — Director John R. Rettberg — Director Neil S. Martin — Chief Operating Officer and Treasurer Lucy J. Dina — Secretary Steve M. Ungerman — Chief Compliance Officer |
| |
| Investment Advisor | | JF International Management Inc. P.O. Box 3151 Road Town, Tortola British Virgin Islands |
| |
| Administrator | | JPMorgan Chase Bank, N.A. 1 Beacon Street, 18th Floor Boston, Massachusetts 02108 U.S.A. |
| |
| Custodian | | JPMorgan Chase Bank N.A. 1 Beacon Street, 18th Floor Boston, Massachusetts 02108 U.S.A. |
| |
Independent Registered Public Accounting Firm | | PricewaterhouseCoopers LLP 300 Madison Avenue New York, New York 10017 U.S.A. |
| |
| Legal Counsel | | Dechert LLP New York: 1095 Avenue of the Americas New York, New York 10036 U.S.A. |
| |
| | Hong Kong: 27/F Henley Building 5 Queens Road Central Hong Kong |
| |
| Registrar, Transfer Agent, and Dividend Paying Agent | | Computershare Trust Company, N.A. P. O. Box 30170 College Station, TX 77842-3170 U.S.A. |
Notice is hereby given in accordance with Section 23(c) of the Investment Company Act of 1940, as amended, that from time to time the Fund may purchase shares of its common stock in the open market.
www.jpmchinaregionfund.com
| | | | | | | | |
| | | |
| JUNE 30, 2015 | | JPMORGAN CHINA REGION FUND, INC. | | | | | 33 | |

This report, including the financial statements herein, is sent to the stockholders of the Fund for their information. It is not a prospectus, circular or representation intended for use in the purchase or sale of shares of the Fund or of any securities mentioned in this report.
© JPMorgan Chase & Co., 2015 All rights reserved. June 30.
ITEM 2. CODE OF ETHICS.
Not required for this filing.
ITEM 3. AUDIT COMMITTEE FINANCIAL EXPERT.
Not required for this filing.
ITEM 4. PRINCIPAL ACCOUNTANT FEES AND SERVICES.
Not required for this filing.
ITEM 5. AUDIT COMMITTEE OF LISTED REGISTRANTS.
Not required for this filing.
ITEM 6. SCHEDULE OF INVESTMENTS
(a) Schedule of Investments is included as part of Item 1.
(b) Not applicable to the Fund.
ITEM 7. DISCLOSURE OF PROXY VOTING POLICIES AND PROCEDURES FOR CLOSED-END MANAGEMENT INVESTMENT COMPANIES.
Not required for this filing.
ITEM 8. PORTFOLIO MANAGERS OF CLOSED-END MANAGEMENT INVESTMENT COMPANIES.
| | (a) | Not applicable to a semiannual report. |
| | (b) | There has been no change, as of the date of this filing, in any of the portfolio managers identified in response to paragraph (a)(1) of this Item in the registrant’s most recently filed annual report on Form N-CSR. |
ITEM 9. PURCHASE OF EQUITY SECURITIES BY CLOSED-END MANAGEMENT INVESTMENT COMPANY AND AFFILIATED PURCHASERS.
Not applicable to the Fund.
ITEM 10. SUBMISSION OF MATTERS TO A VOTE OF SECURITY HOLDERS.
There have been no material changes to the procedures by which the shareholders may recommend nominees to the Fund’s board of directors since the Fund filed its last form N-CSR.
ITEM 11. CONTROLS AND PROCEDURES.
(a) The Fund’s principal executive and principal financial officers have concluded that the Fund’s disclosure controls and procedures (as defined in Rule 30a-3(c) under the Investment Company Act of 1940, as amended (the “1940 Act”) (17 CFR 270.30a-3(c))) are effective, as of a date within 90 days of the filing date of this Form N-CSR based on their evaluation of these controls and procedures required by Rule 30a-3(b) under the 1940 Act (17 CFR 270.30a-3(b)) and Rules 13a-15(b) or 15d-15(b) under the 1934 Act (17 CFR 240.13a-15(b) or 240.15d-15(b)).
(b) There were no changes in the Fund’s internal control over financial reporting (as defined in Rule 30a-3(d) under the 1940 Act (17 CFR 270.30a-3(d))) that occurred during the Fund’s second fiscal quarter that has materially affected, or is reasonably likely to materially affect, the Fund’s internal control over financial reporting.
ITEM 12. EXHIBITS.
(a)(1) Not required for this filing.
(a)(2) Certifications pursuant to Rule 30a-2(a) under the Investment Company Act of 1940.
(a)(3) Not required for this filing.
(a)(4) Not required for this filing.
(b) The certifications required by Rule 30a-2(b) of the 1940 Act and Section 906 of the Sarbanes-Oxley Act of 2002 are attached hereto.
SIGNATURES
Pursuant to the requirements of the Securities Exchange Act of 1934 and the Investment Company Act of 1940, the registrant has duly caused this report to be signed on its behalf by the undersigned, thereunto duly authorized.
JPMorgan China Region Fund, Inc.
| | |
By: | | /s/ Simon Crinage |
| | Simon Crinage |
| | President and Principal Executive Officer |
| | September 3, 2015 |
Pursuant to the requirements of the Securities Exchange Act of 1934 and the Investment Company Act of 1940, this report has been signed below by the following persons on behalf of the registrant and in the capacities and on the dates indicated.
| | |
By: | | /s/ Simon Crinage |
| | Simon Crinage |
| | President and Principal Executive Officer |
| | September 3, 2015 |
| | |
By: | | /s/ Neil S. Martin |
| | Neil S. Martin |
| | Treasurer and Chief Operating Officer |
| | September 3, 2015 |