UNITED STATES
SECURITIES AND EXCHANGE COMMISSION
Washington, D.C. 20549 |
CERTIFIED SHAREHOLDER REPORT OF REGISTERED MANAGEMENT
INVESTMENT COMPANIES |
| Investment Company Act file number 811- 6718 |
Dreyfus Investment Grade Funds, Inc.
(Exact name of Registrant as specified in charter) |
c/o The Dreyfus Corporation
200 Park Avenue
New York, New York 10166
(Address of principal executive offices) (Zip code) |
Michael A. Rosenberg, Esq.
200 Park Avenue
New York, New York 10166
(Name and address of agent for service) |
| Registrant's telephone number, including area code: | | (212) 922-6000 |
| Date of fiscal year end: | | 7/31 | | |
| Date of reporting period: | | 7/31/09 | | |
| Item 1. | | Reports to Stockholders. |
-2-
| | Dreyfus
Inflation Adjusted
Securities Fund |
| | ANNUAL REPORT July 31, 2009 |

Save time. Save paper. View your next shareholder report online as soon as it’s available. Log into www.dreyfus.com and sign up for Dreyfus eCommunications. It’s simple and only takes a few minutes.
The views expressed in this report reflect those of the portfolio manager only through the end of the period covered and do not necessarily represent the views of Dreyfus or any other person in the Dreyfus organization. Any such views are subject to change at any time based upon market or other conditions and Dreyfus disclaims any responsibility to update such views.These views may not be relied on as investment advice and, because investment decisions for a Dreyfus fund are based on numerous factors, may not be relied on as an indication of trading intent on behalf of any Dreyfus fund.

| | | Contents |
| |
| | | THE FUND |
| |
|
| 2 | | A Letter from the Chairman and CEO |
| 3 | | Discussion of Fund Performance |
| 6 | | Fund Performance |
| 7 | | Understanding Your Fund’s Expenses |
| 7 | | Comparing Your Fund’s Expenses |
| | | With Those of Other Funds |
| 8 | | Statement of Investments |
| 10 | | Statement of Assets and Liabilities |
| 11 | | Statement of Operations |
| 12 | | Statement of Changes in Net Assets |
| 14 | | Financial Highlights |
| 16 | | Notes to Financial Statements |
| 25 | | Report of Independent Registered |
| | | Public Accounting Firm |
| 26 | | Important Tax Information |
| 27 | | Information About the Review and Approval |
| | | of the Fund’s Management Agreement |
| 32 | | Board Members Information |
| 34 | | Officers of the Fund |
| |
| | | FOR MORE INFORMATION |
| |
|
| | | Back Cover |
Dreyfus
Inflation Adjusted
Securities Fund |

A LETTER FROM THE CHAIRMAN AND CEO
Dear Shareholder:
We are pleased to present this annual report for Dreyfus Inflation Adjusted Securities Fund, covering the 12-month period from August 1, 2008, through July 31, 2009.
The severe recession and banking crisis that dominated the financial markets over much of the past year appear to have eased. Previously frozen credit markets have thawed to an extent, giving businesses improved access to the capital they need to grow. After reaching multi-year lows early in 2009, higher-yielding segments of the bond market staged an impressive rally, while U.S.Treasury securities have experienced significant price volatility since January as a result of recession-related factors and technical supply issues.The U.S. economy remains weak overall, but we have seen encouraging evidence of potential recovery, including signs of healing in the battered housing and manufacturing sectors. Even the unemployment rate, which historically has been a lagging indicator of economic trends, recently showed signs of improvement.
Although these developments give us reasons for optimism, we remain cautious due to the speed and magnitude of the corporate bond market’s 2009 rebound. Indeed, the market’s advance was fueled more by investors’ renewed appetites for risk than improving business fundamentals. We would prefer to see a steadier rise in asset prices supported by more concrete economic data, as the rapid rise increases the possibility that profit-taking could fuel further volatility. In uncertain markets such as this one,even the most seasoned investors can benefit from professional counsel. To determine how your investments should be positioned for any potential challenges and opportunities that lie ahead, we urge you, as always, to talk regularly with your financial advisor.
For information about how the fund performed during the reporting period, as well as market perspectives, we have provided a Discussion of Fund Performance given by the fund’s Portfolio Manager.
Thank you for your continued confidence and support.

Jonathan R. Baum
Chairman and Chief Executive Officer
The Dreyfus Corporation
August 17, 2009 |
2

DISCUSSION OF FUND PERFORMANCE
For the period of August 1, 2008, through July 31, 2009, as provided by Robert Bayston, Portfolio Manager
Fund and Market Performance Overview
For the 12-month period ended July 31, 2009, Dreyfus Inflation Adjusted Securities Fund’s Institutional shares produced a total return of –0.30%, and the fund’s Investor shares returned –0.54%.1 In comparison, the fund’s benchmark, the Barclays Capital U.S. Treasury Inflation Protected Securities Index (the “Index”), produced a total return of –0.53% for the same period.2
Treasury Inflation Protected securities (“TIPS”) were particularly hard-hit in September and October of last year, but have since rallied to an extent year to date as the economic downturn bottomed and deflationary concerns eased. Despite this volatility, the fund’s returns were in line with its benchmark Index, which we attribute in part to our relatively long average duration early in the reporting period and the success of our security selection strategy.
The Fund’s Investment Approach
The fund seeks returns that exceed the rate of inflation.To pursue this goal, the fund normally invests at least 80% of its assets in inflation-indexed securities, which are fixed-income securities designed to protect investors from a loss of value due to inflation by periodically adjusting their principal and/or coupon according to the rate of inflation.
The fund invests primarily in high-quality, U.S. dollar-denominated, inflation-indexed securities. To a limited extent, the fund may invest in foreign currency-denominated, inflation-protected securities and other fixed-income securities not adjusted for inflation, including U.S. government bonds and notes, corporate bonds, mortgage-related securities and asset-backed securities.The fund seeks to keep its average effective duration between two and 10 years, and the fund may invest in securities of any maturity without restriction.
The Fund 3
| DISCUSSION OF FUND PERFORMANCE (continued) |
TIPS Rallied as Deflation Concerns Moderated
The reporting period began in the midst of the longest and deepest recession since the 1930s as housing markets slumped, unemployment rates climbed and consumer confidence deteriorated. In addition, by the start of the reporting period, a global banking crisis already had produced steep declines for higher yielding bonds, including mortgage-backed securities, asset-backed securities and corporate bonds.
In contrast, most U.S. government securities had rallied strongly amid a “flight to quality,” causing their yields to fall to unprecedented low levels. However,TIPS proved to be an exception to that trend. Because of the threat that the global economic downturn might lead to bouts of deflation not seen since the Great Depression,TIPS with maturities of approximately 10 years and less began the reporting period out of favor among investors, and their inflation-adjusted yields were significantly higher than nominal Treasuries. In addition, TIPS had been subject to the effects of limited market liquidity and a wave of deleveraging among institutional investors, which also put downward pressure on prices.
Duration and Security Selection Strategies Bolstered Returns
Because we believed at the time that deflation fears were overblown, we attempted to lock in TIPS’ relatively high yields for as long as we deemed practical by maintaining the fund’s average duration in a range that was longer than industry averages.This positioning enabled the fund to participate more fully in a rally amongTIPS when deflation concerns began to moderate. The rally persisted throughout the spring as it became clearer that a meltdown of the international banking system had been averted. Investors began to look forward to an economic recovery and, potentially, a commensurate acceleration of inflation.
Our security selection strategy also produced positive contributions to the fund’s relative performance, as we had focused on seasoned TIPS with relatively high inflation accruals. In our judgment,TIPS with these characteristics were undervalued compared to more recently issued securities. The fund particularly benefited from an emphasis on TIPS with maturities in the 20-year range as yield differences narrowed along the market’s maturity spectrum.
4
Later in the spring, afterTIPS had rallied and became more fairly valued, we began to reduce the fund’s average duration toward a position that is roughly in line with industry averages.
After the Rally, a More Cautious Investment Posture
As of the reporting period’s end, the economic outlook is unclear.We expect the pace of an eventual economic recovery to be limited by reluctant spending among consumers who increasingly are unemployed and have suffered significant wealth deterioration.The Federal Reserve Board has indicated that it does not see an acceleration of inflation as an imminent threat, and it said that it intends to keep short-term interest rates near historically low levels for some time.
Given this backdrop, we do not believe that the springtime TIPS rally is likely to resume. In addition,TIPS currently appear to be fairly valued at price levels that reflect a low to moderate level of inflation.Therefore, we have maintained a generally neutral investment posture.We believe this is a prudent strategy until we see economic data that more clearly indicate the U.S. economy’s future direction.
August 17, 2009
| 1 | Total return includes reinvestment of dividends and any capital gains paid. Past performance is no guarantee of future results. Share price, yield and investment return fluctuate such that upon redemption, fund shares may be worth more or less than their original cost. Return figures provided reflect the absorption of certain fund expenses by The Dreyfus Corporation pursuant to an agreement in effect through December 1, 2009, at which time it may be extended, terminated or modified. Had these expenses not been absorbed, the fund’s returns would have been lower. |
| |
| 2 | SOURCE: LIPPER — Reflects reinvestment of dividends and, where applicable, capital gain distributions.The Barclays Capital U.S.Treasury Inflation Protected Securities Index is a sub- index of the U.S.Treasury component of the Barclays Capital U.S. Government Index. Securities in the Barclays Capital U.S.Treasury Inflation Protected Securities Index are dollar-denominated, non-convertible, publicly issued, fixed-rate, investment-grade (Moody’s Baa3 or better) U.S. Treasury inflation notes, with at least one year to final maturity and at least $100 million par amount outstanding. |
| |
| | |
| |
The Fund 5
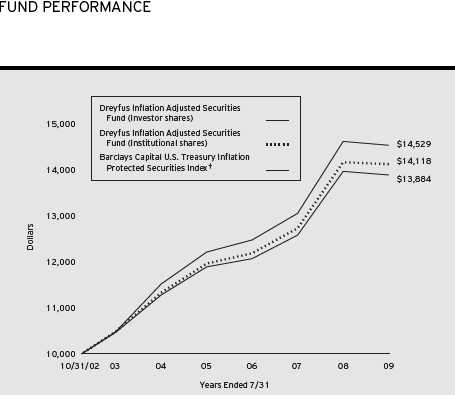
Comparison of change in value of $10,000 investment in Dreyfus Inflation Adjusted Securities
Fund Investor shares and Institutional shares and the Barclays Capital U.S. Treasury Inflation
Protected Securities Index |
| Average Annual Total Returns as of 7/31/09 | | | | | | |
| | | Inception | | | | | | From |
| | | Date | | 1 Year | | 5 Years | | Inception |
| |
| |
| |
| |
|
| Investor shares | | 10/31/02 | | –0.54% | | 4.25% | | 4.98% |
| Institutional shares | | 10/31/02 | | –0.30% | | 4.50% | | 5.24% |
† Source: Lipper Inc.
Past performance is not predictive of future performance.The fund’s performance shown in the graph and table does not
reflect the deduction of taxes that a shareholder would pay on fund distributions or the redemption of fund shares.
The above graph compares a $10,000 investment made in Investor and Institutional shares of Dreyfus Inflation Adjusted
Securities Fund on 10/31/02 (inception date) to a $10,000 investment made in the Barclays Capital U.S.Treasury
Inflation Protected Securities Index (the “Index”) on that date.All dividends and capital gain distributions are reinvested.
The fund’s performance shown in the line graph takes into account all applicable fees and expenses.The Index is a sub-
index of the U.S.Treasury component of the Barclays Capital U.S. Government Index. Securities in the Index are
dollar-denominated, non-convertible, publicly-issued, fixed-rate, investment-grade (Moody’s Baa3 or better) U.S.Treasury
inflation notes, with at least one year to final maturity and at least $100 million par amount outstanding. Unlike a
mutual fund, the Index is not subject to charges, fees and other expenses. Investors cannot invest directly in any index.
Further information relating to fund performance, including expense reimbursements, if applicable, is contained in the
Financial Highlights section of the prospectus and elsewhere in this report. |
6
UNDERSTANDING YOUR FUND’S EXPENSES (Unaudited)
As a mutual fund investor, you pay ongoing expenses, such as management fees and other expenses. Using the information below, you can estimate how these expenses affect your investment and compare them with the expenses of other funds.You also may pay one-time transaction expenses, including sales charges (loads) and redemption fees, which are not shown in this section and would have resulted in higher total expenses. For more information, see your fund’s prospectus or talk to your financial adviser.
Review your fund’s expenses
The table below shows the expenses you would have paid on a $1,000 investment in Dreyfus Inflation Adjusted Securities Fund from February 1, 2009 to July 31, 2009. It also shows how much a $1,000 investment would be worth at the close of the period, assuming actual returns and expenses.
Expenses and Value of a $1,000 Investment assuming actual returns for the six months ended July 31, 2009
| | | Investor Shares | | Institutional Shares |
| |
| |
|
| Expenses paid per $1,000† | | $ 2.74 | | $ 1.52 |
| Ending value (after expenses) | | $1,047.50 | | $1,048.70 |
COMPARING YOUR FUND’S EXPENSES WITH THOSE OF OTHER FUNDS (Unaudited)
Using the SEC’s method to compare expenses
The Securities and Exchange Commission (SEC) has established guidelines to help investors assess fund expenses. Per these guidelines, the table below shows your fund’s expenses based on a $1,000 investment, assuming a hypothetical 5% annualized return. You can use this information to compare the ongoing expenses (but not transaction expenses or total cost) of investing in the fund with those of other funds.All mutual fund shareholder reports will provide this information to help you make this comparison. Please note that you cannot use this information to estimate your actual ending account balance and expenses paid during the period.
Expenses and Value of a $1,000 Investment assuming a hypothetical 5% annualized return for the six months ended July 31, 2009
| | | Investor Shares | | Institutional Shares |
| |
| |
|
| Expenses paid per $1,000† | | $ 2.71 | | $ 1.51 |
| Ending value (after expenses) | | $1,022.12 | | $1,023.31 |
† Expenses are equal to the fund’s annualized expense ratio of .54% for Investor shares and .30% for Institutional
shares, multiplied by the average account value over the period, multiplied by 181/365 (to reflect the one-half
year period). |
The Fund 7
| STATEMENT OF INVESTMENTS | | | | |
| July 31, 2009 | | | | |
| |
| |
|
| |
| |
| |
| |
| | | Principal | | |
| Bonds and Notes—99.7% | | Amount ($) | | Value ($) |
| |
| |
|
| U.S. Treasury Inflation Protected Securities: | | | | |
| 0.63%, 4/15/13 | | 1,947,503 a,b | | 1,924,377 |
| 1.38%, 7/15/18 | | 704,108 a,b | | 686,505 |
| 1.63%, 1/15/15 | | 3,561,218 a,b | | 3,552,315 |
| 1.75%, 1/15/28 | | 673,669 a,b | | 627,775 |
| 1.88%, 7/15/15 | | 3,512,455 a,b | | 3,557,457 |
| 2.00%, 1/15/14 | | 1,889,838 a,b | | 1,929,408 |
| 2.00%, 7/15/14 | | 4,726,035 b | | 4,824,989 |
| 2.00%, 1/15/16 | | 4,147,913 a,b | | 4,217,909 |
| 2.00%, 1/15/26 | | 5,259,769 a,b | | 5,113,484 |
| 2.38%, 4/15/11 | | 4,651,911 a,b | | 4,791,468 |
| 2.38%, 1/15/25 | | 5,143,506 a,b | | 5,256,020 |
| 2.38%, 1/15/27 | | 991,437 a,b | | 1,015,293 |
| 2.50%, 7/15/16 | | 7,242,627 a,b | | 7,611,552 |
| 2.63%, 7/15/17 | | 4,566,564 a,b | | 4,880,515 |
| 3.00%, 7/15/12 | | 5,179,402 a,b | | 5,475,601 |
| 3.63%, 4/15/28 | | 4,887,187 b | | 5,889,061 |
| 3.88%, 4/15/29 | | 2,868,176 a,b | | 3,595,975 |
| Total Bonds and Notes | | | | |
| (cost $64,997,051) | | | | 64,949,704 |
| |
| |
| Other Investment—.1% | | Shares | | Value ($) |
| |
| |
|
| Registered Investment Company; | | | | |
| Dreyfus Institutional Preferred | | | | |
| Plus Money Market Fund | | | | |
| (cost $57,000) | | 57,000 c | | 57,000 |
8
| Investment of Cash Collateral | | | | |
| for Securities Loaned—39.7% | | Shares | | Value ($) |
| |
| |
|
| Registered Investment Company; | | | | |
| Dreyfus Institutional Cash | | | | |
| Advantage Plus Fund | | | | |
| (cost $25,842,012) | | 25,842,012 c | | 25,842,012 |
| |
| Total Investments (cost $90,896,063) | | 139.5% | | 90,848,716 |
| Liabilities, Less Cash and Receivables | | (39.5%) | | (25,714,557) |
| Net Assets | | 100.0% | | 65,134,159 |
a All or a portion of these securities are on loan.At July 31, 2009, the total market value of the fund’s securities on
loan is $25,965,706 and the total market value of the collateral held by the fund is $29,001,239, consisting of
cash collateral of $25,842,012 and U.S. Government and Agency securities valued at $3,159,227.
b Principal amount for accrual purposes is periodically adjusted based on changes in the Consumer Price Index.
c Investment in affiliated money market mutual fund. |
| Portfolio Summary (Unaudited)† | | | | |
| | | Value (%) | | | | Value (%) |
| |
| |
| |
|
| U.S. Government & Agencies | | 99.7 | | Money Market Investments | | 39.8 |
| | | | | | | 139.5 |
| † Based on net assets. | | | | | | |
| See notes to financial statements. | | | | | | |
The Fund 9
STATEMENT OF ASSETS AND LIABILITIES
July 31, 2009
| | | Cost | | Value |
| |
| |
|
| Assets ($): | | | | |
| Investments in securities—See Statement of Investments (including | | |
| securities on loan, valued at $25,965,706)—Note 1(b): | | | | |
| Unaffiliated issuers | | 64,997,051 | | 64,949,704 |
| Affiliated issuers | | 25,899,012 | | 25,899,012 |
| Cash | | | | 336,767 |
| Receivable for investment securities sold | | | | 1,305,889 |
| Receivable for shares of Common Stock subscribed | | | | 570,949 |
| Interest receivable | | | | 173,708 |
| Prepaid expenses | | | | 9,513 |
| | | | | 93,245,542 |
| Liabilities ($): | | | | |
| Due to The Dreyfus Corporation and affiliates—Note 3(b) | | | | 9,916 |
| Liability for securities on loan—Note 1(b) | | | | 25,842,012 |
| Payable for investment securities purchased | | | | 1,537,584 |
| Payable for shares of Common Stock redeemed | | | | 677,484 |
| Accrued expenses | | | | 44,387 |
| | | | | 28,111,383 |
| Net Assets ($) | | | | 65,134,159 |
| Composition of Net Assets ($): | | | | |
| Paid-in capital | | | | 66,674,344 |
| Accumulated distributions in excess of investment income—net | | | | (497) |
| Accumulated net realized gain (loss) on investments | | | | (1,492,341) |
| Accumulated net unrealized appreciation | | | | |
| (depreciation) on investments | | | | (47,347) |
| Net Assets ($) | | | | 65,134,159 |
| |
| |
|
| |
| |
| Net Asset Value Per Share | | | | |
| | | Investor Shares | | Institutional Shares |
| |
| |
|
| Net Assets ($) | | 40,556,968 | | 24,577,191 |
| Shares Outstanding | | 3,386,610 | | 2,052,715 |
| Net Asset Value Per Share ($) | | 11.98 | | 11.97 |
| |
| See notes to financial statements. | | | | |
10
| STATEMENT OF OPERATIONS | | |
| Year Ended July 31, 2009 | | |
| |
|
| |
| |
| |
| |
| Investment Income ($): | | |
| Income: | | |
| Interest | | 502,879 |
| Income from securities lending | | 82,541 |
| Dividends; | | |
| Affiliated issuers | | 2,468 |
| Total Income | | 587,888 |
| Expenses: | | |
| Management fee—Note 3(a) | | 137,665 |
| Shareholder servicing costs—Note 3(b) | | 102,392 |
| Auditing fees | | 40,830 |
| Registration fees | | 33,518 |
| Prospectus and shareholders’ reports | | 10,616 |
| Custodian fees—Note 3(b) | | 7,422 |
| Directors’ fees and expenses—Note 3(c) | | 1,181 |
| Loan commitment fees—Note 2 | | 837 |
| Miscellaneous | | 18,168 |
| Total Expenses | | 352,629 |
| Less—reduction in management fee | | |
| due to undertaking—Note 3(a) | | (136,797) |
| Less—reduction in fees due to earnings credits—Note 1(b) | | (628) |
| Net Expenses | | 215,204 |
| Investment Income—Net | | 372,684 |
| Realized and Unrealized Gain (Loss) on Investments—Note 4 ($): | | |
| Net realized gain (loss) on investments | | (1,491,794) |
| Change in net unrealized appreciation (depreciation) on investments | | 1,087,356 |
| Net Realized and Unrealized Gain (Loss) on Investments | | (404,438) |
| Net (Decrease) in Net Assets Resulting from Operations | | (31,754) |
| |
| See notes to financial statements. | | |
The Fund 11
STATEMENT OF CHANGES IN NET ASSETS
| | | | | Year Ended July 31, |
| | |
| |
|
| | | 2009 | | 2008 |
| |
| |
|
| Operations ($): | | | | |
| Investment income—net | | 372,684 | | 1,433,749 |
| Net realized gain (loss) on investments | | (1,491,794) | | 665,250 |
| Change in net unrealized appreciation | | | | |
| (depreciation) on investments | | 1,087,356 | | (1,242,424) |
| Net Increase (Decrease) in Net Assets | | | | |
| Resulting from Operations | | (31,754) | | 856,575 |
| Dividends to Shareholders from ($): | | | | |
| Investment income—net: | | | | |
| Investor Shares | | (378,508) | | (904,889) |
| Institutional Shares | | (219,791) | | (529,563) |
| Net realized gain on investments: | | | | |
| Investor Shares | | (217,001) | | — |
| Institutional Shares | | (125,345) | | — |
| Total Dividends | | (940,645) | | (1,434,452) |
| Capital Stock Transactions ($): | | | | |
| Net proceeds from shares sold: | | | | |
| Investor Shares | | 26,339,642 | | 30,998,869 |
| Institutional Shares | | 19,491,115 | | 10,938,925 |
| Dividends reinvested: | | | | |
| Investor Shares | | 587,130 | | 898,164 |
| Institutional Shares | | 277,721 | | 360,518 |
| Cost of shares redeemed: | | | | |
| Investor Shares | | (12,547,868) | | (7,214,234) |
| Institutional Shares | | (8,611,199) | | (65,381) |
| Increase (Decrease) in Net Assets | | | | |
| from Capital Stock Transactions | | 25,536,541 | | 35,916,861 |
| Total Increase (Decrease) in Net Assets | | 24,564,142 | | 35,338,984 |
| Net Assets ($): | | | | |
| Beginning of Period | | 40,570,017 | | 5,231,033 |
| End of Period | | 65,134,159 | | 40,570,017 |
| Undistributed (distributions in excess of) | | | | |
| investment income—net | | (497) | | 26,984 |
12
| | | | | Year Ended July 31, |
| | |
| |
|
| | | 2009 | | 2008 |
| |
| |
|
| Capital Share Transactions: | | | | |
| Investor Shares | | | | |
| Shares sold | | 2,236,422 | | 2,473,558 |
| Shares issued for dividends reinvested | | 49,400 | | 72,191 |
| Shares redeemed | | (1,080,612) | | (581,927) |
| Net Increase (Decrease) in Shares Outstanding | | 1,205,210 | | 1,963,822 |
| Institutional Shares | | | | |
| Shares sold | | 1,668,857 | | 862,529 |
| Shares issued for dividends reinvested | | 23,554 | | 29,054 |
| Shares redeemed | | (756,913) | | (5,210) |
| Net Increase (Decrease) in Shares Outstanding | | 935,498 | | 886,373 |
| |
| See notes to financial statements. | | | | |
The Fund 13
FINANCIAL HIGHLIGHTS
The following tables describe the performance for each share class for the fiscal periods indicated.All information (except portfolio turnover rate) reflects financial results for a single fund share.Total return shows how much your investment in the fund would have increased (or decreased) during each period, assuming you had reinvested all dividends and distributions.These figures have been derived from the fund’s financial statements.
| | | | | Year Ended July 31, | | |
| | |
| |
| |
|
| Investor Shares | | 2009 | | 2008 | | 2007 | | 2006 | | 2005 |
| |
| |
| |
| |
| |
|
| Per Share Data ($): | | | | | | | | | | |
| Net asset value, beginning of period | | 12.30 | | 11.67 | | 11.69 | | 12.34 | | 12.25 |
| Investment Operations: | | | | | | | | | | |
| Investment income—neta | | .08 | | .79 | | .21 | | .26 | | .25 |
| Net realized and unrealized | | | | | | | | | | |
| gain (loss) on investments | | (.14) | | .48 | | .27 | | (.06) | | .40 |
| Total from Investment Operations | | (.06) | | 1.27 | | .48 | | .20 | | .65 |
| Distributions: | | | | | | | | | | |
| Dividends from investment income—net | | (.16) | | (.64) | | (.50) | | (.71) | | (.56) |
| Dividends from net realized | | | | | | | | | | |
| gain on investments | | (.10) | | — | | — | | (.14) | | — |
| Total Distributions | | (.26) | | (.64) | | (.50) | | (.85) | | (.56) |
| Net asset value, end of period | | 11.98 | | 12.30 | | 11.67 | | 11.69 | | 12.34 |
| Total Return (%) | | (.54) | | 11.01 | | 4.24 | | 1.51 | | 5.39 |
| Ratios/Supplemental Data (%): | | | | | | | | | | |
| Ratio of total expenses | | | | | | | | | | |
| to average net assets | | .87 | | 1.04 | | 2.10 | | 1.88 | | 1.74 |
| Ratio of net expenses | | | | | | | | | | |
| to average net assets | | .55 | | .55 | | .53 | | .55 | | .55 |
| Ratio of net investment income | | | | | | | | | | |
| to average net assets | | .73 | | 6.39 | | 1.83 | | 2.18 | | 2.00 |
| Portfolio Turnover Rate | | 77.13 | | 90.18 | | 18.17 | | 60.82 | | 118.91 |
| Net Assets, end of period ($ x 1,000) | | 40,557 | | 26,830 | | 2,538 | | 3,269 | | 3,009 |
| |
| a Based on average shares outstanding at each month end. | | | | | | | | |
| See notes to financial statements. | | | | | | | | | | |
14
| | | | | Year Ended July 31, | | |
| | |
| |
| |
|
| Institutional Shares | | 2009 | | 2008 | | 2007 | | 2006 | | 2005 |
| |
| |
| |
| |
| |
|
| Per Share Data ($): | | | | | | | | | | |
| Net asset value, beginning of period | | 12.30 | | 11.66 | | 11.68 | | 12.35 | | 12.25 |
| Investment Operations: | | | | | | | | | | |
| Investment income—neta | | .11 | | .84 | | .24 | | .29 | | .28 |
| Net realized and unrealized | | | | | | | | | | |
| gain (loss) on investments | | (.15) | | .48 | | .26 | | (.07) | | .41 |
| Total from Investment Operations | | (.04) | | 1.32 | | .50 | | .22 | | .69 |
| Distributions: | | | | | | | | | | |
| Dividends from investment income—net | | (.19) | | (.68) | | (.52) | | (.75) | | (.59) |
| Dividends from net realized | | | | | | | | | | |
| gain on investments | | (.10) | | — | | — | | (.14) | | — |
| Total Distributions | | (.29) | | (.68) | | (.52) | | (.89) | | (.59) |
| Net asset value, end of period | | 11.97 | | 12.30 | | 11.66 | | 11.68 | | 12.35 |
| Total Return (%) | | (.30) | | 11.29 | | 4.47 | | 1.82 | | 5.60 |
| Ratios/Supplemental Data (%): | | | | | | | | | | |
| Ratio of total expenses | | | | | | | | | | |
| to average net assets | | .55 | | .77 | | 1.83 | | 1.63 | | 1.49 |
| Ratio of net expenses | | | | | | | | | | |
| to average net assets | | .30 | | .30 | | .28 | | .30 | | .30 |
| Ratio of net investment income | | | | | | | | | | |
| to average net assets | | .98 | | 6.68 | | 2.08 | | 2.43 | | 2.26 |
| Portfolio Turnover Rate | | 77.13 | | 90.18 | | 18.17 | | 60.82 | | 118.91 |
| Net Assets, end of period ($ x 1,000) | | 24,577 | | 13,740 | | 2,693 | | 3,463 | | 3,405 |
| |
| a Based on average shares outstanding at each month end. | | | | | | | | |
| See notes to financial statements. | | | | | | | | | | |
The Fund 15
NOTES TO FINANCIAL STATEMENTS
NOTE 1—Significant Accounting Policies:
Dreyfus Inflation Adjusted Securities Fund (the “fund”) is a separate diversified series of Dreyfus Investment Grade Funds, Inc. (the “Company”), which is registered under the Investment Company Act of 1940, as amended (the “Act”), as an open-end management investment company and operates as a series company currently offering three series, including the fund.The fund’s investment objective seeks returns that exceed the rate of inflation.The Dreyfus Corporation (the “Manager” or “Dreyfus”), a wholly-owned subsidiary of The Bank of New York Mellon Corporation (“BNY Mellon”), serves as the fund’s investment advisor.
MBSC Securities Corporation (the “Distributor”), a wholly-owned subsidiary of the Manager, is the distributor of the fund’s shares, which are sold to the public without a sales charge.The fund is authorized to issue 500 million shares of $.001 par value Common Stock in each of the following classes of shares: Investor and Institutional. Investor shares are subject to a shareholder services plan. Other differences between the classes include the services offered to and the expenses borne by each class, the allocation of certain transfer agency costs, the minimum initial investment and certain voting rights. Income, expenses (other than expenses attributable to a specific class), and realized and unrealized gains or losses on investments are allocated to each class of shares based on its relative net assets.
As of July 31, 2009, MBC Investments Corp., an indirect subsidiary of BNY Mellon, held 204,961 Investor and 209,228 Institutional shares of the fund.
The Company accounts separately for the assets, liabilities and operations of each series. Expenses directly attributable to each series are charged to that series’ operations; expenses which are applicable to all series are allocated among them on a pro rata basis.
The fund’s financial statements are prepared in accordance with U.S. generally accepted accounting principles, which may require the use of management estimates and assumptions. Actual results could differ from those estimates.
16
The fund enters into contracts that contain a variety of indemnifications. The fund’s maximum exposure under these arrangements is unknown.The fund does not anticipate recognizing any loss related to these arrangements.
(a) Portfolio valuation: Investments in securities excluding short-term investments (other than U.S.Treasury Bills), financial futures and options are valued each business day by an independent pricing service (the “Service”) approved by the Board of Directors. Investments for which quoted bid prices are readily available and are representative of the bid side of the market in the judgment of the Service are valued at the mean between the quoted bid prices (as obtained by the Service from dealers in such securities) and asked prices (as calculated by the Service based upon its evaluation of the market for such securities). Other investments (which constitute a majority of the portfolio securities) are valued as determined by the Service, based on methods which include consideration of: yields or prices of securities of comparable quality, coupon, maturity and type; indications as to values from dealers; and general market conditions. Restricted securities, as well as securities or other assets for which recent market quotations are not readily available, that are not valued by a pricing service approved by the Board of Directors, or are determined by the fund not to reflect accurately fair value, are valued at fair value as determined in good faith under the direction of the Board of Directors. The factors that may be considered when fair valuing a security include fundamental analytical data, the nature and duration of restrictions on disposition, an evaluation of the forces that influence the market in which the securities are purchased and sold and public trading in similar securities of the issuer or comparable issuers. Short-term investments, excluding U.S. Treasury Bills, are carried at amortized cost, which approximates value. Registered investment companies that are not traded on an exchange are valued at their net asset value. Financial futures and options, which are traded on an exchange, are valued at the last sales price on the securities exchange on which such securities are primarily traded or at the last sales price on the national securities
The Fund 17
| NOTES TO FINANCIAL STATEMENTS (continued) |
market on each business day. Options traded over-the-counter are priced at the mean between the bid and asked price.
The fund adopted Statement of Financial Accounting Standards No. 157 “FairValue Measurements” (“FAS 157”). FAS 157 establishes an authoritative definition of fair value, sets out a framework for measuring fair value, and requires additional disclosures about fair value measurements.
Various inputs are used in determining the value of the fund’s investments relating to FAS 157.These inputs are summarized in the three broad levels listed below.
Level 1—quoted prices in active markets for identical investments.
Level 2—other significant observable inputs (including quoted prices for similar investments, interest rates, prepayment speeds, credit risk, etc.).
Level 3—significant unobservable inputs (including the fund’s own assumptions in determining the fair value of investments).
The inputs or methodology used for valuing securities are not necessarily an indication of the risk associated with investing in those securities.
The following is a summary of the inputs used as of July 31, 2009 in valuing the fund’s investments:
| | | | | Level 2—Other | | Level 3— | | |
| | | Level 1— | | Significant | | Significant | | |
| | | Quoted | | Observable | | Unobservable | | |
| | | Prices | | Inputs | | Inputs | | Total |
| |
| |
| |
| |
|
| Assets ($) | | | | | | | | |
| Investments in Securities: | | | | | | |
| U.S. Treasury | | | | | | | | |
| Securities | | — | | 64,949,704 | | — | | 64,949,704 |
| Mutual Funds | | 25,899,012 | | — | | — | | 25,899,012 |
| Other Financial | | | | | | | | |
| Instruments† | | — | | — | | — | | — |
| Liabilities ($) | | | | | | | | |
| Other Financial | | | | | | | | |
| Instruments† | | — | | — | | — | | — |
† Other financial instruments include derivative instruments, such as futures, forward foreign currency
exchange contracts, swap contracts and options contracts. Amounts shown represent unrealized
appreciation (depreciation), or in the case of options, market value at period end. |
18
(b) Securities transactions and investment income: Securities transactions are recorded on a trade date basis. Realized gains and losses from securities transactions are recorded on the identified cost basis. Dividend income is recognized on the ex-dividend date and interest income, including, where applicable, accretion of discount and amortization of premium on investments, is recognized on the accrual basis.
The fund has arrangements with the custodian and cash management bank whereby the fund may receive earnings credits when positive cash balances are maintained, which are used to offset custody and cash management fees. For financial reporting purposes, the fund includes net earnings credits as an expense offset in the Statement of Operations.
Pursuant to a securities lending agreement with The Bank of New York Mellon, a subsidiary of BNY Mellon and an affiliate of Dreyfus, the fund may lend securities to qualified institutions. It is the fund’s policy that, at origination, all loans are secured by collateral of at least 102% of the value of U.S. securities loaned and 105% of the value of foreign securities loaned. Collateral equivalent to at least 100% of the market value of securities on loan is maintained at all times. Collateral is either in the form of cash, which can be invested in certain money market mutual funds managed by the Manager, U.S. Government and Agency securities or letters of credit.The fund is entitled to receive all income on securities loaned, in addition to income earned as a result of the lending transaction. Although each security loaned is fully collateralized, the fund bears the risk of delay in recovery of, or loss of rights in, the securities loaned should a borrower fail to return the securities in a timely manner. During the period ended July 31, 2009, The Bank of New York Mellon earned $44,445 from lending fund portfolio securities, pursuant to the securities lending agreement.
(c) Affiliated issuers: Investments in other investment companies advised by the Manager are defined as “affiliated” in the Act.
(d) Dividends to shareholders: It is the policy of the fund to declare dividends daily from investment income-net. Such dividends are paid monthly. Dividends from net realized capital gains, if any, are normally
The Fund 19
| NOTES TO FINANCIAL STATEMENTS (continued) |
declared and paid annually, but the fund may make distributions on a more frequent basis to comply with the distribution requirements of the Internal Revenue Code of 1986, as amended (the “Code”).To the extent that net realized capital gains can be offset by capital loss carryovers, it is the policy of the fund not to distribute such gains. Income and capital gain distributions are determined in accordance with income tax regulations, which may differ from U.S. generally accepted accounting principles.
(e) Federal income taxes: It is the policy of the fund to continue to qualify as a regulated investment company, if such qualification is in the best interests of its shareholders, by complying with the applicable provisions of the Code, and to make distributions of taxable income sufficient to relieve it from substantially all federal income and excise taxes.
As of and during the period ended July 31, 2009, the fund did not have any liabilities for any uncertain tax positions. The fund recognizes interest and penalties, if any, related to uncertain tax positions as income tax expense in the Statement of Operations. During the period, the fund did not incur any interest or penalties.
Each of the tax years in the four-year period ended July 31, 2009 remains subject to examination by the Internal Revenue Service and state taxing authorities.
At July 31, 2009, the components of accumulated earnings on a tax basis were as follows: accumulated capital losses $47,768 and unrealized depreciation $542,013. In addition, the fund had $950,404 of capital losses realized after October 31, 2008, which were deferred for tax purposes to the first day of the following fiscal year.
The accumulated capital loss carryover is available for federal income tax purposes to be applied against future net securities profits, if any, realized subsequent to July 31, 2009. If not applied, the carryover expires in fiscal 2017.
20
The tax character of distributions paid to shareholders during the fiscal periods ended July 31, 2009 and July 31, 2008 were as follows: ordinary income $940,645 and $1,434,452, respectively.
During the period ended July 31, 2009, as a result of permanent book to tax differences, primarily due to the tax treatment for dividend reclassification, the fund increased accumulated undistributed investment income-net by $198,134, decreased accumulated net realized gain (loss) on investments by $47,168 and decreased paid-in capital by $150,966. Net assets and net asset value per share were not affected by this reclassification.
NOTE 2—Bank Lines of Credit:
The fund participates with other Dreyfus-managed funds in a $145 million unsecured credit facility led by Citibank,N.A. and a $300 million unsecured credit facility provided by The Bank of New York Mellon (each, a “Facility”), each to be utilized primarily for temporary or emergency purposes, including the financing of redemptions. In connection therewith, the fund has agreed to pay its pro rata portion of Facility fees for each Facility. Interest is charged to the fund based on rates determined pursuant to the terms of the respective Facility at the time of the borrowing. During the period ended July 31, 2009, the fund did not borrow under the facilities.
NOTE 3—Management Fee and Other Transactions With Affiliates:
(a) Pursuant to a management agreement (“Agreement”) with the Manager, the management fee is computed at the annual rate of .30% of the value of the fund’s average daily net assets and is payable monthly. The Manager has undertaken from August 1, 2008 through December 1, 2009, that if, the aggregate expenses of the fund (exclusive of taxes, brokerage fees, interest expense, commitment fees on borrowings,
The Fund 21
| NOTES TO FINANCIAL STATEMENTS (continued) |
shareholder services plan fees and extraordinary expenses) exceed an annual rate of .30% of the value of the fund’s average daily net assets, the fund may deduct from the payment to be made to the Manager under the Agreement, or the Manager will bear, such excess expense. The reduction in management fee, pursuant to the undertaking, amounted to $136,797 during the period ended July 31, 2009.
(b) Under the Investor Shares Shareholder Services Plan, the fund pays the Distributor at an annual rate of .25% of the value of Investor Shares average daily net assets for the provision of certain services. The services provided may include personal services relating to shareholder accounts, such as answering shareholder inquiries regarding the fund and providing reports and other information, and services related to the maintenance of shareholder accounts. The Distributor may make payments to Service Agents (a securities dealer, financial institution or other industry professional) in respect of these services. The Distributor determines the amounts to be paid to Service Agents. During the period ended July 31, 2009, Investor Shares were charged $76,734 pursuant to the Shareholder Services Plan.
The fund compensates Dreyfus Transfer, Inc., a wholly-owned subsidiary of the Manager, under a transfer agency agreement for providing personnel and facilities to perform transfer agency services for the fund. During the period ended July 31, 2009, the fund was charged $4,831 pursuant to the transfer agency agreement.
The fund compensates The Bank of New York Mellon under a cash management agreement for performing cash management services related to fund subscriptions and redemptions. During the period ended July 31, 2009, the fund was charged $628 pursuant to the cash management agreement. These fees were offset by earnings credits pursuant to the cash management agreement.
22
The fund also compensates The Bank of New York Mellon under a custody agreement for providing custodial services for the fund. During the period ended July 31, 2009, the fund was charged $7,422 pursuant to the custody agreement.
During the period ended July 31, 2009, the fund was charged $5,939 for services performed by the Chief Compliance Officer.
The components of “Due to The Dreyfus Corporation and affiliates” in the Statement of Assets and Liabilities consist of: management fees $16,431, shareholder services plan fees $8,571, custodian fees $2,339, chief compliance officer fees $2,227 and transfer agency per account fees $620, which are offset against an expense reimbursement currently in effect in the amount of $20,272.
(c) Each Board member also serves as a Board member of other funds within the Dreyfus complex. Annual retainer fees and attendance fees are allocated to each fund based on net assets.
NOTE 4—Securities Transactions:
The aggregate amount of purchases and sales (including paydowns) of investment securities, excluding short-term securities, during the period ended July 31, 2009, amounted to $61,273,799 and $35,162,276, respectively.
The fund adopted Statement of Financial Accounting Standards No. 161 “Disclosures about Derivative Instruments and Hedging Activities” (“FAS 161”). FAS 161 requires qualitative disclosures about objectives and strategies for using derivatives, quantitative disclosures about fair value amounts of gains and losses on derivative instruments and disclosures about credit-risk-related contingent features in derivative
The Fund 23
| NOTES TO FINANCIAL STATEMENTS (continued) |
agreements. Since the fund held no derivatives during the period ended July 31, 2009, FAS 161 disclosures did not impact the notes to the financial statements.
At July 31, 2009, the cost of investments for federal income tax purposes was $91,390,729; accordingly, accumulated net unrealized depreciation on investments was $542,013, consisting of $311,204 gross unrealized appreciation and $853,217 gross unrealized depreciation.
NOTE 5—Subsequent Events Evaluation:
Dreyfus has evaluated the need for disclosures and/or adjustments resulting from subsequent events through September 25, 2009, the date the financial statements were available to be issued.This evaluation did not result in any subsequent events that necessitated disclosures and/or adjustments.
24
REPORT OF INDEPENDENT REGISTERED
PUBLIC ACCOUNTING FIRM |
Shareholders and Board of Directors Dreyfus Inflation Adjusted Securities Fund
We have audited the accompanying statement of assets and liabilities, including the statement of investments, of Dreyfus Inflation Adjusted Securities Fund (one of the series comprising Dreyfus Investment Grade Bond Funds, Inc.) as of July 31, 2009, and the related statement of operations for the year then ended, the statement of changes in net assets for each of the two years in the period then ended, and financial highlights for each of the years indicated therein.These financial statements and financial highlights are the responsibility of the Fund’s management. Our responsibility is to express an opinion on these financial statements and financial highlights based on our audits.
We conducted our audits in accordance with the standards of the Public Company Accounting Oversight Board (United States).Those standards require that we plan and perform the audit to obtain reasonable assurance about whether the financial statements and financial highlights are free of material misstatement.We were not engaged to perform an audit of the Fund’s internal control over financial reporting. Our audits included consideration of internal control over financial reporting as a basis for designing audit procedures that are appropriate in the circumstances, but not for the purpose of expressing an opinion on the effectiveness of the Fund’s internal control over financial reporting. Accordingly, we express no such opinion. An audit also includes examining, on a test basis, evidence supporting the amounts and disclosures in the financial statements and financial highlights, assessing the accounting principles used and significant estimates made by management, and evaluating the overall financial statement presentation. Our procedures included confirmation of securities owned as of July 31, 2009 by correspondence with the custodian and others.We believe that our audits provide a reasonable basis for our opinion.
In our opinion, the financial statements and financial highlights referred to above present fairly, in all material respects, the financial position of Dreyfus Inflation Adjusted Securities Fund at July 31, 2009, the results of its operations for the year then ended, the changes in its net assets for each of the two years in the period then ended, and the financial highlights for each of the indicated years, in conformity with U.S. generally accepted accounting principles.

New York, New York
September 25, 2009 |
The Fund 25
IMPORTANT TAX INFORMATION (Unaudited)
For federal tax purposes the fund hereby designates 100% of ordinary dividends paid during the fiscal year ended July 31, 2009 as qualifying “interest related dividends.” Also for state individual income tax purposes, the fund hereby designates 99.78% of the ordinary income dividends paid during the fiscal year ended July 31, 2009 as attributable to interest income from direct obligations of the United States. Such dividends are currently exempt from taxation for individual income tax purposes in most states, including New York, California and the District of Columbia.Also, the fund hereby designates $.0960 per share as a short-term capital gain distribution paid on December 23, 2008.
26
INFORMATION ABOUT THE REVIEW AND APPROVAL OF
THE FUND’S MANAGEMENT AGREEMENT (Unaudited) |
At a meeting of the Board of Directors of the fund held on July 14 and 15, 2009, the Board considered the re-approval for an annual period (through July 29, 2010) of the Management Agreement with Dreyfus for the fund, pursuant to which Dreyfus provides the fund with investment advisory and administrative services. The Board members, none of whom are “interested persons” (as defined in the Investment Company Act of 1940, as amended) of the fund, were assisted in their review by independent legal counsel and met with counsel in executive session separate from representatives of Dreyfus.
Analysis of Nature, Extent and Quality of Services Provided to the Fund. The Board members received a presentation from representatives of Dreyfus regarding services provided to the fund and other funds in the Dreyfus fund complex, and discussed the nature, extent and quality of the services provided to the fund pursuant to its Management Agreement. Dreyfus’ representatives reviewed the fund’s distribution of accounts and the relationships Dreyfus has with various intermediaries and the different needs of each. Dreyfus’ representatives noted the distribution channels for the fund as well as the diversity of distribution among the funds in the Dreyfus fund complex, and Dreyfus’ corresponding need for broad, deep, and diverse resources to be able to provide ongoing shareholder services to each distribution channel, including those of the fund. Dreyfus also provided the number of shareholder accounts in the fund, as well as the fund’s asset size.
The Board members also considered Dreyfus’ research and portfolio management capabilities and that Dreyfus also provides oversight of day-to-day fund operations, including fund accounting and administration and assistance in meeting legal and regulatory requirements. The Board members also considered Dreyfus’ extensive administrative, accounting and compliance infrastructure.The Board also considered Dreyfus’ brokerage policies and practices and the standards applied in seeking best execution.
The Fund 27
INFORMATION ABOUT THE REVIEW AND APPROVAL OF THE
FUND’S MANAGEMENT AGREEMENT (Unaudited) (continued) |
Comparative Analysis of the Fund’s Performance and Management Fee and Expense Ratio. The Board members reviewed the performance of the fund’s Investor Shares and comparisons to a group of retail no-load Treasury inflation-protected securities funds (the “Performance Group”) and to a larger universe of funds, consisting of all retail and institutional Treasury inflation-protected securities funds (the “Performance Universe”) selected and provided by Lipper, Inc., an independent provider of investment company data.The Board was provided with a description of the methodology Lipper used to select the Performance Group and Performance Universe, as well as the Expense Group and Expense Universe (discussed below). The Board members discussed the results of the comparisons for various periods ended May 31, 2009.The Board members noted that the fund’s total return performance variously was above and below the Performance Group medians for the periods shown, and was above the Performance Universe medians for the periods shown. The Board members noted that the fund’s yield performance was above the Performance Group and Performance Universe medians for all periods except two. Dreyfus also provided a comparison of the fund’s total returns to the returns of the fund’s benchmark index for each of the calendar years since inception.
The Board members also discussed the fund’s management fee and expense ratio and reviewed the range of management fees and expense ratios as compared to a comparable group of funds (the “Expense Group”) and a broader group of funds (the “Expense Universe”), each selected and provided by Lipper. The Board members noted that the fund’s contractual management fee was lower than the Expense Group median, and the actual management fee (even without taking into account the reduction due to an undertaking to limit the fund’s expenses) and total expense ratio (which included the undertaking by Dreyfus to limit the fund’s expense ratio) were lower than the Expense Group and Expense Universe medians. The Board noted that the fund’s expense ratio was lower due to the undertaking by Dreyfus to waive fees and reimburse expenses.
28
Representatives of Dreyfus stated that there were no other mutual funds managed by Dreyfus or its affiliates with similar investment objectives, policies and strategies, and reviewed with the Board other accounts managed by Dreyfus or its affiliates, with similar investment objectives, policies and strategies as the fund (the “Similar Accounts”). Dreyfus representatives explained the nature of the Similar Accounts and the differences, from Dreyfus’ perspective, in providing services to such Similar Accounts as compared to managing and providing services to the fund. Dreyfus’ representatives also reviewed the costs associated with distribution through intermediaries.The Board analyzed differences in fees paid to Dreyfus and discussed the relationship of the fees paid in light of the services provided. The Board members considered the relevance of the fee information provided for the Similar Accounts to evaluate the appropriateness and reasonableness of the fund’s management fee.
Analysis of Profitability and Economies of Scale. Dreyfus’ representatives reviewed the dollar amount of expenses allocated and profit received by Dreyfus and the method used to determine such expenses and profit.The Board considered information, previously provided and discussed, prepared by an independent consulting firm regarding Dreyfus’ approach to allocating costs to, and determining the profitability of, individual funds and the entire Dreyfus mutual fund complex. The Board members also considered that the methodology had also been reviewed by an independent registered public accounting firm which, like the consultant, found the methodology to be reason-able.The consulting firm also analyzed where any economies of scale might emerge in connection with the management of the fund. The Board members evaluated the profitability analysis in light of the relevant circumstances for the fund and the extent to which economies of scale would be realized if the fund grows and whether fee levels reflect these economies of scale for the benefit of fund investors.The Board
The Fund 29
INFORMATION ABOUT THE REVIEW AND APPROVAL OF THE
FUND’S MANAGEMENT AGREEMENT (Unaudited) (continued) |
members also considered potential benefits to Dreyfus from acting as investment adviser and noted that there were no soft dollar arrangements with respect to trading the fund’s investments.
It was noted that the Board members should consider Dreyfus’ profitability with respect to the fund as part of their evaluation of whether the fees under the Management Agreement bear a reasonable relationship to the mix of services provided by Dreyfus, including the nature, extent and quality of such services and that a discussion of economies of scale is predicated on increasing assets and that, if a fund’s assets had been decreasing, the possibility that Dreyfus may have realized any economies of scale would be less. It also was noted that the profitability percentage for managing the fund was within ranges determined by appropriate court cases to be reasonable given the services rendered and generally superior service levels provided. The Board also noted the fee waiver and expense reimbursement arrangement and its effect on Dreyfus’ profitability.
At the conclusion of these discussions, the Board agreed that it had been furnished with sufficient information to make an informed business decision with respect to continuation of the Management Agreement, with respect to the fund. Based on the discussions and considerations as described above, the Board made the following conclusions and determinations.
- The Board concluded that the nature, extent and quality of the ser- vices provided by Dreyfus are adequate and appropriate.
- The Board generally was satisfied with the fund’s performance and expressed confidence in the fund’s portfolio management team, which continued to apply a consistent investment strategy.
30
- The Board concluded that the fee paid by the fund to Dreyfus was reasonable in light of the services provided, comparative performance, expense and management fee information, including Dreyfus’ under- taking to limit the fund’s expense ratio (which reduced the fund’s actual management fee and expense ratio), costs of the services pro- vided and profits to be realized and benefits derived or to be derived by Dreyfus from its relationship with the fund.
- The Board determined that the economies of scale which may accrue to Dreyfus and its affiliates in connection with the manage- ment of the fund had been adequately considered by Dreyfus in connection with the management fee rate charged to the fund and that, to the extent in the future it were determined that material economies of scale had not been shared with the fund, the Board would seek to have those economies of scale shared with the fund.
The Board members considered these conclusions and determinations, along with information received on a routine and regular basis throughout the year, and, without any one factor being dispositive, the Board determined that re-approval of the Management Agreement,with respect to the fund, was in the best interests of the fund and its shareholders.
The Fund 31
32
The Fund 33

34

The Fund 35
NOTES
For More Information
Telephone 1-800-645-6561
Mail The Dreyfus Family of Funds, 144 Glenn Curtiss Boulevard, Uniondale, NY 11556-0144 E-mail Send your request to info@dreyfus.com Internet Information can be viewed online or downloaded at: http://www.dreyfus.com
The fund files its complete schedule of portfolio holdings with the Securities and Exchange Commission (“SEC”) for the first and third quarters of each fiscal year on Form N-Q. The fund’s Forms N-Q are available on the SEC’s website at http://www.sec.gov and may be reviewed and copied at the SEC’s Public Reference Room in Washington, DC. Information on the operation of the Public Reference Room may be obtained by calling 1-800-SEC-0330.
A description of the policies and procedures that the fund uses to determine how to vote proxies relating to portfolio securities, and information regarding how the fund voted these proxies for the most recent 12-month period ended June 30 is available at http://www.dreyfus.com and on the SEC’s website at http://www.sec.gov. The description of the policies and procedures is also available without charge, upon request, by calling 1-800-645-6561.
| © 2009 MBSC Securities Corporation |

| | Dreyfus
Intermediate
Term Income Fund |
| | ANNUAL REPORT July 31, 2009 |

Save time. Save paper. View your next shareholder report online as soon as it’s available. Log into www.dreyfus.com and sign up for Dreyfus eCommunications. It’s simple and only takes a few minutes.
The views expressed in this report reflect those of the portfolio manager only through the end of the period covered and do not necessarily represent the views of Dreyfus or any other person in the Dreyfus organization. Any such views are subject to change at any time based upon market or other conditions and Dreyfus disclaims any responsibility to update such views.These views may not be relied on as investment advice and, because investment decisions for a Dreyfus fund are based on numerous factors, may not be relied on as an indication of trading intent on behalf of any Dreyfus fund.
| | | Contents |
| |
| |
| | | THE FUND |
| |
|
| 2 | | A Letter from the Chairman and CEO |
| 3 | | Discussion of Fund Performance |
| 6 | | Fund Performance |
| 8 | | Understanding Your Fund’s Expenses |
| 8 | | Comparing Your Fund’s Expenses |
| | | With Those of Other Funds |
| 9 | | Statement of Investments |
| 37 | | Statement of Financial Futures |
| 38 | | Statement of Options Written |
| 39 | | Statement of Assets and Liabilities |
| 40 | | Statement of Operations |
| 41 | | Statement of Changes in Net Assets |
| 43 | | Financial Highlights |
| 47 | | Notes to Financial Statements |
| 68 | | Report of Independent Registered |
| | | Public Accounting Firm |
| 69 | | Important Tax Information |
| 70 | | Information About the Review and Approval |
| | | of the Fund’s Management Agreement |
| 75 | | Board Members Information |
| 77 | | Officers of the Fund |
| |
| | | FOR MORE INFORMATION |
| |
|
| | | Back Cover |
Dreyfus
Intermediate
Term Income Fund |

A LETTER FROM THE CHAIRMAN AND CEO
Dear Shareholder:
We are pleased to present this annual report for Dreyfus Intermediate Term Income Fund, covering the 12-month period from August 1, 2008, through July 31, 2009.
The severe recession and banking crisis that dominated the financial markets over much of the past year appear to have eased. Previously frozen credit markets have thawed to an extent, giving businesses improved access to the capital they need to grow. After reaching multi-year lows early in 2009, higher-yielding segments of the bond market staged an impressive rally, while U.S.Treasury securities have experienced significant price volatility since January as a result of recession-related factors and technical supply issues.The U.S. economy remains weak overall, but we have seen encouraging evidence of potential recovery, including signs of healing in the battered housing and manufacturing sectors. Even the unemployment rate, which historically has been a lagging indicator of economic trends, recently showed signs of improvement.
Although these developments give us reasons for optimism, we remain cautious due to the speed and magnitude of the corporate bond market’s 2009 rebound. Indeed, the market’s advance was fueled more by investors’ renewed appetites for risk than improving business fundamentals. We would prefer to see a steadier rise in asset prices supported by more concrete economic data, as the rapid rise increases the possibility that profit-taking could fuel further volatility. In uncertain markets such as this one,even the most seasoned investors can benefit from professional counsel. To determine how your investments should be positioned for any potential challenges and opportunities that lie ahead, we urge you, as always, to talk regularly with your financial advisor.
For information about how the fund performed during the reporting period, as well as market perspectives, we have provided a Discussion of Fund Performance given by the fund’s Portfolio Manager.
Thank you for your continued confidence and support.
Jonathan R. Baum
Chairman and Chief Executive Officer
The Dreyfus Corporation
August 17, 2009 |
2

DISCUSSION OF FUND PERFORMANCE
For the period of August 1, 2008, through July 31, 2009, as provided by Kent Wosepka, Portfolio Manager
Fund and Market Performance Overview
For the 12-month period ended July 31, 2009, Dreyfus Intermediate Term Income Fund’s Class A shares produced a total return of 4.90%, Class B shares returned 3.95%, Class C shares returned 4.01% and Class I shares returned 5.27%.1 In comparison, the fund’s benchmark, the Barclays Capital U.S. Aggregate Bond Index, achieved a total return of 7.85% for the same period.2
The U.S. bond market encountered extreme volatility in the fall of 2008 due to a global financial crisis and recession, but market declines early in the reporting period were offset by a sustained rally in 2009. The fund produced lower returns than its benchmark, as better relative performance during the rally was not enough to fully offset earlier weakness among corporate bonds and mortgage-backed securities.
The Fund’s Investment Approach
The fund seeks to maximize total return, consisting of capital appreciation and current income.To pursue this goal, the fund normally invests at least 80% of its assets in fixed-income securities of U.S. and foreign issuers rated at least investment grade or the unrated equivalent as determined by Dreyfus.These securities include:U.S.government bonds and notes, corporate bonds, municipal bonds, convertible securities, preferred stocks, inflation-indexed securities, asset-backed securities, mortgage-related securities and foreign bonds.Typically, the fund can be expected to have an average effective maturity ranging from five to 10 years, and an average effective duration ranging between three and eight years. For additional yield, the fund may invest up to 20% of its assets in fixed-income securities rated below investment grade.
2009 Market Rally Erased Earlier Losses
The reporting period began in the midst of a global banking crisis that produced steep declines among higher yielding bonds, including mortgage-backed, asset-backed and corporate securities. In contrast, U.S. Treasury securities rallied strongly amid a “flight to quality,” causing
The Fund 3
| DISCUSSION OF FUND PERFORMANCE (continued) |
their yields to fall to unprecedented low levels. Meanwhile, slumping housing markets, rising unemployment and deteriorating consumer confidence led to the longest and deepest recession since the 1930s.
The Federal Reserve Board (the “Fed”) and U.S. government responded aggressively to the downturn. Government officials rescued a number of struggling corporations, and Congress followed up with the $787 billion American Recovery and Reinvestment Act of 2009.The Fed injected massive amounts of liquidity into the banking system and purchased mortgage- and asset-backed debt through unprecedented programs such as the Term Asset-Backed Securities Loan Facility (TALF). In addition, the Fed completed a series of interest-rate reductions by cutting its target range for the overnight federal funds rate to an all-time low of between 0% to 0.25% by the end of 2008.
As it became clearer in March 2009 that these measures had helped to avert a collapse of the U.S. banking system, investor sentiment began to improve to an extent. Investors capitalized on attractive valuations among higher yielding bonds, sparking springtime rallies that were particularly impressive for investment-grade and high yield corporate bonds. Mortgage-backed securities also rebounded, in part due to massive purchases by the Fed. Conversely, U.S. Treasury securities gave back some of their earlier gains.
Sector Allocation Strategy Produced Mixed Results
The fund began the reporting period with underweighted exposure to U.S. Treasury securities and overweight positions in higher yielding market sectors, including investment-grade corporate bonds and higher-quality mortgage-backed securities. These positions bore the brunt of selling pressure in 2008 as investors deleveraged their portfolios.Although the fund’s investment-grade corporate bond holdings were broadly diversified across industry groups, weakness was especially pronounced among bonds issued by financial companies at the center of the banking crisis.
However, these higher yielding positions led the 2009 market rally. Investment-grade corporate bonds with BBB ratings fared particularly well, while our focus on current-coupon mortgage-backed securities issued by U.S. government agencies benefited from the Fed’s repurchase programs. As they reached more attractive valuations toward year-end 2008, we established larger positions in the fund of
4
commercial mortgages and asset-backed securities, as well as high yield corporate bonds, which are not part of the benchmark but ranked among the market’s better performers over the final five months of the reporting period. At that time, we also set the fund’s average duration in a range that was longer than industry averages, a position that bolstered the fund’s relative performance as intermediate- and longer-term bond yields declined.We subsequently reduced the fund’s average duration toward a market-neutral position.
Maintaining a Disciplined Approach to Security Selection
As of the reporting period’s end, we have maintained the fund’s sector allocation strategy, as we believe that higher yielding bonds have room for further gains. However, we are aware that the bulk of the bond market rally probably is behind us, and we expect the Fed to pare back its remedial programs as the credit markets and U.S. economy recover. Therefore, we believe that security selection will become a more critical determinant of fund performance over the foreseeable future, an environment to which our relative value-oriented approach may be particularly well suited.
August 17, 2009
| | The fund may use derivative instruments, such as options, futures and options on futures, forward
contracts, swaps (including credit default swaps on corporate bonds and asset-backed securities),
options on swaps, and other credit derivatives.A small investment in derivatives could have a
potentially large impact on the fund’s performance.The use of derivatives involves risks different
from, or possibly greater than, the risks associated with investing directly in the underlying assets.
Credit default swaps and similar instruments involve greater risks than if the fund had invested in
the reference obligation directly, since, in addition to general market risks, they are subject to
illiquidity risk, counterparty risk and credit risks. |
| 1 | Total return includes reinvestment of dividends and any capital gains paid, and does not take into consideration the maximum initial sales charge in the case of Class A shares, or the applicable contingent deferred sales charges imposed on redemptions in the case of Class B and Class C shares. Had these charges been reflected, returns would have been lower. Past performance is no guarantee of future results. Share price, yield and investment return fluctuate such that upon redemption, fund shares may be worth more or less than their original cost. Return figure provided for the fund’s Class A shares and Class I shares reflects the absorption of certain fund expenses by The Dreyfus Corporation pursuant to an undertaking in effect through December 31, 2009, at which time it may be extended, terminated or modified. Had these expenses not been absorbed, the fund’s Class A and Class I shares’ returns would have been lower. |
| |
| 2 | SOURCE: LIPPER INC. — Reflects reinvestment of dividends and, where applicable, capital gain distributions. The Barclays Capital U. S. Aggregate Bond Index is a widely accepted, unmanaged total return index of corporate, U. S. government and U. S. government agency debt instruments, mortgage-backed securities and asset-backed securities with an average maturity of 1-10 years. |
| |
The Fund 5

| | † Source: Lipper Inc.
Past performance is not predictive of future performance.The fund’s performance shown in the graph and table does not
reflect the deduction of taxes that a shareholder would pay on fund distributions or the redemption of fund shares.
The above graph compares a $10,000 investment made in Class A shares of Dreyfus Intermediate Term Income Fund
on 7/31/99 to a $10,000 investment made in the Barclays Capital U.S.Aggregate Index (the “Index”) on that date.
All dividends and capital gain distributions are reinvested. Performance for Class B, Class C and Class I shares will
vary from the performance of Class A shares shown above due to differences in charges and expenses.
The fund invests primarily in debt securities and securities with debt-like characteristics of domestic and foreign issuers
and maintains an average effective maturity ranging between five and ten years and an average effective duration ranging
between three and eight years.The fund’s performance shown in the line graph takes into account all applicable fees and
expenses.The Index is a widely accepted, unmanaged total return index of corporate, U.S. government and U.S.
government agency debt instruments, mortgage-backed securities and asset-backed securities with an average maturity of
1-10 years. Unlike a mutual fund, the Index is not subject to charges, fees and other expenses. Investors cannot invest
directly in any index. Further information relating to fund performance, including expense reimbursements, if applicable, is
contained in the Financial Highlights section of the prospectus and elsewhere in this report. |
6
| Average Annual Total Returns as of 7/31/09 | | | | | | | | |
| |
| | | Inception | | | | | | | | | | From |
| | | Date | | 1 Year | | 5 Years | | 10 Years | | Inception |
| |
| |
| |
| |
| |
|
| Class A shares | | | | | | | | | | | | |
| with maximum sales charge (4.5%) | | 2/2/96 | | 0.15% | | 3.17% | | 5.03% | | | | — |
| without sales charge | | 2/2/96 | | 4.90% | | 4.12% | | 5.51% | | | | — |
| Class B shares | | | | | | | | | | | | |
| with applicable redemption charge † | | 5/13/08 | | –0.04% | | 3.58%††† | | 5.51%†††,†††† | | — |
| without redemption | | 5/13/08 | | 3.95% | | 3.91%††† | | 5.51%†††,†††† | | — |
| Class C shares | | | | | | | | | | | | |
| with applicable redemption charge †† | | 5/13/08 | | 3.01% | | 3.91%††† | | 5.41%††† | | — |
| without redemption | | 5/13/08 | | 4.01% | | 3.91%††† | | 5.41%††† | | — |
| Class I shares | | 5/31/01 | | 5.27% | | 4.40% | | — | | | | 4.63% |
The Fund 7
UNDERSTANDING YOUR FUND’S EXPENSES (Unaudited)
As a mutual fund investor, you pay ongoing expenses, such as management fees and other expenses. Using the information below, you can estimate how these expenses affect your investment and compare them with the expenses of other funds.You also may pay one-time transaction expenses, including sales charges (loads) and redemption fees, which are not shown in this section and would have resulted in higher total expenses. For more information, see your fund’s prospectus or talk to your financial adviser.
Review your fund’s expenses
The table below shows the expenses you would have paid on a $1,000 investment in Dreyfus Intermediate Term Income Fund from February 1, 2009 to July 31, 2009. It also shows how much a $1,000 investment would be worth at the close of the period, assuming actual returns and expenses.
Expenses and Value of a $1,000 Investment assuming actual returns for the six months ended July 31, 2009
| | | Class A | | Class B | | Class C | | Class I |
| |
| |
| |
| |
|
| Expenses paid per $1,000† | | $ 4.34 | | $ 8.88 | | $ 8.98 | | $ 2.78 |
| Ending value (after expenses) | | $1,110.70 | | $1,105.60 | | $1,105.90 | | $1,112.20 |
COMPARING YOUR FUND’S EXPENSES WITH THOSE OF OTHER FUNDS (Unaudited)
Using the SEC’s method to compare expenses
The Securities and Exchange Commission (SEC) has established guidelines to help investors assess fund expenses. Per these guidelines, the table below shows your fund’s expenses based on a $1,000 investment, assuming a hypothetical 5% annualized return. You can use this information to compare the ongoing expenses (but not transaction expenses or total cost) of investing in the fund with those of other funds.All mutual fund shareholder reports will provide this information to help you make this comparison. Please note that you cannot use this information to estimate your actual ending account balance and expenses paid during the period.
Expenses and Value of a $1,000 Investment assuming a hypothetical 5% annualized return for the six months ended July 31, 2009
| | | Class A | | Class B | | Class C | | Class I |
| |
| |
| |
| |
|
| Expenses paid per $1,000† | | $ 4.16 | | $ 8.50 | | $ 8.60 | | $ 2.66 |
| Ending value (after expenses) | | $1,020.68 | | $1,016.36 | | $1,016.27 | | $1,022.17 |
| | † Expenses are equal to the fund’s annualized expense ratio of .83% for Class A, 1.70% for Class B, 1.72% for Class
C and .53% for Class I, multiplied by the average account value over the period, multiplied by 181/365 (to reflect the
one-half year period). |
8
| STATEMENT OF INVESTMENTS | | | | | | | | |
| July 31, 2009 | | | | | | | | | | |
| |
| |
| |
| |
| |
|
| |
| |
| |
| | | Coupon | | Maturity | | Principal | | | | |
| Bonds and Notes—111.2% | | Rate (%) | | Date | | Amount ($) | | | | Value ($) |
| |
| |
| |
| |
| |
|
| Advertising—.0% | | | | | | | | | | |
| Lamar Media, | | | | | | | | | | |
| Gtd. Notes | | 6.63 | | 8/15/15 | | 545,000 | | | | 482,325 |
| Aerospace & Defense—.3% | | | | | | | | | | |
| L-3 Communications, | | | | | | | | | | |
| Gtd. Notes, Ser. B | | 6.38 | | 10/15/15 | | 3,140,000 | | | | 3,030,100 |
| Raytheon, | | | | | | | | | | |
| Sr. Unscd. Notes | | 5.50 | | 11/15/12 | | 375,000 | | | | 409,763 |
| | | | | | | | | | | 3,439,863 |
| Agriculture—.4% | | | | | | | | | | |
| Altria Group, | | | | | | | | | | |
| Gtd. Notes | | 9.70 | | 11/10/18 | | 2,535,000 | | | | 3,087,533 |
| Philip Morris International, | | | | | | | | | | |
| Sr. Unscd. Notes | | 5.65 | | 5/16/18 | | 2,175,000 | | | | 2,318,054 |
| | | | | | | | | | | 5,405,587 |
| Asset-Backed Ctfs./ | | | | | | | | | | |
| Auto Receivables—3.0% | | | | | | | | | | |
| Americredit Automobile Receivables | | | | | | | | | | |
| Trust, Ser. 2007-CM, Cl. A3B | | 0.33 | | 5/7/12 | | 549,640 | | a | | 544,025 |
| Americredit Automobile Receivables | | | | | | | | | | |
| Trust, Ser. 2008-AF, Cl. A2B | | 2.05 | | 1/12/12 | | 1,454,041 | | a | | 1,449,610 |
| Americredit Automobile Receivables | | | | | | | | | | |
| Trust, Ser. 2008-AF, Cl. A2A | | 4.47 | | 1/12/12 | | 57,904 | | | | 58,226 |
| Americredit Automobile Receivables | | | | | | | | | | |
| Trust, Ser. 2006-BG, Cl. A3 | | 5.21 | | 10/6/11 | | 994,504 | | | | 993,446 |
| Americredit Automobile Receivables | | | | | | | | | | |
| Trust, Ser. 2006-RM, Cl. A2 | | 5.42 | | 8/8/11 | | 1,703,034 | | | | 1,733,368 |
| Americredit Automobile Receivables | | | | | | | | | | |
| Trust, Ser. 2007-CM, Cl. A3A | | 5.42 | | 5/7/12 | | 3,290,929 | | | | 3,344,555 |
| Americredit Automobile Receivables | | | | | | | | | | |
| Trust, Ser. 2006-AF, Cl. A3 | | 5.56 | | 9/6/11 | | 362,994 | | | | 363,093 |
| Americredit Prime Automobile | | | | | | | | | | |
| Receivables, Ser. 2007-1, Cl. B | | 5.35 | | 9/9/13 | | 70,000 | | | | 65,953 |
| Americredit Prime Automobile | | | | | | | | | | |
| Receivables, Ser. 2007-1, Cl. C | | 5.43 | | 2/10/14 | | 70,000 | | | | 58,596 |
| Americredit Prime Automobile | | | | | | | | | | |
| Receivables, Ser. 2007-1, Cl. E | | 6.96 | | 3/8/16 | | 6,504,306 | | b | | 3,916,603 |
| Capital Auto Receivables Asset | | | | | | | | | | |
| Trust, Ser. 2005-1, Cl. C | | 4.73 | | 9/15/10 | | 367,768 | | | | 368,573 |
The Fund 9
| STATEMENT OF INVESTMENTS (continued) |
| | | Coupon | | Maturity | | Principal | | | | |
| Bonds and Notes (continued) | | Rate (%) | | Date | | Amount ($) | | | | Value ($) |
| |
| |
| |
| |
| |
|
| Asset-Backed Ctfs./ | | | | | | | | | | |
| Auto Receivables (continued) | | | | | | | | | | |
| Capital Auto Receivables Asset | | | | | | | | | | |
| Trust, Ser. 2007-3, Cl. A3A | | 5.02 | | 9/15/11 | | 1,872,603 | | | | 1,905,972 |
| Capital Auto Receivables Asset | | | | | | | | | | |
| Trust, Ser. 2005-1, Cl. D | | 6.50 | | 5/15/12 | | 2,400,000 | | b | | 2,402,722 |
| Capital Auto Receivables Asset | | | | | | | | | | |
| Trust, Ser. 2007-1, Cl. D | | 6.57 | | 9/16/13 | | 1,708,000 | | b | | 1,220,502 |
| Capital Auto Receivables Asset | | | | | | | | | | |
| Trust, Ser. 2006-1, Cl. D | | 7.16 | | 1/15/13 | | 1,050,000 | | b | | 1,025,275 |
| Capital One Auto Finance Trust, | | | | | | | | | | |
| Ser. 2007-A, Cl. A3B | | 0.29 | | 8/15/11 | | 1,031,272 | | a | | 1,026,216 |
| Capital One Auto Finance Trust, | | | | | | | | | | |
| Ser. 2007-B, Cl. A3B | | 0.29 | | 4/15/12 | | 2,548,297 | | a | | 2,522,243 |
| Capital One Auto Finance Trust, | | | | | | | | | | |
| Ser. 2006-C, Cl. A3A | | 5.07 | | 7/15/11 | | 770,354 | | | | 770,438 |
| Capital One Auto Finance Trust, | | | | | | | | | | |
| Ser. 2007-C, Cl. A3A | | 5.13 | | 4/16/12 | | 1,114,100 | | | | 1,122,801 |
| Ford Credit Auto Owner Trust, | | | | | | | | | | |
| Ser. 2006-C, Cl. C | | 5.47 | | 9/15/12 | | 340,000 | | | | 328,500 |
| Ford Credit Auto Owner Trust, | | | | | | | | | | |
| Ser. 2007-A, Cl. D | | 7.05 | | 12/15/13 | | 3,825,000 | | b | | 2,364,130 |
| Ford Credit Auto Owner Trust, | | | | | | | | | | |
| Ser. 2006-B, Cl. D | | 7.12 | | 2/15/13 | | 1,600,000 | | b | | 1,148,957 |
| Household Automotive Trust, | | | | | | | | | | |
| Ser. 2005-3, Cl. A4 | | 4.94 | | 11/19/12 | | 1,335,587 | | | | 1,370,864 |
| Household Automotive Trust, | | | | | | | | | | |
| Ser. 2006-1, Cl. A3 | | 5.43 | | 6/17/11 | | 1,928,437 | | | | 1,958,003 |
| Hyundai Auto Receivables Trust, | | | | | | | | | | |
| Ser. 2007-A, Cl. A3A | | 5.04 | | 1/17/12 | | 337,747 | | | | 344,930 |
| Hyundai Auto Receivables Trust, | | | | | | | | | | |
| Ser. 2006-B, Cl. C | | 5.25 | | 5/15/13 | | 515,287 | | | | 513,899 |
| JP Morgan Auto Receivables Trust, | | | | | | | | | | |
| Ser. 2007-A, Cl. A3 | | 5.19 | | 2/15/11 | | 2,092,796 | | b | | 2,109,045 |
| Wachovia Auto Loan Owner Trust, | | | | | | | | | | |
| Ser. 2007-1, Cl. C | | 5.45 | | 10/22/12 | | 285,000 | | | | 239,183 |
| Wachovia Auto Loan Owner Trust, | | | | | | | | | | |
| Ser. 2007-1, Cl. D | | 5.65 | | 2/20/13 | | 1,160,000 | | | | 908,208 |
| WFS Financial Owner Trust, | | | | | | | | | | |
| Ser. 2005-3, Cl. B | | 4.50 | | 5/17/13 | | 485,000 | | | | 486,653 |
10
| | | Coupon | | Maturity | | Principal | | | | |
| Bonds and Notes (continued) | | Rate (%) | | Date | | Amount ($) | | | | Value ($) |
| |
| |
| |
| |
| |
|
| Asset-Backed Ctfs./ | | | | | | | | | | |
| Auto Receivables (continued) | | | | | | | | | | |
| WFS Financial Owner Trust, | | | | | | | | | | |
| Ser. 2005-3, Cl. C | | 4.54 | | 5/17/13 | | 50,000 | | | | 50,214 |
| | | | | | | | | | | 36,714,803 |
| Asset-Backed Ctfs./Credit Cards—1.2% | | | | | | | | | | |
| Advanta Business Card Master | | | | | | | | | | |
| Trust, Ser. 2007-A1, Cl. A | | 0.34 | | 1/20/15 | | 757,968 | | a | | 697,613 |
| Advanta Business Card Master | | | | | | | | | | |
| Trust, Ser. 2005-A2, Cl. A2 | | 0.42 | | 5/20/13 | | 2,095,945 | | a | | 1,929,050 |
| Advanta Business Card Master | | | | | | | | | | |
| Trust, Ser. 2006-A3, Cl. A3 | | 5.30 | | 5/21/12 | | 1,693,893 | | | | 1,592,903 |
| Capital One Multi-Asset Execution | | | | | | | | | | |
| Trust, Ser. 2004-C4, Cl. C4 | | 0.94 | | 6/15/12 | | 3,800,000 | | | | 3,794,715 |
| Citibank Credit Card Issuance | | | | | | | | | | |
| Trust, Ser. 2006-C4, Cl. C4 | | 0.52 | | 1/9/12 | | 2,500,000 | | a | | 2,458,321 |
| Washington Mutual Master Note | | | | | | | | | | |
| Trust, Ser. 2007-B1, Cl. B1 | | 4.95 | | 3/17/14 | | 3,945,000 | | b | | 3,938,535 |
| | | | | | | | | | | 14,411,137 |
| Asset-Backed Ctfs./ | | | | | | | | | | |
| Home Equity Loans—1.1% | | | | | | | | | | |
| Ameriquest Mortgage Securities, | | | | | | | | | | |
| Ser. 2003-11, Cl. AF6 | | 5.14 | | 1/25/34 | | 861,288 | | a | | 768,375 |
| Bayview Financial Acquisition | | | | | | | | | | |
| Trust, Ser. 2005-B, Cl. 1A6 | | 5.21 | | 4/28/39 | | 3,902,040 | | a | | 2,848,899 |
| Citicorp Residential Mortgage | | | | | | | | | | |
| Securities, Ser. 2006-2, Cl. A2 | | 5.56 | | 9/25/36 | | 167,277 | | a | | 166,011 |
| Citigroup Mortgage Loan Trust, | | | | | | | | | | |
| Ser. 2005-HE1, Cl. M1 | | 0.72 | | 5/25/35 | | 1,689,686 | | a | | 1,645,109 |
| Citigroup Mortgage Loan Trust, | | | | | | | | | | |
| Ser. 2005-WF1, Cl. A5 | | 5.01 | | 2/25/35 | | 3,895,198 | | a | | 2,816,715 |
| Citigroup Mortgage Loan Trust, | | | | | | | | | | |
| Ser. 2005-WF2, Cl. AF7 | | 5.25 | | 8/25/35 | | 1,561,249 | | a | | 1,026,991 |
| CS First Boston Mortgage | | | | | | | | | | |
| Securities, Ser. 2005-FIX1, Cl. A5 | | 4.90 | | 5/25/35 | | 270,794 | | a | | 187,964 |
| GSAA Home Equity Trust, | | | | | | | | | | |
| Ser. 2006-7, Cl. AV1 | | 0.37 | | 3/25/46 | | 38,424 | | a | | 37,531 |
| JP Morgan Mortgage Acquisition, | | | | | | | | | | |
| Ser. 2005-FRE1, Cl. A2F2 | | 5.22 | | 10/25/35 | | 155 | | a | | 154 |
The Fund 11
| STATEMENT OF INVESTMENTS (continued) |
| | | Coupon | | Maturity | | Principal | | | | |
| Bonds and Notes (continued) | | Rate (%) | | Date | | Amount ($) | | | | Value ($) |
| |
| |
| |
| |
| |
|
| Asset-Backed Ctfs./ | | | | | | | | | | |
| Home Equity Loans (continued) | | | | | | | | | | |
| JP Morgan Mortgage Acquisition, | | | | | | | | | | |
| Ser. 2007-CH1, Cl. AF1B | | 5.94 | | 11/25/36 | | 44,863 | | a | | 43,429 |
| Mastr Asset Backed Securities | | | | | | | | | | |
| Trust, Ser. 2006-AM1, Cl. A2 | | 0.42 | | 1/25/36 | | 1,040,327 | | a | | 983,890 |
| Residential Asset Mortgage | | | | | | | | | | |
| Products, Ser. 2005-RS2, Cl. M2 | | 0.77 | | 2/25/35 | | 3,690,000 | | a | | 711,618 |
| Residential Asset Mortgage | | | | | | | | | | |
| Products, Ser. 2005-RS2, Cl. M3 | | 0.84 | | 2/25/35 | | 1,090,000 | | a | | 25,337 |
| Residential Asset Mortgage | | | | | | | | | | |
| Products, Ser. 2003-RS9, | | | | | | | | | | |
| Cl. MI1 | | 5.80 | | 10/25/33 | | 48,812 | | a | | 22,995 |
| Residential Asset Securities, | | | | | | | | | | |
| Ser. 2005-EMX4, Cl. A2 | | 0.55 | | 11/25/35 | | 2,815,574 | | a | | 2,443,805 |
| | | | | | | | | | | 13,728,823 |
| Asset-Backed Ctfs./ | | | | | | | | | | |
| Manufactured Housing—.4% | | | | | | | | | | |
| Green Tree Financial, | | | | | | | | | | |
| Ser. 1994-7, Cl. M1 | | 9.25 | | 3/15/20 | | 1,410,691 | | | | 1,352,459 |
| Origen Manufactured Housing, | | | | | | | | | | |
| Ser. 2004-B, Cl. A2 | | 3.79 | | 12/15/17 | | 1,960 | | | | 1,951 |
| Origen Manufactured Housing, | | | | | | | | | | |
| Ser. 2005-B, Cl. A2 | | 5.25 | | 12/15/18 | | 1,652,579 | | | | 1,615,071 |
| Origen Manufactured Housing, | | | | | | | | | | |
| Ser. 2005-B, Cl. M2 | | 6.48 | | 1/15/37 | | 1,745,000 | | | | 1,247,038 |
| Vanderbilt Mortgage Finance, | | | | | | | | | | |
| Ser. 1999-A, Cl. 1A6 | | 6.75 | | 3/7/29 | | 80,000 | | a | | 68,414 |
| | | | | | | | | | | 4,284,933 |
| Automobiles—.3% | | | | | | | | | | |
| Goodyear Tire & Rubber, | | | | | | | | | | |
| Gtd. Notes | | 8.63 | | 12/1/11 | | 3,004,000 | | c | | 3,056,570 |
| Banks—6.7% | | | | | | | | | | |
| BAC Capital Trust XIV, | | | | | | | | | | |
| Bank Gtd. Notes | | 5.63 | | 12/31/49 | | 6,605,000 | | a | | 3,899,004 |
| Barclays Bank, | | | | | | | | | | |
| Jr. Sub. Bonds | | 5.93 | | 9/29/49 | | 1,230,000 | | a,b | | 788,245 |
| Barclays Bank, | | | | | | | | | | |
| Sr. Unscd. Notes | | 6.75 | | 5/22/19 | | 2,200,000 | | | | 2,392,819 |
12
| | | Coupon | | Maturity | | Principal | | | | |
| Bonds and Notes (continued) | | Rate (%) | | Date | | Amount ($) | | | | Value ($) |
| |
| |
| |
| |
| |
|
| Banks (continued) | | | | | | | | | | |
| Barclays Bank, | | | | | | | | | | |
| Sub. Notes | | 10.18 | | 6/12/21 | | 1,508,000 | | b | | 1,774,204 |
| Capital One Financial, | | | | | | | | | | |
| Sr. Unscd. Notes | | 0.93 | | 9/10/09 | | 8,415,000 | | a | | 8,406,391 |
| Citigroup, | | | | | | | | | | |
| Sr. Unscd. Notes | | 5.50 | | 4/11/13 | | 9,785,000 | | | | 9,677,903 |
| Goldman Sachs Group, | | | | | | | | | | |
| Sub. Notes | | 5.63 | | 1/15/17 | | 330,000 | | | | 330,941 |
| Goldman Sachs Group, | | | | | | | | | | |
| Sr. Unscd. Notes | | 6.15 | | 4/1/18 | | 90,000 | | | | 96,333 |
| Goldman Sachs Group, | | | | | | | | | | |
| Sub. Notes | | 6.75 | | 10/1/37 | | 9,390,000 | | | | 9,501,713 |
| JPMorgan Chase & Co., | | | | | | | | | | |
| Sr. Unscd. Notes | | 6.00 | | 1/15/18 | | 4,790,000 | | | | 5,080,949 |
| JPMorgan Chase & Co., | | | | | | | | | | |
| Sr. Unscd. Notes | | 6.40 | | 5/15/38 | | 3,890,000 | | | | 4,246,176 |
| M & I Marshall & Ilsley Bank, | | | | | | | | | | |
| Sub. Notes, Ser. BN | | 0.92 | | 12/4/12 | | 1,235,000 | | a | | 836,188 |
| M&T Bank, | | | | | | | | | | |
| Sr. Unscd. Bonds | | 5.38 | | 5/24/12 | | 245,000 | | c | | 242,788 |
| Manufacturers & Traders Trust, | | | | | | | | | | |
| Sub. Notes | | 5.59 | | 12/28/20 | | 475,000 | | a | | 369,512 |
| Morgan Stanley, | | | | | | | | | | |
| Sr. Unscd. Notes | | 5.30 | | 3/1/13 | | 1,680,000 | | | | 1,727,344 |
| Morgan Stanley, | | | | | | | | | | |
| Sr. Unscd. Notes | | 5.55 | | 4/27/17 | | 115,000 | | | | 115,248 |
| Morgan Stanley, | | | | | | | | | | |
| Sr. Unscd. Notes | | 5.75 | | 8/31/12 | | 1,365,000 | | | | 1,439,018 |
| Morgan Stanley, | | | | | | | | | | |
| Sr. Unscd. Notes | | 6.60 | | 4/1/12 | | 2,100,000 | | | | 2,236,149 |
| NB Capital Trust IV, | | | | | | | | | | |
| Bank Gtd. Cap. Secs. | | 8.25 | | 4/15/27 | | 1,290,000 | | | | 1,135,200 |
| Northern Trust, | | | | | | | | | | |
| Sr. Unscd. Notes | | 5.30 | | 8/29/11 | | 65,000 | | | | 69,470 |
| PNC Funding, | | | | | | | | | | |
| Gtd. Notes | | 0.63 | | 1/31/12 | | 85,000 | | a | | 80,181 |
| PNC Funding, | | | | | | | | | | |
| Gtd. Notes | | 6.70 | | 6/10/19 | | 3,100,000 | | | | 3,349,380 |
The Fund 13
| STATEMENT OF INVESTMENTS (continued) |
| | | Coupon | | Maturity | | Principal | | | | |
| Bonds and Notes (continued) | | Rate (%) | | Date | | Amount ($) | | | | Value ($) |
| |
| |
| |
| |
| |
|
| Banks (continued) | | | | | | | | | | |
| Sovereign Bancorp, | | | | | | | | | | |
| Sr. Unscd. Notes | | 0.84 | | 3/23/10 | | 4,790,000 | | a | | 4,768,349 |
| Sovereign Bancorp, | | | | | | | | | | |
| Sr. Unscd. Notes | | 4.80 | | 9/1/10 | | 1,070,000 | | a | | 1,047,593 |
| SunTrust Preferred Capital I, | | | | | | | | | | |
| Bank Gtd. Notes | | 5.85 | | 12/31/49 | | 995,000 | | a | | 577,373 |
| USB Capital IX, | | | | | | | | | | |
| Gtd. Notes | | 6.19 | | 10/29/49 | | 12,790,000 | | a | | 9,148,099 |
| Wells Fargo & Co., | | | | | | | | | | |
| Sub. Notes | | 6.38 | | 8/1/11 | | 540,000 | | | | 566,435 |
| Wells Fargo Capital XIII, | | | | | | | | | | |
| Gtd. Secs. | | 7.70 | | 12/29/49 | | 9,510,000 | | a | | 8,279,967 |
| | | | | | | | | | | 82,182,972 |
| Building & Construction—.3% | | | | | | | | | | |
| Masco, | | | | | | | | | | |
| Sr. Unscd. Notes | | 0.94 | | 3/12/10 | | 3,605,000 | | a | | 3,518,776 |
| Chemicals—.3% | | | | | | | | | | |
| Dow Chemical, | | | | | | | | | | |
| Sr. Unscd. Notes | | 8.55 | | 5/15/19 | | 2,885,000 | | | | 3,170,448 |
| Praxair, | | | | | | | | | | |
| Sr. Unscd. Notes | | 5.25 | | 11/15/14 | | 110,000 | | | | 120,654 |
| Praxair, | | | | | | | | | | |
| Sr. Unscd. Notes | | 5.38 | | 11/1/16 | | 45,000 | | | | 46,613 |
| | | | | | | | | | | 3,337,715 |
| Commercial & Professional | | | | | | | | | | |
| Services—.8% | | | | | | | | | | |
| Aramark, | | | | | | | | | | |
| Gtd. Notes | | 8.50 | | 2/1/15 | | 2,978,000 | | c | | 3,015,225 |
| Ceridian, | | | | | | | | | | |
| Sr. Unscd. Notes | | 11.25 | | 11/15/15 | | 900,000 | | a | | 771,750 |
| ERAC USA Finance, | | | | | | | | | | |
| Sr. Unscd. Bonds | | 5.60 | | 5/1/15 | | 550,000 | | b | | 508,610 |
| ERAC USA Finance, | | | | | | | | | | |
| Gtd. Notes | | 6.38 | | 10/15/17 | | 3,900,000 | | b | | 3,650,006 |
| ERAC USA Finance, | | | | | | | | | | |
| Gtd. Notes | | 7.00 | | 10/15/37 | | 220,000 | | b | | 185,030 |
| ERAC USA Finance, | | | | | | | | | | |
| Sr. Unscd. Notes | | 7.95 | | 12/15/09 | | 2,315,000 | | b | | 2,335,712 |
| | | | | | | | | | | 10,466,333 |
14
| | | Coupon | | Maturity | | Principal | | | | |
| Bonds and Notes (continued) | | Rate (%) | | Date | | Amount ($) | | | | Value ($) |
| |
| |
| |
| |
| |
|
| Commercial Mortgage | | | | | | | | | | |
| Pass-Through Ctfs.—10.6% | | | | | | | | | | |
| Banc of America Commercial | | | | | | | | | | |
| Mortgage, Ser. 2002-2, Cl. A3 | | 5.12 | | 7/11/43 | | 365,000 | | | | 367,937 |
| Bayview Commercial Asset Trust, | | | | | | | | | | |
| Ser. 2006-SP1, Cl. A1 | | 0.56 | | 4/25/36 | | 215,497 | | a,b | | 128,910 |
| Bayview Commercial Asset Trust, | | | | | | | | | | |
| Ser. 2006-SP2, Cl. A | | 0.57 | | 1/25/37 | | 3,271,681 | | a,b | | 1,757,351 |
| Bayview Commercial Asset Trust, | | | | | | | | | | |
| Ser. 2004-1, Cl. A | | 0.65 | | 4/25/34 | | 642,847 | | a,b | | 452,112 |
| Bayview Commercial Asset Trust, | | | | | | | | | | |
| Ser. 2005-3A, Cl. A2 | | 0.69 | | 11/25/35 | | 2,777,593 | | a,b | | 1,430,460 |
| Bayview Commercial Asset Trust, | | | | | | | | | | |
| Ser. 2006-1A, Cl. M6 | | 0.93 | | 4/25/36 | | 655,882 | | a,b | | 147,206 |
| Bayview Commercial Asset Trust, | | | | | | | | | | |
| Ser. 2005-4A, Cl. M5 | | 0.94 | | 1/25/36 | | 1,026,699 | | a,b | | 364,766 |
| Bayview Commercial Asset Trust, | | | | | | | | | | |
| Ser. 2005-3A, Cl. B1 | | 1.39 | | 11/25/35 | | 55,013 | | a,b | | 12,695 |
| Bayview Commercial Asset Trust, | | | | | | | | | | |
| Ser. 2004-1, Cl. M2 | | 1.49 | | 4/25/34 | | 311,482 | | a,b | | 150,535 |
| Bayview Commercial Asset Trust, | | | | | | | | | | |
| Ser. 2006-2A, Cl. B2 | | 1.76 | | 7/25/36 | | 522,961 | | a,b | | 109,252 |
| Bayview Commercial Asset Trust, | | | | | | | | | | |
| Ser. 2006-1A, Cl. B2 | | 1.99 | | 4/25/36 | | 136,138 | | a,b | | 27,739 |
| Bayview Commercial Asset Trust, | | | | | | | | | | |
| Ser. 2006-2A, Cl. B3 | | 2.99 | | 7/25/36 | | 441,248 | | a,b | | 108,812 |
| Bayview Commercial Asset Trust, | | | | | | | | | | |
| Ser. 2006-1A, Cl. B3 | | 3.24 | | 4/25/36 | | 659,512 | | a,b | | 159,833 |
| Bayview Commercial Asset Trust, | | | | | | | | | | |
| Ser. 2005-3A, Cl. B3 | | 3.29 | | 11/25/35 | | 852,697 | | a,b | | 226,553 |
| Bayview Commercial Asset Trust, | | | | | | | | | | |
| Ser. 2005-4A, Cl. B3 | | 3.79 | | 1/25/36 | | 134,698 | | a,b | | 30,123 |
| Bear Stearns Commercial Mortgage | | | | | | | | | | |
| Securities, Ser. 2003-T12, Cl. A3 | | 4.24 | | 8/13/39 | | 282,959 | | a | | 283,510 |
| Bear Stearns Commercial Mortgage | | | | | | | | | | |
| Securities, Ser. 2004-PWR5, | | | | | | | | | | |
| Cl. A2 | | 4.25 | | 7/11/42 | | 2,120,087 | | | | 2,120,076 |
| Bear Stearns Commercial Mortgage | | | | | | | | | | |
| Securities, Ser. 2005-T18, | | | | | | | | | | |
| Cl. A2 | | 4.56 | | 2/13/42 | | 3,475,000 | | a | | 3,481,883 |
The Fund 15
| STATEMENT OF INVESTMENTS (continued) |
| | | Coupon | | Maturity | | Principal | | | | |
| Bonds and Notes (continued) | | Rate (%) | | Date | | Amount ($) | | | | Value ($) |
| |
| |
| |
| |
| |
|
| Commercial Mortgage | | | | | | | | | | |
| Pass-Through Ctfs. (continued) | | | | | | | | | | |
| Bear Stearns Commercial Mortgage | | | | | | | | | | |
| Securities, Ser. 2004-PWR5, | | | | | | | | | | |
| Cl. A3 | | 4.57 | | 7/11/42 | | 110,000 | | | | 109,547 |
| Bear Stearns Commercial Mortgage | | | | | | | | | | |
| Securities, Ser. 2005-PW10, | | | | | | | | | | |
| Cl. A4 | | 5.41 | | 12/11/40 | | 1,905,000 | | a | | 1,888,459 |
| Bear Stearns Commercial Mortgage | | | | | | | | | | |
| Securities, Ser. 2007-T26, Cl. A4 | | 5.47 | | 1/12/45 | | 5,055,000 | | a | | 4,610,209 |
| Bear Stearns Commercial Mortgage | | | | | | | | | | |
| Securities, Ser. 2006-PW13, | | | | | | | | | | |
| Cl. A3 | | 5.52 | | 9/11/41 | | 35,000 | | | | 32,106 |
| Bear Stearns Commercial Mortgage | | | | | | | | | | |
| Securities, Ser. 2006-PW12, | | | | | | | | | | |
| Cl. AAB | | 5.69 | | 9/11/38 | | 715,000 | | a | | 728,784 |
| Bear Stearns Commercial Mortgage | | | | | | | | | | |
| Securities, Ser. 2007-T28, | | | | | | | | | | |
| Cl. A4 | | 5.74 | | 9/11/42 | | 6,845,000 | | a | | 6,123,663 |
| Citigroup Commercial Mortgage | | | | | | | | | | |
| Trust, Ser. 2007-C6, Cl. AM | | 5.70 | | 12/10/49 | | 3,040,000 | | a | | 1,785,721 |
| Citigroup Commercial Mortgage | | | | | | | | | | |
| Trust, Ser. 2007-C6, Cl. A4 | | 5.70 | | 12/10/49 | | 2,542,000 | | a | | 2,175,197 |
| Credit Suisse/Morgan Stanley | | | | | | | | | | |
| Commercial Mortgage | | | | | | | | | | |
| Certificates, Ser. 2006-HC1A, | | | | | | | | | | |
| Cl. A1 | | 0.48 | | 5/15/23 | | 5,408,923 | | a,b | | 4,516,924 |
| Crown Castle Towers, | | | | | | | | | | |
| Ser. 2005-1A, Cl. AFX | | 4.64 | | 6/15/35 | | 1,850,000 | | b | | 1,831,500 |
| Crown Castle Towers, | | | | | | | | | | |
| Ser. 2006-1A, Cl. AFX | | 5.24 | | 11/15/36 | | 5,760,000 | | b | | 5,644,800 |
| Crown Castle Towers, | | | | | | | | | | |
| Ser. 2006-1A, Cl. B | | 5.36 | | 11/15/36 | | 4,670,000 | | b | | 4,576,600 |
| Crown Castle Towers, | | | | | | | | | | |
| Ser. 2006-1A, Cl. C | | 5.47 | | 11/15/36 | | 925,000 | | b | | 906,500 |
| Crown Castle Towers, | | | | | | | | | | |
| Ser. 2005-1A, Cl. D | | 5.61 | | 6/15/35 | | 4,730,000 | | b | | 4,682,700 |
| Crown Castle Towers, | | | | | | | | | | |
| Ser. 2006-1A, Cl. D | | 5.77 | | 11/15/36 | | 2,475,000 | | b | | 2,425,500 |
| CS First Boston Mortgage | | | | | | | | | | |
| Securities, Ser. 2005-C4, Cl. A2 | | 5.02 | | 8/15/38 | | 50,000 | | | | 50,373 |
16
| | | Coupon | | Maturity | | Principal | | | | |
| Bonds and Notes (continued) | | Rate (%) | | Date | | Amount ($) | | | | Value ($) |
| |
| |
| |
| |
| |
|
| Commercial Mortgage | | | | | | | | | | |
| Pass-Through Ctfs. (continued) | | | | | | | | | | |
| CS First Boston Mortgage | | | | | | | | | | |
| Securities, Ser. 2005-C4, | | | | | | | | | | |
| Cl. AAB | | 5.07 | | 8/15/38 | | 3,345,000 | | a | | 3,401,638 |
| CS First Boston Mortgage | | | | | | | | | | |
| Securities, Ser. 2005-C5, | | | | | | | | | | |
| Cl. A4 | | 5.10 | | 8/15/38 | | 6,230,000 | | a | | 6,022,478 |
| CS First Boston Mortgage | | | | | | | | | | |
| Securities, Ser. 2001-CF2, | | | | | | | | | | |
| Cl. G | | 6.93 | | 2/15/34 | | 130,000 | | b | | 94,619 |
| First Union National Bank | | | | | | | | | | |
| Commercial Mortgage, | | | | | | | | | | |
| Ser. 2001-C2, Cl. A2 | | 6.66 | | 1/12/43 | | 2,376,838 | | | | 2,470,845 |
| GMAC Commercial Mortgage | | | | | | | | | | |
| Securities, Ser. 2003-C3, | | | | | | | | | | |
| Cl. A2 | | 4.22 | | 4/10/40 | | 1,044,059 | | | | 1,053,746 |
| Goldman Sachs Mortgage Securities | | | | | | | | | | |
| Corporation II, Ser. 2007-EOP, | | | | | | | | | | |
| Cl. B | | 0.55 | | 3/6/20 | | 1,630,000 | | a,b | | 1,200,258 |
| Goldman Sachs Mortgage Securities | | | | | | | | | | |
| Corporation II, Ser. 2007-EOP, | | | | | | | | | | |
| Cl. E | | 0.74 | | 3/6/20 | | 610,000 | | a,b | | 440,638 |
| Goldman Sachs Mortgage Securities | | | | | | | | | | |
| Corporation II, Ser. 2007-EOP, | | | | | | | | | | |
| Cl. F | | 0.78 | | 3/6/20 | | 5,680,000 | | a,b | | 3,968,005 |
| Goldman Sachs Mortgage Securities | | | | | | | | | | |
| Corporation II, Ser. 2007-EOP, | | | | | | | | | | |
| Cl. G | | 0.82 | | 3/6/20 | | 3,110,000 | | a,b | | 2,143,243 |
| Goldman Sachs Mortgage Securities | | | | | | | | | | |
| Corporation II, Ser. 2007-EOP, | | | | | | | | | | |
| Cl. H | | 0.95 | | 3/6/20 | | 25,000 | | a,b | | 17,254 |
| Goldman Sachs Mortgage Securities | | | | | | | | | | |
| Corporation II, Ser. 2007-EOP, | | | | | | | | | | |
| Cl. K | | 1.35 | | 3/6/20 | | 2,380,000 | | a,b | | 1,606,517 |
| Goldman Sachs Mortgage Securities | | | | | | | | | | |
| Corporation II, Ser. 2007-EOP, | | | | | | | | | | |
| Cl. L | | 1.60 | | 3/6/20 | | 6,725,000 | | a,b | | 4,169,500 |
| Greenwich Capital Commercial | | | | | | | | | | |
| Funding, Ser. 2004-GG1, | | | | | | | | | | |
| Cl. A7 | | 5.32 | | 6/10/36 | | 650,000 | | a | | 651,958 |
The Fund 17
| STATEMENT OF INVESTMENTS (continued) |
| | | Coupon | | Maturity | | Principal | | | | |
| Bonds and Notes (continued) | | Rate (%) | | Date | | Amount ($) | | | | Value ($) |
| |
| |
| |
| |
| |
|
| Commercial Mortgage | | | | | | | | | | |
| Pass-Through Ctfs. (continued) | | | | | | | | | | |
| JP Morgan Chase Commercial | | | | | | | | | | |
| Mortgage Securities, | | | | | | | | | | |
| Ser. 2005-LDP5, Cl. A2 | | 5.20 | | 12/15/44 | | 1,250,000 | | | | 1,268,690 |
| LB Commercial Conduit Mortgage | | | | | | | | | | |
| Trust, Ser. 1999-C1, Cl. B | | 6.93 | | 6/15/31 | | 58,202 | | | | 58,139 |
| LB-UBS Commercial Mortgage Trust, | | | | | | | | | | |
| Ser. 2005-C3, Cl. A5 | | 4.74 | | 7/15/30 | | 2,280,000 | | | | 2,164,929 |
| LB-UBS Commercial Mortgage Trust, | | | | | | | | | | |
| Ser. 2006-C1, Cl. A4 | | 5.16 | | 2/15/31 | | 2,330,000 | | | | 2,112,417 |
| Merrill Lynch Mortgage Trust, | | | | | | | | | | |
| Ser. 2003-KEY1, Cl. A2 | | 4.44 | | 11/12/35 | | 2,412,814 | | | | 2,443,457 |
| Merrill Lynch Mortgage Trust, | | | | | | | | | | |
| Ser. 2005-CKI1, Cl. A2 | | 5.22 | | 11/12/37 | | 300,000 | | a | | 304,680 |
| Merrill Lynch Mortgage Trust, | | | | | | | | | | |
| Ser. 2005-CKI1, Cl. A6 | | 5.24 | | 11/12/37 | | 4,035,000 | | a | | 3,964,502 |
| Merrill Lynch Mortgage Trust, | | | | | | | | | | |
| Ser. 2005-LC1, Cl. A4 | | 5.29 | | 1/12/44 | | 1,665,000 | | a | | 1,623,103 |
| Merrill Lynch Mortgage Trust, | | | | | | | | | | |
| Ser. 2002-MW1, Cl. A3 | | 5.40 | | 7/12/34 | | 883,630 | | | | 898,117 |
| Merrill Lynch/Countrywide | | | | | | | | | | |
| Commercial Mortgage Trust, | | | | | | | | | | |
| Ser. 2006-2, Cl. A4 | | 5.91 | | 6/12/46 | | 4,885,000 | | a | | 4,698,999 |
| Morgan Stanley Capital I, | | | | | | | | | | |
| Ser. 2006-IQ12, Cl. AAB | | 5.33 | | 12/15/43 | | 100,000 | | | | 96,250 |
| Morgan Stanley Capital I, | | | | | | | | | | |
| Ser. 2007-HQ11, Cl. A4 | | 5.45 | | 2/12/44 | | 8,855,000 | | a | | 7,212,131 |
| Morgan Stanley Capital I, | | | | | | | | | | |
| Ser. 2007-HQ11, Cl. AM | | 5.48 | | 2/12/44 | | 5,440,000 | | a | | 3,090,450 |
| Morgan Stanley Capital I, | | | | | | | | | | |
| Ser. 2007-T27, Cl. A4 | | 5.65 | | 6/11/42 | | 4,280,000 | | a | | 3,720,437 |
| Morgan Stanley Dean Witter Capital | | | | | | | | | | |
| I, Ser. 2001-TOP3, Cl. A4 | | 6.39 | | 7/15/33 | | 60,682 | | | | 63,174 |
| Morgan Stanley Dean Witter Capital | | | | | | | | | | |
| I, Ser. 2001-PPM, Cl. A3 | | 6.54 | | 2/15/31 | | 40,729 | | | | 41,792 |
| SBA CMBS Trust, | | | | | | | | | | |
| Ser. 2006-1A, Cl. A | | 5.31 | | 11/15/36 | | 1,550,000 | | b | | 1,534,500 |
| SBA CMBS Trust, | | | | | | | | | | |
| Ser. 2005-1A, Cl. C | | 5.73 | | 11/15/35 | | 1,430,000 | | b | | 1,401,400 |
18
| | | Coupon | | Maturity | | Principal | | | | |
| Bonds and Notes (continued) | | Rate (%) | | Date | | Amount ($) | | | | Value ($) |
| |
| |
| |
| |
| |
|
| Commercial Mortgage | | | | | | | | | | |
| Pass-Through Ctfs. (continued) | | | | | | | | | | |
| SBA CMBS Trust, | | | | | | | | | | |
| Ser. 2006-1A, Cl. D | | 5.85 | | 11/15/36 | | 1,925,000 | | b | | 1,867,250 |
| TIAA Seasoned Commercial | | | | | | | | | | |
| Mortgage Trust, | | | | | | | | | | |
| Ser. 2007-C4, Cl. A3 | | 6.07 | | 8/15/39 | | 495,000 | | a | | 497,839 |
| Wachovia Bank Commercial Mortgage | | | | | | | | | | |
| Trust, Ser. 2005-C16, Cl. A2 | | 4.38 | | 10/15/41 | | 2,937,030 | | | | 2,935,157 |
| Wachovia Bank Commercial Mortgage | | | | | | | | | | |
| Trust, Ser. 2005-C19, Cl. A5 | | 4.66 | | 5/15/44 | | 2,095,000 | | | | 2,036,534 |
| Wachovia Bank Commercial Mortgage | | | | | | | | | | |
| Trust, Ser. 2007-C34, Cl. A3 | | 5.68 | | 5/15/46 | | 5,850,000 | | | | 4,781,651 |
| | | | | | | | | | | 129,504,633 |
| Diversified Financial Services—6.9% | | | | | | | | | | |
| American Express, | | | | | | | | | | |
| Sr. Unscd. Notes | | 7.25 | | 5/20/14 | | 5,255,000 | | | | 5,686,404 |
| Ameriprise Financial, | | | | | | | | | | |
| Jr. Sub. Notes | | 7.52 | | 6/1/66 | | 3,441,000 | | a | | 2,652,839 |
| Amvescap, | | | | | | | | | | |
| Gtd. Notes | | 5.38 | | 2/27/13 | | 380,000 | | | | 362,047 |
| Amvescap, | | | | | | | | | | |
| Gtd. Notes | | 5.38 | | 12/15/14 | | 25,000 | | | | 23,115 |
| Amvescap, | | | | | | | | | | |
| Gtd. Notes | | 5.63 | | 4/17/12 | | 6,510,000 | | | | 6,514,557 |
| Boeing Capital, | | | | | | | | | | |
| Sr. Unscd. Notes | | 7.38 | | 9/27/10 | | 1,065,000 | | | | 1,125,093 |
| BSKYB Finance UK, | | | | | | | | | | |
| Gtd. Notes | | 6.50 | | 10/15/35 | | 2,905,000 | | b | | 2,784,001 |
| Capital One Bank USA, | | | | | | | | | | |
| Sub. Notes | | 8.80 | | 7/15/19 | | 2,940,000 | | | | 3,194,381 |
| Capmark Financial Group, | | | | | | | | | | |
| Gtd. Notes | | 7.88 | | 5/10/12 | | 4,415,000 | | a | | 1,070,222 |
| Caterpillar Financial Services, | | | | | | | | | | |
| Sr. Unscd. Notes | | 7.15 | | 2/15/19 | | 3,555,000 | | | | 4,008,614 |
| Countrywide Home Loans, | | | | | | | | | | |
| Gtd. Notes, Ser. L | | 4.00 | | 3/22/11 | | 1,820,000 | | | | 1,828,195 |
| Credit Suisse Guernsey, | | | | | | | | | | |
| Jr. Sub. Notes | | 5.86 | | 12/31/49 | | 2,930,000 | | a | | 1,965,863 |
The Fund 19
| STATEMENT OF INVESTMENTS (continued) |
| | | Coupon | | Maturity | | Principal | | | | |
| Bonds and Notes (continued) | | Rate (%) | | Date | | Amount ($) | | | | Value ($) |
| |
| |
| |
| |
| |
|
| Diversified Financial | | | | | | | | | | |
| Services (continued) | | | | | | | | | | |
| Credit Suisse USA, | | | | | | | | | | |
| Gtd. Notes | | 5.50 | | 8/16/11 | | 1,215,000 | | | | 1,296,763 |
| Discover Financial Services, | | | | | | | | | | |
| Sr. Notes | | 10.25 | | 7/15/19 | | 2,980,000 | | | | 3,142,461 |
| Fresenius US Finance II, | | | | | | | | | | |
| Gtd. Notes | | 9.00 | | 7/15/15 | | 3,000,000 | | b | | 3,255,000 |
| General Electric Capital, | | | | | | | | | | |
| Sr. Unscd. Notes | | 5.25 | | 10/19/12 | | 1,390,000 | | c | | 1,452,460 |
| General Electric Capital, | | | | | | | | | | |
| Sr. Unscd. Notes | | 5.63 | | 5/1/18 | | 6,415,000 | | | | 6,486,053 |
| Genworth Global Funding, | | | | | | | | | | |
| Scd. Notes | | 5.20 | | 10/8/10 | | 65,000 | | c | | 63,387 |
| Goldman Sachs Capital II, | | | | | | | | | | |
| Gtd. Bonds | | 5.79 | | 12/29/49 | | 1,275,000 | | a | | 911,625 |
| HSBC Finance, | | | | | | | | | | |
| Sr. Unscd. Notes | | 0.98 | | 9/14/12 | | 7,535,000 | | a | | 6,809,153 |
| Hutchison Whampoa International, | | | | | | | | | | |
| Gtd. Notes | | 7.63 | | 4/9/19 | | 1,390,000 | | b | | 1,595,589 |
| International Lease Finance, | | | | | | | | | | |
| Sr. Unscd. Notes | | 0.88 | | 5/24/10 | | 125,000 | | a | | 108,859 |
| International Lease Finance, | | | | | | | | | | |
| Sr. Unscd. Notes | | 6.38 | | 3/25/13 | | 3,065,000 | | | | 2,134,083 |
| Jefferies Group, | | | | | | | | | | |
| Sr. Unscd. Notes | | 5.88 | | 6/8/14 | | 100,000 | | | | 94,677 |
| Jefferies Group, | | | | | | | | | | |
| Sr. Unscd. Debs. | | 6.25 | | 1/15/36 | | 850,000 | | | | 606,149 |
| Jefferies Group, | | | | | | | | | | |
| Sr. Unscd. Notes | | 7.75 | | 3/15/12 | | 668,000 | | | | 686,749 |
| John Deere Capital, | | | | | | | | | | |
| Sr. Unscd. Notes | | 0.71 | | 9/1/09 | | 1,389,000 | | a | | 1,389,006 |
| Leucadia National, | | | | | | | | | | |
| Sr. Unscd. Notes | | 7.00 | | 8/15/13 | | 1,745,000 | | | | 1,679,563 |
| Leucadia National, | | | | | | | | | | |
| Sr. Unscd. Notes | | 7.13 | | 3/15/17 | | 7,720,000 | | | | 6,870,800 |
| MBNA Capital, | | | | | | | | | | |
| Bank Gtd. Cap. Secs., | | | | | | | | | | |
| Ser. A | | 8.28 | | 12/1/26 | | 2,285,000 | | | | 2,010,800 |
20
| | | Coupon | | Maturity | | Principal | | | | |
| Bonds and Notes (continued) | | Rate (%) | | Date | | Amount ($) | | | | Value ($) |
| |
| |
| |
| |
| |
|
| Diversified Financial | | | | | | | | | | |
| Services (continued) | | | | | | | | | | |
| MBNA, | | | | | | | | | | |
| Sr. Unscd. Notes | | 6.13 | | 3/1/13 | | 1,345,000 | | | | 1,367,981 |
| Merrill Lynch & Co., | | | | | | | | | | |
| Sr. Unscd. Notes, Ser. C | | 1.24 | | 2/5/10 | | 1,722,000 | | a | | 1,712,977 |
| Merrill Lynch & Co., | | | | | | | | | | |
| Sr. Unscd. Notes, Ser. C | | 4.25 | | 2/8/10 | | 1,450,000 | | | | 1,470,096 |
| Merrill Lynch & Co., | | | | | | | | | | |
| Sub. Notes | | 5.70 | | 5/2/17 | | 1,025,000 | | | | 905,643 |
| Merrill Lynch & Co., | | | | | | | | | | |
| Sr. Unscd. Notes | | 6.40 | | 8/28/17 | | 50,000 | | | | 49,181 |
| NIPSCO Capital Markets, | | | | | | | | | | |
| Sr. Unscd. Notes | | 7.86 | | 3/27/17 | | 105,000 | | | | 93,600 |
| Pearson Dollar Finance Two, | | | | | | | | | | |
| Gtd. Notes | | 6.25 | | 5/6/18 | | 2,515,000 | | b | | 2,518,725 |
| SLM, | | | | | | | | | | |
| Sr. Unscd. Notes, Ser. A | | 4.50 | | 7/26/10 | | 3,055,000 | | | | 2,781,975 |
| SMFG Preferred Capital, | | | | | | | | | | |
| Sub. Bonds | | 6.08 | | 1/29/49 | | 173,000 | | a,b | | 152,245 |
| Windsor Financing, | | | | | | | | | | |
| Sr. Scd. Notes | | 5.88 | | 7/15/17 | | 1,278,458 | | b | | 1,122,127 |
| | | | | | | | | | | 83,983,058 |
| Electric Utilities—4.8% | | | | | | | | | | |
| AES, | | | | | | | | | | |
| Sr. Unscd. Notes | | 7.75 | | 10/15/15 | | 3,515,000 | | c | | 3,418,338 |
| AES, | | | | | | | | | | |
| Sr. Unscd. Notes | | 8.00 | | 10/15/17 | | 1,485,000 | | | | 1,462,725 |
| Cleveland Electric Illuminating, | | | | | | | | | | |
| Sr. Unscd. Notes | | 5.70 | | 4/1/17 | | 910,000 | | | | 922,533 |
| Commonwealth Edison, | | | | | | | | | | |
| First Mortgage Bonds | | 6.15 | | 9/15/17 | | 60,000 | | | | 65,910 |
| Consolidated Edison of NY, | | | | | | | | | | |
| Sr. Unscd. Debs., Ser. 06-D | | 5.30 | | 12/1/16 | | 675,000 | | | | 709,356 |
| Consolidated Edison of NY, | | | | | | | | | | |
| Sr. Unscd. Debs., Ser. 08-A | | 5.85 | | 4/1/18 | | 2,320,000 | | | | 2,511,894 |
| Consumers Energy, | | | | | | | | | | |
| First Mortgage Bonds, Ser. O | | 5.00 | | 2/15/12 | | 1,160,000 | | c | | 1,188,369 |
The Fund 21
| STATEMENT OF INVESTMENTS (continued) |
| | | Coupon | | Maturity | | Principal | | | | |
| Bonds and Notes (continued) | | Rate (%) | | Date | | Amount ($) | | | | Value ($) |
| |
| |
| |
| |
| |
|
| Electric Utilities (continued) | | | | | | | | | | |
| Consumers Energy, | | | | | | | | | | |
| First Mortgage Bonds | | 6.70 | | 9/15/19 | | 1,585,000 | | | | 1,797,251 |
| Duke Energy Carolinas, | | | | | | | | | | |
| Sr. Unscd. Notes | | 5.63 | | 11/30/12 | | 50,000 | | | | 54,325 |
| Enel Finance International, | | | | | | | | | | |
| Gtd. Notes | | 5.70 | | 1/15/13 | | 275,000 | | b | | 293,692 |
| Enel Finance International, | | | | | | | | | | |
| Gtd. Bonds | | 6.25 | | 9/15/17 | | 8,965,000 | | b | | 9,781,532 |
| Energy Future Holdings, | | | | | | | | | | |
| Gtd. Notes | | 10.88 | | 11/1/17 | | 6,745,000 | | a,c | | 5,885,013 |
| FirstEnergy, | | | | | | | | | | |
| Sr. Unscd. Notes, Ser. B | | 6.45 | | 11/15/11 | | 7,390,000 | | | | 7,887,236 |
| FPL Group Capital, | | | | | | | | | | |
| Gtd. Debs. | | 5.63 | | 9/1/11 | | 1,570,000 | | | | 1,680,497 |
| IPALCO Enterprises, | | | | | | | | | | |
| Sr. Scd. Notes | | 8.63 | | 11/14/11 | | 140,000 | | a | | 144,550 |
| National Grid, | | | | | | | | | | |
| Sr. Unscd. Notes | | 6.30 | | 8/1/16 | | 3,577,000 | | | | 3,778,063 |
| Nevada Power, | | | | | | | | | | |
| Mortgage Notes | | 6.50 | | 8/1/18 | | 2,620,000 | | | | 2,827,735 |
| Nevada Power, | | | | | | | | | | |
| Mortgage Notes, Ser. R | | 6.75 | | 7/1/37 | | 395,000 | | | | 429,583 |
| NiSource Finance, | | | | | | | | | | |
| Gtd. Notes | | 1.23 | | 11/23/09 | | 4,410,000 | | a | | 4,382,486 |
| NiSource Finance, | | | | | | | | | | |
| Gtd. Notes | | 5.25 | | 9/15/17 | | 650,000 | | | | 583,424 |
| NiSource Finance, | | | | | | | | | | |
| Gtd. Notes | | 6.40 | | 3/15/18 | | 1,530,000 | | | | 1,459,850 |
| NiSource Finance, | | | | | | | | | | |
| Gtd. Notes | | 7.88 | | 11/15/10 | | 720,000 | | | | 753,353 |
| NRG Energy, | | | | | | | | | | |
| Gtd. Notes | | 7.38 | | 1/15/17 | | 3,135,000 | | | | 3,033,113 |
| Pepco Holdings, | | | | | | | | | | |
| Sr. Unscd. Notes | | 1.29 | | 6/1/10 | | 2,540,000 | | a | | 2,516,629 |
| Sierra Pacific Power, | | | | | | | | | | |
| Mortgage Notes, Ser. P | | 6.75 | | 7/1/37 | | 200,000 | | c | | 217,510 |
| Southern, | | | | | | | | | | |
| Sr. Unscd. Notes, Ser. A | | 5.30 | | 1/15/12 | | 475,000 | | | | 506,073 |
| | | | | | | | | | | 58,291,040 |
22
| | | Coupon | | Maturity | | Principal | | | | |
| Bonds and Notes (continued) | | Rate (%) | | Date | | Amount ($) | | | | Value ($) |
| |
| |
| |
| |
| |
|
| Environmental Control—.8% | | | | | | | | | | |
| Allied Waste North America, | | | | | | | | | | |
| Sr. Unscd. Notes, | | | | | | | | | | |
| Ser. B | | 7.13 | | 5/15/16 | | 1,025,000 | | | | 1,059,728 |
| Allied Waste North America, | | | | | | | | | | |
| Sr. Unscd. Notes | | 7.25 | | 3/15/15 | | 1,490,000 | | | | 1,543,917 |
| USA Waste Services, | | | | | | | | | | |
| Sr. Unscd. Notes | | 7.00 | | 7/15/28 | | 2,395,000 | | | | 2,533,687 |
| Veolia Environnement, | | | | | | | | | | |
| Sr. Unscd. Notes | | 5.25 | | 6/3/13 | | 3,820,000 | | | | 3,977,254 |
| Waste Management, | | | | | | | | | | |
| Gtd. Notes | | 7.38 | | 3/11/19 | | 925,000 | | | | 1,052,568 |
| | | | | | | | | | | 10,167,154 |
| Food & Beverages—2.7% | | | | | | | | | | |
| Anheuser-Busch InBev Worldwide, | | | | | | | | | | |
| Gtd. Notes | | 8.20 | | 1/15/39 | | 5,655,000 | | b | | 7,135,428 |
| Delhaize Group, | | | | | | | | | | |
| Sr. Unscd. Notes | | 6.50 | | 6/15/17 | | 75,000 | | | | 79,332 |
| Diageo Capital, | | | | | | | | | | |
| Gtd. Notes | | 7.38 | | 1/15/14 | | 4,010,000 | | | | 4,610,862 |
| Kraft Foods, | | | | | | | | | | |
| Sr. Unscd. Notes | | 6.00 | | 2/11/13 | | 165,000 | | | | 178,749 |
| Kraft Foods, | | | | | | | | | | |
| Sr. Unscd. Notes | | 6.88 | | 2/1/38 | | 5,410,000 | | | | 6,195,164 |
| Kroger, | | | | | | | | | | |
| Gtd. Notes | | 5.00 | | 4/15/13 | | 105,000 | | | | 109,003 |
| Kroger, | | | | | | | | | | |
| Gtd. Notes | | 6.15 | | 1/15/20 | | 3,230,000 | | | | 3,454,614 |
| Kroger, | | | | | | | | | | |
| Gtd. Notes | | 6.40 | | 8/15/17 | | 55,000 | | c | | 60,134 |
| Safeway, | | | | | | | | | | |
| Sr. Unscd. Notes | | 4.95 | | 8/16/10 | | 135,000 | | | | 138,452 |
| Safeway, | | | | | | | | | | |
| Sr. Unscd. Notes | | 6.35 | | 8/15/17 | | 2,645,000 | | | | 2,901,427 |
| Stater Brothers Holdings, | | | | | | | | | | |
| Gtd. Notes | | 7.75 | | 4/15/15 | | 2,318,000 | | c | | 2,248,460 |
| Stater Brothers Holdings, | | | | | | | | | | |
| Gtd. Notes | | 8.13 | | 6/15/12 | | 2,617,000 | | | | 2,656,255 |
| SUPERVALU, | | | | | | | | | | |
| Sr. Unscd. Bonds | | 7.50 | | 5/15/12 | | 1,150,000 | | c | | 1,164,375 |
The Fund 23
| STATEMENT OF INVESTMENTS (continued) |
| | | Coupon | | Maturity | | Principal | | | | |
| Bonds and Notes (continued) | | Rate (%) | | Date | | Amount ($) | | | | Value ($) |
| |
| |
| |
| |
| |
|
| Food & Beverages (continued) | | | | | | | | | | |
| SUPERVALU, | | | | | | | | | | |
| Sr. Unscd. Bonds | | 7.50 | | 11/15/14 | | 315,000 | | | | 306,338 |
| SUPERVALU, | | | | | | | | | | |
| Sr. Unscd. Notes | | 8.00 | | 5/1/16 | | 1,415,000 | | | | 1,411,463 |
| | | | | | | | | | | 32,650,056 |
| Foreign/Governmental—1.1% | | | | | | | | | | |
| Federal Republic of Brazil, | | | | | | | | | | |
| Sr. Unscd. Bonds | | 6.00 | | 1/17/17 | | 4,540,000 | | | | 4,737,490 |
| Province of Quebec Canada, | | | | | | | | | | |
| Unscd. Notes | | 4.60 | | 5/26/15 | | 2,795,000 | | c | | 2,942,582 |
| Republic of Italy, | | | | | | | | | | |
| Sr. Unscd. Notes | | 5.38 | | 6/12/17 | | 2,850,000 | | | | 2,979,498 |
| United Mexican States, | | | | | | | | | | |
| Sr. Unscd. Notes | | 5.63 | | 1/15/17 | | 2,910,000 | | | | 2,982,750 |
| | | | | | | | | | | 13,642,320 |
| Health Care—1.8% | | | | | | | | | | |
| American Home Products, | | | | | | | | | | |
| Sr. Unscd. Notes | | 6.95 | | 3/15/11 | | 580,000 | | a | | 627,159 |
| Bausch & Lomb, | | | | | | | | | | |
| Sr. Unscd. Notes | | 9.88 | | 11/1/15 | | 2,450,000 | | c | | 2,456,125 |
| Community Health Systems, | | | | | | | | | | |
| Gtd. Notes | | 8.88 | | 7/15/15 | | 2,995,000 | | | | 3,099,825 |
| Davita, | | | | | | | | | | |
| Gtd. Notes | | 6.63 | | 3/15/13 | | 3,050,000 | | | | 3,011,875 |
| HCA, | | | | | | | | | | |
| Sr. Unscd. Notes | | 6.30 | | 10/1/12 | | 2,370,000 | | | | 2,239,650 |
| HCA, | | | | | | | | | | |
| Sr. Unscd. Notes | | 6.75 | | 7/15/13 | | 2,765,000 | | | | 2,599,100 |
| HCA, | | | | | | | | | | |
| Sr. Unscd. Notes | | 7.88 | | 2/1/11 | | 545,000 | | | | 547,725 |
| HCA, | | | | | | | | | | |
| Sr. Unscd. Notes | | 8.75 | | 9/1/10 | | 1,149,000 | | c | | 1,166,235 |
| LVB Acquisition, | | | | | | | | | | |
| Gtd. Notes | | 11.63 | | 10/15/17 | | 3,810,000 | | c | | 4,152,900 |
| Pfizer, | | | | | | | | | | |
| Sr. Unscd. Notes | | 6.20 | | 3/15/19 | | 775,000 | | | | 878,463 |
| UnitedHealth Group, | | | | | | | | | | |
| Sr. Unscd. Notes | | 5.25 | | 3/15/11 | | 150,000 | | | | 155,181 |
24
| | | Coupon | | Maturity | | Principal | | | | |
| Bonds and Notes (continued) | | Rate (%) | | Date | | Amount ($) | | | | Value ($) |
| |
| |
| |
| |
| |
|
| Health Care (continued) | | | | | | | | | | |
| Wellpoint, | | | | | | | | | | |
| Sr. Unscd. Notes | | 5.88 | | 6/15/17 | | 440,000 | | | | 440,897 |
| Wellpoint, | | | | | | | | | | |
| Sr. Unscd. Notes | | 7.00 | | 2/15/19 | | 1,055,000 | | | | 1,128,715 |
| | | | | | | | | | | 22,503,850 |
| Machinery—.1% | | | | | | | | | | |
| Terex, | | | | | | | | | | |
| Gtd. Notes | | 7.38 | | 1/15/14 | | 1,250,000 | | | | 1,196,875 |
| Manufacturing—.3% | | | | | | | | | | |
| Bombardier, | | | | | | | | | | |
| Sr. Unscd. Notes | | 8.00 | | 11/15/14 | | 3,600,000 | | b,c | | 3,492,000 |
| Siemens Financieringsmaatschappij, | | | | | | | | | | |
| Gtd. Notes | | 5.75 | | 10/17/16 | | 100,000 | | b | | 107,125 |
| | | | | | | | | | | 3,599,125 |
| Media—4.8% | | | | | | | | | | |
| Cablevision Systems, | | | | | | | | | | |
| Sr. Unscd. Notes, Ser. B | | 8.00 | | 4/15/12 | | 440,000 | | a | | 449,900 |
| Comcast, | | | | | | | | | | |
| Gtd. Notes | | 5.50 | | 3/15/11 | | 906,000 | | | | 952,989 |
| Comcast, | | | | | | | | | | |
| Gtd. Notes | | 6.30 | | 11/15/17 | | 3,890,000 | | | | 4,291,098 |
| Cox Communications, | | | | | | | | | | |
| Notes | | 6.25 | | 6/1/18 | | 3,535,000 | | b | | 3,749,719 |
| CSC Holdings, | | | | | | | | | | |
| Sr. Unscd. Notes | | 8.50 | | 4/15/14 | | 690,000 | | b,c | | 714,150 |
| CSC Holdings, | | | | | | | | | | |
| Sr. Unscd. Notes | | 8.63 | | 2/15/19 | | 1,825,000 | | b | | 1,888,875 |
| DirecTV Holdings/Financing, | | | | | | | | | | |
| Gtd. Notes | | 7.63 | | 5/15/16 | | 2,980,000 | | c | | 3,032,150 |
| Echostar DBS, | | | | | | | | | | |
| Gtd. Notes | | 7.75 | | 5/31/15 | | 3,500,000 | | | | 3,526,250 |
| News America Holdings, | | | | | | | | | | |
| Gtd. Debs | | 7.70 | | 10/30/25 | | 775,000 | | | | 793,488 |
| News America, | | | | | | | | | | |
| Gtd. Notes | | 6.15 | | 3/1/37 | | 6,990,000 | | | | 6,854,003 |
| News America, | | | | | | | | | | |
| Gtd. Notes | | 6.65 | | 11/15/37 | | 3,220,000 | | | | 3,347,908 |
The Fund 25
| STATEMENT OF INVESTMENTS (continued) |
| | | Coupon | | Maturity | | Principal | | | | |
| Bonds and Notes (continued) | | Rate (%) | | Date | | Amount ($) | | | | Value ($) |
| |
| |
| |
| |
| |
|
| Media (continued) | | | | | | | | | | |
| News America, | | | | | | | | | | |
| Gtd. Debs. | | 7.63 | | 11/30/28 | | 90,000 | | | | 93,577 |
| Reed Elsevier Capital, | | | | | | | | | | |
| Gtd. Notes | | 4.63 | | 6/15/12 | | 6,130,000 | | | | 6,179,941 |
| Time Warner Cable, | | | | | | | | | | |
| Gtd. Notes | | 5.85 | | 5/1/17 | | 3,740,000 | | | | 3,935,243 |
| Time Warner Cable, | | | | | | | | | | |
| Gtd. Notes | | 6.75 | | 7/1/18 | | 5,430,000 | | c | | 6,045,643 |
| Time Warner, | | | | | | | | | | |
| Gtd. Notes | | 1.15 | | 11/13/09 | | 290,000 | | a | | 289,236 |
| Time Warner, | | | | | | | | | | |
| Gtd. Notes | | 5.88 | | 11/15/16 | | 11,335,000 | | | | 11,914,559 |
| Time Warner, | | | | | | | | | | |
| Gtd. Notes | | 6.75 | | 4/15/11 | | 900,000 | | | | 959,868 |
| | | | | | | | | | | 59,018,597 |
| Mining—.9% | | | | | | | | | | |
| BHP Billiton Finance USA, | | | | | | | | | | |
| Gtd. Notes | | 6.50 | | 4/1/19 | | 1,430,000 | | | | 1,630,406 |
| Freeport-McMoRan Cooper & Gold, | | | | | | | | | | |
| Sr. Unscd. Notes | | 8.38 | | 4/1/17 | | 2,885,000 | | | | 3,062,436 |
| Rio Tinto Finance USA, | | | | | | | | | | |
| Gtd. Notes | | 5.88 | | 7/15/13 | | 3,340,000 | | | | 3,540,824 |
| Teck Resources, | | | | | | | | | | |
| Sr. Scd. Notes | | 10.25 | | 5/15/16 | | 335,000 | | b | | 381,063 |
| Teck Resources, | | | | | | | | | | |
| Sr. Scd. Notes | | 10.75 | | 5/15/19 | | 2,410,000 | | b | | 2,816,688 |
| | | | | | | | | | | 11,431,417 |
| Office And Business Equipment—.3% | | | | | | | | | | |
| Xerox, | | | | | | | | | | |
| Sr. Unscd. Notes | | 5.50 | | 5/15/12 | | 792,000 | | | | 834,116 |
| Xerox, | | | | | | | | | | |
| Sr. Unscd. Notes | | 5.65 | | 5/15/13 | | 1,075,000 | | | | 1,071,861 |
| Xerox, | | | | | | | | | | |
| Sr. Unscd. Notes | | 8.25 | | 5/15/14 | | 1,145,000 | | | | 1,248,794 |
| | | | | | | | | | | 3,154,771 |
| Oil & Gas—2.5% | | | | | | | | | | |
| Amerada Hess, | | | | | | | | | | |
| Sr. Unscd. Notes | | 6.65 | | 8/15/11 | | 890,000 | | | | 956,275 |
| Anadarko Petroleum, | | | | | | | | | | |
| Sr. Unscd. Notes | | 8.70 | | 3/15/19 | | 2,815,000 | | | | 3,346,669 |
26
| | | Coupon | | Maturity | | Principal | | | | |
| Bonds and Notes (continued) | | Rate (%) | | Date | | Amount ($) | | | | Value ($) |
| |
| |
| |
| |
| |
|
| Oil & Gas (continued) | | | | | | | | | | |
| Chesapeake Energy, | | | | | | | | | | |
| Gtd. Notes | | 7.50 | | 6/15/14 | | 165,000 | | | | 163,763 |
| Chesapeake Energy, | | | | | | | | | | |
| Gtd. Notes | | 9.50 | | 2/15/15 | | 6,230,000 | | | | 6,642,738 |
| Husky Energy, | | | | | | | | | | |
| Sr. Unscd. Notes | | 7.25 | | 12/15/19 | | 2,850,000 | | | | 3,272,265 |
| Marathon Oil, | | | | | | | | | | |
| Sr. Unscd. Notes | | 7.50 | | 2/15/19 | | 1,480,000 | | | | 1,712,083 |
| Newfield Exploration, | | | | | | | | | | |
| Sr. Sub. Notes | | 7.13 | | 5/15/18 | | 795,000 | | | | 777,113 |
| Petro-Canada, | | | | | | | | | | |
| Sr. Unscd. Notes | | 6.80 | | 5/15/38 | | 4,060,000 | | | | 4,248,149 |
| Range Resouces, | | | | | | | | | | |
| Gtd. Notes | | 8.00 | | 5/15/19 | | 4,345,000 | | c | | 4,442,763 |
| Sempra Energy, | | | | | | | | | | |
| Sr. Unscd. Notes | | 6.50 | | 6/1/16 | | 2,720,000 | | | | 2,990,069 |
| Valero Energy, | | | | | | | | | | |
| Sr. Unscd. Notes | | 9.38 | | 3/15/19 | | 1,395,000 | | | | 1,621,431 |
| | | | | | | | | | | 30,173,318 |
| Packaging & Containers—.5% | | | | | | | | | | |
| Crown Americas, | | | | | | | | | | |
| Gtd. Notes | | 7.63 | | 11/15/13 | | 575,000 | | | | 589,375 |
| Crown Americas, | | | | | | | | | | |
| Gtd. Notes | | 7.75 | | 11/15/15 | | 2,340,000 | | | | 2,386,800 |
| Owens-Brockway Glass Container, | | | | | | | | | | |
| Gtd. Notes | | 6.75 | | 12/1/14 | | 2,500,000 | | | | 2,443,750 |
| Owens-Brockway Glass Container, | | | | | | | | | | |
| Gtd. Notes | | 7.38 | | 5/15/16 | | 960,000 | | b | | 955,200 |
| | | | | | | | | | | 6,375,125 |
| Paper & Paper Related—.3% | | | | | | | | | | |
| Georgia-Pacific, | | | | | | | | | | |
| Gtd. Notes | | 7.00 | | 1/15/15 | | 1,310,000 | | b | | 1,277,250 |
| Georgia-Pacific, | | | | | | | | | | |
| Gtd. Notes | | 8.25 | | 5/1/16 | | 2,035,000 | | b | | 2,116,400 |
| | | | | | | | | | | 3,393,650 |
| Pipelines—1.0% | | | | | | | | | | |
| ANR Pipeline, | | | | | | | | | | |
| Sr. Unscd. Notes | | 7.00 | | 6/1/25 | | 50,000 | | | | 48,630 |
| El Paso Natural Gas, | | | | | | | | | | |
| Sr. Unscd. Notes | | 5.95 | | 4/15/17 | | 20,000 | | | | 20,530 |
The Fund 27
| STATEMENT OF INVESTMENTS (continued) |
| | | Coupon | | Maturity | | Principal | | | | |
| Bonds and Notes (continued) | | Rate (%) | | Date | | Amount ($) | | | | Value ($) |
| |
| |
| |
| |
| |
|
| Pipelines (continued) | | | | | | | | | | |
| El Paso, | | | | | | | | | | |
| Sr. Unscd. Notes | | 8.25 | | 2/15/16 | | 3,160,000 | | | | 3,239,000 |
| Kinder Morgan Energy Partners, | | | | | | | | | | |
| Sr. Unscd. Notes | | 6.85 | | 2/15/20 | | 4,340,000 | | | | 4,812,726 |
| Trans-Canada Pipelines, | | | | | | | | | | |
| Sr. Unscd. Notes | | 7.63 | | 1/15/39 | | 3,125,000 | | | | 3,982,259 |
| | | | | | | | | | | 12,103,145 |
| Property & Casualty Insurance—2.3% | | | | | | | | | | |
| Ace INA Holdings, | | | | | | | | | | |
| Gtd. Notes | | 5.70 | | 2/15/17 | | 85,000 | | c | | 88,523 |
| Ace INA Holdings, | | | | | | | | | | |
| Gtd. Notes | | 5.80 | | 3/15/18 | | 2,300,000 | | | | 2,417,102 |
| Allmerica Financial, | | | | | | | | | | |
| Sr. Unscd. Notes | | 7.63 | | 10/15/25 | | 1,745,000 | | | | 1,468,946 |
| HUB International Holdings, | | | | | | | | | | |
| Sr. Sub. Notes | | 10.25 | | 6/15/15 | | 3,025,000 | | b | | 2,412,438 |
| Jackson National Life Global | | | | | | | | | | |
| Funding, Sr. Scd. Notes | | 5.38 | | 5/8/13 | | 240,000 | | b,c | | 237,171 |
| Lincoln National, | | | | | | | | | | |
| Sr. Unscd. Notes | | 0.72 | | 3/12/10 | | 1,035,000 | | a | | 1,013,417 |
| Lincoln National, | | | | | | | | | | |
| Jr. Sub. Cap. Secs. | | 6.05 | | 4/20/67 | | 6,660,000 | | a | | 4,129,200 |
| MetLife, | | | | | | | | | | |
| Sr. Unscd. Notes | | 7.72 | | 2/15/19 | | 2,740,000 | | | | 3,104,190 |
| Metropolitan Life Global Funding | | | | | | | | | | |
| I, Sr. Scd. Notes | | 5.13 | | 4/10/13 | | 3,100,000 | | b | | 3,163,259 |
| Nippon Life Insurance, | | | | | | | | | | |
| Sub. Notes | | 4.88 | | 8/9/10 | | 4,100,000 | | b | | 4,096,855 |
| Prudential Financial, | | | | | | | | | | |
| Sr. Notes | | 6.20 | | 1/15/15 | | 3,500,000 | | | | 3,600,975 |
| Prudential Financial, | | | | | | | | | | |
| Sr. Unscd. Notes | | 6.63 | | 12/1/37 | | 885,000 | | | | 787,399 |
| Willis North America, | | | | | | | | | | |
| Gtd. Notes | | 6.20 | | 3/28/17 | | 1,500,000 | | | | 1,337,214 |
| | | | | | | | | | | 27,856,689 |
| Real Estate—3.6% | | | | | | | | | | |
| Arden Realty, | | | | | | | | | | |
| Sr. Unscd. Notes | | 5.25 | | 3/1/15 | | 700,000 | | | | 704,398 |
| Boston Properties, | | | | | | | | | | |
| Sr. Unscd. Notes | | 5.00 | | 6/1/15 | | 810,000 | | | | 712,457 |
28
| | | Coupon | | Maturity | | Principal | | | | |
| Bonds and Notes (continued) | | Rate (%) | | Date | | Amount ($) | | | | Value ($) |
| |
| |
| |
| |
| |
|
| Real Estate (continued) | | | | | | | | | | |
| Boston Properties, | | | | | | | | | | |
| Sr. Unscd. Notes | | 5.63 | | 4/15/15 | | 2,015,000 | | | | 1,837,958 |
| Boston Properties, | | | | | | | | | | |
| Sr. Unscd. Notes | | 6.25 | | 1/15/13 | | 140,000 | | | | 139,952 |
| Commercial Net Lease Realty, | | | | | | | | | | |
| Sr. Unscd. Notes | | 6.15 | | 12/15/15 | | 3,180,000 | | | | 2,832,191 |
| Duke Realty, | | | | | | | | | | |
| Sr. Unscd. Notes | | 5.25 | | 1/15/10 | | 80,000 | | | | 79,766 |
| Duke Realty, | | | | | | | | | | |
| Sr. Unscd. Notes | | 5.88 | | 8/15/12 | | 790,000 | | | | 723,973 |
| Federal Realty Investment Trust, | | | | | | | | | | |
| Sr. Unscd. Notes | | 5.40 | | 12/1/13 | | 1,525,000 | | | | 1,413,640 |
| Federal Realty Investment Trust, | | | | | | | | | | |
| Sr. Unscd. Bonds | | 5.65 | | 6/1/16 | | 550,000 | | | | 499,800 |
| Federal Realty Investment Trust, | | | | | | | | | | |
| Sr. Unscd. Notes | | 6.00 | | 7/15/12 | | 1,625,000 | | c | | 1,573,358 |
| Federal Realty Investment Trust, | | | | | | | | | | |
| Sr. Unscd. Notes | | 6.20 | | 1/15/17 | | 145,000 | | | | 130,735 |
| Healthcare Realty Trust, | | | | | | | | | | |
| Sr. Unscd. Notes | | 5.13 | | 4/1/14 | | 7,695,000 | | | | 6,813,946 |
| Healthcare Realty Trust, | | | | | | | | | | |
| Sr. Unscd. Notes | | 8.13 | | 5/1/11 | | 225,000 | | | | 232,040 |
| HRPT Properties Trust, | | | | | | | | | | |
| Sr. Unscd. Notes | | 1.22 | | 3/16/11 | | 3,725,000 | | a | | 3,268,717 |
| Liberty Property, | | | | | | | | | | |
| Sr. Unscd. Notes | | 5.50 | | 12/15/16 | | 190,000 | | | | 156,263 |
| Liberty Property, | | | | | | | | | | |
| Sr. Unscd. Notes | | 6.63 | | 10/1/17 | | 1,100,000 | | | | 956,668 |
| Mack-Cali Realty, | | | | | | | | | | |
| Sr. Unscd. Notes | | 5.05 | | 4/15/10 | | 4,735,000 | | | | 4,727,045 |
| Mack-Cali Realty, | | | | | | | | | | |
| Sr. Unscd. Notes | | 5.13 | | 1/15/15 | | 145,000 | | | | 122,530 |
| Mack-Cali Realty, | | | | | | | | | | |
| Sr. Unscd. Notes | | 5.25 | | 1/15/12 | | 2,145,000 | | | | 1,955,783 |
| Mack-Cali Realty, | | | | | | | | | | |
| Sr. Unscd. Notes | | 5.80 | | 1/15/16 | | 690,000 | | c | | 602,891 |
| Prologis, | | | | | | | | | | |
| Sr. Unscd. Notes | | 6.63 | | 5/15/18 | | 2,830,000 | | | | 2,407,713 |
| Regency Centers, | | | | | | | | | | |
| Gtd. Notes | | 5.25 | | 8/1/15 | | 1,777,000 | | | | 1,525,547 |
The Fund 29
| STATEMENT OF INVESTMENTS (continued) |
| | | Coupon | | Maturity | | Principal | | | | |
| Bonds and Notes (continued) | | Rate (%) | | Date | | Amount ($) | | | | Value ($) |
| |
| |
| |
| |
| |
|
| Real Estate (continued) | | | | | | | | | | |
| Regency Centers, | | | | | | | | | | |
| Gtd. Notes | | 5.88 | | 6/15/17 | | 210,000 | | | | 179,118 |
| Simon Property Group, | | | | | | | | | | |
| Sr. Unscd. Notes | | 4.60 | | 6/15/10 | | 1,203,000 | | | | 1,226,030 |
| Simon Property Group, | | | | | | | | | | |
| Sr. Unscd. Notes | | 4.88 | | 8/15/10 | | 2,105,000 | | | | 2,156,966 |
| Simon Property Group, | | | | | | | | | | |
| Sr. Unscd. Notes | | 5.00 | | 3/1/12 | | 1,000,000 | | | | 1,012,814 |
| Simon Property Group, | | | | | | | | | | |
| Sr. Unscd. Notes | | 5.75 | | 5/1/12 | | 260,000 | | | | 265,338 |
| WEA Finance, | | | | | | | | | | |
| Sr. Notes | | 7.13 | | 4/15/18 | | 4,015,000 | | b | | 3,900,564 |
| WEA Finance, | | | | | | | | | | |
| Gtd. Notes | | 7.50 | | 6/2/14 | | 2,400,000 | | b | | 2,449,646 |
| | | | | | | | | | | 44,607,847 |
| Residential Mortgage | | | | | | | | | | |
| Pass-Through Ctfs.—.5% | | | | | | | | | | |
| ChaseFlex Trust, | | | | | | | | | | |
| Ser. 2006-2, Cl. A1A | | 5.59 | | 9/25/36 | | 54,689 | | a | | 53,839 |
| Impac CMB Trust, | | | | | | | | | | |
| Ser. 2005-8, Cl. 2M2 | | 1.04 | | 2/25/36 | | 2,660,835 | | a | | 1,021,494 |
| Impac CMB Trust, | | | | | | | | | | |
| Ser. 2005-8, Cl. 2M3 | | 1.79 | | 2/25/36 | | 2,151,936 | | a | | 856,686 |
| Impac Secured Assets CMN Owner | | | | | | | | | | |
| Trust, Ser. 2006-1, Cl. 2A1 | | 0.64 | | 5/25/36 | | 1,951,936 | | a | | 1,354,636 |
| JP Morgan Mortgage Trust, | | | | | | | | | | |
| Ser. 2005-A1, Cl. 5A1 | | 4.48 | | 2/25/35 | | 1,461,745 | | a | | 1,326,373 |
| Prudential Home Mortgage | | | | | | | | | | |
| Securities, Ser. 1994-A, Cl. 5B | | 6.73 | | 4/28/24 | | 2,338 | | a,b | | 1,815 |
| Residential Funding Mortgage | | | | | | | | | | |
| Securities I, Ser. 2004-S3, | | | | | | | | | | |
| Cl. M1 | | 4.75 | | 3/25/19 | | 946,595 | | | | 757,947 |
| Structured Asset Mortgage | | | | | | | | | | |
| Investments, Ser. 1998-2, Cl. B | | 5.43 | | 4/30/30 | | 1,320 | | a | | 932 |
| Terwin Mortgage Trust, | | | | | | | | | | |
| Ser. 2006-9HGA, Cl. A1 | | 0.37 | | 10/25/37 | | 180,628 | | a,b | | 163,870 |
| | | | | | | | | | | 5,537,592 |
| Retail—.4% | | | | | | | | | | |
| Home Depot, | | | | | | | | | | |
| Sr. Unscd. Notes | | 5.88 | | 12/16/36 | | 2,157,000 | | | | 1,999,660 |
30
| | | Coupon | | Maturity | | Principal | | |
| Bonds and Notes (continued) | | Rate (%) | | Date | | Amount ($) | | Value ($) |
| |
| |
| |
| |
|
| Retail (continued) | | | | | | | | |
| Staples, | | | | | | | | |
| Gtd. Notes | | 9.75 | | 1/15/14 | | 2,575,000 c | | 3,019,442 |
| | | | | | | | | 5,019,102 |
| State/Territory | | | | | | | | |
| General Obligations—2.1% | | | | | | | | |
| Buckeye Tobacco Settlement | | | | | | | | |
| Financing Authority, | | | | | | | | |
| Tobacco Settlement | | | | | | | | |
| Asset-Backed Bonds | | 5.13 | | 6/1/24 | | 400,000 | | 329,500 |
| California | | | | | | | | |
| GO (Various Purpose) | | 7.55 | | 4/1/39 | | 6,515,000 | | 6,742,895 |
| Erie Tobacco Asset Securitization | | | | | | | | |
| Corporation, Tobacco | | | | | | | | |
| Settlement Asset-Backed Bonds | | 6.00 | | 6/1/28 | | 540,000 | | 414,747 |
| Michigan Tobacco Settlement | | | | | | | | |
| Finance Authority, | | | | | | | | |
| Tobacco Settlement | | | | | | | | |
| Asset-Backed Bonds | | 7.31 | | 6/1/34 | | 12,585,000 | | 8,477,508 |
| New York Counties | | | | | | | | |
| Tobacco Trust IV, | | | | | | | | |
| Tobacco Settlement | | | | | | | | |
| Pass-Through Bonds | | 6.00 | | 6/1/27 | | 3,500,000 | | 2,706,235 |
| Tobacco Settlement Authority of | | | | | | | | |
| Iowa, Tobacco Settlement | | | | | | | | |
| Asset-Backed Bonds | | 6.50 | | 6/1/23 | | 8,255,000 | | 6,114,148 |
| Tobacco Settlement Finance | | | | | | | | |
| Authority of West Virginia, | | | | | | | | |
| Tobacco Settlement | | | | | | | | |
| Asset-Backed Bonds | | 7.47 | | 6/1/47 | | 425,000 | | 288,137 |
| Tobacco Settlement Financing | | | | | | | | |
| Corporation of New Jersey, | | | | | | | | |
| Tobacco Settlement | | | | | | | | |
| Asset-Backed Bonds | | 4.50 | | 6/1/23 | | 965,000 | | 827,970 |
| | | | | | | | | 25,901,140 |
| Steel—.3% | | | | | | | | |
| Arcelormittal, | | | | | | | | |
| Sr. Unscd. Notes | | 9.85 | | 6/1/19 | | 2,845,000 | | 3,297,719 |
| Technology—.0% | | | | | | | | |
| International Business Machines, | | | | | | | | |
| Unsub. Notes | | 5.70 | | 9/14/17 | | 135,000 | | 147,962 |
The Fund 31
| STATEMENT OF INVESTMENTS (continued) |
| | | Coupon | | Maturity | | Principal | | | | |
| Bonds and Notes (continued) | | Rate (%) | | Date | | Amount ($) | | | | Value ($) |
| |
| |
| |
| |
| |
|
| Telecommunications—3.8% | | | | | | | | | | |
| AT & T, | | | | | | | | | | |
| Sr. Unscd. Notes | | 5.60 | | 5/15/18 | | 9,035,000 | | | | 9,663,267 |
| CC Holdings GS V, | | | | | | | | | | |
| Sr. Scd. Notes | | 7.75 | | 5/1/17 | | 5,665,000 | | b | | 5,806,625 |
| Cisco Systems, | | | | | | | | | | |
| Notes | | 5.90 | | 2/15/39 | | 3,175,000 | | | | 3,385,944 |
| Intelsat Jackson Holdings, | | | | | | | | | | |
| Gtd. Notes | | 11.25 | | 6/15/16 | | 1,510,000 | | | | 1,615,700 |
| Intelsat Subsidiary Holding, | | | | | | | | | | |
| Gtd. Notes | | 8.88 | | 1/15/15 | | 1,055,000 | | b | | 1,070,825 |
| KPN, | | | | | | | | | | |
| Sr. Unscd. Notes | | 8.00 | | 10/1/10 | | 200,000 | | | | 211,135 |
| KPN, | | | | | | | | | | |
| Sr. Unscd. Bonds | | 8.38 | | 10/1/30 | | 10,000 | | | | 12,552 |
| Qwest, | | | | | | | | | | |
| Bank Note, Ser. B | | 6.95 | | 6/30/10 | | 464,000 | | a | | 465,740 |
| Qwest, | | | | | | | | | | |
| Bank Note, Ser. B | | 6.95 | | 6/30/10 | | 1,858,000 | | a | | 1,864,968 |
| Telecom Italia Capital, | | | | | | | | | | |
| Gtd. Notes | | 5.25 | | 11/15/13 | | 3,775,000 | | | | 3,900,998 |
| Telecom Italia Capital, | | | | | | | | | | |
| Gtd. Notes | | 5.25 | | 10/1/15 | | 595,000 | | | | 606,671 |
| Telecom Italia Capital, | | | | | | | | | | |
| Gtd. Notes | | 7.72 | | 6/4/38 | | 1,485,000 | | | | 1,678,694 |
| Telefonica Emisiones, | | | | | | | | | | |
| Gtd. Notes | | 5.98 | | 6/20/11 | | 3,835,000 | | | | 4,110,721 |
| Verizon Communications, | | | | | | | | | | |
| Sr. Unscd. Notes | | 6.35 | | 4/1/19 | | 40,000 | | | | 45,152 |
| Verizon Communications, | | | | | | | | | | |
| Sr. Unscd. Notes | | 7.35 | | 4/1/39 | | 2,285,000 | | | | 2,767,272 |
| Verizon Wireless Capital, | | | | | | | | | | |
| Sr. Unscd. Notes | | 5.55 | | 2/1/14 | | 5,830,000 | | b | | 6,346,719 |
| Wind Acquisition Finance, | | | | | | | | | | |
| Sr. Notes | | 11.75 | | 7/15/17 | | 2,355,000 | | b | | 2,531,625 |
| | | | | | | | | | | 46,084,608 |
| Textiles—.3% | | | | | | | | | | |
| Mohawk Industries, | | | | | | | | | | |
| Sr. Unscd. Notes | | 6.25 | | 1/15/11 | | 3,329,000 | | a | | 3,303,014 |
32
| | | Coupon | | Maturity | | Principal | | |
| Bonds and Notes (continued) | | Rate (%) | | Date | | Amount ($) | | Value ($) |
| |
| |
| |
| |
|
| Transportation—.1% | | | | | | | | |
| Norfolk Southern, | | | | | | | | |
| Sr. Unscd. Notes | | 5.75 | | 4/1/18 | | 830,000 | | 862,113 |
| Union Pacific, | | | | | | | | |
| Sr. Unscd. Notes | | 6.65 | | 1/15/11 | | 60,000 | | 62,939 |
| | | | | | | | | 925,052 |
| U.S. Government Agencies—.7% | | | | | | | | |
| Federal National Mortgage | | | | | | | | |
| Association, Notes | | 5.25 | | 9/15/16 | | 7,356,000 d | | 8,173,811 |
| Small Business Administration | | | | | | | | |
| Participation Ctfs., Gov’t | | | | | | | | |
| Gtd. Debs., Ser. 97-J | | 6.55 | | 10/1/17 | | 253,067 | | 273,027 |
| | | | | | | | | 8,446,838 |
| U.S. Government Agencies/ | | | | | | | | |
| Mortgage-Backed—39.6% | | | | | | | | |
| Federal Home Loan Mortgage Corp.: | | | | | | | | |
| 5.50% | | | | | | 5,600,000 d,e | | 5,859,874 |
| 3.50%, 9/1/10 | | | | | | 167,162 d | | 168,195 |
| 4.00%, 10/1/09 | | | | | | 61,161 d | | 61,317 |
| 4.50%, 10/1/09—2/1/39 | | | | | | 11,870,941 d | | 11,937,140 |
| 5.00%, 10/1/18—6/1/37 | | | | | | 23,301,488 d | | 23,937,176 |
| 5.50%, 11/1/22—1/1/38 | | | | | | 31,081,085 d | | 32,376,178 |
| 6.00%, 7/1/17—12/1/37 | | | | | | 21,619,354 d | | 22,710,906 |
| 6.50%, 3/1/14—3/1/32 | | | | | | 671,191 d | | 722,203 |
| 7.00%, 3/1/12 | | | | | | 5,271 d | | 5,527 |
| 7.50%, 12/1/25—1/1/31 | | | | | | 32,691 d | | 36,483 |
| 8.00%, 10/1/19—10/1/30 | | | | | | 15,689 d | | 17,564 |
| 8.50%, 7/1/30 | | | | | | 1,084 d | | 1,243 |
| Multiclass Mortgage Participation Ctfs., | | | | | | | | |
| Ser. 2586, Cl. WE, 4.00%, 12/15/32 | | | | | | 4,155,397 d | | 4,127,092 |
| Multiclass Mortgage Participation Ctfs., | | | | | | | | |
| Ser. 51, Cl. E, 10.00%, 7/15/20 | | | | | | 177,991 d | | 178,315 |
| Multiclass Mortgage Participation Ctfs. | | | | | | | | |
| (Interest Only Obligations), Ser. 2752, | | | | | | |
| Cl. GM, 5.00%, 3/15/26 | | | | | | 3,194,738 d,f | | 111,697 |
| Multiclass Mortgage Participation Ctfs. | | | | | | | | |
| (Interest Only Obligations), Ser. 2731, | | | | | | |
| Cl. PY, 5.00%, 5/15/26 | | | | | | 3,215,622 d,f | | 103,775 |
| Multiclass Mortgage Participation Ctfs. | | | | | | | | |
| (Interest Only Obligations) Ser. 2750, | | | | | | |
| Cl. IK, 5.00%, 5/15/26 | | | | | | 3,859,080 d,f | | 123,365 |
The Fund 33
| STATEMENT OF INVESTMENTS (continued) |
| | | Principal | | |
| Bonds and Notes (continued) | | Amount ($) | | Value ($) |
| |
| |
|
| U.S. Government Agencies/ | | | | |
| Mortgage-Backed (continued) | | | | |
| Federal National Mortgage Association: | | | | |
| 4.00% | | 39,410,000 d,e | | 38,658,767 |
| 4.50% | | 65,525,000 d,e | | 65,934,531 |
| 5.00% | | 63,970,000 d,e | | 65,626,198 |
| 5.50% | | 23,610,000 d,e | | 24,735,158 |
| 6.00% | | 41,025,000 d,e | | 43,505,741 |
| 3.53%, 7/1/10 | | 265,768 d | | 270,006 |
| 4.00%, 5/1/10 | | 783,214 d | | 794,828 |
| 4.06%, 6/1/13 | | 100,000 d | | 102,946 |
| 4.50%, 6/1/10 | | 40,586 d | | 41,602 |
| 5.00%, 7/1/11—4/1/23 | | 9,484,617 d | | 9,910,395 |
| 5.50%, 8/1/22—6/1/38 | | 57,070,471 d | | 59,299,825 |
| 6.00%, 1/1/19—4/1/38 | | 21,292,272 d | | 22,414,345 |
| 6.50%, 11/1/10—10/1/32 | | 240,351 d | | 259,557 |
| 7.00%, 9/1/14—7/1/32 | | 88,487 d | | 95,689 |
| 7.50%, 3/1/12—3/1/31 | | 25,650 d | | 28,036 |
| 8.00%, 5/1/13—3/1/31 | | 37,157 d | | 41,447 |
| Pass-Through Ctfs., | | | | |
| Ser. 2004-58, Cl. LJ, | | | | |
| 5.00%, 7/25/34 | | 7,233,610 d | | 7,561,825 |
| Grantor Trust, | | | | |
| Ser. 2001-T11, Cl. B, | | | | |
| 5.50%, 9/25/11 | | 285,000 d | | 304,790 |
| Pass-Through Ctfs., | | | | |
| Ser. 1988-16, Cl. B, 9.50%, | | | | |
| 6/25/18 | | 108,031 d | | 121,900 |
| Government National Mortgage Association I: | | | | |
| 5.50%, 4/15/33 | | 3,536,759 | | 3,702,883 |
| 6.00%, 1/15/29 | | 34,538 | | 36,640 |
| 6.50%, 4/15/28—9/15/32 | | 87,075 | | 94,104 |
| 7.00%, 12/15/26—9/15/31 | | 22,784 | | 25,059 |
| 7.50%, 12/15/26—11/15/30 | | 6,578 | | 7,352 |
| 8.00%, 1/15/30—10/15/30 | | 20,390 | | 23,136 |
| 8.50%, 4/15/25 | | 5,565 | | 6,366 |
| 9.00%, 10/15/27 | | 10,552 | | 12,178 |
| 9.50%, 2/15/25 | | 3,769 | | 4,320 |
| 9.50%, 11/15/17 | | 158,530 | | 172,349 |
| Ser. 2004-43, Cl. A, 2.82%, 12/16/19 | | 676,704 | | 682,898 |
| Ser. 2003-88, Cl. AC, 2.91%, 6/16/18 | | 58,808 | | 59,405 |
| Ser. 2004-23, Cl. B, 2.95%, 3/16/19 | | 634,819 | | 636,850 |
34
| | | Principal | | |
| Bonds and Notes (continued) | | Amount ($) | | Value ($) |
| |
| |
|
| U.S. Government Agencies/ | | | | |
| Mortgage-Backed (continued) | | | | |
| Government National Mortgage Association I (continued): | | | | |
| Ser. 2004-57, Cl. A, 3.02%, 1/16/19 | | 236,024 | | 238,079 |
| Ser. 2007-46, Cl. A, 3.14%, 11/16/29 | | 2,931,684 | | 2,954,079 |
| Ser. 2004-25, Cl. AC, 3.38%, 1/16/23 | | 305,924 | | 307,379 |
| Ser. 2004-77, Cl. A, 3.40%, 3/16/20 | | 291,296 | | 293,064 |
| Ser. 2004-67, Cl. A, 3.65%, 9/16/17 | | 96,971 | | 97,270 |
| Ser. 2005-90, Cl. A, 3.76%, 9/16/28 | | 1,062,803 | | 1,088,928 |
| Ser. 2005-34, Cl. A, 3.96%, 9/16/21 | | 1,109,130 | | 1,116,781 |
| Ser. 2005-29, Cl. A, 4.02%, 7/16/27 | | 4,692,274 | | 4,827,772 |
| Ser. 2005-9, Cl. A, 4.03%, 5/16/22 | | 115,960 | | 117,987 |
| Ser. 2007-52, Cl. A, 4.05%, 10/16/25 | | 4,533,493 | | 4,639,310 |
| Ser. 2006-66, Cl. A, 4.09%, 1/16/30 | | 1,484,579 | | 1,526,661 |
| Ser. 2004-51, Cl. A, 4.15%, 2/16/18 | | 286,074 | | 289,610 |
| Ser. 2006-9, Cl. A, 4.20%, 8/16/26 | | 198,344 | | 203,222 |
| Ser. 2006-3, Cl. A, 4.21%, 1/16/28 | | 1,289,333 | | 1,324,782 |
| Ser. 2006-55, Cl. A, 4.25%, 7/16/29 | | 1,310,482 | | 1,353,275 |
| Ser. 2006-51, Cl. A, 4.25%, 10/16/30 | | 131,641 | | 136,076 |
| Ser. 2005-59, Cl. A, 4.39%, 5/16/23 | | 2,315,564 | | 2,366,986 |
| Ser. 2005-32, Cl. B, 4.39%, 8/16/30 | | 6,517,640 | | 6,672,892 |
| Ser. 2005-87, Cl. A, 4.45%, 3/16/25 | | 718,227 | | 737,401 |
| Ser. 2004-39, Cl. LC, 5.50%, 12/20/29 | | 6,601,298 | | 6,700,252 |
| Government National Mortgage Association II: | | | | |
| 6.50%, 2/20/31—7/20/31 | | 190,960 | | 206,305 |
| 7.00%, 11/20/29 | | 555 | | 608 |
| | | | | 484,847,895 |
| U.S. Government Securities—3.3% | | | | |
| U.S. Treasury Bonds; | | | | |
| 4.25%, 5/15/39 | | 14,518,000 | | 14,372,864 |
| U.S. Treasury Notes: | | | | |
| 2.50%, 3/31/13 | | 2,195,000 c | | 2,239,587 |
| 3.50%, 2/15/18 | | 16,490,000 | | 16,613,691 |
| 3.88%, 10/31/12 | | 350,000 c | | 374,254 |
| 4.88%, 4/30/11 | | 3,927,000 c | | 4,191,154 |
| U.S. Treasury Strip; | | | | |
| 0.00%, 2/15/36 | | 9,190,000 i | | 2,890,669 |
| | | | | 40,682,219 |
| Total Bonds and Notes | | | | |
| (cost $1,377,786,116) | | | | 1,358,875,648 |
The Fund 35
| STATEMENT OF INVESTMENTS (continued) | | | | |
| |
| |
|
| |
| |
| |
| |
| | | Principal | | |
| Short-Term Investments—6.8% | | Amount ($) | | Value ($) |
| |
| |
|
| U.S. Treasury Bills: | | | | |
| 0.14%, 8/6/09 | | 74,000,000 | | 73,999,408 |
| 0.17%, 10/15/09 | | 9,408,000 g | | 9,405,140 |
| Total Short-Term Investments | | | | |
| (cost $83,403,159) | | | | 83,404,548 |
| |
| Other Investment—1.4% | | Shares | | Value ($) |
| |
| |
|
| Registered Investment Company; | | | | |
| Dreyfus Institutional Preferred Plus Money Market Fund | | | | |
| (cost $17,435,000) | | 17,435,000 h | | 17,435,000 |
| |
| Investment of Cash Collateral for Securities Loaned—2.5% | | |
| |
|
| Registered Investment Company; | | | | |
| Dreyfus Institutional Cash Advantage Plus Fund | | | | |
| (cost $31,008,257) | | 31,008,257 h | | 31,008,257 |
| Total Investments (cost $1,509,632,532) | | 121.9% | | 1,490,723,453 |
| Liabilities, Less Cash and Receivables | | (21.9%) | | (268,107,406) |
| Net Assets | | 100.0% | | 1,222,616,047 |
| a | Variable rate security—interest rate subject to periodic change. |
| |
| b | Securities exempt from registration under Rule 144A of the Securities Act of 1933.These securities may be resold in transactions exempt from registration, normally to qualified institutional buyers.At July 31, 2009, these securities amounted to $153,819,852 or 12.6% of net assets. |
| |
| c | All or a portion of these securities are on loan.At July 31, 2009, the total market value of the fund’s securities on loan is $30,184,387 and the total market value of the collateral held by the fund is $31,008,257. |
| |
| d | On September 7, 2008, the Federal Housing Finance Agency (FHFA) placed Federal National Mortgage Association and Federal Home Loan Mortgage Corporation into conservatorship with FHFA as the conservator. |
| |
| | As such, the FHFA will oversee the continuing affairs of these companies. |
| |
| e | Purchased on a forward commitment basis. |
| |
| f | Notional face amount shown. |
| |
| g | All or partially held by a broker as collateral for open financial futures, options and swap positions. |
| |
| h | Investment in affiliated money market mutual fund. |
| |
| i | Security issued with a zero coupon. Income recognized through the accretion of discount. |
| |
| Portfolio Summary (Unaudited)† | | | | |
| |
| Value (%) | | | | Value (%) |
| |
| |
|
| Corporate Bonds | | 47.6 | | State/Government General Obligations | | 2.1 |
| U.S. Government & Agencies | | 43.6 | | Foreign/Governmental | | 1.1 |
| Asset/Mortgage-Backed | | 16.8 | | | | |
| Short-Term/Money Market Investments | | 10.7 | | | | 121.9 |
| |
| † Based on net assets. | | | | | | |
| See notes to financial statements. | | | | | | |
36
STATEMENT OF FINANCIAL FUTURES
July 31, 2009
| | | | | | | | | Unrealized |
| | | | | Market Value | | | | Appreciation |
| | | | | Covered by | | | | (Depreciation) |
| Contracts | | Contracts ($) | | Expiration | | at 7/31/2009 ($) |
| |
| |
| |
|
| Financial Futures Long | | | | | | | | |
| U.S. Treasury 2 Year Notes | | 160 | | 34,652,500 | | September 2009 | | 264,999 |
| U.S. Treasury 5 Year Notes | | 683 | | 78,806,459 | | September 2009 | | 1,683,326 |
| U.S. Treasury 30 Year Bonds | | 226 | | 26,894,000 | | September 2009 | | (188,785) |
| Financial Futures Short | | | | | | | | |
| U.S. Treasury 10 Year Notes | | 1,362 | | (159,737,063) | | September 2009 | | (3,933,601) |
| Gross Unrealized Appreciation | | | | | | | | 1,948,325 |
| Gross Unrealized Depreciation | | | | | | | | (4,122,386) |
| |
| See notes to financial statements. | | | | | | | | |
The Fund 37
STATEMENT OF OPTIONS WRITTEN
July 31, 2009
| | | Face Amount | | |
| | | Covered by | | |
| | | Contracts ($) | | Value ($) |
| |
| |
|
| Call Options: | | | | |
| 5-Year USD LIBOR-BBA, | | | | |
| August 2009 @ 2.91 | | 27,064,000 a | | (196,560) |
| Federal National Mortgage Association, | | | | |
| August 2009 @ 100 | | 23,535,000 a | | (198,282) |
| Federal National Mortgage Association, | | | | |
| September 2009 @ 99.75 | | 23,658,000 a | | (362,866) |
| U.S. Treasury 10 Year Notes | | | | |
| August 2009 @ 118.50 | | 10,000,000 a | | (54,688) |
| Put Options: | | | | |
| 5-Year USD LIBOR-BBA, | | | | |
| August 2009 @ 2.91 | | 27,064,000 a | | (251,393) |
| Federal National Mortgage Association, | | | | |
| August 2009 @ 100 | | 23,535,000 a | | (65,898) |
| Federal National Mortgage Association, | | | | |
| September 2009 @ 99.75 | | 23,658,000 a | | (259,363) |
| U.S. Treasury 10 Year Notes | | | | |
| August 2009 @ 118.50 | | 10,000,000 a | | (176,562) |
| (Premiums received $2,160,248) | | | | (1,565,612) |
USD—US Dollar
LIBOR—London Interbank Offered Rate
BBA—British Bankers Association
a Non-income producing security.
See notes to financial statements. |
38
STATEMENT OF ASSETS AND LIABILITIES
July 31, 2009
| | | | | | | Cost | | Value |
| |
| |
| |
| |
|
| Assets ($): | | | | | | | | |
| Investments in securities—See Statement of Investments (including | | | | |
| securities on loan, valued at $30,184,387)—Note 1(c): | | | | |
| Unaffiliated issuers | | | | 1,461,189,275 | | 1,442,280,196 |
| Affiliated issuers | | | | | | 48,443,257 | | 48,443,257 |
| Cash | | | | | | | | 5,543,967 |
| Cash denominated in foreign currencies | | | | 97,043 | | 104,047 |
| Dividends and interest receivable | | | | | | | | 12,966,562 |
| Receivable for investment securities sold | | | | | | 1,815,967 |
| Unrealized appreciation on forward foreign currency exchange contracts—Note 4 | | 577,440 |
| Receivable for shares of Common Stock subscribed | | | | | | 496,645 |
| Prepaid expenses | | | | | | | | 72,337 |
| | | | | | | | | 1,512,300,418 |
| Liabilities ($): | | | | | | | | |
| Due to The Dreyfus Corporation and affiliates—Note 3(c) | | | | 833,039 |
| Payable for investment securities purchased | | | | | | 245,073,062 |
| Liability for securities on loan—Note 1(c) | | | | | | 31,008,257 |
| Other liabilities | | | | | | | | 4,693,735 |
| Unrealized depreciation on swap contracts—Note 4 | | | | | | 3,733,570 |
| Payable for shares of Common Stock redeemed | | | | | | 1,731,402 |
| Outstanding options written, at value (premiums received | | | | |
| $2,160,248)—See Statement of Options Written | | | | | | 1,565,612 |
| Payable for futures variation margin—Note 4 | | | | | | 524,060 |
| Unrealized depreciation on forward foreign currency exchange contracts—Note 4 | | 120,120 |
| Accrued expenses | | | | | | | | 401,514 |
| | | | | | | | | 289,684,371 |
| Net Assets ($) | | | | | | 1,222,616,047 |
| Composition of Net Assets ($): | | | | | | | | |
| Paid-in capital | | | | | | | | 1,375,172,054 |
| Accumulated distributions in excess of investment income—net | | | | (484,701) |
| Accumulated net realized gain (loss) on investments | | | | | | (128,313,556) |
| Accumulated net unrealized appreciation (depreciation) on investments, | | |
| options transactions, swap transactions and foreign currency transactions | | |
| [including ($2,174,061) net unrealized (depreciation) on financial futures] | | (23,757,750) |
| Net Assets ($) | | | | | | 1,222,616,047 |
| |
| |
| |
|
| |
| |
| |
| Net Asset Value Per Share | | | | | | | | |
| | | Class A | | Class B | | Class C | | Class I |
| |
| |
| |
| |
|
| Net Assets ($) | | 1,125,877,835 | | 18,918,013 | | 50,196,418 | | 27,623,781 |
| Shares Outstanding | | 93,802,049 | | 1,575,406 | | 4,183,262 | | 2,302,058 |
| Net Asset Value Per Share ($) | | 12.00 | | 12.01 | | 12.00 | | 12.00 |
| |
| See notes to financial statements. | | | | | | | | |
The Fund 39
| STATEMENT OF OPERATIONS | | |
| Year Ended July 31, 2009 | | |
| |
|
| |
| |
| |
| |
| Investment Income ($): | | |
| Income: | | |
| Interest | | 69,206,728 |
| Income from securities lending | | 377,854 |
| Dividends: | | |
| Unaffiliated issuers | | 58,658 |
| Affiliated issuers | | 98,380 |
| Total Income | | 69,741,620 |
| Expenses: | | |
| Management fee—Note 3(a) | | 5,463,037 |
| Shareholder servicing costs—Note 3(c) | | 4,881,197 |
| Distribution fees—Note 3(b) | | 503,206 |
| Prospectus and shareholders’ reports | | 178,830 |
| Professional fees | | 97,817 |
| Custodian fees—Note 3(c) | | 88,641 |
| Registration fees | | 26,813 |
| Directors’ fees and expenses—Note 3(d) | | 23,091 |
| Loan commitment fees—Note 2 | | 3,938 |
| Interest expense—Note 2 | | 95 |
| Miscellaneous | | 400,111 |
| Total Expenses | | 11,666,776 |
| Less—reduction in expenses due to undertaking—Note 3(a) | | (1,140,480) |
| Less—reduction in fees due to earnings credits—Note 1(c) | | (71,142) |
| Net Expenses | | 10,455,154 |
| Investment Income—Net | | 59,286,466 |
| Realized and Unrealized Gain (Loss) on Investments—Note 4 ($): | | |
| Net realized gain (loss) on investments and foreign currency transactions | | (83,477,072) |
| Net realized gain (loss) on options transactions | | (1,051,552) |
| Net realized gain (loss) on financial futures | | 18,418,239 |
| Net realized gain (loss) on swap transactions | | (8,137,290) |
| Net realized gain (loss) on forward foreign currency exchange contracts | | (586,819) |
| Net Realized Gain (Loss) | | (74,834,494) |
| Change in net unrealized appreciation (depreciation) on investments, financial | | |
| futures, options transactions, forward foreign currency exchange contracts and | | |
| swap transactions [including ($2,699,811) net unrealized (depreciation) on | | |
| financial futures, $595,595 net unrealized appreciation on options transactions, | | |
| $978,951 net unrealized appreciation on forward foreign currency exchange | | |
| contracts and $5,358,184 net unrealized appreciation on swap transactions] | | 62,134,455 |
| Net Realized and Unrealized Gain (Loss) on Investments | | (12,700,039) |
| Net Increase in Net Assets Resulting from Operations | | 46,586,427 |
| |
| See notes to financial statements. | | |
40
STATEMENT OF CHANGES IN NET ASSETS
| | | | | Year Ended July 31, |
| | |
| |
|
| | | 2009 | | 2008a |
| |
| |
|
| Operations ($): | | | | |
| Investment income—net | | 59,286,466 | | 34,780,281 |
| Net realized gain (loss) on investments | | (74,834,494) | | 4,894,569 |
| Change in net unrealized appreciation | | | | |
| (depreciation) on investments | | 62,134,455 | | (45,519,071) |
| Net Increase (Decrease) in Net Assets | | | | |
| Resulting from Operations | | 46,586,427 | | (5,844,221) |
| Dividends to Shareholders from ($): | | | | |
| Investment income—net: | | | | |
| Class A Shares | | (54,961,724) | | (34,632,229) |
| Class B Shares | | (1,041,319) | | (488,129) |
| Class C Shares | | (2,034,388) | | (405,909) |
| Class I Shares | | (1,472,323) | | (1,832,889) |
| Net realized gain on investments: | | | | |
| Class A Shares | | — | | (565,680) |
| Class I Shares | | — | | (35,010) |
| Total Dividends | | (59,509,754) | | (37,959,846) |
| Capital Stock Transactions ($): | | | | |
| Net proceeds from shares sold: | | | | |
| Class A Shares | | 154,083,624 | | 222,507,532 |
| Class B Shares | | 2,358,381 | | 414,463 |
| Class C Shares | | 8,135,534 | | 1,748,659 |
| Class I Shares | | 5,400,642 | | 6,052,135 |
| Net assets received in connection | | | | |
| with reorganization—Note 1 | | 24,536,722 | | 893,043,027 |
| Dividends reinvested: | | | | |
| Class A Shares | | 48,776,930 | | 32,113,936 |
| Class B Shares | | 761,622 | | 305,847 |
| Class C Shares | | 1,552,632 | | 368,060 |
| Class I Shares | | 753,682 | | 412,193 |
| Cost of shares redeemed: | | | | |
| Class A Shares | | (342,729,365) | | (240,852,088) |
| Class B Shares | | (24,618,909) | | (7,488,161) |
| Class C Shares | | (14,022,262) | | (2,626,570) |
| Class I Shares | | (22,162,835) | | (27,625,732) |
| Increase (Decrease) in Net Assets from | | | | |
| Capital Stock Transactions | | (157,173,602) | | 878,373,301 |
| Total Increase (Decrease) in Net Assets | | (170,096,929) | | 834,569,234 |
| Net Assets ($): | | | | |
| Beginning of Period | | 1,392,712,976 | | 558,143,742 |
| End of Period | | 1,222,616,047 | | 1,392,712,976 |
| Undistributed (distributions in excess of) | | | | |
| investment income—net | | (484,701) | | 3,164,256 |
The Fund 41
| STATEMENT OF CHANGES IN NET ASSETS (continued) |
| | | | | Year Ended July 31, |
| | |
| |
|
| | | 2009 | | 2008a |
| |
| |
|
| Capital Share Transactions: | | | | |
| Class Ab | | | | |
| Shares sold | | 13,579,025 | | 17,901,918 |
| Shares issued in connection | | | | |
| with reorganization—Note 1 | | 1,676,218 | | 61,527,674 |
| Shares issued for dividends reinvested | | 4,314,541 | | 2,603,126 |
| Shares redeemed | | (30,407,431) | | (19,529,043) |
| Net Increase (Decrease) in Shares Outstanding | | (10,837,647) | | 62,503,675 |
| Class Bb | | | | |
| Shares sold | | 208,473 | | 34,805 |
| Shares issued in connection | | | | |
| with reorganization—Note 1 | | — | | 4,016,826 |
| Shares issued for dividends reinvested | | 67,640 | | 25,191 |
| Shares redeemed | | (2,164,750) | | (612,779) |
| Net Increase (Decrease) in Shares Outstanding | | (1,888,637) | | 3,464,043 |
| Class C | | | | |
| Shares sold | | 719,901 | | 142,665 |
| Shares issued in connection | | | | |
| with reorganization—Note 1 | | — | | 4,614,219 |
| Shares issued for dividends reinvested | | 137,248 | | 30,342 |
| Shares redeemed | | (1,245,418) | | (215,695) |
| Net Increase (Decrease) in Shares Outstanding | | (388,269) | | 4,571,531 |
| Class I | | | | |
| Shares sold | | 474,157 | | 492,119 |
| Shares issued in connection | | | | |
| with reorganization—Note 1 | | 536,798 | | 2,058,484 |
| Shares issued for dividends reinvested | | 66,279 | | 33,756 |
| Shares redeemed | | (1,988,284) | | (2,232,178) |
| Net Increase (Decrease) in Shares Outstanding | | (911,050) | | 352,181 |
| a | The fund changed to a four class fund on May 13, 2008.The existing Investor and Institutional shares were redesignated as Class A and Class I shares, respectively, and the fund commenced offering Class B and Class C shares. |
| |
| b | During the period ended July 31, 2009, 1,076,760 Class B shares representing $12,320,922, were automatically converted to 1,076,645 Class A shares and during the period ended July 31, 2008, 373,886 Class B shares representing $4,574,229, were automatically converted to 374,049 Class A shares. |
| |
| See notes to financial statements. |
42
FINANCIAL HIGHLIGHTS
The following tables describe the performance for each share class for the fiscal periods indicated. All information (except portfolio turnover rate) reflects financial results for a single fund share.Total return shows how much your investment in the fund would have increased (or decreased) during each period, assuming you had reinvested all dividends and distributions.These figures have been derived from the fund’s financial statements.
| | | | | Year Ended July 31, | | |
| | |
| |
| |
|
| Class A Shares | | 2009 | | 2008a | | 2007 | | 2006 | | 2005 |
| |
| |
| |
| |
| |
|
| Per Share Data ($): | | | | | | | | | | |
| Net asset value, beginning of period | | 12.02 | | 12.40 | | 12.35 | | 12.75 | | 12.53 |
| Investment Operations: | | | | | | | | | | |
| Investment income—netb | | .56 | | .55 | | .61 | | .53 | | .46 |
| Net realized and unrealized | | | | | | | | | | |
| gain (loss) on investments | | (.02) | | (.32) | | .08 | | (.28) | | .31 |
| Total from Investment Operations | | .54 | | .23 | | .69 | | .25 | | .77 |
| Distributions: | | | | | | | | | | |
| Dividends from investment income—net | | (.56) | | (.60) | | (.64) | | (.58) | | (.55) |
| Dividends from net realized | | | | | | | | | | |
| gain on investments | | — | | (.01) | | — | | (.07) | | — |
| Total Distributions | | (.56) | | (.61) | | (.64) | | (.65) | | (.55) |
| Net asset value, end of period | | 12.00 | | 12.02 | | 12.40 | | 12.35 | | 12.75 |
| Total Return (%) | | 4.90c | | 1.76c | | 5.74 | | 2.05 | | 6.24 |
| Ratios/Supplemental Data (%): | | | | | | | | | | |
| Ratio of total expenses | | | | | | | | | | |
| to average net assets | | .92 | | .87 | | .92 | | .91 | | .89 |
| Ratio of net expenses | | | | | | | | | | |
| to average net assets | | .82 | | .80 | | .80 | | .80 | | .80 |
| Ratio of net investment income | | | | | | | | | | |
| to average net assets | | 4.93 | | 4.53 | | 4.85 | | 4.21 | | 3.63 |
| Portfolio Turnover Rated | | 343.03 | | 385.86 | | 492.35 | | 439.09 | | 644.23 |
| Net Assets, end of period ($ x 1,000) | | 1,125,878 | | 1,257,597 | | 522,661 | | 458,856 | | 531,232 |
| a | The fund commenced offering four classes of shares on May 13, 2008.The existing Investor shares were redesignated as Class A shares. |
| |
| b | Based on average shares outstanding at each month end. |
| |
| c | Exclusive of sales charge. |
| |
| d | The portfolio turnover rates excluding mortgage dollar roll transactions for the periods ended July 31, 2009, 2008, 2007, 2006 and 2005 were 108.07%, 125.60%, 357.70%, 270.18% and 521.83%, respectively. |
| |
| See notes to financial statements. |
The Fund 43
| FINANCIAL HIGHLIGHTS (continued) |
| | | Year Ended July 31, |
| | |
|
| Class B Shares | | 2009 | | 2008a |
| |
| |
|
| Per Share Data ($): | | | | |
| Net asset value, beginning of period | | 12.01 | | 12.35 |
| Investment Operations: | | | | |
| Investment income—netb | | .46 | | .06 |
| Net realized and unrealized gain (loss) on investments | | .00c | | (.29) |
| Total from Investment Operations | | .46 | | (.23) |
| Distributions: | | | | |
| Dividends from investment income—net | | (.46) | | (.11) |
| Net asset value, end of period | | 12.01 | | 12.01 |
| Total Return (%)d | | 3.95 | | (1.77)e |
| Ratios/Supplemental Data (%): | | | | |
| Ratio of total expenses to average net assets | | 1.59 | | 1.70f |
| Ratio of net expenses to average net assetsg | | 1.59 | | 1.70f |
| Ratio of net investment income to average net assets | | 4.14 | | 2.43f |
| Portfolio Turnover Rateh | | 343.03 | | 385.86 |
| Net Assets, end of period ($ x 1,000) | | 18,918 | | 41,588 |
| a | From May 13, 2008 (commencement of initial offering) to July 31, 2008. |
| |
| b | Based on average shares outstanding at each month end. |
| |
| c | Amount represents less than $.01 per share. |
| |
| d | Exclusive of sales charge. |
| |
| e | Not annualized. |
| |
| f | Annualized. |
| |
| g | Expense waivers and/or reimbursements amounted to less than .01%. |
| |
| h | The portfolio turnover rates excluding mortgage dollar roll transactions for the periods ended July 31, 2009 and 2008 were 108.07% and 125.60%, respectively. |
| |
| See notes to financial statements. |
44
| | | Year Ended July 31, |
| | |
|
| Class C Shares | | 2009 | | 2008a |
| |
| |
|
| Per Share Data ($): | | | | |
| Net asset value, beginning of period | | 12.02 | | 12.35 |
| Investment Operations: | | | | |
| Investment income—netb | | .46 | | .06 |
| Net realized and unrealized gain (loss) on investments | | (.02) | | (.28) |
| Total from Investment Operations | | .44 | | (.22) |
| Distributions: | | | | |
| Dividends from investment income—net | | (.46) | | (.11) |
| Net asset value, end of period | | 12.00 | | 12.02 |
| Total Return (%)c | | 4.01 | | (1.81)d |
| Ratios/Supplemental Data (%): | | | | |
| Ratio of total expenses to average net assets | | 1.69 | | 1.49e |
| Ratio of net expenses to average net assetsf | | 1.69 | | 1.49e |
| Ratio of net investment income to average net assets | | 4.07 | | 2.64e |
| Portfolio Turnover Rateg | | 343.03 | | 385.86 |
| Net Assets, end of period ($ x 1,000) | | 50,196 | | 54,928 |
| a | From May 13, 2008 (commencement of initial offering) to July 31, 2008. |
| |
| b | Based on average shares outstanding at each month end. |
| |
| c | Exclusive of sales charge. |
| |
| d | Not annualized. |
| |
| e | Annualized. |
| |
| f | Expense waivers and/or reimbursements amounted to less than .01%. |
| |
| g | The portfolio turnover rates excluding mortgage dollar roll transactions for the periods ended July 31, 2009 and 2008 were 108.07% and 125.60%, respectively. |
| |
| See notes to financial statements. |
The Fund 45
| FINANCIAL HIGHLIGHTS (continued) |
| | | | | Year Ended July 31, | | |
| | |
| |
| |
|
| Class I Shares | | 2009 | | 2008a | | 2007 | | 2006 | | 2005 |
| |
| |
| |
| |
| |
|
| Per Share Data ($): | | | | | | | | | | |
| Net asset value, beginning of period | | 12.01 | | 12.40 | | 12.34 | | 12.75 | | 12.52 |
| Investment Operations: | | | | | | | | | | |
| Investment income—netb | | .58 | | .60 | | .64 | | .56 | | .51 |
| Net realized and unrealized | | | | | | | | | | |
| gain (loss) on investments | | .00c | | (.34) | | .09 | | (.28) | | .30 |
| Total from Investment Operations | | .58 | | .26 | | .73 | | .28 | | .81 |
| Distributions: | | | | | | | | | | |
| Dividends from investment income—net | | (.59) | | (.64) | | (.67) | | (.62) | | (.58) |
| Dividends from net realized | | | | | | | | | | |
| gain on investments | | — | | (.01) | | — | | (.07) | | — |
| Total Distributions | | (.59) | | (.65) | | (.67) | | (.69) | | (.58) |
| Net asset value, end of period | | 12.00 | | 12.01 | | 12.40 | | 12.34 | | 12.75 |
| Total Return (%) | | 5.27 | | 2.05 | | 6.02 | | 2.35 | | 6.40 |
| Ratios/Supplemental Data (%): | | | | | | | | | | |
| Ratio of total expenses | | | | | | | | | | |
| to average net assets | | .60 | | .52 | | .53 | | .51 | | .55 |
| Ratio of net expenses | | | | | | | | | | |
| to average net assets | | .54 | | .52d | | .53d | | .51d | | .53 |
| Ratio of net investment income | | | | | | | | | | |
| to average net assets | | 5.18 | | 4.83 | | 5.10 | | 4.48 | | 3.86 |
| Portfolio Turnover Ratee | | 343.03 | | 385.86 | | 492.35 | | 439.09 | | 644.23 |
| Net Assets, end of period ($ x 1,000) | | 27,624 | | 38,600 | | 35,482 | | 31,473 | | 27,401 |
| a | The fund commenced offering four classes of shares on May 13, 2008.The existing Institutional shares were redesignated as Class I shares. |
| |
| b | Based on average shares outstanding at each month end. |
| |
| c | Amount represents less than $.01 per share. |
| |
| d | Expense waivers and/or reimbursements amounted to less than .01%. |
| |
| e | The portfolio turnover rates excluding mortgage dollar roll transactions for the periods ended July 31, 2009, 2008, 2007, 2006 and 2005 were 108.07%, 125.60%, 357.70%, 270.18% and 521.83%, respectively. |
| |
| See notes to financial statements. |
46
NOTES TO FINANCIAL STATEMENTS
NOTE 1—Significant Accounting Policies:
Dreyfus Intermediate Term Income Fund (the “fund”) is a separate diversified series of Dreyfus Investment Grade Funds, Inc. (the “Company”), which is registered under the Investment Company Act of 1940, as amended (the “Act”), as an open-end management investment company and operates as a series company currently offering three series, including the fund.The fund’s investment objective is to seek to maximize total return, consisting of capital appreciation and current income. The Dreyfus Corporation (the “Manager” or “Dreyfus”), a wholly-owned subsidiary of The Bank of New York Mellon Corporation (“BNY Mellon”), serves as the fund’s investment adviser.
At a meeting of the fund’s Board of Directors held on October 16, 2008, the Board approved, effective December 1, 2008, a proposal to change the name of the fund from “Dreyfus Premier Intermediate Term Income Fund” to “Dreyfus Intermediate Term Income Fund”.
As of the close of business on December 17, 2008, pursuant to an Agreement and Plan of Reorganization previously approved by the fund’s Board of Directors, all of the assets, subject to the liabilities, of Dreyfus Premier Limited Term Income Fund (“Limited Term Income”) were transferred to the fund in exchange for corresponding class of shares of Common Stock of the fund of equal value. Shareholders of Class A, Class B and Class C shares of Limited Term Income received Class A shares of the fund and shareholders of Class I shares of Limited Term Income received Class I shares of the fund, in each case in an amount equal to the aggregate net asset value of their investment in Limited Term Income at the time of the exchange.The net asset value of the fund’s shares on the close of business December 17, 2008, after the reorganization was $11.09 for Class A, $11.08 for Class I, and a total of 1,676,218 Class A shares and 536,798 Class I shares, representing net assets of $24,536,722 (including $2,679,073 net unrealized depreciation on investments) were issued to shareholders of Limited Term Income in the exchange.The exchange was a tax-free event to the Limited Term Income shareholders.
The Fund 47
| NOTES TO FINANCIAL STATEMENTS (continued) |
As of the close of business on May 15, 2008, pursuant to an Agreement and Plan of Reorganization previously approved by the fund’s Board of Directors, all of the assets, subject to the liabilities, of Dreyfus Premier Core Bond Fund (“Premier Core Bond”) were transferred to the fund in exchange for corresponding class of shares of Common Stock of the fund of equal value. Shareholders of Class A, Class B, Class C and Class I shares of Premier Core Bond received Class A, Class B, Class C and Class I shares of the fund, respectively, in each case in an amount equal to the aggregate net asset value of their investment in Premier Core Bond at the time of the exchange. The net asset value of the fund’s shares on the close of business May 15, 2008, after the reorganization was $12.39 for Class A, $12.39 for Class B, $12.39 for Class C and $12.39 for Class I shares, and a total of 32,492,389 Class A shares, 3,766,828 Class B shares, 2,985,185 Class C shares and 1,871,602 Class I shares, representing net assets of $509,426,510 (including $24,013,207 net unrealized depreciation on investments) were issued to shareholders of Premier Core Bond in the exchange.The exchange was a tax-free event to the Premier Core Bond shareholders.
As of the close of business on May 13, 2008, pursuant to an Agreement and Plan of Reorganization previously approved by the fund’s Board of Directors, all of the assets, subject to the liabilities, of Dreyfus Premier Managed Income Fund (“Premier Managed Income”) were transferred to the fund in exchange for corresponding class of shares of Common Stock of the fund of equal value. Shareholders of Class A, Class B, Class C and Class I shares of Premier Managed Income received Class A, Class B, Class C and Class I shares of the fund, respectively, in each case in an amount equal to the aggregate net asset value of their investment in Premier Managed Income at the time of the exchange.The net asset value of the fund’s shares on the close of business May 13, 2008, after the reorganization was $12.35 for Class A, $12.35 for Class B, $12.35 for Class C and $12.35 for Class I shares, and a total of 7,571,050 Class A shares, 249,998 Class B shares, 1,629,034 Class C shares and 186,882 Class I shares, representing net assets of $119,022,316 (including $2,685,763 net unrealized depreciation on investments) were issued to shareholders of Premier Managed
48
Income in the exchange. The exchange was a tax-free event to the Premier Managed Income shareholders.
As of the close of business on May 14, 2008, pursuant to an Agreement and Plan of Reorganization previously approved by the fund’s Board of Directors, all of the assets, subject to liabilities, of Dreyfus A Bonds Plus, Inc. (“A Bonds Plus”) were transferred to the fund in exchange for shares of Common Stock of the fund of equal value. Shareholders of A Bonds Plus received Class A shares of the fund, in an amount equal to the aggregate net asset value of their investment in A Bonds Plus at the time of the exchange.The fund’s net asset value on the close of business on May 14, 2008 after the reorganization was $12.33 for Class A shares, and a total of 21,464,235 Class A shares representing net assets of $264,594,201 (including $8,827,883 net unrealized depreciation on investments) were issued to shareholders of A Bonds Plus in the exchange.The exchange was a tax-free event to A Bonds Plus shareholders.
MBSC Securities Corporation (the “Distributor”), a wholly-owned subsidiary of the Manager, is the distributor of the fund’s shares. The fund is authorized to issue 1.2 billion shares of $.001 par value Common Stock.The fund currently offers four classes of shares: Class A (500 million shares authorized), Class B (100 million shares authorized), Class C (100 million shares authorized) and Class I (500 million shares authorized). Class A shares are subject to a sales charge imposed at the time of purchase. Class B shares are subject to a contingent deferred sales charge (“CDSC”) imposed on Class B share redemptions made within six years of purchase and automatically convert to Class A shares after six years.The fund does not offer Class B shares, except in connection with dividend reinvestment and permitted exchanges of Class B shares. Class C shares are subject to a CDSC imposed on Class C shares redeemed within one year of purchase. Class I shares are sold at net asset value per share only to institutional investors. Other differences between the classes include the services offered to and the expenses borne by each class, the allocation of certain transfer agency costs and certain voting rights. Income, expenses (other than expenses attributable to a specific class), and realized and
The Fund 49
| NOTES TO FINANCIAL STATEMENTS (continued) |
unrealized gains or losses on investments are allocated to each class of shares based on its relative net assets.
The Company accounts separately for the assets, liabilities and operations of each series. Expenses directly attributable to each series are charged to that series’ operations; expenses which are applicable to all series are allocated among them on a pro rata basis.
The fund’s financial statements are prepared in accordance with U.S. generally accepted accounting principles, which may require the use of management estimates and assumptions. Actual results could differ from those estimates.
The fund enters into contracts that contain a variety of indemnifications. The fund’s maximum exposure under these arrangements is unknown.The fund does not anticipate recognizing any loss related to these arrangements.
(a) Portfolio valuation: Investments in securities excluding short-term investments (other than U.S. Treasury Bills), financial futures, options, swap transactions and forward foreign currency exchange contracts (“forward contracts”) are valued each business day by an independent pricing service (the “Service”) approved by the Board of Directors. Investments for which quoted bid prices are readily available and are representative of the bid side of the market in the judgment of the Service are valued at the mean between the quoted bid prices (as obtained by the Service from dealers in such securities) and asked prices (as calculated by the Service based upon its evaluation of the market for such securities). Other investments (which constitute a majority of the portfolio securities) are valued as determined by the Service, based on methods which include consideration of: yields or prices of securities of comparable quality, coupon, maturity and type; indications as to values from dealers; and general market conditions. Restricted securities, as well as securities or other assets for which recent market quotations are not readily available, that are not valued by a pricing service approved by the Board of Directors, or are determined by the fund not to reflect accurately fair value, are valued at fair value as determined in good faith under the direction of the Board of Directors. The factors
50
that may be considered when fair valuing a security include fundamental analytical data, the nature and duration of restrictions on disposition, an evaluation of the forces that influence the market in which the securities are purchased and sold and public trading in similar securities of the issuer or comparable issuers. Short-term investments, excluding U.S. Treasury Bills, are carried at amortized cost, which approximates value. Registered investment companies that are not traded on an exchange are valued at their net asset value. Financial futures and options, which are traded on an exchange, are valued at the last sales price on the securities exchange on which such securities are primarily traded or at the last sales price on the national securities market on each business day. Options traded over-the-counter are priced at the mean between the bid and the asked price. Investments in swap transactions are valued each business day by an independent pricing service approved by the Board of Directors. Swaps are valued by the service by using a swap pricing model which incorporates among other factors, default probabilities, recovery rates, credit curves of the underlying issuer and swap spreads on interest rates. Investments denominated in foreign currencies are translated to U.S. dollars at the prevailing rates of exchange. Forward contracts are valued at the forward rate.
The fund adopted Statement of Financial Accounting Standards No.157 “FairValue Measurements” (“FAS 157”). FAS 157 establishes an authoritative definition of fair value, sets out a framework for measuring fair value, and requires additional disclosures about fair value measurements.
Various inputs are used in determining the value of the fund’s investments relating to FAS 157.These inputs are summarized in the three broad levels listed below.
Level 1—quoted prices in active markets for identical investments.
Level 2—other significant observable inputs (including quoted prices for similar investments, interest rates, prepayment speeds, credit risk, etc.).
Level 3—significant unobservable inputs (including the fund’s own assumptions in determining the fair value of investments).
The Fund 51
| NOTES TO FINANCIAL STATEMENTS (continued) |
The inputs or methodology used for valuing securities are not necessarily an indication of the risk associated with investing in those securities.
The following is a summary of the inputs used as of July 31, 2009 in valuing the fund’s investments:
| | | | | Level 2—Other | | Level 3— | | |
| | | Level 1— | | Significant | | Significant | | |
| | | Quoted | | Observable | | Unobservable | | |
| | | Prices | | Inputs | | Inputs | | Total |
| |
| |
| |
| |
|
| Assets ($) | | | | | | | | |
| Investments in Securities: | | | | | | |
| U.S. Treasury | | | | | | | | |
| Securities | | — | | 124,086,767 | | — | | 124,086,767 |
| Asset-Backed | | — | | 69,139,696 | | — | | 69,139,696 |
| Corporate Bonds | | — | | 581,173,315 | | — | | 581,173,315 |
| Foreign Government | | — | | 13,642,320 | | — | | 13,642,320 |
| Municipal Bonds | | — | | 25,901,140 | | — | | 25,901,140 |
| U.S. Government Agencies/ | | | | | | |
| Mortgage-Backed | | — | | 493,294,733 | | — | | 493,294,733 |
| Residential | | | | | | | | |
| Mortgage-Backed | | — | | 5,537,592 | | — | | 5,537,592 |
| Commercial | | | | | | | | |
| Mortgage-Backed | | — | | 129,504,633 | | — | | 129,504,633 |
| Mutual Funds | | 48,443,257 | | — | | — | | 48,443,257 |
| Other Financial | | | | | | | | |
| Instruments† | | 1,948,325 | | 577,440 | | — | | 2,525,765 |
| Liabilities ($) | | | | | | | | |
| Other Financial | | | | | | | | |
| Instruments† | | (5,240,045) | | (4,301,643) | | — | | (9,541,688) |
| | † Other financial instruments include derivative instruments, such as futures, forward foreign currency
exchange contracts, swap contracts and options contracts.Amounts shown represent unrealized
appreciation (depreciation), or in the case of options, market value at period end.
(b) Foreign currency transactions: The fund does not isolate that por- |
tion of the results of operations resulting from changes in foreign exchange rates on investments from the fluctuations arising from changes in market prices of securities held. Such fluctuations are included with the net realized and unrealized gain or loss on investments.
Net realized foreign exchange gains or losses arise from sales of foreign currencies, currency gains or losses realized on securities transactions
52
and the difference between the amounts of dividends, interest, and foreign withholding taxes recorded on the fund’s books and the U.S. dollar equivalent of the amounts actually received or paid. Net unrealized foreign exchange gains and losses arise from changes in the value of assets and liabilities other than investments resulting from changes in exchange rates. Foreign currency gains and losses on investments are included with net realized and unrealized gain or loss on investments.
(c) Securities transactions and investment income: Securities transactions are recorded on a trade date basis. Realized gains and losses from securities transactions are recorded on the identified cost basis. Dividend income is recognized on the ex-dividend date and interest income, including, where applicable, accretion of discount and amortization of premium on investments, is recognized on the accrual basis.
The fund has arrangements with the custodian and cash management bank whereby the fund may receive earnings credits when positive cash balances are maintained, which are used to offset custody and cash management fees. For financial reporting purposes, the fund includes net earnings credits as an expense offset in the Statement of Operations.
Pursuant to a securities lending agreement with The Bank of New York Mellon, a subsidiary of BNY Mellon and an affiliate of Dreyfus, the fund may lend securities to qualified institutions. It is the fund’s policy that, at origination, all loans are secured by collateral of at least 102% of the value of U.S. securities loaned and 105% of the value of foreign securities loaned. Collateral equivalent to at least 100% of the market value of securities on loan is maintained at all times. Collateral is either in the form of cash, which can be invested in certain money market mutual funds managed by the Manager, U.S. Government and Agency securities or letters of credit.The fund is entitled to receive all income on securities loaned, in addition to income earned as a result of the lending transaction. Although each security loaned is fully collateralized, the fund bears the risk of delay in recovery of, or loss of rights in, the securities loaned should a borrower fail to return the
The Fund 53
| NOTES TO FINANCIAL STATEMENTS (continued) |
securities in a timely manner. During the period ended July 31, 2009, The Bank of New York Mellon earned $203,460 from lending fund portfolio securities, pursuant to the securities lending agreement.
(d) Affiliated issuers: Investments in other investment companies advised by the Manager are defined as “affiliated” in the Act.
(e) Dividends to shareholders: It is the policy of the fund to declare dividends daily from investment income-net. Such dividends are paid monthly. Dividends from net realized capital gains, if any, are normally declared and paid annually, but the fund may make distributions on a more frequent basis to comply with the distribution requirements of the Internal Revenue Code of 1986, as amended (the “Code”).To the extent that net realized capital gains can be offset by capital loss carryovers, it is the policy of the fund not to distribute such gains. Income and capital gain distributions are determined in accordance with income tax regulations, which may differ from U.S. generally accepted accounting principles.
(f) Federal income taxes: It is the policy of the fund to continue to qualify as a regulated investment company, if such qualification is in the best interests of its shareholders, by complying with the applicable provisions of the Code, and to make distributions of taxable income sufficient to relieve it from substantially all federal income and excise taxes.
As of and during the period ended July 31, 2009, the fund did not have any liabilities for any uncertain tax positions. The fund recognizes interest and penalties, if any, related to uncertain tax positions as income tax expense in the Statement of Operations. During the period, the fund did not incur any interest or penalties.
Each of the tax years in the four-year period ended July 31, 2009 remains subject to examination by the Internal Revenue Service and state taxing authorities.
At July 31, 2009, the components of accumulated earnings on a tax basis were as follows: accumulated capital losses $85,393,312, and unrealized depreciation $24,653,957. In addition, the fund had $42,024,037
54
of capital losses and $484,701 of currency losses realized after October 31, 2008, which were deferred for tax purposes to the first day of the following fiscal year.
The accumulated capital loss carryover is available for federal income tax purposes to be applied against future net securities profits, if any, realized subsequent to July 31, 2009. If not applied, $8,440,328 of the carryover expires in fiscal 2011, $7,653,528 expires in fiscal 2012, $19,091,268 expires in fiscal 2013, $4,661,252 expires in fiscal 2014, $11,616,326 expires in fiscal 2015, $635,541 expires in fiscal 2016 and $33,295,069 expires in fiscal 2017. Based on certain provisions in the code, some of these losses acquired from fund mergers are subject to an annual limitation.
The tax character of distributions paid to shareholders during the fiscal periods ended July 31, 2009 and July 31, 2008 were as follows: ordinary income $59,509,754 and $37,959,846, respectively.
During the period ended July 31, 2009, as a result of permanent book to tax differences, primarily due to the tax treatment for amortization of premiums, paydown gains and losses on mortgage-backed securities, wash sales and capital loss carryovers from a fund merger, foreign currency transactions and a capital loss carryover expiration, the fund decreased accumulated undistributed investment income-net by $3,425,669, increased accumulated net realized gain (loss) on investments by $3,741,911 and decreased paid-in capital by $316,242. Net assets and net asset value per share were not affected by this reclassification.
NOTE 2—Bank Line of Credit:
The fund participates with other Dreyfus-managed funds in a $300 million unsecured line of credit provided by The Bank of New York Mellon (the “BNYM Facility”) primarily to be utilized for temporary or emergency purposes, including the financing of redemptions. The
The Fund 55
| NOTES TO FINANCIAL STATEMENTS (continued) |
terms of the BNYM Facility limits the amount of individual fund borrowings. Interest is charged to the fund based on prevailing market rates in effect at the time of borrowing. Effective October 15, 2008, in connection therewith, the fund has agreed to pay commitment fees on its pro rata portion of the BNYM Facility.
The average amount of borrowings outstanding under the BNYM Facility during the period ended July 31,2009 was approximately $2,800, with a related weighted average annualized interest rate of 3.35%.
NOTE 3—Management Fee and Other Transactions With Affiliates:
(a) Pursuant to a management agreement (“Agreement”) with the Manager, the management fee is computed at the annual rate of .45% of the value of the fund’s average daily net assets and is payable monthly.
The Manager has contractually agreed to waive receipt of its fees and/or assume the expenses of the fund until December 31, 2009, so that the total annual operating expenses of Class A and Class I shares (excluding taxes, interest, brokerage commissions, commitment fees on borrowings and extraordinary expenses) do not exceed .85% for Class A and .53% for Class I, respectively. The reduction in expenses, pursuant to the undertaking, amounted to $1,140,480 during the period ended July 31, 2009.
During the period ended July 31, 2009, the Distributor retained $13,779 from commissions earned on sales of the fund’s Class A shares and $67,726 and $9,521 from CDSCs on redemptions of the fund’s Class B and Class C shares, respectively.
(b) Under the Distribution Plan (the “Plan”) adopted pursuant to Rule 12b-1 under the Act, Class B and Class C shares pay the Distributor for distributing their shares at an annual rate of .50% of the value of the average daily net assets of Class B shares and .75% of the value of the average daily net assets of Class C shares. During the period ended July 31, 2009, Class B and Class C shares were charged $130,420 and $372,786, respectively, pursuant to the Plan.
56
(c) Under the Shareholder Services Plan, Class A, Class B and Class C shares pay the Distributor at an annual rate of .25% of the value of their average daily net assets for the provision of certain services.The services provided may include personal services relating to shareholder accounts, such as answering shareholder inquiries regarding the fund and providing reports and other information, and services related to the maintenance of shareholder accounts. The Distributor may make payments to Service Agents (a securities dealer, financial institution or other industry professional) in respect of these services. The Distributor determines the amounts to be paid to Service Agents. During the period ended July 31, 2009, Class A, Class B and Class C shares were charged $2,774,591, $65,210 and $124,262, respectively, pursuant to the Shareholder Services Plan.
The fund compensates Dreyfus Transfer, Inc., a wholly-owned subsidiary of the Manager, under a transfer agency agreement for providing personnel and facilities to perform transfer agency services for the fund. During the period ended July 31, 2009, the fund was charged $699,204 pursuant to the transfer agency agreement.
The fund compensates The Bank of New York Mellon under a cash management agreement for performing cash management services related to fund subscriptions and redemptions. During the period ended July 31, 2009, the fund was charged $59,764 pursuant to the cash management agreement.These fees were offset by earnings credits pursuant to the cash management agreement.
The fund also compensates The Bank of New York Mellon under a custody agreement for providing custodial services for the fund. During the period ended July 31, 2009, the fund was charged $88,641 pursuant to the custody agreement.
During the period ended July 31, 2009, the fund was charged $5,939 for services performed by the Chief Compliance Officer.
The components of “Due to The Dreyfus Corporation and affiliates” in the Statement of Assets and Liabilities consist of: management fees
The Fund 57
| NOTES TO FINANCIAL STATEMENTS (continued) |
$457,413, Rule 12b-1 distribution plan fees $39,568, shareholder services plan fees $248,415, custodian fees $28,713, chief compliance officer fees $2,227 and transfer agency per account fees $158,500, which are offset against an expense reimbursement currently in effect in the amount of $101,797.
(d) Each Board member also serves as a Board member of other funds within the Dreyfus complex. Annual retainer fees and attendance fees are allocated to each fund based on net assets.
NOTE 4—Securities Transactions:
The aggregate amount of purchases and sales (including paydowns) of investment securities, excluding short-term securities, option transactions, financial futures, forward contracts and swap transactions, during the period ended July 31, 2009, amounted to $4,991,167,298 and $5,436,495,850, respectively, of which $3,418,780,664 in purchases and $3,427,325,666 in sales were from mortgage dollar roll transactions.
The fund adopted Statement of Financial Accounting Standards No. 161 “Disclosures about Derivative Instruments and Hedging Activities” (“FAS 161”) which changes the disclosure requirement for derivative instruments and hedging activities. Because investment companies value their derivatives at fair value and recognize changes in fair value through the Statement of Operations, they do not qualify for FAS 133 hedge accounting. Accordingly, even though a fund’s investments in derivatives may represent economic hedges, they are considered to be non-hedging transactions for purposes of FAS 161 disclosure. FAS 161 requires qualitative disclosures about objectives and strategies for using derivatives, quantitative disclosures about fair value amounts of gains and losses on derivative instruments and disclosures about credit-risk-related contingent features in derivative agreements.The following tables show the fund’s exposure to different types of market risk as it relates to the Statement of Assets and Liabilities and the Statement of Operations, repectively.All changes to accounting policies and disclosures have been made in accordance with FAS 161 and are incorporated for the current period as part of the disclosures within this Note.
58
Fair value of derivative instruments as of July 31, 2009 is shown below:
| | | Derivative | | | | Derivative |
| | | Assets ($) | | | | Liabilities ($) |
| |
| |
| |
|
| Interest rate risk 1 | | 1,948,325 | | Interest rate risk1,2 | | (5,687,998) |
| Foreign currency risk 3 | | 577,440 | | Foreign currency risk4 | | (120,120) |
| Credit risk | | — | | Credit risk5 | | (3,733,570) |
| Gross fair value of | | | | | | |
| derivatives | | | | | | |
| contracts | | 2,525,765 | | | | (9,541,688) |
Statement of Assets and Liabilities location:
| 1 | Includes cumulative appreciation/depreciation of futures contracts as reported on the Statement of Financial Futures, but only the unpaid variation margin is reported within the Statement of Assets and Liabilities. |
| |
| 2 | Outstanding options written, at value. |
| |
| 3 | Unrealized appreciation on forward foreign currency exchange contracts. |
| |
| 4 | Unrealized depreciation on forward foreign currency exchange contracts. |
| |
| 5 | Unrealized depreciation on swap contracts. |
| |
The effect of derivative instruments on the Statement of Operations the period ended July 31, 2009 is shown below:
| | | Amount of realized gain or (loss) on derivatives recognized in income ($) |
| | |
|
| | | | | | | Foreign | | | | |
| | | | | | | Currency | | | | |
| Underlying risk | | Options6 | | Futures7 | | Contracts8 | | Swaps9 | | Total |
| |
| |
| |
| |
| |
|
| Interest rate | | (1,051,552) | | 18,418,239 | | — | | 306,264 | | 17,672,951 |
| Foreign | | | | | | | | | | |
| currency | | — | | — | | (586,819) | | — | | (586,819) |
| Credit | | — | | — | | — | | (8,443,554) | | (8,443,554) |
| Total | | (1,051,552) | | 18,418,239 | | (586,819) | | (8,137,290) | | 8,642,578 |
| Change in unrealized appreciation or (depreciation) on derivatives recognized in income ($)10 |
|
| | | | | | | Foreign | | | | |
| | | | | | | Currency | | | | |
| Underlying risk | | Options | | Futures | | Contracts | | Swaps | | Total |
| |
| |
| |
| |
| |
|
| Interest rate | | 595,595 | | (2,699,811) | | — | | (209,811) | | (2,314,027) |
| Foreign | | | | | | | | | | |
| currency | | — | | — | | 978,951 | | — | | 978,951 |
| Credit | | — | | — | | — | | 5,567,995 | | 5,567,995 |
| Total | | 595,595 | | (2,699,811) | | 978,951 | | 5,358,184 | | 4,232,919 |
| Statement of Operations location: |
| 6 | Net realized gain (loss) on options transactions. |
| |
| 7 | Net realized gain (loss) on financial futures. |
| |
| 8 | Net realized gain (loss) on forward foreign currency exchange contracts. |
| |
| 9 | Net realized gain (loss) on swap transactions. |
| |
| 10 | Change in net unrealized appreciation (depreciation) on investments, financial futures, options transactions, forward foreign currency exchange contracts and swap transactions. |
| |
The Fund 59
| NOTES TO FINANCIAL STATEMENTS (continued) |
During the period ended July 31, 2009, the average notional value of interest rate contracts was $274,304,745, which represented 32.2% of average net assets.The average notional value of foreign currency contracts was $23,512,389, which represented 2.8% of average net assets. The average notional value of credit contracts was $70,090,538, which represented 8.2% of average net assets.
Mortgage Dollar Rolls: A mortgage dollar roll transaction involves a sale by the fund of mortgage related securities that it holds with an agreement by the fund to repurchase similar securities at an agreed upon price and date.The securities purchased will bear the same interest rate as those sold, but generally will be collateralized by pools of mortgages with different prepayment histories than those securities sold.
Futures Contracts: In the normal course of pursuing its investment objectives, the fund is exposed to market risk (including equity price risk, interest rate risk and foreign currency exchange risk) as a result of changes in value of underlying financial instruments. The fund may invest in financial futures contracts in order to manage its exposure to or protect against changes in the market. A futures contract represents a commitment for the future purchase or a sale of an asset at a specified date. Upon entering into such contracts, these investments require initial margin deposits with a broker, which consist of cash or cash equivalents. The amount of these deposits is determined by the exchange or Board of Trade on which the contract is traded and is subject to change. Accordingly, variation margin payments are received or made to reflect daily unrealized gains or losses which are recorded in the Statement of Operations. Futures contracts are valued daily at the settlement price established by the Board of Trade or exchange upon which they are traded.When the contracts are closed, the fund recognizes a realized gain or loss.There is minimal counterparty credit risk to the fund with futures, since futures are exchange traded and the exchange’s clearinghouse, as counterparty to all exchange traded
60
futures, guarantees the futures against default. Contracts open at July 31, 2009 are set forth in the Statement of Financial Futures.
Options: A call option gives the purchaser of the option the right (but not the obligation) to buy, and obligates the writer to sell, the underlying security or securities at the exercise price at any time during the option period, or at a specified date. Conversely, a put option gives the purchaser of the option the right (but not the obligation) to sell, and obligates the writer to buy the underlying security or securities at the exercise price at any time during the option period, or at a specified date.The fund may purchase and write (sell) put and call options primarily to hedge against changes in security prices, or securities that the fund intends to purchase, or against fluctuations in value caused by changes in prevailing market interest rates or other market conditions.
As a writer of call options, the fund receives a premium at the outset and then bears the market risk of unfavorable changes in the price of the financial instrument underlying the option. Generally, the fund would incur a gain, to the extent of the premium, if the price of the underlying financial instrument decreases between the date the option is written and the date on which the option is terminated. Generally, the fund would realize a loss, if the price of the financial instrument increases between those dates.
As a writer of put options, the fund receives a premium at the outset and then bears the market risk of unfavorable changes in the price of the financial instrument underlying the option. Generally, the fund would incur a gain, to the extent of the premium, if the price of the underlying financial instrument increases between the date the option is written and the date on which the option is terminated. Generally, the fund would realize a loss, if the price of the financial instrument decreases between those dates. As a writer of an option, the fund may have no control over whether the underlying securities may be sold
The Fund 61
| NOTES TO FINANCIAL STATEMENTS (continued) |
(call) or purchased (put) and as a result bear the market risk of an unfavorable change in the price of the security underlying the written option. One risk of holding a put or a call option is that if the option is not sold or exercised prior to its expiration, it becomes worthless. However, this risk is limited to the premium paid by the fund. Upon the expiration or closing of the option transaction, a gain or loss is reported in the Statement of Operations.
The following summarizes the fund’s call/put options written for the period ended July 31, 2009:
| | | Face Amount | | | | Options Terminated |
| | | | | | |
|
| | | Covered by | | Premiums | | | | Net Realized |
| Options Written: | | Contracts ($) | | Received ($) | | Cost ($) | | Gain (Loss) ($) |
| |
| |
| |
| |
|
| Contracts outstanding | | | | | | | | |
| July 31, 2008 | | 167,726,000 | | 1,669,372 | | | | |
| Contracts written | | 2,056,866,000 | | 19,270,506 | | | | |
| Contracts terminated: | | | | | | | | |
| Contracts closed | | 1,134,160,000 | | 10,387,869 | | 19,297,345 | | (8,909,476) |
| Contracts expired | | 921,918,000 | | 8,391,761 | | — | | 8,391,761 |
| Total contracts | | | | | | | | |
| terminated | | 2,056,078,000 | | 18,779,630 | | 19,297,345 | | (517,715) |
| Contracts outstanding | | | | | | |
| July 31, 2009 | | 168,514,000 | | 2,160,248 | | | | |
Forward Foreign Currency Exchange Contracts: The fund may enter into forward contracts in order to hedge its exposure to changes in foreign currency exchange rates on its foreign portfolio holdings, to settle foreign currency transactions or as a part of an investment strat-egy.When executing forward contracts, the fund is obligated to buy or sell a foreign currency at a specified rate on a certain date in the future. With respect to sales of forward contracts, the fund would incur a loss if the value of the contracts increases between the date the forward contracts are opened and the date the forward contracts are closed.The fund realizes a gain if the value of the contracts decreases between those dates. With respect to purchases of forward contracts, the fund would incur a loss if the value of the contracts decreases between the date the forward contracts are opened and the date the forward contracts are closed. The fund realizes a gain if the value of the contracts increases between those dates.The fund is also exposed to credit risk associated
62
with counterparty nonperformance on these forward contracts, which is typically limited to the unrealized gain on each open contract.The following summarizes open forward contracts at July 31, 2009:
| | | | | | | | | Unrealized |
| | | Foreign | | | | | | Appreciation |
| Forward Foreign Currency Currency | | | | | | (Depreciation) |
| Exchange Contracts | | Amounts | | Cost ($) | | Value ($) | | at 7/31/2009 (S) |
| |
| |
| |
| |
|
| Purchases: | | | | | | | | |
| Argentine Peso, | | | | | | | | |
| expiring 9/4/2009 | | 22,586,000 | | 5,858,885 | | 5,808,484 | | (50,401) |
| Brazilian Real, | | | | | | | | |
| expiring 9/4/2009 | | 11,778,000 | | 6,184,300 | | 6,268,144 | | 83,844 |
| British Pound, | | | | | | | | |
| expiring 8/28/2009 | | 3,560,000 | | 5,868,304 | | 5,946,432 | | 78,128 |
| Canadian Dollar, | | | | | | | | |
| expiring 8/28/2009 | | 6,750,000 | | 6,155,108 | | 6,266,491 | | 111,383 |
| Euro, | | | | | | | | |
| expiring 8/28/2009 | | 2,765,000 | | 3,936,005 | | 3,941,202 | | 5,197 |
| Hungary Forint, | | | | | | | | |
| expiring | | | | | | | | |
| 9/4/2009 | | 1,132,590,000 | | 5,861,508 | | 6,020,055 | | 158,547 |
| Russian Ruble, | | | | | | | | |
| expiring 9/4/2009 | | 182,996,000 | | 5,836,448 | | 5,766,729 | | (69,719) |
| South Korean Won, | | | | | | | | |
| expiring | | | | | | | | |
| 8/28/2009 | | 7,929,310,000 | | 6,347,256 | | 6,454,569 | | 107,313 |
| Turkish Lira, | | | | | | | | |
| expiring 9/4/2009 | | 8,900,000 | | 5,970,750 | | 6,003,778 | | 33,028 |
| Gross Unrealized Appreciation | | | | | | 577,440 |
| Gross Unrealized Depreciation | | | | | | (120,120) |
Swaps: The fund may enter into swap agreements to exchange the interest rate on, or return generated by, one nominal instrument for the return generated by another nominal instrument.The fund enters into these agreements for a variety of reasons, including to hedge certain market or interest rate risks, to manage the interest rate sensitivity (sometimes called duration) of fixed income securities, to provide a substitute for purchasing or selling particular securities or to increase potential returns.
The Fund 63
| NOTES TO FINANCIAL STATEMENTS (continued) |
The fund accrues for the interim payments on swap contracts on a daily basis, with the net amount recorded within unrealized appreciation (depreciation) on swap contracts in the Statement of Assets and Liabilities. Once the interim payments are settled in cash, the net amount is recorded as realized gain (loss) on swaps, in addition to realized gain (loss) recorded upon the termination of swaps contracts in the Statement of Operations. Upfront payments made and/or received by the fund, are recorded as an asset and /or liability in the Statement of Assets and Liabilities and are recorded as a realized gain or loss ratably over the contract’s term/event with the exception of forward started interest rate swaps which are recorded as realized gains or losses on the termination date. Fluctuations in the value of swap contracts are recorded for financial statement purposes as unrealized appreciation or depreciation on swap transactions.
Interest Rate Swaps: Interest rate swaps involve the exchange of commitments to pay and receive interest based on a notional principal amount.The fund enters into these agreements for a variety of reasons, including to hedge certain market or interest rate risks, to manage the interest rate sensitivity (sometimes called duration) of fixed income securities, to provide a substitute for purchasing or selling particular securities or to increase potential returns.The fund may elect to pay a fixed rate and receive a floating rate, or receive a fixed rate and pay a floating rate on a notional principal amount.The net interest received or paid on interest rate swap agreements is included within unrealized appreciation (depreciation) on swap contracts in the Statement of Assets and Liabilities. Interest rate swaps are valued daily and the change, if any, is recorded as an unrealized gain or loss in the Statement of Operations. When a swap contract is terminated early, the fund records a realized gain or loss equal to the difference between the current realized value and the expected cash flows.
The fund’s maximum risk of loss from counterparty credit risk is the discounted net value of the cash flows to be received from the coun-terparty over the contract’s remaining life, to the extent that the amount is positive. This risk is mitigated by having a master netting
64
arrangement between the fund and the counterparty and by the posting of collateral by the counterparty to the fund to cover the fund’s exposure to the counterparty. At July 31, 2009, the fund had no open interest rate swaps.
Credit Default Swaps: Credit default swaps involve commitments to pay a fixed interest rate in exchange for payment if a credit event affecting a third party (the referenced company) occurs. Credit events may include a failure to pay interest or principal, bankruptcy, or restructuring. The fund enters into these agreements to manage its exposure to the market or certain sectors of the market, to reduce its risk exposure to defaults of corporate and sovereign issuers, or to create exposure to corporate or sovereign issuers to which it is not otherwise exposed. For those credit default swaps in which the fund is paying a fixed rate, the fund is buying credit protection on the instrument. In the event of a credit event, the fund would receive the full notional amount for the reference obligation. For those credit default swaps in which the fund is receiving a fixed rate, the fund is selling credit protection on the underlying instrument. The maximum pay-outs for these contracts are limited to the notional amount of each swap. Credit default swaps may involve greater risks than if the fund had invested in the reference obligation directly and are subject to general market risk, liquidity risk, counterparty risk and credit risk.
The maximum potential amount of future payments (undiscounted) that a fund as a seller of protection could be required to make under a credit default swap agreement would be an amount equal to the notional amount of the agreement (which may exceed the amount of unrealized appreciation or depreciation reflected on the Statement of Assets and Liabilities). Notional amounts of all credit default swap agreements are disclosed in the following chart, which summarizes open credit default swaps on corporate and sovereign issues entered into by the fund at July 31, 2009.These potential amounts would be partially offset by any recovery values of the respective referenced
The Fund 65
| NOTES TO FINANCIAL STATEMENTS (continued) |
obligations, upfront payments received upon entering into the agreement, or net amounts received from the settlement of buy protection credit default swap agreements entered into by the fund for the same referenced entity or entities.
| | | | | (Pay) | | | | | | Upfront | | |
| | | | | Receive | | Implied | | | | Premiums | | Unrealized |
| Reference | | Notional | | Fixed | | Credit | | Market | | Paid | | Appreciation |
| Obligation | | Amount ($)2 Rate (%) | | Spread%3 Value ($) | | (Received) ($) (Depreciation) ($) |
| |
| |
| |
|
| |
| Sale Contracts:1 | | | | | | | | | | |
| Northern | | | | | | | | | | | | |
| Tobacco, 5%, | | | | | | | | | | | | |
| 6/1/2046 | | | | | | | | | | | | |
| 12/20/2011† | | 11,710,000a | | 1.35 | | 9.50 | | (1,866,785) | | — | | (1,866,785) |
| Southern | | | | | | | | | | | | |
| California | | | | | | | | | | | | |
| Tobacco, 5%, | | | | | | | | | | | | |
| 6/1/2037 | | | | | | | | | | | | |
| 12/20/2011† | | 11,710,000a | | 1.35 | | 9.50 | | (1,866,785) | | — | | (1,866,785) |
| | | | | | | | | | | | | (3,733,570) |
| † Expiration Date | | | | | | | | | | | | |
| Counterparties: | | | | | | | | | | | | |
| a | Citibank |
| |
| 1 | If the fund is a seller of protection and a credit event occurs, as defined under the terms of the swap agreement, the fund will either (i) pay to the buyer of protection an amount equal to the notional amount of the swap and take delivery of the reference obligation or (ii) pay a net settlement amount in the form of cash or securities equal to the notional amount of the swap less the recovery value of the reference obligation. |
| |
| 2 | The maximum potential amount the fund could be required to pay as a seller of credit protection or receive as a buyer of credit protection if a credit event occurs as defined under the terms of the swap agreement. |
| |
| 3 | Implied credit spreads, represented in absolute terms, utilized in determining the market value as of the period end serve as an indicator of the current status of the payment/performance risk and represent the likelihood of risk of default for the credit derivative.The credit spread of a particular referenced entity reflects the cost of buying/selling protection and may include upfront payments required to be made to enter into the agreement.Wider credit spreads represent a deterioration of the referenced entity’s credit soundness and a greater likelihood of risk of default or other credit event occurring as defined under the terms of the agreement.A credit spread identified as “Defaulted” indicates a credit event has occurred for the referenced entity. |
| |
The fund adopted the Financial Accounting Standards Board (“FASB”) Staff Position No. 133-1 and FIN 45-4, “Disclosures about Credit Derivatives and Certain Guarantees: An Amendment of FASB Statement No. 133 and FASB Interpretation No.45”(the “FSP”).The FSP amends FASB Statement No. 133 (“FAS 133”), “Accounting for Derivative Instruments and Hedging Activities”, and also amends
66
FASB Interpretation No. 45 (“FIN 45”),“Guarantor’s Accounting and Disclosure Requirements for Guarantees, Including Indirect Guarantees of Indebtedness of Others”.The amendments to FAS 133 include required disclosure for (i) the nature and terms of the credit derivative, reasons for entering into the credit derivative, the events or circumstances that would require the seller to perform under the credit derivative, and the current status of the payment/performance risk of the credit derivative, (ii) the maximum potential amount of future payments (undiscounted) the seller could be required to make under the credit derivative, (iii) the fair value of the credit derivative, and (iv) the nature of any recourse provisions and assets held either as collateral or by third parties.The amendments to FIN 45 require additional disclosures about the current status of the payment/performance risk of a guarantee. All changes to accounting policies have been made in accordance with the FSP and incorporated for the current period as part of the Notes to the Statement of Investments and disclosures within this Note.
At July 31, 2009, the cost of investments for federal income tax purposes was $1,512,122,635; accordingly, accumulated net unrealized depreciation on investments was $21,399,182, consisting of $46,386,087 gross unrealized appreciation and $67,785,269 gross unrealized depreciation.
NOTE 5—Subsequent Events Evaluation:
Dreyfus has evaluated the need for disclosures and/or adjustments resulting from subsequent events through September 25, 2009, the date the financial statements were available to be issued. This evaluation did not result in any subsequent events that necessitated disclosures and/or adjustments.
The Fund 67
REPORT OF INDEPENDENT REGISTERED
PUBLIC ACCOUNTING FIRM |
Shareholders and Board of Directors Dreyfus Intermediate Term Income Fund
We have audited the accompanying statement of assets and liabilities, including the statements of investments, financial futures and options written, of Dreyfus Intermediate Term Income Fund (formerly, Dreyfus Premier Intermediate Term Income Fund) (one of the series comprising Dreyfus Investment Grade Funds, Inc.) as of July 31, 2009, and the related statement of operations for the year then ended, the statement of changes in net assets for each of the two years in the period then ended, and financial highlights for each of the periods indicated therein.These financial statements and financial highlights are the responsibility of the Fund’s management. Our responsibility is to express an opinion on these financial statements and financial highlights based on our audits.
We conducted our audits in accordance with the standards of the Public Company Accounting Oversight Board (United States).Those standards require that we plan and perform the audit to obtain reasonable assurance about whether the financial statements and financial highlights are free of material misstatement.We were not engaged to perform an audit of the Fund’s internal control over financial reporting. Our audits included consideration of internal control over financial reporting as a basis for designing audit procedures that are appropriate in the circumstances, but not for the purpose of expressing an opinion on the effectiveness of the Fund’s internal control over financial reporting. Accordingly, we express no such opinion. An audit also includes examining, on a test basis, evidence supporting the amounts and disclosures in the financial statements and financial highlights, assessing the accounting principles used and significant estimates made by management, and evaluating the overall financial statement presentation. Our procedures included confirmation of securities held as of July 31, 2009 by correspondence with the custodian and others. We believe that our audits provide a reasonable basis for our opinion.
In our opinion, the financial statements and financial highlights referred to above present fairly, in all material respects, the financial position of Dreyfus Intermediate Term Income Fund at July 31, 2009, the results of its operations for the year then ended, the changes in its net assets for each of the two years in the period then ended, and the financial highlights for each of the indicated periods, in conformity with U.S. generally accepted accounting principles.
| | New York, New York
September 25, 2009 |
68
IMPORTANT TAX INFORMATION (Unaudited)
For federal tax purposes the fund hereby designates 0.14% of the ordinary dividends paid during the fiscal year ended July 31, 2009 as qualifying for the corporate dividends received deduction. Also certain dividends paid by the fund may be subject to a maximum tax rate of 15%, as provided for by the Jobs and Growth Tax Relief Reconciliation Act of 2003. Of the distributions paid during the fiscal year, $58,658 represents the maximum amount that may be considered qualified dividend income. Shareholders will receive notification in early 2010 of the percentage applicable to the preparation of their 2009 income tax returns. Also, the fund hereby designates 98.43% of ordinary income dividends paid during the fiscal year ended July 31, 2009 as qualifying “interest related dividends”.
The Fund 69
INFORMATION ABOUT THE REVIEW AND APPROVAL OF
THE FUND’S MANAGEMENT AGREEMENT (Unaudited) |
At a meeting of the Board of Directors of the fund held on July 14 and 15, 2009, the Board considered the re-approval for an annual period (through July 29, 2010) of the Management Agreement with Dreyfus for the fund, pursuant to which Dreyfus provides the fund with investment advisory and administrative services.The Board members, none of whom are “interested persons” (as defined in the Investment Company Act of 1940, as amended) of the fund, were assisted in their review by independent legal counsel and met with counsel in executive session separate from representatives of Dreyfus.
Analysis of Nature, Extent and Quality of Services Provided to the Fund. The Board members received a presentation from representatives of Dreyfus regarding services provided to the fund and other funds in the Dreyfus fund complex, and discussed the nature, extent and quality of the services provided to the fund pursuant to its Management Agreement. Dreyfus’ representatives reviewed the fund’s distribution of accounts and the relationships Dreyfus has with various intermediaries and the different needs of each. Dreyfus’ representatives noted the distribution channels for the fund as well as the diversity of distribution among the funds in the Dreyfus fund complex, and Dreyfus’ corresponding need for broad, deep, and diverse resources to be able to provide ongoing shareholder services to each distribution channel, including those of the fund. Dreyfus also provided the number of shareholder accounts in the fund, as well as the fund’s asset size.
The Board members also considered Dreyfus’ research and portfolio management capabilities and that Dreyfus also provides oversight of day-to-day fund operations, including fund accounting and administration and assistance in meeting legal and regulatory requirements. The Board members also considered Dreyfus’ extensive administrative, accounting and compliance infrastructure.The Board also considered Dreyfus’ brokerage policies and practices and the standards applied in seeking best execution.
70
Comparative Analysis of the Fund’s Performance and Management Fee and Expense Ratio. The Board members reviewed the performance of the fund’s Class A Shares and comparisons to a group of retail front-end load intermediate investment-grade debt funds (the “Performance Group”) and to a larger universe of funds, consisting of all retail and institutional intermediate investment grade debt funds (the “Performance Universe”), selected and provided by Lipper, Inc., an independent provider of investment company data.The Board was provided with a description of the methodology Lipper used to select the Performance Group and Performance Universe, as well as the Expense Group and Expense Universe (discussed below). The Board members discussed the results of the comparisons for various periods ended May 31, 2009.The Board members noted that the fund’s total return performance variously was at or below the Performance Group medians for all periods and was below the Performance Universe medians for all periods except one. The Board members noted that the fund’s yield performance was above the Performance Group and Performance Universe medians for all periods except one. Dreyfus representatives noted that the fund’s performance was in the second quartile of its Lipper category for the more recent 3-month and 5-month periods ended May 31, 2009. Representatives of Dreyfus discussed certain factors that affected the fund’s relative performance, including the fund’s consistent investment approach and the impact that the investment environment (as impacted by the housing and credit crises, the Lehman bankruptcy filing, etc.) had on the fund’s investment approach over the last year or more. Dreyfus also provided a comparison of the fund’s total returns to the returns of the fund’s benchmark index for each of the calendar years for the prior ten years.
The Board members also discussed the fund’s management fee and expense ratio and reviewed the range of management fees and expense ratios as compared to a comparable group of funds (the
The Fund 71
INFORMATION ABOUT THE REVIEW AND APPROVAL OF THE
FUND’S MANAGEMENT AGREEMENT (Unaudited) (continued) |
“Expense Group”) and a broader group of funds (the “Expense Universe”), each selected and provided by Lipper. The Board members noted that the fund’s contractual management fee was lower than the Expense Group median, and that the actual management fee and expense ratio were lower than the Expense Group and Expense Universe medians. The Board noted that the fund’s actual management fee and expense ratio were lower due to the undertaking by Dreyfus to waive fees and reimburse expenses.
Representatives of Dreyfus reviewed with the Board members the advisory fees paid by mutual funds managed by Dreyfus or its affiliates with similar investment objectives, policies and strategies, and included within the fund’s Lipper category (the “Similar Funds”), and by other accounts managed by Dreyfus or its affiliates, with similar investment objectives, policies and strategies as the fund (the “Similar Accounts”). Dreyfus representatives explained the nature of the Similar Accounts and the differences, from Dreyfus’ perspective, in providing services to such Similar Accounts as compared to managing and providing services to the fund. Dreyfus’ representatives also reviewed the costs associated with distribution through intermediaries. The Board analyzed differences in fees paid to Dreyfus and discussed the relationship of the fees paid in light of the services provided.The Board members considered the relevance of the fee information provided for the Similar Funds and Similar Accounts to evaluate the appropriateness and reasonableness of the fund’s management fee.
Analysis of Profitability and Economies of Scale. Dreyfus’ representatives reviewed the dollar amount of expenses allocated and profit received by Dreyfus and the method used to determine such expenses and profit.The Board considered information, previously provided and discussed, prepared by an independent consulting firm regarding Dreyfus’ approach to allocating costs to, and determining the profitability of, individual funds and the entire Dreyfus mutual fund complex. The Board members also considered that the methodology had also been reviewed by an independent registered public accounting firm
72
which, like the consultant, found the methodology to be reasonable. The consulting firm also analyzed where any economies of scale might emerge in connection with the management of the fund. The Board members evaluated the profitability analysis in light of the relevant circumstances for the fund and the extent to which economies of scale would be realized if the fund grows and whether fee levels reflect these economies of scale for the benefit of fund investors.The Board members also considered potential benefits to Dreyfus from acting as investment adviser and noted that there were no soft dollar arrangements with respect to trading the fund’s investments.
It was noted that the Board members should consider Dreyfus’ profitability with respect to the fund as part of their evaluation of whether the fees under the Management Agreement bear a reasonable relationship to the mix of services provided by Dreyfus, including the nature, extent and quality of such services and that a discussion of economies of scale is predicated on increasing assets and that, if a fund’s assets had been decreasing, the possibility that Dreyfus may have realized any economies of scale would be less. It also was noted that the profitability percentage for managing the fund was within ranges determined by appropriate court cases to be reasonable given the services rendered and generally superior service levels provided. The Board also noted the fee waiver and expense reimbursement arrangement and its effect on Dreyfus’ profitability.
At the conclusion of these discussions, the Board agreed that it had been furnished with sufficient information to make an informed business decision with respect to continuation of the Management Agreement, with respect to the fund. Based on the discussions and considerations as described above, the Board made the following conclusions and determinations.
- The Board concluded that the nature, extent and quality of the ser- vices provided by Dreyfus are adequate and appropriate.
The Fund 73
INFORMATION ABOUT THE REVIEW AND APPROVAL OF THE
FUND’S MANAGEMENT AGREEMENT (Unaudited) (continued) |
- The Board, noting the fund’s total return performance (including its more recent 3-month and 5-month performance) and the impact that the relatively recent investment environment has had on the fund’s performance, was satisfied with the fund’s yield performance and expressed confidence in the fund’s portfolio management team, which continued to apply a consistent investment strategy.
- The Board concluded that the fee paid by the fund to Dreyfus was reasonable in light of the services provided, comparative performance, expense and management fee information, including Dreyfus’ under- taking to limit the fund’s expense ratio (which reduced the fund’s actual management fee and expense ratio), costs of the services pro- vided and profits to be realized and benefits derived or to be derived by Dreyfus from its relationship with the fund.
- The Board determined that the economies of scale which may accrue to Dreyfus and its affiliates in connection with the manage- ment of the fund had been adequately considered by Dreyfus in connection with the management fee rate charged to the fund and that, to the extent in the future it were determined that material economies of scale had not been shared with the fund, the Board would seek to have those economies of scale shared with the fund.
The Board members considered these conclusions and determinations, along with information received on a routine and regular basis throughout the year, and, without any one factor being dispositive, the Board determined that re-approval of the Management Agreement,with respect to the fund, was in the best interests of the fund and its shareholders.
74

The Fund 75

76

The Fund 77

78
NOTES
For More Information
Telephone Call your financial representative or 1-800-645-6561
Mail The Dreyfus Family of Funds, 144 Glenn Curtiss Boulevard, Uniondale, NY 11556-0144 E-mail Send your request to info@dreyfus.com Internet Information can be viewed online or downloaded at: http://www.dreyfus.com
The fund files its complete schedule of portfolio holdings with the Securities and Exchange Commission (“SEC”) for the first and third quarters of each fiscal year on Form N-Q. The fund’s Forms N-Q are available on the SEC’s website at http://www.sec.gov and may be reviewed and copied at the SEC’s Public Reference Room in Washington, DC. Information on the operation of the Public Reference Room may be obtained by calling 1-800-SEC-0330.
A description of the policies and procedures that the fund uses to determine how to vote proxies relating to portfolio securities, and information regarding how the fund voted these proxies for the most recent 12-month period ended June 30 is available at http://www.dreyfus.com and on the SEC’s website at http://www.sec.gov. The description of the policies and procedures is also available without charge, upon request, by calling 1-800-645-6561.
© 2009 MBSC Securities Corporation

Dreyfus
Short Term Income Fund |
| | ANNUAL REPORT July 31, 2009 |

Save time. Save paper. View your next shareholder report online as soon as it’s available. Log into www.dreyfus.com and sign up for Dreyfus eCommunications. It’s simple and only takes a few minutes.
The views expressed in this report reflect those of the portfolio manager only through the end of the period covered and do not necessarily represent the views of Dreyfus or any other person in the Dreyfus organization. Any such views are subject to change at any time based upon market or other conditions and Dreyfus disclaims any responsibility to update such views.These views may not be relied on as investment advice and, because investment decisions for a Dreyfus fund are based on numerous factors, may not be relied on as an indication of trading intent on behalf of any Dreyfus fund.

| | | Contents |
| |
| |
| | | THE FUND |
| |
|
| 2 | | A Letter from the Chairman and CEO |
| 3 | | Discussion of Fund Performance |
| 6 | | Fund Performance |
| 8 | | Understanding Your Fund’s Expenses |
| 8 | | Comparing Your Fund’s Expenses |
| | | With Those of Other Funds |
| 9 | | Statement of Investments |
| 25 | | Statement of Financial Futures |
| 26 | | Statement of Options Written |
| 27 | | Statement of Assets and Liabilities |
| 28 | | Statement of Operations |
| 29 | | Statement of Changes in Net Assets |
| 31 | | Financial Highlights |
| 34 | | Notes to Financial Statements |
| 49 | | Report of Independent Registered |
| | | Public Accounting Firm |
| 50 | | Important Tax Information |
| 51 | | Information About the Review and Approval |
| | | of the Fund’s Management Agreement |
| 55 | | Board Members Information |
| 57 | | Officers of the Fund |
| |
| | | FOR MORE INFORMATION |
| |
|
| | | Back Cover |
Dreyfus
Short Term Income Fund |

A LETTER FROM THE CHAIRMAN AND CEO
Dear Shareholder:
We are pleased to present this annual report for Dreyfus Short Term Income Fund, covering the 12-month period from August 1, 2008, through July 31, 2009.
The severe recession and banking crisis that dominated the financial markets over much of the past year appear to have eased. Previously frozen credit markets have thawed to an extent, giving businesses improved access to the capital they need to grow. After reaching multi-year lows early in 2009, higher-yielding segments of the bond market staged an impressive rally, while U.S.Treasury securities have experienced significant price volatility since January as a result of recession-related factors and technical supply issues.The U.S. economy remains weak overall, but we have seen encouraging evidence of potential recovery, including signs of healing in the battered housing and manufacturing sectors. Even the unemployment rate, which historically has been a lagging indicator of economic trends, recently showed signs of improvement.
Although these developments give us reasons for optimism, we remain cautious due to the speed and magnitude of the corporate bond market’s 2009 rebound. Indeed, the market’s advance was fueled more by investors’ renewed appetites for risk than improving business fundamentals. We would prefer to see a steadier rise in asset prices supported by more concrete economic data, as the rapid rise increases the possibility that profit-taking could fuel further volatility. In uncertain markets such as this one,even the most seasoned investors can benefit from professional counsel. To determine how your investments should be positioned for any potential challenges and opportunities that lie ahead, we urge you, as always, to talk regularly with your financial advisor.
For information about how the fund performed during the reporting period, as well as market perspectives, we have provided a Discussion of Fund Performance given by the fund’s Portfolio Managers.
Thank you for your continued confidence and support.

Jonathan R. Baum
Chairman and Chief Executive Officer
The Dreyfus Corporation
August 17, 2009 |
2

DISCUSSION OF FUND PERFORMANCE
For the period of August 1, 2008, through July 31, 2009, as provided by Peter Vaream and David Bowser, Portfolio Managers
Fund and Market Performance Overview
For the 12-month period ended July 31, 2009, Dreyfus Short Term Income Fund’s Class B shares produced a total return of 3.96%, Class D shares produced a total return of 4.66% and Class P shares produced a total return of 4.66%.1 In comparison, the fund’s benchmark, the Merrill Lynch 1-5 Year Corporate/Government Index (the “Index”), achieved a total return of 5.56% for the same period.2
The U.S. bond market encountered extreme volatility in the fall of 2008 due to a global financial crisis and recession, but market declines early in the reporting period were offset by a sustained rally in 2009. The fund produced lower returns than its benchmark, as better relative performance during the rally was not enough to fully offset earlier weakness among corporate bonds and mortgage-backed securities.
The Fund’s Investment Approach
The fund seeks to maximize total returns consisting of capital appreciation and current income.To pursue this goal, the fund invests at least 80% of its assets in fixed-income securities of U.S. or foreign issuers rated investment grade or the unrated equivalent as determined by Dreyfus. This may include U.S. government bonds and notes, corporate bonds, municipal bonds, convertible securities, preferred stocks, inflation-indexed securities, asset-backed securities, mortgage-related securities (including CMOs) and foreign bonds. For additional yield, the fund may invest up to 20% of its assets in fixed-income securities rated below investment grade (“high yield” or “junk” bonds). Typically, the fund’s portfolio can be expected to have an average effective maturity and an average effective duration of three years or less.
2009 Market Rally Erased Earlier Losses
The reporting period began in the midst of a global banking crisis that produced steep declines among higher yielding bonds, including mort-
The Fund 3
| DISCUSSION OF FUND PERFORMANCE (continued) |
gage-backed, asset-backed and corporate securities. In contrast, U.S. Treasury securities rallied strongly amid a “flight to quality,” causing their yields to fall to unprecedented low levels. Meanwhile, slumping housing markets, rising unemployment and deteriorating consumer confidence led to the longest and deepest recession since the 1930s.
The Federal Reserve Board (the “Fed”) and U.S. government responded aggressively to the downturn. Government officials rescued a number of struggling corporations, and Congress followed up with the $787 billion American Recovery and Reinvestment Act of 2009.The Fed injected massive amounts of liquidity into the banking system and purchased mortgage- and asset-backed debt through unprecedented programs such as the Term Asset-Backed Securities Loan Facility (TALF). In addition, the Fed completed a series of interest-rate reductions by cutting its target for the overnight federal funds rate to an all-time low of 0% to 0.25% by the end of 2008.
As it became clearer in March 2009 that these measures had helped to avert a collapse of the U.S. banking system, investor sentiment began to improve to an extent. Investors capitalized on attractive valuations among higher yielding bonds, sparking springtime rallies that were particularly impressive for investment-grade and high yield corporate bonds. Mortgage-backed securities also rebounded, in part due to massive purchases by the Fed. Conversely, U.S.Treasury securities gave back some of their earlier gains.
Sector Allocation Strategy Produced Mixed Results
The fund began the reporting period with underweighted exposure to U.S. Treasury securities and overweight positions in higher yielding market sectors, including investment-grade corporate bonds and mortgage-backed securities.These higher yielding positions bore the brunt of selling pressure in 2008 as investors deleveraged their portfolios. Although the fund’s investment-grade corporate bond holdings were broadly diversified across industry groups, weakness was especially pronounced among bonds issued by financial companies at the center of the banking crisis.
4
However, higher yielding bonds led the 2009 market rally. Investment-grade corporate securities with BBB ratings fared particularly well, while our focus on 15-year current-coupon mortgages issued by U.S. government agencies benefited from the Fed’s repurchases of mortgage-backed securities.We also maintained a modest position in carefully selected high yield corporate bonds, which are not part of the benchmark but ranked among the market’s better performers over the final five months of the reporting period.
Our interest rate strategies focused primarily on capturing the benefits of falling interest rates for short-term bonds during the flight to quality. Although this strategy proved effective for the fund’s holdings of U.S. government securities, volatility among corporate bonds largely masked the strategy’s impact on the fund’s overall performance.
Maintaining a Disciplined Approach to Security Selection
As of the reporting period’s end, we have maintained the fund’s sector allocation strategy, as we believe that higher yielding bonds have room for further gains. However, we are aware that the bulk of the bond market rally probably is behind us, and we expect the Fed to pare back its remedial programs as the credit markets and U.S. economy recover. Therefore, we believe that security selection will become a more critical determinant of fund performance over the foreseeable future, an environment to which our relative value-oriented approach may be particularly well suited.
August 17, 2009
| 1 | Total return includes reinvestment of dividends and any capital gains paid, and does not take into consideration the applicable contingent deferred sales charges imposed on redemptions in the case of Class B shares. Had these charges been reflected, returns would have been lower. Past performance is no guarantee of future results. Share price, yield and investment return fluctuate such that upon redemption, fund shares may be worth more or less than their original cost. |
| |
| 2 | SOURCE: LIPPER INC. — Reflects reinvestment of dividends and, where applicable, capital gain distributions.The Merrill Lynch 1-5Year Corporate/Government Index is a market value- weighted index that tracks the performance of publicly placed, non-convertible, fixed-rate, coupon- bearing, investment-grade U.S. domestic debt. Maturities of the securities range from one to five years. |
| |
The Fund 5
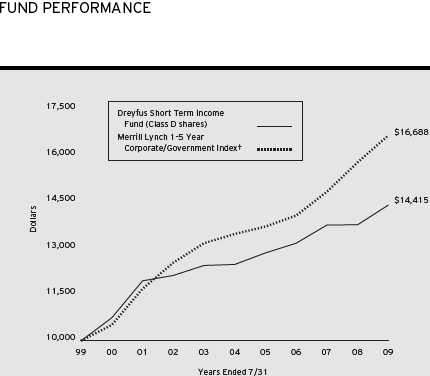
Comparison of change in value of $10,000 investment in Dreyfus Short Term Income Fund Class D shares and the Merrill Lynch 1-5 Year Corporate/Government Index
† Source: Lipper Inc.
Past performance is not predictive of future performance.
The above graph compares a $10,000 investment made in Class D shares of Dreyfus Short Term Income Fund on 7/31/99 to a $10,000 investment made in the Merrill Lynch 1-5Year Corporate/Government Index (the “Index”) on that date.All dividends and capital gain distributions are reinvested. Performance for Class B and Class P shares will vary from the performance of Class D shares shown above due to differences in charges and expenses.
The fund invests primarily in debt securities and securities with debt-like characteristics of domestic and foreign issuers and maintains an average effective maturity and an average effective duration of three years or less.The Index is an unmanaged performance benchmark including U.S. government and fixed-coupon domestic investment-grade corporate bonds with maturities greater than or equal to one year and less than five years. Unlike a mutual fund, the Index is not subject to charges, fees and other expenses. Investors cannot invest directly in any index. Further information relating to fund performance, including expense reimbursements, if applicable, is contained in the Financial Highlights section of the prospectus and elsewhere in this report.
6
| Average Annual Total Returns as of 7/31/09 | | | | | | |
| Inception |
| | | Date | | 1 Year | | 5 Years | | 10 Years |
| |
| |
| |
| |
|
| Class B shares | | | | | | | | |
| with applicable redemption charge † | | 11/1/02 | | –0.04% | | 1.88% | | 3.57%††,††† |
| without redemption | | 11/1/02 | | 3.96% | | 2.23% | | 3.57%††,††† |
| Class D shares | | 8/18/92 | | 4.66% | | 2.91% | | 3.72% |
| Class P shares | | 11/1/02 | | 4.66% | | 2.92% | | 3.75%††† |
Past performance is not predictive of future performance.The fund’s performance shown in the graph and table does not reflect the deduction of taxes that a shareholder would pay on fund distributions or the redemption of fund shares.
The Fund 7
UNDERSTANDING YOUR FUND’S EXPENSES (Unaudited)
As a mutual fund investor, you pay ongoing expenses, such as management fees and other expenses. Using the information below, you can estimate how these expenses affect your investment and compare them with the expenses of other funds.You also may pay one-time transaction expenses, including sales charges (loads) and redemption fees, which are not shown in this section and would have resulted in higher total expenses. For more information, see your fund’s prospectus or talk to your financial adviser.
Review your fund’s expenses
The table below shows the expenses you would have paid on a $1,000 investment in Dreyfus Short Term Income Fund from February 1, 2009 to July 31, 2009. It also shows how much a $1,000 investment would be worth at the close of the period, assuming actual returns and expenses.
Expenses and Value of a $1,000 Investment assuming actual returns for the six months ended July 31, 2009
| | | Class B | | Class D | | Class P |
| |
| |
| |
|
| Expenses paid per $1,000† | | $ 8.40 | | $ 4.75 | | $ 4.70 |
| Ending value (after expenses) | | $1,078.90 | | $1,081.80 | | $1,081.70 |
COMPARING YOUR FUND’S EXPENSES WITH THOSE OF OTHER FUNDS (Unaudited)
Using the SEC’s method to compare expenses
The Securities and Exchange Commission (SEC) has established guidelines to help investors assess fund expenses. Per these guidelines, the table below shows your fund’s expenses based on a $1,000 investment, assuming a hypothetical 5% annualized return. You can use this information to compare the ongoing expenses (but not transaction expenses or total cost) of investing in the fund with those of other funds.All mutual fund shareholder reports will provide this information to help you make this comparison. Please note that you cannot use this information to estimate your actual ending account balance and expenses paid during the period.
Expenses and Value of a $1,000 Investment assuming a hypothetical 5% annualized return for the six months ended July 31, 2009
| | | Class B | | Class D | | Class P |
| |
| |
| |
|
| Expenses paid per $1,000† | | $ 8.15 | | $ 4.61 | | $ 4.56 |
| Ending value (after expenses) | | $1,016.71 | | $1,020.23 | | $1,020.28 |
† Expenses are equal to the fund’s annualized expense ratio of 1.63% for Class B, .92% for Class D, and .91%
for Class P, multiplied by the average account value over the period, multiplied by 181/365 (to reflect the one-half
year period). |
8
| STATEMENT OF INVESTMENTS | | | | | | | | |
| July 31, 2009 | | | | | | | | | | |
| |
| |
| |
| |
| |
|
| |
| |
| |
| | | Coupon | | Maturity | | Principal | | | | |
| Bonds and Notes—92.2% | | Rate (%) | | Date | | Amount ($) | | | | Value ($) |
| |
| |
| |
| |
| |
|
| Advertising—.0% | | | | | | | | | | |
| Lamar Media, | | | | | | | | | | |
| Gtd. Notes | | 6.63 | | 8/15/15 | | 89,000 | | | | 78,765 |
| Aerospace & Defense—.2% | | | | | | | | | | |
| L-3 Communications, | | | | | | | | | | |
| Gtd. Notes, Ser. B | | 6.38 | | 10/15/15 | | 475,000 | | | | 458,375 |
| Agriculture—.8% | | | | | | | | | | |
| Altria Group, | | | | | | | | | | |
| Gtd. Notes | | 8.50 | | 11/10/13 | | 650,000 | | | | 751,555 |
| Philip Morris International, | | | | | | | | | | |
| Sr. Unscd. Notes | | 4.88 | | 5/16/13 | | 775,000 | | | | 819,487 |
| | | | | | | | | | | 1,571,042 |
| Asset-Backed Ctfs./ | | | | | | | | | | |
| Auto Receivables—2.8% | | | | | | | | | | |
| Americredit Automobile Receivables | | | | | | | | | | |
| Trust, Ser. 2008-AF, Cl. A2A | | 4.47 | | 1/12/12 | | 193,014 | | | | 194,085 |
| Americredit Automobile Receivables | | | | | | | | | | |
| Trust, Ser. 2007-CM, Cl. A3A | | 5.42 | | 5/7/12 | | 822,732 | | | | 836,139 |
| Americredit Prime Automobile | | | | | | | | | | |
| Receivables, Ser. 2007-1, Cl. E | | 6.96 | | 3/8/16 | | 389,146 | | a | | 234,327 |
| Capital Auto Receivables Asset | | | | | | | | | | |
| Trust, Ser. 2006-2, Cl. B | | 5.07 | | 12/15/11 | | 485,000 | | | | 485,478 |
| Capital One Auto Finance Trust, | | | | | | | | | | |
| Ser. 2007-C, Cl. A3A | | 5.13 | | 4/16/12 | | 883,474 | | | | 890,374 |
| Ford Credit Auto Owner Trust, | | | | | | | | | | |
| Ser. 2006-C, Cl. B | | 5.30 | | 6/15/12 | | 1,875,000 | | | | 1,875,943 |
| Ford Credit Auto Owner Trust, | | | | | | | | | | |
| Ser. 2007-A, Cl. D | | 7.05 | | 12/15/13 | | 300,000 | | a | | 185,422 |
| Hyundai Auto Receivables Trust, | | | | | | | | | | |
| Ser. 2006-B, Cl. C | | 5.25 | | 5/15/13 | | 1,060,445 | | | | 1,057,590 |
| | | | | | | | | | | 5,759,358 |
| Asset-Backed Ctfs./Credit Cards—1.1% | | | | | | | | |
| Advanta Business Card Master | | | | | | | | | | |
| Trust, Ser. 2007-A1, Cl. A | | 0.34 | | 1/20/15 | | 118,638 | | b | | 109,192 |
| Advanta Business Card Master | | | | | | | | | | |
| Trust, Ser. 2005-A2, Cl. A2 | | 0.42 | | 5/20/13 | | 336,142 | | b | | 309,376 |
| Advanta Business Card Master | | | | | | | | | | |
| Trust, Ser. 2006-A3, Cl. A3 | | 5.30 | | 5/21/12 | | 270,232 | | | | 254,121 |
| Capital One Multi-Asset Execution | | | | | | | | | | |
| Trust, Ser. 2004-C4, Cl. C4 | | 0.94 | | 6/15/12 | | 620,000 | | | | 619,138 |
The Fund 9
| STATEMENT OF INVESTMENTS (continued) |
| | | Coupon | | Maturity | | Principal | | | | |
| Bonds and Notes (continued) | | Rate (%) | | Date | | Amount ($) | | | | Value ($) |
| |
| |
| |
| |
| |
|
| Asset-Backed Ctfs./ | | | | | | | | | | |
| Credit Cards (continued) | | | | | | | | | | |
| Capital One Multi-Asset Execution | | | | | | | | | | |
| Trust, Ser. 2004-B6, Cl. B6 | | 4.15 | | 7/16/12 | | 995,000 | | | | 1,001,263 |
| | | | | | | | | | | 2,293,090 |
| Asset-Backed Ctfs./ | | | | | | | | | | |
| Home Equity Loans—2.0% | | | | | | | | | | |
| Ameriquest Mortgage Securities, | | | | | | | | | | |
| Ser. 2003-11, Cl. AF6 | | 5.14 | | 1/25/34 | | 1,076,610 | | b | | 960,469 |
| Bayview Financial Acquisition | | | | | | | | | | |
| Trust, Ser. 2005-B, Cl. 1A6 | | 5.21 | | 4/28/39 | | 1,782,635 | | b | | 1,301,511 |
| Citigroup Mortgage Loan Trust, | | | | | | | | | | |
| Ser. 2005-WF2, Cl. AF7 | | 5.25 | | 8/25/35 | | 1,939,734 | | b | | 1,275,958 |
| Green Tree Financial, | | | | | | | | | | |
| Ser. 1994-7, Cl. M1 | | 9.25 | | 3/15/20 | | 219,991 | | | | 210,910 |
| Residential Asset Mortgage | | | | | | | | | | |
| Products, Ser. 2003-RS9, | | | | | | | | | | |
| Cl. MI1 | | 5.80 | | 10/25/33 | | 511,368 | | b | | 240,898 |
| Residential Funding Mortgage | | | | | | | | | | |
| Securities II, Ser. 2005-HI3, | | | | | | | | | | |
| Cl. A2 | | 5.09 | | 9/25/35 | | 78,181 | | | | 76,486 |
| | | | | | | | | | | 4,066,232 |
| Automobiles—.3% | | | | | | | | | | |
| DaimlerChrysler, | | | | | | | | | | |
| Gtd. Notes | | 7.20 | | 9/1/09 | | 250,000 | | | | 250,677 |
| Goodyear Tire & Rubber, | | | | | | | | | | |
| Gtd. Notes | | 8.63 | | 12/1/11 | | 460,000 | | c | | 468,050 |
| | | | | | | | | | | 718,727 |
| Banks—7.1% | | | | | | | | | | |
| Barclays Bank, | | | | | | | | | | |
| Sr. Notes | | 5.20 | | 7/10/14 | | 780,000 | | | | 809,801 |
| Barclays Bank, | | | | | | | | | | |
| Sr. Unscd. Notes | | 6.75 | | 5/22/19 | | 700,000 | | | | 761,353 |
| Barclays Bank, | | | | | | | | | | |
| Sub. Notes | | 10.18 | | 6/12/21 | | 232,000 | | a | | 272,955 |
| Charter One Bank, | | | | | | | | | | |
| Sr. Unscd. Notes | | 5.50 | | 4/26/11 | | 1,435,000 | | | | 1,457,883 |
| Citigroup, | | | | | | | | | | |
| Sr. Unscd. Notes | | 5.50 | | 4/11/13 | | 2,250,000 | | | | 2,225,374 |
| JPMorgan Chase & Co., | | | | | | | | | | |
| Sr. Unscd. Notes | | 4.85 | | 6/16/11 | | 900,000 | | | | 940,853 |
10
| | | Coupon | | Maturity | | Principal | | | | |
| Bonds and Notes (continued) | | Rate (%) | | Date | | Amount ($) | | | | Value ($) |
| |
| |
| |
| |
| |
|
| Banks (continued) | | | | | | | | | | |
| JPMorgan Chase & Co., | | | | | | | | | | |
| Sr. Unscd. Notes | | 5.38 | | 1/15/14 | | 2,385,000 | | | | 2,494,567 |
| M&T Bank, | | | | | | | | | | |
| Sr. Unscd. Bonds | | 5.38 | | 5/24/12 | | 705,000 | | c | | 698,635 |
| Morgan Stanley, | | | | | | | | | | |
| Sr. Unscd. Notes | | 6.00 | | 4/28/15 | | 300,000 | | | | 310,950 |
| Northern Trust, | | | | | | | | | | |
| Sr. Unscd. Notes | | 5.30 | | 8/29/11 | | 575,000 | | | | 614,539 |
| PNC Funding, | | | | | | | | | | |
| Gtd. Notes | | 5.40 | | 6/10/14 | | 760,000 | | | | 784,978 |
| Sovereign Bancorp, | | | | | | | | | | |
| Sr. Unscd. Notes | | 4.80 | | 9/1/10 | | 1,075,000 | | b | | 1,052,488 |
| SunTrust Preferred Capital I, | | | | | | | | | | |
| Bank Gtd. Notes | | 5.85 | | 12/31/49 | | 89,000 | | b | | 51,644 |
| Wells Fargo Bank, | | | | | | | | | | |
| Sub. Notes, Ser. AI | | 7.55 | | 6/21/10 | | 705,000 | | | | 743,535 |
| Wells Fargo Capital XIII, | | | | | | | | | | |
| Gtd. Secs. | | 7.70 | | 12/29/49 | | 1,470,000 | | b | | 1,279,869 |
| | | | | | | | | | | 14,499,424 |
| Building & Construction—.2% | | | | | | | | | | |
| Masco, | | | | | | | | | | |
| Sr. Unscd. Notes | | 0.94 | | 3/12/10 | | 390,000 | | b | | 380,672 |
| Chemicals—.8% | | | | | | | | | | |
| Dow Chemical, | | | | | | | | | | |
| Sr. Unscd. Notes | | 8.55 | | 5/15/19 | | 450,000 | | | | 494,524 |
| E.I. Du Pont de Nemours, | | | | | | | | | | |
| Sr. Unscd. Notes | | 5.88 | | 1/15/14 | | 1,100,000 | | | | 1,216,897 |
| | | | | | | | | | | 1,711,421 |
| Commercial & Professional | | | | | | | | | | |
| Services—.6% | | | | | | | | | | |
| Aramark, | | | | | | | | | | |
| Gtd. Notes | | 8.50 | | 2/1/15 | | 456,000 | | c | | 461,700 |
| ERAC USA Finance, | | | | | | | | | | |
| Sr. Unscd. Bonds | | 5.60 | | 5/1/15 | | 720,000 | | a | | 665,816 |
| | | | | | | | | | | 1,127,516 |
| Commercial Mortgage | | | | | | | | | | |
| Pass-Through Ctfs.—9.2% | | | | | | | | | | |
| Banc of America Commercial | | | | | | | | | | |
| Mortgage, Ser. 2005-6, Cl. A1 | | 5.00 | | 9/10/47 | | 802,591 | | | | 809,357 |
The Fund 11
| STATEMENT OF INVESTMENTS (continued) |
| | | Coupon | | Maturity | | Principal | | | | |
| Bonds and Notes (continued) | | Rate (%) | | Date | | Amount ($) | | | | Value ($) |
| |
| |
| |
| |
| |
|
| Commercial Mortgage | | | | | | | | | | |
| Pass-Through Ctfs. (continued) | | | | | | | | | | |
| Bayview Commercial Asset Trust, | | | | | | | | | | |
| Ser. 2006-SP1, Cl. A1 | | 0.56 | | 4/25/36 | | 107,749 | | a,b | | 64,455 |
| Bayview Commercial Asset Trust, | | | | | | | | | | |
| Ser. 2004-1, Cl. A | | 0.65 | | 4/25/34 | | 254,488 | | a,b | | 178,980 |
| Bayview Commercial Asset Trust, | | | | | | | | | | |
| Ser. 2004-1, Cl. M2 | | 1.49 | | 4/25/34 | | 351,246 | | a,b | | 169,752 |
| Bayview Commercial Asset Trust, | | | | | | | | | | |
| Ser. 2006-1A, Cl. B2 | | 1.99 | | 4/25/36 | | 133,113 | | a,b | | 27,123 |
| Bayview Commercial Asset Trust, | | | | | | | | | | |
| Ser. 2005-4A, Cl. B2 | | 2.69 | | 1/25/36 | | 419,061 | | a,b | | 100,755 |
| Bayview Commercial Asset Trust, | | | | | | | | | | |
| Ser. 2005-3A, Cl. B3 | | 3.29 | | 11/25/35 | | 151,285 | | a,b | | 40,195 |
| Bear Stearns Commercial Mortgage | | | | | | | | | | |
| Securities, Ser. 2006-PW12, | | | | | | | | | | |
| Cl. AAB | | 5.69 | | 9/11/38 | | 375,000 | | b | | 382,230 |
| Citigroup Commercial Mortgage | | | | | | | | | | |
| Trust, Ser. 2006-C5, Cl. A1 | | 5.27 | | 10/15/49 | | 898,758 | | | | 911,817 |
| Credit Suisse Mortgage Capital | | | | | | | | | | |
| Certificates, Ser. 2006-C1, Cl. A2 | | 5.51 | | 2/15/39 | | 1,200,000 | | | | 1,213,711 |
| Crown Castle Towers, | | | | | | | | | | |
| Ser. 2006-1A, Cl. AFX | | 5.24 | | 11/15/36 | | 1,300,000 | | a | | 1,274,000 |
| Crown Castle Towers, | | | | | | | | | | |
| Ser. 2006-1A, Cl. B | | 5.36 | | 11/15/36 | | 460,000 | | a | | 450,800 |
| Crown Castle Towers, | | | | | | | | | | |
| Ser. 2006-1A, Cl. C | | 5.47 | | 11/15/36 | | 1,035,000 | | a | | 1,014,300 |
| Crown Castle Towers, | | | | | | | | | | |
| Ser. 2005-1A, Cl. D | | 5.61 | | 6/15/35 | | 1,920,000 | | a | | 1,900,800 |
| CS First Boston Mortgage | | | | | | | | | | |
| Securities, Ser. 2005-C4, Cl. A2 | | 5.02 | | 8/15/38 | | 1,250,000 | | | | 1,259,315 |
| First Union National Bank | | | | | | | | | | |
| Commercial Mortgage Trust, | | | | | | | | | | |
| Ser. 2001-C2, Cl. A2 | | 6.66 | | 1/12/43 | | 392,945 | | | | 408,486 |
| Goldman Sachs Mortgage Securities | | | | | | | | | | |
| Corporation II, Ser. 2007-EOP, Cl. B | | 0.55 | | 3/6/20 | | 1,630,000 | | a,b | | 1,200,258 |
| Goldman Sachs Mortgage Securities | | | | | | | | | | |
| Corporation II, Ser. 2007-EOP, Cl. F | | 0.78 | | 3/6/20 | | 730,000 | | a,b | | 509,973 |
| Goldman Sachs Mortgage Securities | | | | | | | | | | |
| Corporation II, Ser. 2007-EOP, Cl. K | | 1.35 | | 3/6/20 | | 350,000 | | a,b | | 236,252 |
12
| | | Coupon | | Maturity | | Principal | | | | |
| Bonds and Notes (continued) | | Rate (%) | | Date | | Amount ($) | | | | Value ($) |
| |
| |
| |
| |
| |
|
| Commercial Mortgage | | | | | | | | | | |
| Pass-Through Ctfs. (continued) | | | | | | | | | | |
| JP Morgan Chase Commercial | | | | | | | | | | |
| Mortgage Securities, | | | | | | | | | | |
| Ser. 2005-LDP5, Cl. A1 | | 5.04 | | 12/15/44 | | 1,520,488 | | | | 1,531,355 |
| JP Morgan Chase Commercial | | | | | | | | | | |
| Mortgage Securities, | | | | | | | | | | |
| Ser. 2001-CIBC, Cl. D | | 6.75 | | 3/15/33 | | 955,000 | | | | 912,563 |
| Merrill Lynch Mortgage Trust, | | | | | | | | | | |
| Ser. 2005-CKI1, Cl. A2 | | 5.22 | | 11/12/37 | | 350,000 | | b | | 355,460 |
| Morgan Stanley Capital I, | | | | | | | | | | |
| Ser. 2005-HQ5, Cl. A2 | | 4.81 | | 1/14/42 | | 704,187 | | | | 710,361 |
| Morgan Stanley Dean Witter Capital | | | | | | | | | | |
| I, Ser. 2001-TOP3, Cl. A4 | | 6.39 | | 7/15/33 | | 1,353,671 | | | | 1,409,255 |
| SBA CMBS Trust, | | | | | | | | | | |
| Ser. 2006-1A, Cl. A | | 5.31 | | 11/15/36 | | 1,695,000 | | a | | 1,678,050 |
| | | | | | | | | | | 18,749,603 |
| Computers—.4% | | | | | | | | | | |
| Hewlett-Packard, | | | | | | | | | | |
| Sr. Unscd. Notes | | 2.25 | | 5/27/11 | | 405,000 | | | | 411,124 |
| Hewlett-Parkard, | | | | | | | | | | |
| Notes | | 2.95 | | 8/15/12 | | 410,000 | | | | 420,323 |
| | | | | | | | | | | 831,447 |
| Diversified Financial | | | | | | | | | | |
| Services—5.4% | | | | | | | | | | |
| American Express Credit, | | | | | | | | | | |
| Sr. Unscd. Notes | | 1.69 | | 5/27/10 | | 530,000 | | b | | 527,363 |
| American Express, | | | | | | | | | | |
| Sr. Unscd. Notes | | 7.25 | | 5/20/14 | | 840,000 | | | | 908,959 |
| Ameriprise Financial, | | | | | | | | | | |
| Jr. Sub. Notes | | 7.52 | | 6/1/66 | | 212,000 | | b | | 163,441 |
| Amvescap, | | | | | | | | | | |
| Gtd. Notes | | 5.38 | | 2/27/13 | | 380,000 | | | | 362,047 |
| Capital One Bank USA, | | | | | | | | | | |
| Sub. Notes | | 8.80 | | 7/15/19 | | 765,000 | | | | 831,191 |
| Capmark Financial Group, | | | | | | | | | | |
| Gtd. Notes | | 7.88 | | 5/10/12 | | 430,000 | | b | | 104,235 |
| Caterpillar Financial Services, | | | | | | | | | | |
| Sr. Unscd. Notes | | 5.13 | | 10/12/11 | | 765,000 | | | | 803,987 |
The Fund 13
| STATEMENT OF INVESTMENTS (continued) |
| | | Coupon | | Maturity | | Principal | | | | |
| Bonds and Notes (continued) | | Rate (%) | | Date | | Amount ($) | | | | Value ($) |
| |
| |
| |
| |
| |
|
| Diversified Financial | | | | | | | | | | |
| Services (continued) | | | | | | | | | | |
| Caterpillar Financial Services, | | | | | | | | | | |
| Sr. Unscd. Notes | | 6.13 | | 2/17/14 | | 725,000 | | | | 792,038 |
| Countrywide Home Loans, | | | | | | | | | | |
| Gtd. Notes, Ser. L | | 4.00 | | 3/22/11 | | 280,000 | | | | 281,261 |
| Credit Suisse Guernsey, | | | | | | | | | | |
| Jr. Sub. Notes | | 5.86 | | 12/29/49 | | 660,000 | | b | | 442,822 |
| Credit Suisse USA, | | | | | | | | | | |
| Gtd. Notes | | 5.50 | | 8/16/11 | | 1,255,000 | | | | 1,339,455 |
| Fresenius US Finance II, | | | | | | | | | | |
| Gtd. Notes | | 9.00 | | 7/15/15 | | 460,000 | | a | | 499,100 |
| General Electric Capital, | | | | | | | | | | |
| Sr. Unscd. Notes | | 4.80 | | 5/1/13 | | 1,155,000 | | c | | 1,178,437 |
| General Electric Capital, | | | | | | | | | | |
| Sr. Unscd. Notes, Ser. A | | 5.45 | | 1/15/13 | | 900,000 | | c | | 938,975 |
| General Electric Capital, | | | | | | | | | | |
| Sr. Unscd. Notes | | 5.90 | | 5/13/14 | | 245,000 | | | | 260,830 |
| Goldman Sachs Capital II, | | | | | | | | | | |
| Gtd. Bonds | | 5.79 | | 12/29/49 | | 150,000 | | b | | 107,250 |
| HSBC Finance Capital Trust IX, | | | | | | | | | | |
| Gtd. Notes | | 5.91 | | 11/30/35 | | 970,000 | | b | | 543,200 |
| Hutchison Whampoa International, | | | | | | | | | | |
| Gtd. Notes | | 7.63 | | 4/9/19 | | 220,000 | | a | | 252,539 |
| Jefferies Group, | | | | | | | | | | |
| Sr. Unscd. Notes | | 7.75 | | 3/15/12 | | 368,000 | | | | 378,329 |
| Leucadia National, | | | | | | | | | | |
| Sr. Unscd. Notes | | 7.00 | | 8/15/13 | | 270,000 | | | | 259,875 |
| | | | | | | | | | | 10,975,334 |
| Electric Utilities—5.6% | | | | | | | | | | |
| AES, | | | | | | | | | | |
| Sr. Unscd. Notes | | 7.75 | | 10/15/15 | | 470,000 | | | | 457,075 |
| Appalachian Power, | | | | | | | | | | |
| Sr. Unscd. Notes, Ser. O | | 5.65 | | 8/15/12 | | 315,000 | | | | 331,303 |
| Columbus Southern Power, | | | | | | | | | | |
| Sr. Unscd. Notes | | 6.05 | | 5/1/18 | | 150,000 | | | | 158,568 |
| CommonWealth Edison, | | | | | | | | | | |
| First Mortgage Bonds, Ser. 102 | | 4.74 | | 8/15/10 | | 330,000 | | | | 336,931 |
| Consolidated Edison of New York, | | | | | | | | | | |
| Sr. Unscd. Debs., Ser. 08-A | | 5.85 | | 4/1/18 | | 800,000 | | | | 866,170 |
14
| | | Coupon | | Maturity | | Principal | | | | |
| Bonds and Notes (continued) | | Rate (%) | | Date | | Amount ($) | | | | Value ($) |
| |
| |
| |
| |
| |
|
| Electric Utilities (continued) | | | | | | | | | | |
| Consumers Energy, | | | | | | | | | | |
| First Mortgage Bonds | | 6.70 | | 9/15/19 | | 410,000 | | c | | 464,904 |
| Enel Finance International, | | | | | | | | | | |
| Gtd. Notes | | 5.70 | | 1/15/13 | | 250,000 | | a | | 266,993 |
| FirstEnergy, | | | | | | | | | | |
| Sr. Unscd. Notes, Ser. B | | 6.45 | | 11/15/11 | | 1,090,000 | | | | 1,163,341 |
| FPL Group Capital, | | | | | | | | | | |
| Gtd. Debs. | | 5.63 | | 9/1/11 | | 1,520,000 | | | | 1,626,978 |
| National Grid, | | | | | | | | | | |
| Sr. Unscd. Notes | | 6.30 | | 8/1/16 | | 724,000 | | | | 764,696 |
| Nevada Power, | | | | | | | | | | |
| Mortgage Notes | | 7.13 | | 3/15/19 | | 745,000 | | | | 835,801 |
| NiSource Finance, | | | | | | | | | | |
| Gtd. Notes | | 1.23 | | 11/23/09 | | 641,000 | | b | | 637,001 |
| NiSource Finance, | | | | | | | | | | |
| Gtd. Notes | | 6.15 | | 3/1/13 | | 545,000 | | | | 545,219 |
| PacifiCorp, | | | | | | | | | | |
| First Mortgage Bonds | | 6.90 | | 11/15/11 | | 2,265,000 | | | | 2,507,939 |
| Southern, | | | | | | | | | | |
| Sr. Unscd. Notes, Ser. A | | 5.30 | | 1/15/12 | | 362,000 | | c | | 385,681 |
| | | | | | | | | | | 11,348,600 |
| Environmental Control—1.1% | | | | | | | | | | |
| Allied Waste North America, | | | | | | | | | | |
| Sr. Unscd. Notes, Ser. B | | 7.13 | | 5/15/16 | | 210,000 | | | | 217,115 |
| Allied Waste North America, | | | | | | | | | | |
| Sr. Unscd. Notes | | 7.25 | | 3/15/15 | | 310,000 | | | | 321,218 |
| Veolia Environnement, | | | | | | | | | | |
| Sr. Unscd. Notes | | 5.25 | | 6/3/13 | | 920,000 | | | | 957,873 |
| Waste Management, | | | | | | | | | | |
| Gtd. Notes | | 6.38 | | 3/11/15 | | 725,000 | | | | 767,169 |
| | | | | | | | | | | 2,263,375 |
| Food & Beverages—3.4% | | | | | | | | | | |
| Anheuser-Busch InBev Worldwide, | | | | | | | | | | |
| Gtd. Notes | | 7.20 | | 1/15/14 | | 865,000 | | a,c | | 962,332 |
| Bottling Group, | | | | | | | | | | |
| Gtd. Notes | | 6.95 | | 3/15/14 | | 640,000 | | | | 744,040 |
| Cola-Cola, | | | | | | | | | | |
| Sr. Unscd. Notes | | 3.63 | | 3/15/14 | | 725,000 | | | | 747,990 |
The Fund 15
| STATEMENT OF INVESTMENTS (continued) |
| | | Coupon | | Maturity | | Principal | | | | |
| Bonds and Notes (continued) | | Rate (%) | | Date | | Amount ($) | | | | Value ($) |
| |
| |
| |
| |
| |
|
| Food & Beverages (continued) | | | | | | | | | | |
| Delhaize Group, | | | | | | | | | | |
| Sr. Unscd. Notes | | 6.50 | | 6/15/17 | | 185,000 | | | | 195,685 |
| Diageo Capital, | | | | | | | | | | |
| Gtd. Notes | | 7.38 | | 1/15/14 | | 975,000 | | | | 1,121,095 |
| Kraft Foods, | | | | | | | | | | |
| Sr. Unscd. Notes | | 6.00 | | 2/11/13 | | 145,000 | | | | 157,082 |
| Kroger, | | | | | | | | | | |
| Gtd. Notes | | 6.40 | | 8/15/17 | | 270,000 | | | | 295,205 |
| Kroger, | | | | | | | | | | |
| Gtd. Notes | | 6.75 | | 4/15/12 | | 430,000 | | | | 470,006 |
| PepsiAmericas, | | | | | | | | | | |
| Notes | | 4.38 | | 2/15/14 | | 730,000 | | c | | 752,778 |
| Safeway, | | | | | | | | | | |
| Sr. Unscd. Notes | | 6.25 | | 3/15/14 | | 705,000 | | | | 773,219 |
| Stater Brothers Holdings, | | | | | | | | | | |
| Gtd. Notes | | 7.75 | | 4/15/15 | | 116,000 | | | | 112,520 |
| Stater Brothers Holdings, | | | | | | | | | | |
| Gtd. Notes | | 8.13 | | 6/15/12 | | 131,000 | | | | 132,965 |
| SUPERVALU, | | | | | | | | | | |
| Sr. Unscd. Bonds | | 7.50 | | 5/15/12 | | 175,000 | | | | 177,188 |
| SUPERVALU, | | | | | | | | | | |
| Sr. Unscd. Bonds | | 7.50 | | 11/15/14 | | 50,000 | | | | 48,625 |
| SUPERVALU, | | | | | | | | | | |
| Sr. Unscd. Notes | | 8.00 | | 5/1/16 | | 235,000 | | | | 234,413 |
| | | | | | | | | | | 6,925,143 |
| Foreign/Governmental—1.1% | | | | | | | | | | |
| Federal Republic of Brazil, | | | | | | | | | | |
| Sr. Unscd. Notes | | 7.88 | | 3/7/15 | | 410,000 | | c | | 473,960 |
| Province of Quebec, | | | | | | | | | | |
| Unscd. Debs., Ser. PJ | | 6.13 | | 1/22/11 | | 685,000 | | | | 733,764 |
| Republic of Italy, | | | | | | | | | | |
| Sr. Unscd. Notes | | 3.50 | | 7/15/11 | | 700,000 | | | | 723,442 |
| United Mexican States, | | | | | | | | | | |
| Unscd. Notes, Ser. A | | 5.88 | | 1/15/14 | | 225,000 | | | | 237,938 |
| | | | | | | | | | | 2,169,104 |
| Health Care—2.6% | | | | | | | | | | |
| Abbott Laboratories, | | | | | | | | | | |
| Sr. Unscd. Notes | | 5.13 | | 4/1/19 | | 725,000 | | | | 767,388 |
| American Home Products, | | | | | | | | | | |
| Sr. Unscd. Notes | | 6.95 | | 3/15/11 | | 1,150,000 | | b | | 1,243,505 |
16
| | | Coupon | | Maturity | | Principal | | | | |
| Bonds and Notes (continued) | | Rate (%) | | Date | | Amount ($) | | | | Value ($) |
| |
| |
| |
| |
| |
|
| Health Care (continued) | | | | | | | | | | |
| Community Health Systems, | | | | | | | | | | |
| Gtd. Notes | | 8.88 | | 7/15/15 | | 460,000 | | | | 476,100 |
| Davita, | | | | | | | | | | |
| Gtd. Notes | | 6.63 | | 3/15/13 | | 470,000 | | | | 464,125 |
| Lincoln National, | | | | | | | | | | |
| Sr. Unscd. Notes | | 8.75 | | 7/1/19 | | 475,000 | | | | 523,799 |
| Medco Health Solutions, | | | | | | | | | | |
| Sr. Unscd. Notes | | 7.25 | | 8/15/13 | | 725,000 | | | | 800,917 |
| UnitedHealth Group, | | | | | | | | | | |
| Sr. Unscd. Notes | | 5.50 | | 11/15/12 | | 450,000 | | | | 472,157 |
| Wellpoint, | | | | | | | | | | |
| Sr. Unscd. Notes | | 5.88 | | 6/15/17 | | 190,000 | | | | 190,387 |
| Wellpoint, | | | | | | | | | | |
| Sr. Unscd. Notes | | 6.00 | | 2/15/14 | | 275,000 | | | | 286,184 |
| | | | | | | | | | | 5,224,562 |
| Machinery—.1% | | | | | | | | | | |
| Terex, | | | | | | | | | | |
| Gtd. Notes | | 7.38 | | 1/15/14 | | 205,000 | | | | 196,288 |
| Manufacturing—.3% | | | | | | | | | | |
| Bombardier, | | | | | | | | | | |
| Sr. Unscd. Notes | | 8.00 | | 11/15/14 | | 600,000 | | a | | 582,000 |
| Media—4.5% | | | | | | | | | | |
| British Sky Broadcasting, | | | | | | | | | | |
| Gtd. Notes | | 6.10 | | 2/15/18 | | 1,025,000 | | a | | 1,047,093 |
| Cablevision Systems, | | | | | | | | | | |
| Sr. Unscd. Notes, Ser. B | | 8.00 | | 4/15/12 | | 60,000 | | b,c | | 61,350 |
| Comcast, | | | | | | | | | | |
| Gtd. Notes | | 5.50 | | 3/15/11 | | 1,134,000 | | | | 1,192,814 |
| Cox Communications, | | | | | | | | | | |
| Notes | | 6.25 | | 6/1/18 | | 295,000 | | a | | 312,919 |
| CSC Holdings, | | | | | | | | | | |
| Sr. Unscd. Notes | | 8.50 | | 4/15/14 | | 100,000 | | a | | 103,500 |
| CSC Holdings, | | | | | | | | | | |
| Sr. Unscd. Notes | | 8.63 | | 2/15/19 | | 300,000 | | a | | 310,500 |
| Dish DBS, | | | | | | | | | | |
| Gtd. Notes | | 7.75 | | 5/31/15 | | 265,000 | | | | 266,988 |
| News America, | | | | | | | | | | |
| Gtd. Notes | | 5.30 | | 12/15/14 | | 735,000 | | | | 764,783 |
| Reed Elsevier Capital, | | | | | | | | | | |
| Gtd. Notes | | 4.63 | | 6/15/12 | | 310,000 | | | | 312,526 |
The Fund 17
| STATEMENT OF INVESTMENTS (continued) |
| | | Coupon | | Maturity | | Principal | | | | |
| Bonds and Notes (continued) | | Rate (%) | | Date | | Amount ($) | | | | Value ($) |
| |
| |
| |
| |
| |
|
| Media (continued) | | | | | | | | | | |
| Reed Elsevier Capital, | | | | | | | | | | |
| Gtd. Notes | | 7.75 | | 1/15/14 | | 900,000 | | | | 1,021,061 |
| Time Warner Cable, | | | | | | | | | | |
| Gtd. Notes | | 5.40 | | 7/2/12 | | 1,400,000 | | | | 1,495,976 |
| Time Warner Cable, | | | | | | | | | | |
| Gtd. Notes | | 6.20 | | 7/1/13 | | 1,380,000 | | | | 1,499,939 |
| Time Warner, | | | | | | | | | | |
| Gtd. Notes | | 6.75 | | 4/15/11 | | 695,000 | | | | 741,231 |
| | | | | | | | | | | 9,130,680 |
| Mining—.8% | | | | | | | | | | |
| BHP Billiton Finance USA, | | | | | | | | | | |
| Gtd. Notes | | 5.50 | | 4/1/14 | | 460,000 | | | | 500,176 |
| Rio Tinto Finance USA, | | | | | | | | | | |
| Gtd. Notes | | 5.88 | | 7/15/13 | | 540,000 | | | | 572,469 |
| Teck Resources, | | | | | | | | | | |
| Sr. Scd. Notes | | 10.25 | | 5/15/16 | | 50,000 | | a | | 56,875 |
| Teck Resources, | | | | | | | | | | |
| Sr. Scd. Notes | | 10.75 | | 5/15/19 | | 360,000 | | a | | 420,750 |
| | | | | | | | | | | 1,550,270 |
| Office And Business Equipment—.4% | | | | | | | | | | |
| Xerox, | | | | | | | | | | |
| Sr. Unscd. Notes | | 8.25 | | 5/15/14 | | 730,000 | | | | 796,175 |
| Oil & Gas—2.8% | | | | | | | | | | |
| Amerada Hess, | | | | | | | | | | |
| Sr. Unscd. Notes | | 6.65 | | 8/15/11 | | 945,000 | | | | 1,015,371 |
| Anadarko Petroleum, | | | | | | | | | | |
| Sr. Unscd. Notes | | 8.70 | | 3/15/19 | | 435,000 | | | | 517,158 |
| Chesapeake Energy, | | | | | | | | | | |
| Gtd. Notes | | 7.50 | | 6/15/14 | | 150,000 | | | | 148,875 |
| Chesapeake Energy, | | | | | | | | | | |
| Gtd. Notes | | 9.50 | | 2/15/15 | | 960,000 | | | | 1,023,600 |
| Husky Energy, | | | | | | | | | | |
| Sr. Notes | | 5.90 | | 6/15/14 | | 725,000 | | | | 780,158 |
| Marathon Oil, | | | | | | | | | | |
| Sr. Unscd. Notes | | 6.50 | | 2/15/14 | | 445,000 | | | | 491,135 |
| Range Resources, | | | | | | | | | | |
| Gtd. Notes | | 8.00 | | 5/15/19 | | 690,000 | | c | | 705,525 |
| Sempra Energy, | | | | | | | | | | |
| Sr. Unscd. Notes | | 6.50 | | 6/1/16 | | 435,000 | | | | 478,191 |
18
| | | Coupon | | Maturity | | Principal | | | | |
| Bonds and Notes (continued) | | Rate (%) | | Date | | Amount ($) | | | | Value ($) |
| |
| |
| |
| |
| |
|
| Oil & Gas (continued) | | | | | | | | | | |
| Valero Energy, | | | | | | | | | | |
| Sr. Unscd. Notes | | 9.38 | | 3/15/19 | | 435,000 | | c | | 505,607 |
| | | | | | | | | | | 5,665,620 |
| Packaging & Containers—.8% | | | | | | | | | | |
| Bemis Company, | | | | | | | | | | |
| Sr. Unscd. Notes | | 5.65 | | 8/1/14 | | 435,000 | | | | 456,418 |
| Crown Americas, | | | | | | | | | | |
| Gtd. Notes | | 7.63 | | 11/15/13 | | 690,000 | | c | | 707,250 |
| Owens Brockway Glass Container, | | | | | | | | | | |
| Gtd. Notes | | 6.75 | | 12/1/14 | | 400,000 | | | | 391,000 |
| Owens Brockway Glass Container, | | | | | | | | | | |
| Gtd. Notes | | 7.38 | | 5/15/16 | | 50,000 | | a | | 49,750 |
| | | | | | | | | | | 1,604,418 |
| Paper & Paper Related—.3% | | | | | | | | | | |
| Georgia-Pacific, | | | | | | | | | | |
| Gtd. Notes | | 7.00 | | 1/15/15 | | 205,000 | | a | | 199,875 |
| Georgia-Pacific, | | | | | | | | | | |
| Gtd. Notes | | 8.25 | | 5/1/16 | | 310,000 | | a | | 322,400 |
| | | | | | | | | | | 522,275 |
| Pipelines—1.7% | | | | | | | | | | |
| El Paso, | | | | | | | | | | |
| Sr. Unscd. Notes | | 8.25 | | 2/15/16 | | 485,000 | | | | 497,125 |
| Enterprise Products Operating, | | | | | | | | | | |
| Gtd. Notes, Ser. F | | 4.63 | | 10/15/09 | | 2,045,000 | | | | 2,050,654 |
| Kinder Morgan Energy Partners, | | | | | | | | | | |
| Sr. Unscd. Notes | | 5.63 | | 2/15/15 | | 910,000 | | | | 962,635 |
| | | | | | | | | | | 3,510,414 |
| Property & Casualty | | | | | | | | | | |
| Insurance—1.5% | | | | | | | | | | |
| Jackson National Life Global | | | | | | | | | | |
| Funding, Sr. Scd. Notes | | 5.38 | | 5/8/13 | | 590,000 | | a | | 583,045 |
| Metropolitan Life Global Funding | | | | | | | | | | |
| I, Sr. Scd. Notes | | 5.13 | | 4/10/13 | | 1,000,000 | | a | | 1,020,406 |
| Nippon Life Insurance, | | | | | | | | | | |
| Sub. Notes | | 4.88 | | 8/9/10 | | 1,050,000 | | a | | 1,049,195 |
| Prudential Financial, | | | | | | | | | | |
| Sr. Unscd. Notes | | 5.10 | | 12/14/11 | | 485,000 | | | | 482,513 |
| | | | | | | | | | | 3,135,159 |
The Fund 19
| STATEMENT OF INVESTMENTS (continued) |
| | | Coupon | | Maturity | | Principal | | | | |
| Bonds and Notes (continued) | | Rate (%) | | Date | | Amount ($) | | | | Value ($) |
| |
| |
| |
| |
| |
|
| Real Estate | | | | | | | | | | |
| Investment Trusts—2.9% | | | | | | | | | | |
| Arden Realty, | | | | | | | | | | |
| Sr. Unscd. Notes | | 5.25 | | 3/1/15 | | 475,000 | | | | 477,985 |
| Duke Realty, | | | | | | | | | | |
| Sr. Unscd. Notes | | 5.88 | | 8/15/12 | | 600,000 | | | | 549,853 |
| Federal Realty Investment Trust, | | | | | | | | | | |
| Sr. Unscd. Bonds | | 5.65 | | 6/1/16 | | 345,000 | | | | 313,511 |
| Federal Realty Investment Trust, | | | | | | | | | | |
| Sr. Unscd. Notes | | 6.00 | | 7/15/12 | | 305,000 | | | | 295,307 |
| Healthcare Realty Trust, | | | | | | | | | | |
| Sr. Unscd. Notes | | 5.13 | | 4/1/14 | | 1,165,000 | | | | 1,031,611 |
| HRPT Properties Trust, | | | | | | | | | | |
| Sr. Unscd. Notes | | 1.22 | | 3/16/11 | | 462,000 | | b | | 405,409 |
| Liberty Property, | | | | | | | | | | |
| Sr. Unscd. Notes | | 5.50 | | 12/15/16 | | 165,000 | | | | 135,702 |
| Mack-Cali Realty, | | | | | | | | | | |
| Sr. Unscd. Notes | | 5.05 | | 4/15/10 | | 550,000 | | | | 549,076 |
| Mack-Cali Realty, | | | | | | | | | | |
| Sr. Unscd. Notes | | 5.25 | | 1/15/12 | | 300,000 | | | | 273,536 |
| Regency Centers, | | | | | | | | | | |
| Gtd. Notes | | 5.88 | | 6/15/17 | | 370,000 | | | | 315,588 |
| Simon Property Group, | | | | | | | | | | |
| Sr. Unscd. Notes | | 5.00 | | 3/1/12 | | 503,000 | | | | 509,445 |
| WEA Finance, | | | | | | | | | | |
| Sr. Notes | | 7.13 | | 4/15/18 | | 660,000 | | a | | 641,189 |
| WEA Finance, | | | | | | | | | | |
| Gtd. Notes | | 7.50 | | 6/2/14 | | 320,000 | | a | | 326,620 |
| | | | | | | | | | | 5,824,832 |
| Residential Mortgage | | | | | | | | | | |
| Pass-Through Ctfs.—.3% | | | | | | | | | | |
| ChaseFlex Trust, | | | | | | | | | | |
| Ser. 2006-2, Cl. A1A | | 5.59 | | 9/25/36 | | 23,001 | | b | | 22,644 |
| GSR Mortgage Loan Trust, | | | | | | | | | | |
| Ser. 2004-12, Cl. 2A2 | | 5.32 | | 12/25/34 | | 467,972 | | b | | 335,816 |
| Impac Secured Assets CMN | | | | | | | | | | |
| Owner Trust, Ser. 2006-1, | | | | | | | | | | |
| Cl. 2A1 | | 0.64 | | 5/25/36 | | 439,589 | | b | | 305,073 |
| | | | | | | | | | | 663,533 |
20
| | | Coupon | | Maturity | | Principal | | | | |
| Bonds and Notes (continued) | | Rate (%) | | Date | | Amount ($) | | | | Value ($) |
| |
| |
| |
| |
| |
|
| Retail—.2% | | | | | | | | | | |
| Staples, | | | | | | | | | | |
| Gtd. Notes | | 9.75 | | 1/15/14 | | 405,000 | | c | | 474,903 |
| State/Territory General Obligations—1.3% | | | | | | | | |
| Erie Tobacco Asset Securitization | | | | | | | | | | |
| Corporation, Tobacco | | | | | | | | | | |
| Settlement Asset-Backed Bonds | | 6.00 | | 6/1/28 | | 815,000 | | | | 625,961 |
| Michigan Tobacco Settlement | | | | | | | | | | |
| Finance Authority, Tobacco | | | | | | | | | | |
| Settlement Asset-Backed Bonds | | 7.31 | | 6/1/34 | | 790,000 | | | | 532,160 |
| Tobacco Settlement Authority of | | | | | | | | | | |
| Iowa, Tobacco Settlement | | | | | | | | | | |
| Asset-Backed Bonds | | 6.50 | | 6/1/23 | | 2,082,000 | | | | 1,542,054 |
| | | | | | | | | | | 2,700,175 |
| Telecommunications—3.2% | | | | | | | | | | |
| AT & T, | | | | | | | | | | |
| Gtd. Notes | | 7.30 | | 11/15/11 | | 565,000 | | b,c | | 627,927 |
| CC Holdings GS V, | | | | | | | | | | |
| Sr. Scd. Notes | | 7.75 | | 5/1/17 | | 895,000 | | a | | 917,375 |
| Cisco Systems, | | | | | | | | | | |
| Sr. Unscd. Notes | | 4.95 | | 2/15/19 | | 780,000 | | | | 820,841 |
| Telecom Italia Capital, | | | | | | | | | | |
| Gtd. Notes | | 5.25 | | 11/15/13 | | 1,230,000 | | | | 1,271,054 |
| Telefonica Emisiones, | | | | | | | | | | |
| Gtd. Notes | | 5.98 | | 6/20/11 | | 675,000 | | | | 723,530 |
| Verizon Communications, | | | | | | | | | | |
| Sr. Unscd. Notes | | 7.35 | | 4/1/39 | | 350,000 | | | | 423,871 |
| Verizon Wireless Capital, | | | | | | | | | | |
| Sr. Unscd. Notes | | 5.55 | | 2/1/14 | | 1,100,000 | | a | | 1,197,494 |
| Vodafone Group, | | | | | | | | | | |
| Sr. Unscd. Notes | | 5.00 | | 9/15/15 | | 450,000 | | | | 467,143 |
| | | | | | | | | | | 6,449,235 |
| Textiles & Apparel—.4% | | | | | | | | | | |
| Mohawk Industries, | | | | | | | | | | |
| Sr. Unscd. Notes | | 6.25 | | 1/15/11 | | 805,000 | | b | | 798,716 |
| Transportation—1.0% | | | | | | | | | | |
| Canadian National Railway, | | | | | | | | | | |
| Sr. Unscd. Notes | | 4.95 | | 1/15/14 | | 735,000 | | | | 778,997 |
The Fund 21
| STATEMENT OF INVESTMENTS (continued) |
| | | Coupon | | Maturity | | Principal | | | | |
| Bonds and Notes (continued) | | Rate (%) | | Date | | Amount ($) | | | | Value ($) |
| |
| |
| |
| |
| |
|
| Transportation (continued) | | | | | | | | | | |
| Norfolk Southern, | | | | | | | | | | |
| Sr. Unscd. Notes | | 8.63 | | 5/15/10 | | 1,250,000 | | | | 1,320,869 |
| | | | | | | | | | | 2,099,866 |
| U.S. Government Agencies—7.3% | | | | | | | | | | |
| Federal Home Loan Mortgage Corp., | | | | | | | | | | |
| Notes | | 4.50 | | 7/15/13 | | 4,940,000 | | d | | 5,334,731 |
| Federal National Mortgage | | | | | | | | | | |
| Association, Bonds, Ser. 1 | | 4.75 | | 11/19/12 | | 8,638,000 | | d | | 9,403,655 |
| Federal National Mortgage | | | | | | | | | | |
| Association, Notes | | 5.38 | | 11/15/11 | | 75,000 | | d | | 81,762 |
| | | | | | | | | | | 14,820,148 |
| U.S. Government Agencies/ | | | | | | | | | | |
| Mortgage-Backed—6.4% | | | | | | | | | | |
| Federal Home Loan Mortgage Corp.: | | | | | | | | | | |
| 3.50%, 9/1/10 | | | | | | 195,022 d | | 196,228 |
| 4.00%, 3/1/10—4/1/10 | | | | | | 4,653,410 d | | 4,728,256 |
| 6.50%, 6/1/32 | | | | | | 2,673 d | | 2,880 |
| Stripped Security, Interest Only Class, | | | | | | | | | | |
| Ser. 1987, Cl. PI, 7.00%, 9/15/12 | | | | | | 41,663 d,e | | 2,794 |
| Federal National Mortgage Association: | | | | | | | | | | |
| 4.00%, 2/1/10—5/1/10 | | | | | | 1,252,772 d | | 1,268,155 |
| Gtd. Pass-Through Ctfs., Ser. 2003-49, | | | | | | | | | | |
| Cl. JE, 3.00%, 4/25/33 | | | | | | 465,650 d | | 449,850 |
| Government National Mortgage Association I: | | | | | | | | |
| Ser. 2005-90, Cl. A, 3.76%, 9/16/28 | | | | | | 1,659,464 | | | | 1,700,255 |
| Ser. 2005-34, Cl. A, 3.96%, 9/16/21 | | | | | | 611,609 | | | | 615,828 |
| Ser. 2005-29, Cl. A, 4.02%, 7/16/27 | | | | | | 1,122,937 | | | | 1,155,364 |
| Ser. 2006-3, Cl. A, 4.21%, 1/16/28 | | | | | | 1,393,873 | | | | 1,432,197 |
| Ser. 2006-5, Cl. A, 4.24%, 7/16/29 | | | | | | 143,821 | | | | 148,344 |
22
| | | Principal | | |
| Bonds and Notes (continued) | | Amount ($) | | Value ($) |
| |
| |
|
| U.S. Government Agencies/Mortgage-Backed (continued) | | | | |
| Government National Mortgage Association I (continued): | | | | |
| Ser. 2005-59, Cl. A, 4.39%, 5/16/23 | | 546,531 | | 558,668 |
| Ser. 2005-87, Cl. A, 4.45%, 3/16/25 | | 750,874 | | 770,920 |
| Government National Mortgage Association II: | | | | |
| 7.00%, 12/20/30—4/20/31 | | 19,321 | | 21,205 |
| 7.50%, 11/20/29—12/20/30 | | 20,421 | | 22,757 |
| | | | | 13,073,701 |
| U.S. Government Securities—11.3% | | | | |
| U.S. Treasury Notes: | | | | |
| 2.50%, 3/31/13 | | 4,680,000 c | | 4,775,065 |
| 3.50%, 2/15/18 | | 1,652,000 | | 1,664,392 |
| 4.88%, 4/30/11 | | 5,231,000 c | | 5,582,868 |
| 4.88%, 5/31/11 | | 10,280,000 c | | 10,998,397 |
| | | | | 23,020,722 |
| Total Bonds and Notes | | | | |
| (cost $188,330,490) | | | | 187,770,920 |
| |
| Short-Term Investments—.1% | | | | |
| |
| |
|
| U.S. Treasury Bills; | | | | |
| 0.17%, 10/15/09 | | | | |
| (cost $229,916) | | 230,000 f | | 229,930 |
| |
| Other Investment—6.8% | | Shares | | Value ($) |
| |
| |
|
| Registered Investment Company; | | | | |
| Dreyfus Institutional Preferred | | | | |
| Plus Money Market Fund | | | | |
| (cost $13,802,000) | | 13,802,000 g | | 13,802,000 |
The Fund 23
| STATEMENT OF INVESTMENTS (continued) |
| Investment of Cash Collateral | | | | |
| for Securities Loaned—13.1% | | Shares | | Value ($) |
| |
| |
|
| Registered Investment Company; | | | | |
| Dreyfus Institutional Cash | | | | |
| Advantage Plus Fund | | | | |
| (cost $26,818,552) | | 26,818,552 g | | 26,818,552 |
| |
| Total Investments (cost $229,180,958) | | 112.2% | | 228,621,402 |
| Liabilities, Less Cash and Receivables | | (12.2%) | | (24,929,866) |
| Net Assets | | 100.0% | | 203,691,536 |
| a | Securities exempt from registration under Rule 144A of the Securities Act of 1933.These securities may be resold in transactions exempt from registration, normally to qualified institutional buyers.At July 31, 2009, these securities amounted to $21,326,163 or 10.5% of net assets. |
| |
| b | Variable rate security—interest rate subject to periodic change. |
| |
| c | All or a portion of these securities are on loan.At July 31, 2009, the total market value of the fund’s securities on loan is $26,002,496 and the total market value of the collateral held by the fund is $26,818,552. |
| |
| d | On September 7, 2008, the Federal Housing Finance Agency (FHFA) placed Federal National Mortgage Association and Federal Home Loan Mortgage Corporation into conservatorship with FHFA as the conservator.As such, the FHFA will oversee the continuing affairs of these companies. |
| |
| e | Notional face amount shown. |
| |
| f | All or partially held by a broker as collateral for open financial futures positions. |
| |
| g | Investment in affiliated money market mutual fund. |
| |
| Portfolio Summary (Unaudited)† | | | | |
| |
| | | Value (%) | | | | Value (%) |
| |
| |
| |
|
| Corporate Bonds | | 49.4 | | Asset/Mortgage-Backed | | 15.4 |
| U.S. Government & Agencies | | 25.0 | | State/Government General Obligations | | 1.3 |
| Short-Term/ | | | | Foreign/Governmental | | 1.1 |
| Money Market Investments | | 20.0 | | | | 112.2 |
| |
| † Based on net assets. | | | | | | |
| See notes to financial statements. | | | | | | |
24
STATEMENT OF FINANCIAL FUTURES
July 31, 2009 |
| | | | | | | | | Unrealized |
| | | | | Market Value | | | | Appreciation |
| | | | | Covered by | | | | (Depreciation) |
| | | Contracts | | Contracts ($) | | Expiration | | at 7/31/2009 ($) |
| |
| |
| |
| |
|
| Financial Futures Long | | | | | | | | |
| U.S. Treasury 2 Year Notes | | 286 | | 61,941,342 | | September 2009 | | 114,967 |
| Financial Futures Short | | | | | | | | |
| U.S. Treasury 10 Year Notes | | 168 | | (19,703,250) | | September 2009 | | (457,844) |
| |
| See notes to financial statements. | | | | | | | | |
The Fund 25
| STATEMENT OF OPTIONS WRITTEN | | | | |
| July 31, 2009 | | | | |
| |
| |
|
| |
| |
| |
| | | Face Amount | | |
| | | Covered by | | |
| | | Contracts ($) | | Value ($) |
| |
| |
|
| Call Options: | | | | |
| 5-Year USD LIBOR-BBA, | | | | |
| August 2009 @ 2.91 | | 4,469,000 a | | (32,457) |
| Federal National Mortgage Association, | | | | |
| August 2009 @ 100 | | 3,814,000 a | | (32,133) |
| Federal National Mortgage Association, | | | | |
| September 2009 @ 99.75 | | 1,935,000 a | | (29,679) |
| Put Options: | | | | |
| 5-Year USD LIBOR-BBA, | | | | |
| August 2009 @ 2.91 | | 4,469,000 a | | (41,512) |
| Federal National Mortgage Association, | | | | |
| August 2009 @ 100 | | 3,814,000 a | | (10,680) |
| Federal National Mortgage Association, | | | | |
| September 2009 @ 99.75 | | 1,935,000 a | | (21,213) |
| (Premiums received $251,474) | | | | (167,674) |
USD—US Dollar
LIBOR—London Interbank Offered Rate
BBA—British Bankers Association
a Non-income producing security.
See notes to financial statements. |
26
STATEMENT OF ASSETS AND LIABILITIES
July 31, 2009
| | | | | Cost | | Value |
| |
| |
| |
|
| Assets ($): | | | | | | |
| Investments in securities—See Statement of Investments (including | | | | |
| securities on loan, valued at $26,002,496)—Note 1(c): | | | | |
| Unaffiliated issuers | | | | 188,560,406 | | 188,000,850 |
| Affiliated issuers | | | | 40,620,552 | | 40,620,552 |
| Cash | | | | | | 446,811 |
| Dividends and interest receivable | | | | | | 2,077,716 |
| Receivable for investment securities sold | | | | | | 275,282 |
| Receivable for shares of Common Stock subscribed | | | | | | 48,208 |
| Prepaid expenses | | | | | | 9,775 |
| | | | | | | 231,479,194 |
| Liabilities ($): | | | | | | |
| Due to The Dreyfus Corporation and affiliates—Note 3(c) | | | | 176,004 |
| Liability for securities on loan—Note 1(c) | | | | | | 26,818,552 |
| Payable for investment securities purchased | | | | | | 317,695 |
| Outstanding options written, at value (premiums received | | | | |
| $251,474)—See Statement of Options Written | | | | | | 167,674 |
| Payable for shares of Common Stock redeemed | | | | | | 135,059 |
| Payable for futures variation margin—Note 4 | | | | | | 76,500 |
| Accrued expenses | | | | | | 96,174 |
| | | | | | | 27,787,658 |
| Net Assets ($) | | | | | | 203,691,536 |
| Composition of Net Assets ($): | | | | | | |
| Paid-in capital | | | | | | 301,576,576 |
| Accumulated undistributed investment income—net | | | | | | 46,437 |
| Accumulated net realized gain (loss) on investments | | | | | | (97,112,844) |
| Accumulated net unrealized appreciation (depreciation) | | | | |
| on investments [including ($342,877) net unrealized | | | | |
| (depreciation) on financial futures] | | | | | | (818,633) |
| Net Assets ($) | | | | | | 203,691,536 |
| |
| |
| |
|
| |
| |
| Net Asset Value Per Share | | | | | | |
| | | Class B | | Class D | | Class P |
| |
| |
| |
|
| Net Assets ($) | | 2,478,667 | | 199,862,691 | | 1,350,178 |
| Shares Outstanding | | 239,645 | | 19,324,748 | | 130,385 |
| Net Asset Value Per Share ($) | | 10.34 | | 10.34 | | 10.36 |
| |
| See notes to financial statements. | | | | | | |
The Fund 27
| STATEMENT OF OPERATIONS | | |
| Year Ended July 31, 2009 | | |
| |
|
| |
| |
| |
| |
| Investment Income ($): | | |
| Income: | | |
| Interest | | 9,794,151 |
| Income from securities lending | | 174,611 |
| Dividends; | | |
| Affiliated issuers | | 25,365 |
| Total Income | | 9,994,127 |
| Expenses: | | |
| Management fee—Note 3(a) | | 962,503 |
| Shareholder servicing costs—Note 3(c) | | 660,594 |
| Professional fees | | 58,738 |
| Registration fees | | 46,258 |
| Prospectus and shareholders’ reports | | 35,953 |
| Custodian fees—Note 3(c) | | 22,292 |
| Distribution fees—Note 3(b) | | 17,306 |
| Directors’ fees and expenses—Note 3(d) | | 609 |
| Loan commitment fees—Note 2 | | 519 |
| Miscellaneous | | 55,740 |
| Total Expenses | | 1,860,512 |
| Less—reduction in fees due to earnings credits—Note 1(c) | | (14,397) |
| Net Expenses | | 1,846,115 |
| Investment Income—Net | | 8,148,012 |
| Realized and Unrealized Gain (Loss) on Investments—Note 4 ($): | | |
| Net realized gain (loss) on investments and foreign currency transactions | | (11,003,199) |
| Net realized gain (loss) on options transactions | | 68,766 |
| Net realized gain (loss) on financial futures | | 2,096,470 |
| Net realized gain (loss) on swap transactions | | 115,029 |
| Net realized gain (loss) on forward foreign currency exchange contracts | | 49,469 |
| Net Realized Gain (Loss) | | (8,673,465) |
| Change in net unrealized appreciation (depreciation) on investments, financial | | |
| futures, options transactions, swap transactions and foreign currency | | |
| transactions [including ($527,807) net unrealized (depreciation) on financial | | |
| futures, $83,800 net unrealized appreciation on options transactions and | | |
| ($78,804) net unrealized (depreciation) on swap transactions] | | 8,704,819 |
| Net Realized and Unrealized Gain (Loss) on Investments | | 31,354 |
| Net Increase in Net Assets Resulting from Operations | | 8,179,366 |
| |
| See notes to financial statements. | | |
28
STATEMENT OF CHANGES IN NET ASSETS
| | | | | Year Ended July 31, |
| | |
| |
|
| | | 2009 | | 2008 |
| |
| |
|
| Operations ($): | | | | |
| Investment income—net | | 8,148,012 | | 10,539,085 |
| Net realized gain (loss) on investments | | (8,673,465) | | (3,954,000) |
| Change in net unrealized appreciation | | | | |
| (depreciation) on investments | | 8,704,819 | | (6,286,872) |
| Net Increase (Decrease) in Net Assets | | | | |
| Resulting from Operations | | 8,179,366 | | 298,213 |
| Dividends to Shareholders from ($): | | | | |
| Investment income—net: | | | | |
| Class B Shares | | (128,317) | | (192,456) |
| Class D Shares | | (8,373,648) | | (10,721,636) |
| Class P Shares | | (59,185) | | (130,016) |
| Net realized gain on investments: | | | | |
| Class B Shares | | — | | (3,083) |
| Class D Shares | | — | | (145,939) |
| Class P Shares | | — | | (1,822) |
| Total Dividends | | (8,561,150) | | (11,194,952) |
| Capital Stock Transactions ($): | | | | |
| Net proceeds from shares sold: | | | | |
| Class B Shares | | 1,046,260 | | 519,129 |
| Class D Shares | | 30,887,353 | | 21,113,476 |
| Class P Shares | | 256,496 | | 80,000 |
| Dividends reinvested: | | | | |
| Class B Shares | | 112,985 | | 166,604 |
| Class D Shares | | 7,133,067 | | 9,378,797 |
| Class P Shares | | 52,104 | | 63,383 |
| Cost of shares redeemed: | | | | |
| Class B Shares | | (3,020,546) | | (1,788,927) |
| Class D Shares | | (51,840,666) | | (67,136,832) |
| Class P Shares | | (629,241) | | (1,640,577) |
| Increase (Decrease) in Net Assets | | | | |
| from Capital Stock Transactions | | (16,002,188) | | (39,244,947) |
| Total Increase (Decrease) in Net Assets | | (16,383,972) | | (50,141,686) |
| Net Assets ($): | | | | |
| Beginning of Period | | 220,075,508 | | 270,217,194 |
| End of Period | | 203,691,536 | | 220,075,508 |
| Undistributed investment income—net | | 46,437 | | 50,863 |
The Fund 29
STATEMENT OF CHANGES IN NET ASSETS (continued)
| | | | | Year Ended July 31, |
| | |
| |
|
| | | 2009 | | 2008 |
| |
| |
|
| Capital Share Transactions: | | | | |
| Class Ba | | | | |
| Shares sold | | 105,413 | | 48,463 |
| Shares issued for dividends reinvested | | 11,436 | | 15,652 |
| Shares redeemed | | (305,093) | | (167,919) |
| Net Increase (Decrease) in Shares Outstanding | | (188,244) | | (103,804) |
| Class Da | | | | |
| Shares sold | | 3,095,472 | | 1,978,132 |
| Shares issued for dividends reinvested | | 718,610 | | 880,395 |
| Shares redeemed | | (5,211,091) | | (6,292,035) |
| Net Increase (Decrease) in Shares Outstanding | | (1,397,009) | | (3,433,508) |
| Class P | | | | |
| Shares sold | | 25,431 | | 7,416 |
| Shares issued for dividends reinvested | | 5,249 | | 5,948 |
| Shares redeemed | | (62,618) | | (156,676) |
| Net Increase (Decrease) in Shares Outstanding | | (31,938) | | (143,312) |
| a | During the year ended July 31, 2009, 117,232 Class B shares representing $1,153,445 were automatically converted to 117,182 Class D shares and during the period ended July 31, 2008, 40,832 Class B shares representing $437,273 were automatically converted to 40,830 Class D shares. |
| |
| See notes to financial statements. |
30
FINANCIAL HIGHLIGHTS
The following tables describe the performance for each share class for the fiscal periods indicated.All information (except portfolio turnover rate) reflects financial results for a single fund share.Total return shows how much your investment in the fund would have increased (or decreased) during each period, assuming you had reinvested all dividends and distributions.These figures have been derived from the fund’s financial statements.
| | | | | Year Ended July 31, | | |
| | |
| |
| |
|
| Class B Shares | | 2009 | | 2008 | | 2007 | | 2006 | | 2005 |
| |
| |
| |
| |
| |
|
| Per Share Data ($): | | | | | | | | | | |
| Net asset value, beginning of period | | 10.32 | | 10.81 | | 10.82 | | 11.03 | | 11.13 |
| Investment Operations: | | | | | | | | | | |
| Investment income—neta | | .34 | | .38 | | .38 | | .32 | | .21 |
| Net realized and unrealized | | | | | | | | | | |
| gain (loss) on investments | | .05 | | (.46) | | .03 | | (.12) | | .05 |
| Total from Investment Operations | | .39 | | (.08) | | .41 | | .20 | | .26 |
| Distributions: | | | | | | | | | | |
| Dividends from investment income—net | | (.37) | | (.40) | | (.42) | | (.39) | | (.35) |
| Dividends from net realized | | | | | | | | | | |
| gain on investments | | — | | (.01) | | — | | (.02) | | (.01) |
| Total Distributions | | (.37) | | (.41) | | (.42) | | (.41) | | (.36) |
| Net asset value, end of period | | 10.34 | | 10.32 | | 10.81 | | 10.82 | | 11.03 |
| Total Return (%)b | | 3.96 | | (.78) | | 3.84 | | 1.81 | | 2.37 |
| Ratios/Supplemental Data (%): | | | | | | | | | | |
| Ratio of total expenses | | | | | | | | | | |
| to average net assets | | 1.70 | | 1.57 | | 1.56 | | 1.50 | | 1.50 |
| Ratio of net expenses | | | | | | | | | | |
| to average net assets | | 1.70c | | 1.57c | | 1.56 | | 1.50 | | 1.50 |
| Ratio of net investment income | | | | | | | | | | |
| to average net assets | | 3.50 | | 3.62 | | 3.46 | | 2.92 | | 1.88 |
| Portfolio Turnover Rate | | 99.46d | | 86.45d | | 146.57 | | 181.07d 494.93d |
| Net Assets, end of period ($ x 1,000) | | 2,479 | | 4,417 | | 5,746 | | 7,905 | | 11,586 |
| a | Based on average shares outstanding at each month end. |
| |
| b | Exclusive of sales charge. |
| |
| c | Expense waivers and/or reimbursements amounted to less than .01%. |
| |
| d | The portfolio turnover rates excluding mortgage dollar roll transactions for the periods ended July 31, 2009, 2008, 2006 and 2005, were 98.62%, 86.39%, 169.73% and 463.30% , respectively. |
| |
| See notes to financial statements. |
The Fund 31
| FINANCIAL HIGHLIGHTS (continued) |
| | | | | Year Ended July 31, | | |
| | |
| |
| |
|
| Class D Shares | | 2009 | | 2008 | | 2007 | | 2006 | | 2005 |
| |
| |
| |
| |
| |
|
| Per Share Data ($): | | | | | | | | | | |
| Net asset value, beginning of period | | 10.33 | | 10.81 | | 10.82 | | 11.03 | | 11.13 |
| Investment Operations: | | | | | | | | | | |
| Investment income—neta | | .42 | | .46 | | .45 | | .39 | | .28 |
| Net realized and unrealized | | | | | | | | | | |
| gain (loss) on investments | | .03 | | (.45) | | .03 | | (.12) | | .05 |
| Total from Investment Operations | | .45 | | .01 | | .48 | | .27 | | .33 |
| Distributions: | | | | | | | | | | |
| Dividends from investment income—net | | (.44) | | (.48) | | (.49) | | (.46) | | (.42) |
| Dividends from net realized | | | | | | | | | | |
| gain on investments | | — | | (.01) | | — | | (.02) | | (.01) |
| Total Distributions | | (.44) | | (.49) | | (.49) | | (.48) | | (.43) |
| Net asset value, end of period | | 10.34 | | 10.33 | | 10.81 | | 10.82 | | 11.03 |
| Total Return (%) | | 4.66 | | .02 | | 4.49 | | 2.48 | | 2.99 |
| Ratios/Supplemental Data (%): | | | | | | | | | | |
| Ratio of total expenses | | | | | | | | | | |
| to average net assets | | .95 | | .89 | | .90 | | .86 | | .88 |
| Ratio of net expenses | | | | | | | | | | |
| to average net assets | | .95b | | .89b | | .90 | | .86 | | .88 |
| Ratio of net investment income | | | | | | | | | | |
| to average net assets | | 4.25 | | 4.30 | | 4.12 | | 3.55 | | 2.52 |
| Portfolio Turnover Rate | | 99.46c | | 86.45c | | 146.57 | | 181.07c 494.93c |
| Net Assets, end of period ($ x 1,000) | | 199,863 | | 213,980 | | 261,164 | | 315,555 | | 434,779 |
| a | Based on average shares outstanding at each month end. |
| |
| b | Expense waivers and/or reimbursements amounted to less than .01%. |
| |
| c | The portfolio turnover rates excluding mortgage dollar roll transactions for the periods ended July 31, 2009, 2008, 2006 and 2005, were 98.62%, 86.39%, 169.73% and 463.30% , respectively. |
| |
| See notes to financial statements. |
32
| | | | | Year Ended July 31, | | |
| | |
| |
| |
|
| Class P Shares | | 2009 | | 2008 | | 2007 | | 2006 | | 2005 |
| |
| |
| |
| |
| |
|
| Per Share Data ($): | | | | | | | | | | |
| Net asset value, beginning of period | | 10.34 | | 10.82 | | 10.83 | | 11.04 | | 11.15 |
| Investment Operations: | | | | | | | | | | |
| Investment income—neta | | .42 | | .47 | | .45 | | .39 | | .30 |
| Net realized and unrealized | | | | | | | | | | |
| gain (loss) on investments | | .04 | | (.46) | | .03 | | (.12) | | .02 |
| Total from Investment Operations | | .46 | | .01 | | .48 | | .27 | | .32 |
| Distributions: | | | | | | | | | | |
| Dividends from investment income—net | | (.44) | | (.48) | | (.49) | | (.46) | | (.42) |
| Dividends from net realized | | | | | | | | | | |
| gain on investments | | — | | (.01) | | — | | (.02) | | (.01) |
| Total Distributions | | (.44) | | (.49) | | (.49) | | (.48) | | (.43) |
| Net asset value, end of period | | 10.36 | | 10.34 | | 10.82 | | 10.83 | | 11.04 |
| Total Return (%) | | 4.66 | | .02 | | 4.50 | | 2.46 | | 3.01 |
| Ratios/Supplemental Data (%): | | | | | | | | | | |
| Ratio of total expenses | | | | | | | | | | |
| to average net assets | | .96 | | .89 | | .90 | | .88 | | .86 |
| Ratio of net expenses | | | | | | | | | | |
| to average net assets | | .96b | | .89b | | .90 | | .88 | | .86 |
| Ratio of net investment income | | | | | | | | | | |
| to average net assets | | 4.24 | | 4.32 | | 4.12 | | 3.56 | | 2.59 |
| Portfolio Turnover Rate | | 99.46c | | 86.45c | | 146.57 | | 181.07c 494.93c |
| Net Assets, end of period ($ x 1,000) | | 1,350 | | 1,678 | | 3,308 | | 4,025 | | 7,674 |
| a | Based on average shares outstanding at each month end. |
| |
| b | Expense waivers and/or reimbursements amounted to less than .01%. |
| |
| c | The portfolio turnover rates excluding mortgage dollar roll transactions for the periods ended July 31, 2009, 2008, 2006 and 2005, were 98.62%, 86.39%, 169.73% and 463.30% , respectively. |
| |
| See notes to financial statements. |
The Fund 33
NOTES TO FINANCIAL STATEMENTS
NOTE 1—Significant Accounting Policies:
Dreyfus Short Term Income Fund (the “fund”) is a separate non-diversified series of Dreyfus Investment Grade Funds, Inc. (the “Company”), which is registered under the Investment Company Act of 1940, as amended (the “Act”), as an open-end management investment company and operates as a series company currently offering three series, including the fund. The fund’s investment objective is to seek to maximize total return, consisting of capital appreciation and current income. The Dreyfus Corporation (the “Manager” or “Dreyfus”), a wholly-owned subsidiary of The Bank of New York Mellon Corporation (“BNY Mellon”), serves as the fund’s investment adviser.
At a meeting of the fund’s Board of Directors held on October 16, 2008, the Board approved, effective December 1, 2008, a proposal to change the name of the fund from “Dreyfus Premier Short Term Income Fund” to “Dreyfus Short Term Income Fund”.
MBSC Securities Corporation (the “Distributor”), a wholly-owned subsidiary of the Manager, is the distributor of the fund’s shares. The fund is authorized to issue 700 million shares of $.001 par value Common Stock.The fund currently offers three classes of shares: Class B (100 million shares authorized), Class D (500 million shares authorized) and Class P (100 million shares authorized). Class B shares are subject to a contingent deferred sales charge (“CDSC”) imposed on Class B share redemptions made within six years of purchase and automatically convert to Class D shares after six years.The fund does not offer Class B shares, except in connection with dividend reinvestment and permitted exchanges of Class B shares. Class D and Class P shares are sold at net asset value per share only to institutional investors. Class D shares purchased at net asset value (an investment of $250,000 or more) will have a CDSC imposed on redemptions made within eighteen months of purchase. Other differences between the classes include the services offered to and the expenses borne by each class, the allocation of certain transfer agency costs and certain voting rights. Income, expenses (other than expenses attributable to a specific class),
34
and realized and unrealized gains or losses on investments are allocated to each class of shares based on its relative net assets.
The Company accounts separately for the assets, liabilities and operations of each series. Expenses directly attributable to each series are charged to that series’ operations; expenses which are applicable to all series are allocated among them on a pro rata basis.
The fund’s financial statements are prepared in accordance with U.S. generally accepted accounting principles, which may require the use of management estimates and assumptions. Actual results could differ from those estimates.
The fund enters into contracts that contain a variety of indemnifications. The fund’s maximum exposure under these arrangements is unknown.The fund does not anticipate recognizing any loss related to these arrangements.
(a) Portfolio valuation: Investments in securities, excluding short-term investments (other than U.S.Treasury Bills), financial futures, options, swap transactions and forward foreign currency exchange contracts (“forward contracts”) are valued each business day by an independent pricing service (the “Service”) approved by the Board of Directors. Investments for which quoted bid prices are readily available and are representative of the bid side of the market in the judgment of the Service are valued at the mean between the quoted bid prices (as obtained by the Service from dealers in such securities) and asked prices (as calculated by the Service based upon its evaluation of the market for such securities). Other investments (which constitute a majority of the portfolio securities) are valued as determined by the Service, based on methods which include consideration of: yields or prices of securities of comparable quality, coupon, maturity and type, indications as to values from dealers, and general market conditions. Restricted securities, as well as securities or other assets for which recent market quotations are not readily available, that are not valued by a pricing service approved by the Board of Directors, or are determined by the fund not
The Fund 35
| NOTES TO FINANCIAL STATEMENTS (continued) |
to reflect accurately fair value, are valued at fair value as determined in good faith under the direction of the Board of Directors.The factors that may be considered when fair valuing a security include fundamental analytical data, the nature and duration of restrictions on disposition, an evaluation of the forces that influence the market in which the securities are purchased and sold and public trading in similar securities of the issuer or comparable issuers. Short-term investments, excluding U.S. Treasury Bills, are carried at amortized cost, which approximates value. Registered investment companies that are not traded on an exchange are valued at their net asset value. Financial futures and options, which are traded on an exchange, are valued at the last sales price on the securities exchange on which such securities are primarily traded or at the last sales price on the national securities market on each business day. Options traded over-the-counter are priced at the mean between the bid and asked price. Investments in swap transactions are valued each business day by an independent pricing service approved by the Board of Directors. Swaps are valued by the service by using a swap pricing model which incorporates among other factors, default probabilities, recovery rates, credit curves of the underlying issuers and swap spreads on interest rates. Investments denominated in foreign currencies are translated to U.S. dollars at the prevailing rates of exchange. Forward contracts are valued at the forward rate.
The fund adopted Statement of Financial Accounting Standards No. 157 “FairValue Measurements” (“FAS 157”). FAS 157 establishes an authoritative definition of fair value, sets out a framework for measuring fair value, and requires additional disclosures about fair value measurements.
Various inputs are used in determining the value of the fund’s investments relating to FAS 157.These inputs are summarized in the three broad levels listed below.
Level 1—quoted prices in active markets for identical investments.
Level 2—other significant observable inputs (including quoted prices for similar investments, interest rates, prepayment speeds, credit risk, etc.).
Level 3—significant unobservable inputs (including the fund’s own assumptions in determining the fair value of investments).
36
The inputs or methodology used for valuing securities are not necessarily an indication of the risk associated with investing in those securities.
The following is a summary of the inputs used as of July 31, 2009 in valuing the fund’s investments:
| | | | | Level 2—Other | | Level 3— | | |
| | | Level 1— | | Significant | | Significant | | |
| | | Quoted | | Observable | | Unobservable | | |
| | | Prices | | Inputs | | Inputs | | Total |
| |
| |
| |
| |
|
| Assets ($) | | | | | | | | |
| Investments in Securities: | | | | | | |
| U.S. Treasury | | | | | | | | |
| Securities | | — | | 23,250,652 | | — | | 23,250,652 |
| Asset-Backed | | — | | 12,118,680 | | — | | 12,118,680 |
| Corporate Bonds | | — | | 100,455,254 | | — | | 100,455,254 |
| Foreign Government | | — | | 2,169,104 | | — | | 2,169,104 |
| Municipal Bonds | | — | | 2,700,175 | | — | | 2,700,175 |
| U.S. Government | | | | | | | | |
| Agencies/ | | | | | | | | |
| Mortgage-Backed | | — | | 27,893,849 | | — | | 27,893,849 |
| Residential | | | | | | | | |
| Mortgage-Backed | | — | | 663,533 | | — | | 663,533 |
| Commercial | | | | | | | | |
| Mortgage-Backed | | — | | 18,749,603 | | — | | 18,749,603 |
| Mutual Funds | | 40,620,552 | | — | | — | | 40,620,552 |
| Other Financial | | | | | | | | |
| Instruments† | | 114,967 | | — | | — | | 114,967 |
| Liabilities ($) | | | | | | | | |
| Other Financial | | | | | | | | |
| Instruments† | | (551,549) | | (73,969) | | — | | (625,518) |
† Other financial instruments include derivative instruments such as futures, forward foreign currency
exchange contracts, swap contracts and options contracts.Amounts shown represent unrealized
appreciation (depreciation), or in the case of options, market value at period end.
(b) Foreign currency transactions: The fund does not isolate that por- |
tion of the results of operations resulting from changes in foreign exchange rates on investments from the fluctuations arising from changes in market prices of securities held. Such fluctuations are included with the net realized and unrealized gain or loss on investments.
The Fund 37
| NOTES TO FINANCIAL STATEMENTS (continued) |
Net realized foreign exchange gains or losses arise from sales of foreign currencies, currency gains or losses realized on securities transactions and the difference between the amounts of dividends, interest, and foreign withholding taxes recorded on the fund’s books and the U.S. dollar equivalent of the amounts actually received or paid. Net unrealized foreign exchange gains and losses arise from changes in the value of assets and liabilities other than investments resulting from changes in exchange rates. Foreign currency gains and losses on investments are included with net realized and unrealized gain or loss on investments.
(c) Securities transactions and investment income: Securities transactions are recorded on a trade date basis. Realized gains and losses from securities transactions are recorded on the identified cost basis. Dividend income is recognized on the ex-dividend date and interest income, including, where applicable, accretion of discount and amortization of premium on investments, is recognized on the accrual basis.
The fund has arrangements with the custodian and cash management bank whereby the fund may receive earnings credits when positive cash balances are maintained, which are used to offset custody and cash management fees. For financial reporting purposes, the fund includes net earnings credits as an expense offset in the Statement of Operations.
Pursuant to a securities lending agreement with The Bank of New York Mellon, a subsidiary of BNY Mellon and an affiliate of Dreyfus, the fund may lend securities to qualified institutions. It is the fund’s policy that, at origination, all loans are secured by collateral of at least 102% of the value of U.S. securities loaned and 105% of the value of foreign securities loaned. Collateral equivalent to at least 100% of the market value of securities on loan is maintained at all times. Collateral is either in the form of cash, which can be invested in certain money market mutual funds managed by the Manager, U.S. Government and Agency securities or letters of credit.The fund is entitled to receive all income on securities loaned, in addition to income earned as a result of the lending transaction. Although each security loaned is fully col-
38
lateralized, the fund bears the risk of delay in recovery of, or loss of rights in, the securities loaned should a borrower fail to return the securities in a timely manner. During the period ended July 31, 2009, The Bank of New York Mellon earned $74,833 from lending fund portfolio securities, pursuant to the securities lending agreement.
(d) Affiliated issuers: Investments in other investment companies advised by the Manager are defined as “affiliated” in the Act.
(e) Dividends to shareholders: It is the policy of the fund to declare dividends daily from investment income-net. Such dividends are paid monthly. Dividends from net realized capital gains, if any, are normally declared and paid annually, but the fund may make distributions on a more frequent basis to comply with the distribution requirements of the Internal Revenue Code of 1986, as amended (the “Code”).To the extent that net realized capital gains can be offset by capital loss carryovers, it is the policy of the fund not to distribute such gains. Income and capital gain distributions are determined in accordance with income tax regulations, which may differ from U.S. generally accepted accounting principles.
(f) Federal income taxes: It is the policy of the fund to continue to qualify as a regulated investment company, if such qualification is in the best interests of its shareholders, by complying with the applicable provisions of the Code, and to make distributions of taxable income sufficient to relieve it from substantially all federal income and excise taxes.
As of and during the period ended July 31, 2009, the fund did not have any liabilities for any uncertain tax positions. The fund recognizes interest and penalties, if any, related to uncertain tax positions as income tax expense in the Statement of Operations. During the period, the fund did not incur any interest or penalties.
Each of the tax years in the four-year period ended July 31, 2009 remains subject to examination by the Internal Revenue Service and state taxing authorities.
The Fund 39
| NOTES TO FINANCIAL STATEMENTS (continued) |
At July 31, 2009, the components of accumulated earnings on a tax basis were as follows: undistributed ordinary income $46,437, accumulated capital losses $88,947,509 and unrealized depreciation $1,297,730. In addition, the fund had $7,686,238 of capital losses realized after October 31, 2008, which were deferred for tax purposes to the first day of the following fiscal year.
The accumulated capital loss carryover is available for federal income tax purposes to be applied against future net securities profits, if any, realized subsequent to July 31, 2009. If not applied, $4,403,293 of the carryover expires in fiscal 2010, $21,420,716 expires in fiscal 2011, $7,815,155 expires in fiscal 2012, $29,412,542 expires in fiscal 2013, $8,634,655 expires in fiscal 2014, $7,342,005 expires in fiscal 2015, $4,178,299 expires in fiscal 2016 and $5,740,844 expires in fiscal 2017.
The tax character of distributions paid to shareholders during the fiscal periods ended July 31, 2009 and July 31, 2008 were as follows: ordinary income $8,561,150 and $11,194,952, respectively.
During the period ended July 31, 2009, as a result of permanent book to tax differences, primarily due to the tax treatment for amortization of premiums, paydown gains and losses on mortgage backed securities and foreign currency transactions, the fund increased accumulated undistributed investment income-net by $408,712 and decreased accumulated net realized gain (loss) on investments by the same amount. Net assets and net asset value per share were not affected by this reclassification.
NOTE 2—Bank Line of Credit:
The fund participates with other Dreyfus-managed funds in a $300 million unsecured line of credit provided by The Bank of New York Mellon (the “BNYM Facility”) primarily to be utilized for temporary or emergency purposes including the financing of redemptions. The terms of the BNYM Facility limits the amount of individual fund borrowings. Interest is charged to the fund based on prevailing market
40
rates in effect at the time of borrowing. Effective October 15, 2008, in connection therewith, the fund has agreed to pay commitment fees on its pro rata portion of the BNYM Facility. During the period ended July 31, 2009, the fund did not borrow under the BNYM Facility.
NOTE 3—Management Fee and Other Transactions With Affiliates:
(a) Pursuant to a management agreement with the Manager, the management fee is computed at the annual rate of .50% of the value of the fund’s average daily net assets and is payable monthly.
During the period ended July 31, 2009, the Distributor retained $8,767 from CDSCs on redemptions of the fund’s Class B shares.
(b) Under the Distribution Plan (the “Plan”) adopted pursuant to Rule 12b-1 under the Act, Class B shares pay the Distributor for distributing their shares at an annual rate of .50% of the value of the average daily net assets of Class B shares. During the period ended July 31, 2009, Class B shares were charged $17,306, pursuant to the Plan.
(c) Under the Shareholder Services Plan, Class B, Class D and Class P shares pay the Distributor at an annual rate of .25% of the value of the average daily net assets of Class B and Class P shares and .20% of the value of the average daily net assets of Class D shares, for the provision of certain services.The services provided may include personal services relating to shareholder accounts, such as answering shareholder inquiries regarding Class B, Class D and Class P shares and providing reports and other information, and services related to the maintenance of shareholder accounts.The Distributor may make payments to Service Agents (a securities dealer, financial institution or other industry professional) in respect of these services.The Distributor determines the amounts to be paid to Service Agents. During the period ended July 31, 2009, Class B, Class D and Class P shares were charged, $8,653, $375,424 and $3,318, respectively, pursuant to the Shareholder Services Plan.
The Fund 41
| NOTES TO FINANCIAL STATEMENTS (continued) |
The fund compensates Dreyfus Transfer, Inc., a wholly-owned subsidiary of the Manager, under a transfer agency agreement for providing personnel and facilities to perform transfer agency services for the fund. During the period ended July 31, 2009, the fund was charged $136,692 pursuant to the transfer agency agreement.
The fund compensates The Bank of New York Mellon under a cash management agreement for performing cash management services related to fund subscriptions and redemptions. During the period ended July 31, 2009, the fund was charged $14,397 pursuant to the cash management agreement.These fees were offset by earnings credits pursuant to the cash management agreement.
The fund also compensates The Bank of New York Mellon under a custody agreement for providing custodial services for the fund. During the period ended July 31, 2009, the fund was charged $22,292 pursuant to the custody agreement.
During the period ended July 31, 2009, the fund was charged $5,939 for services performed by the Chief Compliance Officer.
The components of “Due to The Dreyfus Corporation and affiliates” in the Statement of Assets and Liabilities consist of: management fees $84,010, Rule 12b-1 distribution plan fees $1,058, shareholder services plan fees $33,711, custodian fees $10,000, chief compliance officer fees $2,227 and transfer agency per account fees $44,998.
(d) Each Board member also serves as a Board member of other funds within the Dreyfus complex. Annual retainer fees and attendance fees are allocated to each fund based on net assets.
NOTE 4—Securities Transactions:
The aggregate amount of purchases and sales (including paydowns) of investment securities, excluding short-term securities, financial futures, forward contracts, options transactions and swap transactions
42
during the period ended July 31, 2009, amounted to $185,590,320 and $203,381,839, respectively, of which $1,565,816 in purchases and $1,569,713 in sales were from mortgage dollar roll transactions.
The fund adopted Statement of Financial Accounting Standards No. 161 “Disclosures about Derivative Instruments and Hedging Activities” (“FAS 161”) which changes the disclosure requirements for derivative instruments and hedging activities. Because investment companies value their derivatives at fair value and recognize changes in fair value through the Statement of Operations, they do not qualify for FAS 133 hedge accounting. Accordingly, even though a fund’s investments in derivatives may represent economic hedges, they are considered to be non-hedge transactions for purposes of FAS 161 disclosure. FAS 161 requires qualitative disclosures about objectives and strategies for using derivatives, quantitative disclosures about fair value amounts of gains and losses on derivative instruments and disclosures about credit-risk-related contingent features in derivative agreements. The following tables show the fund’s exposure to different types of market risk as it relates to the Statement of Assets and Liabilities and the Statement of Operations, respectively. All changes to accounting policies and disclosures have been made in accordance with FAS 161 and are incorporated for the current period as part of the disclosures within this Note.
Fair value of derivative instruments as of July 31, 2009 is shown below:
| | | Derivative | | | | Derivative |
| | | Assets ($) | | | | Liabilities ($) |
| |
| |
| |
|
| Interest rate risk 1 | | 114,967 | | Interest rate risk1,2 | | (625,518) |
| Gross fair value of | | | | | | |
| derivative contracts | | 114,967 | | | | (625,518) |
Statement of Assets and Liabilities location:
| 1 | Includes cumulative appreciation/depreciation of futures contracts as reported on the Statement of Financial Futures, but only the unpaid variation margin is reported within the Statement of Assets and Liabilities. |
| |
| 2 | Outstanding options written, at value. |
| |
The Fund 43
| NOTES TO FINANCIAL STATEMENTS (continued) |
The effect of derivative instruments on the Statement of Operations the period ended July 31, 2009 is shown below:
| | | Amount of realized gain or (loss) on derivatives recognized in income ($) |
| | |
|
| | | | | | | Foreign | | | | |
| | | | | | | Currency | | | | |
| Underlying risk | | Options3 | | Futures4 | | Contracts5 | | Swaps6 | | Total |
| |
| |
| |
| |
| |
|
| Interest rate | | 68,766 | | 2,096,470 | | — | | 115,029 | | 2,280,265 |
| Foreign currency | | — | | — | | 49,469 | | — | | 49,469 |
| Total | | 68,766 | | 2,096,470 | | 49,469 | | 115,029 | | 2,329,734 |
| |
| Change in unrealized appreciation or (depreciation) on derivatives recognized in income ($)7 |
|
| | | | | | | Foreign | | | | |
| | | | | | | Currency | | | | |
| Underlying risk | | Options | | Futures | | Contracts | | Swaps | | Total |
| |
| |
| |
| |
| |
|
| Interest rate | | 83,800 | | (527,807) | | — | | (78,804) | | (522,811) |
| Total | | 83,800 | | (527,807) | | — | | (78,804) | | (522,811) |
| | Statement of Operations location: |
| 3 | Net realized gain (loss) on options transactions. |
| |
| 4 | Net realized gain (loss) on financial futures. |
| |
| 5 | Net realized gain (loss) on forward foreign currency exchange contracts. |
| |
| 6 | Net realized gain (loss) on swap transactions. |
| |
| 7 | Net change in unrealized appreciation (depreciation) on investments, financial futures, options transactions, forward foreign currency exchange contracts and swap transactions. |
| |
During the period ended July 31, 2009, the average notional value of interest rate contracts was $46,467,376, which represented 18.9% of average net assets.The average notional value of foreign currency contracts was $1,071,180, which represented .4% of average net assets.
Mortgage Dollar Rolls: A mortgage dollar roll transaction involves a sale by the fund of mortgage related securities that it holds with an agreement by the fund to repurchase similar securities at an agreed upon price and date.The securities purchased will bear the same interest rate as those sold, but generally will be collateralized by pools of mortgages with different prepayment histories than those securities sold.
Futures Contracts: In the normal course of pursuing its investment objectives, the fund is exposed to market risk (including equity price risk, interest rate risk and foreign currency exchange risk) as a result of changes in value of underlying financial instruments. The fund may invest in financial futures contracts in order to manage its exposure to
44
or protect against changes in the market.A futures contract represents a commitment for the future purchase or a sale of an asset at a specified date. Upon entering into such contracts, these investments require initial margin deposits with a broker, which consist of cash or cash equivalents. The amount of these deposits is determined by the exchange or Board ofTrade on which the contract is traded and is subject to change.Accordingly, variation margin payments are received or made to reflect daily unrealized gains or losses which are recorded in the Statement of Operations. Futures contracts are valued daily at the settlement price established by the Board of Trade or exchange upon which they are traded.When the contracts are closed, the fund recognizes a realized gain or loss.There is minimal counterparty credit risk to the fund with futures, since futures are exchange traded and the exchange’s clearinghouse, as counterparty to all exchange traded futures, guarantees the futures against default. Contracts open at July 31, 2009 are set forth in the Statement of Financial Futures.
Options: A call option gives the purchaser of the option the right (but not the obligation) to buy, and obligates the writer to sell, the underlying security or securities at the exercise price at any time during the option period, or at a specified date. Conversely, a put option gives the purchaser of the option the right (but not the obligation) to sell, and obligates the writer to buy the underlying security or securities at the exercise price at any time during the option period, or at a specified date.The fund may purchase and write (sell) put and call options primarily to hedge against changes in security prices, or securities that the fund intends to purchase, or against fluctuations in value caused by changes in prevailing market interest rates or other market conditions.
As a writer of call options, the fund receives a premium at the outset and then bears the market risk of unfavorable changes in the price of the financial instrument underlying the option. Generally, the fund would incur a gain, to the extent of the premium, if the price of the underlying financial instrument decreases between the date the option is written and the date on which the option is terminated. Generally,
The Fund 45
| NOTES TO FINANCIAL STATEMENTS (continued) |
the fund would realize a loss, if the price of the financial instrument increases between those dates.
As a writer of put options, the fund receives a premium at the outset and then bears the market risk of unfavorable changes in the price of the financial instrument underlying the option. Generally, the fund would incur a gain, to the extent of the premium, if the price of the underlying financial instrument increases between the date the option is written and the date on which the option is terminated. Generally, the fund would realize a loss, if the price of the financial instrument decreases between those dates. As a writer of an option, the fund may have no control over whether the underlying securities may be sold (call) or purchased (put) and as a result bear the market risk of an unfavorable change in the price of the security underlying the written option. One risk of holding a put or a call option is that if the option is not sold or exercised prior to its expiration, it becomes worthless. However, this risk is limited to the premium paid by the fund. Upon the expiration or closing of the option transaction, a gain or loss is reported in the Statement of Operations.
The following summarizes the fund’s call/put options written for the period ended July 31, 2009:
| | | Face Amount | | | | Options Terminated |
| | | | | | |
|
| | | Covered by | | Premiums | | | | Net Realized |
| Options Written: | | Contracts ($) | | Received ($) | | Cost ($) | | Gain (Loss) ($) |
| |
| |
| |
| |
|
| Contracts outstanding | | | | | | | | |
| July 31, 2008 | | — | | — | | | | |
| Contracts written | | 65,642,000 | | 495,133 | | | | |
| Contracts terminated: | | | | | | | | |
| Contracts closed | | 19,675,000 | | 130,377 | | 174,893 | | (44,516) |
| Contracts expired | | 25,531,000 | | 113,282 | | — | | 113,282 |
| Total contracts terminated | | 45,206,000 | | 243,659 | | 174,893 | | 68,766 |
| Contracts Outstanding | | | | | | | | |
| July 31, 2009 | | 20,436,000 | | 251,474 | | | | |
Forward Foreign Currency Exchange Contracts: The fund may enter into forward contracts in order to hedge its exposure to changes in foreign currency exchange rates on its foreign fund holdings, to settle foreign currency transactions or as a part of an investment strategy. When executing forward contracts, the fund is obligated to buy or sell
46
a foreign currency at a specified rate on a certain date in the future. With respect to sales of forward contracts, the fund would incur a loss if the value of the contracts increases between the date the forward contracts are opened and the date the forward contracts are closed.The fund realizes a gain if the value of the contracts decreases between those dates. With respect to purchases of forward contracts, the fund would incur a loss if the value of the contracts decreases between the date the forward contracts are opened and the date the forward contracts are closed.The fund realizes a gain if the value of the contracts increases between those dates.The fund is also exposed to credit risk associated with counterparty nonperformance on these forward contracts, which is typically limited to the unrealized gain on each open contract.At July 31, 2009, there were no open forward contracts.
Swaps:The fund may enter into swap agreements to exchange the interest rate on,or return generated by,one nominal instrument for the return generated by another nominal instrument. The fund enters into these agreements for a variety of reasons, including to hedge certain market or interest rate risks, to manage the interest rate sensitivity (sometimes called duration) of fixed income securities, to provide a substitute for purchasing or selling particular securities or to increase potential returns.
The fund accrues for the interim payments on swap contracts on a daily basis, with the net amount recorded within unrealized appreciation (depreciation) on swap contracts in the Statement of Assets and Liabilities. Once the interim payments are settled in cash, the net amount is recorded as realized gain (loss) on swaps, in addition to realized gain (loss) recorded upon the termination of swaps contracts in the Statement of Operations. Upfront payments made and/or received by the fund, are recorded as an asset and/or liability in the Statement of Assets and Liabilities and are recorded as a realized gain or loss ratably over the contract’s term/event with the exception of forward started interest rate swaps which are recorded as realized gains or losses on the termination date. Fluctuations in the value of swap contracts are recorded for financial statement purposes as unrealized appreciation or depreciation on swap transactions.
The Fund 47
| NOTES TO FINANCIAL STATEMENTS (continued) |
Interest Rate Swaps: Interest rate swaps involve the exchange of commitments to pay and receive interest based on a notional principal amount.The fund enters into these agreements for a variety of reasons, including to hedge certain market or interest rate risks, to manage the interest rate sensitivity (sometimes called duration) of fixed income securities, to provide a substitute for purchasing or selling particular securities or to increase potential returns.The fund may elect to pay a fixed rate and receive a floating rate, or receive a fixed rate and pay a floating rate on a notional principal amount.The net interest received or paid on interest rate swap agreements is included within unrealized appreciation (depreciation) on swap contracts in the Statement of Assets and Liabilities. Interest rate swaps are valued daily and the change, if any, is recorded as an unrealized gain or loss in the Statement of Operations. When a swap contract is terminated early, the fund records a realized gain or loss equal to the difference between the current realized value and the expected cash flows.
The fund’s maximum risk of loss from counterparty credit risk is the discounted net value of the cash flows to be received from the coun-terparty over the contract’s remaining life, to the extent that the amount is positive. This risk is mitigated by having a master netting arrangement between the fund and the counterparty and by the posting of collateral by the counterparty to the fund to cover the fund’s exposure to the counterparty.At July 31, 2009, the fund had no open interest rate swap contracts.
At July 31, 2009, the cost of investments for federal income tax purposes was $230,002,931; accordingly, accumulated net unrealized depreciation on investments was $1,381,529, consisting of $6,253,696 gross unrealized appreciation and $7,635,225 gross unrealized depreciation.
NOTE 5—Subsequent Events Evaluation:
Dreyfus has evaluated the need for disclosures and/or adjustments resulting from subsequent events through September 25, 2009, the date the financial statements were available to be issued. This evaluation did not result in any subsequent events that necessitated disclosures and/or adjustments.
48
REPORT OF INDEPENDENT REGISTERED
PUBLIC ACCOUNTING FIRM |
| | Shareholders and Board of Directors
Dreyfus Short Term Income Fund |
We have audited the accompanying statement of assets and liabilities, including the statements of investments, financial futures and options written, of Dreyfus ShortTerm Income Fund (formerly, Dreyfus Premier Short Term Income Fund), (one of the series comprising Dreyfus Investment Grade Funds, Inc.), as of July 31, 2009, and the related statement of operations for the year then ended, the statement of changes in net assets for each of the two years in the period then ended, and financial highlights for each of the years indicated therein. These financial statements and financial highlights are the responsibility of the Fund’s management. Our responsibility is to express an opinion on these financial statements and financial highlights based on our audits.
We conducted our audits in accordance with the standards of the Public Company Accounting Oversight Board (United States).Those standards require that we plan and perform the audit to obtain reasonable assurance about whether the financial statements and financial highlights are free of material misstatement.We were not engaged to perform an audit of the Fund’s internal control over financial reporting. Our audits included consideration of internal control over financial reporting as a basis for designing audit procedures that are appropriate in the circumstances, but not for the purpose of expressing an opinion on the effectiveness of the Fund’s internal control over financial reporting. Accordingly, we express no such opinion.An audit also includes examining, on a test basis, evidence supporting the amounts and disclosures in the financial statements and financial highlights, assessing the accounting principles used and significant estimates made by management, and evaluating the overall financial statement presentation. Our procedures included confirmation of securities owned as of July 31, 2009 by correspondence with the custodian and others.We believe that our audits provide a reasonable basis for our opinion.
In our opinion, the financial statements and financial highlights referred to above present fairly, in all material respects, the financial position of Dreyfus Short Term Income Fund at July 31, 2009, the results of its operations for the year then ended, the changes in its net assets for each of the two years in the period then ended, and the financial highlights for each of the indicated years, in conformity with U.S. generally accepted accounting principles.

New York, New York
September 25, 2009 |
The Fund 49
IMPORTANT TAX INFORMATION (Unaudited)
The fund hereby designates 99.21% of ordinary income dividends paid during the fiscal year ended July 31, 2009 as qualifying “interest related dividends”.
50
INFORMATION ABOUT THE REVIEW AND APPROVAL
OF THE FUND’S MANAGEMENT AGREEMENT (Unaudited) |
At a meeting of the Board of Directors of the fund held on July 14 and 15, 2009, the Board considered the re-approval for an annual period (through July 29, 2010) of the Management Agreement with Dreyfus for the fund, pursuant to which Dreyfus provides the fund with investment advisory and administrative services. The Board members, none of whom are “interested persons” (as defined in the Investment Company Act of 1940, as amended) of the fund, were assisted in their review by independent legal counsel and met with counsel in executive session separate from representatives of Dreyfus.
Analysis of Nature, Extent and Quality of Services Provided to the Fund. The Board members received a presentation from representatives of Dreyfus regarding services provided to the fund and other funds in the Dreyfus fund complex, and discussed the nature, extent and quality of the services provided to the fund pursuant to its Management Agreement. Dreyfus’ representatives reviewed the fund’s distribution of accounts and the relationships Dreyfus has with various intermediaries and the different needs of each. Dreyfus’ representatives noted the distribution channels for the fund as well as the diversity of distribution among the funds in the Dreyfus fund complex, and Dreyfus’ corresponding need for broad, deep, and diverse resources to be able to provide ongoing shareholder services to each distribution channel, including those of the fund. Dreyfus also provided the number of shareholder accounts in the fund, as well as the fund’s asset size.
The Board members also considered Dreyfus’ research and portfolio management capabilities and that Dreyfus also provides oversight of day-to-day fund operations, including fund accounting and administration and assistance in meeting legal and regulatory requirements. The Board members also considered Dreyfus’ extensive administrative, accounting and compliance infrastructure.The Board also considered Dreyfus’ brokerage policies and practices and the standards applied in seeking best execution.
Comparative Analysis of the Fund’s Performance and Management Fee and Expense Ratio. The Board members reviewed the performance of the fund’s Class D shares and comparisons to a group of retail no-load
The Fund 51
INFORMATION ABOUT THE REVIEW AND APPROVAL OF THE
FUND’S MANAGEMENT AGREEMENT (Unaudited) (continued) |
short investment-grade debt funds (the “Performance Group”) and to a larger universe of funds, consisting of all retail and institutional short investment-grade debt funds (the “Performance Universe”), selected and provided by Lipper, Inc., an independent provider of investment company data. The Board was provided with a description of the methodology Lipper used to select the Performance Group and Performance Universe, as well as the Expense Group and Expense Universe (discussed below).The Board members discussed the results of the comparisons for various periods ended May 31, 2009. The Board members noted that the fund’s total return performance was below the Performance Group medians for all periods and below the Performance Universe medians for all periods except one.The Board members noted that the fund’s yield performance was above the Performance Group and Performance Universe medians for all periods. Dreyfus representatives noted that the fund’s performance was in the first quartile of its Lipper category for the more recent 3-month and 5-month periods ended May 31, 2009. Representatives of Dreyfus discussed certain factors that affected the fund’s relative performance, including the fund’s consistent investment approach and the impact that the investment environment (as impacted by the housing and credit crises, the Lehman bankruptcy filing, etc.) had on the fund’s investment approach over the last year or more. Dreyfus also provided a comparison of the fund’s total returns to the returns of the fund’s benchmark index for each of the calendar years for the prior ten years.
The Board members also discussed the fund’s management fee and expense ratio and reviewed the range of management fees and expense ratios as compared to a comparable group of funds (the “Expense Group”) and a broader group of funds (the “Expense Universe”), each selected and provided by Lipper. The Board members noted that the fund’s contractual management fee was at the Expense Group median, and that the actual management fee and expense ratio were above the Expense Group and Expense Universe medians.
Representatives of Dreyfus stated that there were no other mutual funds or other accounts managed by Dreyfus or its affiliates with sim-
52
ilar investment objectives, policies and strategies as the fund. Dreyfus’ representatives also reviewed the costs associated with distribution through intermediaries.
Analysis of Profitability and Economies of Scale. Dreyfus’ representatives reviewed the dollar amount of expenses allocated and profit received by Dreyfus and the method used to determine such expenses and profit.The Board considered information, previously provided and discussed, prepared by an independent consulting firm regarding Dreyfus’ approach to allocating costs to, and determining the profitability of, individual funds and the entire Dreyfus mutual fund complex. The Board members also considered that the methodology had also been reviewed by an independent registered public accounting firm which, like the consultant, found the methodology to be reasonable. The consulting firm also analyzed where any economies of scale might emerge in connection with the management of the fund. The Board members evaluated the profitability analysis in light of the relevant circumstances for the fund and the extent to which economies of scale would be realized if the fund grows and whether fee levels reflect these economies of scale for the benefit of fund investors.The Board members also considered potential benefits to Dreyfus from acting as investment adviser and noted that there were no soft dollar arrangements with respect to trading the fund’s investments.
It was noted that the Board members should consider Dreyfus’ profitability with respect to the fund as part of their evaluation of whether the fees under the Management Agreement bear a reasonable relationship to the mix of services provided by Dreyfus, including the nature, extent and quality of such services and that a discussion of economies of scale is predicated on increasing assets and that, if a fund’s assets had been decreasing, the possibility that Dreyfus may have realized any economies of scale would be less. It also was noted that the profitability percentage for managing the fund was within ranges determined by appropriate court cases to be reasonable given the services rendered and generally superior service levels provided.
The Fund 53
INFORMATION ABOUT THE REVIEW AND APPROVAL OF THE
FUND’S MANAGEMENT AGREEMENT (Unaudited) (continued) |
At the conclusion of these discussions, the Board agreed that it had been furnished with sufficient information to make an informed business decision with respect to continuation of the Management Agreement, with respect to the fund. Based on the discussions and considerations as described above, the Board made the following conclusions and determinations.
- The Board concluded that the nature, extent and quality of the ser- vices provided by Dreyfus are adequate and appropriate.
- The Board, noting the fund’s total return performance (including its more recent 3-month and 5-month performance) and the impact that the relatively recent investment environment has had on the fund’s performance, was satisfied with the fund’s yield performance and expressed confidence in the fund’s portfolio management team, which continued to apply a consistent investment strategy.
- The Board concluded that the fee paid by the fund to Dreyfus was reasonable in light of the services provided, comparative performance, expense and management fee information, costs of the services pro- vided and profits to be realized and benefits derived or to be derived by Dreyfus from its relationship with the fund.
- The Board determined that the economies of scale which may accrue to Dreyfus and its affiliates in connection with the manage- ment of the fund had been adequately considered by Dreyfus in connection with the management fee rate charged to the fund and that, to the extent in the future it were determined that material economies of scale had not been shared with the fund, the Board would seek to have those economies of scale shared with the fund.
The Board members considered these conclusions and determinations, along with information received on a routine and regular basis throughout the year, and, without any one factor being dispositive, the Board determined that re-approval of the Management Agreement,with respect to the fund, was in the best interests of the fund and its shareholders.
54

The Fund 55
56
The Fund 57

58
NOTES
For More Information

Telephone Call your financial representative or 1-800-554-4611
Mail The Dreyfus Family of Funds, 144 Glenn Curtiss Boulevard, Uniondale, NY 11556-0144
The fund files its complete schedule of portfolio holdings with the Securities and Exchange Commission (“SEC”) for the first and third quarters of each fiscal year on Form N-Q. The fund’s Forms N-Q are available on the SEC’s website at http://www.sec.gov and may be reviewed and copied at the SEC’s Public Reference Room in Washington, DC. Information on the operation of the Public Reference Room may be obtained by calling 1-800-SEC-0330.
A description of the policies and procedures that the fund uses to determine how to vote proxies relating to portfolio securities, and information regarding how the fund voted these proxies for the most recent 12-month period ended June 30 is available at http://www.dreyfus.com and on the SEC’s website at http://www.sec.gov. The description of the policies and procedures is also available without charge, upon request, by calling 1-800-645-6561.
© 2009 MBSC Securities Corporation

Item 2. Code of Ethics.
The Registrant has adopted a code of ethics that applies to the Registrant's principal executive officer, principal financial officer, principal accounting officer or controller, or persons performing similar functions. There have been no amendments to, or waivers in connection with, the Code of Ethics during the period covered by this Report.
Item 3. Audit Committee Financial Expert.
The Registrant's Board has determined that Joseph S. DiMartino, a member of the Audit Committee of the Board, is an audit committee financial expert as defined by the Securities and Exchange Commission (the "SEC"). Joseph S. DiMartino is "independent" as defined by the SEC for purposes of audit committee financial expert determinations.
Item 4. Principal Accountant Fees and Services.
(a) Audit Fees. The aggregate fees billed for each of the last two fiscal years (the "Reporting Periods") for professional services rendered by the Registrant's principal accountant (the "Auditor") for the audit of the Registrant's annual financial statements or services that are normally provided by the Auditor in connection with the statutory and regulatory filings or engagements for the Reporting Periods, were $120,622 in 2008 and $99,257 in 2009.
(b) Audit-Related Fees. The aggregate fees billed in the Reporting Periods for assurance and related services by the Auditor that are reasonably related to the performance of the audit of the Registrant's financial statements and are not reported under paragraph (a) of this Item 4 were $25,764 in 2008 and $15,828 in 2009.
The aggregate fees billed in the Reporting Periods for non-audit assurance and related services by the Auditor to the Registrant's investment adviser (not including any sub-investment adviser whose role is primarily portfolio management and is subcontracted with or overseen by another investment adviser), and any entity controlling, controlled by or under common control with the investment adviser that provides ongoing services to the Registrant ("Service Affiliates"), that were reasonably related to the performance of the annual audit of the Service Affiliate, which required pre-approval by the Audit Committee were $0 in 2008 and $0 in 2009.
(c) Tax Fees. The aggregate fees billed in the Reporting Periods for professional services rendered by the Auditor for tax compliance, tax advice, and tax planning ("Tax Services") were $ 13,474 in 2008 and $10,732 in 2009. These services consisted of: (i) review or preparation of U.S. federal, state, local and excise tax returns; (ii) U.S. federal, state and local tax planning, advice and assistance regarding statutory, regulatory or administrative developments; (iii) tax advice regarding tax qualification matters and/or treatment of various financial instruments held or proposed to be acquired or held. The aggregate fees billed in the Reporting Periods for Tax Services by the Auditor to Service Affiliates, which required pre-approval by the Audit Committee were $0 in 2008 and $0 in 2009.
(d) All Other Fees. The aggregate fees billed in the Reporting Periods for products and services provided by the Auditor, other than the services reported in paragraphs (a) through (c) of this Item, were $343 in 2008 and $426 in 2009. [These services consisted of a review of the Registrant's anti-money laundering program].
The aggregate fees billed in the Reporting Periods for Non-Audit Services by the Auditor to Service Affiliates, other than the services reported in paragraphs (b) through (c) of this Item, which required pre-approval by the Audit Committee, were $0 in 2008 and $0 in 2009.
SSL-DOCS2 70128344v15
Note: In each of (b) through (d) of this Item 4, 100% of all services provided by the Auditor were pre-approved as required.
Audit Committee Pre-Approval Policies and Procedures. The Registrant's Audit Committee has established policies and procedures (the "Policy") for pre-approval (within specified fee limits) of the Auditor's engagements for non-audit services to the Registrant and Service Affiliates without specific case-by-case consideration. Pre-approval considerations include whether the proposed services are compatible with maintaining the Auditor's independence. Pre-approvals pursuant to the Policy are considered annually.
Non-Audit Fees. The aggregate non-audit fees billed by the Auditor for services rendered to the Registrant, and rendered to Service Affiliates, for the Reporting Periods were $3,157,478 in 2008 and $22,703,649 in 2009.
Auditor Independence. The Registrant's Audit Committee has considered whether the provision of non-audit services that were rendered to Service Affiliates, which were not pre-approved (not requiring pre-approval), is compatible with maintaining the Auditor's independence.
| Item 5. | | Audit Committee of Listed Registrants. |
| | | Not applicable. [CLOSED-END FUNDS ONLY] |
| Item 6. | | Investments. |
| (a) | | Not applicable. |
| Item 7. | | Disclosure of Proxy Voting Policies and Procedures for Closed-End Management |
| | | Investment Companies. |
| | | Not applicable. [CLOSED-END FUNDS ONLY] |
| Item 8. | | Portfolio Managers of Closed-End Management Investment Companies. |
| | | Not applicable. [CLOSED-END FUNDS ONLY, beginning with reports for periods ended |
| | | on and after December 31, 2005] |
| Item 9. | | Purchases of Equity Securities by Closed-End Management Investment Companies and |
| | | Affiliated Purchasers. |
| | | Not applicable. [CLOSED-END FUNDS ONLY] |
| Item 10. | | Submission of Matters to a Vote of Security Holders. |
| There have been no material changes to the procedures applicable to Item 10. |
| |
| Item 11. | | Controls and Procedures. |
(a) The Registrant's principal executive and principal financial officers have concluded, based on their evaluation of the Registrant's disclosure controls and procedures as of a date within 90 days of the filing date of this report, that the Registrant's disclosure controls and procedures are reasonably designed to ensure that information required to be disclosed by the Registrant on Form N-CSR is recorded, processed, summarized and reported within the required time periods and that information required to be disclosed by the Registrant
SSL-DOCS2 70128344v15
in the reports that it files or submits on Form N-CSR is accumulated and communicated to the Registrant's management, including its principal executive and principal financial officers, as appropriate to allow timely decisions regarding required disclosure.
(b) There were no changes to the Registrant's internal control over financial reporting that occurred during the second fiscal quarter of the period covered by this report that have materially affected, or are reasonably likely to materially affect, the Registrant's internal control over financial reporting.
(a)(1) Code of ethics referred to in Item 2.
(a)(2) Certifications of principal executive and principal financial officers as required by Rule 30a-2(a) under the Investment Company Act of 1940.
(a)(3) Not applicable.
(b) Certification of principal executive and principal financial officers as required by Rule 30a-2(b) under the Investment Company Act of 1940.
SSL-DOCS2 70128344v15
Pursuant to the requirements of the Securities Exchange Act of 1934 and the Investment Company Act of 1940, the Registrant has duly caused this Report to be signed on its behalf by the undersigned, thereunto duly authorized.
Dreyfus Investment Grade Funds, Inc.
| By: | | /s/ J. David Officer |
| | |
|
| | | J. David Officer, |
| | | President |
| |
| Date: | | Tuesday, September 22, 2009 |
Pursuant to the requirements of the Securities Exchange Act of 1934 and the Investment Company Act of 1940, this Report has been signed below by the following persons on behalf of the Registrant and in the capacities and on the dates indicated.
| By: | | /s/ J. David Officer |
| | |
|
| | | J. David Officer, |
| | | President |
| |
| Date: | | Tuesday, September 22, 2009 |
| By: | | /s/ James Windels |
| | |
|
| | | James Windels, |
| | | Treasurer |
| |
| Date: | | Tuesday, September 22, 2009 |
(a)(1) Code of ethics referred to in Item 2.
(a)(2) Certifications of principal executive and principal financial officers as required by Rule 30a-2(a) under the Investment Company Act of 1940. (EX-99.CERT)
(b) Certification of principal executive and principal financial officers as required by Rule 30a-2(b) under the Investment Company Act of 1940. (EX-99.906CERT)
SSL-DOCS2 70128344v15