UNITED STATES
SECURITIES AND EXCHANGE COMMISSION
Washington, D.C. 20549
FORM N-CSR/A
CERTIFIED SHAREHOLDER REPORT OF REGISTERED MANAGEMENT
INVESTMENT COMPANIES
Investment Company Act file number | 811- 6718 |
| |
| Dreyfus Investment Grade Funds, Inc. | |
| (Exact name of Registrant as specified in charter) | |
| | |
| c/o The Dreyfus Corporation 200 Park Avenue New York, New York 10166 | |
| (Address of principal executive offices) (Zip code) | |
| | |
| Michael A. Rosenberg, Esq. 200 Park Avenue New York, New York 10166 | |
| (Name and address of agent for service) | |
|
Registrant's telephone number, including area code: | (212) 922-6000 |
| |
Date of fiscal year end: | 7/31 | |
Date of reporting period: | 7/31/11 | |
| | | | | | | |
FORM N-CSR/A
Item 1. Reports to Stockholders.
| |
| Dreyfus |
| Inflation Adjusted |
| Securities Fund |
ANNUAL REPORT July 31, 2011

Save time. Save paper. View your next shareholder report online as soon as it’s available. Log into www.dreyfus.com and sign up for Dreyfus eCommunications. It’s simple and only takes a few minutes.
The views expressed in this report reflect those of the portfolio manager only through the end of the period covered and do not necessarily represent the views of Dreyfus or any other person in the Dreyfus organization. Any such views are subject to change at any time based upon market or other conditions and Dreyfus disclaims any responsibility to update such views.These views may not be relied on as investment advice and, because investment decisions for a Dreyfus fund are based on numerous factors, may not be relied on as an indication of trading intent on behalf of any Dreyfus fund.
Not FDIC-Insured • Not Bank-Guaranteed • May Lose Value
| | Contents |
| | THE FUND |
| 2 | A Letter from the Chairman and CEO |
| 3 | Discussion of Fund Performance |
| 6 | Fund Performance |
| 8 | Understanding Your Fund’s Expenses |
| 8 | Comparing Your Fund’s Expenses With Those of Other Funds |
| 9 | Statement of Investments |
| 11 | Statement of Assets and Liabilities |
| 12 | Statement of Operations |
| 13 | Statement of Changes in Net Assets |
| 15 | Financial Highlights |
| 17 | Notes to Financial Statements |
| 26 | Report of Independent Registered Public Accounting Firm |
| 27 | Important Tax Information |
| 28 | Information About the Renewal of the Fund’s Management Agreement |
| 33 | Board Members Information |
| 35 | Officers of the Fund |
| | FOR MORE INFORMATION |
| | Back Cover |
Dreyfus
Inflation Adjusted
Securities Fund
The Fund

A LETTER FROM THE CHAIRMAN AND CEO
Dear Shareholder:
We are pleased to present this annual report for Dreyfus Inflation Adjusted Securities Fund, covering the 12-month period from August 1, 2010, through July 31, 2011. For information about how the fund performed during the reporting period, as well as general market perspectives, we provide a Discussion of Fund Performance on the pages that follow.
Although the reporting period began on an optimistic note with a renewed commitment by the Federal Reserve Board (the “Fed”) to avoid a return to recession, the reporting period ended amid sharply deteriorating investor sentiment due to disappointing economic data, a persistent sovereign debt crisis in Europe and a contentious debate regarding taxes, spending and borrowing in the United States. In fact, just days after the reporting period’s end, U.S. lawmakers enacted legislation to raise the nation’s debt ceiling and a major credit rating agency downgraded U.S. long-term debt, marking the first time in history that U.S. Treasury securities were not assigned the highest possible credit rating. Fixed-income securities proved volatile in this tumultuous environment, as the stalled economy caused higher yielding market sectors to give back many of the reporting period’s previous gains while U.S. government securities rallied.
The economic outlook currently is clouded by heightened market volatility and political in-fighting; however, we currently believe that a sustained, moderate global expansion is more likely than a double-dip recession. Inflationary pressures appear to be waning in most countries, including the United States, as energy prices have retreated from their highs. Consequently, the Fed is likely to maintain aggressively accommodative monetary policy, which may help offset the financial stresses caused by recent fiscal policy choices in the United States and Europe.To assess how these and other developments may affect your investments, we encourage you, as always, to speak with your financial advisor.
Thank you for your continued confidence and support.

Jonathan R. Baum
Chairman and Chief Executive Officer
The Dreyfus Corporation
August 15, 2011
2

DISCUSSION OF FUND PERFORMANCE
For the period of August 1, 2010, through July 31, 2011, as provided by Robert Bayston, Portfolio Manager
Fund and Market Performance Overview
For the 12-month period ended July 31, 2011, Dreyfus Inflation Adjusted Securities Fund’s Institutional shares produced a total return of 10.95%, and the fund’s Investor shares returned 10.60%.1 In comparison, the fund’s benchmark, the Barclays Capital U.S.Treasury Inflation Protected Securities Index (the “Index”), produced a total return of 11.79% for the same period.2
Treasury Inflation Protected Securities (“TIPS”) produced highly competitive returns during the reporting period, mainly due to inflation accruals stemming from improved economic conditions over the fall of 2010 and sharply higher energy prices during the first quarter of 2011. The fund produced lower returns than its benchmark, primarily as a result of shortfalls in our interest-rate strategies.
The Fund’s Investment Approach
The fund seeks returns that exceed the rate of inflation.To pursue its goal, the fund normally invests at least 80% of its assets in inflation-indexed securities, which are fixed-income securities designed to protect investors from a loss of value due to inflation by periodically adjusting their principal and/or coupon according to the rate of inflation.
The fund invests primarily in high-quality, U.S. dollar-denominated, inflation-indexed securities.To a limited extent, the fund may invest in foreign currency-denominated, inflation-protected securities and other fixed-income securities not adjusted for inflation, including U.S. government bonds and notes, corporate bonds, mortgage-related securities and asset-backed securities.The fund seeks to keep its average effective duration between two and 10 years, and the fund may invest in securities of any maturity without restriction.
Shifting Economic Sentiment Sparked Market Volatility
Investors’ outlooks began to improve from depressed levels early in the reporting period as the financial markets responded positively to
DISCUSSION OF FUND PERFORMANCE (continued)
an announcement by the Federal Reserve Board (the “Fed”) that it would soon begin a massive quantitative easing program to stimulate greater U.S. economic growth.A more optimistic outlook was reinforced by subsequent improvements in employment, consumer spending and corporate earnings. These developments sent prices of U.S. government securities lower when investors anticipated higher interest rates, but TIPS generally held up better than nominal U.S. Treasury securities as investors anticipated a possible acceleration of inflation in a more robust economy.
Investors began to question the sustainability of the economic recovery in February 2011, when political unrest in the Middle East led to sharply rising energy prices, and again in March, when natural and nuclear disasters in Japan threatened to disrupt the industrial supply chain for global manufacturers.The spike in energy prices and renewed economic concerns proved beneficial to TIPS, as prices were boosted by inflation accruals and a“flight to quality” among newly risk-averse investors.While prices of nominal U.S. Treasuries subsequently moderated as investors’ concerns eased, energy prices for TIPS remained elevated.
In late April, economic sentiment began to deteriorate in earnest when Greece appeared headed for default on its sovereign debt, U.S. economic data proved more disappointing than expected and a contentious debate regarding U.S. government spending and borrowing intensified. Some of these worries came to a head just days after the reporting period’s end, when Congress raised the U.S. debt ceiling and Standard & Poor’s downgraded its credit rating on long-term U.S. debt securities. Consequently, the reporting period ended with a renewed flight to quality that sent nominal yields back toward historical lows. Real yields also declined, but not as sharply as nominal yields.
Interest-Rate Strategies Dampened Fund Performance
Although the fund participated to a substantial degree in the strong total returns produced by TIPS during the reporting period, our interest rate strategies prevented it from matching the benchmark’s returns. A relatively long average duration at the end of 2010 magnified market weakness at the time, and we emphasized intermediate-term TIPS at a time when short-term securities fared better. Later in the reporting period, a more defensive interest-rate posture prevented the fund from fully capturing the benefits of the rally among U.S.Treasury securities.
4
A More Defensive Investment Posture
We have adopted a more defensive investment posture in light of the developments now roiling the financial markets, and in anticipation of waning inflationary pressures. Because economic weakness may cause yield differences along the market’s maturity spectrum to narrow, we have established a mildly overweighted position among TIPS in the 10-year maturity range.
If the Fed responds to recent developments with measures that keep the U.S. economic recovery intact, we may adopt a more constructive investment posture. But until we see stronger evidence that the uncertainty confronting the U.S. and global economies is behind us, we intend to keep the fund’s composition and interest-rate positioning roughly in line with market averages.
August 15, 2011
| | |
| | Bond funds are subject generally to interest rate, credit, liquidity and market risks, to varying |
| | degrees, all of which are more fully described in the fund’s prospectus. Generally, all other factors |
| | being equal, bond prices are inversely related to interest-rate changes, and rate increases can cause |
| | price declines. |
| | Interest payments on inflation-protected bonds will vary as the bond’s principal value is |
| | periodically adjusted based on the rate of inflation. If the index measuring inflation falls, the |
| | interest payable on these securities will be reduced.Any increase in the principal amount of an |
| | inflation-protected bond (which follows a rise in the relevant inflation index), will be considered |
| | taxable ordinary income, even though investors do not receive their principal until maturity. |
| | During periods of rising interest rates and flat or declining inflation rates, inflation-protected bonds |
| | can underperform. Inflation-protected bonds issued by corporations generally do not guarantee |
| | repayment of principal. |
| | The fund may use derivative instruments, such as options, futures and options on futures, forward |
| | contracts, swaps (including credit default swaps on corporate bonds and asset-backed securities), |
| | options on swaps and other credit derivatives.A small investment in derivatives could have a |
| | potentially large impact on the fund’s performance.The use of derivatives involves risks different |
| | from, or possibly greater than, the risks associated with investing directly in the underlying assets. |
| 1 | Total return includes reinvestment of dividends and any capital gains paid. Past performance is no |
| | guarantee of future results. Share price, yield and investment return fluctuate such that upon |
| | redemption, fund shares may be worth more or less than their original cost. |
| 2 | SOURCE: LIPPER INC. — Reflects reinvestment of dividends and, where applicable, capital |
| | gain distributions.The Barclays Capital U.S.Treasury Inflation Protected Securities Index is a |
| | sub-index of the U.S.Treasury component of the Barclays Capital U.S. Government Index. |
| | Securities in the Barclays Capital U.S.Treasury Inflation Protected Securities Index are dollar- |
| | denominated, non-convertible, publicly issued, fixed-rate, investment-grade (Moody’s Baa3 or |
| | better) U.S.Treasury inflation notes, with at least one year to final maturity and at least $100 |
| | million par amount outstanding. Investors cannot invest directly in any index. |
FUND PERFORMANCE

| |
| Comparison of change in value of $10,000 investment in Dreyfus Inflation Adjusted Securities |
| Fund Investor shares and Institutional shares and the Barclays Capital U.S. Treasury Inflation |
| Protected Securities Index |
| † Source: Lipper Inc. |
| Past performance is not predictive of future performance. |
| The above graph compares a $10,000 investment made in Investor and Institutional shares of Dreyfus Inflation |
| Adjusted Securities Fund on 10/31/02 (inception date) to a $10,000 investment made in the Barclays Capital |
| U. S. Treasury Inflation Protected Securities Index (the “Index”) on that date. All dividends and capital gain |
| distributions are reinvested. |
| The fund’s performance shown in the line graph takes into account all applicable fees and expenses.The Index is a sub- |
| index of the U.S.Treasury component of the Barclays Capital U.S. Government Index. Securities in the Index are |
| dollar-denominated, non-convertible, publicly-issued, fixed-rate, investment-grade (Moody’s Baa3 or better) U.S.Treasury |
| inflation notes, with at least one year to final maturity and at least $100 million par amount outstanding. Unlike a |
| mutual fund, the Index is not subject to charges, fees and other expenses. Investors cannot invest directly in any index. |
| Further information relating to fund performance, including expense reimbursements, if applicable, is contained in the |
| Financial Highlights section of the prospectus and elsewhere in this report. |
6
| | | | | |
| Average Annual Total Returns as of 7/31/11 | | |
| |
| | Inception | | | From |
| | Date | 1 Year | 5 Years | Inception |
| Investor shares | 10/31/02 | 10.60% | 6.81% | 6.09% |
| Institutional shares | 10/31/02 | 10.95% | 7.10% | 6.37% |
| Barclays Capital | | | | |
| U.S. Treasury | | | | |
| Inflation Protected | | | | |
| Securities Index | 10/31/02 | 11.79% | 7.38% | 6.81% |
Past performance is not predictive of future performance.The fund’s performance shown in the graph and table does not reflect the deduction of taxes that a shareholder would pay on fund distributions or the redemption of fund shares.
UNDERSTANDING YOUR FUND’S EXPENSES (Unaudited)
As a mutual fund investor, you pay ongoing expenses, such as management fees and other expenses. Using the information below, you can estimate how these expenses affect your investment and compare them with the expenses of other funds.You also may pay one-time transaction expenses, including sales charges (loads) and redemption fees, which are not shown in this section and would have resulted in higher total expenses. For more information, see your fund’s prospectus or talk to your financial adviser.
Review your fund’s expenses
The table below shows the expenses you would have paid on a $1,000 investment in Dreyfus Inflation Adjusted Securities Fund from February 1, 2011 to July 31, 2011. It also shows how much a $1,000 investment would be worth at the close of the period, assuming actual returns and expenses.
Expenses and Value of a $1,000 Investment
assuming actual returns for the six months ended July 31, 2011
| | | |
| | Investor Shares | Institutional Shares |
| Expenses paid per $1,000† | $3.79 | $2.08 |
| Ending value (after expenses) | $1,091.80 | $1,094.20 |
COMPARING YOUR FUND’S EXPENSES
WITH THOSE OF OTHER FUNDS (Unaudited)
Using the SEC’s method to compare expenses
The Securities and Exchange Commission (SEC) has established guidelines to help investors assess fund expenses. Per these guidelines, the table below shows your fund’s expenses based on a $1,000 investment, assuming a hypothetical 5% annualized return. You can use this information to compare the ongoing expenses (but not transaction expenses or total cost) of investing in the fund with those of other funds.All mutual fund shareholder reports will provide this information to help you make this comparison. Please note that you cannot use this information to estimate your actual ending account balance and expenses paid during the period.
Expenses and Value of a $1,000 Investment
assuming a hypothetical 5% annualized return for the six months ended July 31, 2011
| | | |
| | Investor Shares | Institutional Shares |
| Expenses paid per $1,000† | $3.66 | $2.01 |
| Ending value (after expenses) | $1,021.17 | $1,022.81 |
| |
| † Expenses are equal to the fund’s annualized expense ratio of .73% for Investor Shares and .40% for Institutional |
| Shares, multiplied by the average account value over the period, multiplied by 181/365 (to reflect the one-half |
| year period). |
8
| |
| STATEMENT OF INVESTMENTS |
| July 31, 2011 |
| | | |
| | Principal | |
| Bonds and Notes—99.6% | Amount ($) | Value ($) |
| U.S. Treasury Inflation Protected Securities: | | |
| 0.13%, 4/15/16 | 28,593,107 a | 29,873,106 |
| 0.50%, 4/15/15 | 234,570 a | 248,498 |
| 0.63%, 4/15/13 | 5,980,513 a,b | 6,181,423 |
| 0.63%, 7/15/21 | 10,511,946 a | 10,764,065 |
| 1.13%, 1/15/21 | 21,539,257 a,b | 23,223,691 |
| 1.25%, 7/15/20 | 6,687,187 a | 7,331,350 |
| 1.38%, 7/15/18 | 3,352,698 a,b | 3,745,594 |
| 1.38%, 1/15/20 | 7,653,022 a | 8,486,482 |
| 1.63%, 1/15/18 | 8,363,322 a | 9,446,631 |
| 1.75%, 1/15/28 | 4,675,048 a | 5,249,205 |
| 1.88%, 7/15/13 | 32,739,824 a | 34,901,176 |
| 2.00%, 1/15/14 | 5,755,414 a | 6,246,874 |
| 2.00%, 7/15/14 | 1,882,981 a | 2,072,015 |
| 2.00%, 1/15/16 | 11,667,731 a | 13,201,851 |
| 2.00%, 1/15/26 | 13,428,704 a | 15,597,225 |
| 2.13%, 2/15/40 | 7,850,177 a | 9,254,621 |
| 2.13%, 2/15/41 | 4,369,339 a | 5,158,551 |
| 2.38%, 1/15/25 | 5,158,721 a | 6,268,248 |
| 2.38%, 1/15/27 | 2,800,813 a | 3,409,116 |
| 2.50%, 7/15/16 | 6,630,729 a | 7,739,307 |
| 2.50%, 1/15/29 | 7,292,483 a | 9,056,353 |
| 2.63%, 7/15/17 | 8,002,413 a | 9,534,747 |
| 3.63%, 4/15/28 | 11,371,924 a,b | 15,918,033 |
| 3.88%, 4/15/29 | 6,308,152 a,b | 9,208,426 |
| Total Bonds and Notes | | |
| (cost $236,036,466) | | 252,116,588 |
STATEMENT OF INVESTMENTS (continued)
| | | |
| Other Investment—.4% | Shares | Value ($) |
| Registered Investment Company; | | |
| Dreyfus Institutional Preferred | | |
| Plus Money Market Fund | | |
| (cost $1,133,000) | 1,133,000 c | 1,133,000 |
| |
| Total Investments (cost $237,169,466) | 100.0% | 253,249,588 |
| Liabilities, Less Cash and Receivables | (.0%) | (80,576) |
| Net Assets | 100.0% | 253,169,012 |
| |
| a Principal amount for accrual purposes is periodically adjusted based on changes in the Consumer Price Index. |
| b Security, or portion thereof, on loan.At July 31, 2011, the value of the fund’s securities on loan was $31,201,647 and |
| the value of the collateral held by the fund was $32,052,148, consisting of U.S Government & Agency Securities. |
| c Investment in affiliated money market mutual fund. |
| | | | |
| Portfolio Summary (Unaudited)† | | |
| | Value (%) | | Value (%) |
| U.S. Government & Agencies | 99.6 | Money Market Investments | .4 |
| | | | 100.0 |
| † Based on net assets. | | | |
| See notes to financial statements. | | | |
10
| |
| STATEMENT OF ASSETS AND LIABILITIES |
| July 31, 2011 |
| | | |
| | Cost | Value |
| Assets ($): | | |
| Investments in securities—See Statement of Investments (including | |
| securities on loan, valued at $31,201,647)—Note 1(b): | | |
| Unaffiliated issuers | 236,036,466 | 252,116,588 |
| Affiliated issuers | 1,133,000 | 1,133,000 |
| Receivable for investment securities sold | | 12,281,766 |
| Receivable for shares of Common Stock subscribed | | 646,455 |
| Dividends and interest receivable | | 464,197 |
| Prepaid expenses | | 4,567 |
| | | 266,646,573 |
| Liabilities ($): | | |
| Due to The Dreyfus Corporation and affiliates—Note 3(b) | | 82,038 |
| Cash overdraft due to Custodian | | 499,374 |
| Payable for investment securities purchased | | 12,648,938 |
| Payable for shares of Common Stock redeemed | | 177,407 |
| Accrued expenses | | 69,804 |
| | | 13,477,561 |
| Net Assets ($) | | 253,169,012 |
| Composition of Net Assets ($): | | |
| Paid-in capital | | 234,325,529 |
| Accumulated undistributed investment income—net | | 1,874,364 |
| Accumulated net realized gain (loss) on investments | | 888,997 |
| Accumulated net unrealized appreciation | | |
| (depreciation) on investments | | 16,080,122 |
| Net Assets ($) | | 253,169,012 |
| |
| |
| Net Asset Value Per Share | | |
| | Investor Shares | Institutional Shares |
| Net Assets ($) | 46,476,443 | 206,692,569 |
| Shares Outstanding | 3,396,984 | 15,112,977 |
| Net Asset Value Per Share ($) | 13.68 | 13.68 |
| |
| See notes to financial statements. | | |
| |
| STATEMENT OF OPERATIONS |
| Year Ended July 31, 2011 |
| | |
| Investment Income ($): | |
| Income: | |
| Interest | 9,755,912 |
| Income from securities lending—Note 1(b) | 11,351 |
| Dividends; | |
| Affiliated issuers | 1,640 |
| Total Income | 9,768,903 |
| Expenses: | |
| Management fee—Note 3(a) | 585,505 |
| Shareholder servicing costs—Note 3(b) | 163,371 |
| Auditing fees | 47,880 |
| Registration fees | 46,575 |
| Custodian fees—Note 3(b) | 19,840 |
| Directors’ fees and expenses—Note 3(c) | 18,049 |
| Prospectus and shareholders’ reports | 16,470 |
| Legal fees | 4,788 |
| Loan commitment fees—Note 2 | 1,924 |
| Miscellaneous | 17,443 |
| Total Expenses | 921,845 |
| Less—reduction in fees due to earnings credits—Note 3(b) | (67) |
| Net Expenses | 921,778 |
| Investment Income—Net | 8,847,125 |
| Realized and Unrealized Gain (Loss) on Investments—Note 4 ($): | |
| Net realized gain (loss) on investments | 2,414,887 |
| Net unrealized appreciation (depreciation) on investments | 10,813,042 |
| Net Realized and Unrealized Gain (Loss) on Investments | 13,227,929 |
| Net Increase in Net Assets Resulting from Operations | 22,075,054 |
| |
| See notes to financial statements. | |
12
STATEMENT OF CHANGES IN NET ASSETS
| | | |
| | | Year Ended July 31, |
| | 2011 | 2010 |
| Operations ($): | | |
| Investment income—net | 8,847,125 | 2,862,339 |
| Net realized gain (loss) on investments | 2,414,887 | 386,374 |
| Net unrealized appreciation | | |
| (depreciation) on investments | 10,813,042 | 5,314,427 |
| Net Increase (Decrease) in Net Assets | | |
| Resulting from Operations | 22,075,054 | 8,563,140 |
| Dividends to Shareholders from ($): | | |
| Investment income—net: | | |
| Investor Shares | (1,501,489) | (807,812) |
| Institutional Shares | (6,170,802) | (1,354,777) |
| Net realized gain on investments: | | |
| Investor Shares | (98,397) | — |
| Institutional Shares | (321,249) | — |
| Total Dividends | (8,091,937) | (2,162,589) |
| Capital Stock Transactions ($): | | |
| Net proceeds from shares sold: | | |
| Investor Shares | 13,487,739 | 18,229,270 |
| Institutional Shares | 116,242,045 | 91,849,994 |
| Dividends reinvested: | | |
| Investor Shares | 1,530,780 | 773,951 |
| Institutional Shares | 1,864,926 | 369,361 |
| Cost of shares redeemed: | | |
| Investor Shares | (14,232,560) | (19,606,339) |
| Institutional Shares | (28,417,119) | (14,440,863) |
| Increase (Decrease) in Net Assets | | |
| from Capital Stock Transactions | 90,475,811 | 77,175,374 |
| Total Increase (Decrease) in Net Assets | 104,458,928 | 83,575,925 |
| Net Assets ($): | | |
| Beginning of Period | 148,710,084 | 65,134,159 |
| End of Period | 253,169,012 | 148,710,084 |
| Undistributed investment income—net | 1,874,364 | 699,427 |
STATEMENT OF CHANGES IN NET ASSETS (continued)
| | | |
| | | Year Ended July 31, |
| | 2011 | 2010 |
| Capital Share Transactions: | | |
| Investor Shares | | |
| Shares sold | 1,035,465 | 1,462,065 |
| Shares issued for dividends reinvested | 116,118 | 61,395 |
| Shares redeemed | (1,093,860) | (1,570,809) |
| Net Increase (Decrease) in Shares Outstanding | 57,723 | (47,349) |
| Institutional Shares | | |
| Shares sold | 8,889,621 | 7,325,995 |
| Shares issued for dividends reinvested | 141,744 | 29,209 |
| Shares redeemed | (2,172,894) | (1,153,413) |
| Net Increase (Decrease) in Shares Outstanding | 6,858,471 | 6,201,791 |
| |
| See notes to financial statements. | | |
14
FINANCIAL HIGHLIGHTS
The following tables describe the performance for each share class for the fiscal periods indicated.All information (except portfolio turnover rate) reflects financial results for a single fund share.Total return shows how much your investment in the fund would have increased (or decreased) during each period, assuming you had reinvested all dividends and distributions.These figures have been derived from the fund’s financial statements.
| | | | | | |
| | | Year Ended July 31, | |
| Investor Shares | 2011 | 2010 | 2009 | 2008 | 2007 |
| Per Share Data ($): | | | | | |
| Net asset value, beginning of period | 12.83 | 11.98 | 12.30 | 11.67 | 11.69 |
| Investment Operations: | | | | | |
| Investment income—neta | .51 | .33 | .08 | .79 | .21 |
| Net realized and unrealized | | | | | |
| gain (loss) on investments | .82 | .76 | (.14) | .48 | .27 |
| Total from Investment Operations | 1.33 | 1.09 | (.06) | 1.27 | .48 |
| Distributions: | | | | | |
| Dividends from investment income—net | (.45) | (.24) | (.16) | (.64) | (.50) |
| Dividends from net realized | | | | | |
| gain on investments | (.03) | — | (.10) | — | — |
| Total Distributions | (.48) | (.24) | (.26) | (.64) | (.50) |
| Net asset value, end of period | 13.68 | 12.83 | 11.98 | 12.30 | 11.67 |
| Total Return (%) | 10.60 | 9.23 | (.54) | 11.01 | 4.24 |
| Ratios/Supplemental Data (%): | | | | | |
| Ratio of total expenses | | | | | |
| to average net assets | .73 | .79 | .87 | 1.04 | 2.10 |
| Ratio of net expenses | | | | | |
| to average net assets | .73 | .71 | .55 | .55 | .53 |
| Ratio of net investment income | | | | | |
| to average net assets | 3.90 | 2.63 | .73 | 6.39 | 1.83 |
| Portfolio Turnover Rate | 138.50 | 61.50 | 77.13 | 90.18 | 18.17 |
| Net Assets, end of period ($ x 1,000) | 46,476 | 42,846 | 40,557 | 26,830 | 2,538 |
| |
| a Based on average shares outstanding at each month end. | | | | |
| See notes to financial statements. | | | | | |
FINANCIAL HIGHLIGHTS (continued)
| | | | | | |
| | | Year Ended July 31, | |
| Institutional Shares | 2011 | 2010 | 2009 | 2008 | 2007 |
| Per Share Data ($): | | | | | |
| Net asset value, beginning of period | 12.83 | 11.97 | 12.30 | 11.66 | 11.68 |
| Investment Operations: | | | | | |
| Investment income—neta | .62 | .37 | .11 | .84 | .24 |
| Net realized and unrealized | | | | | |
| gain (loss) on investments | .76 | .77 | (.15) | .48 | .26 |
| Total from Investment Operations | 1.38 | 1.14 | (.04) | 1.32 | .50 |
| Distributions: | | | | | |
| Dividends from investment income—net | (.50) | (.28) | (.19) | (.68) | (.52) |
| Dividends from net realized | | | | | |
| gain on investments | (.03) | — | (.10) | — | — |
| Total Distributions | (.53) | (.28) | (.29) | (.68) | (.52) |
| Net asset value, end of period | 13.68 | 12.83 | 11.97 | 12.30 | 11.66 |
| Total Return (%) | 10.95 | 9.58 | (.30) | 11.29 | 4.47 |
| Ratios/Supplemental Data (%): | | | | | |
| Ratio of total expenses | | | | | |
| to average net assets | .40 | .44 | .55 | .77 | 1.83 |
| Ratio of net expenses | | | | | |
| to average net assets | .40 | .42 | .30 | .30 | .28 |
| Ratio of net investment income | | | | | |
| to average net assets | 4.71 | 2.97 | .98 | 6.68 | 2.08 |
| Portfolio Turnover Rate | 138.50 | 61.50 | 77.13 | 90.18 | 18.17 |
| Net Assets, end of period ($ x 1,000) | 206,693 | 105,864 | 24,577 | 13,740 | 2,693 |
| |
| a Based on average shares outstanding at each month end. | | | | |
| See notes to financial statements. | | | | | |
16
NOTES TO FINANCIAL STATEMENTS
NOTE 1—Significant Accounting Policies:
Dreyfus Inflation Adjusted Securities Fund (the “fund”) is a separate diversified series of Dreyfus Investment Grade Funds, Inc. (the “Company”), which is registered under the Investment Company Act of 1940, as amended (the “Act”), as an open-end management investment company and operates as a series company currently offering three series, including the fund.The fund’s investment objective is to seek returns that exceed the rate of inflation.The Dreyfus Corporation (the “Manager” or “Dreyfus”), a wholly-owned subsidiary ofThe Bank of New York Mellon Corporation (“BNY Mellon”), serves as the fund’s investment adviser.
MBSC Securities Corporation (the “Distributor”), a wholly-owned subsidiary of the Manager, is the distributor of the fund’s shares, which are sold to the public without a sales charge.The fund is authorized to issue 500 million shares of $.001 par value Common Stock in each of the following classes of shares: Investor and Institutional. Investor shares are subject to a shareholder services plan. Other differences between the classes include the services offered to and the expenses borne by each class, the allocation of certain transfer agency costs, the minimum initial investment and certain voting rights. Income, expenses (other than expenses attributable to a specific class), and realized and unrealized gains or losses on investments are allocated to each class of shares based on its relative net assets.
The Company accounts separately for the assets, liabilities and operations of each series. Expenses directly attributable to each series are charged to that series’ operations; expenses which are applicable to all series are allocated among them on a pro rata basis.
The Financial Accounting Standards Board (“FASB”) Accounting Standards Codification (“ASC”) is the exclusive reference of authoritative U.S. generally accepted accounting principles (“GAAP”) recognized by the FASB to be applied by nongovernmental entities. Rules and interpretive releases of the Securities and Exchange Commission (“SEC”)
NOTES TO FINANCIAL STATEMENTS (continued)
under authority of federal laws are also sources of authoritative GAAP for SEC registrants.The fund’s financial statements are prepared in accordance with GAAP, which may require the use of management estimates and assumptions.Actual results could differ from those estimates.
The Company enters into contracts that contain a variety of indemnifications. The fund’s maximum exposure under these arrangements is unknown.The fund does not anticipate recognizing any loss related to these arrangements.
(a) Portfolio valuation: Investments in securities, excluding short-term investments (other than U.S. Treasury Bills), are valued each business day by an independent pricing service (the “Service”) approved by the Board of Directors. Investments for which quoted bid prices are readily available and are representative of the bid side of the market in the judgment of the Service are valued at the mean between the quoted bid prices (as obtained by the Service from dealers in such securities) and asked prices (as calculated by the Service based upon its evaluation of the market for such securities). Other investments (which constitute a majority of the portfolio securities) are valued as determined by the Service, based on methods which include consideration of: yields or prices of securities of comparable quality, coupon, maturity and type; indications as to values from dealers; and general market conditions. Restricted securities, as well as securities or other assets for which recent market quotations are not readily available, and are not valued by a pricing service approved by the Board of Directors, or are determined by the fund not to reflect accurately fair value, are valued at fair value as determined in good faith under the direction of the Board of Directors.The factors that may be considered when fair valuing a security include fundamental analytical data, the nature and duration of restrictions on disposition, an evaluation of the forces that influence the market in which the securities are purchased and sold and public trading in similar securities of the issuer or comparable issuers. Short-
18
term investments, excluding U.S.Treasury Bills, are carried at amortized cost, which approximates value. Registered investment companies that are not traded on an exchange are valued at their net asset value.
The fair value of a financial instrument is the amount that would be received to sell an asset or paid to transfer a liability in an orderly transaction between market participants at the measurement date (i.e. the exit price). GAAP establishes a fair value hierarchy that prioritizes the inputs of valuation techniques used to measure fair value.This hierarchy gives the highest priority to unadjusted quoted prices in active markets for identical assets or liabilities (Level 1 measurements) and the lowest priority to unobservable inputs (Level 3 measurements).
Additionally, GAAP provides guidance on determining whether the volume and activity in a market has decreased significantly and whether such a decrease in activity results in transactions that are not orderly. GAAP requires enhanced disclosures around valuation inputs and techniques used during annual and interim periods.
Various inputs are used in determining the value of the fund’s investments relating to fair value measurements.These inputs are summarized in the three broad levels listed below:
Level 1—unadjusted quoted prices in active markets for identical investments.
Level 2—other significant observable inputs (including quoted prices for similar investments, interest rates, prepayment speeds, credit risk, etc.).
Level 3—significant unobservable inputs (including the fund’s own assumptions in determining the fair value of investments).
The inputs or methodology used for valuing securities are not necessarily an indication of the risk associated with investing in those securities.
NOTES TO FINANCIAL STATEMENTS (continued)
The following is a summary of the inputs used as of July 31, 2011 in valuing the fund’s investments:
| | | | | |
| | | Level 2—Other | Level 3— | |
| | Level 1— | Significant | Significant | |
| | Unadjusted | Observable | Unobservable | |
| | Quoted Prices | Inputs | Inputs | Total |
| Assets ($) | | | | |
| Investments in Securities: | | | |
| Mutual Funds | 1,133,000 | — | — | 1,133,000 |
| U.S. Treasury | — | 252,116,588 | — | 252,116,588 |
In January 2010, FASB issued Accounting Standards Update (“ASU”) No. 2010-06 “Improving Disclosures about Fair Value Measurements” (“ASU 2010-06”).The portions of ASU 2010-06 which require reporting entities to prepare new disclosures surrounding amounts and reasons for significant transfers in and out of Level 1 and Level 2 fair value measurements as well as inputs and valuation techniques used to measure fair value for both recurring and nonrecurring fair value measurements that fall in either Level 2 or Level 3 have been adopted by the fund. No significant transfers between Level 1 or Level 2 fair value measurements occurred at July 31, 2011.
In May 2011, FASB issued ASU No. 2011-04 “Amendments to Achieve Common Fair Value Measurement and Disclosure Requirements in GAAP and International Financial Reporting Standards (“IFRS”)” (“ASU 2011-04”). ASU 2011-04 includes common requirements for measurement of and disclosure about fair value between GAAP and IFRS. ASU 2011-04 will require reporting entities to disclose the following information for fair value measurements categorized within Level 3 of the fair value hierarchy: quantitative information about the unobservable inputs used in the fair value measurement, the valuation processes used by the reporting entity and a narrative description of the sensitivity of the fair value measurement to changes in unobservable inputs and the interrelationships between those unobservable inputs. In addition, ASU 2011-04 will require reporting entities to make disclo-
20
sures about amounts and reasons for all transfers in and out of Level 1 and Level 2 fair value measurements.The new and revised disclosures are effective for interim and annual reporting periods beginning after December 15, 2011. At this time, management is evaluating the implications of ASU 2011-04 and its impact on the financial statements.
(b) Securities transactions and investment income: Securities transactions are recorded on a trade date basis. Realized gains and losses from securities transactions are recorded on the identified cost basis. Dividend income is recognized on the ex-dividend date and interest income, including, where applicable, accretion of discount and amortization of premium on investments, is recognized on the accrual basis.
Pursuant to a securities lending agreement with The Bank of New York Mellon, a subsidiary of BNY Mellon and an affiliate of Dreyfus, the fund may lend securities to qualified institutions. It is the fund’s policy that, at origination, all loans are secured by collateral of at least 102% of the value of U.S. securities loaned and 105% of the value of foreign securities loaned. Collateral equivalent to at least 100% of the market value of securities on loan is maintained at all times. Collateral is either in the form of cash, which can be invested in certain money market mutual funds managed by the Manager, U.S. Government and Agency securities or letters of credit.The fund is entitled to receive all income on securities loaned, in addition to income earned as a result of the lending transaction. Although each security loaned is fully collateralized, the fund bears the risk of delay in recovery of, or loss of rights in, the securities loaned should a borrower fail to return the securities in a timely manner. During the period ended July 31, 2011, The Bank of NewYork Mellon earned $6,112 from lending portfolio securities, pursuant to the securities lending agreement.
(c) Affiliated issuers: Investments in other investment companies advised by Dreyfus are defined as “affiliated” in the Act.
NOTES TO FINANCIAL STATEMENTS (continued)
The fund may invest in shares of certain affiliated investment companies also advised or managed by Dreyfus. Investments in affiliated investment companies for the period ended July 31, 2011 were as follows:
| | | | | | |
| Affiliated | | | | | |
| Investment | Value | | | Value | Net |
| Company | 7/31/2010 ($) | Purchases ($) | Sales ($) | 7/31/2011 ($) | Assets (%) |
| Dreyfus | | | | | |
| Institutional | | | | | |
| Preferred | | | | | |
| Plus Money | | | | | |
| Market Fund | 276,000 | 71,040,000 | 70,183,000 | 1,133,000 | .4 |
(d) Dividends to shareholders: It is the policy of the fund to declare dividends daily from investment income-net. Such dividends are paid monthly. Dividends from net realized capital gains, if any, are normally declared and paid annually, but the fund may make distributions on a more frequent basis to comply with the distribution requirements of the Internal Revenue Code of 1986, as amended (the “Code”).To the extent that net realized capital gains can be offset by capital loss carryovers, it is the policy of the fund not to distribute such gains. Income and capital gain distributions are determined in accordance with income tax regulations, which may differ from GAAP.
(e) Federal income taxes: It is the policy of the fund to continue to qualify as a regulated investment company, if such qualification is in the best interests of its shareholders, by complying with the applicable provisions of the Code, and to make distributions of taxable income sufficient to relieve it from substantially all federal income and excise taxes.
As of and during the period ended July 31, 2011, the fund did not have any liabilities for any uncertain tax positions. The fund recognizes interest and penalties, if any, related to uncertain tax positions as income tax expense in the Statement of Operations. During the period, the fund did not incur any interest or penalties.
Each of the tax years in the four-year period ended July 31, 2011 remains subject to examination by the Internal Revenue Service and state taxing authorities.
22
At July 31, 2011, the components of accumulated earnings on a tax basis were as follows: undistributed ordinary income $3,012,836, undistributed capital gains $473,491, and unrealized appreciation $15,357,156.
The tax character of distributions paid to shareholders during the fiscal periods ended July 31, 2011 and July 31, 2010 were as follows: ordinary income $7,929,131 and $2,162,589 and long-term capital gains $162,806 and $0, respectively.
During the period ended July 31, 2011, as a result of permanent book to tax differences, primarily due to the tax treatment for treasury inflation-protected securities, the fund increased accumulated undistributed investment income-net by $103 and decreased accumulated net realized gain (loss) on investments by the same amount. Net assets and net asset value per share were not affected by this reclassification.
NOTE 2—Bank Lines of Credit:
The fund participates with other Dreyfus-managed funds in a $225 million unsecured credit facility led by Citibank, N.A. and a $300 million unsecured credit facility provided by The Bank of New York Mellon, (each, a “Facility”), each to be utilized primarily for temporary or emergency purposes, including the financing of redemptions. In connection therewith, the fund has agreed to pay its pro rata portion of commitment fees for each Facility. Interest is charged to the fund based on rates determined pursuant to the terms of the respective Facility at the time of borrowing. During the period ended July 31, 2011, the fund did not borrow under the Facilities.
NOTE 3—Management Fee and Other Transactions With Affiliates:
(a) Pursuant to a management agreement with the Manager, the management fee is computed at the annual rate of .30% of the value of the fund’s average daily net assets and is payable monthly.
NOTES TO FINANCIAL STATEMENTS (continued)
(b) Under the Investor Shares Shareholder Services Plan, the fund pays the Distributor at an annual rate of .25% of the value of Investor Shares average daily net assets for the provision of certain services. The services provided may include personal services relating to shareholder accounts, such as answering shareholder inquiries regarding the fund and providing reports and other information, and services related to the maintenance of shareholder accounts. The Distributor may make payments to Service Agents (a securities dealer, financial institution or other industry professional) in respect of these services. The Distributor determines the amounts to be paid to Service Agents. During the period ended July 31, 2011, Investor Shares were charged $108,215 pursuant to the Shareholder Services Plan.
The fund compensates Dreyfus Transfer, Inc., a wholly-owned subsidiary of the Manager, under a transfer agency agreement for providing personnel and facilities to perform transfer agency services for the fund. During the period ended July 31, 2011, the fund was charged $14,345 pursuant to the transfer agency agreement, which is included in Shareholder servicing costs in the Statement of Operations.
The fund has arrangements with the custodian and cash management bank whereby the fund may receive earnings credits when positive cash balances are maintained, which are used to offset custody and cash management fees. For financial reporting purposes, the fund includes net earnings credits as an expense offset in the Statement of Operations.
The fund compensates The Bank of New York Mellon under a cash management agreement for performing cash management services related to fund subscriptions and redemptions. During the period ended July 31, 2011, the fund was charged $1,407 pursuant to the cash management agreement, which is included in Shareholder servicing costs in the Statement of Operations. These fees were partially offset by earnings credits of $67.
24
The fund also compensates The Bank of New York Mellon under a custody agreement for providing custodial services for the fund. During the period ended July 31, 2011, the fund was charged $19,840 pursuant to the custody agreement.
During the period ended July 31, 2011, the fund was charged $7,880 for services performed by the Chief Compliance Officer.
The components of “Due to The Dreyfus Corporation and affiliates” in the Statement of Assets and Liabilities consist of: management fees $62,151, shareholder services plan fees $9,643, custodian fees $5,257, chief compliance officer fees $2,756 and transfer agency per account fees $2,231.
(c) Each Board member also serves as a Board member of other funds within the Dreyfus complex. Annual retainer fees and attendance fees are allocated to each fund based on net assets.
NOTE 4—Securities Transactions:
The aggregate amount of purchases and sales of investment securities, excluding short-term securities, during the period ended July 31, 2011, amounted to $360,686,204 and $268,988,732, respectively.
At July 31, 2011, the cost of investments for federal income tax purposes was $237,892,432; accordingly, accumulated net unrealized appreciation on investments was $15,357,156, consisting of $16,101,936 gross unrealized appreciation and $744,780 gross unrealized depreciation.
| |
| REPORT OF INDEPENDENT REGISTERED |
| PUBLIC ACCOUNTING FIRM |
Shareholders and Board of Directors Dreyfus Inflation Adjusted Securities Fund
We have audited the accompanying statement of assets and liabilities, including the statement of investments, of Dreyfus Inflation Adjusted Securities Fund (one of the series comprising Dreyfus Investment Grade Funds, Inc.) as of July 31, 2011, and the related statement of operations for the year then ended, the statement of changes in net assets for each of the two years in the period then ended, and financial highlights for each of the years indicated therein. These financial statements and financial highlights are the responsibility of the Fund’s management. Our responsibility is to express an opinion on these financial statements and financial highlights based on our audits.
We conducted our audits in accordance with the standards of the Public Company Accounting Oversight Board (United States).Those standards require that we plan and perform the audit to obtain reasonable assurance about whether the financial statements and financial highlights are free of material misstatement.We were not engaged to perform an audit of the Fund’s internal control over financial reporting. Our audits included consideration of internal control over financial reporting as a basis for designing audit procedures that are appropriate in the circumstances, but not for the purpose of expressing an opinion on the effectiveness of the Fund’s internal control over financial reporting. Accordingly, we express no such opinion. An audit also includes examining, on a test basis, evidence supporting the amounts and disclosures in the financial statements and financial highlights, assessing the accounting principles used and significant estimates made by management, and evaluating the overall financial statement presentation. Our procedures included confirmation of securities owned as of July 31, 2011 by correspondence with the custodian and others.We believe that our audits provide a reasonable basis for our opinion.
In our opinion, the financial statements and financial highlights referred to above present fairly, in all material respects, the financial position of Dreyfus Inflation Adjusted Securities Fund at July 31, 2011, the results of its operations for the year then ended, the changes in its net assets for each of the two years in the period then ended, and the financial highlights for each of the indicated years, in conformity with U.S. generally accepted accounting principles.

New York, New York
September 26, 2011
26
IMPORTANT TAX INFORMATION (Unaudited)
For federal tax purposes the fund hereby designates 100% of ordinary dividends paid during the fiscal year ended July 31, 2011 as qualifying “interest related dividends.”Also for state individual income tax purposes, the fund hereby designates 100% of the ordinary income dividends paid during the fiscal year ended July 31, 2011 as attributable to interest income from direct obligations of the United States. Such dividends are currently exempt from taxation for individual income tax purposes in most states, including NewYork, California and the District of Columbia.
| |
| INFORMATION ABOUT THE RENEWAL OF THE |
| FUND’S MANAGEMENT AGREEMENT (Unaudited) |
At a meeting of the fund’s Board of Directors held on July 13 and 14, 2011, the Board considered the renewal of the fund’s Management Agreement pursuant to which Dreyfus provides the fund with investment advisory and administrative services (the“Agreement”).The Board members, none of whom are “interested persons” (as defined in the Investment Company Act of 1940, as amended) of the fund, were assisted in their review by independent legal counsel and met with counsel in executive session separate from representatives of Dreyfus. In considering the renewal of the Agreement, the Board considered all factors that it believed to be relevant, including those discussed below.The Board did not identify any one factor as dispositive, and each Board member may have attributed different weights to the factors considered.
Analysis of Nature, Extent, and Quality of Services Provided to the Fund.The Board members considered information previously provided to them in presentations from representatives of Dreyfus regarding the nature, extent, and quality of the services provided to funds in the Dreyfus fund complex, and representatives of Dreyfus confirmed that there had been no material changes in this information. Dreyfus provided the number of open accounts in the fund, the fund’s asset size and the allocation of fund assets among distribution channels. Dreyfus also had previously provided information regarding the diverse intermediary relationships and distribution channels of funds in the Dreyfus fund complex and Dreyfus’ corresponding need for broad, deep, and diverse resources to be able to provide ongoing shareholder services to each distribution channel, including the distribution channel(s) for the fund.
The Board members also considered research support available to, and portfolio management capabilities of, the fund’s portfolio management personnel and that Dreyfus also provides oversight of day-to-day fund operations, including fund accounting and administration and assistance in meeting legal and regulatory requirements.The Board members also considered Dreyfus’ extensive administrative, accounting, and compliance infrastructures.
28
Comparative Analysis of the Fund’s Performance and Management Fee and Expense Ratio. The Board members reviewed reports prepared by Lipper, Inc. (“Lipper”), an independent provider of investment company data, which included information comparing (1) the fund’s performance with the performance of a group of comparable funds (the “Performance Group”) and with a broader group of funds (the “Performance Universe”), all for various periods ended May 31, 2011, and (2) the fund’s actual and contractual management fees and total expenses with those of a group of comparable funds (the “Expense Group”) and with a broader group of funds (the “Expense Universe”), the information for which was derived in part from fund financial statements available to Lipper as of January 31, 2011. Dreyfus previously had furnished the Board with a description of the methodology Lipper used to select the Performance Group and Performance Universe and the Expense Group and Expense Universe.
Dreyfus representatives stated that the usefulness of performance comparisons may be affected by a number of factors, including different investment limitations that may be applicable to the fund and comparison funds.They also noted that performance generally should be considered over longer periods of time.The Board members discussed the results of the comparisons and noted that the fund’s total return performance was variously above, at and below the Performance Group and Performance Universe medians.The Board also noted that the fund’s yield was variously above, at and below the Performance Group and Performance Universe medians. Dreyfus also provided a comparison of the fund’s calendar year total returns to the returns of the fund’s benchmark index.
The Board members also reviewed the range of actual and contractual management fees and total expenses of the Expense Group and Expense Universe funds and discussed the results of the comparisons. They noted that the fund’s contractual management fee was below the
| |
| INFORMATION ABOUT THE RENEWAL OF THE FUND’S |
| MANAGEMENT AGREEMENT (Unaudited) (continued) |
Expense Group median, the fund’s actual management fee was above the Expense Group median and below the Expense Universe median, and the fund’s total expenses were below the Expense Group and Expense Universe medians.
Representatives of Dreyfus reviewed with the Board members the management or investment advisory fees (1) paid by funds advised or administered by Dreyfus that are in the same Lipper category as the fund and (2) paid to Dreyfus or the Dreyfus-affiliated primary employer of the fund’s primary portfolio manager for advising any separate accounts and/or other types of client portfolios that are considered to have similar investment strategies and policies as the fund (the “Similar Clients”), and explained the nature of the Similar Clients.They discussed differences in fees paid and the relationship of the fees paid in light of any differences in the services provided and other relevant factors.The Board members considered the relevance of the fee information provided for the Similar Clients to evaluate the appropriateness and reasonableness of the fund’s management fee.
Analysis of Profitability and Economies of Scale. Dreyfus’ representatives reviewed the expenses allocated and profit received by Dreyfus and the resulting profitability percentage for managing the fund, and the method used to determine the expenses and profit. The Board concluded that the profitability results were not unreasonable, given the services rendered and service levels provided by Dreyfus. The Board previously had been provided with information prepared by an independent consulting firm regarding Dreyfus’ approach to allocating costs to, and determining the profitability of, individual funds and the entire Dreyfus fund complex. The consulting firm also had analyzed where any economies of scale might emerge in connection with the management of a fund.
The Board’s counsel stated that the Board members should consider the profitability analysis (1) as part of their evaluation of whether the fees under the Agreement bear a reasonable relationship to the mix of
30
services provided by Dreyfus, including the nature, extent and quality of such services, and (2) in light of the relevant circumstances for the fund and the extent to which economies of scale would be realized if the fund grows and whether fee levels reflect these economies of scale for the benefit of fund shareholders.They also noted that, as a result of shared and allocated costs among funds in the Dreyfus funds complex, the extent of economies of scale could depend substantially on the level of assets in the complex as a whole, so that increases and decreases in complex-wide assets can affect potential economies of scale in a manner that is disproportionate to, or even in the opposite direction from, changes in the fund’s asset level.The Board members also considered potential benefits to Dreyfus from acting as investment adviser and noted that there were no soft dollar arrangements in effect for trading the fund’s investments.
At the conclusion of these discussions, the Board agreed that it had been furnished with sufficient information to make an informed business decision with respect to the renewal of the Agreement. Based on the discussions and considerations as described above, the Board concluded and determined as follows.
The Board concluded that the nature, extent and quality of the services provided by Dreyfus are adequate and appropriate.
The Board generally was satisfied with the fund’s overall perfor- mance, in light of the considerations described above.
The Board concluded that the fee paid to Dreyfus was reasonable in light of the considerations described above.
The Board determined that the economies of scale which may accrue to Dreyfus and its affiliates in connection with the management of the fund had been adequately considered by Dreyfus in connection with the fee rate charged to the fund pursuant to the Agreement and that, to the extent in the future it were determined that material economies of scale had not been shared with the fund, the Board would seek to have those economies of scale shared with the fund.
| |
| INFORMATION ABOUT THE RENEWAL OF THE FUND’S |
| MANAGEMENT AGREEMENT (Unaudited) (continued) |
The Board members considered these conclusions and determinations, along with information received on a routine and regular basis throughout the year. In addition, it should be noted that the Board’s consideration of the contractual fee arrangements for this fund had the benefit of a number of years of reviews of prior or similar agreements during which lengthy discussions took place between the Board members and Dreyfus representatives. Certain aspects of the arrangements may receive greater scrutiny in some years than in others, and the Board members’ conclusions may be based, in part, on their consideration of the same or similar arrangements in prior years. The Board members determined that renewal of the Agreement was in the best interests of the fund and its shareholders.
32
BOARD MEMBERS INFORMATION (Unaudited)
| |
| Joseph S. DiMartino (67) |
| Chairman of the Board (1995) |
| Principal Occupation During Past 5Years: |
| • Corporate Director and Trustee |
| Other Public Company Board Memberships During Past 5Years: |
| • CBIZ (formerly, Century Business Services, Inc.), a provider of outsourcing functions for small |
| and medium size companies, Director (1997-present) |
| • Sunair Services Corporation, a provider of certain outdoor-related services to homes and |
| businesses, Director (2005-2009) |
| • The Newark Group, a provider of a national market of paper recovery facilities, paperboard |
| mills and paperboard converting plants, Director (2000-2010) |
| No. of Portfolios for which Board Member Serves: 168 |
| ——————— |
| Clifford L. Alexander, Jr. (77) |
| Board Member (2003) |
| Principal Occupation During Past 5Years: |
| • President of Alexander & Associates, Inc., a management consulting firm (January 1981-present) |
| No. of Portfolios for which Board Member Serves: 45 |
| ——————— |
| David W. Burke (75) |
| Board Member (1994) |
| Principal Occupation During Past 5Years: |
| • Corporate Director and Trustee |
| No. of Portfolios for which Board Member Serves: 83 |
| ——————— |
| Whitney I. Gerard (76) |
| Board Member (1993) |
| Principal Occupation During Past 5Years: |
| • Partner of Chadbourne & Parke LLP |
| No. of Portfolios for which Board Member Serves: 25 |
BOARD MEMBERS INFORMATION (Unaudited) (continued)
| |
| Nathan Leventhal (68) |
| Board Member (2009) |
| Principal Occupation During Past 5Years: |
| • Commissioner, NYC Planning Commission (March 2007-present) |
| • Chairman of the Avery-Fisher Artist Program (November 1997-present) |
| Other Public Company Board Memberships During Past 5Years: |
| • Movado Group, Inc., Director |
| No. of Portfolios for which Board Member Serves: 43 |
| ——————— |
| George L. Perry (77) |
| Board Member (1992) |
| Principal Occupation During Past 5Years: |
| • Economist and Senior Fellow at Brookings Institution |
| No. of Portfolios for which Board Member Serves: 25 |
| ——————— |
| Benaree Pratt Wiley (65) |
| Board Member (2009) |
| Principal Occupation During Past 5Years: |
| • Principal,TheWiley Group, a firm specializing in strategy and business development (2005-present) |
| Other Public Company Board Memberships During Past 5Years: |
| • CBIZ (formerly, Century Business Services, Inc.), a provider of outsourcing functions for small |
| and medium size companies, Director (2008-present) |
| No. of Portfolios for which Board Member Serves: 69 |
| ——————— |
Once elected all Board Members serve for an indefinite term, but achieve Emeritus status upon reaching age 80.The address of the Board Members and Officers is in c/o The Dreyfus Corporation, 200 Park Avenue, NewYork, NewYork 10166.Additional information about the Board Members is available in the fund’s Statement of Additional Information which can be obtained from Dreyfus free of charge by calling this toll free number: 1-800-DREYFUS.
Lucy Wilson Benson, Emeritus Board Member
Arthur A. Hartman, Emeritus Board Member
34
OFFICERS OF THE FUND (Unaudited)
BRADLEY J. SKAPYAK, President since JOSEPH M. CHIOFFI, Vice President and January 2010. Assistant Secretary since August 2005.
Chief Operating Officer and a director of the Senior Counsel of BNY Mellon, and an officer Manager since June 2009. From April 2003 to of 77 investment companies (comprised of 193 June 2009, Mr. Skapyak was the head of the portfolios) managed by the Manager. He is 49 Investment Accounting and Support years old and has been an employee of the Department of the Manager. He is an officer Manager since June 2000. of 76 investment companies (comprised of 168
KATHLEEN DENICHOLAS, Vice President portfolios) managed by the Manager. He is 52 and Assistant Secretary since years old and has been an employee of the
January 2010.
Manager since February 1988.
Senior Counsel of BNY Mellon, and an officer
MICHAEL A. ROSENBERG, Vice President of 77 investment companies (comprised of 193 and Secretary since August 2005. portfolios) managed by the Manager. She is 36 Assistant General Counsel of BNY Mellon, years old and has been an employee of the and an officer of 77 investment companies Manager since February 2001.
(comprised of 193 portfolios) managed by the
JANETTE E. FARRAGHER, Vice President
Manager. He is 51 years old and has been an and Assistant Secretary since employee of the Manager since October 1991.
August 2005.
KIESHA ASTWOOD, Vice President and
Assistant General Counsel of BNY Mellon,
Assistant Secretary since January 2010. and an officer of 77 investment companies Counsel of BNY Mellon, and an officer of 77 (comprised of 193 portfolios) managed by the investment companies (comprised of 193 Manager. She is 48 years old and has been an portfolios) managed by the Manager. She is 38 employee of the Manager since February 1984. years old and has been an employee of the
JOHN B. HAMMALIAN, Vice President and
Manager since July 1995.
Assistant Secretary since August 2005.
JAMES BITETTO, Vice President and
Managing Counsel of BNY Mellon, and an
Assistant Secretary since August 2005. officer of 77 investment companies (comprised Senior Counsel of BNY Mellon and Secretary of 193 portfolios) managed by the Manager. of the Manager, and an officer of 77 He is 48 years old and has been an employee investment companies (comprised of 193 of the Manager since February 1991. portfolios) managed by the Manager. He is 45
M. CRISTINA MEISER, Vice President and years old and has been an employee of the
Assistant Secretary since January 2010.
Manager since December 1996.
Senior Counsel of BNY Mellon, and an officer
JONI LACKS CHARATAN, Vice President of 77 investment companies (comprised of 193 and Assistant Secretary since portfolios) managed by the Manager. She is 41
August 2005. years old and has been an employee of the Senior Counsel of BNY Mellon, and an officer Manager since August 2001. of 77 investment companies (comprised of 193 portfolios) managed by the Manager. She is 55 years old and has been an employee of the Manager since October 1988.
OFFICERS OF THE FUND (Unaudited) (continued)
ROBERT R. MULLERY, Vice President and Assistant Secretary since August 2005.
Managing Counsel of BNY Mellon, and an officer of 77 investment companies (comprised of 193 portfolios) managed by the Manager. He is 59 years old and has been an employee of the Manager since May 1986.
JEFF PRUSNOFSKY, Vice President and Assistant Secretary since August 2005.
Managing Counsel of BNY Mellon, and an officer of 77 investment companies (comprised of 193 portfolios) managed by the Manager. He is 46 years old and has been an employee of the Manager since October 1990.
JAMES WINDELS, Treasurer since November 2001.
Director – Mutual Fund Accounting of the Manager, and an officer of 77 investment companies (comprised of 193 portfolios) managed by the Manager. He is 52 years old and has been an employee of the Manager since April 1985.
RICHARD CASSARO, Assistant Treasurer since January 2008.
Senior Accounting Manager – Money Market and Municipal Bond Funds of the Manager, and an officer of 77 investment companies (comprised of 193 portfolios) managed by the Manager. He is 52 years old and has been an employee of the Manager since September 1982.
GAVIN C. REILLY, Assistant Treasurer since December 2005.
Tax Manager of the Investment Accounting and Support Department of the Manager, and an officer of 77 investment companies (comprised of 193 portfolios) managed by the Manager. He is 42 years old and has been an employee of the Manager since April 1991.
ROBERT ROBOL, Assistant Treasurer since August 2003.
Senior Accounting Manager – Fixed Income Funds of the Manager, and an officer of 77 investment companies (comprised of 193 portfolios) managed by the Manager. He is 47 years old and has been an employee of the Manager since October 1988.
ROBERT SALVIOLO, Assistant Treasurer since July 2007.
Senior Accounting Manager – Equity Funds of the Manager, and an officer of 77 investment companies (comprised of 193 portfolios) managed by the Manager. He is 44 years old and has been an employee of the Manager since June 1989.
ROBERT SVAGNA, Assistant Treasurer since August 2005.
Senior Accounting Manager – Equity Funds of the Manager, and an officer of 77 investment companies (comprised of 193 portfolios) managed by the Manager. He is 44 years old and has been an employee of the Manager since November 1990.
36
JOSEPH W. CONNOLLY, Chief Compliance Officer since October 2004.
Chief Compliance Officer of the Manager and The Dreyfus Family of Funds (77 investment companies, comprised of 193 portfolios). From November 2001 through March 2004, Mr. Connolly was first Vice-President, Mutual Fund Servicing for Mellon Global Securities Services. In that capacity, Mr. Connolly was responsible for managing Mellon’s Custody, Fund Accounting and Fund Administration services to third-party mutual fund clients. He is 54 years old and has served in various capacities with the Manager since 1980, including manager of the firm’s Fund Accounting Department from 1997 through October 2001.
STEPHEN J. STOREN, Anti-Money Laundering Compliance Officer since May 2011.
Chief Compliance Officer of the Distributor, and the Anti-Money Laundering Compliance Officer of 73 investment companies (comprised of 189 portfolios) managed by the Manager. He is 56 years old and has been an employee of the Distributor since October 1999.
For More Information
Telephone 1-800-DREYFUS
Mail The Dreyfus Family of Funds, 144 Glenn Curtiss Boulevard, Uniondale, NY 11556-0144 E-mail Send your request to info@dreyfus.com Internet Information can be viewed online or downloaded at: http://www.dreyfus.com
The fund files its complete schedule of portfolio holdings with the Securities and Exchange Commission (“SEC”) for the first and third quarters of each fiscal year on Form N-Q. The fund’s Forms N-Q are available on the SEC’s website at http://www.sec.gov and may be reviewed and copied at the SEC’s Public Reference Room in Washington, DC. Information on the operation of the Public Reference Room may be obtained by calling 1-800-SEC-0330.
| |
| Dreyfus |
| Intermediate |
| Term Income Fund |
ANNUAL REPORT July 31, 2011

Save time. Save paper. View your next shareholder report online as soon as it’s available. Log into www.dreyfus.com and sign up for Dreyfus eCommunications. It’s simple and only takes a few minutes.
The views expressed in this report reflect those of the portfolio manager only through the end of the period covered and do not necessarily represent the views of Dreyfus or any other person in the Dreyfus organization. Any such views are subject to change at any time based upon market or other conditions and Dreyfus disclaims any responsibility to update such views.These views may not be relied on as investment advice and, because investment decisions for a Dreyfus fund are based on numerous factors, may not be relied on as an indication of trading intent on behalf of any Dreyfus fund.
Not FDIC-Insured • Not Bank-Guaranteed • May Lose Value
| | Contents |
| | THE FUND |
| 2 | A Letter from the Chairman and CEO |
| 3 | Discussion of Fund Performance |
| 6 | Fund Performance |
| 8 | Understanding Your Fund’s Expenses |
| 8 | Comparing Your Fund’s Expenses With Those of Other Funds |
| 9 | Statement of Investments |
| 23 | Statement of Assets and Liabilities |
| 24 | Statement of Operations |
| 25 | Statement of Changes in Net Assets |
| 27 | Financial Highlights |
| 31 | Notes to Financial Statements |
| 50 | Report of Independent Registered Public Accounting Firm |
| 51 | Important Tax Information |
| 52 | Information About the Renewal of the Fund’s Management Agreement |
| 57 | Board Members Information |
| 59 | Officers of the Fund |
| | FOR MORE INFORMATION |
| | Back Cover |
Dreyfus
Intermediate
Term Income Fund
The Fund

A LETTER FROM THE CHAIRMAN AND CEO
Dear Shareholder:
We are pleased to present this annual report for Dreyfus Intermediate Term Income Fund, covering the 12-month period from August 1, 2010, through July 31, 2011. For information about how the fund performed during the reporting period, as well as general market perspectives, we provide a Discussion of Fund Performance on the pages that follow.
Although the reporting period began on an optimistic note with a renewed commitment by the Federal Reserve Board (the “Fed”) to avoid a return to recession, the reporting period ended amid sharply deteriorating investor sentiment due to disappointing economic data, a persistent sovereign debt crisis in Europe and a contentious debate regarding taxes, spending and borrowing in the United States. In fact, just days after the reporting period’s end, U.S. lawmakers enacted legislation to raise the nation’s debt ceiling and a major credit rating agency downgraded U.S. long-term debt, marking the first time in history that U.S. Treasury securities were not assigned the highest possible credit rating. Fixed-income securities proved volatile in this tumultuous environment, as the stalled economy caused higher yielding market sectors to give back many of the reporting period’s previous gains while U.S. government securities rallied.
The economic outlook currently is clouded by heightened market volatility and political in-fighting; however, we currently believe that a sustained, moderate global expansion is more likely than a double-dip recession. Inflationary pressures appear to be waning in most countries, including the United States, as energy prices have retreated from their highs. Consequently, the Fed is likely to maintain aggressively accommodative monetary policy, which may help offset the financial stresses caused by recent fiscal policy choices in the United States and Europe.To assess how these and other developments may affect your investments, we encourage you, as always, to speak with your financial advisor.
Thank you for your continued confidence and support.

Jonathan R. Baum
Chairman and Chief Executive Officer
The Dreyfus Corporation
August 15, 2011
2

DISCUSSION OF FUND PERFORMANCE
For the period of August 1, 2010, through July 31, 2011, as provided by David Horsfall, David Bowser, CFA, and Peter Vaream, Portfolio Managers
Fund and Market Performance Overview
For the 12-month period ended July 31, 2011, Dreyfus Intermediate Term Income Fund’s Class A shares produced a total return of 5.75%, Class B shares produced a total return of 5.14%, Class C shares returned 5.01% and Class I shares returned 6.09%.1 In comparison, the fund’s benchmark, the Barclays Capital U.S. Aggregate Bond Index, achieved a total return of 4.44% for the same period.2
Bonds produced mixed results amid heightened volatility over the reporting period as investors responded first to signs of economic strength and later to evidence of renewed economic weakness. The fund produced higher returns than its benchmark, primarily due to its emphasis on higher yielding segments of the bond market.
The Fund’s Investment Approach
The fund seeks to maximize total return, consisting of capital appreciation and current income.To pursue its goal, the fund normally invests at least 80% of its assets in fixed-income securities of U.S. and foreign issuers rated at least investment grade or the unrated equivalent as determined by Dreyfus.These securities include: U.S. government bonds and notes, corporate bonds, municipal bonds, convertible securities, preferred stocks, inflation-indexed securities, asset-backed securities, mortgage-related securities and foreign bonds.Typically, the fund can be expected to have an average effective maturity ranging from five to 10 years, and an average effective duration ranging between three and eight years. For additional yield, the fund may invest up to 20% of its assets in fixed-income securities rated below investment grade.
Shifting Economic Sentiment Sparked Market Volatility
Investors’ outlooks began to improve early in the reporting period as the financial markets responded positively to an announcement by the Federal Reserve Board (the “Fed”) that it would soon begin a massive quantitative easing program to stimulate greater economic growth. A
DISCUSSION OF FUND PERFORMANCE (continued)
more optimistic outlook subsequently was reinforced by improvements in employment, consumer spending and corporate earnings. These developments supported corporate bonds into the first quarter of 2011, but they sent prices of U.S. government securities lower.
Investors began to question the sustainability of the economic recovery in February 2011, when political unrest in the Middle East led to sharply rising energy prices, and again in March, when devastating natural and nuclear disasters in Japan threatened to disrupt the global industrial supply chain. Nonetheless, investors proved resilient, and the more economically sensitive sectors of the bond market bounced back.
In late April, economic sentiment began to deteriorate in earnest when Greece appeared headed for default on its sovereign debt, U.S. economic data proved more disappointing than expected and a contentious debate regarding U.S. government spending and borrowing intensified. Some of these worries came to a head just days after the reporting period’s end, when Congress passed legislation cutting government spending and raising the U.S. debt ceiling, and Standard & Poor’s downgraded its credit rating on long-term U.S. debt securities. Consequently, the reporting period ended in the midst of declines in higher yielding bonds, while Treasury securities rallied during a “flight to quality.”
Sector Allocation Strategy Buoyed Fund Performance
The fund’s relative performance was bolstered over much of the reporting period by overweighted exposure to higher yielding market sectors, including investment-grade and high yield corporate bonds, commercial mortgage-backed securities and residential mortgage-backed securities. Investment-grade bonds issued by financial services companies fared particularly well in the constructive climate early in the year.The fund’s holdings of high yield bonds also fared well at the time, including securities from energy companies engaged in deleveraging their balance sheets.The fund also benefited from its security selection strategy among residential mortgage-backed securities, where higher-coupon mortgages benefited from lower-than-expected prepayment rates.
Although our focus on higher yielding market sectors detracted from relative performance amid bouts of heightened volatility from late April through July 2011, it was not enough to erase positive results from earlier in the year. However, the fund’s interest rate strategies
4
generally undermined results compared to the benchmark.A relatively long average duration at the end of 2010 magnified weakness in U.S. government securities at the time, and a more defensive interest-rate posture later in the reporting period prevented the fund from participating fully in the rally among U.S. government securities.
A More Defensive Investment Posture
We have adopted a more defensive investment posture in light of the developments now roiling the financial markets. If, as we currently expect, the U.S. economic recovery remains intact when the dust settles, we may return to an emphasis on higher yielding sectors of the bond market that have tended to do well during economic expansions. But until we see stronger evidence that the uncertainty confronting the U.S. and global economies is waning, we intend to keep the fund’s sector allocation, credit quality and interest-rate exposures roughly in line with its benchmark.
August 15, 2011
| | |
| | Bond funds are subject generally to interest rate, credit, liquidity and market risks, to varying |
| | degrees, all of which are more fully described in the fund’s prospectus. Generally, all other factors |
| | being equal, bond prices are inversely related to interest-rate changes, and rate increases can cause |
| | price declines. |
| | High yield bonds are subject to increased credit risk and are considered speculative in terms of the |
| | issuer’s perceived ability to continue making interest payments on a timely basis and to repay |
| | principal upon maturity. |
| | The fund may use derivative instruments, such as options, futures and options on futures, forward |
| | contracts, swaps (including credit default swaps on corporate bonds and asset-backed securities), |
| | options on swaps and other credit derivatives.A small investment in derivatives could have a |
| | potentially large impact on the fund’s performance.The use of derivatives involves risks different |
| | from, or possibly greater than, the risks associated with investing directly in the underlying assets. |
| 1 | Total return includes reinvestment of dividends and any capital gains paid, and does not take into |
| | consideration the maximum initial sales charge in the case of Class A shares, or the applicable |
| | contingent deferred sales charges imposed on redemptions in the case of Class B and Class C |
| | shares. Had these charges been reflected, returns would have been lower. Past performance is no |
| | guarantee of future results. Share price, yield and investment return fluctuate such that upon |
| | redemption, fund shares may be worth more or less than their original cost. |
| 2 | SOURCE: LIPPER INC. — Reflects reinvestment of dividends and, where applicable, capital |
| | gain distributions.The Barclays Capital U.S.Aggregate Bond Index is a widely accepted, |
| | unmanaged total return index of corporate, U.S. government and U.S. government agency debt |
| | instruments, mortgage-backed securities and asset-backed securities with an average maturity of 1- |
| | 10 years. Investors cannot invest directly in any index. |
FUND PERFORMANCE
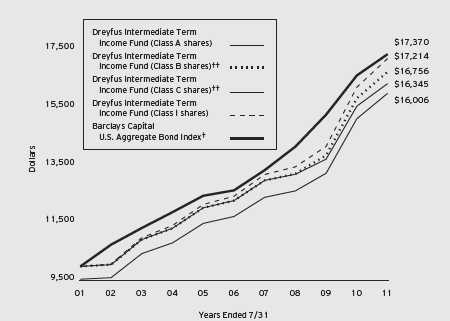
Comparison of change in value of $10,000 investment in Dreyfus Intermediate Term Income Fund Class A shares, Class B shares, Class C shares and Class I shares and the Barclays Capital
| | |
| † | Source: Lipper Inc. |
| †† | The total return figures presented for Class B and Class C shares of the fund reflect the performance of the fund’s |
| | Class A shares for the period prior to May 13, 2008 (the inception date for Class B and Class C shares |
| | respectively), adjusted to reflect the applicable sales load for each share class. |
| |
| Past performance is not predictive of future performance. |
| The above graph compares a $10,000 investment made in each of the Class A, Class B, Class C and Class I shares of |
| Dreyfus Intermediate Term Income Fund on 7/31/01 to a $10,000 investment made in the Barclays Capital U.S. |
| Aggregate Bond Index (the “Index”) on that date.All dividends and capital gain distributions are reinvested. |
| The fund invests primarily in debt securities and securities with debt-like characteristics of domestic and foreign issuers |
| and maintains an average effective maturity ranging between five and ten years and an average effective duration ranging |
| between three and eight years.The fund’s performance shown in the line graph above takes into account the maximum |
| initial sales charge on Class A shares and all other applicable fees and expenses on all classes. Performance for Class B |
| shares assumes the conversion of Class B shares to Class A shares at the end of the sixth year following the date of |
| purchase.The Index is a widely accepted, unmanaged total return index of corporate, U.S. government and U.S. |
| government agency debt instruments, mortgage-backed securities and asset-backed securities with an average maturity of 1- |
| 10 years. Unlike a mutual fund, the Index is not subject to charges, fees and other expenses. Investors cannot invest |
| directly in any index. Further information relating to fund performance, including expense reimbursements, if applicable, is |
| contained in the Financial Highlights section of the prospectus and elsewhere in this report. |
6
| | | | | |
| Average Annual Total Returns as of 7/31/11 | | | |
| |
| Inception |
| | Date | 1 Year | 5 Years | 10 Years |
| Class A shares | | | | |
| with maximum sales charge (4.5%) | 2/2/96 | 0.98% | 5.44% | 4.82% |
| without sales charge | 2/2/96 | 5.75% | 6.41% | 5.30% |
| Class B shares | | | | |
| with applicable redemption charge † | 5/13/08 | 1.14% | 5.65%††† | 5.30%††† |
| without redemption | 5/13/08 | 5.14% | 5.96%††† | 5.30%††† |
| Class C shares | | | | |
| with applicable redemption charge †† | 5/13/08 | 4.01% | 5.88%††† | 5.04%††† |
| without redemption | 5/13/08 | 5.01% | 5.88%††† | 5.04%††† |
| Class I shares | 5/31/01 | 6.09% | 6.71% | 5.58% |
| Barclays Capital | | | | |
| U.S. Aggregate Bond Index | | 4.44% | 6.57% | 5.68% |
| | |
| Past performance is not predictive of future performance.The fund’s performance shown in the graph and table does not |
| reflect the deduction of taxes that a shareholder would pay on fund distributions or the redemption of fund shares. |
| † | The maximum contingent deferred sales charge for Class B shares is 4%.After six years Class B shares convert to |
| | Class A shares. |
| †† | The maximum contingent deferred sales charge for Class C shares is 1% for shares redeemed within one year of the |
| | date of purchase. |
| ††† The total return performance figures presented for Class B and Class C shares of the fund reflect the performance of |
| | the fund’s Class A shares for the period prior to May 13, 2008 (the inception date for Class B and Class C shares |
| | respectively), adjusted to reflect the applicable sales load for each share class. |
UNDERSTANDING YOUR FUND’S EXPENSES (Unaudited)
As a mutual fund investor, you pay ongoing expenses, such as management fees and other expenses. Using the information below, you can estimate how these expenses affect your investment and compare them with the expenses of other funds.You also may pay one-time transaction expenses, including sales charges (loads) and redemption fees, which are not shown in this section and would have resulted in higher total expenses. For more information, see your fund’s prospectus or talk to your financial adviser.
Review your fund’s expenses
The table below shows the expenses you would have paid on a $1,000 investment in Dreyfus Intermediate Term Income Fund from February 1, 2011 to July 31, 2011. It also shows how much a $1,000 investment would be worth at the close of the period, assuming actual returns and expenses.
Expenses and Value of a $1,000 Investment
assuming actual returns for the six months ended July 31, 2011
| | | | | |
| | Class A | Class B | Class C | Class I |
| Expenses paid per $1,000† | $ 4.61 | $ 6.78 | $ 7.98 | $ 2.89 |
| Ending value (after expenses) | $1,041.10 | $1,039.30 | $1,037.70 | $1,041.70 |
COMPARING YOUR FUND’S EXPENSES
WITH THOSE OF OTHER FUNDS (Unaudited)
Using the SEC’s method to compare expenses
The Securities and Exchange Commission (SEC) has established guidelines to help investors assess fund expenses. Per these guidelines, the table below shows your fund’s expenses based on a $1,000 investment, assuming a hypothetical 5% annualized return. You can use this information to compare the ongoing expenses (but not transaction expenses or total cost) of investing in the fund with those of other funds.All mutual fund shareholder reports will provide this information to help you make this comparison. Please note that you cannot use this information to estimate your actual ending account balance and expenses paid during the period.
Expenses and Value of a $1,000 Investment
assuming a hypothetical 5% annualized return for the six months ended July 31, 2011
| | | | | |
| | Class A | Class B | Class C | Class I |
| Expenses paid per $1,000† | $ 4.56 | $ 6.71 | $ 7.90 | $ 2.86 |
| Ending value (after expenses) | $1,020.28 | $1,018.15 | $1,016.96 | $1,021.97 |
| |
| Expenses are equal to the fund's annualized expense ratio of .91% for Class A, 1.34% for Class B, 1.58% for Class |
| C and .57% for Class I, multiplied by the average account value over the period, multiplied by 181/365 (to reflect the |
| one-half year period). |
8
| |
| STATEMENT OF INVESTMENTS |
| July 31, 2011 |
| | | | | | |
| | Coupon | Maturity | Principal | | |
| Bonds and Notes—109.6% | Rate (%) | Date | Amount ($)d | Value ($) |
| Aerospace & Defense—.2% | | | | | |
| Meccanica Holdings USA, | | | | | |
| Gtd. Notes | 6.25 | 7/15/19 | 2,530,000 | a | 2,654,430 |
| Agriculture—.3% | | | | | |
| Altria Group, | | | | | |
| Gtd. Notes | 10.20 | 2/6/39 | 2,125,000 | | 3,185,605 |
| Asset-Backed Ctfs./ | | | | | |
| Auto Receivables—3.5% | | | | | |
| Ally Auto Receivables Trust, | | | | | |
| Ser. 2010-1, Cl. B | 3.29 | 3/15/15 | 3,975,000 | a | 4,159,987 |
| Americredit Automobile Receivables | | | | | |
| Trust, Ser. 2010-3, Cl. C | 3.34 | 4/8/16 | 1,855,000 | | 1,902,013 |
| Americredit Automobile Receivables | | | | | |
| Trust, Ser. 2011-3, Cl. D | 4.04 | 7/10/17 | 5,275,000 | | 5,317,910 |
| Americredit Automobile Receivables | | | | | |
| Trust, Ser. 2010-1, Cl. C | 5.19 | 8/17/15 | 1,395,000 | | 1,476,133 |
| Americredit Prime Automobile | | | | | |
| Receivable, Ser. 2007-1, Cl. B | 5.35 | 9/9/13 | 65,116 | | 65,566 |
| Americredit Prime Automobile | | | | | |
| Receivable, Ser. 2007-1, Cl. C | 5.43 | 2/10/14 | 70,000 | | 70,896 |
| Americredit Prime Automobile | | | | | |
| Receivable, Ser. 2007-1, Cl. E | 6.96 | 3/8/16 | 6,504,306 | a | 6,597,013 |
| Capital Auto Receivables Asset | | | | | |
| Trust, Ser. 2007-1, Cl. D | 6.57 | 9/16/13 | 1,708,000 | a | 1,761,480 |
| Carmax Auto Owner Trust, | | | | | |
| Ser. 2010-1, Cl. B | 3.75 | 12/15/15 | 980,000 | | 1,032,061 |
| Chrysler Financial Auto | | | | | |
| Securitization Trust, | | | | | |
| Ser. 2010-A, Cl. C | 2.00 | 1/8/14 | 5,820,000 | | 5,839,013 |
| Franklin Auto Trust, | | | | | |
| Ser. 2008-A, Cl. B | 6.10 | 5/20/16 | 2,970,000 | a | 3,040,619 |
| JPMorgan Auto Receivables Trust, | | | | | |
| Ser. 2008-A, Cl. CFTS | 5.22 | 7/15/15 | 1,245,557 | a | 1,236,705 |
| Santander Drive Auto Receivables | | | | | |
| Trust, Ser. 2010-2, Cl. B | 2.24 | 12/15/14 | 1,402,000 | | 1,407,453 |
| Santander Drive Auto Receivables | | | | | |
| Trust, Ser. 2010-B, Cl. C | 3.02 | 10/17/16 | 3,660,000 | a | 3,707,146 |
| Smart Trust, | | | | | |
| Ser. 2011-1USA, Cl. A3B | 1.04 | 10/14/14 | 4,010,000 | a,b | 4,018,047 |
| | | | | | 41,632,042 |
STATEMENT OF INVESTMENTS (continued)
| | | | | | |
| | Coupon | Maturity | Principal | | |
| Bonds and Notes (continued) | Rate (%) | Date | Amount ($)d | Value ($) |
| Asset-Backed Ctfs./Credit Cards—1.0% | | | | |
| Citibank Omni Master Trust, | | | | | |
| Ser. 2009-A14A, Cl. A14 | 2.94 | 8/15/18 | 11,075,000 | a,b | 11,664,579 |
| Asset-Backed Ctfs./ | | | | | |
| Home Equity Loans—1.0% | | | | | |
| Ameriquest Mortgage Securities, | | | | | |
| Ser. 2003-11, Cl. AF6 | 5.64 | 1/25/34 | 601,245 | b | 610,107 |
| Bayview Financial Acquisition | | | | | |
| Trust, Ser. 2005-B, Cl. 1A6 | 5.21 | 4/28/39 | 3,111,898 | b | 2,976,882 |
| Carrington Mortgage Loan Trust, | | | | | |
| Ser. 2005-NC5, Cl. A2 | 0.51 | 10/25/35 | 1,719,019 | b | 1,519,410 |
| Citicorp Residential Mortgage | | | | | |
| Securities, Ser. 2006-1, Cl. A3 | 5.71 | 7/25/36 | 971,279 | b | 976,848 |
| Citigroup Mortgage Loan Trust, | | | | | |
| Ser. 2005-HE1, Cl. M1 | 0.62 | 5/25/35 | 251,303 | b | 250,851 |
| Citigroup Mortgage Loan Trust, | | | | | |
| Ser. 2005-WF1, Cl. A5 | 5.01 | 11/25/34 | 3,063,195 | b | 3,061,704 |
| First Franklin Mortgage Loan Asset | | | | | |
| Backed Certificates, | | | | | |
| Ser. 2005-FF2, Cl. M1 | 0.59 | 3/25/35 | 724,750 | b | 709,940 |
| Home Equity Asset Trust, | | | | | |
| Ser. 2005-2, Cl. M1 | 0.64 | 7/25/35 | 103,149 | b | 102,798 |
| JP Morgan Mortgage Acquisition, | | | | | |
| Ser. 2006-CH2, Cl. AV2 | 0.24 | 10/25/36 | 377,879 | b | 370,967 |
| Mastr Asset Backed Securities | | | | | |
| Trust, Ser. 2006-AM1, Cl. A2 | 0.32 | 1/25/36 | 52,938 | b | 52,740 |
| Residential Asset Securities, | | | | | |
| Ser. 2005-EMX4, Cl. A2 | 0.45 | 11/25/35 | 842,555 | b | 831,939 |
| | | | | | 11,464,186 |
| Asset-Backed Ctfs./ | | | | | |
| Manufactured Housing—.1% | | | | | |
| Origen Manufactured Housing, | | | | | |
| Ser. 2005-B, Cl. A2 | 5.25 | 12/15/18 | 9,411 | | 9,464 |
| Origen Manufactured Housing, | | | | | |
| Ser. 2005-B, Cl. M2 | 6.48 | 1/15/37 | 1,595,798 | | 1,671,029 |
| Vanderbilt Mortgage Finance, | | | | | |
| Ser. 1999-A, Cl. 1A6 | 6.75 | 3/7/29 | 80,000 | b | 80,215 |
| | | | | | 1,760,708 |
| Banks—3.9% | | | | | |
| Citigroup, | | | | | |
| Sr. Unscd. Notes | 5.50 | 4/11/13 | 6,225,000 | | 6,603,163 |
10
| | | | | | |
| | Coupon | Maturity | Principal | | |
| Bonds and Notes (continued) | Rate (%) | Date | Amount ($)d | Value ($) |
| Banks (continued) | | | | | |
| Discover Bank, | | | | | |
| Sub. Notes | 7.00 | 4/15/20 | 1,750,000 | | 1,978,743 |
| JPMorgan Chase & Co., | | | | | |
| Sr. Unscd. Notes | 6.00 | 1/15/18 | 2,055,000 | | 2,333,044 |
| Lloyds TSB Bank, | | | | | |
| Bank Gtd. Notes | 4.88 | 1/21/16 | 3,250,000 | | 3,359,444 |
| Lloyds TSB Bank, | | | | | |
| Bank Gtd. Notes | 6.38 | 1/21/21 | 1,040,000 | | 1,098,732 |
| Manufacturers & Traders Trust, | | | | | |
| Sub. Notes | 5.59 | 12/28/20 | 475,000 | b | 478,312 |
| Morgan Stanley, | | | | | |
| Sr. Unscd. Notes | 5.30 | 3/1/13 | 1,680,000 | | 1,771,605 |
| Morgan Stanley, | | | | | |
| Sr. Unscd. Notes | 5.55 | 4/27/17 | 5,050,000 | | 5,424,952 |
| Morgan Stanley, | | | | | |
| Sr. Unscd. Notes | 5.75 | 8/31/12 | 1,180,000 | | 1,239,210 |
| NB Capital Trust IV, | | | | | |
| Gtd. Cap. Secs | 8.25 | 4/15/27 | 1,290,000 | | 1,330,313 |
| Societe Generale, | | | | | |
| Sr. Unscd. Notes | 1.30 | 4/11/14 | 2,090,000 | a,b | 2,048,110 |
| USB Capital IX, | | | | | |
| Gtd. Notes | 3.50 | 10/29/49 | 7,090,000 | b | 5,804,796 |
| Wells Fargo Capital XIII, | | | | | |
| Gtd. Cap. Secs | 7.70 | 12/29/49 | 11,615,000 | b | 12,036,044 |
| | | | | | 45,506,468 |
| Building Materials—.3% | | | | | |
| Holcim US Finance Sarl & Cie, | | | | | |
| Gtd. Notes | 6.00 | 12/30/19 | 2,760,000 | a | 3,031,233 |
| Chemicals—.0% | | | | | |
| Dow Chemical, | | | | | |
| Sr. Unscd. Notes | 2.50 | 2/15/16 | 190,000 | | 192,134 |
| Commercial & Professional | | | | | |
| Services—.0% | | | | | |
| Ceridian, | | | | | |
| Gtd. Notes | 11.25 | 11/15/15 | 185,000 | b | 188,700 |
| Commercial Mortgage | | | | | |
| Pass-Through Ctfs.—3.0% | | | | | |
| Bear Stearns Commercial | | | | | |
| Mortgage Securities, | | | | | |
| Ser. 2006-PW13, Cl. A3 | 5.52 | 9/11/41 | 35,000 | | 36,259 |
STATEMENT OF INVESTMENTS (continued)
| | | | | | |
| | Coupon | Maturity | Principal | | |
| Bonds and Notes (continued) | Rate (%) | Date | Amount ($)d | Value ($) |
| Commercial Mortgage | | | | | |
| Pass-Through Ctfs. (continued) | | | | | |
| CS First Boston Mortgage | | | | | |
| Securities, Ser. 2004-C3, Cl. A3 | 4.30 | 7/15/36 | 172,096 | | 172,025 |
| CS First Boston Mortgage | | | | | |
| Securities, Ser. 2005-C4, Cl. AAB | 5.07 | 8/15/38 | 2,548,409 | b | 2,623,545 |
| GS Mortgage Securities Corporation | | | | | |
| II, Ser. 2007-EOP, Cl. B | 1.84 | 3/6/20 | 1,630,000 | a,b | 1,612,621 |
| GS Mortgage Securities Corporation | | | | | |
| II, Ser. 2007-EOP, Cl. E | 2.67 | 3/6/20 | 610,000 | a,b | 604,143 |
| GS Mortgage Securities Corporation | | | | | |
| II, Ser. 2007-EOP, Cl. F | 2.84 | 3/6/20 | 5,680,000 | a,b | 5,616,819 |
| GS Mortgage Securities Corporation | | | | | |
| II, Ser. 2007-EOP, Cl. G | 3.02 | 3/6/20 | 3,110,000 | a,b | 3,076,966 |
| GS Mortgage Securities Corporation | | | | | |
| II, Ser. 2007-EOP, Cl. H | 3.58 | 3/6/20 | 25,000 | a,b | 24,828 |
| GS Mortgage Securities Corporation | | | | | |
| II, Ser. 2007-EOP, Cl. K | 5.33 | 3/6/20 | 2,380,000 | a,b | 2,373,959 |
| GS Mortgage Securities Corporation | | | | | |
| II, Ser. 2007-EOP, Cl. L | 6.42 | 3/6/20 | 6,725,000 | a,b | 6,697,933 |
| JP Morgan Chase Commercial | | | | | |
| Mortgage Securities, | | | | | |
| Ser. 2009-IWST, Cl. C | 7.69 | 12/5/27 | 5,455,000 | a,b | 6,288,877 |
| Merrill Lynch Mortgage Trust, | | | | | |
| Ser. 2005-LC1, Cl. A2 | 5.20 | 1/12/44 | 857,355 | b | 856,967 |
| Merrill Lynch Mortgage Trust, | | | | | |
| Ser. 2005-CKI1, Cl. A6 | 5.22 | 11/12/37 | 4,035,000 | b | 4,428,004 |
| Morgan Stanley Capital I, | | | | | |
| Ser. 2006-IQ12, Cl. AAB | 5.33 | 12/15/43 | 100,000 | | 104,695 |
| Morgan Stanley Dean Witter Capital I, | | | | | |
| Ser. 2001-TOP3, Cl. A4 | 6.39 | 7/15/33 | 7,801 | | 7,798 |
| TIAA Seasoned Commercial Mortgage | | | | | |
| Trust, Ser. 2007-C4, Cl. A3 | 5.98 | 8/15/39 | 495,000 | b | 539,701 |
| | | | | | 35,065,140 |
| Diversified Financial Services—5.3% | | | | | |
| American Express, | | | | | |
| Sr. Unscd. Notes | 7.25 | 5/20/14 | 2,000,000 | | 2,306,356 |
| Ameriprise Financial, | | | | | |
| Jr. Sub. Notes | 7.52 | 6/1/66 | 3,441,000 | b | 3,638,858 |
| Capital One Bank USA, | | | | | |
| Sub. Notes | 8.80 | 7/15/19 | 7,540,000 | | 9,497,595 |
12
| | | | | | |
| | Coupon | Maturity | Principal | | |
| Bonds and Notes (continued) | Rate (%) | Date | Amount ($)d | Value ($) |
| Diversified Financial | | | | | |
| Services (continued) | | | | | |
| Capital One Capital VI, | | | | | |
| Gtd. Cap. Secs. | 8.88 | 5/15/40 | 2,240,000 | | 2,356,207 |
| Discover Financial Services, | | | | | |
| Sr. Unscd. Notes | 10.25 | 7/15/19 | 5,402,000 | | 7,106,677 |
| ERAC USA Finance, | | | | | |
| Gtd. Notes | 6.38 | 10/15/17 | 2,535,000 | a | 2,997,840 |
| Ford Motor Credit, | | | | | |
| Sr. Unscd. Notes | 8.00 | 12/15/16 | 3,135,000 | | 3,598,447 |
| FUEL Trust, | | | | | |
| Scd. Notes | 4.21 | 4/15/16 | 3,065,000 | a | 3,119,011 |
| General Electric Capital, | | | | | |
| Sr. Unscd. Notes | 0.88 | 4/7/14 | 4,535,000 | b | 4,511,413 |
| Harley-Davidson Funding, | | | | | |
| Gtd. Notes | 5.75 | 12/15/14 | 5,980,000 | a | 6,588,321 |
| Hutchison Whampoa International, | | | | | |
| Gtd. Notes | 5.75 | 9/11/19 | 1,110,000 | a | 1,224,427 |
| Hutchison Whampoa International, | | | | | |
| Gtd. Notes | 7.63 | 4/9/19 | 1,390,000 | a | 1,696,209 |
| Hyundai Capital Services, | | | | | |
| Sr. Unscd. Notes | 4.38 | 7/27/16 | 1,300,000 | a,c | 1,360,012 |
| International Lease Finance, | | | | | |
| Sr. Unscd. Notes | 8.25 | 12/15/20 | 2,875,000 | | 3,205,625 |
| Invesco, | | | | | |
| Gtd. Notes | 5.38 | 2/27/13 | 380,000 | | 403,176 |
| Invesco, | | | | | |
| Gtd. Notes | 5.38 | 12/15/14 | 25,000 | | 27,595 |
| Invesco, | | | | | |
| Gtd. Notes | 5.63 | 4/17/12 | 5,310,000 | | 5,497,831 |
| MBNA Capital A, | | | | | |
| Gtd. Cap. Secs., Ser. A | 8.28 | 12/1/26 | 2,285,000 | | 2,350,694 |
| MBNA, | | | | | |
| Sr. Unscd. Notes | 6.13 | 3/1/13 | 185,000 | | 196,228 |
| Merrill Lynch & Co., | | | | | |
| Sub. Notes | 5.70 | 5/2/17 | 1,025,000 | | 1,049,423 |
| Merrill Lynch & Co., | | | | | |
| Sr. Unscd. Notes | 6.40 | 8/28/17 | 50,000 | | 55,294 |
| Nisource Capital Markets, | | | | | |
| Sr. Unscd. Notes | 7.86 | 3/27/17 | 105,000 | | 124,591 |
| | | | | | 62,911,830 |
STATEMENT OF INVESTMENTS (continued)
| | | | | | |
| | | Coupon | Maturity | Principal | |
| Bonds and Notes (continued) | Rate (%) | Date | Amount ($)d | Value ($) |
| Electric Utilities—.7% | | | | | |
| Cleveland Electric Illuminating, | | | | | |
| Sr. Unscd. Notes | | 5.70 | 4/1/17 | 910,000 | 1,013,787 |
| Commonwealth Edison, | | | | | |
| First Mortgage Bonds | | 6.15 | 9/15/17 | 60,000 | 70,807 |
| Consolidated Edison of NY, | | | | | |
| Sr. Unscd. Debs., Ser. 06-D | | 5.30 | 12/1/16 | 675,000 | 781,732 |
| Duke Energy Carolinas, | | | | | |
| Sr. Unscd. Notes | | 5.63 | 11/30/12 | 50,000 | 53,153 |
| Exelon Generation, | | | | | |
| Sr. Unscd. Notes | | 5.20 | 10/1/19 | 2,200,000 | 2,357,150 |
| Nevada Power, | | | | | |
| Mortgage Notes, Ser. R | | 6.75 | 7/1/37 | 395,000 | 485,353 |
| NiSource Finance, | | | | | |
| Gtd. Notes | | 5.25 | 9/15/17 | 650,000 | 725,917 |
| NiSource Finance, | | | | | |
| Gtd. Notes | | 6.40 | 3/15/18 | 1,530,000 | 1,767,690 |
| Sierra Pacific Power, | | | | | |
| Mortgage Notes, Ser. P | | 6.75 | 7/1/37 | 550,000 | 667,681 |
| | | | | | 7,923,270 |
| Environmental Control—.5% | | | | | |
| Waste Management, | | | | | |
| Sr. Unscd. Notes | | 7.00 | 7/15/28 | 2,395,000 | 2,879,087 |
| Waste Management, | | | | | |
| Gtd. Notes | | 7.75 | 5/15/32 | 2,000,000 | 2,584,920 |
| | | | | | 5,464,007 |
| Food & Beverages—.3% | | | | | |
| Kraft Foods, | | | | | |
| Sr. Unscd. Notes | | 6.88 | 2/1/38 | 2,750,000 | 3,334,972 |
| Foreign/Governmental—2.2% | | | | | |
| Chilean Government, | | | | | |
| Sr. Unscd. Notes | CLP | 5.50 | 8/5/20 | 3,232,500,000 | 7,321,044 |
| Corp Andina De Formento, | | | | | |
| Sr. Unscd. Notes | | 3.75 | 1/15/16 | 3,255,000 | 3,346,566 |
| Province of Quebec Canada, | | | | | |
| Unscd. Notes | | 4.60 | 5/26/15 | 2,795,000 | 3,136,689 |
| Republic of Korea, | | | | | |
| Sr. Unscd. Notes | | 7.13 | 4/16/19 | 1,500,000 | 1,848,656 |
| Republic of Philippines, | | | | | |
| Sr. Unscd. Bonds | PHP | 6.25 | 1/14/36 | 170,000,000 | 3,891,774 |
14
| | | | | | | |
| | | Coupon | Maturity | Principal | | |
| Bonds and Notes (continued) | Rate (%) | Date | Amount ($)d | Value ($) |
| Foreign/Governmental (continued) | | | | | |
| Russian Government, | | | | | | |
| Sr. Unscd. Bonds | RUB | 7.85 | 3/10/18 | 160,000,000 | a | 6,108,936 |
| | | | | | | 25,653,665 |
| Media—2.2% | | | | | | |
| Comcast, | | | | | | |
| Gtd. Bonds | | 6.40 | 5/15/38 | 2,775,000 | | 3,075,857 |
| Cox Communications, | | | | | | |
| Sr. Unscd. Notes | | 6.25 | 6/1/18 | 3,535,000 | a | 4,153,961 |
| DirecTV Holdings, | | | | | | |
| Gtd. Notes | | 6.00 | 8/15/40 | 205,000 | | 215,416 |
| NBC Universal Media, | | | | | | |
| Sr. Unscd. Notes | | 5.15 | 4/30/20 | 3,170,000 | a | 3,454,080 |
| News America, | | | | | | |
| Gtd. Notes | | 6.65 | 11/15/37 | 2,830,000 | | 2,977,853 |
| News America, | | | | | | |
| Gtd. Notes | | 6.90 | 8/15/39 | 2,640,000 | | 2,857,444 |
| Pearson Dollar Finance Two, | | | | | | |
| Gtd. Notes | | 6.25 | 5/6/18 | 2,990,000 | a | 3,392,687 |
| Reed Elsevier Capital, | | | | | | |
| Gtd. Notes | | 4.63 | 6/15/12 | 1,068,000 | | 1,100,069 |
| Time Warner Cable, | | | | | | |
| Gtd. Notes | | 6.75 | 7/1/18 | 1,000,000 | | 1,192,660 |
| Time Warner, | | | | | | |
| Gtd. Debs. | | 6.10 | 7/15/40 | 1,045,000 | | 1,111,293 |
| Time Warner, | | | | | | |
| Gtd. Debs. | | 6.20 | 3/15/40 | 1,798,000 | | 1,931,460 |
| | | | | | | 25,462,780 |
| Mining—.4% | | | | | | |
| Freeport-McMoRan Copper & Gold, | | | | | |
| Sr. Unscd. Notes | | 8.38 | 4/1/17 | 2,885,000 | | 3,155,437 |
| Teck Resources, | | | | | | |
| Sr. Scd. Notes | | 10.25 | 5/15/16 | 1,616,000 | | 1,941,084 |
| | | | | | | 5,096,521 |
| Municipal Bonds—1.2% | | | | | | |
| California, | | | | | | |
| GO (Build America Bonds) | | 7.30 | 10/1/39 | 3,095,000 | | 3,680,853 |
| California, | | | | | | |
| GO (Build America Bonds) | | 7.55 | 4/1/39 | 3,180,000 | | 3,911,114 |
STATEMENT OF INVESTMENTS (continued)
| | | | | | |
| | Coupon | Maturity | Principal | | |
| Bonds and Notes (continued) | Rate (%) | Date | Amount ($)d | Value ($) |
| Municipal Bonds (continued) | | | | | |
| Illinois, | | | | | |
| GO | 4.42 | 1/1/15 | 3,430,000 | | 3,572,139 |
| New York City, | | | | | |
| GO (Build America Bonds) | 5.99 | 12/1/36 | 3,200,000 | | 3,561,088 |
| | | | | | 14,725,194 |
| Office And Business | | | | | |
| Equipment—.3% | | | | | |
| Xerox, | | | | | |
| Sr. Unscd. Notes | 5.50 | 5/15/12 | 792,000 | | 821,451 |
| Xerox, | | | | | |
| Sr. Unscd. Notes | 5.65 | 5/15/13 | 1,075,000 | | 1,156,371 |
| Xerox, | | | | | |
| Sr. Unscd. Notes | 8.25 | 5/15/14 | 1,145,000 | | 1,347,475 |
| | | | | | 3,325,297 |
| Oil & Gas—2.0% | | | | | |
| Anadarko Petroleum, | | | | | |
| Sr. Unscd. Notes | 6.38 | 9/15/17 | 4,765,000 | | 5,624,439 |
| EQT, | | | | | |
| Sr. Unscd. Notes | 8.13 | 6/1/19 | 2,955,000 | | 3,693,014 |
| Hess, | | | | | |
| Sr. Unscd. Notes | 5.60 | 2/15/41 | 1,500,000 | | 1,541,307 |
| Pemex Project Funding Master | | | | | |
| Trust, Gtd. Bonds | 6.63 | 6/15/35 | 2,865,000 | | 3,136,628 |
| Petrobras International Finance, | | | | | |
| Gtd. Notes | 5.38 | 1/27/21 | 1,490,000 | | 1,594,458 |
| Petrobras International Finance, | | | | | |
| Gtd. Notes | 6.75 | 1/27/41 | 1,255,000 | | 1,413,887 |
| Petro-Canada, | | | | | |
| Sr. Unscd. Notes | 6.80 | 5/15/38 | 1,040,000 | | 1,246,144 |
| Sempra Energy, | | | | | |
| Sr. Unscd. Notes | 6.50 | 6/1/16 | 2,720,000 | | 3,230,452 |
| Valero Energy, | | | | | |
| Gtd. Notes | 6.13 | 2/1/20 | 2,100,000 | c | 2,401,146 |
| | | | | | 23,881,475 |
| Paper & Paper Related—.2% | | | | | |
| Georgia-Pacific, | | | | | |
| Gtd. Notes | 8.25 | 5/1/16 | 2,035,000 | a | 2,317,250 |
| Pipelines—1.7% | | | | | |
| El Paso, | | | | | |
| Sr. Unscd. Bonds | 6.50 | 9/15/20 | 1,725,000 | | 1,927,380 |
16
| | | | | |
| | Coupon | Maturity | Principal | |
| Bonds and Notes (continued) | Rate (%) | Date | Amount ($)d | Value ($) |
| Pipelines (continued) | | | | |
| El Paso, | | | | |
| Sr. Unscd. Notes | 7.00 | 6/15/17 | 370,000 | 430,344 |
| El Paso, | | | | |
| Sr. Unscd. Notes | 7.75 | 1/15/32 | 3,155,000 | 3,763,082 |
| El Paso Natural Gas, | | | | |
| Sr. Unscd. Notes | 5.95 | 4/15/17 | 20,000 | 23,126 |
| Enterprise Products Operating, | | | | |
| Gtd. Notes | 5.95 | 2/1/41 | 4,395,000 | 4,647,392 |
| Kinder Morgan Energy Partners, | | | | |
| Sr. Unscd. Notes | 6.55 | 9/15/40 | 2,955,000 | 3,290,582 |
| Plains All American Pipeline, | | | | |
| Gtd. Notes | 5.00 | 2/1/21 | 2,550,000 | 2,721,133 |
| Plains All American Pipeline, | | | | |
| Gtd. Notes | 5.75 | 1/15/20 | 3,089,000 | 3,431,657 |
| | | | | 20,234,696 |
| Property & Casualty | | | | |
| Insurance—2.6% | | | | |
| American International Group, | | | | |
| Sr. Unscd. Notes | 3.65 | 1/15/14 | 890,000 | 916,730 |
| American International Group, | | | | |
| Sr. Unscd. Notes | 6.40 | 12/15/20 | 3,340,000 | 3,670,874 |
| AON, | | | | |
| Sr. Unscd. Notes | 3.50 | 9/30/15 | 2,160,000 | 2,258,425 |
| Cincinnati Financial, | | | | |
| Sr. Unscd. Notes | 6.13 | 11/1/34 | 1,234,000 | 1,232,794 |
| Cincinnati Financial, | | | | |
| Sr. Unscd. Debs | 6.92 | 5/15/28 | 2,101,000 | 2,307,677 |
| Hanover Insurance Group, | | | | |
| Sr. Unscd. Notes | 7.63 | 10/15/25 | 1,745,000 | 1,874,526 |
| HUB International Holdings, | | | | |
| Sr. Sub. Notes | 10.25 | 6/15/15 | 1,685,000 a | 1,693,425 |
| Lincoln National, | | | | |
| Sr. Unscd. Notes | 6.25 | 2/15/20 | 2,905,000 | 3,313,138 |
| Principal Financial Group, | | | | |
| Gtd. Notes | 8.88 | 5/15/19 | 2,600,000 | 3,376,649 |
| Willis North America, | | | | |
| Gtd. Notes | 6.20 | 3/28/17 | 3,665,000 | 4,070,466 |
| Willis North America, | | | | |
| Gtd. Notes | 7.00 | 9/29/19 | 4,790,000 | 5,432,487 |
| | | | | 30,147,191 |
STATEMENT OF INVESTMENTS (continued)
| | | | | | |
| | Coupon | Maturity | Principal | | |
| Bonds and Notes (continued) | Rate (%) | Date | Amount ($)d | Value ($) |
| Real Estate—2.2% | | | | | |
| Boston Properties, | | | | | |
| Sr. Unscd. Notes | 6.25 | 1/15/13 | 35,000 | | 37,518 |
| Developers Diversified Realty, | | | | | |
| Sr. Unscd. Notes | 4.75 | 4/15/18 | 2,865,000 | | 2,909,373 |
| Duke Realty, | | | | | |
| Sr. Unscd. Notes | 6.75 | 3/15/20 | 545,000 | | 623,877 |
| Duke Realty, | | | | | |
| Sr. Unscd. Notes | 8.25 | 8/15/19 | 2,565,000 | | 3,178,458 |
| ERP Operating, | | | | | |
| Sr. Unscd. Notes | 5.75 | 6/15/17 | 1,220,000 | | 1,384,306 |
| Federal Realty Investment Trust, | | | | | |
| Sr. Unscd. Notes | 5.40 | 12/1/13 | 1,525,000 | | 1,641,592 |
| Federal Realty Investment Trust, | | | | | |
| Sr. Unscd. Bonds | 5.65 | 6/1/16 | 550,000 | | 613,117 |
| Federal Realty Investment Trust, | | | | | |
| Sr. Unscd. Notes | 6.20 | 1/15/17 | 145,000 | | 165,636 |
| Healthcare Realty Trust, | | | | | |
| Sr. Unscd. Notes | 5.13 | 4/1/14 | 3,000,000 | | 3,204,222 |
| Mack-Cali Realty, | | | | | |
| Sr. Unscd. Notes | 5.13 | 1/15/15 | 145,000 | | 157,239 |
| Mack-Cali Realty, | | | | | |
| Sr. Unscd. Notes | 5.25 | 1/15/12 | 2,145,000 | | 2,183,747 |
| Mack-Cali Realty, | | | | | |
| Sr. Unscd. Notes | 5.80 | 1/15/16 | 690,000 | | 770,733 |
| Regency Centers, | | | | | |
| Gtd. Notes | 5.25 | 8/1/15 | 1,777,000 | | 1,957,815 |
| Regency Centers, | | | | | |
| Gtd. Notes | 5.88 | 6/15/17 | 210,000 | | 237,268 |
| Simon Property Group, | | | | | |
| Sr. Unscd. Notes | 6.75 | 2/1/40 | 2,337,000 | | 2,757,978 |
| WEA Finance, | | | | | |
| Gtd. Notes | 7.13 | 4/15/18 | 4,015,000 | a | 4,751,419 |
| | | | | | 26,574,298 |
| Residential Mortgage | | | | | |
| Pass-Through Ctfs.—.9% | | | | | |
| Banc of America Mortgage | | | | | |
| Securities, Ser. 2005-2, | | | | | |
| Cl. 2A1 | 5.00 | 3/25/20 | 1,787,778 | | 1,791,418 |
| Fosse Master Issuer, | | | | | |
| Ser. 2011-1A, Cl. A2 | 1.65 | 10/18/54 | 5,775,000 | a,b | 5,787,087 |
18
| | | | | | |
| | Coupon | Maturity | Principal | | |
| Bonds and Notes (continued) | Rate (%) | Date | Amount ($)d | Value ($) |
| Residential Mortgage | | | | | |
| Pass-Through Ctfs. (continued) | | | | | |
| Impac CMB Trust, | | | | | |
| Ser. 2005-8, Cl. 2M2 | 0.94 | 2/25/36 | 1,918,481 | b | 1,426,689 |
| Impac CMB Trust, | | | | | |
| Ser. 2005-8, Cl. 2M3 | 1.69 | 2/25/36 | 1,551,561 | b | 1,101,838 |
| Prudential Home Mortgage | | | | | |
| Securities, Ser. 1994-A, Cl. 5B | 6.73 | 4/28/24 | 1,202 | a,b | 972 |
| Residential Funding Mortgage | | | | | |
| Securities I, Ser. 2004-S3, Cl. M1 | 4.75 | 3/25/19 | 586,689 | | 535,349 |
| | | | | | 10,643,353 |
| Retail—1.5% | | | | | |
| Autozone, | | | | | |
| Sr. Unscd. Notes | 5.75 | 1/15/15 | 3,040,000 | | 3,423,049 |
| CVS Pass-Through Trust, | | | | | |
| Pass Thru Certificates Notes | 8.35 | 7/10/31 | 6,794,305 | a | 8,491,488 |
| Home Depot, | | | | | |
| Sr. Unscd. Notes | 5.95 | 4/1/41 | 2,065,000 | | 2,250,646 |
| Staples, | | | | | |
| Gtd. Notes | 9.75 | 1/15/14 | 2,575,000 | | 3,065,164 |
| | | | | | 17,230,347 |
| Steel—.3% | | | | | |
| Arcelormittal, | | | | | |
| Sr. Unscd. Notes | 5.25 | 8/5/20 | 3,250,000 | c | 3,315,887 |
| Telecommunications—1.5% | | | | | |
| CC Holdings, | | | | | |
| Sr. Scd. Notes | 7.75 | 5/1/17 | 3,065,000 | a | 3,367,669 |
| Cellco Partnership/Verizon | | | | | |
| Wireless Capital, Sr. Unscd. Notes | 5.55 | 2/1/14 | 2,800,000 | | 3,093,695 |
| Digicel Group, | | | | | |
| Sr. Unscd. Notes | 8.88 | 1/15/15 | 6,005,000 | a | 6,155,125 |
| Telecom Italia Capital, | | | | | |
| Gtd. Notes | 5.25 | 11/15/13 | 3,775,000 | | 3,841,342 |
| Verizon Communications, | | | | | |
| Sr. Unscd. Notes | 7.35 | 4/1/39 | 1,400,000 | | 1,781,933 |
| | | | | | 18,239,764 |
| U.S. Government Agencies—.0% | | | | | |
| Small Business Administration | | | | | |
| Participation Ctfs., Gov’t | | | | | |
| Gtd. Debs., Ser. 97-J | 6.55 | 10/1/17 | 160,206 | | 174,202 |
STATEMENT OF INVESTMENTS (continued)
| | | |
| | Principal | |
| Bonds and Notes (continued) | Amount ($)d | Value ($) |
| U.S. Government Agencies/ | | |
| Mortgage-Backed—33.2% | | |
| Federal Home Loan Mortgage Corp.: | | |
| 4.00% | 56,005,000 e,f | 56,897,580 |
| 5.00%, 10/1/18—9/1/40 | 1,724,065 f | 1,847,710 |
| 5.50%, 11/1/22—9/1/40 | 18,302,311 f | 19,914,109 |
| 6.00%, 7/1/17—12/1/37 | 9,994,659 f | 11,060,998 |
| 6.50%, 3/1/14—3/1/32 | 369,383 f | 420,408 |
| 7.00%, 3/1/12 | 460 f | 467 |
| 7.50%, 12/1/25—1/1/31 | 27,828 f | 32,473 |
| 8.00%, 10/1/19—1/1/28 | 10,812 f | 12,680 |
| 8.50%, 7/1/30 | 785 f | 946 |
| Multiclass Mortgage Participation Ctfs., | | |
| Ser. 51, Cl. E, 10.00%, 7/15/20 | 123,206 f | 123,600 |
| Multiclass Mortgage Participation Ctfs., | | |
| Ser. 2586, Cl. WE, 4.00%, 12/15/32 | 1,656,211 f | 1,720,556 |
| Federal National Mortgage Association: | | |
| 4.00% | 12,885,000 e,f | 13,090,355 |
| 5.00% | 74,160,000 e,f | 79,188,731 |
| 5.50% | 115,835,000 e,f | 125,468,508 |
| 6.00% | 26,300,000 e,f | 28,924,869 |
| 5.00%, 5/1/18—9/1/40 | 8,019,892 f | 8,641,484 |
| 5.50%, 8/1/22—8/1/40 | 23,738,153 f | 25,866,438 |
| 6.00%, 1/1/19—4/1/38 | 11,039,889 f | 12,212,811 |
| 6.50%, 3/1/26—10/1/32 | 145,615 f | 165,548 |
| 7.00%, 9/1/14—7/1/32 | 52,024 f | 58,688 |
| 7.50%, 3/1/12—3/1/31 | 15,555 f | 17,586 |
| 8.00%, 5/1/13—3/1/31 | 25,037 f | 28,703 |
| Pass-Through Ctfs., Ser. 2004-58, | | |
| Cl. LJ, 5.00%, 7/25/34 | 3,780,093 f | 3,890,202 |
| Pass-Through Ctfs., Ser. 1988-16, | | |
| Cl. B, 9.50%, 6/25/18 | 71,011 f | 81,285 |
| Government National Mortgage Association I: | | |
| 5.50%, 4/15/33 | 2,455,155 | 2,732,683 |
| 6.00%, 1/15/29 | 27,701 | 31,208 |
| 6.50%, 4/15/28—9/15/32 | 55,793 | 64,006 |
| 7.00%, 12/15/26—9/15/31 | 17,118 | 20,010 |
| 7.50%, 12/15/26—11/15/30 | 5,753 | 6,761 |
| 8.00%, 1/15/30—10/15/30 | 16,815 | 19,751 |
| 8.50%, 4/15/25 | 4,452 | 5,336 |
| 9.00%, 10/15/27 | 9,722 | 11,826 |
| 9.50%, 2/15/25 | 3,065 | 3,636 |
| 9.50%, 11/15/17 | 88,986 | 96,058 |
20
| | | |
| | Principal | |
| Bonds and Notes (continued) | Amount ($)d | Value ($) |
| U.S. Government Agencies/Mortgage-Backed (continued) | | |
| Government National Mortgage Association II: | | |
| 6.50%, 2/20/31—7/20/31 | 126,343 | 144,325 |
| 7.00%, 11/20/29 | 416 | 486 |
| | | 392,802,821 |
| U.S. Government Securities—37.1% | | |
| U.S. Treasury Bonds: | | |
| 3.88%, 8/15/40 | 37,185,000 | 35,552,355 |
| 4.25%, 5/15/39 | 3,000 | 3,069 |
| 4.63%, 2/15/40 | 7,295,000 | 7,927,615 |
| 5.25%, 11/15/28 | 5,420,000 | 6,504,845 |
| 6.13%, 11/15/27 | 2,180,000 | 2,861,590 |
| U.S. Treasury Notes: | | |
| 1.00%, 9/30/11 | 91,330,000 | 91,465,625 |
| 1.38%, 9/15/12 | 11,915,000 c | 12,060,220 |
| 2.13%, 5/31/15 | 143,935,000 | 150,805,881 |
| 2.38%, 7/31/17 | 34,255,000 | 35,502,087 |
| 2.63%, 8/15/20 | 53,040,000 | 52,882,524 |
| 3.63%, 5/15/13 | 41,015,000 | 43,421,432 |
| | | 438,987,243 |
| Total Bonds and Notes | | |
| (cost $1,254,316,416) | | 1,294,791,288 |
| |
| | Face Amount | |
| | Covered by | |
| Options Purchased—.0% | Contracts ($) | Value ($) |
| Call Options: | | |
| Japanese Yen, | | |
| August 2011 @ $90 | 12,500,000 g | 0 |
| Japanese Yen, | | |
| August 2011 @ $90 | 12,395,000 g | 0 |
| Total Options | | |
| (cost $632,680) | | 0 |
| |
| | Principal | |
| Short-Term Investments—14.5% | Amount ($) | Value ($) |
| U.S. Treasury Bills: | | |
| 0.01%, 8/11/11 | 170,000,000 | 169,987,930 |
| 0.01%, 11/17/11 | 805,000 | 804,799 |
| Total Short-Term Investments | | |
| (cost $170,805,272) | | 170,792,729 |
STATEMENT OF INVESTMENTS (continued)
| | | |
| Other Investment—.8% | Shares | Value ($) |
| Registered Investment Company; | | |
| Dreyfus Institutional Preferred | | |
| Plus Money Market Fund | | |
| (cost $9,872,000) | 9,872,000 h | 9,872,000 |
| |
| Investment of Cash Collateral | | |
| for Securities Loaned—.5% | | |
| Registered Investment Company; | | |
| Dreyfus Institutional Cash Advantage Fund | | |
| (cost $5,461,700) | 5,461,700 h | 5,461,700 |
| |
| Total Investments (cost $1,441,088,068) | 125.4% | 1,480,917,717 |
| Liabilities, Less Cash and Receivables | (25.4%) | (299,775,572) |
| Net Assets | 100.0% | 1,181,142,145 |
| |
| GO—General Obligation |
| a Securities exempt from registration under Rule 144A of the Securities Act of 1933.These securities may be resold in |
| transactions exempt from registration, normally to qualified institutional buyers.At July 31, 2011, these securities |
| were valued at $136,875,414 or 11.6% of net assets. |
| b Variable rate security—interest rate subject to periodic change. |
| c Security, or portion thereof, on loan.At July 31, 2011, the value of the fund’s securities on loan was $17,338,919 |
| and the value of the collateral held by the fund was $17,831,746, consisting of cash collateral of $5,461,700 and |
| US Government and agency securities valued at $12,370,046. |
| d Principal amount stated in U.S. Dollars unless otherwise noted. |
| CLP—Chilean Peso |
| PHP—Philipines Peso |
| RUB—Russian Ruble |
| e Purchased on a forward commitment basis. |
| f The Federal Housing Finance Agency (“FHFA”) placed Federal Home Loan Mortgage Corporation and Federal |
| National Mortgage Association into conservatorship with FHFA as the conservator.As such, the FHFA oversees the |
| continuing affairs of these companies. |
| g Non-income producing security. |
| h Investment in affiliated money market mutual fund. |
| | | | |
| Portfolio Summary (Unaudited)† | | |
| |
| | Value (%) | | Value (%) |
| U.S. Government & Agencies | 70.3 | Foreign/Governmental | 2.2 |
| Corporate Bonds | 26.4 | Municipal Bonds | 1.2 |
| Short-Term/ | | Options Purchased | .0 |
| Money Market Investments | 15.8 | | |
| Asset/Mortgage-Backed | 9.5 | | 125.4 |
| |
| † Based on net assets. | | | |
| See notes to financial statements. | | | |
22
| |
| STATEMENT OF ASSETS AND LIABILITIES |
| July 31, 2011 |
| | | | | |
| | | | Cost | Value |
| Assets ($): | | | | |
| Investments in securities—See Statement of Investments (including | | |
| securities on loan, valued at $17,338,919)—Note 1(c): | | | |
| Unaffiliated issuers | | 1,425,754,368 1,465,584,017 |
| Affiliated issuers | | | 15,333,700 | 15,333,700 |
| Cash | | | | 42,688 |
| Receivable for investment securities sold | | | 32,793,740 |
| Dividends and interest receivable | | | | 9,094,591 |
| Receivable for shares of Common Stock subscribed | | | 1,161,463 |
| | | | 1,524,010,199 |
| Liabilities ($): | | | | |
| Due to The Dreyfus Corporation and affiliates—Note 3(c) | | | 832,251 |
| Payable for investment securities purchased | | | 334,308,329 |
| Liability for securities on loan—Note 1(c) | | | 5,461,700 |
| Payable for shares of Common Stock redeemed | | | 1,704,875 |
| Unrealized depreciation on swap contracts—Note 4 | | | 86,026 |
| Unrealized depreciation on forward foreign | | | |
| currency exchange contracts—Note 4 | | | 66,722 |
| Accrued expenses | | | | 408,151 |
| | | | | 342,868,054 |
| Net Assets ($) | | | 1,181,142,145 |
| Composition of Net Assets ($): | | | | |
| Paid-in capital | | | 1,194,789,437 |
| Accumulated undistributed investment income—net | | | 1,644,642 |
| Accumulated net realized gain (loss) on investments | | | (54,976,102) |
| Accumulated net unrealized appreciation (depreciation) on | | |
| investments, options transactions, swap transactions and | | |
| foreign currency transactions | | | | 39,684,168 |
| Net Assets ($) | | | 1,181,142,145 |
| |
| |
| Net Asset Value Per Share | | | | |
| | Class A | Class B | Class C | Class I |
| Net Assets ($) | 1,110,179,169 | 3,877,113 | 41,001,029 | 26,084,834 |
| Shares Outstanding | 82,597,059 | 288,517 | 3,050,742 | 1,941,317 |
| Net Asset Value Per Share ($) | 13.44 | 13.44 | 13.44 | 13.44 |
| |
| See notes to financial statements. | | | | |
| |
| STATEMENT OF OPERATIONS |
| Year Ended July 31, 2011 |
| | |
| Investment Income ($): | |
| Income: | |
| Interest | 47,745,019 |
| Dividends; | |
| Affiliated issuers | 35,855 |
| Income from securities lending—Note 1(c) | 21,827 |
| Total Income | 47,802,701 |
| Expenses: | |
| Management fee—Note 3(a) | 5,353,661 |
| Shareholder servicing costs—Note 3(c) | 4,598,122 |
| Distribution fees—Note 3(b) | 354,928 |
| Custodian fees—Note 3(c) | 99,196 |
| Professional fees | 69,890 |
| Registration fees | 64,777 |
| Directors’ fees and expenses—Note 3(d) | 39,663 |
| Prospectus and shareholders’ reports | 33,576 |
| Loan commitment fees—Note 2 | 32,418 |
| Miscellaneous | 91,812 |
| Total Expenses | 10,738,043 |
| Less—reduction in fees due to earnings credits—Note 3(c) | (2,442) |
| Net Expenses | 10,735,601 |
| Investment Income—Net | 37,067,100 |
| Realized and Unrealized Gain (Loss) on Investments—Note 4 ($): | |
| Net realized gain (loss) on investments and foreign currency transactions | 47,119,717 |
| Net realized gain (loss) on options transactions | 115,426 |
| Net realized gain (loss) on financial futures | 1,327,298 |
| Net realized gain (loss) on swap transactions | 450,852 |
| Net realized gain (loss) on forward foreign currency exchange contracts | (244,455) |
| Net Realized Gain (Loss) | 48,768,838 |
| Net unrealized appreciation (depreciation) | |
| on investments and foreign currency transactions | (19,369,416) |
| Net unrealized appreciation (depreciation) on options transactions | (1,218,523) |
| Net unrealized appreciation (depreciation) on financial futures | (435,742) |
| Net unrealized appreciation (depreciation) on swap transactions | 1,444,705 |
| Net unrealized appreciation (depreciation) | |
| on forward foreign currency exchange contracts | (353,609) |
| Net Unrealized Appreciation (Depreciation) | (19,932,585) |
| Net Realized and Unrealized Gain (Loss) on Investments | 28,836,253 |
| Net Increase in Net Assets Resulting from Operations | 65,903,353 |
| |
| See notes to financial statements. | |
24
STATEMENT OF CHANGES IN NET ASSETS
| | | |
| | | Year Ended July 31, |
| | 2011 | 2010 |
| Operations ($): | | |
| Investment income—net | 37,067,100 | 51,929,878 |
| Net realized gain (loss) on investments | 48,768,838 | 30,339,546 |
| Net unrealized appreciation | | |
| (depreciation) on investments | (19,932,585) | 83,374,503 |
| Net Increase (Decrease) in Net Assets | | |
| Resulting from Operations | 65,903,353 | 165,643,927 |
| Dividends to Shareholders from ($): | | |
| Investment income—net: | | |
| Class A Shares | (38,020,867) | (48,695,693) |
| Class B Shares | (169,015) | (550,219) |
| Class C Shares | (1,176,973) | (1,744,113) |
| Class I Shares | (1,002,567) | (1,279,118) |
| Total Dividends | (40,369,422) | (52,269,143) |
| Capital Stock Transactions ($): | | |
| Net proceeds from shares sold: | | |
| Class A Shares | 174,417,803 | 168,794,214 |
| Class B Shares | 343,380 | 730,529 |
| Class C Shares | 5,222,500 | 10,637,849 |
| Class I Shares | 9,951,572 | 15,882,924 |
| Dividends reinvested: | | |
| Class A Shares | 33,883,733 | 43,694,500 |
| Class B Shares | 124,344 | 382,750 |
| Class C Shares | 809,002 | 1,335,614 |
| Class I Shares | 481,274 | 552,023 |
| Cost of shares redeemed: | | |
| Class A Shares | (298,701,117) | (266,471,594) |
| Class B Shares | (7,709,626) | (10,363,205) |
| Class C Shares | (13,856,218) | (18,857,966) |
| Class I Shares | (14,752,972) | (16,913,930) |
| Increase (Decrease) in Net Assets from | | |
| Capital Stock Transactions | (109,786,325) | (70,596,292) |
| Total Increase (Decrease) in Net Assets | (84,252,394) | 42,778,492 |
| Net Assets ($): | | |
| Beginning of Period | 1,265,394,539 | 1,222,616,047 |
| End of Period | 1,181,142,145 | 1,265,394,539 |
| Undistributed investment income—net | 1,644,642 | 1,473,891 |
STATEMENT OF CHANGES IN NET ASSETS (continued)
| | | |
| | | Year Ended July 31, |
| | 2011 | 2010 |
| Capital Share Transactions: | | |
| Class Aa | | |
| Shares sold | 13,145,002 | 13,393,151 |
| Shares issued for dividends reinvested | 2,556,597 | 3,460,021 |
| Shares redeemed | (22,593,723) | (21,166,038) |
| Net Increase (Decrease) in Shares Outstanding | (6,892,124) | (4,312,866) |
| Class Ba | | |
| Shares sold | 25,999 | 58,494 |
| Shares issued for dividends reinvested | 9,389 | 30,494 |
| Shares redeemed | (583,210) | (828,055) |
| Net Increase (Decrease) in Shares Outstanding | (547,822) | (739,067) |
| Class C | | |
| Shares sold | 394,848 | 845,451 |
| Shares issued for dividends reinvested | 61,054 | 105,914 |
| Shares redeemed | (1,048,953) | (1,490,834) |
| Net Increase (Decrease) in Shares Outstanding | (593,051) | (539,469) |
| Class I | | |
| Shares sold | 755,036 | 1,265,003 |
| Shares issued for dividends reinvested | 36,312 | 43,810 |
| Shares redeemed | (1,115,673) | (1,345,229) |
| Net Increase (Decrease) in Shares Outstanding | (324,325) | (36,416) |
| |
| a During the period ended July 31, 2011, 139,312 Class B shares representing $1,842,064, were automatically |
| converted to 139,280 Class A shares and during the period ended July 31, 2010, 329,609 Class B shares |
| representing $4,109,406, were automatically converted to 329,547 Class A shares. |
See notes to financial statements.
26
FINANCIAL HIGHLIGHTS
The following tables describe the performance for each share class for the fiscal periods indicated.All information (except portfolio turnover rate) reflects financial results for a single fund share.Total return shows how much your investment in the fund would have increased (or decreased) during each period, assuming you had reinvested all dividends and distributions.These figures have been derived from the fund’s financial statements.
| | | | | | |
| | | | Year Ended July 31, | |
| Class A Shares | 2011 | 2010 | 2009 | 2008a | 2007 |
| Per Share Data ($): | | | | | |
| Net asset value, beginning of period | 13.15 | 12.00 | 12.02 | 12.40 | 12.35 |
| Investment Operations: | | | | | |
| Investment income—netb | .41 | .53 | .56 | .55 | .61 |
| Net realized and unrealized | | | | | |
| gain (loss) on investments | .33 | 1.15 | (.02) | (.32) | .08 |
| Total from Investment Operations | .74 | 1.68 | .54 | .23 | .69 |
| Distributions: | | | | | |
| Dividends from | | | | | |
| investment income—net | (.45) | (.53) | (.56) | (.60) | (.64) |
| Dividends from net realized | | | | | |
| gain on investments | — | — | — | (.01) | — |
| Total Distributions | (.45) | (.53) | (.56) | (.61) | (.64) |
| Net asset value, end of period | 13.44 | 13.15 | 12.00 | 12.02 | 12.40 |
| Total Return (%) | 5.75c | 14.29c | 4.90c | 1.76c | 5.74 |
| Ratios/Supplemental Data (%): | | | | | |
| Ratio of total expenses | | | | | |
| to average net assets | .88 | .89 | .92 | .87 | .92 |
| Ratio of net expenses | | | | | |
| to average net assets | .88 | .88 | .82 | .80 | .80 |
| Ratio of net investment income | | | | | |
| to average net assets | 3.14 | 4.21 | 4.93 | 4.53 | 4.85 |
| Portfolio Turnover Rated | 371.17 | 237.07 | 343.03 | 385.86 | 492.35 |
| Net Assets, end of period | | | | | |
| ($ x 1,000) | 1,110,179 | 1,176,710 | 1,125,878 | 1,257,597 | 522,661 |
| |
| a The fund commenced offering four classes of shares on May 13, 2008.The existing Investor shares were redesignated |
| as Class A shares. |
| b Based on average shares outstanding at each month end. |
| c Exclusive of sales charge. |
| d The portfolio turnover rates excluding mortgage dollar roll transactions for the periods ended July 31, 2011, 2010, |
| 2009, 2008 and 2007 were 156.79%, 90.98%, 108.07%, 125.60% and 357.70%, respectively. |
See notes to financial statements.
FINANCIAL HIGHLIGHTS (continued)
| | | | | |
| | | Year Ended July 31, | |
| Class B Shares | 2011 | 2010 | 2009 | 2008a |
| Per Share Data ($): | | | | |
| Net asset value, beginning of period | 13.15 | 12.01 | 12.01 | 12.35 |
| Investment Operations: | | | | |
| Investment income—netb | .32 | .48 | .46 | .06 |
| Net realized and unrealized | | | | |
| gain (loss) on investments | .34 | 1.13 | .00c | (.29) |
| Total from Investment Operations | .66 | 1.61 | .46 | (.23) |
| Distributions: | | | | |
| Dividends from investment income—net | (.37) | (.47) | (.46) | (.11) |
| Net asset value, end of period | 13.44 | 13.15 | 12.01 | 12.01 |
| Total Return (%)d | 5.14 | 13.72 | 3.95 | (1.77)e |
| Ratios/Supplemental Data (%): | | | | |
| Ratio of total expenses to average net assets | 1.52 | 1.43 | 1.59 | 1.70f |
| Ratio of net expenses to average net assets | 1.52 | 1.43 | 1.59 | 1.70f |
| Ratio of net investment income | | | | |
| to average net assets | 2.53 | 3.86 | 4.14 | 2.43f |
| Portfolio Turnover Rateg | 371.17 | 237.07 | 343.03 | 385.86 |
| Net Assets, end of period ($ x 1,000) | 3,877 | 10,996 | 18,918 | 41,588 |
| |
| a From May 13, 2008 (commencement of initial offering) to July 31, 2008. |
| b Based on average shares outstanding at each month end. |
| c Amount represents less than $.01 per share. |
| d Exclusive of sales charge. |
| e Not annualized. |
| f Annualized. |
| g The portfolio turnover rates excluding mortgage dollar roll transactions for the periods ended July 31, 2011, 2010, |
| 2009 and 2008 were 156.79%, 90.98%, 108.07% and 125.60%, respectively. |
See notes to financial statements.
28
| | | | | |
| | | Year Ended July 31, | |
| Class C Shares | 2011 | 2010 | 2009 | 2008a |
| Per Share Data ($): | | | | |
| Net asset value, beginning of period | 13.15 | 12.00 | 12.02 | 12.35 |
| Investment Operations: | | | | |
| Investment income—netb | .32 | .43 | .46 | .06 |
| Net realized and unrealized | | | | |
| gain (loss) on investments | .33 | 1.15 | (.02) | (.28) |
| Total from Investment Operations | .65 | 1.58 | .44 | (.22) |
| Distributions: | | | | |
| Dividends from investment income—net | (.36) | (.43) | (.46) | (.11) |
| Net asset value, end of period | 13.44 | 13.15 | 12.00 | 12.02 |
| Total Return (%)c | 5.01 | 13.40 | 4.01 | (1.81)d |
| Ratios/Supplemental Data (%): | | | | |
| Ratio of total expenses to average net assets | 1.59 | 1.66 | 1.69 | 1.49e |
| Ratio of net expenses to average net assets | 1.59 | 1.66 | 1.69 | 1.49e |
| Ratio of net investment income | | | | |
| to average net assets | 2.44 | 3.41 | 4.07 | 2.64e |
| Portfolio Turnover Ratef | 371.17 | 237.07 | 343.03 | 385.86 |
| Net Assets, end of period ($ x 1,000) | 41,001 | 47,907 | 50,196 | 54,928 |
| |
| a From May 13, 2008 (commencement of initial offering) to July 31, 2008. |
| b Based on average shares outstanding at each month end. |
| c Exclusive of sales charge. |
| d Not annualized. |
| e Annualized. |
| f The portfolio turnover rates excluding mortgage dollar roll transactions for the periods ended July 31, 2011, 2010, |
| 2009 and 2008 were 156.79%, 90.98%, 108.07% and 125.60%, respectively. |
See notes to financial statements.
FINANCIAL HIGHLIGHTS (continued)
| | | | | | |
| | | Year Ended July 31, | |
| Class I Shares | 2011 | 2010 | 2009 | 2008a | 2007 |
| Per Share Data ($): | | | | | |
| Net asset value, beginning of period | 13.14 | 12.00 | 12.01 | 12.40 | 12.34 |
| Investment Operations: | | | | | |
| Investment income—netb | .46 | .56 | .58 | .60 | .64 |
| Net realized and unrealized | | | | | |
| gain (loss) on investments | .34 | 1.15 | .00c | (.34) | .09 |
| Total from Investment Operations | .80 | 1.71 | .58 | .26 | .73 |
| Distributions: | | | | | |
| Dividends from investment income—net | (.50) | (.57) | (.59) | (.64) | (.67) |
| Dividends from net realized | | | | | |
| gain on investments | — | — | — | (.01) | — |
| Total Distributions | (.50) | (.57) | (.59) | (.65) | (.67) |
| Net asset value, end of period | 13.44 | 13.14 | 12.00 | 12.01 | 12.40 |
| Total Return (%) | 6.09 | 14.52 | 5.27 | 2.05 | 6.02 |
| Ratios/Supplemental Data (%): | | | | | |
| Ratio of total expenses | | | | | |
| to average net assets | .55 | .62 | .60 | .52 | .53 |
| Ratio of net expenses | | | | | |
| to average net assets | .55 | .59 | .54 | .52 | .53 |
| Ratio of net investment income | | | | | |
| to average net assets | 3.46 | 4.46 | 5.18 | 4.83 | 5.10 |
| Portfolio Turnover Rated | 371.17 | 237.07 | 343.03 | 385.86 | 492.35 |
| Net Assets, end of period ($ x 1,000) | 26,085 | 29,781 | 27,624 | 38,600 | 35,482 |
| |
| a The fund commenced offering four classes of shares on May 13, 2008.The existing Institutional shares were |
| redesignated as Class I shares. |
| b Based on average shares outstanding at each month end. |
| c Amount represents less than $.01 per share. |
| d The portfolio turnover rates excluding mortgage dollar roll transactions for the periods ended July 31, 2011, 2010, |
| 2009, 2008 and 2007 were 156.79%, 90.98%, 108.07%, 125.60% and 357.70%, respectively. |
See notes to financial statements.
30
NOTES TO FINANCIAL STATEMENTS
NOTE 1—Significant Accounting Policies:
Dreyfus IntermediateTerm Income Fund (the “fund”) is a separate diversified series of Dreyfus Investment Grade Funds, Inc. (the “Company”), which is registered under the Investment Company Act of 1940, as amended (the “Act”), as an open-end management investment company and operates as a series company currently offering three series, including the fund.The fund’s investment objective seeks to maximize total return, consisting of capital appreciation and current income.The Dreyfus Corporation (the “Manager” or “Dreyfus”), a wholly-owned subsidiary of The Bank of New York Mellon Corporation (“BNY Mellon”), serves as the fund’s investment adviser.
MBSC Securities Corporation (the “Distributor”), a wholly-owned subsidiary of the Manager, is the distributor of the fund’s shares. The fund is authorized to issue 1.2 billion shares of $.001 par value Common Stock.The fund currently offers four classes of shares: Class A (500 million shares authorized), Class B (100 million shares authorized), Class C (100 million shares authorized) and Class I (500 million shares authorized). Class A shares are subject to a sales charge imposed at the time of purchase. Class B shares are subject to a contingent deferred sales charge (“CDSC”) imposed on Class B share redemptions made within six years of purchase and automatically convert to Class A shares after six years. The fund no longer offers Class B shares, except in connection with dividend reinvestment and permitted exchanges of Class B shares. Class C shares are subject to a CDSC imposed on Class C shares redeemed within one year of purchase. Class I shares are sold at net asset value per share only to institutional investors. Other differences between the classes include the services offered to and the expenses borne by each class, the allocation of certain transfer agency costs and certain voting rights. Income, expenses (other than expenses attributable to a specific class), and realized and unrealized gains or losses on investments are allocated to each class of shares based on its relative net assets.
NOTES TO FINANCIAL STATEMENTS (continued)
The Company accounts separately for the assets, liabilities and operations of each series. Expenses directly attributable to each series are charged to that series’ operations; expenses which are applicable to all series are allocated among them on a pro rata basis.
The Financial Accounting Standards Board (“FASB”) Accounting Standards Codification (“ASC”) is the exclusive reference of authoritative U.S. generally accepted accounting principles (“GAAP”) recognized by the FASB to be applied by nongovernmental entities. Rules and interpretive releases of the Securities and Exchange Commission (“SEC”) under authority of federal laws are also sources of authoritative GAAP for SEC registrants. The fund’s financial statements are prepared in accordance with GAAP, which may require the use of management estimates and assumptions.Actual results could differ from those estimates.
The Company enters into contracts that contain a variety of indemnifications.The fund’s maximum exposure under these arrangements is unknown.The fund does not anticipate recognizing any loss related to these arrangements.
(a) Portfolio valuation: Investments in securities, excluding short-term investments (other than U.S. Treasury Bills), financial futures, options transactions, swap transactions and forward foreign currency exchange contracts (“forward contracts”) are valued each business day by an independent pricing service (the “Service”) approved by the Board of Directors. Investments for which quoted bid prices are readily available and are representative of the bid side of the market in the judgment of the Service are valued at the mean between the quoted bid prices (as obtained by the Service from dealers in such securities) and asked prices (as calculated by the Service based upon its evaluation of the market for such securities). Other investments (which constitute a majority of the portfolio securities) are valued as determined by the Service, based on methods which include consideration of: yields or prices of securities of comparable quality, coupon, maturity and type; indications as to values from dealers; and general market conditions. Restricted securities, as well as securities or other assets for which recent market quotations are not
32
readily available, that are not valued by a pricing service approved by the Board of Directors, or are determined by the fund not to reflect accurately fair value, are valued at fair value as determined in good faith under the direction of the Board of Directors.The factors that may be considered when fair valuing a security include fundamental analytical data, the nature and duration of restrictions on disposition, an evaluation of the forces that influence the market in which the securities are purchased and sold and public trading in similar securities of the issuer or comparable issuers. Short-term investments, excluding U.S. Treasury Bills, are carried at amortized cost, which approximates value. Registered investment companies that are not traded on an exchange are valued at their net asset value. Financial futures and options, which are traded on an exchange, are valued at the last sales price on the securities exchange on which such securities are primarily traded or at the last sales price on the national securities market on each business day. Options traded over-the-counter are valued at the mean between the bid and the asked price. Investments in swap transactions are valued each business day by an independent pricing service approved by the Board of Directors. Swaps are valued by the service by using a swap pricing model which incorporates among other factors, default probabilities, recovery rates, credit curves of the underlying issuer and swap spreads on interest rates. Investments denominated in foreign currencies are translated to U.S. dollars at the prevailing rates of exchange. Forward contracts are valued at the forward rate.
The fair value of a financial instrument is the amount that would be received to sell an asset or paid to transfer a liability in an orderly transaction between market participants at the measurement date (i.e. the exit price). GAAP establishes a fair value hierarchy that prioritizes the inputs of valuation techniques used to measure fair value.This hierarchy gives the highest priority to unadjusted quoted prices in active markets for identical assets or liabilities (Level 1 measurements) and the lowest priority to unobservable inputs (Level 3 measurements).
NOTES TO FINANCIAL STATEMENTS (continued)
Additionally, GAAP provides guidance on determining whether the volume and activity in a market has decreased significantly and whether such a decrease in activity results in transactions that are not orderly. GAAP requires enhanced disclosures around valuation inputs and techniques used during annual and interim periods.
Various inputs are used in determining the value of the fund’s investments relating to fair value measurements.These inputs are summarized in the three broad levels listed below:
Level 1—unadjusted quoted prices in active markets for identical investments.
Level 2—other significant observable inputs (including quoted prices for similar investments, interest rates, prepayment speeds, credit risk, etc.).
Level 3—significant unobservable inputs (including the fund’s own assumptions in determining the fair value of investments).
The inputs or methodology used for valuing securities are not necessarily an indication of the risk associated with investing in those securities.
The following is a summary of the inputs used as of July 31, 2011 in valuing the fund’s investments:
| | | | | |
| | | Level 2—Other | Level 3— | |
| | Level 1— | Significant | Significant | |
| | Unadjusted | Observable | Unobservable | |
| | Quoted Prices | Inputs | Inputs | Total |
| Assets ($) | | | | |
| Investments in Securities: | | | |
| Asset-Backed | — | 66,521,515 | — | 66,521,515 |
| Commercial | | | | |
| Mortgage-Backed | — | 35,065,140 | — | 35,065,140 |
| Corporate Bonds† | — | 310,218,155 | — | 310,218,155 |
| Foreign Government | — | 25,653,665 | — | 25,653,665 |
| Municipal Bonds | — | 14,725,194 | — | 14,725,194 |
| Mutual Funds | 15,333,700 | — | — | 15,333,700 |
| Residential | | | | |
| Mortgage-Backed | — | 10,643,353 | — | 10,643,353 |
| U.S. Government | | | | |
| Agencies/ | | | | |
| Mortgage-Backed | — | 392,977,023 | — | 392,977,023 |
34
| | | | | |
| | | Level 2—Other | Level 3— | |
| | Level 1— | Significant | Significant | |
| | Unadjusted | Observable | Unobservable | |
| | Quoted Prices | Inputs | Inputs | Total |
| Assets ($) (continued) | | | |
| U.S. Treasury | — | 609,779,972 | — | 609,779,972 |
| Other Financial | | | | |
| Instruments: | | | | |
| Options Purchased | — | 0 | — | 0 |
| Liabilities ($) | | | | |
| Other Financial | | | | |
| Instruments: | | | | |
| Forward Foreign | | | | |
| Currency Exchange | | | | |
| Contracts†† | — | (66,722) | — | (66,722) |
| Swaps†† | — | (86,026) | — | (86,026) |
| | |
| † | See Statement of Investments for additional detailed categorizations. |
| †† | Amount shown represents unrealized appreciation (depreciation) at period end. |
In January 2010, FASB issued Accounting Standards Update (“ASU”) No. 2010-06 “Improving Disclosures about Fair Value Measurements” (“ASU 2010-06”).The portions of ASU 2010-06 which require reporting entities to prepare new disclosures surrounding amounts and reasons for significant transfers in and out of Level 1 and Level 2 fair value measurements as well as inputs and valuation techniques used to measure fair value for both recurring and nonrecurring fair value measurements that fall in either Level 2 or Level 3 have been adopted by the fund. No significant transfers between Level 1 or Level 2 fair value measurements occurred at July 31, 2011.
In May 2011, FASB issued ASU No. 2011-04 “Amendments to Achieve Common Fair Value Measurement and Disclosure Requirements in GAAP and International Financial Reporting Standards (“IFRS”)” (“ASU 2011-04”). ASU 2011-04 includes common requirements for measurement of and disclosure about fair value between GAAP and IFRS. ASU 2011-04 will require reporting entities to disclose the following information for fair value measurements categorized within Level 3 of the fair value hierarchy: quantitative information about the
NOTES TO FINANCIAL STATEMENTS (continued)
unobservable inputs used in the fair value measurement, the valuation processes used by the reporting entity and a narrative description of the sensitivity of the fair value measurement to changes in unobservable inputs and the interrelationships between those unobservable inputs. In addition, ASU 2011-04 will require reporting entities to make disclosures about amounts and reasons for all transfers in and out of Level 1 and Level 2 fair value measurements.The new and revised disclosures are effective for interim and annual reporting periods beginning after December 15, 2011. At this time, management is evaluating the implications of ASU 2011-04 and its impact on the financial statements
(b) Foreign currency transactions: The fund does not isolate that portion of the results of operations resulting from changes in foreign exchange rates on investments from the fluctuations arising from changes in market prices of securities held. Such fluctuations are included with the net realized and unrealized gain or loss on investments.
Net realized foreign exchange gains or losses arise from sales of foreign currencies, currency gains or losses realized on securities transactions between trade and settlement date, and the difference between the amounts of dividends, interest, and foreign withholding taxes recorded on the fund’s books and the U.S. dollar equivalent of the amounts actually received or paid. Net unrealized foreign exchange gains and losses arise from changes in the value of assets and liabilities other than investments resulting from changes in exchange rates. Foreign currency gains and losses on investments are included with net realized and unrealized gain or loss on investments.
(c) Securities transactions and investment income: Securities transactions are recorded on a trade date basis. Realized gains and losses from securities transactions are recorded on the identified cost basis. Dividend income is recognized on the ex-dividend date and interest income, including, where applicable, accretion of discount and amortization of premium on investments, is recognized on the accrual basis.
Pursuant to a securities lending agreement withThe Bank of NewYork Mellon, a subsidiary of BNY Mellon and an affiliate of Dreyfus, the
36
fund may lend securities to qualified institutions. It is the fund’s policy that, at origination, all loans are secured by collateral of at least 102% of the value of U.S. securities loaned and 105% of the value of foreign securities loaned. Collateral equivalent to at least 100% of the market value of securities on loan is maintained at all times. Collateral is either in the form of cash, which can be invested in certain money market mutual funds managed by the Manager, U.S. Government and Agency securities or letters of credit.The fund is entitled to receive all income on securities loaned, in addition to income earned as a result of the lending transaction. Although each security loaned is fully collateralized, the fund bears the risk of delay in recovery of, or loss of rights in, the securities loaned should a borrower fail to return the securities in a timely manner. During the period ended July 31, 2011, The Bank of New York Mellon earned $11,753 from lending portfolio securities, pursuant to the securities lending agreement.
(d) Affiliated issuers: Investments in other investment companies advised by Dreyfus are defined as “affiliated” in the Act.
The fund may invest in shares of certain affiliated investment companies also advised or managed by Dreyfus. Investments in affiliated investment companies for the period ended July 31, 2011 were as follows:
| | | | | | |
| Affiliated | | | | | |
| Investment | Value | | | Value | Net |
| Company | 7/31/2010 ($) | Purchases ($) | Sales ($) | 7/31/2011 ($) | Assets (%) |
| Dreyfus | | | | | |
| Institutional | | | | | |
| Preferred | | | | | |
| Plus Money | | | | | |
| Market Fund | 1,235,000 | 1,120,349,000 | 1,111,712,000 | 9,872,000 | .8 |
| Dreyfus | | | | | |
| Institutional | | | | | |
| Cash | | | | | |
| Advantage | | | | | |
| Fund† | 14,924,807 | 73,157,040 | 82,620,147 | 5,461,700 | .5 |
| Total | 16,159,807 | 1,193,506,040 | 1,194,332,147 | 15,333,700 | 1.3 |
| | |
| † | On June 7, 2011, Dreyfus Institutional Cash Advantage Plus Fund was acquired by Dreyfus |
| | Institutional Cash Advantage Fund, resulting in a transfer of shares. |
NOTES TO FINANCIAL STATEMENTS (continued)
(e) Dividends to shareholders: It is the policy of the fund to declare dividends daily from investment income-net. Such dividends are paid monthly. Dividends from net realized capital gains, if any, are normally declared and paid annually, but the fund may make distributions on a more frequent basis to comply with the distribution requirements of the Internal Revenue Code of 1986, as amended (the “Code”).To the extent that net realized capital gains can be offset by capital loss carryovers, it is the policy of the fund not to distribute such gains. Income and capital gain distributions are determined in accordance with income tax regulations, which may differ from GAAP.
(f) Federal income taxes: It is the policy of the fund to continue to qualify as a regulated investment company, if such qualification is in the best interests of its shareholders, by complying with the applicable provisions of the Code, and to make distributions of taxable income sufficient to relieve it from substantially all federal income and excise taxes.
As of and during the period ended July 31, 2011, the fund did not have any liabilities for any uncertain tax positions. The fund recognizes interest and penalties, if any, related to uncertain tax positions as income tax expense in the Statement of Operations. During the period, the fund did not incur any interest or penalties.
Each of the tax years in the four-year period ended July 31, 2011 remains subject to examination by the Internal Revenue Service and state taxing authorities.
At July 31, 2011, the components of accumulated earnings on a tax basis were as follows: undistributed ordinary income $2,491,248, accumulated capital losses $51,882,012 and unrealized appreciation $35,743,472.
The accumulated capital loss carryover is available for federal income tax purposes to be applied against future net securities profits, if any, realized subsequent to July 31, 2011. If not applied, $26,906 of the carryover expires in fiscal 2013, $2,935,095 expires in fiscal 2014, $11,616,326 expires in fiscal 2015, $635,541 expires in fiscal 2016, $33,295,069 expires in fiscal 2017 and $3,373,075 expires in fiscal 2018.
38
The tax character of distributions paid to shareholders during the fiscal periods ended July 31, 2011 and July 31, 2010 were as follows: ordinary income $40,369,422 and $52,269,143, respectively.
During the period ended July 31, 2011, as a result of permanent book to tax differences, primarily due to the tax treatment for amortization of premiums, paydown gains and losses on mortgage-backed securities, foreign currency transactions, consent fees and swap periodic payments, the fund increased accumulated undistributed investment income-net by $3,473,073 and decreased accumulated net realized gain (loss) on investments by the same amount. Net assets and net asset value per share were not affected by this reclassification.
(g) New accounting pronouncement: In April 2011, the FASB issued ASU No. 2011-03 “Transfers and Servicing (Topic 860) Reconsideration of Effective Control for Repurchase Agreements (“ASU 2011-03”)” which relates to the accounting for repurchase agreements and similar agreements including mortgage dollar rolls, that both entitle and obligate a transferor to repurchase or redeem financial assets before their maturity. ASU 2011-03 modifies the criteria for determining effective control of transferred assets and as a result certain agreements may now be accounted for as secured borrowings.ASU 2011-03 is effective prospectively for new transfers and existing transactions that are modified in the first interim or annual period beginning on or after December 15, 2011. Management is currently evaluating the implications of this change and its impact on the financial statements.
NOTE 2—Bank Lines of Credit:
The fund participates with other Dreyfus-managed funds in a $225 million unsecured credit facility led by Citibank, N.A. and a $300 million unsecured credit facility provided by The Bank of New York Mellon (each, a “Facility”), each to be utilized primarily for temporary or emergency purposes, including the financing of redemptions. In connection therewith, the fund has agreed to pay its pro rata portion of commitment fees for each Facility. Interest is charged to the fund
NOTES TO FINANCIAL STATEMENTS (continued)
based on rates determined pursuant to the terms of the respective Facility at the time of borrowing. During the period ended July 31, 2011, the fund did not borrow under the Facilities.
NOTE 3—Management Fee and Other Transactions With Affiliates:
(a) Pursuant to a management agreement with the Manager, the management fee is computed at the annual rate of .45% of the value of the fund’s average daily net assets and is payable monthly.
During the period ended July 31, 2011, the Distributor retained $337 from commissions earned on sales of the fund’s Class A shares and $18,521 and $2,521 from CDSCs on redemptions of the fund’s Class B and Class C shares, respectively.
(b) Under the Distribution Plan (the “Plan”) adopted pursuant to Rule 12b-1 under the Act, Class B and Class C shares pay the Distributor for distributing their shares at an annual rate of .50% of the value of the average daily net assets of Class B shares and .75% of the value of the average daily net assets of Class C shares. During the period ended July 31, 2011, Class B and Class C shares were charged $29,928 and $325,000, respectively, pursuant to the Plan.
(c) Under the Shareholder Services Plan, Class A, Class B and Class C shares pay the Distributor at an annual rate of .25% of the value of their average daily net assets for the provision of certain services.The services provided may include personal services relating to shareholder accounts, such as answering shareholder inquiries regarding the fund and providing reports and other information, and services related to the maintenance of shareholder accounts.The Distributor may make payments to Service Agents (a securities dealer, financial institution or other industry professional) in respect of these services.The Distributor determines the amounts to be paid to Service Agents. During the period ended July 31, 2011, Class A, Class B and Class C shares were charged $2,783,914, $14,964 and $108,333, respectively, pursuant to the Shareholder Services Plan.
40
The fund compensates Dreyfus Transfer, Inc., a wholly-owned subsidiary of the Manager, under a transfer agency agreement for providing personnel and facilities to perform transfer agency services for the fund. During the period ended July 31, 2011, the fund was charged $449,578 pursuant to the transfer agency agreement, which is included in Shareholder servicing costs in the Statement of Operations.
The fund has arrangements with the custodian and cash management bank whereby the fund may receive earnings credits when positive cash balances are maintained, which are used to offset custody and cash management fees. For financial reporting purposes, the fund includes net earnings credits as an expense offset in the Statement of Operations.
The fund compensates The Bank of New York Mellon under a cash management agreement for performing cash management services related to fund subscriptions and redemptions. During the period ended July 31, 2011, the fund was charged $49,666 pursuant to the cash management agreement, which is included in Shareholder servicing costs in the Statement of Operations.These fees were partially offset by earnings credits of $2,442.
The fund also compensates The Bank of New York Mellon under a custody agreement for providing custodial services for the fund. During the period ended July 31, 2011, the fund was charged $99,196 pursuant to the custody agreement.
During the period ended July 31, 2011, the fund was charged $7,880 for services performed by the Chief Compliance Officer.
The components of “Due to The Dreyfus Corporation and affiliates” in the Statement of Assets and Liabilities consist of: management fees $449,724, Rule 12b-1 distribution plan fees $27,549, shareholder services plan fees $244,218, custodian fees $33,264, chief compliance officer fees $2,756 and transfer agency per account fees $74,740.
NOTES TO FINANCIAL STATEMENTS (continued)
(d) Each Board member also serves as a Board member of other funds within the Dreyfus complex. Annual retainer fees and attendance fees are allocated to each fund based on net assets.
NOTE 4—Securities Transactions:
The aggregate amount of purchases and sales (including paydowns) of investment securities, excluding short-term securities, options transactions, financial futures, forward contracts and swap transactions, during the period ended July 31, 2011, amounted to $4,800,300,690 and $4,907,348,549, respectively, of which $2,772,583,571 in purchases and $2,779,089,065 in sales were from mortgage dollar roll transactions.
Mortgage Dollar Rolls: A mortgage dollar roll transaction involves a sale by the fund of mortgage related securities that it holds with an agreement by the fund to repurchase similar securities at an agreed upon price and date.The securities purchased will bear the same interest rate as those sold, but generally will be collateralized by pools of mortgages with different prepayment histories than those securities sold.
The following tables show the fund’s exposure to different types of market risk as it relates to the Statement of Assets and Liabilities and the Statement of Operations, respectively.
Fair value of derivative instruments as of July 31, 2011 is shown below:
| | | | |
| | Derivative | | Derivative |
| | Assets ($) | | Liabilities ($) |
| Foreign exchange risk1 | 0 | Foreign exchange risk2 | (66,722) |
| Credit risk | — | Credit risk3 | (86,026) |
| Gross fair value of | | | |
| derivatives contracts | 0 | | (152,748) |
| | |
| Statement of Assets and Liabilities location: |
| 1 | Options purchased are included in Statement of Investments in Securities of Unaffiliated issuers at |
| | market value. |
| 2 | Unrealized depreciation on forward foreign currency exchange contracts. |
| 3 | Unrealized depreciation on swap contracts. |
42
The effect of derivative instruments in the Statement of Operations during the period ended July 31, 2011 is shown below:
| | | | | | |
| | Amount of realized gain or (loss) on derivatives recognized in income ($) |
| | | | Forward | | |
| Underlying risk | Options4 | Futures5 | Contracts6 | Swaps7 | Total |
| Interest rate | (139,352) | 1,327,298 | — | — | 1,187,946 |
| Foreign | | | | | |
| exchange | 254,778 | — | (244,455) | — | 10,323 |
| Credit | — | — | — | 450,852 | 450,852 |
| Total | 115,426 | 1,327,298 | (244,455) | 450,852 | 1,649,121 |
Change in unrealized appreciation or (depreciation) on derivatives recognized in income ($)
| | | | | | |
| Change in unrealized appreciation or (depreciation) on derivatives recognized in income ($) |
| | | | Forward | | |
| Underlying risk | Options8 | Futures9 | Contracts10 | Swaps11 | Total |
| Interest rate | (585,843) | (435,742) | — | — | (1,021,585) |
| Foreign | | | | | |
| exchange | (632,680) | — | (353,609) | — | (986,289) |
| Credit | — | — | — | 1,444,705 | 1,444,705 |
| Total | (1,218,523) | (435,742) | (353,609) | 1,444,705 | (563,169) |
| | |
| Statement of Operations location: |
| 4 | Net realized gain (loss) on options transactions. |
| 5 | Net realized gain (loss) on financial futures. |
| 6 | Net realized gain (loss) on forward foreign currency exchange contracts. |
| 7 | Net realized gain (loss) on swap transactions. |
| 8 | Net unrealized appreciation (depreciation) on options transactions. |
| 9 | Net unrealized appreciation (depreciation) on financial futures. |
| 10 Net unrealized appreciation (depreciation) on forward foreign currency exchange contracts. |
| 11 Net unrealized appreciation (depreciation) on swap transactions. |
Futures Contracts: In the normal course of pursuing its investment objective, the fund is exposed to market risk, including interest rate risk, as a result of changes in value of underlying financial instruments. The fund invests in financial futures contracts in order to manage its exposure to or protect against changes in the market. A
NOTES TO FINANCIAL STATEMENTS (continued)
futures contract represents a commitment for the future purchase or a sale of an asset at a specified date. Upon entering into such contracts, these investments require initial margin deposits with a broker, which consist of cash or cash equivalents. The amount of these deposits is determined by the exchange or Board of Trade on which the contract is traded and is subject to change.Accordingly, variation margin payments are received or made to reflect daily unrealized gains or losses which are recorded in the Statement of Operations. Futures contracts are valued daily at the last sales price established by the Board of Trade or exchange upon which they are traded.When the contracts are closed, the fund recognizes a realized gain or loss. There is minimal counterparty credit risk to the fund with futures since futures are exchange traded, and the exchange’s clearinghouse guarantees the futures against default.At July 31, 2011, there were no financial futures contracts outstanding.
Options: The fund purchases and writes (sells) put and call options to hedge against changes in interest rates and foreign currencies, or as a substitute for an investment. The fund is subject to interest rate and currency risk in the course of pursuing its investment objectives through its investments in options contracts. A call option gives the purchaser of the option the right (but not the obligation) to buy, and obligates the writer to sell, the underlying security or securities at the exercise price at any time during the option period, or at a specified date. Conversely, a put option gives the purchaser of the option the right (but not the obligation) to sell, and obligates the writer to buy the underlying security or securities at the exercise price at any time during the option period, or at a specified date.
As a writer of call options, the fund receives a premium at the outset and then bears the market risk of unfavorable changes in the price of the financial instrument underlying the option. Generally, the fund realizes a gain, to the extent of the premium, if the price of the underlying financial instrument decreases between the date the option is written and the date on which the option is terminated. Generally, the fund incurs a loss, if the price of the financial instrument increases between those dates.
44
As a writer of put options, the fund receives a premium at the outset and then bears the market risk of unfavorable changes in the price of the financial instrument underlying the option. Generally, the fund realizes a gain, to the extent of the premium, if the price of the underlying financial instrument increases between the date the option is written and the date on which the option is terminated. Generally, the fund incurs a loss, if the price of the financial instrument decreases between those dates.
As a writer of an option, the fund has no control over whether the underlying securities may be sold (call) or purchased (put) and as a result bears the market risk of an unfavorable change in the price of the security underlying the written option.There is a risk of loss from a change in value of such options which may exceed the related premiums received. One risk of holding a put or a call option is that if the option is not sold or exercised prior to its expiration, it becomes worthless. However, this risk is limited to the premium paid by the fund. Upon the expiration or closing of the option transaction, a gain or loss is reported in the Statement of Operations.
The following summarizes the fund’s call/put options written during the period ended July 31, 2011:
| | | | | |
| | Face Amount | | Options Terminated |
| | Covered by | Premiums | | Net Realized |
| Options Written: | Contracts ($) | Received ($) | Cost ($) Gain (Loss) ($) |
| Contracts outstanding | | | | |
| July 31, 2010 | 39,580,000 | 593,700 | | |
| Contracts written | 55,162,000 | 3,791,212 | | |
| Contracts terminated: | | | | |
| Contracts closed | 28,952,000 | 2,727,854 | 4,349,354 | (1,621,500) |
| Contracts expired | 65,790,000 | 1,657,058 | — | 1,657,058 |
| Total contracts | | | | |
| terminated | 94,742,000 | 4,384,912 | 4,349,354 | 35,558 |
| Contracts outstanding | | | | |
| July 31, 2011 | — | — | | |
Forward Foreign Currency Exchange Contracts: The fund enters into forward contracts in order to hedge its exposure to changes in foreign currency exchange rates on its foreign portfolio holdings, to settle
NOTES TO FINANCIAL STATEMENTS (continued)
foreign currency transactions or as a part of its investment strategy. When executing forward contracts, the fund is obligated to buy or sell a foreign currency at a specified rate on a certain date in the future. With respect to sales of forward contracts, the fund incurs a loss if the value of the contract increases between the date the forward contract is opened and the date the forward contract is closed.The fund realizes a gain if the value of the contract decreases between those dates. With respect to purchases of forward contracts, the fund incurs a loss if the value of the contract decreases between the date the forward contract is opened and the date the forward contract is closed.The fund realizes a gain if the value of the contract increases between those dates. Any realized gain or loss which occurred during the period is reflected in the Statement of Operations.The fund is exposed to foreign currency risk as a result of changes in value of underlying financial instruments. The fund is also exposed to credit risk associated with counterparty nonperformance on these forward contracts, which is typically limited to the unrealized gain on each open contract.The following summarizes open forward contracts at July 31, 2011:
| | | | | |
| | Foreign | | | |
| Forward Foreign Currency | Currency | | | Unrealized |
| Exchange Contracts | Amounts | Proceeds ($) | Value ($) (Depreciation) ($) |
| Sales: | | | | |
| Chilean Peso, | | | | |
| Expiring 8/26/2011 | 3,356,440,000 | 7,241,042 | 7,307,764 | (66,722) |
Swaps: The fund enters into swap agreements to exchange the interest rate on, or return generated by, one nominal instrument for the return generated by another nominal instrument.The fund enters into these agreements to hedge certain market or interest rate risks, to manage the interest rate sensitivity (sometimes called duration) of fixed income securities, to provide a substitute for purchasing or selling particular securities or to increase potential returns.
The fund accrues for the interim payments on swap contracts on a daily basis, with the net amount recorded within unrealized appreciation (depreciation) on swap contracts in the Statement of Assets and Liabilities. Once the interim payments are settled in cash, the net
46
amount is recorded as realized gain (loss) on swaps, in addition to realized gain (loss) recorded upon the termination of swap contracts in the Statement of Operations. Upfront payments made and/or received by the fund, are recorded as an asset and/or liability in the Statement of Assets and Liabilities and are recorded as a realized gain or loss ratably over the contract’s term/event with the exception of forward starting interest rate swaps which are recorded as realized gains or losses on the termination date. Fluctuations in the value of swap contracts are recorded for financial statement purposes as unrealized appreciation or depreciation on swap transactions.
Credit Default Swaps: Credit default swaps involve commitments to pay a fixed interest rate in exchange for payment if a credit event affecting a third party (the referenced company) occurs. Credit events may include a failure to pay interest or principal, bankruptcy, or restructur-ing.The fund enters into these agreements to manage its exposure to the market or certain sectors of the market, to reduce its risk exposure to defaults of corporate and sovereign issuers, or to create exposure to corporate or sovereign issuers to which it is not otherwise exposed. For those credit default swaps in which the fund is paying a fixed rate, the fund is buying credit protection on the instrument. In the event of a credit event, the fund would receive the full notional amount for the reference obligation. For those credit default swaps in which the fund is receiving a fixed rate, the fund is selling credit protection on the underlying instrument. The maximum payouts for these contracts are limited to the notional amount of each swap. Credit default swaps may involve greater risks than if the fund had invested in the reference obligation directly and are subject to general market risk, liquidity risk, counterparty risk and credit risk.
The maximum potential amount of future payments (undiscounted) that a fund as a seller of protection could be required to make under a credit default swap agreement would be an amount equal to the notional amount of the agreement which may exceed the amount of unrealized appreciation or depreciation reflected in the Statement of Assets and
NOTES TO FINANCIAL STATEMENTS (continued)
Liabilities. Notional amounts of all credit default swap agreements are disclosed in the following chart, which summarizes open credit default swaps on corporate issues entered into by the fund. These potential amounts would be partially offset by any recovery values of the respective referenced obligations, upfront payments received upon entering into the agreement, or net amounts received from the settlement of buy protection credit default swap agreements entered into by the fund for the same referenced entity or entities. The following summarizes open credit default swaps entered into by the fund at July 31, 2011:
| | | | | | | |
| | | (Pay) | | | Upfront | |
| | | Receive | Implied | | Premiums | |
| Reference | Notional | Fixed | Credit | Market | Received | Unrealized |
| Obligation | Amount ($)2 | Rate (%) | Spread (%)3 | Value ($) | (Paid) ($) (Depreciation) ($) |
| |
| Sale Contracts:1 | | | | | | |
| Northern Tobacco, | | | | | | |
| 5%, 6/1/2046 | | | | | | |
| 12/20/2011† | 11,710,000a | 1.35 | 2.75 | (43,013) | — | (43,013) |
| Southern California | | | | | | |
| Tobacco, | | | | | | |
| 5%, 6/1/2037 | | | | | | |
| 12/20/2011† | 11,710,000a | 1.35 | 2.75 | (43,013) | — | (43,013) |
| | | | | | | (86,026) |
| | |
| † Expiration Date |
| Counterparties: |
| a | Citibank |
| 1 | If the fund is a seller of protection and a credit event occurs, as defined under the terms of the swap |
| | agreement, the fund will either (i) pay to the buyer of protection an amount equal to the notional |
| | amount of the swap and take delivery of the reference obligation or (ii) pay a net settlement |
| | amount in the form of cash or securities equal to the notional amount of the swap less the recovery |
| | value of the reference obligation. |
| 2 | The maximum potential amount the fund could be required to pay as a seller of credit protection |
| | or receive as a buyer of credit protection if a credit event occurs as defined under the terms of the |
| | swap agreement. |
| 3 | Implied credit spreads, represented in absolute terms, utilized in determining the market value as of |
| | the period end serve as an indicator of the current status of the payment/performance risk and |
| | represent the likelihood of risk of default for the credit derivative.The credit spread of a particular |
| | referenced entity reflects the cost of buying/selling protection and may include upfront payments |
| | required to be made to enter into the agreement.Wider credit spreads represent a deterioration of |
| | the referenced entity’s credit soundness and a greater likelihood of risk of default or other credit |
| | event occurring as defined under the terms of the agreement.A credit spread identified as |
| | “Defaulted” indicates a credit event has occurred for the referenced entity. |
48
GAAP requires disclosure for (i) the nature and terms of the credit derivative, reasons for entering into the credit derivative, the events or circumstances that would require the seller to perform under the credit derivative, and the current status of the payment/performance risk of the credit derivative, (ii) the maximum potential amount of future payments (undiscounted) the seller could be required to make under the credit derivative, (iii) the fair value of the credit derivative, and (iv) the nature of any recourse provisions and assets held either as collateral or by third parties.All required disclosures have been made and are incorporated within the current period as part of the Notes to the Statement of Investments and disclosures within this Note.
The following summarizes the average market value of derivatives outstanding during the period ended July 31, 2011:
| | |
| | Average Market Value ($) |
| Interest rate futures contracts | 38,582,321 |
| Interest rate options contracts | 375,478 |
| Foreign currency options contracts | 203,172 |
| Forward contracts | 38,922,437 |
The following summarizes the average notional value of swap contracts outstanding during the period ended July 31, 2011:
| | |
| | Average Notional Value ($) |
| Credit default swap contracts | 23,420,000 |
At July 31, 2011, the cost of investments for federal income tax purposes was $1,443,671,249; accordingly, accumulated net unrealized appreciation on investments was $37,246,468, consisting of $43,412,295 gross unrealized appreciation and $6,165,827 gross unrealized depreciation.
| |
| REPORT OF INDEPENDENT REGISTERED |
| PUBLIC ACCOUNTING FIRM |
Shareholders and Board of Directors Dreyfus Intermediate Term Income Fund
We have audited the accompanying statement of assets and liabilities, including the statement of investments, of Dreyfus Intermediate Term Income Fund (one of the series comprising Dreyfus Investment Grade Funds, Inc.) as of July 31, 2011, and the related statement of operations for the year then ended, the statement of changes in net assets for each of the two years in the period then ended, and financial highlights for each of the periods indicated therein. These financial statements and financial highlights are the responsibility of the Fund’s management. Our responsibility is to express an opinion on these financial statements and financial highlights based on our audits.
We conducted our audits in accordance with the standards of the Public Company Accounting Oversight Board (United States).Those standards require that we plan and perform the audit to obtain reasonable assurance about whether the financial statements and financial highlights are free of material misstatement.We were not engaged to perform an audit of the Fund’s internal control over financial reporting. Our audits included consideration of internal control over financial reporting as a basis for designing audit procedures that are appropriate in the circumstances, but not for the purpose of expressing an opinion on the effectiveness of the Fund’s internal control over financial reporting. Accordingly, we express no such opinion.An audit also includes examining, on a test basis, evidence supporting the amounts and disclosures in the financial statements and financial highlights, assessing the accounting principles used and significant estimates made by management, and evaluating the overall financial statement presentation. Our procedures included confirmation of securities owned as of July 31, 2011 by correspondence with the custodian and others. We believe that our audits provide a reasonable basis for our opinion.
In our opinion, the financial statements and financial highlights referred to above present fairly, in all material respects, the financial position of Dreyfus IntermediateTerm Income Fund at July 31, 2011, the results of its operations for the year then ended, the changes in its net assets for each of the two years in the period then ended, and the financial highlights for each of the indicated periods, in conformity with U.S. generally accepted accounting principles.

New York, New York
September 26, 2011
50
IMPORTANT TAX INFORMATION (Unaudited)
The fund hereby designates 97.64% of ordinary income dividends paid during the fiscal year ended July 31, 2011 as qualifying “interest related dividends”.
| |
| INFORMATION ABOUT THE RENEWAL OF THE |
| FUND’S MANAGEMENT AGREEMENT (Unaudited) |
At a meeting of the fund’s Board of Directors held on July 13 and 14, 2011, the Board considered the renewal of the fund’s Management Agreement pursuant to which Dreyfus provides the fund with investment advisory and administrative services (the “Agreement”). The Board members, none of whom are “interested persons” (as defined in the Investment Company Act of 1940, as amended) of the fund, were assisted in their review by independent legal counsel and met with counsel in executive session separate from representatives of Dreyfus. In considering the renewal of the Agreement, the Board considered all factors that it believed to be relevant, including those discussed below.The Board did not identify any one factor as dispositive, and each Board member may have attributed different weights to the factors considered.
Analysis of Nature, Extent, and Quality of Services Provided to the Fund.The Board members considered information previously provided to them in presentations from representatives of Dreyfus regarding the nature, extent, and quality of the services provided to funds in the Dreyfus fund complex, and representatives of Dreyfus confirmed that there had been no material changes in this information. Dreyfus provided the number of open accounts in the fund, the fund’s asset size and the allocation of fund assets among distribution channels. Dreyfus also had previously provided information regarding the diverse intermediary relationships and distribution channels of funds in the Dreyfus fund complex and Dreyfus’ corresponding need for broad, deep, and diverse resources to be able to provide ongoing shareholder services to each distribution channel, including the distribution channel(s) for the fund.
The Board members also considered research support available to, and portfolio management capabilities of, the fund’s portfolio management personnel and that Dreyfus also provides oversight of day-to-day fund operations, including fund accounting and administration and assistance in meeting legal and regulatory requirements.The Board members also considered Dreyfus’ extensive administrative, accounting, and compliance infrastructures.
52
Comparative Analysis of the Fund’s Performance and Management Fee and Expense Ratio. The Board members reviewed reports prepared by Lipper, Inc. (“Lipper”), an independent provider of investment company data, which included information comparing (1) the fund’s performance with the performance of a group of comparable funds (the “Performance Group”) and with a broader group of funds (the “Performance Universe”), all for various periods ended May 31, 2011, and (2) the fund’s actual and contractual management fees and total expenses with those of a group of comparable funds (the “Expense Group”) and with a broader group of funds (the “Expense Universe”), the information for which was derived in part from fund financial statements available to Lipper as of January 31, 2011. Dreyfus previously had furnished the Board with a description of the methodology Lipper used to select the Performance Group and Performance Universe and the Expense Group and Expense Universe.
Dreyfus representatives stated that the usefulness of performance comparisons may be affected by a number of factors, including different investment limitations that may be applicable to the fund and comparison funds.The Board members discussed the results of the comparisons and noted that the fund’s total return performance was variously above, at and below the Performance Group and Performance Universe medians.The Board also noted that the fund’s yield was variously above and below the Performance Group median and above the Performance Universe median. Dreyfus also provided a comparison of the fund’s calendar year total returns to the returns of the fund’s benchmark index.
The Board members also reviewed the range of actual and contractual management fees and total expenses of the Expense Group and Expense Universe funds and discussed the results of the comparisons. They noted that the fund’s contractual management fee was at the Expense Group median, the fund’s actual management fee was above
| |
| INFORMATION ABOUT THE RENEWAL OF THE FUND’S |
| MANAGEMENT AGREEMENT (Unaudited) (continued) |
the Expense Group and Expense Universe medians, and that the fund’s total expenses were at the Expense Group median and below the Expense Universe median.
Representatives of Dreyfus reviewed with the Board members the management or investment advisory fees (1) paid by funds advised or administered by Dreyfus that are in the same Lipper category as the fund and (2) paid to Dreyfus or the Dreyfus-affiliated primary employer of the fund’s primary portfolio manager for advising any separate accounts and/or other types of client portfolios that are considered to have similar investment strategies and policies as the fund (the “Similar Clients”), and explained the nature of the Similar Clients.They discussed differences in fees paid and the relationship of the fees paid in light of any differences in the services provided and other relevant factors.The Board members considered the relevance of the fee information provided for the Similar Clients to evaluate the appropriateness and reasonableness of the fund’s management fee.
Analysis of Profitability and Economies of Scale. Dreyfus’ representatives reviewed the expenses allocated and profit received by Dreyfus and the resulting profitability percentage for managing the fund, and the method used to determine the expenses and profit. The Board concluded that the profitability results were not unreasonable, given the services rendered and service levels provided by Dreyfus. The Board previously had been provided with information prepared by an independent consulting firm regarding Dreyfus’ approach to allocating costs to, and determining the profitability of, individual funds and the entire Dreyfus fund complex. The consulting firm also had analyzed where any economies of scale might emerge in connection with the management of a fund.
The Board’s counsel stated that the Board members should consider the profitability analysis (1) as part of their evaluation of whether the fees under the Agreement bear a reasonable relationship to the mix of services provided by Dreyfus, including the nature, extent and quality of such services, and (2) in light of the relevant circumstances for the fund and the extent to which economies of scale would be realized if
54
the fund grows and whether fee levels reflect these economies of scale for the benefit of fund shareholders. Dreyfus representatives noted that a discussion of economies of scale is predicated on a fund having achieved a substantial size with increasing assets and that, if a fund’s assets had been stable or decreasing, the possibility that Dreyfus may have realized any economies of scale would be less. They also noted that, as a result of shared and allocated costs among funds in the Dreyfus funds complex, the extent of economies of scale could depend substantially on the level of assets in the complex as a whole, so that increases and decreases in complex-wide assets can affect potential economies of scale in a manner that is disproportionate to, or even in the opposite direction from, changes in the fund’s asset level. The Board members also considered potential benefits to Dreyfus from acting as investment adviser and noted that there were no soft dollar arrangements in effect for trading the fund’s investments.
At the conclusion of these discussions, the Board agreed that it had been furnished with sufficient information to make an informed business decision with respect to the renewal of the Agreement. Based on the discussions and considerations as described above, the Board concluded and determined as follows.
The Board concluded that the nature, extent and quality of the services provided by Dreyfus are adequate and appropriate.
The Board generally was satisfied with the fund’s overall perfor- mance, in light of the considerations described above.
The Board concluded that the fee paid to Dreyfus was reasonable in light of the considerations described above.
The Board determined that the economies of scale which may accrue to Dreyfus and its affiliates in connection with the management of the fund had been adequately considered by Dreyfus in connection with the fee rate charged to the fund pursuant to the Agreement and that, to the extent in the future it were determined that material economies of scale had not been shared with the fund, the Board would seek to have those economies of scale shared with the fund.
| |
| INFORMATION ABOUT THE RENEWAL OF THE FUND’S |
| MANAGEMENT AGREEMENT (Unaudited) (continued) |
The Board members considered these conclusions and determinations, along with information received on a routine and regular basis throughout the year. In addition, it should be noted that the Board’s consideration of the contractual fee arrangements for this fund had the benefit of a number of years of reviews of prior or similar agreements during which lengthy discussions took place between the Board members and Dreyfus representatives. Certain aspects of the arrangements may receive greater scrutiny in some years than in others, and the Board members’ conclusions may be based, in part, on their consideration of the same or similar arrangements in prior years. The Board members determined that renewal of the Agreement was in the best interests of the fund and its shareholders.
56
BOARD MEMBERS INFORMATION (Unaudited)
| |
| Joseph S. DiMartino (67) |
| Chairman of the Board (1995) |
| Principal Occupation During Past 5Years: |
| • Corporate Director and Trustee |
| Other Public Company Board Memberships During Past 5Years: |
| • CBIZ (formerly, Century Business Services, Inc.), a provider of outsourcing functions for small |
| and medium size companies, Director (1997-present) |
| • Sunair Services Corporation, a provider of certain outdoor-related services to homes and |
| businesses, Director (2005-2009) |
| • The Newark Group, a provider of a national market of paper recovery facilities, paperboard |
| mills and paperboard converting plants, Director (2000-2010) |
| No. of Portfolios for which Board Member Serves: 168 |
| ——————— |
| Clifford L. Alexander, Jr. (77) |
| Board Member (2003) |
| Principal Occupation During Past 5Years: |
| • President of Alexander & Associates, Inc., a management consulting firm ( January 1981-present) |
| No. of Portfolios for which Board Member Serves: 45 |
| ——————— |
| David W. Burke (75) |
| Board Member (1994) |
| Principal Occupation During Past 5Years: |
| • Corporate Director and Trustee |
| No. of Portfolios for which Board Member Serves: 83 |
| ——————— |
| Whitney I. Gerard (76) |
| Board Member (1993) |
| Principal Occupation During Past 5Years: |
| • Partner of Chadbourne & Parke LLP |
| No. of Portfolios for which Board Member Serves: 25 |
BOARD MEMBERS INFORMATION (Unaudited) (continued)
| |
| Nathan Leventhal (68) |
| Board Member (2009) |
| Principal Occupation During Past 5Years: |
| • Commissioner, NYC Planning Commission (March 2007-present) |
| • Chairman of the Avery-Fisher Artist Program (November 1997-present) |
| Other Public Company Board Memberships During Past 5Years: |
| • Movado Group, Inc., Director |
| No. of Portfolios for which Board Member Serves: 43 |
| ——————— |
| George L. Perry (77) |
| Board Member (1992) |
| Principal Occupation During Past 5Years: |
| • Economist and Senior Fellow at Brookings Institution |
| No. of Portfolios for which Board Member Serves: 25 |
| ——————— |
| Benaree Pratt Wiley (65) |
| Board Member (2009) |
| Principal Occupation During Past 5Years: |
| • Principal,TheWiley Group, a firm specializing in strategy and business development (2005-present) |
| Other Public Company Board Memberships During Past 5Years: |
| • CBIZ (formerly, Century Business Services, Inc.), a provider of outsourcing functions |
| for small and medium size companies, Director (2008-present) |
| No. of Portfolios for which Board Member Serves: 69 |
| ——————— |
Once elected all Board Members serve for an indefinite term, but achieve Emeritus status upon reaching age 80.The address of the Board Members and Officers is in c/o The Dreyfus Corporation, 200 Park Avenue, NewYork, NewYork 10166.Additional information about the Board Members is available in the fund’s Statement of Additional Information which can be obtained from Dreyfus free of charge by calling this toll free number: 1-800-DREYFUS.
Lucy Wilson Benson, Emeritus Board Member
Arthur A. Hartman, Emeritus Board Member
58
OFFICERS OF THE FUND (Unaudited)
BRADLEY J. SKAPYAK, President since January 2010.
Chief Operating Officer and a director of the Manager since June 2009. From April 2003 to June 2009, Mr. Skapyak was the head of the Investment Accounting and Support Department of the Manager. He is an officer of 76 investment companies (comprised of 168 portfolios) managed by the Manager. He is 52 years old and has been an employee of the Manager since February 1988.
MICHAEL A. ROSENBERG, Vice President and Secretary since August 2005.
Assistant General Counsel of BNY Mellon, and an officer of 77 investment companies (comprised of 193 portfolios) managed by the Manager. He is 51 years old and has been an employee of the Manager since October 1991.
KIESHA ASTWOOD, Vice President and Assistant Secretary since January 2010.
Counsel of BNY Mellon, and an officer of 77 investment companies (comprised of 193 portfolios) managed by the Manager. She is 38 years old and has been an employee of the Manager since July 1995.
JAMES BITETTO, Vice President and Assistant Secretary since August 2005.
Senior Counsel of BNY Mellon and Secretary of the Manager, and an officer of 77 investment companies (comprised of 193 portfolios) managed by the Manager. He is 45 years old and has been an employee of the Manager since December 1996.
JONI LACKS CHARATAN, Vice President and Assistant Secretary since August 2005.
Senior Counsel of BNY Mellon, and an officer of 77 investment companies (comprised of 193 portfolios) managed by the Manager. She is 55 years old and has been an employee of the Manager since October 1988.
JOSEPH M. CHIOFFI, Vice President and Assistant Secretary since August 2005.
Senior Counsel of BNY Mellon, and an officer of 77 investment companies (comprised of 193 portfolios) managed by the Manager. He is 49 years old and has been an employee of the Manager since June 2000.
KATHLEEN DENICHOLAS, Vice President and Assistant Secretary since January 2010.
Senior Counsel of BNY Mellon, and an officer of 77 investment companies (comprised of 193 portfolios) managed by the Manager. She is 36 years old and has been an employee of the Manager since February 2001.
JANETTE E. FARRAGHER, Vice President and Assistant Secretary since August 2005.
Assistant General Counsel of BNY Mellon, and an officer of 77 investment companies (comprised of 193 portfolios) managed by the Manager. She is 48 years old and has been an employee of the Manager since February 1984.
JOHN B. HAMMALIAN, Vice President and Assistant Secretary since August 2005.
Managing Counsel of BNY Mellon, and an officer of 77 investment companies (comprised of 193 portfolios) managed by the Manager. He is 48 years old and has been an employee of the Manager since February 1991.
M. CRISTINA MEISER, Vice President and Assistant Secretary since January 2010.
Senior Counsel of BNY Mellon, and an officer of 77 investment companies (comprised of 193 portfolios) managed by the Manager. She is 41 years old and has been an employee of the Manager since August 2001.
OFFICERS OF THE FUND (Unaudited) (continued)
ROBERT R. MULLERY, Vice President and Assistant Secretary since August 2005.
Managing Counsel of BNY Mellon, and an officer of 77 investment companies (comprised of 193 portfolios) managed by the Manager. He is 59 years old and has been an employee of the Manager since May 1986.
JEFF PRUSNOFSKY, Vice President and Assistant Secretary since August 2005.
Managing Counsel of BNY Mellon, and an officer of 77 investment companies (comprised of 193 portfolios) managed by the Manager. He is 46 years old and has been an employee of the Manager since October 1990.
JAMES WINDELS, Treasurer since November 2001.
Director – Mutual Fund Accounting of the Manager, and an officer of 77 investment companies (comprised of 193 portfolios) managed by the Manager. He is 52 years old and has been an employee of the Manager since April 1985.
RICHARD CASSARO, Assistant Treasurer since January 2008.
Senior Accounting Manager – Money Market and Municipal Bond Funds of the Manager, and an officer of 77 investment companies (comprised of 193 portfolios) managed by the Manager. He is 52 years old and has been an employee of the Manager since September 1982.
GAVIN C. REILLY, Assistant Treasurer since December 2005.
Tax Manager of the Investment Accounting and Support Department of the Manager, and an officer of 77 investment companies (comprised of 193 portfolios) managed by the Manager. He is 42 years old and has been an employee of the Manager since April 1991.
ROBERT ROBOL, Assistant Treasurer since August 2003.
Senior Accounting Manager – Fixed Income Funds of the Manager, and an officer of 77 investment companies (comprised of 193 portfolios) managed by the Manager. He is 47 years old and has been an employee of the Manager since October 1988.
ROBERT SALVIOLO, Assistant Treasurer since July 2007.
Senior Accounting Manager – Equity Funds of the Manager, and an officer of 77 investment companies (comprised of 193 portfolios) managed by the Manager. He is 44 years old and has been an employee of the Manager since June 1989.
ROBERT SVAGNA, Assistant Treasurer since August 2005.
Senior Accounting Manager – Equity Funds of the Manager, and an officer of 77 investment companies (comprised of 193 portfolios) managed by the Manager. He is 44 years old and has been an employee of the Manager since November 1990.
60
JOSEPH W. CONNOLLY, Chief Compliance Officer since October 2004.
Chief Compliance Officer of the Manager and The Dreyfus Family of Funds (77 investment companies, comprised of 193 portfolios). From November 2001 through March 2004, Mr. Connolly was first Vice-President, Mutual Fund Servicing for Mellon Global Securities Services. In that capacity, Mr. Connolly was responsible for managing Mellon’s Custody, Fund Accounting and Fund Administration services to third-party mutual fund clients. He is 54 years old and has served in various capacities with the Manager since 1980, including manager of the firm’s Fund Accounting Department from 1997 through October 2001.
STEPHEN J. STOREN, Anti-Money Laundering Compliance Officer since May 2011.
Chief Compliance Officer of the Distributor, and the Anti-Money Laundering Compliance Officer of 73 investment companies (comprised of 189 portfolios) managed by the Manager. He is 56 years old and has been an employee of the Distributor since October 1999.
For More Information
Telephone Call your financial representative or 1-800-DREYFUS
Mail The Dreyfus Family of Funds, 144 Glenn Curtiss Boulevard, Uniondale, NY 11556-0144 E-mail Send your request to info@dreyfus.com Internet Information can be viewed online or downloaded at: http://www.dreyfus.com
The fund files its complete schedule of portfolio holdings with the Securities and Exchange Commission (“SEC”) for the first and third quarters of each fiscal year on Form N-Q. The fund’s Forms N-Q are available on the SEC’s website at http://www.sec.gov and may be reviewed and copied at the SEC’s Public Reference Room in Washington, DC. Information on the operation of the Public Reference Room may be obtained by calling 1-800-SEC-0330.
| |
| Dreyfus |
| Short Term Income Fund |
ANNUAL REPORT July 31, 2011

Save time. Save paper. View your next shareholder report online as soon as it’s available. Log into www.dreyfus.com and sign up for Dreyfus eCommunications. It’s simple and only takes a few minutes.
The views expressed in this report reflect those of the portfolio manager only through the end of the period covered and do not necessarily represent the views of Dreyfus or any other person in the Dreyfus organization. Any such views are subject to change at any time based upon market or other conditions and Dreyfus disclaims any responsibility to update such views.These views may not be relied on as investment advice and, because investment decisions for a Dreyfus fund are based on numerous factors, may not be relied on as an indication of trading intent on behalf of any Dreyfus fund.
Not FDIC-Insured • Not Bank-Guaranteed • May Lose Value
| | Contents |
| | THE FUND |
| 2 | A Letter from the Chairman and CEO |
| 3 | Discussion of Fund Performance |
| 6 | Fund Performance |
| 8 | Understanding Your Fund’s Expenses |
| 8 | Comparing Your Fund’s Expenses With Those of Other Funds |
| 9 | Statement of Investments |
| 20 | Statement of Financial Futures |
| 21 | Statement of Assets and Liabilities |
| 22 | Statement of Operations |
| 23 | Statement of Changes in Net Assets |
| 25 | Financial Highlights |
| 28 | Notes to Financial Statements |
| 41 | Report of Independent Registered Public Accounting Firm |
| 42 | Important Tax Information |
| 43 | Information About the Renewal of the Fund’s Management Agreement |
| 48 | Board Members Information |
| 50 | Officers of the Fund |
| | FOR MORE INFORMATION |
| | Back Cover |
Dreyfus
Short Term Income Fund
The Fund

A LETTER FROM THE CHAIRMAN AND CEO
Dear Shareholder:
We are pleased to present this annual report for Dreyfus Short Term Income Fund, covering the 12-month period from August 1, 2010, through July 31, 2011. For information about how the fund performed during the reporting period, as well as general market perspectives, we provide a Discussion of Fund Performance on the pages that follow.
Although the reporting period began on an optimistic note with a renewed commitment by the Federal Reserve Board (the “Fed”) to avoid a return to recession, the reporting period ended amid sharply deteriorating investor sentiment due to disappointing economic data, a persistent sovereign debt crisis in Europe and a contentious debate regarding taxes, spending and borrowing in the United States. In fact, just days after the reporting period’s end, U.S. lawmakers enacted legislation to raise the nation’s debt ceiling and a major credit rating agency downgraded U.S. long-term debt, marking the first time in history that U.S. Treasury securities were not assigned the highest possible credit rating. Fixed-income securities proved volatile in this tumultuous environment, as the stalled economy caused higher yielding market sectors to give back many of the reporting period’s previous gains while U.S. government securities rallied.
The economic outlook currently is clouded by heightened market volatility and political in-fighting; however, we currently believe that a sustained, moderate global expansion is more likely than a double-dip recession. Inflationary pressures appear to be waning in most countries, including the United States, as energy prices have retreated from their highs. Consequently, the Fed is likely to maintain aggressively accommodative monetary policy, which may help offset the financial stresses caused by recent fiscal policy choices in the United States and Europe.To assess how these and other developments may affect your investments, we encourage you, as always, to speak with your financial advisor.
Thank you for your continued confidence and support.

Jonathan R. Baum
Chairman and Chief Executive Officer
The Dreyfus Corporation
August 15, 2011
2

DISCUSSION OF FUND PERFORMANCE
For the period of August 1, 2010, through July 31, 2011, as provided by David Bowser, CFA, and Peter Vaream, Portfolio Managers
Fund and Market Performance Overview
For the 12-month period ended July 31, 2011, Dreyfus Short Term Income Fund’s Class B shares produced a total return of 2.00%, Class D shares produced a total return of 2.67% and Class P shares produced a total return of 2.65%.1 In comparison, the fund’s benchmark, the BofA Merrill Lynch 1-5 Year Corporate/Government Index (the “Index”), achieved a total return of 2.92% for the same period.2
Bonds produced mixed results amid heightened volatility over the reporting period as investors responded first to signs of economic strength and later to evidence of renewed economic weakness. The fund produced lower returns than its benchmark, primarily due to shortfalls in its interest-rate strategies.
The Fund’s Investment Approach
The fund seeks to maximize total returns consisting of capital appreciation and current income.To pursue its goal, the fund invests at least 80% of its assets in fixed-income securities of U.S. or foreign issuers rated investment grade or the unrated equivalent as determined by Dreyfus.This may include U.S. government bonds and notes, corporate bonds, municipal bonds, convertible securities, preferred stocks, inflation-indexed securities, asset-backed securities, mortgage-related securities (including CMOs) and foreign bonds. For additional yield, the fund may invest up to 20% of its assets in fixed-income securities rated below investment grade (“high yield” or “junk” bonds). Typically, the fund’s portfolio can be expected to have an average effective maturity and an average effective duration of three years or less.
Shifting Economic Sentiment Sparked Market Volatility
Investors’ outlooks began to improve early in the reporting period as concerns regarding a sovereign debt crisis in Europe eased and the financial markets responded positively to an announcement by the Federal Reserve Board (the “Fed”) that it would soon begin a massive
DISCUSSION OF FUND PERFORMANCE (continued)
quantitative easing program to stimulate greater economic growth. A more optimistic outlook subsequently was reinforced by improvements in employment, consumer spending and corporate earnings. These developments supported corporate bonds into the first quarter of 2011, but they sent prices of U.S. government securities lower as investors anticipated higher interest rates.
Investors began to question the sustainability of the economic recovery in February 2011, when political unrest in the Middle East led to sharply rising energy prices, and again in March, when devastating natural and nuclear disasters in Japan threatened to disrupt the industrial supply chain for global manufacturers. Nonetheless, investors proved resilient, and the more economically sensitive sectors of the bond market bounced back from these unexpected shocks.
In late April, economic sentiment began to deteriorate in earnest when Greece again appeared headed for default on its sovereign debt, U.S. economic data proved more disappointing than expected and a contentious debate regarding U.S. government spending and borrowing intensified. Some of these worries came to a head just days after the reporting period’s end, when Congress passed legislation cutting government spending and raising the U.S. debt ceiling, and Standard & Poor’s downgraded its credit rating on long-term U.S. debt securities. Consequently, the reporting period ended in the midst of declines in higher yielding bonds, while Treasury securities rallied during a “flight to quality.”
Interest-Rate Strategies Dampened Fund Performance
Although the fund scored a number of successes with its sector allocation and security selection strategies, its interest rate strategies undermined results compared to the benchmark.A relatively long average duration at the end of 2010 magnified weakness in U.S. government securities at the time, and a more defensive interest-rate posture prevented the fund from participating fully in the rally among U.S. government securities later in the reporting period.
These shortfalls were balanced to a substantial degree by overweighted exposure to higher yielding market sectors, including investment-grade corporate bonds, high yield corporate bonds, commercial mortgage-backed securities and residential mortgage-backed securities. Investment-grade bonds issued by financial services companies fared
4
particularly well in the constructive climate early in the year, as did an emphasis on credits with BBB ratings.The fund’s holdings of high yield bonds also fared well at the time.Although our focus on higher yielding market sectors detracted from relative performance amid bouts of heightened volatility from late April through July 2011, it was not enough to erase positive results from earlier in the year.
A More Defensive Investment Posture
We have adopted a more defensive investment posture in light of the developments now roiling the financial markets. If, as we currently expect, the U.S. economic recovery remains intact when the dust settles, we may return to an emphasis on higher yielding sectors of the bond market that have tended to do well during economic expansions. But until we see stronger evidence that the uncertainty confronting the U.S. and global economies is waning, we intend to keep the fund’s sector allocation, credit quality and interest-rate exposures roughly in line with its benchmark.
August 15, 2011
| | |
| | Bond funds are subject generally to interest rate, credit, liquidity and market risks, to varying |
| | degrees, all of which are more fully described in the fund’s prospectus. Generally, all other factors |
| | being equal, bond prices are inversely related to interest-rate changes, and rate increases can cause |
| | price declines. |
| | High yield bonds are subject to increased credit risk and are considered speculative in terms of the |
| | issuer’s perceived ability to continue making interest payments on a timely basis and to repay |
| | principal upon maturity. |
| | The fund may use derivative instruments, such as options, futures and options on futures, forward |
| | contracts, swaps (including credit default swaps on corporate bonds and asset-backed securities), |
| | options on swaps and other credit derivatives.A small investment in derivatives could have a |
| | potentially large impact on the fund’s performance.The use of derivatives involves risks different |
| | from, or possibly greater than, the risks associated with investing directly in the underlying assets. |
| 1 | Total return includes reinvestment of dividends and any capital gains paid, and does not take into |
| | consideration the applicable contingent deferred sales charges imposed on redemptions in the case of |
| | Class B shares. Had these charges been reflected, returns would have been lower. Past performance |
| | is no guarantee of future results. Share price, yield and investment return fluctuate such that upon |
| | redemption, fund shares may be worth more or less than their original cost. |
| 2 | SOURCE: LIPPER INC. — Reflects reinvestment of dividends and, where applicable, capital |
| | gain distributions.The BofA Merrill Lynch 1-5Year Corporate/Government Index is a market |
| | value-weighted index that tracks the performance of publicly placed, non-convertible, fixed-rate, |
| | coupon-bearing, investment-grade U.S. domestic debt. Maturities of the securities range from one to |
| | five years. Investors cannot invest directly in any index. |
FUND PERFORMANCE
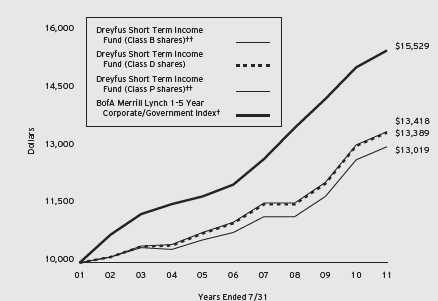
Comparison of change in value of $10,000 investment in Dreyfus Short Term Income Fund Class B shares, Class D shares and Class P shares and the BofA Merrill Lynch 1-5 Year Corporate/Government Index
| | |
| † | Source: Lipper Inc. |
| †† | The total return figures presented for Class B and Class P shares of the fund reflect the performance of the fund’s |
| | Class D shares for the period prior to November 1, 2002 (the inception date for Class B and Class P shares |
| | respectively), adjusted to reflect the applicable sales load for each share class. |
| |
| Past performance is not predictive of future performance. |
| The above graph compares a $10,000 investment made in each of the Class B, Class D and Class P shares of Dreyfus |
| Short Term Income Fund on 7/31/01 to a $10,000 investment made in the BofA Merrill Lynch 1-5Year |
| Corporate/Government Index (the “Index”) on that date.All dividends and capital gain distributions are reinvested. |
| The fund invests primarily in debt securities and securities with debt-like characteristics of domestic and foreign issuers |
| and maintains an average effective maturity and an average effective duration of three years or less. Performance for Class |
| B shares assumes the conversion of Class B shares to Class D shares at the end of the sixth year following the date of |
| purchase.The Index is an unmanaged performance benchmark including U.S. government and fixed-coupon domestic |
| investment-grade corporate bonds with maturities greater than or equal to one year and less than five years. Unlike a |
| mutual fund, the Index is not subject to charges, fees and other expenses. Investors cannot invest directly in any index. |
| Further information relating to fund performance, including expense reimbursements, if applicable, is contained in the |
| Financial Highlights section of the prospectus and elsewhere in this report. |
6
| | | | | |
| Average Annual Total Returns as of 7/31/11 | | | |
| | Inception | | | |
| | Date | 1 Year | 5 Years | 10 Years |
| Class B shares | | | | |
| with applicable redemption charge † | 11/1/02 | –2.00% | 2.86% | 2.67%†† |
| without redemption | 11/1/02 | 2.00% | 3.21% | 2.67%†† |
| Class D shares | 8/18/92 | 2.67% | 3.96% | 2.96% |
| Class P shares | 11/1/02 | 2.65% | 3.95% | 2.98%†† |
| BofA Merrill Lynch 1-5 Year | | | | |
| Corporate/Government Index | | 2.92% | 5.23% | 4.50% |
Past performance is not predictive of future performance.The fund’s performance shown in the graph and table does not reflect the deduction of taxes that a shareholder would pay on fund distributions or the redemption of fund shares.
| | |
| † | The maximum contingent deferred sales charge for Class B shares is 4%.After six years Class B shares convert to |
| | Class D shares. |
| †† | The total return performance figures presented for Class B and Class P shares of the fund reflect the performance of |
| | the fund’s Class D shares for the period prior to November 1, 2002 (the inception date for Class B and Class P |
| | shares respectively), adjusted to reflect the applicable sales load for each share class. |
UNDERSTANDING YOUR FUND’S EXPENSES (Unaudited)
As a mutual fund investor, you pay ongoing expenses, such as management fees and other expenses. Using the information below, you can estimate how these expenses affect your investment and compare them with the expenses of other funds.You also may pay one-time transaction expenses, including sales charges (loads) and redemption fees, which are not shown in this section and would have resulted in higher total expenses. For more information, see your fund’s prospectus or talk to your financial adviser.
Review your fund’s expenses
The table below shows the expenses you would have paid on a $1,000 investment in Dreyfus Short Term Income Fund from February 1, 2011 to July 31, 2011. It also shows how much a $1,000 investment would be worth at the close of the period, assuming actual returns and expenses.
Expenses and Value of a $1,000 Investment
assuming actual returns for the six months ended July 31, 2011
| | | | |
| | Class B | Class D | Class P |
| Expenses paid per $1,000† | $ 8.77 | $ 4.59 | $ 4.79 |
| Ending value (after expenses) | $1,008.80 | $1,013.00 | $1,012.70 |
COMPARING YOUR FUND’S EXPENSES
WITH THOSE OF OTHER FUNDS (Unaudited)
Using the SEC’s method to compare expenses
The Securities and Exchange Commission (SEC) has established guidelines to help investors assess fund expenses. Per these guidelines, the table below shows your fund’s expenses based on a $1,000 investment, assuming a hypothetical 5% annualized return. You can use this information to compare the ongoing expenses (but not transaction expenses or total cost) of investing in the fund with those of other funds.All mutual fund shareholder reports will provide this information to help you make this comparison. Please note that you cannot use this information to estimate your actual ending account balance and expenses paid during the period.
Expenses and Value of a $1,000 Investment
assuming a hypothetical 5% annualized return for the six months ended July 31, 2011
| | | | |
| | Class B | Class D | Class P |
| Expenses paid per $1,000† | $ 8.80 | $ 4.61 | $ 4.81 |
| Ending value (after expenses) | $1,016.07 | $1,020.23 | $1,020.03 |
| |
| † Expenses are equal to the fund’s annualized expense ratio of 1.76% for Class B, .92% for Class D, and .96% |
| for Class P, multiplied by the average account value over the period, multiplied by 181/365 (to reflect the one-half |
| year period). |
8
| |
| STATEMENT OF INVESTMENTS |
| July 31, 2011 |
| | | | | | |
| | Coupon | Maturity | Principal | | |
| Bonds and Notes—98.2% | Rate (%) | Date | Amount ($) | | Value ($) |
| Agriculture—.2% | | | | | |
| Altria Group, | | | | | |
| Gtd. Notes | 8.50 | 11/10/13 | 555,000 | | 641,909 |
| Asset—Backed Certificates—.7% | | | | | |
| CNH Equipment Trust, | | | | | |
| Ser. 2011-A, Cl. A4 | 2.04 | 10/17/16 | 1,850,000 | | 1,884,256 |
| Asset-Backed Ctfs./ | | | | | |
| Auto Receivables—5.1% | | | | | |
| Ally Auto Receivables Trust, | | | | | |
| Ser. 2010-2, Cl. A3 | 1.38 | 7/15/14 | 1,500,000 | | 1,508,732 |
| Ally Auto Receivables Trust, | | | | | |
| Ser. 2010-1, Cl. B | 3.29 | 3/15/15 | 775,000 | a | 811,067 |
| Ally Master Owner Trust, | | | | | |
| Ser. 2010-4, Cl. A | 1.26 | 8/15/17 | 780,000 | b | 791,473 |
| Americredit Automobile Receivables | | | | | |
| Trust, Ser. 2010-3, Cl. A3 | 1.14 | 4/8/15 | 945,000 | | 947,088 |
| Americredit Automobile Receivables | | | | | |
| Trust, Ser. 2010-3, Cl. C | 3.34 | 4/8/16 | 390,000 | | 399,884 |
| Americredit Automobile Receivables | | | | | |
| Trust, Ser. 2010-1, Cl. B | 3.72 | 11/17/14 | 1,230,000 | | 1,263,065 |
| Americredit Automobile Receivables | | | | | |
| Trust, Ser. 2011-3, Cl. D | 4.04 | 7/10/17 | 1,000,000 | | 1,008,135 |
| Americredit Prime Automobile | | | | | |
| Receivable, Ser. 2007-1, Cl. E | 6.96 | 3/8/16 | 389,146 | a | 394,693 |
| Carmax Auto Owner Trust, | | | | | |
| Ser. 2010-3, Cl. C | 2.59 | 8/15/16 | 450,000 | | 459,860 |
| Carmax Auto Owner Trust, | | | | | |
| Ser. 2010-1, Cl. B | 3.75 | 12/15/15 | 185,000 | | 194,828 |
| Carmax Auto Owner Trust, | | | | | |
| Ser. 2010-2, Cl. B | 3.96 | 6/15/16 | 490,000 | | 517,354 |
| Chrysler Financial Auto | | | | | |
| Securitization Trust, | | | | | |
| Ser. 2009-B, Cl. B | 2.94 | 6/8/13 | 313,332 | | 313,365 |
| Ford Credit Floorplan Master Owner | | | | | |
| Trust, Ser. 2011-1, Cl. A2 | 0.79 | 2/15/16 | 855,000 | b | 852,208 |
| Franklin Auto Trust, | | | | | |
| Ser. 2008-A, Cl. B | 6.10 | 5/20/16 | 585,000 | a | 598,910 |
| JPMorgan Auto Receivables Trust, | | | | | |
| Ser. 2008-A, Cl. CFTS | 5.22 | 7/15/15 | 242,251 | a | 240,530 |
STATEMENT OF INVESTMENTS (continued)
| | | | | | |
| | Coupon | Maturity | Principal | | |
| Bonds and Notes (continued) | Rate (%) | Date | Amount ($) | | Value ($) |
| Asset-Backed Ctfs./ | | | | | |
| Auto Receivables (continued) | | | | | |
| Santander Drive Auto Receivables | | | | | |
| Trust, Ser. 2011-S1A, Cl. C | 1.89 | 5/15/17 | 1,444,621 | a | 1,436,269 |
| Santander Drive Auto Receivables | | | | | |
| Trust, Ser. 2010-2, Cl. B | 2.24 | 12/15/14 | 300,000 | | 301,167 |
| Santander Drive Auto Receivables | | | | | |
| Trust, Ser. 2010-3, Cl. C | 3.06 | 11/15/17 | 545,000 | | 549,516 |
| Smart Trust, | | | | | |
| Ser. 2011-1USA, Cl. A3B | 1.04 | 10/14/14 | 880,000 | a,b | 881,766 |
| | | | | | 13,469,910 |
| Asset-Backed Ctfs./Credit Cards—1.0% | | | | |
| Citibank Omni Master Trust, | | | | | |
| Ser. 2009-A14A, Cl. A14 | 2.94 | 8/15/18 | 2,400,000 | a,b | 2,527,764 |
| Asset-Backed Ctfs./ | | | | | |
| Home Equity Loans—1.4% | | | | | |
| Ameriquest Mortgage Securities, | | | | | |
| Ser. 2003-11, Cl. AF6 | 5.64 | 1/25/34 | 751,556 | b | 762,634 |
| Bayview Financial Acquisition | | | | | |
| Trust, Ser. 2005-B, Cl. 1A6 | 5.21 | 4/28/39 | 1,421,661 | b | 1,359,979 |
| Carrington Mortgage Loan Trust, | | | | | |
| Ser. 2005-NC5, Cl. A2 | 0.51 | 10/25/35 | 299,898 | b | 265,075 |
| Citicorp Residential Mortgage | | | | | |
| Securities, Ser. 2006-1, Cl. A3 | 5.71 | 7/25/36 | 191,313 | b | 192,409 |
| Credit-Based Asset Servicing and | | | | | |
| Securitization, Ser. 2002-CB3, | | | | | |
| Cl. M2 | 2.06 | 6/25/32 | 1,019,603 | b | 1,019,746 |
| Home Equity Asset Trust, | | | | | |
| Ser. 2005-2, Cl. M1 | 0.64 | 7/25/35 | 16,935 | b | 16,877 |
| JP Morgan Mortgage Acquisition, | | | | | |
| Ser. 2006-CH2, Cl. AV2 | 0.24 | 10/25/36 | 70,365 | b | 69,078 |
| | | | | | 3,685,798 |
| Banks—5.1% | | | | | |
| Bank of America, | | | | | |
| Sr. Unscd. Notes | 4.50 | 4/1/15 | 460,000 | | 481,249 |
| Bank of America, | | | | | |
| Sr. Unscd. Notes | 7.38 | 5/15/14 | 1,880,000 | | 2,103,019 |
| Capital One Financial, | | | | | |
| Sr. Unscd. Notes | 7.38 | 5/23/14 | 750,000 | | 853,354 |
| Citigroup, | | | | | |
| Sr. Unscd. Notes | 4.75 | 5/19/15 | 1,500,000 | | 1,610,531 |
10
| | | | | | |
| | Coupon | Maturity | Principal | | |
| Bonds and Notes (continued) | Rate (%) | Date | Amount ($) | | Value ($) |
| Banks (continued) | | | | | |
| Citigroup, | | | | | |
| Sr. Unscd. Notes | 5.50 | 4/11/13 | 1,330,000 | | 1,410,796 |
| Credit Suisse/New York, | | | | | |
| Sr. Unscd. Notes | 3.50 | 3/23/15 | 925,000 | | 963,747 |
| JPMorgan Chase & Co., | | | | | |
| Sr. Unscd. Notes | 5.38 | 1/15/14 | 1,085,000 | | 1,188,261 |
| Lloyds TSB Bank, | | | | | |
| Bank Gtd. Notes | 6.38 | 1/21/21 | 550,000 | | 581,060 |
| Morgan Stanley, | | | | | |
| Sr. Unscd. Notes | 4.10 | 1/26/15 | 920,000 | | 946,818 |
| Morgan Stanley, | | | | | |
| Sr. Unscd. Notes | 6.00 | 4/28/15 | 300,000 | | 330,086 |
| Societe Generale, | | | | | |
| Sr. Unscd. Notes | 1.30 | 4/11/14 | 325,000 | a,b | 318,486 |
| Wells Fargo Capital XIII, | | | | | |
| Gtd. Cap. Secs | 7.70 | 12/29/49 | 2,530,000 | b | 2,621,713 |
| | | | | | 13,409,120 |
| Building Materials—.3% | | | | | |
| Holcim US Finance Sarl & Cie, | | | | | |
| Gtd. Notes | 6.00 | 12/30/19 | 590,000 | a | 647,981 |
| Chemicals—.1% | | | | | |
| Sherwin-Williams, | | | | | |
| Sr. Unscd. Notes | 3.13 | 12/15/14 | 295,000 | | 312,425 |
| Commercial Mortgage | | | | | |
| Pass-Through Ctfs.—2.4% | | | | | |
| Banc of America Commercial | | | | | |
| Mortgage, Ser. 2004-6, Cl. A5 | 4.81 | 12/10/42 | 85,000 | | 90,977 |
| Banc of America Commercial | | | | | |
| Mortgage, Ser. 2005-6, Cl. A4 | 5.37 | 9/10/47 | 895,000 | b | 984,693 |
| Bear Stearns Commercial Mortgage | | | | | |
| Securities, Ser. 2006-PW12, | | | | | |
| Cl. AAB | 5.69 | 9/11/38 | 368,376 | b | 392,386 |
| Bear Stearns Commercial Mortgage | | | | | |
| Securities, Ser. 2007-PW17, | | | | | |
| Cl. AAB | 5.70 | 6/11/50 | 1,150,000 | | 1,232,484 |
| GS Mortgage Securities Corporation II, | | | | | |
| Ser. 2007-EOP, Cl. B | 1.84 | 3/6/20 | 1,630,000 | a,b | 1,612,621 |
| GS Mortgage Securities Corporation II, | | | | | |
| Ser. 2007-EOP, Cl. F | 2.84 | 3/6/20 | 730,000 | a,b | 721,880 |
STATEMENT OF INVESTMENTS (continued)
| | | | | | |
| | Coupon | Maturity | Principal | | |
| Bonds and Notes (continued) | Rate (%) | Date | Amount ($) | | Value ($) |
| Commercial Mortgage | | | | | |
| Pass-Through Ctfs. (continued) | | | | | |
| GS Mortgage Securities Corporation II, | | | | | |
| Ser. 2007-EOP, Cl. K | 5.33 | 3/6/20 | 350,000 | a,b | 349,112 |
| JP Morgan Chase Commercial | | | | | |
| Mortgage Securities, | | | | | |
| Ser. 2006-CB14, Cl. ASB | 5.51 | 12/12/44 | 307,271 | b | 323,400 |
| Morgan Stanley Capital I, | | | | | |
| Ser. 2005-HQ7, Cl. A4 | 5.20 | 11/14/42 | 475,000 | b | 518,323 |
| Morgan Stanley Dean Witter Capital | | | | | |
| I, Ser. 2001-TOP3, Cl. A4 | 6.39 | 7/15/33 | 174,013 | | 173,954 |
| | | | | | 6,399,830 |
| Computers—.2% | | | | | |
| Hewlett-Packard, | | | | | |
| Sr. Unscd. Notes | 2.20 | 12/1/15 | 405,000 | | 413,189 |
| Diversified Financial Services—5.7% | | | | | |
| American Express Credit, | | | | | |
| Sr. Unscd. Notes | 5.13 | 8/25/14 | 730,000 | | 801,852 |
| American Express Credit, | | | | | |
| Sr. Unscd. Notes, Ser. C | 7.30 | 8/20/13 | 155,000 | | 172,759 |
| American Express, | | | | | |
| Sr. Unscd. Notes | 7.25 | 5/20/14 | 840,000 | | 968,670 |
| Ameriprise Financial, | | | | | |
| Jr. Sub. Notes | 7.52 | 6/1/66 | 212,000 | b | 224,190 |
| Capital One Bank USA, | | | | | |
| Sub. Notes | 8.80 | 7/15/19 | 765,000 | | 963,615 |
| Caterpillar Financial Services, | | | | | |
| Sr. Unscd. Notes | 5.13 | 10/12/11 | 765,000 | | 772,258 |
| Caterpillar Financial Services, | | | | | |
| Sr. Unscd. Notes | 6.13 | 2/17/14 | 725,000 | | 818,208 |
| Discover Financial Services, | | | | | |
| Sr. Unscd. Notes | 10.25 | 7/15/19 | 475,000 | | 624,893 |
| Erac USA Finance, | | | | | |
| Gtd. Notes | 5.90 | 11/15/15 | 1,100,000 | a | 1,253,487 |
| Ford Motor Credit, | | | | | |
| Sr. Unscd. Notes | 8.00 | 12/15/16 | 580,000 | | 665,741 |
| FUEL Trust, | | | | | |
| Scd. Notes | 4.21 | 4/15/16 | 695,000 | a | 707,247 |
| General Electric Capital, | | | | | |
| Sr. Unscd. Notes | 0.88 | 4/7/14 | 980,000 | b | 974,903 |
12
| | | | | | |
| | Coupon | Maturity | Principal | | |
| Bonds and Notes (continued) | Rate (%) | Date | Amount ($) | | Value ($) |
| Diversified Financial | | | | | |
| Services (continued) | | | | | |
| General Electric Capital, | | | | | |
| Gtd. Notes | 3.00 | 12/9/11 | 2,250,000 | | 2,272,833 |
| General Electric Capital, | | | | | |
| Sr. Unscd. Notes | 4.80 | 5/1/13 | 240,000 | | 255,345 |
| General Electric Capital, | | | | | |
| Sr. Unscd. Notes, Ser. A | 5.45 | 1/15/13 | 900,000 | | 957,789 |
| Harley-Davidson Funding, | | | | | |
| Gtd. Notes | 5.75 | 12/15/14 | 1,080,000 | a | 1,189,864 |
| Hutchison | | | | | |
| Whampoa International, | | | | | |
| Gtd. Notes | 4.63 | 9/11/15 | 570,000 | a | 615,207 |
| Hyundai Capital Services, | | | | | |
| Sr. Unscd. Notes | 4.38 | 7/27/16 | 400,000 | a | 418,465 |
| Invesco, | | | | | |
| Gtd. Notes | 5.38 | 2/27/13 | 380,000 | | 403,176 |
| | | | | | 15,060,502 |
| Electric Utilities—2.1% | | | | | |
| Appalachian Power, | | | | | |
| Sr. Unscd. Notes, Ser. O | 5.65 | 8/15/12 | 315,000 | | 329,587 |
| Columbus Southern Power, | | | | | |
| Sr. Unscd. Notes | 6.05 | 5/1/18 | 150,000 | | 174,574 |
| Duke Energy Ohio, | | | | | |
| First Mortgage Bonds | 2.10 | 6/15/13 | 925,000 | | 946,899 |
| Enel Finance International, | | | | | |
| Gtd. Notes | 5.70 | 1/15/13 | 620,000 | a,c | 642,414 |
| Exelon Generation, | | | | | |
| Sr. Unscd. Notes | 4.00 | 10/1/20 | 645,000 | | 636,306 |
| Nevada Power, | | | | | |
| Mortgage Notes | 6.50 | 4/15/12 | 1,000,000 | | 1,040,207 |
| NextEra Energy Capital Holdings, | | | | | |
| Gtd. Debs | 5.63 | 9/1/11 | 1,100,000 | | 1,104,212 |
| NiSource Finance, | | | | | |
| Gtd. Notes | 6.15 | 3/1/13 | 545,000 | | 585,437 |
| | | | | | 5,459,636 |
| Environmental Control—.3% | | | | | |
| Waste Management, | | | | | |
| Gtd. Notes | 6.38 | 3/11/15 | 725,000 | | 838,542 |
STATEMENT OF INVESTMENTS (continued)
| | | | | | |
| | Coupon | Maturity | Principal | | |
| Bonds and Notes (continued) | Rate (%) | Date | Amount ($) | | Value ($) |
| Food & Beverages—.6% | | | | | |
| Diageo Capital, | | | | | |
| Gtd. Bonds | 4.83 | 7/15/20 | 975,000 | | 1,056,736 |
| Kraft Foods, | | | | | |
| Sr. Unscd. Notes | 6.13 | 2/1/18 | 530,000 | | 627,831 |
| | | | | | 1,684,567 |
| Foreign/Governmental—.3% | | | | | |
| Province of Ontario Canada, | | | | | |
| Sr. Unscd. Bonds | 4.38 | 2/15/13 | 760,000 | | 805,443 |
| Health Care—.3% | | | | | |
| Medco Health Solutions, | | | | | |
| Sr. Unscd. Notes | 7.25 | 8/15/13 | 725,000 | | 806,133 |
| Media—1.9% | | | | | |
| Comcast, | | | | | |
| Gtd. Notes | 5.15 | 3/1/20 | 605,000 | c | 675,646 |
| Cox Communications, | | | | | |
| Sr. Unscd. Notes | 6.25 | 6/1/18 | 650,000 | a | 763,812 |
| NBC Universal, | | | | | |
| Sr. Unscd. Notes | 3.65 | 4/30/15 | 700,000 | a | 746,052 |
| News America, | | | | | |
| Gtd. Notes | 5.30 | 12/15/14 | 735,000 | | 812,181 |
| Reed Elsevier Capital, | | | | | |
| Gtd. Notes | 4.63 | 6/15/12 | 310,000 | | 319,308 |
| Reed Elsevier Capital, | | | | | |
| Gtd. Notes | 7.75 | 1/15/14 | 900,000 | | 1,031,866 |
| Time Warner Cable, | | | | | |
| Gtd. Notes | 6.20 | 7/1/13 | 580,000 | | 635,677 |
| | | | | | 4,984,542 |
| Mining—.2% | | | | | |
| Teck Resources, | | | | | |
| Sr. Scd. Notes | 10.25 | 5/15/16 | 316,000 | | 379,568 |
| Multimedia—.2% | | | | | |
| News America, | | | | | |
| Gtd. Notes | 4.50 | 2/15/21 | 505,000 | a | 505,847 |
| Municipal Bonds—.3% | | | | | |
| Illinois, | | | | | |
| GO | 4.42 | 1/1/15 | 640,000 | | 666,522 |
| Office and Business Equipment—.3% | | | | | |
| Xerox, | | | | | |
| Sr. Unscd. Notes | 8.25 | 5/15/14 | 730,000 | | 859,089 |
14
| | | | | | |
| | Coupon | Maturity | Principal | | |
| Bonds and Notes (continued) | Rate (%) | Date | Amount ($) | | Value ($) |
| Oil & Gas—1.6% | | | | | |
| Anadarko Petroleum, | | | | | |
| Sr. Unscd. Notes | 6.38 | 9/15/17 | 1,015,000 | | 1,198,070 |
| EQT, | | | | | |
| Sr. Unscd. Notes | 8.13 | 6/1/19 | 215,000 | | 268,696 |
| Hess, | | | | | |
| Sr. Unscd. Notes | 8.13 | 2/15/19 | 505,000 | | 656,226 |
| National Grid, | | | | | |
| Sr. Unscd. Notes | 6.30 | 8/1/16 | 724,000 | | 846,381 |
| Sempra Energy, | | | | | |
| Sr. Unscd. Notes | 6.50 | 6/1/16 | 435,000 | | 516,635 |
| Valero Energy, | | | | | |
| Gtd. Notes | 6.13 | 2/1/20 | 660,000 | c | 754,646 |
| | | | | | 4,240,654 |
| Paper & Paper Related—.4% | | | | | |
| Georgia-Pacific, | | | | | |
| Gtd. Notes | 8.25 | 5/1/16 | 860,000 | a | 979,280 |
| Pipelines—1.1% | | | | | |
| El Paso, | | | | | |
| Sr. Unscd. Bonds | 6.50 | 9/15/20 | 405,000 | | 452,515 |
| El Paso, | | | | | |
| Sr. Unscd. Notes | 7.00 | 6/15/17 | 80,000 | | 93,047 |
| Kinder Morgan Energy Partners, | | | | | |
| Sr. Unscd. Notes | 5.30 | 9/15/20 | 615,000 | | 670,736 |
| Kinder Morgan Energy Partners, | | | | | |
| Sr. Unscd. Notes | 5.63 | 2/15/15 | 910,000 | | 1,028,200 |
| Plains All American Pipeline, | | | | | |
| Gtd. Notes | 4.25 | 9/1/12 | 650,000 | | 672,177 |
| | | | | | 2,916,675 |
| Property & Casualty Insurance—3.2% | | | | | |
| American International Group, | | | | | |
| Sr. Unscd. Notes | 3.65 | 1/15/14 | 190,000 | | 195,706 |
| American International Group, | | | | | |
| Sr. Unscd. Notes | 6.40 | 12/15/20 | 75,000 | | 82,430 |
| AON, | | | | | |
| Sr. Unscd. Notes | 3.50 | 9/30/15 | 695,000 | | 726,669 |
| Lincoln National, | | | | | |
| Sr. Unscd. Notes | 8.75 | 7/1/19 | 500,000 | | 649,876 |
| MetLife Institutional Funding II, | | | | | |
| Scd. Notes | 1.15 | 4/4/14 | 1,200,000 | a,b | 1,203,552 |
STATEMENT OF INVESTMENTS (continued)
| | | | | |
| | Coupon | Maturity | Principal | |
| Bonds and Notes (continued) | Rate (%) | Date | Amount ($) | Value ($) |
| Property & Casualty | | | | |
| Insurance (continued) | | | | |
| Metropolitan Life Global Funding I, | | | | |
| Sr. Scd. Notes | 5.13 | 4/10/13 | 1,000,000 a | 1,063,341 |
| Principal Financial Group, | | | | |
| Gtd. Notes | 8.88 | 5/15/19 | 1,125,000 | 1,461,050 |
| Prudential Financial, | | | | |
| Sr. Unscd. Notes | 4.75 | 9/17/15 | 365,000 | 397,522 |
| Prudential Financial, | | | | |
| Sr. Unscd. Notes | 5.10 | 12/14/11 | 485,000 | 492,084 |
| Willis North America, | | | | |
| Gtd. Notes | 6.20 | 3/28/17 | 615,000 | 683,039 |
| Willis North America, | | | | |
| Gtd. Notes | 7.00 | 9/29/19 | 1,360,000 | 1,542,418 |
| | | | | 8,497,687 |
| Real Estate—3.1% | | | | |
| Boston Properties, | | | | |
| Sr. Unscd. Notes | 5.63 | 4/15/15 | 620,000 | 697,876 |
| Developers Diversified Realty, | | | | |
| Sr. Unscd. Notes | 4.75 | 4/15/18 | 650,000 | 660,067 |
| Duke Realty, | | | | |
| Sr. Unscd. Notes | 5.88 | 8/15/12 | 570,000 | 595,321 |
| Duke Realty, | | | | |
| Sr. Unscd. Notes | 6.75 | 3/15/20 | 110,000 | 125,920 |
| Duke Realty, | | | | |
| Sr. Unscd. Notes | 8.25 | 8/15/19 | 495,000 | 613,387 |
| ERP Operating, | | | | |
| Sr. Unscd. Notes | 5.75 | 6/15/17 | 230,000 | 260,976 |
| Federal Realty Investment Trust, | | | | |
| Sr. Unscd. Bonds | 5.65 | 6/1/16 | 345,000 | 384,592 |
| Federal Realty Investment Trust, | | | | |
| Sr. Unscd. Notes | 6.00 | 7/15/12 | 305,000 | 317,846 |
| Healthcare Realty Trust, | | | | |
| Sr. Unscd. Notes | 5.13 | 4/1/14 | 630,000 | 672,887 |
| Mack-Cali Realty, | | | | |
| Sr. Unscd. Notes | 5.25 | 1/15/12 | 300,000 | 305,419 |
| Regency Centers, | | | | |
| Gtd. Notes | 5.88 | 6/15/17 | 370,000 | 418,044 |
| Simon Property Group, | | | | |
| Sr. Unscd. Notes | 4.20 | 2/1/15 | 930,000 | 1,001,235 |
16
| | | | | | |
| | Coupon | Maturity | Principal | | |
| Bonds and Notes (continued) | Rate (%) | Date | Amount ($) | | Value ($) |
| Real Estate (continued) | | | | | |
| Simon Property Group, | | | | | |
| Sr. Unscd. Notes | 5.65 | 2/1/20 | 337,000 | | 377,279 |
| Simon Property Group, | | | | | |
| Sr. Unscd. Notes | 5.88 | 3/1/17 | 443,000 | | 510,830 |
| WEA Finance, | | | | | |
| Gtd. Notes | 7.13 | 4/15/18 | 660,000 | a | 781,055 |
| WEA Finance, | | | | | |
| Gtd. Notes | 7.50 | 6/2/14 | 320,000 | a | 368,904 |
| | | | | | 8,091,638 |
| Residential Mortgage | | | | | |
| Pass-Through Ctfs.—.7% | | | | | |
| CS First Boston Mortgage | | | | | |
| Securities, Ser. 2004-7, | | | | | |
| Cl. 6A1 | 5.25 | 10/25/19 | 443,524 | | 448,640 |
| Fosse Master Issuer, | | | | | |
| Ser. 2011-1A, Cl. A2 | 1.65 | 10/18/54 | 1,275,000 | a,b | 1,277,669 |
| GSR Mortgage Loan Trust, | | | | | |
| Ser. 2004-12, Cl. 2A2 | 3.11 | 12/25/34 | 294,839 | b | 231,558 |
| | | | | | 1,957,867 |
| Retail—.5% | | | | | |
| Autozone, | | | | | |
| Sr. Unscd. Notes | 5.75 | 1/15/15 | 805,000 | | 906,432 |
| Staples, | | | | | |
| Gtd. Notes | 9.75 | 1/15/14 | 405,000 | | 482,094 |
| | | | | | 1,388,526 |
| Steel—.4% | | | | | |
| Arcelormittal, | | | | | |
| Sr. Unscd. Notes | 3.75 | 8/5/15 | 1,045,000 | | 1,085,466 |
| Telecommunications—1.1% | | | | | |
| AT&T, | | | | | |
| Sr. Unscd. Notes | 2.50 | 8/15/15 | 650,000 | | 669,852 |
| Cellco Partnership/Verizon | | | | | |
| Wireless Capital, Sr. Unscd. Notes | 5.55 | 2/1/14 | 620,000 | | 685,032 |
| Telecom Italia Capital, | | | | | |
| Gtd. Notes | 5.25 | 11/15/13 | 1,230,000 | | 1,251,616 |
| Verizon Communications, | | | | | |
| Sr. Unscd. Notes | 6.35 | 4/1/19 | 280,000 | | 337,632 |
| | | | | | 2,944,132 |
STATEMENT OF INVESTMENTS (continued)
| | | | | | |
| | Coupon | Maturity | Principal | | |
| Bonds and Notes (continued) | Rate (%) | Date | Amount ($) | | Value ($) |
| U.S. Government Agencies—11.5% | | | | | |
| Federal Home Loan Mortgage Corp., | | | | | |
| Notes | 3.50 | 5/29/13 | 4,185,000 | d | 4,420,076 |
| Federal Home Loan Mortgage Corp., | | | | | |
| Notes | 4.88 | 11/15/13 | 11,625,000 | c,d | 12,773,969 |
| Federal National Mortgage | | | | | |
| Association, Notes | 1.50 | 6/26/13 | 12,780,000 | c,d | 13,039,523 |
| | | | | | 30,233,568 |
| U.S. Government Agencies/ | | | | | |
| Mortgage-Backed—3.4% | | | | | |
| Federal Home Loan Mortgage Corp: | | | | | |
| 5.00%, 7/1/40—9/1/40 | | | 1,105,290 d | 1,185,249 |
| 5.50%, 4/1/40—9/1/40 | | | 5,242,613 d | 5,697,492 |
| 6.50%, 6/1/32 | | | 1,495 d | 1,707 |
| Stripped Security, Interest Only Class, | | | | | |
| Ser. 1987, Cl. PI, 7.00%, 9/15/12 | | | 8,043 d,e | 240 |
| Federal National Mortgage Association: | | | | | |
| 5.00%, 7/1/40—9/1/40 | | | 660,283 d | 709,192 |
| 5.50%, 7/1/40—8/1/40 | | | 1,005,809 d | 1,091,702 |
| Gtd. Pass-Through Ctfs., Ser. 2003-49, | | | | | |
| Cl. JE, 3.00%, 4/25/33 | | | 267,788 d | 277,838 |
| Government National Mortgage Association II: | | | | |
| 7.00%, 12/20/30—4/20/31 | | | 13,946 | | 16,310 |
| 7.50%, 11/20/29—12/20/30 | | | 15,365 | | 18,018 |
| | | | | | 8,997,748 |
| U.S. Government Securities—42.5% | | | | | |
| U.S. Treasury Notes: | | | | | |
| 1.00%, 9/30/11 | | | 25,335,000 | | 25,372,622 |
| 1.38%, 9/15/12 | | | 23,095,000 c | 23,376,482 |
| 1.75%, 8/15/12 | | | 14,455,000 | | 14,675,222 |
| 1.75%, 4/15/13 | | | 5,915,000 | | 6,057,764 |
| 2.13%, 5/31/15 | | | 28,805,000 | | 30,180,035 |
| 2.38%, 7/31/17 | | | 4,575,000 | | 4,741,557 |
| 2.63%, 8/15/20 | | | 1,880,000 | | 1,874,418 |
| 3.63%, 5/15/13 | | | 5,515,000 | | 5,838,576 |
| | | | | | 112,116,676 |
| Total Bonds and Notes | | | | | |
| (cost $253,253,112) | | | | | 258,892,490 |
18
| | | |
| | Principal | |
| Short-Term Investments—.2% | Amount ($) | Value ($) |
| U.S. Treasury Bills; | | |
| 0.08%, 11/17/11 | | |
| (cost $499,873) | 500,000 f | 499,862 |
| |
| Other Investment—1.1% | Shares | Value ($) |
| Registered Investment Company; | | |
| Dreyfus Institutional Preferred Plus Money Market Fund | | |
| (cost $3,038,000) | 3,038,000 g | 3,038,000 |
| |
| Investment of Cash Collateral | | |
| for Securities Loaned—.8% | | |
| Registered Investment Company; | | |
| Dreyfus Institutional Cash Advantage Fund | | |
| (cost $2,017,350) | 2,017,350 g | 2,017,350 |
| Total Investments (cost $258,808,335) | 100.3% | 264,447,702 |
| Liabilities, Less Cash and Receivables | (.3%) | (799,118) |
| Net Assets | 100.0% | 263,648,584 |
| |
| GO—General Obligation |
| a Securities exempt from registration under Rule 144A of the Securities Act of 1933.These securities may be resold in |
| transactions exempt from registration, normally to qualified institutional buyers.At July 31, 2011, these securities |
| were valued at $23,057,275 or 8.7% of net assets. |
| b Variable rate security—interest rate subject to periodic change. |
| c Security, or portion thereof, on loan.At July 31, 2011, the value of the fund’s securities on loan was $38,110,774 |
| and the value of the collateral held by the fund was $39,125,834, consisting of cash collateral of $2,017,350 and |
| U.S. Government and agency securities valued at $37,108,484. |
| d The Federal Housing Finance Agency (“FHFA”) placed Federal Home Loan Mortgage Corporation and Federal |
| National Mortgage Association into conservatorship with FHFA as the conservator.As such, the FHFA oversees the |
| continuing affairs of these companies. |
| e Notional face amount shown. |
| f Held by a broker as collateral for open financial futures positions. |
| g Investment in affiliated money market mutual fund. |
| | | | |
| Portfolio Summary (Unaudited)† | | |
| |
| Value (%) | | Value (%) |
| |
| U.S. Government & Agencies | 57.4 | Foreign/Governmental | .3 |
| Corporate Bonds | 28.9 | Municipal Bonds | .3 |
| Asset/Mortgage-Backed | 11.3 | | |
| Short-Term/Money Market Investments | 2.1 | | 100.3 |
| |
| † Based on net assets. |
| See notes to financial statements. |
| |
| STATEMENT OF FINANCIAL FUTURES |
| July 31, 2011 |
| | | | | |
| | | | | Unrealized |
| | | Market Value | | Appreciation |
| | | Covered by | | (Depreciation) |
| | Contracts | Contracts ($) | Expiration | at 7/31/2011 ($) |
| Financial Futures Long | | | | |
| U.S. Treasury 2 Year Notes | 136 | 29,909,376 | September 2011 | 140,251 |
| U.S. Treasury 5 Year Notes | 135 | 16,395,117 | September 2011 | 250,257 |
| Financial Futures Short | | | | |
| U.S. Treasury 10 Year Notes | 238 | (29,913,625) | September 2011 | (627,258) |
| Gross Unrealized Appreciation | | | | 390,508 |
| Gross Unrealized Depreciation | | | | (627,258) |
See notes to financial statements.
20
| |
| STATEMENT OF ASSETS AND LIABILITIES |
| July 31, 2011 |
| | | | |
| | | Cost | Value |
| Assets ($): | | | |
| Investments in securities—See Statement of Investments (including | | |
| securities on loan, valued at $38,110,774)—Note 1(b): | | |
| Unaffiliated issuers | | 253,752,985 | 259,392,352 |
| Affiliated issuers | | 5,055,350 | 5,055,350 |
| Cash | | | 7,762 |
| Dividends and interest receivable | | | 1,882,397 |
| Receivable for investment securities sold | | | 615,939 |
| Receivable for shares of Common Stock subscribed | | | 41,678 |
| Prepaid expenses | | | 16,984 |
| | | | 267,012,462 |
| Liabilities ($): | | | |
| Due to The Dreyfus Corporation and affiliates—Note 3(c) | | 190,799 |
| Liability for securities on loan—Note 1(b) | | | 2,017,350 |
| Payable for shares of Common Stock redeemed | | | 735,324 |
| Payable for investment securities purchased | | | 193,298 |
| Payable for futures variation margin—Note 4 | | | 148,445 |
| Accrued expenses | | | 78,662 |
| | | | 3,363,878 |
| Net Assets ($) | | | 263,648,584 |
| Composition of Net Assets ($): | | | |
| Paid-in capital | | | 328,312,969 |
| Accumulated undistributed investment income—net | | | 88,903 |
| Accumulated net realized gain (loss) on investments | | | (70,155,905) |
| Accumulated net unrealized appreciation (depreciation) | | | |
| on investments [including ($236,750) net unrealized | | | |
| (depreciation) on financial futures] | | | 5,402,617 |
| Net Assets ($) | | | 263,648,584 |
| |
| |
| Net Asset Value Per Share | | | |
| | Class B | Class D | Class P |
| Net Assets ($) | 949,180 | 261,652,331 | 1,047,073 |
| Shares Outstanding | 88,388 | 24,328,054 | 97,242 |
| Net Asset Value Per Share ($) | 10.74 | 10.76 | 10.77 |
| |
| See notes to financial statements. | | | |
| |
| STATEMENT OF OPERATIONS |
| Year Ended July 31, 2011 |
| | |
| Investment Income ($): | |
| Income: | |
| Interest | 7,717,559 |
| Dividends; | |
| Affiliated issuers | 11,385 |
| Income from securities lending—Note 1(b) | 5,749 |
| Total Income | 7,734,693 |
| Expenses: | |
| Management fee—Note 3(a) | 1,287,343 |
| Shareholder servicing costs—Note 3(c) | 808,684 |
| Professional fees | 52,532 |
| Registration fees | 45,537 |
| Prospectus and shareholders’ reports | 31,577 |
| Custodian fees—Note 3(c) | 23,207 |
| Distribution fees—Note 3(b) | 7,754 |
| Loan commitment fees—Note 2 | 7,636 |
| Directors’ fees and expenses—Note 3(d) | 4,125 |
| Miscellaneous | 51,886 |
| Total Expenses | 2,320,281 |
| Less—reduction in fees due to earnings credits—Note 3(c) | (772) |
| Net Expenses | 2,319,509 |
| Investment Income—Net | 5,415,184 |
| Realized and Unrealized Gain (Loss) on Investments—Note 4 ($): | |
| Net realized gain (loss) on investments | 4,156,130 |
| Net realized gain (loss) on options transactions | 103,309 |
| Net realized gain (loss) on financial futures | (910,311) |
| Net Realized Gain (Loss) | 3,349,128 |
| Net unrealized appreciation (depreciation) on investments | (1,794,493) |
| Net unrealized appreciation (depreciation) on financial futures | (312,156) |
| Net Unrealized Appreciation (Depreciation) | (2,106,649) |
| Net Realized and Unrealized Gain (Loss) on Investments | 1,242,479 |
| Net Increase in Net Assets Resulting from Operations | 6,657,663 |
| |
| See notes to financial statements. | |
22
STATEMENT OF CHANGES IN NET ASSETS
| | | |
| | | Year Ended July 31, |
| | 2011 | 2010 |
| Operations ($): | | |
| Investment income—net | 5,415,184 | 6,992,865 |
| Net realized gain (loss) on investments | 3,349,128 | 2,504,121 |
| Net unrealized appreciation | | |
| (depreciation) on investments | (2,106,649) | 8,327,899 |
| Net Increase (Decrease) in Net Assets | | |
| Resulting from Operations | 6,657,663 | 17,824,885 |
| Dividends to Shareholders from ($): | | |
| Investment income—net: | | |
| Class B Shares | (34,530) | (66,395) |
| Class D Shares | (7,194,431) | (8,342,045) |
| Class P Shares | (36,344) | (54,395) |
| Total Dividends | (7,265,305) | (8,462,835) |
| Capital Stock Transactions ($): | | |
| Net proceeds from shares sold: | | |
| Class B Shares | 286,719 | 744,003 |
| Class D Shares | 79,385,280 | 91,449,612 |
| Class P Shares | 54,613 | 900,133 |
| Dividends reinvested: | | |
| Class B Shares | 33,426 | 60,498 |
| Class D Shares | 6,216,510 | 7,122,987 |
| Class P Shares | 26,578 | 46,748 |
| Cost of shares redeemed: | | |
| Class B Shares | (1,377,440) | (1,364,850) |
| Class D Shares | (79,606,719) | (51,386,283) |
| Class P Shares | (508,940) | (880,235) |
| Increase (Decrease) in Net Assets | | |
| from Capital Stock Transactions | 4,510,027 | 46,692,613 |
| Total Increase (Decrease) in Net Assets | 3,902,385 | 56,054,663 |
| Net Assets ($): | | |
| Beginning of Period | 259,746,199 | 203,691,536 |
| End of Period | 263,648,584 | 259,746,199 |
| Undistributed investment income—net | 88,903 | 116,855 |
STATEMENT OF CHANGES IN NET ASSETS (continued)
| | | |
| | | Year Ended July 31, |
| | 2011 | 2010 |
| Capital Share Transactions: | | |
| Class Ba | | |
| Shares sold | 26,660 | 70,467 |
| Shares issued for dividends reinvested | 3,103 | 5,910 |
| Shares redeemed | (128,079) | (129,318) |
| Net Increase (Decrease) in Shares Outstanding | (98,316) | (52,941) |
| Class Da | | |
| Shares sold | 7,363,226 | 8,618,606 |
| Shares issued for dividends reinvested | 576,526 | 670,149 |
| Shares redeemed | (7,387,550) | (4,837,651) |
| Net Increase (Decrease) in Shares Outstanding | 552,202 | 4,451,104 |
| Class P | | |
| Shares sold | 5,048 | 84,519 |
| Shares issued for dividends reinvested | 2,461 | 4,397 |
| Shares redeemed | (47,187) | (82,381) |
| Net Increase (Decrease) in Shares Outstanding | (39,678) | 6,535 |
| |
| a During the period ended July 31, 2011, 22,558 Class B shares representing $243,276 were automatically |
| converted to 22,534 Class D shares and during the period ended July 31, 2010, 68,007 Class B shares |
| representing $717,295 were automatically converted to 67,921 Class D shares. |
See notes to financial statements.
24
FINANCIAL HIGHLIGHTS
The following tables describe the performance for each share class for the fiscal periods indicated.All information (except portfolio turnover rate) reflects financial results for a single fund share.Total return shows how much your investment in the fund would have increased (or decreased) during each period, assuming you had reinvested all dividends and distributions.These figures have been derived from the fund’s financial statements.
| | | | | | |
| | | Year Ended July 31, | |
| Class B Shares | 2011 | 2010 | 2009 | 2008 | 2007 |
| Per Share Data ($): | | | | | |
| Net asset value, beginning of period | 10.76 | 10.34 | 10.32 | 10.81 | 10.82 |
| Investment Operations: | | | | | |
| Investment income—neta | .16 | .24 | .34 | .38 | .38 |
| Net realized and unrealized | | | | | |
| gain (loss) on investments | .06 | .50 | .05 | (.46) | .03 |
| Total from Investment Operations | .22 | .74 | .39 | (.08) | .41 |
| Distributions: | | | | | |
| Dividends from investment income—net | (.24) | (.32) | (.37) | (.40) | (.42) |
| Dividends from net realized | | | | | |
| gain on investments | — | — | — | (.01) | — |
| Total Distributions | (.24) | (.32) | (.37) | (.41) | (.42) |
| Net asset value, end of period | 10.74 | 10.76 | 10.34 | 10.32 | 10.81 |
| Total Return (%)b | 2.00 | 7.22 | 3.96 | (.78) | 3.84 |
| Ratios/Supplemental Data (%): | | | | | |
| Ratio of total expenses | | | | | |
| to average net assets | 1.52 | 1.61 | 1.70 | 1.57 | 1.56 |
| Ratio of net expenses | | | | | |
| to average net assets | 1.52 | 1.61 | 1.70 | 1.57 | 1.56 |
| Ratio of net investment income | | | | | |
| to average net assets | 1.51 | 2.34 | 3.50 | 3.62 | 3.46 |
| Portfolio Turnover Rate | 118.74 | 90.03 | 99.46c | 86.45c | 146.57 |
| Net Assets, end of period ($ x 1,000) | 949 | 2,010 | 2,479 | 4,417 | 5,746 |
| |
| a Based on average shares outstanding at each month end. |
| b Exclusive of sales charge. |
| c The portfolio turnover rates excluding mortgage dollar roll transactions for the periods ended July 31, 2009 and |
| 2008 were 98.62% and 86.39%, respectively. |
See notes to financial statements.
FINANCIAL HIGHLIGHTS (continued)
| | | | | | |
| | | Year Ended July 31, | |
| Class D Shares | 2011 | 2010 | 2009 | 2008 | 2007 |
| Per Share Data ($): | | | | | |
| Net asset value, beginning of period | 10.78 | 10.34 | 10.33 | 10.81 | 10.82 |
| Investment Operations: | | | | | |
| Investment income—neta | .23 | .32 | .42 | .46 | .45 |
| Net realized and unrealized | | | | | |
| gain (loss) on investments | .06 | .51 | .03 | (.45) | .03 |
| Total from Investment Operations | .29 | .83 | .45 | .01 | .48 |
| Distributions: | | | | | |
| Dividends from investment income—net | (.31) | (.39) | (.44) | (.48) | (.49) |
| Dividends from net realized | | | | | |
| gain on investments | — | — | — | (.01) | — |
| Total Distributions | (.31) | (.39) | (.44) | (.49) | (.49) |
| Net asset value, end of period | 10.76 | 10.78 | 10.34 | 10.33 | 10.81 |
| Total Return (%) | 2.67 | 8.12 | 4.66 | .02 | 4.49 |
| Ratios/Supplemental Data (%): | | | | | |
| Ratio of total expenses | | | | | |
| to average net assets | .90 | .90 | .95 | .89 | .90 |
| Ratio of net expenses | | | | | |
| to average net assets | .90 | .90 | .95 | .89 | .90 |
| Ratio of net investment income | | | | | |
| to average net assets | 2.11 | 3.00 | 4.25 | 4.30 | 4.12 |
| Portfolio Turnover Rate | 118.74 | 90.03 | 99.46b | 86.45b | 146.57 |
| Net Assets, end of period ($ x 1,000) | 261,652 | 256,259 | 199,863 | 213,980 | 261,164 |
| |
| a Based on average shares outstanding at each month end. |
| b The portfolio turnover rates excluding mortgage dollar roll transactions for the periods ended July 31, 2009 and |
| 2008 were 98.62% and 86.39%, respectively. |
See notes to financial statements.
26
| | | | | | |
| | | Year Ended July 31, | |
| Class P Shares | 2011 | 2010 | 2009 | 2008 | 2007 |
| Per Share Data ($): | | | | | |
| Net asset value, beginning of period | 10.79 | 10.36 | 10.34 | 10.82 | 10.83 |
| Investment Operations: | | �� | | | |
| Investment income—neta | .23 | .32 | .42 | .47 | .45 |
| Net realized and unrealized | | | | | |
| gain (loss) on investments | .05 | .50 | .04 | (.46) | .03 |
| Total from Investment Operations | .28 | .82 | .46 | .01 | .48 |
| Distributions: | | | | | |
| Dividends from investment income—net | (.30) | (.39) | (.44) | (.48) | (.49) |
| Dividends from net realized | | | | | |
| gain on investments | — | — | — | (.01) | — |
| Total Distributions | (.30) | (.39) | (.44) | (.49) | (.49) |
| Net asset value, end of period | 10.77 | 10.79 | 10.36 | 10.34 | 10.82 |
| Total Return (%) | 2.65 | 8.10 | 4.66 | .02 | 4.50 |
| Ratios/Supplemental Data (%): | | | | | |
| Ratio of total expenses | | | | | |
| to average net assets | .93 | .93 | .96 | .89 | .90 |
| Ratio of net expenses | | | | | |
| to average net assets | .93 | .93 | .96 | .89 | .90 |
| Ratio of net investment income | | | | | |
| to average net assets | 2.09 | 2.97 | 4.24 | 4.32 | 4.12 |
| Portfolio Turnover Rate | 118.74 | 90.03 | 99.46b | 86.45b | 146.57 |
| Net Assets, end of period ($ x 1,000) | 1,047 | 1,478 | 1,350 | 1,678 | 3,308 |
| |
| a Based on average shares outstanding at each month end. |
| b The portfolio turnover rates excluding mortgage dollar roll transactions for the periods ended July 31, 2009 and |
| 2008 were 98.62% and 86.39%, respectively. |
See notes to financial statements.
NOTES TO FINANCIAL STATEMENTS
NOTE 1—Significant Accounting Policies:
Dreyfus Short Term Income Fund (the “fund”) is a separate non-diversified series of Dreyfus Investment Grade Funds, Inc. (the “Company”), which is registered under the Investment Company Act of 1940, as amended (the “Act”), as an open-end management investment company and operates as a series company currently offering three series, including the fund.The fund’s investment objective seeks to maximize total return, consisting of capital appreciation and current income.The Dreyfus Corporation (the “Manager” or “Dreyfus”), a wholly-owned subsidiary of The Bank of New York Mellon Corporation (“BNY Mellon”), serves as the fund’s investment adviser.
MBSC Securities Corporation (the “Distributor”), a wholly-owned subsidiary of the Manager, is the distributor of the fund’s shares.The fund is authorized to issue 700 million shares of $.001 par value Common Stock.The fund currently offers three classes of shares: Class B (100 million shares authorized), Class D (500 million shares authorized) and Class P (100 million shares authorized). Class B shares are subject to a contingent deferred sales charge (“CDSC”) imposed on Class B share redemptions made within six years of purchase and automatically convert to Class D shares after six years.The fund no longer offers Class B shares, except in connection with dividend reinvestment and permitted exchanges of Class B shares. Class D and Class P shares are sold at net asset value per share only to institutional investors. Class D shares purchased at net asset value (an investment of $250,000 or more) will have a CDSC imposed on redemptions made within eighteen months of purchase. Other differences between the classes include the services offered to and the expenses borne by each class, the allocation of certain transfer agency costs and certain voting rights. Income, expenses (other than expenses attributable to a specific class), and realized and unrealized gains or losses on investments are allocated to each class of shares based on its relative net assets.
28
The Company accounts separately for the assets, liabilities and operations of each series. Expenses directly attributable to each series are charged to that series’ operations; expenses which are applicable to all series are allocated among them on a pro rata basis.
The Financial Accounting Standards Board (“FASB”) Accounting Standards Codification (“ASC”) is the exclusive reference of authoritative U.S. generally accepted accounting principles (“GAAP”) recognized by the FASB to be applied by nongovernmental entities. Rules and interpretive releases of the Securities and Exchange Commission (“SEC”) under authority of federal laws are also sources of authoritative GAAP for SEC registrants. The fund’s financial statements are prepared in accordance with GAAP, which may require the use of management estimates and assumptions.Actual results could differ from those estimates.
The Company enters into contracts that contain a variety of indemnifications. The fund’s maximum exposure under these arrangements is unknown.The fund does not anticipate recognizing any loss related to these arrangements.
(a) Portfolio valuation: Investments in securities, excluding short-term investments (other than U.S.Treasury Bills), financial futures and options transactions are valued each business day by an independent pricing service (the “Service”) approved by the Board of Directors. Investments for which quoted bid prices are readily available and are representative of the bid side of the market in the judgment of the Service are valued at the mean between the quoted bid prices (as obtained by the Service from dealers in such securities) and asked prices (as calculated by the Service based upon its evaluation of the market for such securities). Other investments (which constitute a majority of the portfolio securities) are valued as determined by the Service, based on methods which include consideration of: yields or prices of securities of comparable quality, coupon, maturity and type, indications as to
NOTES TO FINANCIAL STATEMENTS (continued)
values from dealers, and general market conditions. Restricted securities, as well as securities or other assets for which recent market quotations are not readily available and are not valued by a pricing service approved by the Board of Directors, or are determined by the fund not to reflect accurately fair value, are valued at fair value as determined in good faith under the direction of the Board of Directors.The factors that may be considered when fair valuing a security include fundamental analytical data, the nature and duration of restrictions on disposition, an evaluation of the forces that influence the market in which the securities are purchased and sold and public trading in similar securities of the issuer or comparable issuers. Short-term investments, excluding U.S. Treasury Bills, are carried at amortized cost, which approximates value. Registered investment companies that are not traded on an exchange are valued at their net asset value. Financial futures and options, which are traded on an exchange, are valued at the last sales price on the securities exchange on which such securities are primarily traded or at the last sales price on the national securities market on each business day. Options traded over-the-counter are valued at the mean between the bid and asked price.
The fair value of a financial instrument is the amount that would be received to sell an asset or paid to transfer a liability in an orderly transaction between market participants at the measurement date (i.e. the exit price). GAAP establishes a fair value hierarchy that prioritizes the inputs of valuation techniques used to measure fair value.This hierarchy gives the highest priority to unadjusted quoted prices in active markets for identical assets or liabilities (Level 1 measurements) and the lowest priority to unobservable inputs (Level 3 measurements).
Additionally, GAAP provides guidance on determining whether the volume and activity in a market has decreased significantly and whether such a decrease in activity results in transactions that are not orderly. GAAP requires enhanced disclosures around valuation inputs and techniques used during annual and interim periods.
30
Various inputs are used in determining the value of the fund’s investments relating to fair value measurements.These inputs are summarized in the three broad levels listed below:
Level 1—unadjusted quoted prices in active markets for identical investments.
Level 2—other significant observable inputs (including quoted prices for similar investments, interest rates, prepayment speeds, credit risk, etc.).
Level 3—significant unobservable inputs (including the fund’s own assumptions in determining the fair value of investments).
The inputs or methodology used for valuing securities are not necessarily an indication of the risk associated with investing in those securities.
The following is a summary of the inputs used as of July 31, 2011 in valuing the fund’s investments:
| | | | | |
| | | Level 2—Other | Level 3— | |
| | Level 1— | Significant | Significant | |
| | Unadjusted | Observable | Unobservable | |
| | Quoted Prices | Inputs | Inputs | Total |
| Assets ($) | | | | |
| Investments in Securities: | | | |
| Asset-Backed | — | 21,567,728 | — | 21,567,728 |
| Commercial | | | | |
| Mortgage-Backed | — | 6,399,830 | — | 6,399,830 |
| Corporate Bonds† | — | 76,147,108 | — | 76,147,108 |
| Foreign Government | — | 805,443 | — | 805,443 |
| Municipal Bonds | — | 666,522 | — | 666,522 |
| Mutual Funds | 5,055,350 | — | — | 5,055,350 |
| Residential | | | | |
| Mortgage-Backed | — | 1,957,867 | — | 1,957,867 |
| U.S. Government | | | | |
| Agencies/ | | | | |
| Mortgage-Backed | — | 39,231,316 | — | 39,231,316 |
| U.S. Treasury | — | 112,616,538 | — | 112,616,538 |
NOTES TO FINANCIAL STATEMENTS (continued)
| | | | | |
| | | Level 2—Other | Level 3— | |
| | Level 1— | Significant | Significant | |
| | Unadjusted | Observable | Unobservable | |
| | Quoted Prices | Inputs | Inputs | Total |
| Assets ($) (continued) | | | |
| Other Financial | | | | |
| Instruments: | | | | |
| Futures†† | 390,508 | — | — | 390,508 |
| Liabilities ($) | | | | |
| Other Financial | | | | |
| Instruments: | | | | |
| Futures†† | (627,258) | — | — | (627,258) |
| | |
| † | See Statement of Investments for additional detailed categorizations. |
| †† | Amount shown represents unrealized appreciation (depreciation) at period end. |
In January 2010, FASB issued Accounting Standards Update (“ASU”) No. 2010-06 “Improving Disclosures about Fair Value Measurements” (“ASU 2010-06”).The portions of ASU 2010-06 which require reporting entities to prepare new disclosures surrounding amounts and reasons for significant transfers in and out of Level 1 and Level 2 fair value measurements as well as inputs and valuation techniques used to measure fair value for both recurring and nonrecurring fair value measurements that fall in either Level 2 or Level 3 have been adopted by the fund. No significant transfers between Level 1 or Level 2 fair value measurements occurred at July 31, 2011.
In May 2011, FASB issued ASU No. 2011-04 “Amendments to Achieve Common Fair Value Measurement and Disclosure Requirements in GAAP and International Financial Reporting Standards (“IFRS”)” (“ASU 2011-04”). ASU 2011-04 includes common requirements for measurement of and disclosure about fair value between GAAP and IFRS. ASU 2011-04 will require reporting entities to disclose the following information for fair value measurements categorized within Level 3 of the fair value hierarchy: quantitative information about the unobservable inputs used in the fair value measurement, the valuation processes used by the reporting entity and a narrative description of the sensitivity of the fair value measurement to changes in unobservable
32
inputs and the interrelationships between those unobservable inputs. In addition, ASU 2011-04 will require reporting entities to make disclosures about amounts and reasons for all transfers in and out of Level 1 and Level 2 fair value measurements.The new and revised disclosures are effective for interim and annual reporting periods beginning after December 15, 2011. At this time, management is evaluating the implications of ASU 2011-04 and its impact on the financial statements.
(b) Securities transactions and investment income: Securities transactions are recorded on a trade date basis. Realized gains and losses from securities transactions are recorded on the identified cost basis. Dividend income is recognized on the ex-dividend date and interest income, including, where applicable, accretion of discount and amortization of premium on investments, is recognized on the accrual basis.
Pursuant to a securities lending agreement withThe Bank of NewYork Mellon, a subsidiary of BNY Mellon and an affiliate of Dreyfus, the fund may lend securities to qualified institutions. It is the fund’s policy that, at origination, all loans are secured by collateral of at least 102% of the value of U.S. securities loaned and 105% of the value of foreign securities loaned. Collateral equivalent to at least 100% of the market value of securities on loan is maintained at all times. Collateral is either in the form of cash, which can be invested in certain money market mutual funds managed by the Manager, U.S. Government and Agency securities or letters of credit.The fund is entitled to receive all income on securities loaned, in addition to income earned as a result of the lending transaction. Although each security loaned is fully collateralized, the fund bears the risk of delay in recovery of, or loss of rights in, the securities loaned should a borrower fail to return the securities in a timely manner. During the period ended July 31, 2011, The Bank of New York Mellon earned $2,464 from lending portfolio securities, pursuant to the securities lending agreement.
(c) Affiliated issuers: Investments in other investment companies advised by Dreyfus are defined as “affiliated” in the Act.
NOTES TO FINANCIAL STATEMENTS (continued)
The fund may invest in shares of certain affiliated investment companies also advised or managed by Dreyfus. Investments in affiliated investment companies for the period ended July 31, 2011 were as follows:
| | | | | | |
| Affiliated | | | | | |
| Investment | Value | | | Value | Net |
| Company | 7/31/2010 ($) | Purchases ($) | Sales ($) | 7/31/2011 ($) | Assets (%) |
| Dreyfus | | | | | |
| Institutional | | | | | |
| Preferred | | | | | |
| Plus Money | | | | | |
| Market | | | | | |
| Fund | 6,953,000 | 118,604,000 | 122,519,000 | 3,038,000 | 1.1 |
| Dreyfus | | | | | |
| Institutional | | | | | |
| Cash | | | | | |
| Advantage | | | | | |
| Fund† | 2,275,025 | 13,948,665 | 14,206,340 | 2,017,350 | .8 |
| Total | 9,228,025 | 132,552,665 | 136,725,340 | 5,055,350 | 1.9 |
| | |
| † | On June 7, 2011, Dreyfus Institutional Cash Advantage Plus Fund was acquired by Dreyfus |
| | Institutional Cash Advantage Fund, resulting in a transfer of shares. |
(d) Dividends to shareholders: It is the policy of the fund to declare dividends daily from investment income-net. Such dividends are paid monthly. Dividends from net realized capital gains, if any, are normally declared and paid annually, but the fund may make distributions on a more frequent basis to comply with the distribution requirements of the Internal Revenue Code of 1986, as amended (the “Code”).To the extent that net realized capital gains can be offset by capital loss carryovers, it is the policy of the fund not to distribute such gains. Income and capital gain distributions are determined in accordance with income tax regulations, which may differ from GAAP.
(e) Federal income taxes: It is the policy of the fund to continue to qualify as a regulated investment company, if such qualification is in the best interests of its shareholders, by complying with the applicable provisions of the Code, and to make distributions of taxable income sufficient to relieve it from substantially all federal income and excise taxes.
As of and during the period ended July 31, 2011, the fund did not have any liabilities for any uncertain tax positions. The fund recognizes
34
interest and penalties, if any, related to uncertain tax positions as income tax expense in the Statement of Operations. During the period, the fund did not incur any interest or penalties.
Each of the tax years in the four-year period ended July 31, 2011 remains subject to examination by the Internal Revenue Service and state taxing authorities.
At July 31, 2011, the components of accumulated earnings on a tax basis were as follows: undistributed ordinary income $88,903, accumulated capital losses $67,983,607 and unrealized appreciation $4,142,734. In addition, the fund had $912,415 of capital losses realized after October 31, 2010, which were deferred for tax purposes to the first day of the following fiscal year.
The accumulated capital loss carryover is available for federal income tax purposes to be applied against future net securities profits, if any, realized subsequent to July 31, 2011. If not applied, $7,815,155 of the carryover expires in fiscal 2012, $29,412,542 expires in fiscal 2013, $8,634,655 expires in fiscal 2014, $7,342,005 expires in fiscal 2015, $4,178,299 expires in fiscal 2016, $5,740,844 expires in fiscal 2017 and $4,860,107 expires in fiscal 2018.
The tax character of distributions paid to shareholders during the fiscal periods ended July 31, 2011 and July 31, 2010 were as follows: ordinary income $7,265,305 and $8,462,835, respectively.
During the period ended July 31, 2011, as a result of permanent book to tax differences, primarily due to the tax treatment for amortization of premiums, paydown gains and losses on mortgage backed securities, foreign currency transactions, consent fees and a capital loss carryover expiration, the fund increased accumulated undistributed investment income-net by $1,822,169, increased accumulated net realized gain (loss) on investments by $18,240,785 and decreased paid-in capital by $20,062,954. Net assets and net asset value per share were not affected by this reclassification.
NOTES TO FINANCIAL STATEMENTS (continued)
(f) New accounting pronouncement: In April 2011, the FASB issued ASU No. 2011-03“Transfers and Servicing (Topic 860) Reconsideration of Effective Control for Repurchase Agreements (“ASU 2011-03”)” which relates to the accounting for repurchase agreements and similar agreements including mortgage dollar rolls, that both entitle and obligate a transferor to repurchase or redeem financial assets before their maturity. ASU 2011-03 modifies the criteria for determining effective control of transferred assets and as a result certain agreements may now be accounted for as secured borrowings.ASU 2011-03 is effective prospectively for new transfers and existing transactions that are modified in the first interim or annual period beginning on or after December 15, 2011. Management is currently evaluating the implications of this change and its impact on the financial statements.
NOTE 2—Bank Lines of Credit:
The fund participates with other Dreyfus-managed funds in a $225 million unsecured credit facility led by Citibank, N.A. and a $300 million unsecured credit facility provided by The Bank of New York Mellon (each, a “Facility”), each to be utilized primarily for temporary or emergency purposes, including the financing of redemptions. In connection therewith, the fund has agreed to pay its pro rata portion of commitment fees for each Facility. Interest is charged to the fund based on rates determined pursuant to the terms of the respective Facility at the time of borrowing. During the period ended July 31, 2011, the fund did not borrow under the Facilities.
NOTE 3—Management Fee and Other Transactions With Affiliates:
(a) Pursuant to a management agreement with the Manager, the management fee is computed at the annual rate of .50% of the value of the fund’s average daily net assets and is payable monthly.
During the period ended July 31, 2011, the Distributor retained $976 from CDSCs on redemptions of the fund’s Class B shares.
(b) Under the Distribution Plan (the “Plan”) adopted pursuant to Rule 12b-1 under the Act, Class B shares pay the Distributor for distributing
36
its shares at an annual rate of .50% of the value of the average daily net assets of Class B shares. During the period ended July 31, 2011, Class B shares were charged $7,754, pursuant to the Plan.
(c) Under the Shareholder Services Plan, Class B, Class D and Class P shares pay the Distributor at an annual rate of .25% of the value of the average daily net assets of Class B and Class P shares and .20% of the value of the average daily net assets of Class D shares for the provision of certain services.The services provided may include personal services relating to shareholder accounts, such as answering shareholder inquiries regarding Class B, Class D and Class P shares and providing reports and other information, and services related to the maintenance of shareholder accounts.The Distributor may make payments to Service Agents (a securities dealer, financial institution or other industry professional) in respect of these services.The Distributor determines the amounts to be paid to Service Agents. During the period ended July 31, 2011, Class B, Class D and Class P shares were charged, $3,877, $509,307 and $3,230, respectively, pursuant to the Shareholder Services Plan.
The fund compensates Dreyfus Transfer, Inc., a wholly-owned subsidiary of the Manager, under a transfer agency agreement for providing personnel and facilities to perform transfer agency services for the fund. During the period ended July 31, 2011, the fund was charged $141,911 pursuant to the transfer agency agreement, which is included in Shareholder servicing costs in the Statement of Operations.
The fund has arrangements with the custodian and cash management bank whereby the fund may receive earnings credits when positive cash balances are maintained, which are used to offset custody and cash management fees. For financial reporting purposes, the fund includes net earnings credits as an expense offset in the Statement of Operations.
The fund compensates The Bank of New York Mellon under a cash management agreement for performing cash management services related to fund subscriptions and redemptions. During the period ended July 31, 2011, the fund was charged $15,887 pursuant to the
NOTES TO FINANCIAL STATEMENTS (continued)
cash management agreement, which is included in Shareholder servicing costs in the Statement of Operations.These fees were partially offset by earnings credits of $772.
The fund also compensates The Bank of New York Mellon under a custody agreement for providing custodial services for the fund. During the period ended July 31, 2011, the fund was charged $23,207 pursuant to the custody agreement.
During the period ended July 31, 2011, the fund was charged $7,880 for services performed by the Chief Compliance Officer.
The components of “Due to The Dreyfus Corporation and affiliates” in the Statement of Assets and Liabilities consist of: management fees $111,373, Rule 12b-1 distribution plan fees $403, shareholder services plan fees $44,634, custodian fees $8,056, chief compliance officer fees $2,756 and transfer agency per account fees $23,577.
(d) Each Board member also serves as a Board member of other funds within the Dreyfus complex. Annual retainer fees and attendance fees are allocated to each fund based on net assets.
NOTE 4—Securities Transactions:
The aggregate amount of purchases and sales (including paydowns) of investment securities, excluding short-term securities, financial futures and options transactions, during the period ended July 31, 2011, amounted to $305,956,353 and $298,190,714, respectively.
Futures Contracts: In the normal course of pursuing its investment objective, the fund is exposed to market risk, including interest rate risk, as a result of changes in value of underlying financial instruments.The fund invests in financial futures contracts in order to manage its exposure to or protect against changes in the market. A futures contract represents a commitment for the future purchase or a sale of an asset at a specified date. Upon entering into such contracts, these investments require initial margin deposits with a broker, which consist of cash or cash equivalents. The amount of these deposits is determined by the exchange or Board of Trade on which the contract is traded and is sub-
38
ject to change. Accordingly, variation margin payments are received or made to reflect daily unrealized gains or losses which are recorded in the Statement of Operations. Futures contracts are valued daily at the last sales price established by the Board of Trade or exchange upon which they are traded. When the contracts are closed, the fund recognizes a realized gain or loss. There is minimal counterparty credit risk to the fund with futures since futures are exchange traded, and the exchange’s clearinghouse guarantees the futures against default. Contracts open at July 31, 2011 are set forth in the Statement of Financial Futures.
Options: The fund purchases and writes (sells) put and call options to hedge against changes in interest rates, or as a substitute for an invest-ment.The fund is subject to interest rate risk in the course of pursuing its investment objectives through its investments in options contracts.A call option gives the purchaser of the option the right (but not the obligation) to buy, and obligates the writer to sell, the underlying security or securities at the exercise price at any time during the option period, or at a specified date. Conversely, a put option gives the purchaser of the option the right (but not the obligation) to sell, and obligates the writer to buy the underlying security or securities at the exercise price at any time during the option period, or at a specified date.
As a writer of call options, the fund receives a premium at the outset and then bears the market risk of unfavorable changes in the price of the financial instrument underlying the option. Generally, the fund realizes a gain, to the extent of the premium, if the price of the underlying financial instrument decreases between the date the option is written and the date on which the option is terminated. Generally, the fund incurs a loss, if the price of the financial instrument increases between those dates.
As a writer of put options, the fund receives a premium at the outset and then bears the market risk of unfavorable changes in the price of the financial instrument underlying the option. Generally, the fund realizes a gain, to the extent of the premium, if the price of the underlying financial instrument increases between the date the option is written and the
NOTES TO FINANCIAL STATEMENTS (continued)
date on which the option is terminated. Generally, the fund incurs a loss, if the price of the financial instrument decreases between those dates.
As a writer of an option, the fund has no control over whether the underlying securities may be sold (call) or purchased (put) and as a result bears the market risk of an unfavorable change in the price of the security underlying the written option.There is a risk of loss from a change in value of such options which may exceed the related premiums received. One risk of holding a put or a call option is that if the option is not sold or exercised prior to its expiration, it becomes worthless. However, this risk is limited to the premium paid by the fund. Upon the expiration or closing of the option transaction, a gain or loss is reported in the Statement of Operations.
The following summarizes the fund’s call/put options written during the period ended July 31, 2011:
| | | | | |
| | Face Amount | | Options Terminated |
| | Covered by | Premiums | | Net Realized |
| Options Written: | Contracts ($) | Received ($) | Cost ($) | Gain ($) |
| Contracts outstanding | | | | |
| July 31, 2010 | — | — | | |
| Contracts written | 494,000 | 299,095 | | |
| Contracts terminated: | | | | |
| Contracts closed | 470,000 | 281,163 | 197,706 | 83,457 |
| Contracts expired | 24,000 | 17,932 | — | 17,932 |
| Total contracts terminated | 494,000 | 299,095 | 197,706 | 101,389 |
| Contracts Outstanding | | | | |
| July 31, 2011 | — | — | | |
The following summarizes the average market value of derivatives outstanding during the period ended July 31, 2011:
| | |
| | Average Market Value ($) |
| Interest rate futures contracts | 72,730,651 |
| Interest rate options contracts | 27,909 |
At July 31, 2011, the cost of investments for federal income tax purposes was $260,003,005; accordingly, accumulated net unrealized appreciation on investments was $4,444,697, consisting of $6,189,869 gross unrealized appreciation and $1,745,172 gross unrealized depreciation.
40
| |
| REPORT OF INDEPENDENT REGISTERED |
| PUBLIC ACCOUNTING FIRM |
Shareholders and Board of Directors
Dreyfus Short Term Income Fund
We have audited the accompanying statement of assets and liabilities, including the statements of investments and financial futures, of Dreyfus Short Term Income Fund (one of the series comprising Dreyfus Investment Grade Funds, Inc.) as of July 31, 2011, and the related statement of operations for the year then ended, the statement of changes in net assets for each of the two years in the period then ended, and financial highlights for each of the years indicated therein.These financial statements and financial highlights are the responsibility of the Fund’s management. Our responsibility is to express an opinion on these financial statements and financial highlights based on our audits.
We conducted our audits in accordance with the standards of the Public Company Accounting Oversight Board (United States).Those standards require that we plan and perform the audit to obtain reasonable assurance about whether the financial statements and financial highlights are free of material misstatement.We were not engaged to perform an audit of the Fund’s internal control over financial reporting. Our audits included consideration of internal control over financial reporting as a basis for designing audit procedures that are appropriate in the circumstances, but not for the purpose of expressing an opinion on the effectiveness of the Fund’s internal control over financial reporting. Accordingly, we express no such opinion. An audit also includes examining, on a test basis, evidence supporting the amounts and disclosures in the financial statements and financial highlights, assessing the accounting principles used and significant estimates made by management, and evaluating the overall financial statement presentation. Our procedures included confirmation of securities owned as of July 31, 2011 by correspondence with the custodian and others. We believe that our audits provide a reasonable basis for our opinion.
In our opinion, the financial statements and financial highlights referred to above present fairly, in all material respects, the financial position of Dreyfus Short Term Income Fund at July 31, 2011, the results of its operations for the year then ended, the changes in its net assets for each of the two years in the period then ended, and the financial highlights for each of the indicated years, in conformity with U.S. generally accepted accounting principles.

| |
| New York, New York |
| September 26, 2011 |
IMPORTANT TAX INFORMATION (Unaudited)
The fund hereby designates 99.78% of ordinary income dividends paid during the fiscal year ended July 31, 2011 as qualifying “interest related dividends”.
42
| |
| INFORMATION ABOUT THE RENEWAL OF THE |
| FUND’S MANAGEMENT AGREEMENT (Unaudited) |
At a meeting of the fund’s Board of Directors held on July 13 and 14, 2011, the Board considered the renewal of the fund’s Management Agreement pursuant to which Dreyfus provides the fund with investment advisory and administrative services (the“Agreement”).The Board members, none of whom are “interested persons” (as defined in the Investment Company Act of 1940, as amended) of the fund, were assisted in their review by independent legal counsel and met with counsel in executive session separate from representatives of Dreyfus. In considering the renewal of the Agreement, the Board considered all factors that it believed to be relevant, including those discussed below.The Board did not identify any one factor as dispositive, and each Board member may have attributed different weights to the factors considered.
Analysis of Nature, Extent, and Quality of Services Provided to the Fund.The Board members considered information previously provided to them in presentations from representatives of Dreyfus regarding the nature, extent, and quality of the services provided to funds in the Dreyfus fund complex, and representatives of Dreyfus confirmed that there had been no material changes in this information. Dreyfus provided the number of open accounts in the fund, the fund’s asset size and the allocation of fund assets among distribution channels. Dreyfus also had previously provided information regarding the diverse intermediary relationships and distribution channels of funds in the Dreyfus fund complex and Dreyfus’ corresponding need for broad, deep, and diverse resources to be able to provide ongoing shareholder services to each distribution channel, including the distribution channel(s) for the fund.
The Board members also considered research support available to, and portfolio management capabilities of, the fund’s portfolio management personnel and that Dreyfus also provides oversight of day-to-day fund operations, including fund accounting and administration and assistance in meeting legal and regulatory requirements.The Board members also considered Dreyfus’ extensive administrative, accounting, and compliance infrastructures.
| |
| INFORMATION ABOUT THE RENEWAL OF THE FUND’S |
| MANAGEMENT AGREEMENT (Unaudited) (continued) |
Comparative Analysis of the Fund’s Performance and Management Fee and Expense Ratio. The Board members reviewed reports prepared by Lipper, Inc. (“Lipper”), an independent provider of investment company data, which included information comparing (1) the fund’s performance with the performance of a group of comparable funds (the “Performance Group”) and with a broader group of funds (the “Performance Universe”), all for various periods ended May 31, 2011, and (2) the fund’s actual and contractual management fees and total expenses with those of a group of comparable funds (the “Expense Group”) and with a broader group of funds (the “Expense Universe”), the information for which was derived in part from fund financial statements available to Lipper as of January 31, 2011. Dreyfus previously had furnished the Board with a description of the methodology Lipper used to select the Performance Group and Performance Universe and the Expense Group and Expense Universe.
Dreyfus representatives stated that the usefulness of performance comparisons may be affected by a number of factors, including different investment limitations that may be applicable to the fund and comparison funds.The Board members discussed the results of the comparisons and noted that the fund’s total return performance was above the Performance Group and Performance Universe medians for all periods except the ten-year period.The Board also noted that the fund’s yield was above the Performance Group and Performance Universe medians for all periods. Dreyfus also provided a comparison of the fund’s calendar year total returns to the returns of the fund’s benchmark index.
The Board members also reviewed the range of actual and contractual management fees and total expenses of the Expense Group and Expense Universe funds and discussed the results of the comparisons.They noted that the fund’s contractual management fee was above the Expense Group median, and the actual management fee and total expenses were above the Expense Group and Expense Universe medians.
44
Representatives of Dreyfus reviewed with the Board members the management or investment advisory fees (1) paid by funds advised or administered by Dreyfus that are in the same Lipper category as the fund and (2) paid to Dreyfus or the Dreyfus-affiliated primary employer of the fund’s primary portfolio manager for advising any separate accounts and/or other types of client portfolios that are considered to have similar investment strategies and policies as the fund (the ��Similar Clients”), and explained the nature of the Similar Clients.They discussed differences in fees paid and the relationship of the fees paid in light of any differences in the services provided and other relevant factors.The Board members considered the relevance of the fee information provided for the Similar Clients to evaluate the appropriateness and reasonableness of the fund’s management fee.
Analysis of Profitability and Economies of Scale. Dreyfus’ representatives reviewed the expenses allocated and profit received by Dreyfus and the resulting profitability percentage for managing the fund, and the method used to determine the expenses and profit. The Board concluded that the profitability results were not unreasonable, given the services rendered and service levels provided by Dreyfus. The Board previously had been provided with information prepared by an independent consulting firm regarding Dreyfus’ approach to allocating costs to, and determining the profitability of, individual funds and the entire Dreyfus fund complex. The consulting firm also had analyzed where any economies of scale might emerge in connection with the management of a fund.
The Board’s counsel stated that the Board members should consider the profitability analysis (1) as part of their evaluation of whether the fees under the Agreement bear a reasonable relationship to the mix of services provided by Dreyfus, including the nature, extent and quality of such services, and (2) in light of the relevant circumstances for the
| |
| INFORMATION ABOUT THE RENEWAL OF THE FUND’S |
| MANAGEMENT AGREEMENT (Unaudited) (continued) |
fund and the extent to which economies of scale would be realized if the fund grows and whether fee levels reflect these economies of scale for the benefit of fund shareholders.They also noted that, as a result of shared and allocated costs among funds in the Dreyfus funds complex, the extent of economies of scale could depend substantially on the level of assets in the complex as a whole, so that increases and decreases in complex-wide assets can affect potential economies of scale in a manner that is disproportionate to, or even in the opposite direction from, changes in the fund’s asset level.The Board members also considered potential benefits to Dreyfus from acting as investment adviser and noted that there were no soft dollar arrangements in effect for trading the fund’s investments.
At the conclusion of these discussions, the Board agreed that it had been furnished with sufficient information to make an informed business decision with respect to the renewal of the Agreement. Based on the discussions and considerations as described above, the Board concluded and determined as follows.
The Board concluded that the nature, extent and quality of the services provided by Dreyfus are adequate and appropriate.
The Board generally was satisfied with the fund’s performance.
The Board concluded that the fee paid to Dreyfus was reasonable in light of the considerations described above.
The Board determined that the economies of scale which may accrue to Dreyfus and its affiliates in connection with the management of the fund had been adequately considered by Dreyfus in connection with the fee rate charged to the fund pursuant to the Agreement and that, to the extent in the future it were determined that material economies of scale had not been shared with the fund, the Board would seek to have those economies of scale shared with the fund.
46
The Board members considered these conclusions and determinations, along with information received on a routine and regular basis throughout the year. In addition, it should be noted that the Board’s consideration of the contractual fee arrangements for this fund had the benefit of a number of years of reviews of prior or similar agreements during which lengthy discussions took place between the Board members and Dreyfus representatives. Certain aspects of the arrangements may receive greater scrutiny in some years than in others, and the Board members’ conclusions may be based, in part, on their consideration of the same or similar arrangements in prior years. The Board members determined that renewal of the Agreement was in the best interests of the fund and its shareholders.
BOARD MEMBERS INFORMATION (Unaudited)
| |
| Joseph S. DiMartino (67) |
| Chairman of the Board (1995) |
| Principal Occupation During Past 5Years: |
| • Corporate Director and Trustee |
| Other Public Company Board Memberships During Past 5Years: |
| • CBIZ (formerly, Century Business Services, Inc.), a provider of outsourcing functions for small |
| and medium size companies, Director (1997-present) |
| • Sunair Services Corporation, a provider of certain outdoor-related services to homes and |
| businesses, Director (2005-2009) |
| • The Newark Group, a provider of a national market of paper recovery facilities, paperboard |
| mills and paperboard converting plants, Director (2000-2010) |
| No. of Portfolios for which Board Member Serves: 168 |
| ——————— |
| Clifford L. Alexander, Jr. (77) |
| Board Member (2003) |
| Principal Occupation During Past 5Years: |
| • President of Alexander & Associates, Inc., a management consulting firm (January 1981-present) |
| No. of Portfolios for which Board Member Serves: 45 |
| ——————— |
| David W. Burke (75) |
| Board Member (1994) |
| Principal Occupation During Past 5Years: |
| • Corporate Director and Trustee |
| No. of Portfolios for which Board Member Serves: 83 |
| ——————— |
| Whitney I. Gerard (76) |
| Board Member (1993) |
| Principal Occupation During Past 5Years: |
| • Partner of Chadbourne & Parke LLP |
| No. of Portfolios for which Board Member Serves: 25 |
48
| |
| Nathan Leventhal (68) |
| Board Member (2009) |
| Principal Occupation During Past 5Years: |
| • Commissioner, NYC Planning Commission (March 2007-present) |
| • Chairman of the Avery-Fisher Artist Program (November 1997-present) |
| Other Public Company Board Memberships During Past 5Years: |
| • Movado Group, Inc., Director |
| No. of Portfolios for which Board Member Serves: 43 |
| ——————— |
| George L. Perry (77) |
| Board Member (1992) |
| Principal Occupation During Past 5Years: |
| • Economist and Senior Fellow at Brookings Institution |
| No. of Portfolios for which Board Member Serves: 25 |
| ——————— |
| Benaree Pratt Wiley (65) |
| Board Member (2009) |
| Principal Occupation During Past 5Years: |
| • Principal,TheWiley Group, a firm specializing in strategy and business development (2005-present) |
| Other Public Company Board Memberships During Past 5Years: |
| • CBIZ (formerly, Century Business Services, Inc.), a provider of outsourcing functions for small |
| and medium size companies, Director (2008-present) |
| No. of Portfolios for which Board Member Serves: 69 |
| ——————— |
Once elected all Board Members serve for an indefinite term, but achieve Emeritus status upon reaching age 80.The address of the Board Members and Officers is in c/o The Dreyfus Corporation, 200 Park Avenue, NewYork, NewYork 10166.Additional information about the Board Members is available in the fund’s Statement of Additional Information which can be obtained from Dreyfus free of charge by calling this toll free number: 1-800-DREYFUS.
Lucy Wilson Benson, Emeritus Board Member
Arthur A. Hartman, Emeritus Board Member
OFFICERS OF THE FUND (Unaudited)
BRADLEY J. SKAPYAK, President since January 2010.
Chief Operating Officer and a director of the Manager since June 2009. From April 2003 to June 2009, Mr. Skapyak was the head of the Investment Accounting and Support Department of the Manager. He is an officer of 76 investment companies (comprised of 168 portfolios) managed by the Manager. He is 52 years old and has been an employee of the Manager since February 1988.
MICHAEL A. ROSENBERG, Vice President and Secretary since August 2005.
Assistant General Counsel of BNY Mellon, and an officer of 77 investment companies (comprised of 193 portfolios) managed by the Manager. He is 51 years old and has been an employee of the Manager since October 1991.
KIESHA ASTWOOD, Vice President and Assistant Secretary since January 2010.
Counsel of BNY Mellon, and an officer of 77 investment companies (comprised of 193 portfolios) managed by the Manager. She is 38 years old and has been an employee of the Manager since July 1995.
JAMES BITETTO, Vice President and Assistant Secretary since August 2005.
Senior Counsel of BNY Mellon and Secretary of the Manager, and an officer of 77 investment companies (comprised of 193 portfolios) managed by the Manager. He is 45 years old and has been an employee of the Manager since December 1996.
JONI LACKS CHARATAN, Vice President and Assistant Secretary since August 2005.
Senior Counsel of BNY Mellon, and an officer of 77 investment companies (comprised of 193 portfolios) managed by the Manager. She is 55 years old and has been an employee of the Manager since October 1988.
JOSEPH M. CHIOFFI, Vice President and Assistant Secretary since August 2005.
Senior Counsel of BNY Mellon, and an officer of 77 investment companies (comprised of 193 portfolios) managed by the Manager. He is 49 years old and has been an employee of the Manager since June 2000.
KATHLEEN DENICHOLAS, Vice President and Assistant Secretary since January 2010.
Senior Counsel of BNY Mellon, and an officer of 77 investment companies (comprised of 193 portfolios) managed by the Manager. She is 36 years old and has been an employee of the Manager since February 2001.
JANETTE E. FARRAGHER, Vice President and Assistant Secretary since August 2005.
Assistant General Counsel of BNY Mellon, and an officer of 77 investment companies (comprised of 193 portfolios) managed by the Manager. She is 48 years old and has been an employee of the Manager since February 1984.
JOHN B. HAMMALIAN, Vice President and Assistant Secretary since August 2005.
Managing Counsel of BNY Mellon, and an officer of 77 investment companies (comprised of 193 portfolios) managed by the Manager. He is 48 years old and has been an employee of the Manager since February 1991.
M. CRISTINA MEISER, Vice President and Assistant Secretary since January 2010.
Senior Counsel of BNY Mellon, and an officer of 77 investment companies (comprised of 193 portfolios) managed by the Manager. She is 41 years old and has been an employee of the Manager since August 2001.
50
ROBERT R. MULLERY, Vice President and Assistant Secretary since August 2005.
Managing Counsel of BNY Mellon, and an officer of 77 investment companies (comprised of 193 portfolios) managed by the Manager. He is 59 years old and has been an employee of the Manager since May 1986.
JEFF PRUSNOFSKY, Vice President and Assistant Secretary since August 2005.
Managing Counsel of BNY Mellon, and an officer of 77 investment companies (comprised of 193 portfolios) managed by the Manager. He is 46 years old and has been an employee of the Manager since October 1990.
JAMES WINDELS, Treasurer since November 2001.
Director – Mutual Fund Accounting of the Manager, and an officer of 77 investment companies (comprised of 193 portfolios) managed by the Manager. He is 52 years old and has been an employee of the Manager since April 1985.
RICHARD CASSARO, Assistant Treasurer since January 2008.
Senior Accounting Manager – Money Market and Municipal Bond Funds of the Manager, and an officer of 77 investment companies (comprised of 193 portfolios) managed by the Manager. He is 52 years old and has been an employee of the Manager since September 1982.
GAVIN C. REILLY, Assistant Treasurer since August 2005.
Tax Manager of the Investment Accounting and Support Department of the Manager, and an officer of 77 investment companies (comprised of 193 portfolios) managed by the Manager. He is 42 years old and has been an employee of the Manager since April 1991.
ROBERT ROBOL, Assistant Treasurer since August 2003.
Senior Accounting Manager – Fixed Income Funds of the Manager, and an officer of 77 investment companies (comprised of 193 portfolios) managed by the Manager. He is 47 years old and has been an employee of the Manager since October 1988.
ROBERT SALVIOLO, Assistant Treasurer since July 2007.
Senior Accounting Manager – Equity Funds of the Manager, and an officer of 77 investment companies (comprised of 193 portfolios) managed by the Manager. He is 44 years old and has been an employee of the Manager since June 1989.
ROBERT SVAGNA, Assistant Treasurer since August 2005.
Senior Accounting Manager – Equity Funds of the Manager, and an officer of 77 investment companies (comprised of 193 portfolios) managed by the Manager. He is 44 years old and has been an employee of the Manager since November 1990.
OFFICERS OF THE FUND (Unaudited) (continued)
JOSEPH W. CONNOLLY, Chief Compliance Officer since October 2004.
Chief Compliance Officer of the Manager and The Dreyfus Family of Funds (77 investment companies, comprised of 193 portfolios). From November 2001 through March 2004, Mr. Connolly was first Vice-President, Mutual Fund Servicing for Mellon Global Securities Services. In that capacity, Mr. Connolly was responsible for managing Mellon’s Custody, Fund Accounting and Fund Administration services to third-party mutual fund clients. He is 54 years old and has served in various capacities with the Manager since 1980, including manager of the firm’s Fund Accounting Department from 1997 through October 2001.
STEPHEN J. STOREN, Anti-Money Laundering Compliance Officer since May 2011.
Chief Compliance Officer of the Distributor, and the Anti-Money Laundering Compliance Officer of 73 investment companies (comprised of 189 portfolios) managed by the Manager. He is 56 years old and has been an employee of the Distributor since October 1999.
52
For More Information
Telephone Call your financial representative or 1-800-DREYFUS
Mail The Dreyfus Family of Funds, 144 Glenn Curtiss Boulevard, Uniondale, NY 11556-0144
The fund files its complete schedule of portfolio holdings with the Securities and Exchange Commission (“SEC”) for the first and third quarters of each fiscal year on Form N-Q. The fund’s Forms N-Q are available on the SEC’s website at http://www.sec.gov and may be reviewed and copied at the SEC’s Public Reference Room in Washington, DC. Information on the operation of the Public Reference Room may be obtained by calling 1-800-SEC-0330.
A description of the policies and procedures that the fund uses to determine how to vote proxies relating to portfolio securities, and information regarding how the fund voted these proxies for the most recent 12-month period ended June 30 is available at http://www.dreyfus.com and on the SEC’s website at http://www.sec.gov. The description of the policies and procedures is also available without charge, upon request, by calling 1-800-DREYFUS.

Item 2. Code of Ethics.
The Registrant has adopted a code of ethics that applies to the Registrant's principal executive officer, principal financial officer, principal accounting officer or controller, or persons performing similar functions. There have been no amendments to, or waivers in connection with, the Code of Ethics during the period covered by this Report.
Item 3. Audit Committee Financial Expert.
The Registrant's Board has determined that Joseph S. DiMartino, a member of the Audit Committee of the Board, is an audit committee financial expert as defined by the Securities and Exchange Commission (the "SEC"). Joseph S. DiMartino is "independent" as defined by the SEC for purposes of audit committee financial expert determinations.
Item 4. Principal Accountant Fees and Services.
(a) Audit Fees. The aggregate fees billed for each of the last two fiscal years (the "Reporting Periods") for professional services rendered by the Registrant's principal accountant (the "Auditor") for the audit of the Registrant's annual financial statements or services that are normally provided by the Auditor in connection with the statutory and regulatory filings or engagements for the Reporting Periods, were $ 99,257 in 2010 and $107,460 in 2011.
(b) Audit-Related Fees. The aggregate fees billed in the Reporting Periods for assurance and related services by the Auditor that are reasonably related to the performance of the audit of the Registrant's financial statements and are not reported under paragraph (a) of this Item 4 were $16,146 in 2010 and $18,000 in 2011. These services consisted of one or more of the following: (i) agreed upon procedures related to compliance with Internal Revenue Code section 817(h), (ii) security counts required by Rule 17f-2 under the Investment Company Act of 1940, as amended, (iii) advisory services as to the accounting or disclosure treatment of Registrant transactions or events and (iv) advisory services to the accounting or disclosure treatment of the actual or potential impact to the Registrant of final or proposed rules, standards or interpretations by the Securities and Exchange Commission, the Financial Accounting Standards Boards or other regulatory or standard-setting bodies.
The aggregate fees billed in the Reporting Periods for non-audit assurance and related services by the Auditor to the Registrant's investment adviser (not including any sub-investment adviser whose role is primarily portfolio management and is subcontracted with or overseen by another investment adviser), and any entity controlling, controlled by or under common control with the investment adviser that provides ongoing services to the Registrant ("Service Affiliates"), that were reasonably related to the performance of the annual audit of the Service Affiliate, which required pre-approval by the Audit Committee were $0 in 2010 and $0 in 2011.
(c) Tax Fees. The aggregate fees billed in the Reporting Periods for professional services rendered by the Auditor for tax compliance, tax advice, and tax planning ("Tax Services") were $ 12,996 in 2010 and $10,902 in 2011. These services consisted of: (i) review or preparation of U.S. federal, state, local and excise tax returns; (ii) U.S. federal, state and local tax planning, advice and assistance regarding statutory, regulatory or administrative developments; (iii) tax advice regarding tax qualification matters and/or treatment of various financial instruments held or proposed to be acquired or held. The aggregate fees billed in the Reporting Periods for Tax Services by the Auditor to Service Affiliates, which required pre-approval by the Audit Committee were $0 in 2010 and $0 in 2011.
(d) All Other Fees. The aggregate fees billed in the Reporting Periods for products and services provided by the Auditor, other than the services reported in paragraphs (a) through (c) of this Item, were $2,002 in 2010 and $510 in 2011. [These services consisted of a review of the Registrant's anti-money laundering program].
The aggregate fees billed in the Reporting Periods for Non-Audit Services by the Auditor to Service Affiliates, other than the services reported in paragraphs (b) through (c) of this Item, which required pre-approval by the Audit Committee, were $0 in 2010 and $0 in 2011.
(e)(1) Audit Committee Pre-Approval Policies and Procedures. The Registrant's Audit Committee has established policies and procedures (the "Policy") for pre-approval (within specified fee limits) of the Auditor's engagements for non-audit services to the Registrant and Service Affiliates without specific case-by-case consideration. The pre-approved services in the Policy can include pre-approved audit services, pre-approved audit-related services, pre-approved tax services and pre-approved all other services. Pre-approval considerations include whether the proposed services are compatible with maintaining the Auditor's independence. Pre-approvals pursuant to the Policy are considered annually.
(e)(2) Note: None of the services described in paragraphs (b) through (d) of this Item 4 were approved by the Audit Committee pursuant to paragraph (c)(7)(i)(C) of Rule 2-01 of Regulation S-X.
(f) None of the hours expended on the principal accountant's engagement to audit the registrant's financial statements for the most recent fiscal year were attributed to work performed by persons other than the principal account's full-time, permanent employees.
Non-Audit Fees. The aggregate non-audit fees billed by the Auditor for services rendered to the Registrant, and rendered to Service Affiliates, for the Reporting Periods were $28,443,195 in 2010 and $17,495,155 in 2011.
Auditor Independence. The Registrant's Audit Committee has considered whether the provision of non-audit services that were rendered to Service Affiliates, which were not pre-approved (not requiring pre-approval), is compatible with maintaining the Auditor's independence.
Item 5. Audit Committee of Listed Registrants.
Not applicable. [CLOSED-END FUNDS ONLY]
Item 6. Investments.
(a) Not applicable.
Item 7. Disclosure of Proxy Voting Policies and Procedures for Closed-End Management Investment Companies.
Not applicable. [CLOSED-END FUNDS ONLY]
Item 8. Portfolio Managers of Closed-End Management Investment Companies.
Not applicable. [CLOSED-END FUNDS ONLY, beginning with reports for periods ended on and after December 31, 2005]
Item 9. Purchases of Equity Securities by Closed-End Management Investment Companies and Affiliated Purchasers.
Not applicable. [CLOSED-END FUNDS ONLY]
Item 10. Submission of Matters to a Vote of Security Holders.
There have been no material changes to the procedures applicable to Item 10.
Item 11. Controls and Procedures.
(a) The Registrant's principal executive and principal financial officers have concluded, based on their evaluation of the Registrant's disclosure controls and procedures as of a date within 90 days of the filing date of this report, that the Registrant's disclosure controls and procedures are reasonably designed to ensure that information required to be disclosed by the Registrant on Form N-CSR is recorded, processed, summarized and reported within the required time periods and that information required to be disclosed by the Registrant in the reports that it files or submits on Form N-CSR is accumulated and communicated to the Registrant's management, including its principal executive and principal financial officers, as appropriate to allow timely decisions regarding required disclosure.
(b) There were no changes to the Registrant's internal control over financial reporting that occurred during the second fiscal quarter of the period covered by this report that have materially affected, or are reasonably likely to materially affect, the Registrant's internal control over financial reporting.
Item 12. Exhibits.
(a)(1) Code of ethics referred to in Item 2.
(a)(2) Certifications of principal executive and principal financial officers as required by Rule 30a-2(a) under the Investment Company Act of 1940.
(a)(3) Not applicable.
(b) Certification of principal executive and principal financial officers as required by Rule 30a-2(b) under the Investment Company Act of 1940.
SIGNATURES
Pursuant to the requirements of the Securities Exchange Act of 1934 and the Investment Company Act of 1940, the Registrant has duly caused this Report to be signed on its behalf by the undersigned, thereunto duly authorized.
Dreyfus Investment Grade Funds, Inc.
By: /s/ Bradley J. Skapyak |
Bradley J. Skapyak, President |
Date: | Thursday, October 20, 2011 |
|
Pursuant to the requirements of the Securities Exchange Act of 1934 and the Investment Company Act of 1940, this Report has been signed below by the following persons on behalf of the Registrant and in the capacities and on the dates indicated. |
|
By: /s/ Bradley J. Skapyak |
Bradley J. Skapyak President |
Date: | Thursday, October 20, 2011 |
|
By: /s/ James Windels |
James Windels, Treasurer |
Date: | Thursday, October 20, 2011 |
|
EXHIBIT INDEX
(a)(1) Code of ethics referred to in Item 2.
(a)(2) Certifications of principal executive and principal financial officers as required by Rule 30a-2(a) under the Investment Company Act of 1940. (EX-99.CERT)
(b) Certification of principal executive and principal financial officers as required by Rule 30a-2(b) under the Investment Company Act of 1940. (EX-99.906CERT)
Exhibit (a)(1)
[INSERT CODE OF ETHICS]
Exhibit A
Persons Covered by the Code of Ethics
Bradley J. Skapyak | President | (Principal Executive Officer) |
| | |
James Windels | Treasurer | (Principal Financial and Accounting Officer) |
Revised as of January 1, 2010