UNITED STATES
SECURITIES AND EXCHANGE COMMISSION
Washington, D.C. 20549
FORM N-CSR
CERTIFIED SHAREHOLDER REPORT OF REGISTERED MANAGEMENT
INVESTMENT COMPANIES
Investment Company Act file number | 811- 6718 |
| |
| Dreyfus Investment Grade Funds, Inc. | |
| (Exact name of Registrant as specified in charter) | |
| | |
| c/o The Dreyfus Corporation 200 Park Avenue New York, New York 10166 | |
| (Address of principal executive offices) (Zip code) | |
| | |
| John Pak, Esq. 200 Park Avenue New York, New York 10166 | |
| (Name and address of agent for service) | |
|
Registrant's telephone number, including area code: | (212) 922-6000 |
| |
Date of fiscal year end: | 7/31 | |
Date of reporting period: | 7/31/13 | |
| | | | | | | |
FORM N-CSR
Item 1. Reports to Stockholders.
Save time. Save paper. View your next shareholder report online as soon as it’s available. Log into www.dreyfus.com and sign up for Dreyfus eCommunications. It’s simple and only takes a few minutes.
The views expressed in this report reflect those of the portfolio manager only through the end of the period covered and do not necessarily represent the views of Dreyfus or any other person in the Dreyfus organization. Any such views are subject to change at any time based upon market or other conditions and Dreyfus disclaims any responsibility to update such views.These views may not be relied on as investment advice and, because investment decisions for a Dreyfus fund are based on numerous factors, may not be relied on as an indication of trading intent on behalf of any Dreyfus fund.
| | Contents |
| | THE FUND |
| 2 | A Letter from the President |
| 3 | Discussion of Fund Performance |
| 6 | Fund Performance |
| 8 | Understanding Your Fund’s Expenses |
| 8 | Comparing Your Fund’s Expenses With Those of Other Funds |
| 9 | Statement of Investments |
| 10 | Statement of Assets and Liabilities |
| 11 | Statement of Operations |
| 12 | Statement of Changes in Net Assets |
| 14 | Financial Highlights |
| 17 | Notes to Financial Statements |
| 26 | Report of Independent Registered Public Accounting Firm |
| 27 | Important Tax Information |
| 28 | Information About the Renewal of the Fund’s Management Agreement |
| 33 | Board Members Information |
| 35 | Officers of the Fund |
| | FOR MORE INFORMATION |
| | Back Cover |
Dreyfus
Inflation Adjusted
Securities Fund
The Fund
A LETTER FROM THE PRESIDENT
Dear Shareholder:
We are pleased to present this annual report for Dreyfus Inflation Adjusted Securities Fund, covering the 12-month period from August 1, 2012, through July 31, 2013. For information about how the fund performed during the reporting period, as well as general market perspectives, we provide a Discussion of Fund Performance on the pages that follow.
After more than 30 years of declining interest rates, it appears that the secular bull market in bonds may be over. By early 2013, bond yields declined to levels that provided little room for further declines, making an upward trend more likely in the midst of a slow-but-sustained U.S. economic recovery. Indeed, improvements in U.S. housing and labor markets during the reporting period prompted the Federal Reserve Board (the “Fed”) to signal its intent to back away from its quantitative easing program later this year, a development that sparked heightened bond market volatility during the second quarter of 2013.
We expect the U.S. economic recovery to accelerate later this year in advance of a multi-year expansion. Pent-up demographic demand could support continued expansion in the housing market, and higher home equity levels may bolster consumer confidence and spending. In the bond market, the Fed’s widely anticipated shift to a more moderately stimulative monetary policy stance is likely to presage a multiyear upward drift in interest rates as the relationship between rates and economic conditions normalizes. While these developments may hurt some segments of the bond market, others could respond more favorably.Therefore, as always, we urge you to discuss our observations with your financial adviser.
Thank you for your continued confidence and support.
Sincerely,

J. Charles Cardona President The Dreyfus Corporation August 15, 2013
2
DISCUSSION OF FUND PERFORMANCE
For the period of August 1, 2012, through July 31, 2013, as provided by Robert Bayston, CFA, David Horsfall, CFA, and Nate Pearson, CFA, Portfolio Managers
Fund and Market Performance Overview
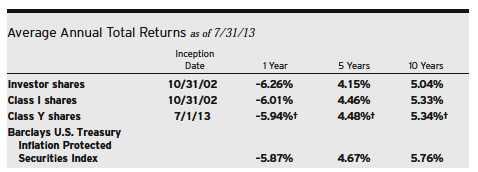
For the 12-month period ended July 31, 2013, Dreyfus Inflation Adjusted Securities Fund’s Class I1 shares produced a total return of –6.01%, Investor shares returned –6.26%, and Class Y shares returned .60.2 In comparison, the fund’s benchmark, the Barclays U.S.Treasury Inflation Protected Securities Index (the “Index”), produced a total return of –5.87% for the same period.3
Interest rates generally remained steady until late in the reporting period, when the U.S. bond market encountered heightened volatility in anticipation of a more moderately accommodative monetary policy from the Federal Reserve Board (the “Fed”). The fund produced lower returns than the Index, mainly due to fees and expenses that are part of the management of the fund but not included in the Index return.
The Fund’s Investment Approach
The fund seeks returns that exceed the rate of inflation.To pursue its goal, the fund normally invests at least 80% of its net assets, plus any borrowings for investment purposes, in inflation-indexed securities, which are fixed income securities designed to protect investors from a loss of value due to inflation by periodically adjusting their principal and/or coupon according to the rate of inflation.
The fund invests primarily in high-quality, U.S. dollar-denominated, inflation-indexed securities.To a limited extent, the fund may invest in foreign currency-denominated, inflation-protected securities and other fixed income securities not adjusted for inflation, which are rated investment grade or the unrated equivalent determined by Dreyfus.These other securities include U.S. government bonds and notes, corporate bonds, mortgage-related securities and asset-backed securities.The fund seeks to keep its average effective duration between two and 10 years, and the fund may invest in securities of any maturity without restriction.
The Fund 3
DISCUSSION OF FUND PERFORMANCE (continued)
Fed Comments Roiled Bond Market
Despite improving employment data and rebounding housing markets in a gradually recovering U.S. economy, yields of U.S. government securities remained near historical lows over much of the reporting period in light of an open-ended quantitative easing program from the Fed, which involved monthly purchases of $85 billion of U.S. government and agency mortgage-backed securities. At the same time, inflationary pressures remained muted in an environment of generally weak global economic growth and falling commodity prices. Uncertainty in advance of the U.S. presidential elections during the fall of 2012 and concerns regarding the impact of the “fiscal cliff” and sequestration also weighed on domestic investors’ economic and inflation expectations. Real yields generally declined in this slow growth, low inflation environment.
In the spring of 2013, investors began to anticipate higher intermediate- and long-term interest rates in the recovering economy, causing yields of U.S. government securities to climb and prices to fall.These worries intensified in late May, when remarks by Fed Chairman Ben Bernanke were interpreted as a signal that the central bank would back away from its ongoing quantitative easing program sooner than many analysts expected. Consequently, prices in most bond market sectors, including TIPS, fell sharply before stabilizing in July, contributing to negative absolute returns for the reporting period overall.
Duration and Allocation Strategies Dampened Fund Results
From August 2012 through April 2013, the fund mildly lagged the Index as we maintained a relatively defensive investment posture in light of widespread economic and political concerns. A relatively short average duration, including underweighted exposure to securities with maturities in the seven- to 10-year range, prevented the fund from participating more fully in the benefits of declining inflation-adjusted yields. In addition, our analysis showed that nominal U.S. Treasury securities were more attractively valued than TIPS with comparable maturities, prompting us to establish overweighted exposure to nominalTreasuries and an underweighted position in TIPS. This allocation strategy detracted mildly from performance in early 2013 when inflation expectations rose.
The fund’s relatively cautious duration and allocation strategies proved beneficial during bouts of heightened market volatility in the wake of the Fed’s hawkish comments. From late May through the reporting period’s end, a short average duration and underweighted exposure to TIPS helped to offset the fund’s previous underperformance.
4
Maintaining a Cautious Investment Posture
We currently expect bond market volatility to persist until investors see a greater degree of economic certainty. Expectations of a shift later this year to a less accommodative U.S. monetary policy have been tempered by disappointing economic data from overseas markets, leading some analysts to question the sustainability of the global recovery.
In addition, we believe that TIPS remain vulnerable to unexpected developments, including the possibility of surprises surrounding a nominee to replace Mr. Bernanke as Chairman of the Fed.Therefore, we have maintained the fund’s relatively cautious investment posture, including a short average duration and a mild emphasis on nominal U.S.Treasury securities over their inflation-protected counterparts.
August 15, 2013
Bond funds are subject generally to interest rate, credit, liquidity and market risks, to varying degrees, all of which are more fully described in the fund’s prospectus. Generally, all other factors being equal, bond prices are inversely related to interest-rate changes, and rate increases can cause price declines.
Interest payments on inflation-protected bonds will vary as the bond’s principal value is periodically adjusted based on the rate of inflation. If the index measuring inflation falls, the interest payable on these securities will be reduced.Any increase in the principal amount of an inflation-protected bond (which follows a rise in the relevant inflation index), will be considered taxable ordinary income, even though investors do not receive their principal until maturity. During periods of rising interest rates and flat or declining inflation rates, inflation-protected bonds can underperform. Inflation-protected bonds issued by corporations generally do not guarantee repayment of principal.
Investing internationally involves special risks, including changes in currency exchange rates, political, economic and social instability, a lack of comprehensive company information, differing auditing and legal standards, and less market liquidity. Investments in foreign currencies are subject to the risk that those currencies will decline in relative value to the U.S. dollar, or, in the case of hedged positions, that the U.S. dollar will decline relative to the currency being hedged. Each of these risks could increase the fund’s volatility.
The fund may use derivative instruments, such as options, futures and options on futures, forward contracts, swaps (including credit default swaps on corporate bonds and asset-backed securities), options on swaps and other credit derivatives.A small investment in derivatives could have a potentially large impact on the fund’s performance.The use of derivatives involves risks different from, or possibly greater than, the risks associated with investing directly in the underlying assets.
|
| 1 Effective July 1, 2013, Institutional shares of the fund were redesignated as Class I shares. |
| 2 Total return includes reinvestment of dividends and any capital gains paid. Past performance is no guarantee of future |
| results. Share price, yield and investment return fluctuate such that upon redemption, fund shares may be worth more |
| or less than their original cost.The total return figures presented for ClassY shares of the fund reflect the performance |
| as of 7/1/13 (the inception date for ClassY shares). |
| 3 SOURCE: LIPPER INC. — Reflects reinvestment of dividends and, where applicable, capital gain distributions. |
| The Barclays U.S.Treasury Inflation Protected Securities Index is a sub-index of the U.S.Treasury component of the |
| Barclays U.S. Government Index. Securities in the Barclays U.S.Treasury Inflation Protected Securities Index are |
| dollar-denominated, non-convertible, publicly issued, fixed-rate, investment-grade (Moody’s Baa3 or better) U.S. |
| Treasury inflation notes, with at least one year to final maturity and at least $100 million par amount outstanding. |
| Investors cannot invest directly in any index. |
The Fund 5
FUND PERFORMANCE
| |
| † | Source: Lipper Inc. |
| †† | The total return figures presented for Class Y shares of the fund reflect the performance of the fund’s Class I shares |
| | for the period prior to 7/1/13 (the inception date for Class Y shares). |
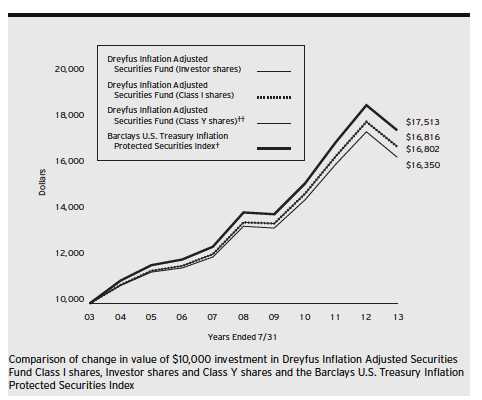
Past performance is not predictive of future performance.
The above graph compares a $10,000 investment made in each of the Investor, Class I and ClassY shares of Dreyfus Inflation Adjusted Securities Fund on 7/31/03 to a $10,000 investment made in the Barclays U.S.Treasury Inflation Protected Securities Index (the “Index”) on that date.All dividends and capital gain distributions are reinvested.
On April 18, 2013, the Board authorized the fund to redesignate Institutional shares to Class I shares effective July 1, 2013.
On April 18, 2013, the Board authorized the fund to offer ClassY shares, as a new class of shares, to certain investors, including certain institutional investors. On July 1, 2013, ClassY shares were offered at net asset value and are not subject to certain fees, including Distribution Plan and Shareholder Services Plan fees.
The fund’s performance shown in the line graph above takes into account all applicable fees and expenses on all classes. The Index is a sub-index of the U.S.Treasury component of the Barclays U.S. Government Index. Securities in the Index are dollar-denominated, non-convertible, publicly-issued, fixed-rate, investment-grade (Moody’s Baa3 or better) U.S.Treasury inflation notes, with at least one year to final maturity and at least $100 million par amount outstanding. Unlike a mutual fund, the Index is not subject to charges, fees and other expenses. Investors cannot invest directly in any index. Further information relating to fund performance, including expense reimbursements, if applicable, is contained in the Financial Highlights section of the prospectus and elsewhere in this report.
6
|
| Past performance is not predictive of future performance.The fund’s performance shown in the graph and table does not |
| reflect the deduction of taxes that a shareholder would pay on fund distributions or the redemption of fund shares. |
| † The total return performance figures presented for ClassY shares of the fund reflect the performance of the fund’s |
| Class I shares for the period prior to 7/1/13 (the inception date for ClassY shares). |
The Fund 7
UNDERSTANDING YOUR FUND’S EXPENSES (Unaudited)
As a mutual fund investor, you pay ongoing expenses, such as management fees and other expenses. Using the information below, you can estimate how these expenses affect your investment and compare them with the expenses of other funds.You also may pay one-time transaction expenses, including sales charges (loads) and redemption fees, which are not shown in this section and would have resulted in higher total expenses. For more information, see your fund’s prospectus or talk to your financial adviser.
Review your fund’s expenses
The table below shows the expenses you would have paid on a $1,000 investment in Dreyfus Inflation Adjusted Securities Fund from February 1, 2013 to July 31, 2013. It also shows how much a $1,000 investment would be worth at the close of the period, assuming actual returns and expenses.

COMPARING YOUR FUND’S EXPENSES
WITH THOSE OF OTHER FUNDS (Unaudited)
Using the SEC’s method to compare expenses
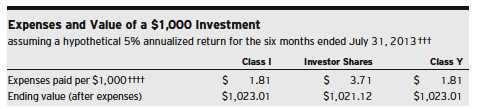
The Securities and Exchange Commission (SEC) has established guidelines to help investors assess fund expenses. Per these guidelines, the table below shows your fund’s expenses based on a $1,000 investment, assuming a hypothetical 5% annualized return. You can use this information to compare the ongoing expenses (but not transaction expenses or total cost) of investing in the fund with those of other funds.All mutual fund shareholder reports will provide this information to help you make this comparison. Please note that you cannot use this information to estimate your actual ending account balance and expenses paid during the period.
| |
| † | From July 1, 2013 (commencement of initial offering) to July 31, 2013 for ClassY shares. |
| †† | Expenses are equal to the fund’s annualized expense ratio of .36% for Class I and .74% for Investor Shares, |
| | multiplied by the average account value over the period, multiplied by 181/365 (to reflect the one-half year period). |
| | Expenses are equal to the fund’s annualized expense ratio of .36% for ClassY, multiplied by the average account |
| | value over the period, multiplied by 31/365 (to reflect the actual days in the period). |
| ††† | Please note that while ClassY shares commenced operations on July 1, 2013, the hypothetical expenses paid during |
| | the period reflect projected activity for the full six month period for purposes of comparability.This projection |
| | assumes that annualized expense ratios were in effect during the period February 1, 2013 to July 31, 2013. |
| †††† | Expenses are equal to the fund’s annualized expense ratio of .36% for Class I, .74% for Investor Shares and |
| | .36% for ClassY, multiplied by the average account value over the period, multiplied by 181/365 (to reflect the |
| | one-half year period). |
8
STATEMENT OF INVESTMENTS
July 31, 2013
| | | | |
| | Principal | | | |
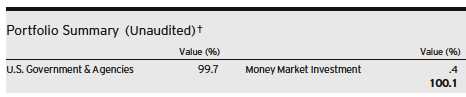
| Bonds and Notes—99.7% | Amount ($) | | Value ($) | |
| U.S. Treasury Inflation Protected Securities: | | | | |
| 0.13%, 4/15/16 | 18,388,254 | a,b | 18,970,794 | |
| 0.13%, 4/15/17 | 57,532,794 | a,b | 59,497,021 | |
| 0.13%, 1/15/22 | 50,382,038 | a,b | 49,899,882 | |
| 0.13%, 7/15/22 | 12,494,245 | b | 12,345,876 | |
| 0.13%, 1/15/23 | 13,225,319 | a,b | 12,904,500 | |
| 0.50%, 4/15/15 | 12,844,338 | a,b | 13,207,088 | |
| 0.63%, 7/15/21 | 23,656,586 | a,b | 24,694,330 | |
| 0.63%, 2/15/43 | 4,164,005 | a,b | 3,465,723 | |
| 1.75%, 1/15/28 | 3,691,375 | a,b | 4,144,576 | |
| 1.88%, 7/15/15 | 19,921,510 | b | 21,231,967 | |
| 2.00%, 1/15/26 | 15,192,123 | b | 17,603,279 | |
| 2.13% 1/15/19 | 31,728,485 | a,b | 36,135,762 | |
| 2.13%, 2/15/40 | 7,549,218 | b | 9,083,831 | |
| 2.13%, 2/15/41 | 11,429,027 | a,b | 13,774,652 | |
| 2.38%, 1/15/27 | 4,009,179 | b | 4,836,853 | |
| 2.50%, 1/15/29 | 9,623,240 | a,b | 11,864,031 | |
| 3.63%, 4/15/28 | 19,911,652 | a,b | 27,664,752 | |
| Total Bonds and Notes | | | | |
| (cost $346,449,266) | | | 341,324,917 | |
| | | | | |
| | | | | |
| Other Investment—.4% | Shares | | Value ($) | |
| Registered Investment Company; | | | | |
| Dreyfus Institutional Preferred | | | | |
| Plus Money Market Fund | | | | |
| (cost $1,195,354) | 1,195,354 | c | 1,195,354 | |
| | | | | |
| Total Investments (cost $347,644,620) | 100.1% | | 342,520,271 | |
| | | | | |
| Liabilities, Less Cash and Receivables | (.1%) | | (264,760 | ) |
| | | | | |
| Net Assets | 100.0% | | 342,255,511 | |
|
| a Security, or portion thereof, on loan.At July 31, 2013, the value of the fund’s securities on loan was $139,101,815 |
| and the value of the collateral held by the fund was $141,443,233, consisting of U.S. Government & Agency securities. |
| b Principal amount for accrual purposes is periodically adjusted based on changes in the Consumer Price Index. |
| c Investment in affiliated money market mutual fund. |
|
| † Based on net assets. |
| See notes to financial statements. |
The Fund 9
STATEMENT OF ASSETS AND LIABILITIES
July 31, 2013
| | | |
| | Cost | Value | |
| Assets ($): | | | |
| Investments in securities—See Statement of Investments (including | | | |
| securities on loan, valued at $139,101,815)—Note 1(b): | | | |
| Unaffiliated issuers | 346,449,266 | 341,324,917 | |
| Affiliated issuers | 1,195,354 | 1,195,354 | |
| Receivable for investment securities sold | | 19,656,995 | |
| Dividends, interest and securities lending income receivable | | 557,593 | |
| Receivable for shares of Common Stock subscribed | | 88,494 | |
| Prepaid expenses | | 25,289 | |
| | | 362,848,642 | |
| Liabilities ($): | | | |
| Due to The Dreyfus Corporation and affiliates—Note 3(b) | | 114,003 | |
| Cash overdraft due to Custodian | | 305,295 | |
| Payable for investment securities purchased | | 19,681,535 | |
| Payable for shares of Common Stock redeemed | | 411,493 | |
| Accrued expenses | | 80,805 | |
| | | 20,593,131 | |
| Net Assets ($) | | 342,255,511 | |
| Composition of Net Assets ($): | | | |
| Paid-in capital | | 351,623,531 | |
| Accumulated undistributed investment income—net | | 824,164 | |
| Accumulated net realized gain (loss) on investments | | (5,067,835 | ) |
| Accumulated net unrealized appreciation | | | |
| (depreciation) on investments | | (5,124,349 | ) |
| Net Assets ($) | | 342,255,511 | |
| | | |
| Net Asset Value Per Share | | | |
| | Class I | Investor Shares | Class Y |
| Net Assets ($) | 305,695,256 | 36,559,251 | 1,004 |
| Shares Outstanding | 23,873,711 | 2,853,901 | 78.4 |
| Net Asset Value Per Share ($) | 12.80 | 12.81 | 12.81 |
|
| See notes to financial statements. |
10
STATEMENT OF OPERATIONS
Year Ended July 31, 2013
| | |
| Investment Income ($): | | |
| Income: | | |
| Interest | 8,279,478 | |
| Income from securities lending—Note 1(b) | 83,910 | |
| Dividends; | | |
| Affiliated issuers | 1,816 | |
| Total Income | 8,365,204 | |
| Expenses: | | |
| Management fee—Note 3(a) | 1,141,102 | |
| Shareholder servicing costs—Note 3(b) | 220,454 | |
| Professional fees | 70,101 | |
| Registration fees | 45,633 | |
| Custodian fees—Note 3(b) | 30,154 | |
| Prospectus and shareholders’ reports | 27,101 | |
| Directors’ fees and expenses—Note 3(c) | 13,103 | |
| Loan commitment fees—Note 2 | 3,609 | |
| Miscellaneous | 22,748 | |
| Total Expenses | 1,574,005 | |
| Less—reduction in fees due to earnings credits—Note 3(b) | (109 | ) |
| Net Expenses | 1,573,896 | |
| Investment Income—Net | 6,791,308 | |
| Realized and Unrealized Gain (Loss) on Investments—Note 4 ($): | | |
| Net realized gain (loss) on investments | 3,715,512 | |
| Net unrealized appreciation (depreciation) on investments | (33,604,926 | ) |
| Net Realized and Unrealized Gain (Loss) on Investments | (29,889,414 | ) |
| Net (Decrease) in Net Assets Resulting from Operations | (23,098,106 | ) |
|
| See notes to financial statements. |
The Fund 11
STATEMENT OF CHANGES IN NET ASSETS
| | | | |
| | | | Year Ended July 31, | |
| | 2013 | a | 2012 | |
| Operations ($): | | | | |
| Investment income—net | 6,791,308 | | 7,441,736 | |
| Net realized gain (loss) on investments | 3,715,512 | | 7,452,085 | |
| Net unrealized appreciation | | | | |
| (depreciation) on investments | (33,604,926 | ) | 12,400,455 | |
| Net Increase (Decrease) in Net Assets | | | | |
| Resulting from Operations | (23,098,106 | ) | 27,294,276 | |
| Dividends to Shareholders from ($): | | | | |
| Investment income—net: | | | | |
| Class I Shares | (6,459,592 | ) | (6,763,300 | ) |
| Investor Shares | (882,942 | ) | (1,234,033 | ) |
| Class Y Shares | (2 | ) | — | |
| Net realized gain on investments: | | | | |
| Class I Shares | (12,305,261 | ) | (2,140,902 | ) |
| Investor Shares | (2,160,396 | ) | (461,245 | ) |
| Total Dividends | (21,808,193 | ) | (10,599,480 | ) |
| Capital Stock Transactions ($): | | | | |
| Net proceeds from shares sold: | | | | |
| Class I Shares | 120,651,016 | | 143,727,438 | |
| Investor Shares | 10,077,854 | | 28,541,270 | |
| Class Y Shares | 1,000 | | — | |
| Dividends reinvested: | | | | |
| Class I Shares | 9,413,116 | | 3,370,949 | |
| Investor Shares | 2,858,557 | | 1,616,217 | |
| Cost of shares redeemed: | | | | |
| Class I Shares | (94,162,287 | ) | (58,631,848 | ) |
| Investor Shares | (33,707,106 | ) | (16,458,174 | ) |
| Increase (Decrease) in Net Assets | | | | |
| from Capital Stock Transactions | 15,132,150 | | 102,165,852 | |
| Total Increase (Decrease) in Net Assets | (29,774,149 | ) | 118,860,648 | |
| Net Assets ($): | | | | |
| Beginning of Period | 372,029,660 | | 253,169,012 | |
| End of Period | 342,255,511 | | 372,029,660 | |
| Undistributed investment income—net | 824,164 | | 1,326,452 | |
12
| | | | |
| | | | Year Ended July 31, | |
| | 2013 | a | 2012 | |
| Capital Share Transactions: | | | | |
| Class I Shares | | | | |
| Shares sold | 8,679,188 | | 10,263,235 | |
| Shares issued for dividends reinvested | 678,344 | | 240,615 | |
| Shares redeemed | (6,917,561 | ) | (4,183,087 | ) |
| Net Increase (Decrease) in Shares Outstanding | 2,439,971 | | 6,320,763 | |
| Investor Shares | | | | |
| Shares sold | 719,000 | | 2,034,250 | |
| Shares issued for dividends reinvested | 205,256 | | 115,336 | |
| Shares redeemed | (2,442,630 | ) | (1,174,295 | ) |
| Net Increase (Decrease) in Shares Outstanding | (1,518,374 | ) | 975,291 | |
| Class Y | | | | |
| Shares sold | 78.4 | | — | |
| |
| a | Effective July 1, 2013, the existing Institutional shares were redesignated as Class I shares and the fund commenced |
| | offering ClassY shares. |
| See notes to financial statements. |
The Fund 13
FINANCIAL HIGHLIGHTS
The following tables describe the performance for each share class for the fiscal periods indicated.All information (except portfolio turnover rate) reflects financial results for a single fund share.Total return shows how much your investment in the fund would have increased (or decreased) during each period, assuming you had reinvested all dividends and distributions.These figures have been derived from the fund’s financial statements.
| | | | | | | | | | |
| | | | Year Ended July 31, | | | |
| Class I Shares | 2013 | a | 2012 | | 2011 | | 2010 | | 2009 | |
| Per Share Data ($): | | | | | | | | | | |
| Net asset value, beginning of period | 14.42 | | 13.68 | | 12.83 | | 11.97 | | 12.30 | |
| Investment Operations: | | | | | | | | | | |
| Investment income—netb | .26 | | .34 | | .62 | | .37 | | .11 | |
| Net realized and unrealized | | | | | | | | | | |
| gain (loss) on investments | (1.07 | ) | .89 | | .76 | | .77 | | (.15 | ) |
| Total from Investment Operations | (.81 | ) | 1.23 | | 1.38 | | 1.14 | | (.04 | ) |
| Distributions: | | | | | | | | | | |
| Dividends from investment income—net | (.28 | ) | (.37 | ) | (.50 | ) | (.28 | ) | (.19 | ) |
| Dividends from net realized | | | | | | | | | | |
| gain on investments | (.53 | ) | (.12 | ) | (.03 | ) | — | | (.10 | ) |
| Total Distributions | (.81 | ) | (.49 | ) | (.53 | ) | (.28 | ) | (.29 | ) |
| Net asset value, end of period | 12.80 | | 14.42 | | 13.68 | | 12.83 | | 11.97 | |
| Total Return (%) | (6.01 | ) | 9.16 | | 10.95 | | 9.58 | | (.30 | ) |
| Ratios/Supplemental Data (%): | | | | | | | | | | |
| Ratio of total expenses | | | | | | | | | | |
| to average net assets | .37 | | .37 | | .40 | | .44 | | .55 | |
| Ratio of net expenses | | | | | | | | | | |
| to average net assets | .37 | | .37 | | .40 | | .42 | | .30 | |
| Ratio of net investment income | | | | | | | | | | |
| to average net assets | 1.85 | | 2.45 | | 4.71 | | 2.97 | | .98 | |
| Portfolio Turnover Rate | 131.32 | | 97.40 | | 138.50 | | 61.50 | | 77.13 | |
| Net Assets, end of period ($ x 1,000) | 305,695 | | 308,977 | | 206,693 | | 105,864 | | 24,577 | |
| |
| a | Effective July 1, 2013, the existing Institutional shares were redesignated as Class I shares. |
| b | Based on average shares outstanding at each month end. |
| See notes to financial statements. |
14
| | | | | | | | | | |
| | | | Year Ended July 31, | | | |
| Investor Shares | 2013 | | 2012 | | 2011 | | 2010 | | 2009 | |
| Per Share Data ($): | | | | | | | | | | |
| Net asset value, beginning of period | 14.42 | | 13.68 | | 12.83 | | 11.98 | | 12.30 | |
| Investment Operations: | | | | | | | | | | |
| Investment income—neta | .20 | | .29 | | .51 | | .33 | | .08 | |
| Net realized and unrealized | | | | | | | | | | |
| gain (loss) on investments | (1.05 | ) | .89 | | .82 | | .76 | | (.14 | ) |
| Total from Investment Operations | (.85 | ) | 1.18 | | 1.33 | | 1.09 | | (.06 | ) |
| Distributions: | | | | | | | | | | |
| Dividends from investment income—net | (.23 | ) | (.32 | ) | (.45 | ) | (.24 | ) | (.16 | ) |
| Dividends from net realized | | | | | | | | | | |
| gain on investments | (.53 | ) | (.12 | ) | (.03 | ) | — | | (.10 | ) |
| Total Distributions | (.76 | ) | (.44 | ) | (.48 | ) | (.24 | ) | (.26 | ) |
| Net asset value, end of period | 12.81 | | 14.42 | | 13.68 | | 12.83 | | 11.98 | |
| Total Return (%) | (6.26 | ) | 8.80 | | 10.60 | | 9.23 | | (.54 | ) |
| Ratios/Supplemental Data (%): | | | | | | | | | | |
| Ratio of total expenses | | | | | | | | | | |
| to average net assets | .70 | | .70 | | .73 | | .79 | | .87 | |
| Ratio of net expenses | | | | | | | | | | |
| to average net assets | .70 | | .70 | | .73 | | .71 | | .55 | |
| Ratio of net investment income | | | | | | | | | | |
| to average net assets | 1.40 | | 2.05 | | 3.90 | | 2.63 | | .73 | |
| Portfolio Turnover Rate | 131.32 | | 97.40 | | 138.50 | | 61.50 | | 77.13 | |
| Net Assets, end of period ($ x 1,000) | 36,559 | | 63,053 | | 46,476 | | 42,846 | | 40,557 | |
|
| a Based on average shares outstanding at each month end. |
| See notes to financial statements. |
The Fund 15
FINANCIAL HIGHLIGHTS (continued)
| | |
| | Period Ended | |
| Class Y Shares | July 31, 2013a | |
| Per Share Data ($): | | |
| Net asset value, beginning of period | 12.76 | |
| Investment Operations: | | |
| Investment income—netb | .03 | |
| Net realized and unrealized | | |
| gain (loss) on investments | .05 | |
| Total from Investment Operations | .08 | |
| Distributions: | | |
| Dividends from investment income—net | (.03 | ) |
| Net asset value, end of period | 12.81 | |
| Total Return (%)c | .60 | |
| Ratios/Supplemental Data (%): | | |
| Ratio of total expenses to average net assetsd | .36 | |
| Ratio of net expenses to average net assetsd | .36 | |
| Ratio of net investment income | | |
| to average net assetsd | 2.36 | |
| Portfolio Turnover Rate | 131.32 | |
| Net Assets, end of period ($ x 1,000) | 1 | |
| |
| a | From July 1, 2013 (commencement of initial offering) to July 31, 2013. |
| b | Based on average shares outstanding. |
| c | Not annualized. |
| d | Annualized. |
| See notes to financial statements. |
16
NOTES TO FINANCIAL STATEMENTS
NOTE 1—Significant Accounting Policies:
Dreyfus Inflation Adjusted Securities Fund (the “fund”) is a separate diversified series of Dreyfus Investment Grade Funds, Inc. (the “Company”), which is registered under the Investment Company Act of 1940, as amended (the “Act”), as an open-end management investment company and operates as a series company currently offering three series, including the fund.The fund’s investment objective is to seek returns that exceed the rate of inflation.The Dreyfus Corporation (the “Manager” or “Dreyfus”), a wholly-owned subsidiary of The Bank of New York Mellon Corporation (“BNY Mellon”), serves as the fund’s investment adviser.
At a meeting held on April 18, 2013, the Company’s Board of Directors (the “Board”) approved, effective July 1, 2013: (a) for the fund to offer Class Y shares; (b) redesignation of Institutional shares as Class I shares; and, (c) an increase in the authorized shares of the fund from 1 billion to 1.1 billion and authorized 100 million ClassY shares.
MBSC Securities Corporation (the “Distributor”), a wholly-owned subsidiary of the Manager, is the distributor of the fund’s shares, which are sold to the public without a sales charge.The fund is authorized to issue 1.1 billion shares of $.001 par value Common Stock. The fund currently offers three classes of shares: Class I (500 million shares authorized), Investor (500 million shares authorized) and ClassY (100 million shares authorized). Class I shares are sold at net asset value per share only to institutional investors. Investor Shares are subject to a Shareholder Services Plan fee. ClassY shares are sold at net asset value per share to certain investors, including certain institutional investors. Other differences between the classes include the services offered to and the expenses borne by each class, the allocation of certain transfer agency costs and certain voting rights. Income, expenses (other than expenses attributable to a specific class), and realized and unrealized gains or losses on investments are allocated to each class of shares based on its relative net assets.
The Fund 17
NOTES TO FINANCIAL STATEMENTS (continued)
As of July 31, 2013, MBC Investments Corp., an indirect subsidiary of BNY Mellon, held all of the outstanding Class Y shares of the fund.
The Company accounts separately for the assets, liabilities and operations of each series. Expenses directly attributable to each series are charged to that series’ operations; expenses which are applicable to all series are allocated among them on a pro rata basis.
The Financial Accounting Standards Board (“FASB”) Accounting Standards Codification is the exclusive reference of authoritative U.S. generally accepted accounting principles (“GAAP”) recognized by the FASB to be applied by nongovernmental entities. Rules and interpretive releases of the Securities and Exchange Commission (“SEC”) under authority of federal laws are also sources of authoritative GAAP for SEC registrants. The fund’s financial statements are prepared in accordance with GAAP, which may require the use of management estimates and assumptions.Actual results could differ from those estimates.
The Company enters into contracts that contain a variety of indemnifications.The fund’s maximum exposure under these arrangements is unknown.The fund does not anticipate recognizing any loss related to these arrangements.
(a) Portfolio valuation: The fair value of a financial instrument is the amount that would be received to sell an asset or paid to transfer a liability in an orderly transaction between market participants at the measurement date (i.e., the exit price). GAAP establishes a fair value hierarchy that prioritizes the inputs of valuation techniques used to measure fair value.This hierarchy gives the highest priority to unadjusted quoted prices in active markets for identical assets or liabilities (Level 1 measurements) and the lowest priority to unobservable inputs (Level 3 measurements).
Additionally, GAAP provides guidance on determining whether the volume and activity in a market has decreased significantly and whether such a decrease in activity results in transactions that are not orderly. GAAP requires enhanced disclosures around valuation inputs and techniques used during annual and interim periods.
18
Various inputs are used in determining the value of the fund’s investments relating to fair value measurements.These inputs are summarized in the three broad levels listed below:
Level 1—unadjusted quoted prices in active markets for identical investments.
Level 2—other significant observable inputs (including quoted prices for similar investments, interest rates, prepayment speeds, credit risk, etc.).
Level 3—significant unobservable inputs (including the fund’s own assumptions in determining the fair value of investments).
The inputs or methodology used for valuing securities are not necessarily an indication of the risk associated with investing in those securities.
Changes in valuation techniques may result in transfers in or out of an assigned level within the disclosure hierarchy. Valuation techniques used to value the fund’s investments are as follows:
Registered investment companies that are not traded on an exchange are valued at their net asset value and are categorized within Level 1 of the fair value hierarchy.
Investments in securities, excluding short-term investments (other than U.S. Treasury Bills) are valued each business day by an independent pricing service (the “Service”) approved by the Board. Investments for which quoted bid prices are readily available and are representative of the bid side of the market in the judgment of the Service are valued at the mean between the quoted bid prices (as obtained by the Service from dealers in such securities) and asked prices (as calculated by the Service based upon its evaluation of the market for such securities). Other investments (which constitute a majority of the portfolio securities) are valued as determined by the Service, based on methods which include consideration of the following: yields or prices of securities of comparable quality, coupon, maturity and type; indications as to values from dealers; and general market conditions.These securities are generally categorized within Level 2 of the fair value hierarchy.
The Fund 19
NOTES TO FINANCIAL STATEMENTS (continued)
The Service’s procedures are reviewed by Dreyfus under the general supervision of the Board.
When market quotations or official closing prices are not readily available, or are determined not to reflect accurately fair value, such as when the value of a security has been significantly affected by events after the close of the exchange or market on which the security is principally traded (for example, a foreign exchange or market), but before the fund calculates its net asset value, the fund may value these investments at fair value as determined in accordance with the procedures approved by the Board. Certain factors may be considered when fair valuing investments such as: fundamental analytical data, the nature and duration of restrictions on disposition, an evaluation of the forces that influence the market in which the securities are purchased and sold, and public trading in similar securities of the issuer or comparable issuers.These securities are either categorized within Level 2 or 3 of the fair value hierarchy depending on the relevant inputs used.
For restricted securities where observable inputs are limited, assumptions about market activity and risk are used and are categorized within Level 3 of the fair value hierarchy.
The following is a summary of the inputs used as of July 31, 2013 in valuing the fund’s investments:
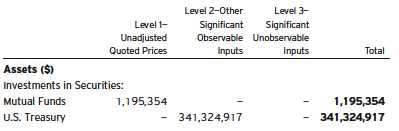
At July 31, 2013, there were no transfers between Level 1 and Level 2 of the fair value hierarchy.
(b) Securities transactions and investment income: Securities transactions are recorded on a trade date basis. Realized gains and losses from securities transactions are recorded on the identified cost basis.
20
Dividend income is recognized on the ex-dividend date and interest income, including, where applicable, accretion of discount and amortization of premium on investments, is recognized on the accrual basis.
Pursuant to a securities lending agreement with The Bank of New York Mellon, a subsidiary of BNY Mellon and an affiliate of Dreyfus, the fund may lend securities to qualified institutions. It is the fund’s policy that, at origination, all loans are secured by collateral of at least 102% of the value of U.S. securities loaned and 105% of the value of foreign securities loaned. Collateral equivalent to at least 100% of the market value of securities on loan is maintained at all times. Collateral is either in the form of cash, which can be invested in certain money market mutual funds managed by the Manager or U.S. Government and Agency securities. The fund is entitled to receive all dividends, interest and distributions on securities loaned, in addition to income earned as a result of the lending transaction. Should a borrower fail to return the securities in a timely manner, The Bank of New York Mellon is required to replace the securities for the benefit of the fund or credit the fund with the market value of the unreturned securities and is subrogated to the fund’s rights against the borrower and the collateral. During the period ended July 31, 2013,The Bank of New York Mellon earned $45,182 from lending portfolio securities, pursuant to the securities lending agreement.
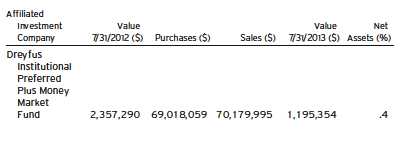
(c) Affiliated issuers: Investments in other investment companies advised by Dreyfus are defined as “affiliated” under the Act. Investments in affiliated investment companies during the period ended July 31, 2013 were as follows:
The Fund 21
NOTES TO FINANCIAL STATEMENTS (continued)
(d) Dividends to shareholders: It is the policy of the fund to declare dividends daily from investment income-net. Such dividends are paid monthly. Dividends from net realized capital gains, if any, are normally declared and paid annually, but the fund may make distributions on a more frequent basis to comply with the distribution requirements of the Internal Revenue Code of 1986, as amended (the “Code”).To the extent that net realized capital gains can be offset by capital loss carryovers, it is the policy of the fund not to distribute such gains. Income and capital gain distributions are determined in accordance with income tax regulations, which may differ from GAAP.
(e) Federal income taxes: It is the policy of the fund to continue to qualify as a regulated investment company, if such qualification is in the best interests of its shareholders, by complying with the applicable provisions of the Code, and to make distributions of taxable income sufficient to relieve it from substantially all federal income and excise taxes.
As of and during the period ended July 31, 2013, the fund did not have any liabilities for any uncertain tax positions.The fund recognizes interest and penalties, if any, related to uncertain tax positions as income tax expense in the Statement of Operations. During the period, the fund did not incur any interest or penalties.
Each tax year in the four-year period ended July 31, 2013 remains subject to examination by the Internal Revenue Service and state taxing authorities.
At July 31, 2013, the components of accumulated earnings on a tax basis were as follows: undistributed ordinary income $824,164 and unrealized depreciation $6,062,391. In addition, the fund had $4,129,793 of capital losses realized after October 31, 2012, which were deferred for tax purposes to the first day of the following fiscal year.
The tax character of distributions paid to shareholders during the fiscal periods ended July 31, 2013 and July 31, 2012 were as follows: ordinary income $10,714,597 and $9,811,278 and long-term capital gains $11,093,596 and $788,202, respectively.
22
During the period ended July 31, 2013, as a result of permanent book to tax differences, primarily due to the tax treatment for treasury inflation-protected securities and dividend reclassification, the fund increased accumulated undistributed investment income-net by $48,940 and decreased accumulated net realized gain (loss) on investments by the same amount. Net assets and net asset value per share were not affected by this reclassification.
NOTE 2—Bank Lines of Credit:
The fund participates with other Dreyfus-managed funds in a $210 million unsecured credit facility led by Citibank, N.A. and a $300 million unsecured credit facility provided by The Bank of New York Mellon (each, a “Facility”), each to be utilized primarily for temporary or emergency purposes, including the financing of redemptions. Prior to October 10, 2012, the unsecured credit facility with Citibank, N.A. was $225 million. In connection therewith, the fund has agreed to pay its pro rata portion of commitment fees for each Facility. Interest is charged to the fund based on rates determined pursuant to the terms of the respective Facility at the time of borrowing. During the period ended July 31, 2013, the fund did not borrow under the Facilities.
NOTE 3—Management Fee and Other Transactions With Affiliates:
(a) Pursuant to a management agreement with the Manager, the management fee is computed at the annual rate of .30% of the value of the fund’s average daily net assets and is payable monthly.
(b) Under the Shareholder Services Plan, Investor shares pay the Distributor at an annual rate of .25% of the value of its average daily net assets for the provision of certain services.The services provided may include personal services relating to shareholder accounts, such as answering shareholder inquiries regarding the fund and providing reports and other information, and services related to the maintenance of shareholder accounts. The Distributor may make payments
The Fund 23
NOTES TO FINANCIAL STATEMENTS (continued)
to Service Agents (securities dealers, financial institutions or other industry professionals) with respect to these services.The Distributor determines the amounts to be paid to Service Agents. During the period ended July 31, 2013, Investor Shares were charged $130,326 pursuant to the Shareholder Services Plan.
The fund has arrangements with the transfer agent and the custodian whereby the fund may receive earnings credits when positive cash balances are maintained, which are used to offset transfer agency and custody fees. For financial reporting purposes, the fund includes net earnings credits as an expense offset in the Statement of Operations.
The fund compensates Dreyfus Transfer, Inc., a wholly-owned subsidiary of the Manager, under a transfer agency agreement for providing transfer agency services for the fund and cash management services related to fund subscriptions and redemptions. During the period ended July 31, 2013, the fund was charged $33,446 for transfer agency services and $799 for cash management services. Cash management fees were partially offset by earnings credits of $104.These fees are included in Shareholder servicing costs in the Statement of Operations.
The fund compensatesThe Bank of NewYork Mellon under a custody agreement for providing custodial services for the fund. During the period ended July 31, 2013, the fund was charged $30,154 pursuant to the custody agreement.
The fund compensates The Bank of New York Mellon under a cash management agreement for performing certain cash management services related to fund subscriptions and redemptions. During the period ended July 31, 2013, the fund was charged $477 pursuant to the cash management agreement, which is included in Shareholder servicing costs in the Statement of Operations.These fees were partially offset by earnings credits of $5.
24
During the period ended July 31, 2013, the fund was charged $8,892 for services performed by the Chief Compliance Officer and his staff.
The components of “Due to The Dreyfus Corporation and affiliates” in the Statement of Assets and Liabilities consist of: management fees $88,298, Shareholder Services Plan fees $7,941, custodian fees $7,588, Chief Compliance Officer fees $5,420 and transfer agency fees $4,756.
(c) Each Board member also serves as a Board member of other funds within the Dreyfus complex. Annual retainer fees and attendance fees are allocated to each fund based on net assets.
NOTE 4—Securities Transactions:
The aggregate amount of purchases and sales of investment securities, excluding short-term securities, during the period ended July 31, 2013, amounted to $496,065,947 and $494,235,633, respectively.
At July 31, 2013, the cost of investments for federal income tax purposes was $348,582,662; accordingly, accumulated net unrealized depreciation on investments was $6,062,391, consisting of $5,336,255 gross unrealized appreciation and $11,398,646 gross unrealized depreciation.
The Fund 25
REPORT OF INDEPENDENT REGISTERED
PUBLIC ACCOUNTING FIRM
Shareholders and Board of Directors
Dreyfus Inflation Adjusted Securities Fund
We have audited the accompanying statement of assets and liabilities, including the statement of investments, of Dreyfus Inflation Adjusted Securities Fund (one of the series comprising Dreyfus Investment Grade Funds, Inc.) as of July 31, 2013, and the related statement of operations for the year then ended, the statement of changes in net assets for each of the two years in the period then ended, and the financial highlights for each of the periods indicated therein. These financial statements and financial highlights are the responsibility of the Fund’s management. Our responsibility is to express an opinion on these financial statements and financial highlights based on our audits.
We conducted our audits in accordance with the standards of the Public Company Accounting Oversight Board (United States).Those standards require that we plan and perform the audit to obtain reasonable assurance about whether the financial statements and financial highlights are free of material misstatement.We were not engaged to perform an audit of the Fund’s internal control over financial reporting. Our audits included consideration of internal control over financial reporting as a basis for designing audit procedures that are appropriate in the circumstances, but not for the purpose of expressing an opinion on the effectiveness of the Fund’s internal control over financial reporting. Accordingly, we express no such opinion.An audit also includes examining, on a test basis, evidence supporting the amounts and disclosures in the financial statements and financial highlights, assessing the accounting principles used and significant estimates made by management, and evaluating the overall financial statement presentation. Our procedures included confirmation of securities owned as of July 31, 2013 by correspondence with the custodian and others. We believe that our audits provide a reasonable basis for our opinion.
In our opinion, the financial statements and financial highlights referred to above present fairly, in all material respects, the financial position of Dreyfus Inflation Adjusted Securities Fund at July 31, 2013, the results of its operations for the year then ended, the changes in its net assets for each of the two years in the period then ended, and the financial highlights for each of the indicated periods, in conformity with U.S. generally accepted accounting principles.

New York, New York September 26, 2013
26
IMPORTANT TAX INFORMATION (Unaudited)
For federal tax purposes, the fund hereby reports 100% of ordinary income dividends paid during the fiscal year ended July 31, 2013 as qualifying “interest-related dividends.” Also for state individual income tax purposes, the fund hereby reports 100% of the ordinary income dividends paid during its fiscal year ended July 31, 2013 as attributable to interest income from direct obligations of the United States. Such dividends are currently exempt from taxation for individual income tax purposes in most states, including New York, California, Connecticut and the District of Columbia.Also, the fund hereby reports $.1232 per share as a short-term capital gain distribution and $.4057 per share as a long-term capital gain distribution paid on December 20, 2012.
The Fund 27
INFORMATION ABOUT THE RENEWAL OF THE
FUND’S MANAGEMENT AGREEMENT (Unaudited)
At a meeting of the fund’s Board of Directors held on July 17 and 18, 2013, the Board considered the renewal of the fund’s Management Agreement pursuant to which Dreyfus provides the fund with investment advisory and administrative services (the “Agreement”). The Board members, a majority of whom are not “interested persons” (as defined in the Investment Company Act of 1940, as amended) of the fund, were assisted in their review by independent legal counsel and met with counsel in executive session separate from Dreyfus representatives. In considering the renewal of the Agreement, the Board considered all factors that it believed to be relevant, including those discussed below. The Board did not identify any one factor as dispositive, and each Board member may have attributed different weights to the factors considered.
Analysis of Nature, Extent, and Quality of Services Provided to the Fund. The Board considered information provided to them at the meeting and in previous presentations from Dreyfus representatives regarding the nature, extent, and quality of the services provided to funds in the Dreyfus fund complex. Dreyfus provided the number of open accounts in the fund, the fund’s asset size and the allocation of fund assets among distribution channels. Dreyfus also had previously provided information regarding the diverse intermediary relationships and distribution channels of funds in the Dreyfus fund complex (such as retail direct or intermediary, in which intermediaries typically are paid by the fund and/or Dreyfus) and Dreyfus’ corresponding need for broad, deep, and diverse resources to be able to provide ongoing shareholder services to each intermediary or distribution channel, as applicable to the fund.
The Board also considered research support available to, and portfolio management capabilities of, the fund’s portfolio management personnel and that Dreyfus also provides oversight of day-to-day fund operations, including fund accounting and administration and assistance in meeting legal and regulatory requirements.The Board also considered Dreyfus’ extensive administrative, accounting, and compliance infrastructures.
28
Comparative Analysis of the Fund’s Performance and Management Fee and Expense Ratio. The Board reviewed reports prepared by Lipper, Inc. (“Lipper”), an independent provider of investment company data, which included information comparing (1) the fund’s performance with the performance of a group of comparable funds (the “Performance Group”) and with a broader group of funds (the “Performance Universe”), all for various periods ended May 31, 2013, and (2) the fund’s actual and contractual management fees and total expenses with those of a group of comparable funds (the “Expense Group”) and with a broader group of funds (the “Expense Universe”), the information for which was derived in part from fund financial statements available to Lipper as of the date of its analysis. Dreyfus previously had furnished the Board with a description of the methodology Lipper used to select the Performance Group and Performance Universe and the Expense Group and Expense Universe.
Dreyfus representatives stated that the usefulness of performance comparisons may be affected by a number of factors, including different investment limitations that may be applicable to the fund and comparison funds.They also noted that performance generally should be considered over longer periods of time, although it is possible that long-term performance can be adversely affected by even one period of significant underperformance so that a single investment decision or theme has the ability to affect disproportionately long-term performance. The Board discussed the results of the comparisons and noted that the fund’s total return performance was below the Performance Group median for the various periods, except for the four- and five-year periods when the fund’s performance was at the Performance Group median, and below the Performance Universe median for the various periods, except for the two- and five-year periods when the fund’s performance was above the Performance Universe median.The Board also noted that the fund’s yield performance was above the Performance Group and Performance
The Fund 29
INFORMATION ABOUT THE RENEWAL OF THE FUND’S
MANAGEMENT AGREEMENT (Unaudited) (continued)
Universe medians for eight of the ten one-year periods ended May 31st (including being the higher of only two funds in the Performance Group for three of the ten years). Dreyfus also provided a comparison of the fund’s calendar year total returns to the returns of the fund’s benchmark index.
The Board also reviewed the range of actual and contractual management fees and total expenses of the Expense Group and Expense Universe funds and discussed the results of the comparisons.The Board noted that the fund’s contractual management fee was below the Expense Group median, the fund’s actual management fee was at the Expense Group median and above the Expense Universe median and the fund’s total expenses were at the Expense Group median and above the Expense Universe median.
Dreyfus representatives reviewed with the Board the management or investment advisory fees (1) paid by funds advised or administered by Dreyfus that are in the same Lipper category as the fund and (2) paid to Dreyfus or the Dreyfus-affiliated primary employer of the fund’s primary portfolio manager(s) for advising any separate accounts and/or other types of client portfolios that are considered to have similar investment strategies and policies as the fund (the “Similar Clients”), and explained the nature of the Similar Clients.They discussed differences in fees paid and the relationship of the fees paid in light of any differences in the services provided and other relevant factors. The Board considered the relevance of the fee information provided for the Similar Clients to evaluate the appropriateness and reasonableness of the fund’s management fee.
Analysis of Profitability and Economies of Scale. Dreyfus representatives reviewed the expenses allocated and profit received by Dreyfus and the resulting profitability percentage for managing the fund and the aggregate profitability percentage to Dreyfus of managing the funds in the Dreyfus fund complex, and the method used to determine
30
the expenses and profit. The Board concluded that the profitability results were not unreasonable, given the services rendered and service levels provided by Dreyfus. The Board also had been provided with information prepared by an independent consulting firm regarding Dreyfus’ approach to allocating costs to, and determining the profitability of, individual funds and the entire Dreyfus fund complex.The consulting firm also had analyzed where any economies of scale might emerge in connection with the management of a fund.
The Board considered on the advice of its counsel the profitability analysis (1) as part of its evaluation of whether the fees under the Agreement bear a reasonable relationship to the mix of services provided by Dreyfus, including the nature, extent and quality of such services, and (2) in light of the relevant circumstances for the fund and the extent to which economies of scale would be realized if the fund grows and whether fee levels reflect these economies of scale for the benefit of fund shareholders. Dreyfus representatives noted that a discussion of economies of scale is predicated on a fund having achieved a substantial size with increasing assets and that, if a fund’s assets had been stable or decreasing, the possibility that Dreyfus may have realized any economies of scale would be less. Dreyfus representatives noted that, as a result of shared and allocated costs among funds in the Dreyfus fund complex, the extent of economies of scale could depend substantially on the level of assets in the complex as a whole, so that increases and decreases in complex-wide assets can affect potential economies of scale in a manner that is disproportionate to, or even in the opposite direction from, changes in the fund’s asset level. The Board also considered potential benefits to Dreyfus from acting as investment adviser and noted that there were no soft dollar arrangements in effect for trading the fund’s investments.
At the conclusion of these discussions, the Board agreed that it had been furnished with sufficient information to make an informed business decision with respect to the renewal of the Agreement. Based
The Fund 31
INFORMATION ABOUT THE RENEWAL OF THE FUND’S
MANAGEMENT AGREEMENT (Unaudited) (continued)
on the discussions and considerations as described above, the Board concluded and determined as follows.
The Board concluded that the nature, extent and quality of the services provided by Dreyfus are adequate and appropriate.
The Board generally was satisfied with the fund’s overall performance, in light of the considerations described above.
The Board concluded that the fee paid to Dreyfus was reasonable in light of the considerations described above.
The Board determined that the economies of scale which may accrue to Dreyfus and its affiliates in connection with the management of the fund had been adequately considered by Dreyfus in connection with the fee rate charged to the fund pursuant to the Agreement and that, to the extent in the future it were determined that material economies of scale had not been shared with the fund, the Board would seek to have those economies of scale shared with the fund.
In evaluating the Agreement, the Board considered these conclusions and determinations and also relied on its previous knowledge, gained through meetings and other interactions with Dreyfus and its affiliates, of the fund and the services provided to the fund by Dreyfus.The Board also relied on information received on a routine and regular basis throughout the year relating to the operations of the fund and the investment management and other services provided under the Agreement, including information on the investment performance of the fund in comparison to similar mutual funds and benchmark performance indices; general market outlook as applicable to the fund; and compliance reports. In addition, the Board’s consideration of the contractual fee arrangements for this fund had the benefit of a number of years of reviews of prior or similar agreements during which lengthy discussions took place between the Board and Dreyfus representatives. Certain aspects of the arrangements may receive greater scrutiny in some years than in others, and the Board’s conclusions may be based, in part, on their consideration of the same or similar arrangements in prior years. The Board determined that renewal of the Agreement was in the best interests of the fund and its shareholders.
32
BOARD MEMBERS INFORMATION (Unaudited)
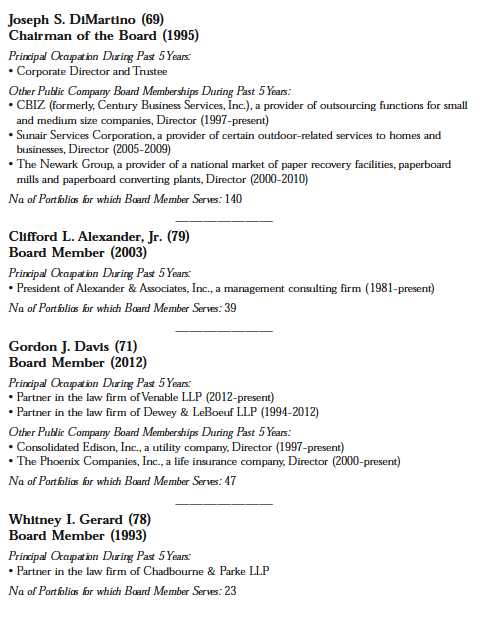
The Fund 33
BOARD MEMBERS INFORMATION (Unaudited) (continued)
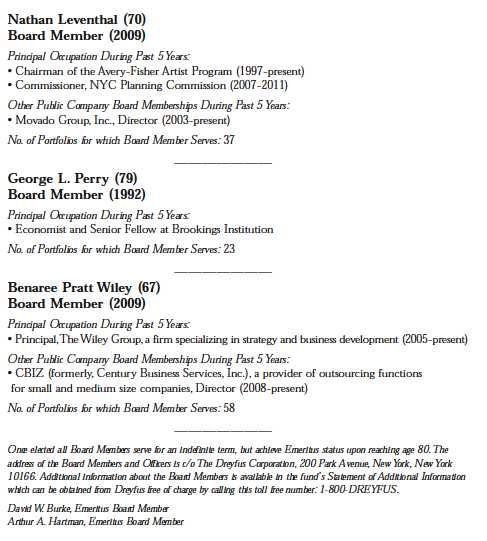
34
OFFICERS OF THE FUND (Unaudited)
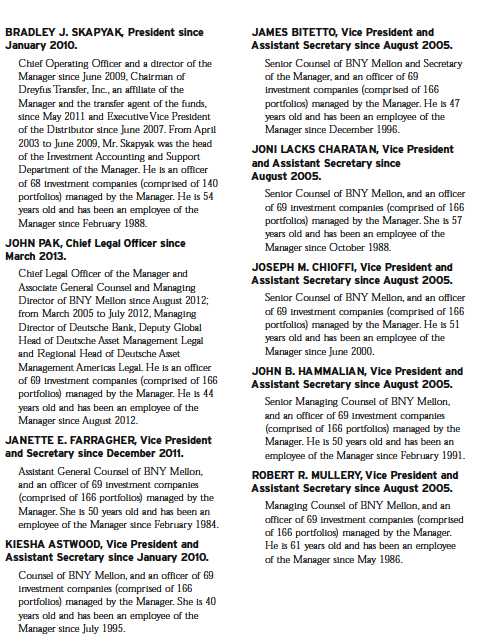
The Fund 35
OFFICERS OF THE FUND (Unaudited) (continued)
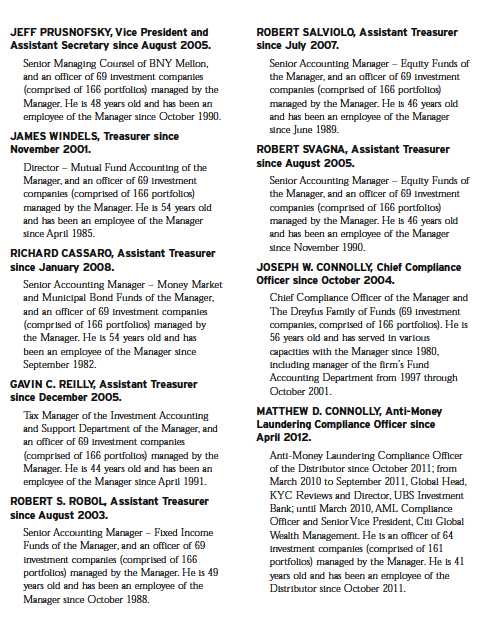
36
Save time. Save paper. View your next shareholder report online as soon as it’s available. Log into www.dreyfus.com and sign up for Dreyfus eCommunications. It’s simple and only takes a few minutes.
The views expressed in this report reflect those of the portfolio manager only through the end of the period covered and do not necessarily represent the views of Dreyfus or any other person in the Dreyfus organization. Any such views are subject to change at any time based upon market or other conditions and Dreyfus disclaims any responsibility to update such views.These views may not be relied on as investment advice and, because investment decisions for a Dreyfus fund are based on numerous factors, may not be relied on as an indication of trading intent on behalf of any Dreyfus fund.
| | Contents |
| | THE FUND |
| 2 | A Letter from the President |
| 3 | Discussion of Fund Performance |
| 6 | Fund Performance |
| 8 | Understanding Your Fund’s Expenses |
| 8 | Comparing Your Fund’s Expenses With Those of Other Funds |
| 9 | Statement of Investments |
| 21 | Statement of Options Written |
| 22 | Statement of Assets and Liabilities |
| 23 | Statement of Operations |
| 24 | Statement of Changes in Net Assets |
| 27 | Financial Highlights |
| 31 | Notes to Financial Statements |
| 50 | Report of Independent Registered Public Accounting Firm |
| 51 | Important Tax Information |
| 52 | Information About the Renewal of the Fund’s Management Agreement |
| 57 | Board Members Information |
| 59 | Officers of the Fund |
| | FOR MORE INFORMATION |
| | Back Cover |
Dreyfus
Intermediate
Term Income Fund
The Fund
A LETTER FROM THE PRESIDENT
Dear Shareholder:
We are pleased to present this annual report for Dreyfus Intermediate Term Income Fund, covering the 12-month period from August 1, 2012, through July 31, 2013. For information about how the fund performed during the reporting period, as well as general market perspectives, we provide a Discussion of Fund Performance on the pages that follow.
After more than 30 years of declining interest rates, it appears that the secular bull market in bonds may be over. By early 2013, bond yields declined to levels that provided little room for further declines, making an upward trend more likely in the midst of a slow-but-sustained U.S. economic recovery. Indeed, improvements in U.S. housing and labor markets during the reporting period prompted the Federal Reserve Board (the “Fed”) to signal its intent to back away from its quantitative easing program later this year, a development that sparked heightened bond market volatility during the second quarter of 2013.
We expect the U.S. economic recovery to accelerate later this year in advance of a multi-year expansion. Pent-up demographic demand could support continued expansion in the housing market, and higher home equity levels may bolster consumer confidence and spending. In the bond market, the Fed’s widely anticipated shift to a more moderately stimulative monetary policy stance is likely to presage a multiyear upward drift in interest rates as the relationship between rates and economic conditions normalizes.While these developments may hurt some segments of the bond market, others could respond more favorably.Therefore, as always, we urge you to discuss our observations with your financial adviser.
Thank you for your continued confidence and support.
Sincerely,

J. Charles Cardona President The Dreyfus Corporation August 15, 2013
2
DISCUSSION OF FUND PERFORMANCE
For the period of August 1, 2012, through July 31, 2013, as provided by David Horsfall and David Bowser, CFA, Portfolio Managers
Fund and Market Performance Overview
For the 12-month period ended July 31, 2013, Dreyfus Intermediate Term Income Fund’s Class A shares produced a total return of –0.24%, Class C shares returned –0.99%, Class I shares returned 0.01%, and ClassY shares returned 0.22%.1 In comparison, the fund’s benchmark, the Barclays U.S.Aggregate Bond Index, achieved a total return of –1.90% for the same period.2
Interest rates generally remained steady until late in the reporting period, when the U.S. bond market encountered heightened volatility in anticipation of a more moderately accommodative monetary policy from the Federal Reserve Board (the “Fed”).The fund produced higher returns than its benchmark, mainly due to strong security selections among corporate-backed securities.
The Fund’s Investment Approach
The fund seeks to maximize total return, consisting of capital appreciation and current income.To pursue its goal, the fund normally invests at least 80% of its net assets, plus any borrowings for investment purposes, in fixed income securities of U.S. and foreign issuers rated at least investment grade or the unrated equivalent as determined by Dreyfus.These securities include U.S. government bonds and notes, corporate bonds, municipal bonds, convertible securities, preferred stocks, inflation-indexed securities, asset-backed securities, mortgage-related securities (including CMOs), and foreign bonds.Typically, the fund can be expected to have an average effective maturity ranging between five and ten years, and an average effective duration ranging between three and eight years. For additional yield, the fund may invest up to 20% of its assets in fixed income securities rated below investment grade (“high yield” or “junk bonds”) to as low as Caa/CCC or the unrated equivalent as determined by Dreyfus.The fund will focus primarily on U.S. securities but may invest up to 30% of its total assets in fixed income securities of foreign issuers, including those of issuers in emerging markets.
The Fund 3
DISCUSSION OF FUND PERFORMANCE (continued)
Fed Comments Roiled Bond Market
Gradually improving employment data and rebounding housing markets in a slowly recovering U.S. economy supported prices of higher yielding bonds over much of the reporting period. Meanwhile, yields of U.S. government securities remained near historical lows in light of the Fed’s open-ended quantitative easing program involving monthly purchases of $85 billion of U.S. government securities.
In 2013, investors began to anticipate higher intermediate- and long-term interest rates in the recovering economy, causing yields of U.S. government securities to climb.These worries intensified in late May and June, when remarks by Fed chairman Ben Bernanke were interpreted as a signal that the central bank would back away from its ongoing quantitative easing program sooner than many analysts expected. Consequently, prices in most bond market sectors fell sharply before stabilizing in July, and the benchmark ended the reporting period with a modest loss.
Corporate-Backed Securities Buoyed Fund Results
An emphasis on higher yielding sectors of the U.S. bond market helped the fund participate more fully in their relative strength from August 2012 through April 2013. Overweighted exposure to BBB-rated corporate bonds, and out-of-index positions in high yield securities, fared particularly well. Results from mortgage-backed securities were supported in late 2012 by our focus on lower-coupon mortgages, which responded well to subdued prepayment rates at the time.The fund also held sovereign bonds from Spain and Italy, which rebounded from previously depressed levels.Tactical trades in foreign currencies, including the South African rand, further bolstered relative performance.The fund employed futures contracts to establish its currency positions.
When the U.S. bond market encountered heightened volatility in May, we trimmed its overweighted positions in higher yielding market sectors, including corporate-backed bonds, and we eliminated its positions in sovereign bonds from overseas issuers.We also reduced the fund’s average duration from a generally neutral position to one we consider to be shorter than market averages. Finally, we modestly increased the fund’s exposure to attractively valued asset-backed securities.These changes proved successful in sheltering the fund from the brunt of heightened market volatility.
4
A More Cautious Investment Posture
As of the reporting period’s end, we expect bond market volatility to persist until investors see a greater degree of economic certainty. Expectations of a shift later this year to a more moderately accommodative U.S. monetary policy have been exacerbated by disappointing economic data from overseas markets, leading some analysts to question the sustainability of the global recovery. However, we also have seen some stabilization of U.S. interest rates and higher yielding bond prices, and we remain watchful for opportunities to purchase attractively valued securities that may have been punished too severely by recent market turbulence. Nonetheless, in light of the risks of ongoing market volatility, we have maintained a relatively cautious investment posture, including a short average duration and a more mild emphasis on corporate-backed securities.
August 15, 2013
|
| Bond funds are subject generally to interest rate, credit, liquidity and market risks, to varying degrees, all of which are |
| more fully described in the fund’s prospectus. Generally, all other factors being equal, bond prices are inversely related |
| to interest-rate changes, and rate increases can cause price declines. |
| High yield bonds are subject to increased credit risk and are considered speculative in terms of the issuer’s perceived |
| ability to continue making interest payments on a timely basis and to repay principal upon maturity. |
| Investing internationally involves special risks, including changes in currency exchange rates, political, economic and |
| social instability, a lack of comprehensive company information, differing auditing and legal standards, and less market |
| liquidity.The fixed income securities of issuers located in emerging markets can be more volatile and less liquid than |
| those of issuers in more mature economies. |
| The fund may use derivative instruments, such as options, futures and options on futures, forward contracts, swaps |
| (including credit default swaps on corporate bonds and asset-backed securities), options on swaps and other credit |
| derivatives.A small investment in derivatives could have a potentially large impact on the fund’s performance.The use |
| of derivatives involves risks different from, or possibly greater than, the risks associated with investing directly in the |
| underlying assets. |
|
| 1 Total return includes reinvestment of dividends and any capital gains paid, and does not take into consideration the |
| maximum initial sales charge in the case of Class A shares, or the applicable contingent deferred sales charges imposed |
| on redemptions in the case of Class C shares. Had these charges been reflected, returns would have been lower. Past |
| performance is no guarantee of future results. Share price, yield and investment return fluctuate such that upon |
| redemption, fund shares may be worth more or less than their original cost.The total return figures presented for |
| ClassY shares of the fund reflect the performance as of 7/1/13 (the inception date for ClassY shares). |
| 2 SOURCE: LIPPER INC. — Reflects reinvestment of dividends and, where applicable, capital gain distributions. |
| The Barclays U.S.Aggregate Bond Index is a widely accepted, unmanaged total return index of corporate, U.S. |
| government and U.S. government agency debt instruments, mortgage-backed securities and asset-backed securities with |
| an average maturity of 1-10 years. Investors cannot invest directly in any index. |
The Fund 5
FUND PERFORMANCE
| |
| † | Source: Lipper Inc. |
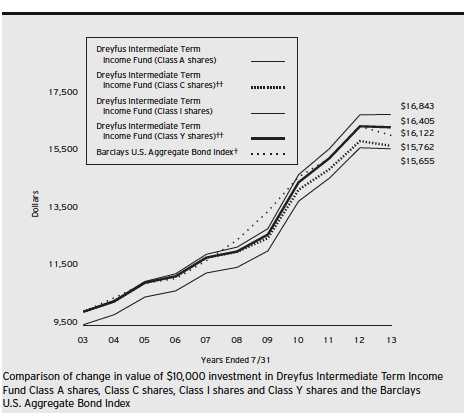
| †† | The total return figures presented for Class C shares of the fund reflect the performance of the fund’s Class A shares |
| | for the period prior to 5/13/08 (the inception date for Class C shares). |
| | The total return figures presented for ClassY shares of the fund reflect the performance of the fund’s Class A shares |
| | for the period prior to 7/1/13 (the inception date for ClassY shares). |
|
| Past performance is not predictive of future performance. |
| The above graph compares a $10,000 investment made in each of the Class A, Class C, Class I and ClassY shares of |
| Dreyfus Intermediate Term Income Fund on 7/31/03 to a $10,000 investment made in the Barclays U.S.Aggregate |
| Bond Index (the “Index”) on that date.All dividends and capital gain distributions are reinvested. |
| On April 18, 2013, the Board authorized the fund to offer ClassY shares, as a new class of shares, to certain investors, |
| including certain institutional investors. On July 1, 2013, ClassY shares were offered at net asset value and are not |
| subject to certain fees, including Distribution Plan and Shareholder Services Plan fees. |
| The fund invests primarily in debt securities and securities with debt-like characteristics of domestic and foreign issuers |
| and maintains an average effective maturity ranging between five and ten years and an average effective duration ranging |
| between three and eight years.The fund’s performance shown in the line graph above takes into account the maximum |
| initial sales charge on Class A shares and all other applicable fees and expenses on all classes.The Index is a widely |
| accepted, unmanaged total return index of corporate, U.S. government and U.S. government agency debt instruments, |
| mortgage-backed securities and asset-backed securities with an average maturity of 1-10 years. Unlike a mutual fund, the |
| Index is not subject to charges, fees and other expenses. Investors cannot invest directly in any index. Further information |
| relating to fund performance, including expense reimbursements, if applicable, is contained in the Financial Highlights |
| section of the prospectus and elsewhere in this report. |
6
| | | | | | | |
| Average Annual Total Returns as of 7/31/13 | | | | | | |
| Inception |
| | Date | 1 | Year | 5 Years | | 10 Years | |
| Class A shares | | | | | | | |
| with maximum sales charge (4.5%) | 2/2/96 | –4.71 | % | 5.31 | % | 4.58 | % |
| without sales charge | 2/2/96 | –0.24 | % | 6.29 | % | 5.07 | % |
| Class C shares | | | | | | | |
| with applicable redemption charge † | 5/13/08 | –1.95 | % | 5.48 | % | 4.66 | %†† |
| without redemption | 5/13/08 | –0.99 | % | 5.48 | % | 4.66 | %†† |
| Class I shares | 5/31/01 | 0.01 | % | 6.59 | % | 5.35 | % |
| Class Y shares | 7/1/13 | –0.21 | %†† | 6.30 | %†† | 5.07 | %†† |
| Barclays U.S. Aggregate Bond Index | | –1.90 | % | 5.23 | % | 4.89 | % |
| |
| Past performance is not predictive of future performance.The fund’s performance shown in the graph and table does not |
| reflect the deduction of taxes that a shareholder would pay on fund distributions or the redemption of fund shares. |
| † | The maximum contingent deferred sales charge for Class C shares is 1% for shares redeemed within one year of the |
| | date of purchase. |
| †† | The total return performance figures presented for Class C shares of the fund reflect the performance of the fund’s |
| | Class A shares for the period prior to 5/13/08 (the inception date for Class C shares). |
| | The total return performance figures presented for ClassY shares of the fund reflect the performance of the fund’s |
| | Class A shares for the period prior to 7/1/13 (the inception date for ClassY shares). |
The Fund 7
UNDERSTANDING YOUR FUND’S EXPENSES (Unaudited)
As a mutual fund investor, you pay ongoing expenses, such as management fees and other expenses. Using the information below, you can estimate how these expenses affect your investment and compare them with the expenses of other funds.You also may pay one-time transaction expenses, including sales charges (loads) and redemption fees, which are not shown in this section and would have resulted in higher total expenses. For more information, see your fund’s prospectus or talk to your financial adviser.
Review your fund’s expenses
The table below shows the expenses you would have paid on a $1,000 investment in Dreyfus Intermediate Term Income Fund from February 1, 2013 to July 31, 2013. It also shows how much a $1,000 investment would be worth at the close of the period, assuming actual returns and expenses.
| | | | | | | | |
| Expenses and Value of a $1,000 Investment | | | | | | |
| assuming actual returns for the six months ended July 31, 2013† | | | | |
| | | Class A | | Class C | | Class I | | Class Y |
| Expenses paid per $1,000†† | $ | 4.22 | $ | 7.93 | $ | 2.70 | $ | 0.39 |
| Ending value (after expenses) | $ | 978.80 | $ | 975.20 | $ | 980.20 | $ | 1,002.20 |
COMPARING YOUR FUND’S EXPENSES
WITH THOSE OF OTHER FUNDS (Unaudited)
Using the SEC’s method to compare expenses
The Securities and Exchange Commission (SEC) has established guidelines to help investors assess fund expenses. Per these guidelines, the table below shows your fund’s expenses based on a $1,000 investment, assuming a hypothetical 5% annualized return. You can use this information to compare the ongoing expenses (but not transaction expenses or total cost) of investing in the fund with those of other funds.All mutual fund shareholder reports will provide this information to help you make this comparison. Please note that you cannot use this information to estimate your actual ending account balance and expenses paid during the period.
| | | | | | | | |
| Expenses and Value of a $1,000 Investment | | | | | | |
| assuming a hypothetical 5% annualized return for the six months ended July 31, 2013††† |
| | | Class A | | Class C | | Class I | | Class Y |
| Expenses paid per $1,000†††† | $ | 4.31 | $ | 8.10 | $ | 2.76 | $ | 2.31 |
| Ending value (after expenses) | $ | 1,020.53 | $ | 1,016.76 | $ | 1,022.07 | $ | 1,022.51 |
| |
| † | From July 1, 2013 (commencement of initial offering) to July 31, 2013 for ClassY shares. |
| †† | Expenses are equal to the fund’s annualized expense ratio of .86% for Class A, 1.62% for Class C, .55% for Class |
| | I, multiplied by the average account value over the period, multiplied by 181/365 (to reflect the one-half year period). |
| | Expenses are equal to the fund’s annualized expense ratio of .46% for ClassY shares, multiplied by the average |
| | account value over the period, multiplied by 31/365 (to reflect the actual days in the period). |
| ††† | Please note that while ClassY shares commenced operations on July 1, 2013, the hypothetical expenses paid during |
| | the period reflect projected activity for the full six month period for purposes of comparability.This projection |
| | assumes that annualized expense ratios were in effect during the period February 1, 2013 to July 31, 2013. |
| †††† | Expenses are equal to the fund’s annualized expense ratio of .86% for Class A, 1.62% for Class C, .55% for |
| | Class I and .46% for ClassY, multiplied by the average account value over the period, multiplied by 181/365 (to |
| | reflect the one-half year period). |
8
STATEMENT OF INVESTMENTS
July 31, 2013
| | | | | |
| | Coupon | Maturity | Principal | | |
| Bonds and Notes—119.1% | Rate (%) | Date | Amount ($) | | Value ($) |
| Asset-Backed Ctfs./ | | | | | |
| Auto Receivables—6.0% | | | | | |
| Americredit Automobile Receivables | | | | | |
| Trust, Ser. 2013-1, Cl. D | 2.09 | 2/8/19 | 4,275,000 | | 4,141,894 |
| AmeriCredit Automobile Receivables | | | | | |
| Trust, Ser. 2012-5, Cl. D | 2.35 | 12/10/18 | 2,190,000 | | 2,154,703 |
| AmeriCredit Automobile Receivables | | | | | |
| Trust, Ser. 2012-1, Cl. C | 2.67 | 1/8/18 | 2,410,000 | | 2,469,194 |
| Americredit Automobile Receivables | | | | | |
| Trust, Ser. 2012-4, Cl. D | 2.68 | 10/9/18 | 2,970,000 | | 2,961,123 |
| AmeriCredit Automobile Receivables | | | | | |
| Trust, Ser. 2012-1, Cl. D | 4.72 | 3/8/18 | 5,965,000 | | 6,329,637 |
| AmeriCredit Automobile Receivables | | | | | |
| Trust, Ser. 2011-5, Cl. D | 5.05 | 12/8/17 | 6,895,000 | | 7,337,156 |
| Capital Auto Receivables Asset | | | | | |
| Trust, Ser. 2013-1, Cl. D | 2.19 | 9/20/21 | 6,240,000 | | 6,030,221 |
| CarMax Auto Owner Trust, | | | | | |
| Ser. 2010-1, Cl. B | 3.75 | 12/15/15 | 1,180,000 | | 1,200,159 |
| CarMax Auto Owner Trust, | | | | | |
| Ser. 2010-2, Cl. B | 3.96 | 6/15/16 | 140,000 | | 144,348 |
| Santander Drive Auto Receivables | | | | | |
| Trust, Ser. 2010-2, Cl. B | 2.24 | 12/15/14 | 647,616 | | 648,896 |
| Santander Drive Auto Receivables | | | | | |
| Trust, Ser. 2013-1, Cl. D | 2.27 | 1/15/19 | 2,935,000 | | 2,831,892 |
| Santander Drive Auto Receivables | | | | | |
| Trust, Ser. 2012-6, Cl. D | 2.52 | 9/17/18 | 3,980,000 | | 3,927,160 |
| Santander Drive Auto Receivables | | | | | |
| Trust, Ser. 2012-5, Cl. C | 2.70 | 8/15/18 | 4,545,000 | | 4,567,757 |
| Santander Drive Auto Receivables | | | | | |
| Trust, Ser. 2010-B, Cl. C | 3.02 | 10/17/16 | 4,060,821 | a | 4,104,692 |
| Santander Drive Auto Receivables | | | | | |
| Trust, Ser. 2010-3, Cl. C | 3.06 | 11/15/17 | 405,000 | | 413,910 |
| Santander Drive Auto Receivables | | | | | |
| Trust, Ser. 2011-1, Cl. C | 3.11 | 5/16/16 | 6,860,000 | | 6,998,136 |
| Santander Drive Auto Receivables | | | | | |
| Trust, Ser. 2012-2, Cl. C | 3.20 | 2/15/18 | 540,000 | | 551,368 |
| Santander Drive Auto Receivables | | | | | |
| Trust, Ser. 2012-3, Cl. D | 3.64 | 5/15/18 | 4,255,000 | | 4,341,770 |
| Santander Drive Auto Receivables | | | | | |
| Trust, Ser. 2012-1, Cl. C | 3.78 | 11/15/17 | 1,415,000 | | 1,448,334 |
The Fund 9
STATEMENT OF INVESTMENTS (continued)
| | | | | |
| | Coupon | Maturity | Principal | | |
| Bonds and Notes (continued) | Rate (%) | Date | Amount ($) | | Value ($) |
| Asset-Backed Ctfs./ | | | | | |
| Auto Receivables (continued) | | | | | |
| Santander Drive Auto Receivables | | | | | |
| Trust, Ser. 2011-3, Cl. D | 4.23 | 5/15/17 | 2,775,000 | | 2,862,250 |
| Santander Drive Auto Receivables | | | | | |
| Trust, Ser. 2011-4, Cl. D | 4.74 | 9/15/17 | 3,235,000 | | 3,370,702 |
| | | | | | 68,835,302 |
| Asset-Backed Ctfs./ | | | | | |
| Home Equity Loans—.2% | | | | | |
| Ameriquest Mortgage Securities, | | | | | |
| Ser. 2003-11, Cl. AF6 | 5.46 | 12/25/33 | 363,175 | b | 370,710 |
| Citigroup Mortgage Loan Trust, | | | | | |
| Ser. 2005-WF1, Cl. A5 | 5.01 | 11/25/34 | 1,367,754 | b | 1,389,520 |
| | | | | | 1,760,230 |
| Asset-Backed Ctfs./ | | | | | |
| Manufactured Housing—.1% | | | | | |
| Origen Manufactured Housing | | | | | |
| Contract Trust, Ser. 2005-B, Cl. M2 | 6.48 | 1/15/37 | 1,198,594 | | 1,287,656 |
| Commercial Mortgage | | | | | |
| Pass-Through Ctfs.—4.1% | | | | | |
| Bear Stearns Commercial Mortgage | | | | | |
| Securities Trust, | | | | | |
| Ser. 2006-PW13, Cl. A3 | 5.52 | 9/11/41 | 11,832 | | 11,824 |
| Extended Stay America Trust, | | | | | |
| Ser. 2013-ESH7, Cl. C7 | 3.90 | 12/5/31 | 6,430,000 | a | 6,136,753 |
| GS Mortgage Securities Corporation | | | | | |
| II Trust, Ser. 2007-EOP, Cl. B | 1.73 | 3/6/20 | 4,595,000 | a,b | 4,604,174 |
| GS Mortgage Securities Corporation | | | | | |
| II Trust, Ser. 2007-EOP, Cl. E | 2.48 | 3/6/20 | 1,730,000 | a,b | 1,736,242 |
| GS Mortgage Securities Corporation | | | | | |
| II Trust, Ser. 2007-EOP, Cl. F | 2.63 | 3/6/20 | 5,680,000 | a,b | 5,693,442 |
| GS Mortgage Securities Corporation | | | | | |
| II Trust, Ser. 2007-EOP, Cl. G | 2.79 | 3/6/20 | 3,110,000 | a,b | 3,118,556 |
| GS Mortgage Securities Corporation | | | | | |
| II Trust, Ser. 2007-EOP, Cl. H | 3.30 | 3/6/20 | 25,000 | a,b | 25,125 |
| GS Mortgage Securities Corporation | | | | | |
| II Trust, Ser. 2007-EOP, Cl. K | 4.80 | 3/6/20 | 3,030,000 | a,b | 3,046,507 |
| GS Mortgage Securities Corporation | | | | | |
| II Trust, Ser. 2007-EOP, Cl. L | 5.46 | 3/6/20 | 6,725,000 | a,b | 6,721,328 |
10
| | | | | |
| | Coupon | Maturity | Principal | | |
| Bonds and Notes (continued) | Rate (%) | Date | Amount ($) | | Value ($) |
| Commercial Mortgage | | | | | |
| Pass-Through Ctfs. (continued) | | | | | |
| JP Morgan Chase Commercial | | | | | |
| Mortgage Securities Trust, | | | | | |
| Ser. 2011-C3, Cl. A4 | 4.72 | 2/15/46 | 6,410,000 | a | 6,993,233 |
| JP Morgan Chase Commercial | | | | | |
| Mortgage Securities Trust, | | | | | |
| Ser. 2009-IWST, Cl. C | 7.69 | 12/5/27 | 5,455,000 | a,b | 6,537,457 |
| Morgan Stanley Capital I Trust, | | | | | |
| Ser. 2006-IQ12, Cl. AAB | 5.33 | 12/15/43 | 19,630 | | 19,605 |
| TIAA Seasoned | | | | | |
| Commercial Mortgage Trust, | | | | | |
| Ser. 2007-C4, Cl. A3 | 5.53 | 8/15/39 | 351,746 | b | 366,434 |
| WFRBS Commercial Mortgage Trust, | | | | | |
| Ser. 2011-C5, Cl. A4 | 3.67 | 11/15/44 | 2,085,000 | | 2,132,241 |
| | | | | | 47,142,921 |
| Consumer Discretionary—2.8% | | | | | |
| Cox Communications, | | | | | |
| Sr. Unscd. Notes | 6.25 | 6/1/18 | 4,110,000 | a | 4,762,105 |
| Ford Motor Credit, | | | | | |
| Sr. Unscd. Notes | 4.21 | 4/15/16 | 3,725,000 | | 3,928,404 |
| Ford Motor Credit, | | | | | |
| Sr. Unscd. Notes | 5.00 | 5/15/18 | 6,595,000 | | 7,166,338 |
| Hyundai Capital Services, | | | | | |
| Sr. Unscd. Notes | 4.38 | 7/27/16 | 1,700,000 | a | 1,811,090 |
| News America, | | | | | |
| Gtd. Debs | 7.63 | 11/30/28 | 2,670,000 | | 3,303,126 |
| Pearson Dollar Finance Two, | | | | | |
| Gtd. Notes | 6.25 | 5/6/18 | 1,320,000 | a | 1,519,606 |
| Staples, | | | | | |
| Sr. Unscd. Notes | 2.75 | 1/12/18 | 6,640,000 | | 6,689,986 |
| TCI Communications, | | | | | |
| Sr. Unscd. Debs | 7.88 | 2/15/26 | 355,000 | | 470,463 |
| Time Warner Cable, | | | | | |
| Gtd. Debs | 6.55 | 5/1/37 | 2,715,000 | | 2,601,423 |
| | | | | | 32,252,541 |
| Consumer Staples—2.1% | | | | | |
| ConAgra Foods, | | | | | |
| Sr. Unscd. Notes | 4.65 | 1/25/43 | 1,395,000 | | 1,338,828 |
The Fund 11
STATEMENT OF INVESTMENTS (continued)
| | | | | |
| | Coupon | Maturity | Principal | | |
| Bonds and Notes (continued) | Rate (%) | Date | Amount ($) | | Value ($) |
| Consumer Staples (continued) | | | | | |
| CVS Pass-Through Trust, | | | | | |
| Pass Thru Certificates Notes | 8.35 | 7/10/31 | 7,557,325 | a | 9,613,998 |
| Lorillard Tobacco, | | | | | |
| Gtd. Notes | 3.75 | 5/20/23 | 3,190,000 | | 2,914,591 |
| Mondelez International, | | | | | |
| Sr. Unscd. Notes | 6.88 | 2/1/38 | 3,075,000 | | 3,793,655 |
| Pernod-Ricard, | | | | | |
| Sr. Unscd. Notes | 4.25 | 7/15/22 | 1,715,000 | a | 1,752,341 |
| Pernod-Ricard, | | | | | |
| Sr. Unscd. Notes | 4.45 | 1/15/22 | 1,510,000 | a | 1,569,423 |
| Walgreen, | | | | | |
| Sr. Unscd. Notes | 1.00 | 3/13/15 | 2,360,000 | | 2,371,134 |
| | | | | | 23,353,970 |
| Energy—1.9% | | | | | |
| Anadarko Petroleum, | | | | | |
| Sr. Unscd. Notes | 6.38 | 9/15/17 | 2,485,000 | | 2,899,523 |
| Energy Transfer Partners, | | | | | |
| Sr. Unscd. Notes | 5.15 | 2/1/43 | 3,815,000 | | 3,568,635 |
| Kinder Morgan Energy Partners, | | | | | |
| Sr. Unscd. Notes | 6.55 | 9/15/40 | 3,560,000 | | 4,050,379 |
| Pemex Project Funding Master | | | | | |
| Trust, Gtd. Bonds | 6.63 | 6/15/35 | 3,475,000 | | 3,735,625 |
| Petrobras International Finance, | | | | | |
| Gtd. Notes | 5.38 | 1/27/21 | 1,795,000 | | 1,796,499 |
| Petrobras International Finance, | | | | | |
| Gtd. Notes | 6.75 | 1/27/41 | 1,515,000 | | 1,468,593 |
| Petroleos Mexicanos, | | | | | |
| Gtd. Notes | 4.88 | 1/24/22 | 1,350,000 | | 1,390,500 |
| Williams Partners, | | | | | |
| Sr. Unscd. Notes | 3.35 | 8/15/22 | 1,870,000 | | 1,729,172 |
| Williams Partners, | | | | | |
| Sr. Unscd. Notes | 6.30 | 4/15/40 | 920,000 | | 980,692 |
| | | | | | 21,619,618 |
| Financial—12.2% | | | | | |
| AIG SunAmerica Global Financing X, | | | | | |
| Sr. Scd. Notes | 6.90 | 3/15/32 | 1,175,000 | a | 1,443,542 |
| Ally Financial, | | | | | |
| Gtd. Notes | 4.63 | 6/26/15 | 5,975,000 | | 6,172,844 |
12
| | | | | |
| | Coupon | Maturity | Principal | | |
| Bonds and Notes (continued) | Rate (%) | Date | Amount ($) | | Value ($) |
| Financial (continued) | | | | | |
| Ameriprise Financial, | | | | | |
| Jr. Sub. Notes | 7.52 | 6/1/66 | 4,051,000 | b | 4,496,610 |
| AON, | | | | | |
| Gtd. Notes | 3.50 | 9/30/15 | 2,620,000 | | 2,751,443 |
| Bank of America, | | | | | |
| Sr. Unscd. Notes | 5.00 | 5/13/21 | 4,590,000 | | 4,941,947 |
| BBVA US Senior, | | | | | |
| Bank Gtd. Notes | 4.66 | 10/9/15 | 9,635,000 | | 9,950,845 |
| Boston Properties, | | | | | |
| Sr. Unscd. Notes | 3.70 | 11/15/18 | 1,540,000 | | 1,631,568 |
| Cincinnati Financial, | | | | | |
| Sr. Unscd. Notes | 6.13 | 11/1/34 | 1,797,000 | | 1,899,359 |
| Cincinnati Financial, | | | | | |
| Sr. Unscd. Debs | 6.92 | 5/15/28 | 1,331,000 | | 1,594,322 |
| CIT Group, | | | | | |
| Sr. Unscd. Notes | 5.00 | 5/15/17 | 2,930,000 | | 3,105,800 |
| Citigroup, | | | | | |
| Sr. Unscd. Notes | 5.38 | 8/9/20 | 5,170,000 | | 5,806,200 |
| DDR, | | | | | |
| Sr. Unscd. Notes | 4.75 | 4/15/18 | 3,410,000 | | 3,705,763 |
| Discover Financial Services, | | | | | |
| Sr. Unscd. Notes | 5.20 | 4/27/22 | 6,400,000 | | 6,725,491 |
| Duke Realty, | | | | | |
| Gtd. Notes | 8.25 | 8/15/19 | 5,000 | | 6,260 |
| Federal Realty Investment Trust, | | | | | |
| Sr. Unscd. Bonds | 5.65 | 6/1/16 | 550,000 | | 613,305 |
| Federal Realty Investment Trust, | | | | | |
| Sr. Unscd. Notes | 6.20 | 1/15/17 | 145,000 | | 164,827 |
| Genworth Holdings, | | | | | |
| Gtd. Notes | 7.20 | 2/15/21 | 905,000 | | 1,051,788 |
| Genworth Holdings, | | | | | |
| Gtd. Notes | 7.70 | 6/15/20 | 1,395,000 | | 1,651,980 |
| Goldman Sachs Group, | | | | | |
| Sr. Unscd. Notes | 5.25 | 7/27/21 | 3,615,000 | | 3,906,065 |
| Goldman Sachs Group, | | | | | |
| Sr. Unscd. Notes | 5.75 | 1/24/22 | 1,975,000 | | 2,201,935 |
| Hartford Financial Services Group, | | | | | |
| Sr. Unscd. Notes | 5.13 | 4/15/22 | 645,000 | | 711,845 |
The Fund 13
STATEMENT OF INVESTMENTS (continued)
| | | | | |
| | Coupon | Maturity | Principal | | |
| Bonds and Notes (continued) | Rate (%) | Date | Amount ($) | | Value ($) |
| Financial (continued) | | | | | |
| Health Care REIT, | | | | | |
| Sr. Unscd. Notes | 5.13 | 3/15/43 | 3,985,000 | | 3,761,752 |
| HSBC Holdings, | | | | | |
| Sr. Unscd. Notes | 4.00 | 3/30/22 | 4,585,000 | | 4,689,877 |
| International Lease Finance, | | | | | |
| Sr. Unscd. Notes | 5.75 | 5/15/16 | 3,285,000 | | 3,477,997 |
| International Lease Finance, | | | | | |
| Sr. Unscd. Notes | 6.63 | 11/15/13 | 3,310,000 | | 3,363,787 |
| Intesa Sanpaolo, | | | | | |
| Sr. Unscd. Notes | 6.50 | 2/24/21 | 610,000 | a | 619,205 |
| JPMorgan Chase & Co., | | | | | |
| Sr. Unscd. Notes | 4.35 | 8/15/21 | 4,125,000 | | 4,348,327 |
| JPMorgan Chase & Co., | | | | | |
| Sr. Unscd. Notes | 6.00 | 1/15/18 | 2,055,000 | | 2,365,428 |
| Liberty Mutual Group, | | | | | |
| Gtd. Notes | 6.50 | 5/1/42 | 1,475,000 | a | 1,649,755 |
| Merrill Lynch & Co., | | | | | |
| Sub. Notes | 5.70 | 5/2/17 | 785,000 | | 856,069 |
| Merrill Lynch & Co., | | | | | |
| Sr. Unscd. Notes | 6.40 | 8/28/17 | 35,000 | | 40,030 |
| Morgan Stanley, | | | | | |
| Sr. Unscd. Notes | 5.50 | 7/28/21 | 3,215,000 | | 3,525,968 |
| Morgan Stanley, | | | | | |
| Sr. Unscd. Notes | 5.55 | 4/27/17 | 3,720,000 | | 4,099,500 |
| Nisource Capital Markets, | | | | | |
| Sr. Unscd. Notes | 7.86 | 3/27/17 | 105,000 | | 118,362 |
| Pacific LifeCorp, | | | | | |
| Sr. Unscd. Notes | 5.13 | 1/30/43 | 5,090,000 | a | 4,806,024 |
| Prudential Financial, | | | | | |
| Jr. Sub. Notes | 5.88 | 9/15/42 | 3,380,000 | b | 3,422,250 |
| Regency Centers, | | | | | |
| Gtd. Notes | 5.25 | 8/1/15 | 1,964,000 | | 2,114,460 |
| Regency Centers, | | | | | |
| Gtd. Notes | 5.88 | 6/15/17 | 210,000 | | 234,560 |
| Royal Bank of Scotland Group, | | | | | |
| Sr. Unscd. Notes | 2.55 | 9/18/15 | 3,770,000 | | 3,850,346 |
| Royal Bank of Scotland, | | | | | |
| Sub. Notes | 9.50 | 3/16/22 | 5,995,000 | b | 6,649,354 |
| Santander US Debt, | | | | | |
| Bank Gtd. Notes | 3.72 | 1/20/15 | 6,685,000 | a | 6,793,330 |
14
| | | | | |
| | Coupon | Maturity | Principal | | |
| Bonds and Notes (continued) | Rate (%) | Date | Amount ($) | | Value ($) |
| Financial (continued) | | | | | |
| Standard Chartered, | | | | | |
| Sub. Notes | 3.95 | 1/11/23 | 5,285,000 | a | 4,970,881 |
| WEA Finance, | | | | | |
| Gtd. Notes | 7.13 | 4/15/18 | 3,490,000 | a | 4,185,833 |
| Willis North America, | | | | | |
| Gtd. Notes | 6.20 | 3/28/17 | 4,475,000 | | 4,971,555 |
| | | | | | 139,448,389 |
| Foreign/Governmental—1.5% | | | | | |
| Corporacion Andina de Fomento, | | | | | |
| Sr. Unscd. Notes | 3.75 | 1/15/16 | 3,845,000 | | 4,068,341 |
| Indonesia Eximbank, | | | | | |
| Sr. Unscd. Notes | 3.75 | 4/26/17 | 3,070,000 | | 3,085,820 |
| Korea Finance, | | | | | |
| Sr. Unscd. Notes | 2.25 | 8/7/17 | 4,610,000 | c | 4,570,695 |
| Province of Quebec Canada, | | | | | |
| Sr. Unscd. Notes | 4.60 | 5/26/15 | 3,380,000 | | 3,633,270 |
| Republic of Korea, | | | | | |
| Sr. Unscd. Notes | 7.13 | 4/16/19 | 1,860,000 | | 2,287,519 |
| | | | | | 17,645,645 |
| Health Care—.4% | | | | | |
| WellPoint, | | | | | |
| Sr. Unscd. Notes | 1.25 | 9/10/15 | 4,355,000 | | 4,388,046 |
| Industrial—.8% | | | | | |
| ERAC USA Finance, | | | | | |
| Gtd. Notes | 6.38 | 10/15/17 | 2,995,000 | a | 3,480,708 |
| Waste Management, | | | | | |
| Gtd. Notes | 7.00 | 7/15/28 | 2,351,000 | | 2,979,935 |
| Waste Management, | | | | | |
| Gtd. Notes | 7.75 | 5/15/32 | 2,000,000 | | 2,647,026 |
| | | | | | 9,107,669 |
| Information Technology—.4% | | | | | |
| Hewlett-Packard, | | | | | |
| Sr. Unscd. Notes | 4.30 | 6/1/21 | 1,195,000 | | 1,191,929 |
| Xerox, | | | | | |
| Sr. Unscd. Notes | 5.63 | 12/15/19 | 3,000,000 | | 3,357,648 |
| | | | | | 4,549,577 |
| Materials—1.0% | | | | | |
| Teck Resources, | | | | | |
| Gtd. Notes | 5.40 | 2/1/43 | 3,930,000 | c | 3,393,280 |
The Fund 15
STATEMENT OF INVESTMENTS (continued)
| | | | | |
| | Coupon | Maturity | Principal | | |
| Bonds and Notes (continued) | Rate (%) | Date | Amount ($) | | Value ($) |
| Materials (continued) | | | | | |
| Teck Resources, | | | | | |
| Gtd. Notes | 6.25 | 7/15/41 | 2,470,000 | | 2,342,239 |
| Vale Overseas, | | | | | |
| Gtd. Notes | 4.38 | 1/11/22 | 3,240,000 | | 3,085,371 |
| Vale, | | | | | |
| Sr. Unscd. Notes | 5.63 | 9/11/42 | 3,090,000 | | 2,670,106 |
| | | | | | 11,490,996 |
| Municipal Bonds—.8% | | | | | |
| California, | | | | | |
| GO (Build America Bonds) | 7.30 | 10/1/39 | 3,705,000 | | 4,788,712 |
| New York City, | | | | | |
| GO (Build America Bonds) | 5.99 | 12/1/36 | 3,830,000 | | 4,363,327 |
| | | | | | 9,152,039 |
| Residential Mortgage | | | | | |
| Pass-Through Ctfs.—.2% | | | | | |
| Credit Suisse First Boston | | | | | |
| Mortgage Securities, | | | | | |
| Ser. 2004-7, Cl. 6A1 | 5.25 | 10/25/19 | 195,652 | | 198,694 |
| Impac CMB Trust, | | | | | |
| Ser. 2005-8, Cl. 2M2 | 0.94 | 2/25/36 | 1,266,278 | b | 1,190,060 |
| Impac CMB Trust, | | | | | |
| Ser. 2005-8, Cl. 2M3 | 1.69 | 2/25/36 | 1,024,096 | b | 964,217 |
| Prudential Home Mortgage | | | | | |
| Securities, Ser. 1994-A, Cl. 5B | 6.73 | 4/28/24 | 643 | b | 520 |
| Residential Funding Mortgage | | | | | |
| Securities I Trust, | | | | | |
| Ser. 2004-S3, Cl. M1 | 4.75 | 3/25/19 | 282,862 | | 268,057 |
| | | | | | 2,621,548 |
| Telecommunications—1.6% | | | | | |
| Cellco Partnership/Verizon | | | | | |
| Wireless Capital, Sr. Unscd. Notes | 8.50 | 11/15/18 | 2,165,000 | | 2,813,853 |
| SBA Tower Trust, | | | | | |
| Mortgage Bonds | 3.60 | 4/15/43 | 6,210,000 | a | 6,178,770 |
| Telecom Italia Capital, | | | | | |
| Gtd. Notes | 7.20 | 7/18/36 | 6,080,000 | | 5,921,519 |
| Telefonica Emisiones, | | | | | |
| Gtd. Notes | 7.05 | 6/20/36 | 2,550,000 | | 2,829,100 |
| | | | | | 17,743,242 |
16
| | | | | | |
| | | Coupon | Maturity | Principal | | |
| Bonds and Notes (continued) | | Rate (%) | Date | Amount ($) | | Value ($) |
| U.S. Government Agencies—.0% | | | | | | |
| Small Business Administration | | | | | | |
| Participation Ctfs., Gov’t | | | | | | |
| Gtd. Debs., Ser. 97-J | | 6.55 | 10/1/17 | 66,663 | | 70,995 |
| U.S. Government Agencies/ | | | | | | |
| Mortgage-Backed—22.7% | | | | | | |
| Federal Home Loan Mortgage Corp.: | | | | | | |
| 4.00% | | | | 25,755,000 | d,e | 26,724,838 |
| 5.00%, 10/1/18—9/1/40 | | | | 1,203,007 | e | 1,314,765 |
| 5.50%, 11/1/22—5/1/40 | | | | 4,428,332 | e | 4,801,669 |
| 6.00%, 7/1/17—12/1/37 | | | | 1,739,191 | e | 1,911,450 |
| 6.50%, 3/1/14—3/1/32 | | | | 211,509 | e | 240,397 |
| 7.00%, 11/1/31 | | | | 95,364 | e | 110,445 |
| 7.50%, 12/1/25—1/1/31 | | | | 22,590 | e | 25,083 |
| 8.00%, 10/1/19—1/1/28 | | | | 7,513 | e | 8,617 |
| 8.50%, 7/1/30 | | | | 501 | e | 614 |
| Multiclass Mortgage | | | | | | |
| Participation Ctfs., | | | | | | |
| REMIC, Ser. 2586, | | | | | | |
| Cl. WE, 4.00%, 12/15/32 | | | | 271,333 | e | 273,643 |
| Multiclass Mortgage | | | | | | |
| Participation Ctfs., | | | | | | |
| REMIC, Ser. 51, | | | | | | |
| Cl. E, 10.00%, 7/15/20 | | | | 67,993 | e | 78,197 |
| Federal National Mortgage Association: | | | | | | |
| 2.50% | | | | 11,620,000 | d,e | 11,616,369 |
| 3.00% | | | | 53,915,000 | d,e | 53,014,604 |
| 3.50% | | | | 65,645,000 | d,e | 66,198,880 |
| 4.00% | | | | 16,645,000 | d,e | 17,302,998 |
| 4.50% | | | | 21,865,000 | d,e | 23,173,483 |
| 5.00% | | | | 29,325,000 | d,e | 31,602,277 |
| 4.50%, 11/1/14 | | | | 985 | e | 1,047 |
| 5.00%, 5/1/18—9/1/40 | | | | 3,798,855 | e | 4,145,604 |
| 5.50%, 8/1/22—8/1/40 | | | | 11,805,126 | e | 12,947,445 |
| 6.00%, 1/1/19—1/1/38 | | | | 1,595,240 | e | 1,751,948 |
| 6.50%, 3/1/26—10/1/32 | | | | 75,520 | e | 86,413 |
| 7.00%, 9/1/14—7/1/32 | | | | 41,220 | e | 46,867 |
| 7.50%, 10/1/15—3/1/31 | | | | 12,000 | e | 13,079 |
| 8.00%, 12/1/25 | | | | 11,474 | e | 13,031 |
| Pass-Through Ctfs., REMIC, | | | | | | |
| Ser. 1988-16, Cl. B, | | | | | | |
| 9.50%, 6/25/18 | | | | 35,068 | e | 38,828 |
The Fund 17
STATEMENT OF INVESTMENTS (continued)
| | | | | |
| | Coupon | Maturity | Principal | | |
| Bonds and Notes (continued) | Rate (%) | Date | Amount ($) | | Value ($) |
| U.S. Government Agencies/ | | | | | |
| Mortgage-Backed (continued) | | | | | |
| Government National Mortgage Association I: | | | | |
| 5.50%, 4/15/33 | | | 1,364,015 | | 1,505,629 |
| 6.50%, 4/15/28—9/15/32 | | | 39,760 | | 45,220 |
| 7.00%, 12/15/26—9/15/31 | | | 11,425 | | 13,406 |
| 7.50%, 12/15/26—11/15/30 | | | 2,586 | | 2,669 |
| 8.00%, 5/15/26—10/15/30 | | | 16,008 | | 17,286 |
| 8.50%, 4/15/25 | | | 3,789 | | 4,392 |
| 9.00%, 10/15/27 | | | 8,719 | | 8,969 |
| 9.50%, 2/15/25 | | | 2,237 | | 2,518 |
| 9.50%, 11/15/17 | | | 45,019 | | 48,067 |
| Government National Mortgage Association II: | | | | |
| 6.50%, 2/20/31—7/20/31 | | | 86,064 | | 99,350 |
| 7.00%, 11/20/29 | | | 273 | | 320 |
| | | | | | 259,190,417 |
| U.S. Government Securities—58.3% | | | | | |
| U.S. Treasury Bonds: | | | | | |
| 3.88%, 8/15/40 | | | 37,450,000 | c | 39,498,066 |
| 6.13%, 11/15/27 | | | 4,245,000 | | 5,738,047 |
| U.S. Treasury Notes: | | | | | |
| 0.13%, 8/31/13 | | | 63,115,000 | | 63,119,923 |
| 0.13%, 7/31/14 | | | 60,555,000 | c | 60,546,704 |
| 0.25%, 10/31/13 | | | 120,765,000 | | 120,828,643 |
| 1.75%, 5/31/16 | | | 31,145,000 | c | 32,186,427 |
| 2.13%, 5/31/15 | | | 143,280,000 | c | 148,082,172 |
| 2.38%, 7/31/17 | | | 124,380,000 | c | 130,919,652 |
| 2.63%, 8/15/20 | | | 60,535,000 | c | 63,067,542 |
| 2.63%, 11/15/20 | | | 1,870,000 | | 1,942,608 |
| | | | | | 665,929,784 |
| Utilities—2.0% | | | | | |
| Cleveland Electric Illuminating, | | | | | |
| Sr. Unscd. Notes | 5.70 | 4/1/17 | 910,000 | | 1,000,515 |
| Commonwealth Edison, | | | | | |
| First Mortgage Bonds | 6.15 | 9/15/17 | 60,000 | | 70,385 |
| Consolidated Edison of New York, | | | | | |
| Sr. Unscd. Debs., Ser. 06-D | 5.30 | 12/1/16 | 675,000 | | 762,015 |
18
| | | | | | |
| | Coupon | Maturity | Principal | | | |
| Bonds and Notes (continued) | Rate (%) | Date | Amount ($) | | | Value ($) |
| Utilities (continued) | | | | | | |
| Electricite de France, | | | | | | |
| Sub. Notes | 5.25 | 1/29/49 | 5,815,000 | a,b | | 5,570,787 |
| Enel Finance International, | | | | | | |
| Gtd. Notes | 6.80 | 9/15/37 | 4,650,000 | a | | 4,606,137 |
| Exelon Generation, | | | | | | |
| Sr. Unscd. Notes | 5.20 | 10/1/19 | 2,200,000 | | | 2,436,691 |
| Exelon Generation, | | | | | | |
| Sr. Unscd. Notes | 6.25 | 10/1/39 | 355,000 | | | 387,497 |
| Nevada Power, | | | | | | |
| Mortgage Notes, Ser. R | 6.75 | 7/1/37 | 395,000 | | | 509,851 |
| Nisource Finance, | | | | | | |
| Gtd. Notes | 4.45 | 12/1/21 | 3,295,000 | | | 3,415,211 |
| Sempra Energy, | | | | | | |
| Sr. Unscd. Notes | 6.50 | 6/1/16 | 3,060,000 | | | 3,502,161 |
| Sierra Pacific Power, | | | | | | |
| Mortgage Notes, Ser. P | 6.75 | 7/1/37 | 550,000 | | | 700,599 |
| | | | | | | 22,961,849 |
| Total Bonds and Notes | | | | | | |
| (cost $1,347,696,922) | | | | | | 1,360,552,434 |
| |
| | | | Face Amount | | | |
| | | | Covered by | | | |
| Options Purchased—.4% | | | Contracts ($) | | | Value ($) |
| Put Options | | | | | | |
| 3-Month USD LIBOR-BBA, | | | | | | |
| March 2023 @ $4.50 | | | | | | |
| (cost $4,311,872) | | | 60,560,000 | f | 4,543,441 |
| |
| Other Investment—.5% | | | Shares | | | Value ($) |
| Registered | | | | | | |
| Investment Company; | | | | | | |
| Dreyfus | | | | | | |
| Institutional Preferred | | | | | | |
| Plus Money Market Fund | | | | | | |
| (cost $5,937,942) | | | 5,937,942 | g | 5,937,942 |
The Fund 19
STATEMENT OF INVESTMENTS (continued)
| | | | |
| Investment of Cash Collateral | | | | |
| for Securities Loaned—.5% | Shares | | Value ($) | |
| Registered Investment Company; | | | | |
| Dreyfus Institutional Cash Advantage Fund | | | | |
| (cost $5,106,300) | 5,106,300 | g | 5,106,300 | |
| Total Investments (cost $1,363,053,036) | 120.5 | % | 1,376,140,117 | |
| Liabilities, Less Cash and Receivables | (20.5 | %) | (233,816,325 | ) |
| Net Assets | 100.0 | % | 1,142,323,792 | |
|
| BBA—British Bankers Association |
| GO—General Obligation |
| LIBOR—London Interbank Offered Rate |
| REIT—Real Estate Investment Trust |
| REMIC—Real Estate Mortgage Investment Conduit |
| USD—U.S. Dollar |
|
| a Securities exempt from registration pursuant to Rule 144A under the Securities Act of 1933.These securities may be |
| resold in transactions exempt from registration, normally to qualified institutional buyers.At July 31, 2013, these |
| securities were valued at $114,051,044 or 10.0% of net assets. |
| b Variable rate security—interest rate subject to periodic change. |
| c Security, or portion thereof, on loan.At July 31, 2013, the value of the fund’s securities on loan was $401,339,436 |
| and the value of the collateral held by the fund was $411,080,340, consisting of cash collateral of $5,106,300 and |
| U.S. Government and agency securities valued at $405,974,040. |
| d Purchased on a forward commitment basis. |
| e The Federal Housing Finance Agency (“FHFA”) placed the Federal Home Loan Mortgage Corporation and Federal |
| National Mortgage Association into conservatorship with FHFA as the conservator.As such, the FHFA oversees the |
| continuing affairs of these companies. |
| f Non-income producing security. |
| g Investment in affiliated money market mutual fund. |
| | | |
| Portfolio Summary (Unaudited)† | | |
| |
| | Value (%) | | Value (%) |
| U.S. Government Agencies/ | | Money Market Investments | 1.0 |
| Mortgage-Backed | 81.0 | Municipal Bonds | .8 |
| Corporate Bonds | 25.2 | Options Purchased | .4 |
| Asset-Backed | 6.3 | Residential Mortgage-Backed | .2 |
| Commercial Mortgage-Backed | 4.1 | | |
| Foreign/Governmental | 1.5 | | 120.5 |
|
| † Based on net assets. |
| See notes to financial statements. |
20
STATEMENT OF OPTIONS WRITTEN
July 31, 2013
| | | | |
| | Face Amount | | | |
| | Covered by | | | |
| | Contracts ($) | | Value ($) | |
| Put Options: | | | | |
| 3-Month USD LIBOR-BBA, | | | | |
| March 2015 @ $3.75 | | | | |
| (premiums received $1,863,734) | 60,560,000 | a | (3,540,743 | ) |
|
| BBA—British Bankers Association |
| LIBOR—London Interbank Offered Rate |
| USD—U.S. Dollar |
| a Non-income producing security. |
| See notes to financial statements. |
The Fund 21
STATEMENT OF ASSETS AND LIABILITIES
July 31, 2013
| | | |
| | Cost | Value | |
| Assets ($): | | | |
| Investments in securities—See Statement of Investments (including | | | |
| securities on loan, valued at $401,339,436)—Note 1(c): | | | |
| Unaffiliated issuers | 1,352,008,794 | 1,365,095,875 | |
| Affiliated issuers | 11,044,242 | 11,044,242 | |
| Receivable for investment securities sold | | 33,137,969 | |
| Dividend, interest and securities lending income receivable | | 6,438,117 | |
| Receivable for shares of Common Stock subscribed | | 1,670 | |
| Prepaid expenses | | 55,589 | |
| | | 1,415,773,462 | |
| Liabilities ($): | | | |
| Due to The Dreyfus Corporation and affiliates—Note 3(c) | | 746,333 | |
| Cash overdraft due to Custodian | | 57,717 | |
| Payable for open mortgage dollar roll transactions—Note 4 | | 236,259,018 | |
| Payable for investment securities purchased | | 25,099,606 | |
| Liability for securities on loan—Note 1(c) | | 5,106,300 | |
| Outstanding options written, at value (premiums received | | | |
| $1,863,734)—See Statement of Options Written—Note 4 | | 3,540,743 | |
| Payable for shares of Common Stock redeemed | | 2,246,903 | |
| Accrued expenses | | 393,050 | |
| | | 273,449,670 | |
| Net Assets ($) | | 1,142,323,792 | |
| Composition of Net Assets ($): | | | |
| Paid-in capital | | 1,139,994,797 | |
| Accumulated undistributed investment income—net | | 667,792 | |
| Accumulated net realized gain (loss) on investments | | (9,748,869 | ) |
| Accumulated net unrealized appreciation (depreciation) | | | |
| on investments and options transactions | | 11,410,072 | |
| Net Assets ($) | | 1,142,323,792 | |
| | | | |
| Net Asset Value Per Share | | | | |
| | Class A | Class C | Class I | Class Y |
| Net Assets ($) | 848,610,205 | 34,258,942 | 259,453,645 | 1,000 |
| Shares Outstanding | 62,446,255 | 2,521,015 | 19,098,161 | 73.58 |
| Net Asset Value Per Share ($) | 13.59 | 13.59 | 13.59 | 13.59 |
|
| See notes to financial statements. |
22
STATEMENT OF OPERATIONS
Year Ended July 31, 2013
| | |
| Investment Income ($): | | |
| Income: | | |
| Interest | 30,930,931 | |
| Dividends; | | |
| Unaffiliated issuers | 331,771 | |
| Affiliated issuers | 21,658 | |
| Income from securities lending—Note 1(c) | 168,215 | |
| Total Income | 31,452,575 | |
| Expenses: | | |
| Management fee—Note 3(a) | 5,266,511 | |
| Shareholder servicing costs—Note 3(c) | 3,870,127 | |
| Distribution fees—Note 3(b) | 308,784 | |
| Professional fees | 117,253 | |
| Custodian fees—Note 3(c) | 106,191 | |
| Registration fees | 69,668 | |
| Prospectus and shareholders’ reports | 66,499 | |
| Directors’ fees and expenses—Note 3(d) | 35,652 | |
| Loan commitment fees—Note 2 | 10,059 | |
| Miscellaneous | 85,622 | |
| Total Expenses | 9,936,366 | |
| Less—reduction in expenses due to undertaking—Note 3(a) | (54,718 | ) |
| Less—reduction in fees due to earnings credits—Note 3(c) | (1,968 | ) |
| Net Expenses | 9,879,680 | |
| Investment Income—Net | 21,572,895 | |
| Realized and Unrealized Gain (Loss) on Investments—Note 4 ($): | | |
| Net realized gain (loss) on investments and foreign currency transactions | 10,813,432 | |
| Net realized gain (loss) on options transactions | 210,513 | |
| Net realized gain (loss) on financial futures | (14,174 | ) |
| Net realized gain (loss) on swap transactions | (352,560 | ) |
| Net realized gain (loss) on forward foreign currency exchange contracts | 452,000 | |
| Net Realized Gain (Loss) | 11,109,211 | |
| Net unrealized appreciation (depreciation) | | |
| on investments and foreign currency transactions | (35,329,570 | ) |
| Net unrealized appreciation (depreciation) on options transactions | (1,445,440 | ) |
| Net unrealized appreciation (depreciation) on financial futures | (2,563 | ) |
| Net unrealized appreciation (depreciation) | | |
| on forward foreign currency exchange transactions | (607,251 | ) |
| Net Unrealized Appreciation (Depreciation) | (37,384,824 | ) |
| Net Realized and Unrealized Gain (Loss) on Investments | (26,275,613 | ) |
| Net (Decrease) in Net Assets Resulting from Operations | (4,702,718 | ) |
|
| See notes to financial statements. |
The Fund 23
STATEMENT OF CHANGES IN NET ASSETS
| | | | |
| | | | Year Ended July 31, | |
| | 2013 | a | 2012 | b |
| Operations ($): | | | | |
| Investment income—net | 21,572,895 | | 20,073,218 | |
| Net realized gain (loss) on investments | 11,109,211 | | 56,966,087 | |
| Net unrealized appreciation | | | | |
| (depreciation) on investments | (37,384,824 | ) | 1,971,412 | |
| Net Increase (Decrease) in Net Assets | | | | |
| Resulting from Operations | (4,702,718 | ) | 79,010,717 | |
| Dividends to Shareholders from ($): | | | | |
| Investment income—net: | | | | |
| Class A Shares | (22,265,613 | ) | (24,241,554 | ) |
| Class B Shares | — | | (31,151 | ) |
| Class C Shares | (664,309 | ) | (690,147 | ) |
| Class I Shares | (4,889,912 | ) | (1,519,897 | ) |
| Class Y Shares | (2 | ) | — | |
| Net realized gain on investments: | | | | |
| Class A Shares | (9,121,673 | ) | — | |
| Class C Shares | (405,880 | ) | — | |
| Class I Shares | (940,415 | ) | — | |
| Total Dividends | (38,287,804 | ) | (26,482,749 | ) |
| Capital Stock Transactions ($): | | | | |
| Net proceeds from shares sold: | | | | |
| Class A Shares | 104,981,562 | | 171,064,546 | |
| Class B Shares | — | | 44,521 | |
| Class C Shares | 3,533,808 | | 8,374,236 | |
| Class I Shares | 60,600,537 | | 77,838,952 | |
| Class Y Shares | 1,000 | | — | |
| Net assets received in connection | | | | |
| with reorganization—Note 1 | 172,875,697 | | — | |
24
| | | | |
| | | | Year Ended July 31, | |
| | 2013 | a | 2012 | b |
| Capital Stock Transactions ($) (continued): | | | | |
| Dividends reinvested: | | | | |
| Class A Shares | 28,092,606 | | 21,511,901 | |
| Class B Shares | — | | 22,619 | |
| Class C Shares | 746,546 | | 475,791 | |
| Class I Shares | 4,774,741 | | 1,187,030 | |
| Cost of shares redeemed: | | | | |
| Class A Shares | (243,595,071 | ) | (359,737,664 | ) |
| Class B Shares | — | | (4,016,237 | ) |
| Class C Shares | (12,166,485 | ) | (8,375,469 | ) |
| Class I Shares | (58,798,486 | ) | (17,792,480 | ) |
| Increase (Decrease) in Net Assets | | | | |
| from Capital Stock Transactions | 61,046,455 | | (109,402,254 | ) |
| Total Increase (Decrease) in Net Assets | 18,055,933 | | (56,874,286 | ) |
| Net Assets ($): | | | | |
| Beginning of Period | 1,124,267,859 | | 1,181,142,145 | |
| End of Period | 1,142,323,792 | | 1,124,267,859 | |
| Undistributed investment income—net | 667,792 | | 3,922,874 | |
The Fund 25
STATEMENT OF CHANGES IN NET ASSETS (continued)
| | | | |
| | | | Year Ended July 31, | |
| | 2013 | a | 2012 | b |
| Capital Share Transactions: | | | | |
| Class Ac,d | | | | |
| Shares sold | 7,466,921 | | 12,512,995 | |
| Shares issued for dividends reinvested | 1,997,614 | | 1,566,724 | |
| Shares redeemed | (17,368,482 | ) | (26,326,576 | ) |
| Net Increase (Decrease) in Shares Outstanding | (7,903,947 | ) | (12,246,857 | ) |
| Class Bc | | | | |
| Shares sold | — | | 3,269 | |
| Shares issued for dividends reinvested | — | | 1,661 | |
| Shares redeemed | — | | (293,447 | ) |
| Net Increase (Decrease) in Shares Outstanding | — | | (288,517 | ) |
| Class Cd | | | | |
| Shares sold | 251,281 | | 610,565 | |
| Shares issued for dividends reinvested | 53,038 | | 34,638 | |
| Shares redeemed | (868,830 | ) | (610,419 | ) |
| Net Increase (Decrease) in Shares Outstanding | (564,511 | ) | 34,784 | |
| Class I | | | | |
| Shares sold | 4,298,318 | | 5,687,821 | |
| Shares issued in connection | | | | |
| with reorganization—Note 1 | 12,234,875 | | — | |
| Shares issued for dividends reinvested | 341,296 | | 86,023 | |
| Shares redeemed | (4,197,134 | ) | (1,294,355 | ) |
| Net Increase (Decrease) in Shares Outstanding | 12,677,355 | | 4,479,489 | |
| Class Y | | | | |
| Shares sold | 73.58 | | — | |
| |
| a | Effective July 1, 2013, the fund commenced offering ClassY shares. |
| b | Effective as of the close of business on March 13, 2012, the fund no longer offers Class B shares. |
| c | During the period ended July 31, 2012, 119,625 Class B shares representing $1,636,401 were automatically |
| | converted to 119,569 Class A shares. |
| d | During the period ended July 31, 2013, 150,323 Class C shares representing $2,122,392 were exchanged for |
| | 150,418 Class A shares. |
| See notes to financial statements. |
26
FINANCIAL HIGHLIGHTS
The following tables describe the performance for each share class for the fiscal periods indicated.All information (except portfolio turnover rate) reflects financial results for a single fund share.Total return shows how much your investment in the fund would have increased (or decreased) during each period, assuming you had reinvested all dividends and distributions.These figures have been derived from the fund’s financial statements.
| | | | | | | | | | |
| | | | | | Year Ended July 31, | | | |
| Class A Shares | 2013 | | 2012 | | 2011 | | 2010 | | 2009 | |
| Per Share Data ($): | | | | | | | | | | |
| Net asset value, | | | | | | | | | | |
| beginning of period | 14.08 | | 13.44 | | 13.15 | | 12.00 | | 12.02 | |
| Investment Operations: | | | | | | | | | | |
| Investment income—neta | .26 | | .25 | | .41 | | .53 | | .56 | |
| Net realized and unrealized | | | | | | | | | | |
| gain (loss) on investments | (.29 | ) | .71 | | .33 | | 1.15 | | (.02 | ) |
| Total from Investment Operations | (.03 | ) | .96 | | .74 | | 1.68 | | .54 | |
| Distributions: | | | | | | | | | | |
| Dividends from | | | | | | | | | | |
| investment income—net | (.33 | ) | (.32 | ) | (.45 | ) | (.53 | ) | (.56 | ) |
| Dividends from net realized | | | | | | | | | | |
| gain on investments | (.13 | ) | — | | — | | — | | — | |
| Total Distributions | (.46 | ) | (.32 | ) | (.45 | ) | (.53 | ) | (.56 | ) |
| Net asset value, end of period | 13.59 | | 14.08 | | 13.44 | | 13.15 | | 12.00 | |
| Total Return (%)b | (.24 | ) | 7.26 | | 5.75 | | 14.29 | | 4.90 | |
| Ratios/Supplemental Data (%): | | | | | | | | | | |
| Ratio of total expenses | | | | | | | | | | |
| to average net assets | .86 | | .89 | | .88 | | .89 | | .92 | |
| Ratio of net expenses | | | | | | | | | | |
| to average net assets | .86 | | .89 | | .88 | | .88 | | .82 | |
| Ratio of net investment income | | | | | | | | | | |
| to average net assets | 1.82 | | 1.80 | | 3.14 | | 4.21 | | 4.93 | |
| Portfolio Turnover Ratec | 447.47 | | 464.84 | | 371.17 | | 237.07 | | 343.03 | |
| Net Assets, end of period | | | | | | | | | | |
| ($ x 1,000) | 848,610 | | 990,446 | | 1,110,179 | | 1,176,710 | | 1,125,878 | |
| |
| a | Based on average shares outstanding at each month end. |
| b | Exclusive of sales charge. |
| c | The portfolio turnover rates excluding mortgage dollar roll transactions for the periods ended July 31, 2013, 2012, |
| | 2011, 2010 and 2009 were 227.13%, 205.07%, 156.79%, 90.98% and 108.07%, respectively. |
| See notes to financial statements. |
The Fund 27
FINANCIAL HIGHLIGHTS (continued)
| | | | | | | | | | |
| | | | Year Ended July 31, | | | |
| Class C Shares | 2013 | | 2012 | | 2011 | | 2010 | | 2009 | |
| Per Share Data ($): | | | | | | | | | | |
| Net asset value, beginning of period | 14.08 | | 13.44 | | 13.15 | | 12.00 | | 12.02 | |
| Investment Operations: | | | | | | | | | | |
| Investment income—neta | .15 | | .15 | | .32 | | .43 | | .46 | |
| Net realized and unrealized | | | | | | | | | | |
| gain (loss) on investments | (.28 | ) | .72 | | .33 | | 1.15 | | (.02 | ) |
| Total from Investment Operations | (.13 | ) | .87 | | .65 | | 1.58 | | .44 | |
| Distributions: | | | | | | | | | | |
| Dividends from investment income—net | (.23 | ) | (.23 | ) | (.36 | ) | (.43 | ) | (.46 | ) |
| Dividends from net realized | | | | | | | | | | |
| gain on investments | (.13 | ) | — | | — | | — | | — | |
| Total Distributions | (.36 | ) | (.23 | ) | (.36 | ) | (.43 | ) | (.46 | ) |
| Net asset value, end of period | 13.59 | | 14.08 | | 13.44 | | 13.15 | | 12.00 | |
| Total Return (%)b | (.99 | ) | 6.49 | | 5.01 | | 13.40 | | 4.01 | |
| Ratios/Supplemental Data (%): | | | | | | | | | | |
| Ratio of total expenses | | | | | | | | | | |
| to average net assets | 1.61 | | 1.63 | | 1.59 | | 1.66 | | 1.69 | |
| Ratio of net expenses | | | | | | | | | | |
| to average net assets | 1.61 | | 1.63 | | 1.59 | | 1.66 | | 1.69 | |
| Ratio of net investment income | | | | | | | | | | |
| to average net assets | 1.08 | | 1.07 | | 2.44 | | 3.41 | | 4.07 | |
| Portfolio Turnover Ratec | 447.47 | | 464.84 | | 371.17 | | 237.07 | | 343.03 | |
| Net Assets, end of period ($ x 1,000) | 34,259 | | 43,439 | | 41,001 | | 47,907 | | 50,196 | |
| |
| a | Based on average shares outstanding at each month end. |
| b | Exclusive of sales charge. |
| c | The portfolio turnover rates excluding mortgage dollar roll transactions for the periods ended July 31, 2013, 2012, |
| | 2011, 2010 and 2009 were 227.13%, 205.07%, 156.79%, 90.98% and 108.07%, respectively. |
| See notes to financial statements. |
28
| | | | | | | | | | |
| | | | Year Ended July 31, | | | |
| Class I Shares | 2013 | | 2012 | | 2011 | | 2010 | | 2009 | |
| Per Share Data ($): | | | | | | | | | | |
| Net asset value, beginning of period | 14.08 | | 13.44 | | 13.14 | | 12.00 | | 12.01 | |
| Investment Operations: | | | | | | | �� | | | |
| Investment income—neta | .29 | | .28 | | .46 | | .56 | | .58 | |
| Net realized and unrealized | | | | | | | | | | |
| gain (loss) on investments | (.28 | ) | .72 | | .34 | | 1.15 | | .00 | b |
| Total from Investment Operations | .01 | | 1.00 | | .80 | | 1.71 | | .58 | |
| Distributions: | | | | | | | | | | |
| Dividends from investment income—net | (.37 | ) | (.36 | ) | (.50 | ) | (.57 | ) | (.59 | ) |
| Dividends from net realized | | | | | | | | | | |
| gain on investments | (.13 | ) | — | | — | | — | | — | |
| Total Distributions | (.50 | ) | (.36 | ) | (.50 | ) | (.57 | ) | (.59 | ) |
| Net asset value, end of period | 13.59 | | 14.08 | | 13.44 | | 13.14 | | 12.00 | |
| Total Return (%) | .01 | | 7.59 | | 6.09 | | 14.52 | | 5.27 | |
| Ratios/Supplemental Data (%): | | | | | | | | | | |
| Ratio of total expenses | | | | | | | | | | |
| to average net assets | .61 | | .69 | | .55 | | .62 | | .60 | |
| Ratio of net expenses | | | | | | | | | | |
| to average net assets | .58 | | .69 | | .55 | | .59 | | .54 | |
| Ratio of net investment income | | | | | | | | | | |
| to average net assets | 2.12 | | 1.99 | | 3.46 | | 4.46 | | 5.18 | |
| Portfolio Turnover Ratec | 447.47 | | 464.84 | | 371.17 | | 237.07 | | 343.03 | |
| Net Assets, end of period ($ x 1,000) | 259,454 | | 90,383 | | 26,085 | | 29,781 | | 27,624 | |
| |
| a | Based on average shares outstanding at each month end. |
| b | Amount represents less than $.01 per share. |
| c | The portfolio turnover rates excluding mortgage dollar roll transactions for the periods ended July 31, 2013, 2012, |
| | 2011, 2010 and 2009 were 227.13%, 205.07%, 156.79%, 90.98% and 108.07%, respectively. |
| See notes to financial statements. |
The Fund 29
FINANCIAL HIGHLIGHTS (continued)
| | |
| | Period Ended | |
| Class Y Shares | July 31, 2013a | |
| Per Share Data ($): | | |
| Net asset value, beginning of period | 13.59 | |
| Investment Operations: | | |
| Investment income—netb | .02 | |
| Net realized and unrealized | | |
| gain (loss) on investments | .01 | |
| Total from Investment Operations | .03 | |
| Distributions: | | |
| Dividends from investment income—net | (.03 | ) |
| Net asset value, end of period | 13.59 | |
| Total Return (%)c | .22 | |
| Ratios/Supplemental Data (%): | | |
| Ratio of total expenses to average net assetsd | .46 | |
| Ratio of net expenses to average net assetsd | .46 | |
| Ratio of net investment income | | |
| to average net assetsd | 1.97 | |
| Portfolio Turnover Ratee | 447.47 | |
| Net Assets, end of period ($ x 1,000) | 1 | |
| |
| a | From July 1, 2013 (commencement of initial offering) to July 31, 2013. |
| b | Based on average shares outstanding. |
| c | Not annualized. |
| d | Annualized. |
| e | The portfolio turnover rate excluding mortgage dollar roll transactions for the period ended July 31, 2013 was 227.13%. |
| See notes to financial statements. |
NOTES TO FINANCIAL STATEMENTS
NOTE 1—Significant Accounting Policies:
Dreyfus Intermediate Term Income Fund (the “fund”) is a separate diversified series of Dreyfus Investment Grade Funds, Inc. (the “Company”), which is registered under the Investment Company Act of 1940, as amended (the “Act”), as an open-end management investment company and operates as a series company currently offering three series, including the fund. The fund’s investment objective seeks to maximize total return, consisting of capital appreciation and current income. The Dreyfus Corporation (the “Manager” or “Dreyfus”), a wholly-owned subsidiary of The Bank of New York Mellon Corporation (“BNY Mellon”), serves as the fund’s investment adviser.
As of the close of business on January 18, 2013, pursuant to an Agreement and Plan of Reorganization previously approved by the Company’s Board of Directors (the “Board”), all of the assets, subject to the liabilities, of Dreyfus Investment Funds—Dreyfus/Standish Fixed Income Fund (“Standish Fixed Income”) were transferred to the fund in exchange for Class I shares of Common Stock of the fund of equal value.The purpose of the transaction was to combine two funds with comparable investment objectives and strategies. Shareholders of Standish Fixed Income received Class I shares of the fund, in an amount equal to the aggregate net asset value of their investment in Standish Fixed Income at the time of the exchange. The exchange ratio for Standish Fixed Income was 1.59 to 1.The net asset value of the fund’s shares on the close of business January 18, 2013, after the reorganization was $14.13 for Class I shares, and a total of 12,234,875 Class I shares were issued to shareholders of Standish Fixed Income in the exchange.
The Fund 31
NOTES TO FINANCIAL STATEMENTS (continued)
The net unrealized appreciation (depreciation) on investments and net assets prior to the acquisition as of the merger date for Standish Fixed Income and the fund, were as follows:
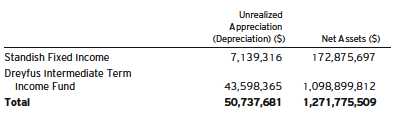
Assuming the merger had been completed on August 1, 2012, the fund’s pro forma Statement of Operations during the period ended July 31, 2013 would have been as follows:
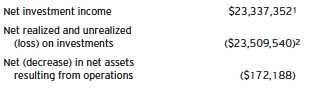
| |
| 1 | $21,572,895 as reported in the Statement of Operations plus $1,764,457 Standish Fixed |
| | Income pre-merger. |
| 2 | ($26,275,613) as reported in the Statement of Operations plus $2,766,073 Standish Fixed |
| | Income pre-merger. |
Because the combined funds have been managed as a single integrated fund since the merger was completed, it is not practicable to separate the amounts of revenue and earnings of Standish Fixed Income that have been included in the fund’s Statement of Operations during the period ended July 31, 2013.
At a meeting held on April 18, 2013, the Board approved, effective July 1, 2013: (a) for the fund to offer Class Y shares; and, (b) an increase in the authorized shares of the fund from 1.2 billion to 1.3 billion and authorized 100 million Class Y shares.
MBSC Securities Corporation (the “Distributor”), a wholly-owned subsidiary of the Manager, is the distributor of the fund’s shares.The fund is authorized to issue 1.3 billion shares of $.001 par value
32
Common Stock.The fund currently offers four classes of shares: Class A (500 million shares authorized), Class C (200 million shares authorized), Class I (500 million shares authorized) and ClassY (100 million shares authorized). Class A shares generally are subject to a sales charge imposed at the time of purchase. Class C shares are subject to a contingent deferred sales charge (“CDSC”) imposed on Class C shares redeemed within one year of purchase. Class I shares are sold at net asset value per share only to institutional investors. Class Y shares are sold at net asset value per share to certain investors, including certain institutional investors. Other differences between the classes include the services offered to and the expenses borne by each class, the allocation of certain transfer agency costs and certain voting rights. Income, expenses (other than expenses attributable to a specific class), and realized and unrealized gains or losses on investments are allocated to each class of shares based on its relative net assets.
The sales charge may be reduced or waived for certain purchases of Class A shares. Effective April 1, 2013, pursuant to new/modified front-end sales charge waivers, Class A shares of the fund may be purchased at net asset value without payment of a sales charge by (a) investors who participate in a self-directed investment brokerage account program offered by financial intermediaries that have entered into an agreement with the fund’s Distributor (financial intermediaries offering self-directed investment brokerage accounts may or may not charge their customers a transaction fee) and (b) investors who purchase Class A shares directly through the fund’s Distributor, and either (i) have, or whose spouse or minor children have, beneficially owned shares and continuously maintained an open account with the Distributor in a Dreyfus-managed fund since on or before February 28, 2006, or (ii) such purchase is for a self-directed investment account that may or may not be subject to a transaction fee.
As of July 31, 2013, MBC Investments Corp., an indirect subsidiary of BNY Mellon, held all of the outstanding Class Y shares of the fund.
The Fund 33
NOTES TO FINANCIAL STATEMENTS (continued)
The Company accounts separately for the assets, liabilities and operations of each series. Expenses directly attributable to each series are charged to that series’ operations; expenses which are applicable to all series are allocated among them on a pro rata basis.
The Financial Accounting Standards Board (“FASB”) Accounting Standards Codification is the exclusive reference of authoritative U.S. generally accepted accounting principles (“GAAP”) recognized by the FASB to be applied by nongovernmental entities. Rules and interpretive releases of the Securities and Exchange Commission (“SEC”) under authority of federal laws are also sources of authoritative GAAP for SEC registrants. The fund’s financial statements are prepared in accordance with GAAP, which may require the use of management estimates and assumptions.Actual results could differ from those estimates.
The Company enters into contracts that contain a variety of indemnifications.The fund’s maximum exposure under these arrangements is unknown.The fund does not anticipate recognizing any loss related to these arrangements.
(a) Portfolio valuation: The fair value of a financial instrument is the amount that would be received to sell an asset or paid to transfer a liability in an orderly transaction between market participants at the measurement date (i.e., the exit price). GAAP establishes a fair value hierarchy that prioritizes the inputs of valuation techniques used to measure fair value.This hierarchy gives the highest priority to unadjusted quoted prices in active markets for identical assets or liabilities (Level 1 measurements) and the lowest priority to unobservable inputs (Level 3 measurements).
Additionally, GAAP provides guidance on determining whether the volume and activity in a market has decreased significantly and whether such a decrease in activity results in transactions that are not orderly. GAAP requires enhanced disclosures around valuation inputs and techniques used during annual and interim periods.
34
Various inputs are used in determining the value of the fund’s investments relating to fair value measurements.These inputs are summarized in the three broad levels listed below:
Level 1—unadjusted quoted prices in active markets for identical investments.
Level 2—other significant observable inputs (including quoted prices for similar investments, interest rates, prepayment speeds, credit risk, etc.).
Level 3—significant unobservable inputs (including the fund’s own assumptions in determining the fair value of investments).
The inputs or methodology used for valuing securities are not necessarily an indication of the risk associated with investing in those securities.
Changes in valuation techniques may result in transfers in or out of an assigned level within the disclosure hierarchy. Valuation techniques used to value the fund’s investments are as follows:
Registered investment companies that are not traded on an exchange are valued at their net asset value and are categorized within Level 1 of the fair value hierarchy.
Investments in securities, excluding short-term investments (other than U.S. Treasury Bills), financial futures, options and forward foreign currency exchange contracts (“forward contracts”) are valued each business day by an independent pricing service (the “Service”) approved by the Board. Investments for which quoted bid prices are readily available and are representative of the bid side of the market in the judgment of the Service are valued at the mean between the quoted bid prices (as obtained by the Service from dealers in such securities) and asked prices (as calculated by the Service based upon its evaluation of the market for such securities). Other investments (which constitute a majority of the portfolio securities) are valued as determined by the Service, based on methods which include consideration of the following:
The Fund 35
NOTES TO FINANCIAL STATEMENTS (continued)
yields or prices of securities of comparable quality, coupon, maturity and type; indications as to values from dealers; and general market conditions.These securities are generally categorized within Level 2 of the fair value hierarchy.
The Service’s procedures are reviewed by Dreyfus under the general supervision of the Board.
When market quotations or official closing prices are not readily available, or are determined not to reflect accurately fair value, such as when the value of a security has been significantly affected by events after the close of the exchange or market on which the security is principally traded (for example, a foreign exchange or market), but before the fund calculates its net asset value, the fund may value these investments at fair value as determined in accordance with the procedures approved by the Board. Certain factors may be considered when fair valuing investments such as: fundamental analytical data, the nature and duration of restrictions on disposition, an evaluation of the forces that influence the market in which the securities are purchased and sold, and public trading in similar securities of the issuer or comparable issuers.These securities are either categorized within Level 2 or 3 of the fair value hierarchy depending on the relevant inputs used.
For restricted securities where observable inputs are limited, assumptions about market activity and risk are used and are categorized within Level 3 of the fair value hierarchy.
Investments denominated in foreign currencies are translated to U.S. dollars at the prevailing rates of exchange.
Financial futures and options, which are traded on an exchange, are valued at the last sales price on the securities exchange on which such securities are primarily traded or at the last sales price on the national securities market on each business day. These securities are generally categorized within Level 1 of the fair value hierarchy. Options traded over-the-counter are valued at the mean between the bid and asked price.These securities are generally categorized within Level 2 of the
36
fair value hierarchy. Investments in swap transactions are valued each business day by the Service. Swaps are valued by the Service by using a swap pricing model which incorporates among other factors, default probabilities, recovery rates, credit curves of the underlying issuer and swap spreads on interest rates and are generally categorized within Level 2 of the fair value hierarchy. Forward contracts are valued at the forward rate and are generally categorized within Level 2 of the fair value hierarchy.
The following is a summary of the inputs used as of July 31, 2013 in valuing the fund’s investments:
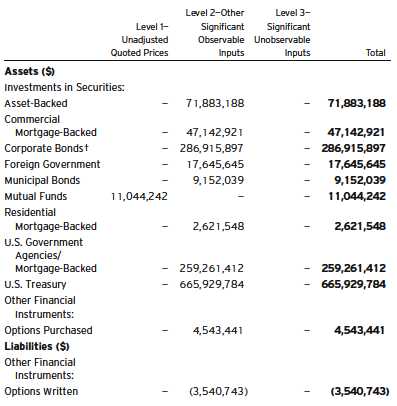
| |
| † | See Statement of Investments for additional detailed categorizations. |
The Fund 37
NOTES TO FINANCIAL STATEMENTS (continued)
At July 31, 2013, there were no transfers between Level 1 and Level 2 of the fair value hierarchy.
(b) Foreign currency transactions: The fund does not isolate that portion of the results of operations resulting from changes in foreign exchange rates on investments from the fluctuations arising from changes in the market prices of securities held. Such fluctuations are included with the net realized and unrealized gain or loss on investments.
Net realized foreign exchange gains or losses arise from sales of foreign currencies, currency gains or losses realized on securities transactions between trade and settlement date, and the difference between the amounts of dividends, interest and foreign withholding taxes recorded on the fund’s books and the U.S. dollar equivalent of the amounts actually received or paid. Net unrealized foreign exchange gains and losses arise from changes in the value of assets and liabilities other than investments resulting from changes in exchange rates. Foreign currency gains and losses on foreign currency transactions are also included with net realized and unrealized gain or loss on investments.
(c) Securities transactions and investment income: Securities transactions are recorded on a trade date basis. Realized gains and losses from securities transactions are recorded on the identified cost basis. Dividend income is recognized on the ex-dividend date and interest income, including, where applicable, accretion of discount and amortization of premium on investments, is recognized on the accrual basis.
Pursuant to a securities lending agreement with The Bank of New York Mellon, a subsidiary of BNY Mellon and an affiliate of Dreyfus, the fund may lend securities to qualified institutions. It is the fund’s policy that, at origination, all loans are secured by collateral of at least 102% of the value of U.S. securities loaned and 105% of the value of foreign securities loaned. Collateral equivalent to at least 100% of the market value of securities on loan is maintained at all times. Collateral is either in the form of cash, which can be invested in certain money market mutual funds managed by the Manager or U.S. Government
38
and Agency securities. The fund is entitled to receive all dividends, interest and distributions on securities loaned, in addition to income earned as a result of the lending transaction. Should a borrower fail to return the securities in a timely manner, The Bank of New York Mellon is required to replace the securities for the benefit of the fund or credit the fund with the market value of the unreturned securities and is subrogated to the fund’s rights against the borrower and the collateral. During the period ended July 31, 2013,The Bank of New York Mellon earned $90,577 from lending portfolio securities, pursuant to the securities lending agreement.
(d) Affiliated issuers: Investments in other investment companies advised by Dreyfus are defined as “affiliated” under the Act. Investments in affiliated investment companies during the period ended July 31, 2013 were as follows:
| | | | | | |
| Affiliated | | | | | | |
| Investment | Value | | | Value | | Net |
| Company | 7/31/2012 | ($) | Purchases ($) Sales ($) | 7/31/2013 | ($) | Assets (%) |
| Dreyfus | | | | | | |
| Institutional | | | | | | |
| Preferred | | | | | | |
| Plus Money | | | | | | |
| Market | | | | | | |
| Fund | 8,471,434 | | 576,724,846 579,258,338 | 5,937,942 | | .5 |
| Dreyfus | | | | | | |
| Institutional | | | | | | |
| Cash | | | | | | |
| Advantage | | | | | | |
| Fund | 6,366,959 | | 107,769,562 109,030,221 | 5,106,300 | | .5 |
| Total | 14,838,393 | | 684,494,408 688,288,559 | 11,044,242 | | 1.0 |
(e) Dividends to shareholders: It is the policy of the fund to declare dividends daily from investment income-net. Such dividends are paid monthly. Dividends from net realized capital gains, if any, are normally declared and paid annually, but the fund may make distributions on a more frequent basis to comply with the distribution requirements of the Internal Revenue Code of 1986, as amended (the “Code”).To the extent that net realized capital gains can be offset by capital loss carry-
The Fund 39
NOTES TO FINANCIAL STATEMENTS (continued)
overs, it is the policy of the fund not to distribute such gains. Income and capital gain distributions are determined in accordance with income tax regulations, which may differ from GAAP.
(f) Federal income taxes: It is the policy of the fund to continue to qualify as a regulated investment company, if such qualification is in the best interests of its shareholders, by complying with the applicable provisions of the Code, and to make distributions of taxable income sufficient to relieve it from substantially all federal income and excise taxes.
As of and during the period ended July 31, 2013, the fund did not have any liabilities for any uncertain tax positions.The fund recognizes interest and penalties, if any, related to uncertain tax positions as income tax expense in the Statement of Operations. During the period, the fund did not incur any interest or penalties.
Each tax year in the four-year period ended July 31, 2013 remains subject to examination by the Internal Revenue Service and state taxing authorities.
At July 31, 2013, the components of accumulated earnings on a tax basis were as follows: undistributed ordinary income $667,792 and unrealized appreciation $4,954,909. In addition, the fund had $3,293,706 of capital losses realized after October 31, 2012, which were deferred for tax purposes to the first day of the following fiscal year.
The tax character of distributions paid to shareholders during the fiscal periods ended July 31, 2013 and July 31, 2012 were as follows: ordinary income $32,397,996 and $26,482,749, and long-term capital gains $5,889,808 and $0, respectively.
During the period ended July 31, 2013, as a result of permanent book to tax differences, primarily due to the tax treatment for amortization of premiums, paydown gains and losses on mortgage-backed securities, foreign currency transactions, dividend reclassification, consent fees and capital loss carryover and wash sales from merger, the fund increased accumulated undistributed investment income-net by $2,991,859,
40
decreased accumulated net realized gain (loss) on investments by $3,692,334 and increased paid-in capital by $700,475. Net assets and net asset value per share were not affected by this reclassification.
(g) Accounting Pronouncement: In January 2013, FASB issued Accounting Standards Update No. 2013-01 (“ASU 2013-01”), “Clarifying the Scope of Disclosures about Offsetting Assets and Liabilities”, which replaced Accounting Standards Update No. 2011-11 (“ASU 2011-11”), “Disclosures about Offsetting Assets and Liabilities”. ASU 2013-01 is effective for fiscal years beginning on or after January 1, 2013, and interim periods within those annual periods. ASU 2011-11 was intended to enhance disclosure requirements on the offsetting of financial assets and liabilities.ASU 2013-01 limits the scope of the new balance sheet offsetting disclosures to derivatives, repurchase agreements, and securities lending transactions to the extent that they are (a) offset in the financial statements or (b) subject to enforceable master netting arrangements (“MNA”) or similar agreements. Management is currently evaluating the application of ASU 2013-01 and its impact on the fund’s financial statements.
NOTE 2—Bank Lines of Credit:
The fund participates with other Dreyfus-managed funds in a $210 million unsecured credit facility led by Citibank, N.A. and a $300 million unsecured credit facility provided by The Bank of New York Mellon (each, a “Facility”), each to be utilized primarily for temporary or emergency purposes, including the financing of redemptions. Prior to October 10, 2012, the unsecured credit facility with Citibank, N.A. was $225 million. In connection therewith, the fund has agreed to pay its pro rata portion of commitment fees for each Facility. Interest is charged to the fund based on rates determined pursuant to the terms of the respective Facility at the time of borrowing. During the period ended July 31, 2013, the fund did not borrow under the Facilities.
The Fund 41
NOTES TO FINANCIAL STATEMENTS (continued)
NOTE 3—Management Fee and Other Transactions With Affiliates:
(a) Pursuant to a management agreement with the Manager, the management fee is computed at the annual rate of .45% of the value of the fund’s average daily net assets and is payable monthly.The Manager has contractually agreed, from February 1, 2013 through July 1, 2014 for Class I shares and from July 1, 2013 through July 1, 2014 for Class Y shares, to waive receipt of its fees and/or assume the expenses of the fund’s Class I and Y shares, so that the expenses of the fund’s Class I and Y shares (excluding taxes, interest expense, brokerage commissions, commitment fees on borrowings and extraordinary expenses) do not exceed .55% of the value of the average daily net assets of Class I andY shares. The reduction in expenses, pursuant to the undertaking, amounted to $54,718 during the period ended July 31, 2013.
During the period ended July 31, 2013, the Distributor retained $9,015 from commissions earned on sales of the fund’s Class A shares and $3,696 from CDSCs on redemptions of the fund’s Class C shares.
(b) Under the Distribution Plan adopted pursuant to Rule 12b-1 under the Act, Class C shares pay the Distributor for distributing its shares at an annual rate of .75% of the value of its average daily net assets. During the period ended July 31, 2013, Class C shares were charged $308,784, pursuant to the Distribution Plan.
(c) Under the Shareholder Services Plan, Class A and Class C shares pay the Distributor at an annual rate of .25% of the value of their average daily net assets for the provision of certain services.The services provided may include personal services relating to shareholder accounts, such as answering shareholder inquiries regarding the fund and providing reports and other information, and services related to the maintenance of shareholder accounts.The Distributor may make payments to Service Agents (securities dealers, financial institutions or other industry professionals) with respect to these services. The Distributor determines the amounts to be paid to Service Agents.
42
During the period ended July 31, 2013, Class A and Class C shares were charged $2,361,467 and $102,928, respectively, pursuant to the Shareholder Services Plan.
The fund has arrangements with the transfer agent and the custodian whereby the fund may receive earnings credits when positive cash balances are maintained, which are used to offset transfer agency and custody fees. For financial reporting purposes, the fund includes net earnings credits as an expense offset in the Statement of Operations.
The fund compensates Dreyfus Transfer, Inc., a wholly-owned subsidiary of the Manager, under a transfer agency agreement for providing transfer agency services for the fund and cash management services related to fund subscriptions and redemptions. During the period ended July 31, 2013, the fund was charged $452,400 for transfer agency services and $14,246 for cash management services. Cash management fees were partially offset by earnings credits of $1,899. These fees are included in Shareholder servicing costs in the Statement of Operations.
The fund compensatesThe Bank of NewYork Mellon under a custody agreement for providing custodial services for the fund. During the period ended July 31, 2013, the fund was charged $106,191 pursuant to the custody agreement.
The fund compensates The Bank of New York Mellon under a cash management agreement for performing certain cash management services related to fund subscriptions and redemptions.The Bank of New York Mellon also provides shareholder redemption draft processing services. During the period ended July 31, 2013, the fund was charged $8,314 pursuant to the cash management agreement, which is included in Shareholder servicing costs in the Statement of Operations. These fees were partially offset by earnings credits of $69.
During the period ended July 31, 2013, the fund was charged $8,892 for services performed by the Chief Compliance Officer and his staff.
The Fund 43
NOTES TO FINANCIAL STATEMENTS (continued)
The components of “Due to The Dreyfus Corporation and affiliates” in the Statement of Assets and Liabilities consist of: management fees $440,052, Distribution Plan fees $22,192, Shareholder Services Plan fees $189,204, custodian fees $34,418, Chief Compliance Officer fees $5,420 and transfer agency fees $64,915, which are offset against an expense reimbursement currently in effect in the amount of $9,868.
(d) Each Board member also serves as a Board member of other funds within the Dreyfus complex. Annual retainer fees and attendance fees are allocated to each fund based on net assets.
NOTE 4—Securities Transactions:
The aggregate amount of purchases and sales (including paydowns) of investment securities, excluding short-term securities, options transactions, financial futures, forward contracts and swap transactions, during the period ended July 31, 2013, amounted to $6,341,194,100 and $6,360,969,444, respectively, of which $3,122,509,559 in purchases and $3,127,657,844 in sales were from mortgage dollar roll transactions.
Mortgage Dollar Rolls: A mortgage dollar roll transaction involves a sale by the fund of mortgage related securities that it holds with an agreement by the fund to repurchase similar securities at an agreed upon price and date.The securities purchased will bear the same interest rate as those sold, but generally will be collateralized by pools of mortgages with different prepayment histories than those securities sold.The fund accounts for mortgage dollar rolls as purchases and sales transactions.
Derivatives: A derivative is a financial instrument whose performance is derived from the performance of another asset. Each type of derivative instrument that was held by the fund during the period ended July 31, 2013 is discussed below.
The following tables show the fund’s exposure to different types of market risk as it relates to the Statement of Assets and Liabilities and the Statement of Operations, respectively.
44
Fair value of derivative instruments as of July 31, 2013 is shown below:
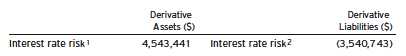
| |
| Statement of Assets and Liabilities location: |
| 1 | Options purchased are included in Investments in securities—Unaffiliated issuers, at value. |
| 2 | Outstanding options written, at value. |
The effect of derivative instruments in the Statement of Operations during the period ended July 31, 2013 is shown below:
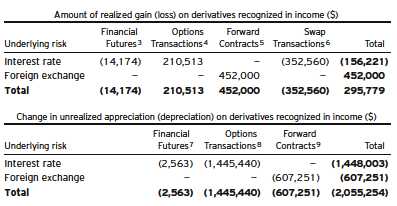
| |
| Statement of Operations location: |
| 3 | Net realized gain (loss) on financial futures. |
| 4 | Net realized gain (loss) on options transactions. |
| 5 | Net realized gain (loss) on forward foreign currency exchange contracts. |
| 6 | Net realized gain (loss) on swap transactions. |
| 7 | Net unrealized appreciation (depreciation) on financial futures. |
| 8 | Net unrealized appreciation (depreciation) on options transactions. |
| 9 | Net unrealized appreciation (depreciation) on forward foreign currency exchange contracts. |
Financial Futures: In the normal course of pursuing its investment objective, the fund is exposed to market risk, including interest rate risk as a result of changes in value of underlying financial instruments.The fund invests in financial futures in order to manage its exposure to or protect against changes in the market.A financial futures contract rep-
The Fund 45
NOTES TO FINANCIAL STATEMENTS (continued)
resents a commitment for the future purchase or a sale of an asset at a specified date. Upon entering into such contracts, these investments require initial margin deposits with a counterparty, which consist of cash or cash equivalents.The amount of these deposits is determined by the exchange or Board of Trade on which the contract is traded and is subject to change.Accordingly, variation margin payments are received or made to reflect daily unrealized gains or losses which are recorded in the Statement of Operations.When the contracts are closed, the fund recognizes a realized gain or loss which is reflected in the Statement of Operations.There is minimal counterparty credit risk to the fund with financial futures since they are exchange traded, and the exchange guarantees the financial futures against default. At July 31, 2013, there were no financial futures outstanding.
Options Transactions: The fund purchases and writes (sells) put and call options to hedge against changes in interest rates, or as a substitute for an investment.The fund is subject to market risk and interest rate risk in the course of pursuing its investment objectives through its investments in options contracts. A call option gives the purchaser of the option the right (but not the obligation) to buy, and obligates the writer to sell, the underlying security or securities at the exercise price at any time during the option period, or at a specified date. Conversely, a put option gives the purchaser of the option the right (but not the obligation) to sell, and obligates the writer to buy the underlying security or securities at the exercise price at any time during the option period, or at a specified date.
As a writer of call options, the fund receives a premium at the outset and then bears the market risk of unfavorable changes in the price of the financial instrument underlying the option. Generally, the fund realizes a gain, to the extent of the premium, if the price of the underlying financial instrument decreases between the date the option is written and the date on which the option is terminated. Generally, the fund incurs a loss if the price of the financial instrument increases between those dates.
46
As a writer of put options, the fund receives a premium at the outset and then bears the market risk of unfavorable changes in the price of the financial instrument underlying the option. Generally, the fund realizes a gain, to the extent of the premium, if the price of the underlying financial instrument increases between the date the option is written and the date on which the option is terminated. Generally, the fund incurs a loss if the price of the financial instrument decreases between those dates.
As a writer of an option, the fund has no control over whether the underlying securities may be sold (call) or purchased (put) and as a result bears the market risk of an unfavorable change in the price of the security underlying the written option. There is a risk of loss from a change in value of such options which may exceed the related premiums received.The Statement of Operations reflects the following: any unrealized gains or losses which occurred during the period as well as any realized gains or losses which occurred upon the expiration or closing of the option transaction.
The following summarizes the fund’s call/put options written during the period ended July 31, 2013:
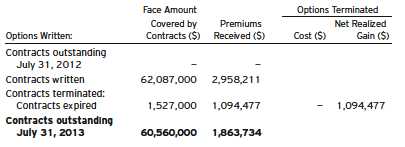
Forward Foreign Currency Exchange Contracts: The fund enters into forward contracts in order to hedge its exposure to changes in foreign currency exchange rates on its foreign portfolio holdings, to settle foreign currency transactions or as a part of its investment strategy. When executing forward contracts, the fund is obligated to buy or sell
The Fund 47
NOTES TO FINANCIAL STATEMENTS (continued)
a foreign currency at a specified rate on a certain date in the future. With respect to sales of forward contracts, the fund incurs a loss if the value of the contract increases between the date the forward contract is opened and the date the forward contract is closed.The fund realizes a gain if the value of the contract decreases between those dates. With respect to purchases of forward contracts, the fund incurs a loss if the value of the contract decreases between the date the forward contract is opened and the date the forward contract is closed.The fund realizes a gain if the value of the contract increases between those dates. Any realized or unrealized gains or losses which occurred during the period are reflected in the Statement of Operations. The fund is exposed to foreign currency risk as a result of changes in value of underlying financial instruments.The fund is also exposed to credit risk associated with counterparty nonperformance on these forward contracts, which is typically limited to the unrealized gain on each open contract. At July 31, 2013, there were no forward contracts outstanding.
Swap Transactions:The fund enters into swap agreements to exchange the interest rate on, or return generated by, one nominal instrument for the return generated by another nominal instrument.The fund enters into these agreements to hedge certain market or interest rate risks, to manage the interest rate sensitivity (sometimes called duration) of fixed income securities, to provide a substitute for purchasing or selling particular securities or to increase potential returns.
The fund accrues for the interim payments on swap agreements on a daily basis, with the net amount recorded within unrealized appreciation (depreciation) on swap agreements in the Statement of Assets and Liabilities. Once the interim payments are settled in cash, the net amount is recorded as a realized gain (loss) on swaps, in addition to realized gain (loss) recorded upon the termination of swap agreements in the Statement of Operations. Upfront payments made and/or received by the fund, are recorded as an asset and/or liability in the Statement of Assets and Liabilities and are recorded as a realized gain or loss ratably over the agreement’s term/event with the exception of
48
forward starting interest rate swaps which are recorded as realized gains or losses on the termination date. Fluctuations in the value of swap agreements are recorded for financial statement purposes as unrealized appreciation or depreciation on swap transactions.
Interest Rate Swaps: Interest rate swaps involve the exchange of commitments to pay and receive interest based on a notional principal amount.The fund may elect to pay a fixed rate and receive a floating rate, or receive a fixed rate and pay a floating rate on a notional principal amount.The net interest received or paid on interest rate swap agreements is included within realized gain (loss) on swap agreements in the Statement of Operations. Interest rate swap agreements are subject to general market risk, liquidity risk, counterparty risk and interest rate risk. For financial reporting purposes, forward rate agreements are classified as interest rate swaps.At July 31, 2013, there were no interest rate swap agreements outstanding.
The following summarizes the average market value of derivatives outstanding during the period ended July 31, 2013:
| |
| | Average Market Value ($) |
| Interest rate financial futures | 83,531,206 |
| Interest rate options contracts | 2,713,003 |
| Forward contracts | 62,952,175 |
The following summarizes the average notional value of swap contracts outstanding during the period ended July 31, 2013:
| |
| | Average Notional Value ($) |
| Interest rate swap agreements | 12,516,923 |
At July 31, 2013, the cost of investments for federal income tax purposes was $1,369,508,199; accordingly, accumulated net unrealized appreciation on investments was $6,631,918, consisting of $22,074,182 gross unrealized appreciation and $15,442,264 gross unrealized depreciation.
The Fund 49
REPORT OF INDEPENDENT REGISTERED
PUBLIC ACCOUNTING FIRM
Shareholders and Board of Directors
Dreyfus Intermediate Term Income Fund
We have audited the accompanying statement of assets and liabilities, including the statements of investments and options written, of Dreyfus IntermediateTerm Income Fund (one of the series comprising Dreyfus Investment Grade Funds, Inc.) as of July 31, 2013, and the related statement of operations for the year then ended, the statement of changes in net assets for each of the two years in the period then ended, and the financial highlights for each of the periods indicated therein. These financial statements and financial highlights are the responsibility of the Fund’s management. Our responsibility is to express an opinion on these financial statements and financial highlights based on our audits.
We conducted our audits in accordance with the standards of the Public Company Accounting Oversight Board (United States).Those standards require that we plan and perform the audit to obtain reasonable assurance about whether the financial statements and financial highlights are free of material misstatement.We were not engaged to perform an audit of the Fund’s internal control over financial reporting. Our audits included consideration of internal control over financial reporting as a basis for designing audit procedures that are appropriate in the circumstances, but not for the purpose of expressing an opinion on the effectiveness of the Fund’s internal control over financial reporting. Accordingly, we express no such opinion. An audit also includes examining, on a test basis, evidence supporting the amounts and disclosures in the financial statements and financial highlights, assessing the accounting principles used and significant estimates made by management, and evaluating the overall financial statement presentation. Our procedures included confirmation of securities owned as of July 31, 2013 by correspondence with the custodian and others.We believe that our audits provide a reasonable basis for our opinion.
In our opinion, the financial statements and financial highlights referred to above present fairly, in all material respects, the financial position of Dreyfus Intermediate Term Income Fund at July 31, 2013, the results of its operations for the year then ended, the changes in its net assets for each of the two years in the period then ended, and the financial highlights for each of the indicated periods, in conformity with U.S. generally accepted accounting principles.
New York, New York September 26, 2013
50
IMPORTANT TAX INFORMATION (Unaudited)
The fund hereby reports 75.93% of ordinary income dividends paid during the fiscal year ended July 31, 2013 as qualifying “interest related dividends”.Also, the fund hereby reports $.1079 per share as a short-term capital gain distribution and $.0256 per share as a long-term capital gain distribution paid on December 12, 2012.
The Fund 51
INFORMATION ABOUT THE RENEWAL OF THE
FUND’S MANAGEMENT AGREEMENT (Unaudited)
At a meeting of the fund’s Board of Directors held on July 17 and 18, 2013, the Board considered the renewal of the fund’s Management Agreement pursuant to which Dreyfus provides the fund with investment advisory and administrative services (the “Agreement”). The Board members, a majority of whom are not “interested persons” (as defined in the Investment Company Act of 1940, as amended) of the fund, were assisted in their review by independent legal counsel and met with counsel in executive session separate from Dreyfus representatives. In considering the renewal of the Agreement, the Board considered all factors that it believed to be relevant, including those discussed below. The Board did not identify any one factor as dispositive, and each Board member may have attributed different weights to the factors considered.
Analysis of Nature, Extent, and Quality of Services Provided to the Fund. The Board considered information provided to them at the meeting and in previous presentations from Dreyfus representatives regarding the nature, extent, and quality of the services provided to funds in the Dreyfus fund complex. Dreyfus provided the number of open accounts in the fund, the fund’s asset size and the allocation of fund assets among distribution channels. Dreyfus also had previously provided information regarding the diverse intermediary relationships and distribution channels of funds in the Dreyfus fund complex (such as retail direct or intermediary, in which intermediaries typically are paid by the fund and/or Dreyfus) and Dreyfus’ corresponding need for broad, deep, and diverse resources to be able to provide ongoing shareholder services to each intermediary or distribution channel, as applicable to the fund.
The Board also considered research support available to, and portfolio management capabilities of, the fund’s portfolio management personnel and that Dreyfus also provides oversight of day-to-day fund operations, including fund accounting and administration and assistance in meeting legal and regulatory requirements.The Board also considered Dreyfus’ extensive administrative, accounting, and compliance infrastructures.
52
Comparative Analysis of the Fund’s Performance and Management Fee and Expense Ratio. The Board reviewed reports prepared by Lipper, Inc. (“Lipper”), an independent provider of investment company data, which included information comparing (1) the fund’s performance with the performance of a group of comparable funds (the “Performance Group”) and with a broader group of funds (the “Performance Universe”), all for various periods ended May 31, 2013, and (2) the fund’s actual and contractual management fees and total expenses with those of a group of comparable funds (the “Expense Group”) and with a broader group of funds (the “Expense Universe”), the information for which was derived in part from fund financial statements available to Lipper as of the date of its analysis. Dreyfus previously had furnished the Board with a description of the methodology Lipper used to select the Performance Group and Performance Universe and the Expense Group and Expense Universe.
Dreyfus representatives stated that the usefulness of performance comparisons may be affected by a number of factors, including different investment limitations that may be applicable to the fund and comparison funds. The Board discussed the results of the comparisons and noted that the fund’s total return performance was above the Performance Group median for the various periods, except for the one- and four-year periods when the fund’s performance was slightly below the Performance Group median, and above the Performance Universe median for all periods.The Board also noted that the fund’s yield performance was above the Performance Group median for six of the ten one-year periods and above or at the Performance Universe median for eight of the ten one-year periods ended May 31st. Dreyfus also provided a comparison of the fund’s calendar year total returns to the returns of the fund’s benchmark index.
The Board also reviewed the range of actual and contractual management fees and total expenses of the Expense Group and Expense Universe
The Fund 53
INFORMATION ABOUT THE RENEWAL OF THE FUND’S
MANAGEMENT AGREEMENT (Unaudited) (continued)
funds and discussed the results of the comparisons.The Board noted that the fund’s contractual management fee was below the Expense Group median, the fund’s actual management fee was at the Expense Group median and above the Expense Universe median and the fund’s total expenses were above the Expense Group and Expense Universe medians. Dreyfus representatives noted that Dreyfus has contractually agreed to waive receipt of its fees and/or assume the expenses of the fund, until July 1, 2014, so that annual direct fund operating expenses of the fund’s Class I andY shares (excluding taxes, interest, brokerage commissions, commitment fees on borrowings and extraordinary expenses) do not exceed 0.55% of the value of the fund’s average daily net assets.
Dreyfus representatives reviewed with the Board the management or investment advisory fees (1) paid by funds advised or administered by Dreyfus that are in the same Lipper category as the fund and (2) paid to Dreyfus or the Dreyfus-affiliated primary employer of the fund’s primary portfolio manager(s) for advising any separate accounts and/or other types of client portfolios that are considered to have similar investment strategies and policies as the fund (the “Similar Clients”), and explained the nature of the Similar Clients.They discussed differences in fees paid and the relationship of the fees paid in light of any differences in the services provided and other relevant factors. The Board considered the relevance of the fee information provided for the Similar Clients to evaluate the appropriateness and reasonableness of the fund’s management fee.
Analysis of Profitability and Economies of Scale. Dreyfus representatives reviewed the expenses allocated and profit received by Dreyfus and the resulting profitability percentage for managing the fund and the aggregate profitability percentage to Dreyfus of managing the funds in the Dreyfus fund complex, and the method used to determine the expenses and profit. The Board concluded that the profitability results were not unreasonable, given the services rendered and service
54
levels provided by Dreyfus. The Board also had been provided with information prepared by an independent consulting firm regarding Dreyfus’ approach to allocating costs to, and determining the profitability of, individual funds and the entire Dreyfus fund complex.The consulting firm also had analyzed where any economies of scale might emerge in connection with the management of a fund.
The Board considered on the advice of its counsel the profitability analysis (1) as part of its evaluation of whether the fees under the Agreement bear a reasonable relationship to the mix of services provided by Dreyfus, including the nature, extent and quality of such services, and (2) in light of the relevant circumstances for the fund and the extent to which economies of scale would be realized if the fund grows and whether fee levels reflect these economies of scale for the benefit of fund shareholders. Dreyfus representatives noted that a discussion of economies of scale is predicated on a fund having achieved a substantial size with increasing assets and that, if a fund’s assets had been stable or decreasing, the possibility that Dreyfus may have realized any economies of scale would be less. Dreyfus representatives noted that, as a result of shared and allocated costs among funds in the Dreyfus fund complex, the extent of economies of scale could depend substantially on the level of assets in the complex as a whole, so that increases and decreases in complex-wide assets can affect potential economies of scale in a manner that is disproportionate to, or even in the opposite direction from, changes in the fund’s asset level. The Board also considered potential benefits to Dreyfus from acting as investment adviser and noted that there were no soft dollar arrangements in effect for trading the fund’s investments.
At the conclusion of these discussions, the Board agreed that it had been furnished with sufficient information to make an informed business decision with respect to the renewal of the Agreement. Based
The Fund 55
INFORMATION ABOUT THE RENEWAL OF THE FUND’S
MANAGEMENT AGREEMENT (Unaudited) (continued)
on the discussions and considerations as described above, the Board concluded and determined as follows.
The Board concluded that the nature, extent and quality of the services provided by Dreyfus are adequate and appropriate.
The Board generally was satisfied with the fund’s performance.
The Board concluded that the fee paid to Dreyfus was reasonable in light of the considerations described above.
The Board determined that the economies of scale which may accrue to Dreyfus and its affiliates in connection with the management of the fund had been adequately considered by Dreyfus in connection with the fee rate charged to the fund pursuant to the Agreement and that, to the extent in the future it were determined that material economies of scale had not been shared with the fund, the Board would seek to have those economies of scale shared with the fund.
In evaluating the Agreement, the Board considered these conclusions and determinations and also relied on its previous knowledge, gained through meetings and other interactions with Dreyfus and its affiliates, of the fund and the services provided to the fund by Dreyfus. The Board also relied on information received on a routine and regular basis throughout the year relating to the operations of the fund and the investment management and other services provided under the Agreement, including information on the investment performance of the fund in comparison to similar mutual funds and benchmark performance indices; general market outlook as applicable to the fund; and compliance reports. In addition, the Board’s consideration of the contractual fee arrangements for this fund had the benefit of a number of years of reviews of prior or similar agreements during which lengthy discussions took place between the Board and Dreyfus representatives. Certain aspects of the arrangements may receive greater scrutiny in some years than in others, and the Board’s conclusions may be based, in part, on their consideration of the same or similar arrangements in prior years.The Board determined that renewal of the Agreement was in the best interests of the fund and its shareholders.
56
BOARD MEMBERS INFORMATION (Unaudited)
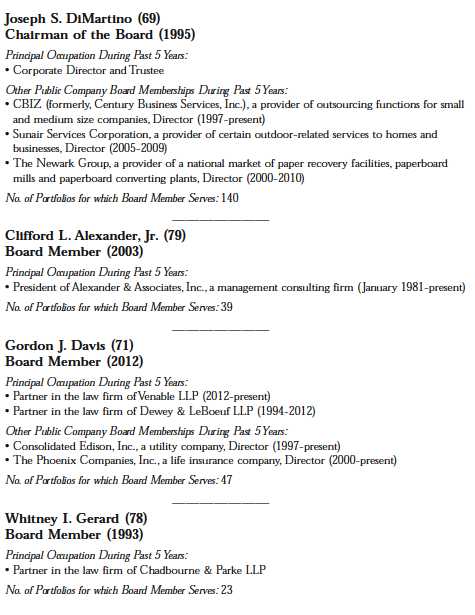
The Fund 57
BOARD MEMBERS INFORMATION (Unaudited) (continued)
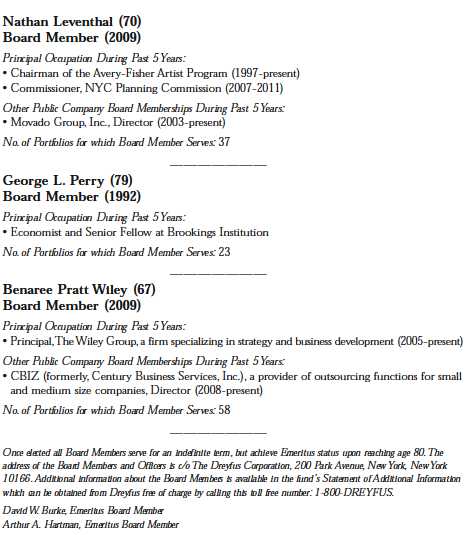
58
OFFICERS OF THE FUND (Unaudited)
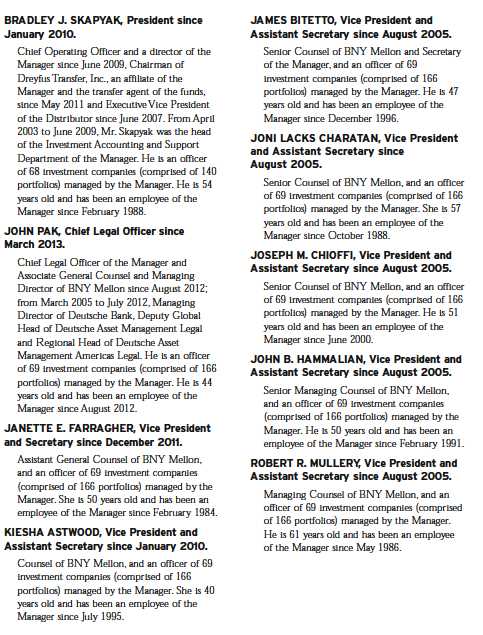
The Fund 59
OFFICERS OF THE FUND (Unaudited) (continued)
60
Save time. Save paper. View your next shareholder report online as soon as it’s available. Log into www.dreyfus.com and sign up for Dreyfus eCommunications. It’s simple and only takes a few minutes.
The views expressed in this report reflect those of the portfolio manager only through the end of the period covered and do not necessarily represent the views of Dreyfus or any other person in the Dreyfus organization. Any such views are subject to change at any time based upon market or other conditions and Dreyfus disclaims any responsibility to update such views.These views may not be relied on as investment advice and, because investment decisions for a Dreyfus fund are based on numerous factors, may not be relied on as an indication of trading intent on behalf of any Dreyfus fund.
| | Contents |
| | THE FUND |
| 2 | A Letter from the President |
| 3 | Discussion of Fund Performance |
| 6 | Fund Performance |
| 8 | Understanding Your Fund’s Expenses |
| 8 | Comparing Your Fund’s Expenses With Those of Other Funds |
| 9 | Statement of Investments |
| 18 | Statement of Financial Futures |
| 18 | Statement of Options Written |
| 19 | Statement of Assets and Liabilities |
| 20 | Statement of Operations |
| 21 | Statement of Changes in Net Assets |
| 23 | Financial Highlights |
| 25 | Notes to Financial Statements |
| 42 | Report of Independent Registered Public Accounting Firm |
| 43 | Important Tax Information |
| 44 | Information About the Renewal of the Fund’s Management Agreement |
| 50 | Board Members Information |
| 52 | Officers of the Fund |
| | FOR MORE INFORMATION |
| | Back Cover |
Dreyfus
Short Term Income Fund
The Fund
A LETTER FROM THE PRESIDENT
Dear Shareholder:
We are pleased to present this annual report for Dreyfus Short Term Income Fund, covering the 12-month period from August 1, 2012, through July 31, 2013. For information about how the fund performed during the reporting period, as well as general market perspectives, we provide a Discussion of Fund Performance on the pages that follow.
After more than 30 years of declining interest rates, it appears that the secular bull market in bonds may be over. By early 2013, bond yields declined to levels that provided little room for further declines, making an upward trend more likely in the midst of a slow-but-sustained U.S. economic recovery. Indeed, improvements in U.S. housing and labor markets during the reporting period prompted the Federal Reserve Board (the “Fed”) to signal its intent to back away from its quantitative easing program later this year, a development that sparked heightened bond market volatility during the second quarter of 2013.
We expect the U.S. economic recovery to accelerate later this year in advance of a multi-year expansion. Pent-up demographic demand could support continued expansion in the housing market, and higher home equity levels may bolster consumer confidence and spending. In the bond market, the Fed’s widely anticipated shift to a more moderately stimulative monetary policy stance is likely to presage a multiyear upward drift in interest rates as the relationship between rates and economic conditions normalizes. While these developments may hurt some segments of the bond market, others could respond more favorably.Therefore, as always, we urge you to discuss our observations with your financial adviser.
Thank you for your continued confidence and support.
Sincerely,

J. Charles Cardona President The Dreyfus Corporation August 15, 2013
2
DISCUSSION OF FUND PERFORMANCE
For the period of August 1, 2012, through July 31, 2013, as provided by David Horsfall and David Bowser, CFA, Portfolio Managers
Fund and Market Performance Overview
For the 12-month period ended July 31, 2013, Dreyfus Short Term Income Fund’s Class D shares produced a total return of 1.60%, and Class P shares produced a total return of 1.56%.1 In comparison, the fund’s benchmark, the BofA Merrill Lynch 1-5 Year Corporate/Government Index (the “Index”), achieved a total return of 0.47% for the same period.2
Interest rates generally remained steady until late in the reporting period, when longer term bonds encountered heightened volatility in anticipation of a more moderately accommodative monetary policy from the Federal Reserve Board (the “Fed”). The fund produced higher returns than the Index, mainly due to strong security selections among corporate-backed bonds.
The Fund’s Investment Approach
The fund seeks to maximize total return, consisting of capital appreciation and current income. To pursue its goal, the fund invests at least 80% of its net assets, plus any borrowings for investment purposes, in fixed-income securities of U.S. or foreign issuers rated investment grade or the unrated equivalent as determined by Dreyfus.This may include U.S. government bonds and notes, corporate bonds, municipal bonds, convertible securities, preferred stocks, inflation-indexed securities, asset-backed securities, mortgage-related securities (including CMOs), and foreign bonds. For additional yield, the fund may invest up to 20% of its assets in fixed-income securities rated below investment grade (“high yield” or “junk” bonds) to as low as Caa/CCC or the unrated equivalent as determined by Dreyfus.The fund will focus primarily on U.S. securities, but may invest up to 30% of its total assets in fixed-income securities of foreign issuers, including those of issuers in emerging markets.Typically, the fund’s portfolio can be expected to have an average effective maturity and an average effective duration of three years or less.
The Fund 3
DISCUSSION OF FUND PERFORMANCE (continued)
Fed Comments Roiled Bond Market
Gradually improving employment data and rebounding housing markets in a slowly recovering U.S. economy supported prices of higher yielding bonds over much of the reporting period. Meanwhile, yields of short-term U.S. government securities remained near historical lows in light of the Fed’s unchanged target of 0% to 0.25% for the overnight federal funds rate.Yields of longer term government bonds also remained low due to the Fed’s open-ended quantitative easing program involving monthly purchases of $85 billion of U.S. government securities.
In 2013, investors began to anticipate higher intermediate- and long-term interest rates in the recovering economy, causing yields of longer term U.S. government securities to climb while yields of short-term bonds remained anchored by the unchanged federal funds rate. Investors’ worries about rising longer term rates intensified in late May and June, when remarks by Fed Chairman Ben Bernanke were interpreted as a signal that the central bank would back away from its ongoing quantitative easing program sooner than many analysts expected. Consequently, prices of longer term bonds fell sharply in most market sectors before stabilizing in July. Shorter term bonds lost value to a significantly lower degree.
Corporate-Backed Securities Buoyed Fund Results
An emphasis on higher yielding sectors of the U.S. bond market helped the fund participate more fully in their relative strength from August 2012 through April 2013. Overweighted exposure to BBB-rated corporate bonds, and out-of-index positions in high yield securities, fared particularly well. The fund also held U.S. dollar-denominated sovereign bonds from the emerging markets, which rebounded along with global economic prospects.Tactical trades in foreign currencies, including the South African rand, further bolstered relative performance.The fund employed futures contracts to establish its currency positions.
When the U.S. bond market encountered heightened volatility in May, we trimmed its overweighted positions in higher yielding market sectors, including corporate-backed bonds, and we eliminated its positions in sovereign bonds from overseas issuers. Finally, we modestly increased the fund’s exposure to attractively valued asset-backed securities. These changes proved successful in sheltering the fund from the brunt of heightened market volatility.
4
A More Cautious Investment Posture
As of the reporting period’s end, we expect bond market volatility to persist. Expectations of a shift later this year to a more moderately accommodative U.S. monetary policy have been exacerbated by disappointing economic data from overseas markets, leading some analysts to question the sustainability of the global recovery. However, we also have seen some stabilization of U.S. interest rates and higher yielding bond prices, and we remain watchful for opportunities to purchase attractively valued securities that may have been punished too severely by recent market turbulence. Nonetheless, in light of the risks of ongoing market volatility, we have maintained a relatively cautious investment posture, including a neutral average duration and a more mild emphasis on corporate-backed securities.
August 15, 2013
|
| Bond funds are subject generally to interest rate, credit, liquidity and market risks, to varying degrees, all of which are |
| more fully described in the fund’s prospectus. Generally, all other factors being equal, bond prices are inversely related |
| to interest-rate changes, and rate increases can cause price declines. |
| High yield bonds are subject to increased credit risk and are considered speculative in terms of the issuer’s perceived |
| ability to continue making interest payments on a timely basis and to repay principal upon maturity. |
| Investing internationally involves special risks, including changes in currency exchange rates, political, economic and |
| social instability, a lack of comprehensive company information, differing auditing and legal standards, and less market |
| liquidity.The fixed income securities of issuers located in emerging markets can be more volatile and less liquid than |
| those of issuers in more mature economies. |
| The fund may use derivative instruments, such as options, futures and options on futures, forward contracts, swaps |
| (including credit default swaps on corporate bonds and asset-backed securities), options on swaps and other credit |
| derivatives.A small investment in derivatives could have a potentially large impact on the fund’s performance.The use |
| of derivatives involves risks different from, or possibly greater than, the risks associated with investing directly in the |
| underlying assets. |
|
| 1 Total return includes reinvestment of dividends and any capital gains paid. Past performance is no guarantee of future |
| results. Share price, yield and investment return fluctuate such that upon redemption, fund shares may be worth more |
| or less than their original cost.The Dreyfus Corporation has contractually agreed, until December 1, 2013, to waive |
| receipt of its fees and/or assume the expenses of the fund so that the expenses of none of the classes (excluding Rule |
| 12b-1 fees, shareholder services fees & interest on borrowings) exceed 0.45%. |
| 2 SOURCE: LIPPER INC. — Reflects reinvestment of dividends and, where applicable, capital gain distributions. |
| The BofA Merrill Lynch 1-5Year Corporate/Government Index is a market value-weighted index that tracks the |
| performance of publicly placed, non-convertible, fixed-rate, coupon-bearing, investment-grade U.S. domestic debt. |
| Maturities of the securities range from one to five years. Investors cannot invest directly in any index. |
The Fund 5
FUND PERFORMANCE
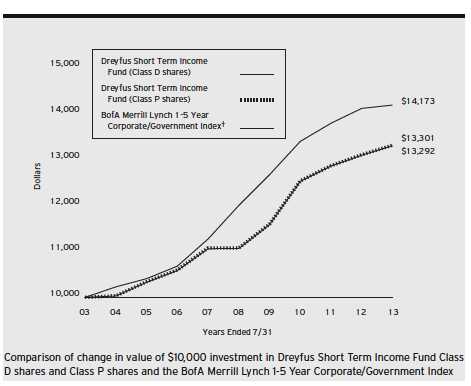
|
| † Source: Lipper Inc. |
| Past performance is not predictive of future performance. |
| The above graph compares a $10,000 investment made in each of the Class D and Class P shares of Dreyfus Short |
| Term Income Fund on 7/31/03 to a $10,000 investment made in the BofA Merrill Lynch 1-5Year |
| Corporate/Government Index (the “Index”) on that date.All dividends and capital gain distributions are reinvested. |
| The fund invests primarily in debt securities and securities with debt-like characteristics of domestic and foreign issuers |
| and maintains an average effective maturity and an average effective duration of three years or less.The Index is an |
| unmanaged performance benchmark including U.S. government and fixed-coupon domestic investment-grade corporate |
| bonds with maturities greater than or equal to one year and less than five years. Unlike a mutual fund, the Index is not |
| subject to charges, fees and other expenses. Investors cannot invest directly in any index. Further information relating to |
| fund performance, including expense reimbursements, if applicable, is contained in the Financial Highlights section of the |
| prospectus and elsewhere in this report. |
6

Past performance is not predictive of future performance.The fund’s performance shown in the graph and table does not reflect the deduction of taxes that a shareholder would pay on fund distributions or the redemption of fund shares.
The Fund 7
UNDERSTANDING YOUR FUND’S EXPENSES (Unaudited)
As a mutual fund investor, you pay ongoing expenses, such as management fees and other expenses. Using the information below, you can estimate how these expenses affect your investment and compare them with the expenses of other funds.You also may pay one-time transaction expenses, including sales charges (loads) and redemption fees, which are not shown in this section and would have resulted in higher total expenses. For more information, see your fund’s prospectus or talk to your financial adviser.
Review your fund’s expenses
The table below shows the expenses you would have paid on a $1,000 investment in Dreyfus Short Term Income Fund from February 1, 2013 to July 31, 2013. It also shows how much a $1,000 investment would be worth at the close of the period, assuming actual returns and expenses.

COMPARING YOUR FUND’S EXPENSES WITH THOSE OF OTHER FUNDS (Unaudited)
Using the SEC’s method to compare expenses
The Securities and Exchange Commission (SEC) has established guidelines to help investors assess fund expenses. Per these guidelines, the table below shows your fund’s expenses based on a $1,000 investment, assuming a hypothetical 5% annualized return. You can use this information to compare the ongoing expenses (but not transaction expenses or total cost) of investing in the fund with those of other funds.All mutual fund shareholder reports will provide this information to help you make this comparison. Please note that you cannot use this information to estimate your actual ending account balance and expenses paid during the period.
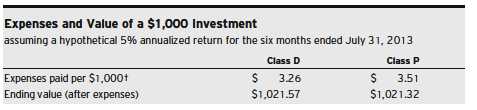
|
| † Expenses are equal to the fund’s annualized expense ratio of .65% for Class D and .70% for Class P, multiplied |
| by the average account value over the period, multiplied by 181/365 (to reflect the one-half year period). |
8
STATEMENT OF INVESTMENTS
July 31, 2013
| | | | | |
| | Coupon | Maturity | Principal | | |
| Bonds and Notes—98.1% | Rate (%) | Date | Amount ($) | | Value ($) |
| Asset-Backed Ctfs./ | | | | | |
| Auto Receivables—8.4% | | | | | |
| Ally Master Owner Trust, | | | | | |
| Ser. 2010-4, Cl. A | 1.26 | 8/15/17 | 780,000 | a | 787,945 |
| Americredit Automobile Receivables | | | | | |
| Trust, Ser. 2013-1, Cl. D | 2.09 | 2/8/19 | 840,000 | | 813,846 |
| AmeriCredit Automobile Receivables | | | | | |
| Trust, Ser. 2012-5, Cl. D | 2.35 | 12/10/18 | 415,000 | | 408,311 |
| Americredit Automobile Receivables | | | | | |
| Trust, Ser. 2012-4, Cl. D | 2.68 | 10/9/18 | 655,000 | | 653,042 |
| AmeriCredit Automobile Receivables | | | | | |
| Trust, Ser. 2012-2, Cl. D | 3.38 | 4/9/18 | 1,200,000 | | 1,227,870 |
| AmeriCredit Automobile Receivables | | | | | |
| Trust, Ser. 2012-1, Cl. D | 4.72 | 3/8/18 | 1,590,000 | | 1,687,196 |
| AmeriCredit Automobile Receivables | | | | | |
| Trust, Ser. 2011-5, Cl. D | 5.05 | 12/8/17 | 1,310,000 | | 1,394,006 |
| AmeriCredit Automobile Receivables | | | | | |
| Trust, Ser. 2010-2, Cl. E | 8.66 | 10/10/17 | 550,000 | b | 591,543 |
| Capital Auto Receivables Asset | | | | | |
| Trust, Ser. 2013-1, Cl. D | 2.19 | 9/20/21 | 440,000 | | 425,208 |
| Carmax Auto Owner Trust, | | | | | |
| Ser. 2010-3, Cl. C | 2.59 | 8/15/16 | 450,000 | | 459,824 |
| CarMax Auto Owner Trust, | | | | | |
| Ser. 2010-1, Cl. B | 3.75 | 12/15/15 | 185,000 | | 188,161 |
| CarMax Auto Owner Trust, | | | | | |
| Ser. 2010-2, Cl. B | 3.96 | 6/15/16 | 2,615,000 | | 2,696,209 |
| Santander Drive Auto Receivables | | | | | |
| Trust, Ser. 2011-S1A, Cl. C | 1.89 | 5/15/17 | 646,254 | b | 647,949 |
| Santander Drive Auto Receivables | | | | | |
| Trust, Ser. 2010-2, Cl. B | 2.24 | 12/15/14 | 115,508 | | 115,737 |
| Santander Drive Auto Receivables | | | | | |
| Trust, Ser. 2013-1, Cl. D | 2.27 | 1/15/19 | 575,000 | | 554,800 |
| Santander Drive Auto Receivables | | | | | |
| Trust, Ser. 2012-6, Cl. D | 2.52 | 9/17/18 | 755,000 | | 744,976 |
| Santander Drive Auto Receivables | | | | | |
| Trust, Ser. 2013-2, Cl. D | 2.57 | 3/15/19 | 1,460,000 | | 1,421,295 |
| Santander Drive Auto Receivables | | | | | |
| Trust, Ser. 2012-5, Cl. C | 2.70 | 8/15/18 | 1,180,000 | | 1,185,908 |
| Santander Drive Auto Receivables | | | | | |
| Trust, Ser. 2010-3, Cl. C | 3.06 | 11/15/17 | 545,000 | | 556,991 |
The Fund 9
STATEMENT OF INVESTMENTS (continued)
| | | | | |
| | Coupon | Maturity | Principal | | |
| Bonds and Notes (continued) | Rate (%) | Date | Amount ($) | | Value ($) |
| Asset-Backed Ctfs./ | | | | | |
| Auto Receivables (continued) | | | | | |
| Santander Drive Auto Receivables | | | | | |
| Trust, Ser. 2011-1, Cl. C | 3.11 | 5/16/16 | 1,275,000 | | 1,300,674 |
| Santander Drive Auto Receivables | | | | | |
| Trust, Ser. 2012-3, Cl. D | 3.64 | 5/15/18 | 820,000 | | 836,722 |
| Santander Drive Auto Receivables | | | | | |
| Trust, Ser. 2012-1, Cl. C | 3.78 | 11/15/17 | 285,000 | | 291,714 |
| Santander Drive Auto Receivables | | | | | |
| Trust, Ser. 2011-4, Cl. D | 4.74 | 9/15/17 | 620,000 | | 646,008 |
| Smart Trust, | | | | | |
| Ser. 2013-2US, Cl. A4A | 1.18 | 2/14/19 | 1,540,000 | | 1,506,890 |
| | | | | | 21,142,825 |
| Asset-Backed Ctfs./Equipment—.8% | | | | | |
| CNH Equipment Trust, | | | | | |
| Ser. 2011-A, Cl. A4 | 2.04 | 10/17/16 | 1,850,000 | | 1,878,402 |
| Asset-Backed Ctfs./ | | | | | |
| Home Equity Loans—.2% | | | | | |
| Ameriquest Mortgage Securities, | | | | | |
| Ser. 2003-11, Cl. AF6 | 5.46 | 12/25/33 | 453,968 | a | 463,387 |
| Commercial Mortgage | | | | | |
| Pass-Through Ctfs.—2.9% | | | | | |
| Banc of America Merrill Lynch | | | | | |
| Commercial Mortgage, | | | | | |
| Ser. 2004-6, Cl. A5 | 4.81 | 12/10/42 | 85,000 | | 88,412 |
| Banc of America Merrill Lynch | | | | | |
| Commercial Mortgage, | | | | | |
| Ser. 2005-6, Cl. A4 | 5.19 | 9/10/47 | 895,000 | a | 965,550 |
| Bear Stearns Commercial Mortgage | | | | | |
| Securities Trust, | | | | | |
| Ser. 2006-PW12, Cl. AAB | 5.69 | 9/11/38 | 173,018 | a | 173,005 |
| Bear Stearns Commercial Mortgage | | | | | |
| Securities Trust, | | | | | |
| Ser. 2007-PW17, Cl. AAB | 5.70 | 6/11/50 | 959,186 | | 995,420 |
| Bear Stearns Commercial Mortgage | | | | | |
| Securities, Ser. 2007-T26, Cl. A4 | 5.47 | 1/12/45 | 600,000 | a | 673,919 |
| Citigroup Commercial Mortgage | | | | | |
| Trust, Ser. 2007-C6, Cl. A4 | 5.70 | 12/10/49 | 825,000 | a | 938,059 |
| GS Mortgage Securities Corporation | | | | | |
| II Trust, Ser. 2007-EOP, Cl. B | 1.73 | 3/6/20 | 1,630,000 | a,b | 1,633,254 |
10
| | | | | |
| | Coupon | Maturity | Principal | | |
| Bonds and Notes (continued) | Rate (%) | Date | Amount ($) | | Value ($) |
| Commercial Mortgage | | | | | |
| Pass-Through Ctfs. (continued) | | | | | |
| GS Mortgage Securities Corporation | | | | | |
| II Trust, Ser. 2007-EOP, Cl. F | 2.63 | 3/6/20 | 730,000 | a,b | 731,728 |
| GS Mortgage Securities Corporation | | | | | |
| II Trust, Ser. 2007-EOP, Cl. K | 4.80 | 3/6/20 | 350,000 | a,b | 351,907 |
| JP Morgan Chase Commercial | | | | | |
| Mortgage Securities Trust, | | | | | |
| Ser. 2006-CB14, Cl. ASB | 5.51 | 12/12/44 | 155,785 | a | 162,462 |
| Morgan Stanley Capital I Trust, | | | | | |
| Ser. 2005-HQ7, Cl. A4 | 5.21 | 11/14/42 | 475,000 | a | 508,152 |
| | | | | | 7,221,868 |
| Consumer Discretionary—2.4% | | | | | |
| Comcast, | | | | | |
| Gtd. Notes | 5.90 | 3/15/16 | 655,000 | | 737,134 |
| Cox Communications, | | | | | |
| Sr. Unscd. Notes | 6.25 | 6/1/18 | 650,000 | b | 753,131 |
| Daimler Finance North America, | | | | | |
| Gtd. Notes | 1.25 | 1/11/16 | 1,130,000 | b | 1,127,898 |
| NBC Universal Media, | | | | | |
| Gtd. Notes | 3.65 | 4/30/15 | 700,000 | | 735,269 |
| Staples, | | | | | |
| Sr. Unscd. Notes | 2.75 | 1/12/18 | 1,295,000 | | 1,304,749 |
| Time Warner Cable, | | | | | |
| Gtd. Notes | 5.85 | 5/1/17 | 555,000 | | 606,691 |
| Walgreen, | | | | | |
| Sr. Unscd. Notes | 1.00 | 3/13/15 | 730,000 | | 733,444 |
| | | | | | 5,998,316 |
| Consumer Staples—1.1% | | | | | |
| ConAgra Foods, | | | | | |
| Sr. Unscd. Notes | 1.90 | 1/25/18 | 1,390,000 | | 1,382,530 |
| Mondelez International, | | | | | |
| Sr. Unscd. Notes | 6.13 | 2/1/18 | 530,000 | | 617,560 |
| Pernod-Ricard, | | | | | |
| Sr. Unscd. Notes | 2.95 | 1/15/17 | 650,000 | b | 666,599 |
| | | | | | 2,666,689 |
| Energy—.9% | | | | | |
| Anadarko Petroleum, | | | | | |
| Sr. Unscd. Notes | 6.38 | 9/15/17 | 535,000 | | 624,243 |
The Fund 11
STATEMENT OF INVESTMENTS (continued)
| | | | | |
| | Coupon | Maturity | Principal | | |
| Bonds and Notes (continued) | Rate (%) | Date | Amount ($) | | Value ($) |
| Energy (continued) | | | | | |
| EQT, | | | | | |
| Sr. Unscd. Notes | 8.13 | 6/1/19 | 215,000 | | 261,684 |
| Spectra Energy Partners, | | | | | |
| Sr. Unscd. Notes | 2.95 | 6/15/16 | 595,000 | | 610,791 |
| Williams Partners, | | | | | |
| Sr. Unscd. Notes | 3.35 | 8/15/22 | 405,000 | | 374,500 |
| Williams Partners, | | | | | |
| Sr. Unscd. Notes | 4.00 | 11/15/21 | 450,000 | | 444,721 |
| | | | | | 2,315,939 |
| Financial—12.2% | | | | | |
| Ally Financial, | | | | | |
| Gtd. Notes | 4.63 | 6/26/15 | 1,200,000 | | 1,239,734 |
| American Express, | | | | | |
| Sr. Unscd. Notes | 7.25 | 5/20/14 | 575,000 | | 605,351 |
| American International Group, | | | | | |
| Sr. Unscd. Notes | 3.65 | 1/15/14 | 190,000 | | 192,658 |
| Ameriprise Financial, | | | | | |
| Jr. Sub. Notes | 7.52 | 6/1/66 | 212,000 | a | 235,320 |
| AON, | | | | | |
| Gtd. Notes | 3.50 | 9/30/15 | 695,000 | | 729,867 |
| Bank of America, | | | | | |
| Sr. Unscd. Notes, Ser. 1 | 3.75 | 7/12/16 | 1,020,000 | | 1,079,011 |
| Bank of America, | | | | | |
| Sr. Unscd. Notes | 5.65 | 5/1/18 | 145,000 | | 163,171 |
| BBVA US Senior, | | | | | |
| Bank Gtd. Notes | 4.66 | 10/9/15 | 1,805,000 | | 1,864,170 |
| Boston Properties, | | | | | |
| Sr. Unscd. Notes | 3.70 | 11/15/18 | 365,000 | | 386,703 |
| CIT Group, | | | | | |
| Sr. Unscd. Notes | 5.00 | 5/15/17 | 555,000 | | 588,300 |
| Citigroup, | | | | | |
| Sr. Unscd. Notes | 4.45 | 1/10/17 | 1,000,000 | | 1,079,576 |
| Citigroup, | | | | | |
| Sr. Unscd. Notes | 4.75 | 5/19/15 | 160,000 | | 169,598 |
| DDR, | | | | | |
| Sr. Unscd. Notes | 4.75 | 4/15/18 | 650,000 | | 706,377 |
| Discover Financial Services, | | | | | |
| Sr. Unscd. Notes | 5.20 | 4/27/22 | 575,000 | | 604,243 |
12
| | | | | |
| | Coupon | Maturity | Principal | | |
| Bonds and Notes (continued) | Rate (%) | Date | Amount ($) | | Value ($) |
| Financial (continued) | | | | | |
| Erac USA Finance, | | | | | |
| Gtd. Notes | 5.90 | 11/15/15 | 1,100,000 | b | 1,213,599 |
| Federal Realty Investment Trust, | | | | | |
| Sr. Unscd. Bonds | 5.65 | 6/1/16 | 345,000 | | 384,710 |
| Ford Motor Credit, | | | | | |
| Sr. Unscd. Notes | 3.88 | 1/15/15 | 1,750,000 | | 1,806,257 |
| Ford Motor Credit, | | | | | |
| Sr. Unscd. Notes | 4.21 | 4/15/16 | 695,000 | | 732,950 |
| Ford Motor Credit, | | | | | |
| Sr. Unscd. Notes | 5.00 | 5/15/18 | 340,000 | | 369,455 |
| Genworth Holdings, | | | | | |
| Gtd. Notes | 7.20 | 2/15/21 | 210,000 | | 244,061 |
| Genworth Holdings, | | | | | |
| Gtd. Notes | 7.70 | 6/15/20 | 320,000 | | 378,949 |
| Goldman Sachs Group, | | | | | |
| Sr. Unscd. Notes | 3.63 | 2/7/16 | 680,000 | | 713,848 |
| Goldman Sachs Group, | | | | | |
| Sr. Unscd. Notes | 5.75 | 1/24/22 | 405,000 | | 451,536 |
| Hartford Financial Services Group, | | | | | |
| Sr. Unscd. Notes | 4.00 | 10/15/17 | 600,000 | | 642,130 |
| Health Care REIT, | | | | | |
| Sr. Unscd. Notes | 2.25 | 3/15/18 | 490,000 | | 484,340 |
| HSBC Holdings, | | | | | |
| Sr. Unscd. Notes | 4.00 | 3/30/22 | 905,000 | | 925,701 |
| Hyundai Capital Services, | | | | | |
| Sr. Unscd. Notes | 4.38 | 7/27/16 | 400,000 | b | 426,139 |
| International Lease Finance, | | | | | |
| Sr. Unscd. Notes | 5.75 | 5/15/16 | 625,000 | | 661,719 |
| International Lease Finance, | | | | | |
| Sr. Unscd. Notes | 6.63 | 11/15/13 | 535,000 | | 543,694 |
| Intesa Sanpaolo, | | | | | |
| Sr. Unscd. Notes | 6.50 | 2/24/21 | 120,000 | b | 121,811 |
| Liberty Mutual Group, | �� | | | | |
| Gtd. Notes | 4.95 | 5/1/22 | 565,000 | b | 586,546 |
| Morgan Stanley, | | | | | |
| Sr. Unscd. Notes | 3.80 | 4/29/16 | 650,000 | | 682,719 |
| Morgan Stanley, | | | | | |
| Sr. Unscd. Notes | 4.10 | 1/26/15 | 660,000 | | 685,786 |
The Fund 13
STATEMENT OF INVESTMENTS (continued)
| | | | | |
| | Coupon | Maturity | Principal | | |
| Bonds and Notes (continued) | Rate (%) | Date | Amount ($) | | Value ($) |
| Financial (continued) | | | | | |
| PNC Bank, | | | | | |
| Sub. Notes | 6.88 | 4/1/18 | 600,000 | | 721,798 |
| Principal Life Global Funding II, | | | | | |
| Scd. Notes | 1.00 | 12/11/15 | 1,970,000 | b | 1,973,014 |
| Royal Bank of Scotland Group, | | | | | |
| Sr. Unscd. Notes | 2.55 | 9/18/15 | 725,000 | | 740,451 |
| Royal Bank of Scotland, | | | | | |
| Sub. Notes | 9.50 | 3/16/22 | 1,210,000 | a | 1,342,072 |
| Santander US Debt, | | | | | |
| Bank Gtd. Notes | 3.72 | 1/20/15 | 1,925,000 | b | 1,956,195 |
| Standard Chartered, | | | | | |
| Sub. Notes | 3.95 | 1/11/23 | 1,015,000 | b | 954,672 |
| WEA Finance, | | | | | |
| Gtd. Notes | 7.13 | 4/15/18 | 460,000 | b | 551,714 |
| Willis North America, | | | | | |
| Gtd. Notes | 6.20 | 3/28/17 | 615,000 | | 683,242 |
| | | | | | 30,623,187 |
| Foreign/Governmental—1.0% | | | | | |
| Indonesia Eximbank, | | | | | |
| Sr. Unscd. Notes | 3.75 | 4/26/17 | 590,000 | | 593,040 |
| Korea Finance, | | | | | |
| Sr. Unscd. Notes | 2.25 | 8/7/17 | 1,200,000 | | 1,189,769 |
| Petroleos Mexicanos, | | | | | |
| Gtd. Notes | 4.88 | 1/24/22 | 600,000 | | 618,000 |
| | | | | | 2,400,809 |
| Health Care—.5% | | | | | |
| Actavis, | | | | | |
| Sr. Unscd. Notes | 3.25 | 10/1/22 | 525,000 | | 502,112 |
| WellPoint, | | | | | |
| Sr. Unscd. Notes | 1.25 | 9/10/15 | 835,000 | | 841,336 |
| | | | | | 1,343,448 |
| Industrial—.4% | | | | | |
| Waste Management, | | | | | |
| Gtd. Notes | 6.38 | 3/11/15 | 725,000 | | 785,069 |
| Xerox, | | | | | |
| Sr. Unscd. Notes | 5.63 | 12/15/19 | 215,000 | | 240,631 |
| | | | | | 1,025,700 |
14
| | | | | |
| | Coupon | Maturity | Principal | | |
| Bonds and Notes (continued) | Rate (%) | Date | Amount ($) | | Value ($) |
| Information Technology—.3% | | | | | |
| Hewlett-Packard, | | | | | |
| Sr. Unscd. Notes | 2.13 | 9/13/15 | 405,000 | | 411,459 |
| Hewlett-Packard, | | | | | |
| Sr. Unscd. Notes | 4.30 | 6/1/21 | 345,000 | | 344,113 |
| | | | | | 755,572 |
| Materials—.6% | | | | | |
| Kinder Morgan Energy Partners, | | | | | |
| Sr. Unscd. Notes | 5.63 | 2/15/15 | 910,000 | | 974,892 |
| Vale Overseas, | | | | | |
| Gtd. Notes | 4.38 | 1/11/22 | 650,000 | | 618,979 |
| | | | | | 1,593,871 |
| Residential Mortgage | | | | | |
| Pass-Through Ctfs.—.2% | | | | | |
| Credit Suisse First | | | | | |
| Boston Mortgage Securities, | | | | | |
| Ser. 2004-7, Cl. 6A1 | 5.25 | 10/25/19 | 194,049 | | 197,065 |
| GSR Mortgage Loan Trust, | | | | | |
| Ser. 2004-12, Cl. 2A2 | 3.06 | 12/25/34 | 184,478 | a | 179,274 |
| | | | | | 376,339 |
| Telecommunication | | | | | |
| Services—1.1% | | | | | |
| Cellco Partnership/Verizon | | | | | |
| Wireless Capital, | | | | | |
| Sr. Unscd. Notes | 8.50 | 11/15/18 | 465,000 | | 604,361 |
| SBA Tower Trust, | | | | | |
| Mortgage Bonds | 3.60 | 4/15/43 | 1,280,000 | b | 1,273,563 |
| Telefonica Emisiones, | | | | | |
| Gtd. Notes | 5.46 | 2/16/21 | 855,000 | | 893,457 |
| | | | | | 2,771,381 |
| U.S. Government Agencies—9.1% | | | | | |
| Federal Home Loan Mortgage Corp., | | | | | |
| Notes | 1.25 | 8/1/19 | 6,450,000 | c,d | 6,147,527 |
| Federal Home Loan Mortgage Corp., | | | | | |
| Notes | 4.88 | 11/15/13 | 11,625,000 | c,d | 11,788,552 |
| Federal National Mortgage | | | | | |
| Association, Notes | 0.88 | 8/28/17 | 5,100,000 | c,d | 5,020,175 |
| | | | | | 22,956,254 |
The Fund 15
STATEMENT OF INVESTMENTS (continued)

16
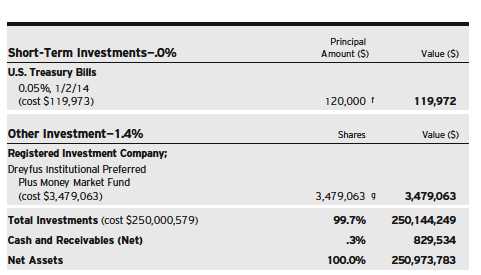
|
| BBA—British Bankers Association |
| LIBOR—London Interbank Offered Rate |
| REMIC—Real Estate Mortgage Investment Conduit |
| USD—U.S. Dollar |
| a Variable rate security—interest rate subject to periodic change. |
| b Securities exempt from registration pursuant to Rule 144A under the Securities Act of 1933.These securities may be |
| resold in transactions exempt from registration, normally to qualified institutional buyers.At July 31, 2013, these |
| securities were valued at $15,561,262 or 6.2% of net assets. |
| c Security, or portion thereof, on loan.At July 31, 2013, the value of the fund’s securities on loan was $102,383,390 |
| and the value of the collateral held by the fund was $104,983,048, consisting of U.S. Government & Agency securities. |
| d The Federal Housing Finance Agency (“FHFA”) placed the Federal Home Loan Mortgage Corporation and Federal |
| National Mortgage Association into conservatorship with FHFA as the conservator.As such, the FHFA oversees the |
| continuing affairs of these companies. |
| e Non-income producing security. |
| f Held by or on behalf of a counterparty for open financial futures contracts. |
| g Investment in affiliated money market mutual fund. |
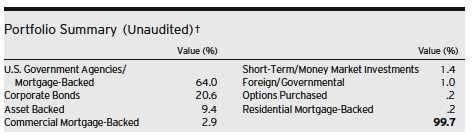
|
| † Based on net assets. |
| See notes to financial statements. |
The Fund 17
STATEMENT OF FINANCIAL FUTURES
July 31, 2013
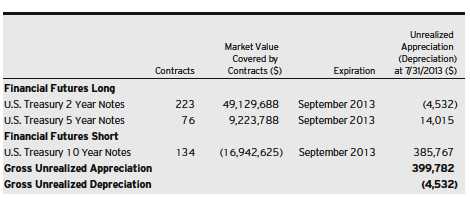
See notes to financial statements.
STATEMENT OF OPTIONS WRITTEN
July 31, 2013
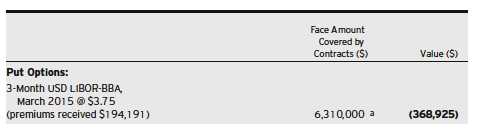
|
| BBA—British Bankers Association |
| LIBOR—London Interbank Offered Rate |
| USD—U.S. Dollar |
| a Non-income producing security. |
| See notes to financial statements. |
18
STATEMENT OF ASSETS AND LIABILITIES
July 31, 2013
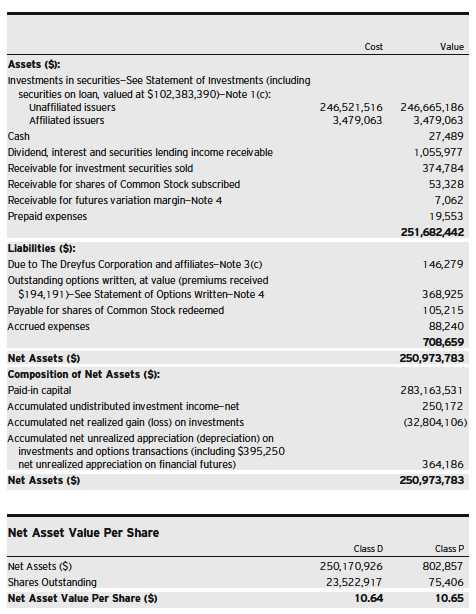
|
| See notes to financial statements. |
The Fund 19
STATEMENT OF OPERATIONS
Year Ended July 31, 2013
| | |
| Investment Income ($): | | |
| Income: | | |
| Interest | 5,497,251 | |
| Income from securities lending—Note 1(c) | 44,418 | |
| Dividends; | | |
| Affiliated issuers | 4,038 | |
| Total Income | 5,545,707 | |
| Expenses: | | |
| Management fee—Note 3(a) | 1,254,668 | |
| Shareholder servicing costs—Note 3(b) | 760,193 | |
| Professional fees | 62,280 | |
| Registration fees | 43,144 | |
| Prospectus and shareholders’ reports | 28,829 | |
| Custodian fees—Note 3(b) | 26,502 | |
| Directors’ fees and expenses—Note 3(c) | 8,902 | |
| Loan commitment fees—Note 2 | 3,394 | |
| Miscellaneous | 40,521 | |
| Total Expenses | 2,228,433 | |
| Less—reduction in expenses due to undertaking—Note 3(a) | (488,090 | ) |
| Less—reduction in fees due to earnings credits—Note 3(b) | (645 | ) |
| Net Expenses | 1,739,698 | |
| Investment Income—Net | 3,806,009 | |
| Realized and Unrealized Gain (Loss) on Investments—Note 4 ($): | | |
| Net realized gain (loss) on investments and foreign currency transactions | 2,916,143 | |
| Net realized gain (loss) on options transactions | 44,343 | |
| Net realized gain (loss) on financial futures | 369,432 | |
| Net realized gain (loss) on swap transactions | (78,715 | ) |
| Net realized gain (loss) on forward foreign currency exchange contracts | 31,543 | |
| Net Realized Gain (Loss) | 3,282,746 | |
| Net unrealized appreciation (depreciation) on investments | (3,364,505 | ) |
| Net unrealized appreciation (depreciation) on options transactions | (150,603 | ) |
| Net unrealized appreciation (depreciation) on financial futures | 423,423 | |
| Net unrealized appreciation (depreciation) on | | |
| forward foreign currency exchange contracts | (70,487 | ) |
| Net Unrealized Appreciation (Depreciation) | (3,162,172 | ) |
| Net Realized and Unrealized Gain (Loss) on Investments | 120,574 | |
| Net Increase in Net Assets Resulting from Operations | 3,926,583 | |
|
| See notes to financial statements. |
20
STATEMENT OF CHANGES IN NET ASSETS
| | | | |
| | | | Year Ended July 31, | |
| | 2013 | | 2012 | a |
| Operations ($): | | | | |
| Investment income—net | 3,806,009 | | 3,434,606 | |
| Net realized gain (loss) on investments | 3,282,746 | | 3,209,773 | |
| Net unrealized appreciation | | | | |
| (depreciation) on investments | (3,162,172 | ) | (1,876,259 | ) |
| Net Increase (Decrease) in Net Assets | | | | |
| Resulting from Operations | 3,926,583 | | 4,768,120 | |
| Dividends to Shareholders from ($): | | | | |
| Investment income—net: | | | | |
| Class B Shares | — | | (7,301 | ) |
| Class D Shares | (5,523,790 | ) | (5,539,247 | ) |
| Class P Shares | (22,909 | ) | (24,349 | ) |
| Net realized gain on investments: | | | | |
| Class D Shares | (548,030 | ) | — | |
| Class P Shares | (2,446 | ) | — | |
| Total Dividends | (6,097,175 | ) | (5,570,897 | ) |
| Capital Stock Transactions ($): | | | | |
| Net proceeds from shares sold: | | | | |
| Class B Shares | — | | 27,663 | |
| Class D Shares | 64,260,089 | | 56,357,564 | |
| Class P Shares | 200,938 | | 243,970 | |
| Dividends reinvested: | | | | |
| Class B Shares | — | | 6,646 | |
| Class D Shares | 5,487,581 | | 4,909,602 | |
| Class P Shares | 14,310 | | 13,042 | |
| Cost of shares redeemed: | | | | |
| Class B Shares | — | | (979,617 | ) |
| Class D Shares | (68,262,224 | ) | (71,273,055 | ) |
| Class P Shares | (559,831 | ) | (148,110 | ) |
| Increase (Decrease) in Net Assets | | | | |
| from Capital Stock Transactions | 1,140,863 | | (10,842,295 | ) |
| Total Increase (Decrease) in Net Assets | (1,029,729 | ) | (11,645,072 | ) |
| Net Assets ($): | | | | |
| Beginning of Period | 252,003,512 | | 263,648,584 | |
| End of Period | 250,973,783 | | 252,003,512 | |
| Undistributed investment income—net | 250,172 | | 598,795 | |
The Fund 21
STATEMENT OF CHANGES IN NET ASSETS (continued)
| | | | |
| | | | Year Ended July 31, | |
| | 2013 | | 2012 | a |
| Capital Share Transactions: | | | | |
| Class Bb | | | | |
| Shares sold | — | | 2,602 | |
| Shares issued for dividends reinvested | — | | 624 | |
| Shares redeemed | — | | (91,614 | ) |
| Net Increase (Decrease) in Shares Outstanding | — | | (88,388 | ) |
| Class Db | | | | |
| Shares sold | 5,975,201 | | 5,271,729 | |
| Shares issued for dividends reinvested | 510,413 | | 459,215 | |
| Shares redeemed | (6,352,939 | ) | (6,668,756 | ) |
| Net Increase (Decrease) in Shares Outstanding | 132,675 | | (937,812 | ) |
| Class P | | | | |
| Shares sold | 18,634 | | 22,794 | |
| Shares issued for dividends reinvested | 1,330 | | 1,218 | |
| Shares redeemed | (51,975 | ) | (13,837 | ) |
| Net Increase (Decrease) in Shares Outstanding | (32,011 | ) | 10,175 | |
| |
| a | Effective as of the close of business on March 13, 2012, the fund no longer offers Class B shares. |
| b | During the year ended July 31, 2012, 32,512 Class B shares representing $348,357 were automatically converted |
| | to 32,571 Class D shares. |
| See notes to financial statements. |
22
FINANCIAL HIGHLIGHTS
The following tables describe the performance for each share class for the fiscal periods indicated.All information (except portfolio turnover rate) reflects financial results for a single fund share.Total return shows how much your investment in the fund would have increased (or decreased) during each period, assuming you had reinvested all dividends and distributions.These figures have been derived from the fund’s financial statements.
| | | | | | | | | | |
| | | | Year Ended July 31, | | | |
| Class D Shares | 2013 | | 2012 | | 2011 | | 2010 | | 2009 | |
| Per Share Data ($): | | | | | | | | | | |
| Net asset value, beginning of period | 10.72 | | 10.76 | | 10.78 | | 10.34 | | 10.33 | |
| Investment Operations: | | | | | | | | | | |
| Investment income—neta | .16 | | .14 | | .23 | | .32 | | .42 | |
| Net realized and unrealized | | | | | | | | | | |
| gain (loss) on investments | .02 | | .05 | | .06 | | .51 | | .03 | |
| Total from Investment Operations | .18 | | .19 | | .29 | | .83 | | .45 | |
| Distributions: | | | | | | | | | | |
| Dividends from investment income—net | (.24 | ) | (.23 | ) | (.31 | ) | (.39 | ) | (.44 | ) |
| Dividends from net realized | | | | | | | | | | |
| gain on investments | (.02 | ) | — | | — | | — | | — | |
| Total Distributions | (.26 | ) | (.23 | ) | (.31 | ) | (.39 | ) | (.44 | ) |
| Net asset value, end of period | 10.64 | | 10.72 | | 10.76 | | 10.78 | | 10.34 | |
| Total Return (%) | 1.60 | | 1.80 | | 2.67 | | 8.12 | | 4.66 | |
| Ratios/Supplemental Data (%): | | | | | | | | | | |
| Ratio of total expenses | | | | | | | | | | |
| to average net assets | .89 | | .90 | | .90 | | .90 | | .95 | |
| Ratio of net expenses | | | | | | | | | | |
| to average net assets | .69 | | .90 | | .90 | | .90 | | .95 | |
| Ratio of net investment income | | | | | | | | | | |
| to average net assets | 1.52 | | 1.33 | | 2.11 | | 3.00 | | 4.25 | |
| Portfolio Turnover Rate | 109.51b 173.05b | | 118.74 | | 90.03 | | 99.46 | b |
| Net Assets, end of period | | | | | | | | | | |
| ($ x 1,000) | 250,171 | | 250,850 | | 261,652 | | 256,259 | | 199,863 | |
| |
| a | Based on average shares outstanding at each month end. |
| b | The portfolio turnover rates excluding mortgage dollar roll transactions for the periods ended July 31, 2013, 2012 |
| | and 2009 were 106.46%,160.80% and 98.62%, respectively. |
| See notes to financial statements. |
The Fund 23
FINANCIAL HIGHLIGHTS (continued)
| | | | | | | | | | |
| | | | Year Ended July 31, | | | |
| Class P Shares | 2013 | | 2012 | | 2011 | | 2010 | | 2009 | |
| Per Share Data ($): | | | | | | | | | | |
| Net asset value, beginning of period | 10.74 | | 10.77 | | 10.79 | | 10.36 | | 10.34 | |
| Investment Operations: | | | | | | | | | | |
| Investment income—neta | .16 | | .14 | | .23 | | .32 | | .42 | |
| Net realized and unrealized | | | | | | | | | | |
| gain (loss) on investments | .00 | b | .06 | | .05 | | .50 | | .04 | |
| Total from Investment Operations | .16 | | .20 | | .28 | | .82 | | .46 | |
| Distributions: | | | | | | | | | | |
| Dividends from investment income—net | (.23 | ) | (.23 | ) | (.30 | ) | (.39 | ) | (.44 | ) |
| Dividends from net realized | | | | | | | | | | |
| gain on investments | (.02 | ) | — | | — | | — | | — | |
| Total Distributions | (.25 | ) | (.23 | ) | (.30 | ) | (.39 | ) | (.44 | ) |
| Net asset value, end of period | 10.65 | | 10.74 | | 10.77 | | 10.79 | | 10.36 | |
| Total Return (%) | 1.56 | | 1.85 | | 2.65 | | 8.10 | | 4.66 | |
| Ratios/Supplemental Data (%): | | | | | | | | | | |
| Ratio of total expenses | | | | | | | | | | |
| to average net assets | .93 | | .95 | | .93 | | .93 | | .96 | |
| Ratio of net expenses | | | | | | | | | | |
| to average net assets | .74 | | .95 | | .93 | | .93 | | .96 | |
| Ratio of net investment income | | | | | | | | | | |
| to average net assets | 1.50 | | 1.30 | | 2.09 | | 2.97 | | 4.24 | |
| Portfolio Turnover Rate | 109.51c 173.05c | | 118.74 | | 90.03 | | 99.46 | c |
| Net Assets, end of period ($ x 1,000) | 803 | | 1,153 | | 1,047 | | 1,478 | | 1,350 | |
| |
| a | Based on average shares outstanding at each month end. |
| b | Amount represents less than $.01 per share. |
| c | The portfolio turnover rates excluding mortgage dollar roll transactions for the periods ended July 31, 2013, 2012 |
| | and 2009 were 106.46%,160.80% and 98.62%, respectively. |
| See notes to financial statements. |
24
NOTES TO FINANCIAL STATEMENTS
NOTE 1—Significant Accounting Policies:
Dreyfus ShortTerm Income Fund (the “fund”) is a separate non-diversified series of Dreyfus Investment Grade Funds, Inc. (the “Company”), which is registered under the Investment Company Act of 1940, as amended (the “Act”), as an open-end management investment company and operates as a series company currently offering three series, including the fund.The fund’s investment objective seeks to maximize total return, consisting of capital appreciation and current income.The Dreyfus Corporation (the “Manager” or “Dreyfus”), a wholly-owned subsidiary of The Bank of New York Mellon Corporation (“BNY Mellon”), serves as the fund’s investment adviser.
MBSC Securities Corporation (the “Distributor”), a wholly-owned subsidiary of the Manager, is the distributor of the fund’s shares, which are sold to the public without a sales charge.The fund is authorized to issue 800 million shares of $.001 par value Common Stock.The fund currently offers two classes of shares: Class D (500 million shares authorized) and Class P (300 million shares authorized). Class D and Class P shares are sold at net asset value per share only to institutional investors. Other differences between the classes include the services offered to and the expenses borne by each class, the allocation of certain transfer agency costs and certain voting rights. Income, expenses (other than expenses attributable to a specific class), and realized and unrealized gains or losses on investments are allocated to each class of shares based on its relative net assets.
The Company accounts separately for the assets, liabilities and operations of each series. Expenses directly attributable to each series are charged to that series’ operations; expenses which are applicable to all series are allocated among them on a pro rata basis.
The Financial Accounting Standards Board (“FASB”) Accounting Standards Codification is the exclusive reference of authoritative U.S. generally accepted accounting principles (“GAAP”) recognized by the FASB to be applied by nongovernmental entities. Rules and interpretive releases of the Securities and Exchange Commission (“SEC”) under
The Fund 25
NOTES TO FINANCIAL STATEMENTS (continued)
authority of federal laws are also sources of authoritative GAAP for SEC registrants. The fund’s financial statements are prepared in accordance with GAAP, which may require the use of management estimates and assumptions.Actual results could differ from those estimates.
The Company enters into contracts that contain a variety of indemnifications.The fund’s maximum exposure under these arrangements is unknown.The fund does not anticipate recognizing any loss related to these arrangements.
(a) Portfolio valuation: The fair value of a financial instrument is the amount that would be received to sell an asset or paid to transfer a liability in an orderly transaction between market participants at the measurement date (i.e., the exit price). GAAP establishes a fair value hierarchy that prioritizes the inputs of valuation techniques used to measure fair value.This hierarchy gives the highest priority to unadjusted quoted prices in active markets for identical assets or liabilities (Level 1 measurements) and the lowest priority to unobservable inputs (Level 3 measurements).
Additionally, GAAP provides guidance on determining whether the volume and activity in a market has decreased significantly and whether such a decrease in activity results in transactions that are not orderly. GAAP requires enhanced disclosures around valuation inputs and techniques used during annual and interim periods.
Various inputs are used in determining the value of the fund’s investments relating to fair value measurements.These inputs are summarized in the three broad levels listed below:
Level 1—unadjusted quoted prices in active markets for identical investments.
Level 2—other significant observable inputs (including quoted prices for similar investments, interest rates, prepayment speeds, credit risk, etc.).
Level 3—significant unobservable inputs (including the fund’s own assumptions in determining the fair value of investments).
26
The inputs or methodology used for valuing securities are not necessarily an indication of the risk associated with investing in those securities.
Changes in valuation techniques may result in transfers in or out of an assigned level within the disclosure hierarchy. Valuation techniques used to value the fund’s investments are as follows:
Registered investment companies that are not traded on an exchange are valued at their net asset value and are categorized within Level 1 of the fair value hierarchy.
Investments in securities, excluding short-term investments (other than U.S. Treasury Bills), financial futures, options and forward foreign currency exchange contracts (“forward contracts”) are valued each business day by an independent pricing service (the “Service”) approved by the Company’s Board of Directors (the “Board”). Investments for which quoted bid prices are readily available and are representative of the bid side of the market in the judgment of the Service are valued at the mean between the quoted bid prices (as obtained by the Service from dealers in such securities) and asked prices (as calculated by the Service based upon its evaluation of the market for such securities). Other investments (which constitute a majority of the portfolio securities) are valued as determined by the Service, based on methods which include consideration of the following: yields or prices of securities of comparable quality, coupon, maturity and type; indications as to values from dealers; and general market conditions.These securities are generally categorized within Level 2 of the fair value hierarchy.
U.S. Treasury Bills are valued at the mean price between quoted bid prices and asked prices by the Service. These securities are generally categorized within Level 2 of the fair value hierarchy.
The Service’s procedures are reviewed by Dreyfus under the general supervision of the Board.
When market quotations or official closing prices are not readily available, or are determined not to reflect accurately fair value, such as
The Fund 27
NOTES TO FINANCIAL STATEMENTS (continued)
when the value of a security has been significantly affected by events after the close of the exchange or market on which the security is principally traded (for example, a foreign exchange or market), but before the fund calculates its net asset value, the fund may value these investments at fair value as determined in accordance with the procedures approved by the Board. Certain factors may be considered when fair valuing investments such as: fundamental analytical data, the nature and duration of restrictions on disposition, an evaluation of the forces that influence the market in which the securities are purchased and sold, and public trading in similar securities of the issuer or comparable issuers.These securities are either categorized within Level 2 or 3 of the fair value hierarchy depending on the relevant inputs used.
For restricted securities where observable inputs are limited, assumptions about market activity and risk are used and are categorized within Level 3 of the fair value hierarchy.
Investments denominated in foreign currencies are translated to U.S. dollars at the prevailing rates of exchange.
Financial futures and options, which are traded on an exchange, are valued at the last sales price on the securities exchange on which such securities are primarily traded or at the last sales price on the national securities market on each business day.These securities are generally categorized within Level 1 of the fair value hierarchy. Options traded over-the-counter are valued at the mean between the bid and asked price.These securities are generally categorized within Level 2 of the fair value hierarchy. Investments in swap transactions are valued each business day by the Service. Swaps are valued by the Service by using a swap pricing model which incorporates among other factors, default probabilities, recovery rates, credit curves of the underlying issuer and swap spreads on interest rates and are generally categorized within Level 2 of the fair value hierarchy. Forward contracts are valued at the forward rate and are generally categorized within Level 2 of the fair value hierarchy.
28
The following is a summary of the inputs used as of July 31, 2013 in valuing the fund’s investments:

| |
| † | See Statement of Investments for additional detailed categorizations. |
| †† | Amount shown represents unrealized appreciation (depreciation) at period end. |
At July 31, 2013, there were no transfers between Level 1 and Level 2 of the fair value hierarchy.
(b) Foreign currency transactions: The fund does not isolate that portion of the results of operations resulting from changes in foreign exchange rates on investments from the fluctuations arising from changes
The Fund 29
NOTES TO FINANCIAL STATEMENTS (continued)
in the market prices of securities held. Such fluctuations are included with the net realized and unrealized gain or loss on investments.
Net realized foreign exchange gains or losses arise from sales of foreign currencies, currency gains or losses realized on securities transactions between trade and settlement date, and the difference between the amounts of dividends, interest and foreign withholding taxes recorded on the fund’s books and the U.S. dollar equivalent of the amounts actually received or paid. Net unrealized foreign exchange gains and losses arise from changes in the value of assets and liabilities other than investments resulting from changes in exchange rates. Foreign currency gains and losses on foreign currency transactions are also included with net realized and unrealized gain or loss on investments.
(c) Securities transactions and investment income: Securities transactions are recorded on a trade date basis. Realized gains and losses from securities transactions are recorded on the identified cost basis. Dividend income is recognized on the ex-dividend date and interest income, including, where applicable, accretion of discount and amortization of premium on investments, is recognized on the accrual basis.
Pursuant to a securities lending agreement with The Bank of New York Mellon, a subsidiary of BNY Mellon and an affiliate of Dreyfus, the fund may lend securities to qualified institutions. It is the fund’s policy that, at origination, all loans are secured by collateral of at least 102% of the value of U.S. securities loaned and 105% of the value of foreign securities loaned. Collateral equivalent to at least 100% of the market value of securities on loan is maintained at all times. Collateral is either in the form of cash, which can be invested in certain money market mutual funds managed by the Manager or U.S. Government and Agency securities. The fund is entitled to receive all dividends, interest and distributions on securities loaned, in addition to income earned as a result of the lending transaction. Should a borrower fail to return the securities in a timely manner, The Bank of New York
30
Mellon is required to replace the securities for the benefit of the fund or credit the fund with the market value of the unreturned securities and is subrogated to the fund’s rights against the borrower and the collateral. During the period ended July 31, 2013,The Bank of NewYork Mellon earned $19,036 from lending portfolio securities, pursuant to the securities lending agreement.
(d) Affiliated issuers: Investments in other investment companies advised by Dreyfus are defined as “affiliated” under the Act. Investments in affiliated investment companies during the period ended July 31, 2013 were as follows:
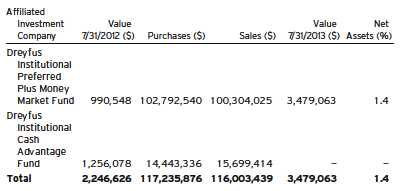
(e) Dividends to shareholders: It is the policy of the fund to declare dividends daily from investment income-net. Such dividends are paid monthly. Dividends from net realized capital gains, if any, are normally declared and paid annually, but the fund may make distributions on a more frequent basis to comply with the distribution requirements of the Internal Revenue Code of 1986, as amended (the “Code”).To the extent that net realized capital gains can be offset by capital loss carryovers, it is the policy of the fund not to distribute such gains. Income and capital gain distributions are determined in accordance with income tax regulations, which may differ from GAAP.
The Fund 31
NOTES TO FINANCIAL STATEMENTS (continued)
(f) Federal income taxes: It is the policy of the fund to continue to qualify as a regulated investment company, if such qualification is in the best interests of its shareholders, by complying with the applicable provisions of the Code, and to make distributions of taxable income sufficient to relieve it from substantially all federal income and excise taxes.
As of and during the period ended July 31, 2013, the fund did not have any liabilities for any uncertain tax positions.The fund recognizes interest and penalties, if any, related to uncertain tax positions as income tax expense in the Statement of Operations. During the period, the fund did not incur any interest or penalties.
Each tax year in the four-year period ended July 31, 2013 remains subject to examination by the Internal Revenue Service and state taxing authorities.
At July 31, 2013, the components of accumulated earnings on a tax basis were as follows: undistributed ordinary income $250,172, accumulated capital losses $30,755,910 and unrealized depreciation $1,684,010.
Under the Regulated Investment Company Modernization Act of 2010 (the “2010 Act”), the fund is permitted to carry forward capital losses incurred in taxable years beginning after December 22, 2010 (“post-enactment losses”) for an unlimited period. Furthermore, post-enactment capital loss carryovers retain their character as either short-term or long-term capital losses rather than short-term as they were under previous statute. The 2010 Act requires post-enactment losses to be utilized before the utilization of losses incurred in taxable years prior to the effective date of the 2010 Act (“pre-enactment losses”).As a result of this ordering rule, pre-enactment losses may be more likely to expire unused.
The accumulated capital loss carryover is available for federal income tax purposes to be applied against future net realized capital gains, if any, realized subsequent to July 31, 2013. If not applied, $8,634,655 of the
32
carryover expires in fiscal year 2014, $7,342,005 expires in fiscal year 2015, $4,178,299 expires in fiscal year 2016, $5,740,844 expires in fiscal year 2017 and $4,860,107 expires in fiscal year 2018.
The tax character of distributions paid to shareholders during the fiscal periods ended July 31, 2013 and July 31, 2012 were as follows: ordinary income $6,097,175 and $5,570,897.
During the period ended July 31, 2013, as a result of permanent book to tax differences, primarily due to the tax treatment for amortization of premiums, paydown gains and losses on mortgage backed securities, foreign currency transactions, consent fees, dividend reclassification and a capital loss carryover expiration, the fund increased accumulated undistributed investment income-net by $1,392,067, increased accumulated net realized gain (loss) on investments by $26,382,696 and decreased paid-in capital by $27,774,763. Net assets and net asset value per share were not affected by this reclassification.
(g) Accounting Pronouncement: In January 2013, FASB issued Accounting Standards Update No. 2013-01 (“ASU 2013-01”), “Clarifying the Scope of Disclosures about Offsetting Assets and Liabilities”, which replaced Accounting Standards Update No. 2011-11 (“ASU 2011-11”), “Disclosures about Offsetting Assets and Liabilities”. ASU 2013-01 is effective for fiscal years beginning on or after January 1, 2013, and interim periods within those annual periods.ASU 2011-11 was intended to enhance disclosure requirements on the offsetting of financial assets and liabilities.ASU 2013-01 limits the scope of the new balance sheet offsetting disclosures to derivatives, repurchase agreements, and securities lending transactions to the extent that they are (a) offset in the financial statements or (b) subject to enforceable master netting arrangements (“MNA”) or similar agreements. Management is currently evaluating the application of ASU 2013-01 and its impact on the fund’s financial statements.
The Fund 33
NOTES TO FINANCIAL STATEMENTS (continued)
NOTE 2—Bank Lines of Credit:
The fund participates with other Dreyfus-managed funds in a $210 million unsecured credit facility led by Citibank, N.A. and a $300 million unsecured credit facility provided by The Bank of New York Mellon (each, a “Facility”), each to be utilized primarily for temporary or emergency purposes, including the financing of redemptions. Prior to October 10, 2012, the unsecured credit facility with Citibank, N.A. was $225 million. In connection therewith, the fund has agreed to pay its pro rata portion of commitment fees for each Facility. Interest is charged to the fund based on rates determined pursuant to the terms of the respective Facility at the time of borrowing. During the period ended July 31, 2013, the fund did not borrow under the Facilities.
NOTE 3—Management Fee and Other Transactions With Affiliates:
(a) Pursuant to a management agreement with the Manager, the management fee is computed at the annual rate of .50% of the value of the fund’s average daily net assets and is payable monthly.
Dreyfus has contractually agreed, from October 1, 2012 through December 1, 2013, to waive receipt of its fees and/or assume the expenses of the fund, so that the expenses of none of the classes (excluding Shareholder Services Plan fees, taxes, interest expense, brokerage commissions, commitment fees on borrowings and extraordinary expenses) exceed .45% of the value of the average daily net assets of their class.The reduction in expenses, pursuant to the undertaking, amounted to $488,090 during the period ended July 31, 2013.
(b) Under the Shareholder Services Plan, Class D and Class P shares pay the Distributor at an annual rate of .20% of the value of the average daily net assets of Class D shares and .25% of the value of the average daily net assets of Class P shares for the provision of certain services. The services provided may include personal services relating to shareholder accounts, such as answering shareholder inquiries regarding the fund and providing reports and other information, and
34
services related to the maintenance of shareholder accounts. The Distributor may make payments to Service Agents (securities dealers, financial institutions or other industry professionals) with respect to these services.The Distributor determines the amounts to be paid to Service Agents. During the period ended July 31, 2013, Class D and Class P shares were charged, $499,778 and $2,611, respectively, pursuant to the Shareholder Services Plan.
The fund has arrangements with the transfer agent and the custodian whereby the fund may receive earnings credits when positive cash balances are maintained, which are used to offset transfer agency and custody fees. For financial reporting purposes, the fund includes net earnings credits as an expense offset in the Statement of Operations.
The fund compensates Dreyfus Transfer, Inc., a wholly-owned subsidiary of the Manager, under a transfer agency agreement for providing transfer agency services for the fund and cash management services related to fund subscriptions and redemptions. During the period ended July 31, 2013, the fund was charged $139,290 for transfer agency services and $4,732 for cash management services. Cash management fees were partially offset by earnings credits of $624. These fees are included in Shareholder servicing costs in the Statement of Operations.
The fund compensatesThe Bank of NewYork Mellon under a custody agreement for providing custodial services for the fund. During the period ended July 31, 2013, the fund was charged $26,502 pursuant to the custody agreement.
The fund compensates The Bank of New York Mellon under a cash management agreement for performing certain cash management services related to fund subscriptions and redemptions.The Bank of New York Mellon also provides shareholder redemption draft processing services. During the period ended July 31, 2013, the fund was charged $2,739 pursuant to the cash management agreement, which is included in Shareholder servicing costs in the Statement of Operations. These fees were partially offset by earnings credits of $21.
The Fund 35
NOTES TO FINANCIAL STATEMENTS (continued)
During the period ended July 31, 2013, the fund was charged $8,892 for services performed by the Chief Compliance Officer and his staff.
The components of “Due to The Dreyfus Corporation and affiliates” in the Statement of Assets and Liabilities consist of: management fees $106,769, Shareholder Services Plan fees $42,742, custodian fees $10,151, Chief Compliance Officer fees $5,420 and transfer agency fees $30,007, which are offset against an expense reimbursement currently in effect in the amount of $48,810.
(d) Each Board member also serves as a Board member of other funds within the Dreyfus complex. Annual retainer fees and attendance fees are allocated to each fund based on net assets.
NOTE 4—Securities Transactions:
The aggregate amount of purchases and sales (including paydowns) of investment securities, excluding short-term securities, financial futures, options transactions, swap transactions and forward contracts, during the period ended July 31, 2013, amounted to $269,859,172 and $270,323,451, respectively, of which $7,515,494 in purchases and $7,531,186 in sales were from mortgage dollar roll transactions.
Mortgage Dollar Rolls: A mortgage dollar roll transaction involves a sale by the fund of mortgage related securities that it holds with an agreement by the fund to repurchase similar securities at an agreed upon price and date.The securities purchased will bear the same interest rate as those sold, but generally will be collateralized by pools of mortgages with different prepayment histories than those securities sold.The fund accounts for mortgage dollar rolls as purchases and sales transactions.
Derivatives: A derivative is a financial instrument whose performance is derived from the performance of another asset. Each type of derivative instrument that was held by the fund during the period ended July 31, 2013 is discussed below.
The following tables show the fund’s exposure to different types of market risk as it relates to the Statement of Assets and Liabilities and the Statement of Operations, respectively.
36
Fair value of derivative instruments as of July 31, 2013 is shown below:
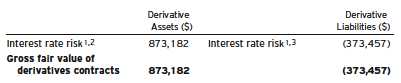
| |
| Statement of Assets and Liabilities location: |
| 1 | Includes cumulative appreciation (depreciation) on financial futures as reported in the Statement of |
| | Financial Futures, but only the unpaid variation margin is reported in the Statement of Assets |
| | and Liabilities. |
| 2 | Options purchased are included in Investments in securities—Unaffiliated issuers, at value. |
| 3 | Outstanding options written, at value. |
The effect of derivative instruments in the Statement of Operations during the period ended July 31, 2013 is shown below:

| |
| Statement of Operations location: |
| 4 | Net realized gain (loss) on financial futures. |
| 5 | Net realized gain (loss) on options transactions. |
| 6 | Net realized gain (loss) on forward foreign currency exchange contracts. |
| 7 | Net realized gain (loss) on swap transactions. |
| 8 | Net unrealized appreciation (depreciation) on financial futures. |
| 9 | Net unrealized appreciation (depreciation) on options transactions. |
| 10 Net unrealized appreciation (depreciation) on forward foreign currency exchange contracts. |
Financial Futures: In the normal course of pursuing its investment objective, the fund is exposed to market risk, including interest rate risk, as a result of changes in value of underlying financial instruments.The fund invests in financial futures in order to manage its exposure to or
The Fund 37
NOTES TO FINANCIAL STATEMENTS (continued)
protect against changes in the market.A financial futures contract represents a commitment for the future purchase or a sale of an asset at a specified date. Upon entering into such contracts, these investments require initial margin deposits with a counterparty, which consist of cash or cash equivalents.The amount of these deposits is determined by the exchange or Board of Trade on which the contract is traded and is subject to change.Accordingly, variation margin payments are received or made to reflect daily unrealized gains or losses which are recorded in the Statement of Operations.When the contracts are closed, the fund recognizes a realized gain or loss which is reflected in the Statement of Operations.There is minimal counterparty credit risk to the fund with financial futures since they are exchange traded, and the exchange guarantees the financial futures against default. Financial futures open at July 31, 2013 are set forth in the Statement of Financial Futures.
Options Transactions: The fund purchases and writes (sells) put and call options to hedge against changes in interest rates or as a substitute for an investment.The fund is subject to market risk and interest rate risk in the course of pursuing its investment objectives through its investments in options contracts. A call option gives the purchaser of the option the right (but not the obligation) to buy, and obligates the writer to sell, the underlying security or securities at the exercise price at any time during the option period, or at a specified date. Conversely, a put option gives the purchaser of the option the right (but not the obligation) to sell, and obligates the writer to buy the underlying security or securities at the exercise price at any time during the option period, or at a specified date.
As a writer of call options, the fund receives a premium at the outset and then bears the market risk of unfavorable changes in the price of the financial instrument underlying the option. Generally, the fund realizes a gain, to the extent of the premium, if the price of the underlying financial instrument decreases between the date the option is written and the date on which the option is terminated. Generally, the fund incurs a loss if the price of the financial instrument increases between those dates.
38
As a writer of put options, the fund receives a premium at the outset and then bears the market risk of unfavorable changes in the price of the financial instrument underlying the option. Generally, the fund realizes a gain, to the extent of the premium, if the price of the underlying financial instrument increases between the date the option is written and the date on which the option is terminated. Generally, the fund incurs a loss if the price of the financial instrument decreases between those dates.
As a writer of an option, the fund has no control over whether the underlying securities may be sold (call) or purchased (put) and as a result bears the market risk of an unfavorable change in the price of the security underlying the written option.There is a risk of loss from a change in value of such options which may exceed the related premiums received. The Statement of Operations reflects the following: any unrealized gains or losses which occurred during the period as well as any realized gains or losses which occurred upon the expiration or closing of the option transaction.
The following summarizes the fund’s call/put options written during the period ended July 31, 2013:

Forward Foreign Currency Exchange Contracts: The fund enters into forward contracts in order to hedge its exposure to changes in foreign currency exchange rates on its foreign portfolio holdings, to settle foreign currency transactions or as a part of its investment strategy. When executing forward contracts, the fund is obligated to buy or sell
The Fund 39
NOTES TO FINANCIAL STATEMENTS (continued)
a foreign currency at a specified rate on a certain date in the future. With respect to sales of forward contracts, the fund incurs a loss if the value of the contract increases between the date the forward contract is opened and the date the forward contract is closed.The fund realizes a gain if the value of the contract decreases between those dates. With respect to purchases of forward contracts, the fund incurs a loss if the value of the contract decreases between the date the forward contract is opened and the date the forward contract is closed.The fund realizes a gain if the value of the contract increases between those dates. Any realized or unrealized gains or losses which occurred during the period are reflected in the Statement of Operations. The fund is exposed to foreign currency risk as a result of changes in value of underlying financial instruments.The fund is also exposed to credit risk associated with counterparty nonperformance on these forward contracts, which is typically limited to the unrealized gain on each open contract. At July 31, 2013, there were no forward contracts outstanding.
Swap Transactions:The fund enters into swap agreements to exchange the interest rate on, or return generated by, one nominal instrument for the return generated by another nominal instrument.The fund enters into these agreements to hedge certain market or interest rate risks, to manage the interest rate sensitivity (sometimes called duration) of fixed income securities, to provide a substitute for purchasing or selling particular securities or to increase potential returns.
The fund accrues for the interim payments on swap agreements on a daily basis, with the net amount recorded within unrealized appreciation (depreciation) on swap agreements in the Statement of Assets and Liabilities. Once the interim payments are settled in cash, the net amount is recorded as a realized gain (loss) on swaps, in addition to realized gain (loss) recorded upon the termination of swap agreements in the Statement of Operations. Upfront payments made and/or received by the fund, are recorded as an asset and/or liability in the Statement of Assets and Liabilities and are recorded as a realized gain or loss ratably over the agreement’s term/event with the exception of
40
forward starting interest rate swaps which are recorded as realized gains or losses on the termination date. Fluctuations in the value of swap agreements are recorded for financial statement purposes as unrealized appreciation or depreciation on swap transactions.
Interest Rate Swaps: Interest rate swaps involve the exchange of commitments to pay and receive interest based on a notional principal amount.The fund may elect to pay a fixed rate and receive a floating rate, or receive a fixed rate and pay a floating rate on a notional principal amount.The net interest received or paid on interest rate swap agreements is included within realized gain (loss) on swap agreements in the Statement of Operations. Interest rate swap agreements are subject to general market risk, liquidity risk, counterparty risk and interest rate risk. For financial reporting purposes, forward rate agreements are classified as interest rate swaps.At July 31, 2013, there were no interest rate swap agreements outstanding.
The following summarizes the average market value of derivatives outstanding during the period ended July 31, 2013:
| |
| | Average Market Value ($) |
| Interest rate financial futures | 95,782,579 |
| Interest rate options contracts | 296,918 |
| Forward contracts | 6,518,498 |
The following summarizes the average notional value of swap agreements outstanding during the period ended July 31, 2013:
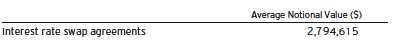
At July 31, 2013, the cost of investments for federal income tax purposes was $251,653,525; accordingly, accumulated net unrealized depreciation on investments was $1,509,276, consisting of $2,346,525 gross unrealized appreciation and $3,855,801 gross unrealized depreciation.
The Fund 41
REPORT OF INDEPENDENT REGISTERED
PUBLIC ACCOUNTING FIRM
Shareholders and Board of Directors
Dreyfus Short Term Income Fund
We have audited the accompanying statement of assets and liabilities, including the statements of investments, financial futures and options written, of Dreyfus Short Term Income Fund (one of the series comprising Dreyfus Investment Grade Funds, Inc.) as of July 31, 2013, and the related statement of operations for the year then ended, the statement of changes in net assets for each of the two years in the period then ended, and the financial highlights for each of the five years in the period then ended.These financial statements and financial highlights are the responsibility of the Fund’s management. Our responsibility is to express an opinion on these financial statements and financial highlights based on our audits.
We conducted our audits in accordance with the standards of the Public Company Accounting Oversight Board (United States).Those standards require that we plan and perform the audit to obtain reasonable assurance about whether the financial statements and financial highlights are free of material misstatement.We were not engaged to perform an audit of the Fund’s internal control over financial reporting. Our audits included consideration of internal control over financial reporting as a basis for designing audit procedures that are appropriate in the circumstances, but not for the purpose of expressing an opinion on the effectiveness of the Fund’s internal control over financial reporting. Accordingly, we express no such opinion.An audit also includes examining, on a test basis, evidence supporting the amounts and disclosures in the financial statements and financial highlights, assessing the accounting principles used and significant estimates made by management, and evaluating the overall financial statement presentation. Our procedures included confirmation of securities owned as of July 31, 2013 by correspondence with the custodian and others. We believe that our audits provide a reasonable basis for our opinion.
In our opinion, the financial statements and financial highlights referred to above present fairly, in all material respects, the financial position of Dreyfus Short Term Income Fund at July 31, 2013, the results of its operations for the year then ended, the changes in its net assets for each of the two years in the period then ended, and the financial highlights for each of the five years in the period then ended, in conformity with U.S. generally accepted accounting principles.
New York, New York September 26, 2013
42
IMPORTANT TAX INFORMATION (Unaudited)
The fund hereby reports 85.64% of ordinary income dividends paid during the fiscal year ended July 31, 2013 as qualifying “interest related dividends”.Also, the fund hereby reports $.0237 per share as a short-term capital gain distribution paid on December 6, 2012.
The Fund 43
INFORMATION ABOUT THE RENEWAL OF THE
FUND’S MANAGEMENT AGREEMENT (Unaudited)
At a meeting of the fund’s Board of Directors held on July 17 and 18, 2013, the Board considered the renewal of the fund’s Management Agreement pursuant to which Dreyfus provides the fund with investment advisory and administrative services (the “Agreement”). The Board members, a majority of whom are not “interested persons” (as defined in the Investment Company Act of 1940, as amended) of the fund, were assisted in their review by independent legal counsel and met with counsel in executive session separate from Dreyfus representatives. In considering the renewal of the Agreement, the Board considered all factors that it believed to be relevant, including those discussed below. The Board did not identify any one factor as dispositive, and each Board member may have attributed different weights to the factors considered.
Analysis of Nature, Extent, and Quality of Services Provided to the Fund. The Board considered information provided to them at the meeting and in previous presentations from Dreyfus representatives regarding the nature, extent, and quality of the services provided to funds in the Dreyfus fund complex. Dreyfus provided the number of open accounts in the fund, the fund’s asset size and the allocation of fund assets among distribution channels. Dreyfus also had previously provided information regarding the diverse intermediary relationships and distribution channels of funds in the Dreyfus fund complex (such as retail direct or intermediary, in which intermediaries typically are paid by the fund and/or Dreyfus) and Dreyfus’ corresponding need for broad, deep, and diverse resources to be able to provide ongoing shareholder services to each intermediary or distribution channel, as applicable to the fund.
The Board also considered research support available to, and portfolio management capabilities of, the fund’s portfolio management personnel and that Dreyfus also provides oversight of day-to-day fund operations, including fund accounting and administration and assistance in meeting legal and regulatory requirements.The Board also considered Dreyfus’ extensive administrative, accounting, and compliance infrastructures.
44
Comparative Analysis of the Fund’s Performance and Management Fee and Expense Ratio. The Board reviewed reports prepared by Lipper, Inc. (“Lipper”), an independent provider of investment company data, which included information comparing (1) the fund’s performance with the performance of a group of comparable funds (the “Performance Group”) and with a broader group of funds (the “Performance Universe”), all for various periods ended May 31, 2013, and (2) the fund’s actual and contractual management fees and total expenses with those of a group of comparable funds (the “Expense Group”) and with a broader group of funds (the “Expense Universe”), the information for which was derived in part from fund financial statements available to Lipper as of the date of its analysis. Dreyfus previously had furnished the Board with a description of the methodology Lipper used to select the Performance Group and Performance Universe and the Expense Group and Expense Universe.
Dreyfus representatives stated that the usefulness of performance comparisons may be affected by a number of factors, including different investment limitations that may be applicable to the fund and comparison funds. The Board discussed the results of the comparisons and noted that the fund’s total return performance was above or at the Performance Group and Performance Universe medians for the various periods, except for the ten-year period when the fund’s performance was below the Performance Group median.The Board also noted that the fund’s yield performance was above or at the Performance Group median and above the Performance Universe median for all of the ten one-year periods ended May 31st. Dreyfus also provided a comparison of the fund’s calendar year total returns to the returns of the fund’s benchmark index.
The Board also reviewed the range of actual and contractual management fees and total expenses of the Expense Group and Expense Universe funds and discussed the results of the comparisons. The
The Fund 45
INFORMATION ABOUT THE RENEWAL OF THE FUND’S
MANAGEMENT AGREEMENT (Unaudited) (continued)
Board noted that the fund’s contractual management fee was above the Expense Group median, the fund’s actual management fee was below the Expense Group and Expense Universe medians and the fund’s total expenses were above the Expense Group and Expense Universe medians. Dreyfus representatives noted that Dreyfus has contractually agreed to waive receipt of its fees and/or assume the expenses of the fund, until December 1, 2013, so that annual direct fund operating expenses (excluding Rule 12b-1 fees, shareholder services fees, taxes, interest, brokerage commissions, commitment fees on borrowings, acquired fund fees and extraordinary expenses) do not exceed 0.45% of the fund’s average daily net assets.
Dreyfus representatives reviewed with the Board the management or investment advisory fees (1) paid by funds advised or administered by Dreyfus that are in the same Lipper category as the fund and (2) paid to Dreyfus or the Dreyfus-affiliated primary employer of the fund’s primary portfolio manager(s) for advising any separate accounts and/or other types of client portfolios that are considered to have similar investment strategies and policies as the fund (the “Similar Clients”), and explained the nature of the Similar Clients. They discussed differences in fees paid and the relationship of the fees paid in light of any differences in the services provided and other relevant factors. The Board considered the relevance of the fee information provided for the Similar Clients to evaluate the appropriateness and reasonableness of the fund’s management fee.
Analysis of Profitability and Economies of Scale. Dreyfus representatives reviewed the expenses allocated and profit received by Dreyfus and the resulting profitability percentage for managing the fund and the aggregate profitability percentage to Dreyfus of managing the funds in the Dreyfus fund complex, and the method used to determine the expenses and profit. The Board concluded that the prof-
46
itability results were not unreasonable, given the services rendered and service levels provided by Dreyfus.The Board also noted the expense limitation arrangement and its effect on Dreyfus’ profitability. The Board also had been provided with information prepared by an independent consulting firm regarding Dreyfus’ approach to allocating costs to, and determining the profitability of, individual funds and the entire Dreyfus fund complex.The consulting firm also had analyzed where any economies of scale might emerge in connection with the management of a fund.
The Board considered on the advice of its counsel the profitability analysis (1) as part of its evaluation of whether the fees under the Agreement bear a reasonable relationship to the mix of services provided by Dreyfus, including the nature, extent and quality of such services, and (2) in light of the relevant circumstances for the fund and the extent to which economies of scale would be realized if the fund grows and whether fee levels reflect these economies of scale for the benefit of fund shareholders. Dreyfus representatives noted that a discussion of economies of scale is predicated on a fund having achieved a substantial size with increasing assets and that, if a fund’s assets had been stable or decreasing, the possibility that Dreyfus may have realized any economies of scale would be less. Dreyfus representatives also noted that, as a result of shared and allocated costs among funds in the Dreyfus fund complex, the extent of economies of scale could depend substantially on the level of assets in the complex as a whole, so that increases and decreases in complex-wide assets can affect potential economies of scale in a manner that is disproportionate to, or even in the opposite direction from, changes in the fund’s asset level.The Board also considered potential benefits to Dreyfus from acting as investment adviser and noted that there were no soft dollar arrangements in effect for trading the fund’s investments.
The Fund 47
INFORMATION ABOUT THE RENEWAL OF THE FUND’S
MANAGEMENT AGREEMENT (Unaudited) (continued)
At the conclusion of these discussions, the Board agreed that it had been furnished with sufficient information to make an informed business decision with respect to the renewal of the Agreement. Based on the discussions and considerations as described above, the Board concluded and determined as follows.
The Board concluded that the nature, extent and quality of the services provided by Dreyfus are adequate and appropriate.
The Board was satisfied with the fund’s performance.
The Board concluded that the fee paid to Dreyfus was reasonable in light of the considerations described above.
The Board determined that the economies of scale which may accrue to Dreyfus and its affiliates in connection with the management of the fund had been adequately considered by Dreyfus in connection with the fee rate charged to the fund pursuant to the Agreement and that, to the extent in the future it were determined that material economies of scale had not been shared with the fund, the Board would seek to have those economies of scale shared with the fund.
In evaluating the Agreement, the Board considered these conclusions and determinations and also relied on its previous knowledge, gained through meetings and other interactions with Dreyfus and its affiliates, of the fund and the services provided to the fund by Dreyfus.The Board also relied on information received on a routine and regular basis throughout the year relating to the operations of the fund and the investment management and other services provided under the Agreement, including information on the investment performance of the fund in comparison to similar mutual funds and benchmark performance indices; general market outlook as applicable to the fund; and compliance reports. In addition, the Board’s consideration of the contractual fee arrangements for this fund had the benefit of a number of
48
years of reviews of prior or similar agreements during which lengthy discussions took place between the Board and Dreyfus representatives. Certain aspects of the arrangements may receive greater scrutiny in some years than in others, and the Board’s conclusions may be based, in part, on their consideration of the same or similar arrangements in prior years.The Board determined that renewal of the Agreement was in the best interests of the fund and its shareholders.
The Fund 49
BOARD MEMBERS INFORMATION (Unaudited)
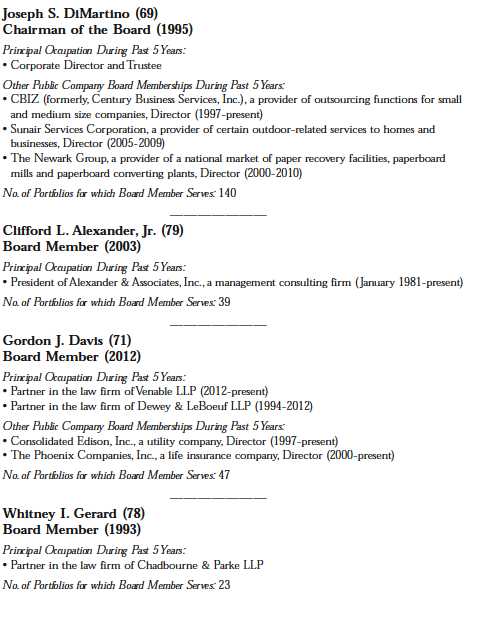
50
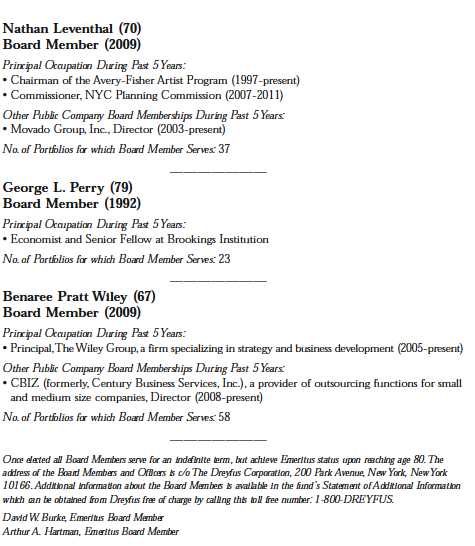
The Fund 51
OFFICERS OF THE FUND (Unaudited)
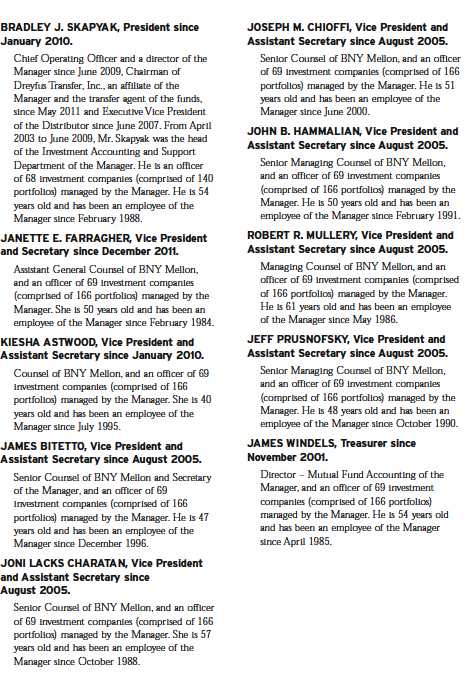
52
The Fund 53
Item 2. Code of Ethics.
The Registrant has adopted a code of ethics that applies to the Registrant's principal executive officer, principal financial officer, principal accounting officer or controller, or persons performing similar functions. There have been no amendments to, or waivers in connection with, the Code of Ethics during the period covered by this Report.
Item 3. Audit Committee Financial Expert.
The Registrant's Board has determined that Joseph S. DiMartino, a member of the Audit Committee of the Board, is an audit committee financial expert as defined by the Securities and Exchange Commission (the "SEC"). Joseph S. DiMartino is "independent" as defined by the SEC for purposes of audit committee financial expert determinations.
Item 4. Principal Accountant Fees and Services.
(a) Audit Fees. The aggregate fees billed for each of the last two fiscal years (the "Reporting Periods") for professional services rendered by the Registrant's principal accountant (the "Auditor") for the audit of the Registrant's annual financial statements or services that are normally provided by the Auditor in connection with the statutory and regulatory filings or engagements for the Reporting Periods, were $111,222 in 2012 and $113,805 in 2013.
(b) Audit-Related Fees. The aggregate fees billed in the Reporting Periods for assurance and related services by the Auditor that are reasonably related to the performance of the audit of the Registrant's financial statements and are not reported under paragraph (a) of this Item 4 were $18,000 in 2012 and $26,400 in 2013. These services consisted of one or more of the following: (i) agreed upon procedures related to compliance with Internal Revenue Code section 817(h), (ii) security counts required by Rule 17f-2 under the Investment Company Act of 1940, as amended, (iii) advisory services as to the accounting or disclosure treatment of Registrant transactions or events and (iv) advisory services to the accounting or disclosure treatment of the actual or potential impact to the Registrant of final or proposed rules, standards or interpretations by the Securities and Exchange Commission, the Financial Accounting Standards Boards or other regulatory or standard-setting bodies.
The aggregate fees billed in the Reporting Periods for non-audit assurance and related services by the Auditor to the Registrant's investment adviser (not including any sub-investment adviser whose role is primarily portfolio management and is subcontracted with or overseen by another investment adviser), and any entity controlling, controlled by or under common control with the investment adviser that provides ongoing services to the Registrant ("Service Affiliates"), that were reasonably related to the performance of the annual audit of the Service Affiliate, which required pre-approval by the Audit Committee were $0 in 2012 and $0 in 2013.
(c) Tax Fees. The aggregate fees billed in the Reporting Periods for professional services rendered by the Auditor for tax compliance, tax advice, and tax planning ("Tax Services") were $8,903 in 2012 and $10,052 in 2013. These services consisted of: (i) review or preparation of U.S. federal, state, local and excise tax returns; (ii) U.S. federal, state and local tax planning, advice and assistance regarding statutory, regulatory or administrative developments; (iii) tax advice regarding tax qualification matters and/or treatment of various financial instruments held or proposed to be acquired or held, and (iv) determination of Passive Foreign Investment Companies. The aggregate fees billed in the Reporting Periods for Tax Services by the Auditor to Service Affiliates, which required pre-approval by the Audit Committee were $0 in 2012 and $0 in 2013.
(d) All Other Fees. The aggregate fees billed in the Reporting Periods for products and services provided by the Auditor, other than the services reported in paragraphs (a) through (c) of this Item, were $2,768 in 2012 and $2,789 in 2013. [These services consisted of a review of the Registrant's anti-money laundering program].
The aggregate fees billed in the Reporting Periods for Non-Audit Services by the Auditor to Service Affiliates, other than the services reported in paragraphs (b) through (c) of this Item, which required pre-approval by the Audit Committee, were $200,000 in 2012 and $0 in 2013.
(e)(1) Audit Committee Pre-Approval Policies and Procedures. The Registrant's Audit Committee has established policies and procedures (the "Policy") for pre-approval (within specified fee limits) of the Auditor's engagements for non-audit services to the Registrant and Service Affiliates without specific case-by-case consideration. The pre-approved services in the Policy can include pre-approved audit services, pre-approved audit-related services, pre-approved tax services and pre-approved all other services. Pre-approval considerations include whether the proposed services are compatible with maintaining the Auditor's independence. Pre-approvals pursuant to the Policy are considered annually.
(e)(2) Note: None of the services described in paragraphs (b) through (d) of this Item 4 were approved by the Audit Committee pursuant to paragraph (c)(7)(i)(C) of Rule 2-01 of Regulation S-X.
(f) None of the hours expended on the principal accountant's engagement to audit the registrant's financial statements for the most recent fiscal year were attributed to work performed by persons other than the principal account's full-time, permanent employees.
Non-Audit Fees. The aggregate non-audit fees billed by the Auditor for services rendered to the Registrant, and rendered to Service Affiliates, for the Reporting Periods were $40,144,410 in 2012 and $51,691,422 in 2013.
Auditor Independence. The Registrant's Audit Committee has considered whether the provision of non-audit services that were rendered to Service Affiliates, which were not pre-approved (not requiring pre-approval), is compatible with maintaining the Auditor's independence.
Item 5. Audit Committee of Listed Registrants.
Not applicable. [CLOSED-END FUNDS ONLY]
Item 6. Investments.
(a) Not applicable.
Item 7. Disclosure of Proxy Voting Policies and Procedures for Closed-End Management Investment Companies.
Not applicable. [CLOSED-END FUNDS ONLY]
Item 8. Portfolio Managers of Closed-End Management Investment Companies.
Not applicable. [CLOSED-END FUNDS ONLY, beginning with reports for periods ended on and after December 31, 2005]
Item 9. Purchases of Equity Securities by Closed-End Management Investment Companies and Affiliated Purchasers.
Not applicable. [CLOSED-END FUNDS ONLY]
Item 10. Submission of Matters to a Vote of Security Holders.
There have been no material changes to the procedures applicable to Item 10.
Item 11. Controls and Procedures.
(a) The Registrant's principal executive and principal financial officers have concluded, based on their evaluation of the Registrant's disclosure controls and procedures as of a date within 90 days of the filing date of this report, that the Registrant's disclosure controls and procedures are reasonably designed to ensure that information required to be disclosed by the Registrant on Form N-CSR is recorded, processed, summarized and reported within the required time periods and that information required to be disclosed by the Registrant in the reports that it files or submits on Form N-CSR is accumulated and communicated to the Registrant's management, including its principal executive and principal financial officers, as appropriate to allow timely decisions regarding required disclosure.
(b) There were no changes to the Registrant's internal control over financial reporting that occurred during the second fiscal quarter of the period covered by this report that have materially affected, or are reasonably likely to materially affect, the Registrant's internal control over financial reporting.
Item 12. Exhibits.
(a)(1) Code of ethics referred to in Item 2.
(a)(2) Certifications of principal executive and principal financial officers as required by Rule 30a-2(a) under the Investment Company Act of 1940.
(a)(3) Not applicable.
(b) Certification of principal executive and principal financial officers as required by Rule 30a-2(b) under the Investment Company Act of 1940.
SIGNATURES
Pursuant to the requirements of the Securities Exchange Act of 1934 and the Investment Company Act of 1940, the Registrant has duly caused this Report to be signed on its behalf by the undersigned, thereunto duly authorized.
Dreyfus Investment Grade Funds, Inc.
By: /s/ Bradley J. Skapyak |
Bradley J. Skapyak, President |
Date: | September 25, 2013 |
|
Pursuant to the requirements of the Securities Exchange Act of 1934 and the Investment Company Act of 1940, this Report has been signed below by the following persons on behalf of the Registrant and in the capacities and on the dates indicated. |
|
By: /s/ Bradley J. Skapyak |
Bradley J. Skapyak, President |
Date: | September 25, 2013 |
|
By: /s/ James Windels |
James Windels, Treasurer |
Date: | September 25, 2013 |
|
EXHIBIT INDEX
(a)(1) Code of ethics referred to in Item 2.
(a)(2) Certifications of principal executive and principal financial officers as required by Rule 30a-2(a) under the Investment Company Act of 1940. (EX-99.CERT)
(b) Certification of principal executive and principal financial officers as required by Rule 30a-2(b) under the Investment Company Act of 1940. (EX-99.906CERT)
Exhibit (a)(1)
[INSERT CODE OF ETHICS]
Exhibit A
Persons Covered by the Code of Ethics
Bradley J. Skapyak | President | (Principal Executive Officer) |
| | |
James Windels | Treasurer | (Principal Financial and Accounting Officer) |
Revised as of January 1, 2010