UNITED STATES
SECURITIES AND EXCHANGE COMMISSION
Washington, D.C. 20549
FORM N-CSR
CERTIFIED SHAREHOLDER REPORT OF REGISTERED MANAGEMENT
INVESTMENT COMPANIES
Investment Company Act file number | 811- 6718 |
| |
| Dreyfus Investment Grade Funds, Inc. | |
| (Exact name of Registrant as specified in charter) | |
| | |
| c/o The Dreyfus Corporation 200 Park Avenue New York, New York 10166 | |
| (Address of principal executive offices) (Zip code) | |
| | |
| Janette E. Farragher, Esq. 200 Park Avenue New York, New York 10166 | |
| (Name and address of agent for service) | |
|
Registrant's telephone number, including area code: | (212) 922-6000 |
| |
Date of fiscal year end: | 7/31 | |
Date of reporting period: | 7/31/12 | |
| | | | | | | |
FORM N-CSR
Item 1. Reports to Stockholders.
Save time. Save paper. View your next shareholder report online as soon as it’s available. Log into www.dreyfus.com and sign up for Dreyfus eCommunications. It’s simple and only takes a few minutes.
The views expressed in this report reflect those of the portfolio manager only through the end of the period covered and do not necessarily represent the views of Dreyfus or any other person in the Dreyfus organization. Any such views are subject to change at any time based upon market or other conditions and Dreyfus disclaims any responsibility to update such views.These views may not be relied on as investment advice and, because investment decisions for a Dreyfus fund are based on numerous factors, may not be relied on as an indication of trading intent on behalf of any Dreyfus fund.
Not FDIC-Insured • Not Bank-Guaranteed • May Lose Value
| | Contents |
| | THE FUND |
| 2 | A Letter from the Chairman and CEO |
| 3 | Discussion of Fund Performance |
| 6 | Fund Performance |
| 8 | Understanding Your Fund’s Expenses |
| 8 | Comparing Your Fund’s Expenses With Those of Other Funds |
| 9 | Statement of Investments |
| 11 | Statement of Assets and Liabilities |
| 12 | Statement of Operations |
| 13 | Statement of Changes in Net Assets |
| 15 | Financial Highlights |
| 17 | Notes to Financial Statements |
| 26 | Report of Independent Registered Public Accounting Firm |
| 27 | Important Tax Information |
| 28 | Information About the Renewal of the Fund’s Management Agreement |
| 33 | Board Members Information |
| 35 | Officers of the Fund |
| | FOR MORE INFORMATION |
| | Back Cover |
Dreyfus
Inflation Adjusted
Securities Fund
The Fund

A LETTER FROM THE CHAIRMAN AND CEO
Dear Shareholder:
We are pleased to present this annual report for Dreyfus InflationAdjusted Securities Fund covering the 12-month period from August 1, 2011, through July 31, 2012. For information about how the fund performed during the reporting period, as well as general market perspectives, we provide a Discussion of Fund Performance on the pages that follow.
The bond market proved volatile over the reporting period, as an intensifying European debt crisis and an unprecedented downgrade of long-term U.S. government securities last year triggered a massive flight to perceived safe havens in August and September 2011.Then, favorable U.S. employment data and liquidity enhancements from European policymakers sparked rallies through the first quarter of 2012. However, political developments later raised doubts about some of Europe’s proposed solutions, and U.S. economic data weakened in the spring. Despite these swings in investor sentiment, most bond market sectors produced respectable total rates of return for the reporting period due in part to wide yield spreads based on U.S. Treasury securities, which have been pegged near historically low levels for most of the reporting period.
Although challenges remain overseas, we believe the U.S. economy is likely to maintain positive economic growth while overseas markets contend with growth recessionary environments. In our judgment, current sluggishness is at least partly due to the lagging effects of tighter monetary policies in some areas of the world, and we expect stronger growth when a shift to more accommodative policies begins to have an impact on global economic activity. In addition, the adjustment among U.S. exporters to weaker European demand and slower economic growth in certain emerging markets should be largely completed later this year, potentially setting the stage for a stronger economic rebound in 2013.
As always, we encourage you to discuss our observations with your financial advisor.
Thank you for your continued confidence and support.

Jonathan R. Baum
Chairman and Chief Executive Officer
The Dreyfus Corporation
August 15, 2012
2

DISCUSSION OF FUND PERFORMANCE
For the period of August 1, 2011, through July 31, 2012, as provided by Robert Bayston, David Horsfall, CFA and Nate Pearson, CFA, Portfolio Managers
Fund and Market Performance Overview
For the 12-month period ended July 31, 2012, Dreyfus Inflation Adjusted Securities Fund’s Institutional shares produced a total return of 9.16%, and the fund’s Investor shares returned 8.80%.1 In comparison, the fund’s benchmark, the Barclays U.S. Treasury Inflation Protected Securities Index (the “Index”), produced a total return of 9.49% for the same period.2 Bouts of domestic economic weakness, turmoil in overseas markets and more accommodative monetary policies among the world’s central banks caused yields of longer-term U.S.Treasury securities—including Treasury Inflation Protected Securities (“TIPS”)—to fall and their prices to rise.The fund produced lower returns than its benchmark, as a relatively short average duration over the summer of 2012 prevented the fund from participating more fully in market rallies.
The Fund’s Investment Approach
The fund seeks returns that exceed the rate of inflation.To pursue its goal, the fund normally invests at least 80% of its net assets in inflation-indexed securities, which are fixed income securities designed to protect investors from a loss of value due to inflation by periodically adjusting their principal and/or coupon according to the rate of inflation.
The fund invests primarily in high-quality, U.S. dollar-denominated, inflation-indexed securities.To a limited extent, the fund may invest in foreign currency-denominated, inflation-protected securities and other fixed income securities not adjusted for inflation, including U.S. government bonds and notes, corporate bonds, mortgage-related securities and asset-backed securities. The fund seeks to keep its average effective duration between two and 10 years, and the fund may invest in securities of any maturity without restriction.
Macroeconomic Developments Boosted U.S. Treasuries
Just days after the start of the reporting period, financial markets were roiled by the downgrade of one rating agency’s assessment of long-term
DISCUSSION OF FUND PERFORMANCE (continued)
U.S. government securities.This development, together with a worsening sovereign debt crisis in Europe, triggered a flight to quality among investors, and traditional safe havens such as U.S. Treasury securities gained substantial value.
Employment gains and other encouraging U.S. economic news helped alleviate investors’ worries in October, and a quantitative easing program in Europe appeared to forestall a more severe banking crisis in the region. As a result,Treasuries gave back some of their previous gains as investors grew more tolerant of risks and turned away from traditional safe havens and toward riskier market sectors. However, the Federal Reserve Board (the “Fed”) launched Operation Twist, a stimulative program involving massive purchases of longer-term U.S. Treasury securities, and yields remained near historical lows.
The U.S. economic recovery faltered in the spring of 2012 when the public sector shed jobs and employment gains in the private sector moderated. Meanwhile, proposed austerity programs to relieve fiscal pressures in Europe encountered political resistance.Yields of U.S.Treasury securities plunged to record lows, fueling additional price appreciation.
Inflationary pressures remained relatively muted during the reporting period, primarily due to falling energy prices. However, the core inflation rate, which excludes food and energy, was buoyed by rising apparel prices when raw materials became more expensive. Automobile and housing prices also climbed as the disruptive effects of the 2011 Japan earthquake and 2008 financial crisis, respectively, receded over time.
Duration Strategy Produced Mixed Results
At the start of the reporting period, we set the fund’s average duration in a position that was roughly in line with the benchmark, and we maintained an emphasis on TIPS with 10-year maturities and strong liquidity characteristics.This strategy enabled the fund to participate in rallies while cushioning market declines over the second half of 2011. In early 2012, in anticipation of narrower yield differences along the market’s maturity spectrum, we shifted the fund’s emphasis toTIPS with 30-year maturities.This move enabled the fund to participate more fully in rallies while reducing its exposure to short-term securities, which we regarded as overvalued. Finally, over the summer of 2012, after yields had fallen to historical lows, we moved the fund’s average duration to a
4
relatively short position.While we believe this strategy positions the fund well for the longer term, it prevented fuller participation in market rallies during June and July.
Maintaining a Cautious Stance
Market volatility is likely to remain elevated over the near term as investors react to headlines trumpeting Europe’s struggles. Moreover, recently mixed U.S. economic data has increased the likelihood of additional measures from the Fed to stimulate economic growth. Meanwhile, we expect inflationary pressures to rise modestly as housing costs climb, especially in the rental market. Conversely, wage inflation is likely to remain negligible. In light of these factors, we have maintained the fund’s average duration in a relatively short position, and we have focused our security selection strategy on TIPS that, in our analysis, feature favorable seasonal characteristics.
August 15, 2012
| |
| | Bond funds are subject generally to interest rate, credit, liquidity and market risks, to varying degrees, |
| | all of which are more fully described in the fund’s prospectus. Generally, all other factors being equal, |
| | bond prices are inversely related to interest-rate changes, and rate increases can cause price declines. |
| | Interest payments on inflation-protected bonds will vary as the bond’s principal value is |
| | periodically adjusted based on the rate of inflation. If the index measuring inflation falls, the |
| | interest payable on these securities will be reduced.Any increase in the principal amount of an |
| | inflation-protected bond (which follows a rise in the relevant inflation index), will be considered |
| | taxable ordinary income, even though investors do not receive their principal until maturity. |
| | During periods of rising interest rates and flat or declining inflation rates, inflation-protected bonds |
| | can underperform. Inflation-protected bonds issued by corporations generally do not guarantee |
| | repayment of principal. |
| | Investing internationally involves special risk, including changes in currency exchange rates, |
| | political, economic and social instability, a lack of comprehensive company information, differing |
| | auditing and legal standards, and less market liquidity. |
| | Investments in foreign currencies are subject to the risk that those currencies will decline in relative |
| | value to the U.S. dollar, or, in the case of hedged positions, that the U.S. dollar will decline relative |
| | to the currency being hedged. Each of these risks could increase the fund’s volatility. |
| | The fund may use derivative instruments, such as options, futures and options on futures, forward |
| | contracts, swaps (including credit default swaps on corporate bonds and asset-backed securities), |
| | options on swaps and other credit derivatives.A small investment in derivatives could have a |
| | potentially large impact on the fund’s performance.The use of derivatives involves risks different |
| | from, or possibly greater than, the risks associated with investing directly in the underlying assets. |
| 1 | Total return includes reinvestment of dividends and any capital gains paid. Past performance is no |
| | guarantee of future results. Share price, yield and investment return fluctuate such that upon |
| | redemption, fund shares may be worth more or less than their original cost. |
| 2 | SOURCE: LIPPER INC. — Reflects reinvestment of dividends and, where applicable, capital |
| | gain distributions.The Barclays U.S.Treasury Inflation Protected Securities Index is a sub-index |
| | of the U.S.Treasury component of the Barclays U.S. Government Index. Securities in the |
| | Barclays U.S.Treasury Inflation Protected Securities Index are dollar-denominated, non- |
| | convertible, publicly issued, fixed-rate, investment-grade (Moody’s Baa3 or better) U.S.Treasury |
| | inflation notes, with at least one year to final maturity and at least $100 million par amount |
| | outstanding. Investors cannot invest directly in any index. |
FUND PERFORMANCE

† Source: Lipper Inc.
Past performance is not predictive of future performance.
The above graph compares a $10,000 investment made in Investor shares and Institutional shares of Dreyfus Inflation Adjusted Securities Fund on 10/31/02 (inception date) to a $10,000 investment made in the Barclays U.S.Treasury Inflation Protected Securities Index (the “Index”) on that date.All dividends and capital gain distributions are reinvested. The fund’s performance shown in the line graph above takes into account all applicable fees and expenses for Investor and Institutional shares.The Index is a sub-index of the U.S.Treasury component of the Barclays U.S. Government Index. Securities in the Index are dollar-denominated, non-convertible, publicly-issued, fixed-rate, investment-grade (Moody’s Baa3 or better) U.S.Treasury inflation notes, with at least one year to final maturity and at least $100 million par amount outstanding. Unlike a mutual fund, the Index is not subject to charges, fees and other expenses. Investors cannot invest directly in any index. Further information relating to fund performance, including expense reimbursements, if applicable, is contained in the Financial Highlights section of the prospectus and elsewhere in this report.
6
| | | | | | | |
| Average Annual Total Returns as of 7/31/12 | | | |
| | Inception | | | From |
| | Date | 1Year | 5 Years | Inception |
| Investor shares | 10/31/02 | 8.80% | 7.73% | 6.36% |
| Institutional shares | 10/31/02 | 9.16% | 8.05% | 6.65% |
| Barclays U.S. Treasury | | | | |
| Inflation Protected | | | | |
| Securities Index | 10/31/02 | 9.49% | 8.36% | 7.08% |
Past performance is not predictive of future performance.The fund’s performance shown in the graph and table does not reflect the deduction of taxes that a shareholder would pay on fund distributions or the redemption of fund shares.
As a mutual fund investor, you pay ongoing expenses, such as management fees and other expenses. Using the information below, you can estimate how these expenses affect your investment and compare them with the expenses of other funds.You also may pay one-time transaction expenses, including sales charges (loads) and redemption fees, which are not shown in this section and would have resulted in higher total expenses. For more information, see your fund’s prospectus or talk to your financial adviser.
Review your fund’s expenses
The table below shows the expenses you would have paid on a $1,000 investment in Dreyfus Inflation Adjusted Securities Fund from February 1, 2012 to July 31, 2012. It also shows how much a $1,000 investment would be worth at the close of the period, assuming actual returns and expenses.
| | | | |
| Expenses and Value of a $1,000 Investment | | |
| assuming actual returns for the six months ended July 31, 2012 | | |
| | | Investor Shares | | Institutional Shares |
| Expenses paid per $1,000† | $ | 3.54 | $ | 1.92 |
| Ending value (after expenses) | $ | 1,031.90 | $ | 1,033.60 |
|
| COMPARING YOUR FUND’S EXPENSES |
| WITH THOSE OF OTHER FUNDS (Unaudited) |
Using the SEC’s method to compare expenses
The Securities and Exchange Commission (SEC) has established guidelines to help investors assess fund expenses. Per these guidelines, the table below shows your fund’s expenses based on a $1,000 investment, assuming a hypothetical 5% annualized return. You can use this information to compare the ongoing expenses (but not transaction expenses or total cost) of investing in the fund with those of other funds.All mutual fund shareholder reports will provide this information to help you make this comparison. Please note that you cannot use this information to estimate your actual ending account balance and expenses paid during the period.
| | | | |
| Expenses and Value of a $1,000 Investment | | |
| assuming a hypothetical 5% annualized return for the six months ended July 31, 2012 |
| | | Investor Shares | | Institutional Shares |
| Expenses paid per $1,000† | $ | 3.52 | $ | 1.91 |
| Ending value (after expenses) | $ | 1,021.38 | $ | 1,022.97 |
† Expenses are equal to the fund’s annualized expense ratio of .70% for Investor Shares and .38% for Institutional Shares, multiplied by the average account value over the period, multiplied by 182/366 (to reflect the one-half year period).
8
|
| STATEMENT OF INVESTMENTS |
| July 31, 2012 |
| | | |
| | Principal | | |
| Bonds and Notes—99.5% | Amount ($) | | Value ($) |
| U.S. Treasury Inflation Protected Securities: | | | |
| 0.13%, 4/15/16 | 15,086,988 | a,b | 15,859,019 |
| 0.13%, 1/15/22 | 25,374,853 | b | 27,416,742 |
| 0.63%, 7/15/21 | 19,190,754 | a,b | 21,742,529 |
| 1.13%, 1/15/21 | 16,520,842 | a,b | 19,313,905 |
| 1.25%, 7/15/20 | 9,916,446 | a,b | 11,693,662 |
| 1.38%, 1/15/20 | 10,101,819 | a,b | 11,918,570 |
| 1.63%, 1/15/18 | 10,054,280 | a,b | 11,623,693 |
| 1.75%, 1/15/28 | 4,322,298 | a,b | 5,600,078 |
| 2.00%, 1/15/14 | 15,790,168 | b | 16,478,525 |
| 2.00%, 7/15/14 | 33,449,849 | a,b | 35,631,917 |
| 2.00%, 1/15/16 | 3,473,790 | a,b | 3,872,192 |
| 2.00%, 1/15/26 | 15,576,474 | a,b | 20,425,867 |
| 2.13%, 2/15/40 | 8,937,121 | a,b | 13,387,530 |
| 2.13%, 2/15/41 | 13,732,315 | a,b | 20,729,355 |
| 2.38%, 1/15/25 | 6,010,853 | a,b | 8,116,058 |
| 2.50%, 7/15/16 | 68,717,596 | a,b | 79,315,155 |
| 2.50%, 1/15/29 | 9,494,803 | a,b | 13,634,689 |
| 3.63%, 4/15/28 | 20,868,072 | a,b | 33,190,021 |
| Total Bonds and Notes | | | |
| (cost $341,468,930) | | | 369,949,507 |
STATEMENT OF INVESTMENTS (continued)
| | | | |
| Other Investment—.6% | Shares | Value ($) |
| Registered Investment Company; | | |
| Dreyfus Institutional Preferred | | |
| Plus Money Market Fund | | |
| (cost $2,357,290) | 2,357,290c | 2,357,290 |
| |
| Total Investments (cost $343,826,220) | 100.1% | 372,306,797 |
| Liabilities, Less Cash and Receivables | (.1%) | (277,137) |
| Net Assets | 100.0% | 372,029,660 |
|
| a Security, or portion thereof, on loan. At July 31, 2012, the value of the fund’s securities on loan was |
| $140,483,359 and the value of the collateral held by the fund was $142,886,408, consisting of U. S. |
| Government and Agency securities. |
| b Principal amount for accrual purposes is periodically adjusted based on changes in the Consumer Price Index. |
| c Investment in affiliated money market mutual fund. |
| | | |
| Portfolio Summary (Unaudited)† | | |
| | Value (%) | | Value (%) |
| U.S. Government & Agencies | 99.5 | Money Market Investment | .6 |
| | | | 100.1 |
| † Based on net assets. | | | |
| See notes to financial statements. | | | |
10
|
| STATEMENT OF ASSETS AND LIABILITIES |
| July 31, 2012 |
| | |
| | Cost | Value |
| Assets ($): | | |
| Investments in securities—See Statement of Investments (including | |
| securities on loan, valued at $140,483,359)—Note 1(b): | | |
| Unaffiliated issuers | 341,468,930 | 369,949,507 |
| Affiliated issuers | 2,357,290 | 2,357,290 |
| Cash | | 295,228 |
| Receivable for investment securities sold | | 12,209,285 |
| Dividends, interest and securities lending income receivable | | 655,981 |
| Receivable for shares of Common Stock subscribed | | 392,805 |
| Prepaid expenses | | 11,356 |
| | | 385,871,452 |
| Liabilities ($): | | |
| Due to The Dreyfus Corporation and affiliates—Note 3(b) | | 122,532 |
| Payable for investment securities purchased | | 13,528,925 |
| Payable for shares of Common Stock redeemed | | 120,575 |
| Accrued expenses | | 69,760 |
| | | 13,841,792 |
| Net Assets ($) | | 372,029,660 |
| Composition of Net Assets ($): | | |
| Paid-in capital | | 336,491,381 |
| Accumulated undistributed investment income—net | | 1,326,452 |
| Accumulated net realized gain (loss) on investments | | 5,731,250 |
| Accumulated net unrealized appreciation | | |
| (depreciation) on investments | | 28,480,577 |
| Net Assets ($) | | 372,029,660 |
| |
| |
| Net Asset Value Per Share | | |
| | Investor Shares | Institutional Shares |
| Net Assets ($) | 63,052,898 | 308,976,762 |
| Shares Outstanding | 4,372,275 | 21,433,740 |
| Net Asset Value Per Share ($) | 14.42 | 14.42 |
| |
| See notes to financial statements. | | |
|
| STATEMENT OF OPERATIONS |
| Year Ended July 31, 2012 |
| | |
| Investment Income ($): | |
| Income: | |
| Interest | 8,706,211 |
| Income from securities lending—Note 1(b) | 68,532 |
| Dividends; | |
| Affiliated issuers | 1,528 |
| Total Income | 8,776,271 |
| Expenses: | |
| Management fee—Note 3(a) | 938,177 |
| Shareholder servicing costs—Note 3(b) | 215,652 |
| Professional fees | 60,424 |
| Registration fees | 38,429 |
| Custodian fees—Note 3(b) | 24,929 |
| Prospectus and shareholders’ reports | 22,989 |
| Directors’ fees and expenses—Note 3(c) | 11,807 |
| Loan commitment fees—Note 2 | 2,941 |
| Miscellaneous | 19,230 |
| Total Expenses | 1,334,578 |
| Less—reduction in fees due to earnings credits—Note 3(b) | (43) |
| Net Expenses | 1,334,535 |
| Investment Income—Net | 7,441,736 |
| Realized and Unrealized Gain (Loss) on Investments—Note 4 ($): | |
| Net realized gain (loss) on investments | 7,452,085 |
| Net unrealized appreciation (depreciation) on investments | 12,400,455 |
| Net Realized and Unrealized Gain (Loss) on Investments | 19,852,540 |
| Net Increase in Net Assets Resulting from Operations | 27,294,276 |
| |
| See notes to financial statements. | |
12
STATEMENT OF CHANGES IN NET ASSETS
| | | | |
| | | Year Ended July 31, |
| | 2012 | 2011 |
| Operations ($): | | |
| Investment income—net | 7,441,736 | 8,847,125 |
| Net realized gain (loss) on investments | 7,452,085 | 2,414,887 |
| Net unrealized appreciation | | |
| (depreciation) on investments | 12,400,455 | 10,813,042 |
| Net Increase (Decrease) in Net Assets | | |
| Resulting from Operations | 27,294,276 | 22,075,054 |
| Dividends to Shareholders from ($): | | |
| Investment income—net: | | |
| Investor Shares | (1,234,033) | (1,501,489) |
| Institutional Shares | (6,763,300) | (6,170,802) |
| Net realized gain on investments: | | |
| Investor Shares | (461,245) | (98,397) |
| Institutional Shares | (2,140,902) | (321,249) |
| Total Dividends | (10,599,480) | (8,091,937) |
| Capital Stock Transactions ($): | | |
| Net proceeds from shares sold: | | |
| Investor Shares | 28,541,270 | 13,487,739 |
| Institutional Shares | 143,727,438 | 116,242,045 |
| Dividends reinvested: | | |
| Investor Shares | 1,616,217 | 1,530,780 |
| Institutional Shares | 3,370,949 | 1,864,926 |
| Cost of shares redeemed: | | |
| Investor Shares | (16,458,174) | (14,232,560) |
| Institutional Shares | (58,631,848) | (28,417,119) |
| Increase (Decrease) in Net Assets | | |
| from Capital Stock Transactions | 102,165,852 | 90,475,811 |
| Total Increase (Decrease) in Net Assets | 118,860,648 | 104,458,928 |
| Net Assets ($): | | |
| Beginning of Period | 253,169,012 | 148,710,084 |
| End of Period | 372,029,660 | 253,169,012 |
| Undistributed investment income—net | 1,326,452 | 1,874,364 |
STATEMENT OF CHANGES IN NET ASSETS (continued)
| | | | |
| | | Year Ended July 31, |
| | 2012 | 2011 |
| Capital Share Transactions: | | |
| Investor Shares | | |
| Shares sold | 2,034,250 | 1,035,465 |
| Shares issued for dividends reinvested | 115,336 | 116,118 |
| Shares redeemed | (1,174,295) | (1,093,860) |
| Net Increase (Decrease) in Shares Outstanding | 975,291 | 57,723 |
| Institutional Shares | | |
| Shares sold | 10,263,235 | 8,889,621 |
| Shares issued for dividends reinvested | 240,615 | 141,744 |
| Shares redeemed | (4,183,087) | (2,172,894) |
| Net Increase (Decrease) in Shares Outstanding | 6,320,763 | 6,858,471 |
| |
| See notes to financial statements. | | |
14
FINANCIAL HIGHLIGHTS
The following tables describe the performance for each share class for the fiscal periods indicated.All information (except portfolio turnover rate) reflects financial results for a single fund share.Total return shows how much your investment in the fund would have increased (or decreased) during each period, assuming you had reinvested all dividends and distributions.These figures have been derived from the fund’s financial statements.
| | | | | | | | | | |
| | | Year Ended July 31, | |
| Investor Shares | 2012 | 2011 | 2010 | 2009 | 2008 |
| Per Share Data ($): | | | | | |
| Net asset value, beginning of period | 13.68 | 12.83 | 11.98 | 12.30 | 11.67 |
| Investment Operations: | | | | | |
| Investment income—neta | .29 | .51 | .33 | .08 | .79 |
| Net realized and unrealized | | | | | |
| gain (loss) on investments | .89 | .82 | .76 | (.14) | .48 |
| Total from Investment Operations | 1.18 | 1.33 | 1.09 | (.06) | 1.27 |
| Distributions: | | | | | |
| Dividends from investment income—net | (.32) | (.45) | (.24) | (.16) | (.64) |
| Dividends from net realized | | | | | |
| gain on investments | (.12) | (.03) | — | (.10) | — |
| Total Distributions | (.44) | (.48) | (.24) | (.26) | (.64) |
| Net asset value, end of period | 14.42 | 13.68 | 12.83 | 11.98 | 12.30 |
| Total Return (%) | 8.80 | 10.60 | 9.23 | (.54) | 11.01 |
| Ratios/Supplemental Data (%): | | | | | |
| Ratio of total expenses | | | | | |
| to average net assets | .70 | .73 | .79 | .87 | 1.04 |
| Ratio of net expenses | | | | | |
| to average net assets | .70 | .73 | .71 | .55 | .55 |
| Ratio of net investment income | | | | | |
| to average net assets | 2.05 | 3.90 | 2.63 | .73 | 6.39 |
| Portfolio Turnover Rate | 97.40 | 138.50 | 61.50 | 77.13 | 90.18 |
| Net Assets, end of period ($ x 1,000) | 63,053 | 46,476 | 42,846 | 40,557 | 26,830 |
| |
| a Based on average shares outstanding at each month end. | | | | |
| See notes to financial statements. | | | | | |
FINANCIAL HIGHLIGHTS (continued)
| | | | | | | | | | |
| | | Year Ended July 31, | |
| Institutional Shares | 2012 | 2011 | 2010 | 2009 | 2008 |
| Per Share Data ($): | | | | | |
| Net asset value, beginning of period | 13.68 | 12.83 | 11.97 | 12.30 | 11.66 |
| Investment Operations: | | | | | |
| Investment income—neta | .34 | .62 | .37 | .11 | .84 |
| Net realized and unrealized | | | | | |
| gain (loss) on investments | .89 | .76 | .77 | (.15) | .48 |
| Total from Investment Operations | 1.23 | 1.38 | 1.14 | (.04) | 1.32 |
| Distributions: | | | | | |
| Dividends from investment income—net | (.37) | (.50) | (.28) | (.19) | (.68) |
| Dividends from net realized | | | | | |
| gain on investments | (.12) | (.03) | — | (.10) | — |
| Total Distributions | (.49) | (.53) | (.28) | (.29) | (.68) |
| Net asset value, end of period | 14.42 | 13.68 | 12.83 | 11.97 | 12.30 |
| Total Return (%) | 9.16 | 10.95 | 9.58 | (.30) | 11.29 |
| Ratios/Supplemental Data (%): | | | | | |
| Ratio of total expenses | | | | | |
| to average net assets | .37 | .40 | .44 | .55 | .77 |
| Ratio of net expenses | | | | | |
| to average net assets | .37 | .40 | .42 | .30 | .30 |
| Ratio of net investment income | | | | | |
| to average net assets | 2.45 | 4.71 | 2.97 | .98 | 6.68 |
| Portfolio Turnover Rate | 97.40 | 138.50 | 61.50 | 77.13 | 90.18 |
| Net Assets, end of period ($ x 1,000) | 308,977 | 206,693 | 105,864 | 24,577 | 13,740 |
| |
| a Based on average shares outstanding at each month end. | | | | |
| See notes to financial statements. | | | | | |
16
NOTES TO FINANCIAL STATEMENTS
NOTE 1—Significant Accounting Policies:
Dreyfus Inflation Adjusted Securities Fund (the “fund”) is a separate diversified series of Dreyfus Investment Grade Funds, Inc. (the “Company”), which is registered under the Investment Company Act of 1940, as amended (the “Act”), as an open-end management investment company and operates as a series company currently offering three series, including the fund.The fund’s investment objective is to seek returns that exceed the rate of inflation.The Dreyfus Corporation (the “Manager” or “Dreyfus”), a wholly-owned subsidiary of The Bank of New York Mellon Corporation (“BNY Mellon”), serves as the fund’s investment adviser.
MBSC Securities Corporation (the “Distributor”), a wholly-owned subsidiary of the Manager, is the distributor of the fund’s shares, which are sold to the public without a sales charge.The fund is authorized to issue 500 million shares of $.001 par value Common Stock in each of the following classes of shares: Investor and Institutional. Investor Shares are subject to a shareholder services plan. Other differences between the classes include the services offered to and the expenses borne by each class, the allocation of certain transfer agency costs and certain voting rights. Income, expenses (other than expenses attributable to a specific class), and realized and unrealized gains or losses on investments are allocated to each class of shares based on its relative net assets.
The Company accounts separately for the assets, liabilities and operations of each series. Expenses directly attributable to each series are charged to that series’ operations; expenses which are applicable to all series are allocated among them on a pro rata basis.
The Financial Accounting Standards Board (“FASB”) Accounting Standards Codification is the exclusive reference of authoritative U.S. generally accepted accounting principles (“GAAP”) recognized by the FASB to be applied by nongovernmental entities. Rules and interpretive releases of the Securities and Exchange Commission (“SEC”) under
NOTES TO FINANCIAL STATEMENTS (continued)
authority of federal laws are also sources of authoritative GAAP for SEC registrants. The fund’s financial statements are prepared in accordance with GAAP, which may require the use of management estimates and assumptions.Actual results could differ from those estimates.
The Company enters into contracts that contain a variety of indemnifications.The fund’s maximum exposure under these arrangements is unknown.The fund does not anticipate recognizing any loss related to these arrangements.
(a) Portfolio valuation: The fair value of a financial instrument is the amount that would be received to sell an asset or paid to transfer a liability in an orderly transaction between market participants at the measurement date (i.e., the exit price). GAAP establishes a fair value hierarchy that prioritizes the inputs of valuation techniques used to measure fair value.This hierarchy gives the highest priority to unadjusted quoted prices in active markets for identical assets or liabilities (Level 1 measurements) and the lowest priority to unobservable inputs (Level 3 measurements).
Additionally, GAAP provides guidance on determining whether the volume and activity in a market has decreased significantly and whether such a decrease in activity results in transactions that are not orderly. GAAP requires enhanced disclosures around valuation inputs and techniques used during annual and interim periods.
Various inputs are used in determining the value of the fund’s investments relating to fair value measurements.These inputs are summarized in the three broad levels listed below:
Level 1—unadjusted quoted prices in active markets for identical investments.
Level 2—other significant observable inputs (including quoted prices for similar investments, interest rates, prepayment speeds, credit risk, etc.).
Level 3—significant unobservable inputs (including the fund’s own assumptions in determining the fair value of investments).
18
The inputs or methodology used for valuing securities are not necessarily an indication of the risk associated with investing in those securities.
Changes in valuation techniques may result in transfers in or out of an assigned level within the disclosure hierarchy. Valuation techniques used to value the fund’s investments are as follows:
Registered investment companies that are not traded on an exchange are valued at their net asset value and are categorized within Level 1 of the fair value hierarchy.
Investments in securities excluding short-term investments (other than U.S. Treasury Bills) are valued each business day by an independent pricing service (the “Service”) approved by the Company’s Board of Directors. Investments for which quoted bid prices are readily available and are representative of the bid side of the market in the judgment of the Service are valued at the mean between the quoted bid prices (as obtained by the Service from dealers in such securities) and asked prices (as calculated by the Service based upon its evaluation of the market for such securities). Other investments (which constitute a majority of the portfolio securities) are valued as determined by the Service, based on methods which include consideration of the following: yields or prices of securities of comparable quality, coupon, maturity and type; indications as to values from dealers; and general market conditions.These securities are generally categorized within Level 2 of the fair value hierarchy.
U.S. Treasury Bills are valued at the mean price between quoted bid prices and asked prices by the Service. These securities are generally categorized within Level 2 of the fair value hierarchy.
The Service’s procedures are reviewed by Dreyfus under the general supervision of the Company’s Board of Directors.
When market quotations or official closing prices are not readily available, or are determined not to reflect accurately fair value, such as when the value of a security has been significantly affected by events after the close of the exchange or market on which the security is principally
NOTES TO FINANCIAL STATEMENTS (continued)
traded (for example, a foreign exchange or market), but before the fund calculates its net asset value, the fund may value these investments at fair value as determined in accordance with the procedures approved by the Company’s Board of Directors. Certain factors may be considered when fair valuing investments such as: fundamental analytical data, the nature and duration of restrictions on disposition, an evaluation of the forces that influence the market in which the securities are purchased and sold, and public trading in similar securities of the issuer or comparable issuers. These securities are either categorized as Level 2 or 3 depending on the relevant inputs used.
For restricted securities where observable inputs are limited, assumptions about market activity and risk are used and are categorized within Level 3 of the fair value hierarchy.
The following is a summary of the inputs used as of July 31, 2012 in valuing the fund’s investments:
| | | | |
| | | Level 2—Other | Level 3— | |
| | Level 1— | Significant | Significant | |
| | Unadjusted | Observable | Unobservable | |
| | Quoted Prices | Inputs | Inputs | Total |
| Assets ($) | | | | |
| Investments in Securities: | | | |
| Mutual Funds | 2,357,290 | — | — | 2,357,290 |
| U.S. Treasury | — | 369,949,507 | — | 369,949,507 |
At July 31, 2012, there were no transfers between Level 1 and Level 2 of the fair value hierarchy.
(b) Securities transactions and investment income: Securities transactions are recorded on a trade date basis. Realized gains and losses from securities transactions are recorded on the identified cost basis. Dividend income is recognized on the ex-dividend date and interest income, including, where applicable, accretion of discount and amortization of premium on investments, is recognized on the accrual basis.
Pursuant to a securities lending agreement with The Bank of New York Mellon, a subsidiary of BNY Mellon and an affiliate of Dreyfus, the fund may lend securities to qualified institutions. It is the fund’s
20
policy that, at origination, all loans are secured by collateral of at least 102% of the value of U.S. securities loaned and 105% of the value of foreign securities loaned. Collateral equivalent to at least 100% of the market value of securities on loan is maintained at all times. Collateral is either in the form of cash, which can be invested in certain money market mutual funds managed by the Manager, U.S. Government and Agency securities or letters of credit.The fund is entitled to receive all income on securities loaned, in addition to income earned as a result of the lending transaction. Although each security loaned is fully collateralized, the fund bears the risk of delay in recovery of, or loss of rights in, the securities loaned should a borrower fail to return the securities in a timely manner. During the period ended July 31, 2012, The Bank of NewYork Mellon earned $36,902 from lending portfolio securities, pursuant to the securities lending agreement.
(c) Affiliated issuers: Investments in other investment companies advised by Dreyfus are defined as “affiliated” in the Act. Investments in affiliated investment companies for the period ended July 31, 2012 were as follows:
| | | | | | | |
| Affiliated | | | | | | | |
| Investment | Value | | | | Value | | Net |
| Company | 7/31/2011 | ($) | Purchases ($) | Sales ($) | 7/31/2012 | ($) | Assets (%) |
| Dreyfus | | | | | | | |
| Institutional | | | | | | | |
| Preferred | | | | | | | |
| Plus Money | | | | | | | |
| Market | | | | | | | |
| Fund | 1,133,000 | | 86,581,563 | 85,357,273 | 2,357,290 | | .6 |
(d) Dividends to shareholders: It is the policy of the fund to declare dividends daily from investment income-net. Such dividends are paid monthly. Dividends from net realized capital gains, if any, are normally declared and paid annually, but the fund may make distributions on a more frequent basis to comply with the distribution requirements of the Internal Revenue Code of 1986, as amended (the “Code”).To the extent that net realized capital gains can be offset by capital loss carry-
NOTES TO FINANCIAL STATEMENTS (continued)
overs, it is the policy of the fund not to distribute such gains. Income and capital gain distributions are determined in accordance with income tax regulations, which may differ from GAAP.
(e) Federal income taxes: It is the policy of the fund to continue to qualify as a regulated investment company, if such qualification is in the best interests of its shareholders, by complying with the applicable provisions of the Code, and to make distributions of taxable income sufficient to relieve it from substantially all federal income and excise taxes.
As of and during the period ended July 31, 2012, the fund did not have any liabilities for any uncertain tax positions.The fund recognizes interest and penalties, if any, related to uncertain tax positions as income tax expense in the Statement of Operations. During the period, the fund did not incur any interest or penalties.
Each of the tax years in the four-year period ended July 31, 2012 remains subject to examination by the Internal Revenue Service and state taxing authorities.
At July 31, 2012, the components of accumulated earnings on a tax basis were as follows: undistributed ordinary income $2,519,645, undistributed capital gains $5,167,325 and unrealized appreciation $27,851,309.
The tax character of distributions paid to shareholders during the fiscal periods ended July 31, 2012 and July 31, 2011 were as follows: ordinary income $9,811,278 and $7,929,131 and long-term capital gains $788,202 and $162,806, respectively.
During the period ended July 31, 2012, as a result of permanent book to tax differences, primarily due to the tax treatment for treasury inflation-protected securities, the fund increased accumulated undistributed investment income-net by $7,685 and decreased accumulated net realized gain (loss) on investments by the same amount. Net assets and net asset value per share were not affected by this reclassification.
22
NOTE 2—Bank Lines of Credit:
The fund participates with other Dreyfus-managed funds in a $225 million unsecured credit facility led by Citibank, N.A. and a $300 million unsecured credit facility provided by The Bank of New York Mellon, (each, a “Facility”), each to be utilized primarily for temporary or emergency purposes, including the financing of redemptions. In connection therewith, the fund has agreed to pay its pro rata portion of commitment fees for each Facility. Interest is charged to the fund based on rates determined pursuant to the terms of the respective Facility at the time of borrowing. During the period ended July 31, 2012, the fund did not borrow under the Facilities.
NOTE 3—Management Fee and Other Transactions With Affiliates:
(a) Pursuant to a management agreement with the Manager, the management fee is computed at the annual rate of .30% of the value of the fund’s average daily net assets and is payable monthly.
(b) Under the Investor Shares Shareholder Services Plan, the fund pays the Distributor at an annual rate of .25% of the value of Investor Shares average daily net assets for the provision of certain services. The services provided may include personal services relating to shareholder accounts, such as answering shareholder inquiries regarding the fund and providing reports and other information, and services related to the maintenance of shareholder accounts. The Distributor may make payments to Service Agents (securities dealers, financial institutions or other industry professionals) in respect of these services.The Distributor determines the amounts to be paid to Service Agents. During the period ended July 31, 2012, Investor Shares were charged $135,834 pursuant to the Shareholder Services Plan.
NOTES TO FINANCIAL STATEMENTS (continued)
The fund compensates DreyfusTransfer, Inc. (“DTI”), a wholly-owned subsidiary of the Manager, under a transfer agency agreement for providing transfer agency services for the fund, and since May 29, 2012, cash management services related to fund subscriptions and redemptions. During the period ended July 31, 2012, the fund was charged $20,162 for transfer agency services and $105 for cash management services.These fees are included in Shareholder servicing costs in the Statement of Operations.
The fund compensatesThe Bank of NewYork Mellon under a custody agreement for providing custodial services for the fund. During the period ended July 31, 2012, the fund was charged $24,929 pursuant to the custody agreement.
The fund has arrangements with the transfer agent and the custodian whereby the fund may receive earnings credits when positive cash balances are maintained, which are used to offset transfer agency and custody fees. For financial reporting purposes, the fund includes net earnings credits as an expense offset in the Statement of Operations.
Prior to May 29, 2012, the fund compensated The Bank of New York Mellon under cash management agreement for performing cash management services related to fund subscriptions and redemptions. During the period ended July 31, 2012, the fund was charged $1,459 pursuant to the cash management agreement, which is included in Shareholder servicing costs in the Statement of Operations.These fees were partially offset by earnings credits of $43.
During the period ended July 31, 2012, the fund was charged $6,418 for services performed by the Chief Compliance Officer and his staff.
24
The components of “Due to The Dreyfus Corporation and affiliates” in the Statement of Assets and Liabilities consist of: management fees $92,987, Shareholder Services Plan fees $13,032, custodian fees $4,800, Chief Compliance Officer fees $3,713 and transfer agency per account fees $8,000.
(c) Each Board member also serves as a Board member of other funds within the Dreyfus complex. Annual retainer fees and attendance fees are allocated to each fund based on net assets.
NOTE 4—Securities Transactions:
The aggregate amount of purchases and sales of investment securities, excluding short-term securities, during the period ended July 31, 2012, amounted to $400,852,589 and $302,091,802, respectively.
At July 31, 2012, the cost of investments for federal income tax purposes was $344,455,488; accordingly, accumulated net unrealized appreciation on investments was $27,851,309, consisting of $29,255,598 gross unrealized appreciation and $1,404,289 gross unrealized depreciation.
|
| REPORT OF INDEPENDENT REGISTERED |
| PUBLIC ACCOUNTING FIRM |
|
| Shareholders and Board of Directors |
| Dreyfus Inflation Adjusted Securities Fund |
We have audited the accompanying statement of assets and liabilities, including the statement of investments, of Dreyfus Inflation Adjusted Securities Fund (one of the series comprising Dreyfus Investment Grade Funds, Inc.) as of July 31, 2012, and the related statement of operations for the year then ended, the statement of changes in net assets for each of the two years in the period then ended, and financial highlights for each of the five years in the period then ended. These financial statements and financial highlights are the responsibility of the Fund’s management. Our responsibility is to express an opinion on these financial statements and financial highlights based on our audits.
We conducted our audits in accordance with the standards of the Public Company Accounting Oversight Board (United States).Those standards require that we plan and perform the audit to obtain reasonable assurance about whether the financial statements and financial highlights are free of material misstatement.We were not engaged to perform an audit of the Fund’s internal control over financial reporting. Our audits included consideration of internal control over financial reporting as a basis for designing audit procedures that are appropriate in the circumstances, but not for the purpose of expressing an opinion on the effectiveness of the Fund’s internal control over financial reporting.Accordingly, we express no such opinion. An audit also includes examining, on a test basis, evidence supporting the amounts and disclosures in the financial statements and financial highlights, assessing the accounting principles used and significant estimates made by management, and evaluating the overall financial statement presentation. Our procedures included confirmation of securities owned as of July 31, 2012 by correspondence with the custodian and others.We believe that our audits provide a reasonable basis for our opinion.
In our opinion, the financial statements and financial highlights referred to above present fairly, in all material respects, the financial position of Dreyfus Inflation Adjusted Securities Fund at July 31, 2012, the results of its operations for the year then ended, the changes in its net assets for each of the two years in the period then ended, and the financial highlights for each of the five years in the period then ended, in conformity with U.S. generally accepted accounting principles.

New York, New York
September 24, 2012
26
IMPORTANT TAX INFORMATION (Unaudited)
For federal tax purposes the fund hereby reports 100% of ordinary income dividends paid during the fiscal year ended July 31, 2012 as qualifying “interest related dividends.” Also for state individual income tax purposes, the fund hereby reports 100% of the ordinary income dividends paid during its fiscal year ended July 31, 2012 as attributable to interest income from direct obligations of the United States. Such dividends are currently exempt from taxation for individual income tax purposes in most states, including NewYork, California and the District of Columbia.Also, the fund hereby reports $.0840 per share as a short-term capital gain distribution paid and also reports $.0365 per share as a long-term capital gain distribution paid on December 20, 2011.
|
| INFORMATION ABOUT THE RENEWAL OF THE |
| FUND’S MANAGEMENT AGREEMENT (Unaudited) |
At a meeting of the fund’s Board of Directors held on July 18 and 19, 2012, the Board considered the renewal of the fund’s Management Agreement pursuant to which Dreyfus provides the fund with investment advisory and administrative services (the “Agreement”). The Board members, none of whom are “interested persons” (as defined in the Investment Company Act of 1940, as amended) of the fund, were assisted in their review by independent legal counsel and met with counsel in executive session separate from Dreyfus representatives. In considering the renewal of the Agreement, the Board considered all factors that it believed to be relevant, including those discussed below. The Board did not identify any one factor as dispositive, and each Board member may have attributed different weights to the factors considered.
Analysis of Nature, Extent, and Quality of Services Provided to the Fund. The Board considered information previously provided to them in presentations from Dreyfus representatives regarding the nature, extent, and quality of the services provided to funds in the Dreyfus fund complex, and Dreyfus representatives confirmed that there had been no material changes in this information. Dreyfus provided the number of open accounts in the fund, the fund’s asset size and the allocation of fund assets among distribution channels. Dreyfus also had previously provided information regarding the diverse intermediary relationships and distribution channels of funds in the Dreyfus fund complex (such as retail direct or intermediary, in which intermediaries typically are paid by the fund and/or Dreyfus) and Dreyfus’ corresponding need for broad, deep, and diverse resources to be able to provide ongoing shareholder services to each intermediary or distribution channel, as applicable to the fund.
The Board also considered research support available to, and portfolio management capabilities of, the fund’s portfolio management personnel and that Dreyfus also provides oversight of day-to-day fund operations, including fund accounting and administration and assistance in meeting legal and regulatory requirements.The Board also considered Dreyfus’ extensive administrative, accounting, and compliance infrastructures.
28
Comparative Analysis of the Fund’s Performance and Management Fee and Expense Ratio.The Board reviewed reports prepared by Lipper, Inc. (“Lipper”), an independent provider of investment company data, which included information comparing (1) the fund’s performance with the performance of a group of comparable funds (the “Performance Group”) and with a broader group of funds (the “Performance Universe”), all for various periods ended May 31, 2012, and (2) the fund’s actual and contractual management fees and total expenses with those of a group of comparable funds (the “Expense Group”) and with a broader group of funds (the “Expense Universe”), the information for which was derived in part from fund financial statements available to Lipper as of the date of its analysis. Dreyfus previously had furnished the Board with a description of the methodology Lipper used to select the Performance Group and Performance Universe and the Expense Group and Expense Universe.
Dreyfus representatives stated that the usefulness of performance comparisons may be affected by a number of factors, including different investment limitations that may be applicable to the fund and comparison funds.The Board discussed the results of the comparisons and noted that the fund’s total return performance was below the Performance Group median for all periods, except for the four-year period when the fund’s performance was above the Performance Group median, and above the Performance Universe median for all periods, except for the three-year period when the fund’s performance was below the Performance Universe median. The Board also noted that the fund’s yield performance was above the Performance Group and Performance Universe medians for seven of the nine one-year periods ended May 31st. Dreyfus also provided a comparison of the fund’s calendar year total returns to the returns of the fund’s benchmark index.
The Board also reviewed the range of actual and contractual management fees and total expenses of the Expense Group and Expense Universe funds and discussed the results of the comparisons.The Board
|
| INFORMATION ABOUT THE RENEWAL OF THE FUND’S |
| MANAGEMENT AGREEMENT (Unaudited) (continued) |
noted that the fund’s contractual management fee was below the Expense Group median, the fund’s actual management fee was above the Expense Group median and below the Expense Universe median and the fund’s total expenses were above the Expense Group and Expense Universe medians.
Dreyfus representatives reviewed with the Board the management or investment advisory fees (1) paid by funds advised or administered by Dreyfus that are in the same Lipper category as the fund and (2) paid to Dreyfus or the Dreyfus-affiliated primary employer of the fund’s primary portfolio manager(s) for advising any separate accounts and/or other types of client portfolios that are considered to have similar investment strategies and policies as the fund (the “Similar Clients”), and explained the nature of the Similar Clients. They discussed differences in fees paid and the relationship of the fees paid in light of any differences in the services provided and other relevant factors. The Board considered the relevance of the fee information provided for the Similar Clients to evaluate the appropriateness and reasonableness of the fund’s management fee.
Analysis of Profitability and Economies of Scale. Dreyfus representatives reviewed the expenses allocated and profit received by Dreyfus and the resulting profitability percentage for managing the fund, and the method used to determine the expenses and profit.The Board concluded that the profitability results were not unreasonable, given the services rendered and service levels provided by Dreyfus.The Board previously had been provided with information prepared by an independent consulting firm regarding Dreyfus’ approach to allocating costs to, and determining the profitability of, individual funds and the entire Dreyfus fund complex. The consulting firm also had analyzed where any economies of scale might emerge in connection with the management of a fund.
The Board’s counsel stated that the Board should consider the profitability analysis (1) as part of the evaluation of whether the fees under
30
the Agreement bear a reasonable relationship to the mix of services provided by Dreyfus, including the nature, extent and quality of such services, and (2) in light of the relevant circumstances for the fund and the extent to which economies of scale would be realized if the fund grows and whether fee levels reflect these economies of scale for the benefit of fund shareholders. Dreyfus representatives noted that a discussion of economies of scale is predicated on a fund having achieved a substantial size with increasing assets and that, if a fund’s assets had been stable or decreasing, the possibility that Dreyfus may have realized any economies of scale would be less. Dreyfus representatives also noted that, as a result of shared and allocated costs among funds in the Dreyfus fund complex, the extent of economies of scale could depend substantially on the level of assets in the complex as a whole, so that increases and decreases in complex-wide assets can affect potential economies of scale in a manner that is disproportionate to, or even in the opposite direction from, changes in the fund’s asset level. The Board also considered potential benefits to Dreyfus from acting as investment adviser and noted that there were no soft dollar arrangements in effect for trading the fund’s investments.
At the conclusion of these discussions, the Board agreed that it had been furnished with sufficient information to make an informed business decision with respect to the renewal of the Agreement. Based on the discussions and considerations as described above, the Board concluded and determined as follows.
The Board concluded that the nature, extent and quality of the services provided by Dreyfus are adequate and appropriate.
The Board generally was satisfied with the fund’s overall performance.
The Board concluded that the fee paid to Dreyfus was reasonable in light of the considerations described above.
|
| INFORMATION ABOUT THE RENEWAL OF THE FUND’S |
| MANAGEMENT AGREEMENT (Unaudited) (continued) |
The Board determined that the economies of scale which may accrue to Dreyfus and its affiliates in connection with the management of the fund had been adequately considered by Dreyfus in connection with the fee rate charged to the fund pursuant to the Agreement and that, to the extent in the future it were determined that material economies of scale had not been shared with the fund, the Board would seek to have those economies of scale shared with the fund.
In evaluating the Agreement, the Board considered these conclusions and determinations and also relied on its previous knowledge, gained through meetings and other interactions with Dreyfus and its affiliates, of the fund and the services provided to the fund by Dreyfus.The Board also relied on information received on a routine and regular basis throughout the year relating to the operations of the fund and the investment management and other services provided under the Agreement, including information on the investment performance of the fund in comparison to similar mutual funds and benchmark performance indices; general market outlook as applicable to the fund; and compliance reports. In addition, it should be noted that the Board’s consideration of the contractual fee arrangements for this fund had the benefit of a number of years of reviews of prior or similar agreements during which lengthy discussions took place between the Board and Dreyfus representatives. Certain aspects of the arrangements may receive greater scrutiny in some years than in others, and the Board’s conclusions may be based, in part, on their consideration of the same or similar arrangements in prior years. The Board determined that renewal of the Agreement was in the best interests of the fund and its shareholders.
32

OFFICERS OF THE FUND (Unaudited)
BRADLEY J. SKAPYAK, President since January 2010.
Chief Operating Officer and a director of the Manager since June 2009; from April 2003 to June 2009, Mr. Skapyak was the head of the Investment Accounting and Support Department of the Manager. He is an officer of 72 investment companies (comprised of 156 portfolios) managed by the Manager. He is 53 years old and has been an employee of the Manager since February 1988.
JANETTE E. FARRAGHER, Vice President and Secretary since December 2011.
Assistant General Counsel of BNY Mellon, and an officer of 73 investment companies (comprised of 183 portfolios) managed by the Manager. She is 49 years old and has been an employee of the Manager since February 1984.
KIESHA ASTWOOD, Vice President and Assistant Secretary since January 2010.
Counsel of BNY Mellon, and an officer of 73 investment companies (comprised of 183 portfolios) managed by the Manager. She is 39 years old and has been an employee of the Manager since July 1995.
JAMES BITETTO, Vice President and Assistant Secretary since August 2005.
Senior Counsel of BNY Mellon and Secretary of the Manager, and an officer of 73 investment companies (comprised of 183 portfolios) managed by the Manager. He is 46 years old and has been an employee of the Manager since December 1996.
JONI LACKS CHARATAN, Vice President and Assistant Secretary since August 2005.
Senior Counsel of BNY Mellon, and an officer of 73 investment companies (comprised of 183 portfolios) managed by the Manager. She is 56 years old and has been an employee of the Manager since October 1988.
JOSEPH M. CHIOFFI, Vice President and Assistant Secretary since August 2005.
Senior Counsel of BNY Mellon, and an officer of 73 investment companies (comprised of 183 portfolios) managed by the Manager. He is 50 years old and has been an employee of the Manager since June 2000.
KATHLEEN DENICHOLAS, Vice President and Assistant Secretary since January 2010.
Managing Counsel of BNY Mellon, and an officer of 73 investment companies (comprised of 183 portfolios) managed by the Manager. She is 37 years old and has been an employee of the Manager since February 2001.
JOHN B. HAMMALIAN, Vice President and Assistant Secretary since August 2005.
Senior Managing Counsel of BNY Mellon, and an officer of 73 investment companies (comprised of 183 portfolios) managed by the Manager. He is 49 years old and has been an employee of the Manager since February 1991.
ROBERT R. MULLERY, Vice President and Assistant Secretary since August 2005.
Managing Counsel of BNY Mellon, and an officer of 73 investment companies (comprised of 183 portfolios) managed by the Manager. He is 60 years old and has been an employee of the Manager since May 1986.
JEFF PRUSNOFSKY, Vice President and Assistant Secretary since August 2005.
Senior Managing Counsel of BNY Mellon, and an officer of 73 investment companies (comprised of 183 portfolios) managed by the Manager. He is 47 years old and has been an employee of the Manager since October 1990.
OFFICERS OF THE FUND (Unaudited) (continued)
JAMES WINDELS, Treasurer since November 2001.
Director – Mutual Fund Accounting of the Manager, and an officer of 73 investment companies (comprised of 183 portfolios) managed by the Manager. He is 53 years old and has been an employee of the Manager since April 1985.
RICHARD CASSARO, Assistant Treasurer since January 2008.
Senior Accounting Manager – Money Market and Municipal Bond Funds of the Manager, and an officer of 73 investment companies (comprised of 183 portfolios) managed by the Manager. He is 53 years old and has been an employee of the Manager since September 1982.
GAVIN C. REILLY, Assistant Treasurer since December 2005.
Tax Manager of the Investment Accounting and Support Department of the Manager, and an officer of 73 investment companies (comprised of 183 portfolios) managed by the Manager. He is 43 years old and has been an employee of the Manager since April 1991.
ROBERT S. ROBOL, Assistant Treasurer since August 2003.
Senior Accounting Manager – Fixed Income Funds of the Manager, and an officer of 73 investment companies (comprised of 183 portfolios) managed by the Manager. He is 48 years old and has been an employee of the Manager since October 1988.
ROBERT SALVIOLO, Assistant Treasurer since July 2007.
Senior Accounting Manager – Equity Funds of the Manager, and an officer of 73 investment companies (comprised of 183 portfolios) managed by the Manager. He is 45 years old and has been an employee of the Manager since June 1989.
ROBERT SVAGNA, Assistant Treasurer since August 2005.
Senior Accounting Manager – Equity Funds of the Manager, and an officer of 73 investment companies (comprised of 183 portfolios) managed by the Manager. He is 45 years old and has been an employee of the Manager since November 1990.
JOSEPH W. CONNOLLY, Chief Compliance Officer since October 2004.
Chief Compliance Officer of the Manager and The Dreyfus Family of Funds (73 investment companies, comprised of 183 portfolios). He is 55 years old and has served in various capacities with the Manager since 1980, including manager of the firm’s Fund Accounting Department from 1997 through October 2001.
MATTHEW D. CONNOLLY, Anti-Money Laundering Compliance Officer since April 2012.
Anti-Money Laundering Compliance Officer of the Distributor since October 2011; from March 2010 to September 2011, Global Head, KYC Reviews and Director, UBS Investment Bank; until March 2010,AML Compliance Officer and Senior Vice President, Citi Global Wealth Management. He is an officer of 69 investment companies (comprised of 179 portfolios) managed by the Manager. He is 40 years old and has been an employee of the Distributor since October 2011.
36

Save time. Save paper. View your next shareholder report online as soon as it’s available. Log into www.dreyfus.com and sign up for Dreyfus eCommunications. It’s simple and only takes a few minutes.
The views expressed in this report reflect those of the portfolio manager only through the end of the period covered and do not necessarily represent the views of Dreyfus or any other person in the Dreyfus organization. Any such views are subject to change at any time based upon market or other conditions and Dreyfus disclaims any responsibility to update such views.These views may not be relied on as investment advice and, because investment decisions for a Dreyfus fund are based on numerous factors, may not be relied on as an indication of trading intent on behalf of any Dreyfus fund.
Not FDIC-Insured • Not Bank-Guaranteed • May Lose Value
| | Contents |
| | THE FUND |
| 2 | A Letter from the Chairman and CEO |
| 3 | Discussion of Fund Performance |
| 6 | Fund Performance |
| 8 | Understanding Your Fund’s Expenses |
| 8 | Comparing Your Fund’s Expenses With Those of Other Funds |
| 9 | Statement of Investments |
| 23 | Statement of Financial Futures |
| 24 | Statement of Assets and Liabilities |
| 25 | Statement of Operations |
| 26 | Statement of Changes in Net Assets |
| 28 | Financial Highlights |
| 31 | Notes to Financial Statements |
| 50 | Report of Independent Registered Public Accounting Firm |
| 51 | Important Tax Information |
| 52 | Information About the Renewal of the Fund’s Management Agreement |
| 57 | Board Members Information |
| 59 | Officers of the Fund |
| | FOR MORE INFORMATION |
| | Back Cover |
Dreyfus
Intermediate
Term Income Fund
The Fund

A LETTER FROM THE CHAIRMAN AND CEO
Dear Shareholder:
We are pleased to present this annual report for Dreyfus Intermediate Term Income Fund covering the 12-month period from August 1, 2011, through July 31, 2012. For information about how the fund performed during the reporting period, as well as general market perspectives, we provide a Discussion of Fund Performance on the pages that follow.
The bond market proved volatile over the reporting period, as an intensifying European debt crisis and an unprecedented downgrade of long-term U.S. government securities last year triggered a massive flight to perceived safe havens in August and September 2011.Then, favorable U.S. employment data and liquidity enhancements from European policymakers sparked rallies through the first quarter of 2012. However, political developments later raised doubts about some of Europe’s proposed solutions, and U.S. economic data weakened in the spring. Despite these swings in investor sentiment, most bond market sectors produced respectable total rates of return for the reporting period due in part to wide yield spreads based on U.S.Treasury securities, which have been pegged near historically low levels for most of the reporting period.
Although challenges remain overseas, we believe the U.S. economy is likely to maintain positive economic growth while overseas markets contend with growth recessionary environments. In our judgment, current sluggishness is at least partly due to the lagging effects of tighter monetary policies in some areas of the world, and we expect stronger growth when a shift to more accommodative policies begins to have an impact on global economic activity. In addition, the adjustment among U.S. exporters to weaker European demand and slower economic growth in certain emerging markets should be largely completed later this year, potentially setting the stage for a stronger economic rebound in 2013.
As always, we encourage you to discuss our observations with your financial advisor.
Thank you for your continued confidence and support.

Jonathan R. Baum
Chairman and Chief Executive Officer
The Dreyfus Corporation
August 15, 2012
2

DISCUSSION OF FUND PERFORMANCE
For the period of August 1, 2011, through July 31, 2012, as provided by David Horsfall and David Bowser, CFA, Portfolio Managers
Fund and Market Performance Overview
For the 12-month period ended July 31, 2012, Dreyfus Intermediate Term Income Fund’s Class A shares produced a total return of 7.26%, Class C shares returned 6.49% and Class I shares returned 7.59%.1 In comparison, the fund’s benchmark, the Barclays U.S. Aggregate Bond Index, achieved a total return of 7.25% for the same period.2
Mixed economic data sparked heightened market turbulence over the reporting period, but the U.S. bond market ended the year with attractive results compared to historical averages.The fund’s returns were roughly in line with its benchmark, as strong results from asset-backed securities, commercial mortgages and investment-grade corporate bonds were balanced by mild shortfalls among inflation-adjusted securities and emerging-markets debt.
The Fund’s Investment Approach
The fund seeks to maximize total return, consisting of capital appreciation and current income.To pursue its goal, the fund normally invests at least 80% of its assets in fixed income securities of U.S. and foreign issuers rated at least investment grade or the unrated equivalent as determined by Dreyfus.These securities include: U.S. government bonds and notes, corporate bonds, municipal bonds, convertible securities, preferred stocks, inflation-indexed securities, asset-backed securities, mortgage-related securities (including CMOs) and foreign bonds.Typically, the fund can be expected to have an average effective maturity ranging between five and 10 years, and an average effective duration ranging between three and eight years. For additional yield, the fund may invest up to 20% of its assets in fixed income securities rated below investment grade (“high yield” or “junk bonds”) to as low as Caa/CCC or the unrated equivalent as determined by Dreyfus. The fund will focus primarily on U.S. securities but may invest up to 30% of its total assets in fixed income securities of foreign issuers, including those of issuers in emerging markets.
DISCUSSION OF FUND PERFORMANCE (continued)
Macroeconomic Developments Fueled Market Volatility
Just days after the start of the reporting period, financial markets were roiled by the unprecedented downgrade of one rating agency’s assessment of long-term U.S. government securities. This development, together with a worsening sovereign debt crisis in Europe, triggered steep declines among higher yielding market sectors in August and September, while traditional safe havens gained substantial value.
Employment gains and other encouraging U.S. economic news helped alleviate investors’ worries in October, sparking a strong rally among higher yielding bonds. In addition, a quantitative easing program in Europe appeared to forestall a more severe banking crisis in the region. Investors grew more tolerant of risks, and they turned away from traditional safe havens and toward market sectors expected to benefit from better economic conditions. Consequently, asset-backed securities, commercial mortgages and corporate securities rallied through the first quarter of 2012.
However, the U.S. economic recovery was called into question in the spring, when the public sector shed jobs and employment gains in the private sector proved more anemic than expected. Meanwhile, proposed austerity programs to relieve fiscal pressures in Europe encountered political resistance.These headwinds erased some of the gains previously posted by higher yielding bonds, and yields of U.S.Treasury securities plunged to record lows. Nonetheless, the Barclays U.S.Aggregate Index ended the reporting period with a relatively strong total return.
Higher Yielding Securities Aided Performance
Investors regarded asset-backed securities and commercial mortgage-backed securities as relatively insulated from Europe’s financial troubles, and overweighted exposure to these sectors enabled the fund to participate fully in their strength. In addition, the fund benefited from gains among investment-grade and high yield corporate securities as issuers shored up their balance sheets and default rates remained low. Finally, exposure to the Mexican peso buoyed returns when the currency strengthened along with Mexico’s economy.
These successes were balanced by mild shortfalls in other areas. We established a modest position in Treasury Inflation Protected Securities during the spring of 2012, but these investments lost a degree of value
4
amid disappointing economic data. The fund’s holdings of sovereign bonds from various emerging markets also detracted mildly from relative performance, largely due to concerns regarding slowing growth in Asia.
We generally maintained the fund’s average duration—a measure of sensitivity to changing interest rates—in a range that was slightly shorter than market averages.This strategy, which we implemented through the use of futures contracts on U.S.Treasury securities, had a mildly negative influence on performance. In addition, we used currency forwards to establish the fund’s more successful position in the Mexican peso.
Adjusting to Changing Market Conditions
While we remain concerned regarding ongoing events in Europe, central banks throughout the world have eased their monetary policies, which we expect to boost economic growth rates in the coming months. Therefore, we are prepared to place greater emphasis on yield-oriented securities, which, in our view, also should benefit from robust investor demand in a low interest-rate environment.
August 15, 2012
| |
| | Bond funds are subject generally to interest rate, credit, liquidity and market risks, to varying degrees, |
| | all of which are more fully described in the fund’s prospectus. Generally, all other factors being equal, |
| | bond prices are inversely related to interest-rate changes, and rate increases can cause price declines. |
| | High yield bonds are subject to increased credit risk and are considered speculative in terms of the |
| | issuer’s perceived ability to continue making interest payments on a timely basis and to repay |
| | principal upon maturity. |
| | Investing internationally involves special risk, including changes in currency exchange rates, political, |
| | economic and social instability, a lack of comprehensive company information, differing auditing and |
| | legal standards, and less market liquidity.The fixed income securities of issuers located in emerging |
| | markets can be more volatile and less liquid than those of issuers in more mature economies. |
| | The fund may use derivative instruments, such as options, futures and options on futures, forward |
| | contracts, swaps (including credit default swaps on corporate bonds and asset-backed securities), |
| | options on swaps and other credit derivatives.A small investment in derivatives could have a |
| | potentially large impact on the fund’s performance.The use of derivatives involves risks different |
| | from, or possibly greater than, the risks associated with investing directly in the underlying assets. |
| 1 | Total return includes reinvestment of dividends and any capital gains paid, and does not take into |
| | consideration the maximum initial sales charge in the case of Class A shares, or the applicable |
| | contingent deferred sales charges imposed on redemptions in the case of Class C shares. Had these |
| | charges been reflected, returns would have been lower. Past performance is no guarantee of future |
| | results. Share price, yield and investment return fluctuate such that upon redemption, fund shares |
| | may be worth more or less than their original cost. |
| 2 | SOURCE: LIPPER INC. — Reflects reinvestment of dividends and, where applicable, capital |
| | gain distributions.The Barclays U.S.Aggregate Bond Index is a widely accepted, unmanaged total |
| | return index of corporate, U.S. government and U.S. government agency debt instruments, |
| | mortgage-backed securities and asset-backed securities with an average maturity of 1-10 years. |
| | Investors cannot invest directly in any index. |
FUND PERFORMANCE
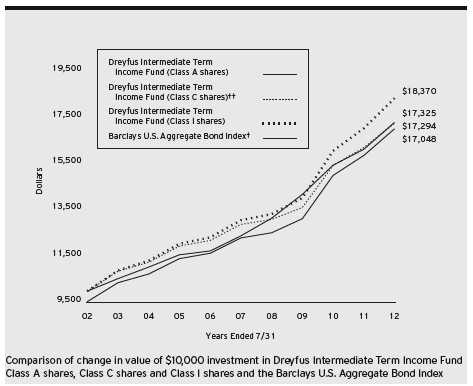
| |
| † | Source: Lipper Inc. |
| †† | The total return figures presented for Class C shares of the fund reflect the performance of the fund’s Class A shares |
| | for the period prior to 5/13/08 (the inception date for Class C shares), adjusted to reflect the applicable sales load for |
| | this share class. |
| Past performance is not predictive of future performance. |
| The above graph compares a $10,000 investment made in each of the Class A, Class C and Class I shares of Dreyfus |
| Intermediate Term Income Fund on 7/31/02 to a $10,000 investment made in the Barclays U.S.Aggregate Bond |
| Index (the “Index”) on that date.All dividends and capital gain distributions are reinvested. |
| The fund invests primarily in debt securities and securities with debt-like characteristics of domestic and foreign issuers |
| and maintains an average effective maturity ranging between five and ten years and an average effective duration ranging |
| between three and eight years.The fund’s performance shown in the line graph above takes into account the maximum |
| initial sales charge on Class A shares and all other applicable fees and expenses on all classes.The Index is a widely |
| accepted, unmanaged total return index of corporate, U.S. government and U.S. government agency debt instruments, |
| mortgage-backed securities and asset-backed securities with an average maturity of 1-10 years. Unlike a mutual fund, the |
| Index is not subject to charges, fees and other expenses. Investors cannot invest directly in any index. Further information |
| relating to fund performance, including expense reimbursements, if applicable, is contained in the Financial Highlights |
| section of the prospectus and elsewhere in this report. |
6
| | | | | | | |
| Average Annual Total Returns as of 7/31/12 | | | |
| |
| Inception |
| | Date | 1Year | 5 Years | 10 Years |
| Class A shares | | | | |
| with maximum sales charge (4.5%) | 2/2/96 | 2.46% | 5.75% | 5.48% |
| without sales charge | 2/2/96 | 7.26% | 6.72% | 5.97% |
| Class C shares | | | | |
| with applicable redemption charge † | 5/13/08 | 5.49% | 6.03%†† | 5.63%†† |
| without redemption | 5/13/08 | 6.49% | 6.03%†† | 5.63%†† |
| Class I shares | 5/31/01 | 7.59% | 7.02% | 6.27% |
| Barclays U.S. Aggregate Bond Index | | 7.25% | 6.91% | 5.65% |
| |
| Past performance is not predictive of future performance.The fund’s performance shown in the graph and table does not |
| reflect the deduction of taxes that a shareholder would pay on fund distributions or the redemption of fund shares. |
| † | The maximum contingent deferred sales charge for Class C shares is 1% for shares redeemed within one year of the |
| | date of purchase. |
| †† | The total return performance figures presented for Class C shares of the fund reflect the performance of the fund’s |
| | Class A shares for the period prior to 5/13/08 (the inception date for Class C shares), adjusted to reflect the |
| | applicable sales load for this share class. |
UNDERSTANDING YOUR FUND’S EXPENSES (Unaudited)
As a mutual fund investor, you pay ongoing expenses, such as management fees and other expenses. Using the information below, you can estimate how these expenses affect your investment and compare them with the expenses of other funds.You also may pay one-time transaction expenses, including sales charges (loads) and redemption fees, which are not shown in this section and would have resulted in higher total expenses. For more information, see your fund’s prospectus or talk to your financial adviser.
Review your fund’s expenses
The table below shows the expenses you would have paid on a $1,000 investment in Dreyfus Intermediate Term Income Fund from February 1, 2012 to July 31, 2012. It also shows how much a $1,000 investment would be worth at the close of the period, assuming actual returns and expenses.
| | | | | | |
| Expenses and Value of a $1,000 Investment | | | | |
| assuming actual returns for the six months ended July 31, 2012 | | | | |
| | | Class A | | Class C | | Class I |
| Expenses paid per $1,000† | $ | 4.45 | $ | 8.12 | $ | 3.69 |
| Ending value (after expenses) | $ | 1,032.80 | $ | 1,029.10 | $ | 1,033.50 |
|
| COMPARING YOUR FUND’S EXPENSES |
| WITH THOSE OF OTHER FUNDS (Unaudited) |
Using the SEC’s method to compare expenses
The Securities and Exchange Commission (SEC) has established guidelines to help investors assess fund expenses. Per these guidelines, the table below shows your fund’s expenses based on a $1,000 investment, assuming a hypothetical 5% annualized return. You can use this information to compare the ongoing expenses (but not transaction expenses or total cost) of investing in the fund with those of other funds.All mutual fund shareholder reports will provide this information to help you make this comparison. Please note that you cannot use this information to estimate your actual ending account balance and expenses paid during the period.
| | | | | | |
| Expenses and Value of a $1,000 Investment | | | | |
| assuming a hypothetical 5% annualized return for the six months ended July 31, 2012 |
| | | Class A | | Class C | | Class I |
| Expenses paid per $1,000† | $ | 4.42 | $ | 8.07 | $ | 3.67 |
| Ending value (after expenses) | $ | 1,020.49 | $ | 1,016.86 | $ | 1,021.23 |
† Expenses are equal to the fund’s annualized expense ratio of .88% for Class A, 1.61% for Class C and .73% for Class I, multiplied by the average account value over the period, multiplied by 182/366 (to reflect the one-half year period).
8
|
| STATEMENT OF INVESTMENTS |
| July 31, 2012 |
| | | | | |
| | Coupon | Maturity | Principal | | |
| Bonds and Notes—124.3% | Rate (%) | Date | Amount ($) | | Value ($) |
| Asset-Backed Ctfs./ | | | | | |
| Auto Receivables—4.1% | | | | | |
| Americredit Automobile Receivables | | | | | |
| Trust, Ser. 2012-1, Cl. C | 2.67 | 1/8/18 | 2,020,000 | | 2,078,422 |
| Americredit Automobile Receivables | | | | | |
| Trust, Ser. 2012-1, Cl. D | 4.72 | 3/8/18 | 4,600,000 | | 4,949,365 |
| Americredit Automobile Receivables | | | | | |
| Trust, Ser. 2011-5, Cl. D | 5.05 | 12/8/17 | 5,800,000 | | 6,218,102 |
| Carmax Auto Owner Trust, | | | | | |
| Ser. 2010-1, Cl. B | 3.75 | 12/15/15 | 980,000 | | 1,015,882 |
| Chrysler Financial Auto | | | | | |
| Securitization Trust, | | | | | |
| Ser. 2010-A, Cl. C | 2.00 | 1/8/14 | 5,820,000 | | 5,832,269 |
| JPMorgan Auto Receivables Trust, | | | | | |
| Ser. 2008-A, Cl. Ctfs | 5.22 | 7/15/15 | 1,245,557 | a | 1,249,004 |
| Santander Drive Auto Receivables | | | | | |
| Trust, Ser. 2010-2, Cl. B | 2.24 | 12/15/14 | 1,402,000 | | 1,409,962 |
| Santander Drive Auto Receivables | | | | | |
| Trust, Ser. 2010-B, Cl. C | 3.02 | 10/17/16 | 3,660,000 | a | 3,735,261 |
| Santander Drive Auto Receivables | | | | | |
| Trust, Ser. 2011-1, Cl. C | 3.11 | 5/16/16 | 5,795,000 | | 5,849,415 |
| Santander Drive Auto Receivables | | | | | |
| Trust, Ser. 2012-3, Cl. D | 3.64 | 5/15/18 | 3,545,000 | | 3,614,452 |
| Santander Drive Auto Receivables | | | | | |
| Trust, Ser. 2012-1, Cl. C | 3.78 | 11/15/17 | 1,185,000 | | 1,225,311 |
| Santander Drive Auto Receivables | | | | | |
| Trust, Ser. 2011-3, Cl. D | 4.23 | 5/15/17 | 2,325,000 | | 2,394,078 |
| Santander Drive Auto Receivables | | | | | |
| Trust, Ser. 2011-4, Cl. D | 4.74 | 9/15/17 | 2,695,000 | | 2,845,628 |
| SMART Trust, | | | | | |
| Ser. 2011-1USA, Cl. A3B | 1.10 | 10/14/14 | 3,618,991 | a,b | 3,625,569 |
| | | | | | 46,042,720 |
| Asset-Backed Ctfs./Credit Cards—1.0% | | | | | |
| Citibank Omni Master Trust, | | | | | |
| Ser. 2009-A14A, Cl. A14 | 3.00 | 8/15/18 | 11,075,000 | a,b | 11,614,192 |
| Asset-Backed Ctfs./ | | | | | |
| Home Equity Loans—.5% | | | | | |
| Ameriquest Mortgage Securities, | | | | | |
| Ser. 2003-11, Cl. AF6 | 5.64 | 12/25/33 | 460,787 | b | 460,577 |
STATEMENT OF INVESTMENTS (continued)
| | | | | |
| | Coupon | Maturity | Principal | | |
| Bonds and Notes (continued) | Rate (%) | Date | Amount ($) | | Value ($) |
| Asset-Backed Ctfs./ | | | | | |
| Home Equity Loans (continued) | | | | | |
| Bayview Financial Acquisition | | | | | |
| Trust, Ser. 2005-B, Cl. 1A6 | 5.21 | 4/28/39 | 1,930,198 | b | 1,898,194 |
| Carrington Mortgage Loan Trust, | | | | | |
| Ser. 2005-NC5, Cl. A2 | 0.57 | 10/25/35 | 1,091,630 | b | 1,056,802 |
| Citicorp Residential Mortgage | | | | | |
| Securities, Ser. 2006-1, Cl. A3 | 5.71 | 7/25/36 | 216,239 | b | 216,412 |
| Citigroup Mortgage Loan Trust, | | | | | |
| Ser. 2005-WF1, Cl. A5 | 5.01 | 11/25/34 | 2,335,479 | b | 2,301,566 |
| Residential Asset Securities, | | | | | |
| Ser. 2005-EMX4, Cl. A2 | 0.51 | 11/25/35 | 123,258 | b | 123,025 |
| | | | | | 6,056,576 |
| Asset-Backed Ctfs./ | | | | | |
| Manufactured Housing—.1% | | | | | |
| Origen Manufactured Housing, | | | | | |
| Ser. 2005-B, Cl. M2 | 6.48 | 1/15/37 | 1,568,137 | | 1,616,092 |
| Casinos—.2% | | | | | |
| Ameristar Casinos, | | | | | |
| Gtd. Notes | 7.50 | 4/15/21 | 2,360,000 | c | 2,554,700 |
| Commercial Mortgage | | | | | |
| Pass-Through Ctfs.—4.0% | | | | | |
| Bear Stearns Commercial Mortgage | | | | | |
| Securities, Ser. 2006-PW13, Cl. A3 | 5.52 | 9/11/41 | 35,000 | | 36,645 |
| Credit Suisse First Boston | | | | | |
| Mortgage Securities, | | | | | |
| Ser. 2005-C4, Cl. AAB | 5.07 | 8/15/38 | 661,249 | b | 664,419 |
| GS Mortgage Securities Corporation | | | | | |
| II, Ser. 2007-EOP, Cl. B | 1.73 | 3/6/20 | 1,630,000 | a,b | 1,610,796 |
| GS Mortgage Securities Corporation | | | | | |
| II, Ser. 2007-EOP, Cl. E | 2.48 | 3/6/20 | 610,000 | a,b | 603,822 |
| GS Mortgage Securities Corporation | | | | | |
| II, Ser. 2007-EOP, Cl. F | 2.63 | 3/6/20 | 5,680,000 | a,b | 5,622,280 |
| GS Mortgage Securities Corporation | | | | | |
| II, Ser. 2007-EOP, Cl. G | 2.79 | 3/6/20 | 3,110,000 | a,b | 3,078,300 |
| GS Mortgage Securities Corporation | | | | | |
| II, Ser. 2007-EOP, Cl. H | 3.30 | 3/6/20 | 25,000 | a,b | 24,788 |
| GS Mortgage Securities Corporation | | | | | |
| II, Ser. 2007-EOP, Cl. K | 4.80 | 3/6/20 | 2,380,000 | a,b | 2,376,403 |
| GS Mortgage Securities Corporation | | | | | |
| II, Ser. 2007-EOP, Cl. L | 5.46 | 3/6/20 | 6,725,000 | a,b | 6,734,072 |
10
| | | | | |
| | Coupon | Maturity | Principal | | |
| Bonds and Notes (continued) | Rate (%) | Date | Amount ($) | | Value ($) |
| Commercial Mortgage | | | | | |
| Pass-Through Ctfs. (continued) | | | | | |
| JP Morgan Chase Commercial | | | | | |
| Mortgage Securities, | | | | | |
| Ser. 2011-C3, Cl. A4 | 4.72 | 2/15/46 | 6,410,000 | a | 7,333,780 |
| JP Morgan Chase Commercial | | | | | |
| Mortgage Securities, | | | | | |
| Ser. 2007-CB20, Cl. AM | 5.88 | 2/12/51 | 2,825,000 | b | 3,066,464 |
| JP Morgan Chase Commercial | | | | | |
| Mortgage Securities, | | | | | |
| Ser. 2009-IWST, Cl. C | 7.69 | 12/5/27 | 5,455,000 | a,b | 6,451,530 |
| Merrill Lynch Mortgage Trust, | | | | | |
| Ser. 2005-CKI1, Cl. A6 | 5.22 | 11/12/37 | 4,035,000 | b | 4,530,103 |
| Morgan Stanley Capital I, | | | | | |
| Ser. 2006-IQ12, Cl. AAB | 5.33 | 12/15/43 | 86,936 | | 89,357 |
| Morgan Stanley Dean Witter Capital | | | | | |
| I, Ser. 2001-TOP3, Cl. A4 | 6.39 | 7/15/33 | 1,689 | | 1,688 |
| TIAA Seasoned Commercial Mortgage | | | | | |
| Trust, Ser. 2007-C4, Cl. A3 | 5.62 | 8/15/39 | 495,000 | b | 529,437 |
| WF-RBS Commercial Mortgage Trust, | | | | | |
| Ser. 2011-C5, Cl. A4 | 3.67 | 11/15/44 | 2,085,000 | | 2,275,052 |
| | | | | | 45,028,936 |
| Consumer Discretionary—3.4% | | | | | |
| Autozone, | | | | | |
| Sr. Unscd. Notes | 3.70 | 4/15/22 | 2,175,000 | | 2,289,396 |
| Cablevision Systems, | | | | | |
| Sr. Unscd. Notes | 7.75 | 4/15/18 | 2,490,000 | | 2,720,325 |
| Cox Communications, | | | | | |
| Sr. Unscd. Notes | 6.25 | 6/1/18 | 3,535,000 | a | 4,223,774 |
| CVS Pass-Through Trust, | | | | | |
| Pass Thru Certificates Notes | 8.35 | 7/10/31 | 6,655,240 | a | 9,027,427 |
| Dish DBS, | | | | | |
| Gtd. Notes | 5.88 | 7/15/22 | 2,730,000 | a | 2,825,550 |
| HanesBrands, | | | | | |
| Gtd. Notes | 6.38 | 12/15/20 | 2,843,000 | | 3,052,671 |
| Macy’s Retail Holdings, | | | | | |
| Gtd. Notes | 3.88 | 1/15/22 | 2,775,000 | | 2,995,640 |
| NBCUniversal Media, | | | | | |
| Sr. Unscd. Notes | 4.38 | 4/1/21 | 3,345,000 | | 3,787,453 |
| Pearson Dollar Finance Two, | | | | | |
| Gtd. Notes | 6.25 | 5/6/18 | 1,170,000 | a | 1,385,078 |
STATEMENT OF INVESTMENTS (continued)
| | | | | |
| | Coupon | Maturity | Principal | | |
| Bonds and Notes (continued) | Rate (%) | Date | Amount ($) | | Value ($) |
| Consumer Discretionary (continued) | | | | | |
| Staples, | | | | | |
| Gtd. Notes | 9.75 | 1/15/14 | 2,575,000 | | 2,869,655 |
| Time Warner | | | | | |
| Gtd. Debs | 6.10 | 7/15/40 | 1,045,000 | | 1,289,188 |
| Time Warner, | | | | | |
| Gtd. Notes | 3.40 | 6/15/22 | 1,620,000 | | 1,712,570 |
| | | | | | 38,178,727 |
| Consumer Staples—.9% | | | | | |
| Kraft Foods, | | | | | |
| Sr. Unscd. Notes | 6.88 | 2/1/38 | 2,750,000 | | 3,800,088 |
| Pernod-Ricard, | | | | | |
| Sr. Unscd. Notes | 4.25 | 7/15/22 | 2,695,000 | a | 2,895,214 |
| SABMiller Holdings, | | | | | |
| Gtd. Notes | 3.75 | 1/15/22 | 1,275,000 | a | 1,401,064 |
| SABMiller Holdings, | | | | | |
| Gtd. Notes | 4.95 | 1/15/42 | 1,520,000 | a | 1,832,746 |
| | | | | | 9,929,112 |
| Energy—3.8% | | | | | |
| Anadarko Petroleum, | | | | | |
| Sr. Unscd. Notes | 6.38 | 9/15/17 | 4,765,000 | | 5,722,074 |
| CNOOC Finance (2012), | | | | | |
| Gtd. Notes | 3.88 | 5/2/22 | 2,335,000 | a | 2,523,925 |
| El Paso, | | | | | |
| Sr. Unscd. Notes | 7.25 | 6/1/18 | 2,480,000 | | 2,873,115 |
| Enterprise Products Operating, | | | | | |
| Gtd. Notes | 5.95 | 2/1/41 | 1,955,000 | | 2,338,303 |
| Hess, | | | | | |
| Sr. Unscd. Notes | 5.60 | 2/15/41 | 1,500,000 | | 1,712,189 |
| Kinder Morgan Energy Partners, | | | | | |
| Sr. Unscd. Notes | 6.55 | 9/15/40 | 2,955,000 | | 3,608,868 |
| Meg Energy, | | | | | |
| Gtd. Notes | 6.38 | 1/30/23 | 2,800,000 | a | 2,870,000 |
| Pemex Project Funding Master | | | | | |
| Trust, Gtd. Bonds | 6.63 | 6/15/35 | 2,865,000 | | 3,688,544 |
| Petrobras International Finance, | | | | | |
| Gtd. Notes | 5.38 | 1/27/21 | 1,490,000 | | 1,674,286 |
| Petrobras International Finance, | | | | | |
| Gtd. Notes | 6.75 | 1/27/41 | 1,255,000 | | 1,581,671 |
12
| | | | | |
| | Coupon | Maturity | Principal | | |
| Bonds and Notes (continued) | Rate (%) | Date | Amount ($) | | Value ($) |
| Energy (continued) | | | | | |
| Petroleos Mexicanos, | | | | | |
| Gtd. Notes | 4.88 | 1/24/22 | 1,050,000 | a | 1,186,500 |
| Plains All American Pipeline, | | | | | |
| Gtd. Notes | 5.00 | 2/1/21 | 2,550,000 | | 2,980,942 |
| Plains All American Pipeline, | | | | | |
| Gtd. Notes | 5.75 | 1/15/20 | 3,089,000 | | 3,685,276 |
| Unit, | | | | | |
| Gtd. Notes | 6.63 | 5/15/21 | 2,810,000 | a,c | 2,802,975 |
| Valero Energy, | | | | | |
| Gtd. Notes | 6.13 | 2/1/20 | 2,100,000 | | 2,530,494 |
| Williams Partners, | | | | | |
| Sr. Unscd. Notes | 6.30 | 4/15/40 | 795,000 | | 1,006,113 |
| | | | | | 42,785,275 |
| Financial—18.9% | | | | | |
| AIG SunAmerica Global Financing X, | | | | | |
| Sr. Scd. Notes | 6.90 | 3/15/32 | 985,000 | a | 1,232,046 |
| Ally Financial, | | | | | |
| Gtd. Notes | 4.63 | 6/26/15 | 5,325,000 | | 5,497,791 |
| Ally Financial, | | | | | |
| Gtd. Notes | 5.50 | 2/15/17 | 5,525,000 | | 5,761,520 |
| American International Group, | | | | | |
| Sr. Unscd. Notes | 6.40 | 12/15/20 | 3,340,000 | | 3,914,106 |
| Ameriprise Financial, | | | | | |
| Jr. Sub. Notes | 7.52 | 6/1/66 | 3,441,000 | b | 3,747,249 |
| AON, | | | | | |
| Gtd. Notes | 3.50 | 9/30/15 | 2,160,000 | | 2,267,793 |
| Bank of America, | | | | | |
| Sr. Unscd. Notes | 5.00 | 5/13/21 | 6,000,000 | | 6,479,310 |
| Bank of America, | | | | | |
| Sr. Unscd. Notes | 5.63 | 7/1/20 | 1,060,000 | | 1,180,731 |
| Bank of America, | | | | | |
| Sr. Unscd. Notes | 5.70 | 1/24/22 | 5,040,000 | | 5,767,882 |
| Boston Properties, | | | | | |
| Sr. Unscd. Notes | 3.70 | 11/15/18 | 2,600,000 | | 2,776,459 |
| Cincinnati Financial, | | | | | |
| Sr. Unscd. Notes | 6.13 | 11/1/34 | 1,234,000 | | 1,400,099 |
| Cincinnati Financial, | | | | | |
| Sr. Unscd. Debs | 6.92 | 5/15/28 | 1,331,000 | | 1,624,822 |
STATEMENT OF INVESTMENTS (continued)
| | | | | |
| | Coupon | Maturity | Principal | | |
| Bonds and Notes (continued) | Rate (%) | Date | Amount ($) | | Value ($) |
| Financial (continued) | | | | | |
| CIT Group, | | | | | |
| Sr. Unscd. Notes | 5.00 | 5/15/17 | 2,445,000 | | 2,556,553 |
| CIT Group, | | | | | |
| Sr. Unscd. Notes | 5.00 | 8/15/22 | 1,480,000 | | 1,480,000 |
| Citigroup, | | | | | |
| Sr. Unscd. Notes | 4.50 | 1/14/22 | 7,665,000 | | 8,078,059 |
| Citigroup, | | | | | |
| Sr. Unscd. Notes | 5.38 | 8/9/20 | 4,955,000 | | 5,473,729 |
| Citigroup, | | | | | |
| Sr. Unscd. Notes | 5.88 | 1/30/42 | 1,585,000 | | 1,831,569 |
| DDR, | | | | | |
| Sr. Unscd. Notes | 4.75 | 4/15/18 | 2,865,000 | | 3,052,738 |
| Discover Financial Services, | | | | | |
| Notes | 5.20 | 4/27/22 | 5,402,000 | a | 5,773,906 |
| Duke Realty, | | | | | |
| Sr. Unscd. Notes | 6.75 | 3/15/20 | 265,000 | | 320,851 |
| Duke Realty, | | | | | |
| Sr. Unscd. Notes | 8.25 | 8/15/19 | 2,565,000 | | 3,260,913 |
| ERAC USA Finance, | | | | | |
| Gtd. Notes | 6.38 | 10/15/17 | 2,535,000 | a | 2,983,751 |
| ERP Operating, | | | | | |
| Sr. Unscd. Notes | 5.75 | 6/15/17 | 1,220,000 | | 1,439,723 |
| Federal Realty Investment Trust, | | | | | |
| Sr. Unscd. Notes | 5.40 | 12/1/13 | 1,525,000 | | 1,607,138 |
| Federal Realty Investment Trust, | | | | | |
| Sr. Unscd. Bonds | 5.65 | 6/1/16 | 550,000 | | 615,579 |
| Federal Realty Investment Trust, | | | | | |
| Sr. Unscd. Notes | 6.20 | 1/15/17 | 145,000 | | 168,308 |
| Ford Motor Credit, | | | | | |
| Sr. Unscd. Notes | 4.21 | 4/15/16 | 3,065,000 | a | 3,175,892 |
| Ford Motor Credit, | | | | | |
| Sr. Unscd. Notes | 5.00 | 5/15/18 | 5,520,000 | | 5,897,331 |
| General Electric Capital, | | | | | |
| Sr. Unscd. Notes | 2.30 | 4/27/17 | 4,750,000 | | 4,861,155 |
| General Electric Capital, | | | | | |
| Sr. Unscd. Notes | 6.88 | 1/10/39 | 2,935,000 | | 4,037,509 |
| Goldman Sachs Group, | | | | | |
| Sr. Unscd. Notes | 5.25 | 7/27/21 | 3,055,000 | | 3,221,598 |
14
| | | | | |
| | Coupon | Maturity | Principal | | |
| Bonds and Notes (continued) | Rate (%) | Date | Amount ($) | | Value ($) |
| Financial (continued) | | | | | |
| Goldman Sachs Group, | | | | | |
| Sr. Unscd. Notes | 5.75 | 1/24/22 | 1,780,000 | | 1,947,923 |
| Hanover Insurance Group, | | | | | |
| Sr. Unscd. Notes | 7.63 | 10/15/25 | 1,745,000 | | 1,999,208 |
| Harley-Davidson Funding, | | | | | |
| Gtd. Notes | 5.75 | 12/15/14 | 5,980,000 | a | 6,477,739 |
| Healthcare Realty Trust, | | | | | |
| Sr. Unscd. Notes | 5.13 | 4/1/14 | 3,000,000 | | 3,135,051 |
| HSBC Holdings, | | | | | |
| Sr. Unscd. Notes | 4.00 | 3/30/22 | 3,960,000 | | 4,246,827 |
| Hyundai Capital Services, | | | | | |
| Sr. Unscd. Notes | 4.38 | 7/27/16 | 1,300,000 | a | 1,377,875 |
| International Lease Finance, | | | | | |
| Sr. Unscd. Notes | 5.75 | 5/15/16 | 1,480,000 | | 1,548,801 |
| International Lease Finance, | | | | | |
| Sr. Unscd. Notes | 6.63 | 11/15/13 | 2,745,000 | | 2,882,250 |
| Invesco, | | | | | |
| Gtd. Notes | 5.38 | 2/27/13 | 380,000 | | 389,413 |
| Invesco, | | | | | |
| Gtd. Notes | 5.38 | 12/15/14 | 25,000 | | 26,992 |
| JPMorgan Chase & Co., | | | | | |
| Sr. Unscd. Notes | 4.35 | 8/15/21 | 8,510,000 | | 9,338,925 |
| JPMorgan Chase & Co., | | | | | |
| Sr. Unscd. Notes | 4.50 | 1/24/22 | 5,135,000 | | 5,701,252 |
| JPMorgan Chase & Co., | | | | | |
| Sr. Unscd. Notes | 6.00 | 1/15/18 | 2,055,000 | | 2,435,179 |
| Korea Finance, | | | | | |
| Sr. Unscd. Notes | 2.25 | 8/7/17 | 3,990,000 | | 3,960,115 |
| Liberty Mutual Group, | | | | | |
| Gtd. Notes | 4.95 | 5/1/22 | 2,475,000 | a | 2,539,320 |
| Mack-Cali Realty, | | | | | |
| Sr. Unscd. Notes | 5.13 | 1/15/15 | 145,000 | | 153,936 |
| Mack-Cali Realty, | | | | | |
| Sr. Unscd. Notes | 5.80 | 1/15/16 | 690,000 | | 762,039 |
| Manufacturers & Traders Trust, | | | | | |
| Sub. Notes | 5.59 | 12/28/20 | 475,000 | b | 472,262 |
| Merrill Lynch & Co., | | | | | |
| Sub. Notes | 5.70 | 5/2/17 | 1,025,000 | | 1,080,463 |
STATEMENT OF INVESTMENTS (continued)
| | | | | |
| | Coupon | Maturity | Principal | | |
| Bonds and Notes (continued) | Rate (%) | Date | Amount ($) | | Value ($) |
| Financial (continued) | | | | | |
| Merrill Lynch & Co., | | | | | |
| Sr. Unscd. Notes | 6.40 | 8/28/17 | 50,000 | | 56,502 |
| Metlife, | | | | | |
| Sr. Unscd. Debs, Ser. A | 6.82 | 8/15/18 | 3,450,000 | | 4,274,460 |
| Morgan Stanley, | | | | | |
| Sr. Unscd. Notes | 5.50 | 7/28/21 | 2,760,000 | | 2,794,114 |
| Morgan Stanley, | | | | | |
| Sr. Unscd. Notes | 5.55 | 4/27/17 | 2,880,000 | | 2,973,704 |
| Morgan Stanley, | | | | | |
| Sr. Unscd. Notes | 5.75 | 8/31/12 | 1,180,000 | | 1,182,962 |
| Nisource Capital Markets, | | | | | |
| Sr. Unscd. Notes | 7.86 | 3/27/17 | 105,000 | | 123,146 |
| PNC Bank, | | | | | |
| Sub. Notes | 6.88 | 4/1/18 | 2,092,000 | | 2,551,006 |
| Prudential Financial, | | | | | |
| Sr. Unscd. Notes | 5.38 | 6/21/20 | 5,115,000 | | 5,840,537 |
| Prudential Financial, | | | | | |
| Sr. Unscd. Notes | 6.20 | 11/15/40 | 5,105,000 | | 5,860,560 |
| Regency Centers, | | | | | |
| Gtd. Notes | 5.25 | 8/1/15 | 1,777,000 | | 1,916,343 |
| Regency Centers, | | | | | |
| Gtd. Notes | 5.88 | 6/15/17 | 210,000 | | 241,014 |
| Royal Bank of Scotland, | | | | | |
| Sub. Notes | 9.50 | 3/16/22 | 5,210,000 | b | 5,615,041 |
| Simon Property Group, | | | | | |
| Sr. Unscd. Notes | 6.75 | 2/1/40 | 1,870,000 | | 2,550,173 |
| US Bancorp, | | | | | |
| Sub. Notes | 2.95 | 7/15/22 | 3,575,000 | | 3,622,530 |
| USB Capital IX, | | | | | |
| Gtd. Notes | 3.50 | 10/29/49 | 7,090,000 | b | 5,865,770 |
| WEA Finance, | | | | | |
| Gtd. Notes | 7.13 | 4/15/18 | 4,015,000 | a | 4,790,196 |
| Willis North America, | | | | | |
| Gtd. Notes | 6.20 | 3/28/17 | 3,665,000 | | 4,141,366 |
| Willis North America, | | | | | |
| Gtd. Notes | 7.00 | 9/29/19 | 4,790,000 | | 5,655,117 |
| | | | | | 212,016,221 |
16
| | | | | |
| | Coupon | Maturity | Principal | | |
| Bonds and Notes (continued) | Rate (%) | Date | Amount ($) | | Value ($) |
| Foreign/Governmental—.8% | | | | | |
| Corp Andina De Formento, | | | | | |
| Sr. Unscd. Notes | 3.75 | 1/15/16 | 3,255,000 | | 3,416,236 |
| Province of Quebec Canada, | | | | | |
| Unscd. Notes | 4.60 | 5/26/15 | 2,795,000 | | 3,107,601 |
| Republic of Korea, | | | | | |
| Sr. Unscd. Notes | 7.13 | 4/16/19 | 1,500,000 | | 1,939,536 |
| | | | | | 8,463,373 |
| Health Care—.6% | | | | | |
| Express Scripts Holding, | | | | | |
| Gtd. Notes | 4.75 | 11/15/21 | 1,970,000 | a | 2,253,463 |
| Gilead Sciences, | | | | | |
| Sr. Unscd. Notes | 4.40 | 12/1/21 | 2,310,000 | | 2,629,265 |
| HCA, | | | | | |
| Sr. Scd. Notes | 5.88 | 3/15/22 | 1,960,000 | | 2,119,250 |
| | | | | | 7,001,978 |
| Industrial—.8% | | | | | |
| Waste Management, | | | | | |
| Gtd. Notes | 7.00 | 7/15/28 | 2,395,000 | | 3,272,243 |
| Waste Management, | | | | | |
| Gtd. Notes | 7.75 | 5/15/32 | 2,000,000 | | 2,942,222 |
| Xerox, | | | | | |
| Sr. Unscd. Notes | 5.63 | 12/15/19 | 2,515,000 | | 2,803,113 |
| | | | | | 9,017,578 |
| Materials—1.7% | | | | | |
| ArcelorMittal, | | | | | |
| Sr. Unscd. Notes | 6.25 | 2/25/22 | 1,075,000 | c | 1,079,165 |
| Ardagh Packaging Finance, | | | | | |
| Gtd. Notes | 7.38 | 10/15/17 | 2,500,000 | a | 2,690,625 |
| Dow Chemical, | | | | | |
| Sr. Unscd. Notes | 2.50 | 2/15/16 | 190,000 | | 197,868 |
| Dow Chemical, | | | | | |
| Sr. Unscd. Notes | 4.13 | 11/15/21 | 6,060,000 | | 6,689,276 |
| Ecolab, | | | | | |
| Sr. Unscd. Notes | 4.35 | 12/8/21 | 1,020,000 | | 1,158,633 |
| Georgia-Pacific, | | | | | |
| Gtd. Notes | 8.25 | 5/1/16 | 2,035,000 | a | 2,209,959 |
STATEMENT OF INVESTMENTS (continued)
| | | | | |
| | Coupon | Maturity | Principal | | |
| Bonds and Notes (continued) | Rate (%) | Date | Amount ($) | | Value ($) |
| Materials (continued) | | | | | |
| Teck Resources, | | | | | |
| Gtd. Notes | 6.25 | 7/15/41 | 2,060,000 | | 2,287,251 |
| Vale Overseas, | | | | | |
| Gtd. Notes | 4.38 | 1/11/22 | 2,715,000 | | 2,851,369 |
| | | | | | 19,164,146 |
| Municipal Bonds—.7% | | | | | |
| California, | | | | | |
| GO (Build America Bonds) | 7.30 | 10/1/39 | 3,095,000 | | 3,989,022 |
| New York City, | | | | | |
| GO (Build America Bonds) | 5.99 | 12/1/36 | 3,200,000 | | 4,169,376 |
| | | | | | 8,158,398 |
| Residential Mortgage | | | | | |
| Pass-Through Ctfs.—.2% | | | | | |
| Impac CMB Trust, | | | | | |
| Ser. 2005-8, Cl. 2M2 | 1.37 | 2/25/36 | 1,593,667 | b | 1,153,662 |
| Impac CMB Trust, | | | | | |
| Ser. 2005-8, Cl. 2M3 | 2.50 | 2/25/36 | 1,288,869 | b | 904,906 |
| Prudential Home Mortgage | | | | | |
| Securities, Ser. 1994-A, Cl. 5B | 6.73 | 4/28/24 | 820 | b | 574 |
| Residential Funding Mortgage | | | | | |
| Securities I, Ser. 2004-S3, Cl. M1 | 4.75 | 3/25/19 | 396,985 | | 373,527 |
| | | | | | 2,432,669 |
| Telecommunications—.6% | | | | | |
| Cellco Partnership/Verizon | | | | | |
| Wireless Capital, Sr. Unscd. Notes | 8.50 | 11/15/18 | 2,030,000 | | 2,831,304 |
| Verizon Communications, | | | | | |
| Sr. Unscd. Notes | 3.50 | 11/1/21 | 2,145,000 | | 2,381,797 |
| Verizon Communications, | | | | | |
| Sr. Unscd. Notes | 4.75 | 11/1/41 | 1,040,000 | | 1,228,869 |
| | | | | | 6,441,970 |
| U.S. Government Agencies—.0% | | | | | |
| Small Business Administration | | | | | |
| Participation Ctfs., Gov’t | | | | | |
| Gtd. Debs., Ser. 97-J | 6.55 | 10/1/17 | 108,551 | | 118,397 |
18
| | | | |
| | Principal | |
| Bonds and Notes (continued) | Amount | Value ($) |
| U.S. Government Agencies/ | | |
| Mortgage-Backed—32.1% | | |
| Federal Home Loan Mortgage Corp.: | | |
| 4.00% | 56,005,000d,e | 59,899,100 |
| 5.00%, 10/1/18—12/1/20 | 319,436d | 345,756 |
| 5.50%, 11/1/22—5/1/40 | 9,235,988d | 10,124,084 |
| 6.00%, 7/1/17—12/1/37 | 6,059,535d | 6,725,172 |
| 6.50%, 3/1/14—3/1/32 | 263,155d | 304,782 |
| 7.50%, 12/1/25—1/1/31 | 25,843d | 29,215 |
| 8.00%, 10/1/19—1/1/28 | 9,054d | 10,559 |
| 8.50%, 7/1/30 | 634d | 800 |
| Multiclass Mortgage Participation Ctfs., REMIC, | | |
| Ser. 51, Cl. E, 10.00%, 7/15/20 | 80,800d | 81,486 |
| Multiclass Mortgage Participation Ctfs., REMIC, | | |
| Ser. 2586, Cl. WE, 4.00%, 12/15/32 | 936,271d | 956,490 |
| Federal National Mortgage Association: | | |
| 3.00% | 10,820,000d,e | 11,229,131 |
| 3.50% | 79,815,000d,e | 84,698,911 |
| 4.00% | 47,340,000d,e | 50,737,043 |
| 5.00% | 59,050,000d,e | 64,313,888 |
| 5.50% | 21,490,000d,e | 23,502,964 |
| 6.00% | 11,200,000d,e | 12,355,003 |
| 5.00%, 5/1/18—9/1/40 | 4,059,884d | 4,480,563 |
| 5.50%, 8/1/22—8/1/40 | 18,412,051d | 20,350,486 |
| 6.00%, 1/1/19—4/1/38 | 6,888,455d | 7,677,496 |
| 6.50%, 3/1/26—10/1/32 | 101,520d | 117,874 |
| 7.00%, 9/1/14—7/1/32 | 39,017d | 45,069 |
| 7.50%, 10/1/15—3/1/31 | 12,523d | 13,775 |
| 8.00%, 5/1/13—3/1/31 | 20,831d | 24,119 |
| Pass-Through Ctfs., REMIC | | |
| Ser. 1988-16, Cl. B, 9.50%, 6/25/18 | 51,856d | 58,211 |
| Government National Mortgage Association I: | | |
| 5.50%, 4/15/33 | 1,896,806 | 2,133,611 |
| 6.00%, 1/15/29 | 20,613 | 23,327 |
| 6.50%, 4/15/28—9/15/32 | 48,147 | 56,293 |
| 7.00%, 12/15/26—9/15/31 | 15,783 | 18,882 |
| 7.50%, 12/15/26—11/15/30 | 5,160 | 5,395 |
| 8.00%, 1/15/30—10/15/30 | 15,849 | 17,357 |
STATEMENT OF INVESTMENTS (continued)
| | | | | |
| | Coupon | Maturity | Principal | |
| Bonds and Notes (continued) | Rate (%) | Date | Amount ($) | Value ($) |
| U.S. Government Agencies/ | | | | |
| Mortgage-Backed (continued) | | | | |
| Government National Mortgage | | | | |
| Association I (continued): | | | | |
| 8.50%, 4/15/25 | | | 4,130 | 5,059 |
| 9.00%, 10/15/27 | | | 9,245 | 9,538 |
| 9.50%, 11/15/17—2/15/25 | | | 67,402 | 72,891 |
| Government National | | | | |
| Mortgage Association II: | | | | |
| 6.50%, 2/20/31—7/20/31 | | | 106,928 | 124,990 |
| 7.00%, 11/20/29 | | | 335 | 404 |
| | | | | 360,549,724 |
| U.S. Government Securities—48.7% | | | | |
| U.S. Treasury Bonds: | | | | |
| 3.88%, 8/15/40 | | | 36,425,000c | 46,430,510 |
| 6.13%, 11/15/27 | | | 8,385,000c | 12,894,562 |
| U.S. Treasury Notes: | | | | |
| 1.38%, 9/15/12 | | | 144,225,000c | 144,467,298 |
| 1.75%, 8/15/12 | | | 241,380,000c | 241,559,104 |
| 1.75%, 5/31/16 | | | 1,515,000 | 1,591,933 |
| 2.13%, 5/31/15 | | | 45,615,000c | 47,988,394 |
| 2.38%, 7/31/17 | | | 48,065,000 | 52,221,902 |
| | | | | 547,153,703 |
| Utilities—1.2% | | | | |
| Calpine, | | | | |
| Sr. Scd. Notes | 7.88 | 1/15/23 | 1,060,000a | 1,211,050 |
| Cleveland Electric Illuminating, | | | | |
| Sr. Unscd. Notes | 5.70 | 4/1/17 | 910,000 | 1,027,841 |
| Commonwealth Edison, | | | | |
| First Mortgage Bonds | 6.15 | 9/15/17 | 60,000 | 73,452 |
| Consolidated Edison Co. | | | | |
| of New York, | | | | |
| Sr. Unscd. Debs., Ser. 06-D | 5.30 | 12/1/16 | 675,000 | 789,122 |
| Exelon Generation, | | | | |
| Sr. Unscd. Notes | 5.20 | 10/1/19 | 2,200,000 | 2,462,328 |
20
| | | | | |
| | Coupon | Maturity | Principal | | |
| Bonds and Notes (continued) | Rate (%) | Date | Amount ($) | | Value ($) |
| Utilities (continued) | | | | | |
| Nevada Power, | | | | | |
| Mortgage Notes, Ser. R | 6.75 | 7/1/37 | 395,000 | | 573,760 |
| Nisource Finance, | | | | | |
| Gtd. Notes | 4.45 | 12/1/21 | 2,740,000 | | 2,982,057 |
| Sempra Energy, | | | | | |
| Sr. Unscd. Notes | 6.50 | 6/1/16 | 2,720,000 | | 3,238,329 |
| Sierra Pacific Power, | | | | | |
| Mortgage Notes, Ser. P | 6.75 | 7/1/37 | 550,000 | | 793,262 |
| | | | | | 13,151,201 |
| Total Bonds and Notes | | | | | |
| (cost $1,356,579,384) | | | | | 1,397,475,688 |
| |
| Preferred Stocks—.5% | | | Shares | | Value ($) |
| Diversified Financial Services | | | | | |
| General Electric Capital, | | | | | |
| Non-Cum, Perpetual, Ser. B, $6.25 | | | | | |
| (cost $5,500,000) | | | 55,000 | b | 5,649,050 |
| | | | Principal | | |
| Short-Term Investments—3.0% | | | Amount ($) | | Value ($) |
| U.S. Treasury Bills: | | | | | |
| 0.06%, 8/9/12 | | | 11,000,000 | | 10,999,912 |
| 0.08%, 9/13/12 | | | 22,480,000 | | 22,478,179 |
| 0.09%, 8/16/12 | | | 540,000 | | 539,993 |
| Total Short-Term Investments | | | | | |
| (cost $34,017,672) | | | | | 34,018,084 |
| |
| Other Investment—.8% | | | Shares | | Value ($) |
| Registered Investment Company; | | | | | |
| Dreyfus Institutional Preferred | | | | | |
| Plus Money Market Fund | | | | | |
| (cost $8,471,434) | | | 8,471,434 | f | 8,471,434 |
STATEMENT OF INVESTMENTS (continued)
| | | | |
| Investment of Cash Collateral | | |
| for Securities Loaned—.6% | Shares | Value ($) |
| Registered Investment Company; | | |
| Dreyfus Institutional Cash | | |
| Advantage Fund | | |
| (cost $6,366,959) | 6,366,959f | 6,366,959 |
| |
| Total Investments (cost $1,410,935,449) | 129.2% | 1,451,981,215 |
| Liabilities, Less Cash and Receivables | (29.2%) | (327,713,356) |
| Net Assets | 100.0% | 1,124,267,859 |
|
| GO—General Obligation |
| REMIC—Real Estate Mortgage Investment Conduit |
| a Securities exempt from registration pursuant to Rule 144A under the Securities Act of 1933.These securities may be |
| resold in transactions exempt from registration, normally to qualified institutional buyers.At July 31, 2012, these |
| securities were valued at $123,749,872 or 11.0% of net assets. |
| b Variable rate security—interest rate subject to periodic change. |
| c Security, or portion thereof, on loan.At July 31, 2012, the value of the fund’s securities on loan was $409,038,197 |
| and the value of the collateral held by the fund was $429,533,106, consisting of cash collateral of $6,366,959 and |
| U.S. Government and agency securities valued at $423,166,147. |
| d The Federal Housing Finance Agency (“FHFA”) placed Federal Home Loan Mortgage Corporation and Federal |
| National Mortgage Association into conservatorship with FHFA as the conservator.As such, the FHFA oversees the |
| continuing affairs of these companies. |
| e Purchased on a forward commitment basis. |
| f Investment in affiliated money market mutual fund. |
| | | |
| Portfolio Summary (Unaudited)† | | |
| |
| Value (%) | | Value (%) |
| U.S. Government & Agencies | 80.8 | Foreign/Governmental | .8 |
| Corporate Bonds | 32.1 | Municipal Bonds | .7 |
| Asset/Mortgage-Backed | 9.9 | Preferred Stocks | .5 |
| Short-Term/Money Market Investments | 4.4 | | 129.2 |
| |
| † Based on net assets. | | | |
| See notes to financial statements. | | | |
22
|
| STATEMENT OF FINANCIAL FUTURES |
| July 31, 2012 |
| | | | | |
| | | Market Value | | Unrealized | |
| | | Covered by | | Appreciation | |
| | Contracts | Contracts ($) | Expiration | at 7/31/2012 | ($) |
| Financial Futures Short | | | | | |
| U.S. Treasury 10 Year Notes | 164 | 22,083,625 | September 2012 | 2,563 | |
| |
| See notes to financial statements. | | | | | |
|
| STATEMENT OF ASSETS AND LIABILITIES |
| July 31, 2012 |
| | | | |
| | | Cost | Value |
| Assets ($): | | | |
| Investments in securities—See Statement of Investments (including | | |
| securities on loan, valued at $409,038,197)—Note 1(c): | | |
| Unaffiliated issuers | | 1,396,097,056 | 1,437,142,822 |
| Affiliated issuers | | 14,838,393 | 14,838,393 |
| Cash | | | 240,189 |
| Receivable for investment securities sold | | | 12,726,384 |
| Receivable for open mortgage-backed dollar rolls—Note 4 | | 11,076,671 |
| Dividends, interest and securities lending income receivable | | 8,803,765 |
| Receivable for shares of Common Stock subscribed | | 359,942 |
| Receivable for futures variation margin—Note 4 | | | 2,563 |
| Unrealized appreciation on forward foreign | | | |
| currency exchange contracts—Note 4 | | | 614,966 |
| Prepaid expenses | | | 47,249 |
| | | | 1,485,852,944 |
| Liabilities ($): | | | |
| Due to The Dreyfus Corporation and affiliates—Note 3(c) | | 777,177 |
| Payable for open mortgage-backed dollar rolls—Note 4 | | 294,015,118 |
| Payable for investment securities purchased | | | 59,326,668 |
| Liability for securities on loan—Note 1(c) | | | 6,366,959 |
| Payable for shares of Common Stock redeemed | | | 695,941 |
| Unrealized depreciation on forward foreign | | | |
| currency exchange contracts—Note 4 | | | 7,715 |
| Accrued expenses | | | 395,507 |
| | | | 361,585,085 |
| Net Assets ($) | | | 1,124,267,859 |
| Composition of Net Assets ($): | | | |
| Paid-in capital | | | 1,085,387,183 |
| Accumulated undistributed investment income—net | | 3,922,874 |
| Accumulated net realized gain (loss) on investments | | (6,697,778) |
| Accumulated net unrealized appreciation (depreciation) on | | |
| investments and foreign currency transactions (including | | |
| $2,563 net unrealized appreciation on financial futures) | | 41,655,580 |
| Net Assets ($) | | | 1,124,267,859 |
| |
| |
| |
| Net Asset Value Per Share | | | |
| | Class A | Class C | Class I |
| Net Assets ($) | 990,445,796 | 43,439,147 | 90,382,916 |
| Shares Outstanding | 70,350,202 | 3,085,526 | 6,420,806 |
| Net Asset Value Per Share ($) | 14.08 | 14.08 | 14.08 |
| |
| See notes to financial statements. | | | |
24
| | |
| Investment Income ($): | |
| Income: | |
| Interest | 30,137,744 |
| Income from securities lending—Note 1(c) | 200,763 |
| Dividends; | |
| Affiliated issuers | 18,474 |
| Total Income | 30,356,981 |
| Expenses: | |
| Management fee—Note 3(a) | 5,072,250 |
| Shareholder servicing costs—Note 3(c) | 4,396,779 |
| Distribution fees—Note 3(b) | 324,449 |
| Professional fees | 124,282 |
| Custodian fees—Note 3(c) | 100,781 |
| Prospectus and shareholders’ reports | 86,745 |
| Directors’ fees and expenses—Note 3(d) | 47,292 |
| Registration fees | 38,377 |
| Loan commitment fees—Note 2 | 12,404 |
| Miscellaneous | 81,442 |
| Total Expenses | 10,284,801 |
| Less—reduction in fees due to earnings credits—Note 3(c) | (1,038) |
| Net Expenses | 10,283,763 |
| Investment Income—Net | 20,073,218 |
| Realized and Unrealized Gain (Loss) on Investments—Note 4 ($): | |
| Net realized gain (loss) on investments and foreign currency transactions | 56,174,205 |
| Net realized gain (loss) on options transactions | (186,462) |
| Net realized gain (loss) on financial futures | (494,172) |
| Net realized gain (loss) on swap transactions | 161,598 |
| Net realized gain (loss) on forward foreign currency exchange contracts | 1,310,918 |
| Net Realized Gain (Loss) | 56,966,087 |
| Net unrealized appreciation (depreciation) | |
| on investments and foreign currency transactions | 576,170 |
| Net unrealized appreciation (depreciation) on options transactions | 632,680 |
| Net unrealized appreciation (depreciation) on financial futures | 2,563 |
| Net unrealized appreciation (depreciation) on swap transactions | 86,026 |
| Net unrealized appreciation (depreciation) | |
| on forward foreign currency exchange transactions | 673,973 |
| Net Unrealized Appreciation (Depreciation) | 1,971,412 |
| Net Realized and Unrealized Gain (Loss) on Investments | 58,937,499 |
| Net Increase in Net Assets Resulting from Operations | 79,010,717 |
| |
| See notes to financial statements. | |
|
| STATEMENT OF OPERATIONS |
| Year Ended July 31, 2012 |
STATEMENT OF CHANGES IN NET ASSETS
| | | | |
| | | Year Ended July 31, |
| | 2012a | 2011 |
| Operations ($): | | |
| Investment income—net | 20,073,218 | 37,067,100 |
| Net realized gain (loss) on investments | 56,966,087 | 48,768,838 |
| Net unrealized appreciation | | |
| (depreciation) on investments | 1,971,412 | (19,932,585) |
| Net Increase (Decrease) in Net Assets | | |
| Resulting from Operations | 79,010,717 | 65,903,353 |
| Dividends to Shareholders from ($): | | |
| Investment income—net: | | |
| Class A Shares | (24,241,554) | (38,020,867) |
| Class B Shares | (31,151) | (169,015) |
| Class C Shares | (690,147) | (1,176,973) |
| Class I Shares | (1,519,897) | (1,002,567) |
| Total Dividends | (26,482,749) | (40,369,422) |
| Capital Stock Transactions ($): | | |
| Net proceeds from shares sold: | | |
| Class A Shares | 171,064,546 | 174,417,803 |
| Class B Shares | 44,521 | 343,380 |
| Class C Shares | 8,374,236 | 5,222,500 |
| Class I Shares | 77,838,952 | 9,951,572 |
| Dividends reinvested: | | |
| Class A Shares | 21,511,901 | 33,883,733 |
| Class B Shares | 22,619 | 124,344 |
| Class C Shares | 475,791 | 809,002 |
| Class I Shares | 1,187,030 | 481,274 |
| Cost of shares redeemed: | | |
| Class A Shares | (359,737,664) | (298,701,117) |
| Class B Shares | (4,016,237) | (7,709,626) |
| Class C Shares | (8,375,469) | (13,856,218) |
| Class I Shares | (17,792,480) | (14,752,972) |
| Increase (Decrease) in Net Assets | | |
| from Capital Stock Transactions | (109,402,254) | (109,786,325) |
| Total Increase (Decrease) in Net Assets | (56,874,286) | (84,252,394) |
| Net Assets ($): | | |
| Beginning of Period | 1,181,142,145 | 1,265,394,539 |
| End of Period | 1,124,267,859 | 1,181,142,145 |
| Undistributed investment income—net | 3,922,874 | 1,644,642 |
26
| | | | |
| | | Year Ended July 31, |
| | 2012a | 2011 |
| Capital Share Transactions: | | |
| Class Ab | | |
| Shares sold | 12,512,995 | 13,145,002 |
| Shares issued for dividends reinvested | 1,566,724 | 2,556,597 |
| Shares redeemed | (26,326,576) | (22,593,723) |
| Net Increase (Decrease) in Shares Outstanding | (12,246,857) | (6,892,124) |
| Class Bb | | |
| Shares sold | 3,269 | 25,999 |
| Shares issued for dividends reinvested | 1,661 | 9,389 |
| Shares redeemed | (293,447) | (583,210) |
| Net Increase (Decrease) in Shares Outstanding | (288,517) | (547,822) |
| Class C | | |
| Shares sold | 610,565 | 394,848 |
| Shares issued for dividends reinvested | 34,638 | 61,054 |
| Shares redeemed | (610,419) | (1,048,953) |
| Net Increase (Decrease) in Shares Outstanding | 34,784 | (593,051) |
| Class I | | |
| Shares sold | 5,687,821 | 755,036 |
| Shares issued for dividends reinvested | 86,023 | 36,312 |
| Shares redeemed | (1,294,355) | (1,115,673) |
| Net Increase (Decrease) in Shares Outstanding | 4,479,489 | (324,325) |
| |
| a | Effective as of the close of business on March 13, 2012, the fund no longer offers Class B shares. |
| b | During the period ended July 31, 2012, 119,625 Class B shares representing $1,636,401 were automatically |
| | converted to 119,569 Class A shares and during the period ended July 31, 2011, 139,312 Class B shares |
| | representing $1,842,064 were automatically converted to 139,280 Class A shares. |
| See notes to financial statements. |
FINANCIAL HIGHLIGHTS
The following tables describe the performance for each share class for the fiscal periods indicated.All information (except portfolio turnover rate) reflects financial results for a single fund share.Total return shows how much your investment in the fund would have increased (or decreased) during each period, assuming you had reinvested all dividends and distributions.These figures have been derived from the fund’s financial statements.
| | | | | | | | | | |
| | | | Year Ended July 31, | |
| Class A Shares | 2012 | 2011 | 2010 | 2009 | 2008a |
| Per Share Data ($): | | | | | |
| Net asset value, | | | | | |
| beginning of period | 13.44 | 13.15 | 12.00 | 12.02 | 12.40 |
| Investment Operations: | | | | | |
| Investment income—netb | .25 | .41 | .53 | .56 | .55 |
| Net realized and unrealized | | | | | |
| gain (loss) on investments | .71 | .33 | 1.15 | (.02) | (.32) |
| Total from Investment Operations | .96 | .74 | 1.68 | .54 | .23 |
| Distributions: | | | | | |
| Dividends from | | | | | |
| investment income—net | (.32) | (.45) | (.53) | (.56) | (.60) |
| Dividends from net realized | | | | | |
| gain on investments | — | — | — | — | (.01) |
| Total Distributions | (.32) | (.45) | (.53) | (.56) | (.61) |
| Net asset value, end of period | 14.08 | 13.44 | 13.15 | 12.00 | 12.02 |
| Total Return (%)c | 7.26 | 5.75 | 14.29 | 4.90 | 1.76 |
| Ratios/Supplemental Data (%): | | | | | |
| Ratio of total expenses | | | | | |
| to average net assets | .89 | .88 | .89 | .92 | .87 |
| Ratio of net expenses | | | | | |
| to average net assets | .89 | .88 | .88 | .82 | .80 |
| Ratio of net investment income | | | | | |
| to average net assets | 1.80 | 3.14 | 4.21 | 4.93 | 4.53 |
| Portfolio Turnover Rated | 464.84 | 371.17 | 237.07 | 343.03 | 385.86 |
| Net Assets, end of period | | | | | |
| ($ x 1,000) | 990,446 | 1,110,179 | 1,176,710 | 1,125,878 | 1,257,597 |
| |
| a | The fund commenced offering four classes of shares on May 13, 2008.The existing Investor shares were redesignated |
| | as Class A shares. |
| b | Based on average shares outstanding at each month end. |
| c | Exclusive of sales charge. |
| d | The portfolio turnover rates excluding mortgage dollar roll transactions for the periods ended July 31, 2012, 2011, |
| | 2010, 2009 and 2008 were 205.07%, 156.79%, 90.98%, 108.07% and 125.60%, respectively. |
| See notes to financial statements. |
28
| | | | | | | | | | |
| | | Year Ended July 31, | |
| Class C Shares | 2012 | 2011 | 2010 | 2009 | 2008a |
| Per Share Data ($): | | | | | |
| Net asset value, beginning of period | 13.44 | 13.15 | 12.00 | 12.02 | 12.35 |
| Investment Operations: | | | | | |
| Investment income—netb | .15 | .32 | .43 | .46 | .06 |
| Net realized and unrealized | | | | | |
| gain (loss) on investments | .72 | .33 | 1.15 | (.02) | (.28) |
| Total from Investment Operations | .87 | .65 | 1.58 | .44 | (.22) |
| Distributions: | | | | | |
| Dividends from | | | | | |
| investment income—net | (.23) | (.36) | (.43) | (.46) | (.11) |
| Net asset value, end of period | 14.08 | 13.44 | 13.15 | 12.00 | 12.02 |
| Total Return (%)c | 6.49 | 5.01 | 13.40 | 4.01 | (1.81)d |
| Ratios/Supplemental Data (%): | | | | | |
| Ratio of total expenses | | | | | |
| to average net assets | 1.63 | 1.59 | 1.66 | 1.69 | 1.49e |
| Ratio of net expenses | | | | | |
| to average net assets | 1.63 | 1.59 | 1.66 | 1.69 | 1.49e |
| Ratio of net investment income | | | | | |
| to average net assets | 1.07 | 2.44 | 3.41 | 4.07 | 2.64e |
| Portfolio Turnover Ratef | 464.84 | 371.17 | 237.07 | 343.03 | 385.86 |
| Net Assets, end of period ($ x 1,000) | 43,439 | 41,001 | 47,907 | 50,196 | 54,928 |
| |
| a | From May 13, 2008 (commencement of initial offering) to July 31, 2008. |
| b | Based on average shares outstanding at each month end. |
| c | Exclusive of sales charge. |
| d | Not annualized. |
| e | Annualized. |
| f | The portfolio turnover rates excluding mortgage dollar roll transactions for the periods ended July 31, 2012, 2011, |
| | 2010, 2009 and 2008 were 205.07%, 156.79%, 90.98%, 108.07% and 125.60%, respectively. |
| See notes to financial statements. |
FINANCIAL HIGHLIGHTS (continued)
| | | | | | | | | | |
| | | Year Ended July 31, | |
| Class I Shares | 2012 | 2011 | 2010 | 2009 | 2008a |
| Per Share Data ($): | | | | | |
| Net asset value, beginning of period | 13.44 | 13.14 | 12.00 | 12.01 | 12.40 |
| Investment Operations: | | | | | |
| Investment income—netb | .28 | .46 | .56 | .58 | .60 |
| Net realized and unrealized | | | | | |
| gain (loss) on investments | .72 | .34 | 1.15 | .00c | (.34) |
| Total from Investment Operations | 1.00 | .80 | 1.71 | .58 | .26 |
| Distributions: | | | | | |
| Dividends from investment income—net | (.36) | (.50) | (.57) | (.59) | (.64) |
| Dividends from net realized | | | | | |
| gain on investments | — | — | — | — | (.01) |
| Total Distributions | (.36) | (.50) | (.57) | (.59) | (.65) |
| Net asset value, end of period | 14.08 | 13.44 | 13.14 | 12.00 | 12.01 |
| Total Return (%) | 7.59 | 6.09 | 14.52 | 5.27 | 2.05 |
| Ratios/Supplemental Data (%): | | | | | |
| Ratio of total expenses | | | | | |
| to average net assets | .69 | .55 | .62 | .60 | .52 |
| Ratio of net expenses | | | | | |
| to average net assets | .69 | .55 | .59 | .54 | .52 |
| Ratio of net investment income | | | | | |
| to average net assets | 1.99 | 3.46 | 4.46 | 5.18 | 4.83 |
| Portfolio Turnover Rated | 464.84 | 371.17 | 237.07 | 343.03 | 385.86 |
| Net Assets, end of period ($ x 1,000) | 90,383 | 26,085 | 29,781 | 27,624 | 38,600 |
| |
| a | The fund commenced offering four classes of shares on May 13, 2008.The existing Institutional shares were |
| | redesignated as Class I shares. |
| b | Based on average shares outstanding at each month end. |
| c | Amount represents less than $.01 per share. |
| d | The portfolio turnover rates excluding mortgage dollar roll transactions for the periods ended July 31, 2012, 2011, |
| | 2010, 2009 and 2008 were 205.07%, 156.79%, 90.98%, 108.07% and 125.60%, respectively. |
| See notes to financial statements. |
30
NOTES TO FINANCIAL STATEMENTS
NOTE 1—Significant Accounting Policies:
Dreyfus Intermediate Term Income Fund (the “fund”) is a separate diversified series of Dreyfus Investment Grade Funds, Inc. (the “Company”), which is registered under the Investment Company Act of 1940, as amended (the “Act”), as an open-end management investment company and operates as a series company currently offering three series, including the fund.The fund’s investment objective seeks to maximize total return, consisting of capital appreciation and current income. The Dreyfus Corporation (the “Manager” or “Dreyfus”), a wholly-owned subsidiary of The Bank of New York Mellon Corporation (“BNY Mellon”), serves as the fund’s investment adviser.
MBSC Securities Corporation (the “Distributor”), a wholly-owned subsidiary of the Manager, is the distributor of the fund’s shares.The fund is authorized to issue 1.2 billion shares of $.001 par value Common Stock.The fund currently offers three classes of shares: Class A (600 million shares authorized), Class C (100 million shares authorized) and Class I (500 million shares authorized). Class A shares are subject to a sales charge imposed at the time of purchase. Class C shares are subject to a contingent deferred sales charge (“CDSC”) imposed on Class C shares redeemed within one year of purchase. Class I shares are sold at net asset value per share only to institutional investors.The Company’s Board of Directors approved, effective as of the close of business on March 13, 2012, the transfer of shares authorized from Class B to Class A shares. Class B shares were subject to a CDSC imposed on Class B share redemptions made within six years of purchase and automatically converted to Class A shares after six years. The fund no longer offers Class B shares. Effective March 13, 2012, all outstanding Class B shares were automatically converted to Class A shares. Other differences between the classes include the services offered to and the expenses borne by each class, the allocation of certain transfer agency costs and certain voting rights. Income, expenses (other than expenses attributable to a specific class), and real-
NOTES TO FINANCIAL STATEMENTS (continued)
ized and unrealized gains or losses on investments are allocated to each class of shares based on its relative net assets.
The Company accounts separately for the assets, liabilities and operations of each series. Expenses directly attributable to each series are charged to that series’ operations; expenses which are applicable to all series are allocated among them on a pro rata basis.
The Financial Accounting Standards Board (“FASB”) Accounting Standards Codification is the exclusive reference of authoritative U.S. generally accepted accounting principles (“GAAP”) recognized by the FASB to be applied by nongovernmental entities. Rules and interpretive releases of the Securities and Exchange Commission (“SEC”) under authority of federal laws are also sources of authoritative GAAP for SEC registrants. The fund’s financial statements are prepared in accordance with GAAP, which may require the use of management estimates and assumptions.Actual results could differ from those estimates.
The Company enters into contracts that contain a variety of indemnifications. The fund’s maximum exposure under these arrangements is unknown.The fund does not anticipate recognizing any loss related to these arrangements.
(a) Portfolio valuation: The fair value of a financial instrument is the amount that would be received to sell an asset or paid to transfer a liability in an orderly transaction between market participants at the measurement date (i.e., the exit price). GAAP establishes a fair value hierarchy that prioritizes the inputs of valuation techniques used to measure fair value.This hierarchy gives the highest priority to unadjusted quoted prices in active markets for identical assets or liabilities (Level 1 measurements) and the lowest priority to unobservable inputs (Level 3 measurements).
Additionally, GAAP provides guidance on determining whether the volume and activity in a market has decreased significantly and whether such a decrease in activity results in transactions that are not orderly. GAAP requires enhanced disclosures around valuation inputs and techniques used during annual and interim periods.
32
Various inputs are used in determining the value of the fund’s investments relating to fair value measurements.These inputs are summarized in the three broad levels listed below:
Level 1—unadjusted quoted prices in active markets for identical investments.
Level 2—other significant observable inputs (including quoted prices for similar investments, interest rates, prepayment speeds, credit risk, etc.).
Level 3—significant unobservable inputs (including the fund’s own assumptions in determining the fair value of investments).
The inputs or methodology used for valuing securities are not necessarily an indication of the risk associated with investing in those securities.
Changes in valuation techniques may result in transfers in or out of an assigned level within the disclosure hierarchy. Valuation techniques used to value the fund’s investments are as follows:
Registered investment companies that are not traded on an exchange are valued at their net asset value and are categorized within Level 1 of the fair value hierarchy.
Investments in securities excluding short-term investments (other than U.S. Treasury Bills), financial futures, options, swaps and forward foreign currency exchange contracts (“forward contracts”) are valued each business day by an independent pricing service (the “Service”) approved by the Company’s Board of Directors. Investments for which quoted bid prices are readily available and are representative of the bid side of the market in the judgment of the Service are valued at the mean between the quoted bid prices (as obtained by the Service from dealers in such securities) and asked prices (as calculated by the Service based upon its evaluation of the market for such securities). Other investments (which constitute a majority of the portfolio securities) are valued as determined by the Service, based on methods which include consideration of the following: yields or prices of securities of comparable quality, coupon, maturity and type; indications as to values from
NOTES TO FINANCIAL STATEMENTS (continued)
dealers; and general market conditions. These securities are generally categorized within Level 2 of the fair value hierarchy.
U.S. Treasury Bills are valued at the mean price between quoted bid prices and asked prices by the Service. These securities are generally categorized within Level 2 of the fair value hierarchy.
The Service’s procedures are reviewed by Dreyfus under the general supervision of the Company’s Board of Directors.
When market quotations or official closing prices are not readily available, or are determined not to reflect accurately fair value, such as when the value of a security has been significantly affected by events after the close of the exchange or market on which the security is principally traded (for example, a foreign exchange or market), but before the fund calculates its net asset value, the fund may value these investments at fair value as determined in accordance with the procedures approved by the Company’s Board of Directors. Certain factors may be considered when fair valuing investments such as: fundamental analytical data, the nature and duration of restrictions on disposition, an evaluation of the forces that influence the market in which the securities are purchased and sold, and public trading in similar securities of the issuer or comparable issuers. These securities are either categorized as Level 2 or 3 depending on the relevant inputs used.
For restricted securities where observable inputs are limited, assumptions about market activity and risk are used and are categorized within Level 3 of the fair value hierarchy.
Investments denominated in foreign currencies are translated to U.S. dollars at the prevailing rates of exchange.
Financial futures and options, which are traded on an exchange, are valued at the last sales price on the securities exchange on which such securities are primarily traded or at the last sales price on the national securities market on each business day. These securities are generally categorized within Level 1 of the fair value hierarchy. Options traded over-the-counter are valued at the mean between the bid and asked
34
price.These securities are generally categorized within Level 2 of the fair value hierarchy. Investments in swap transactions are valued each business day by the Service. Swaps are valued by the Service by using a swap pricing model which incorporates among other factors, default probabilities, recovery rates, credit curves of the underlying issuer and swap spreads on interest rates. These securities are generally categorized within Level 2 of the fair value hierarchy. Forward contracts are valued at the forward rate. These securities are generally categorized within Level 2 of the fair value hierarchy.
The following is a summary of the inputs used as of July 31, 2012 in valuing the fund’s investments:
| | | | |
| | | Level 2—Other | Level 3— | |
| | Level 1— | Significant | Significant | |
| | Unadjusted | Observable | Unobservable | |
| | Quoted Prices | Inputs | Inputs | Total |
| Assets ($) | | | | |
| Investments in Securities: | | | |
| Asset-Backed | — | 65,329,580 | — | 65,329,580 |
| Commercial | | | | |
| Mortgage-Backed | — | 45,028,936 | — | 45,028,936 |
| Corporate Bonds† | — | 360,240,908 | — | 360,240,908 |
| Foreign Government | — | 8,463,373 | — | 8,463,373 |
| Municipal Bonds | — | 8,158,398 | — | 8,158,398 |
| Mutual Funds | 14,838,393 | — | — | 14,838,393 |
| Preferred Stock† | — | 5,649,050 | — | 5,649,050 |
| Residential | | | | |
| Mortgage-Backed | — | 2,432,669 | — | 2,432,669 |
| U.S. Government | | | | |
| Agencies/ | | | | |
| Mortgage-Backed | — | 360,668,121 | — | 360,668,121 |
| U.S. Treasury | — | 581,171,787 | — | 581,171,787 |
| Other Financial | | | | |
| Instruments: | | | | |
| Forward Foreign | | | | |
| Currency Exchange | | | | |
| Contracts†† | — | 614,966 | — | 614,966 |
| Financial Futures†† | 2,563 | — | — | 2,563 |
NOTES TO FINANCIAL STATEMENTS (continued)
| | | | | | |
| | | | Level 2—Other | | Level 3— | |
| | | Level 1— | Significant | | Significant | |
| | | Unadjusted | Observable | | Unobservable | |
| | | Quoted Prices | Inputs | | Inputs | Total |
| Liabilities ($) | | | | | |
| Other Financial | | | | | |
| | Instruments: | | | | | |
| Forward Foreign | | | | | |
| | Currency Exchange | | | | | |
| | Contracts†† | — | (7,715 | ) | — | (7,715) |
| |
| † | See Statement of Investments for additional detailed categorizations. | |
| †† | Amount shown represents unrealized appreciation (depreciation) at period end. | |
At July 31, 2012, there were no transfers between Level 1 and Level 2 of the fair value hierarchy.
(b) Foreign currency transactions: The fund does not isolate that portion of the results of operations resulting from changes in foreign exchange rates on investments from the fluctuations arising from changes in market prices of securities held. Such fluctuations are included with the net realized and unrealized gain or loss on investments.
Net realized foreign exchange gains or losses arise from sales of foreign currencies, currency gains or losses realized on securities transactions between trade and settlement date, and the difference between the amounts of dividends, interest, and foreign withholding taxes recorded on the fund’s books and the U.S. dollar equivalent of the amounts actually received or paid. Net unrealized foreign exchange gains and losses arise from changes in the value of assets and liabilities other than investments resulting from changes in exchange rates. Foreign currency gains and losses on investments are included with net realized and unrealized gain or loss on investments.
(c) Securities transactions and investment income: Securities transactions are recorded on a trade date basis. Realized gains and losses from securities transactions are recorded on the identified cost basis. Dividend income is recognized on the ex-dividend date and interest income, including, where applicable, accretion of discount and amortization of premium on investments, is recognized on the accrual basis.
36
Pursuant to a securities lending agreement withThe Bank of NewYork Mellon, a subsidiary of BNY Mellon and an affiliate of Dreyfus, the fund may lend securities to qualified institutions. It is the fund’s policy that, at origination, all loans are secured by collateral of at least 102% of the value of U.S. securities loaned and 105% of the value of foreign securities loaned. Collateral equivalent to at least 100% of the market value of securities on loan is maintained at all times. Collateral is either in the form of cash, which can be invested in certain money market mutual funds managed by the Manager, U.S. Government and Agency securities or letters of credit.The fund is entitled to receive all income on securities loaned, in addition to income earned as a result of the lending transaction. Although each security loaned is fully collateralized, the fund bears the risk of delay in recovery of, or loss of rights in, the securities loaned should a borrower fail to return the securities in a timely manner. During the period ended July 31, 2012, The Bank of New York Mellon earned $108,103 from lending portfolio securities, pursuant to the securities lending agreement.
(d) Affiliated issuers: Investments in other investment companies advised by Dreyfus are defined as “affiliated” in the Act. Investments in affiliated investment companies for the period ended July 31, 2012 were as follows:
| | | | | | | |
| Affiliated | | | | | | | |
| Investment | Value | | | | Value | | Net |
| Company | 7/31/2011 | ($) | Purchases ($) | Sales ($) | 7/31/2012 | ($) | Assets (%) |
| Dreyfus | | | | | | | |
| Institutional | | | | | | | |
| Preferred | | | | | | | |
| Plus Money | | | | | | | |
| Market Fund | 9,872,000 | | 669,419,647 | 670,820,213 | 8,471,434 | | .8 |
| Dreyfus | | | | | | | |
| Institutional | | | | | | | |
| Cash | | | | | | | |
| Advantage | | | | | | | |
| Fund | 5,461,700 | | 135,896,890 | 134,991,631 | 6,366,959 | | .6 |
| Total | 15,333,700 | | 805,316,537 | 805,811,844 | 14,838,393 | | 1.4 |
NOTES TO FINANCIAL STATEMENTS (continued)
(e) Dividends to shareholders: It is the policy of the fund to declare dividends daily from investment income-net. Such dividends are paid monthly. Dividends from net realized capital gains, if any, are normally declared and paid annually, but the fund may make distributions on a more frequent basis to comply with the distribution requirements of the Internal Revenue Code of 1986, as amended (the “Code”).To the extent that net realized capital gains can be offset by capital loss carryovers, it is the policy of the fund not to distribute such gains. Income and capital gain distributions are determined in accordance with income tax regulations, which may differ from GAAP.
(f) Federal income taxes: It is the policy of the fund to continue to qualify as a regulated investment company, if such qualification is in the best interests of its shareholders, by complying with the applicable provisions of the Code, and to make distributions of taxable income sufficient to relieve it from substantially all federal income and excise taxes.
As of and during the period ended July 31, 2012, the fund did not have any liabilities for any uncertain tax positions.The fund recognizes interest and penalties, if any, related to uncertain tax positions as income tax expense in the Statement of Operations. During the period, the fund did not incur any interest or penalties.
Each of the tax years in the four-year period ended July 31, 2012 remains subject to examination by the Internal Revenue Service and state taxing authorities.
At July 31, 2012, the components of accumulated earnings on a tax basis were as follows: undistributed ordinary income $3,922,874, accumulated capital losses $3,279,847 and unrealized appreciation $38,237,649.
Under the Regulated Investment Company Modernization Act of 2010 (the “2010 Act”), the fund is permitted to carry forward capital losses incurred in taxable years beginning after December 22, 2010 (“post-enactment losses”) for an unlimited period. Furthermore, post-enactment capital loss carryovers retain their character as either short-term or long-term capital losses rather than short-term as they were under previous statute.The 2010 Act requires post-enactment losses to be utilized before
38
the utilization of losses incurred in taxable years prior to the effective date of the 2010 Act (“pre-enactment losses”).As a result of this ordering rule, pre-enactment losses may be more likely to expire unused.
The accumulated capital loss carryover is available for federal income tax purposes to be applied against future net realized capital gains, if any, realized subsequent to July 31, 2012. If not applied, the carryover expires in fiscal year 2018.
The tax character of distributions paid to shareholders during the fiscal periods ended July 31, 2012 and July 31, 2011 were as follows: ordinary income $26,482,749 and $40,369,422, respectively.
During the period ended July 31, 2012, as a result of permanent book to tax differences, primarily due to the tax treatment for amortization of premiums, paydown gains and losses on mortgage-backed securities, foreign currency transactions, consent fees and swap periodic payments, the fund increased accumulated undistributed investment income-net by $8,687,763 and decreased accumulated net realized gain (loss) on investments by the same amount. Net assets and net asset value per share were not affected by this reclassification.
(g) New Accounting Pronouncements: In April 2011, FASB issued ASU No. 2011-03“Transfers and Servicing (Topic 860) Reconsideration of Effective Control for Repurchase Agreements (“ASU 2011-03”) which relates to the accounting for repurchase agreements and similar agreements including mortgage dollar rolls, that both entitle and obligate a transferor to repurchase or redeem financial assets before their maturity. ASU 2011-03 modifies the criteria for determining effective control of transferred assets and as a result certain agreements may now be accounted for as secured borrowings.ASU 2011-03 was effective for new transfers and existing transactions that were modified in the first interim or annual period beginning on or after December 15, 2011.The new disclosures have been implemented and there was no change in accounting for the fund. Management has determined that the fund has not entered into transactions that can be deemed “secured borrowings” as defined by ASU 2011-03.
NOTES TO FINANCIAL STATEMENTS (continued)
In December 2011, FASB issued Accounting Standards Update No. 2011-11 “Disclosures about Offsetting Assets and Liabilities” (“ASU 2011-11”).These disclosure requirements are intended to help investors and other financial statement users to better assess the effect or potential effect of offsetting arrangements on a company’s financial position.They also improve transparency in the reporting of how companies mitigate credit risk, including disclosure of related collateral pledged or received. In addition, ASU 2011-11 facilitates comparison between those entities that prepare their financial statements on the basis of GAAP and those entities that prepare their financial statements on the basis of IFRS.ASU 2011-11 requires entities to: disclose both gross and net information about both instruments and transactions eligible for offset in the financial statements; and disclose instruments and transactions subject to an agreement similar to a master netting agreement.ASU 2011-11 is effective for fiscal years beginning on or after January 1, 2013, and interim periods within those annual periods.At this time, management is evaluating the implications of ASU 2011-11 and its impact on the funds’ financial statement disclosures.
NOTE 2—Bank Lines of Credit:
The fund participates with other Dreyfus-managed funds in a $225 million unsecured credit facility led by Citibank, N.A. and a $300 million unsecured credit facility provided by The Bank of New York Mellon (each, a “Facility”), each to be utilized primarily for temporary or emergency purposes, including the financing of redemptions. In connection therewith, the fund has agreed to pay its pro rata portion of commitment fees for each Facility. Interest is charged to the fund based on rates determined pursuant to the terms of the respective Facility at the time of borrowing. During the period ended July 31, 2012, the fund did not borrow under the Facilities.
NOTE 3—Management Fee and Other Transactions With Affiliates:
(a) Pursuant to a management agreement with the Manager, the management fee is computed at the annual rate of .45% of the value of the fund’s average daily net assets and is payable monthly.
40
During the period ended July 31, 2012, the Distributor retained $12,118 from commissions earned on sales of the fund’s Class A shares and $1,132 and $9,543 from CDSCs on redemptions of the fund’s Class B and Class C shares, respectively.
(b) Under the Distribution Plan adopted pursuant to Rule 12b-1 under the Act, Class B shares paid and Class C shares pay the Distributor for distributing their shares at an annual rate of .50% of the value of the average daily net assets of Class B shares and .75% of the value of the average daily net assets of Class C shares. During the period ended July 31, 2012, Class B and Class C shares were charged $8,720 and $315,729, respectively, pursuant to the Distribution Plan.
(c) Under the Shareholder Services Plan, Class A and Class C shares pay and Class B shares paid the Distributor at an annual rate of .25% of the value of their average daily net assets for the provision of certain services. The services provided may include personal services relating to shareholder accounts, such as answering shareholder inquiries regarding the fund and providing reports and other information, and services related to the maintenance of shareholder accounts. The Distributor may make payments to Service Agents (securities dealers, financial institutions or other industry professionals) in respect of these services. The Distributor determines the amounts to be paid to Service Agents. During the period ended July 31, 2012, Class A, Class B and Class C shares were charged $2,559,822, $4,360 and $105,243, respectively, pursuant to the Shareholder Services Plan.
The fund compensates Dreyfus Transfer, Inc. (“DTI”), a wholly-owned subsidiary of the Manager, under a transfer agency agreement for providing transfer agency services for the fund and, since May 29, 2012, cash management services related to fund subscriptions and redemptions. During the period ended July 31, 2012, the fund was charged $457,368 for transfer agency services and $2,466 for cash management services.These fees are included in Shareholder servicing costs in the Statement of Operations.
NOTES TO FINANCIAL STATEMENTS (continued)
The fund compensatesThe Bank of NewYork Mellon under a custody agreement for providing custodial services for the fund. During the period ended July 31, 2012, the fund was charged $100,781 pursuant to the custody agreement.
The fund has arrangements with the transfer agent and the custodian whereby the fund may receive earnings credits when positive cash balances are maintained, which are used to offset transfer agency and custody fees. For financial reporting purposes, the fund includes net earnings credits as an expense offset in the Statement of Operations.
Prior to May 29, 2012, the fund compensated The Bank of NewYork Mellon under a cash management agreement for performing cash management services related to fund subscriptions and redemptions. Subsequent to May 29, 2012,The Bank of NewYork Mellon has continued to provide shareholder redemption draft processing services. During the period ended July 31, 2012, the fund was charged $35,747 pursuant to the cash management agreement, which is included in Shareholder servicing costs in the Statement of Operations.These fees were partially offset by earnings credits of $1,038.
During the period ended July 31, 2012, the fund was charged $6,418 for services performed by the Chief Compliance Officer and his staff.
The components of “Due to The Dreyfus Corporation and affiliates” in the Statement of Assets and Liabilities consist of: management fees $423,899, Distribution Plan fees $27,425, Shareholder Services Plan fees $217,887, custodian fees $23,722, Chief Compliance Officer fees $3,713 and transfer agency per account fees $80,531.
(d) Each Board member also serves as a Board member of other funds within the Dreyfus complex. Annual retainer fees and attendance fees are allocated to each fund based on net assets.
NOTE 4—Securities Transactions:
The aggregate amount of purchases and sales (including paydowns) of investment securities, excluding short-term securities, options transac-
42
tions, financial futures, forward contracts and swap transactions, during the period ended July 31, 2012, amounted to $6,250,811,517 and $6,193,228,654, respectively, of which $3,454,415,011 in purchases and $3,461,053,355 in sales were from mortgage dollar roll transactions.
Mortgage Dollar Rolls: A mortgage dollar roll transaction involves a sale by the fund of mortgage related securities that it holds with an agreement by the fund to repurchase similar securities at an agreed upon price and date.The securities purchased will bear the same interest rate as those sold, but generally will be collateralized by pools of mortgages with different prepayment histories than those securities sold.The fund accounts for mortgage dollar rolls as purchases and sales transactions.
Derivatives: A derivative is a financial instrument whose performance is derived from the performance of another asset. Each type of derivative instrument that was held by the fund during the period ended July 31, 2012 is discussed below.
The following tables show the fund’s exposure to different types of market risk as it relates to the Statement of Assets and Liabilities and the Statement of Operations, respectively.
Fair value of derivative instruments as of July 31, 2012 is shown below:
| | | | |
| | Derivative | | Derivative |
| | Assets ($) | | Liabilities ($) |
| Interest rate risk1 | 2,563 | Interest rate risk | — |
| Foreign exchange risk2 | 614,966 | Foreign exchange risk3 | (7,715) |
| Gross fair value of | | | |
| derivatives contracts | 617,529 | | (7,715) |
| |
| Statement of Assets and Liabilities location: |
| 1 | Includes cumulative appreciation (depreciation) on financial futures as reported in the Statement of |
| | Financial Futures, but only the unpaid variation margin is reported in the Statement of Assets |
| | and Liabilities. |
| 2 | Unrealized appreciation on forward foreign currency exchange contracts. |
| 3 | Unrealized depreciation on forward foreign currency exchange contracts. |
NOTES TO FINANCIAL STATEMENTS (continued)
The effect of derivative instruments in the Statement of Operations during the period ended July 31, 2012 is shown below:
| | | | | | | | |
| | Amount of realized gain or (loss) on derivatives recognized in income ($) |
| | Financial | Options | Forward | Swap | |
| Underlying risk | Futures4 | Transactions5 | Contracts6 Transactions7 | Total |
| Interest rate | (494,172) | 446,218 | — | — | (47,954) |
| Foreign | | | | | |
| exchange | — | (632,680) | 1,310,918 | — | 678,238 |
| Credit | — | — | — | 161,598 | 161,598 |
| Total | (494,172) | (186,462) | 1,310,918 | 161,598 | 791,882 |
| |
| Change in unrealized appreciation or (depreciation) on derivatives recognized in income ($) |
| | Financial | Options | Forward | Swap | |
| Underlying risk | Futures8 | Transactions9 | Contracts10 Transactions11 | Total |
| Interest rate | 2,563 | — | — | — | 2,563 |
| Foreign exchange | — | 632,680 | 673,973 | — | 1,306,653 |
| Credit | — | — | — | 86,026 | 86,026 |
| Total | 2,563 | 632,680 | 673,973 | 86,026 1,395,242 |
| |
| Statement of Operations location: |
| 4 | Net realized gain (loss) on financial futures. |
| 5 | Net realized gain (loss) on options transactions. |
| 6 | Net realized gain (loss) on forward foreign currency exchange contracts. |
| 7 | Net realized gain (loss) on swap transactions. |
| 8 | Net unrealized appreciation (depreciation) on financial futures. |
| 9 | Net unrealized appreciation (depreciation) on options transactions. |
| 10 Net unrealized appreciation (depreciation) on forward foreign currency exchange contracts. |
| 11 Net unrealized appreciation (depreciation) on swap transactions. |
Financial Futures: In the normal course of pursuing its investment objective, the fund is exposed to market risk, including interest rate risk, as a result of changes in value of underlying financial instruments. The fund invests in financial futures in order to manage its exposure to or protect against changes in the market.A financial futures contract represents a commitment for the future purchase or a sale of an asset at a specified date. Upon entering into such contracts, these investments require initial margin deposits with a counterparty, which consist of cash or cash equivalents.The amount of these deposits is determined by the exchange or Board of Trade on which the contract is traded and is subject to change.Accordingly, variation margin payments are received or made to reflect daily unrealized gains or losses which are recorded
44
in the Statement of Operations. When the contracts are closed, the fund recognizes a realized gain or loss which is reflected in the Statement of Operations.There is minimal counterparty credit risk to the fund with financial futures since they are exchange traded, and the exchange’s clearinghouse guarantees the financial futures against default. Financial futures open at July 31, 2012 are set forth in the Statement of Financial Futures.
Options Transactions: The fund purchases and writes (sells) put and call options to hedge against changes in interest rates and foreign currencies, or as a substitute for an investment. The fund is subject to interest rate and currency risk in the course of pursuing its investment objectives through its investments in options contracts. A call option gives the purchaser of the option the right (but not the obligation) to buy, and obligates the writer to sell, the underlying security or securities at the exercise price at any time during the option period, or at a specified date. Conversely, a put option gives the purchaser of the option the right (but not the obligation) to sell, and obligates the writer to buy the underlying security or securities at the exercise price at any time during the option period, or at a specified date.
As a writer of call options, the fund receives a premium at the outset and then bears the market risk of unfavorable changes in the price of the financial instrument underlying the option. Generally, the fund realizes a gain, to the extent of the premium, if the price of the underlying financial instrument decreases between the date the option is written and the date on which the option is terminated. Generally, the fund incurs a loss if the price of the financial instrument increases between those dates.
As a writer of put options, the fund receives a premium at the outset and then bears the market risk of unfavorable changes in the price of the financial instrument underlying the option. Generally, the fund realizes a gain, to the extent of the premium, if the price of the underlying financial instrument increases between the date the option is written and the
NOTES TO FINANCIAL STATEMENTS (continued)
date on which the option is terminated. Generally, the fund incurs a loss if the price of the financial instrument decreases between those dates.
As a writer of an option, the fund has no control over whether the underlying securities may be sold (call) or purchased (put) and as a result bears the market risk of an unfavorable change in the price of the security underlying the written option.There is a risk of loss from a change in value of such options which may exceed the related premiums received. The Statement of Operations reflects the following: any unrealized gains or losses which occurred during the period as well as any realized gains or losses which occurred upon the expiration or closing of the option transaction. At July 31, 2012, there were no written options outstanding.
The following summarizes the fund’s call/put options written during the period ended July 31, 2012:
| | | | |
| | Face Amount | | Options Terminated |
| | Covered by | Premiums | | Net Realized |
| Options Written: | Contracts ($) | Received ($) | Cost ($) | Gain ($) |
| Contracts outstanding | | | | |
| July 31, 2011 | — | — | | |
| Contracts written | 55,290,000 | 1,057,181 | | |
| Contracts terminated: | | | | |
| Contracts closed | 42,790,000 | 987,221 | 867,497 | 119,724 |
| Contracts expired | 12,500,000 | 69,960 | — | 69,960 |
| Total contracts | | | | |
| terminated | 55,290,000 | 1,057,181 | 867,497 | 189,684 |
| Contracts outstanding | | | | |
| July 31, 2012 | — | — | | |
Forward Foreign Currency Exchange Contracts: The fund enters into forward contracts in order to hedge its exposure to changes in foreign currency exchange rates on its foreign portfolio holdings, to settle foreign currency transactions or as a part of its investment strategy.When executing forward contracts, the fund is obligated to buy or sell a foreign currency at a specified rate on a certain date in the future. With respect to sales of forward contracts, the fund incurs a loss if the value of the contract increases between the date the forward contract is opened
46
and the date the forward contract is closed.The fund realizes a gain if the value of the contract decreases between those dates.With respect to purchases of forward contracts, the fund incurs a loss if the value of the contract decreases between the date the forward contract is opened and the date the forward contract is closed.The fund realizes a gain if the value of the contract increases between those dates. Any realized or unrealized gains or losses which occurred during the period are reflected in the Statement of Operations.The fund is exposed to foreign currency risk as a result of changes in value of underlying financial instruments. The fund is also exposed to credit risk associated with counterparty nonperformance on these forward contracts, which is typically limited to the unrealized gain on each open contract.The following summarizes open forward contracts at July 31, 2012:
| | | | | | |
| | | Foreign | | | Unrealized | |
| Forward Foreign Currency | | Currency | | | Appreciation | |
| Exchange Contracts | | Amounts | Cost ($) | Value ($) (Depreciation) ($) | |
| Purchases: | | | | | | |
| Mexican New Peso, | | | | | | |
| Expiring | | | | | | |
| 8/29/2012 | a | 303,025,000 | 22,329,027 | 22,718,775 | 389,748 | |
| South African Rand, | | | | | | |
| Expiring | | | | | | |
| 8/29/2012 | a | 90,160,000 | 10,621,679 | 10,846,897 | 225,218 | |
| Sales: | | | Proceeds ($) | | | |
| Euro, Expiring | | | | | | |
| 8/29/2012 | b | 420,000 | 509,233 | 516,948 | (7,715) | |
| Gross Unrealized | | | | | | |
| Appreciation | | | | | 614,966 | |
| Gross Unrealized | | | | | | |
| Depreciation | | | | | (7,715) | |
| |
| Counterparties: | | | | | | |
| a JPMorgan Chase & Co. | | | | | | |
| b Morgan Stanley | | | | | | |
Swap Transactions:The fund enters into swap agreements to exchange the interest rate on, or return generated by, one nominal instrument for the return generated by another nominal instrument.The fund enters into these agreements to hedge certain market or interest rate risks, to
NOTES TO FINANCIAL STATEMENTS (continued)
manage the interest rate sensitivity (sometimes called duration) of fixed income securities, to provide a substitute for purchasing or selling particular securities or to increase potential returns.
The fund accrues for the interim payments on swap contracts on a daily basis, with the net amount recorded within unrealized appreciation (depreciation) on swap contracts in the Statement of Assets and Liabilities. Once the interim payments are settled in cash, the net amount is recorded as a realized gain (loss) on swaps, in addition to realized gain (loss) recorded upon the termination of swap contracts in the Statement of Operations. Upfront payments made and/or received by the fund, are recorded as an asset and/or liability in the Statement of Assets and Liabilities and are recorded as a realized gain or loss ratably over the contract’s term/event with the exception of forward starting interest rate swaps which are recorded as realized gains or losses on the termination date. Fluctuations in the value of swap contracts are recorded for financial statement purposes as unrealized appreciation or depreciation on swap transactions.
Credit Default Swaps: Credit default swaps involve commitments to pay a fixed interest rate in exchange for payment if a credit event affecting a third party (the referenced company) occurs. Credit events may include a failure to pay interest or principal, bankruptcy, or restructur-ing.The fund enters into these agreements to manage its exposure to the market or certain sectors of the market, to reduce its risk exposure to defaults of corporate and sovereign issuers, or to create exposure to corporate or sovereign issuers to which it is not otherwise exposed. For those credit default swaps in which the fund is paying a fixed rate, the fund is buying credit protection on the instrument. In the event of a credit event, the fund would receive the full notional amount for the reference obligation. For those credit default swaps in which the fund is receiving a fixed rate, the fund is selling credit protection on the underlying instrument. The maximum payouts for these contracts are limited to the notional amount of each swap. Credit default swaps may involve greater risks than if the fund had invested in the reference obligation directly and are subject to general market risk, liquidity risk, counterparty risk and credit risk.At July 31, 2012, there were no credit default swap agreements outstanding.
48
The following summarizes the average market value of derivatives outstanding during the period ended July 31, 2012:
| |
| | Average Market Value ($) |
| Interest rate financial futures | 10,577,493 |
| Interest rate options contracts | 138,252 |
| Forward contracts | 11,620,285 |
The following summarizes the average notional value of swap contracts outstanding during the period ended July 31, 2012:
| |
| | Average Notional Value ($) |
| Credit default swap contracts | 9,007,692 |
At July 31, 2012, the cost of investments for federal income tax purposes was $1,413,249,395; accordingly, accumulated net unrealized appreciation on investments was $38,731,820, consisting of $43,525,614 gross unrealized appreciation and $4,793,794 gross unrealized depreciation.
NOTE 5—Plan of Reorganization:
At meetings held on July 25-26, 2012, the Company’s Board of Directors approved an agreement and Plan of Reorganization between the Company, on behalf of the fund, and Dreyfus Investment Funds on behalf of Dreyfus/Standish Fixed Income Fund, (the “Acquired Fund”).The merger is subject to the approval of the shareholders of the Acquired Fund at a meeting to be held on or about November 15, 2012. If approved, the merger is anticipated to occur on or about January 18, 2013. The merger provides for the Acquired Fund to transfer all of its assets, subject to its liabilities, to the fund in exchange for a number of Class I shares of the fund of equal value to the assets less liabilities of the Acquired Fund.The fund’s Class I shares will then be distributed to the Acquired Fund’s shareholders on a pro rata basis in liquidation of the Acquired Fund.
|
| REPORT OF INDEPENDENT REGISTERED |
| PUBLIC ACCOUNTING FIRM |
Shareholders and Board of Directors
Dreyfus Intermediate Term Income Fund
We have audited the accompanying statement of assets and liabilities, including the statement of investments, of Dreyfus Intermediate Term Income Fund (one of the series comprising Dreyfus Investment Grade Funds, Inc.) as of July 31, 2012, and the related statement of operations for the year then ended, the statement of changes in net assets for each of the two years in the period then ended, and financial highlights for each of the periods indicated therein. These financial statements and financial highlights are the responsibility of the Fund’s management. Our responsibility is to express an opinion on these financial statements and financial highlights based on our audits.
We conducted our audits in accordance with the standards of the Public Company Accounting Oversight Board (United States).Those standards require that we plan and perform the audit to obtain reasonable assurance about whether the financial statements and financial highlights are free of material misstatement.We were not engaged to perform an audit of the Fund’s internal control over financial reporting. Our audits included consideration of internal control over financial reporting as a basis for designing audit procedures that are appropriate in the circumstances, but not for the purpose of expressing an opinion on the effectiveness of the Fund’s internal control over financial reporting. Accordingly, we express no such opinion.An audit also includes examining, on a test basis, evidence supporting the amounts and disclosures in the financial statements and financial highlights, assessing the accounting principles used and significant estimates made by management, and evaluating the overall financial statement presentation. Our procedures included confirmation of securities owned as of July 31, 2012 by correspondence with the custodian and others.We believe that our audits provide a reasonable basis for our opinion.
In our opinion, the financial statements and financial highlights referred to above present fairly, in all material respects, the financial position of Dreyfus Intermediate Term Income Fund at July 31, 2012, the results of its operations for the year then ended, the changes in its net assets for each of the two years in the period then ended, and the financial highlights for each of the indicated periods, in conformity with U.S. generally accepted accounting principles.

New York, New York
September 24, 2012
50
IMPORTANT TAX INFORMATION (Unaudited)
The fund hereby reports 97.62% of ordinary income dividends paid during the fiscal year ended July 31, 2012 as qualifying “interest related dividends”.
|
| INFORMATION ABOUT THE RENEWAL OF THE |
| FUND’S MANAGEMENT AGREEMENT (Unaudited) |
At a meeting of the fund’s Board of Directors held on July 18 and 19, 2012, the Board considered the renewal of the fund’s Management Agreement pursuant to which Dreyfus provides the fund with investment advisory and administrative services (the “Agreement”).The Board members, none of whom are “interested persons” (as defined in the Investment Company Act of 1940, as amended) of the fund, were assisted in their review by independent legal counsel and met with counsel in executive session separate from Dreyfus representatives. In considering the renewal of the Agreement, the Board considered all factors that it believed to be relevant, including those discussed below.The Board did not identify any one factor as dispositive, and each Board member may have attributed different weights to the factors considered.
Analysis of Nature, Extent, and Quality of Services Provided to the Fund. The Board considered information previously provided to them in presentations from Dreyfus representatives regarding the nature, extent, and quality of the services provided to funds in the Dreyfus fund complex, and Dreyfus representatives confirmed that there had been no material changes in this information. Dreyfus provided the number of open accounts in the fund, the fund’s asset size and the allocation of fund assets among distribution channels. Dreyfus also had previously provided information regarding the diverse intermediary relationships and distribution channels of funds in the Dreyfus fund complex (such as retail direct or intermediary, in which intermediaries typically are paid by the fund and/or Dreyfus) and Dreyfus’ corresponding need for broad, deep, and diverse resources to be able to provide ongoing shareholder services to each intermediary or distribution channel, as applicable to the fund.
The Board also considered research support available to, and portfolio management capabilities of, the fund’s portfolio management personnel and that Dreyfus also provides oversight of day-to-day fund operations, including fund accounting and administration and assistance in meeting legal and regulatory requirements.The Board also considered Dreyfus’ extensive administrative, accounting, and compliance infrastructures.
52
Comparative Analysis of the Fund’s Performance and Management Fee and Expense Ratio. The Board reviewed reports prepared by Lipper, Inc. (“Lipper”), an independent provider of investment company data, which included information comparing (1) the fund’s performance with the performance of a group of comparable funds (the “Performance Group”) and with a broader group of funds (the “Performance Universe”), all for various periods ended May 31, 2012, and (2) the fund’s actual and contractual management fees and total expenses with those of a group of comparable funds (the “Expense Group”) and with a broader group of funds (the “Expense Universe”), the information for which was derived in part from fund financial statements available to Lipper as of the date of its analysis. Dreyfus previously had furnished the Board with a description of the methodology Lipper used to select the Performance Group and Performance Universe and the Expense Group and Expense Universe.
Dreyfus representatives stated that the usefulness of performance comparisons may be affected by a number of factors, including different investment limitations that may be applicable to the fund and comparison funds. The Board discussed the results of the comparisons and noted that the fund’s total return performance was variously above, at and below the Performance Group median and above the Performance Universe median for all periods. The Board also noted that the fund’s yield performance was above or below the Performance Group median and above the Performance Universe median for nine of the ten one-year periods ended May 31st. Dreyfus also provided a comparison of the fund’s calendar year total returns to the returns of the fund’s benchmark index.
The Board also reviewed the range of actual and contractual management fees and total expenses of the Expense Group and Expense Universe funds and discussed the results of the comparisons. The Board noted that the fund’s contractual management fee was above
|
| INFORMATION ABOUT THE RENEWAL OF THE FUND’S |
| MANAGEMENT AGREEMENT (Unaudited) (continued) |
the Expense Group median and that the fund’s actual management fee and total expenses were above the Expense Group and Expense Universe medians.
Dreyfus representatives reviewed with the Board the management or investment advisory fees (1) paid by funds advised or administered by Dreyfus that are in the same Lipper category as the fund and (2) paid to Dreyfus or the Dreyfus-affiliated primary employer of the fund’s primary portfolio manager(s) for advising any separate accounts and/or other types of client portfolios that are considered to have similar investment strategies and policies as the fund (the “Similar Clients”), and explained the nature of the Similar Clients.They discussed differences in fees paid and the relationship of the fees paid in light of any differences in the services provided and other relevant factors. The Board considered the relevance of the fee information provided for the Similar Clients to evaluate the appropriateness and reasonableness of the fund’s management fee.
Analysis of Profitability and Economies of Scale. Dreyfus representatives reviewed the expenses allocated and profit received by Dreyfus and the resulting profitability percentage for managing the fund, and the method used to determine the expenses and profit. The Board concluded that the profitability results were not unreasonable, given the services rendered and service levels provided by Dreyfus. The Board previously had been provided with information prepared by an independent consulting firm regarding Dreyfus’ approach to allocating costs to, and determining the profitability of, individual funds and the entire Dreyfus fund complex. The consulting firm also had analyzed where any economies of scale might emerge in connection with the management of a fund.
The Board’s counsel stated that the Board should consider the profitability analysis (1) as part of the evaluation of whether the fees under the Agreement bear a reasonable relationship to the mix of services provided by Dreyfus, including the nature, extent and quality of such services, and (2) in light of the relevant circumstances for the fund and
54
the extent to which economies of scale would be realized if the fund grows and whether fee levels reflect these economies of scale for the benefit of fund shareholders. Dreyfus representatives noted that a discussion of economies of scale is predicated on a fund having achieved a substantial size with increasing assets and that, if a fund’s assets had been stable or decreasing, the possibility that Dreyfus may have realized any economies of scale would be less. Dreyfus representatives also noted that, as a result of shared and allocated costs among funds in the Dreyfus fund complex, the extent of economies of scale could depend substantially on the level of assets in the complex as a whole, so that increases and decreases in complex-wide assets can affect potential economies of scale in a manner that is disproportionate to, or even in the opposite direction from, changes in the fund’s asset level. The Board also considered potential benefits to Dreyfus from acting as investment adviser and noted that there were no soft dollar arrangements in effect for trading the fund’s investments.
At the conclusion of these discussions, the Board agreed that it had been furnished with sufficient information to make an informed business decision with respect to the renewal of the Agreement. Based on the discussions and considerations as described above, the Board concluded and determined as follows.
The Board concluded that the nature, extent and quality of the services provided by Dreyfus are adequate and appropriate.
The Board generally was satisfied with the fund’s overall performance.
The Board concluded that the fee paid to Dreyfus was reasonable in light of the considerations described above.
The Board determined that the economies of scale which may accrue to Dreyfus and its affiliates in connection with the management of the fund had been adequately considered by Dreyfus in connection with the fee rate charged to the fund pursuant to the Agreement and that, to the extent in the future it were determined that material economies of scale had not been shared with the fund, the Board would seek to have those economies of scale shared with the fund.
|
| INFORMATION ABOUT THE RENEWAL OF THE FUND’S |
| MANAGEMENT AGREEMENT (Unaudited) (continued) |
In evaluating the Agreement, the Board considered these conclusions and determinations and also relied on its previous knowledge, gained through meetings and other interactions with Dreyfus and its affiliates, of the fund and the services provided to the fund by Dreyfus.The Board also relied on information received on a routine and regular basis throughout the year relating to the operations of the fund and the investment management and other services provided under the Agreement, including information on the investment performance of the fund in comparison to similar mutual funds and benchmark performance indices; general market outlook as applicable to the fund; and compliance reports. In addition, it should be noted that the Board’s consideration of the contractual fee arrangements for this fund had the benefit of a number of years of reviews of prior or similar agreements during which lengthy discussions took place between the Board and Dreyfus representatives. Certain aspects of the arrangements may receive greater scrutiny in some years than in others, and the Board’s conclusions may be based, in part, on their consideration of the same or similar arrangements in prior years.The Board determined that renewal of the Agreement was in the best interests of the fund and its shareholders.
56

OFFICERS OF THE FUND (Unaudited)
BRADLEY J. SKAPYAK, President since January 2010.
Chief Operating Officer and a director of the Manager since June 2009; from April 2003 to June 2009, Mr. Skapyak was the head of the Investment Accounting and Support Department of the Manager. He is an officer of 72 investment companies (comprised of 156 portfolios) managed by the Manager. He is 53 years old and has been an employee of the Manager since February 1988.
JANETTE E. FARRAGHER, Vice President and Secretary since December 2011.
Assistant General Counsel of BNY Mellon, and an officer of 73 investment companies (comprised of 183 portfolios) managed by the Manager. She is 49 years old and has been an employee of the Manager since February 1984.
KIESHA ASTWOOD, Vice President and Assistant Secretary since January 2010.
Counsel of BNY Mellon, and an officer of 73 investment companies (comprised of 183 portfolios) managed by the Manager. She is 39 years old and has been an employee of the Manager since July 1995.
JAMES BITETTO, Vice President and Assistant Secretary since August 2005.
Senior Counsel of BNY Mellon and Secretary of the Manager, and an officer of 73 investment companies (comprised of 183 portfolios) managed by the Manager. He is 46 years old and has been an employee of the Manager since December 1996.
JONI LACKS CHARATAN, Vice President and Assistant Secretary since August 2005.
Senior Counsel of BNY Mellon, and an officer of 73 investment companies (comprised of 183 portfolios) managed by the Manager. She is 56 years old and has been an employee of the Manager since October 1988.
JOSEPH M. CHIOFFI, Vice President and Assistant Secretary since August 2005.
Senior Counsel of BNY Mellon, and an officer of 73 investment companies (comprised of 183 portfolios) managed by the Manager. He is 50 years old and has been an employee of the Manager since June 2000.
KATHLEEN DENICHOLAS, Vice President and Assistant Secretary since January 2010.
Managing Counsel of BNY Mellon, and an officer of 73 investment companies (comprised of 183 portfolios) managed by the Manager. She is 37 years old and has been an employee of the Manager since February 2001.
JOHN B. HAMMALIAN, Vice President and Assistant Secretary since August 2005.
Senior Managing Counsel of BNY Mellon, and an officer of 73 investment companies (comprised of 183 portfolios) managed by the Manager. He is 49 years old and has been an employee of the Manager since February 1991.
ROBERT R. MULLERY, Vice President and Assistant Secretary since August 2005.
Managing Counsel of BNY Mellon, and an officer of 73 investment companies (comprised of 183 portfolios) managed by the Manager. He is 60 years old and has been an employee of the Manager since May 1986.
JEFF PRUSNOFSKY, Vice President and Assistant Secretary since August 2005.
Senior Managing Counsel of BNY Mellon, and an officer of 73 investment companies (comprised of 183 portfolios) managed by the Manager. He is 47 years old and has been an employee of the Manager since October 1990.
OFFICERS OF THE FUND (Unaudited) (continued)
JAMES WINDELS, Treasurer since November 2001.
Director – Mutual Fund Accounting of the Manager, and an officer of 73 investment companies (comprised of 183 portfolios) managed by the Manager. He is 53 years old and has been an employee of the Manager since April 1985.
RICHARD CASSARO, Assistant Treasurer since January 2008.
Senior Accounting Manager – Money Market and Municipal Bond Funds of the Manager, and an officer of 73 investment companies (comprised of 183 portfolios) managed by the Manager. He is 53 years old and has been an employee of the Manager since September 1982.
GAVIN C. REILLY, Assistant Treasurer since December 2005.
Tax Manager of the Investment Accounting and Support Department of the Manager, and an officer of 73 investment companies (comprised of 183 portfolios) managed by the Manager. He is 43 years old and has been an employee of the Manager since April 1991.
ROBERT S. ROBOL, Assistant Treasurer since August 2003.
Senior Accounting Manager – Fixed Income Funds of the Manager, and an officer of 73 investment companies (comprised of 183 portfolios) managed by the Manager. He is 48 years old and has been an employee of the Manager since October 1988.
ROBERT SALVIOLO, Assistant Treasurer since July 2007.
Senior Accounting Manager – Equity Funds of the Manager, and an officer of 73 investment companies (comprised of 183 portfolios) managed by the Manager. He is 45 years old and has been an employee of the Manager since June 1989.
ROBERT SVAGNA, Assistant Treasurer since August 2005.
Senior Accounting Manager – Equity Funds of the Manager, and an officer of 73 investment companies (comprised of 183 portfolios) managed by the Manager. He is 45 years old and has been an employee of the Manager since November 1990.
JOSEPH W. CONNOLLY, Chief Compliance Officer since October 2004.
Chief Compliance Officer of the Manager and The Dreyfus Family of Funds (73 investment companies, comprised of 183 portfolios).
He is 55 years old and has served in various capacities with the Manager since 1980, including manager of the firm’s Fund Accounting Department from 1997 through October 2001.
MATTHEW D. CONNOLLY, Anti-Money Laundering Compliance Officer since April 2012.
Anti-Money Laundering Compliance Officer of the Distributor since October 2011; from March 2010 to September 2011, Global Head, KYC Reviews and Director, UBS Investment Bank; until March 2010,AML Compliance Officer and Senior Vice President, Citi Global Wealth Management. He is an officer of 69 investment companies (comprised of 179 portfolios) managed by the Manager. He is 40 years old and has been an employee of the Distributor since October 2011.
60

Save time. Save paper. View your next shareholder report online as soon as it’s available. Log into www.dreyfus.com and sign up for Dreyfus eCommunications. It’s simple and only takes a few minutes.
The views expressed in this report reflect those of the portfolio manager only through the end of the period covered and do not necessarily represent the views of Dreyfus or any other person in the Dreyfus organization. Any such views are subject to change at any time based upon market or other conditions and Dreyfus disclaims any responsibility to update such views.These views may not be relied on as investment advice and, because investment decisions for a Dreyfus fund are based on numerous factors, may not be relied on as an indication of trading intent on behalf of any Dreyfus fund.
Not FDIC-Insured • Not Bank-Guaranteed • May Lose Value
| | Contents |
| | THE FUND |
| 2 | A Letter from the Chairman and CEO |
| 3 | Discussion of Fund Performance |
| 6 | Fund Performance |
| 8 | Understanding Your Fund’s Expenses |
| 8 | Comparing Your Fund’s Expenses With Those of Other Funds |
| 9 | Statement of Investments |
| 20 | Statement of Financial Futures |
| 21 | Statement of Assets and Liabilities |
| 22 | Statement of Operations |
| 23 | Statement of Changes in Net Assets |
| 25 | Financial Highlights |
| 27 | Notes to Financial Statements |
| 42 | Report of Independent Registered Public Accounting Firm |
| 43 | Important Tax Information |
| 44 | Information About the Renewal of the Fund’s Management Agreement |
| 49 | Board Members Information |
| 51 | Officers of the Fund |
| | FOR MORE INFORMATION |
| | Back Cover |
Dreyfus
Short Term Income Fund
The Fund

A LETTER FROM THE CHAIRMAN AND CEO
Dear Shareholder:
We are pleased to present this annual report for Dreyfus Short Term Income Fund covering the 12-month period from August 1, 2011, through July 31, 2012. For information about how the fund performed during the reporting period, as well as general market perspectives, we provide a Discussion of Fund Performance on the pages that follow.
The bond market proved volatile over the reporting period, as an intensifying European debt crisis and an unprecedented downgrade of long-term U.S. government securities last year triggered a massive flight to perceived safe havens in August and September 2011.Then, favorable U.S. employment data and liquidity enhancements from European policymakers sparked rallies through the first quarter of 2012. However, political developments later raised doubts about some of Europe’s proposed solutions, and U.S. economic data weakened in the spring. Despite these swings in investor sentiment, most bond market sectors produced respectable total rates of return for the reporting period due in part to wide yield spreads based on U.S. Treasury securities, which have been pegged near historically low levels for most of the reporting period.
Although challenges remain overseas, we believe the U.S. economy is likely to maintain positive economic growth while overseas markets contend with growth recessionary environments. In our judgment, current sluggishness is at least partly due to the lagging effects of tighter monetary policies in some areas of the world, and we expect stronger growth when a shift to more accommodative policies begins to have an impact on global economic activity. In addition, the adjustment among U.S. exporters to weaker European demand and slower economic growth in certain emerging markets should be largely completed later this year, potentially setting the stage for a stronger economic rebound in 2013.
As always, we encourage you to discuss our observations with your financial advisor.
Thank you for your continued confidence and support.

Jonathan R. Baum
Chairman and Chief Executive Officer
The Dreyfus Corporation
August 15, 2012
2

DISCUSSION OF FUND PERFORMANCE
For the period of August 1, 2011, through July 31, 2012, as provided by David Horsfall and David Bowser, CFA, Portfolio Managers
Fund and Market Performance Overview
For the 12-month period ended July 31, 2012, Dreyfus Short Term Income Fund’s Class D shares produced a total return of 1.80%, and Class P shares produced a total return of 1.85%.1 In comparison, the fund’s benchmark, the BofA Merrill Lynch 1-5Year Corporate/Government Index (the “Index”), achieved a total return of 2.36% for the same period.2
Mixed economic data sparked heightened turbulence among longer-term bonds over the reporting period, but returns from short-term bonds remained constrained by low short-term interest rates established by the Federal Reserve Board.The fund produced lower returns than its benchmark, as mild shortfalls among inflation-adjusted securities and emerging-markets debt impacted overall performance.
The Fund’s Investment Approach
The fund seeks to maximize total returns consisting of capital appreciation and current income.To pursue its goal, the fund invests at least 80% of its assets in fixed income securities of U.S. and foreign issuers rated investment grade or the unrated equivalent as determined by Dreyfus. This may include U.S. government bonds and notes, corporate bonds, municipal bonds, convertible securities, preferred stocks, inflation-indexed securities, asset-backed securities, mortgage-related securities (including CMOs) and foreign bonds. For additional yield, the fund may invest up to 20% of its assets in fixed-income securities rated below investment grade (“high yield” or “junk” bonds) to as low as Caa/CCC or the unrated equivalent as determined by Dreyfus. The fund will focus primarily on U.S. securities, but may invest up to 30% of its total assets in fixed-income securities of foreign issuers, including those of issuers in emerging markets. Typically, the fund’s portfolio can be expected to have an average effective maturity and an average effective duration of three years or less.
DISCUSSION OF FUND PERFORMANCE (continued)
Macroeconomic Developments Fueled Market Volatility
Just days after the start of the reporting period, financial markets were roiled by the unprecedented downgrade of one rating agency’s assessment of long-term U.S. government securities. This development, together with a worsening sovereign debt crisis in Europe, triggered steep declines among higher yielding market sectors in August and September, while traditional safe havens gained substantial value.
Employment gains and other encouraging U.S. economic news helped alleviate investors’ worries in October, sparking a strong rally among higher yielding bonds. In addition, a quantitative easing program in Europe appeared to forestall a more severe banking crisis in the region. Investors grew more tolerant of risks, and they turned away from traditional safe havens and toward market sectors expected to benefit from better economic conditions. Consequently, asset-backed securities, commercial mortgages and corporate securities rallied through the first quarter of 2012.
However, the U.S. economic recovery was called into question in the spring, when the public sector shed jobs and employment gains in the private sector proved more anemic than expected. Meanwhile, proposed austerity programs to relieve fiscal pressures in Europe encountered political resistance.These headwinds erased some of the gains previously posted by higher yielding bonds, and yields of U.S. Treasury securities plunged to record lows. However, these trends were more pronounced among longer-term securities as yields of short-term bonds were anchored by a historically low federal funds rate.
Higher Yielding Securities Aided Performance
Investors regarded asset-backed securities and commercial mortgage-backed securities as relatively insulated from Europe’s financial troubles, and overweighted exposure to these sectors enabled the fund to participate fully in their strength. In addition, the fund benefited from gains among high yield corporate securities as issuers shored up their balance sheets and default rates remained low. Finally, exposure to the Mexican peso buoyed returns when the currency strengthened along with Mexico’s economy.
These successes were balanced by mild shortfalls in other areas.We established a modest position inTreasury Inflation Protected Securities during
4
the spring of 2012, but these investments lost a degree of value amid disappointing economic data. The fund’s holdings of sovereign bonds from various emerging markets also detracted mildly from relative performance, largely due to concerns regarding slowing growth in Asia.
We generally maintained the fund’s average duration—a measure of sensitivity to changing interest rates—in a range that was slightly shorter than market averages.This strategy, which we implemented through the use of futures contracts on U.S.Treasury securities, had a mildly negative influence on performance. In addition, we used currency forwards to establish the fund’s more successful position in the Mexican peso.
Adjusting to Changing Market Conditions
While we remain concerned regarding ongoing events in Europe, central banks throughout the world have eased their monetary policies, which we expect to boost economic growth rates in the coming months. Therefore, we are prepared to place greater emphasis on yield-oriented securities, which, in our view, should also benefit from robust investor demand in a low interest-rate environment.
August 15, 2012
| |
| | Bond funds are subject generally to interest rate, credit, liquidity and market risks, to varying degrees, |
| | all of which are more fully described in the fund’s prospectus. Generally, all other factors being equal, |
| | bond prices are inversely related to interest-rate changes, and rate increases can cause price declines. |
| | High yield bonds are subject to increased credit risk and are considered speculative in terms of the |
| | issuer’s perceived ability to continue making interest payments on a timely basis and to repay |
| | principal upon maturity. |
| | Investing internationally involves special risk, including changes in currency exchange rates, |
| | political, economic and social instability, a lack of comprehensive company information, differing |
| | auditing and legal standards, and less market liquidity.The fixed income securities of issuers |
| | located in emerging markets can be more volatile and less liquid than those of issuers in more |
| | mature economies. |
| | The fund may use derivative instruments, such as options, futures and options on futures, forward |
| | contracts, swaps (including credit default swaps on corporate bonds and asset-backed securities), |
| | options on swaps and other credit derivatives.A small investment in derivatives could have a |
| | potentially large impact on the fund’s performance.The use of derivatives involves risks different |
| | from, or possibly greater than, the risks associated with investing directly in the underlying assets. |
| 1 | Total return includes reinvestment of dividends and any capital gains paid. Past performance is no |
| | guarantee of future results. Share price, yield and investment return fluctuate such that upon |
| | redemption, fund shares may be worth more or less than their original cost. |
| 2 | SOURCE: LIPPER INC. — Reflects reinvestment of dividends and, where applicable, capital |
| | gain distributions.The BofA Merrill Lynch 1-5Year Corporate/Government Index is a market |
| | value-weighted index that tracks the performance of publicly placed, non-convertible, fixed-rate, |
| | coupon-bearing, investment-grade U.S. domestic debt. Maturities of the securities range from one to |
| | five years. Investors cannot invest directly in any index. |
FUND PERFORMANCE

| |
| † | Source: Lipper Inc. |
| †† | The total return figures presented for Class P shares of the fund reflect the performance of the fund’s Class D shares |
| | for the period prior to 11/1/02 (the inception date for Class P shares). |
| Past performance is not predictive of future performance. |
| The above graph compares a $10,000 investment made in each of the Class D and Class P shares of Dreyfus Short Term |
| Income Fund on 7/31/02 to a $10,000 investment made in the BofA Merrill Lynch 1-5Year Corporate/Government |
| Index (the “Index”) on that date.All dividends and capital gain distributions are reinvested. |
| The fund invests primarily in debt securities and securities with debt-like characteristics of domestic and foreign issuers |
| and maintains an average effective maturity and an average effective duration of three years or less.The Index is an |
| unmanaged performance benchmark including U.S. government and fixed-coupon domestic investment-grade corporate |
| bonds with maturities greater than or equal to one year and less than five years. Unlike a mutual fund, the Index is not |
| subject to charges, fees and other expenses. Investors cannot invest directly in any index. Further information relating to |
| fund performance, including expense reimbursements, if applicable, is contained in the Financial Highlights section of the |
| prospectus and elsewhere in this report. |
6
| | | | | | | |
| Average Annual Total Returns as of 7/31/12 | | | |
| | Inception | | | |
| | Date | 1Year | 5 Years | 10 Years |
| Class D shares | 8/18/92 | 1.80% | 3.42% | 3.00% |
| Class P shares | 11/1/02 | 1.85% | 3.42% | 3.02%† |
| BofA Merrill Lynch 1-5 Year | | | | |
| Corporate/Government Index | | 2.36% | 4.59% | 4.01% |
|
| Past performance is not predictive of future performance.The fund’s performance shown in the graph and table does not |
| reflect the deduction of taxes that a shareholder would pay on fund distributions or the redemption of fund shares. |
| † The total return performance figures presented for Class P shares of the fund reflect the performance of the fund’s |
| Class D shares for the period prior to 11/1/02 (the inception date for Class P shares). |
UNDERSTANDING YOUR FUND’S EXPENSES (Unaudited)
As a mutual fund investor, you pay ongoing expenses, such as management fees and other expenses. Using the information below, you can estimate how these expenses affect your investment and compare them with the expenses of other funds.You also may pay one-time transaction expenses, including sales charges (loads) and redemption fees, which are not shown in this section and would have resulted in higher total expenses. For more information, see your fund’s prospectus or talk to your financial adviser.
Review your fund’s expenses
The table below shows the expenses you would have paid on a $1,000 investment in Dreyfus Short Term Income Fund from February 1, 2012 to July 31, 2012. It also shows how much a $1,000 investment would be worth at the close of the period, assuming actual returns and expenses.
| | | | |
| Expenses and Value of a $1,000 Investment | | |
| assuming actual returns for the six months ended July 31, 2012 | | |
| | | Class D | | Class P |
| Expenses paid per $1,000† | $ | 4.55 | $ | 4.75 |
| Ending value (after expenses) | $ | 1,010.60 | $ | 1,011.40 |
|
| COMPARING YOUR FUND’S EXPENSES |
| WITH THOSE OF OTHER FUNDS (Unaudited) |
Using the SEC’s method to compare expenses
The Securities and Exchange Commission (SEC) has established guidelines to help investors assess fund expenses. Per these guidelines, the table below shows your fund’s expenses based on a $1,000 investment, assuming a hypothetical 5% annualized return. You can use this information to compare the ongoing expenses (but not transaction expenses or total cost) of investing in the fund with those of other funds.All mutual fund shareholder reports will provide this information to help you make this comparison. Please note that you cannot use this information to estimate your actual ending account balance and expenses paid during the period.
| | | | |
| Expenses and Value of a $1,000 Investment | | |
| assuming a hypothetical 5% annualized return for the six months ended July 31, 2012 |
| | | Class D | | Class P |
| Expenses paid per $1,000† | $ | 4.57 | $ | 4.77 |
| Ending value (after expenses) | $ | 1,020.34 | $ | 1,020.14 |
† Expenses are equal to the fund’s annualized expense ratio of .91% for Class D and .95% for Class P, multiplied by the average account value over the period, multiplied by 182/366 (to reflect the one-half year period).
8
|
| STATEMENT OF INVESTMENTS |
| July 31, 2012 |
| | | | | |
| | Coupon | Maturity | Principal | | |
| Bonds and Notes—98.7% | Rate (%) | Date | Amount ($) | | Value ($) |
| Asset-Backed Ctfs./ | | | | | |
| Auto Receivables—6.3% | | | | | |
| Ally Master Owner Trust, | | | | | |
| Ser. 2010-4, Cl. A | 1.32 | 8/15/17 | 780,000 | a | 790,365 |
| AmeriCredit Automobile Receivables | | | | | |
| Trust, Ser. 2012-2, Cl. D | 3.38 | 4/9/18 | 1,200,000 | | 1,232,630 |
| AmeriCredit Automobile Receivables | | | | | |
| Trust, Ser. 2012-1, Cl. D | 4.72 | 3/8/18 | 1,590,000 | | 1,710,759 |
| AmeriCredit Automobile Receivables | | | | | |
| Trust, Ser. 2011-5, Cl. D | 5.05 | 12/8/17 | 1,310,000 | | 1,404,433 |
| AmeriCredit Automobile Receivables | | | | | |
| Trust, Ser. 2010-2, Cl. E | 8.66 | 10/10/17 | 550,000 | b | 612,279 |
| Carmax Auto Owner Trust, | | | | | |
| Ser. 2010-3, Cl. C | 2.59 | 8/15/16 | 450,000 | | 459,776 |
| Carmax Auto Owner Trust, | | | | | |
| Ser. 2010-1, Cl. B | 3.75 | 12/15/15 | 185,000 | | 191,774 |
| Carmax Auto Owner Trust, | | | | | |
| Ser. 2010-2, Cl. B | 3.96 | 6/15/16 | 2,615,000 | | 2,729,923 |
| Chrysler Financial Auto | | | | | |
| Securitization Trust, | | | | | |
| Ser. 2010-A, Cl. D | 3.52 | 8/8/16 | 480,000 | | 483,536 |
| JPMorgan Auto Receivables Trust, | | | | | |
| Ser. 2008-A, Cl. CTFS | 5.22 | 7/15/15 | 242,251 | b | 242,922 |
| Santander Drive Auto Receivables | | | | | |
| Trust, Ser. 2011-S1A, Cl. C | 1.89 | 5/15/17 | 1,249,987 | b | 1,241,941 |
| Santander Drive Auto Receivables | | | | | |
| Trust, Ser. 2010-2, Cl. B | 2.24 | 12/15/14 | 300,000 | | 301,704 |
| Santander Drive Auto Receivables | | | | | |
| Trust, Ser. 2010-3, Cl. C | 3.06 | 11/15/17 | 545,000 | | 553,434 |
| Santander Drive Auto Receivables | | | | | |
| Trust, Ser. 2011-1, Cl. C | 3.11 | 5/16/16 | 1,275,000 | | 1,286,972 |
| Santander Drive Auto Receivables | | | | | |
| Trust, Ser. 2012-3, Cl. D | 3.64 | 5/15/18 | 820,000 | | 836,065 |
| Santander Drive Auto Receivables | | | | | |
| Trust, Ser. 2012-1, Cl. C | 3.78 | 11/15/17 | 285,000 | | 294,695 |
| Santander Drive Auto Receivables | | | | | |
| Trust, Ser. 2011-4, Cl. D | 4.74 | 9/15/17 | 620,000 | | 654,653 |
| SMART Trust, | | | | | |
| Ser. 2011-1USA, Cl. A3B | 1.10 | 10/14/14 | 794,193 | a,b | 795,636 |
| | | | | | 15,823,497 |
STATEMENT OF INVESTMENTS (continued)
| | | | | |
| | Coupon | Maturity | Principal | | |
| Bonds and Notes (continued) | Rate (%) | Date | Amount ($) | | Value ($) |
| Asset-Backed Ctfs./ | | | | | |
| Credit Cards—1.0% | | | | | |
| Citibank Omni Master Trust, | | | | | |
| Ser. 2009-A14A, Cl. A14 | 3.00 | 8/15/18 | 2,400,000 | a,b | 2,516,845 |
| Asset-Backed Ctfs./Equipment—.8% | | | | | |
| CNH Equipment Trust, | | | | | |
| Ser. 2011-A, Cl. A4 | 2.04 | 10/17/16 | 1,850,000 | | 1,907,340 |
| Asset-Backed Ctfs./ | | | | | |
| Home Equity Loans—1.2% | | | | | |
| AH Mortgage Advance Trust, | | | | | |
| Ser. SART-3, Cl. 1A1 | 2.98 | 3/13/43 | 1,000,000 | b | 1,007,804 |
| Ameriquest Mortgage Securities, | | | | | |
| Ser. 2003-11, Cl. AF6 | 5.64 | 12/25/33 | 575,984 | a | 575,721 |
| Bayview Financial Acquisition | | | | | |
| Trust, Ser. 2005-B, Cl. 1A6 | 5.21 | 4/28/39 | 881,805 | a | 867,184 |
| Carrington Mortgage Loan Trust, | | | | | |
| Ser. 2005-NC5, Cl. A2 | 0.57 | 10/25/35 | 190,445 | a | 184,368 |
| Citicorp Residential Mortgage | | | | | |
| Securities, Ser. 2006-1, Cl. A3 | 5.71 | 7/25/36 | 42,592 | a | 42,627 |
| Credit-Based Asset Servicing | | | | | |
| and Securitization, | | | | | |
| Ser. 2002-CB3, Cl. M2 | 2.12 | 6/25/32 | 288,831 | a | 288,597 |
| | | | | | 2,966,301 |
| Casinos—.2% | | | | | |
| Ameristar Casinos, | | | | | |
| Gtd. Notes | 7.50 | 4/15/21 | 550,000 | c | 595,375 |
| Commercial Mortgage | | | | | |
| Pass-Through Ctfs.—3.4% | | | | | |
| Banc of America Commercial | | | | | |
| Mortgage, Ser. 2005-6, Cl. A4 | 5.19 | 9/10/47 | 895,000 | a | 1,006,837 |
| Banc of America Merrill Lynch | | | | | |
| Commercial Mortgage, | | | | | |
| Ser. 2004-6, Cl. A5 | 4.81 | 12/10/42 | 85,000 | | 91,411 |
| Bear Stearns Commercial Mortgage | | | | | |
| Securities, Ser. 2007-T26, Cl. A4 | 5.47 | 1/12/45 | 600,000 | a | 697,701 |
| Bear Stearns Commercial Mortgage | | | | | |
| Securities, Ser. 2006-PW12, | | | | | |
| Cl. AAB | 5.69 | 9/11/38 | 290,897 | a | 298,225 |
10
| | | | | |
| | Coupon | Maturity | Principal | | |
| Bonds and Notes (continued) | Rate (%) | Date | Amount ($) | | Value ($) |
| Commercial Mortgage | | | | | |
| Pass-Through Ctfs. (continued) | | | | | |
| Bear Stearns Commercial | | | | | |
| Mortgage Securities, | | | | | |
| Ser. 2007-PW17, Cl. AAB | 5.70 | 6/11/50 | 1,150,000 | | 1,225,875 |
| Citigroup Commercial Mortgage | | | | | |
| Trust, Ser. 2007-C6, Cl. A4 | 5.70 | 12/10/49 | 825,000 | a | 965,205 |
| GS Mortgage Securities Corporation | | | | | |
| II, Ser. 2007-EOP, Cl. B | 1.73 | 3/6/20 | 1,630,000 | a,b | 1,610,796 |
| GS Mortgage Securities Corporation | | | | | |
| II, Ser. 2007-EOP, Cl. F | 2.63 | 3/6/20 | 730,000 | a,b | 722,582 |
| GS Mortgage Securities Corporation | | | | | |
| II, Ser. 2007-EOP, Cl. K | 4.80 | 3/6/20 | 350,000 | a,b | 349,471 |
| JP Morgan Chase Commercial | | | | | |
| Mortgage Securities, | | | | | |
| Ser. 2006-CB14, Cl. ASB | 5.51 | 12/12/44 | 232,121 | a | 245,692 |
| JP Morgan Chase Commercial | | | | | |
| Mortgage Securities, | | | | | |
| Ser. 2007-CB20, Cl. AM | 5.88 | 2/12/51 | 645,000 | a | 700,131 |
| Morgan Stanley Capital I, | | | | | |
| Ser. 2005-HQ7, Cl. A4 | 5.21 | 11/14/42 | 475,000 | a | 530,808 |
| Morgan Stanley | | | | | |
| Dean Witter Capital I, | | | | | |
| Ser. 2001-TOP3, Cl. A4 | 6.39 | 7/15/33 | 37,675 | | 37,646 |
| | | | | | 8,482,380 |
| Consumer Discretionary—2.3% | | | | | |
| Cablevision Systems, | | | | | |
| Sr. Unscd. Notes | 7.75 | 4/15/18 | 570,000 | | 622,725 |
| Comcast, | | | | | |
| Gtd. Notes | 5.90 | 3/15/16 | 655,000 | | 761,303 |
| Cox Communications, | | | | | |
| Sr. Unscd. Notes | 6.25 | 6/1/18 | 650,000 | b | 776,649 |
| Dish DBS, | | | | | |
| Gtd. Notes | 5.88 | 7/15/22 | 625,000 | b | 646,875 |
| Hanesbrands, | | | | | |
| Gtd. Notes | 6.38 | 12/15/20 | 600,000 | | 644,250 |
| NBC Universal Media, | | | | | |
| Sr. Unscd. Notes | 3.65 | 4/30/15 | 700,000 | | 748,757 |
STATEMENT OF INVESTMENTS (continued)
| | | | | |
| | Coupon | Maturity | Principal | | |
| Bonds and Notes (continued) | Rate (%) | Date | Amount ($) | | Value ($) |
| Consumer Discretionary (continued) | | | | | |
| Staples, | | | | | |
| Gtd. Notes | 9.75 | 1/15/14 | 405,000 | | 451,344 |
| Time Warner Cable, | | | | | |
| Gtd. Notes | 5.85 | 5/1/17 | 550,000 | | 652,993 |
| Time Warner, | | | | | |
| Gtd. Notes | 3.40 | 6/15/22 | 370,000 | | 391,143 |
| | | | | | 5,696,039 |
| Consumer Staples—.9% | | | | | |
| Kraft Foods, | | | | | |
| Sr. Unscd. Notes | 6.13 | 2/1/18 | 530,000 | | 649,968 |
| Pernod-Ricard, | | | | | |
| Sr. Unscd. Notes | 2.95 | 1/15/17 | 650,000 | b | 671,336 |
| SABMiller Holdings, | | | | | |
| Gtd. Notes | 2.45 | 1/15/17 | 1,000,000 | b | 1,042,852 |
| | | | | | 2,364,156 |
| Energy—2.9% | | | | | |
| Anadarko Petroleum, | | | | | |
| Sr. Unscd. Notes | 6.38 | 9/15/17 | 1,015,000 | | 1,218,868 |
| EQT, | | | | | |
| Sr. Unscd. Notes | 8.13 | 6/1/19 | 215,000 | | 259,447 |
| Hess, | | | | | |
| Sr. Unscd. Notes | 8.13 | 2/15/19 | 505,000 | | 663,649 |
| Meg Energy, | | | | | |
| Gtd. Notes | 6.38 | 1/30/23 | 650,000 | b | 666,250 |
| Petroleos Mexicanos, | | | | | |
| Gtd. Notes | 4.88 | 1/24/22 | 600,000 | b | 678,000 |
| Plains All American Pipeline, | | | | | |
| Gtd. Notes | 5.75 | 1/15/20 | 565,000 | | 674,063 |
| Plains All American Pipeline, | | | | | |
| Gtd. Notes | 6.13 | 1/15/17 | 1,175,000 | | 1,374,253 |
| Spectra Energy Partners, | | | | | |
| Sr. Unscd. Notes | 2.95 | 6/15/16 | 595,000 | | 607,632 |
| Unit, | | | | | |
| Gtd. Notes | 6.63 | 5/15/21 | 640,000 | b | 638,400 |
| Williams Partners, | | | | | |
| Sr. Unscd. Notes | 4.00 | 11/15/21 | 450,000 | | 481,875 |
| | | | | | 7,262,437 |
12
| | | | | |
| | Coupon | Maturity | Principal | | |
| Bonds and Notes (continued) | Rate (%) | Date | Amount ($) | | Value ($) |
| Financial—19.4% | | | | | |
| Ally Financial, | | | | | |
| Gtd. Notes | 4.63 | 6/26/15 | 1,200,000 | | 1,238,939 |
| Ally Financial, | | | | | |
| Gtd. Notes | 5.50 | 2/15/17 | 1,285,000 | | 1,340,010 |
| American Express, | | | | | |
| Sr. Unscd. Notes | 7.25 | 5/20/14 | 575,000 | | 638,906 |
| American International Group, | | | | | |
| Sr. Unscd. Notes | 3.65 | 1/15/14 | 190,000 | | 194,774 |
| American International Group, | | | | | |
| Sr. Unscd. Notes | 6.40 | 12/15/20 | 75,000 | | 87,892 |
| Ameriprise Financial, | | | | | |
| Jr. Sub. Notes | 7.52 | 6/1/66 | 212,000 | a | 230,868 |
| AON, | | | | | |
| Gtd. Notes | 3.50 | 9/30/15 | 695,000 | | 729,683 |
| Bank of America, | | | | | |
| Sr. Unscd. Notes, Ser. 1 | 3.75 | 7/12/16 | 3,310,000 | | 3,431,298 |
| Bank of America, | | | | | |
| Sr. Unscd. Notes | 4.50 | 4/1/15 | 460,000 | | 483,590 |
| Boston Properties, | | | | | |
| Sr. Unscd. Notes | 3.70 | 11/15/18 | 595,000 | | 635,382 |
| Cellco Partnership/Verizon | | | | | |
| Wireless Capital, | | | | | |
| Sr. Unscd. Notes | 8.50 | 11/15/18 | 465,000 | | 648,550 |
| CIT Group, | | | | | |
| Sr. Unscd. Notes | 5.00 | 5/15/17 | 555,000 | | 580,322 |
| CIT Group, | | | | | |
| Sr. Unscd. Notes | 5.00 | 8/15/22 | 330,000 | | 330,000 |
| Citigroup, | | | | | |
| Sr. Unscd. Notes | 4.45 | 1/10/17 | 3,590,000 | | 3,839,771 |
| Citigroup, | | | | | |
| Sr. Unscd. Notes | 4.50 | 1/14/22 | 660,000 | | 695,567 |
| Citigroup, | | | | | |
| Sr. Unscd. Notes | 4.75 | 5/19/15 | 560,000 | | 593,551 |
| DDR, | | | | | |
| Sr. Unscd. Notes | 4.75 | 4/15/18 | 650,000 | | 692,593 |
| Discover Financial Services, | | | | | |
| Notes | 5.20 | 4/27/22 | 1,825,000 | b | 1,950,644 |
STATEMENT OF INVESTMENTS (continued)
| | | | | |
| | Coupon | Maturity | Principal | | |
| Bonds and Notes (continued) | Rate (%) | Date | Amount ($) | | Value ($) |
| Financial (continued) | | | | | |
| Duke Realty, | | | | | |
| Sr. Unscd. Notes | 6.75 | 3/15/20 | 55,000 | | 66,592 |
| Duke Realty, | | | | | |
| Sr. Unscd. Notes | 8.25 | 8/15/19 | 495,000 | | 629,299 |
| Erac USA Finance, | | | | | |
| Gtd. Notes | 5.90 | 11/15/15 | 1,100,000 | b | 1,233,212 |
| ERP Operating, | | | | | |
| Sr. Unscd. Notes | 5.75 | 6/15/17 | 230,000 | | 271,423 |
| Federal Realty | | | | | |
| Investment Trust, | | | | | |
| Sr. Unscd. Bonds | 5.65 | 6/1/16 | 345,000 | | 386,136 |
| Ford Motor Credit, | | | | | |
| Sr. Unscd. Notes | 3.88 | 1/15/15 | 1,750,000 | | 1,813,070 |
| Ford Motor Credit, | | | | | |
| Sr. Unscd. Notes | 4.21 | 4/15/16 | 695,000 | b | 720,145 |
| Ford Motor Credit, | | | | | |
| Sr. Unscd. Notes | 5.00 | 5/15/18 | 340,000 | | 363,241 |
| General Electric Capital, | | | | | |
| Sr. Unscd. Notes | 2.30 | 4/27/17 | 975,000 | | 997,816 |
| General Electric Capital, | | | | | |
| Sr. Unscd. Notes | 3.35 | 10/17/16 | 950,000 | | 1,017,261 |
| Goldman Sachs Group, | | | | | |
| Sr. Unscd. Notes | 3.63 | 2/7/16 | 680,000 | | 696,527 |
| Goldman Sachs Group, | | | | | |
| Sr. Unscd. Notes | 5.75 | 1/24/22 | 405,000 | | 443,207 |
| Harley-Davidson Funding, | | | | | |
| Gtd. Notes | 5.75 | 12/15/14 | 1,080,000 | b | 1,169,893 |
| Hartford Financial | | | | | |
| Services Group, | | | | | |
| Sr. Unscd. Notes | 4.00 | 10/15/17 | 600,000 | | 616,940 |
| Healthcare Realty Trust, | | | | | |
| Sr. Unscd. Notes | 5.13 | 4/1/14 | 630,000 | | 658,361 |
| HSBC Holdings, | | | | | |
| Sr. Unscd. Notes | 4.00 | 3/30/22 | 905,000 | | 970,550 |
| Hyundai Capital Services, | | | | | |
| Sr. Unscd. Notes | 4.38 | 7/27/16 | 400,000 | b | 423,962 |
| International Lease Finance, | | | | | |
| Sr. Unscd. Notes | 5.75 | 5/15/16 | 325,000 | | 340,108 |
| International Lease Finance, | | | | | |
| Sr. Unscd. Notes | 6.63 | 11/15/13 | 535,000 | | 561,750 |
14
| | | | | |
| | Coupon | Maturity | Principal | | |
| Bonds and Notes (continued) | Rate (%) | Date | Amount ($) | | Value ($) |
| Financial (continued) | | | | | |
| Invesco, | | | | | |
| Gtd. Notes | 5.38 | 2/27/13 | 380,000 | | 389,413 |
| JPMorgan Chase & Co., | | | | | |
| Sr. Unscd. Notes | 4.50 | 1/24/22 | 1,780,000 | | 1,976,286 |
| Korea Finance, | | | | | |
| Sr. Unscd. Notes | 2.25 | 8/7/17 | 1,200,000 | | 1,191,012 |
| Liberty Mutual Group, | | | | | |
| Gtd. Notes | 4.95 | 5/1/22 | 565,000 | b | 579,683 |
| MetLife Institutional Funding II, | | | | | |
| Scd. Notes | 1.36 | 4/4/14 | 1,200,000 | a,b | 1,207,405 |
| MetLife, | | | | | |
| Sr. Unscd. Notes | 7.72 | 2/15/19 | 500,000 | | 647,755 |
| Morgan Stanley, | | | | | |
| Sr. Unscd. Notes | 3.80 | 4/29/16 | 650,000 | | 644,338 |
| Morgan Stanley, | | | | | |
| Sr. Unscd. Notes | 4.10 | 1/26/15 | 660,000 | | 668,307 |
| PNC Bank, | | | | | |
| Sub. Notes | 6.88 | 4/1/18 | 600,000 | | 731,646 |
| Prudential Financial, | | | | | |
| Sr. Unscd. Notes | 3.00 | 5/12/16 | 1,715,000 | | 1,785,161 |
| Prudential Financial, | | | | | |
| Sr. Unscd. Notes | 4.75 | 9/17/15 | 365,000 | | 399,114 |
| Royal Bank of Scotland, | | | | | |
| Sub. Notes | 9.50 | 3/16/22 | 1,210,000 | a,c | 1,304,069 |
| Simon Property Group, | | | | | |
| Sr. Unscd. Notes | 4.20 | 2/1/15 | 930,000 | | 988,525 |
| Simon Property Group, | | | | | |
| Sr. Unscd. Notes | 5.88 | 3/1/17 | 443,000 | | 518,533 |
| US Bancorp, | | | | | |
| Sub. Notes | 2.95 | 7/15/22 | 805,000 | | 815,702 |
| WEA Finance, | | | | | |
| Gtd. Notes | 7.13 | 4/15/18 | 660,000 | b | 787,429 |
| WEA Finance, | | | | | |
| Gtd. Notes | 7.50 | 6/2/14 | 320,000 | b | 349,259 |
| Willis North America, | | | | | |
| Gtd. Notes | 6.20 | 3/28/17 | 615,000 | | 694,936 |
| Willis North America, | | | | | |
| Gtd. Notes | 7.00 | 9/29/19 | 1,360,000 | | 1,605,628 |
| | | | | | 49,006,034 |
STATEMENT OF INVESTMENTS (continued)
| | | | | |
| | Coupon | Maturity | Principal | | |
| Bonds and Notes (continued) | Rate (%) | Date | Amount ($) | | Value ($) |
| Health Care—1.0% | | | | | |
| Express Scripts Holding, | | | | | |
| Gtd. Notes | 2.65 | 2/15/17 | 760,000 | b | 780,572 |
| Express Scripts Holding, | | | | | |
| Gtd. Notes | 3.50 | 11/15/16 | 495,000 | b | 525,492 |
| Gilead Sciences, | | | | | |
| Sr. Unscd. Notes | 3.05 | 12/1/16 | 750,000 | | 803,349 |
| HCA, | | | | | |
| Sr. Scd. Notes | 5.88 | 3/15/22 | 445,000 | | 481,156 |
| | | | | | 2,590,569 |
| Industrial—.5% | | | | | |
| Calpine, | | | | | |
| Sr. Scd. Notes | 7.88 | 1/15/23 | 240,000 | b | 274,200 |
| Waste Management, | | | | | |
| Gtd. Notes | 6.38 | 3/11/15 | 725,000 | | 819,649 |
| Xerox, | | | | | |
| Sr. Unscd. Notes | 5.63 | 12/15/19 | 215,000 | | 239,630 |
| | | | | | 1,333,479 |
| Information Technology—.2% | | | | | |
| Hewlett-Packard, | | | | | |
| Sr. Unscd. Notes | 2.20 | 12/1/15 | 405,000 | | 410,665 |
| Materials—2.3% | | | | | |
| ArcelorMittal, | | | | | |
| Sr. Unscd. Notes | 6.25 | 2/25/22 | 250,000 | c | 250,969 |
| Dow Chemical, | | | | | |
| Sr. Unscd. Notes | 4.13 | 11/15/21 | 590,000 | | 651,266 |
| Ecolab, | | | | | |
| Sr. Unscd. Notes | 3.00 | 12/8/16 | 600,000 | | 640,293 |
| El Paso, | | | | | |
| Sr. Unscd. Notes | 7.25 | 6/1/18 | 600,000 | | 695,108 |
| Georgia-Pacific, | | | | | |
| Gtd. Notes | 8.25 | 5/1/16 | 860,000 | b | 933,939 |
| Kinder Morgan Energy Partners, | | | | | |
| Sr. Unscd. Notes | 5.63 | 2/15/15 | 910,000 | | 1,003,562 |
| Teck Resources, | | | | | |
| Sr. Scd. Notes | 10.25 | 5/15/16 | 850,000 | | 939,991 |
| Vale Overseas, | | | | | |
| Gtd. Notes | 4.38 | 1/11/22 | 650,000 | | 682,648 |
| | | | | | 5,797,776 |
16
| | | | | |
| | Coupon | Maturity | Principal | | |
| Bonds and Notes (continued) | Rate (%) | Date | Amount ($) | | Value ($) |
| Residential Mortgage | | | | | |
| Pass-Through Ctfs.—.2% | | | | | |
| CS First Boston Mortgage | | | | | |
| Securities, Ser. 2004-7, Cl. 6A1 | 5.25 | 10/25/19 | 308,078 | | 313,489 |
| GSR Mortgage Loan Trust, | | | | | |
| Ser. 2004-12, Cl. 2A2 | 2.54 | 12/25/34 | 226,347 | a | 196,272 |
| | | | | | 509,761 |
| Telecommunications—.5% | | | | | |
| AT&T, | | | | | |
| Sr. Unscd. Notes | 2.50 | 8/15/15 | 650,000 | | 685,356 |
| Verizon Communications, | | | | | |
| Sr. Unscd. Notes | 2.00 | 11/1/16 | 625,000 | | 651,118 |
| | | | | | 1,336,474 |
| U.S. Government Agencies—10.5% | | | | | |
| Federal Home Loan Mortgage Corp., | | | | | |
| Notes | 1.25 | 8/1/19 | 6,450,000 | d | 6,447,781 |
| Federal Home Loan Mortgage Corp., | | | | | |
| Notes | 4.88 | 11/15/13 | 11,625,000 | d | 12,329,115 |
| Federal National Mortgage | | | | | |
| Association, Notes | 0.88 | 8/28/17 | 5,100,000 | d | 5,106,854 |
| Federal National Mortgage | | | | | |
| Association, Notes | 1.50 | 6/26/13 | 2,475,000 | d | 2,504,344 |
| | | | | | 26,388,094 |
| U.S. Government Agencies/ | | | | | |
| Mortgage-Backed—2.1% | | | | | |
| Federal Home Loan Mortgage Corp.: | | | | | |
| 6.50%, 6/1/32 | | | 1,459 | d | 1,700 |
| Stripped Security, Interest Only Class, | | | | | |
| REMIC, Ser. 1987, Cl. PI, | | | | | |
| 7.00%, 9/15/12 | | | 282 | d,e | 1 |
| Federal National Mortgage Association: | | | | | |
| 3.00% | | | 2,425,000 | d,f | 2,516,695 |
| 3.50% | | | 2,370,000 | d,f | 2,509,238 |
| Gtd. Pass-Through Ctfs., REMIC, | | | | | |
| Ser. 2003-49, Cl. JE, 3.00%, 4/25/33 | | 196,811 | d | 205,289 |
| Government National Mortgage Association II: | | | | |
| 7.00%, 12/20/30—4/20/31 | | | 11,886 | | 14,433 |
| 7.50%, 11/20/29—12/20/30 | | | 13,094 | | 16,110 |
| | | | | | 5,263,466 |
|
| STATEMENT OF INVESTMENTS (continued) |
| | | | | |
| | Coupon | Maturity | Principal | | |
| Bonds and Notes (continued) | Rate (%) | Date | Amount ($) | | Value ($) |
| U.S. Government Securities—42.1% | | | | | |
| U.S. Treasury Notes: | | | | | |
| 1.25%, 4/15/14 | | | 6,735,000 | c | 6,852,863 |
| 1.38%, 9/15/12 | | | 31,235,000 | c | 31,287,475 |
| 1.75%, 4/15/13 | | | 6,940,000 | | 7,017,804 |
| 2.13%, 5/31/15 | | | 47,880,000 | c | 50,371,244 |
| 2.38%, 7/31/17 | | | 1,165,000 | | 1,265,755 |
| 3.63%, 5/15/13 | | | 9,105,000 | c | 9,352,902 |
| | | | | | 106,148,043 |
| Utilities—.9% | | | | | |
| Duke Energy Carolinas, | | | | | |
| First Mortgage Bonds | 5.10 | 4/15/18 | 800,000 | c | 950,883 |
| National Grid, | | | | | |
| Sr. Unscd. Notes | 6.30 | 8/1/16 | 724,000 | | 839,262 |
| Sempra Energy, | | | | | |
| Sr. Unscd. Notes | 6.50 | 6/1/16 | 435,000 | | 517,894 |
| | | | | | 2,308,039 |
| Total Bonds and Notes | | | | | |
| (cost $245,222,805) | | | | | 248,706,770 |
| |
| Short-Term Investments—2.1% | | | | | |
| U.S. Treasury Bills: | | | | | |
| 0.08%, 9/13/12 | | | 5,040,000 | | 5,039,592 |
| 0.09%, 8/16/12 | | | 200,000 | g | 199,997 |
| Total Short-Term Investments | | | | | |
| (cost $5,239,510) | | | | | 5,239,589 |
| |
| Other Investment—.4% | | | Shares | | Value ($) |
| Registered Investment Company; | | | | | |
| Dreyfus Institutional Preferred | | | | | |
| Plus Money Market Fund | | | | | |
| (cost $990,548) | | | 990,548 | h | 990,548 |
18
| | | | |
| Investment of Cash Collateral | | |
| for Securities Loaned—.5% | Shares | Value ($) |
| Registered Investment Company; | | |
| Dreyfus Institutional Cash Advantage Fund | | |
| (cost $1,256,078) | 1,256,078h | 1,256,078 |
| |
| Total Investments (cost $252,708,941) | 101.7% | 256,192,985 |
| Liabilities, Less Cash and Receivables | (1.7%) | (4,189,473) |
| Net Assets | 100.0% | 252,003,512 |
|
| REMIC—Real Estate Mortgage Investment Conduit |
| a Variable rate security—interest rate subject to periodic change. |
| b Securities exempt from registration pursuant to Rule 144A under the Securities Act of 1933.These securities may be |
| resold in transactions exempt from registration, normally to qualified institutional buyers.At July 31, 2012, these |
| securities were valued at $25,156,473 or 10.0% of net assets. |
| c Security, or portion thereof, on loan.At July 31, 2012, the value of the fund’s securities on loan was $57,475,636 |
| and the value of the collateral held by the fund was $82,147,584, consisting of cash collateral of $1,256,078 and |
| U.S Government & Agency securities valued at $80,891,506. |
| d The Federal Housing Finance Agency (“FHFA”) placed Federal Home Loan Mortgage Corporation and Federal |
| National Mortgage Association into conservatorship with FHFA as the conservator.As such, the FHFA oversees the |
| continuing affairs of these companies. |
| e Notional face amount shown. |
| f Purchased on a forward commitment basis. |
| g Held by or on behalf of a counterparty for open financial futures positions. |
| h Investment in affiliated money market mutual fund. |
| | | |
| Portfolio Summary (Unaudited)† | | |
| |
| | Value (%) | | Value (%) |
| U.S. Government & Agencies | 54.7 | Short-Term/ | |
| Corporate Bonds | 31.1 | Money Market Investments | 3.0 |
| Asset/Mortgage-Backed | 12.9 | | 101.7 |
| |
| † Based on net assets. | | | |
| See notes to financial statements. | | | |
|
| STATEMENT OF FINANCIAL FUTURES |
| July 31, 2012 |
| | | | | | |
| | | | | | Unrealized |
| | | Market Value | | | Appreciation |
| | | Covered by | | | (Depreciation) |
| | Contracts | Contracts ($) | | Expiration | at 7/31/2012($) |
| Financial Futures Long | | | | | |
| U.S. Treasury 2 Year Notes | 258 | 56,916,413 | | September 2012 | 97,444 |
| Financial Futures Short | | | | | |
| U.S. Treasury 10 Year Notes | 259 | (34,875,969 | ) | September 2012 | (125,617) |
| Gross Unrealized Appreciation | | | | | 97,444 |
| Gross Unrealized Depreciation | | | | | (125,617) |
| |
| See notes to financial statements. | | | | | |
20
|
| STATEMENT OF ASSETS AND LIABILITIES |
| July 31, 2012 |
| | | |
| | Cost | Value |
| Assets ($): | | |
| Investments in securities—See Statement of Investments (including | | |
| securities on loan, valued at $57,475,636)—Note 1(c): | | |
| Unaffiliated issuers | 250,462,315 | 253,946,359 |
| Affiliated issuers | 2,246,626 | 2,246,626 |
| Cash | | 170,661 |
| Receivable for investment securities sold | | 23,972,308 |
| Dividends, interest and securities lending income receivable | | 1,511,131 |
| Receivable for shares of Common Stock subscribed | | 91,775 |
| Unrealized appreciation on forward foreign | | |
| currency exchange contracts—Note 4 | | 70,487 |
| Prepaid expenses | | 25,832 |
| | | 282,035,179 |
| Liabilities ($): | | |
| Due to The Dreyfus Corporation and affiliates—Note 3(c) | | 183,253 |
| Payable for investment securities purchased | | 28,317,919 |
| Liability for securities on loan—Note 1(c) | | 1,256,078 |
| Payable for shares of Common Stock redeemed | | 182,058 |
| Payable for futures variation margin—Note 4 | | 13,509 |
| Accrued expenses | | 78,850 |
| | | 30,031,667 |
| Net Assets ($) | | 252,003,512 |
| Composition of Net Assets ($): | | |
| Paid-in capital | | 309,797,431 |
| Accumulated undistributed investment income—net | | 598,795 |
| Accumulated net realized gain (loss) on investments | | (61,919,072) |
| Accumulated net unrealized appreciation (depreciation) on | | |
| investments and foreign currency transactions [including | | |
| ($28,173) net unrealized (depreciation) on financial futures] | | 3,526,358 |
| Net Assets ($) | | 252,003,512 |
| |
| |
| Net Asset Value Per Share | | |
| | Class D | Class P |
| Net Assets ($) | 250,850,194 | 1,153,318 |
| Shares Outstanding | 23,390,242 | 107,417 |
| Net Asset Value Per Share ($) | 10.72 | 10.74 |
| |
| See notes to financial statements. | | |
|
| STATEMENT OF OPERATIONS |
| Year Ended July 31, 2012 |
| | |
| Investment Income ($): | |
| Income: | |
| Interest | 5,731,525 |
| Income from securities lending—Note 1(c) | 47,627 |
| Dividends; | |
| Affiliated issuers | 2,105 |
| Total Income | 5,781,257 |
| Expenses: | |
| Management fee—Note 3(a) | 1,294,966 |
| Shareholder servicing costs—Note 3(c) | 832,873 |
| Professional fees | 65,225 |
| Registration fees | 40,863 |
| Custodian fees—Note 3(c) | 25,179 |
| Prospectus and shareholders’ reports | 24,772 |
| Directors’ fees and expenses—Note 3(d) | 10,447 |
| Distribution fees—Note 3(b) | 2,481 |
| Loan commitment fees—Note 2 | 2,260 |
| Miscellaneous | 47,908 |
| Total Expenses | 2,346,974 |
| Less—reduction in fees due to earnings credits—Note 3(c) | (323) |
| Net Expenses | 2,346,651 |
| Investment Income—Net | 3,434,606 |
| Realized and Unrealized Gain (Loss) on Investments—Note 4 ($): | |
| Net realized gain (loss) on investments and foreign currency transactions | 5,236,527 |
| Net realized gain (loss) on financial futures | (1,956,577) |
| Net realized gain (loss) on forward foreign currency exchange contracts | (70,177) |
| Net Realized Gain (Loss) | 3,209,773 |
| Net unrealized appreciation (depreciation) on investments | (2,155,323) |
| Net unrealized appreciation (depreciation) on financial futures | 208,577 |
| Net unrealized appreciation (depreciation) on | |
| forward foreign currency exchange contracts | 70,487 |
| Net Unrealized Appreciation (Depreciation) | (1,876,259) |
| Net Realized and Unrealized Gain (Loss) on Investments | 1,333,514 |
| Net Increase in Net Assets Resulting from Operations | 4,768,120 |
| |
| See notes to financial statements. | |
22
STATEMENT OF CHANGES IN NET ASSETS
| | | | |
| | | Year Ended July 31, |
| | 2012a | 2011 |
| Operations ($): | | |
| Investment income—net | 3,434,606 | 5,415,184 |
| Net realized gain (loss) on investments | 3,209,773 | 3,349,128 |
| Net unrealized appreciation | | |
| (depreciation) on investments | (1,876,259) | (2,106,649) |
| Net Increase (Decrease) in Net Assets | | |
| Resulting from Operations | 4,768,120 | 6,657,663 |
| Dividends to Shareholders from ($): | | |
| Investment income—net: | | |
| Class B Shares | (7,301) | (34,530) |
| Class D Shares | (5,539,247) | (7,194,431) |
| Class P Shares | (24,349) | (36,344) |
| Total Dividends | (5,570,897) | (7,265,305) |
| Capital Stock Transactions ($): | | |
| Net proceeds from shares sold: | | |
| Class B Shares | 27,663 | 286,719 |
| Class D Shares | 56,357,564 | 79,385,280 |
| Class P Shares | 243,970 | 54,613 |
| Dividends reinvested: | | |
| Class B Shares | 6,646 | 33,426 |
| Class D Shares | 4,909,602 | 6,216,510 |
| Class P Shares | 13,042 | 26,578 |
| Cost of shares redeemed: | | |
| Class B Shares | (979,617) | (1,377,440) |
| Class D Shares | (71,273,055) | (79,606,719) |
| Class P Shares | (148,110) | (508,940) |
| Increase (Decrease) in Net Assets | | |
| from Capital Stock Transactions | (10,842,295) | 4,510,027 |
| Total Increase (Decrease) in Net Assets | (11,645,072) | 3,902,385 |
| Net Assets ($): | | |
| Beginning of Period | 263,648,584 | 259,746,199 |
| End of Period | 252,003,512 | 263,648,584 |
| Undistributed investment income—net | 598,795 | 88,903 |
STATEMENT OF CHANGES IN NET ASSETS (continued)
| | | | |
| | | Year Ended July 31, |
| | 2012a | 2011 |
| Capital Share Transactions: | | |
| Class Bb | | |
| Shares sold | 2,602 | 26,660 |
| Shares issued for dividends reinvested | 624 | 3,103 |
| Shares redeemed | (91,614) | (128,079) |
| Net Increase (Decrease) in Shares Outstanding | (88,388) | (98,316) |
| Class Db | | |
| Shares sold | 5,271,729 | 7,363,226 |
| Shares issued for dividends reinvested | 459,215 | 576,526 |
| Shares redeemed | (6,668,756) | (7,387,550) |
| Net Increase (Decrease) in Shares Outstanding | (937,812) | 552,202 |
| Class P | | |
| Shares sold | 22,794 | 5,048 |
| Shares issued for dividends reinvested | 1,218 | 2,461 |
| Shares redeemed | (13,837) | (47,187) |
| Net Increase (Decrease) in Shares Outstanding | 10,175 | (39,678) |
| |
| a | Effective as of the close of business on March 13, 2012, the fund no longer offers Class B shares. |
| b | During the period ended July 31, 2012, 32,512 Class B shares representing $348,357 were automatically |
| | converted to 32,571 Class D shares and during the period ended July 31, 2011, 22,558 Class B shares |
| | representing $243,276 were automatically converted to 22,534 Class D shares. |
| See notes to financial statements. |
24
FINANCIAL HIGHLIGHTS
The following tables describe the performance for each share class for the fiscal periods indicated.All information (except portfolio turnover rate) reflects financial results for a single fund share.Total return shows how much your investment in the fund would have increased (or decreased) during each period, assuming you had reinvested all dividends and distributions.These figures have been derived from the fund’s financial statements.
| | | | | | | | | | |
| | | Year Ended July 31, | |
| Class D Shares | 2012 | 2011 | 2010 | 2009 | 2008 |
| Per Share Data ($): | | | | | |
| Net asset value, beginning of period | 10.76 | 10.78 | 10.34 | 10.33 | 10.81 |
| Investment Operations: | | | | | |
| Investment income—neta | .14 | .23 | .32 | .42 | .46 |
| Net realized and unrealized | | | | | |
| gain (loss) on investments | .05 | .06 | .51 | .03 | (.45) |
| Total from Investment Operations | .19 | .29 | .83 | .45 | .01 |
| Distributions: | | | | | |
| Dividends from investment income—net | (.23) | (.31) | (.39) | (.44) | (.48) |
| Dividends from net realized | | | | | |
| gain on investments | — | — | — | — | (.01) |
| Total Distributions | (.23) | (.31) | (.39) | (.44) | (.49) |
| Net asset value, end of period | 10.72 | 10.76 | 10.78 | 10.34 | 10.33 |
| Total Return (%) | 1.80 | 2.67 | 8.12 | 4.66 | .02 |
| Ratios/Supplemental Data (%): | | | | | |
| Ratio of total expenses | | | | | |
| to average net assets | .90 | .90 | .90 | .95 | .89 |
| Ratio of net expenses | | | | | |
| to average net assets | .90 | .90 | .90 | .95 | .89 |
| Ratio of net investment income | | | | | |
| to average net assets | 1.33 | 2.11 | 3.00 | 4.25 | 4.30 |
| Portfolio Turnover Rate | 173.05b | 118.74 | 90.03 | 99.46b | 86.45b |
| Net Assets, end of period ($ x 1,000) | 250,850 | 261,652 | 256,259 | 199,863 | 213,980 |
| |
| a | Based on average shares outstanding at each month end. |
| b | The portfolio turnover rates excluding mortgage dollar roll transactions for the periods ended July 31, 2012, 2009 |
| | and 2008 were 160.80%, 98.62% and 86.39%, respectively. |
| See notes to financial statements. |
FINANCIAL HIGHLIGHTS (continued)
| | | | | | | | | | |
| | | Year Ended July 31, | |
| Class P Shares | 2012 | 2011 | 2010 | 2009 | 2008 |
| Per Share Data ($): | | | | | |
| Net asset value, beginning of period | 10.77 | 10.79 | 10.36 | 10.34 | 10.82 |
| Investment Operations: | | | | | |
| Investment income—neta | .14 | .23 | .32 | .42 | .47 |
| Net realized and unrealized | | | | | |
| gain (loss) on investments | .06 | .05 | .50 | .04 | (.46) |
| Total from Investment Operations | .20 | .28 | .82 | .46 | .01 |
| Distributions: | | | | | |
| Dividends from investment income—net | (.23) | (.30) | (.39) | (.44) | (.48) |
| Dividends from net realized | | | | | |
| gain on investments | — | — | — | — | (.01) |
| Total Distributions | (.23) | (.30) | (.39) | (.44) | (.49) |
| Net asset value, end of period | 10.74 | 10.77 | 10.79 | 10.36 | 10.34 |
| Total Return (%) | 1.85 | 2.65 | 8.10 | 4.66 | .02 |
| Ratios/Supplemental Data (%): | | | | | |
| Ratio of total expenses | | | | | |
| to average net assets | .95 | .93 | .93 | .96 | .89 |
| Ratio of net expenses | | | | | |
| to average net assets | .95 | .93 | .93 | .96 | .89 |
| Ratio of net investment income | | | | | |
| to average net assets | 1.30 | 2.09 | 2.97 | 4.24 | 4.32 |
| Portfolio Turnover Rate | 173.05b | 118.74 | 90.03 | 99.46b | 86.45b |
| Net Assets, end of period ($ x 1,000) | 1,153 | 1,047 | 1,478 | 1,350 | 1,678 |
| |
| a | Based on average shares outstanding at each month end. |
| b | The portfolio turnover rates excluding mortgage dollar roll transactions for the periods ended July 31, 2012, 2009 |
| | and 2008 were 160.80%, 98.62% and 86.39%, respectively. |
| See notes to financial statements. |
26
NOTES TO FINANCIAL STATEMENTS
NOTE 1—Significant Accounting Policies:
Dreyfus ShortTerm Income Fund (the “fund”) is a separate non-diversified series of Dreyfus Investment Grade Funds, Inc. (the “Company”), which is registered under the Investment Company Act of 1940, as amended (the “Act”), as an open-end management investment company and operates as a series company currently offering three series, including the fund.The fund’s investment objective seeks to maximize total return, consisting of capital appreciation and current income.The Dreyfus Corporation (the “Manager” or “Dreyfus”), a wholly-owned subsidiary of The Bank of New York Mellon Corporation (“BNY Mellon”), serves as the fund’s investment adviser.
MBSC Securities Corporation (the “Distributor”), a wholly-owned subsidiary of the Manager, is the distributor of the fund’s shares.The fund is authorized to issue 700 million shares of $.001 par value Common Stock.The fund currently offers two classes of shares: Class D (600 million shares authorized) and Class P (100 million shares authorized). Class D and Class P shares are sold at net asset value per share only to institutional investors. The Company’s Board of Directors approved, effective as of the close of business on March 13, 2012, the transfer of shares authorized from Class B to Class D shares. Class B shares were subject to a contingent deferred sales charge (“CDSC”) imposed on Class B share redemptions made within six years of purchase and automatically converted to Class D shares after six years.The fund no longer offers Class B shares. Effective March 13, 2012, all outstanding Class B shares were converted to Class D shares. Other differences between the classes include the services offered to and the expenses borne by each class, the allocation of certain transfer agency costs and certain voting rights. Income, expenses (other than expenses attributable to a specific class), and realized and unrealized gains or losses on investments are allocated to each class of shares based on its relative net assets.
NOTES TO FINANCIAL STATEMENTS (continued)
The Company accounts separately for the assets, liabilities and operations of each series. Expenses directly attributable to each series are charged to that series’ operations; expenses which are applicable to all series are allocated among them on a pro rata basis.
The Financial Accounting Standards Board (“FASB”) Accounting Standards Codification is the exclusive reference of authoritative U.S. generally accepted accounting principles (“GAAP”) recognized by the FASB to be applied by nongovernmental entities. Rules and interpretive releases of the Securities and Exchange Commission (“SEC”) under authority of federal laws are also sources of authoritative GAAP for SEC registrants. The fund’s financial statements are prepared in accordance with GAAP, which may require the use of management estimates and assumptions.Actual results could differ from those estimates.
The Company enters into contracts that contain a variety of indemnifications.The fund’s maximum exposure under these arrangements is unknown.The fund does not anticipate recognizing any loss related to these arrangements.
(a) Portfolio valuation: The fair value of a financial instrument is the amount that would be received to sell an asset or paid to transfer a liability in an orderly transaction between market participants at the measurement date (i.e., the exit price). GAAP establishes a fair value hierarchy that prioritizes the inputs of valuation techniques used to measure fair value.This hierarchy gives the highest priority to unadjusted quoted prices in active markets for identical assets or liabilities (Level 1 measurements) and the lowest priority to unobservable inputs (Level 3 measurements).
Additionally, GAAP provides guidance on determining whether the volume and activity in a market has decreased significantly and whether such a decrease in activity results in transactions that are not orderly. GAAP requires enhanced disclosures around valuation inputs and techniques used during annual and interim periods.
28
Various inputs are used in determining the value of the fund’s investments relating to fair value measurements.These inputs are summarized in the three broad levels listed below:
Level 1—unadjusted quoted prices in active markets for identical investments.
Level 2—other significant observable inputs (including quoted prices for similar investments, interest rates, prepayment speeds, credit risk, etc.).
Level 3—significant unobservable inputs (including the fund’s own assumptions in determining the fair value of investments).
The inputs or methodology used for valuing securities are not necessarily an indication of the risk associated with investing in those securities.
Changes in valuation techniques may result in transfers in or out of an assigned level within the disclosure hierarchy. Valuation techniques used to value the fund’s investments are as follows:
Registered investment companies that are not traded on an exchange are valued at their net asset value and are categorized within Level 1 of the fair value hierarchy.
Investments in securities excluding short-term investments (other than U.S. Treasury Bills), financial futures and forward foreign currency exchange contracts (“forward contracts”) are valued each business day by an independent pricing service (the “Service”) approved by the Company’s Board of Directors. Investments for which quoted bid prices are readily available and are representative of the bid side of the market in the judgment of the Service are valued at the mean between the quoted bid prices (as obtained by the Service from dealers in such securities) and asked prices (as calculated by the Service based upon its evaluation of the market for such securities). Other investments (which constitute a majority of the portfolio securities) are valued as determined by the Service, based on methods which include consideration
NOTES TO FINANCIAL STATEMENTS (continued)
of the following: yields or prices of securities of comparable quality, coupon, maturity and type; indications as to values from dealers; and general market conditions. These securities are generally categorized within Level 2 of the fair value hierarchy.
U.S. Treasury Bills are valued at the mean price between quoted bid prices and asked prices by the Service. These securities are generally categorized within Level 2 of the fair value hierarchy.
The Service’s procedures are reviewed by Dreyfus under the general supervision of the Company’s Board of Directors.
When market quotations or official closing prices are not readily available, or are determined not to reflect accurately fair value, such as when the value of a security has been significantly affected by events after the close of the exchange or market on which the security is principally traded (for example, a foreign exchange or market), but before the fund calculates its net asset value, the fund may value these investments at fair value as determined in accordance with the procedures approved by the Company’s Board of Directors. Certain factors may be considered when fair valuing investments such as: fundamental analytical data, the nature and duration of restrictions on disposition, an evaluation of the forces that influence the market in which the securities are purchased and sold, and public trading in similar securities of the issuer or comparable issuers. These securities are either categorized as Level 2 or 3 depending on the relevant inputs used.
For restricted securities where observable inputs are limited, assumptions about market activity and risk are used and are categorized within Level 3 of the fair value hierarchy.
Investments denominated in foreign currencies are translated to U.S. dollars at the prevailing rate of exchange.
Financial futures, which are traded on an exchange, are valued at the last sales price on the securities exchange on which such securities are primarily traded or at the last sales price on the national securities
30
market on each business day.These securities are generally categorized within Level 1 of the fair value hierarchy. Forward contracts are valued at the forward rate. These securities are generally categorized within Level 2 of the fair value hierarchy.
The following is a summary of the inputs used as of July 31, 2012 in valuing the fund’s investments:
| | | | | |
| | | | Level 2—Other | Level 3— | |
| | Level 1— | | Significant | Significant | |
| | Unadjusted | | Observable | Unobservable | |
| | Quoted Prices | | Inputs | Inputs | Total |
| Assets ($) | | | | | |
| Investments in Securities: | | | | |
| Asset-Backed | — | | 23,213,983 | — | 23,213,983 |
| Commercial | | | | | |
| Mortgage-Backed | — | | 8,482,380 | — | 8,482,380 |
| Corporate Bonds† | — | | 78,701,043 | — | 78,701,043 |
| Mutual Funds | 2,246,626 | | — | — | 2,246,626 |
| Residential | | | | | |
| Mortgage-Backed | — | | 509,761 | — | 509,761 |
| U.S. Government | | | | | |
| Agencies/ | | | | | |
| Mortgage-Backed | — | | 31,651,560 | — | 31,651,560 |
| U.S. Treasury | — | | 111,387,632 | — | 111,387,632 |
| Other Financial | | | | | |
| Instruments: | | | | | |
| Forward Foreign | | | | | |
| Currency Exchange | | | | | |
| Contracts†† | — | | 70,487 | — | 70,487 |
| Financial Futures†† | 97,444 | | — | — | 97,444 |
| Liabilities ($) | | | | | |
| Other Financial | | | | | |
| Instruments: | | | | | |
| Financial Futures†† | (125,617 | ) | — | — | (125,617) |
| |
| † | See Statement of Investments for additional detailed categorizations. |
| †† | Amount shown represents unrealized appreciation (depreciation) at period end. |
At July 31, 2012, there were no transfers between Level 1 and Level 2 of the fair value hierarchy.
NOTES TO FINANCIAL STATEMENTS (continued)
(b) Foreign currency transactions: The fund does not isolate that portion of the results of operations resulting from changes in foreign exchange rates on investments from the fluctuations arising from changes in the market prices of securities held. Such fluctuations are included with the net realized and unrealized gain or loss on investments.
Net realized foreign exchange gains or losses arise from sales of foreign currencies, currency gains or losses realized on securities transactions between trade and settlement date, and the difference between the amounts of dividends, interest and foreign withholding taxes recorded on the fund’s books and the U.S. dollar equivalent of the amounts actually received or paid. Net unrealized foreign exchange gains and losses arise from changes in the value of assets and liabilities other than investments resulting from changes in exchange rates. Foreign currency gains and losses on investments are included with net realized and unrealized gain or loss on investments.
(c) Securities transactions and investment income: Securities transactions are recorded on a trade date basis. Realized gains and losses from securities transactions are recorded on the identified cost basis. Dividend income is recognized on the ex-dividend date and interest income, including, where applicable, accretion of discount and amortization of premium on investments, is recognized on the accrual basis.
Pursuant to a securities lending agreement withThe Bank of NewYork Mellon, a subsidiary of BNY Mellon and an affiliate of Dreyfus, the fund may lend securities to qualified institutions. It is the fund’s policy that, at origination, all loans are secured by collateral of at least 102% of the value of U.S. securities loaned and 105% of the value of foreign securities loaned. Collateral equivalent to at least 100% of the market value of securities on loan is maintained at all times. Collateral is either in the form of cash, which can be invested in certain money market mutual funds managed by the Manager, U.S. Government and Agency securities or letters of credit.The fund is entitled to receive all income on securities loaned, in addition to income earned as a result of the lending transaction. Although each security loaned is fully collateral-
32
ized, the fund bears the risk of delay in recovery of, or loss of rights in, the securities loaned should a borrower fail to return the securities in a timely manner. During the period ended July 31, 2012, The Bank of New York Mellon earned $20,412 from lending portfolio securities, pursuant to the securities lending agreement.
(d) Affiliated issuers: Investments in other investment companies advised by Dreyfus are defined as “affiliated” in the Act. Investments in affiliated investment companies for the period ended July 31, 2012 were as follows:
| | | | | | | |
| Affiliated | | | | | | | |
| Investment | Value | | | | Value | | Net |
| Company | 7/31/2011 | ($) | Purchases ($) | Sales ($) | 7/31/2012 | ($) | Assets (%) |
| Dreyfus | | | | | | | |
| Institutional | | | | | | | |
| Preferred | | | | | | | |
| Plus Money | | | | | | | |
| Market Fund | 3,038,000 | | 95,497,634 | 97,545,086 | 990,548 | | .4 |
| Dreyfus | | | | | | | |
| Institutional | | | | | | | |
| Cash | | | | | | | |
| Advantage | | | | | | | |
| Fund | 2,017,350 | | 48,841,659 | 49,602,931 | 1,256,078 | | .5 |
| Total | 5,055,350 | | 144,339,293 | 147,148,017 | 2,246,626 | | .9 |
(e) Dividends to shareholders: It is the policy of the fund to declare dividends daily from investment income-net. Such dividends are paid monthly. Dividends from net realized capital gains, if any, are normally declared and paid annually, but the fund may make distributions on a more frequent basis to comply with the distribution requirements of the Internal Revenue Code of 1986, as amended (the “Code”).To the extent that net realized capital gains can be offset by capital loss carryovers, it is the policy of the fund not to distribute such gains. Income and capital gain distributions are determined in accordance with income tax regulations, which may differ from GAAP.
(f) Federal income taxes: It is the policy of the fund to continue to qualify as a regulated investment company, if such qualification is in the best interests of its shareholders, by complying with the applicable pro-
NOTES TO FINANCIAL STATEMENTS (continued)
visions of the Code, and to make distributions of taxable income sufficient to relieve it from substantially all federal income and excise taxes.
As of and during the period ended July 31, 2012, the fund did not have any liabilities for any uncertain tax positions. The fund recognizes interest and penalties, if any, related to uncertain tax positions as income tax expense in the Statement of Operations. During the period, the fund did not incur any interest or penalties.
Each of the tax years in the four-year period ended July 31, 2012 remains subject to examination by the Internal Revenue Service and state taxing authorities.
At July 31, 2012, the components of accumulated earnings on a tax basis were as follows: undistributed ordinary income $598,795, accumulated capital losses $60,168,453 and unrealized appreciation $2,096,394. In addition, the fund had $320,655 of capital losses realized after October 31, 2011, which were deferred for tax purposes to the first day of the following fiscal year.
Under the Regulated Investment Company Modernization Act of 2010 (the “2010 Act”), the fund is permitted to carry forward capital losses incurred in taxable years beginning after December 22, 2010 (“post-enactment losses”) for an unlimited period. Furthermore, post-enactment capital loss carryovers retain their character as either short-term or long-term capital losses rather than short-term as they were under previous statute.The 2010 Act requires post-enactment losses to be utilized before the utilization of losses incurred in taxable years prior to the effective date of the 2010 Act (“pre-enactment losses”).As a result of this ordering rule, pre-enactment losses may be more likely to expire unused.
The accumulated capital loss carryover is available for federal income tax purposes to be applied against future net realized capital gains, if any, realized subsequent to July 31, 2012. If not applied, $29,412,543 of the carryover expires in fiscal year 2013, $8,634,655 expires in fiscal year 2014, $7,342,005 expires in fiscal year 2015, $4,178,299 expires in fiscal year 2016, $5,740,844 expires in fiscal year 2017 and $4,860,107 expires in fiscal year 2018.
34
The tax character of distributions paid to shareholders during the fiscal periods ended July 31, 2012 and July 31, 2011 were as follows: ordinary income $5,570,897 and $7,265,305, respectively.
During the period ended July 31, 2012, as a result of permanent book to tax differences, primarily due to the tax treatment for amortization of premiums, paydown gains and losses on mortgage backed securities, foreign currency transactions, consent fees and a capital loss carryover expiration, the fund increased accumulated undistributed investment income-net by $2,646,183, increased accumulated net realized gain (loss) on investments by $5,027,060 and decreased paid-in capital by $7,673,243. Net assets and net asset value per share were not affected by this reclassification.
(g) New Accounting Pronouncements: In April 2011, FASB issued ASU No. 2011-03 “Transfers and Servicing (Topic 860) Reconsideration of Effective Control for Repurchase Agreements (“ASU 2011-03”)” which relates to the accounting for repurchase agreements and similar agreements including mortgage dollar rolls, that both entitle and obligate a transferor to repurchase or redeem financial assets before their matu-rity.ASU 2011-03 modifies the criteria for determining effective control of transferred assets and as a result certain agreements may now be accounted for as secured borrowings. ASU 2011-03 was effective for new transfers and existing transactions that were modified in the first interim or annual period beginning on or after December 15, 2011.The new disclosures have been implemented and there was no change in accounting for the fund. Management has determined that the fund has not entered into transactions that can be deemed “secured borrowings” as defined by ASU 2011-03.
In December 2011, FASB issued Accounting Standards Update No. 2011-11 “Disclosures about Offsetting Assets and Liabilities” (“ASU 2011-11”).These disclosure requirements are intended to help investors and other financial statement users to better assess the effect or potential effect of offsetting arrangements on a company’s financial position.
NOTES TO FINANCIAL STATEMENTS (continued)
They also improve transparency in the reporting of how companies mitigate credit risk, including disclosure of related collateral pledged or received. In addition, ASU 2011-11 facilitates comparison between those entities that prepare their financial statements on the basis of GAAP and those entities that prepare their financial statements on the basis of IFRS.ASU 2011-11 requires entities to: disclose both gross and net information about both instruments and transactions eligible for offset in the financial statements; and disclose instruments and transactions subject to an agreement similar to a master netting agreement. ASU 2011-11 is effective for fiscal years beginning on or after January 1, 2013, and interim periods within those annual periods.At this time, management is evaluating the implications of ASU 2011-11 and its impact on the funds’ financial statement disclosures.
NOTE 2—Bank Lines of Credit:
The fund participates with other Dreyfus-managed funds in a $225 million unsecured credit facility led by Citibank, N.A. and a $300 million unsecured credit facility provided by The Bank of New York Mellon (each, a “Facility”), each to be utilized primarily for temporary or emergency purposes, including the financing of redemptions. In connection therewith, the fund has agreed to pay its pro rata portion of commitment fees for each Facility. Interest is charged to the fund based on rates determined pursuant to the terms of the respective Facility at the time of borrowing. During the period ended July 31, 2012, the fund did not borrow under the Facilities.
NOTE 3—Management Fee and Other Transactions With Affiliates:
(a) Pursuant to a management agreement with the Manager, the management fee is computed at the annual rate of .50% of the value of the fund’s average daily net assets and is payable monthly.
During the period ended July 31, 2012, the Distributor retained $34 from CDSCs on redemptions of the fund’s Class B shares.
36
(b) Under the Distribution Plan adopted pursuant to Rule 12b-1 under the Act, Class B shares paid the Distributor for distributing its shares at an annual rate of .50% of the value of the average daily net assets of Class B shares. During the period ended July 31, 2012, Class B shares were charged $2,481, pursuant to the Distribution Plan.
(c) Under the Shareholder Services Plan, Class B shares paid and Class D and Class P shares pay the Distributor at an annual rate of .25% of the value of the average daily net assets of Class B and Class P shares and .20% of the value of the average daily net assets of Class D shares for the provision of certain services.The services provided may include personal services relating to shareholder accounts, such as answering shareholder inquiries regarding the fund and providing reports and other information, and services related to the maintenance of shareholder accounts.The Distributor may make payments to Service Agents (securities dealers, financial institutions or other industry professionals) in respect of these services.The Distributor determines the amounts to be paid to Service Agents. During the period ended July 31, 2012, Class B, Class D and Class P shares were charged, $1,240, $514,692 and $2,880, respectively, pursuant to the Shareholder Services Plan.
The fund compensates DreyfusTransfer, Inc. (“DTI”), a wholly-owned subsidiary of the Manager, under a transfer agency agreement for providing transfer agency services for the fund and, since May 29, 2012, cash management services related to fund subscriptions and redemptions. During the period ended July 31, 2012, the fund was charged $140,513 for transfer agency services and $759 for cash management services.These fees are included in Shareholder servicing costs in the Statement of Operations.
The fund compensatesThe Bank of NewYork Mellon under a custody agreement for providing custodial services for the fund. During the period ended July 31, 2012, the fund was charged $25,179 pursuant to the custody agreement.
NOTES TO FINANCIAL STATEMENTS (continued)
The fund has arrangements with the transfer agent and the custodian whereby the fund may receive earnings credits when positive cash balances are maintained, which are used to offset transfer agency and custody fees. For financial reporting purposes, the fund includes net earnings credits as an expense offset in the Statement of Operations.
Prior to May 29, 2012, the fund compensated The Bank of NewYork Mellon under a cash management agreement for performing cash management services related to fund subscriptions and redemptions. Subsequent to May 29, 2012,The Bank of NewYork Mellon has continued to provide shareholder redemption draft processing services. During the period ended July 31, 2012, the fund was charged $11,237 pursuant to the cash management agreement, which is included in Shareholder servicing costs in the Statement of Operations.These fees were partially offset by earnings credits of $323.
During the period ended July 31, 2012, the fund was charged $6,418 for services performed by the Chief Compliance Officer and his staff.
The components of “Due to The Dreyfus Corporation and affiliates” in the Statement of Assets and Liabilities consist of: management fees $106,820, Shareholder Services Plan fees $42,777, custodian fees $6,023, Chief Compliance Officer fees $3,713 and transfer agency per account fees $23,920.
(d) Each Board member also serves as a Board member of other funds within the Dreyfus complex. Annual retainer fees and attendance fees are allocated to each fund based on net assets.
NOTE 4—Securities Transactions:
The aggregate amount of purchases and sales (including paydowns) of investment securities, excluding short-term securities, financial futures and forward contracts, during the period ended July 31, 2012, amounted to $447,331,056 and $458,515,415, respectively, of which $31,652,500 in purchases and $31,738,430 in sales were from mortgage dollar roll transactions.
38
Mortgage Dollar Rolls: A mortgage dollar roll transaction involves a sale by the fund of mortgage related securities that it holds with an agreement by the fund to repurchase similar securities at an agreed upon price and date.The securities purchased will bear the same interest rate as those sold, but generally will be collateralized by pools of mortgages with different prepayment histories than those securities sold.The fund accounts for mortgage dollar rolls as purchases and sales transactions.
Derivatives: A derivative is a financial instrument whose performance is derived from the performance of another asset. Each type of derivative instrument that was held by the fund during the period ended July 31, 2012 is discussed below.
The following tables show the fund’s exposure to different types of market risk as it relates to the Statement of Assets and Liabilities and the Statement of Operations, respectively.
Fair value of derivative instruments as of July 31, 2012 is shown below:
| | | | |
| | | Derivative | | Derivative |
| | | Assets ($) | | Liabilities ($) |
| Interest rate risk1 | 97,444 | Interest rate risk1 | (125,617) |
| Foreign exchange risk2 | 70,487 | Foreign exchange risk | — |
| Gross fair value of | | | |
| | derivatives contracts | 167,931 | | (125,617) |
| |
| Statement of Assets and Liabilities location: | | |
| 1 | Includes cumulative appreciation (depreciation) on financial futures as reported in the Statement of |
| | Financial Futures, but only the unpaid variation margin is reported in the Statement of Assets |
| | and Liabilities. | | | |
| 2 | Unrealized appreciation on forward foreign currency exchange contracts. | |
The effect of derivative instruments in the Statement of Operations during the period ended July 31, 2012 is shown below:
| | | | | | |
| | Amount of realized gain or (loss) on derivatives recognized in income ($) |
| | Financial | Forward | |
| Underlying risk | Futures3 | Contracts4 | Total |
| Interest rate | (1,956,577) | — | (1,956,577) |
| Foreign exchange | — | (70,177) | (70,177) |
| Total | (1,956,577) | (70,177) | (2,026,754) |
NOTES TO FINANCIAL STATEMENTS (continued)
| | | | |
| | Change in unrealized appreciation or (depreciation) on derivatives recognized in income ($) |
| | | Financial | Forward | |
| Underlying risk | Futures5 | Contracts6 | Total |
| Interest rate | 208,577 | — | 208,577 |
| Foreign exchange | — | 70,487 | 70,487 |
| Total | 208,577 | 70,487 | 279,064 |
| |
| Statement of Operations location: | | | |
| 3 | Net realized gain (loss) on financial futures. | | |
| 4 | Net realized gain (loss) on forward foreign currency exchange contracts. | |
| 5 | Net unrealized appreciation (depreciation) on financial futures. | | |
| 6 | Net unrealized appreciation (depreciation) on forward foreign currency exchange contracts. |
Financial Futures: In the normal course of pursuing its investment objective, the fund is exposed to market risk, including interest rate risk, as a result of changes in value of underlying financial instruments.The fund invests in financial futures in order to manage its exposure to or protect against changes in the market.A financial futures contract represents a commitment for the future purchase or a sale of an asset at a specified date. Upon entering into such contracts, these investments require initial margin deposits with a counterparty, which consist of cash or cash equiv-alents.The amount of these deposits is determined by the exchange or Board of Trade on which the contract is traded and is subject to change. Accordingly, variation margin payments are received or made to reflect daily unrealized gains or losses which are recorded in the Statement of Operations.When the contracts are closed, the fund recognizes a realized gain or loss which is reflected in the Statement of Operations.There is minimal counterparty credit risk to the fund with financial futures since they are exchange traded, and the exchange’s clearinghouse guarantees the financial futures against default. Financial futures open at July 31, 2012 are set forth in the Statement of Financial Futures.
Forward Foreign Currency Exchange Contracts: The fund enters into forward contracts in order to hedge its exposure to changes in foreign currency exchange rates on its foreign portfolio holdings, to settle foreign currency transactions or as a part of its investment strategy. When executing forward contracts, the fund is obligated to buy or sell a foreign currency at a specified rate on a certain date in the future. With respect to sales of forward contracts, the fund incurs a loss if the
40
value of the contract increases between the date the forward contract is opened and the date the forward contract is closed.The fund realizes a gain if the value of the contract decreases between those dates.With respect to purchases of forward contracts, the fund incurs a loss if the value of the contract decreases between the date the forward contract is opened and the date the forward contract is closed.The fund realizes a gain if the value of the contract increases between those dates. Any realized or unrealized gains or losses which occurred during the period are reflected in the Statement of Operations. The fund is exposed to foreign currency risk as a result of changes in value of underlying financial instruments.The fund is also exposed to credit risk associated with counterparty nonperformance on these forward contracts, which is typically limited to the unrealized gain on each open contract.The following summarizes open forward contracts at July 31, 2012:
| | | | |
| | Foreign | | | |
| Forward Foreign Currency | Currency | | | Unrealized |
| Exchange Contracts | Amounts | Cost ($) | Value ($) Apppreciation ($) |
| Purchases: | | | | |
| Mexican New Peso, | | | | |
| Expiring 8/29/2012a | 34,760,000 | 2,561,363 | 2,606,071 | 44,708 |
| South African Rand, | | | | |
| Expiring 8/29/2012a | 10,320,000 | 1,215,791 | 1,241,570 | 25,779 |
| | | | | 70,487 |
| |
| Counterparty: | | | | |
| a JPMorgan Chase & Co. | | | | |
The following summarizes the average market value of derivatives outstanding during the period ended July 31, 2012:
| |
| | Average Market Value ($) |
| Interest rate financial futures | 66,206,389 |
| Forward contracts | 1,134,241 |
At July 31, 2012, the cost of investments for federal income tax purposes was $254,096,591; accordingly, accumulated net unrealized appreciation on investments was $2,096,394, consisting of $4,394,419 gross unrealized appreciation and $2,298,025 gross unrealized depreciation.
|
| REPORT OF INDEPENDENT REGISTERED |
| PUBLIC ACCOUNTING FIRM |
Shareholders and Board of Directors
Dreyfus Short Term Income Fund
We have audited the accompanying statement of assets and liabilities, including the statements of investments and financial futures, of Dreyfus Short Term Income Fund (one of the series comprising Dreyfus Investment Grade Funds, Inc.) as of July 31, 2012, and the related statement of operations for the year then ended, the statement of changes in net assets for each of the two years in the period then ended, and financial highlights for each of the years indicated therein. These financial statements and financial highlights are the responsibility of the Fund’s management. Our responsibility is to express an opinion on these financial statements and financial highlights based on our audits.
We conducted our audits in accordance with the standards of the Public Company Accounting Oversight Board (United States).Those standards require that we plan and perform the audit to obtain reasonable assurance about whether the financial statements and financial highlights are free of material misstatement.We were not engaged to perform an audit of the Fund’s internal control over financial reporting. Our audits included consideration of internal control over financial reporting as a basis for designing audit procedures that are appropriate in the circumstances, but not for the purpose of expressing an opinion on the effectiveness of the Fund’s internal control over financial reporting. Accordingly, we express no such opinion.An audit also includes examining, on a test basis, evidence supporting the amounts and disclosures in the financial statements and financial highlights, assessing the accounting principles used and significant estimates made by management, and evaluating the overall financial statement presentation. Our procedures included confirmation of securities owned as of July 31, 2012 by correspondence with the custodian and others.We believe that our audits provide a reasonable basis for our opinion.
In our opinion, the financial statements and financial highlights referred to above present fairly, in all material respects, the financial position of Dreyfus Short Term Income Fund at July 31, 2012, the results of its operations for the year then ended, the changes in its net assets for each of the two years in the period then ended, and the financial highlights for each of the indicated years, in conformity with U.S. generally accepted accounting principles.

New York, New York
September 24, 2012
42
IMPORTANT TAX INFORMATION (Unaudited)
The fund hereby reports 98.46% of ordinary income dividends paid during the fiscal year ended July 31, 2012 as qualifying “interest related dividends”.
|
| INFORMATION ABOUT THE RENEWAL OF THE |
| FUND’S MANAGEMENT AGREEMENT (Unaudited) |
At a meeting of the fund’s Board of Directors held on July 18 and 19, 2012, the Board considered the renewal of the fund’s Management Agreement pursuant to which Dreyfus provides the fund with investment advisory and administrative services (the “Agreement”). The Board members, none of whom are “interested persons” (as defined in the Investment Company Act of 1940, as amended) of the fund, were assisted in their review by independent legal counsel and met with counsel in executive session separate from Dreyfus representatives. In considering the renewal of the Agreement, the Board considered all factors that it believed to be relevant, including those discussed below. The Board did not identify any one factor as dispositive, and each Board member may have attributed different weights to the factors considered.
Analysis of Nature, Extent, and Quality of Services Provided to the Fund.The Board considered information previously provided to them in presentations from Dreyfus representatives regarding the nature, extent, and quality of the services provided to funds in the Dreyfus fund complex, and Dreyfus representatives confirmed that there had been no material changes in this information. Dreyfus provided the number of open accounts in the fund, the fund’s asset size and the allocation of fund assets among distribution channels. Dreyfus also had previously provided information regarding the diverse intermediary relationships and distribution channels of funds in the Dreyfus fund complex (such as retail direct or intermediary, in which intermediaries typically are paid by the fund and/or Dreyfus) and Dreyfus’ corresponding need for broad, deep, and diverse resources to be able to provide ongoing shareholder services to each intermediary or distribution channel, as applicable to the fund.
The Board also considered research support available to, and portfolio management capabilities of, the fund’s portfolio management personnel and that Dreyfus also provides oversight of day-to-day fund operations, including fund accounting and administration and assistance in meeting legal and regulatory requirements.The Board also considered Dreyfus’ extensive administrative, accounting, and compliance infrastructures.
44
Comparative Analysis of the Fund’s Performance and Management Fee and Expense Ratio.The Board reviewed reports prepared by Lipper, Inc. (“Lipper”), an independent provider of investment company data, which included information comparing (1) the fund’s performance with the performance of a group of comparable funds (the “Performance Group”) and with a broader group of funds (the “Performance Universe”), all for various periods ended May 31, 2012, and (2) the fund’s actual and contractual management fees and total expenses with those of a group of comparable funds (the “Expense Group”) and with a broader group of funds (the “Expense Universe”), the information for which was derived in part from fund financial statements available to Lipper as of the date of its analysis. Dreyfus previously had furnished the Board with a description of the methodology Lipper used to select the Performance Group and Performance Universe and the Expense Group and Expense Universe.
Dreyfus representatives stated that the usefulness of performance comparisons may be affected by a number of factors, including different investment limitations that may be applicable to the fund and comparison funds. The Board discussed the results of the comparisons and noted that the fund’s total return performance was above or below the Performance Group and Performance Universe medians for all periods. The Board also noted that the fund’s yield performance was above or at the Performance Group median and above the Performance Universe median for the ten one-year periods ended May 31st. Dreyfus also provided a comparison of the fund’s calendar year total returns to the returns of the fund’s benchmark index.
The Board also reviewed the range of actual and contractual management fees and total expenses of the Expense Group and Expense Universe funds and discussed the results of the comparisons.The Board noted that the fund’s contractual management fee was above the Expense Group median and the actual management fee and total expenses were above the Expense Group and Expense Universe medians.
|
| INFORMATION ABOUT THE RENEWAL OF THE FUND’S |
| MANAGEMENT AGREEMENT (Unaudited) (continued) |
Dreyfus representatives reviewed with the Board the management or investment advisory fees (1) paid by funds advised or administered by Dreyfus that are in the same Lipper category as the fund and (2) paid to Dreyfus or the Dreyfus-affiliated primary employer of the fund’s primary portfolio manager(s) for advising any separate accounts and/or other types of client portfolios that are considered to have similar investment strategies and policies as the fund (the “Similar Clients”), and explained the nature of the Similar Clients.They discussed differences in fees paid and the relationship of the fees paid in light of any differences in the services provided and other relevant factors. The Board considered the relevance of the fee information provided for the Similar Clients to evaluate the appropriateness and reasonableness of the fund’s management fee.
Analysis of Profitability and Economies of Scale. Dreyfus representatives reviewed the expenses allocated and profit received by Dreyfus and the resulting profitability percentage for managing the fund, and the method used to determine the expenses and profit. The Board concluded that the profitability results were not unreasonable, given the services rendered and service levels provided by Dreyfus. The Board previously had been provided with information prepared by an independent consulting firm regarding Dreyfus’ approach to allocating costs to, and determining the profitability of, individual funds and the entire Dreyfus fund complex. The consulting firm also had analyzed where any economies of scale might emerge in connection with the management of a fund.
The Board’s counsel stated that the Board should consider the profitability analysis (1) as part of the evaluation of whether the fees under the Agreement bear a reasonable relationship to the mix of services provided by Dreyfus, including the nature, extent and quality of such services, and (2) in light of the relevant circumstances for the fund and the extent to which economies of scale would be realized if the fund grows and whether fee levels reflect these economies of scale
46
for the benefit of fund shareholders. Dreyfus representatives noted that a discussion of economies of scale is predicated on a fund having achieved a substantial size with increasing assets and that, if a fund’s assets had been stable or decreasing, the possibility that Dreyfus may have realized any economies of scale would be less. Dreyfus representatives noted that, as a result of shared and allocated costs among funds in the Dreyfus fund complex, the extent of economies of scale could depend substantially on the level of assets in the complex as a whole, so that increases and decreases in complex-wide assets can affect potential economies of scale in a manner that is disproportionate to, or even in the opposite direction from, changes in the fund’s asset level.The Board also considered potential benefits to Dreyfus from acting as investment adviser and noted that there were no soft dollar arrangements in effect for trading the fund’s investments.
At the conclusion of these discussions, the Board agreed that it had been furnished with sufficient information to make an informed business decision with respect to the renewal of the Agreement. Based on the discussions and considerations as described above, the Board concluded and determined as follows.
The Board concluded that the nature, extent and quality of the services provided by Dreyfus are adequate and appropriate.
The Board generally was satisfied with the fund’s overall performance.
The Board concluded that the fee paid to Dreyfus was reasonable in light of the considerations described above.
The Board determined that the economies of scale which may accrue to Dreyfus and its affiliates in connection with the management of the fund had been adequately considered by Dreyfus in connection with the fee rate charged to the fund pursuant to the Agreement and that, to the extent in the future it were determined that material economies of scale had not been shared with the fund, the Board would seek to have those economies of scale shared with the fund.
|
| INFORMATION ABOUT THE RENEWAL OF THE FUND’S |
| MANAGEMENT AGREEMENT (Unaudited) (continued) |
In evaluating the Agreement, the Board considered these conclusions and determinations and also relied on its previous knowledge, gained through meetings and other interactions with Dreyfus and its affiliates, of the fund and the services provided to the fund by Dreyfus.The Board also relied on information received on a routine and regular basis throughout the year relating to the operations of the fund and the investment management and other services provided under the Agreement, including information on the investment performance of the fund in comparison to similar mutual funds and benchmark performance indices; general market outlook as applicable to the fund; and compliance reports. In addition, it should be noted that the Board’s consideration of the contractual fee arrangements for this fund had the benefit of a number of years of reviews of prior or similar agreements during which lengthy discussions took place between the Board and Dreyfus representatives. Certain aspects of the arrangements may receive greater scrutiny in some years than in others, and the Board’s conclusions may be based, in part, on their consideration of the same or similar arrangements in prior years. The Board determined that renewal of the Agreement was in the best interests of the fund and its shareholders.
48

OFFICERS OF THE FUND (Unaudited)
BRADLEY J. SKAPYAK, President since January 2010.
Chief Operating Officer and a director of the Manager since June 2009; from April 2003 to June 2009, Mr. Skapyak was the head of the Investment Accounting and Support Department of the Manager. He is an officer of 72 investment companies (comprised of 156 portfolios) managed by the Manager. He is 53 years old and has been an employee of the Manager since February 1988.
JANETTE E. FARRAGHER, Vice President and Secretary since December 2011.
Assistant General Counsel of BNY Mellon, and an officer of 73 investment companies (comprised of 183 portfolios) managed by the Manager. She is 49 years old and has been an employee of the Manager since February 1984.
KIESHA ASTWOOD, Vice President and Assistant Secretary since January 2010.
Counsel of BNY Mellon, and an officer of 73 investment companies (comprised of 183 portfolios) managed by the Manager. She is 39 years old and has been an employee of the Manager since July 1995.
JAMES BITETTO, Vice President and Assistant Secretary since August 2005.
Senior Counsel of BNY Mellon and Secretary of the Manager, and an officer of 73 investment companies (comprised of 183 portfolios) managed by the Manager. He is 46 years old and has been an employee of the Manager since December 1996.
JONI LACKS CHARATAN, Vice President and Assistant Secretary since August 2005.
Senior Counsel of BNY Mellon, and an officer of 73 investment companies (comprised of 183 portfolios) managed by the Manager. She is 56 years old and has been an employee of the Manager since October 1988.
JOSEPH M. CHIOFFI, Vice President and Assistant Secretary since August 2005.
Senior Counsel of BNY Mellon, and an officer of 73 investment companies (comprised of 183 portfolios) managed by the Manager. He is 50 years old and has been an employee of the Manager since June 2000.
KATHLEEN DENICHOLAS, Vice President and Assistant Secretary since January 2010.
Managing Counsel of BNY Mellon, and an officer of 73 investment companies (comprised of 183 portfolios) managed by the Manager. She is 37 years old and has been an employee of the Manager since February 2001.
JOHN B. HAMMALIAN, Vice President and Assistant Secretary since August 2005.
Senior Managing Counsel of BNY Mellon, and an officer of 73 investment companies (comprised of 183 portfolios) managed by the Manager. He is 49 years old and has been an employee of the Manager since February 1991.
ROBERT R. MULLERY, Vice President and Assistant Secretary since August 2005.
Managing Counsel of BNY Mellon, and an officer of 73 investment companies (comprised of 183 portfolios) managed by the Manager. He is 60 years old and has been an employee of the Manager since May 1986.
JEFF PRUSNOFSKY, Vice President and Assistant Secretary since August 2005.
Senior Managing Counsel of BNY Mellon, and an officer of 73 investment companies (comprised of 183 portfolios) managed by the Manager. He is 47 years old and has been an employee of the Manager since October 1990.
OFFICERS OF THE FUND (Unaudited) (continued)
JAMES WINDELS, Treasurer since November 2001.
Director – Mutual Fund Accounting of the Manager, and an officer of 73 investment companies (comprised of 183 portfolios) managed by the Manager. He is 53 years old and has been an employee of the Manager since April 1985.
RICHARD CASSARO, Assistant Treasurer since January 2008.
Senior Accounting Manager – Money Market and Municipal Bond Funds of the Manager, and an officer of 73 investment companies (comprised of 183 portfolios) managed by the Manager. He is 53 years old and has been an employee of the Manager since September 1982.
GAVIN C. REILLY, Assistant Treasurer since December 2005.
Tax Manager of the Investment Accounting and Support Department of the Manager, and an officer of 73 investment companies (comprised of 183 portfolios) managed by the Manager. He is 43 years old and has been an employee of the Manager since April 1991.
ROBERT S. ROBOL, Assistant Treasurer since August 2003.
Senior Accounting Manager – Fixed Income Funds of the Manager, and an officer of 73 investment companies (comprised of 183 portfolios) managed by the Manager. He is 48 years old and has been an employee of the Manager since October 1988.
ROBERT SALVIOLO, Assistant Treasurer since July 2007.
Senior Accounting Manager – Equity Funds of the Manager, and an officer of 73 investment companies (comprised of 183 portfolios) managed by the Manager. He is 45 years old and has been an employee of the Manager since June 1989.
ROBERT SVAGNA, Assistant Treasurer since August 2005.
Senior Accounting Manager – Equity Funds of the Manager, and an officer of 73 investment companies (comprised of 183 portfolios) managed by the Manager. He is 45 years old and has been an employee of the Manager since November 1990.
JOSEPH W. CONNOLLY, Chief Compliance Officer since October 2004.
Chief Compliance Officer of the Manager and The Dreyfus Family of Funds (73 investment companies, comprised of 183 portfolios). He is 55 years old and has served in various capacities with the Manager since 1980, including manager of the firm’s Fund Accounting Department from 1997 through October 2001.
MATTHEW D. CONNOLLY, Anti-Money Laundering Compliance Officer since April 2012.
Anti-Money Laundering Compliance Officer of the Distributor since October 2011; from March 2010 to September 2011, Global Head, KYC Reviews and Director, UBS Investment Bank; until March 2010,AML Compliance Officer and Senior Vice President, Citi Global Wealth Management. He is an officer of 69 investment companies (comprised of 179 portfolios) managed by the Manager. He is 40 years old and has been an employee of the Distributor since October 2011.
52
Item 2. Code of Ethics.
The Registrant has adopted a code of ethics that applies to the Registrant's principal executive officer, principal financial officer, principal accounting officer or controller, or persons performing similar functions. There have been no amendments to, or waivers in connection with, the Code of Ethics during the period covered by this Report.
Item 3. Audit Committee Financial Expert.
The Registrant's Board has determined that Joseph S. DiMartino, a member of the Audit Committee of the Board, is an audit committee financial expert as defined by the Securities and Exchange Commission (the "SEC"). Joseph S. DiMartino is "independent" as defined by the SEC for purposes of audit committee financial expert determinations.
Item 4. Principal Accountant Fees and Services.
(a) Audit Fees. The aggregate fees billed for each of the last two fiscal years (the "Reporting Periods") for professional services rendered by the Registrant's principal accountant (the "Auditor") for the audit of the Registrant's annual financial statements or services that are normally provided by the Auditor in connection with the statutory and regulatory filings or engagements for the Reporting Periods, were $ 107,460 in 2011 and $111,222 in 2012.
(b) Audit-Related Fees. The aggregate fees billed in the Reporting Periods for assurance and related services by the Auditor that are reasonably related to the performance of the audit of the Registrant's financial statements and are not reported under paragraph (a) of this Item 4 were $18,000 in 2011 and $18,000 in 2012. These services consisted of one or more of the following: (i) agreed upon procedures related to compliance with Internal Revenue Code section 817(h), (ii) security counts required by Rule 17f-2 under the Investment Company Act of 1940, as amended, (iii) advisory services as to the accounting or disclosure treatment of Registrant transactions or events and (iv) advisory services to the accounting or disclosure treatment of the actual or potential impact to the Registrant of final or proposed rules, standards or interpretations by the Securities and Exchange Commission, the Financial Accounting Standards Boards or other regulatory or standard-setting bodies.
The aggregate fees billed in the Reporting Periods for non-audit assurance and related services by the Auditor to the Registrant's investment adviser (not including any sub-investment adviser whose role is primarily portfolio management and is subcontracted with or overseen by another investment adviser), and any entity controlling, controlled by or under common control with the investment adviser that provides ongoing services to the Registrant ("Service Affiliates"), that were reasonably related to the performance of the annual audit of the Service Affiliate, which required pre-approval by the Audit Committee were $0 in 2011 and $0 in 2012.
(c) Tax Fees. The aggregate fees billed in the Reporting Periods for professional services rendered by the Auditor for tax compliance, tax advice, and tax planning ("Tax Services") were $ 10,902 in 2011 and $8,903 in 2012. These services consisted of: (i) review or preparation of U.S. federal, state, local and excise tax returns; (ii) U.S. federal, state and local tax planning, advice and assistance regarding statutory, regulatory or administrative developments; (iii) tax advice regarding tax qualification matters and/or treatment of various financial instruments held or proposed to be acquired or held. The aggregate fees billed in the Reporting Periods for Tax Services by the Auditor to Service Affiliates, which required pre-approval by the Audit Committee were $0 in 2011 and $0 in 2012.
(d) All Other Fees. The aggregate fees billed in the Reporting Periods for products and services provided by the Auditor, other than the services reported in paragraphs (a) through (c) of this Item, were $510 in 2011 and $2,768 in 2012. [These services consisted of a review of the Registrant's anti-money laundering program].
-3-
SSL-DOCS2 70128344v15
The aggregate fees billed in the Reporting Periods for Non-Audit Services by the Auditor to Service Affiliates, other than the services reported in paragraphs (b) through (c) of this Item, which required pre-approval by the Audit Committee, were $0 in 2011 and $3,213 in 2012.
(e)(1) Audit Committee Pre-Approval Policies and Procedures. The Registrant's Audit Committee has established policies and procedures (the "Policy") for pre-approval (within specified fee limits) of the Auditor's engagements for non-audit services to the Registrant and Service Affiliates without specific case-by-case consideration. The pre-approved services in the Policy can include pre-approved audit services, pre-approved audit-related services, pre-approved tax services and pre-approved all other services. Pre-approval considerations include whether the proposed services are compatible with maintaining the Auditor's independence. Pre-approvals pursuant to the Policy are considered annually.
(e)(2) Note: None of the services described in paragraphs (b) through (d) of this Item 4 were approved by the Audit Committee pursuant to paragraph (c)(7)(i)(C) of Rule 2-01 of Regulation S-X.
(f) None of the hours expended on the principal accountant's engagement to audit the registrant's financial statements for the most recent fiscal year were attributed to work performed by persons other than the principal account's full-time, permanent employees.
Non-Audit Fees. The aggregate non-audit fees billed by the Auditor for services rendered to the Registrant, and rendered to Service Affiliates, for the Reporting Periods were $17,495,155 in 2011 and $39,291,938 in 2012.
Auditor Independence. The Registrant's Audit Committee has considered whether the provision of non-audit services that were rendered to Service Affiliates, which were not pre-approved (not requiring pre-approval), is compatible with maintaining the Auditor's independence.
Item 5. Audit Committee of Listed Registrants.
Not applicable. [CLOSED-END FUNDS ONLY]
Item 6. Investments.
(a) Not applicable.
Item 7. Disclosure of Proxy Voting Policies and Procedures for Closed-End Management Investment Companies.
Not applicable. [CLOSED-END FUNDS ONLY]
Item 8. Portfolio Managers of Closed-End Management Investment Companies.
Not applicable. [CLOSED-END FUNDS ONLY, beginning with reports for periods ended on and after December 31, 2005]
Item 9. Purchases of Equity Securities by Closed-End Management Investment Companies and Affiliated Purchasers.
Not applicable. [CLOSED-END FUNDS ONLY]
-4-
SSL-DOCS2 70128344v15
Item 10. Submission of Matters to a Vote of Security Holders.
There have been no material changes to the procedures applicable to Item 10.
Item 11. Controls and Procedures.
(a) The Registrant's principal executive and principal financial officers have concluded, based on their evaluation of the Registrant's disclosure controls and procedures as of a date within 90 days of the filing date of this report, that the Registrant's disclosure controls and procedures are reasonably designed to ensure that information required to be disclosed by the Registrant on Form N-CSR is recorded, processed, summarized and reported within the required time periods and that information required to be disclosed by the Registrant in the reports that it files or submits on Form N-CSR is accumulated and communicated to the Registrant's management, including its principal executive and principal financial officers, as appropriate to allow timely decisions regarding required disclosure.
(b) There were no changes to the Registrant's internal control over financial reporting that occurred during the second fiscal quarter of the period covered by this report that have materially affected, or are reasonably likely to materially affect, the Registrant's internal control over financial reporting.
Item 12. Exhibits.
(a)(1) Code of ethics referred to in Item 2.
(a)(2) Certifications of principal executive and principal financial officers as required by Rule 30a-2(a) under the Investment Company Act of 1940.
(a)(3) Not applicable.
(b) Certification of principal executive and principal financial officers as required by Rule 30a-2(b) under the Investment Company Act of 1940.
-5-
SSL-DOCS2 70128344v15
SIGNATURES
Pursuant to the requirements of the Securities Exchange Act of 1934 and the Investment Company Act of 1940, the Registrant has duly caused this Report to be signed on its behalf by the undersigned, thereunto duly authorized.
Dreyfus Investment Grade Funds, Inc.
By: /s/ Bradley J. Skapyak |
Bradley J. Skapyak, President |
Date: | Wednesday, September 26, 2012 |
|
Pursuant to the requirements of the Securities Exchange Act of 1934 and the Investment Company Act of 1940, this Report has been signed below by the following persons on behalf of the Registrant and in the capacities and on the dates indicated. |
|
By: /s/ Bradley J. Skapyak |
Bradley J. Skapyak President |
Date: | Wednesday, September 26, 2012 |
|
By: /s/ James Windels |
James Windels, Treasurer |
Date: | Wednesday, September 26, 2012 |
|
EXHIBIT INDEX
(a)(1) Code of ethics referred to in Item 2.
(a)(2) Certifications of principal executive and principal financial officers as required by Rule 30a-2(a) under the Investment Company Act of 1940. (EX-99.CERT)
(b) Certification of principal executive and principal financial officers as required by Rule 30a-2(b) under the Investment Company Act of 1940. (EX-99.906CERT)