UNITED STATES
SECURITIES AND EXCHANGE COMMISSION
Washington, D.C. 20549
FORM N-CSR
CERTIFIED SHAREHOLDER REPORT OF REGISTERED MANAGEMENT
INVESTMENT COMPANIES
Investment Company Act file number | 811- 6718 |
| |
| Dreyfus Investment Grade Funds, Inc. | |
| (Exact name of Registrant as specified in charter) | |
| | |
| c/o The Dreyfus Corporation 200 Park Avenue New York, New York 10166 | |
| (Address of principal executive offices) (Zip code) | |
| | |
| Michael A. Rosenberg, Esq. 200 Park Avenue New York, New York 10166 | |
| (Name and address of agent for service) | |
|
Registrant's telephone number, including area code: | (212) 922-6000 |
| |
Date of fiscal year end: | 7/31 | |
Date of reporting period: | 7/31/10 | |
| | | | | | |
FORM N-CSR
Item 1. Reports to Stockholders.
|
| Dreyfus |
| Inflation Adjusted |
| Securities Fund |
ANNUAL REPORT July 31, 2010

Save time. Save paper. View your next shareholder report online as soon as it’s available. Log into www.dreyfus.com and sign up for Dreyfus eCommunications. It’s simple and only takes a few minutes.
The views expressed in this report reflect those of the portfolio manager only through the end of the period covered and do not necessarily represent the views of Dreyfus or any other person in the Dreyfus organization. Any such views are subject to change at any time based upon market or other conditions and Dreyfus disclaims any responsibility to update such views.These views may not be relied on as investment advice and, because investment decisions for a Dreyfus fund are based on numerous factors, may not be relied on as an indication of trading intent on behalf of any Dreyfus fund.
Not FDIC-Insured • Not Bank-Guaranteed • May Lose Value
| | Contents |
| | THE FUND |
| 2 | A Letter from the Chairman and CEO |
| 3 | Discussion of Fund Performance |
| 6 | Fund Performance |
| 8 | Understanding Your Fund’s Expenses |
| 8 | Comparing Your Fund’s Expenses With Those of Other Funds |
| 9 | Statement of Investments |
| 11 | Statement of Assets and Liabilities |
| 12 | Statement of Operations |
| 13 | Statement of Changes in Net Assets |
| 15 | Financial Highlights |
| 17 | Notes to Financial Statements |
| 26 | Report of Independent Registered Public Accounting Firm |
| 27 | Important Tax Information |
| 27 | Proxy Results |
| 28 | Information About the Review and Approval of the Fund’s Management Agreement |
| 33 | Board Members Information |
| 35 | Officers of the Fund |
| | FOR MORE INFORMATION |
| | Back Cover |
|
| Dreyfus |
| Inflation Adjusted |
| Securities Fund |
The Fund

A LETTER FROM THE CHAIRMAN AND CEO
Dear Shareholder:
We are pleased to present this annual report for Dreyfus Inflation Adjusted Securities Fund, covering the 12-month period from August 1, 2009, through July 31, 2010.
For the reporting period as a whole, both bond and equity markets continued to stage a sustained but mild recovery, with higher-yielding bond market sectors generally producing more robust returns than broader fixed-income market averages. However, during the second quarter of 2010 in particular,renewed market volatility caused significant headwinds for equity markets and, to a lesser extent, higher-yielding sectors of the bond markets.Traditional safe havens like U.S.Treasury securities gained value as investors grew more risk averse when developments in overseas markets—including a sovereign debt crisis in Europe and inflation concerns in China—threatened to dampen global economic growth.
Despite these seemingly uncertain markets, many economists, including our own Chief Economist, do not anticipate a “double-dip” recession. Instead, we expect current financial strains to ease and the domestic economy to expand,albeit at a more moderate rate than previously anticipated, over the second half of the year.We still remain cautious about the current market and economic environment and believe that for most investors a long-term investment approach focusing on high quality and diversification between stocks and bonds, relative to individual needs, is appropriate. Given today’s ever-changing markets, we recommend meeting with your financial advisor, since they are best suited to help you assess both the risks and potential opportunities provided by the fixed-income and stock markets in this investment climate.
For information about how the fund performed during the reporting period, as well as general market perspectives, we provide a Discussion of Fund Performance on the pages that follow.
Thank you for your continued confidence and support.

Jonathan R. Baum
Chairman and Chief Executive Officer
The Dreyfus Corporation
August 16, 2010
2

DISCUSSION OF FUND PERFORMANCE
For the period of August 1, 2009, through July 31, 2010, as provided by Robert Bayston, Portfolio Manager
Fund and Market Performance Overview
For the 12-month period ended July 31, 2010, Dreyfus Inflation Adjusted Securities Fund’s Institutional shares produced a total return of 9.58%, and the fund’s Investor shares returned 9.23%.1 In comparison, the fund’s benchmark, the Barclays Capital U.S. Treasury Inflation Protected Securities Index (the “Index”), produced a total return of 9.60% for the same period.2 Treasury Inflation Protected Securities (“TIPS”) fared well over the reporting period as inflation-adjusted yields declined in a sub-par economic recovery, causing bond prices to climb commensurately. The fund produced returns that were roughly in line with the benchm ark, as the benefits of tactical changes in the fund’s duration position were offset by the effects of mutual fund fees and expenses that are not reflected in the benchmark’s return.
The Fund’s Investment Approach
The fund seeks returns that exceed the rate of inflation.To pursue this goal, the fund normally invests at least 80% of its assets in inflation-indexed securities, which are fixed-income securities designed to protect investors from a loss of value due to inflation by periodically adjusting their principal and/or coupon according to the rate of inflation.
The fund invests primarily in high-quality, U.S. dollar-denominated, inflation-indexed securities.To a limited extent, the fund may invest in foreign currency-denominated, inflation-protected securities and other fixed-income securities not adjusted for inflation, including U.S. government bonds and notes, corporate bonds, mortgage-related securities and asset-backed securities. The fund seeks to keep its average effective duration between two and 10 years, and the fund may invest in securities of any maturity without restriction.
Tepid Recovery Lifted Inflation-Adjusted Prices
The reporting period began in the midst of an economic recovery as manufacturing activity increased, housing prices appeared to bottom
DISCUSSION OF FUND PERFORMANCE (continued)
and the labor market showed evidence of modest improvement. The domestic economic rebound was sparked, in part, by historically low short-term interest rates from the Federal Reserve Board (the “Fed”) and a massive stimulus program from the U.S. government. Although improving economic conditions helped boost prices of higher yielding fixed-income securities, including investment-grade corporate bonds, the rebound proved milder than historical averages.As a result, inflationary pressures remained negligible, and inflation-adjusted yields declined.
In the spring of 2010, a number of developments brought the strength and sustainability of the U.S. and global economic recoveries into question. In Europe, Greece found itself unable to finance a heavy debt load, requiring intervention from the International Monetary Fund and the European Union. Meanwhile, surging property values in China kindled local inflation fears, and investors grew concerned that potential remedial measures might constrain a major engine of global growth.The United States also encountered greater economic uncertainty when retail sales, employment and housing data sent mixed signals to investors.
As a result of these developments, higher yielding bond market sectors lost value in the spring, and traditionally defensive U.S. government securities, including TIPS, generally rallied as investors became more risk-averse. Despite inflation concerns in China, U.S. economic data revealed few domestic inflationary pressures, providing continued support for bond prices through the reporting period’s end.
Fund Participated Fully in Market Rally
Throughout the fund’s fiscal year, we maintained its average duration—a measure of sensitivity to changing interest rates—in a range that was roughly in line with industry averages. With nominal short-term interest rates at record lows and no indication that the Fed would change monetary policy over the near term, it made little sense to us to establish a longer- or shorter-than-average duration stance. As part of this strategy, we generally maintained a “bulleted” focus on intermediate-term securities.
However, changes in supply-and-demand dynamics sometimes prompted us to make tactical changes to the fund’s average duration.At times during the reporting period, we moved to a slightly longer position along the maturity spectrum to pursue potential benefits from these technical influences. On average, these shifts helped bolster the
4
fund’s relative performance.The fund also benefited to a degree from our security selection strategy which included capitalizing on valuation dislocations between similar TIPS based on largely technical factors.
Maintaining a Disciplined Approach
As of the reporting period’s end, the U.S. economy appears unlikely to fall into another recession, but the continued expansion probably will remain slower and choppier than most previous recoveries. In addition, we expect inflationary pressures to remain minimal, suggesting that the Fed is unlikely to raise short-term interest rates anytime soon.
Therefore, we have maintained the fund’s average duration in the neutral range, and we expect to continue to make tactical shifts as valuations change in response to supply-and-demand and market liquidity factors. In our judgment, these are prudent strategies in today’s slow-growth economic climate.
August 16, 2010
Bond funds are subject generally to interest rate, credit, liquidity and market risks, to varying degrees, all of which are more fully described in the fund’s prospectus. Generally, all other factors being equal, bond prices are inversely related to interest-rate changes, and rate increases can cause price declines. Interest payments on inflation-protected bonds will vary as the bond’s principal value is periodically adjusted based on the rate of inflation. If the index measuring inflation falls, the interest payable on these securities will be reduced.Any increase in the principal amount of an inflation-protected bond (which follows a rise in the relevant inflation index), will be considered taxable ordinary income, even though investors do not receive their principal until maturity. During periods of rising interest rates and flat or declining inflation rates, inflation-protected bonds can underperform. In flation-protected bonds issued by corporations generally do not guarantee repayment of principal.
The fund may use derivative instruments, such as options, futures and options on futures, forward contracts, swaps (including credit default swaps on corporate bonds and asset-backed securities), options on swaps and other credit derivatives. A small investment in derivatives could have a potentially large impact on the fund’s performance.The use of derivatives involves risks different from, or possibly greater than, the risks associated with investing directly in the underlying assets.
| |
| 1 | Total return includes reinvestment of dividends and any capital gains paid. Past performance is no |
| | guarantee of future results. Share price, yield and investment return fluctuate such that upon |
| | redemption, fund shares may be worth more or less than their original cost. Return figures |
| | provided reflect the absorption of certain fund expenses by The Dreyfus Corporation, pursuant to |
| | an agreement in effect through December 1, 2009, at which time it was terminated. Had these |
| | expenses not been absorbed, the fund’s returns would have been lower. |
| 2 | SOURCE: LIPPER INC. — Reflects reinvestment of dividends and, where applicable, capital |
| | gain distributions.The Barclays Capital U.S.Treasury Inflation Protected Securities Index is a |
| | sub-index of the U.S.Treasury component of the Barclays Capital U.S. Government Index. |
| | Securities in the Barclays Capital U.S.Treasury Inflation Protected Securities Index are dollar- |
| | denominated, non-convertible, publicly issued, fixed-rate, investment-grade (Moody’s Baa3 or |
| | better) U.S.Treasury inflation notes, with at least one year to final maturity and at least $100 |
| | million par amount outstanding. Investors cannot invest directly in any index. |
FUND PERFORMANCE
|
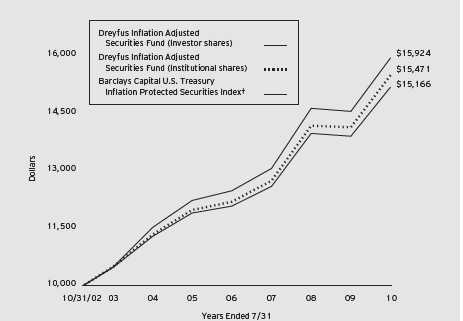
| Comparison of change in value of $10,000 investment in Dreyfus Inflation Adjusted Securities |
| Fund Investor shares and Institutional shares and the Barclays Capital U.S. Treasury Inflation |
| Protected Securities Index |
| † Source: Lipper Inc. |
| Past performance is not predictive of future performance. |
| The above graph compares a $10,000 investment made in Investor and Institutional shares of Dreyfus Inflation Adjusted |
| Securities Fund on 10/31/02 (inception date) to a $10,000 investment made in the Barclays Capital U.S.Treasury |
| Inflation Protected Securities Index (the “Index”) on that date.All dividends and capital gain distributions are reinvested. |
| The fund’s performance shown in the line graph takes into account all applicable fees and expenses.The Index is a sub- |
| index of the U.S.Treasury component of the Barclays Capital U.S. Government Index. Securities in the Index are |
| dollar-denominated, non-convertible, publicly-issued, fixed-rate, investment-grade (Moody’s Baa3 or better) U.S.Treasury |
| inflation notes, with at least one year to final maturity and at least $100 million par amount outstanding. Unlike a |
| mutual fund, the Index is not subject to charges, fees and other expenses. Investors cannot invest directly in any index. |
| Further information relating to fund performance, including expense reimbursements, if applicable, is contained in the |
| Financial Highlights section of the prospectus and elsewhere in this report. |
6
| | | | |
| Average Annual Total Returns as of 7/31/10 | | | |
| |
| | Inception | | | From |
| | Date | 1 Year | 5 Years | Inception |
| Investor shares | 10/31/02 | 9.23% | 5.00% | 5.52% |
| Institutional shares | 10/31/02 | 9.58% | 5.28% | 5.79% |
| Barclays Capital | | | | |
| U.S. Treasury | | | | |
| Inflation Protected | | | | |
| Securities Index | 10/31/02 | 9.60% | 5.45% | 6.19% |
Past performance is not predictive of future performance.The fund’s performance shown in the graph and table does not reflect the deduction of taxes that a shareholder would pay on fund distributions or the redemption of fund shares.
UNDERSTANDING YOUR FUND’S EXPENSES (Unaudited)
As a mutual fund investor, you pay ongoing expenses, such as management fees and other expenses. Using the information below, you can estimate how these expenses affect your investment and compare them with the expenses of other funds.You also may pay one-time transaction expenses, including sales charges (loads) and redemption fees, which are not shown in this section and would have resulted in higher total expenses. For more information, see your fund’s prospectus or talk to your financial adviser.
Review your fund’s expenses
The table below shows the expenses you would have paid on a $1,000 investment in Dreyfus Inflation Adjusted Securities Fund from February 1, 2010 to July 31, 2010. It also shows how much a $1,000 investment would be worth at the close of the period, assuming actual returns and expenses.
|
| Expenses and Value of a $1,000 Investment |
| assuming actual returns for the six months ended July 31, 2010 |
| | |
| | Investor Shares | Institutional Shares |
| Expenses paid per $1,000† | $ 3.77 | $ 2.16 |
| Ending value (after expenses) | $1,027.00 | $1,028.80 |
|
| COMPARING YOUR FUND’S EXPENSES |
| WITH THOSE OF OTHER FUNDS (Unaudited) |
Using the SEC’s method to compare expenses
The Securities and Exchange Commission (SEC) has established guidelines to help investors assess fund expenses. Per these guidelines, the table below shows your fund’s expenses based on a $1,000 investment, assuming a hypothetical 5% annualized return. You can use this information to compare the ongoing expenses (but not transaction expenses or total cost) of investing in the fund with those of other funds.All mutual fund shareholder reports will provide this information to help you make this comparison. Please note that you cannot use this information to estimate your actual ending account balance and expenses paid during the period.
|
| Expenses and Value of a $1,000 Investment |
| assuming a hypothetical 5% annualized return for the six months ended July 31, 2010 |
| | |
| | Investor Shares | Institutional Shares |
| Expenses paid per $1,000† | $ 3.76 | $ 2.16 |
| Ending value (after expenses) | $1,021.08 | $1,022.66 |
|
| Expenses are equal to the fund’s annualized expense ratio of .75% for Investor Shares and .43% for Institutional Shares, |
| multiplied by the average account value over the period, multiplied by 181/365 (to reflect the one-half year period). |
8
| | |
| STATEMENT OF INVESTMENTS | | |
| July 31, 2010 | | |
| |
| |
| |
| |
| | Principal | |
| Bonds and Notes—99.5% | Amount ($) | Value ($) |
| U.S. Treasury Inflation Protected Securities: | | |
| 0.50%, 4/15/15 | 5,778,688 a | 5,887,940 |
| 0.63%, 4/15/13 | 4,113,317 a,b | 4,211,008 |
| 1.25%, 4/14/14 | 1,448,415 a | 1,517,327 |
| 1.38%, 7/15/18 | 3,566,384 a | 3,709,595 |
| 1.38%, 1/15/20 | 1,765,593 a | 1,814,837 |
| 1.63%, 1/15/15 | 16,806,356 a | 17,804,234 |
| 1.75%, 1/15/28 | 2,535,833 a | 2,547,521 |
| 1.88%, 7/15/15 | 1,289,898 a,b | 1,387,950 |
| 1.88%, 7/15/19 | 8,644,428 a | 9,294,783 |
| 2.00%, 1/15/14 | 7,601,669 a | 8,117,753 |
| 2.00%, 7/15/14 | 1,471,094 a | 1,580,850 |
| 2.00%, 1/15/16 | 7,810,029 a | 8,453,747 |
| 2.00%, 1/15/26 | 9,587,484 a,b | 10,063,110 |
| 2.13%, 2/15/40 | 2,700,172 a | 2,873,150 |
| 2.38%, 1/15/17 | 2,374,683 a | 2,627,178 |
| 2.38%, 1/15/25 | 3,557,940 a,b | 3,920,405 |
| 2.38%, 1/15/27 | 1,931,102 a | 2,121,196 |
| 2.50%, 7/15/16 | 10,052,378 a | 11,228,033 |
| 2.50%, 1/15/29 | 6,935,429 a | 7,759,011 |
| 2.63%, 7/15/17 | 6,559,187 a | 7,417,004 |
| 3.00%, 7/15/12 | 13,899,726 a,b | 14,796,689 |
| 3.38%, 1/15/12 | 1,357,702 a | 1,429,300 |
| 3.63%, 4/15/28 | 9,221,149 a,b | 11,804,509 |
| 3.88%, 4/15/29 | 4,187,127 a,b | 5,568,552 |
| Total Bonds and Notes | | |
| (cost $142,668,602) | | 147,935,682 |
STATEMENT OF INVESTMENTS (continued)
| | |
| Other Investment—.2% | Shares | Value ($) |
| Registered Investment Company; | | |
| Dreyfus Institutional Preferred | | |
| Plus Money Market Fund | | |
| (cost $276,000) | 276,000 c | 276,000 |
| |
| Total Investments (cost $142,944,602) | 99.7% | 148,211,682 |
| Cash and Receivables (Net) | .3% | 498,402 |
| Net Assets | 100.0% | 148,710,084 |
|
| a Principal amount for accrual purposes is periodically adjusted based on changes in the Consumer Price Index. |
| b Security, or portion thereof, on loan.At July 31, 2010, the total market value of the fund’s securities on loan is |
| $35,613,028 and the total market value of the collateral held by the fund is $36,269,612, consisting of |
| U.S. Government and Agency securities valued at $36,269,612. |
| c Investment in affiliated money market mutual fund. |
| | | |
| Portfolio Summary (Unaudited)† | | |
| | Value (%) | | Value (%) |
| U.S. Government & Agencies | 99.5 | Money Market Investment | .2 |
| | | | 99.7 |
| † Based on net assets. | | | |
| See notes to financial statements. | | | |
10
|
| STATEMENT OF ASSETS AND LIABILITIES |
| July 31, 2010 |
| | |
| | Cost | Value |
| Assets ($): | | |
| Investments in securities—See Statement of Investments (including | |
| securities on loan, valued at $35,613,028)—Note 1(b): | | |
| Unaffiliated issuers | 142,668,602 | 147,935,682 |
| Affiliated issuers | 276,000 | 276,000 |
| Cash | | 273,506 |
| Dividends and interest receivable | | 304,199 |
| Receivable for shares of Common Stock subscribed | | 49,607 |
| Prepaid expenses | | 6,864 |
| | | 148,845,858 |
| Liabilities ($): | | |
| Due to The Dreyfus Corporation and affiliates—Note 3(b) | | 56,685 |
| Payable for shares of Common Stock redeemed | | 25,343 |
| Accrued expenses | | 53,746 |
| | | 135,774 |
| Net Assets ($) | | 148,710,084 |
| Composition of Net Assets ($): | | |
| Paid-in capital | | 143,849,718 |
| Accumulated undistributed investment income—net | | 699,427 |
| Accumulated net realized gain (loss) on investments | | (1,106,141) |
| Accumulated net unrealized appreciation | | |
| (depreciation) on investments | | 5,267,080 |
| Net Assets ($) | | 148,710,084 |
| |
| |
| Net Asset Value Per Share | | |
| | Investor Shares | Institutional Shares |
| Net Assets ($) | 42,845,961 | 105,864,123 |
| Shares Outstanding | 3,339,261 | 8,254,506 |
| Net Asset Value Per Share ($) | 12.83 | 12.83 |
| |
| See notes to financial statements. | | |
| |
| STATEMENT OF OPERATIONS | |
| Year Ended July 31, 2010 | |
| |
| |
| |
| |
| Investment Income ($): | |
| Income: | |
| Interest | 3,395,645 |
| Income from securities lending—Note 1(b) | 12,054 |
| Dividends; | |
| Affiliated issuers | 961 |
| Total Income | 3,408,660 |
| Expenses: | |
| Management fee—Note 3(a) | 303,723 |
| Shareholder servicing costs—Note 3(b) | 158,719 |
| Registration fees | 43,466 |
| Auditing fees | 37,351 |
| Prospectus and shareholders’ reports | 16,790 |
| Custodian fees—Note 3(b) | 13,904 |
| Legal fees | 2,656 |
| Directors’ fees and expenses—Note 3(c) | 1,509 |
| Loan commitment fees—Note 2 | 1,486 |
| Interest expense—Note 2 | 173 |
| Miscellaneous | 12,878 |
| Total Expenses | 592,655 |
| Less—reduction in management fee due to undertaking—Note 3(a) | (46,265) |
| Less—reduction in fees due to earnings credits—Note 1(b) | (69) |
| Net Expenses | 546,321 |
| Investment Income—Net | 2,862,339 |
| Realized and Unrealized Gain (Loss) on Investments—Note 4 ($): | |
| Net realized gain (loss) on investments | 386,374 |
| Net unrealized appreciation (depreciation) on investments | 5,314,427 |
| Net Realized and Unrealized Gain (Loss) on Investments | 5,700,801 |
| Net Increase in Net Assets Resulting from Operations | 8,563,140 |
| |
| See notes to financial statements. | |
12
STATEMENT OF CHANGES IN NET ASSETS
| | |
| | | Year Ended July 31, |
| | 2010 | 2009 |
| Operations ($): | | |
| Investment income—net | 2,862,339 | 372,684 |
| Net realized gain (loss) on investments | 386,374 | (1,491,794) |
| Net unrealized appreciation | | |
| (depreciation) on investments | 5,314,427 | 1,087,356 |
| Net Increase (Decrease) in Net Assets | | |
| Resulting from Operations | 8,563,140 | (31,754) |
| Dividends to Shareholders from ($): | | |
| Investment income—net: | | |
| Investor Shares | (807,812) | (378,508) |
| Institutional Shares | (1,354,777) | (219,791) |
| Net realized gain on investments: | | |
| Investor Shares | — | (217,001) |
| Institutional Shares | — | (125,345) |
| Total Dividends | (2,162,589) | (940,645) |
| Capital Stock Transactions ($): | | |
| Net proceeds from shares sold: | | |
| Investor Shares | 18,229,270 | 26,339,642 |
| Institutional Shares | 91,849,994 | 19,491,115 |
| Dividends reinvested: | | |
| Investor Shares | 773,951 | 587,130 |
| Institutional Shares | 369,361 | 277,721 |
| Cost of shares redeemed: | | |
| Investor Shares | (19,606,339) | (12,547,868) |
| Institutional Shares | (14,440,863) | (8,611,199) |
| Increase (Decrease) in Net Assets | | |
| from Capital Stock Transactions | 77,175,374 | 25,536,541 |
| Total Increase (Decrease) in Net Assets | 83,575,925 | 24,564,142 |
| Net Assets ($): | | |
| Beginning of Period | 65,134,159 | 40,570,017 |
| End of Period | 148,710,084 | 65,134,159 |
| Undistributed (distributions in excess of) | | |
| investment income—net | 699,427 | (497) |
STATEMENT OF CHANGES IN NET ASSETS (continued)
| | |
| | | Year Ended July 31, |
| | 2010 | 2009 |
| Capital Share Transactions: | | |
| Investor Shares | | |
| Shares sold | 1,462,065 | 2,236,422 |
| Shares issued for dividends reinvested | 61,395 | 49,400 |
| Shares redeemed | (1,570,809) | (1,080,612) |
| Net Increase (Decrease) in Shares Outstanding | (47,349) | 1,205,210 |
| Institutional Shares | | |
| Shares sold | 7,325,995 | 1,668,857 |
| Shares issued for dividends reinvested | 29,209 | 23,554 |
| Shares redeemed | (1,153,413) | (756,913) |
| Net Increase (Decrease) in Shares Outstanding | 6,201,791 | 935,498 |
| |
| See notes to financial statements. | | |
14
FINANCIAL HIGHLIGHTS
The following tables describe the performance for each share class for the fiscal periods indicated.All information (except portfolio turnover rate) reflects financial results for a single fund share.Total return shows how much your investment in the fund would have increased (or decreased) during each period, assuming you had reinvested all dividends and distributions.These figures have been derived from the fund’s financial statements.
| | | | | |
| | | Year Ended July 31, | |
| Investor Shares | 2010 | 2009 | 2008 | 2007 | 2006 |
| Per Share Data ($): | | | | | |
| Net asset value, beginning of period | 11.98 | 12.30 | 11.67 | 11.69 | 12.34 |
| Investment Operations: | | | | | |
| Investment income—neta | .33 | .08 | .79 | .21 | .26 |
| Net realized and unrealized | | | | | |
| gain (loss) on investments | .76 | (.14) | .48 | .27 | (.06) |
| Total from Investment Operations | 1.09 | (.06) | 1.27 | .48 | .20 |
| Distributions: | | | | | |
| Dividends from investment income—net | (.24) | (.16) | (.64) | (.50) | (.71) |
| Dividends from net realized | | | | | |
| gain on investments | — | (.10) | — | — | (.14) |
| Total Distributions | (.24) | (.26) | (.64) | (.50) | (.85) |
| Net asset value, end of period | 12.83 | 11.98 | 12.30 | 11.67 | 11.69 |
| Total Return (%) | 9.23 | (.54) | 11.01 | 4.24 | 1.51 |
| Ratios/Supplemental Data (%): | | | | | |
| Ratio of total expenses | | | | | |
| to average net assets | .79 | .87 | 1.04 | 2.10 | 1.88 |
| Ratio of net expenses | | | | | |
| to average net assets | .71 | .55 | .55 | .53 | .55 |
| Ratio of net investment income | | | | | |
| to average net assets | 2.63 | .73 | 6.39 | 1.83 | 2.18 |
| Portfolio Turnover Rate | 61.50 | 77.13 | 90.18 | 18.17 | 60.82 |
| Net Assets, end of period ($ x 1,000) | 42,846 | 40,557 | 26,830 | 2,538 | 3,269 |
| |
| a Based on average shares outstanding at each month end. | | | | |
| See notes to financial statements. | | | | | |
FINANCIAL HIGHLIGHTS (continued)
| | | | | |
| | | Year Ended July 31, | |
| Institutional Shares | 2010 | 2009 | 2008 | 2007 | 2006 |
| Per Share Data ($): | | | | | |
| Net asset value, beginning of period | 11.97 | 12.30 | 11.66 | 11.68 | 12.35 |
| Investment Operations: | | | | | |
| Investment income—neta | .37 | .11 | .84 | .24 | .29 |
| Net realized and unrealized | | | | | |
| gain (loss) on investments | .77 | (.15) | .48 | .26 | (.07) |
| Total from Investment Operations | 1.14 | (.04) | 1.32 | .50 | .22 |
| Distributions: | | | | | |
| Dividends from investment income—net | (.28) | (.19) | (.68) | (.52) | (.75) |
| Dividends from net realized | | | | | |
| gain on investments | — | (.10) | — | — | (.14) |
| Total Distributions | (.28) | (.29) | (.68) | (.52) | (.89) |
| Net asset value, end of period | 12.83 | 11.97 | 12.30 | 11.66 | 11.68 |
| Total Return (%) | 9.58 | (.30) | 11.29 | 4.47 | 1.82 |
| Ratios/Supplemental Data (%): | | | | | |
| Ratio of total expenses | | | | | |
| to average net assets | .44 | .55 | .77 | 1.83 | 1.63 |
| Ratio of net expenses | | | | | |
| to average net assets | .42 | .30 | .30 | .28 | .30 |
| Ratio of net investment income | | | | | |
| to average net assets | 2.97 | .98 | 6.68 | 2.08 | 2.43 |
| Portfolio Turnover Rate | 61.50 | 77.13 | 90.18 | 18.17 | 60.82 |
| Net Assets, end of period ($ x 1,000) | 105,864 | 24,577 | 13,740 | 2,693 | 3,463 |
| |
| a Based on average shares outstanding at each month end. | | | | |
| See notes to financial statements. | | | | | |
16
NOTES TO FINANCIAL STATEMENTS
NOTE 1—Significant Accounting Policies:
Dreyfus Inflation Adjusted Securities Fund (the “fund”) is a separate diversified series of Dreyfus Investment Grade Funds, Inc. (the “Company”), which is registered under the Investment Company Act of 1940, as amended (the “Act”), as an open-end management investment company and operates as a series company currently offering three series, including the fund.The fund’s investment objective seeks returns that exceed the rate of inflation. The Dreyfus Corporation (the “Manager” or “Dreyfus”), a wholly-owned subsidiary of The Bank of New York Mellon Corporation (“BNY Mellon”), serves as the fund’s investment adviser.
MBSC Securities Corporation (the “Distributor”), a wholly-owned subsidiary of the Manager, is the distributor of the fund’s shares, which are sold to the public without a sales charge.The fund is authorized to issue 500 million shares of $.001 par value Common Stock in each of the following classes of shares: Investor and Institutional. Investor shares are subject to a shareholder services plan. Other differences between the classes include the services offered to and the expenses borne by each class, the allocation of certain transfer agency costs, the minimum initial investment and certain voting rights. Income, expenses (other than expenses attributable to a specific class), and realized and unrealized gains or losses on investments are allocated to each class of shares based on its relative net assets.
The Company accounts separately for the assets, liabilities and operations of each series. Expenses directly attributable to each series are charged to that series’ operations; expenses which are applicable to all series are allocated among them on a pro rata basis.
The Financial Accounting Standards Board (“FASB”) Accounting Standards Codification (“ASC”) has become the exclusive reference of authoritative U.S. generally accepted accounting principles (“GAAP”) recognized by the FASB to be applied by nongovernmental entities. Rules and interpretive releases of the Securities and Exchange Commission (“SEC”) under authority of federal laws are also sources of authoritative GAAP for SEC registrants. The ASC has superseded
NOTES TO FINANCIAL STATEMENTS (continued)
all existing non-SEC accounting and reporting standards. The fund’s financial statements are prepared in accordance with GAAP, which may require the use of management estimates and assumptions.Actual results could differ from those estimates.
The Company enters into contracts that contain a variety of indemnifications. The fund’s maximum exposure under these arrangements is unknown.The fund does not anticipate recognizing any loss related to these arrangements.
(a) Portfolio valuation: Investments in securities excluding short-term investments (other than U.S.Treasury Bills), are valued each business day by an independent pricing service (the “Service”) approved by the Board of Directors. Investments for which quoted bid prices are readily available and are representative of the bid side of the market in the judgment of the Service are valued at the mean between the quoted bid prices (as obtained by the Service from dealers in such securities) and asked prices (as calculated by the Service based upon its evaluation of the market for such securities). Other investments (which constitute a majority of the portfolio securities) are valued as determined by the Service, based on methods which include consideration of: yields or prices of securities of comparable quality, coupon, maturity and type; indica tions as to values from dealers; and general market conditions. Restricted securities, as well as securities or other assets for which recent market quotations are not readily available, and are not valued by a pricing service approved by the Board of Directors, or are determined by the fund not to reflect accurately fair value, are valued at fair value as determined in good faith under the direction of the Board of Directors. The factors that may be considered when fair valuing a security include fundamental analytical data, the nature and duration of restrictions on disposition, an evaluation of the forces that influence the market in which the securities are purchased and sold and public trading in similar securities of the issuer or comparable issuers. Short-term investments, excluding U.S. Treasury Bills, are carried at amortized cost, which approximates value. Registered investment companies that are not traded on an exchange are valued at their net asset value.
The fair value of a financial instrument is the amount that would be received to sell an asset or paid to transfer a liability in an orderly trans-
18
action between market participants at the measurement date (i.e. the exit price). GAAP establishes a fair value hierarchy that prioritizes the inputs of valuation techniques used to measure fair value.This hierarchy gives the highest priority to unadjusted quoted prices in active markets for identical assets or liabilities (Level 1 measurements) and the lowest priority to unobservable inputs (Level 3 measurements).
Additionally, GAAP provides guidance on determining whether the volume and activity in a market has decreased significantly and whether such a decrease in activity results in transactions that are not orderly. GAAP requires enhanced disclosures around valuation inputs and techniques used during annual and interim periods.
Various inputs are used in determining the value of the fund’s investments relating to fair value measurements.These inputs are summarized in the three broad levels listed below:
Level 1—unadjusted quoted prices in active markets for
identical investments.
Level 2—other significant observable inputs (including quoted
prices for similar investments, interest rates, prepayment speeds,
credit risk, etc.).
Level 3—significant unobservable inputs (including the fund’s own
assumptions in determining the fair value of investments).
The inputs or methodology used for valuing securities are not necessarily an indication of the risk associated with investing in those securities.
The following is a summary of the inputs used as of July 31, 2010 in valuing the fund’s investments:
| | | | |
| | | Level 2—Other | Level 3— | |
| | Level 1— | Significant | Significant | |
| | Unadjusted | Observable Unobservable | |
| | Quoted Prices | Inputs | Inputs | Total |
| Assets ($) | | | | |
| Investments in Securities: | | | |
| Mutual Funds | 276,000 | — | — | 276,000 |
| U.S. Treasury | — | 147,935,682 | — | 147,935,682 |
NOTES TO FINANCIAL STATEMENTS (continued)
In January 2010, FASB issued Accounting Standards Update (“ASU”) No. 2010-06 “Improving Disclosures about FairValue Measurements”. The portions of ASU No. 2010-06 which require reporting entities to prepare new disclosures surrounding amounts and reasons for significant transfers in and out of Level 1 and Level 2 fair value measurements as well as inputs and valuation techniques used to measure fair value for both recurring and nonrecurring fair value measurements that fall in either Level 2 or Level 3 have been adopted by the fund. No significant transfers between Level 1 or Level 2 fair value measurements occurred during the period ended July 31, 2010. The remaining portion of ASU No. 2010-06 requires reporting entities to make new disclosures about information on purchases, sales, issuances and settlements on a gross basis in the reconciliation of activity in Level 3 fair value measurements. These new and revised disclosures are required to be implemented for fiscal years beginning after December 15, 2010. Management is currently evaluating the impact that the adoption of this remaining portion of ASU No. 2010-06 may have on the fund’s financial statement disclosures.
(b) Securities transactions and investment income: Securities transactions are recorded on a trade date basis. Realized gains and losses from securities transactions are recorded on the identified cost basis. Dividend income is recognized on the ex-dividend date and interest income, including, where applicable, accretion of discount and amortization of premium on investments, is recognized on the accrual basis.
The fund has arrangements with the custodian and cash management bank whereby the fund may receive earnings credits when positive cash balances are maintained, which are used to offset custody and cash management fees. For financial reporting purposes, the fund includes net earnings credits as an expense offset in the Statement of Operations.
Pursuant to a securities lending agreement with The Bank of New York Mellon, a subsidiary of BNY Mellon and an affiliate of Dreyfus, the fund may lend securities to qualified institutions. It is the fund’s policy that, at origination, all loans are secured by collateral of at least 102% of the value of U.S. securities loaned and 105% of the value of
20
foreign securities loaned. Collateral equivalent to at least 100% of the market value of securities on loan is maintained at all times. Collateral is either in the form of cash, which can be invested in certain money market mutual funds managed by the Manager, U.S. Government and Agency securities or letters of credit.The fund is entitled to receive all income on securities loaned, in addition to income earned as a result of the lending transaction. Although each security loaned is fully collateralized, the fund bears the risk of delay in recovery of, or loss of rights in, the securities loaned should a borrower fail to return the securities in a timely manner. During the period ended July 31, 2010, The Bank of NewYork Mellon earned $6,491 from lending portfolio securities, pursuant to the securities lending agreement.
(c) Affiliated issuers: Investments in other investment companies advised by Dreyfus are defined as “affiliated” in the Act.
The fund may invest in shares of certain affiliated investment companies also advised or managed by Dreyfus. Investments in affiliated investment companies for the period ended July 31, 2010 were as follows:
| | | | | |
| Affiliated | | | | | |
| Investment | Value | | | Value | Net |
| Company | 7/31/2009 ($) | Purchases ($) | Sales ($) | 7/31/2010 ($) Assets (%) |
| Dreyfus | | | | | |
| Institutional | | | | | |
| Preferred | | | | | |
| Plus Money | | | | | |
| Market | | | | | |
| Fund | 57,000 | 54,500,000 | 54,281,000 | 276,000 | .2 |
| Dreyfus | | | | | |
| Institutional | | | | | |
| Cash | | | | | |
| Advantage | | | | | |
| Plus Fund | 25,842,012 | 31,687,271 | 57,529,283 | — | — |
| Total | 25,899,012 | 86,187,271 | 111,810,283 | 276,000 | .2 |
(d) Dividends to shareholders: It is the policy of the fund to declare dividends daily from investment income-net. Such dividends are paid monthly. Dividends from net realized capital gains, if any, are normally declared and paid annually, but the fund may make distributions on a
NOTES TO FINANCIAL STATEMENTS (continued)
more frequent basis to comply with the distribution requirements of the Internal Revenue Code of 1986, as amended (the “Code”).To the extent that net realized capital gains can be offset by capital loss carryovers, it is the policy of the fund not to distribute such gains. Income and capital gain distributions are determined in accordance with income tax regulations, which may differ from GAAP.
(e) Federal income taxes: It is the policy of the fund to continue to qualify as a regulated investment company, if such qualification is in the best interests of its shareholders, by complying with the applicable provisions of the Code, and to make distributions of taxable income sufficient to relieve it from substantially all federal income and excise taxes.
As of and during the period ended July 31, 2010, the fund did not have any liabilities for any uncertain tax positions. The fund recognizes interest and penalties, if any, related to uncertain tax positions as income tax expense in the Statement of Operations. During the period, the fund did not incur any interest or penalties.
Each of the tax years in the four-year period ended July 31, 2010 remains subject to examination by the Internal Revenue Service and state taxing authorities.
At July 31, 2010, the components of accumulated earnings on a tax basis were as follows: undistributed ordinary income $699,427, accumulated capital losses $419,083 and unrealized appreciation $4,580,022.
The accumulated capital loss carryover is available for federal income tax purposes to be applied against future net securities profits, if any, realized subsequent to July 31, 2010. If not applied, $47,768 of the carryover expires in fiscal 2017 and $371,315 expires in fiscal 2018.
The tax character of distributions paid to shareholders during the fiscal periods ended July 31, 2010 and July 31, 2009 were as follows: ordinary income $2,162,589 and $940,645, respectively.
During the period ended July 31, 2010, as a result of permanent book to tax differences, primarily due to the tax treatment for treasury inflation-protected securities, the fund increased accumulated undis-
22
tributed investment income-net by $174 and decreased accumulated net realized gain (loss) on investments by the same amount. Net assets and net asset value per share were not affected by this reclassification.
NOTE 2—Bank Lines of Credit:
The fund participates with other Dreyfus-managed funds in a $225 million unsecured credit facility led by Citibank, N.A. and a $300 million unsecured credit facility provided by The Bank of New York Mellon (each, a “Facility”), each to be utilized primarily for temporary or emergency purposes, including the financing of redemptions. In connection therewith, the fund has agreed to pay its pro rata portion of commitment fees for each Facility. Interest is charged to the fund based on rates determined pursuant to the terms of the respective Facility at the time of borrowing.
The average amount of borrowings outstanding under the facilities during the period ended July 31, 2010, was approximately $12,300 with a related weighted average annualized interest rate of 1.40%.
NOTE 3—Management Fee and Other Transactions With Affiliates:
(a) Pursuant to a management agreement (“Agreement”) with the Manager, the management fee is computed at the annual rate of .30% of the value of the fund’s average daily net assets and is payable monthly. The Manager had undertaken from August 1, 2009 through December 1, 2009, that, if the aggregate expenses of the fund (exclusive of taxes, brokerage fees, interest expense, commitment fees on borrowings, shareholder services plan fees and extraordinary expenses) exceed an annual rate of .30% of the value of the fund’s average daily net assets, the fund may deduct from the payment to be made to the Manager under the Agreement, or the Manager would bear, such excess expense. The reduction in management fee, pursuant to the undertaking, amounted to $46,265 during the period ended July 31, 2010.
NOTES TO FINANCIAL STATEMENTS (continued)
(b) Under the Investor Shares Shareholder Services Plan, the fund pays the Distributor at an annual rate of .25% of the value of Investor Shares average daily net assets for the provision of certain services. The services provided may include personal services relating to shareholder accounts, such as answering shareholder inquiries regarding the fund and providing reports and other information, and services related to the maintenance of shareholder accounts. The Distributor may make payments to Service Agents (a securities dealer, financial institution or other industry professional) in respect of these services. The Distributor determines the amounts to be paid to Service Agents. During the period ended July 31, 2010, Investor Shares were charged $106,112 pursuant to the Shareholder Services Plan.
The fund compensates DreyfusTransfer, Inc., a wholly-owned subsidiary of the Manager, under a transfer agency agreement for providing personnel and facilities to perform transfer agency services for the fund. During the period ended July 31, 2010, the fund was charged $14,751 pursuant to the transfer agency agreement, which is included in Shareholder servicing costs in the Statement of Operations.
The fund compensates The Bank of New York Mellon under a cash management agreement for performing cash management services related to fund subscriptions and redemptions. During the period ended July 31, 2010, the fund was charged $1,257 pursuant to the cash management agreement, which is included in Shareholder servicing costs in the Statement of Operations. These fees were partially offset by earnings credits of $69.
The fund also compensates The Bank of New York Mellon under a custody agreement for providing custodial services for the fund. During the period ended July 31, 2010, the fund was charged $13,904 pursuant to the custody agreement.
24
During the period ended July 31, 2010, the fund was charged $4,366 for services performed by the Chief Compliance Officer.
The components of “Due to The Dreyfus Corporation and affiliates” in the Statement of Assets and Liabilities consist of: management fees $36,661, shareholder services plan fees $9,031, custodian fees $4,002, chief compliance officer fees $1,341 and transfer agency per account fees $5,650.
(c) Each Board member also serves as a Board member of other funds within the Dreyfus complex. Annual retainer fees and attendance fees are allocated to each fund based on net assets.
NOTE 4—Securities Transactions:
The aggregate amount of purchases and sales (including paydowns) of investment securities, excluding short-term securities, during the period ended July 31, 2010, amounted to $139,830,183 and $61,958,204, respectively.
The provisions of ASC Topic 815 “Derivatives and Hedging” require qualitative disclosures about objectives and strategies for using derivatives, quantitative disclosures about fair value amounts of gains and losses on derivative instruments and disclosures about credit-risk-related contingent features in derivative agreements.The fund held no derivatives during the period ended July 31, 2010. These disclosures did not impact the notes to the financial statements.
At July 31, 2010, the cost of investments for federal income tax purposes was $143,631,660; accordingly, accumulated net unrealized appreciation on investments was $4,580,022, consisting of $5,267,080 gross unrealized appreciation and $687,058 gross unrealized depreciation.
|
| REPORT OF INDEPENDENT REGISTERED |
| PUBLIC ACCOUNTING FIRM |
Shareholders and Board of Directors Dreyfus Inflation Adjusted Securities Fund
We have audited the accompanying statement of assets and liabilities, including the statement of investments, of Dreyfus Inflation Adjusted Securities Fund (one of the series comprising Dreyfus Investment Grade Funds, Inc.), as of July 31, 2010, and the related statement of operations for the year then ended, the statement of changes in net assets for each of the two years in the period then ended, and financial highlights for each of the years indicated therein.These financial statements and financial highlights are the responsibility of the Fund’s management. Our responsibility is to express an opinion on these financial statements and financial highlights based on our audits.
We conducted our audits in accordance with the standards of the Public Company Accounting Oversight Board (United States).Those standards require that we plan and perform the audit to obtain reasonable assurance about whether the financial statements and financial highlights are free of material misstatement. We were not engaged to perform an audit of the Fund’s internal control over financial reporting. Our audits included consideration of internal control over financial reporting as a basis for designing audit procedures that are appropriate in the circumstances, but not for the purpose of expressing an opinion on the effectiveness of the Fund’s internal control over financial reporting. Accordingly, we express no such opinion. An audit also includes examining, on a test basis, evidence supporting the amounts and disclosures in the financial statements and financial highlights, assessing the accounting principles us ed and significant estimates made by management, and evaluating the overall financial statement presentation. Our procedures included confirmation of securities owned as of July 31, 2010 by correspondence with the custodian and others. We believe that our audits provide a reasonable basis for our opinion.
In our opinion, the financial statements and financial highlights referred to above present fairly, in all material respects, the financial position of Dreyfus Inflation Adjusted Securities Fund at July 31, 2010, the results of its operations for the year then ended, the changes in its net assets for each of the two years in the period then ended, and the financial highlights for each of the indicated years, in conformity with U.S. generally accepted accounting principles.

New York, New York
September 20, 2010
26
IMPORTANT TAX INFORMATION (Unaudited)
For federal tax purposes the fund hereby designates 100% of ordinary dividends paid during the fiscal year ended July 31, 2010 as qualifying “interest related dividends.” Also for state individual income tax purposes, the fund hereby designates 100% of the ordinary income dividends paid during the fiscal year ended July 31, 2010 as attributable to interest income from direct obligations of the United States. Such dividends are currently exempt from taxation for individual income tax purposes in most states, including New York, California and the District of Columbia.
PROXY RESULTS (Unaudited)
Dreyfus Investment Grade Funds, Inc. held a special meeting of shareholders on October 9, 2009.The proposal considered at the meeting, and the results, are as follows:
| | | |
| | | Shares | |
| | Votes For | | Authority Withheld |
| To elect additional Board Members: | | | |
| Clifford L. Alexander, Jr. | 69,338,387 | | 3,729,000 |
| Joseph S. DiMartino | 69,406,095 | | 3,661,292 |
| Nathan Leventhal | 69,385,853 | | 3,681,534 |
| Benaree Pratt Wiley | 69,333,345 | | 3,734,042 |
|
| INFORMATION ABOUT THE REVIEW AND APPROVAL OF |
| THE FUND’S MANAGEMENT AGREEMENT (Unaudited) |
At a meeting of the Board of Directors for the fund held on July 14 and 15, 2010, the Board considered the re-approval for an annual period (through July 29, 2011) of the Management Agreement with Dreyfus for the fund, pursuant to which Dreyfus provides the fund with investment advisory and administrative services. The Board members, none of whom are “interested persons” (as defined in the Investment Company Act of 1940, as amended) of the fund, were assisted in their review by independent legal counsel and met with counsel in executive session separate from representatives of Dreyfus.
Analysis of Nature, Extent and Quality of Services Provided to the Fund. The Board members received a presentation from representatives of Dreyfus regarding services provided to the fund and other funds in the Dreyfus fund complex, and discussed the nature, extent and quality of the services provided to the fund pursuant to its Management Agreement. Dreyfus’ representatives reviewed the fund’s distribution of accounts and the relationships Dreyfus has with various intermediaries and the different needs of each. Dreyfus’ representatives noted the distribution channels for the fund as well as the diversity of distribution among the funds in the Dreyfus fund complex, and Dreyfus’ corresponding need for broad, deep and diverse resources to be able to provide ongoing shareholder services to each distribution channel, including those of the fund. Dreyfus also provided the number of shareholder accounts in the fund, as well as the fund’s asset size.
The Board members also considered Dreyfus’ research and portfolio management capabilities and that Dreyfus also provides oversight of day-to-day fund operations, including fund accounting and administration and assistance in meeting legal and regulatory requirements. The Board members also considered Dreyfus’ extensive administrative, accounting and compliance infrastructure.The Board also considered Dreyfus’ brokerage policies and practices and the standards applied in seeking best execution.
28
Comparative Analysis of the Fund’s Performance and Management Fee and Expense Ratio. The Board members reviewed the fund’s performance and comparisons to a group of retail front-end load and no-load Treasury inflation-protected securities funds (the “Performance Group”) and to a larger universe of funds, consisting of all retail and institutional Treasury inflation-protected securities funds (the “Performance Universe”), selected and provided by Lipper, Inc., an independent provider of investment company data.The Board was provided with a description of the methodology Lipper used to select the Performance Group and Performance Universe, as well as the Expense Group and Expense Universe (discussed below).The Board members discussed the results of the comparisons for various periods ended May 31, 2010.The Board members noted that th e fund’s total return performance was above or at the Performance Group medians, and was above the Performance Universe medians, for the periods shown. The Board members noted that the fund’s yield performance was above the Performance Group and Performance Universe medians for all periods except for the one year periods ended May 31, 2009 and May 31, 2010. Dreyfus also provided a comparison of the fund’s calendar year total returns to the returns of the fund’s benchmark index.
The Board members also discussed the fund’s management fee and expense ratio and reviewed the range of management fees and expense ratios as compared to a comparable group of funds (the “Expense Group”) and a broader group of funds (the “Expense Universe”), each selected and provided by Lipper.The Board members noted that the fund’s contractual management fee was lower than the Expense Group median, and that the actual management fee and expense ratio were lower than the Expense Group and Expense Universe medians. The Board noted that the fund’s actual management fee and expense ratio were lower due to an undertaking by Dreyfus to waive fees and reimburse expenses.
|
| INFORMATION ABOUT THE REVIEW AND APPROVAL OF THE |
| FUND’S MANAGEMENT AGREEMENT (Unaudited) (continued) |
Representatives of Dreyfus stated that there were no other mutual funds managed by Dreyfus or its affiliates with similar investment objectives, policies and strategies as the fund, and reviewed with the Board other accounts managed by Dreyfus or its affiliates with similar investment objectives, policies and strategies as the fund (the “Similar Accounts”). Dreyfus representatives explained the nature of the Similar Accounts and the differences in providing services to such Similar Accounts as compared to managing and providing services to the fund. The Board analyzed differences in fees paid to Dreyfus and discussed the relationship of the fees paid in light of the services provided.The Board members considered the relevance of the fee information provided for the Similar Accounts to evaluate the appropriateness and reasonableness of the fund’s management fee.
Analysis of Profitability and Economies of Scale. Dreyfus’ representatives reviewed the dollar amount of expenses allocated and profit received by Dreyfus and the method used to determine such expenses and profit. The Board previously had been provided with information prepared by an independent consulting firm regarding Dreyfus’ approach to allocating costs to, and determining the profitability of, individual funds and the entire Dreyfus mutual fund complex.The Board members also had been informed that the methodology had been reviewed by an independent registered public accounting firm which, like the consultant, found the methodology to be reasonable. The consulting firm also analyzed where any economies of scale might emerge in connection with the management of the fund.The Board members evaluated the profitability analysis in light of the relevan t circumstances for the fund and the extent to which economies of scale would be realized if the fund grows and whether fee levels reflect these economies of scale for the benefit of fund investors.The Board members also considered potential benefits to Dreyfus from acting as investment adviser and noted that there were no soft dollar arrangements with respect to trading the fund’s investments.
30
It was noted that the Board members should consider Dreyfus’ profitability with respect to the fund as part of their evaluation of whether the fee under the Management Agreement bears a reasonable relationship to the mix of services provided by Dreyfus, including the nature, extent and quality of such services and that a discussion of economies of scale is predicated on increasing assets and that,if a fund’s assets had been decreasing, the possibility that Dreyfus may have realized any economies of scale would be less. It also was noted that Dreyfus did not realize a profit on the fund’s operations.The Board also noted the fee waiver and expense reimbursement arrangement and its effect on Dreyfus’ profitability.
At the conclusion of these discussions, the Board agreed that it had been furnished with sufficient information to make an informed business decision with respect to continuation of the Management Agreement. Based on the discussions and considerations as described above, the Board made the following conclusions and determinations.
The Board concluded that the nature, extent and quality of the services provided by Dreyfus are adequate and appropriate.
The Board generally was satisfied with the fund’s performance.
The Board concluded that the fee paid by the fund to Dreyfus was reasonable in light of the services provided, comparative performance, expense and management fee information, costs of the services pro- vided and profits to be realized and benefits derived or to be derived by Dreyfus from its relationship with the fund.
The Board determined that the economies of scale which may accrue to Dreyfus and its affiliates in connection with the management of the fund had been adequately considered by Dreyfus in connection with the management fee rate charged to the fund and that, to the extent in the future it were determined that material economies of scale had not been shared with the fund, the Board would seek to have those economies of scale shared with the fund.
|
| INFORMATION ABOUT THE REVIEW AND APPROVAL OF THE |
| FUND’S MANAGEMENT AGREEMENT (Unaudited) (continued) |
The Board members considered these conclusions and determinations, along with information received on a routine and regular basis throughout the year, and, without any one factor being dispositive, the Board determined that re-approval of the Management Agreement was in the best interests of the fund and its shareholders.
32
BOARD MEMBERS INFORMATION (Unaudited)
|
| Whitney I. Gerard (75) |
| Board Member (1993) |
| Principal Occupation During Past 5Years: |
| • Partner of Chadbourne & Parke LLP |
| No. of Portfolios for which Board Member Serves: 26 |
BOARD MEMBERS INFORMATION (Unaudited) (continued)
Once elected all Board Members serve for an indefinite term, but achieve Emeritus status upon reaching age 80.The address of the Board Members and Officers is in c/o The Dreyfus Corporation, 200 Park Avenue, NewYork, NewYork 10166.Additional information about the Board Members is available in the fund’s Statement of Additional Information which can be obtained from Dreyfus free of charge by calling this toll free number: 1-800-554-4611.
|
| Lucy Wilson Benson, Emeritus Board Member |
| Arthur A. Hartman, Emeritus Board Member |
34
OFFICERS OF THE FUND (Unaudited)

OFFICERS OF THE FUND (Unaudited) (continued)

36

For More Information

|
| Telephone 1-800-645-6561 |
| Mail The Dreyfus Family of Funds, 144 Glenn Curtiss Boulevard, Uniondale, NY 11556-0144 |
| E-mail Send your request to info@dreyfus.com |
| Internet Information can be viewed online or downloaded at: http://www.dreyfus.com |
The fund files its complete schedule of portfolio holdings with the Securities and Exchange Commission (“SEC”) for the first and third quarters of each fiscal year on Form N-Q. The fund’s Forms N-Q are available on the SEC’s website at http://www.sec.gov and may be reviewed and copied at the SEC’s Public Reference Room in Washington, DC. Information on the operation of the Public Reference Room may be obtained by calling 1-800-SEC-0330.
A description of the policies and procedures that the fund uses to determine how to vote proxies relating to portfolio securities, and information regarding how the fund voted these proxies for the most recent 12-month period ended June 30 is available at http://www.dreyfus.com and on the SEC’s website at http://www.sec.gov. The description of the policies and procedures is also available without charge, upon request, by calling 1-800-645-6561.

|
| Dreyfus |
| Intermediate |
| Term Income Fund |
ANNUAL REPORT July 31, 2010

Save time. Save paper. View your next shareholder report online as soon as it’s available. Log into www.dreyfus.com and sign up for Dreyfus eCommunications. It’s simple and only takes a few minutes.
The views expressed in this report reflect those of the portfolio manager only through the end of the period covered and do not necessarily represent the views of Dreyfus or any other person in the Dreyfus organization. Any such views are subject to change at any time based upon market or other conditions and Dreyfus disclaims any responsibility to update such views.These views may not be relied on as investment advice and, because investment decisions for a Dreyfus fund are based on numerous factors, may not be relied on as an indication of trading intent on behalf of any Dreyfus fund.

| | Contents |
| | THE FUND |
| 2 | A Letter from the Chairman and CEO |
| 3 | Discussion of Fund Performance |
| 6 | Fund Performance |
| 8 | Understanding Your Fund’s Expenses |
| 8 | Comparing Your Fund’s Expenses With Those of Other Funds |
| 9 | Statement of Investments |
| 30 | Statement of Financial Futures |
| 30 | Statement of Options Written |
| 31 | Statement of Assets and Liabilities |
| 32 | Statement of Operations |
| 33 | Statement of Changes in Net Assets |
| 35 | Financial Highlights |
| 39 | Notes to Financial Statements |
| 59 | Report of Independent Registered Public Accounting Firm |
| 60 | Important Tax Information |
| 60 | Proxy Results |
| 61 | Information About the Review and Approval of the Fund’s Management Agreement |
| 66 | Board Members Information |
| 68 | Officers of the Fund |
| | FOR MORE INFORMATION |
| | Back Cover |
|
| Dreyfus |
| Intermediate |
| Term Income Fund |
The Fund

A LETTER FROM THE CHAIRMAN AND CEO
Dear Shareholder:
We are pleased to present this annual report for Dreyfus Intermediate Term Income Fund, covering the 12-month period from August 1, 2009, through July 31, 2010.
For the reporting period as a whole, both bond and equity markets continued to stage a sustained but mild recovery, with higher-yielding bond market sectors generally producing more robust returns than broader fixed-income market averages. However, during the second quarter of 2010 in particular,renewed market volatility caused significant headwinds for equity markets and, to a lesser extent, higher-yielding sectors of the bond markets.Traditional safe havens like U.S.Treasury securities gained value as investors grew more risk averse when developments in overseas markets—including a sovereign debt crisis in Europe and inflation concerns in China—threatened to dampen global economic growth.
Despite these seemingly uncertain markets, many economists, including our own Chief Economist, do not anticipate a “double-dip” recession. Instead, we expect current financial strains to ease and the domestic economy to expand, albeit at a more moderate rate than previously anticipated, over the second half of the year. We still remain cautious about the current market and economic environment and believe that for most investors a long-term investment approach focusing on high quality and diversification between stocks and bonds, relative to individual needs, is appropriate. Given today’s ever-changing markets, we recommend meeting with your financial advisor, since they are best suited to help you assess both the risks and potential opportunities provided by the fixed-income and stock markets in this investment climate.
For information about how the fund performed during the reporting period, as well as general market perspectives, we provide a Discussion of Fund Performance on the pages that follow.
Thank you for your continued confidence and support.

Jonathan R. Baum
Chairman and Chief Executive Officer
The Dreyfus Corporation
August 16, 2010
2

DISCUSSION OF FUND PERFORMANCE
For the period of August 1, 2009, through July 31, 2010, as provided by David Bowser, CFA, and Peter Vaream, Portfolio Managers
Fund and Market Performance Overview
For the 12-month period ended July 31, 2010, Dreyfus Intermediate Term Income Fund’s Class A shares produced a total return of 14.29%, Class B shares returned 13.72%, Class C shares returned 13.40% and Class I shares returned 14.52%.1 In comparison, the fund’s benchmark, the Barclays Capital U.S. Aggregate Bond Index, achieved a total return of 8.91% for the same period.2 Higher-yielding sectors of the bond market rallied over most of the reporting period before suffering heightened volatility during the spring of 2010, when investors began to question the sustainability of the global economic recovery.The fund produced higher returns than its benchmark for the reporting period overall, primarily due to strong results from its positions in commercial mortgage-backed securities, investment-grade corporate bonds and high yield securities.
The Fund’s Investment Approach
The fund seeks to maximize total return, consisting of capital appreciation and current income.To pursue this goal, the fund normally invests at least 80% of its assets in fixed-income securities of U.S. and foreign issuers rated at least investment grade or the unrated equivalent as determined by Dreyfus.These securities include: U.S. government bonds and notes, corporate bonds, municipal bonds, convertible securities, preferred stocks, inflation-indexed securities, asset-backed securities, mortgage-related securities and foreign bonds.Typically, the fund can be expected to have an average effective maturity ranging from five to 10 years, and an average effective duration ranging between three and eight years. For additional yield, the fund may invest up to 20% of its assets in fixed-income securities rated below investment grade.
Economic Recovery Lifted U.S. Bond Market
The reporting period began in the midst of an economic recovery as manufacturing activity increased, housing prices appeared to bottom and the labor market showed early evidence of modest improvement. The domestic economic rebound was sparked, in part, by historically low short-term interest rates from the Federal Reserve Board and a massive
DISCUSSION OF FUND PERFORMANCE (continued)
stimulus program adopted by the U.S. government. Improving economic conditions helped boost prices of higher-yielding fixed-income securities, including investment-grade corporate bonds and commercial mortgage-backed securities. In contrast, U.S. government securities lagged market averages as investors favored riskier investments.
However, investor sentiment changed during the spring of 2010, when a number of developments brought the strength and sustainability of the global economic recovery into question. In Europe, Greece found itself unable to finance a heavy debt load, requiring intervention from the International Monetary Fund and other members of the European Union. Meanwhile, surging property values in China kindled local inflation fears, and investors grew concerned that potential remedial measures might constrain a major engine of global growth.The United States also encountered greater economic uncertainty when retail sales, employment and housing data sent mixed signals to investors.
As a result of these developments, higher-yielding market sectors lost value, giving back a portion of the reporting period’s previous gains before exhibiting renewed strength in July. Conversely, traditionally defensive U.S. government securities generally rallied in the spring. High-quality commercial mortgage-backed securities proved to be an exception to this trend, as improved conditions in U.S. commercial real estate markets provided consistent price support.
Fund Participated Fully in Market Rally
Although the fund was affected by weakness in higher-yielding market sectors in the spring, several strategies helped it out perform its benchmark in the market rally over most of the reporting period. Chief among them was overweighted exposure to high-quality commercial mortgage-backed securities, which climbed from depressed levels as investor confidence strengthened.To a lesser degree, favorable timing of trades among residential mortgage-backed securities also produced above-average results. In addition, a “short” position in the euro enabled the fund to profit from the currency’s relative weakness as the sovereign debt crisis intensified.
We utilizedTreasury futures to facilitate interest rate duration and yield curve strategies. Duration and yield curve positions were both positive contributors to performance for the year. In addition, we bought and sold options on interest rate instruments. Our primary trade consisted of selling options on Treasuries to take advantage of cheaply priced volatility in the market.
4
Our interest-rate strategies also proved successful, mainly due to a relatively long average duration and a “bulleted” focus on bonds in the seven- to 10-year maturity range, where yield differences remained relatively steep.
Maintaining a Disciplined Approach to Security Selection
As of the reporting period’s end, we believe that the U.S. economy is unlikely to fall into another recession, but the continued expansion probably will remain slower and choppier than most previous recoveries. Therefore, we have reduced the fund’s exposure to higher-yielding market sectors, especially corporate bonds, to more modestly overweighted positions.We have correspondingly increased the fund’s holdings of U.S. government securities, includingTreasuries and mortgage-backed securities backed by U.S. government agencies. We also have eliminated the fund’s short position against the euro. In our judgment, these are prudent strategies in today’s uncertain economic climate.
August 16, 2010
Bond funds are subject generally to interest rate, credit, liquidity and market risks, to varying degrees, all of which are more fully described in the fund’s prospectus. Generally, all other factors being equal, bond prices are inversely related to interest-rate changes, and rate increases can cause price declines.
High yield bonds are subject to increased credit risk and are considered speculative in terms of the issuer’s perceived ability to continue making interest payments on a timely basis and to repay principal upon maturity.
The fund may use derivative instruments, such as options, futures and options on futures, forward contracts, swaps (including credit default swaps on corporate bonds and asset-backed securities), options on swaps and other credit derivatives.A small investment in derivatives could have a potentially large impact on the fund’s performance.The use of derivatives involves risks different from, or possibly greater than, the risks associated with investing directly in the underlying assets.
| |
| 1 | Total return includes reinvestment of dividends and any capital gains paid, and does not take into |
| | consideration the maximum initial sales charge in the case of Class A shares, or the applicable |
| | contingent deferred sales charges imposed on redemptions in the case of Class B and Class C |
| | shares. Had these charges been reflected, returns would have been lower.The Dreyfus Corporation |
| | has undertaken to waive receipt of its fees and/or assume the expenses of the fund from August 1, |
| | 2009, to December 31, 2009, so that the total annual operating expenses of Class A and Class |
| | I shares (excluding taxes, interest, brokerage commissions, commitment fees on borrowings and |
| | extraordinary expenses) do not exceed 0.85% for Class A and 0.53% for Class I respectively. |
| | The Dreyfus Corporation may terminate this undertaking upon at least 90 days’ prior notice to |
| | investors. Past performance is no guarantee of future results. Share price, yield and investment |
| | return fluctuate such that upon redemption, fund shares may be worth more or less than their |
| | original cost. |
| 2 | SOURCE: LIPPER INC. — Reflects reinvestment of dividends and, where applicable, capital |
| | gain distributions.The Barclays Capital U.S.Aggregate Bond Index is a widely accepted, |
| | unmanaged total return index of corporate, U.S. government and U.S. government agency debt |
| | instruments, mortgage-backed securities and asset-backed securities with an average maturity of |
| | 1-10 years. Investors cannot invest directly in any index. |
FUND PERFORMANCE

|
| Comparison of change in value of $10,000 investment in Dreyfus Intermediate Term Income |
| Fund Class A shares and the Barclays Capital U.S. Aggregate Index |
| † Source: Lipper Inc. |
| Past performance is not predictive of future performance. |
| The above graph compares a $10,000 investment made in Class A shares of Dreyfus Intermediate Term Income Fund |
| on 7/31/00 to a $10,000 investment made in the Barclays Capital U.S.Aggregate Index (the “Index”) on that date. |
| All dividends and capital gain distributions are reinvested. |
| The fund invests primarily in debt securities and securities with debt-like characteristics of domestic and foreign issuers |
| and maintains an average effective maturity ranging between five and ten years and an average effective duration |
| ranging between three and eight years. The fund’s performance shown in the line graph takes into account all applicable |
| fees and expenses. Performance for Class B, Class C and Class I shares will vary from the performance of Class A |
| shares shown above due to differences in charges and expenses. The Index is a widely accepted, unmanaged total return |
| index of corporate, U. S. government and U. S. government agency debt instruments, mortgage-backed securities and |
| asset-backed securities with an average maturity of 1-10 years. Unlike a mutual fund, the Index is not subject to |
| charges, fees and other expenses. Investors cannot invest directly in any index. Further information relating to fund |
| performance, including expense reimbursements, if applicable, is contained in the Financial Highlights section of the |
| prospectus and elsewhere in this report. |
6
| | | | | | |
| Average Annual Total Returns as of 7/31/10 | | | | |
| |
| | Inception | | | | | From |
| | Date | 1 Year | 5 Years | 10 Years | Inception |
| Class A shares | | | | | | |
| with maximum sales charge (4.5%) | 2/2/96 | 9.11% | 4.69% | 5.52% | | — |
| without sales charge | 2/2/96 | 14.29% | 5.66% | 6.01% | | — |
| Class B shares | | | | | | |
| with applicable redemption charge † | 5/13/08 | 9.72% | 5.01%††† | 6.01%†††,†††† | — |
| without redemption | 5/13/08 | 13.72% | 5.33%††† | 6.01%†††,†††† | — |
| Class C shares | | | | | | |
| with applicable redemption charge †† | 5/13/08 | 12.40% | 5.28%††† | 5.82%††† | — |
| without redemption | 5/13/08 | 13.40% | 5.28%††† | 5.82%††† | — |
| Class I shares | 5/31/01 | 14.52% | 5.95% | — | | 5.67% |
| Barclays Capital | | | | | | |
| U.S. Aggregate Index††††† | 5/31/01 | 8.91% | 5.96% | 6.48% | | 6.01% |
Past performance is not predictive of future performance.The fund’s performance shown in the graph and table does not reflect the deduction of taxes that a shareholder would pay on fund distributions or the redemption of fund shares.
| |
| † | The maximum contingent deferred sales charge for Class B shares is 4%.After six years Class B shares convert to |
| | Class A shares. |
| †† | The maximum contingent deferred sales charge for Class C shares is 1% for shares redeemed within one year of |
| | the date of purchase. |
| ††† | The total return performance figures presented for Class B and Class C shares of the fund represent the |
| | performance of the fund’s Class A shares for periods prior to 5/13/08 (the inception date for Class B and |
| | Class C shares), adjusted to reflect the applicable sales load for each share class. |
| †††† | Assumes the conversion of Class B shares to Class A shares at the end of the sixth year following the |
| | date of purchase. |
| ††††† The Index date is based on the life of Class I shares. |
UNDERSTANDING YOUR FUND’S EXPENSES (Unaudited)
As a mutual fund investor, you pay ongoing expenses, such as management fees and other expenses. Using the information below, you can estimate how these expenses affect your investment and compare them with the expenses of other funds.You also may pay one-time transaction expenses, including sales charges (loads) and redemption fees, which are not shown in this section and would have resulted in higher total expenses. For more information, see your fund’s prospectus or talk to your financial adviser.
Review your fund’s expenses
The table below shows the expenses you would have paid on a $1,000 investment in Dreyfus Intermediate Term Income Fund from February 1, 2010 to July 31, 2010. It also shows how much a $1,000 investment would be worth at the close of the period, assuming actual returns and expenses.
|
| Expenses and Value of a $1,000 Investment |
| assuming actual returns for the six months ended July 31, 2010 |
| | | | |
| | Class A | Class B | Class C | Class I |
| Expenses paid per $1,000† | $ 4.60 | $ 7.80 | $ 8.51 | $ 3.17 |
| Ending value (after expenses) | $1,059.40 | $1,056.50 | $1,055.40 | $1,060.10 |
|
| COMPARING YOUR FUND’S EXPENSES |
| WITH THOSE OF OTHER FUNDS (Unaudited) |
Using the SEC’s method to compare expenses
The Securities and Exchange Commission (SEC) has established guidelines to help investors assess fund expenses. Per these guidelines, the table below shows your fund’s expenses based on a $1,000 investment, assuming a hypothetical 5% annualized return. You can use this information to compare the ongoing expenses (but not transaction expenses or total cost) of investing in the fund with those of other funds.All mutual fund shareholder reports will provide this information to help you make this comparison. Please note that you cannot use this information to estimate your actual ending account balance and expenses paid during the period.
|
| Expenses and Value of a $1,000 Investment |
| assuming a hypothetical 5% annualized return for the six months ended July 31, 2010 |
| | | | |
| | Class A | Class B | Class C | Class I |
| Expenses paid per $1,000† | $ 4.51 | $ 7.65 | $ 8.35 | $ 3.11 |
| Ending value (after expenses) | $1,020.33 | $1,017.21 | $1,016.51 | $1,021.72 |
|
| † Expenses are equal to the fund’s annualized expense ratio of .90% for Class A, 1.53% for Class B, 1.67% for |
| Class C and .62% for Class I, multiplied by the average account value over the period, multiplied by 181/365 (to |
| reflect the one-half year period). |
8
| | | | | |
| STATEMENT OF INVESTMENTS | | | | |
| July 31, 2010 | | | | | |
| |
| |
| |
| | Coupon | Maturity | Principal | | |
| Bonds and Notes—108.9% | Rate (%) | Date | Amount ($) | | Value ($) |
| Advertising—.3% | | | | | |
| Lamar Media, | | | | | |
| Gtd. Notes | 6.63 | 8/15/15 | 3,493,000 | a | 3,493,000 |
| Agriculture—.6% | | | | | |
| Altria Group, | | | | | |
| Gtd. Notes | 9.70 | 11/10/18 | 5,100,000 | | 6,691,929 |
| Philip Morris International, | | | | | |
| Sr. Unscd. Notes | 5.65 | 5/16/18 | 1,400,000 | | 1,581,059 |
| | | | | | 8,272,988 |
| Asset-Backed Ctfs./ | | | | | |
| Auto Receivables—2.8% | | | | | |
| Ally Auto Receivables Trust, | | | | | |
| Ser. 2010-1, Cl. B | 3.29 | 3/15/15 | 3,975,000 | b | 4,042,178 |
| Americredit Automobile Receivables | | | | | |
| Trust, Ser. 2010-1, Cl. C | 5.19 | 8/17/15 | 1,395,000 | | 1,468,784 |
| Americredit Automobile Receivables | | | | | |
| Trust, Ser. 2007-CM, Cl. A3A | 5.42 | 5/7/12 | 550,677 | | 552,863 |
| Americredit Prime Automobile | | | | | |
| Receivables, Ser. 2007-1, Cl. B | 5.35 | 9/9/13 | 70,000 | | 72,166 |
| Americredit Prime Automobile | | | | | |
| Receivables, Ser. 2007-1, Cl. C | 5.43 | 2/10/14 | 70,000 | | 72,194 |
| Americredit Prime Automobile | | | | | |
| Receivables, Ser. 2007-1, Cl. E | 6.96 | 3/8/16 | 6,504,306 | b | 6,216,718 |
| Capital Auto Receivables Asset | | | | | |
| Trust, Ser. 2007-1, Cl. D | 6.57 | 9/16/13 | 1,708,000 | b | 1,789,187 |
| Capital One Auto Finance Trust, | | | | | |
| Ser. 2007-B, Cl. A3B | 0.34 | 4/15/12 | 93,261 | c | 93,242 |
| Carmax Auto Owner Trust, | | | | | |
| Ser. 2010-1, Cl. B | 3.75 | 12/15/15 | 980,000 | | 1,011,332 |
| Chrysler Financial Lease Trust, | | | | | |
| Ser. 2010-A, Cl. C | 4.49 | 9/16/13 | 2,600,000 | b | 2,602,754 |
| Ford Credit Auto Owner Trust, | | | | | |
| Ser. 2006-C, Cl. C | 5.47 | 9/15/12 | 340,000 | | 352,911 |
| Ford Credit Auto Owner Trust, | | | | | |
| Ser. 2007-A, Cl. D | 7.05 | 12/15/13 | 5,100,000 | b | 5,413,931 |
| Ford Credit Auto Owner Trust, | | | | | |
| Ser. 2006-B, Cl. D | 7.12 | 2/15/13 | 1,600,000 | b | 1,652,446 |
| Franklin Auto Trust, | | | | | |
| Ser. 2008-A, Cl. B | 6.10 | 5/20/16 | 2,970,000 | b | 3,054,853 |
STATEMENT OF INVESTMENTS (continued)
| | | | | |
| | Coupon | Maturity | Principal | | |
| Bonds and Notes (continued) | Rate (%) | Date | Amount ($) | | Value ($) |
| Asset-Backed Ctfs./ | | | | | |
| Auto Receivables (continued) | | | | | |
| Hyundai Auto Receivables Trust, | | | | | |
| Ser. 2006-B, Cl. C | 5.25 | 5/15/13 | 252,286 | | 254,502 |
| JPMorgan Auto Receivables Trust, | | | | | |
| Ser. 2008-A, Cl. CFTS | 5.22 | 7/15/15 | 1,576,034 | b | 1,510,671 |
| JPMorgan Auto Receivables Trust, | | | | | |
| Ser. 2008-A, Cl. D | 5.22 | 7/15/15 | 2,156,744 | b | 2,166,395 |
| Wachovia Auto Loan Owner Trust, | | | | | |
| Ser. 2007-1, Cl. C | 5.45 | 10/22/12 | 1,876,000 | | 1,921,837 |
| Wachovia Auto Loan Owner Trust, | | | | | |
| Ser. 2007-1, Cl. D | 5.65 | 2/20/13 | 1,160,000 | | 1,175,996 |
| | | | | | 35,424,960 |
| Asset-Backed Ctfs./ | | | | | |
| Home Equity Loans—1.6% | | | | | |
| Ameriquest Mortgage Securities, | | | | | |
| Ser. 2003-11, Cl. AF6 | 5.14 | 1/25/34 | 735,033 | c | 742,429 |
| Bayview Financial Acquisition | | | | | |
| Trust, Ser. 2005-B, Cl. 1A6 | 5.21 | 4/28/39 | 3,508,686 | c | 3,325,866 |
| Carrington Mortgage Loan Trust, | | | | | |
| Ser. 2005-NC5, Cl. A2 | 0.65 | 10/25/35 | 2,481,689 | c | 2,347,388 |
| Citicorp Residential Mortgage | | | | | |
| Securities, Ser. 2006-1, Cl. A3 | 5.71 | 7/25/36 | 2,255,501 | c | 2,264,679 |
| Citigroup Mortgage Loan Trust, | | | | | |
| Ser. 2005-HE1, Cl. M1 | 0.76 | 5/25/35 | 884,245 | c | 874,578 |
| Citigroup Mortgage Loan Trust, | | | | | |
| Ser. 2005-WF1, Cl. A5 | 5.01 | 11/25/34 | 3,531,956 | c | 3,095,904 |
| CS First Boston Mortgage | | | | | |
| Securities, Ser. 2005-FIX1, Cl. A5 | 4.90 | 5/25/35 | 260,591 | c | 222,222 |
| First Franklin Mortgage Loan Asset | | | | | |
| Backed Certificates, | | | | | |
| Ser. 2005-FF2, Cl. M1 | 0.73 | 3/25/35 | 1,818,049 | c | 1,768,397 |
| Home Equity Asset Trust, | | | | | |
| Ser. 2005-2, Cl. M1 | 0.78 | 7/25/35 | 864,620 | c | 856,195 |
| JP Morgan Mortgage Acquisition, | | | | | |
| Ser. 2006-CH2, Cl. AV2 | 0.38 | 10/25/36 | 1,098,287 | c | 1,049,559 |
| Mastr Asset Backed Securities | | | | | |
| Trust, Ser. 2006-AM1, Cl. A2 | 0.46 | 1/25/36 | 395,823 | c | 385,282 |
| Morgan Stanley ABS Capital I, | | | | | |
| Ser. 2004-NC1, Cl. M2 | 2.65 | 12/27/33 | 1,491,667 | c | 1,236,841 |
10
| | | | | |
| | Coupon | Maturity | Principal | | |
| Bonds and Notes (continued) | Rate (%) | Date | Amount ($) | | Value ($) |
| Asset-Backed Ctfs./ | | | | | |
| Home Equity Loans (continued) | | | | | |
| Residential Asset Securities, | | | | | |
| Ser. 2005-EMX4, Cl. A2 | 0.59 | 11/25/35 | 1,741,837 | c | 1,697,158 |
| | | | | | 19,866,498 |
| Asset-Backed Ctfs./ | | | | | |
| Manufactured Housing—.2% | | | | | |
| Conseco Financial, | | | | | |
| Ser. 1994-7, Cl. M1 | 9.25 | 3/15/20 | 258,709 | | 259,709 |
| Origen Manufactured Housing, | | | | | |
| Ser. 2005-B, Cl. A2 | 5.25 | 12/15/18 | 683,365 | | 691,737 |
| Origen Manufactured Housing, | | | | | |
| Ser. 2005-B, Cl. M2 | 6.48 | 1/15/37 | 1,745,000 | | 1,755,932 |
| Vanderbilt Mortgage Finance, | | | | | |
| Ser. 1999-A, Cl. 1A6 | 6.75 | 3/7/29 | 80,000 | c | 81,607 |
| | | | | | 2,788,985 |
| Automobiles—.3% | | | | | |
| Lear, | | | | | |
| Gtd. Bonds | 7.88 | 3/15/18 | 2,235,000 | | 2,335,575 |
| Lear, | | | | | |
| Gtd. Notes | 8.13 | 3/15/20 | 1,090,000 | a | 1,139,050 |
| | | | | | 3,474,625 |
| Banks—5.4% | | | | | |
| BAC Capital Trust XIV, | | | | | |
| Gtd. Notes | 5.63 | 9/29/49 | 4,255,000 | c | 3,010,412 |
| Bank of America, | | | | | |
| Sr. Notes | 5.63 | 7/1/20 | 7,170,000 | | 7,412,188 |
| Citigroup, | | | | | |
| Sr. Unscd. Notes | 5.50 | 4/11/13 | 9,785,000 | | 10,402,825 |
| Citigroup, | | | | | |
| Sr. Unscd. Notes | 6.13 | 5/15/18 | 6,210,000 | | 6,654,102 |
| Credit Suisse, | | | | | |
| Sub. Notes | 5.40 | 1/14/20 | 4,510,000 | | 4,763,521 |
| Discover Bank, | | | | | |
| Sub. Notes | 7.00 | 4/15/20 | 1,750,000 | | 1,866,366 |
| JPMorgan Chase & Co., | | | | | |
| Sr. Unscd. Notes | 6.00 | 1/15/18 | 4,790,000 | | 5,414,592 |
| Manufacturers & Traders Trust, | | | | | |
| Sub. Notes | 5.59 | 12/28/20 | 475,000 | c | 452,698 |
STATEMENT OF INVESTMENTS (continued)
| | | | | |
| | Coupon | Maturity | Principal | | |
| Bonds and Notes (continued) | Rate (%) | Date | Amount ($) | | Value ($) |
| Banks (continued) | | | | | |
| Morgan Stanley, | | | | | |
| Sr. Unscd. Notes | 5.30 | 3/1/13 | 1,680,000 | | 1,793,842 |
| Morgan Stanley, | | | | | |
| Sr. Unscd. Notes | 5.50 | 1/26/20 | 3,300,000 | | 3,321,919 |
| Morgan Stanley, | | | | | |
| Sr. Unscd. Notes | 5.75 | 8/31/12 | 1,180,000 | | 1,258,968 |
| NB Capital Trust IV, | | | | | |
| Gtd. Cap. Secs. | 8.25 | 4/15/27 | 1,290,000 | a | 1,328,700 |
| UBS AG/Stamford, | | | | | |
| Sr. Unscd. Notes | 4.88 | 8/4/20 | 2,445,000 | | 2,469,900 |
| USB Capital IX, | | | | | |
| Gtd. Notes | 6.19 | 10/29/49 | 8,315,000 | c | 6,480,711 |
| Wells Fargo Capital XIII, | | | | | |
| Gtd. Secs. | 7.70 | 12/29/49 | 10,855,000 | c | 11,180,650 |
| | | | | | 67,811,394 |
| Building Materials—.2% | | | | | |
| Masco, | | | | | |
| Sr. Unscd. Bonds | 7.13 | 3/15/20 | 3,090,000 | | 3,152,047 |
| Chemicals—.3% | | | | | |
| Dow Chemical, | | | | | |
| Sr. Unscd. Notes | 8.55 | 5/15/19 | 2,885,000 | | 3,608,838 |
| Coal—.2% | | | | | |
| Consol Energy, | | | | | |
| Gtd. Notes | 8.00 | 4/1/17 | 1,585,000 | b | 1,691,988 |
| Consol Energy, | | | | | |
| Gtd. Notes | 8.25 | 4/1/20 | 1,070,000 | b | 1,155,600 |
| | | | | | 2,847,588 |
| Commercial & Professional | | | | | |
| Services—.6% | | | | | |
| Aramark, | | | | | |
| Gtd. Notes | 8.50 | 2/1/15 | 2,978,000 | a | 3,093,398 |
| Ceridian, | | | | | |
| Gtd. Notes | 11.25 | 11/15/15 | 810,000 | c | 771,525 |
| Iron Mountain, | | | | | |
| Sr. Sub. Notes | 8.38 | 8/15/21 | 3,125,000 | | 3,335,938 |
| | | | | | 7,200,861 |
12
| | | | | |
| | Coupon | Maturity | Principal | | |
| Bonds and Notes (continued) | Rate (%) | Date | Amount ($) | | Value ($) |
| Commercial Mortgage | | | | | |
| Pass-Through Ctfs.—9.6% | | | | | |
| Banc of America Commercial | | | | | |
| Mortgage, Ser. 2004-6, Cl. A5 | 4.81 | 12/10/42 | 2,750,000 | | 2,905,867 |
| Bear Stearns Commercial Mortgage | | | | | |
| Securities, Ser. 2003-T12, Cl. A3 | 4.24 | 8/13/39 | 196,642 | c | 202,552 |
| Bear Stearns Commercial Mortgage | | | | | |
| Securities, Ser. 2004-PWR5, Cl. A2 | 4.25 | 7/11/42 | 1,126,923 | | 1,138,041 |
| Bear Stearns Commercial Mortgage | | | | | |
| Securities, Ser. 2005-T18 Cl. A2 | 4.56 | 2/13/42 | 2,276,496 | c | 2,284,436 |
| Bear Stearns Commercial Mortgage | | | | | |
| Securities, Ser. 2004-PWR5, Cl. A3 | 4.57 | 7/11/42 | 110,000 | | 111,774 |
| Bear Stearns Commercial Mortgage | | | | | |
| Securities, Ser. 2004-T14, Cl. A4 | 5.20 | 1/12/41 | 6,310,000 | c | 6,807,986 |
| Bear Stearns Commercial Mortgage | | | | | |
| Securities, Ser. 2007-T26, Cl. A4 | 5.47 | 1/12/45 | 5,055,000 | c | 5,381,723 |
| Bear Stearns Commercial Mortgage | | | | | |
| Securities, Ser. 2006-PW13, Cl. A3 | 5.52 | 9/11/41 | 35,000 | | 37,031 |
| Bear Stearns Commercial Mortgage | | | | | |
| Securities, Ser. 2006-PW12, Cl. AAB | 5.70 | 9/11/38 | 715,000 | c | 784,990 |
| Bear Stearns Commercial Mortgage | | | | | |
| Securities, Ser. 2007-T28, Cl. A4 | 5.74 | 9/11/42 | 6,845,000 | c | 7,372,611 |
| Credit Suisse/Morgan Stanley | | | | | |
| Commercial Mortgage Certificates, | | | | | |
| Ser. 2006-HC1A, Cl. A1 | 0.53 | 5/15/23 | 5,078,165 | b,c | 4,842,032 |
| Crown Castle Towers, | | | | | |
| Ser. 2006-1A, Cl. AFX | 5.24 | 11/15/36 | 5,760,000 | b | 5,961,915 |
| Crown Castle Towers, | | | | | |
| Ser. 2006-1A, Cl. B | 5.36 | 11/15/36 | 4,670,000 | b | 4,827,800 |
| Crown Castle Towers, | | | | | |
| Ser. 2006-1A, Cl. C | 5.47 | 11/15/36 | 1,395,000 | b | 1,442,097 |
| Crown Castle Towers, | | | | | |
| Ser. 2006-1A, Cl. D | 5.77 | 11/15/36 | 3,325,000 | b | 3,436,978 |
| Crown Castle Towers, | | | | | |
| Ser. 2006-1A, Cl. E | 6.07 | 11/15/36 | 1,135,000 | b | 1,173,135 |
| Crown Castle Towers, | | | | | |
| Ser. 2006-1A, Cl. F | 6.65 | 11/15/36 | 4,055,000 | b | 4,193,135 |
STATEMENT OF INVESTMENTS (continued)
| | | | | |
| | Coupon | Maturity | Principal | | |
| Bonds and Notes (continued) | Rate (%) | Date | Amount ($) | | Value ($) |
| Commercial Mortgage | | | | | |
| Pass-Through Ctfs. (continued) | | | | | |
| Crown Castle Towers, | | | | | |
| Ser. 2006-1A, Cl. G | 6.80 | 11/15/36 | 755,000 | b | 780,688 |
| CS First Boston Mortgage | | | | | |
| Securities, Ser. 2004-C3, Cl. A3 | 4.30 | 7/15/36 | 903,361 | | 902,621 |
| CS First Boston Mortgage | | | | | |
| Securities, Ser. 2005-C4, Cl. A2 | 5.02 | 8/15/38 | 9,932 | | 9,939 |
| CS First Boston Mortgage | | | | | |
| Securities, Ser. 2005-C4, Cl. AAB | 5.07 | 8/15/38 | 3,345,000 | c | 3,530,303 |
| CS First Boston Mortgage | | | | | |
| Securities, Ser. 2005-C5, Cl. A4 | 5.10 | 8/15/38 | 6,230,000 | c | 6,686,052 |
| CS First Boston Mortgage | | | | | |
| Securities, Ser. 2001-CF2, Cl. G | 6.93 | 2/15/34 | 130,000 | b | 128,757 |
| First Union National Bank | | | | | |
| Commercial Mortgage, | | | | | |
| Ser. 2001-C2, Cl. A2 | 6.66 | 1/12/43 | 1,950,707 | | 1,987,596 |
| GE Capital Commercial Mortgage, | | | | | |
| Ser. 2004-C2, Cl. A4 | 4.89 | 3/10/40 | 6,000,000 | | 6,350,000 |
| GMAC Commercial Mortgage | | | | | |
| Securities, Ser. 2004-C3, Cl. A3 | 4.21 | 12/10/41 | 768,761 | | 771,442 |
| Goldman Sachs Mortgage Securities | | | | | |
| Corporation II, Ser. 2007-EOP, Cl. B | 0.60 | 3/6/20 | 1,630,000 | b,c | 1,493,806 |
| Goldman Sachs Mortgage Securities | | | | | |
| Corporation II, Ser. 2007-EOP, Cl. E | 0.79 | 3/6/20 | 610,000 | b,c | 539,939 |
| Goldman Sachs Mortgage Securities | | | | | |
| Corporation II, Ser. 2007-EOP, Cl. F | 0.83 | 3/6/20 | 5,680,000 | b,c | 4,974,279 |
| Goldman Sachs Mortgage Securities | | | | | |
| Corporation II, Ser. 2007-EOP, Cl. G | 0.87 | 3/6/20 | 3,110,000 | b,c | 2,706,942 |
| Goldman Sachs Mortgage Securities | | | | | |
| Corporation II, Ser. 2007-EOP, Cl. H | 1.00 | 3/6/20 | 25,000 | b,c | 21,708 |
| Goldman Sachs Mortgage Securities | | | | | |
| Corporation II, Ser. 2007-EOP, Cl. K | 1.40 | 3/6/20 | 2,380,000 | b,c | 2,029,296 |
| Goldman Sachs Mortgage Securities | | | | | |
| Corporation II, Ser. 2007-EOP, Cl. L | 1.65 | 3/6/20 | 6,725,000 | b,c | 5,684,930 |
| Greenwich Capital Commercial | | | | | |
| Funding, Ser. 2004-GG1, Cl. A7 | 5.32 | 6/10/36 | 650,000 | c | 704,634 |
| JP Morgan Chase Commercial | | | | | |
| Mortgage Securities, | | | | | |
| Ser. 2003-CB7, Cl. A3 | 4.45 | 1/12/38 | 1,822,689 | | 1,829,524 |
14
| | | | | |
| | Coupon | Maturity | Principal | | |
| Bonds and Notes (continued) | Rate (%) | Date | Amount ($) | | Value ($) |
| Commercial Mortgage | | | | | |
| Pass-Through Ctfs. (continued) | | | | | |
| JP Morgan Chase Commercial | | | | | |
| Mortgage Securities, | | | | | |
| Ser. 2005-LDP5, Cl. A2 | 5.20 | 12/15/44 | 1,250,000 | | 1,282,868 |
| JP Morgan Chase Commercial | | | | | |
| Mortgage Securities, | | | | | |
| Ser. 2009-IWST, Cl. B | 7.15 | 12/5/27 | 1,200,000 | b | 1,386,066 |
| JP Morgan Chase Commercial | | | | | |
| Mortgage Securities, | | | | | |
| Ser. 2009-IWST, Cl. C | 7.45 | 12/5/27 | 4,065,000 | b,c | 4,519,717 |
| LB-UBS Commercial Mortgage Trust, | | | | | |
| Ser. 2005-C3, Cl. A5 | 4.74 | 7/15/30 | 2,280,000 | | 2,440,557 |
| Merrill Lynch Mortgage Trust, | | | | | |
| Ser. 2003-KEY1, Cl. A2 | 4.44 | 11/12/35 | 1,353,259 | | 1,355,869 |
| Merrill Lynch Mortgage Trust, | | | | | |
| Ser. 2005-LC1, Cl. A2 | 5.20 | 1/12/44 | 2,518,938 | c | 2,534,486 |
| Merrill Lynch Mortgage Trust, | | | | | |
| Ser. 2005-CKI1, Cl. A2 | 5.21 | 11/12/37 | 300,000 | c | 302,122 |
| Merrill Lynch Mortgage Trust, | | | | | |
| Ser. 2005-CKI1, Cl. A6 | 5.23 | 11/12/37 | 4,035,000 | c | 4,391,828 |
| Merrill Lynch Mortgage Trust, | | | | | |
| Ser. 2002-MW1, Cl. A3 | 5.40 | 7/12/34 | 411,570 | | 419,557 |
| Morgan Stanley Capital I, | | | | | |
| Ser. 2006-IQ12, Cl. AAB | 5.33 | 12/15/43 | 100,000 | | 108,933 |
| Morgan Stanley Capital I, | | | | | |
| Ser. 2007-T27, Cl. A4 | 5.65 | 6/11/42 | 7,160,000 | c | 7,717,634 |
| Morgan Stanley Dean Witter Capital | | | | | |
| I, Ser. 2001-TOP3, Cl. A4 | 6.39 | 7/15/33 | 58,191 | | 60,073 |
| Morgan Stanley Dean Witter Capital | | | | | |
| I, Ser. 2001-PPM, Cl. A3 | 6.54 | 2/15/31 | 11,174 | | 11,423 |
| TIAA Seasoned Commercial Mortgage | | | | | |
| Trust, Ser. 2007-C4, Cl. A3 | 6.07 | 8/15/39 | 495,000 | c | 548,770 |
| Wachovia Bank Commercial Mortgage | | | | | |
| Trust, Ser. 2005-C16, Cl. A2 | 4.38 | 10/15/41 | 943,628 | | 966,240 |
| | | | | | 122,082,702 |
| Diversified Financial Services—6.4% | | | | | |
| American Express, | | | | | |
| Sr. Unscd. Notes | 7.25 | 5/20/14 | 5,255,000 | | 6,105,117 |
STATEMENT OF INVESTMENTS (continued)
| | | | | | |
| | | Coupon | Maturity | Principal | | |
| Bonds and Notes (continued) | Rate (%) | Date | Amount ($) | | Value ($) |
| Diversified Financial | | | | | | |
| Services (continued) | | | | | | |
| Ameriprise Financial, | | | | | | |
| Jr. Sub. Notes | | 7.52 | 6/1/66 | 3,441,000 | c | 3,380,783 |
| Capital One Bank USA, | | | | | | |
| Sub. Notes | | 8.80 | 7/15/19 | 4,955,000 | | 6,317,620 |
| Countrywide Home Loans, | | | | | | |
| Gtd. Notes, Ser. L | | 4.00 | 3/22/11 | 1,820,000 | | 1,856,089 |
| Discover Financial Services, | | | | | | |
| Sr. Unscd. Notes | | 10.25 | 7/15/19 | 3,312,000 | | 4,128,315 |
| ERAC USA Finance, | | | | | | |
| Gtd. Notes | | 5.60 | 5/1/15 | 550,000 | b | 609,137 |
| ERAC USA Finance, | | | | | | |
| Gtd. Notes | | 6.38 | 10/15/17 | 6,150,000 | b | 6,979,173 |
| ERAC USA Finance, | | | | | | |
| Gtd. Notes | | 7.00 | 10/15/37 | 220,000 | b | 244,235 |
| FCE Bank, | | | | | | |
| Sr. Unscd. Notes | EUR | 7.13 | 1/16/12 | 1,050,000 | d | 1,411,138 |
| Ford Motor Credit, | | | | | | |
| Sr. Unscd. Notes | | 6.63 | 8/15/17 | 3,260,000 | | 3,240,186 |
| Ford Motor Credit, | | | | | | |
| Sr. Unscd. Notes | | 8.00 | 12/15/16 | 8,135,000 | | 8,694,159 |
| Fresenius US Finance II, | | | | | | |
| Gtd. Notes | | 9.00 | 7/15/15 | 3,000,000 | b | 3,375,000 |
| General Electric Capital, | | | | | | |
| Sr. Unscd. Notes | | 5.63 | 5/1/18 | 5,930,000 | | 6,477,250 |
| Harley-Davidson Funding, | | | | | | |
| Gtd. Notes | | 5.75 | 12/15/14 | 5,980,000 | b | 6,243,449 |
| Hutchison Whampoa International, | | | | | |
| Gtd. Notes | | 5.75 | 9/11/19 | 3,820,000 | b | 4,171,146 |
| Hutchison Whampoa International, | | | | | |
| Gtd. Notes | | 7.63 | 4/9/19 | 1,390,000 | b | 1,698,384 |
| Invesco, | | | | | | |
| Gtd. Notes | | 5.38 | 2/27/13 | 380,000 | | 397,752 |
| Invesco, | | | | | | |
| Gtd. Notes | | 5.38 | 12/15/14 | 25,000 | | 26,039 |
| Invesco, | | | | | | |
| Gtd. Notes | | 5.63 | 4/17/12 | 6,510,000 | | 6,854,073 |
| Jefferies Group, | | | | | | |
| Sr. Unscd. Notes | | 5.88 | 6/8/14 | 100,000 | | 107,072 |
16
| | | | |
| | Coupon | Maturity | Principal | |
| Bonds and Notes (continued) | Rate (%) | Date | Amount ($) | Value ($) |
| Diversified Financial | | | | |
| Services (continued) | | | | |
| Jefferies Group, | | | | |
| Sr. Unscd. Debs. | 6.25 | 1/15/36 | 850,000 | 754,992 |
| MBNA Capital A, | | | | |
| Gtd. Cap. Secs., Ser. A | 8.28 | 12/1/26 | 2,285,000 | 2,350,694 |
| MBNA, | | | | |
| Sr. Unscd. Notes | 6.13 | 3/1/13 | 1,345,000 | 1,453,204 |
| Merrill Lynch & Co., | | | | |
| Sub. Notes | 5.70 | 5/2/17 | 1,025,000 | 1,059,732 |
| Merrill Lynch & Co., | | | | |
| Sr. Unscd. Notes | 6.40 | 8/28/17 | 50,000 | 54,126 |
| Nisource Capital Markets, | | | | |
| Sr. Unscd. Notes | 7.86 | 3/27/17 | 105,000 | 120,201 |
| Pearson Dollar Finance Two, | | | | |
| Gtd. Notes | 6.25 | 5/6/18 | 2,990,000 b | 3,322,509 |
| | | | | 81,431,575 |
| Electric Utilities—1.9% | | | | |
| AES, | | | | |
| Sr. Unscd. Notes | 7.75 | 10/15/15 | 3,515,000 | 3,708,325 |
| Cleveland Electric Illuminating, | | | | |
| Sr. Unscd. Notes | 5.70 | 4/1/17 | 910,000 | 989,505 |
| Commonwealth Edison, | | | | |
| First Mortgage Bonds | 6.15 | 9/15/17 | 60,000 | 70,007 |
| Consolidated Edison of NY, | | | | |
| Sr. Unscd. Debs., Ser. 06-D | 5.30 | 12/1/16 | 675,000 | 760,824 |
| Consumers Energy, | | | | |
| First Mortgage Bonds | 6.70 | 9/15/19 | 1,585,000 | 1,915,539 |
| Duke Energy Carolinas, | | | | |
| Sr. Unscd. Notes | 5.63 | 11/30/12 | 50,000 | 54,835 |
| Exelon Generation, | | | | |
| Sr. Unscd. Notes | 5.20 | 10/1/19 | 2,200,000 | 2,391,514 |
| National Grid, | | | | |
| Sr. Unscd. Notes | 6.30 | 8/1/16 | 2,802,000 | 3,227,327 |
| Nevada Power, | | | | |
| Mortgage Notes | 6.50 | 8/1/18 | 2,620,000 | 3,087,413 |
| Nevada Power, | | | | |
| Mortgage Notes, Ser. R | 6.75 | 7/1/37 | 395,000 | 463,772 |
| NiSource Finance, | | | | |
| Gtd. Notes | 5.25 | 9/15/17 | 650,000 | 680,714 |
STATEMENT OF INVESTMENTS (continued)
| | | | | |
| | Coupon | Maturity | Principal | | |
| Bonds and Notes (continued) | Rate (%) | Date | Amount ($) | | Value ($) |
| Electric Utilities (continued) | | | | | |
| NiSource Finance, | | | | | |
| Gtd. Notes | 6.40 | 3/15/18 | 1,530,000 | | 1,700,075 |
| NiSource Finance, | | | | | |
| Gtd. Notes | 7.88 | 11/15/10 | 720,000 | | 732,743 |
| Progress Energy, | | | | | |
| Sr. Unscd. Notes | 7.05 | 3/15/19 | 2,800,000 | | 3,398,282 |
| Sierra Pacific Power, | | | | | |
| Mortgage Notes, Ser. P | 6.75 | 7/1/37 | 550,000 | | 645,759 |
| | | | | | 23,826,634 |
| Entertainment—.4% | | | | | |
| Ameristar Casinos, | | | | | |
| Gtd. Notes | 9.25 | 6/1/14 | 1,781,000 | | 1,910,123 |
| Penn National Gaming, | | | | | |
| Sr. Sub. Notes | 8.75 | 8/15/19 | 3,055,000 | | 3,207,750 |
| | | | | | 5,117,873 |
| Environmental Control—.7% | | | | | |
| Allied Waste North America, | | | | | |
| Gtd. Notes, Ser. B | 7.13 | 5/15/16 | 1,025,000 | | 1,108,316 |
| Republic Services, | | | | | |
| Gtd. Notes | 5.50 | 9/15/19 | 3,225,000 | b | 3,541,656 |
| Waste Management, | | | | | |
| Sr. Unscd. Notes | 7.00 | 7/15/28 | 2,395,000 | | 2,784,863 |
| Waste Management, | | | | | |
| Gtd. Notes | 7.38 | 3/11/19 | 925,000 | | 1,126,567 |
| | | | | | 8,561,402 |
| Food & Beverages—.8% | | | | | |
| Anheuser-Busch InBev Worldwide, | | | | | |
| Gtd. Notes | 8.20 | 1/15/39 | 3,520,000 | b | 4,817,662 |
| Kraft Foods, | | | | | |
| Sr. Unscd. Notes | 6.88 | 2/1/38 | 2,750,000 | | 3,276,152 |
| Stater Brothers Holdings, | | | | | |
| Gtd. Notes | 7.75 | 4/15/15 | 1,245,000 | | 1,269,900 |
| Stater Brothers Holdings, | | | | | |
| Gtd. Notes | 8.13 | 6/15/12 | 717,000 | | 722,378 |
| | | | | | 10,086,092 |
18
| | | | | | |
| | | Coupon | Maturity | Principal | | |
| Bonds and Notes (continued) | Rate (%) | Date | Amount ($) | | Value ($) |
| Foreign/Governmental—1.7% | | | | | | |
| Banco Nacional de Desenvolvimento | | | | | |
| Economico e Social, Notes | | 5.50 | 7/12/20 | 2,085,000 | b | 2,184,037 |
| Province of Quebec Canada, | | | | | | |
| Unscd. Notes | | 4.60 | 5/26/15 | 2,795,000 | a | 3,114,172 |
| Republic of Chile, | | | | | | |
| Notes | CLP | 5.50 | 8/5/20 373,000,000 | d | 715,588 |
| Republic of Korea, | | | | | | |
| Sr. Unscd. Notes | | 7.13 | 4/16/19 | 1,500,000 | | 1,828,242 |
| Republic of Peru, | | | | | | |
| Sr. Unscd. Bonds | | 6.55 | 3/14/37 | 5,605,000 | | 6,529,825 |
| Russia Foreign Bond, | | | | | | |
| Sr. Unscd. Bonds | | 5.00 | 4/29/20 | 6,455,000 | a,b | 6,535,688 |
| | | | | | | 20,907,552 |
| Health Care—.8% | | | | | | |
| Community Health Systems, | | | | | | |
| Gtd. Notes | | 8.88 | 7/15/15 | 2,995,000 | | 3,144,750 |
| HCA, | | | | | | |
| Sr. Unscd. Notes | | 6.30 | 10/1/12 | 2,370,000 | | 2,417,400 |
| HCA, | | | | | | |
| Sr. Unscd. Notes | | 6.75 | 7/15/13 | 690,000 | | 700,350 |
| Quest Diagnostic, | | | | | | |
| Gtd. Notes | | 5.75 | 1/30/40 | 3,135,000 | | 3,067,475 |
| Wyeth, | | | | | | |
| Gtd. Notes | | 6.95 | 3/15/11 | 580,000 | c | 602,218 |
| | | | | | | 9,932,193 |
| Manufacturing—.2% | | | | | | |
| Bombardier, | | | | | | |
| Sr. Notes | | 7.75 | 3/15/20 | 1,800,000 | b | 1,948,500 |
| Bombardier, | | | | | | |
| Sr. Unscd. Notes | | 8.00 | 11/15/14 | 375,000 | a,b | 394,688 |
| | | | | | | 2,343,188 |
| Media—3.3% | | | | | | |
| Comcast, | | | | | | |
| Gtd. Notes | | 6.30 | 11/15/17 | 2,850,000 | | 3,302,799 |
STATEMENT OF INVESTMENTS (continued)
| | | | | |
| | Coupon | Maturity | Principal | | |
| Bonds and Notes (continued) | Rate (%) | Date | Amount ($) | | Value ($) |
| Media (continued) | | | | | |
| Cox Communications, | | | | | |
| Sr. Unscd. Notes | 6.25 | 6/1/18 | 3,535,000 | b | 4,040,515 |
| CSC Holdings, | | | | | |
| Sr. Unscd. Notes | 8.50 | 4/15/14 | 2,910,000 | | 3,157,350 |
| DirecTV Holdings, | | | | | |
| Gtd. Notes | 5.88 | 10/1/19 | 1,130,000 | | 1,258,777 |
| DirecTV Holdings, | | | | | |
| Gtd. Notes | 7.63 | 5/15/16 | 2,980,000 | | 3,311,704 |
| Discovery Communications, | | | | | |
| Gtd. Notes | 5.63 | 8/15/19 | 1,343,000 | | 1,487,175 |
| Dish DBS, | | | | | |
| Gtd. Notes | 7.75 | 5/31/15 | 3,500,000 | | 3,675,000 |
| NBC Universal, | | | | | |
| Sr. Unscd. Notes | 5.15 | 4/30/20 | 3,170,000 | b | 3,375,853 |
| News America Holdings, | | | | | |
| Gtd. Debs. | 7.70 | 10/30/25 | 775,000 | | 948,120 |
| News America, | | | | | |
| Gtd. Notes | 6.65 | 11/15/37 | 2,830,000 | | 3,160,575 |
| News America, | | | | | |
| Gtd. Debs. | 7.63 | 11/30/28 | 90,000 | | 103,828 |
| Reed Elsevier Capital, | | | | | |
| Gtd. Notes | 4.63 | 6/15/12 | 6,130,000 | | 6,439,173 |
| Time Warner Cable, | | | | | |
| Gtd. Notes | 6.75 | 7/1/18 | 4,095,000 | | 4,790,704 |
| Time Warner, | | | | | |
| Gtd. Notes | 5.88 | 11/15/16 | 2,755,000 | | 3,158,999 |
| | | | | | 42,210,572 |
| Mining—1.1% | | | | | |
| Freeport-McMoRan | | | | | |
| Copper & Gold, | | | | | |
| Sr. Unscd. Notes | 8.38 | 4/1/17 | 2,885,000 | | 3,228,156 |
| Rio Tinto Finance USA, | | | | | |
| Gtd. Notes | 5.88 | 7/15/13 | 3,340,000 | | 3,714,678 |
| Teck Resources, | | | | | |
| Sr. Scd. Notes | 10.25 | 5/15/16 | 2,815,000 | | 3,409,987 |
| Teck Resources, | | | | | |
| Sr. Scd. Notes | 10.75 | 5/15/19 | 2,410,000 | | 3,014,141 |
| | | | | | 13,366,962 |
20
| | | | |
| | Coupon | Maturity | Principal | |
| Bonds and Notes (continued) | Rate (%) | Date | Amount ($) | Value ($) |
| Municipal Bonds—2.3% | | | | |
| California, | | | | |
| GO (Build America Bonds) | | | | |
| (Various Purpose) | 7.30 | 10/1/39 | 3,095,000 | 3,380,823 |
| California, | | | | |
| GO (Build America Bonds) | | | | |
| (Various Purpose) | 7.55 | 4/1/39 | 3,180,000 | 3,584,019 |
| Erie Tobacco Asset Securitization | | | | |
| Corporation, Tobacco | | | | |
| Settlement Asset-Backed Bonds | 6.00 | 6/1/28 | 540,000 | 445,376 |
| Illinois, | | | | |
| GO | 4.42 | 1/1/15 | 3,430,000 | 3,430,000 |
| Los Angeles Unified | | | | |
| School District, GO | | | | |
| (Build America Bonds) | 6.76 | 7/1/34 | 2,555,000 | 2,734,463 |
| Michigan Tobacco Settlement | | | | |
| Finance Authority, Tobacco | | | | |
| Settlement Asset-Backed Bonds | 7.31 | 6/1/34 | 3,795,000 | 2,917,103 |
| New York City, | | | | |
| GO (Build America Bonds) | 5.99 | 12/1/36 | 3,200,000 | 3,400,352 |
| New York Counties Tobacco Trust | | | | |
| IV, Tobacco Settlement | | | | |
| Pass-Through Bonds | 6.00 | 6/1/27 | 3,385,000 | 2,786,058 |
| Tobacco Settlement Authority of | | | | |
| Iowa, Tobacco Settlement | | | | |
| Asset-Backed Bonds | 6.50 | 6/1/23 | 7,675,000 | 6,623,065 |
| Tobacco Settlement Finance | | | | |
| Authority of West Virginia, | | | | |
| Tobacco Settlement | | | | |
| Asset-Backed Bonds | 7.47 | 6/1/47 | 420,000 | 311,480 |
| | | | | 29,612,739 |
| Office & Business Equipment—.3% | | | | |
| Xerox, | | | | |
| Sr. Unscd. Notes | 5.50 | 5/15/12 | 792,000 | 843,402 |
| Xerox, | | | | |
| Sr. Unscd. Notes | 5.65 | 5/15/13 | 1,075,000 | 1,166,877 |
| Xerox, | | | | |
| Sr. Unscd. Notes | 8.25 | 5/15/14 | 1,145,000 | 1,359,515 |
| | | | | 3,369,794 |
STATEMENT OF INVESTMENTS (continued)
| | | | | |
| | Coupon | Maturity | Principal | | |
| Bonds and Notes (continued) | Rate (%) | Date | Amount ($) | | Value ($) |
| Oil & Gas—2.0% | | | | | |
| EQT, | | | | | |
| Sr. Unscd. Notes | 8.13 | 6/1/19 | 2,955,000 | | 3,576,058 |
| Husky Energy, | | | | | |
| Sr. Unscd. Notes | 7.25 | 12/15/19 | 2,850,000 | | 3,499,182 |
| Marathon Oil, | | | | | |
| Sr. Unscd. Notes | 7.50 | 2/15/19 | 497,000 | | 612,226 |
| Petro-Canada, | | | | | |
| Sr. Unscd. Notes | 6.80 | 5/15/38 | 4,060,000 | | 4,798,782 |
| Petroleos Mexicanos, | | | | | |
| Gtd. Bonds | 5.50 | 1/21/21 | 3,680,000 | b | 3,805,120 |
| Range Resources, | | | | | |
| Gtd. Notes | 8.00 | 5/15/19 | 2,795,000 | | 3,011,613 |
| Sempra Energy, | | | | | |
| Sr. Unscd. Notes | 6.50 | 6/1/16 | 2,720,000 | | 3,189,945 |
| Valero Energy, | | | | | |
| Sr. Unscd. Notes | 6.13 | 2/1/20 | 2,100,000 | | 2,282,509 |
| | | | | | 24,775,435 |
| Packaging & Containers—.2% | | | | | |
| Crown Americas, | | | | | |
| Gtd. Notes | 7.63 | 11/15/13 | 230,000 | | 240,063 |
| Crown Americas, | | | | | |
| Gtd. Notes | 7.75 | 11/15/15 | 2,340,000 | | 2,468,700 |
| | | | | | 2,708,763 |
| Paper & Paper Related—.3% | | | | | |
| Georgia-Pacific, | | | | | |
| Gtd. Notes | 7.00 | 1/15/15 | 1,310,000 | b | 1,367,312 |
| Georgia-Pacific, | | | | | |
| Gtd. Notes | 8.25 | 5/1/16 | 2,035,000 | b | 2,218,150 |
| | | | | | 3,585,462 |
| Pipelines—.9% | | | | | |
| ANR Pipeline, | | | | | |
| Sr. Unscd. Notes | 7.00 | 6/1/25 | 50,000 | | 55,108 |
| El Paso Natural Gas, | | | | | |
| Sr. Unscd. Notes | 5.95 | 4/15/17 | 20,000 | | 21,394 |
| El Paso, | | | | | |
| Sr. Unscd. Notes | 8.25 | 2/15/16 | 2,870,000 | | 3,135,475 |
| Kinder Morgan Energy Partners, | | | | | |
| Sr. Unscd. Notes | 6.85 | 2/15/20 | 4,340,000 | | 5,151,098 |
22
| | | | | |
| | Coupon | Maturity | Principal | | |
| Bonds and Notes (continued) | Rate (%) | Date | Amount ($) | | Value ($) |
| Pipelines (continued) | | | | | |
| Plains All American Pipeline, | | | | | |
| Gtd. Notes | 5.75 | 1/15/20 | 3,089,000 | | 3,332,833 |
| | | | | | 11,695,908 |
| Property & Casualty Insurance—2.5% | | | | | |
| ACE INA Holdings, | | | | | |
| Gtd. Notes | 5.80 | 3/15/18 | 2,300,000 | | 2,548,444 |
| Allstate, | | | | | |
| Sr. Unscd. Debs. | 6.75 | 5/15/18 | 2,835,000 | a | 3,288,568 |
| Cincinnati Financial, | | | | | |
| Sr. Unscd. Notes | 6.13 | 11/1/34 | 459,000 | | 437,673 |
| Cincinnati Financial, | | | | | |
| Sr. Unscd. Debs. | 6.92 | 5/15/28 | 701,000 | | 714,378 |
| Hanover Insurance Group, | | | | | |
| Sr. Unscd. Notes | 7.50 | 3/1/20 | 775,000 | a | 827,725 |
| Hanover Insurance Group, | | | | | |
| Sr. Unscd. Notes | 7.63 | 10/15/25 | 1,745,000 | | 1,792,431 |
| HUB International Holdings, | | | | | |
| Sr. Sub. Notes | 10.25 | 6/15/15 | 3,025,000 | b | 2,866,188 |
| Lincoln National, | | | | | |
| Sr. Unscd. Notes | 6.25 | 2/15/20 | 1,645,000 | | 1,758,645 |
| MetLife, | | | | | |
| Sr. Unscd. Notes | 7.72 | 2/15/19 | 2,544,000 | | 3,123,291 |
| Nippon Life Insurance, | | | | | |
| Sub. Notes | 4.88 | 8/9/10 | 4,100,000 | b | 4,100,021 |
| Principal Financial Group, | | | | | |
| Gtd. Notes | 8.88 | 5/15/19 | 2,600,000 | | 3,252,795 |
| Prudential Financial, | | | | | |
| Sr. Unscd. Notes | 4.75 | 9/17/15 | 2,960,000 | | 3,142,241 |
| Willis North America, | | | | | |
| Gtd. Notes | 6.20 | 3/28/17 | 1,500,000 | | 1,576,425 |
| Willis North America, | | | | | |
| Gtd. Notes | 7.00 | 9/29/19 | 2,355,000 | | 2,528,288 |
| | | | | | 31,957,113 |
| Real Estate—3.6% | | | | | |
| Boston Properties, | | | | | |
| Sr. Unscd. Notes | 5.00 | 6/1/15 | 810,000 | | 855,708 |
| Boston Properties, | | | | | |
| Sr. Unscd. Notes | 5.63 | 4/15/15 | 2,030,000 | | 2,231,725 |
STATEMENT OF INVESTMENTS (continued)
| | | | |
| | Coupon | Maturity | Principal | |
| Bonds and Notes (continued) | Rate (%) | Date | Amount ($) | Value ($) |
| Real Estate (continued) | | | | |
| Boston Properties, | | | | |
| Sr. Unscd. Notes | 6.25 | 1/15/13 | 140,000 | 153,417 |
| CommonWealth REIT, | | | | |
| Sr. Unscd. Notes | 1.14 | 3/16/11 | 3,725,000 c | 3,707,269 |
| Duke Realty, | | | | |
| Sr. Unscd. Notes | 5.88 | 8/15/12 | 790,000 | 830,009 |
| Duke Realty, | | | | |
| Sr. Unscd. Notes | 6.75 | 3/15/20 | 545,000 | 591,647 |
| Duke Realty, | | | | |
| Sr. Unscd. Notes | 8.25 | 8/15/19 | 2,565,000 | 2,995,851 |
| ERP Operating, | | | | |
| Sr. Unscd. Notes | 5.75 | 6/15/17 | 1,220,000 | 1,350,524 |
| Federal Realty Investment Trust, | | | | |
| Sr. Unscd. Notes | 5.40 | 12/1/13 | 1,525,000 | 1,652,499 |
| Federal Realty Investment Trust, | | | | |
| Sr. Unscd. Bonds | 5.65 | 6/1/16 | 550,000 | 594,744 |
| Federal Realty Investment Trust, | | | | |
| Sr. Unscd. Notes | 6.00 | 7/15/12 | 1,625,000 | 1,745,872 |
| Federal Realty Investment Trust, | | | | |
| Sr. Unscd. Notes | 6.20 | 1/15/17 | 145,000 | 159,570 |
| Healthcare Realty Trust, | | | | |
| Sr. Unscd. Notes | 5.13 | 4/1/14 | 7,695,000 | 7,940,193 |
| Healthcare Realty Trust, | | | | |
| Sr. Unscd. Notes | 8.13 | 5/1/11 | 225,000 | 234,794 |
| Liberty Property, | | | | |
| Sr. Unscd. Notes | 5.50 | 12/15/16 | 190,000 | 199,251 |
| Liberty Property, | | | | |
| Sr. Unscd. Notes | 6.63 | 10/1/17 | 1,100,000 | 1,193,961 |
| Mack-Cali Realty, | | | | |
| Sr. Unscd. Notes | 5.13 | 1/15/15 | 145,000 | 149,384 |
| Mack-Cali Realty, | | | | |
| Sr. Unscd. Notes | 5.25 | 1/15/12 | 2,145,000 | 2,232,329 |
| Mack-Cali Realty, | | | | |
| Sr. Unscd. Notes | 5.80 | 1/15/16 | 690,000 | 733,528 |
| National Retail Properties, | | | | |
| Sr. Unscd. Notes | 6.15 | 12/15/15 | 3,180,000 | 3,408,082 |
| Regency Centers, | | | | |
| Gtd. Notes | 5.25 | 8/1/15 | 1,777,000 | 1,883,378 |
24
| | | | | |
| | Coupon | Maturity | Principal | | |
| Bonds and Notes (continued) | Rate (%) | Date | Amount ($) | | Value ($) |
| Real Estate (continued) | | | | | |
| Regency Centers, | | | | | |
| Gtd. Notes | 5.88 | 6/15/17 | 210,000 | | 223,657 |
| Simon Property Group, | | | | | |
| Sr. Unscd. Notes | 6.75 | 2/1/40 | 2,921,000 | | 3,400,803 |
| WEA Finance, | | | | | |
| Gtd. Notes | 7.13 | 4/15/18 | 4,015,000 | b | 4,614,464 |
| WEA Finance, | | | | | |
| Gtd. Notes | 7.50 | 6/2/14 | 2,400,000 | b | 2,776,176 |
| | | | | | 45,858,835 |
| Residential Mortgage | | | | | |
| Pass-Through Ctfs.—.3% | | | | | |
| Impac CMB Trust, | | | | | |
| Ser. 2005-8, Cl. 2M2 | 1.08 | 2/25/36 | 2,472,792 | c | 1,065,442 |
| Impac CMB Trust, | | | | | |
| Ser. 2005-8, Cl. 2M3 | 1.83 | 2/25/36 | 1,999,858 | c | 801,399 |
| Impac Secured Assets | | | | | |
| CMN Owner Trust, | | | | | |
| Ser. 2006-1, Cl. 2A1 | 0.68 | 5/25/36 | 1,821,539 | c | 1,501,421 |
| Prudential Home Mortgage | | | | | |
| Securities, Ser. 1994-A, Cl. 5B | 6.73 | 4/28/24 | 1,541 | b,c | 1,249 |
| Residential Funding Mortgage | | | | | |
| Securities I, Ser. 2004-S3, Cl. M1 | 4.75 | 3/25/19 | 797,308 | | 557,652 |
| Structured Asset Mortgage | | | | | |
| Investments, Ser. 1998-2, Cl. B | 5.09 | 4/30/30 | 1,030 | c | 679 |
| Terwin Mortgage Trust, | | | | | |
| Ser. 2006-9HGA, Cl. A1 | 0.41 | 10/25/37 | 11,832 | b,c | 11,758 |
| | | | | | 3,939,600 |
| Retail—1.0% | | | | | |
| Autozone, | | | | | |
| Sr. Unscd. Notes | 5.75 | 1/15/15 | 3,040,000 | | 3,395,640 |
| CVS Pass-Through Trust, | | | | | |
| Pass Thru Certificates | 8.35 | 7/10/31 | 2,704,009 | b | 3,271,837 |
| Home Depot, | | | | | |
| Sr. Unscd. Notes | 5.88 | 12/16/36 | 2,642,000 | | 2,724,629 |
| Staples, | | | | | |
| Gtd. Notes | 9.75 | 1/15/14 | 2,575,000 | | 3,174,589 |
| | | | | | 12,566,695 |
STATEMENT OF INVESTMENTS (continued)
| | | | | |
| | Coupon | Maturity | Principal | | |
| Bonds and Notes (continued) | Rate (%) | Date | Amount ($) | | Value ($) |
| Technology—.1% | | | | | |
| Sungard Data Systems, | | | | | |
| Gtd. Notes | 10.25 | 8/15/15 | 370,000 | a | 390,350 |
| Sungard Data Systems, | | | | | |
| Gtd. Notes | 10.63 | 5/15/15 | 620,000 | | 689,750 |
| | | | | | 1,080,100 |
| Telecommunications—2.4% | | | | | |
| AT & T, | | | | | |
| Sr. Unscd. Notes | 5.60 | 5/15/18 | 9,035,000 | | 10,249,882 |
| CC Holdings, | | | | | |
| Sr. Scd. Notes | 7.75 | 5/1/17 | 5,665,000 | b | 6,217,338 |
| Cellco Partnership/Verizon | | | | | |
| Wireless Capital, | | | | | |
| Sr. Unscd. Notes | 5.55 | 2/1/14 | 2,800,000 | | 3,166,792 |
| Intelsat Jackson Holdings, | | | | | |
| Gtd. Notes | 11.25 | 6/15/16 | 1,230,000 | | 1,334,550 |
| Intelsat Subsidiary Holding, | | | | | |
| Gtd. Notes | 8.88 | 1/15/15 | 1,055,000 | b | 1,094,563 |
| Telecom Italia Capital, | | | | | |
| Gtd. Notes | 5.25 | 11/15/13 | 3,775,000 | | 3,983,856 |
| Verizon Communications, | | | | | |
| Sr. Unscd. Notes | 7.35 | 4/1/39 | 1,400,000 | | 1,773,226 |
| Wind Acquisition Finance, | | | | | |
| Scd. Notes | 11.75 | 7/15/17 | 2,355,000 | b | 2,513,963 |
| | | | | | 30,334,170 |
| U.S. Government Agencies—.5% | | | | | |
| Federal National Mortgage | | | | | |
| Association, Notes | 5.25 | 9/15/16 | 5,356,000 | e | 6,282,856 |
| Small Business Administration | | | | | |
| Participation Ctfs., Gov’t | | | | | |
| Gtd. Debs., Ser. 97-J | 6.55 | 10/1/17 | 203,206 | | 221,954 |
| | | | | | 6,504,810 |
26
| | |
| | Principal | |
| Bonds and Notes (continued) | Amount ($) | Value ($) |
| U.S. Government Agencies/Mortgage-Backed—30.1% | | |
| Federal Home Loan Mortgage Corp.: | | |
| 3.50%, 9/1/10 | 87,991 e | 87,817 |
| 5.00%, 10/1/18—6/1/37 | 19,111,185 e | 20,425,135 |
| 5.50%, 11/1/22—1/1/38 | 22,650,977 e | 24,457,774 |
| 6.00%, 7/1/17—12/1/37 | 14,865,471 e | 16,176,145 |
| 6.50%, 3/1/14—3/1/32 | 501,193 e | 557,228 |
| 7.00%, 3/1/12 | 2,334 e | 2,414 |
| 7.50%, 12/1/25—1/1/31 | 29,806 e | 34,009 |
| 8.00%, 10/1/19—10/1/30 | 13,513 e | 15,464 |
| 8.50%, 7/1/30 | 919 e | 1,074 |
| Multiclass Mortgage Participation Ctfs., | | |
| Ser. 2586, Cl. WE, 4.00%, 12/15/32 | 2,690,408 e | 2,801,027 |
| Multiclass Mortgage Participation Ctfs., | | |
| Ser. 51, Cl. E, 10.00%, 7/15/20 | 143,881 e | 144,319 |
| Federal National Mortgage Association: | | |
| 4.50% | 24,375,000 e,f | 25,403,333 |
| 5.00% | 79,540,000 e,f | 84,563,566 |
| 5.50% | 90,835,000 e,f | 98,013,852 |
| 6.00% | 23,265,000 e,f | 25,235,266 |
| 4.06%, 6/1/13 | 100,000 e | 105,910 |
| 5.00%, 7/1/11—4/1/23 | 7,138,819 e | 7,652,199 |
| 5.50%, 8/1/22—6/1/38 | 43,985,161 e | 47,519,473 |
| 6.00%, 1/1/19—4/1/38 | 15,798,920 e | 17,222,888 |
| 6.50%, 11/1/10—10/1/32 | 193,754 e | 216,501 |
| 7.00%, 9/1/14—7/1/32 | 70,226 e | 78,031 |
| 7.50%, 3/1/12—3/1/31 | 19,520 e | 21,629 |
| 8.00%, 5/1/13—3/1/31 | 30,567 e | 34,813 |
| Pass-Through Ctfs., Ser. 2004-58, | | |
| Cl. LJ, 5.00%, 7/25/34 | 5,824,930 e | 6,106,952 |
| Grantor Trust, Ser. 2001-T11, | | |
| Cl. B, 5.50%, 9/25/11 | 285,000 e | 299,168 |
| Pass-Through Ctfs., Ser. 1988-16, | | |
| Cl. B, 9.50%, 6/25/18 | 89,320 e | 102,640 |
STATEMENT OF INVESTMENTS (continued)
| | |
| | Principal | |
| Bonds and Notes (continued) | Amount ($) | Value ($) |
| U.S. Government Agencies/Mortgage-Backed (continued) | | |
| Government National Mortgage Association I: | | |
| 5.50%, 4/15/33 | 3,090,332 | 3,384,114 |
| 6.00%, 1/15/29 | 29,964 | 33,295 |
| 6.50%, 4/15/28—9/15/32 | 61,205 | 68,835 |
| 7.00%, 12/15/26—9/15/31 | 20,290 | 23,332 |
| 7.50%, 12/15/26—11/15/30 | 6,249 | 7,201 |
| 8.00%, 1/15/30—10/15/30 | 19,933 | 23,454 |
| 8.50%, 4/15/25 | 5,321 | 6,261 |
| 9.00%, 10/15/27 | 10,157 | 12,046 |
| 9.50%, 2/15/25 | 3,426 | 3,993 |
| 9.50%, 11/15/17 | 125,386 | 136,924 |
| Government National Mortgage Association II: | | |
| 6.50%, 2/20/31—7/20/31 | 151,640 | 171,598 |
| 7.00%, 11/20/29 | 464 | 529 |
| | | 381,150,209 |
| U.S. Government Securities—23.0% | | |
| U.S. Treasury Bonds: | | |
| 4.25%, 5/15/39 | 33,233,000 | 34,775,211 |
| 5.25%, 11/15/28 | 12,975,000 | 15,653,118 |
| 7.50%, 11/15/24 | 21,235,000 | 30,966,597 |
| U.S. Treasury Notes: | | |
| 1.00%, 7/31/11 | 20,925,000 | 21,063,963 |
| 1.38%, 9/15/12 | 52,005,000 | 52,874,472 |
| 2.00%, 11/30/13 | 12,250,000 | 12,672,049 |
| 2.38%, 8/31/14 | 75,970,000 | 79,370,873 |
| 3.25%, 7/31/16 | 40,735,000 | 43,618,264 |
| | | 290,994,547 |
| Total Bonds and Notes | | |
| (cost $1,318,103,100) | | 1,377,942,709 |
| |
| |
| Short-Term Investments—9.1% | | |
| U.S. Treasury Bills: | | |
| 0.13%, 9/16/10 | 112,800,000 | 112,780,260 |
| 0.15%, 10/21/10 | 2,025,000 g | 2,024,415 |
| Total Short-Term Investments | | |
| (cost $114,804,868) | | 114,804,675 |
28
| | |
| Other Investment—.1% | Shares | Value ($) |
| Registered Investment Company; | | |
| Dreyfus Institutional Preferred | | |
| Plus Money Market Fund | | |
| (cost $1,235,000) | 1,235,000 h | 1,235,000 |
| |
| Investment of Cash Collateral | | |
| for Securities Loaned—1.2% | | |
| Registered Investment Company; | | |
| Dreyfus Institutional Cash | | |
| Advantage Plus Fund | | |
| (cost $14,924,807) | 14,924,807 h | 14,924,807 |
| |
| Total Investments (cost $1,449,067,775) | 119.3% | 1,508,907,191 |
| Liabilities, Less Cash and Receivables | (19.3%) | (243,512,652) |
| Net Assets | 100.0% | 1,265,394,539 |
|
| GO—General Obligation |
| REIT—Real Estate Investment Trust |
| a Security, or portion thereof, on loan.At July 31, 2010, the total market value of the fund’s securities on loan is |
| $14,399,539 and the total market value of the collateral held by the fund is $14,924,807. |
| b Securities exempt from registration under Rule 144A of the Securities Act of 1933.These securities may be resold in |
| transactions exempt from registration, normally to qualified institutional buyers.At July 31, 2010, these securities had |
| a total market value of $169,779,712 or 13.4% of net assets. |
| c Variable rate security—interest rate subject to periodic change. |
| d Principal amount stated in U.S. Dollars unless otherwise noted. |
| CLP—Chilean Peso |
| EUR—Euro |
| e On September 7, 2008, the Federal Housing Finance Agency (“FHFA”) placed Federal National Mortgage |
| Association and Federal Home Loan Mortgage Corporation into conservatorship with FHFA as the conservator.As |
| such, the FHFA will oversee the continuing affairs of these companies. |
| f Purchased on a forward commitment basis. |
| g Held by a broker as collateral for open financial futures, forward foreign currency exchange contracts and swap positions. |
| h Investment in affiliated money market mutual fund. |
| | | |
| Portfolio Summary (Unaudited)† | | |
| |
| Value (%) | | Value (%) |
| U.S. Government & Agencies | 53.6 | Municipal Bonds | 2.3 |
| Corporate Bonds | 36.8 | Foreign/Governmental | 1.7 |
| Asset/Mortgage-Backed | 14.5 | | |
| Short-Term/Money Market Investments | 10.4 | | 119.3 |
|
| † Based on net assets. |
| See notes to financial statements. |
|
| STATEMENT OF FINANCIAL FUTURES |
| July 31, 2010 |
| | | | |
| | | | | Unrealized |
| | | Market Value | | Appreciation |
| | | Covered by | | (Depreciation) |
| Contracts | Contracts ($) | Expiration | at 7/31/2010 ($) |
| Financial Futures Long | | | | |
| U.S. Treasury 5 Year Notes | 586 | 70,219,281 | September 2010 | 1,417,283 |
| Financial Futures Short | | | | |
| U.S. Treasury 2 Year Notes | 47 | (10,298,875) | September 2010 | (12,484) |
| U.S. Treasury 10 Year Notes | 396 | (49,029,750) | September 2010 | (969,057) |
| Gross Unrealized Appreciation | | | | 1,417,283 |
| Gross Unrealized Depreciation | | | | (981,541) |
| |
| See notes to financial statements. | | | | |
| | |
| STATEMENT OF OPTIONS WRITTEN | | |
| July 31, 2010 | | |
| |
| |
| |
| | Face Amount | |
| | Covered by | |
| | Contracts ($) | Value ($) |
| Put Options; | | |
| 10-Year USD LIBOR-BBA, | | |
| February 2011 @ 5.36 | | |
| (Premiums received $593,700) | 39,580,000 a | (7,857) |
| |
| BBA—British Bankers Association | | |
| LIBOR—London Interbank Offered Rate | | |
| USD—US Dollar | | |
| a Non-income producing security. | | |
| See notes to financial statements. | | |
30
|
| STATEMENT OF ASSETS AND LIABILITIES |
| July 31, 2010 |
| | | | |
| | | | Cost | Value |
| Assets ($): | | | | |
| Investments in securities—See Statement of Investments (including | | |
| securities on loan, valued at $14,399,539)—Note 1(c): | | |
| Unaffiliated issuers | | 1,432,907,968 1,492,747,384 |
| Affiliated issuers | | 16,159,807 | 16,159,807 |
| Cash | | | | 97,943 |
| Receivable for investment securities sold | | | 74,491,562 |
| Dividends and interest receivable | | | | 11,997,754 |
| Receivable for shares of Common Stock subscribed | | | 406,404 |
| Unrealized appreciation on forward foreign | | | |
| currency exchange contracts—Note 4 | | | 291,944 |
| Prepaid expenses and other receivables | | | 23,867 |
| | | | 1,596,216,665 |
| Liabilities ($): | | | | |
| Due to The Dreyfus Corporation and affiliates—Note 3(c) | | | 1,071,262 |
| Payable for investment securities purchased | | | 311,925,900 |
| Liability for securities on loan—Note 1(c) | | | 14,924,807 |
| Unrealized depreciation on swap contracts—Note 4 | | | 1,530,731 |
| Payable for shares of Common Stock redeemed | | | 862,712 |
| Payable for futures variation margin—Note 4 | | | 27,906 |
| Outstanding options written, at value (premiums received | | |
| $593,700)—See Statement of Options Written—Note 4 | | 7,857 |
| Unrealized depreciation on forward foreign | | | |
| currency exchange contracts—Note 4 | | | 5,057 |
| Accrued expenses | | | | 465,894 |
| | | | | 330,822,126 |
| Net Assets ($) | | | 1,265,394,539 |
| Composition of Net Assets ($): | | | | |
| Paid-in capital | | | 1,304,575,762 |
| Accumulated undistributed investment income—net | | | 1,473,891 |
| Accumulated net realized gain (loss) on investments | | | (100,271,867) |
| Accumulated net unrealized appreciation (depreciation) on investments, | | |
| options transactions, swap transactions and foreign currency transactions | |
| (including $435,742 net unrealized appreciation on financial futures) | | 59,616,753 |
| Net Assets ($) | | | 1,265,394,539 |
| |
| |
| |
| Net Asset Value Per Share | | | | |
| | Class A | Class B | Class C | Class I |
| Net Assets ($) | 1,176,710,059 | 10,995,973 | 47,907,152 | 29,781,355 |
| Shares Outstanding | 89,489,183 | 836,339 | 3,643,793 | 2,265,642 |
| Net Asset Value Per Share ($) | 13.15 | 13.15 | 13.15 | 13.14 |
|
| See notes to financial statements. |
| |
| STATEMENT OF OPERATIONS | |
| Year Ended July 31, 2010 | |
| |
| |
| |
| |
| Investment Income ($): | |
| Income: | |
| Interest | 63,141,133 |
| Income from securities lending—Note 1(c) | 52,392 |
| Dividends; | |
| Affiliated issuers | 29,097 |
| Total Income | 63,222,622 |
| Expenses: | |
| Management fee—Note 3(a) | 5,595,822 |
| Shareholder servicing costs—Note 3(c) | 4,755,380 |
| Distribution fees—Note 3(b) | 450,935 |
| Prospectus and shareholders’ reports | 150,249 |
| Custodian fees—Note 3(c) | 144,207 |
| Registration fees | 89,508 |
| Professional fees | 78,604 |
| Loan commitment fees—Note 2 | 27,953 |
| Directors’ fees and expenses—Note 3(d) | 15,938 |
| Miscellaneous | 166,825 |
| Total Expenses | 11,475,421 |
| Less—reduction in expenses due to undertaking—Note 3(a) | (179,858) |
| Less—reduction in fees due to earnings credits—Note 1(c) | (2,819) |
| Net Expenses | 11,292,744 |
| Investment Income—Net | 51,929,878 |
| Realized and Unrealized Gain (Loss) on Investments—Note 4 ($): | |
| Net realized gain (loss) on investments and foreign currency transactions | 20,683,628 |
| Net realized gain (loss) on options transactions | 4,336,054 |
| Net realized gain (loss) on financial futures | (2,489,834) |
| Net realized gain (loss) on swap transactions | 286,640 |
| Net realized gain (loss) on forward foreign currency exchange contracts | 7,523,058 |
| Net Realized Gain (Loss) | 30,339,546 |
| Net unrealized appreciation (depreciation) | |
| on investments and foreign currency transactions | 78,741,087 |
| Net unrealized appreciation (depreciation) on options transactions | (8,793) |
| Net unrealized appreciation (depreciation) on financial futures | 2,609,803 |
| Net unrealized appreciation (depreciation) on swap transactions | 2,202,839 |
| Net unrealized appreciation (depreciation) | |
| on forward foreign currency exchange contracts | (170,433) |
| Net Unrealized Appreciation (Depreciation) | 83,374,503 |
| Net Realized and Unrealized Gain (Loss) on Investments | 113,714,049 |
| Net Increase in Net Assets Resulting from Operations | 165,643,927 |
| |
| See notes to financial statements. | |
32
STATEMENT OF CHANGES IN NET ASSETS
| | |
| | | Year Ended July 31, |
| | 2010 | 2009 |
| Operations ($): | | |
| Investment income—net | 51,929,878 | 59,286,466 |
| Net realized gain (loss) on investments | 30,339,546 | (74,834,494) |
| Net unrealized appreciation | | |
| (depreciation) on investments | 83,374,503 | 62,134,455 |
| Net Increase (Decrease) in Net Assets | | |
| Resulting from Operations | 165,643,927 | 46,586,427 |
| Dividends to Shareholders from ($): | | |
| Investment income—net: | | |
| Class A Shares | (48,695,693) | (54,961,724) |
| Class B Shares | (550,219) | (1,041,319) |
| Class C Shares | (1,744,113) | (2,034,388) |
| Class I Shares | (1,279,118) | (1,472,323) |
| Total Dividends | (52,269,143) | (59,509,754) |
| Capital Stock Transactions ($): | | |
| Net proceeds from shares sold: | | |
| Class A Shares | 168,794,214 | 154,083,624 |
| Class B Shares | 730,529 | 2,358,381 |
| Class C Shares | 10,637,849 | 8,135,534 |
| Class I Shares | 15,882,924 | 5,400,642 |
| Net assets received in connection | | |
| with reorganization—Note 1 | — | 24,536,722 |
| Dividends reinvested: | | |
| Class A Shares | 43,694,500 | 48,776,930 |
| Class B Shares | 382,750 | 761,622 |
| Class C Shares | 1,335,614 | 1,552,632 |
| Class I Shares | 552,023 | 753,682 |
| Cost of shares redeemed: | | |
| Class A Shares | (266,471,594) | (342,729,365) |
| Class B Shares | (10,363,205) | (24,618,909) |
| Class C Shares | (18,857,966) | (14,022,262) |
| Class I Shares | (16,913,930) | (22,162,835) |
| Increase (Decrease) in Net Assets | | |
| from Capital Stock Transactions | (70,596,292) | (157,173,602) |
| Total Increase (Decrease) in Net Assets | 42,778,492 | (170,096,929) |
| Net Assets ($): | | |
| Beginning of Period | 1,222,616,047 | 1,392,712,976 |
| End of Period | 1,265,394,539 | 1,222,616,047 |
| Undistributed (distributions in excess of) | | |
| investment income—net | 1,473,891 | (484,701) |
STATEMENT OF CHANGES IN NET ASSETS (continued)
| | |
| | | Year Ended July 31, |
| | 2010 | 2009 |
| Capital Share Transactions: | | |
| Class Aa | | |
| Shares sold | 13,393,151 | 13,579,025 |
| Shares issued in connection | | |
| with reorganization—Note 1 | — | 1,676,218 |
| Shares issued for dividends reinvested | 3,460,021 | 4,314,541 |
| Shares redeemed | (21,166,038) | (30,407,431) |
| Net Increase (Decrease) in Shares Outstanding | (4,312,866) | (10,837,647) |
| Class Ba | | |
| Shares sold | 58,494 | 208,473 |
| Shares issued for dividends reinvested | 30,494 | 67,640 |
| Shares redeemed | (828,055) | (2,164,750) |
| Net Increase (Decrease) in Shares Outstanding | (739,067) | (1,888,637) |
| Class C | | |
| Shares sold | 845,451 | 719,901 |
| Shares issued for dividends reinvested | 105,914 | 137,248 |
| Shares redeemed | (1,490,834) | (1,245,418) |
| Net Increase (Decrease) in Shares Outstanding | (539,469) | (388,269) |
| Class I | | |
| Shares sold | 1,265,003 | 474,157 |
| Shares issued in connection | | |
| with reorganization—Note 1 | — | 536,798 |
| Shares issued for dividends reinvested | 43,810 | 66,279 |
| Shares redeemed | (1,345,229) | (1,988,284) |
| Net Increase (Decrease) in Shares Outstanding | (36,416) | (911,050) |
|
| a During the period ended July 31, 2010, 329,609 Class B shares representing $4,109,406, were automatically |
| converted to 329,547 Class A shares and during the period ended July 31, 2009, 1,076,760 Class B shares |
| representing $12,320,922, were automatically converted to 1,076,645 Class A shares. |
See notes to financial statements.
34
FINANCIAL HIGHLIGHTS
The following tables describe the performance for each share class for the fiscal periods indicated.All information (except portfolio turnover rate) reflects financial results for a single fund share.Total return shows how much your investment in the fund would have increased (or decreased) during each period, assuming you had reinvested all dividends and distributions.These figures have been derived from the fund’s financial statements.
| | | | | |
| | | | Year Ended July 31, | |
| Class A Shares | 2010 | 2009 | 2008a | 2007 | 2006 |
| Per Share Data ($): | | | | | |
| Net asset value, | | | | | |
| beginning of period | 12.00 | 12.02 | 12.40 | 12.35 | 12.75 |
| Investment Operations: | | | | | |
| Investment income—netb | .53 | .56 | .55 | .61 | .53 |
| Net realized and unrealized | | | | | |
| gain (loss) on investments | 1.15 | (.02) | (.32) | .08 | (.28) |
| Total from Investment Operations | 1.68 | .54 | .23 | .69 | .25 |
| Distributions: | | | | | |
| Dividends from | | | | | |
| investment income—net | (.53) | (.56) | (.60) | (.64) | (.58) |
| Dividends from net realized | | | | | |
| gain on investments | — | — | (.01) | — | (.07) |
| Total Distributions | (.53) | (.56) | (.61) | (.64) | (.65) |
| Net asset value, end of period | 13.15 | 12.00 | 12.02 | 12.40 | 12.35 |
| Total Return (%) | 14.29c | 4.90c | 1.76c | 5.74 | 2.05 |
| Ratios/Supplemental Data (%): | | | | | |
| Ratio of total expenses | | | | | |
| to average net assets | .89 | .92 | .87 | .92 | .91 |
| Ratio of net expenses | | | | | |
| to average net assets | .88 | .82 | .80 | .80 | .80 |
| Ratio of net investment income | | | | | |
| to average net assets | 4.21 | 4.93 | 4.53 | 4.85 | 4.21 |
| Portfolio Turnover Rated | 237.07 | 343.03 | 385.86 | 492.35 | 439.09 |
| Net Assets, end of period | | | | | |
| ($ x 1,000) | 1,176,710 | 1,125,878 | 1,257,597 | 522,661 | 458,856 |
|
| a The fund commenced offering four classes of shares on May 13, 2008.The existing Investor shares were redesignated |
| as Class A shares. |
| b Based on average shares outstanding at each month end. |
| c Exclusive of sales charge. |
| d The portfolio turnover rates excluding mortgage dollar roll transactions for the periods ended July 31, 2010, 2009, |
| 2008, 2007 and 2006 were 90.98%, 108.07%, 125.60%, 357.70% and 270.18%, respectively. |
See notes to financial statements.
FINANCIAL HIGHLIGHTS (continued)
| | | |
| | | Year Ended July 31, |
| Class B Shares | 2010 | 2009 | 2008a |
| Per Share Data ($): | | | |
| Net asset value, beginning of period | 12.01 | 12.01 | 12.35 |
| Investment Operations: | | | |
| Investment income—netb | .48 | .46 | .06 |
| Net realized and unrealized | | | |
| gain (loss) on investments | 1.13 | .00c | (.29) |
| Total from Investment Operations | 1.61 | .46 | (.23) |
| Distributions: | | | |
| Dividends from investment income—net | (.47) | (.46) | (.11) |
| Net asset value, end of period | 13.15 | 12.01 | 12.01 |
| Total Return (%)d | 13.72 | 3.95 | (1.77)e |
| Ratios/Supplemental Data (%): | | | |
| Ratio of total expenses to average net assets | 1.43 | 1.59 | 1.70f |
| Ratio of net expenses to average net assetsg | 1.43 | 1.59 | 1.70f |
| Ratio of net investment income | | | |
| to average net assets | 3.86 | 4.14 | 2.43f |
| Portfolio Turnover Rateh | 237.07 | 343.03 | 385.86 |
| Net Assets, end of period ($ x 1,000) | 10,996 | 18,918 | 41,588 |
|
| a From May 13, 2008 (commencement of initial offering) to July 31, 2008. |
| b Based on average shares outstanding at each month end. |
| c Amount represents less than $.01 per share. |
| d Exclusive of sales charge. |
| e Not annualized. |
| f Annualized. |
| g Expense waivers and/or reimbursements amounted to less than .01%. |
| h The portfolio turnover rates excluding mortgage dollar roll transactions for the periods ended July 31, 2010, 2009 |
| and 2008 were 90.98%, 108.07% and 125.60%, respectively. |
See notes to financial statements.
36
| | | |
| | | Year Ended July 31, |
| Class C Shares | 2010 | 2009 | 2008a |
| Per Share Data ($): | | | |
| Net asset value, beginning of period | 12.00 | 12.02 | 12.35 |
| Investment Operations: | | | |
| Investment income—netb | .43 | .46 | .06 |
| Net realized and unrealized | | | |
| gain (loss) on investments | 1.15 | (.02) | (.28) |
| Total from Investment Operations | 1.58 | .44 | (.22) |
| Distributions: | | | |
| Dividends from investment income—net | (.43) | (.46) | (.11) |
| Net asset value, end of period | 13.15 | 12.00 | 12.02 |
| Total Return (%)c | 13.40 | 4.01 | (1.81)d |
| Ratios/Supplemental Data (%): | | | |
| Ratio of total expenses to average net assets | 1.66 | 1.69 | 1.49e |
| Ratio of net expenses to average net assetsf | 1.66 | 1.69 | 1.49e |
| Ratio of net investment income | | | |
| to average net assets | 3.41 | 4.07 | 2.64e |
| Portfolio Turnover Rateg | 237.07 | 343.03 | 385.86 |
| Net Assets, end of period ($ x 1,000) | 47,907 | 50,196 | 54,928 |
| |
| a | From May 13, 2008 (commencement of initial offering) to July 31, 2008. |
| b | Based on average shares outstanding at each month end. |
| c | Exclusive of sales charge. |
| d | Not annualized. |
| e | Annualized. |
| f | Expense waivers and/or reimbursements amounted to less than .01%. |
| g | The portfolio turnover rates excluding mortgage dollar roll transactions for the periods ended July 31, 2010, 2009 |
| | and 2008 were 90.98%, 108.07% and 125.60%, respectively. |
| See notes to financial statements. |
FINANCIAL HIGHLIGHTS (continued)
| | | | | |
| | | Year Ended July 31, | |
| Class I Shares | 2010 | 2009 | 2008a | 2007 | 2006 |
| Per Share Data ($): | | | | | |
| Net asset value, beginning of period | 12.00 | 12.01 | 12.40 | 12.34 | 12.75 |
| Investment Operations: | | | | | |
| Investment income—netb | .56 | .58 | .60 | .64 | .56 |
| Net realized and unrealized | | | | | |
| gain (loss) on investments | 1.15 | .00c | (.34) | .09 | (.28) |
| Total from Investment Operations | 1.71 | .58 | .26 | .73 | .28 |
| Distributions: | | | | | |
| Dividends from investment income—net | (.57) | (.59) | (.64) | (.67) | (.62) |
| Dividends from net realized | | | | | |
| gain on investments | — | — | (.01) | — | (.07) |
| Total Distributions | (.57) | (.59) | (.65) | (.67) | (.69) |
| Net asset value, end of period | 13.14 | 12.00 | 12.01 | 12.40 | 12.34 |
| Total Return (%) | 14.52 | 5.27 | 2.05 | 6.02 | 2.35 |
| Ratios/Supplemental Data (%): | | | | | |
| Ratio of total expenses | | | | | |
| to average net assets | .62 | .60 | .52 | .53 | .51 |
| Ratio of net expenses | | | | | |
| to average net assets | .59 | .54 | .52d | .53d | .51d |
| Ratio of net investment income | | | | | |
| to average net assets | 4.46 | 5.18 | 4.83 | 5.10 | 4.48 |
| Portfolio Turnover Ratee | 237.07 | 343.03 | 385.86 | 492.35 | 439.09 |
| Net Assets, end of period ($ x 1,000) | 29,781 | 27,624 | 38,600 | 35,482 | 31,473 |
| |
| a | The fund commenced offering four classes of shares on May 13, 2008.The existing Institutional shares were |
| | redesignated as Class I shares. |
| b | Based on average shares outstanding at each month end. |
| c | Amount represents less than $.01 per share. |
| d | Expense waivers and/or reimbursements amounted to less than .01%. |
| e | The portfolio turnover rates excluding mortgage dollar roll transactions for the periods ended July 31, 2010, 2009, |
| | 2008, 2007 and 2006 were 90.98%, 108.07%, 125.60%, 357.70% and 270.18%, respectively. |
| See notes to financial statements. |
38
NOTES TO FINANCIAL STATEMENTS
NOTE 1—Significant Accounting Policies:
Dreyfus Intermediate Term Income Fund (the “fund”) is a separate diversified series of Dreyfus Investment Grade Funds, Inc. (the “Company”), which is registered under the Investment Company Act of 1940, as amended (the “Act”), as an open-end management investment company and operates as a series company currently offering three series, including the fund.The fund’s investment objective seeks to maximize total return, consisting of capital appreciation and current income. The Dreyfus Corporation (the “Manager” or “Dreyfus”), a wholly-owned subsidiary of The Bank of New York Mellon Corporation (“BNY Mellon”), serves as the fund’s investment adviser.
As of the close of business on December 17, 2008, pursuant to an Agreement and Plan of Reorganization previously approved by the fund’s Board of Directors, all of the assets, subject to the liabilities, of Dreyfus Premier Limited Term Income Fund (“Limited Term Income”) were transferred to the fund in exchange for corresponding class of shares of Common Stock of the fund of equal value. Shareholders of Class A, Class B and Class C shares of Limited Term Income received Class A shares of the fund and shareholders of Class I shares of Limited Term Income received Class I shares of the fund, in each case in an amount equal to the aggregate net asset value of their investment in Limited Term Income at the time of the exchange.The net asset value of the fund’s shares on the close of business December 17, 2008, after the reorganization was $11.09 for Class A, $11.08 for Class I, and a total of 1,676,218 Class A sh ares and 536,798 Class I shares, representing net assets of $24,536,722 (including $2,679,073 net unrealized depreciation on investments) were issued to shareholders of Limited Term Income in the exchange. The exchange was a tax-free event to the Limited Term Income shareholders.
MBSC Securities Corporation (the “Distributor”), a wholly-owned subsidiary of the Manager, is the distributor of the fund’s shares. The fund is authorized to issue 1.2 billion shares of $.001 par value Common Stock.The fund currently offers four classes of shares: Class A (500 million shares authorized), Class B (100 million shares authorized), Class C
NOTES TO FINANCIAL STATEMENTS (continued)
(100 million shares authorized) and Class I (500 million shares authorized). Class A shares are subject to a sales charge imposed at the time of purchase. Class B shares are subject to a contingent deferred sales charge (“CDSC”) imposed on Class B share redemptions made within six years of purchase and automatically convert to Class A shares after six years. The fund does not offer Class B shares, except in connection with dividend reinvestment and permitted exchanges of Class B shares. Class C shares are subject to a CDSC imposed on Class C shares redeemed within one year of purchase. Class I shares are sold at net asset value per share only to institutional investors. Other differences between the classes include the services offered to and the expenses borne by each class, the allocation of certain transfer agency costs and certain voting rights. Income, expenses (other than expenses attributable to a specific clas s), and realized and unrealized gains or losses on investments are allocated to each class of shares based on its relative net assets.
The Company accounts separately for the assets, liabilities and operations of each series. Expenses directly attributable to each series are charged to that series’ operations; expenses which are applicable to all series are allocated among them on a pro rata basis.
The Financial Accounting Standards Board (“FASB”) Accounting Standards Codification (“ASC”) has become the exclusive reference of authoritative U.S. generally accepted accounting principles (“GAAP”) recognized by the FASB to be applied by nongovernmental entities. Rules and interpretive releases of the Securities and Exchange Commission (“SEC”) under authority of federal laws are also sources of authoritative GAAP for SEC registrants. The ASC has superseded all existing non-SEC accounting and reporting standards. The fund’s financial statements are prepared in accordance with GAAP, which may require the use of management estimates and assumptions.Actual results could differ from those estimates.
The Company enters into contracts that contain a variety of indemnifications. The fund’s maximum exposure under these arrangements is unknown.The fund does not anticipate recognizing any loss related to these arrangements.
40
(a) Portfolio valuation: Investments in securities, excluding short-term investments (other than U.S. Treasury Bills), financial futures, options transactions, swap transactions and forward foreign currency exchange contracts (“forward contracts”) are valued each business day by an independent pricing service (the “Service”) approved by the Board of Directors. Investments for which quoted bid prices are readily available and are representative of the bid side of the market in the judgment of the Service are valued at the mean between the quoted bid prices (as obtained by the Service from dealers in such securities) and asked prices (as calculated by the Service based upon its evaluation of the market for such securities). Other investments (which constitute a majority of the portfolio securities) are valued as determined by the Serv ice, based on methods which include consideration of: yields or prices of securities of comparable quality, coupon, maturity and type; indications as to values from dealers; and general market conditions. Restricted securities, as well as securities or other assets for which recent market quotations are not readily available, that are not valued by a pricing service approved by the Board of Directors, or are determined by the fund not to reflect accurately fair value, are valued at fair value as determined in good faith under the direction of the Board of Directors.The factors that may be considered when fair valuing a security include fundamental analytical data, the nature and duration of restrictions on disposition, an evaluation of the forces that influence the market in which the securities are purchased and sold and public trading in similar securities of the issuer or comparable issuers. Short-term investments, excluding U.S.Treasury Bills, are carried at amortized cost, which approximates value. Regi stered investment companies that are not traded on an exchange are valued at their net asset value. Financial futures and options, which are traded on an exchange, are valued at the last sales price on the securities exchange on which such securities are primarily traded or at the last sales price on the national securities market on each business day. Options traded over-the-counter are valued at
NOTES TO FINANCIAL STATEMENTS (continued)
the mean between the bid and the asked price.Investments in swap transactions are valued each business day by an independent pricing service approved by the Board of Directors. Swaps are valued by the service by using a swap pricing model which incorporates among other factors, default probabilities, recovery rates, credit curves of the underlying issuer and swap spreads on interest rates. Investments denominated in foreign currencies are translated to U.S.dollars at the prevailing rates of exchange. Forward contracts are valued at the forward rate.
The fair value of a financial instrument is the amount that would be received to sell an asset or paid to transfer a liability in an orderly transaction between market participants at the measurement date (i.e. the exit price). GAAP establishes a fair value hierarchy that prioritizes the inputs of valuation techniques used to measure fair value.This hierarchy gives the highest priority to unadjusted quoted prices in active markets for identical assets or liabilities (Level 1 measurements) and the lowest priority to unobservable inputs (Level 3 measurements).
Additionally, GAAP provides guidance on determining whether the volume and activity in a market has decreased significantly and whether such a decrease in activity results in transactions that are not orderly. GAAP requires enhanced disclosures around valuation inputs and techniques used during annual and interim periods.
Various inputs are used in determining the value of the fund’s investments relating to fair value measurements.These inputs are summarized in the three broad levels listed below:
Level 1—unadjusted quoted prices in active markets for
identical investments.
Level 2—other significant observable inputs (including quoted
prices for similar investments, interest rates, prepayment speeds,
credit risk, etc.).
Level 3—significant unobservable inputs (including the fund’s own
assumptions in determining the fair value of investments).
42
The inputs or methodology used for valuing securities are not necessarily an indication of the risk associated with investing in those securities.
The following is a summary of the inputs used as of July 31, 2010 in valuing the fund’s investments:
| | | | |
| | | Level 2—Other | Level 3— | |
| | Level 1— | Significant | Significant | |
| | Unadjusted | Observable Unobservable | |
| | Quoted Prices | Inputs | Inputs | Total |
| Assets ($) | | | | |
| Investments in Securities: | | | |
| Asset-Backed | — | 58,080,443 | — | 58,080,443 |
| Commercial | | | | |
| Mortgage-Backed | — | 122,082,702 | — | 122,082,702 |
| Corporate Bonds† | — | 464,670,107 | — | 464,670,107 |
| Foreign Government | — | 20,907,552 | — | 20,907,552 |
| Municipal Bonds | — | 29,612,739 | — | 29,612,739 |
| Mutual Funds | 16,159,807 | — | — | 16,159,807 |
| Residential | | | | |
| Mortgage-Backed | — | 3,939,600 | — | 3,939,600 |
| U.S. Government | | | | |
| Agencies/ | | | | |
| Mortgage-Backed | — | 387,655,019 | — | 387,655,019 |
| U.S. Treasury | — | 405,799,222 | — | 405,799,222 |
| Other Financial Instruments: | | | |
| Forward Foreign | | | | |
| Currency Exchange | | | | |
| Contracts†† | — | 291,944 | — | 291,944 |
| Futures†† | 1,417,283 | — | — | 1,417,283 |
| Liabilities ($) | | | | |
| Other Financial | | | | |
| Instruments: | | | | |
| Forward Foreign | | | | |
| Currency Exchange | | | | |
| Contracts†† | — | (5,057) | — | (5,057) |
| Futures†† | (981,541) | — | — | (981,541) |
| Swaps†† | — | (1,530,731) | — | (1,530,731) |
| Options Written | — | (7,857) | — | (7,857) |
| |
| † | See Statement of Investments for industry classification. |
| †† | Amount shown represents unrealized appreciation (depreciation) at period end. |
NOTES TO FINANCIAL STATEMENTS (continued)
In January 2010, FASB issued Accounting Standards Update (“ASU”) No. 2010-06 “Improving Disclosures about Fair Value Measurements”. The portions of ASU No. 2010-06 which require reporting entities to prepare new disclosures surrounding amounts and reasons for significant transfers in and out of Level 1 and Level 2 fair value measurements as well as inputs and valuation techniques used to measure fair value for both recurring and nonrecurring fair value measurements that fall in either Level 2 or Level 3 have been adopted by the fund. No significant transfers between Level 1 or Level 2 fair value measurements occurred during the period ended July 31, 2010.The remaining portion of ASU No. 2010-06 requires reporting entities to make new disclosures about information on purchases, sales, issuances and settlements on a gross basis in the reconciliation of activity in Level 3 fair value measurements.These new and revised disclosures are required to be implemented for fiscal years beginning after December 15, 2010. Management is currently evaluating the impact that the adoption of this remaining portion of ASU No.2010-06 may have on the fund’s financial statement disclosures.
(b) Foreign currency transactions: The fund does not isolate that portion of the results of operations resulting from changes in foreign exchange rates on investments from the fluctuations arising from changes in market prices of securities held. Such fluctuations are included with the net realized and unrealized gain or loss on investments.
Net realized foreign exchange gains or losses arise from sales of foreign currencies, currency gains or losses realized on securities transactions between trade and settlement date, and the difference between the amounts of dividends, interest, and foreign withholding taxes recorded on the fund’s books and the U.S. dollar equivalent of the amounts actually received or paid. Net unrealized foreign exchange gains and losses arise from changes in the value of assets and liabilities other than investments resulting from changes in exchange rates. Foreign currency gains and losses on investments are included with net realized and unrealized gain or loss on investments.
44
(c) Securities transactions and investment income: Securities transactions are recorded on a trade date basis. Realized gains and losses from securities transactions are recorded on the identified cost basis. Dividend income is recognized on the ex-dividend date and interest income, including, where applicable, accretion of discount and amortization of premium on investments, is recognized on the accrual basis.
The fund has arrangements with the custodian and cash management bank whereby the fund may receive earnings credits when positive cash balances are maintained, which are used to offset custody and cash management fees. For financial reporting purposes, the fund includes net earnings credits as an expense offset in the Statement of Operations.
Pursuant to a securities lending agreement withThe Bank of NewYork Mellon, a subsidiary of BNY Mellon and an affiliate of Dreyfus, the fund may lend securities to qualified institutions. It is the fund’s policy that, at origination, all loans are secured by collateral of at least 102% of the value of U.S. securities loaned and 105% of the value of foreign securities loaned. Collateral equivalent to at least 100% of the market value of securities on loan is maintained at all times. Collateral is either in the form of cash, which can be invested in certain money market mutual funds managed by the Manager, U.S. Government and Agency securities or letters of credit.The fund is entitled to receive all income on securities loaned, in addition to income earned as a result of the lending transaction. Although each security loaned is fully collateralized, the fund bears the risk of delay in recovery of, or loss of rights in, the se curities loaned should a borrower fail to return the securities in a timely manner. During the period ended July 31, 2010, The Bank of New York Mellon earned $28,211 from lending portfolio securities, pursuant to the securities lending agreement.
(d) Affiliated issuers: Investments in other investment companies advised by Dreyfus are defined as “affiliated” in the Act.
NOTES TO FINANCIAL STATEMENTS (continued)
The fund may invest in shares of certain affiliated investment companies also advised or managed by Dreyfus. Investments in affiliated investment companies for the period ended July 31, 2010 were as follows:

(e) Dividends to shareholders: It is the policy of the fund to declare dividends daily from investment income-net. Such dividends are paid monthly. Dividends from net realized capital gains, if any, are normally declared and paid annually, but the fund may make distributions on a more frequent basis to comply with the distribution requirements of the Internal Revenue Code of 1986, as amended (the “Code”).To the extent that net realized capital gains can be offset by capital loss carryovers, it is the policy of the fund not to distribute such gains. Income and capital gain distributions are determined in accordance with income tax regulations, which may differ from GAAP.
(f) Federal income taxes: It is the policy of the fund to continue to qualify as a regulated investment company, if such qualification is in the best interests of its shareholders, by complying with the applicable provisions of the Code, and to make distributions of taxable income sufficient to relieve it from substantially all federal income and excise taxes.
As of and during the period ended July 31, 2010, the fund did not have any liabilities for any uncertain tax positions.The fund recognizes inter-
46
est and penalties, if any, related to uncertain tax positions as income tax expense in the Statement of Operations. During the period, the fund did not incur any interest or penalties.
Each of the tax years in the four-year period ended July 31, 2010 remains subject to examination by the Internal Revenue Service and state taxing authorities.
At July 31, 2010, the components of accumulated earnings on a tax basis were as follows:undistributed ordinary income $1,473,891,accumulated capital losses $88,766,387 and unrealized appreciation $48,111,273.
The accumulated capital loss carryover is available for federal income tax purposes to be applied against future net securities profits, if any, realized subsequent to July 31, 2010. If not applied, $8,440,328 of the carryover expires in fiscal 2011, $7,653,528 expires in fiscal 2012, $19,091,268 expires in fiscal 2013, $4,661,252 expires in fiscal 2014, $11,616,326 expires in fiscal 2015, $635,541 expires in fiscal 2016, $33,295,069 expires in fiscal 2017 and $3,373,075 expires in fiscal 2018.
The tax character of distributions paid to shareholders during the fiscal periods ended July 31, 2010 and July 31, 2009 were as follows: ordinary income $52,269,143 and $59,509,754, respectively.
During the period ended July 31, 2010, as a result of permanent book to tax differences, primarily due to the tax treatment for amortization of premiums, paydown gains and losses on mortgage-backed securities, foreign currency transactions and consent fees, the fund increased accumulated undistributed investment income-net by $2,297,857 and decreased accumulated net realized gain (loss) on investments by the same amount. Net assets and net asset value per share were not affected by this reclassification.
NOTES TO FINANCIAL STATEMENTS (continued)
NOTE 2—Bank Lines of Credit:
The fund participates with other Dreyfus-managed funds in a $225 million unsecured credit facility led by Citibank, N.A. and a $300 million unsecured credit facility provided by The Bank of New York Mellon (each, a “Facility”), each to be utilized primarily for temporary or emergency purposes, including the financing of redemptions. In connection therewith, the fund has agreed to pay its pro rata portion of commitment fees for each Facility. Interest is charged to the fund based on rates determined pursuant to the terms of the respective Facility at the time of borrowing. During the period ended on July 31, 2010, the fund did not borrow under the Facilities.
NOTE 3—Management Fee and Other Transactions With Affiliates:
(a) Pursuant to a management agreement with the Manager, the management fee is computed at the annual rate of .45% of the value of the fund’s average daily net assets and is payable monthly.
The Manager had agreed to waive receipt of its fees and/or assume the expenses of the fund from August 1, 2009 to December 31, 2009, so that the total annual operating expenses of Class A and Class I shares (excluding taxes, interest, brokerage commissions, commitment fees on borrowings and extraordinary expenses) did not exceed .85% for Class A and .53% for Class I, respectively. The reduction in expenses, pursuant to the undertaking, amounted to $179,858 during the period ended July 31, 2010.
During the period ended July 31, 2010, the Distributor retained $11,669 from commissions earned on sales of the fund’s Class A shares and $18,368 and $13,579 from CDSCs on redemptions of the fund’s Class B and Class C shares, respectively.
(b) Under the Distribution Plan (the “Plan”) adopted pursuant to Rule 12b-1 under the Act, Class B and Class C shares pay the Distributor for distributing their shares at an annual rate of .50% of the value of the average daily net assets of Class B shares and .75% of the value of the average daily net assets of Class C shares. During the period ended
48
July 31, 2010, Class B and Class C shares were charged $72,300 and $378,635, respectively, pursuant to the Plan.
(c) Under the Shareholder Services Plan, Class A, Class B and Class C shares pay the Distributor at an annual rate of .25% of the value of their average daily net assets for the provision of certain services.The services provided may include personal services relating to shareholder accounts, such as answering shareholder inquiries regarding the fund and providing reports and other information, and services related to the maintenance of shareholder accounts.The Distributor may make payments to Service Agents (a securities dealer, financial institution or other industry professional) in respect of these services. The Distributor determines the amounts to be paid to Service Agents. During the period ended July 31, 2010, Class A, Class B and Class C shares were charged $2,875,689, $36,150 and $126,212, respectively, pursuant to the Shareholder Services Pl an.
The fund compensates Dreyfus Transfer, Inc., a wholly-owned subsidiary of the Manager, under a transfer agency agreement for providing personnel and facilities to perform transfer agency services for the fund. During the period ended July 31, 2010, the fund was charged $481,672 pursuant to the transfer agency agreement, which is included in Shareholder servicing costs in the Statement of Operations.
The fund compensates The Bank of New York Mellon under a cash management agreement for performing cash management services related to fund subscriptions and redemptions. During the period ended July 31, 2010, the fund was charged $52,453 pursuant to the cash management agreement, which is included in Shareholder servicing costs in the Statement of Operations.These fees were partially offset by earnings credits of $2,819.
The fund also compensates The Bank of New York Mellon under a custody agreement for providing custodial services for the fund. During the period ended July 31, 2010, the fund was charged $144,207 pursuant to the custody agreement.
NOTES TO FINANCIAL STATEMENTS (continued)
During the period ended July 31, 2010, the fund was charged $4,366 for services performed by the Chief Compliance Officer.
The components of “Due to The Dreyfus Corporation and affiliates” in the Statement of Assets and Liabilities consist of: management fees $478,695, Rule 12b-1 distribution plan fees $35,083, shareholder services plan fees $259,707, custodian fees $47,851, chief compliance officer fees $1,341 and transfer agency per account fees $248,585.
(d) Each Board member also serves as a Board member of other funds within the Dreyfus complex. Annual retainer fees and attendance fees are allocated to each fund based on net assets.
NOTE 4—Securities Transactions:
The aggregate amount of purchases and sales (including paydowns) of investment securities, excluding short-term securities, options transactions, financial futures, forward contracts and swap transactions, during the period ended July 31, 2010, amounted to $3,260,424,128 and $3,340,417,390, respectively, of which $2,009,104,753 in purchases and $2,016,938,545 in sales were from mortgage dollar roll transactions.
The provisions of ASC Topic 815 “Derivatives and Hedging” require qualitative disclosures about objectives and strategies for using derivatives, quantitative disclosures about fair value amounts of gains and losses on derivative instruments and disclosures about credit-risk-related contingent features in derivative agreements. The disclosure requirements distinguish between derivatives, which are accounted for as “hedges” and those that do not qualify for hedge accounting. Because investment companies value their derivatives at fair value and recognize changes in fair value through the Statement of Operations, they do not qualify for such accounting. Accordingly, even though a fund’s investments in derivatives may represent economic hedges, they are considered to be non-hedge transactions for purposes of this disclosure. The following tables show the fund’s exposure to different types of market ris k as it relates to the Statement of Assets and Liabilities and the Statement of Operations, respectively.
50
Fair value of derivative instruments as of July 31, 2010 is shown below:
| | | |
| | Derivative | | Derivative |
| | Assets ($) | | Liabilities ($) |
| Interest rate risk1 | 1,417,283 | Interest rate risk1,2 | (989,398) |
| Foreign exchange risk3 | 291,944 | Foreign exchange risk4 | (5,057) |
| Credit risk | — | Credit risk5 | (1,530,731) |
| Gross fair value of | | | |
| derivatives contracts | 1,709,227 | | (2,525,186) |
| |
| Statement of Assets and Liabilities location: |
| 1 | Includes cumulative appreciation (depreciation) on futures contracts as reported in the Statement of |
| | Financial Futures, but only the unpaid variation margin is reported in the Statement of Assets |
| | and Liabilities. |
| 2 | Outstanding options written, at value. |
| 3 | Unrealized appreciation on forward foreign currency exchange contracts. |
| 4 | Unrealized depreciation on forward foreign currency exchange contracts. |
| 5 | Unrealized depreciation on swap contracts. |
The effect of derivative instruments in the Statement of Operations during the period ended July 31, 2010 is shown below:
| | | | | |
| | Amount of realized gain or (loss) on derivatives recognized in income ($) |
| | | | Forward | | |
| Underlying risk | Futures6 | Options7 | Contracts8 | Swaps9 | Total |
| Interest rate | (2,489,834) | 4,336,054 | — | — | 1,846,220 |
| Foreign exchange | — | — | 7,523,058 | — | 7,523,058 |
| Credit | — | — | — | 286,640 | 286,640 |
| Total | (2,489,834) | 4,336,054 | 7,523,058 | 286,640 | 9,655,918 |
| | | | | |
| Change in unrealized appreciation or (depreciation) on derivatives recognized in income ($) |
| | | | Forward | | |
| Underlying risk | Futures10 | Options11 | Contracts12 | Swaps13 | Total |
| Interest rate | 2,609,803 | (8,793) | — | | 2,601,010 |
| Foreign exchange | — | — | (170,433) | — | (170,433) |
| Credit | — | — | — | 2,202,839 | 2,202,839 |
| Total | 2,609,803 | (8,793) | (170,433) | 2,202,839 | 4,633,416 |
| |
| Statement of Operations location: |
| 6 | Net realized gain (loss) on financial futures. |
| 7 | Net realized gain (loss) on options transactions. |
| 8 | Net realized gain (loss) on forward foreign currency exchange contracts. |
| 9 | Net realized gain (loss) on swap transactions. |
| 10 | Net unrealized appreciation (depreciation) on financial futures. |
| 11 | Net unrealized appreciation (depreciation) on options transactions. |
| 12 | Net unrealized appreciation (depreciation) on forward foreign currency exchange contracts. |
| 13 | Net unrealized appreciation (depreciation) on swap transactions. |
NOTES TO FINANCIAL STATEMENTS (continued)
The following summarizes the average market value and percentage of average net assets of derivatives outstanding for the period ended July 31, 2010:
| | |
| | Value ($) | Average Net Assets (%) |
| Interest rate futures contracts | 168,758,388 | 13.57 |
| Interest rate options contracts | 10,953,857 | .88 |
| Forward contracts | 59,008,500 | 4.75 |
The following summarizes the average notional value and percentage of average net assets of swap contracts outstanding for the period ended July 31, 2010:
| | |
| | Value ($) | Average Net Assets (%) |
| Credit default swap contracts | 23,420,000 | 1.88 |
Mortgage Dollar Rolls: A mortgage dollar roll transaction involves a sale by the fund of mortgage related securities that it holds with an agreement by the fund to repurchase similar securities at an agreed upon price and date.The securities purchased will bear the same interest rate as those sold, but generally will be collateralized by pools of mortgages with different prepayment histories than those securities sold.
Futures Contracts: In the normal course of pursuing its investment objective, the fund is exposed to market risk, including interest rate risk as a result of changes in value of underlying financial instruments. The fund invests in financial futures contracts in order to manage its exposure to or protect against changes in the market. A futures contract represents a commitment for the future purchase or a sale of an asset at a specified date. Upon entering into such contracts, these investments require initial margin deposits with a broker, which consist of cash or cash equivalents.The amount of these deposits is determined by the exchange or Board of Trade on which the contract is traded and is subject to change. Accordingly, variation margin payments are received or made to reflect daily unrealized gains or losses which are recorded in the Statement of Operations. Futures contracts are valued daily at the last sales price established by the Board of Trade or exchange upon which they are traded. When the contracts are
52
closed, the fund recognizes a realized gain or loss. There is minimal counterparty credit risk to the fund with futures since futures are exchange traded, and the exchange’s clearinghouse guarantees the futures against default. Contracts open at July 31, 2010 are set forth in the Statement of Financial Futures.
Options:The fund may purchase and write (sell) put and call options to hedge against changes in interest rates, or as a substitute for an invest-ment.The fund is subject to interest rate risk in the course of pursuing its investment objectives through its investments in options contracts.A call option gives the purchaser of the option the right (but not the obligation) to buy, and obligates the writer to sell, the underlying security or securities at the exercise price at any time during the option period, or at a specified date. Conversely, a put option gives the purchaser of the option the right (but not the obligation) to sell, and obligates the writer to buy the underlying security or securities at the exercise price at any time during the option period, or at a specified date.
As a writer of call options, the fund receives a premium at the outset and then bears the market risk of unfavorable changes in the price of the financial instrument underlying the option. Generally, the fund realizes a gain,to the extent of the premium,if the price of the underlying financial instrument decreases between the date the option is written and the date on which the option is terminated. Generally, the fund incurs a loss, if the price of the financial instrument increases between those dates.
As a writer of put options, the fund receives a premium at the outset and then bears the market risk of unfavorable changes in the price of the financial instrument underlying the option. Generally, the fund realizes a gain,to the extent of the premium,if the price of the underlying financial instrument increases between the date the option is written and the date on which the option is terminated. Generally, the fund incurs a loss, if the price of the financial instrument decreases between those dates.
As a writer of an option, the fund may have no control over whether the underlying securities may be sold (call) or purchased (put) and as
NOTES TO FINANCIAL STATEMENTS (continued)
a result bears the market risk of an unfavorable change in the price of the security underlying the written option.There is a risk of loss from a change in value of such options which may exceed the related premiums received. One risk of holding a put or a call option is that if the option is not sold or exercised prior to its expiration, it becomes worthless. However, this risk is limited to the premium paid by the fund. Upon the expiration or closing of the option transaction, a gain or loss is reported in the Statement of Operations.
The following summarizes the fund’s call/put options written for the period ended July 31, 2010:
| | | | |
| | Face Amount | | Options Terminated |
| | Covered by | Premiums | | Net Realized |
| Options Written: | Contracts ($) | Received ($) | Cost ($) | Gain ($) |
| Contracts outstanding | | | | |
| July 31, 2009 | 168,514,000 | 2,160,248 | | |
| Contracts written | 1,058,675,000 | 29,866,928 | | |
| Contracts terminated: | | | | |
| Contracts closed | 700,127,000 | 26,703,494 | 26,568,857 | 134,637 |
| Contracts expired | 487,482,000 | 4,729,982 | — | 4,729,982 |
| Total contracts | | | | |
| terminated | 1,187,609,000 | 31,433,476 | 26,568,857 | 4,864,619 |
| Contracts outstanding | | | | |
| July 31, 2010 | 39,580,000 | 593,700 | | |
Forward Foreign Currency Exchange Contracts: The fund enters into forward contracts in order to hedge its exposure to changes in foreign currency exchange rates on its foreign portfolio holdings, to settle foreign currency transactions or as a part of its investment strategy. When executing forward contracts, the fund is obligated to buy or sell a foreign currency at a specified rate on a certain date in the future. With respect to sales of forward contracts, the fund incurs a loss if the value of the contract increases between the date the forward contract is opened and the date the forward contract is closed.The fund realizes a gain if the value of the contract decreases between those dates. With respect to purchases of forward contracts, the fund incurs a loss if the value of the contract decreases between the date the forward contract is opened and the date the forward contract is closed.The fund realizes
54
a gain if the value of the contract increases between those dates. Any realized gain or loss which occurred during the period is reflected in the Statement of Operations.The fund is exposed to foreign currency risk as a result of changes in value of underlying financial instruments. The fund is also exposed to credit risk associated with counterparty nonperformance on these forward contracts, which is typically limited to the unrealized gain on each open contract.The following summarizes open forward contracts at July 31, 2010:
| | | | |
| | | Foreign | | Unrealized |
| Forward Foreign Currency | Currency | | Appreciation |
| Exchange Contracts | Amounts | Cost ($) Value ($) (Depreciation) ($) |
| Purchases; | | | | |
| South Korean Won, | | | |
| Expiring | | | | |
| 8/27/2010 | 29,958,020,000 | 24,996,262 25,288,206 | 291,944 |
| Sales; | | | Proceeds ($) | |
| Chilean Peso, | | | | |
| Expiring | | | | |
| 8/27/2010 | | 383,940,000 | 731,900 736,957 | (5,057) |
| Gross Unrealized | | | |
| Appreciation | | | | 291,944 |
| Gross Unrealized | | | |
| Depreciation | | | | (5,057) |
Swaps: The fund enters into swap agreements to exchange the interest rate on, or return generated by, one nominal instrument for the return generated by another nominal instrument.The fund enters into these agreements to hedge certain market or interest rate risks, to manage the interest rate sensitivity (sometimes called duration) of fixed income securities, to provide a substitute for purchasing or selling particular securities or to increase potential returns.
The fund accrues for the interim payments on swap contracts on a daily basis, with the net amount recorded within unrealized appreciation (depreciation) on swap contracts in the Statement of Assets and Liabilities. Once the interim payments are settled in cash, the net amount is recorded as realized gain (loss) on swaps, in addition to realized gain (loss) recorded upon the termination of swaps contracts in the
NOTES TO FINANCIAL STATEMENTS (continued)
Statement of Operations. Upfront payments made and/or received by the fund, are recorded as an asset and/or liability in the Statement of Assets and Liabilities and are recorded as a realized gain or loss ratably over the contract’s term/event with the exception of forward starting interest rate swaps which are recorded as realized gains or losses on the termination date. Fluctuations in the value of swap contracts are recorded for financial statement purposes as unrealized appreciation or depreciation on swap transactions.
Credit Default Swaps: Credit default swaps involve commitments to pay a fixed interest rate in exchange for payment if a credit event affecting a third party (the referenced company) occurs. Credit events may include a failure to pay interest or principal, bankruptcy, or restructuring. The fund enters into these agreements to manage its exposure to the market or certain sectors of the market, to reduce its risk exposure to defaults of corporate and sovereign issuers, or to create exposure to corporate or sovereign issuers to which it is not otherwise exposed. For those credit default swaps in which the fund is paying a fixed rate, the fund is buying credit protection on the instrument. In the event of a credit event, the fund would receive the full notional amount for the reference obligation. For those credit default swaps in which the fund is receivi ng a fixed rate, the fund is selling credit protection on the underlying instrument. The maximum pay-outs for these contracts are limited to the notional amount of each swap. Credit default swaps may involve greater risks than if the fund had invested in the reference obligation directly and are subject to general market risk, liquidity risk, counterparty risk and credit risk.
The maximum potential amount of future payments (undiscounted) that a fund as a seller of protection could be required to make under a credit default swap agreement would be an amount equal to the notional amount of the agreement which may exceed the amount of unrealized appreciation or depreciation reflected in the Statement of Assets and Liabilities. Notional amounts of all credit default swap
56
agreements are disclosed in the following chart, which summarizes open credit default swaps on corporate issues entered into by the fund.These potential amounts would be partially offset by any recovery values of the respective referenced obligations, upfront payments received upon entering into the agreement, or net amounts received from the settlement of buy protection credit default swap agreements entered into by the fund for the same referenced entity or entities. The following summarizes open credit default swaps entered into by the fund at July 31, 2010:
| | | | | | |
| | | (Pay) | | | Upfront | |
| | | Receive | Implied | | Premiums | |
| Reference | Notional | Fixed | Credit | Market | Received | Unrealized |
| Obligation | Amount ($)2 | Rate (%) | Spread (%)3 | Value ($) | (Paid) ($) (Depreciation) ($) |
| |
| Sale Contracts:1 | | | | | | |
| Northern Tobacco, | | | | | | |
| 5%, 6/1/2046 | | | | | | |
| 12/20/2011† | 11,710,000a | 1.35 | 6.50 | (765,366) | — | (765,366) |
| Southern California | | | | | | |
| Tobacco, 5%, | | | | | | |
| 6/1/2037 | | | | | | |
| 12/20/2011† | 11,710,000a | 1.35 | 6.50 | (765,365) | — | (765,365) |
| | | | | | | (1,530,731) |
|
| † Expiration Date |
| Counterparties: |
| |
| a | Citibank |
| 1 | If the fund is a seller of protection and a credit event occurs, as defined under the terms of the swap |
| | agreement, the fund will either (i) pay to the buyer of protection an amount equal to the notional |
| | amount of the swap and take delivery of the reference obligation or (ii) pay a net settlement |
| | amount in the form of cash or securities equal to the notional amount of the swap less the recovery |
| | value of the reference obligation. |
| 2 | The maximum potential amount the fund could be required to pay as a seller of credit protection |
| | or receive as a buyer of credit protection if a credit event occurs as defined under the terms of the |
| | swap agreement. |
| 3 | Implied credit spreads, represented in absolute terms, utilized in determining the market value as of |
| | the period end serve as an indicator of the current status of the payment/performance risk and |
| | represent the likelihood of risk of default for the credit derivative.The credit spread of a particular |
| | referenced entity reflects the cost of buying/selling protection and may include upfront payments |
| | required to be made to enter into the agreement.Wider credit spreads represent a deterioration of |
| | the referenced entity’s credit soundness and a greater likelihood of risk of default or other credit |
| | event occurring as defined under the terms of the agreement.A credit spread identified as |
| | “Defaulted” indicates a credit event has occurred for the referenced entity. |
NOTES TO FINANCIAL STATEMENTS (continued)
GAAP requires disclosure for (i) the nature and terms of the credit derivative, reasons for entering into the credit derivative, the events or circumstances that would require the seller to perform under the credit derivative, and the current status of the payment/performance risk of the credit derivative, (ii) the maximum potential amount of future payments (undiscounted) the seller could be required to make under the credit derivative, (iii) the fair value of the credit derivative, and (iv) the nature of any recourse provisions and assets held either as collateral or by third parties. All required disclosures have been made and are incorporated within the current period as part of the Notes to the Statement of Investments and disclosures within this Note.
At July 31, 2010, the cost of investments for federal income tax purposes was $1,450,783,240; accordingly, accumulated net unrealized appreciation on investments was $58,123,951, consisting of $72,955,405 gross unrealized appreciation and $14,831,454 gross unrealized depreciation.
58
REPORT OF INDEPENDENT REGISTERED
PUBLIC ACCOUNTING FIRM
Shareholders and Board of Directors Dreyfus Intermediate Term Income Fund
We have audited the accompanying statement of assets and liabilities, including the statements of investments, financial futures and options written, of Dreyfus Intermediate Term Income Fund (one of the series comprising Dreyfus Investment Grade Funds, Inc.) as of July 31, 2010, and the related statement of operations for the year then ended, the statement of changes in net assets for each of the two years in the period then ended, and financial highlights for each of the periods indicated therein. These financial statements and financial highlights are the responsibility of the Fund’s management. Our responsibility is to express an opinion on these financial statements and financial highlights based on our audits.
We conducted our audits in accordance with the standards of the Public Company Accounting Oversight Board (United States).Those standards require that we plan and perform the audit to obtain reasonable assurance about whether the financial statements and financial highlights are free of material misstatement.We were not engaged to perform an audit of the Fund’s internal control over financial reporting. Our audits included consideration of internal control over financial reporting as a basis for designing audit procedures that are appropriate in the circumstances, but not for the purpose of expressing an opinion on the effectiveness of the Fund’s internal control over financial reporting. Accordingly, we express no such opinion.An audit also includes examining, on a test basis, evidence supporting the amounts and disclosures in the financial statements and financial highlights, assessing the accounting principles used and significant estimates made by management, and evaluating the overall financial statement presentation. Our procedures included confirmation of securities owned as of July 31, 2010 by correspondence with the custodian and others.We believe that our audits provide a reasonable basis for our opinion.
In our opinion, the financial statements and financial highlights referred to above present fairly, in all material respects, the financial position of Dreyfus Intermediate Term Income Fund at July 31, 2010, the results of its operations for the year then ended,the changes in its net assets for each of the two years in the period then ended, and the financial highlights for each of the indicated periods, in conformity with U.S. generally accepted accounting principles.

IMPORTANT TAX INFORMATION (Unaudited)
The fund hereby designates 99.43% of ordinary income dividends paid during the fiscal year ended July 31, 2010 as qualifying “interest related dividends”.
PROXY RESULTS (Unaudited)
Dreyfus Investment Grade Funds, Inc. held a special meeting of shareholders on October 9, 2009.The proposal considered at the meeting, and the results, are as follows:
| | | |
| | | Shares | |
| | Votes For | | Authority Withheld |
| To elect additional Board Members: | | | |
| Clifford L. Alexander, Jr. | 69,338,387 | | 3,729,000 |
| Joseph S. DiMartino | 69,406,095 | | 3,661,292 |
| Nathan Leventhal | 69,385,853 | | 3,681,534 |
| Benaree Pratt Wiley | 69,333,345 | | 3,734,042 |
60
|
| INFORMATION ABOUT THE REVIEW AND APPROVAL OF |
| THE FUND’S MANAGEMENT AGREEMENT (Unaudited) |
At a meeting of the Board of Directors for the fund held on July 14 and 15, 2010, the Board considered the re-approval for an annual period (through July 29, 2011) of the Management Agreement with Dreyfus for the fund, pursuant to which Dreyfus provides the fund with investment advisory and administrative services. The Board members, none of whom are “interested persons” (as defined in the Investment Company Act of 1940, as amended) of the fund, were assisted in their review by independent legal counsel and met with counsel in executive session separate from representatives of Dreyfus.
Analysis of Nature, Extent and Quality of Services Provided to the Fund. The Board members received a presentation from representatives of Dreyfus regarding services provided to the fund and other funds in the Dreyfus fund complex, and discussed the nature, extent and quality of the services provided to the fund pursuant to its Management Agreement. Dreyfus’ representatives reviewed the fund’s distribution of accounts and the relationships Dreyfus has with various intermediaries and the different needs of each. Dreyfus’ representatives noted the distribution channels for the fund as well as the diversity of distribution among the funds in the Dreyfus fund complex, and Dreyfus’ corresponding need for broad, deep and diverse resources to be able to provide ongoing shareholder services to each distribution channel, including those of the fund. Dreyfus also provided the number of shareholder accounts in the fund, as well as the fund’s asset size.
The Board members also considered Dreyfus’ research and portfolio management capabilities and that Dreyfus also provides oversight of day-to-day fund operations, including fund accounting and administration and assistance in meeting legal and regulatory requirements. The Board members also considered Dreyfus’ extensive administrative, accounting and compliance infrastructure.The Board also considered Dreyfus’ brokerage policies and practices and the standards applied in seeking best execution.
|
| INFORMATION ABOUT THE REVIEW AND APPROVAL OF THE |
| FUND’S MANAGEMENT AGREEMENT (Unaudited) (continued) |
Comparative Analysis of the Fund’s Performance and Management Fee and Expense Ratio. The Board members reviewed the fund’s performance and comparisons to a group of retail front-end load intermediate investment-grade debt funds (the “Performance Group”) and to a larger universe of funds, consisting of all retail and institutional intermediate investment-grade debt funds (the “Performance Universe”), selected and provided by Lipper, Inc., an independent provider of investment company data.The Board was provided with a description of the methodology Lipper used to select the Performance Group and Performance Universe, as well as the Expense Group and Expense Universe (discussed below).The Board members discussed the results of the comparisons for various periods ended May 31, 2010. The Board members noted that the fund’s total r eturn performance was above or at the Performance Group and Performance Universe medians for all periods except one. The Board members noted that the fund’s yield performance was above the Performance Group medians for all periods except for the one year periods ended May 31, 2009 and May 31, 2010 and above the Performance Universe medians for all periods. Dreyfus also provided a comparison of the fund’s calendar year total returns to the returns of the fund’s benchmark index.
The Board members also discussed the fund’s management fee and expense ratio and reviewed the range of management fees and expense ratios as compared to a comparable group of funds (the “Expense Group”) and a broader group of funds (the “Expense Universe”), each selected and provided by Lipper. The Board members noted that the fund’s contractual management fee was lower than the Expense Group median, and that the actual management fee was lower than the Expense Group median and slightly higher than the Expense Universe median, and the expense ratio was slightly higher than the Expense Group median and lower than the Expense Universe median.The Board noted
62
that the fund’s actual management fee and expense ratio were lower due to an undertaking by Dreyfus to waive fees and reimburse expenses.
Representatives of Dreyfus reviewed with the Board members the advisory fees paid by mutual funds managed by Dreyfus or its affiliates with similar investment objectives, policies and strategies, and included within the fund’s Lipper category (the “Similar Funds”), and by other accounts managed by Dreyfus or its affiliates with similar investment objectives, policies and strategies as the fund (the “Similar Accounts”). Dreyfus representatives explained the nature of the Similar Accounts and the differences in providing services to such Similar Accounts as compared to managing and providing services to the fund.The Board analyzed differences in fees paid to Dreyfus and discussed the relationship of the fees paid in light of the services provided.The Board members considered the relevance of the fee information provided for the Similar Funds and Similar Accounts to evaluate the appropriateness and reasona bleness of the fund’s management fee.
Analysis of Profitability and Economies of Scale. Dreyfus’ representatives reviewed the dollar amount of expenses allocated and profit received by Dreyfus and the method used to determine such expenses and profit. The Board previously had been provided with information prepared by an independent consulting firm regarding Dreyfus’ approach to allocating costs to, and determining the profitability of, individual funds and the entire Dreyfus mutual fund complex.The Board members also had been informed that the methodology had been reviewed by an independent registered public accounting firm which, like the consultant, found the methodology to be reasonable. The consulting firm also analyzed where any economies of scale might emerge in connection with the management of the fund.The Board members evaluated the profitability analysis in light of the relevan t circumstances for the fund and the
|
| INFORMATION ABOUT THE REVIEW AND APPROVAL OF THE |
| FUND’S MANAGEMENT AGREEMENT (Unaudited) (continued) |
extent to which economies of scale would be realized if the fund grows and whether fee levels reflect these economies of scale for the benefit of fund investors.The Board members also considered potential benefits to Dreyfus from acting as investment adviser and noted that there were no soft dollar arrangements with respect to trading the fund’s investments.
It was noted that the Board members should consider Dreyfus’ profitability with respect to the fund as part of their evaluation of whether the fee under the Management Agreement bears a reasonable relationship to the mix of services provided by Dreyfus, including the nature, extent and quality of such services and that a discussion of economies of scale is predicated on increasing assets and that, if a fund’s assets had been decreasing, the possibility that Dreyfus may have realized any economies of scale would be less. It also was noted that the profitability percentage for managing the fund was within the range determined by appropriate court cases to be reasonable given the services rendered.The Board also noted the fee waiver and expense reimbursement arrangement and its effect on Dreyfus’ profitability.
At the conclusion of these discussions, the Board agreed that it had been furnished with sufficient information to make an informed business decision with respect to continuation of the Management Agreement. Based on the discussions and considerations as described above, the Board made the following conclusions and determinations.
The Board concluded that the nature, extent and quality of the services provided by Dreyfus are adequate and appropriate.
The Board generally was satisfied with the fund’s performance.
The Board concluded that the fee paid by the fund to Dreyfus was reasonable in light of the services provided, comparative performance, expense and management fee information, costs of the services provided and profits to be realized and benefits derived or to be derived by Dreyfus from its relationship with the fund.
64
The Board determined that the economies of scale which may accrue to Dreyfus and its affiliates in connection with the management of the fund had been adequately considered by Dreyfus in connection with the management fee rate charged to the fund and that, to the extent in the future it were determined that material economies of scale had not been shared with the fund, the Board would seek to have those economies of scale shared with the fund.
The Board members considered these conclusions and determinations, along with information received on a routine and regular basis throughout the year, and, without any one factor being dispositive, the Board determined that re-approval of the Management Agreement was in the best interests of the fund and its shareholders.
BOARD MEMBERS INFORMATION (Unaudited)
|
| Whitney I. Gerard (75) |
| Board Member (1993) |
| Principal Occupation During Past 5Years: |
| • Partner of Chadbourne & Parke LLP |
| No. of Portfolios for which Board Member Serves: 26 |
66

Once elected all Board Members serve for an indefinite term, but achieve Emeritus status upon reaching age 80.The address of the Board Members and Officers is in c/o The Dreyfus Corporation, 200 Park Avenue, NewYork, NewYork 10166.Additional information about the Board Members is available in the fund’s Statement of Additional Information which can be obtained from Dreyfus free of charge by calling this toll free number: 1-800-554-4611.
Lucy Wilson Benson, Emeritus Board Member
Arthur A. Hartman, Emeritus Board Member
OFFICERS OF THE FUND (Unaudited)

68
OFFICERS OF THE FUND (Unaudited) (continued)

70
For More Information
|
| Dreyfus |
| Short Term Income Fund |
ANNUAL REPORT July 31, 2010

Save time. Save paper. View your next shareholder report online as soon as it’s available. Log into www.dreyfus.com and sign up for Dreyfus eCommunications. It’s simple and only takes a few minutes.
The views expressed in this report reflect those of the portfolio manager only through the end of the period covered and do not necessarily represent the views of Dreyfus or any other person in the Dreyfus organization. Any such views are subject to change at any time based upon market or other conditions and Dreyfus disclaims any responsibility to update such views.These views may not be relied on as investment advice and, because investment decisions for a Dreyfus fund are based on numerous factors, may not be relied on as an indication of trading intent on behalf of any Dreyfus fund.
Not FDIC-Insured • Not Bank-Guaranteed • May Lose Value
| | Contents |
| | THE FUND |
| 2 | A Letter from the Chairman and CEO |
| 3 | Discussion of Fund Performance |
| 6 | Fund Performance |
| 8 | Understanding Your Fund’s Expenses |
| 8 | Comparing Your Fund’s Expenses With Those of Other Funds |
| 9 | Statement of Investments |
| 22 | Statement of Financial Futures |
| 23 | Statement of Assets and Liabilities |
| 24 | Statement of Operations |
| 25 | Statement of Changes in Net Assets |
| 27 | Financial Highlights |
| 30 | Notes to Financial Statements |
| 42 | Report of Independent Registered Public Accounting Firm |
| 43 | Important Tax Information |
| 43 | Proxy Results |
| 44 | Information About the Review and Approval of the Fund’s Management Agreement |
| 48 | Board Members Information |
| 50 | Officers of the Fund |
| | FOR MORE INFORMATION |
| | Back Cover |
|
| Dreyfus |
| Short Term Income Fund |
The Fund

A LETTER FROM THE CHAIRMAN AND CEO
Dear Shareholder:
We are pleased to present this annual report for Dreyfus Short Term Income Fund, covering the 12-month period from August 1, 2009, through July 31, 2010.
For the reporting period as a whole, both bond and equity markets continued to stage a sustained but mild recovery, with higher-yielding bond market sectors generally producing more robust returns than broader fixed-income market averages. However, during the second quarter of 2010 in particular,renewed market volatility caused significant headwinds for equity markets and, to a lesser extent, higher-yielding sectors of the bond markets.Traditional safe havens like U.S.Treasury securities gained value as investors grew more risk averse when developments in overseas markets—including a sovereign debt crisis in Europe and inflation concerns in China—threatened to dampen global economic growth.
Despite these seemingly uncertain markets, many economists, including our own Chief Economist, do not anticipate a “double-dip” recession. Instead, we expect current financial strains to ease and the domestic economy to expand, albeit at a more moderate rate than previously anticipated, over the second half of the year. We still remain cautious about the current market and economic environment and believe that for most investors a long-term investment approach focusing on high quality and diversification between stocks and bonds, relative to individual needs, is appropriate. Given today’s ever-changing markets, we recommend meeting with your financial advisor, since they are best suited to help you assess both the risks and potential opportunities provided by the fixed-income and stock markets in this investment climate.
For information about how the fund performed during the reporting period, as well as general market perspectives, we provide a Discussion of Fund Performance on the pages that follow.
Thank you for your continued confidence and support.
Jonathan R. Baum
Chairman and Chief Executive Officer
The Dreyfus Corporation
August 16, 2010
2

DISCUSSION OF FUND PERFORMANCE
For the period of August 1, 2009, through July 31, 2010, as provided by David Bowser, CFA, and Peter Vaream, Portfolio Managers
Fund and Market Performance Overview
For the 12-month period ended July 31, 2010, Dreyfus Short Term Income Fund’s Class B shares produced a total return of 7.22%, Class D shares produced a total return of 8.12% and Class P shares produced a total return of 8.10%.1 In comparison, the fund’s benchmark, the BofA Merrill Lynch 1-5 Year Corporate/Government Index (the “Index”), achieved a total return of 5.74% for the same period.2
Higher-yielding sectors of the bond market rallied over most of the reporting period despite suffering heightened volatility during the spring of 2010, when investors began to question the sustainability of the global economic recovery.The fund produced higher returns than its benchmark for the reporting period overall, primarily due to strong results from its positions in commercial mortgage-backed securities and investment-grade corporate bonds.
The Fund’s Investment Approach
The fund seeks to maximize total returns consisting of capital appreciation and current income. To pursue this goal, the fund invests at least 80% of its assets in fixed-income securities of U.S.or foreign issuers rated investment grade or the unrated equivalent as determined by Dreyfus. This may include U.S. government bonds and notes, corporate bonds, municipal bonds, convertible securities, preferred stocks, inflation-indexed securities, asset-backed securities, mortgage-related securities (including CMOs) and foreign bonds. For additional yield, the fund may invest up to 20% of its assets in fixed-income securities rated below investment grade (“high yield” or “junk” bonds). Typically, the fund’s portfolio can be expected to have an average effective maturity and an average effective duration of three years or less.
Economic Recovery Lifted U.S. Bond Market
The reporting period began in the midst of an economic recovery as manufacturing activity increased, housing prices appeared to bottom and the labor market showed early evidence of modest improvement.
DISCUSSION OF FUND PERFORMANCE (continued)
The domestic economic rebound was sparked, in part, by historically low short-term interest rates from the Federal Reserve Board and a massive stimulus program adopted by the U.S. government. Improving economic conditions helped boost prices of higher yielding fixed-income securities, including investment-grade corporate bonds and commercial mortgage-backed securities. In contrast, U.S. government securities lagged market averages as investors favored riskier investments.
However, investor sentiment deteriorated during the spring of 2010, when a number of developments brought the strength and sustainability of the global economic recovery into question. In Europe, Greece found itself unable to finance a heavy debt load, requiring intervention from the International Monetary Fund and other members of the European Union. Meanwhile, surging property values in China kindled local inflation fears, and investors grew concerned that potential remedial measures might constrain a major engine of global growth.The United States also encountered greater economic uncertainty when retail sales, employment and housing data sent mixed signals to investors.
As a result of these developments, higher-yielding market sectors lost value, giving back a portion of the reporting period’s previous gains before exhibiting renewed strength in July. Conversely, traditionally defensive U.S. government securities generally rallied in the spring. High-quality commercial mortgage-backed securities proved to be an exception to this trend, as improved conditions in U.S. commercial real estate markets provided consistent price support.
Fund Participated Fully in Market Rally
Although the fund was affected by weakness in higher-yielding market sectors in the spring, several strategies helped it outperform its benchmark in the market rally over most of the reporting period. Chief among them was overweighted exposure to high-quality commercial mortgage-backed securities, which climbed from depressed levels as investor confidence strengthened.To a lesser degree, favorable timing of trades among residential mortgage-backed securities also produced above-average results.
We utilizedTreasury futures to facilitate interest rate duration and yield curve strategies. Duration and yield curve positions were both positive contributors to performance.The fund’s options positions were small and not a significant factor in performance for the year.
4
Our interest-rate strategies also proved successful, mainly due to a relatively long average duration and a “bulleted” focus on bonds in the three- to five-year maturity range, where yield differences remained relatively steep.
Maintaining a Disciplined Approach to Security Selection
As of the reporting period’s end, we believe that the U.S. economy is unlikely to fall into another recession, but the continued expansion probably will remain slower and choppier than most previous recov-eries.Therefore, we believe that the Fed is unlikely to raise short-term interest rates anytime soon.
Although we anticipate that investors’ appetite for income is likely to continue to support higher-yielding market sectors, economic head-winds have prompted us to establish more moderately overweighted positions in higher-yielding market sectors, especially corporate bonds.We have correspondingly increased the fund’s holdings of U.S. government securities, including Treasuries and mortgage-backed securities backed by U.S. government agencies. In our judgment, these are prudent strategies in today’s uncertain economic climate.
August 16, 2010
Bond funds are subject generally to interest rate, credit, liquidity and market risks, to varying degrees, all of which are more fully described in the fund’s prospectus. Generally, all other factors being equal, bond prices are inversely related to interest-rate changes, and rate increases can cause price declines.
High yield bonds are subject to increased credit risk and are considered speculative in terms of the issuer’s perceived ability to continue making interest payments on a timely basis and to repay principal upon maturity.
The fund may use derivative instruments, such as options, futures and options on futures, forward contracts, swaps (including credit default swaps on corporate bonds and asset-backed securities), options on swaps and other credit derivatives.A small investment in derivatives could have a potentially large impact on the fund’s performance.The use of derivatives involves risks different from, or possibly greater than, the risks associated with investing directly in the underlying assets.
| |
| 1 | Total return includes reinvestment of dividends and any capital gains paid, and does not take into |
| | consideration the applicable contingent deferred sales charges imposed on redemptions in the case of |
| | Class B shares. Had these charges been reflected, returns would have been lower. Past performance |
| | is no guarantee of future results. Share price, yield and investment return fluctuate such that upon |
| | redemption, fund shares may be worth more or less than their original cost. |
| 2 | SOURCE: LIPPER INC. — Reflects reinvestment of dividends and, where applicable, capital |
| | gain distributions.The BofAMerrill Lynch 1-5Year Corporate/Government Index is a market |
| | value-weighted index that tracks the performance of publicly placed, non-convertible, fixed-rate, |
| | coupon-bearing, investment-grade U.S. domestic debt. Maturities of the securities range from one to |
| | five years. Investors cannot invest directly in any index. |
FUND PERFORMANCE
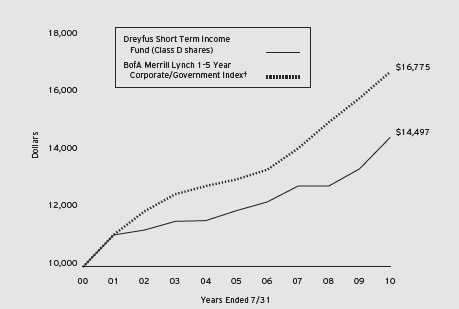
|
| Comparison of change in value of $10,000 investment in Dreyfus Short Term Income Fund Class |
| D shares and the BofA Merrill Lynch 1-5 Year Corporate/Government Index |
| † Source: Lipper Inc. |
| Past performance is not predictive of future performance. |
| The above graph compares a $10,000 investment made in Class D shares of Dreyfus Short Term Income Fund on |
| 7/31/00 to a $10,000 investment made in the BofA Merrill Lynch 1-5Year Corporate/Government Index (the |
| “Index”) on that date.All dividends and capital gain distributions are reinvested. |
| The fund invests primarily in debt securities and securities with debt-like characteristics of domestic and foreign issuers |
| and maintains an average effective maturity and an average effective duration of three years or less. Performance for Class |
| B and Class P shares will vary from the performance of Class D shares shown above due to differences in charges and |
| expenses.The Index is an unmanaged performance benchmark including U.S. government and fixed-coupon domestic |
| investment-grade corporate bonds with maturities greater than or equal to one year and less than five years. Unlike a |
| mutual fund, the Index is not subject to charges, fees and other expenses. Investors cannot invest directly in any index. |
| Further information relating to fund performance, including expense reimbursements, if applicable, is contained in the |
| Financial Highlights section of the prospectus and elsewhere in this report. |
6
| | | | |
| Average Annual Total Returns as of 7/31/10 | | | |
| Inception |
| | Date | 1 Year | 5 Years | 10 Years |
| Class B shares | | | | |
| with applicable redemption charge † | 11/1/02 | 3.22% | 2.83% | 3.56%††,††† |
| without redemption | 11/1/02 | 7.22% | 3.18% | 3.56%††,††† |
| Class D shares | 8/18/92 | 8.12% | 3.92% | 3.78% |
| Class P shares | 11/1/02 | 8.10% | 3.91% | 3.81%††† |
| BofA Merrill Lynch 1-5 Year | | | | |
| Corporate/Government Index | | 5.74% | 5.17% | 5.31% |
Past performance is not predictive of future performance.The fund’s performance shown in the graph and table does not reflect the deduction of taxes that a shareholder would pay on fund distributions or the redemption of fund shares.
| |
| † | The maximum contingent deferred sales charge for Class B shares is 4%.After six years Class B shares convert to |
| | Class D shares. |
| †† | Assumes the conversion of Class B shares to Class D shares at the end of the sixth year following the date of purchase. |
| ††† | The total return performance figures presented for Class B and Class P shares of the fund represent the performance |
| | of the fund’s Class D shares for periods prior to 11/1/02 (the inception date for Class B and Class P shares), |
| | adjusted to reflect the applicable sales load for each share class. |
UNDERSTANDING YOUR FUND’S EXPENSES (Unaudited)
As a mutual fund investor, you pay ongoing expenses, such as management fees and other expenses. Using the information below, you can estimate how these expenses affect your investment and compare them with the expenses of other funds.You also may pay one-time transaction expenses, including sales charges (loads) and redemption fees, which are not shown in this section and would have resulted in higher total expenses. For more information, see your fund’s prospectus or talk to your financial adviser.
Review your fund’s expenses
The table below shows the expenses you would have paid on a $1,000 investment in Dreyfus Short Term Income Fund from February 1, 2010 to July 31, 2010. It also shows how much a $1,000 investment would be worth at the close of the period, assuming actual returns and expenses.
|
| Expenses and Value of a $1,000 Investment |
| assuming actual returns for the six months ended July 31, 2010 |
| | | |
| | Class B | Class D | Class P |
| Expenses paid per $1,000† | $ 8.87 | $ 4.57 | $ 4.77 |
| Ending value (after expenses) | $1,020.80 | $1,026.00 | $1,024.80 |
|
| COMPARING YOUR FUND’S EXPENSES |
| WITH THOSE OF OTHER FUNDS (Unaudited) |
Using the SEC’s method to compare expenses
The Securities and Exchange Commission (SEC) has established guidelines to help investors assess fund expenses. Per these guidelines, the table below shows your fund’s expenses based on a $1,000 investment, assuming a hypothetical 5% annualized return. You can use this information to compare the ongoing expenses (but not transaction expenses or total cost) of investing in the fund with those of other funds.All mutual fund shareholder reports will provide this information to help you make this comparison. Please note that you cannot use this information to estimate your actual ending account balance and expenses paid during the period.
|
| Expenses and Value of a $1,000 Investment |
| assuming a hypothetical 5% annualized return for the six months ended July 31, 2010 |
| | | |
| | Class B | Class D | Class P |
| Expenses paid per $1,000† | $ 8.85 | $ 4.56 | $ 4.76 |
| Ending value (after expenses) | $1,016.02 | $1,020.28 | $1,020.08 |
|
| † Expenses are equal to the fund’s annualized expense ratio of 1.77% for Class B, .91% for Class D, and .95% |
| for Class P, multiplied by the average account value over the period, multiplied by 181/365 (to reflect the one-half |
| year period). |
8
| | | | | |
| STATEMENT OF INVESTMENTS | | | | |
| July 31, 2010 | | | | | |
| |
| |
| |
| | Coupon | Maturity | Principal | | |
| Bonds and Notes—96.5% | Rate (%) | Date | Amount ($) | | Value ($) |
| Advertising—.3% | | | | | |
| Lamar Media, | | | | | |
| Gtd. Notes | 6.63 | 8/15/15 | 789,000 | | 789,000 |
| Agriculture—1.1% | | | | | |
| Altria Group, | | | | | |
| Gtd. Notes | 8.50 | 11/10/13 | 1,585,000 | | 1,883,261 |
| Philip Morris International, | | | | | |
| Sr. Unscd. Notes | 4.88 | 5/16/13 | 775,000 | | 844,583 |
| | | | | | 2,727,844 |
| Asset-Backed Ctfs./ | | | | | |
| Auto Receivables—4.4% | | | | | |
| Ally Auto Receivables Trust, | | | | | |
| Ser. 2010-2, Cl. A3 | 1.38 | 7/15/14 | 1,500,000 | | 1,512,105 |
| Ally Auto Receivables Trust, | | | | | |
| Ser. 2010-1, Cl. B | 3.29 | 3/15/15 | 775,000 | a | 788,098 |
| Americredit Automobile Receivables | | | | | |
| Trust, Ser. 2010-1, Cl. A3 | 1.66 | 3/17/14 | 370,000 | | 372,498 |
| Americredit Automobile Receivables | | | | | |
| Trust, Ser. 2010-1, Cl. B | 3.72 | 11/17/14 | 1,230,000 | | 1,256,917 |
| Americredit Automobile Receivables | | | | | |
| Trust, Ser. 2007-CM, Cl. A3A | 5.42 | 5/7/12 | 137,669 | | 138,216 |
| Americredit Prime Automobile | | | | | |
| Receivables, Ser. 2007-1, Cl. E | 6.96 | 3/8/16 | 389,146 | a | 371,940 |
| Carmax Auto Owner Trust, | | | | | |
| Ser. 2010-1, Cl. B | 3.75 | 12/15/15 | 185,000 | | 190,915 |
| Carmax Auto Owner Trust, | | | | | |
| Ser. 2010-2, Cl. B | 3.96 | 6/15/16 | 490,000 | | 497,032 |
| Carmax Auto Owner Trust, | | | | | |
| Ser. 2006-2, Cl. B | 5.31 | 4/16/12 | 565,000 | | 569,719 |
| Chrysler Financial Auto | | | | | |
| Securitization Trust, | | | | | |
| Ser. 2009-B, Cl. B | 2.94 | 6/8/13 | 530,000 | | 531,602 |
| Chrysler Financial Lease Trust, | | | | | |
| Ser. 2010-A, Cl. A2 | 1.78 | 6/15/11 | 1,265,000 | a | 1,269,845 |
| Ford Credit Auto Owner Trust, | | | | | |
| Ser. 2007-A, Cl. D | 7.05 | 12/15/13 | 1,000,000 | a | 1,061,555 |
| Franklin Auto Trust, | | | | | |
| Ser. 2008-A, Cl. B | 6.10 | 5/20/16 | 585,000 | a | 601,713 |
| Hyundai Auto Receivables Trust, | | | | | |
| Ser. 2006-B, Cl. C | 5.25 | 5/15/13 | 519,198 | | 523,757 |
STATEMENT OF INVESTMENTS (continued)
| | | | | |
| | Coupon | Maturity | Principal | | |
| Bonds and Notes (continued) | Rate (%) | Date | Amount ($) | | Value ($) |
| Asset-Backed Ctfs./ | | | | | |
| Auto Receivables (continued) | | | | | |
| JPMorgan Auto Receivables Trust, | | | | | |
| Ser. 2008-A, Cl. CFTS | 5.22 | 7/15/15 | 306,526 | a | 293,814 |
| JPMorgan Auto Receivables Trust, | | | | | |
| Ser. 2008-A, Cl. D | 5.22 | 7/15/15 | 382,271 | a | 383,982 |
| Wachovia Auto Loan Owner Trust, | | | | | |
| Ser. 2006-1, Cl. C | 5.22 | 11/20/12 | 740,000 | a | 748,356 |
| Wachovia Auto Loan Owner Trust, | | | | | |
| Ser. 2007-1, Cl. C | 5.45 | 10/22/12 | 300,000 | | 307,330 |
| | | | | | 11,419,394 |
| Asset-Backed Ctfs./ | | | | | |
| Home Equity Loans—1.4% | | | | | |
| Ameriquest Mortgage Securities, | | | | | |
| Ser. 2003-11, Cl. AF6 | 5.14 | 1/25/34 | 918,792 | b | 928,037 |
| Bayview Financial Acquisition | | | | | |
| Trust, Ser. 2005-B, Cl. 1A6 | 5.21 | 4/28/39 | 1,602,933 | b | 1,519,412 |
| Carrington Mortgage Loan Trust, | | | | | |
| Ser. 2005-NC5, Cl. A2 | 0.65 | 10/25/35 | 432,953 | b | 409,523 |
| Citicorp Residential Mortgage | | | | | |
| Securities, Ser. 2006-1, Cl. A3 | 5.71 | 7/25/36 | 444,265 | b | 446,073 |
| Conseco Financial, | | | | | |
| Ser. 1994-7, Cl. M1 | 9.25 | 3/15/20 | 40,345 | | 40,500 |
| Home Equity Asset Trust, | | | | | |
| Ser. 2005-2, Cl. M1 | 0.78 | 7/25/35 | 141,953 | b | 140,569 |
| Morgan Stanley ABS Capital I, | | | | | |
| Ser. 2004-NC1, Cl. M2 | 2.65 | 12/27/33 | 240,994 | b | 199,824 |
| | | | | | 3,683,938 |
| Banks—4.8% | | | | | |
| Bank of America, | | | | | |
| Sr. Unscd. Notes | 4.50 | 4/1/15 | 1,390,000 | | 1,437,740 |
| Bank of America, | | | | | |
| Sr. Unscd. Notes | 7.38 | 5/15/14 | 1,880,000 | | 2,157,494 |
| Capital One Financial, | | | | | |
| Sr. Unscd. Notes | 7.38 | 5/23/14 | 750,000 | | 872,494 |
| Citigroup, | | | | | |
| Sr. Unscd. Notes | 5.50 | 4/11/13 | 2,250,000 | | 2,392,065 |
| JPMorgan Chase & Co., | | | | | |
| Sr. Unscd. Notes | 3.40 | 6/24/15 | 1,010,000 | | 1,038,234 |
| JPMorgan Chase & Co., | | | | | |
| Sr. Unscd. Notes | 5.38 | 1/15/14 | 1,085,000 | | 1,186,525 |
10
| | | | | |
| | Coupon | Maturity | Principal | | |
| Bonds and Notes (continued) | Rate (%) | Date | Amount ($) | | Value ($) |
| Banks (continued) | | | | | |
| Morgan Stanley, | | | | | |
| Sr. Unscd. Notes | 4.10 | 1/26/15 | 1,540,000 | | 1,566,534 |
| Morgan Stanley, | | | | | |
| Sr. Unscd. Notes | 6.00 | 4/28/15 | 300,000 | | 323,517 |
| Wells Fargo Capital XIII, | | | | | |
| Gtd. Secs. | 7.70 | 12/29/49 | 1,470,000 | b | 1,514,100 |
| | | | | | 12,488,703 |
| Casinos—.1% | | | | | |
| Ameristar Casinos, | | | | | |
| Gtd. Notes | 9.25 | 6/1/14 | 339,000 | | 363,577 |
| Chemicals—.3% | | | | | |
| Dow Chemical, | | | | | |
| Sr. Unscd. Notes | 8.55 | 5/15/19 | 450,000 | | 562,904 |
| Sherwin-Williams, | | | | | |
| Sr. Unscd. Notes | 3.13 | 12/15/14 | 295,000 | | 309,854 |
| | | | | | 872,758 |
| Commercial & Professional | | | | | |
| Services—1.0% | | | | | |
| Aramark, | | | | | |
| Gtd. Notes | 8.50 | 2/1/15 | 456,000 | c | 473,670 |
| ERAC USA Finance, | | | | | |
| Gtd. Notes | 5.60 | 5/1/15 | 720,000 | a | 797,416 |
| ERAC USA Finance, | | | | | |
| Gtd. Notes | 5.90 | 11/15/15 | 1,100,000 | a | 1,236,591 |
| | | | | | 2,507,677 |
| Commercial Mortgage | | | | | |
| Pass-Through Ctfs.—5.5% | | | | | |
| Banc of America Commercial | | | | | |
| Mortgage, Ser. 2005-6, Cl. A1 | 5.00 | 9/10/47 | 354,744 | | 355,382 |
| Banc of America Commercial | | | | | |
| Mortgage, Ser. 2005-6, Cl. A2 | 5.17 | 9/10/47 | 675,000 | b | 679,842 |
| Bear Stearns Commercial Mortgage | | | | | |
| Securities, Ser. 2006-PW12, | | | | | |
| Cl. AAB | 5.70 | 9/11/38 | 375,000 | b | 411,708 |
| Bear Stearns Commercial Mortgage | | | | | |
| Securities, Ser. 2007-PW17, | | | | | |
| Cl. AAB | 5.70 | 6/11/50 | 1,150,000 | | 1,242,621 |
| Credit Suisse Mortgage Capital | | | | | |
| Certificates, Ser. 2006-C1, Cl. A2 | 5.51 | 2/15/39 | 1,178,491 | b | 1,227,169 |
The Fund 11
STATEMENT OF INVESTMENTS (continued)
| | | | | |
| | Coupon | Maturity | Principal | | |
| Bonds and Notes (continued) | Rate (%) | Date | Amount ($) | | Value ($) |
| Commercial Mortgage | | | | | |
| Pass-Through Ctfs. (continued) | | | | | |
| Crown Castle Towers, | | | | | |
| Ser. 2006-1A, Cl. AFX | 5.24 | 11/15/36 | 1,300,000 | a | 1,345,571 |
| Crown Castle Towers, | | | | | |
| Ser. 2006-1A, Cl. B | 5.36 | 11/15/36 | 460,000 | a | 475,543 |
| Crown Castle Towers, | | | | | |
| Ser. 2006-1A, Cl. C | 5.47 | 11/15/36 | 1,035,000 | a | 1,069,943 |
| Crown Castle Towers, | | | | | |
| Ser. 2006-1A, Cl. F | 6.65 | 11/15/36 | 565,000 | a | 584,247 |
| Crown Castle Towers, | | | | | |
| Ser. 2006-1A, Cl. G | 6.80 | 11/15/36 | 330,000 | a | 341,228 |
| CS First Boston Mortgage | | | | | |
| Securities, Ser. 2005-C4, Cl. A2 | 5.02 | 8/15/38 | 248,290 | | 248,468 |
| First Union National Bank | | | | | |
| Commercial Mortgage, | | | | | |
| Ser. 2001-C2, Cl. A2 | 6.66 | 1/12/43 | 322,496 | | 328,595 |
| GS Mortgage Securities Corporation | | | | | |
| II, Ser. 2007-EOP, Cl. B | 0.60 | 3/6/20 | 1,630,000 | a,b | 1,493,806 |
| GS Mortgage Securities Corporation | | | | | |
| II, Ser. 2007-EOP, Cl. F | 0.83 | 3/6/20 | 730,000 | a,b | 639,300 |
| GS Mortgage Securities Corporation | | | | | |
| II, Ser. 2007-EOP, Cl. K | 1.40 | 3/6/20 | 350,000 | a,b | 298,426 |
| JP Morgan Chase Commercial | | | | | |
| Mortgage Securities, | | | | | |
| Ser. 2003-CB7, Cl. A3 | 4.45 | 1/12/38 | 313,239 | | 314,414 |
| JP Morgan Chase Commercial | | | | | |
| Mortgage Securities, | | | | | |
| Ser. 2001-CIBC, Cl. D | 6.75 | 3/15/33 | 955,000 | | 962,607 |
| JP Morgan Mortgage Acquisition, | | | | | |
| Ser. 2006-CH2, Cl. AV2 | 0.38 | 10/25/36 | 204,514 | b | 195,440 |
| JPMorgan Chase Commercial Mortgage | | | | | |
| Securities, Ser. 2006-CB14, Cl. ASB | 5.51 | 12/12/44 | 374,999 | b | 401,565 |
| Merrill Lynch Mortgage Trust, | | | | | |
| Ser. 2005-CKI1, Cl. A2 | 5.21 | 11/12/37 | 350,000 | b | 352,476 |
| Morgan Stanley Dean Witter Capital | | | | | |
| I, Ser. 2001-TOP3, Cl. A4 | 6.39 | 7/15/33 | 1,298,098 | | 1,340,090 |
| | | | | | 14,308,441 |
12
| | | | | |
| | Coupon | Maturity | Principal | | |
| Bonds and Notes (continued) | Rate (%) | Date | Amount ($) | | Value ($) |
| Computers—.3% | | | | | |
| Hewlett-Packard, | | | | | |
| Sr. Unscd. Notes | 2.25 | 5/27/11 | 405,000 | | 410,820 |
| Hewlett-Parkard, | | | | | |
| Sr. Unscd. Notes | 2.95 | 8/15/12 | 410,000 | | 426,624 |
| | | | | | 837,444 |
| Diversified Financial Services—5.1% | | | | | |
| American Express Credit, | | | | | |
| Sr. Unscd. Notes | 5.13 | 8/25/14 | 130,000 | | 141,696 |
| American Express Credit, | | | | | |
| Sr. Unscd. Notes, Ser. C | 7.30 | 8/20/13 | 155,000 | | 177,789 |
| American Express, | | | | | |
| Sr. Unscd. Notes | 7.25 | 5/20/14 | 840,000 | | 975,889 |
| Ameriprise Financial, | | | | | |
| Jr. Sub. Notes | 7.52 | 6/1/66 | 212,000 | b | 208,290 |
| Capital One Bank USA, | | | | | |
| Sub. Notes | 8.80 | 7/15/19 | 765,000 | | 975,374 |
| Caterpillar Financial Services, | | | | | |
| Sr. Unscd. Notes | 5.13 | 10/12/11 | 765,000 | | 802,734 |
| Caterpillar Financial Services, | | | | | |
| Sr. Unscd. Notes | 6.13 | 2/17/14 | 725,000 | | 829,142 |
| Countrywide Home Loans, | | | | | |
| Gtd. Notes, Ser. L | 4.00 | 3/22/11 | 280,000 | | 285,552 |
| Credit Suisse New York, | | | | | |
| Sr. Unscd. Notes | 3.50 | 3/23/15 | 925,000 | | 952,632 |
| Discover Financial Services, | | | | | |
| Sr. Unscd. Notes | 10.25 | 7/15/19 | 475,000 | | 592,074 |
| Ford Motor Credit, | | | | | |
| Sr. Unscd. Notes | 6.63 | 8/15/17 | 600,000 | | 596,353 |
| Ford Motor Credit, | | | | | |
| Sr. Unscd. Notes | 8.00 | 12/15/16 | 1,670,000 | c | 1,784,787 |
| Fresenius US Finance II, | | | | | |
| Gtd. Notes | 9.00 | 7/15/15 | 985,000 | a | 1,108,125 |
| General Electric Capital, | | | | | |
| Sr. Unscd. Notes | 4.80 | 5/1/13 | 240,000 | | 258,082 |
| General Electric Capital, | | | | | |
| Sr. Unscd. Notes, Ser. A | 5.45 | 1/15/13 | 900,000 | c | 973,224 |
STATEMENT OF INVESTMENTS (continued)
| | | | | |
| | Coupon | Maturity | Principal | | |
| Bonds and Notes (continued) | Rate (%) | Date | Amount ($) | | Value ($) |
| Diversified Financial | | | | | |
| Services (continued) | | | | | |
| Harley-Davidson Funding, | | | | | |
| Gtd. Notes | 5.75 | 12/15/14 | 1,080,000 | a | 1,127,579 |
| Hutchison Whampoa International, | | | | | |
| Gtd. Notes | 4.63 | 9/11/15 | 570,000 | a | 607,751 |
| Invesco, | | | | | |
| Gtd. Notes | 5.38 | 2/27/13 | 380,000 | | 397,752 |
| Jefferies Group, | | | | | |
| Sr. Unscd. Notes | 7.75 | 3/15/12 | 368,000 | | 397,488 |
| | | | | | 13,192,313 |
| Electric Utilities—3.4% | | | | | |
| AES, | | | | | |
| Sr. Unscd. Notes | 7.75 | 10/15/15 | 470,000 | | 495,850 |
| Appalachian Power, | | | | | |
| Sr. Unscd. Notes, Ser. O | 5.65 | 8/15/12 | 315,000 | | 338,555 |
| Columbus Southern Power, | | | | | |
| Sr. Unscd. Notes | 6.05 | 5/1/18 | 150,000 | | 173,728 |
| Duke Energy Ohio, | | | | | |
| First Mortgage Bonds | 2.10 | 6/15/13 | 925,000 | | 944,419 |
| Enel Finance International, | | | | | |
| Gtd. Notes | 5.70 | 1/15/13 | 620,000 | a | 668,337 |
| FPL Group Capital, | | | | | |
| Gtd. Debs. | 5.63 | 9/1/11 | 1,100,000 | | 1,152,078 |
| National Grid, | | | | | |
| Sr. Unscd. Notes | 6.30 | 8/1/16 | 724,000 | | 833,899 |
| Nevada Power, | | | | | |
| Mortgage Notes | 6.50 | 4/15/12 | 1,000,000 | | 1,082,941 |
| NiSource Finance, | | | | | |
| Gtd. Notes | 6.15 | 3/1/13 | 545,000 | | 596,086 |
| PacifiCorp, | | | | | |
| First Mortgage Bonds | 6.90 | 11/15/11 | 2,265,000 | | 2,430,662 |
| | | | | | 8,716,555 |
| Environmental Control—.5% | | | | | |
| Allied Waste North America, | | | | | |
| Gtd. Notes, Ser. B | 7.13 | 5/15/16 | 210,000 | | 227,070 |
| Republic Services, | | | | | |
| Gtd. Notes | 5.50 | 9/15/19 | 245,000 | a | 269,056 |
| Waste Management, | | | | | |
| Gtd. Notes | 6.38 | 3/11/15 | 725,000 | | 842,127 |
| | | | | | 1,338,253 |
14
| | | | | |
| | Coupon | Maturity | Principal | | |
| Bonds and Notes (continued) | Rate (%) | Date | Amount ($) | | Value ($) |
| Food & Beverages—1.1% | | | | | |
| Anheuser-Busch InBev Worldwide, | | | | | |
| Gtd. Notes | 7.20 | 1/15/14 | 790,000 | a | 915,345 |
| Diageo Capital, | | | | | |
| Gtd. Bonds | 4.83 | 7/15/20 | 975,000 | | 1,061,157 |
| Kraft Foods, | | | | | |
| Sr. Unscd. Notes | 6.13 | 2/1/18 | 530,000 | | 613,028 |
| Stater Brothers Holdings, | | | | | |
| Gtd. Notes | 7.75 | 4/15/15 | 116,000 | | 118,320 |
| Stater Brothers Holdings, | | | | | |
| Gtd. Notes | 8.13 | 6/15/12 | 131,000 | | 131,982 |
| | | | | | 2,839,832 |
| Foreign/Governmental—.6% | | | | | |
| Province of Ontario Canada, | | | | | |
| Sr. Unscd. Bonds | 4.38 | 2/15/13 | 760,000 | | 823,139 |
| Province of Quebec Canada, | | | | | |
| Unscd. Debs., Ser. PJ | 6.13 | 1/22/11 | 685,000 | | 703,487 |
| | | | | | 1,526,626 |
| Health Care—1.5% | | | | | |
| Community Health Systems, | | | | | |
| Gtd. Notes | 8.88 | 7/15/15 | 460,000 | | 483,000 |
| Lincoln National, | | | | | |
| Sr. Unscd. Notes | 8.75 | 7/1/19 | 1,110,000 | | 1,398,670 |
| Medco Health Solutions, | | | | | |
| Sr. Unscd. Notes | 7.25 | 8/15/13 | 725,000 | | 839,267 |
| Wyeth, | | | | | |
| Gtd. Notes | 6.95 | 3/15/11 | 1,150,000 | b | 1,194,053 |
| | | | | | 3,914,990 |
| Manufacturing—.0% | | | | | |
| Bombardier, | | | | | |
| Sr. Unscd. Notes | 8.00 | 11/15/14 | 75,000 | a | 78,938 |
| Media—2.7% | | | | | |
| Comcast, | | | | | |
| Gtd. Notes | 5.50 | 3/15/11 | 780,000 | | 801,326 |
| Cox Communications, | | | | | |
| Sr. Unscd. Notes | 6.25 | 6/1/18 | 650,000 | a | 742,952 |
| CSC Holdings, | | | | | |
| Sr. Unscd. Notes | 8.50 | 4/15/14 | 100,000 | | 108,500 |
| Dish DBS, | | | | | |
| Gtd. Notes | 7.75 | 5/31/15 | 265,000 | | 278,250 |
STATEMENT OF INVESTMENTS (continued)
| | | | | |
| | Coupon | Maturity | Principal | | |
| Bonds and Notes (continued) | Rate (%) | Date | Amount ($) | | Value ($) |
| Media (continued) | | | | | |
| Intelsat Subsidiary Holding, | | | | | |
| Gtd. Notes | 8.88 | 1/15/15 | 575,000 | a | 596,562 |
| NBC Universal, | | | | | |
| Sr. Unscd. Notes | 3.65 | 4/30/15 | 700,000 | a | 731,120 |
| News America, | | | | | |
| Gtd. Notes | 5.30 | 12/15/14 | 735,000 | | 825,085 |
| Reed Elsevier Capital, | | | | | |
| Gtd. Notes | 4.63 | 6/15/12 | 310,000 | | 325,635 |
| Reed Elsevier Capital, | | | | | |
| Gtd. Notes | 7.75 | 1/15/14 | 900,000 | | 1,047,720 |
| Time Warner Cable, | | | | | |
| Gtd. Notes | 6.20 | 7/1/13 | 815,000 | | 919,864 |
| Time Warner, | | | | | |
| Gtd. Notes | 5.88 | 11/15/16 | 550,000 | | 630,653 |
| | | | | | 7,007,667 |
| Mining—.7% | | | | | |
| Rio Tinto Finance USA, | | | | | |
| Gtd. Notes | 5.88 | 7/15/13 | 540,000 | | 600,577 |
| Teck Resources, | | | | | |
| Sr. Scd. Notes | 10.25 | 5/15/16 | 550,000 | | 666,250 |
| Teck Resources, | | | | | |
| Sr. Scd. Notes | 10.75 | 5/15/19 | 480,000 | | 600,327 |
| | | | | | 1,867,154 |
| Municipal Bonds—1.4% | | | | | |
| Erie Tobacco Asset Securitization | | | | | |
| Corporation, Tobacco Settlement | | | | | |
| Asset-Backed Bonds, Ser. E | 6.00 | 6/1/28 | 815,000 | | 672,188 |
| Illinois, | | | | | |
| GO | 4.42 | 1/1/15 | 640,000 | | 640,000 |
| Michigan Tobacco Settlement Finance | | | | | |
| Authority, Tobacco Settlement | | | | | |
| Asset-Backed Bonds, Ser. A | 7.31 | 6/1/34 | 720,000 | | 553,442 |
| Tobacco Settlement Authority of | | | | | |
| Iowa, Tobacco Settlement | | | | | |
| Asset-Backed Bonds, Ser. A | 6.50 | 6/1/23 | 1,932,000 | | 1,667,200 |
| | | | | | 3,532,830 |
| Office & Business Equipment—.3% | | | | | |
| Xerox, | | | | | |
| Sr. Unscd. Notes | 8.25 | 5/15/14 | 730,000 | | 866,765 |
16
| | | | | |
| | Coupon | Maturity | Principal | | |
| Bonds and Notes (continued) | Rate (%) | Date | Amount ($) | | Value ($) |
| Oil & Gas—1.4% | | | | | |
| EQT, | | | | | |
| Sr. Unscd. Notes | 8.13 | 6/1/19 | 215,000 | | 260,187 |
| Husky Energy, | | | | | |
| Sr. Unscd. Notes | 5.90 | 6/15/14 | 725,000 | | 814,885 |
| Marathon Oil, | | | | | |
| Sr. Unscd. Notes | 6.50 | 2/15/14 | 445,000 | | 505,064 |
| Petroleos Mexicanos, | | | | | |
| Gtd. Bonds | 5.50 | 1/21/21 | 730,000 | a | 754,820 |
| Sempra Energy, | | | | | |
| Sr. Unscd. Notes | 6.50 | 6/1/16 | 435,000 | c | 510,157 |
| Valero Energy, | | | | | |
| Sr. Unscd. Notes | 6.13 | 2/1/20 | 660,000 | | 717,360 |
| | | | | | 3,562,473 |
| Packaging & Containers—.4% | | | | | |
| Bemis Company, | | | | | |
| Sr. Unscd. Notes | 5.65 | 8/1/14 | 435,000 | | 481,947 |
| Crown Americas, | | | | | |
| Gtd. Notes | 7.75 | 11/15/15 | 575,000 | | 606,625 |
| | | | | | 1,088,572 |
| Paper & Paper Related—.4% | | | | | |
| Georgia-Pacific, | | | | | |
| Gtd. Notes | 7.00 | 1/15/15 | 205,000 | a | 213,969 |
| Georgia-Pacific, | | | | | |
| Gtd. Notes | 8.25 | 5/1/16 | 860,000 | a | 937,400 |
| | | | | | 1,151,369 |
| Pipelines—.9% | | | | | |
| El Paso, | | | | | |
| Sr. Unscd. Notes | 8.25 | 2/15/16 | 485,000 | | 529,862 |
| Kinder Morgan Energy Partners, | | | | | |
| Sr. Unscd. Notes | 5.63 | 2/15/15 | 910,000 | | 1,009,461 |
| Plains All American Pipeline, | | | | | |
| Gtd. Notes | 4.25 | 9/1/12 | 650,000 | | 678,570 |
| | | | | | 2,217,893 |
| Property & Casualty Insurance—3.0% | | | | | |
| Allstate, | | | | | |
| Sr. Unscd. Notes | 5.00 | 8/15/14 | 630,000 | | 694,897 |
| Hanover Insurance Group, | | | | | |
| Sr. Unscd. Notes | 7.50 | 3/1/20 | 150,000 | c | 160,205 |
STATEMENT OF INVESTMENTS (continued)
| | | | | |
| | Coupon | Maturity | Principal | | |
| Bonds and Notes (continued) | Rate (%) | Date | Amount ($) | | Value ($) |
| Property & Casualty | | | | | |
| Insurance (continued) | | | | | |
| Jackson National Life Global | | | | | |
| Funding, Sr. Scd. Notes | 5.38 | 5/8/13 | 590,000 | a | 635,608 |
| Metropolitan Life | | | | | |
| Global Funding I, | | | | | |
| Sr. Scd. Notes | 5.13 | 4/10/13 | 1,000,000 | a | 1,090,024 |
| Nippon Life Insurance, | | | | | |
| Sub. Notes | 4.88 | 8/9/10 | 1,050,000 | a | 1,050,005 |
| Principal Financial Group, | | | | | |
| Gtd. Notes | 8.88 | 5/15/19 | 1,125,000 | | 1,407,459 |
| Prudential Financial, | | | | | |
| Sr. Unscd. Notes | 4.75 | 9/17/15 | 625,000 | | 663,480 |
| Prudential Financial, | | | | | |
| Sr. Unscd. Notes | 5.10 | 12/14/11 | 485,000 | | 509,330 |
| Willis North America, | | | | | |
| Gtd. Notes | 7.00 | 9/29/19 | 1,360,000 | | 1,460,073 |
| | | | | | 7,671,081 |
| Real Estate—3.3% | | | | | |
| Boston Properties, | | | | | |
| Sr. Unscd. Notes | 5.63 | 4/15/15 | 620,000 | | 681,611 |
| Commonwealth REIT, | | | | | |
| Sr. Unscd. Notes | 1.14 | 3/16/11 | 462,000 | b | 459,801 |
| Duke Realty, | | | | | |
| Sr. Unscd. Notes | 5.88 | 8/15/12 | 570,000 | | 598,868 |
| Duke Realty, | | | | | |
| Sr. Unscd. Notes | 6.75 | 3/15/20 | 110,000 | | 119,415 |
| Duke Realty, | | | | | |
| Sr. Unscd. Notes | 8.25 | 8/15/19 | 495,000 | | 578,147 |
| ERP Operating, | | | | | |
| Sr. Unscd. Notes | 5.75 | 6/15/17 | 230,000 | | 254,607 |
| Federal Realty Investment Trust, | | | | | |
| Sr. Unscd. Bonds | 5.65 | 6/1/16 | 345,000 | | 373,067 |
| Federal Realty Investment Trust, | | | | | |
| Sr. Unscd. Notes | 6.00 | 7/15/12 | 305,000 | | 327,687 |
| Healthcare Realty Trust, | | | | | |
| Sr. Unscd. Notes | 5.13 | 4/1/14 | 1,165,000 | | 1,202,122 |
| Liberty Property, | | | | | |
| Sr. Unscd. Notes | 5.50 | 12/15/16 | 165,000 | | 173,034 |
| Mack-Cali Realty, | | | | | |
| Sr. Unscd. Notes | 5.25 | 1/15/12 | 300,000 | | 312,214 |
18
| | | | | |
| | Coupon | Maturity | Principal | | |
| Bonds and Notes (continued) | Rate (%) | Date | Amount ($) | | Value ($) |
| Real Estate (continued) | | | | | |
| Regency Centers, | | | | | |
| Gtd. Notes | 5.88 | 6/15/17 | 370,000 | | 394,063 |
| Simon Property Group, | | | | | |
| Sr. Unscd. Notes | 4.20 | 2/1/15 | 930,000 | | 989,648 |
| Simon Property Group, | | | | | |
| Sr. Unscd. Notes | 5.65 | 2/1/20 | 337,000 | | 371,183 |
| Simon Property Group, | | | | | |
| Sr. Unscd. Notes | 5.88 | 3/1/17 | 443,000 | | 490,131 |
| WEA Finance, | | | | | |
| Gtd. Notes | 7.50 | 6/2/14 | 320,000 | a | 370,157 |
| WEA Finance, | | | | | |
| Gtd. Notes | 7.13 | 4/15/18 | 660,000 | a | 758,542 |
| | | | | | 8,454,297 |
| Residential Mortgage | | | | | |
| Pass-Through Ctfs.—.2% | | | | | |
| GSR Mortgage Loan Trust, | | | | | |
| Ser. 2004-12, Cl. 2A2 | 3.59 | 12/25/34 | 376,643 | b | 296,498 |
| Impac Secured Assets CMN Owner | | | | | |
| Trust, Ser. 2006-1, Cl. 2A1 | 0.68 | 5/25/36 | 410,223 | b | 338,130 |
| | | | | | 634,628 |
| Retail—.5% | | | | | |
| Autozone, | | | | | |
| Sr. Unscd. Notes | 5.75 | 1/15/15 | 805,000 | | 899,175 |
| Staples, | | | | | |
| Gtd. Notes | 9.75 | 1/15/14 | 405,000 | | 499,304 |
| | | | | | 1,398,479 |
| Telecommunications—2.8% | | | | | |
| AT&T, | | | | | |
| Sr. Unscd. Notes | 2.50 | 8/15/15 | 2,100,000 | | 2,113,660 |
| CC Holdings, | | | | | |
| Sr. Scd. Notes | 7.75 | 5/1/17 | 395,000 | a | 433,513 |
| Cellco Partnership/Verizon | | | | | |
| Wireless Capital, Sr. Unscd. Notes | 5.55 | 2/1/14 | 620,000 | | 701,218 |
| General Electric Capital, | | | | | |
| Gtd. Notes | 3.00 | 12/9/11 | 2,250,000 | | 2,319,500 |
| Telecom Italia Capital, | | | | | |
| Gtd. Notes | 5.25 | 11/15/13 | 1,230,000 | | 1,298,051 |
| Verizon Communications, | | | | | |
| Sr. Unscd. Notes | 6.35 | 4/1/19 | 280,000 | | 331,744 |
| | | | | | 7,197,686 |
STATEMENT OF INVESTMENTS (continued)
| | | | | |
| | Coupon | Maturity | Principal | | |
| Bonds and Notes (continued) | Rate (%) | Date | Amount ($) | | Value ($) |
| U.S. Government Agencies—10.0% | | | | | |
| Federal Home Loan Mortgage Corp., | | | | | |
| Notes | 1.70 | 12/17/12 | 6,220,000 | d | 6,245,365 |
| Federal Home Loan Mortgage Corp., | | | | | |
| Notes | 4.50 | 7/15/13 | 4,940,000 | d | 5,459,154 |
| Federal National Mortgage | | | | | |
| Association, Notes | 4.13 | 4/15/14 | 4,325,000 | d | 4,770,626 |
| Federal National Mortgage | | | | | |
| Association, Bonds, Ser. 1 | 4.75 | 11/19/12 | 8,638,000 | d | 9,420,888 |
| Federal National Mortgage | | | | | |
| Association, Notes | 5.38 | 11/15/11 | 75,000 | d | 79,788 |
| | | | | | 25,975,821 |
| U.S. Government Agencies/ | | | | | |
| Mortgage-Backed—3.0% | | | | | |
| Federal Home Loan Mortgage Corp.: | | | | | |
| 3.50%, 9/1/10 | | | 102,657 d | 102,453 |
| 5.50%, 4/1/40—7/1/40 | | | 5,297,407 d | 5,710,295 |
| 6.50%, 6/1/32 | | | 2,121 d | 2,360 |
| Stripped Security, Interest Only Class, | | | | | |
| Ser. 1987, Cl. PI, 7.00%, 9/15/12 | | | 21,046 d,e | 1,109 |
| Federal National Mortgage Association: | | | | | |
| 5.50%, 7/1/40 | | | 770,000 d | 830,617 |
| 5.62%, 12/1/11 | | | 777,902 d | 815,035 |
| Gtd. Pass-Through Ctfs., Ser. 2003-49, | | | | | |
| Cl. JE, 3.00%, 4/25/33 | | | 355,379 d | 369,081 |
| Government National Mortgage Association II: | | | | |
| 7.00%, 12/20/30—4/20/31 | | | 16,373 | | 18,690 |
| 7.50%, 11/20/29—12/20/30 | | | 17,855 | | 20,533 |
| | | | | | 7,870,173 |
| U.S. Government Securities—34.1% | | | | | |
| U.S. Treasury Notes: | | | | | |
| 0.88%, 4/30/11 | | | 14,280,000 | | 14,345,274 |
| 1.00%, 8/31/11 | | | 15,010,000 | | 15,116,136 |
| 1.38%, 9/15/12 | | | 15,390,000 | | 15,647,305 |
| 2.00%, 11/30/13 | | | 13,030,000 | | 13,478,923 |
| 2.38%, 8/31/14 | | | 10,520,000 | | 10,990,938 |
| 3.25%, 7/31/16 | | | 7,850,000 | | 8,405,630 |
| 4.88%, 5/31/11 | | | 10,280,000 | | 10,669,119 |
| | | | | | 88,653,325 |
| Total Bonds and Notes | | | | | |
| (cost $243,322,646) | | | | | 250,756,496 |
20
| | |
| | Principal | |
| Short-Term Investments—.1% | Amount ($) | Value ($) |
| U.S. Treasury Bills; | | |
| 0.15%, 10/21/10 | | |
| (cost $184,937) | 185,000 f | 184,947 |
| |
| Other Investment—2.7% | Shares | Value ($) |
| Registered Investment Company; | | |
| Dreyfus Institutional Preferred | | |
| Plus Money Market Fund | | |
| (cost $6,953,000) | 6,953,000 g | 6,953,000 |
| |
| Investment of Cash Collateral | | |
| for Securities Loaned—.9% | | |
| Registered Investment Company; | | |
| Dreyfus Institutional Cash Advantage Plus Fund | | |
| (cost $2,275,025) | 2,275,025 g | 2,275,025 |
| Total Investments (cost $252,735,608) | 100.2% | 260,169,468 |
| Liabilities, Less Cash and Receivables | (.2%) | (423,269) |
| Net Assets | 100.0% | 259,746,199 |
|
| GO—General Obligation |
| REIT—Real Estate Investment Trust |
| a Securities exempt from registration under Rule 144A of the Securities Act of 1933.These securities may be resold in |
| transactions exempt from registration, normally to qualified institutional buyers.At July 31, 2010, these securities had |
| a total market value of $26,891,177 or 10.4% of net assets. |
| b Variable rate security—interest rate subject to periodic change. |
| c Security, or portion thereof, on loan.At July 31, 2010, the total market value of the fund’s securities on loan is |
| $2,203,366 and the total market value of the collateral held by the fund is $2,275,025. |
| d On September 7, 2008, the Federal Housing Finance Agency (“FHFA”) placed Federal National Mortgage |
| Association and Federal Home Loan Mortgage Corporation into conservatorship with FHFA as the conservator.As |
| such, the FHFA will oversee the continuing affairs of these companies. |
| e Notional face amount shown. |
| f Held by a broker as collateral for open financial futures positions. |
| g Investment in affiliated money market mutual fund. |
| | | |
| Portfolio Summary (Unaudited)† | | |
| |
| Value (%) | | Value (%) |
| U.S. Government & Agencies | 47.1 | Municipal Bonds | 1.4 |
| Corporate Bonds | 35.9 | Foreign/Governmental | .6 |
| Asset/Mortgage-Backed | 11.5 | | |
| Short-Term/Money Market Investments | 3.7 | | 100.2 |
|
| † Based on net assets. |
| See notes to financial statements. |
|
| STATEMENT OF FINANCIAL FUTURES |
| July 31, 2010 |
| | | | |
| | | | | Unrealized |
| | | Market Value | | Appreciation |
| | | Covered by | | (Depreciation) |
| Contracts | Contracts ($) | Expiration | at 7/31/2010 ($) |
| Financial Futures Long | | | | |
| U.S. Treasury 2 Year Notes | 222 | 48,645,750 | September 2010 | 211,781 |
| U.S. Treasury 5 Year Notes | 103 | 12,342,297 | September 2010 | 293,508 |
| Financial Futures Short | | | | |
| U.S. Treasury 10 Year Notes | 143 | (17,705,188) | September 2010 | (423,477) |
| U.S. Treasury 30 Year Bonds | 5 | (643,594) | September 2010 | (6,406) |
| Gross Unrealized Appreciation | | | | 505,289 |
| Gross Unrealized Depreciation | | | | (429,883) |
| |
| See notes to financial statements. | | | | |
22
|
| STATEMENT OF ASSETS AND LIABILITIES |
| July 31, 2010 |
| | | |
| | | Cost | Value |
| Assets ($): | | | |
| Investments in securities—See Statement of Investments (including | | |
| securities on loan, valued at $2,203,366)—Note 1(b): | | |
| Unaffiliated issuers | | 243,507,583 | 250,941,443 |
| Affiliated issuers | | 9,228,025 | 9,228,025 |
| Cash | | | 46,928 |
| Receivable for investment securities sold | | | 2,879,153 |
| Dividends and interest receivable | | | 2,129,476 |
| Receivable for shares of Common Stock subscribed | | | 490,163 |
| Prepaid expenses | | | 15,893 |
| | | | 265,731,081 |
| Liabilities ($): | | | |
| Due to The Dreyfus Corporation and affiliates—Note 3(c) | | 228,386 |
| Payable for investment securities purchased | | | 3,192,861 |
| Liability for securities on loan—Note 1(b) | | | 2,275,025 |
| Payable for shares of Common Stock redeemed | | | 173,893 |
| Payable for futures variation margin—Note 4 | | | 23,703 |
| Accrued expenses | | | 91,014 |
| | | | 5,984,882 |
| Net Assets ($) | | | 259,746,199 |
| Composition of Net Assets ($): | | | |
| Paid-in capital | | | 343,865,896 |
| Accumulated undistributed investment income—net | | | 116,855 |
| Accumulated net realized gain (loss) on investments | | | (91,745,818) |
| Accumulated net unrealized appreciation (depreciation) | | |
| on investments (including $75,406 net unrealized | | | |
| appreciation on financial futures) | | | 7,509,266 |
| Net Assets ($) | | | 259,746,199 |
| |
| |
| Net Asset Value Per Share | | | |
| | Class B | Class D | Class P |
| Net Assets ($) | 2,009,815 | 256,258,852 | 1,477,532 |
| Shares Outstanding | 186,704 | 23,775,852 | 136,920 |
| Net Asset Value Per Share ($) | 10.76 | 10.78 | 10.79 |
| |
| See notes to financial statements. | | | |
| |
| STATEMENT OF OPERATIONS | |
| Year Ended July 31, 2010 | |
| |
| |
| |
| |
| Investment Income ($): | |
| Income: | |
| Interest | 9,101,479 |
| Income from securities lending—Note 1(b) | 13,062 |
| Dividends; | |
| Affiliated issuers | 7,102 |
| Total Income | 9,121,643 |
| Expenses: | |
| Management fee—Note 3(a) | 1,168,097 |
| Shareholder servicing costs—Note 3(c) | 746,963 |
| Professional fees | 56,384 |
| Registration fees | 46,862 |
| Custodian fees—Note 3(c) | 26,321 |
| Prospectus and shareholders’ reports | 18,114 |
| Distribution fees—Note 3(b) | 10,981 |
| Loan commitment fees—Note 2 | 3,694 |
| Directors’ fees and expenses—Note 3(d) | 2,864 |
| Miscellaneous | 49,301 |
| Total Expenses | 2,129,581 |
| Less—reduction in fees due to earnings credits—Note 1(b) | (803) |
| Net Expenses | 2,128,778 |
| Investment Income—Net | 6,992,865 |
| Realized and Unrealized Gain (Loss) on Investments—Note 4 ($): | |
| Net realized gain (loss) on investments | 2,192,138 |
| Net realized gain (loss) on options transactions | 249,497 |
| Net realized gain (loss) on financial futures | 62,486 |
| Net Realized Gain (Loss) | 2,504,121 |
| Net unrealized appreciation (depreciation) on investments | 7,993,416 |
| Net unrealized appreciation (depreciation) on options transactions | (83,800) |
| Net unrealized appreciation (depreciation) on financial futures | 418,283 |
| Net Unrealized Appreciation (Depreciation) | 8,327,899 |
| Net Realized and Unrealized Gain (Loss) on Investments | 10,832,020 |
| Net Increase in Net Assets Resulting from Operations | 17,824,885 |
| |
| See notes to financial statements. | |
24
STATEMENT OF CHANGES IN NET ASSETS
| | |
| | | Year Ended July 31, |
| | 2010 | 2009 |
| Operations ($): | | |
| Investment income—net | 6,992,865 | 8,148,012 |
| Net realized gain (loss) on investments | 2,504,121 | (8,673,465) |
| Net unrealized appreciation | | |
| (depreciation) on investments | 8,327,899 | 8,704,819 |
| Net Increase (Decrease) in Net Assets | | |
| Resulting from Operations | 17,824,885 | 8,179,366 |
| Dividends to Shareholders from ($): | | |
| Investment income—net: | | |
| Class B Shares | (66,395) | (128,317) |
| Class D Shares | (8,342,045) | (8,373,648) |
| Class P Shares | (54,395) | (59,185) |
| Total Dividends | (8,462,835) | (8,561,150) |
| Capital Stock Transactions ($): | | |
| Net proceeds from shares sold: | | |
| Class B Shares | 744,003 | 1,046,260 |
| Class D Shares | 91,449,612 | 30,887,353 |
| Class P Shares | 900,133 | 256,496 |
| Dividends reinvested: | | |
| Class B Shares | 60,498 | 112,985 |
| Class D Shares | 7,122,987 | 7,133,067 |
| Class P Shares | 46,748 | 52,104 |
| Cost of shares redeemed: | | |
| Class B Shares | (1,364,850) | (3,020,546) |
| Class D Shares | (51,386,283) | (51,840,666) |
| Class P Shares | (880,235) | (629,241) |
| Increase (Decrease) in Net Assets | | |
| from Capital Stock Transactions | 46,692,613 | (16,002,188) |
| Total Increase (Decrease) in Net Assets | 56,054,663 | (16,383,972) |
| Net Assets ($): | | |
| Beginning of Period | 203,691,536 | 220,075,508 |
| End of Period | 259,746,199 | 203,691,536 |
| Undistributed investment income—net | 116,855 | 46,437 |
STATEMENT OF CHANGES IN NET ASSETS (continued)
| | |
| | | Year Ended July 31, |
| | 2010 | 2009 |
| Capital Share Transactions: | | |
| Class Ba | | |
| Shares sold | 70,467 | 105,413 |
| Shares issued for dividends reinvested | 5,910 | 11,436 |
| Shares redeemed | (129,318) | (305,093) |
| Net Increase (Decrease) in Shares Outstanding | (52,941) | (188,244) |
| Class Da | | |
| Shares sold | 8,618,606 | 3,095,472 |
| Shares issued for dividends reinvested | 670,149 | 718,610 |
| Shares redeemed | (4,837,651) | (5,211,091) |
| Net Increase (Decrease) in Shares Outstanding | 4,451,104 | (1,397,009) |
| Class P | | |
| Shares sold | 84,519 | 25,431 |
| Shares issued for dividends reinvested | 4,397 | 5,249 |
| Shares redeemed | (82,381) | (62,618) |
| Net Increase (Decrease) in Shares Outstanding | 6,535 | (31,938) |
|
| a During the period ended July 31, 2010, 68,007 Class B shares representing $717,295 were automatically |
| converted to 67,921 Class D shares and during the period ended July 31, 2009, 117,232 Class B shares |
| representing $1,153,445 were automatically converted to 117,182 Class D shares. |
See notes to financial statements.
26
FINANCIAL HIGHLIGHTS
The following tables describe the performance for each share class for the fiscal periods indicated. All information (except portfolio turnover rate) reflects financial results for a single fund share.Total return shows how much your investment in the fund would have increased (or decreased) during each period, assuming you had reinvested all dividends and distributions.These figures have been derived from the fund’s financial statements.
| | | | | |
| | | Year Ended July 31, | |
| Class B Shares | 2010 | 2009 | 2008 | 2007 | 2006 |
| Per Share Data ($): | | | | | |
| Net asset value, beginning of period | 10.34 | 10.32 | 10.81 | 10.82 | 11.03 |
| Investment Operations: | | | | | |
| Investment income—neta | .24 | .34 | .38 | .38 | .32 |
| Net realized and unrealized gain | | | | | |
| (loss) on investments | .50 | .05 | (.46) | .03 | (.12) |
| Total from Investment Operations | .74 | .39 | (.08) | .41 | .20 |
| Distributions: | | | | | |
| Dividends from investment income—net | (.32) | (.37) | (.40) | (.42) | (.39) |
| Dividends from net realized | | | | | |
| gain on investments | — | — | (.01) | — | (.02) |
| Total Distributions | (.32) | (.37) | (.41) | (.42) | (.41) |
| Net asset value, end of period | 10.76 | 10.34 | 10.32 | 10.81 | 10.82 |
| Total Return (%)b | 7.22 | 3.96 | (.78) | 3.84 | 1.81 |
| Ratios/Supplemental Data (%): | | | | | |
| Ratio of total expenses | | | | | |
| to average net assets | 1.61 | 1.70 | 1.57 | 1.56 | 1.50 |
| Ratio of net expenses | | | | | |
| to average net assets | 1.61c | 1.70c | 1.57c | 1.56 | 1.50 |
| Ratio of net investment income | | | | | |
| to average net assets | 2.34 | 3.50 | 3.62 | 3.46 | 2.92 |
| Portfolio Turnover Rate | 90.03 | 99.46d | 86.45d | 146.57 | 181.07d |
| Net Assets, end of period ($ x 1,000) | 2,010 | 2,479 | 4,417 | 5,746 | 7,905 |
|
| a Based on average shares outstanding at each month end. |
| b Exclusive of sales charge. |
| c Expense waivers and/or reimbursements amounted to less than .01%. |
| d The portfolio turnover rates excluding mortgage dollar roll transactions for the periods ended July 31, 2009, 2008 |
| and 2006 were 98.62%, 86.39% and 169.73%, respectively. |
See notes to financial statements.
FINANCIAL HIGHLIGHTS (continued)
| | | | | |
| | | Year Ended July 31, | |
| Class D Shares | 2010 | 2009 | 2008 | 2007 | 2006 |
| Per Share Data ($): | | | | | |
| Net asset value, beginning of period | 10.34 | 10.33 | 10.81 | 10.82 | 11.03 |
| Investment Operations: | | | | | |
| Investment income—neta | .32 | .42 | .46 | .45 | .39 |
| Net realized and unrealized | | | | | |
| gain (loss) on investments | .51 | .03 | (.45) | .03 | (.12) |
| Total from Investment Operations | .83 | .45 | .01 | .48 | .27 |
| Distributions: | | | | | |
| Dividends from investment income—net | (.39) | (.44) | (.48) | (.49) | (.46) |
| Dividends from net realized | | | | | |
| gain on investments | — | — | (.01) | — | (.02) |
| Total Distributions | (.39) | (.44) | (.49) | (.49) | (.48) |
| Net asset value, end of period | 10.78 | 10.34 | 10.33 | 10.81 | 10.82 |
| Total Return (%) | 8.12 | 4.66 | .02 | 4.49 | 2.48 |
| Ratios/Supplemental Data (%): | | | | | |
| Ratio of total expenses | | | | | |
| to average net assets | .90 | .95 | .89 | .90 | .86 |
| Ratio of net expenses | | | | | |
| to average net assets | .90b | .95b | .89b | .90 | .86 |
| Ratio of net investment income | | | | | |
| to average net assets | 3.00 | 4.25 | 4.30 | 4.12 | 3.55 |
| Portfolio Turnover Rate | 90.03 | 99.46c | 86.45c | 146.57 | 181.07c |
| Net Assets, end of period ($ x 1,000) | 256,259 | 199,863 | 213,980 | 261,164 | 315,555 |
|
| a Based on average shares outstanding at each month end. |
| b Expense waivers and/or reimbursements amounted to less than .01%. |
| c The portfolio turnover rates excluding mortgage dollar roll transactions for the periods ended July 31, 2009, 2008 |
| and 2006 were 98.62%, 86.39% and 169.73%, respectively. |
See notes to financial statements.
28
| | | | | |
| | | Year Ended July 31, | |
| Class P Shares | 2010 | 2009 | 2008 | 2007 | 2006 |
| Per Share Data ($): | | | | | |
| Net asset value, beginning of period | 10.36 | 10.34 | 10.82 | 10.83 | 11.04 |
| Investment Operations: | | | | | |
| Investment income—neta | .32 | .42 | .47 | .45 | .39 |
| Net realized and unrealized | | | | | |
| gain (loss) on investments | .50 | .04 | (.46) | .03 | (.12) |
| Total from Investment Operations | .82 | .46 | .01 | .48 | .27 |
| Distributions: | | | | | |
| Dividends from investment income—net | (.39) | (.44) | (.48) | (.49) | (.46) |
| Dividends from net realized | | | | | |
| gain on investments | — | — | (.01) | — | (.02) |
| Total Distributions | (.39) | (.44) | (.49) | (.49) | (.48) |
| Net asset value, end of period | 10.79 | 10.36 | 10.34 | 10.82 | 10.83 |
| Total Return (%) | 8.10 | 4.66 | .02 | 4.50 | 2.46 |
| Ratios/Supplemental Data (%): | | | | | |
| Ratio of total expenses | | | | | |
| to average net assets | .93 | .96 | .89 | .90 | .88 |
| Ratio of net expenses | | | | | |
| to average net assets | .93b | .96b | .89b | .90 | .88 |
| Ratio of net investment income | | | | | |
| to average net assets | 2.97 | 4.24 | 4.32 | 4.12 | 3.56 |
| Portfolio Turnover Rate | 90.03 | 99.46c | 86.45c | 146.57 | 181.07c |
| Net Assets, end of period ($ x 1,000) | 1,478 | 1,350 | 1,678 | 3,308 | 4,025 |
|
| a Based on average shares outstanding at each month end. |
| b Expense waivers and/or reimbursements amounted to less than .01%. |
| c The portfolio turnover rates excluding mortgage dollar roll transactions for the periods ended July 31, 2009, 2008 |
| and 2006 were 98.62%, 86.39% and 169.73%, respectively. |
See notes to financial statements.
NOTES TO FINANCIAL STATEMENTS
NOTE 1—Significant Accounting Policies:
Dreyfus Short Term Income Fund (the “fund”) is a separate non-diversified series of Dreyfus Investment Grade Funds, Inc. (the “Company”), which is registered under the Investment Company Act of 1940, as amended (the “Act”), as an open-end management investment company and operates as a series company currently offering three series, including the fund.The fund’s investment objective seeks to maximize total return, consisting of capital appreciation and current income.The Dreyfus Corporation (the “Manager” or “Dreyfus”), a wholly-owned subsidiary of The Bank of New York Mellon Corporation (“BNY Mellon”), serves as the fund’s investment adviser.
MBSC Securities Corporation (the “Distributor”), a wholly-owned subsidiary of the Manager, is the distributor of the fund’s shares. The fund is authorized to issue 700 million shares of $.001 par value Common Stock.The fund currently offers three classes of shares: Class B (100 million shares authorized), Class D (500 million shares authorized) and Class P (100 million shares authorized). Class B shares are subject to a contingent deferred sales charge (“CDSC”) imposed on Class B share redemptions made within six years of purchase and automatically convert to Class D shares after six years.The fund does not offer Class B shares, except in connection with dividend reinvestment and permitted exchanges of Class B shares. Class D and Class P shares are sold at net asset value per share only to institutional investors. Class D shares purchased at net asset value (an investment of $250,000 or more) will have a CDSC imposed on redemptions made within eighteen months of purchase. Other differences between the classes include the services offered to and the expenses borne by each class, the allocation of certain transfer agency costs and certain voting rights. Income, expenses (other than expenses attributable to a specific class), and realized and unrealized gains or losses on investments are allocated to each class of shares based on its relative net assets.
The Company accounts separately for the assets, liabilities and operations of each series. Expenses directly attributable to each series are charged to that series’ operations; expenses which are applicable to all series are allocated among them on a pro rata basis.
30
The Financial Accounting Standards Board (“FASB”) Accounting Standards Codification (“ASC”) has become the exclusive reference of authoritative U.S. generally accepted accounting principles (“GAAP”) recognized by the FASB to be applied by nongovernmental entities. Rules and interpretive releases of the Securities and Exchange Commission (“SEC”) under authority of federal laws are also sources of authoritative GAAP for SEC registrants. The ASC has superseded all existing non-SEC accounting and reporting standards. The fund’s financial statements are prepared in accordance with GAAP, which may require the use of management estimates and assumptions.Actual results could differ from those estimates.
The Company enters into contracts that contain a variety of indemnifications. The fund’s maximum exposure under these arrangements is unknown.The fund does not anticipate recognizing any loss related to these arrangements.
(a) Portfolio valuation: Investments in securities, excluding short-term investments (other than U.S.Treasury Bills), financial futures and options transactions are valued each business day by an independent pricing service (the “Service”) approved by the Board of Directors. Investments for which quoted bid prices are readily available and are representative of the bid side of the market in the judgment of the Service are valued at the mean between the quoted bid prices (as obtained by the Service from dealers in such securities) and asked prices (as calculated by the Service based upon its evaluation of the market for such securities). Other investments (which constitute a majority of the portfolio securities) are valued as determined by the Service, based on methods which include consideration of: yields or prices of securities of comparabl e quality, coupon, maturity and type, indications as to values from dealers, and general market conditions. Restricted securities, as well as securities or other assets for which recent market quotations are not readily available and are not valued by a pricing service approved by the Board of Directors, or are determined by the fund not to reflect accurately fair value, are valued at fair value as determined in good faith under the direction of the Board of Directors.The factors that may be considered
NOTES TO FINANCIAL STATEMENTS (continued)
when fair valuing a security include fundamental analytical data, the nature and duration of restrictions on disposition, an evaluation of the forces that influence the market in which the securities are purchased and sold and public trading in similar securities of the issuer or comparable issuers. Short-term investments, excluding U.S.Treasury Bills, are carried at amortized cost, which approximates value. Registered investment companies that are not traded on an exchange are valued at their net asset value. Financial futures and options, which are traded on an exchange, are valued at the last sales price on the securities exchange on which such securities are primarily traded or at the last sales price on the national securities market on each business day. Options traded over-the-counter are valued at the mean between the bid and asked price.
The fair value of a financial instrument is the amount that would be received to sell an asset or paid to transfer a liability in an orderly transaction between market participants at the measurement date (i.e. the exit price). GAAP establishes a fair value hierarchy that prioritizes the inputs of valuation techniques used to measure fair value.This hierarchy gives the highest priority to unadjusted quoted prices in active markets for identical assets or liabilities (Level 1 measurements) and the lowest priority to unobservable inputs (Level 3 measurements).
Additionally, GAAP provides guidance on determining whether the volume and activity in a market has decreased significantly and whether such a decrease in activity results in transactions that are not orderly. GAAP requires enhanced disclosures around valuation inputs and techniques used during annual and interim periods.
Various inputs are used in determining the value of the fund’s investments relating to fair value measurements.These inputs are summarized in the three broad levels listed below:
Level 1—unadjusted quoted prices in active markets for
identical investments.
Level 2—other significant observable inputs (including quoted
prices for similar investments, interest rates, prepayment speeds,
credit risk, etc.).
Level 3—significant unobservable inputs (including the fund’s own
assumptions in determining the fair value of investments).
32
The inputs or methodology used for valuing securities are not necessarily an indication of the risk associated with investing in those securities.
The following is a summary of the inputs used as of July 31, 2010 in valuing the fund’s investments:
| | | | |
| | Level 1— | Level 2—Other | Level 3— | |
| | Unadjusted | Significant | Significant | |
| | Quoted | Observable | Unobservable | |
| | Prices | Inputs | Inputs | Total |
| Assets ($) | | | | |
| Investments in Securities: | | | |
| Asset-Backed | — | 15,103,332 | — | 15,103,332 |
| Commercial | | | | |
| Mortgage-Backed | — | 14,308,441 | — | 14,308,441 |
| Corporate Bonds† | — | 93,151,320 | — | 93,151,320 |
| Foreign Government | — | 1,526,626 | — | 1,526,626 |
| Municipal Bonds | — | 3,532,830 | — | 3,532,830 |
| Mutual Funds | 9,228,025 | — | — | 9,228,025 |
| Residential | | | | |
| Mortgage-Backed | — | 634,628 | — | 634,628 |
| U.S. Government | | | | |
| Agencies/ | | | | |
| Mortgage-Backed | — | 33,845,994 | — | 33,845,994 |
| U.S. Treasury | — | 88,838,272 | — | 88,838,272 |
| Other Financial | | | | |
| Instruments: | | | | |
| Futures†† | 505,289 | — | — | 505,289 |
| Liabilities ($) | | | | |
| Other Financial | | | | |
| Instruments: | | | | |
| Futures†† | (429,883) | — | — | (429,883) |
| |
| † | See Statement of Investments for industry classification. |
| †† | Amount shown represents unrealized appreciation (depreciation) at period end. |
In January 2010, FASB issued Accounting Standards Update (“ASU”) No. 2010-06 “Improving Disclosures about FairValue Measurements”. The portions of ASU No.2010-06 which require reporting entities to prepare new disclosures surrounding amounts and reasons for significant transfers in and out of Level 1 and Level 2 fair value measurements as well as inputs and valuation techniques used to measure fair value for
NOTES TO FINANCIAL STATEMENTS (continued)
both recurring and nonrecurring fair value measurements that fall in either Level 2 or Level 3 have been adopted by the fund. No significant transfers between Level 1 or Level 2 fair value measurements occurred during the period ended July 31, 2010. The remaining portion of ASU No. 2010-06 requires reporting entities to make new disclosures about information on purchases, sales, issuances and settlements on a gross basis in the reconciliation of activity in Level 3 fair value measurements. These new and revised disclosures are required to be implemented for fiscal years beginning after December 15, 2010. Management is currently evaluating the impact that the adoption of this remaining portion of ASU No. 2010-06 may have on the fund’s financial statement disclosures.
(b) Securities transactions and investment income: Securities transactions are recorded on a trade date basis. Realized gains and losses from securities transactions are recorded on the identified cost basis. Dividend income is recognized on the ex-dividend date and interest income, including, where applicable, accretion of discount and amortization of premium on investments, is recognized on the accrual basis.
The fund has arrangements with the custodian and cash management bank whereby the fund may receive earnings credits when positive cash balances are maintained, which are used to offset custody and cash management fees. For financial reporting purposes, the fund includes net earnings credits as an expense offset in the Statement of Operations.
Pursuant to a securities lending agreement with The Bank of New York Mellon, a subsidiary of BNY Mellon and an affiliate of Dreyfus, the fund may lend securities to qualified institutions. It is the fund’s policy that, at origination, all loans are secured by collateral of at least 102% of the value of U.S. securities loaned and 105% of the value of foreign securities loaned. Collateral equivalent to at least 100% of the market value of securities on loan is maintained at all times. Collateral is either in the form of cash, which can be invested in certain money market mutual funds managed by the Manager, U.S. Government and Agency securities or letters of credit.The fund is entitled to receive all income on securities loaned, in addition to income earned as a result
34
of the lending transaction. Although each security loaned is fully collateralized, the fund bears the risk of delay in recovery of, or loss of rights in, the securities loaned should a borrower fail to return the securities in a timely manner. During the period ended July 31, 2010, The Bank of NewYork Mellon earned $5,598 from lending portfolio securities, pursuant to the securities lending agreement.
(d) Affiliated issuers: Investments in other investment companies advised by Dreyfus are defined as “affiliated” in the Act.
The fund may invest in shares of certain affiliated investment companies also advised or managed by Dreyfus. Investments in affiliated investment companies for the period ended July 31, 2010 were as follows:
| | | | | |
| Affiliated | | | | | |
| Investment | Value | | | Value | Net |
| Company | 7/31/2009 ($) | Purchases ($) | Sales ($) | 7/31/2010 ($) Assets (%) |
| Dreyfus | | | | | |
| Institutional | | | | | |
| Preferred | | | | | |
| Plus Money | | | | | |
| Market | | | | | |
| Fund | 13,802,000 | 109,247,000 | 116,096,000 | 6,953,000 | 2.7 |
| Dreyfus | | | | | |
| Institutional | | | | | |
| Cash | | | | | |
| Advantage | | | | | |
| Plus Fund | 26,818,552 | 100,717,588 | 125,261,115 | 2,275,025 | .9 |
| Total | 40,620,552 | 209,964,588 | 241,357,115 | 9,228,025 | 3.6 |
(d) Dividends to shareholders: It is the policy of the fund to declare dividends daily from investment income-net. Such dividends are paid monthly. Dividends from net realized capital gains, if any, are normally declared and paid annually, but the fund may make distributions on a more frequent basis to comply with the distribution requirements of the Internal Revenue Code of 1986, as amended (the “Code”).To the extent that net realized capital gains can be offset by capital loss carryovers, it is the policy of the fund not to distribute such gains. Income and capital gain distributions are determined in accordance with income tax regulations, which may differ from GAAP.
NOTES TO FINANCIAL STATEMENTS (continued)
(e) Federal income taxes: It is the policy of the fund to continue to qualify as a regulated investment company, if such qualification is in the best interests of its shareholders, by complying with the applicable provisions of the Code, and to make distributions of taxable income sufficient to relieve it from substantially all federal income and excise taxes.
As of and during the period ended July 31, 2010, the fund did not have any liabilities for any uncertain tax positions. The fund recognizes interest and penalties, if any, related to uncertain tax positions as income tax expense in the Statement of Operations. During the period, the fund did not incur any interest or penalties.
Each of the tax years in the four-year period ended July 31, 2010 remains subject to examination by the Internal Revenue Service and state taxing authorities.
At July 31, 2010, the components of accumulated earnings on a tax basis were as follows: undistributed ordinary income $116,855, accumulated capital losses $89,404,323 and unrealized appreciation $5,167,771.
The accumulated capital loss carryover is available for federal income tax purposes to be applied against future net securities profits, if any, realized subsequent to July 31, 2010. If not applied, $21,420,716 of the carryover expires in fiscal 2011, $7,815,155 expires in fiscal 2012, $29,412,542 expires in fiscal 2013, $8,634,655 expires in fiscal 2014, $7,342,005 expires in fiscal 2015, $4,178,299 expires in fiscal 2016, $5,740,844 expires in fiscal 2017 and $4,860,107 expires in fiscal 2018.
The tax character of distributions paid to shareholders during the fiscal periods ended July 31, 2010 and July 31, 2009 were as follows: ordinary income $8,462,835 and $8,561,150, respectively.
During the period ended July 31, 2010, as a result of permanent book to tax differences, primarily due to the tax treatment for amortization of premiums, paydown gains and losses on mortgage-backed securities, consent fees and a capital loss carryover expiration, the fund increased accumulated undistributed investment income-net by $1,540,388, increased accumulated net realized gain (loss) on investments by
36
$2,862,905 and decreased paid-in capital by $4,403,293. Net assets and net asset value per share were not affected by this reclassification.
NOTE 2—Bank Lines of Credit:
The fund participates with other Dreyfus-managed funds in a $225 million unsecured credit facility led by Citibank, N.A. and a $300 million unsecured credit facility provided by The Bank of New York Mellon (each, a “Facility”), each to be utilized primarily for temporary or emergency purposes, including the financing of redemptions. In connection therewith, the fund has agreed to pay its pro rata portion of commitment fees for each Facility. Interest is charged to the fund based on rates determined pursuant to the terms of the respective Facility at the time of borrowing. During the period ended July 31, 2010, the fund did not borrow under the Facilities.
NOTE 3—Management Fee and Other Transactions With Affiliates:
(a) Pursuant to a management agreement with the Manager, the management fee is computed at the annual rate of .50% of the value of the fund’s average daily net assets and is payable monthly.
During the period ended July 31, 2010, the Distributor retained $2,918 from CDSCs on redemptions of the fund’s Class B shares.
(b) Under the Distribution Plan (the “Plan”) adopted pursuant to Rule 12b-1 under the Act, Class B shares pay the Distributor for distributing its shares at an annual rate of .50% of the value of the average daily net assets of Class B shares. During the period ended July 31, 2010, Class B shares were charged $10,981, pursuant to the Plan.
(c) Under the Shareholder Services Plan, Class B, Class D and Class P shares pay the Distributor at an annual rate of .25% of the value of the average daily net assets of Class B and Class P shares and .20% of the value of the average daily net assets of Class D shares for the provision of certain services.The services provided may include personal services
NOTES TO FINANCIAL STATEMENTS (continued)
relating to shareholder accounts, such as answering shareholder inquiries regarding Class B, Class D and Class P shares and providing reports and other information, and services related to the maintenance of shareholder accounts.The Distributor may make payments to Service Agents (a securities dealer, financial institution or other industry professional) in respect of these services.The Distributor determines the amounts to be paid to Service Agents. During the period ended July 31, 2010, Class B, Class D and Class P shares were charged, $5,490, $459,828 and $3,773, respectively, pursuant to the Shareholder Services Plan.
The fund compensates Dreyfus Transfer, Inc., a wholly-owned subsidiary of the Manager, under a transfer agency agreement for providing personnel and facilities to perform transfer agency services for the fund. During the period ended July 31, 2010, the fund was charged $134,886 pursuant to the transfer agency agreement, which is included in Shareholder servicing costs in the Statement of Operations.
The fund compensates The Bank of New York Mellon under a cash management agreement for performing cash management services related to fund subscriptions and redemptions. During the period ended July 31, 2010, the fund was charged $14,896 pursuant to the cash management agreement, which is included in Shareholder servicing costs in the Statement of Operations.These fees were partially offset by earnings credits of $803.
The fund also compensates The Bank of New York Mellon under a custody agreement for providing custodial services for the fund. During the period ended July 31, 2010, the fund was charged $26,321 pursuant to the custody agreement.
During the period ended July 31, 2010, the fund was charged $4,366 for services performed by the Chief Compliance Officer.
The components of “Due to The Dreyfus Corporation and affiliates” in the Statement of Assets and Liabilities consist of: management fees $108,737, Rule 12b-1 distribution plan fees $850, shareholder services plan fees $43,644, custodian fees $10,064, chief compliance officer fees $1,341 and transfer agency per account fees $63,750.
38
(d) Each Board member also serves as a Board member of other funds within the Dreyfus complex. Annual retainer fees and attendance fees are allocated to each fund based on net assets.
NOTE 4—Securities Transactions:
The aggregate amount of purchases and sales (including paydowns) of investment securities, excluding short-term securities, financial futures and options transactions during the period ended July 31, 2010, amounted to $258,531,250 and $204,346,545, respectively.
The provisions of ASC Topic 815 “Derivatives and Hedging” require qualitative disclosures about objectives and strategies for using derivatives, quantitative disclosures about fair value amounts of gains and losses on derivative instruments and disclosures about credit-risk-related contingent features in derivative agreements. The disclosure requirements distinguish between derivatives, which are accounted for as “hedges” and those that do not qualify for hedge accounting. Because investment companies value their derivatives at fair value and recognize changes in fair value through the Statement of Operations, they do not qualify for such accounting.Accordingly,even though a fund’s investments in derivatives may represent economic hedges, they are considered to be non-hedge transactions for purposes of this disclosure.
The following summarizes the average market value and percentage of average net assets of derivatives outstanding for the period ended July 31, 2010:
| | |
| | Value ($) | Average Net Assets (%) |
| Interest rate futures contracts | 76,541,835 | 32.76 |
| Interest rate options contracts | 88,293 | 0.04 |
Futures Contracts: In the normal course of pursuing its investment objective, the fund is exposed to market risk, including interest rate risk as a result of changes in value of underlying financial instruments. The fund invests in financial futures contracts in order to manage its exposure to or protect against changes in the market. A futures contract represents a commitment for the future purchase or a sale of an
NOTES TO FINANCIAL STATEMENTS (continued)
asset at a specified date. Upon entering into such contracts, these investments require initial margin deposits with a broker, which consist of cash or cash equivalents.The amount of these deposits is determined by the exchange or Board of Trade on which the contract is traded and is subject to change. Accordingly, variation margin payments are received or made to reflect daily unrealized gains or losses which are recorded in the Statement of Operations. Futures contracts are valued daily at the last sales price established by the Board of Trade or exchange upon which they are traded. When the contracts are closed, the fund recognizes a realized gain or loss. There is minimal counterparty credit risk to the fund with futures since futures are exchange traded and the exchange’s clearinghouse guarantees the futures against default. Contracts open at July 31, 2010 are set forth in the Statement of Financial Futures.
Options: The fund may purchase and write (sell) put and call options to hedge against changes in interest rates, or as a substitute for an invest-ment.The fund is subject to interest rate risk, in the course of pursuing its investment objectives through its investments in options contracts.A call option gives the purchaser of the option the right (but not the obligation) to buy, and obligates the writer to sell, the underlying security or securities at the exercise price at any time during the option period, or at a specified date. Conversely, a put option gives the purchaser of the option the right (but not the obligation) to sell, and obligates the writer to buy the underlying security or securities at the exercise price at any time during the option period, or at a specified date.
As a writer of call options, the fund receives a premium at the outset and then bears the market risk of unfavorable changes in the price of the financial instrument underlying the option. Generally, the fund realizes a gain,to the extent of the premium,if the price of the underlying financial instrument decreases between the date the option is written and the date on which the option is terminated. Generally, the fund incurs a loss, if the price of the financial instrument increases between those dates.
As a writer of put options, the fund receives a premium at the outset and then bears the market risk of unfavorable changes in the price of the
40
financial instrument underlying the option. Generally, the fund realizes a gain,to the extent of the premium,if the price of the underlying financial instrument increases between the date the option is written and the date on which the option is terminated. Generally, the fund incurs a loss, if the price of the financial instrument decreases between those dates.
As a writer of an option, the fund may have no control over whether the underlying securities may be sold (call) or purchased (put) and as a result bears the market risk of an unfavorable change in the price of the security underlying the written option.There is a risk of loss from a change in value of such options which may exceed the related premiums received. One risk of holding a put or a call option is that if the option is not sold or exercised prior to its expiration, it becomes worthless. However, this risk is limited to the premium paid by the fund. Upon the expiration or closing of the option transaction, a gain or loss is reported in the Statement of Operations.
The following summarizes the fund’s call/put options written for the period ended July 31, 2010:
| | | | |
| | Face Amount | | Options Terminated |
| | Covered by | Premiums | | Net Realized |
| Options Written: | Contracts ($) | Received ($) | Cost ($) | Gain (Loss) ($) |
| Contracts outstanding | | | | |
| July 31, 2009 | 20,436,000 | 251,474 | | |
| Contracts written | 142,774,000 | 849,389 | | |
| Contracts terminated: | | | | |
| Contracts closed | 69,338,000 | 610,765 | 806,070 | (195,305) |
| Contracts expired | 93,872,000 | 490,098 | — | 490,098 |
| Total contracts terminated | 163,210,000 | 1,100,863 | 806,070 | 294,793 |
| Contracts Outstanding | | | | |
| July 31, 2010 | — | — | | |
At July 31, 2010, the cost of investments for federal income tax purposes was $254,159,839; accordingly, accumulated net unrealized appreciation on investments was $6,009,629, consisting of $8,651,814 gross unrealized appreciation and $2,642,185 gross unrealized depreciation.
|
| REPORT OF INDEPENDENT REGISTERED |
| PUBLIC ACCOUNTING FIRM |
Shareholders and Board of Directors
Dreyfus Short Term Income Fund
We have audited the accompanying statement of assets and liabilities, including the statements of investments and financial futures, of Dreyfus Short Term Income Fund (one of the series comprising Dreyfus Investment Grade Funds, Inc.), as of July 31, 2010, and the related statement of operations for the year then ended, the statement of changes in net assets for each of the two years in the period then ended, and financial highlights for each of the years indicated therein. These financial statements and financial highlights are the responsibility of the Fund’s management. Our responsibility is to express an opinion on these financial statements and financial highlights based on our audits.
We conducted our audits in accordance with the standards of the Public Company Accounting Oversight Board (United States).Those standards require that we plan and perform the audit to obtain reasonable assurance about whether the financial statements and financial highlights are free of material misstatement.We were not engaged to perform an audit of the Fund’s internal control over financial reporting. Our audits included consideration of internal control over financial reporting as a basis for designing audit procedures that are appropriate in the circumstances, but not for the purpose of expressing an opinion on the effectiveness of the Fund’s internal control over financial reporting. Accordingly, we express no such opinion. An audit also includes examining, on a test basis, evidence supporting the amounts and disclosures in the financial statements and financial highlights, assessing the accounting principles use d and significant estimates made by management, and evaluating the overall financial statement presentation. Our procedures included confirmation of securities owned as of July 31, 2010 by correspondence with the custodian and others.We believe that our audits provide a reasonable basis for our opinion.
In our opinion, the financial statements and financial highlights referred to above present fairly, in all material respects, the financial position of Dreyfus Short Term Income Fund at July 31, 2010, the results of its operations for the year then ended, the changes in its net assets for each of the two years in the period then ended, and the financial highlights for each of the indicated years, in conformity with U.S. generally accepted accounting principles.

New York, New York
September 20, 2010
42
IMPORTANT TAX INFORMATION (Unaudited)
The fund hereby designates 99.52% of ordinary income dividends paid during the fiscal year ended July 31, 2010 as qualifying “interest related dividends”.
PROXY RESULTS (Unaudited)
Dreyfus Investment Grade Funds, Inc. held a special meeting of shareholders on October 9, 2009.The proposal considered at the meeting, and the results, are as follows:
| | | |
| | | Shares | |
| | Votes For | | Authority Withheld |
| To elect additional Board Members: | | | |
| Clifford L. Alexander, Jr. | 69,338,387 | | 3,729,000 |
| Joseph S. DiMartino | 69,406,095 | | 3,661,292 |
| Nathan Leventhal | 69,385,853 | | 3,681,534 |
| Benaree Pratt Wiley | 69,333,345 | | 3,734,042 |
|
| INFORMATION ABOUT THE REVIEW AND APPROVAL |
| OF THE FUND’S MANAGEMENT AGREEMENT (Unaudited) |
At a meeting of the Board of Directors for the fund held on July 14 and 15, 2010, the Board considered the re-approval for an annual period (through July 29, 2011) of the Management Agreement with Dreyfus for the fund, pursuant to which Dreyfus provides the fund with investment advisory and administrative services. The Board members, none of whom are “interested persons” (as defined in the Investment Company Act of 1940, as amended) of the fund, were assisted in their review by independent legal counsel and met with counsel in executive session separate from representatives of Dreyfus.
Analysis of Nature, Extent and Quality of Services Provided to the Fund. The Board members received a presentation from representatives of Dreyfus regarding services provided to the fund and other funds in the Dreyfus fund complex, and discussed the nature, extent and quality of the services provided to the fund pursuant to its Management Agreement. Dreyfus’ representatives reviewed the fund’s distribution of accounts and the relationships Dreyfus has with various intermediaries and the different needs of each. Dreyfus’ representatives noted the distribution channels for the fund as well as the diversity of distribution among the funds in the Dreyfus fund complex, and Dreyfus’ corresponding need for broad, deep and diverse resources to be able to provide ongoing shareholder services to each distribution channel, including those of the fund. Dreyfus also provided the number of shareholder accounts in the fund, as well as the fund’s asset size.
The Board members also considered Dreyfus’ research and portfolio management capabilities and that Dreyfus also provides oversight of day-to-day fund operations, including fund accounting and administration and assistance in meeting legal and regulatory requirements. The Board members also considered Dreyfus’ extensive administrative, accounting and compliance infrastructure.The Board also considered Dreyfus’ brokerage policies and practices and the standards applied in seeking best execution.
Comparative Analysis of the Fund’s Performance and Management Fee and Expense Ratio. The Board members reviewed the fund’s performance and comparisons to a group of retail no-load short investment-
44
grade debt funds (the “Performance Group”) and to a larger universe of funds, consisting of all retail and institutional short investment-grade debt funds (the “Performance Universe”), selected and provided by Lipper, Inc., an independent provider of investment company data.The Board was provided with a description of the methodology Lipper used to select the Performance Group and Performance Universe, as well as the Expense Group and Expense Universe (discussed below). The Board members discussed the results of the comparisons for various periods ended May 31, 2010.The Board members noted that the fund’s total return performance was above the Performance Group medians for the two most recent periods, below the Performance Group medians for the other periods and at or above the Performance Universe medians for all periods except one.The Board members noted that the fund’s yield performance was abov e the Performance Group and Performance Universe medians for all periods. The Board noted that the fund’s portfolio managers had managed the fund since July 2008. Dreyfus also provided a comparison of the fund’s calendar year total returns to the returns of the fund’s benchmark index.
The Board members also discussed the fund’s management fee and expense ratio and reviewed the range of management fees and expense ratios as compared to a comparable group of funds (the “Expense Group”) and a broader group of funds (the “Expense Universe”), each selected and provided by Lipper. The Board members noted that the fund’s contractual management fee was at the Expense Group median, and that the actual management fee and expense ratio were above the Expense Group and Expense Universe medians.
Representatives of Dreyfus stated that there were no other mutual funds managed by Dreyfus or its affiliates with similar investment objectives, policies and strategies as the fund , and reviewed with the Board other accounts managed by Dreyfus or its affiliates with similar investment objectives, policies and strategies as the fund (the “Similar Accounts”). Dreyfus representatives explained the nature of the Similar Accounts and the differences in providing services to such Similar
|
| INFORMATION ABOUT THE REVIEW AND APPROVAL OF THE |
| FUND’S MANAGEMENT AGREEMENT (Unaudited) (continued) |
Accounts as compared to managing and providing services to the fund. The Board analyzed differences in fees paid to Dreyfus and discussed the relationship of the fees paid in light of the services provided.The Board members considered the relevance of the fee information provided for the Similar Accounts to evaluate the appropriateness and reasonableness of the fund’s management fee.
Analysis of Profitability and Economies of Scale. Dreyfus’ representatives reviewed the dollar amount of expenses allocated and profit received by Dreyfus and the method used to determine such expenses and profit. The Board previously had been provided with information prepared by an independent consulting firm regarding Dreyfus’ approach to allocating costs to, and determining the profitability of, individual funds and the entire Dreyfus mutual fund complex.The Board members also had been informed that the methodology had been reviewed by an independent registered public accounting firm which, like the consultant, found the methodology to be reasonable. The consulting firm also analyzed where any economies of scale might emerge in connection with the management of the fund.The Board members evaluated the profitability analysis in light of the relevan t circumstances for the fund and the extent to which economies of scale would be realized if the fund grows and whether fee levels reflect these economies of scale for the benefit of fund investors.The Board members also considered potential benefits to Dreyfus from acting as investment adviser and noted that there were no soft dollar arrangements with respect to trading the fund’s investments.
It was noted that the Board members should consider Dreyfus’ profitability with respect to the fund as part of their evaluation of whether the fee under the Management Agreement bears a reasonable relationship to the mix of services provided by Dreyfus, including the nature, extent and quality of such services and that a discussion of economies of scale is predicated on increasing assets and that, if a fund’s assets had been decreasing, the possibility that Dreyfus may have realized any economies of scale would be less. It also was noted that the profitability percentage for managing the fund was within the range determined by appropriate court cases to be reasonable given the services rendered.
46
At the conclusion of these discussions, the Board agreed that it had been furnished with sufficient information to make an informed business decision with respect to continuation of the Management Agreement. Based on the discussions and considerations as described above, the Board made the following conclusions and determinations.
The Board concluded that the nature, extent and quality of the services provided by Dreyfus are adequate and appropriate.
The Board generally was satisfied with the fund’s overall performance.
The Board concluded that the fee paid by the fund to Dreyfus was reasonable in light of the services provided, comparative performance, expense and management fee information, costs of the services pro- vided and profits to be realized and benefits derived or to be derived by Dreyfus from its relationship with the fund.
The Board determined that the economies of scale which may accrue to Dreyfus and its affiliates in connection with the management of the fund had been adequately considered by Dreyfus in connection with the management fee rate charged to the fund and that, to the extent in the future it were determined that material economies of scale had not been shared with the fund, the Board would seek to have those economies of scale shared with the fund.
The Board members considered these conclusions and determinations, along with information received on a routine and regular basis throughout the year, and, without any one factor being dispositive, the Board determined that re-approval of the Management Agreement was in the best interests of the fund and its shareholders.
BOARD MEMBERS INFORMATION (Unaudited)
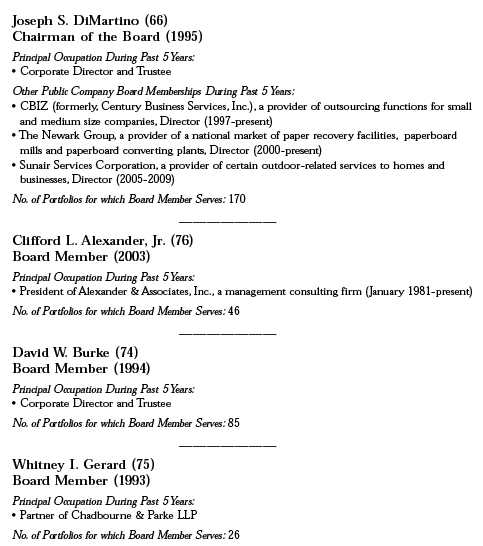
48
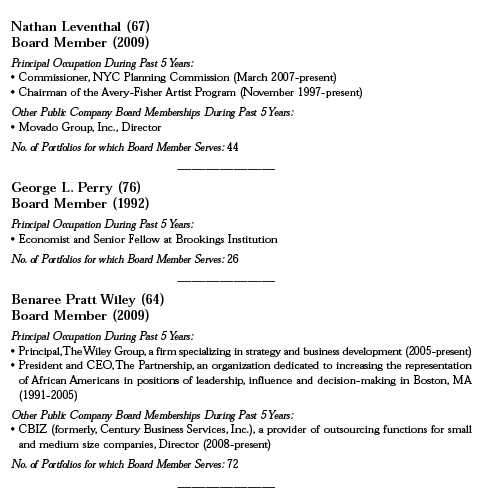
Once elected all Board Members serve for an indefinite term, but achieve Emeritus status upon reaching age 80.The address of the Board Members and Officers is in c/o The Dreyfus Corporation, 200 Park Avenue, NewYork, NewYork 10166.Additional information about the Board Members is available in the fund’s Statement of Additional Information which can be obtained from Dreyfus free of charge by calling this toll free number: 1-800-554-4611.
Lucy Wilson Benson, Emeritus Board Member
Arthur A. Hartman, Emeritus Board Member
OFFICERS OF THE FUND (Unaudited)

50
OFFICERS OF THE FUND (Unaudited) (continued)
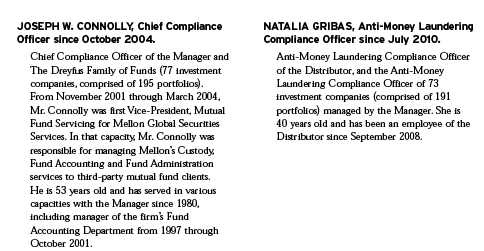
52
For More Information
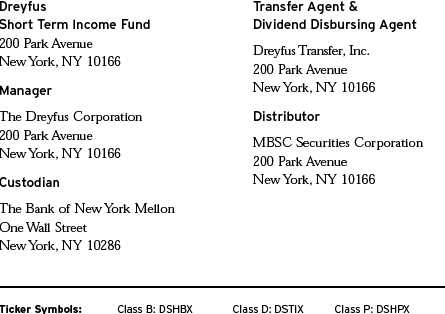
|
| Telephone Call your financial representative or 1-800-554-4611 |
| Mail The Dreyfus Family of Funds, 144 Glenn Curtiss Boulevard, Uniondale, NY 11556-0144 |
The fund files its complete schedule of portfolio holdings with the Securities and Exchange Commission (“SEC”) for the first and third quarters of each fiscal year on Form N-Q. The fund’s Forms N-Q are available on the SEC’s website at http://www.sec.gov and may be reviewed and copied at the SEC’s Public Reference Room in Washington, DC. Information on the operation of the Public Reference Room may be obtained by calling 1-800-SEC-0330.
A description of the policies and procedures that the fund uses to determine how to vote proxies relating to portfolio securities, and information regarding how the fund voted these proxies for the most recent 12-month period ended June 30 is available at http://www.dreyfus.com and on the SEC’s website at http://www.sec.gov. The description of the policies and procedures is also available without charge, upon request, by calling 1-800-645-6561.

Item 2. Code of Ethics.
The Registrant has adopted a code of ethics that applies to the Registrant's principal executive officer, principal financial officer, principal accounting officer or controller, or persons performing similar functions. There have been no amendments to, or waivers in connection with, the Code of Ethics during the period covered by this Report.
Item 3. Audit Committee Financial Expert.
The Registrant's Board has determined that Joseph S. DiMartino, a member of the Audit Committee of the Board, is an audit committee financial expert as defined by the Securities and Exchange Commission (the "SEC"). Joseph S. DiMartino is "independent" as defined by the SEC for purposes of audit committee financial expert determinations.
Item 4. Principal Accountant Fees and Services.
(a) Audit Fees. The aggregate fees billed for each of the last two fiscal years (the "Reporting Periods") for professional services rendered by the Registrant's principal accountant (the "Auditor") for the audit of the Registrant's annual financial statements or services that are normally provided by the Auditor in connection with the statutory and regulatory filings or engagements for the Reporting Periods, were $ 99,257 in 2009 and $99,257 in 2010.
(b) Audit-Related Fees. The aggregate fees billed in the Reporting Periods for assurance and related services by the Auditor that are reasonably related to the performance of the audit of the Registrant's financial statements and are not reported under paragraph (a) of this Item 4 were $15, 828 in 2009 and $16,146 in 2010. These services consisted of one or more of the following: (i) agreed upon procedures related to compliance with Internal Revenue Code section 817(h), (ii) security counts required by Rule 17f-2 under the Investment Company Act of 1940, as amended, (iii) advisory services as to the accounting or disclosure treatment of Registrant transactions or events and (iv) advisory services to the accounting or disclosure treatment of the actual or potential impact to the Registrant of final or proposed rules, standards or interpretations by the Securities and Exchange Commission, the Financial Accounting Standards Boards or other regulatory or standard-setting bodies.
The aggregate fees billed in the Reporting Periods for non-audit assurance and related services by the Auditor to the Registrant's investment adviser (not including any sub-investment adviser whose role is primarily portfolio management and is subcontracted with or overseen by another investment adviser), and any entity controlling, controlled by or under common control with the investment adviser that provides ongoing services to the Registrant ("Service Affiliates"), that were reasonably related to the performance of the annual audit of the Service Affiliate, which required pre-approval by the Audit Committee were $0 in 2009 and $0 in 2010.
(c) Tax Fees. The aggregate fees billed in the Reporting Periods for professional services rendered by the Auditor for tax compliance, tax advice, and tax planning ("Tax Services") were $ 10,732 in 2009 and $12,996 in 2010. These services consisted of: (i) review or preparation of U.S. federal, state, local and excise tax returns; (ii) U.S. federal, state and local tax planning, advice and assistance regarding statutory, regulatory or administrative developments; (iii) tax advice regarding tax qualification matters and/or treatment of various financial instruments held or proposed to be acquired or held. The aggregate fees billed in the Reporting Periods for Tax Services by the Auditor to Service Affiliates, which required pre-approval by the Audit Committee were $0 in 2009 and $0 in 2010.
(d) All Other Fees. The aggregate fees billed in the Reporting Periods for products and services provided by the Auditor, other than the services reported in paragraphs (a) through (c) of this Item, were $426 in 2009 and $2,002 in 2010. [These services consisted of a review of the Registrant's anti-money laundering program].
The aggregate fees billed in the Reporting Periods for Non-Audit Services by the Auditor to Service Affiliates, other than the services reported in paragraphs (b) through (c) of this Item, which required pre-approval by the Audit Committee, were $0 in 2009 and $0 in 2010.
(e)(1) Audit Committee Pre-Approval Policies and Procedures. The Registrant's Audit Committee has established policies and procedures (the "Policy") for pre-approval (within specified fee limits) of the Auditor's engagements for non-audit services to the Registrant and Service Affiliates without specific case-by-case consideration. The pre-approved services in the Policy can include pre-approved audit services, pre-approved audit-related services, pre-approved tax services and pre-approved all other services. Pre-approval considerations include whether the proposed services are compatible with maintaining the Auditor's independence. Pre-approvals pursuant to the Policy are considered annually.
(e)(2) Note: None of the services described in paragraphs (b) through (d) of this Item 4 were approved by the Audit Committee pursuant to paragraph (c)(7)(i)(C) of Rule 2-01 of Regulation S-X.
(f) None of the hours expended on the principal accountant's engagement to audit the registrant's financial statements for the most recent fiscal year were attributed to work performed by persons other than the principal account's full-time, permanent employees.
Non-Audit Fees. The aggregate non-audit fees billed by the Auditor for services rendered to the Registrant, and rendered to Service Affiliates, for the Reporting Periods were $22,703,649 in 2009 and $28,443,195 in 2010.
Auditor Independence. The Registrant's Audit Committee has considered whether the provision of non-audit services that were rendered to Service Affiliates, which were not pre-approved (not requiring pre-approval), is compatible with maintaining the Auditor's independence.
Item 5. Audit Committee of Listed Registrants.
Not applicable. [CLOSED-END FUNDS ONLY]
Item 6. Investments.
(a) Not applicable.
Item 7. Disclosure of Proxy Voting Policies and Procedures for Closed-End Management Investment Companies.
Not applicable. [CLOSED-END FUNDS ONLY]
Item 8. Portfolio Managers of Closed-End Management Investment Companies.
Not applicable. [CLOSED-END FUNDS ONLY, beginning with reports for periods ended on and after December 31, 2005]
Item 9. Purchases of Equity Securities by Closed-End Management Investment Companies and Affiliated Purchasers.
Not applicable. [CLOSED-END FUNDS ONLY]
Item 10. Submission of Matters to a Vote of Security Holders.
There have been no material changes to the procedures applicable to Item 10.
Item 11. Controls and Procedures.
(a) The Registrant's principal executive and principal financial officers have concluded, based on their evaluation of the Registrant's disclosure controls and procedures as of a date within 90 days of the filing date of this report, that the Registrant's disclosure controls and procedures are reasonably designed to ensure that information required to be disclosed by the Registrant on Form N-CSR is recorded, processed, summarized and reported within the required time periods and that information required to be disclosed by the Registrant in the reports that it files or submits on Form N-CSR is accumulated and communicated to the Registrant's management, including its principal executive and principal financial officers, as appropriate to allow timely decisions regarding required disclosure.
(b) There were no changes to the Registrant's internal control over financial reporting that occurred during the second fiscal quarter of the period covered by this report that have materially affected, or are reasonably likely to materially affect, the Registrant's internal control over financial reporting.
Item 12. Exhibits.
(a)(1) Code of ethics referred to in Item 2.
(a)(2) Certifications of principal executive and principal financial officers as required by Rule 30a-2(a) under the Investment Company Act of 1940.
(a)(3) Not applicable.
(b) Certification of principal executive and principal financial officers as required by Rule 30a-2(b) under the Investment Company Act of 1940.
SIGNATURES
Pursuant to the requirements of the Securities Exchange Act of 1934 and the Investment Company Act of 1940, the Registrant has duly caused this Report to be signed on its behalf by the undersigned, thereunto duly authorized.
Dreyfus Investment Grade Funds, Inc.
By: /s/ Bradley J. Skapyak |
Bradley J. Skapyak, President |
Date: | Friday, September 24, 2010 |
|
Pursuant to the requirements of the Securities Exchange Act of 1934 and the Investment Company Act of 1940, this Report has been signed below by the following persons on behalf of the Registrant and in the capacities and on the dates indicated. |
|
By: /s/ Bradley J. Skapyak |
Bradley J. Skapyak President |
Date: | Friday, September 24, 2010 |
|
By: /s/ James Windels |
James Windels, Treasurer |
Date: | Friday, September 24, 2010 |
|
EXHIBIT INDEX
(a)(1) Code of ethics referred to in Item 2.
(a)(2) Certifications of principal executive and principal financial officers as required by Rule 30a-2(a) under the Investment Company Act of 1940. (EX-99.CERT)
(b) Certification of principal executive and principal financial officers as required by Rule 30a-2(b) under the Investment Company Act of 1940. (EX-99.906CERT)